
3Q’11 Financial Results November 3, 2011
Safe Harbor Statement This presentation includes certain "forward - looking statements" including, without limitation, statements regarding the anticipated positive impact of acquiring Network Solutions, expected growth from our investment in marketing initiatives, cost synergies resulting from our recent combination with Register.com, expected benefits to merchants and other customers, market opportunities, and expected customer base, that are subject to risks, uncertainties and other factors that could cause actual results or outcomes to differ materially from those contemplated by the forward - looking statements. These forward - looking statements include, but are not limited to, plans, objectives, expectations and intentions and other statements contained in this presentation that are not historical facts. These statements are sometimes identified by words such as “potential,” “expect,” or words of similar meaning. As a result of the ultimate outcome of such risks and uncertainties, Web.com’s actual results could differ materially from those anticipated in these forward - looking statements. These statements are based on Web.com’s current beliefs or expectations, and there are a number of important factors that could cause the actual results or outcomes to differ materially from those indicated by these forward - looking statements, including, without limitation, Web.com’s ability to integrate the Network Solutions business, Web.com’s ability to further integrate the Web.com and Register.com businesses, disruption created by the Network Solutions acquisition and from integration efforts making it more difficult to maintain relationships with customers, employees or suppliers; risks related to the successful offering of the combined company's products and services; the risk that the anticipated benefits of the acquisition may not be realized; and other risks that may impact Web.com’s and Register.com’s businesses. Other risk factors are set forth under the caption, "Risk Factors," in Web.com’s Annual Report on Form 10 - Q for the quarter ended June 30 , 2011, as filed with the Securities and Exchange Commission, which is available on a website maintained by the Securities and Exchange Commission at www.sec.gov. Web.com expressly disclaims any obligation or undertaking to release publicly any updates or revisions to any forward - looking statements contained herein as a result of new information, future events or otherwise. 2
Non - GAAP measures Some of the measures in this presentation are non - GAAP financial measures within the meaning of the SEC Regulation G. Web.com believes presenting non - GAAP financial measures is useful to investors, because it describes the operating performance of the company, excluding some recurring charges that are included in the most directly comparable measures calculated and presented in accordance with GAAP. Company management uses these non - GAAP measures as important indicators of the Company's past performance and in planning and forecasting performance in future periods. The non - GAAP financial information Web.com presents may not be comparable to similarly - titled financial measures used by other companies, and investors should not consider non - GAAP financial measures in isolation from, or in substitution for, financial information presented in compliance with GAAP. You are encouraged to review the reconciliation of non - GAAP financial measures to GAAP financial measures included in Web.com’s filings with the Securities and Exchange Commission, which are available at www.sec.gov as well as in this presentation. 3
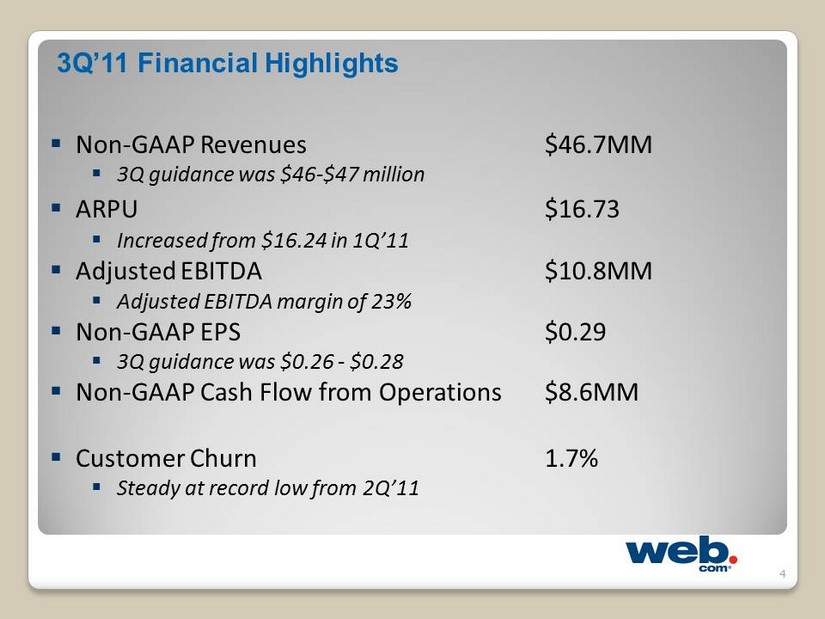
3Q’11 Financial Highlights ▪ Non - GAAP Revenues $46.7MM ▪ 3Q guidance was $46 - $47 million ▪ ARPU $16.73 ▪ Increased from $16.24 in 1Q’11 ▪ Adjusted EBITDA $10.8MM ▪ Adjusted EBITDA margin of 23% ▪ Non - GAAP EPS $0.29 ▪ 3Q guidance was $0.26 - $0.28 ▪ Non - GAAP Cash Flow from Operations $8.6MM ▪ Customer Churn 1.7% ▪ Steady at record low from 2Q’11 4
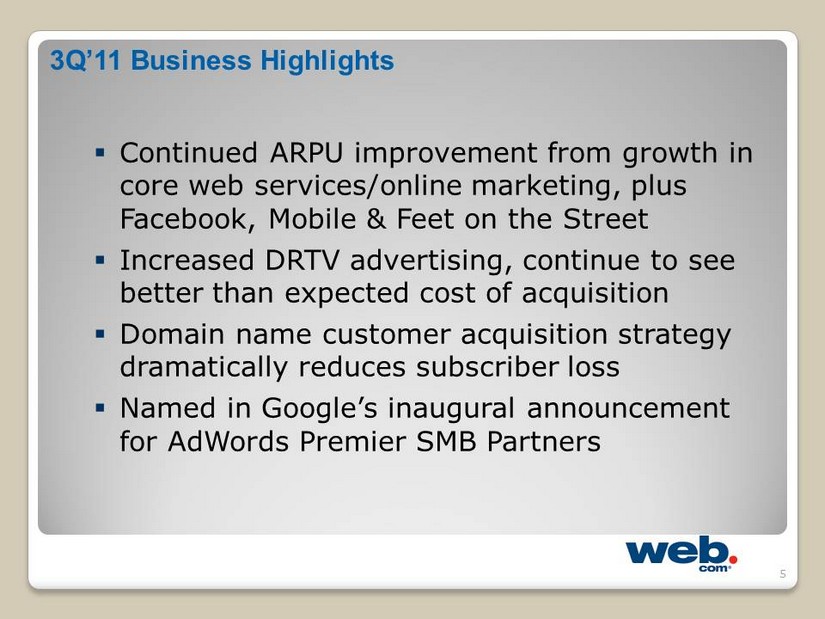
3Q’11 Business Highlights ▪ Continued ARPU improvement from growth in core web services/online marketing, plus Facebook, Mobile & Feet on the Street ▪ Increased DRTV advertising, continue to see better than expected cost of acquisition ▪ Domain name customer acquisition strategy dramatically reduces subscriber loss ▪ Named in Google’s inaugural announcement for AdWords Premier SMB Partners 5

Network Solutions Acquisition Cash Consideration $405 Shares Issued 18.0 Current Share Price $9.16 1 Stock Consideration $165 Total Equity Consideration $570 Net Debt $206 Enterprise Value $776 Deal Summary Terms Revolver ($50) $21 L + 5.5% Term Loan B 600 L + 5.5% 1 Second Lien Debt 150 L + 9.5% 1 Total Debt $771 Equity $165 Financing Summary 1 Based on stock price as of 10/27/2011 ($ in Millions, except per share data) ▪ Acquisition closed on October 27, 2011 ▪ Network Solutions shareholders received 18 million shares and $405 million in cash ▪ Approximately $213 million in Network Solutions net debt was paid off at close ▪ Enterprise Value of $776 million ▪ Web.com secured committed financing from a consortium of banks to fund the cash consideration as well as the refinancing of the two companies’ current debt outstanding ▪ $800 million in total financing commitments ▪ Web.com added Network Solutions owner/General Atlantic managing partner to Board of Directors 6
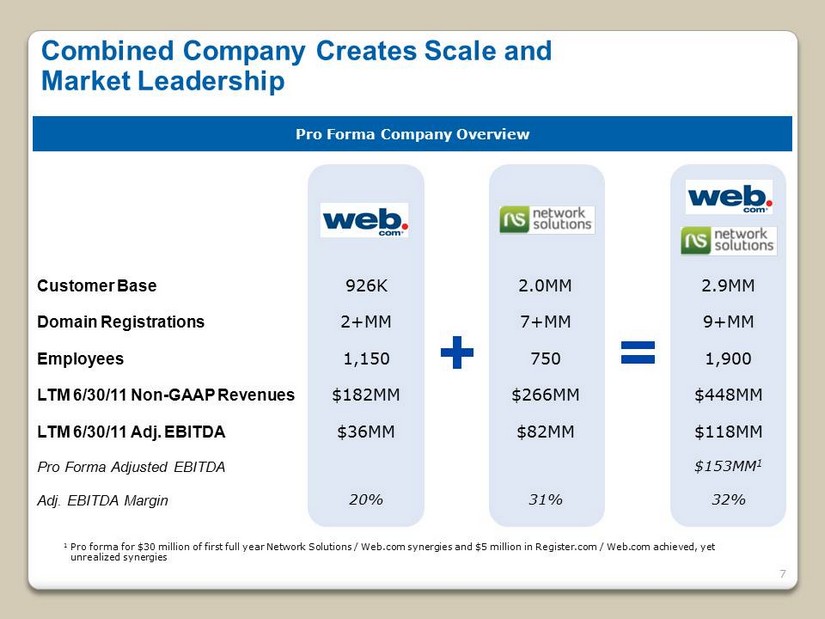
Combined Company Creates Scale and Market Leadership Pro Forma Company Overview 1 Pro forma for $30 million of first full year Network Solutions / Web.com synergies and $5 million in Register.com / Web.com a ch ieved, yet unrealized synergies Customer Base Domain Registrations Employees LTM 6/30/11 Non - GAAP Revenues LTM 6/30/11 Adj. EBITDA Pro Forma Adjusted EBITDA Adj. EBITDA Margin 2.0MM 7+MM 750 $266MM $82MM 31% 926K 2+MM 1,150 $182MM $36MM 20% 2.9MM 9+MM 1,900 $448MM $118MM $153MM 1 32% 7

Cost Synergies ▪ Estimated $30 million in year - one pre - tax cost savings ▪ $40 million run rate synergies that expect to be achieved by the end of 2013 Multiple Sources of Synergies Brand / Marketing Synergies ▪ Creates a leading national brand dedicated to the SMB community ▪ Increased marketing spend to drive subscriber acquisition and branding initiative Revenue Synergies ▪ Opportunity to cross - sell Web.com’s best - in - class suite of solutions to Network Solutions’ 2 million customers ▪ Provides additional products and services from Network Solutions to Web.com’s nearly 1 million subscribers ▪ Potential to drive low teens revenue growth over the next 3 to 4 years 8
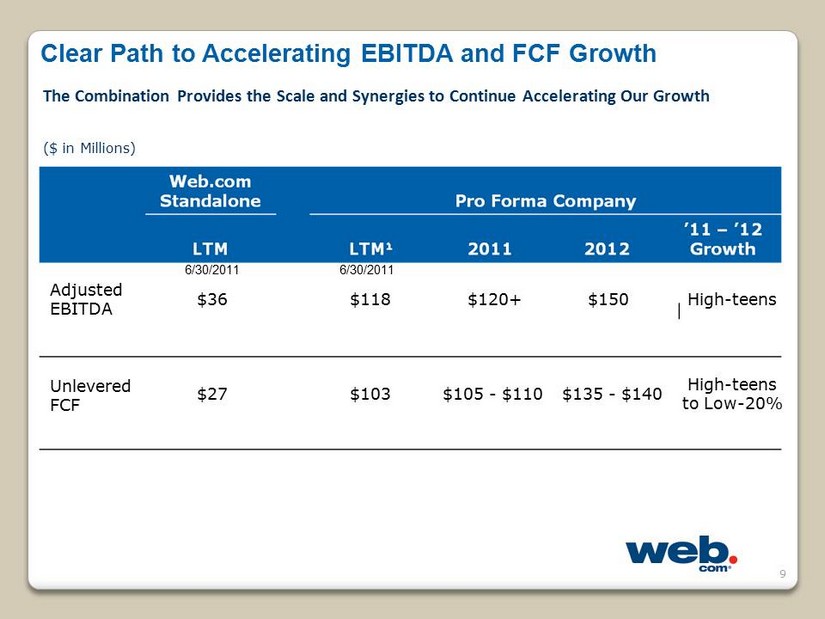
Clear Path to Accelerating EBITDA and FCF Growth The Combination Provides the Scale and Synergies to Continue Accelerating Our Growth Adjusted EBITDA Unlevered FCF $36 $118 $120+ High - teens $27 $103 $105 - $110 High - teens to Low - 20% $150 $135 - $140 ($ in Millions) 9 6/30/2011 6/30/2011

10
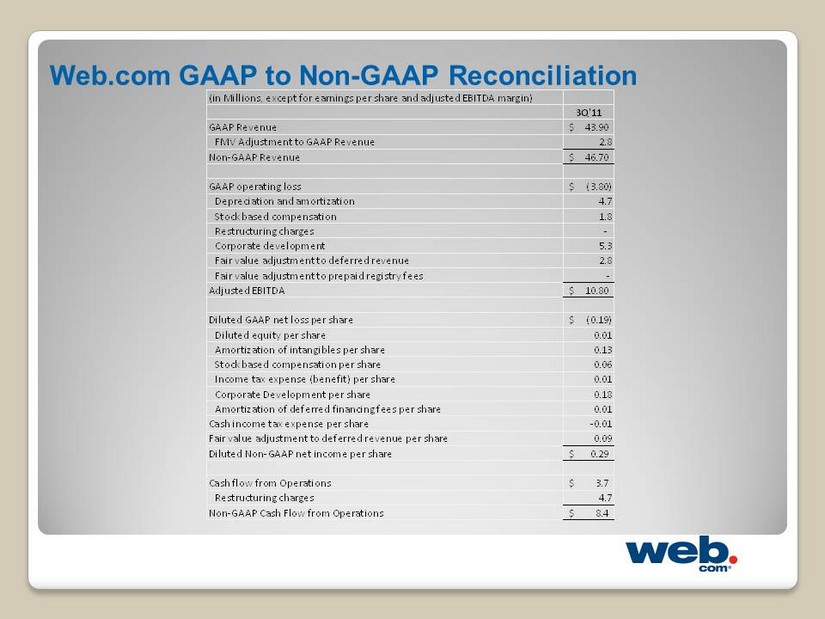
Web.com GAAP to Non - GAAP Reconciliation (in Millions, except for earnings per share and adjusted EBITDA margin) 3Q'11 GAAP Revenue 43.90$ FMV Adjustment to GAAP Revenue 2.8 Non-GAAP Revenue 46.70$ GAAP operating loss (3.80)$ Depreciation and amortization 4.7 Stock based compensation 1.8 Restructuring charges - Corporate development 5.3 Fair value adjustment to deferred revenue 2.8 Fair value adjustment to prepaid registry fees - Adjusted EBITDA 10.80$ Diluted GAAP net loss per share (0.19)$ Diluted equity per share 0.01 Amortization of intangibles per share 0.13 Stock based compensation per share 0.06 Income tax expense (benefit) per share 0.01 Corporate Development per share 0.18 Amortization of deferred financing fees per share 0.01 Cash income tax expense per share -0.01 Fair value adjustment to deferred revenue per share 0.09 Diluted Non-GAAP net income per share 0.29$ Cash flow from Operations 3.7$ Restructuring charges 4.7 Non-GAAP Cash Flow from Operations 8.4$
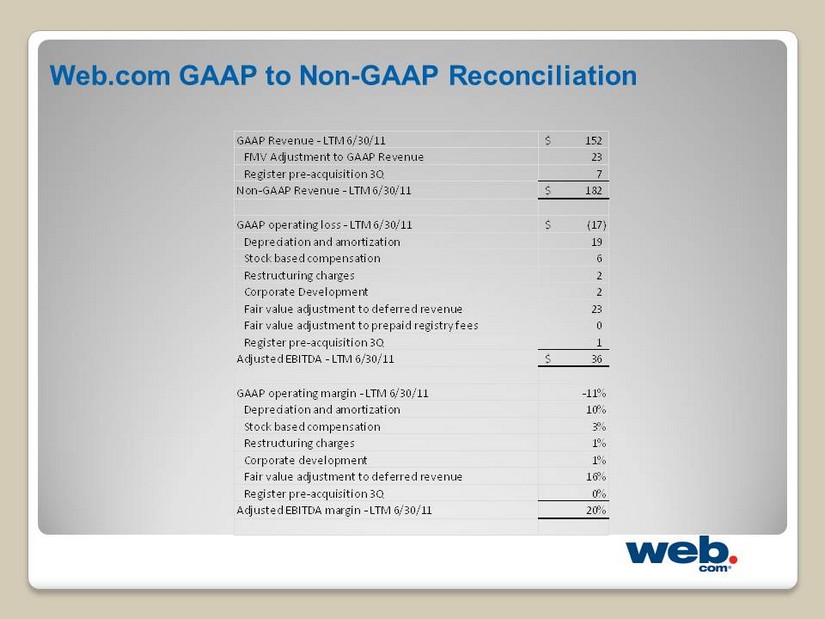
Web.com GAAP to Non - GAAP Reconciliation GAAP Revenue - LTM 6/30/11 152$ FMV Adjustment to GAAP Revenue 23 Register pre-acquisition 3Q 7 Non-GAAP Revenue - LTM 6/30/11 182$ GAAP operating loss - LTM 6/30/11 (17)$ Depreciation and amortization 19 Stock based compensation 6 Restructuring charges 2 Corporate Development 2 Fair value adjustment to deferred revenue 23 Fair value adjustment to prepaid registry fees 0 Register pre-acquisition 3Q 1 Adjusted EBITDA - LTM 6/30/11 36$ GAAP operating margin - LTM 6/30/11 -11% Depreciation and amortization 10% Stock based compensation 3% Restructuring charges 1% Corporate development 1% Fair value adjustment to deferred revenue 16% Register pre-acquisition 3Q 0% Adjusted EBITDA margin - LTM 6/30/11 20%