UNITED STATES
SECURITIES AND EXCHANGE COMMISSION
Washington, D.C. 20549
FORM 10-K
 | | |
| (mark one) | | |
| x | | ANNUAL REPORT PURSUANT TO SECTION 13 OR 15(d)
OF THE SECURITIES EXCHANGE ACT OF 1934 |
For the fiscal year ended December 31, 2012
or
| | |
| o | | TRANSITION REPORT PURSUANT TO SECTION 13 OR 15(d)
OF THE SECURITIES EXCHANGE ACT OF 1934 |
For the transition period from to .
Commission File Number 000-51595
Web.com Group, Inc.
(Exact name of registrant as specified in its charter)
| | |
| Delaware | | 94-3327894 |
(State or other jurisdiction of
incorporation or organization) | | (I.R.S. Employer
Identification No.) |
| | |
| 12808 Gran Bay Parkway, West, Jacksonville, FL | | 32258 |
| (Address of principal executive offices) | | (Zip Code) |
Registrant’s telephone number, including area code: (904) 680-6600
Securities registered pursuant to Section 12(b) of the Act: None.
Securities registered pursuant to section 12(g) of the Act:
Common Stock, $0.001 par value
(Title of class)
Indicate by check mark if the registrant is a well-known seasoned issuer, as defined in Rule 405 of the Securities Act.o Yesx No
Indicate by check mark if the registrant is not required to file reports pursuant to Section 13 or Section 15(d) of the
Act.o Yesx No
Indicate by checkmark whether the registrant (1) has filed all reports required to be filed by Section 13 or 15(d) of the Securities Exchange Act of 1934 during the preceding 12 months (or for such shorter period that the registrant was required to file such reports), and (2) has been subject to such filing requirements for the past 90 days.x Yeso No
Indicate by check mark whether the registrant has submitted electronically and posted on its corporate Web site, if any, every Interactive Data File required to be submitted and posted pursuant to Rule 405 of Regulation S-T (§ 232.405 of this chapter) during the preceding 12 months (or for such shorter period that the registrant was required to submit and post such files).x Yeso No
Indicate by checkmark if disclosure of delinquent filers pursuant to Item 405 of Regulation S-K(§ 229.405 of this chapter) is not contained herein, and will not be contained, to the best of registrant’s knowledge, in definitive proxy or information statements incorporated by reference in Part III of this Form 10-K or any amendment to this Form 10-K.x
Indicate by check mark whether the registrant is a large accelerated filer, an accelerated filer, or a non-accelerated filer. See definition of “accelerated filer and large accelerated filer” in Rule 12b-2 of the Exchange Act. (Check one):
| | | | | | |
| Large accelerated filero | | Accelerated filerx | | Non-accelerated filero
(Do not check if a smaller reporting company) | | Smaller Reporting Companyo |
Indicate by check mark whether the registrant is a shell company (as defined in Rule 12b2 of the Act).o Yesx No
The aggregate market value of the voting and non-voting common equity held by non-affiliates of the registrant was approximately $602,817,682 as of June 30, 2012, based upon the closing sale price of the common stock as quoted by the NASDAQ Global Market reported for such date. Shares of common stock held by each executive officer and each director and by each person who is known by the registrant to own 10% or more of the outstanding common stock have been excluded from this calculation as such persons may be deemed affiliates. This determination of affiliate status is not necessarily a conclusive determination for other purposes.
As of February 28, 2013, the registrant had 49,740,044 shares of common stock outstanding.
DOCUMENTS INCORPORATED BY REFERENCE
Parts of the Proxy Statement for the registrant’s 2013 Annual Meeting of Stockholders, to be filed with the Securities and Exchange Commission pursuant to Regulation 14A not later than 120 days after the end of the fiscal year covered by this Form 10-K, are incorporated by reference in Part III of this Form 10-K.
TABLE OF CONTENTS
TABLE OF CONTENTS
| | |
| | Page |
PART I
| |
Item 1. Business | | | 2 | |
Item 1A. Risk Factors | | | 12 | |
Item 1B. Unresolved Staff Comments | | | 22 | |
Item 2. Properties | | | 23 | |
Item 3. Legal Proceedings | | | 23 | |
Item 4. Mine Safety Disclosures | | | 23 | |
PART II
| |
Item 5. Market for Registrant’s Common Equity, Related Stockholder Matters, and Issuer Purchases of Equity Securities | | | 24 | |
Item 6. Selected Financial Data | | | 25 | |
Item 7. Management’s Discussion and Analysis of Financial Condition and Results of Operation | | | 26 | |
Item 7A. Quantitative and Qualitative Disclosures About Market Risk | | | 44 | |
Item 8. Financial Statements and Supplementary Data | | | 48 | |
Item 9. Changes in and Disagreements With Accountants on Accounting and Financial Disclosure | | | 49 | |
Item 9A. Controls and Procedures | | | 50 | |
Item 9B. Other Information | | | 52 | |
PART III
| |
Item 10. Directors, Executive Officers and Corporate Governance | | | 53 | |
Item 11. Executive Compensation | | | 53 | |
Item 12. Security Ownership of Certain Beneficial Owners and Management and Related Stockholder Matters | | | 53 | |
Item 13. Certain Relationships and Related Transactions, and Director Independence | | | 53 | |
Item 14. Principal Accounting Fees and Services | | | 53 | |
PART IV
| |
Item 15. Exhibits, Financial Statement Schedules | | | 53 | |
i
TABLE OF CONTENTS
PART I
This Annual Report on Form 10-K contains forward-looking statements within the meaning of Section 27A of the Securities Act of 1933, as amended, and Section 21E of the Securities Exchange Act of 1934, as amended, which are subject to the “safe harbor” created by those sections. Forward-looking statements are based on our management’s beliefs and assumptions and on information currently available to our management. All statements other than statements of historical facts are “forward-looking statements” for purposes of these provisions. In some cases, you can identify forward-looking statements by terms such as “anticipate,” “believe,” “could,” “estimate,” “expect,” “intend,” “may,” “plan,” “potential,” “predict,” “project,” “should,” “will,” “would” and similar expressions intended to identify forward-looking statements. These statements involve known and unknown risks, uncertainties and other factors, which may cause our actual results, performance, time frames or achievements to be materially different from any future results, performance, time frames or achievements expressed or implied by the forward-looking statements. We discuss many of these risks, uncertainties and other factors in this Annual Report on Form 10-K in greater detail under the heading “Risk Factors.” Given these risks, uncertainties and other factors, you should not place undue reliance on these forward-looking statements. Also, these forward-looking statements represent our estimates and assumptions only as of the date of this filing. You should read this Annual Report on Form 10-K completely and with the understanding that our actual future results may be materially different from what we expect. We hereby qualify our forward-looking statements by these cautionary statements. Except as required by law, we assume no obligation to update these forward-looking statements publicly, or to update the reasons actual results could differ materially from those anticipated in these forward-looking statements, even if new information becomes available in the future.
Item 1. Business.
Web.com Group, Inc. (referred to as “the Company”, “Web.com Group, Inc.” or “Web.com” herein) is a leading provider of a full line of internet services for small to medium-sized businesses (“SMBs”) and is a global domain name registrar. To meet the internet needs of SMBs anywhere along their lifecycle, the Company provides SMBs with affordable subscription solutions including domain registration, website design and related services, search engine optimization, search engine marketing, social media and mobile products, local sales leads, eCommerce solutions and call center services. Headquartered in Jacksonville, Florida, Web.com is a publicly traded company (Nasdaq: WWWW) serving approximately three million customers with approximately 1,900 employees in 16 locations in North America, South America and the United Kingdom.
On October 27, 2011, the Company completed its acquisition of 100% of the equity interests in Net Sol Parent LLC (formerly known as GA-Net Sol Parent LLC) (“Network Solutions”), a provider of domain names, web hosting and online marketing services. On July 29, 2010, the Company completed its acquisition of the partnership interests in Register.com LP, another provider of domain names, online marketing and web services. Collectively, these acquisitions brought approximately 2.7 million subscribers that present substantial cross- and up-sell opportunities.
Web.com was incorporated under the General Corporation Law of the State of Delaware on March 2, 1999 as Website Pros, Inc. We offered common stock to the public for the first time on November 1, 2005 as Website Pros (NASDAQ: WSPI) and began trading as Web.com (Nasdaq: WWWW) following our acquisition of the legacy Web.com business in September 2007.
Overview
Market Opportunity
There are more than 27 million SMBs in the United States today. Our focus is serving small to medium local enterprises that need to connect with their current and potential customers online. SMBs represent a unique group when it comes to web presence and needs. SMB owners, including sole proprietors, have limited support staff and must devote most of their time to running the daily operations of their businesses. They often have limited knowledge of how to build a web presence and limited time to acquire the skills to do so. At the same time, there is growing acceptance among these SMB owners that an effective internet presence is critical to their marketing efforts and there is evidence that these businesses are shifting their marketing budgets from traditional media to online channels.
2
TABLE OF CONTENTS
What we do
Using a consultative approach, Web.com offers SMBs a single point of entry to an array of effective, affordable online products and services that will help drive their businesses. The breadth and flexibility of our offerings allow us to address the web services needs of a wide variety of customers, ranging from those just establishing their websites to those that want to enhance their existing online presence with more sophisticated marketing and lead generation services. We offer our customers a full range of web services and products on an affordable subscription basis. With just over 3 million subscribers as of December 31, 2012, we are one of the industry’s largest providers of domain names, affordable web services and products that enable SMBs to have an effective online presence.
We have positioned ourselves as a partner to SMBs across all phases of their business’s adaptation to internet technology, from their initial entry onto the web to their use of cutting-edge innovations as they mature. As a domain registrar, we allow the business to establish an online presence by buying a domain name. This basic service is the entry point to higher priced offerings. Having secured a domain, a business next needs a website and e-mail service. Our offerings for these fundamental services span the range of customer budgets and expertise, from inexpensive Do-It-Yourself website and e-mail hosting for the technically-savvy, to Do-It-For-Me custom website design services, online marketing and eCommerce solutions. Customers can engage our experienced consultants for services that range from web design to online advertising campaign management. When online innovations emerge, we can help SMBs leverage the new capabilities.
Through the combination of proprietary website publishing and management software, automated workflow processes, and specialized workforce development and management techniques, Web.com achieves production efficiencies that enable us to offer sophisticated web services at affordable, monthly subscription rates. Our technology automates many aspects of creating, maintaining, enhancing, and marketing websites on behalf of our customers.
We sell our products and services via a telesales and direct sales force, which operates in 14 sales centers in the U.S. and Canada. In addition to these sales centers, we acquire many customers through online and affiliate marketing activities. In 2011, we rolled out a “Feet on the Street” direct sales initiative, as well as a Direct Response Television (“DRTV”) campaign. We also sell web services and products to customers identified by companies with which we have strategic marketing relationships.
Our Strategy
Our current objective is to enhance our position as a leading provider of web services and products for SMBs. The key elements of our business model and approach are:
Continuing to target the SMB segment. The SMB market offers the best opportunity to continue building a leading web services company. This is an attractive market because this large group of businesses needs a comprehensive, affordable solution for their web services requirements. Web services meet critical business needs of these businesses that they often do not have the time, resources, or technical skills to fulfill themselves.
Selling additional services and products to existing customers. Following our acquisition of leading domain registrars, Register.com in 2010 and Network Solutions in 2011, many of our customers only have a domain name or a domain name with very limited web services. We actively target these acquired domain customers for cross-sell and up-sell marketing. Additionally, as customers who currently have other Web.com DIY (Do-It-Yourself) products or eWorks!XL (our primary Do-It-For-Me subscription offering of bundled products and services) build their online presence, we can offer additional premium services and products. In addition, we expect to increase our marketing and sales activities, invest in developing brand awareness through corporate sponsorships such as the Web.com Tour, expand the scope of current strategic marketing relationships, and pursue additional strategic marketing relationships to expand distribution reach.
Developing or acquiring complementary services and technologies. Some of the services and products that we sell are provided through relationships and agreements with other vendors. We will seek opportunities either to internally develop such services and products, or to acquire businesses that provide them. Additionally, we may seek to expand our customer base via acquisition.
3
TABLE OF CONTENTS
Strengthening customer retention. We intend to enhance customer retention by targeting SMBs that already understand the value of the internet to their success, by educating existing and prospective customers about the value of web services to their businesses, and by focusing on customer satisfaction, consistent communication, web service and product enhancements, and high-quality customer service.
Extending position as an affordable web solutions provider. Through the combination of our operational scale and geographical locations, we believe that we have been able to also minimize the cost of delivering our web services and products. Our template driven processes enable us to handle orders efficiently. We have strategically located our primary sales and fulfillment facilities in lower cost areas including Jacksonville, Florida; Hazleton, Pennsylvania; Shaverton, Pennsylvania; Barrie, Ontario; Halifax, Nova Scotia; Yarmouth, Nova Scotia; Herndon, Virginia; and Spokane, Washington. In the future, we may look to new international labor markets to further reduce our costs.
Our Services and Products
Our goal is to provide a broad range of web services and products that enable SMBs to establish, maintain, promote, and optimize their online presence. By providing a comprehensive, performance-based offering, we are able to sell to customers whether or not they have already established an online presence. Customers can subscribe to bundled products that meet a variety of needs, and which can be enhanced with additional services; alternatively, they can choose to purchase ‘a la carte’ solutions for specific issues.
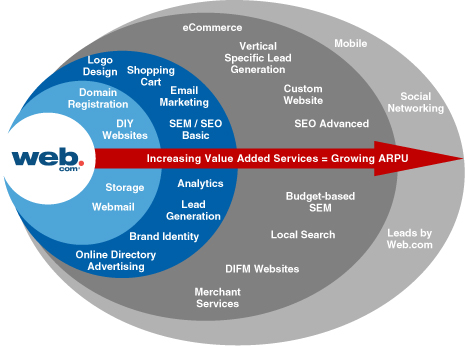
As our customers demand more advanced products and consultative services, they move from low-priced domain registrations towards high-priced, value-added offerings. These Do-It-For-Me offerings have relatively high barriers to entry, as they require sophisticated technological and business process expertise. We are unique in having deployed our feature-rich Do-It-For-Me offerings at an unrivalled scale.
4
TABLE OF CONTENTS
Our web services and products can be categorized into the following:
Domain Name Registration and Services
We have become one of the largest domain name registrars in the world and offer.com and.net domains as well as the latest top level domains, such as. co, .org and.info. We also offer a full suite of domain name services, including domain name registration, domain name transfers, domain name renewal, domain expiration protection and domain privacy services. Domain name customers have a highly proprietary need to maintain their distinct internet address, and we will continue to be their resource for maintaining and extending their registration. Furthermore, these customers represent prime opportunities for additional domain name sales, particularly as additional top level domain names become available. Since all online activity starts with a domain name, we anticipate continuing to be a market leader in selling and servicing these accounts.
Do-It-For-Me Web Services
These services have been created to allow Web.com to undertake virtually all of the work associated with building, maintaining, marketing and enhancing an internet presence to ultimately drive leads to the SMB owner. Since access to these services is through an affordable monthly subscription, these proprietors can have an effective online presence with a minimum outlay of resources. We bundle the most needed products in an efficient manner so the SMB owner can focus on his or her core business while the responsibility for making sure the website is optimized for business generation is outsourced to Web.com.
This is our flagship Do-It-For-Me offering, which consists of a comprehensive website design and publishing package targeted at getting SMBs online quickly, effectively, and affordably. The package includes a five-page semi-custom website built with our proprietary self-editing tool, which allows for easy maintenance by the customer. The package includes domain name registration, initial site design, online marketing, hosting and technical support, a unique toll-free telephone number that is forwarded to the SMB’s telephone line, webmail, online web tools that implement advanced site features, an Internet Scorecard product to analyze site traffic and report leads generated in real-time, several levels of modification and redesign services, and a version of the customer’s website built specifically for mobile devices.
In addition, our SmartClicks product can be added to this product. Once we gain an understanding of the customer’s goals and budget considerations, we can tailor an online advertising campaign that will guarantee an agreed-upon number of “clicks” within the confines of a predictable monthly budget. We create the pay-per-click ads, buy appropriate keywords, monitor the program’s performance, and report results to customers.
We offer complete custom website design services that provide sophisticated functionality and interactivity beyond those available under eWorks! XL and SmartClicks. These sites are typically built for larger, more established customers that have had an online presence in the past, or that are designing their first website with unique specifications. Customers work directly with our experienced web designers to build a fully customized website. Additionally, we are able to sell any of our subscription-based web services and products to our custom web design customers.
We bundle a number of different services contained in our eWorks! XL package into our Gorilla Marketing offering, which is designed to enhance the effectiveness of an online marketing program. These subscription-based services include initial site analysis, initial search engine optimization, search engine inclusion, monthly online marketing submissions to more than 100 search engines, powerful local directories, social sites and GPS navigation devices, listing in online yellow page directories and site submission to many popular search engines and search submission tools.
5
TABLE OF CONTENTS
To help SMBs access the growing and increasingly important social media channel, we offer subscription products designed to optimize and increase online exposure by presenting a professionally designed FacebookTM Company page, creating content and customizing marketing campaigns designed to build a fan base that “likes” the company.
Call center services offers eCommerce businesses a ‘virtual office’ customer service solution. In addition to providing eCommerce products, call center services can supply both eCommerce and brick and mortar businesses with a full suite of call center services, including answering services, live chat, and virtual office assistants. The call center solution can help businesses sell products, resolve customer disputes and build trust, eliminating the guess work and costly overhead associated with hiring in-house customer service employees.
Do-It-Yourself Web Services
We offer a variety of Do-It-Yourself website building and marketing solutions for SMBs that want to build their own websites or enhance their websites with online marketing. These solutions include hosting services, an easy-to-use web building tool, online marketing options and eCommerce capabilities. Potential customers are identified through traditional and online marketing as well as through a number of distribution partners, resellers and affiliates.
We offer core products that are standardized, scalable managed hosting services that place numerous customers on a single shared server, a cost benefit that is passed along to the customer. Starter packages are designed for websites with relatively low volumes of traffic and allow our customers to establish an online presence at minimal cost. Our hosting services feature easy-to-use control panels and extensive online documentation that allow customers to control their own applications.
Our Website Builder package is an easy-to-use website building tool which includes approximately 11,000 starter templates so users can customize their design. There is starter content that can be tailored for a business’s products or services, plus features that keep businesses connected with their customers and prospects, such as a stock image library, social media “share” icons, location maps, customizable contact forms and more. These features enable SMBs to create a professional and effective website to serve customers and grow business by reaching new prospects.
Our Business Builder package includes the Website Builder package plus leading edge marketing tools, including directory submission to more than 100 directories, search engines, social media sites and GPS directories as well as search engine optimization consultation. Customers can also add a FacebookTM Company page as well as eCommerce capability.
We offer e-mail products that offer the customers features they need: e-mail accounts, storage, spam and virus protection, webmail and even document sharing. The added benefit to the customer is that their e-mail address will match their domain names giving them instant creditability.
We offer an e-mail marketing tool that enables our customers to easily communicate with their customers and prospects. To assist our customers in collecting e-mail addresses, a subscription sign-up box is available for site visitors to provide their e-mail information. Included in this product are a variety of professional e-mail templates, a contact management tool and a reporting component to help track an e-mail campaign’s success.
6
TABLE OF CONTENTS
| • | Logo Design and Brand Building |
We are a leading provider of Do-It-Yourself logos and other premium design products to SMBs around the world through our LogoYes products. Our LogoYes Do-It-Yourself logo creation tools provide professional, affordable design products that equip SMBs to compete with larger businesses. LogoYes products and services help build a company’s brand value by presenting a strong, unified image. We also provide the LogoYes design and brand building tools to our Do-It-For-Me web services customers.
Online Marketing Services
Business success on the internet begins with a compelling website, but is only fully realized when the website is “found,” prominently displayed by the various search engines, and ultimately when potential customers are motivated to contact the business. We sell a variety of products and services designed to increase the potential that a website receives prominence in the major search engines like GoogleTM, Yahoo! and Bing, and we have expertise and experience providing pay-per-click advertising as well. Our online marketing proficiency has been recognized by our selection as a Google AdWords Premier SMB Partner and as a Yahoo! Local Ambassador. Some of our online marketing products include:
| • | Search Engine Optimization (SEO) |
Our search engine optimization products and services are designed to help improve organic search engine rankings and to increase qualified traffic and lead generation. We offer keyword research based on industry and competitor specifics, directory submissions, blogging campaigns and link building. Advanced website analytics accompany these products so customers can track their success.
We offer local and national search engine marketing services, sometimes known as pay-per-click advertising — where we will manage an advertising budget for our customers on Google Ad Words or Bing Ad Center.
| • | Budget-based search engine marketing We also offer businesses the option to base their search engine marketing efforts on a monthly budget, rather than a pay-per-click basis. Businesses receive monthly reports that track website traffic and performance. |
| • | Guaranteed click search engine marketingWe will tailor a business’s search engine marketing program to ensure a certain, agreed-upon number of clicks during any specific period, and we will work with the customer to maximize pay-per-click performance. |
Lead Generation
We offer targeted lead generation directed toward service-related businesses. We can work with that customer’s own website, or create a separate, lead-generating website that feeds directly into the customer’s business.
| • | Leads by Web.com Leads by Web.com researches relevant keywords in the customer’s industry to create ads designed to bring traffic to the website. When prospects search for a service, they are driven to a lead generation site to request a quote, and then leads are delivered to the subscriber’s computer or phone for follow up. |
| • | Renovation Experts We offer a premium lead generation service specific to contractors, homebuilders and remodeling professionals. We provide a competitive marketplace that matches homeowners in need of remodeling services with qualified contractors in their local area. Through a subscription-based membership model and per-lead acquisitions, contractors purchase these leads, giving them an opportunity to bid on the homeowner’s project. |
eCommerce
We provide a comprehensive set of products and services that enable eCommerce merchants to sell more on the internet. By coordinating and integrating eCommerce website design and development, internet marketing,
7
TABLE OF CONTENTS
customer service and back-end order management, we can enable eCommerce merchants to have a complete online store solution by providing support and development on multiple eCommerce platforms.
| • | eCommerce Website Design and Development |
Customers work directly with our store development project managers, designers and programmers to build high-end custom eCommerce stores. Business and customer security is a top priority, and all Web.com eCommerce sites meet Visa International’s Payment Card Industry (PCI) data standards. As end-customer sales increase, our eCommerce call center provides end-customer sales and customer support for our eCommerce merchants, freeing up time and resources for eCommerce merchants to focus on growing their business.
| • | Do-It-Yourself eCommerce Solutions |
We provide a proprietary, professional eCommerce tool that can help businesses begin to sell from their website. This shopping cart system supplies all of the tools necessary to create and operate an online store, including built-in e-mail marketing tools, a marketing module, customizable templates and design capabilities, all fully compliant with the Visa Card Information Security Program (CISP) and PCI security standards. Basic packages include Site Builder, unlimited e-mail addresses, and a minimum, Secure Socket Layer (SSL) for security. More sophisticated users may choose to add additional product capacity, affiliate management, multi-level logins, and Dedicated SSL, as well as the ability to accept credit cards and other merchant services.
| • | Do-It-For-Me eCommerce Solutions |
For customers who wish to outsource their eCommerce needs, we can build eCommerce onto our eWorks! XL bundled website design solution. We can add an online storefront, create an online store catalog and secure shopping cart, help with inventory tracking and management, provide automatic shipping rates and process credit cards. For those who desire a highly customized storefront, we offer custom store design and more sophisticated merchant services.
Other Revenue
Domain names are digital assets that generate advertising cash flow and resale revenue for Web.com. We strive to maximize revenue from domains which are newly registered, purchased from third parties, canceled, expired or retained for our in-house portfolio of domain names.
Web.com offers online advertising opportunities for companies focused on SMBs to be featured on our websites. Since our customers return to our website repeatedly to access their account, seek new products and improve their online knowledge via our learning center, we are in an excellent position to provide targeted display advertising, newsletter advertising, and partner sponsorships.
Sales Channels
The sales organization for our subscription web services and products comprises several distinct sales channels, including:
Outbound and Inbound Telesales. We utilize our telesales organization to cross-sell and up-sell our full product offerings to our entire customer base. In addition, we target customer lists provided by companies with which we have strategic marketing relationships. Our sales staff believes that the relationship these customers have with its strategic partners enhances the ability to reach a decision maker, make a presentation, have their offer considered, and close the sale during the initial call. In addition, we maintain a separate team of sales specialists specifically focused on responding to inbound inquiries generated by programs initiated by the company and its strategic marketing partners through a mix of e-mail, direct mail, website, direct response television (DRTV) and other marketing efforts to help promote services to prospective clients.
8
TABLE OF CONTENTS
Online Channel. We promote our services through the Web.com, Network Solutions.com, Register.com, Leads.com, Leads by Web.com, RenovationExperts.com, 1ShoppingCart.com, SolidCactus.com, Submitawebsite.com and LogoYes.com websites. To drive prospects to these sites, we engage in online marketing and advertising campaigns, and participate in seminars targeting SMBs that wish to sell their services online. Our partners also promote our services by including the company’s products on their websites and by including services in their ongoing marketing and promotional efforts with their customers.
Direct Response Television. We have expanded our efforts of promoting Do-It-For-Me products through television advertising campaigns. In addition to legacy ads supporting eWorks and FacebookTM products, we have branded DRTV spots, which describe us and feature real customers who have derived significant business value from our solutions.
Web.com Tour. In 2012, we entered a 10-year agreement to become the umbrella sponsor of the renamed Web.com Tour (formerly the Nationwide Tour), and an official marketing partner of the PGA TOUR. As a sponsor, our brand name has gained heightened visibility, and we believe this relationship will help us reach our target market of small to medium-sized business owners. In addition, in many Web.com Tour and PGA TOUR markets we host a free, small business forum designed to help small businesses learn how to be successful on the internet, as part of an initiative to bring additional benefit to communities where events are held, which in turn helps reach more of our target market. In February 2013, we entered into an agreement with PGA TOUR professional Jim Furyk to become the Company’s official golf ambassador, with the objective of gaining wider awareness of Web.com and the Web.com Tour. The agreement continues through the 2016 season.
Reseller, Affiliate Network and Private Label Partners. We have developed affiliate partners and resellers who sell our services and provide additional opportunities to up-sell and cross-sell Do-It-For-Me services. We have worked closely with these resellers to develop sales support and fulfillment processes that integrate with the resellers’ sales, service, support, and billing practices. The Company provides ongoing marketing and technical support for its partners to ensure a positive customer experience for their end customers. Additionally, we provide these resellers with training and sales materials to support the web services being offered.
Feet on the StreetWeb.com has a direct sales “Feet on the Street” initiative in eight geographic markets: Phoenix, Arizona, Jacksonville, Florida; Atlanta, Georgia; St. Louis, Missouri; Raleigh, North Carolina; Houston, Texas; San Antonio, Texas; and Herndon, Virginia; and expect to add additional markets in 2013. At present, this sales initiative is focused on selling the Leads by Web.com products and services.
Marketing
We engage in a variety of marketing activities to sell additional services and products to our existing customer base, and to enhance the value we provide to SMB entities. Our marketing activities include:
| • | Targeted e-mail and direct response campaigns to prospects and customers; |
| • | Direct response television advertising; |
| • | Search engine and other online advertising; |
| • | Electronic customer newsletters; |
| • | Websites: Web.com, NetworkSolutions.com, Register.com, Leads.com, Leads by Web.com, 1ShoppingCart.com, RenovationExperts.com, SolidCactus.com, LogoYes.com; and Submitawebsite.com; |
| • | Online customer tutorials; and |
9
TABLE OF CONTENTS
Customers
As of December 31, 2012, we had just over 3 million customers. We generally target SMBs that are primarily focused on their regional or local markets. We also target SMBs with significant monthly spending on local print yellow pages advertising. We seek to create long-term relationships with these businesses by helping them locate new customers at a significantly lower cost per lead compared to traditional print yellow pages marketing campaigns.
Data Security
We maintain major operational facilities in Jacksonville, Florida; Atlanta, Georgia; Herndon, Virginia; Spokane, Washington; Hazleton, Pennsylvania; Barrie, Ontario; and Yarmouth, Nova Scotia for most of our internal operations. These facilities are monitored through our redundant Network Operations Centers (NOC) staffed 24 hours a day, seven days a week. The servers that provide our customers’ website data to the internet are located within third-party co-location facilities located in Jacksonville, Florida; Atlanta, Georgia, and Sterling, Virginia. These co-location facilities have a secured network infrastructure including intrusion detection at the router level, full network traffic monitoring, data collection and event reporting. Our contract obligates our co-location provider to provide us a secured space within their overall data center. The facilities are secured through card-key numeric entry and biometric access. Infrared detectors are used throughout the facility. In addition, the co-location facilities are staffed 24 hours a day, seven days a week, with experts to manage and monitor the carrier networks and network access. The co-location facilities also provide multiple internet carriers to help ensure bandwidth availability to our customers. The availability of electric power at the co-location facilities is provided through multiple uninterruptible power supply and generator systems should power supply fail at any of our major facilities. In 2012, we started building out two centralized data centers that are expected to be completed during the first half of 2013.
Customer data is redundant through the use of multiple application and web servers. Customer data is backed up to other disk arrays with fail-over to help ensure high availability. Customer data is also maintained at our national design center and can be republished from archival data at any time. Currently, this process could take approximately 24 hours. Our financial system reporting also uses redundant systems and can be reconstituted in approximately 12 hours. Our customer data is stored on systems that are compliant and certified to meet Visa Card Information Security Program (CISP) and Visa International’s Payment Card Industry Data Standards (PCI). Furthermore, we have a highly available redundant infrastructure, which provides disaster recovery backup to prevent a disruption to our customers.
We continue to work on plans to provide active load balancing and built in disaster-recovery operations between our Atlanta and Jacksonville co-location sites. Under this scenario, a full copy of data would be backed up at each site. Each co-location site would provide fail-over capability for the other to prevent a disruption of our customers’ websites should either co-location site become unavailable.
Third-Party Providers
We offer some of our services to our customers through third-party technology vendors, which enable us to expand our services and create additional revenue opportunities. We do not have long-term contracts with any of these third parties. Accordingly, we or any of these providers can terminate the relationship at any time, for any reason or no reason, on short notice, often as little as 30 days. If any of these relationships terminate, we may need to seek an alternative provider of services or develop the covered services independently.
Competition
The market for web services is highly competitive and evolving. We expect competition to increase from existing competitors as well as new market entrants. Most existing competitors typically offer a limited number of specialized solutions and services, but may provide a more comprehensive set of services in the future. These competitors include, among others, website designers, domain name registrars, internet service providers, internet search engine providers, local business directory providers, eCommerce service providers, lead generation companies and hosting companies. Among the large number of companies we compete with are; Endurance International Group; 1&1 Internet; GoDaddy; and ReachLocal, Inc. Some of our competitors may have greater resources, more brand recognition, and larger installed bases of customers than we do, and we cannot ensure that we will be able to compete favorably against them or our other competitors.
10
TABLE OF CONTENTS
We believe the principal competitive factors in the SMB segment of the web services and online marketing and lead generation industry include:
| • | Value, breadth and flexibility of the service offerings; |
| • | Proprietary workflow processes and customer relationship management software; |
| • | Brand name and reputation; |
| • | Quality of customer support; |
| • | Speed of customer service; |
| • | Ease of implementation, use, and maintenance; and |
| • | Industry expertise and focus. |
Intellectual Property
Our success and ability to compete is dependent in significant part on our ability to develop and maintain the proprietary aspects of our technology and operate without infringing upon the proprietary rights of others. We currently rely primarily on a combination of copyright, trade secret and trademark laws, confidentiality procedures, contractual provisions, and other similar measures to protect our proprietary information. As of December 31, 2012, we owned 25 issued U.S. patents. We also have several additional patent applications pending but not yet issued. Due to the rapidly changing nature of applicable technologies, we believe that the improvement of existing offerings, reliance upon trade secrets and unpatented proprietary know-how and development of new offerings generally will continue to be our principal source of proprietary protection. While we have hired third-party contractors to help develop our software and to design websites, we own the intellectual property created by these contractors. Our software is not substantially dependent on any third-party software, although our software does utilize open source code. Notwithstanding the use of this open source code, we do not believe our usage requires public disclosure of our own source code nor do we believe the use of open source code is material to our business.
We also have an ongoing service mark and trademark registration program pursuant to which we register some of our product names, slogans and logos in the United States and in some foreign countries. License agreements for our software include restrictions intended to protect our intellectual property. These licenses are generally non-transferable and are perpetual. In addition, we require all of our employees, contractors and many of those with whom we have business relationships to sign non-disclosure and confidentiality agreements and to assign to us in writing all inventions created while working for us. Some of our products also include third-party software that we obtain the rights to use through license agreements. In such cases, we have the right to distribute or sublicense the third-party software with our products.
We have entered into confidentiality and other agreements with our employees and contractors, including agreements in which the employees and contractors assign their rights in inventions to us. We have also entered into nondisclosure agreements with suppliers, distributors and some customers to limit access to and disclosure of our proprietary information. Nonetheless, neither the intellectual property laws nor contractual arrangements, nor any of the other steps we have taken to protect our intellectual property can ensure that others will not use our technology, or that others will not develop similar technologies.
We license, or lease from others, many technologies used in our services. We expect that we and our customers could be subject to third-party infringement claims as the number of websites and third-party service providers for web-based businesses grows. Although we do not believe that our technologies or services infringe on the proprietary rights of any third parties, we cannot ensure that third parties will not assert claims against us in the future or that these claims will not be successful.
Employees
As of December 31, 2012, we had approximately 1,900 employees. None of our employees are represented by unions. We consider the relationship with our employees to be good and have not experienced interruptions of operations due to labor disagreements.
11
TABLE OF CONTENTS
Corporate Information
Web.com Group, Inc. was incorporated under the General Corporation Law of the State of Delaware on March 2, 1999 as Website Pros, Inc. Our principal offices are located at 12808 Gran Bay Parkway West, Jacksonville, Florida 32258. Our telephone number is (904) 680-6600 and our website is located atwww.web.com. Our website and the information contained therein or connected thereto shall not be deemed to be incorporated into this Form 10-K.
We make available free of charge on or through our internet website our annual reports on Form 10-K, quarterly reports on Form 10-Q, current reports on Form 8-K and all amendments to those reports as soon as reasonably practicable after such material is electronically filed with or furnished to the Securities Exchange Commission (SEC).
You may read and copy this Form 10-K at the SEC’s public reference room at 100 F Street, NE, Washington D.C. 20549. Information on the operation of the public reference room can be obtained by calling the SEC at 1-800-SEC-0330. The SEC maintains an internet site that contains reports, proxy and information statements and other information regarding our filings atwww.sec.gov.
Item 1A. Risk Factors.
In evaluating Web.com and our business, you should carefully consider the risks and uncertainties set forth below, together with all of the other information in this report, including the risks discussed in “Management’s Discussion and Analysis of Financial Condition and Results of Operations” and our consolidated financial statements and related notes. The risks and uncertainties described below are not the only ones we face. If any of the following risks occur, our business, financial condition, operating results, and prospects could be materially harmed. In that event, the price of our common stock could decline, and you could lose part or all of your investment.
In the future, we may be unable to generate sufficient cash flow to satisfy our debt service obligations.
As of December 31, 2012, we had $700.9 million of outstanding long-term debt. Our ability to generate cash flow from operations to make principal and interest payments on our debt will depend on our future performance, which will be affected by a range of economic, competitive and business factors. If our operations do not generate sufficient cash flow from operations to satisfy our debt service obligations, we may need to seek additional capital to make these payments or undertake alternative financing plans, such as refinancing or restructuring our debt, selling assets or reducing or delaying capital investments and acquisitions. We cannot assure you that such additional capital or alternative financing will be available on favorable terms, if at all. Our inability to generate sufficient cash flow from operations or obtain additional capital or alternative financing on acceptable terms could have a material adverse effect on our business, financial condition and results of operations.
Charges to earnings resulting from acquisitions may adversely affect our operating results.
One of our business strategies is to acquire complementary services, technologies or businesses and we have a history of such acquisitions. Under applicable accounting, we allocate the total purchase price of a particular acquisition to an acquired company’s net tangible assets and intangible assets based on their fair values as of the date of the acquisition, and record the excess of the purchase price over those fair values as goodwill. Our management’s estimates of fair value are based upon assumptions believed to be reasonable but are inherently uncertain. Going forward, the following factors, among others, could result in material charges that would adversely affect our financial results:
| • | charges for the amortization of identifiable intangible assets and for stock-based compensation; |
| • | accrual of newly identified pre-merger contingent liabilities that are identified subsequent to the finalization of the purchase price allocation; and |
| • | charges to income to eliminate certain of our pre-merger activities that duplicate those of the acquired company or to reduce our cost structure. |
12
TABLE OF CONTENTS
Additional costs may include costs of employee redeployment, relocation and retention, including salary increases or bonuses, accelerated amortization of deferred equity compensation and severance payments, reorganization or closure of facilities, taxes and termination of contracts that provide redundant or conflicting services. Some of these costs may have to be accounted for as expenses that would decrease our net income and earnings per share for the periods in which those adjustments are made.
Our operating results are difficult to predict and fluctuations in our performance may result in volatility in the market price of our common stock.
Due to our evolving business model, and the unpredictability of our evolving industry, our operating results are difficult to predict. We expect to experience fluctuations in our operating and financial results due to a number of factors, such as:
| • | our ability to retain and increase sales to existing customers, attract new customers, and satisfy our customers’ requirements; |
| • | the renewal rates and renewal terms for our services; |
| • | changes in our pricing policies; |
| • | the introduction of new services and products by us or our competitors; |
| • | our ability to hire, train and retain members of our sales force; |
| • | the rate of expansion and effectiveness of our sales force; |
| • | technical difficulties or interruptions in our services; |
| • | general economic conditions; |
| • | additional investment in our services or operations; |
| • | ability to successfully identify acquisition targets and integrate acquired businesses and technologies; and |
| • | our success in maintaining and adding strategic marketing relationships. |
These factors and others all tend to make the timing and amount of our revenue unpredictable and may lead to greater period-to-period fluctuations in revenue than we have experienced historically.
Additionally, in light of current global and U.S. economic conditions, we believe that our quarterly revenue and results of operations are likely to vary significantly in the future and that period-to-period comparisons of our operating results may not be meaningful. The results of one quarter may not be relied on as an indication of future performance. If our quarterly revenue or results of operations fall below the expectations of investors or securities analysts, the price of our common stock could decline substantially.
We may expand through acquisitions of, or investments in, other companies or technologies, which may result in additional dilution to our stockholders and consume resources that may be necessary to sustain our business.
One of our business strategies is to acquire complementary services, technologies or businesses. In connection with one or more of those transactions, we may:
| • | issue additional equity securities that would dilute our stockholders; |
| • | use cash that we may need in the future to operate our business; and |
| • | incur debt that could have terms unfavorable to us or that we might be unable to repay. |
Business acquisitions also involve the risk of unknown liabilities associated with the acquired business. In addition, we may not realize the anticipated benefits of any acquisition, including securing the services of key employees. Incurring unknown liabilities or the failure to realize the anticipated benefits of an acquisition could seriously harm our business.
13
TABLE OF CONTENTS
We rely heavily on the reliability, security, and performance of our internally developed systems and operations, and any difficulties in maintaining these systems may result in service interruptions, decreased customer service, or increased expenditures.
The software and workflow processes that underlie our ability to deliver our web services and products have been developed primarily by our own employees. The reliability and continuous availability of these internal systems are critical to our business, and any interruptions that result in our inability to timely deliver our web services or products, or that materially impact the efficiency or cost with which we provide these web services and products, would harm our reputation, profitability, and ability to conduct business. In addition, many of the software systems we currently use will need to be enhanced over time or replaced with equivalent commercial products, either of which could entail considerable effort and expense. If we fail to develop and execute reliable policies, procedures, and tools to operate our infrastructure, we could face a substantial decrease in workflow efficiency and increased costs, as well as a decline in our revenue.
We have a risk of system and internet failures, which could harm our reputation, cause our customers to seek reimbursement for services paid for and not received, and cause our customers to seek another provider for services.
We must be able to operate the systems that manage our network around the clock without interruption. Our operations depend upon our ability to protect our network infrastructure, equipment, and customer files against damage from human error, fire, earthquakes, hurricanes, floods, power loss, telecommunications failures, sabotage, intentional acts of vandalism and similar events. Our networks are currently subject to various points of failure. For example, a problem with one of our routers (devices that move information from one computer network to another) or switches could cause an interruption in the services that we provide to some or all of our customers. In the past, we have experienced periodic interruptions in service. We have also experienced, and in the future we may again experience, delays or interruptions in service as a result of the accidental or intentional actions of internet users, current and former employees, or others. Any future interruptions could:
| • | cause customers or end users to seek damages for losses incurred; |
| • | require us to replace existing equipment or add redundant facilities; |
| • | damage our reputation for reliable service; |
| • | cause existing customers to cancel their contracts; or |
| • | make it more difficult for us to attract new customers. |
If our security measures are breached, our services may be perceived as not being secure, and our business and reputation could suffer.
Our web services involve the storage and transmission of our customers’ proprietary information. It is critical to our business strategy that our facilities and infrastructure remain secure and are perceived by the marketplace to be secure. Although we employ data encryption processes, an intrusion detection system, and other internal control procedures to assure the security of our customers’ data, we cannot guarantee that these measures will be sufficient for this purpose. We have expended significant time and money on the security of our facilities and infrastructure. If our security measures are breached as a result of third-party action, employee error or otherwise, and as a result our customers’ data becomes available to unauthorized parties, we could incur liability and our reputation would be damaged, which could lead to the loss of current and potential customers. If we experience any breaches of our network security or sabotage, we might be required to expend significant capital and other resources to remedy, protect against or alleviate these and related problems, and we may not be able to remedy these problems in a timely manner, or at all. Because techniques used by outsiders to obtain unauthorized network access or to sabotage systems change frequently and generally are not recognized until launched against a target, we may be unable to anticipate these techniques or implement adequate preventative measures.
14
TABLE OF CONTENTS
If internet usage does not grow or if the internet does not continue to be the standard for ecommerce, our business may suffer.
Our success depends upon the continued development and acceptance of the internet as a widely used medium for ecommerce and communication. Rapid growth in the uses of, and interest in, the internet is a relatively recent phenomenon and its continued growth cannot be assured. A number of factors could prevent continued growth, development and acceptance, including:
| • | the unwillingness of companies and consumers to shift their purchasing from traditional vendors to online vendors; |
| • | the internet infrastructure may not be able to support the demands placed on it, and its performance and reliability may decline as usage grows; |
| • | security and authentication issues may create concerns with respect to the transmission over the internet of confidential information; and |
| • | privacy concerns, including those related to the ability of websites to gather user information without the user’s knowledge or consent, may impact consumers’ willingness to interact online. |
Any of these issues could slow the growth of the internet, which could limit our growth and revenues.
If we cannot adapt to technological advances, our web services and products may become obsolete and our ability to compete would be impaired.
Changes in our industry occur very rapidly, including changes in the way the internet operates or is used by SMBs and their customers. As a result, our web services and products could become obsolete quickly. The introduction of competing products employing new technologies and the evolution of new industry standards could render our existing products or services obsolete and unmarketable. To be successful, our web services and products must keep pace with technological developments and evolving industry standards, address the ever-changing and increasingly sophisticated needs of our customers, and achieve market acceptance. If we are unable to develop new web services or products, or enhancements to our web services or products, on a timely and cost-effective basis, or if new web services or products or enhancements do not achieve market acceptance, our business would be seriously harmed.
Providing web services and products to SMBs designed to allow them to internet-enable their businesses is a new and emerging market; if this market fails to develop, we will not be able to grow our business.
Our success depends on a significant number of SMB outsourcing website design, hosting, and management as well as adopting other online business solutions. The market for our web services and products is relatively new and untested. Custom website development has been the predominant method of internet enablement, and SMBs may be slow to adopt our template-based web services and products. Further, if SMBs determine that having an online presence is not giving their businesses an advantage; they would be less likely to purchase our web services and products. If the market for our web services and products fails to grow or grows more slowly than we currently anticipate, or if our web services and products fail to achieve widespread customer acceptance, our business would be seriously harmed.
Our failure to build brand awareness quickly could compromise our ability to compete and to grow our business.
As a result of the highly competitive nature of our market, and the likelihood that we may face competition from new entrants with well established brands, we believe our own brand name recognition and reputation are important. If we do not continue to build brand awareness quickly, we could be placed at a competitive disadvantage to companies whose brands are more recognizable than ours.
A portion of our web services are sold on a month-to-month basis, and if our customers are unable or choose not to subscribe to our web services, our revenue may decrease.
A portion of our web service offerings are sold pursuant to month-to-month subscription agreements and our customers generally can cancel their subscriptions to our web services at any time with little or no penalty.
15
TABLE OF CONTENTS
While we cannot determine with certainty why our subscription renewal rates are not higher, we believe there are a variety of factors, which have in the past led, and may in the future lead, to a decline in our subscription renewal rates. These factors include the cessation of our customers’ businesses, the overall economic environment in the United States and its impact on SMBs, the services and prices offered by us and our competitors, and the evolving use of the internet by SMBs. If our renewal rates are low or decline for any reason, or if customers demand renewal terms less favorable to us, our revenue may decrease, which could adversely affect our financial performance.
We were not profitable for the years ended December 31, 2012, 2011 and 2010 and we may not become or stay profitable in the future.
Although we generated net income for the year ended December 31, 2009, we were not profitable for the years ended December 31, 2012, 2011 and 2010, and may not be profitable in future years. As of December 31, 2012, we had an accumulated deficit of approximately $292.5 million. We expect that our expenses relating to the sale and marketing of our web services, technology improvements and general and administrative functions, as well as the costs of operating and maintaining our technology infrastructure, will increase in the future. Accordingly, we will need to increase our revenue to be able to again achieve and, if achieved, to later maintain profitability. We may not be able to reduce in a timely manner or maintain our expenses in response to any decrease in our revenue, and our failure to do so would adversely affect our operating results and our level of profitability.
Weakened global economic conditions may harm our industry, business and results of operations.
Our overall performance depends in part on worldwide economic conditions, which may remain challenging for the foreseeable future. Global financial developments seemingly unrelated to us or our industry may harm us. The United States and other key international economies have been impacted by falling demand for a variety of goods and services, restricted credit, poor liquidity, reduced corporate profitability, volatility in credit, equity and foreign exchange markets, bankruptcies and overall uncertainty with respect to the economy. These conditions affect spending and could adversely affect our customers’ ability or willingness to purchase our service, delay prospective customers’ purchasing decisions, reduce the value or duration of their subscriptions, or affect renewal rates, all of which could harm our operating results.
Our existing and target customers are SMBs. We believe these businesses are more likely to be significantly affected by economic downturns than larger, more established businesses. For instance, a financial crisis affecting the banking system or financial markets or the possibility that financial institutions may consolidate or go out of business would result in a tightening in the credit markets, which could limit our customers’ access to credit. Additionally, these customers often have limited discretionary funds, which they may choose to spend on items other than our web services and products. If SMBs experience economic hardship, or if they behave more conservatively in light of the general economic environment, they may be unwilling or unable to expend resources to develop their online presences, which would negatively affect the overall demand for our services and products and could cause our revenue to decline.
If we fail to comply with the established rules of credit card associations, we will face the prospect of financial penalties and could lose our ability to accept credit card payments from customers, which would have a material adverse effect on our business, financial condition and results of operations.
A substantial majority of our revenue originates from online credit card transactions. For example, under current credit card industry practices, we are liable for fraudulent and disputed credit card transactions because we do not obtain the cardholder’s signature at the time of the transaction, even though the financial institution issuing the credit card may have authorized the transaction. Under credit card association rules, penalties may be imposed at the discretion of the association. Any such potential penalties would be imposed on our credit card processor by the association. Under our contract with our processor, we are required to reimburse our processor for such penalties. As of December 31, 2012, our compliance with the established rules is within the guidelines established by the credit card associations. However, we face the risk that one or more credit card associations may, at any time, assess penalties against us or terminate our ability to accept credit card payments from customers, which would have a material adverse effect on our business, financial condition and results of operations.
16
TABLE OF CONTENTS
The failure to integrate successfully the businesses of Web.com and an acquired company, if any, in the future within the expected timeframe would adversely affect the combined company’s future results.
The success of any future acquisition will depend, in large part, on the ability of the combined company to realize the anticipated benefits, including annual net operating synergies, from combining the businesses of Web.com and the acquired company. To realize these anticipated benefits, the combined company must successfully integrate the businesses of Web.com and an acquired company. This integration will be complex and time consuming.
The failure to integrate successfully and to manage successfully the challenges presented by the integration process may result in the combined company’s failure to achieve some or all of the anticipated benefits of the acquisition.
Potential difficulties that may be encountered in the integration process include the following:
| • | lost sales and customers as a result of customers of either of the two companies deciding not to do business with the combined company; |
| • | complexities associated with managing the larger, more complex, combined business; |
| • | integrating personnel from the two companies while maintaining focus on providing consistent, high quality services and products; |
| • | potential unknown liabilities and unforeseen expenses, delays or regulatory conditions associated with the acquisition; and |
| • | performance shortfalls at one or both of the companies as a result of the diversion of management’s attention caused by completing the acquisition and integrating the companies’ operations. |
Integrating Web.com and an acquired company may divert management’s attention away from the combined company’s operations.
Successful integration of Web.com’s and an acquired company’s operations, products and personnel may place a significant burden on the combined company’s management and internal resources. Challenges of integration include the combined company’s ability to incorporate acquired products and business technology into its existing product offerings, and its ability to sell the acquired products through Web.com’s existing or acquired sales channels. Web.com may also experience difficulty in effectively integrating the different cultures and practices of the acquired company, as well as in assimilating its’ broad and geographically dispersed personnel. Further, the difficulties of integrating the acquired company could disrupt the combined company’s ongoing business, distract its management focus from other opportunities and challenges, and increase the combined company’s expenses and working capital requirements. The diversion of management attention and any difficulties encountered in the transition and integration process could harm the combined company’s business, financial condition and operating results.
We may not realize the anticipated benefits from an acquisition.
Acquisitions involve the integration of companies that have previously operated independently. We expect that acquisitions may result in financial and operational benefits, including increased revenue, cost savings and other financial and operating benefits. We cannot be certain, however, that we will be able to realize increased revenue, cost savings or other benefits from any acquisition, or, to the extent such benefits are realized, that they are realized timely or to the same degree as we anticipated. Integration may also be difficult, unpredictable, and subject to delay because of possible cultural conflicts and different opinions on product roadmaps or other strategic matters. We may integrate or, in some cases, replace, numerous systems, including those involving management information, purchasing, accounting and finance, sales, billing, employee benefits, payroll and regulatory compliance, many of which may be dissimilar. Difficulties associated with integrating an acquisition’s service and product offering into ours, or with integrating an acquisition’s operations into ours, could have a material adverse effect on the combined company and the market price of our common stock.
17
TABLE OF CONTENTS
Our business depends in part on our ability to continue to provide value-added web services and products, many of which we provide through agreements with third parties, and our business will be harmed if we are unable to provide these web services and products in a cost-effective manner.
A key element of our strategy is to combine a variety of functionalities in our web service offerings to provide our customers with comprehensive solutions to their online presence needs, such as internet search optimization, local yellow pages listings, and eCommerce capability. We provide many of these services through arrangements with third parties, and our continued ability to obtain and provide these services at a low cost is central to the success of our business. For example, we currently have agreements with several service providers that enable us to provide, at a low cost, internet yellow pages advertising. However, these agreements may be terminated on short notice, typically 30 to 90 days, and without penalty. If any of these third parties were to terminate their relationships with us, or to modify the economic terms of these arrangements, we could lose our ability to provide these services at a cost-effective price to our customers, which could cause our revenue to decline or our costs to increase.
Our data centers are maintained by third parties. A disruption in the ability of one of these service providers to provide service to us could cause a disruption in service to our customers.
A substantial portion of the network services and computer servers we utilize in the provision of services to customers are housed in data centers owned by other service providers. In particular, a significant number of our servers are housed in data centers in Atlanta, Georgia; Jacksonville, Florida; and Sterling, Virginia. We obtain internet connectivity for those servers, and for the customers who rely on those servers, in part through direct arrangements with network service providers and in part indirectly through the owners of those data centers. We also utilize other third-party data centers in other locations. In the future, we may house other servers and hardware items in facilities owned or operated by other service providers.
A disruption in the ability of one of these service providers to provide service to us could cause a disruption in service to our customers. A service provider could be disrupted in its operations through a number of contingencies, including unauthorized access, computer viruses, accidental or intentional actions, electrical disruptions, and other extreme conditions. Although we believe we have taken adequate steps to protect our business through contractual arrangements with our service providers, we cannot eliminate the risk of a disruption in service resulting from the accidental or intentional disruption in service by a service provider. Any significant disruption could cause significant harm to us, including a significant loss of customers. In addition, a service provider could raise its prices or otherwise change its terms and conditions in a way that adversely affects our ability to support our customers or could result in a decrease in our financial performance.
We face intense and growing competition. If we are unable to compete successfully, our business will be seriously harmed.
The market for our web services and products is highly competitive and is characterized by relatively low barriers to entry. Our competitors vary in terms of their size and what services they offer. We encounter competition from a wide variety of company types, including:
| • | website design and development service and software companies; |
| • | internet service providers and application service providers; |
| • | internet search engine providers; |
| • | local business directory providers; |
| • | website domain name providers and hosting companies; and |
| • | eCommerce platform and service providers. |
In addition, due to relatively low barriers to entry in our industry, we expect the intensity of competition to increase in the future from both established and emerging companies. Increased competition may result in reduced gross margins, the loss of market share, or other changes which could seriously harm our business. We also expect that competition will increase as a result of industry consolidations and formations of alliances among industry participants.
18
TABLE OF CONTENTS
Many of our current and potential competitors have longer operating histories, significantly greater financial, technical, marketing and other resources, greater brand recognition and, we believe, a larger installed base of customers. These competitors may be able to adapt more quickly to new or emerging technologies and changes in customer requirements. They may also be able to devote greater resources to the promotion and sale of their services and products than we can. If we fail to compete successfully against current or future competitors, our revenue could increase less than anticipated or decline and our business could be harmed.
Our business could be materially harmed if the administration and operation of the internet no longer rely upon the existing domain system.
The domain registration industry continues to develop and adapt to changing technology. This development may include changes in the administration or operation of the internet, including the creation and institution of alternate systems for directing internet traffic without the use of the existing domain system. The widespread acceptance of any alternative systems could eliminate the need to register a domain to establish an online presence and could materially adversely affect our business, financial condition and results of operations.
Our business could be affected by new governmental regulations regarding the internet
To date, government regulations have not materially restricted use of the internet in most parts of the world. The legal and regulatory environment pertaining to the internet, however, is uncertain and may change. New laws may be passed, existing but previously inapplicable laws may be deemed to apply to the internet, or existing legal safe harbors may be narrowed, both by U.S. federal or state governments and by governments of foreign jurisdictions. These changes could affect:
| • | the liability of online resellers for actions by customers, including fraud, illegal content, spam, phishing, libel and defamation, infringement of third-party intellectual property and other abusive conduct; |
| • | other claims based on the nature and content of internet materials; |
| • | user privacy and security issues; |
| • | sales and other taxes, including the value-added tax of the European Union member states; |
| • | characteristics and quality of services; and |
The adoption of any new laws or regulations, or the application or interpretation of existing laws or regulations to the internet, could hinder growth in use of the internet and online services generally, and decrease acceptance of the internet and online services as a means of communications, ecommerce and advertising. In addition, such changes in laws could increase our costs of doing business, subject our business to increased liability or prevent us from delivering our services over the internet, thereby harming our business and results of operations.
We could become involved in claims, lawsuits or investigations that may result in adverse outcomes.
We may become involved in claims, such as lawsuits and investigations, involving but not limited to general business, patents, or employee matters. Such proceedings may initially be viewed as immaterial but could prove to be material. Litigation is inherently unpredictable, and excessive verdicts do occur. Adverse outcomes in lawsuits and investigations could result in significant monetary damages, including indemnification payments, or injunctive relief that could adversely affect our ability to conduct our business and may have a material adverse effect on our financial condition and results of operations. Given the inherent uncertainties in litigation, even when we are able to reasonably estimate the amount of possible loss or range of loss and therefore record an aggregate litigation accrual for probable and reasonably estimable loss contingencies, the accrual may change in the future due to new developments or changes in approach. In addition, such investigations, claims and lawsuits could involve significant expense and diversion of management’s attention and resources from other matters.
19
TABLE OF CONTENTS
We may be unable to protect our intellectual property adequately or cost-effectively, which may cause us to lose market share or otherwise harm our competitive position.
Our success depends, in part, on our ability to protect and preserve the proprietary aspects of our technology, web services, and products. If we are unable to protect our intellectual property, our competitors could use our intellectual property to market services and products similar to those offered by us, which could decrease demand for our web services and products. We may be unable to prevent third parties from using our proprietary assets without our authorization. While we do rely on patents acquired from the Web.com acquisition, we do not currently rely on patents to protect all of our core intellectual property. To protect, control access to, and limit distribution of our intellectual property, we generally enter into confidentiality and proprietary inventions agreements with our employees, and confidentiality or license agreements with consultants, third-party developers, and customers. We also rely on copyright, trademark, and trade secret protection. However, these measures afford only limited protection and may be inadequate. Enforcing our rights to our technology could be costly, time-consuming and distracting. Additionally, others may develop non-infringing technologies that are similar or superior to ours. Any significant failure or inability to adequately protect our proprietary assets will harm our business and reduce our ability to compete.
We might require additional capital to support business growth, and this capital might not be available on acceptable terms, or at all.
We intend to continue to make investments to support our business growth and may require additional funds to respond to business challenges, including the need to develop new services and products or enhance our existing web services, enhance our operating infrastructure and acquire complementary businesses and technologies. Accordingly, we may need to engage in equity or debt financings to secure additional funds.
The global financial crisis, which included, among other things, significant reductions in available capital and liquidity from banks and other providers of credit and substantial reductions or fluctuations in equity and currency values worldwide, may make it difficult for us to obtain additional financing on terms favorable to us, if at all. If we raise additional funds through further issuances of equity or convertible debt securities, our existing stockholders could suffer significant dilution, and any new equity securities we issue could have rights, preferences and privileges superior to those of holders of our common stock. Any debt financing secured by us in the future could involve restrictive covenants relating to our capital raising activities and other financial and operational matters, which may make it more difficult for us to obtain additional capital and to pursue business opportunities, including potential acquisitions. If we are unable to obtain adequate financing or financing on terms satisfactory to us, when we require it, our ability to continue to support our business growth and to respond to business challenges could be significantly impaired.
The Company’s ability to use its net operating loss (NOL) carry forwards to offset future taxable income for U.S. federal income tax purposes may be limited if taxable income does not reach a sufficient level, or as a result of a change in control which could limit available NOLs.
As of December 31, 2012, the Company has Federal net operating loss carry forwards (“NOLs”) of approximately $300.4 million (excluding $30.8 million related to excess tax benefits for stock-based compensation tax deductions in excess of book compensation which will be credited to additional paid-in capital when such deductions reduce taxes payable, as determined on a “with-and-without” basis) available to offset future taxable income which expire between 2020 and 2032. The NOLs are subject to various limitations under Section 382 of the Internal Revenue Code of 1986, as amended (the “Code”). Accordingly, the Company estimates that at least $246.8 million of the NOLs will be available during the carry forward period based on our existing Section 382 limitations. As of December 31, 2012, our valuation allowance includes $117.4 million of these NOLs as it is not more likely than not that this portion of the NOLs will be realized based on the expected reversals of our existing deferred tax liabilities and current Section 382 limits.
Section 382 of the Code imposes an annual limitation on the amount of post-ownership change taxable income generated that may be offset with pre-ownership change NOLs of the corporation that experiences an ownership change. The limitation imposed by Section 382 of the Code for any post-ownership change year generally would be determined by multiplying the value of such corporation’s stock immediately before the ownership change by the applicable long-term tax-exempt rate. Any unused annual limitation may, subject to
20
TABLE OF CONTENTS
certain limits, be carried over to later years, and the limitation may, under certain circumstances, be increased by built-in gains or reduced by built-in losses in the assets held by such corporation at the time of the ownership change.
If the Company experiences any future “ownership change” as defined in Section 382 of the Code, the Company’s ability to utilize its NOLs could be further limited depending on several factors, including but not limited to, the amount of taxable income generated during any post-ownership change year and the annual limitation discussed above. Similar results could apply to our state NOLs because the states in which we operate generally follow Section 382.
Additionally, the Company’s ability to use its NOLs will also depend on the amount of taxable income generated in future periods. The NOLs may expire before the Company can generate sufficient taxable income to utilize the NOLs.
Any growth could strain our resources and our business may suffer if we fail to implement appropriate controls and procedures to manage our growth.
Growth in our business may place a strain on our management, administrative, and sales and marketing infrastructure. If we fail to successfully manage our growth, our business could be disrupted, and our ability to operate our business profitably could suffer. Growth in our employee base may be required to expand our customer base and to continue to develop and enhance our web service and product offerings. To manage growth of our operations and personnel, we would need to enhance our operational, financial, and management controls and our reporting systems and procedures. This would require additional personnel and capital investments, which would increase our cost base. The growth in our fixed cost base may make it more difficult for us to reduce expenses in the short term to offset any shortfalls in revenue.
If we fail to maintain an effective system of internal controls, we may not be able to accurately or timely report our financial results, which could cause our stock price to fall or result in our stock being delisted.
Effective internal controls are necessary for us to provide reliable and accurate financial reports. We will need to devote significant resources and time to comply with the requirements of Sarbanes-Oxley with respect to internal control over financial reporting. In addition, Section 404 under Sarbanes-Oxley requires that we assess and our auditors attest to the design and operating effectiveness of our internal control over financial reporting. Our ability to comply with the annual internal control report requirement for our fiscal year ending on December 31, 2013 will depend on the effectiveness of our financial reporting and data systems and controls across our company and our operating subsidiaries. We expect these systems and controls to become increasingly complex as we integrate acquisitions and our business grows. To effectively manage this complexity, we will need to continue to improve our operational, financial, and management controls and our reporting systems and procedures. Any failure to implement required new or improved controls, or difficulties encountered in the implementation or operation of these controls, could harm our operating results or cause us to fail to meet our financial reporting obligations, which could adversely affect our business and jeopardize our listing on the NASDAQ Global Select Market, either of which would harm our stock price.
We are dependent on our executive officers, and the loss of any key member of this team may compromise our ability to successfully manage our business and pursue our growth strategy.
Our future performance depends largely on the continuing service of our executive officers and senior management team, especially that of David Brown, our Chief Executive Officer. Our executives are not contractually obligated to remain employed by us. Accordingly, any of our key employees could terminate their employment with us at any time without penalty and may go to work for one or more of our competitors after the expiration of their non-compete period. The loss of one or more of our executive officers could make it more difficult for us to pursue our business goals and could seriously harm our business.
Our growth will be adversely affected if we cannot continue to successfully retain, hire, train, and manage our key employees, particularly in the telesales and customer service areas.
Our ability to successfully pursue our growth strategy will depend on our ability to attract, retain, and motivate key employees across our business. We have many key employees throughout our organization that do not have non-competition agreements and may leave to work for a competitor at any time. In particular,
21
TABLE OF CONTENTS
we are substantially dependent on our telesales and customer service employees to obtain and service new customers. Competition for such personnel and others can be intense, and there can be no assurance that we will be able to attract, integrate, or retain additional highly qualified personnel in the future. In addition, our ability to achieve significant growth in revenue will depend, in large part, on our success in effectively training sufficient personnel in these two areas. New hires require significant training and in some cases may take several months before they achieve full productivity, if they ever do. Our recent hires and planned hires may not become as productive as we would like, and we may be unable to hire sufficient numbers of qualified individuals in the future in the markets where we have our facilities. If we are not successful in retaining our existing employees, or hiring, training and integrating new employees, or if our current or future employees perform poorly, growth in the sales of our services and products may not materialize and our business will suffer.
Impairment of goodwill and other intangible assets would result in a decrease in earnings.
Current accounting rules require that goodwill and other intangible assets with indefinite useful lives may not be amortized, but instead must be tested for impairment at least annually. These rules also require that intangible assets with definite useful lives be amortized over their respective estimated useful lives to their estimated residual values, and reviewed for impairment whenever events or changes in circumstances indicate that the carrying amount of an asset may not be recoverable. We have substantial goodwill and other intangible assets, and we would be required to record a significant charge to earnings in our financial statements during the period in which any impairment of our goodwill or intangible assets is determined. Any impairment charges or changes to the estimated amortization periods could have a material adverse effect on our financial results.
Provisions in our amended and restated certificate of incorporation and bylaws or under Delaware law might discourage, delay, or prevent a change of control of our company or changes in our management and, therefore, depress the trading price of our common stock.
Our amended and restated certificate of incorporation and bylaws contain provisions that could depress the trading price of our common stock by acting to discourage, delay, or prevent a change of control of our company or changes in our management that the stockholders of our company may deem advantageous. These provisions:
| • | establish a classified board of directors so that not all members of our board are elected at one time; |
| • | provide that directors may only be removed for cause and only with the approval of 66 2/3% of our stockholders; |
| • | require super-majority voting to amend some provisions in our amended and restated certificate of incorporation and bylaws; |
| • | authorize the issuance of blank check preferred stock that our board of directors could issue to increase the number of outstanding shares to discourage a takeover attempt; |
| • | prohibit stockholder action by written consent, which requires all stockholder actions to be taken at a meeting of our stockholders; |
| • | provide that the board of directors is expressly authorized to make, alter, or repeal our bylaws; and |
| • | establish advance notice requirements for nominations for elections to our board or for proposing matters that can be acted upon by stockholders at stockholder meetings. |
Additionally, we are subject to Section 203 of the Delaware General Corporation Law, which generally prohibits a Delaware corporation from engaging in any of a broad range of business combinations with any “interested” stockholder for a period of three years following the date on which the stockholder became an “interested” stockholder and which may discourage, delay, or prevent a change of control of our company.
Item 1B. Unresolved Staff Comments.
None.
22
TABLE OF CONTENTS
Item 2. Properties.
The Company owns a 32,780 square foot building in Spokane, Washington, in which a web services sales center is located. In addition, we lease the following principal facilities:
| | | | | | |
| | Location | | Square Feet | | Lease Expiration |
| Headquarters and principal administrative, finance, and marketing operations | | | Jacksonville, FL | | | | 112,306 | | | | July 2019 | |
| Technology administrative center | | | Herndon, VA | | | | 96,304 | | | | December 2020 | |
| Technology administrative center | | | Buenos Aires, Argentina | | | | 10,000 | | | | December 2014 | |
| eCommerce operations center | | | Barrie, Ontario, Canada | | | | 8,301 | | | | May 2015 | |
| Sales and customer support operations center | | | Hazleton, PA | | | | 39,429 | | | | January 2013* | |
| Sales and customer support operations center | | | Yarmouth, Nova Scotia,
Canada | | | | 30,400 | | | | February 2014
| |
| Sales and customer support operations center | | | Belleville, IL | | | | 19,428 | | | | May 2013
| |
| Sales and customer support operations center | | | Halifax, Nova Scotia,
Canada | | | | 13,500 | | | | April 2017 | |
| Sales operations center | | | Scottsdale, AZ | | | | 8,280 | | | | May 2013 | |
| eCommerce operations center | | | Shavertown, PA | | | | 15,641 | | | | March 2013 | |
| Technology administrative center | | | Atlanta, GA | | | | 10,235 | | | | December 2015 | |
| Technology data center | | | Atlanta, GA | | | | 4,000 | | | | May 2021 | |

| * | In January 2013, the lease was renewed through January 2018. |
Item 3. Legal Proceedings.
We and our subsidiaries are named from time to time as defendants in various legal actions that are incidental to our business and arise out of or are related to claims made in connection with intellectual property, our customer and vendor contracts or employment related disputes. We believe that the resolution of these legal actions will not have a material adverse effect on our financial position or results of operations. There were no material legal matters that were reasonably possible and estimable at December 31, 2012. In addition, there were no material legal matters for which an estimate could not be made.
Item 4. Mine Safety Disclosures
Not applicable.
23
TABLE OF CONTENTS
PART II
Item 5. Market for Registrant’s Common Equity, Related Stockholder Matters and Issuer Purchases of Equity Securities.
Market Information
On January 3, 2011, our common stock began trading on the NASDAQ Global Select Market under our “WWWW” symbol. From October 27, 2008 to January 2, 2011, our common stock was listed on the NASDAQ Global Market under the symbol “WWWW”. Prior to October 27, 2008, our common stock was listed on the NASDAQ Global Market under the symbol “WSPI”. Prior to November 1, 2005, there was no public market for our common stock. The following table sets forth the high and low stock prices of our common stock for the last two fiscal years as reported on the NASDAQ Global Select Market, as appropriate.
| | | | | | | | |
| | 2012 | | 2011 |
| | | High | | Low | | High | | Low |
| First Quarter | | $ | 15.49 | | | $ | 10.59 | | | $ | 14.64 | | | $ | 8.12 | |
| Second Quarter | | $ | 18.85 | | | $ | 12.86 | | | $ | 16.01 | | | $ | 9.91 | |
| Third Quarter | | $ | 19.27 | | | $ | 15.40 | | | $ | 12.85 | | | $ | 6.94 | |
| Fourth Quarter | | $ | 18.41 | | | $ | 13.58 | | | $ | 12.25 | | | $ | 6.47 | |
The closing price for our common stock as reported by the NASDAQ Global Select Market on February 28, 2013 was $17.08 per common share. As of February 28, 2013, there were 690 stockholders of record of our common stock, not including those shares held in street or nominee name.
Dividend Policy
We have never declared or paid any cash dividends on our capital stock. We currently intend to retain any future earnings to fund the development and expansion of our business, and therefore we do not anticipate paying cash dividends on our common stock in the foreseeable future. Any future determination to pay dividends will be subject to the limitations set forth in our credit agreements and at the discretion of our board of directors. None of our outstanding capital stock is entitled to any dividends.
Issuer Purchases of Equity Securities
The Company did not repurchase any outstanding common shares during the year ended December 31, 2012.
Stock Performance Graph.
The following graph shows the total stockholder return as of the dates indicated of an investment of $100 in cash on December 31, 2007 for (i) the Company’s common stock, (ii) the Nasdaq Composite Index (iii) the RDG Internet Composite Index and (iv) the Company’s Peer Group. The component companies of the Peer Group are as follows: Savvis, Inc., Monster Worldwide Inc., Rackspace Hosting Inc., Websense, Omniture Inc., United Online Inc., Vistaprint NV, Verisign Inc., WebMD Health Corp., Quinstreet Inc., Digital River Inc., Skillsoft Ltd. and Terremark Worldwide Inc. All values assume reinvestment of the full amount of any dividends, however, no dividends have been declared on our common stock to date. The stock price performance on the graph below is not necessarily indicative of future performance.
24
TABLE OF CONTENTS
COMPARISON OF 5 YEAR CUMULATIVE TOTAL RETURN*
Among Web.com Group, Inc., the NASDAQ Composite Index,
the RDG Internet Composite Index, and a Peer Group
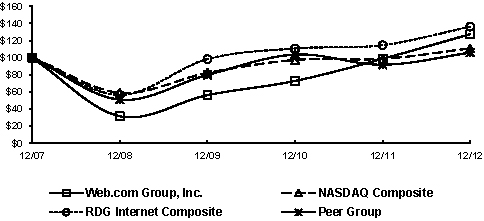
| * | $100 invested on 12/31/07 in stock or index, including reinvestment of dividends. Fiscal year ending December 31. |
Item 6. Selected Financial Data.
| | | | | | | | | | |
| | Year Ended December 31, |
| | | 2012(1,3,5) | | 2011(2-3,5) | | 2010(2-3,5) | | 2009 | | 2008(4) |
| | | (in thousands, except per share data) |
Consolidated Statement of Comprehensive Income:
| | | | | | | | | | | | | | | | | | | | |
| Revenue | | $ | 407,646 | | | $ | 199,205 | | | $ | 120,289 | | | $ | 106,489 | | | $ | 120,114 | |
| Loss from operations | | | (36,010 | ) | | | (40,767 | ) | | | (14,536 | ) | | | (93 | ) | | | (97,077 | ) |
| Net (loss) income from continuing operations | | | (122,217 | ) | | | (12,509 | ) | | | (6,648 | ) | | | 1,569 | | | | (96,380 | ) |
Income from discontinued
operations | | | — | | | | 200 | | | | 116 | | | | 1,040 | | | | 170 | |
| Net (loss) income | | | (122,217 | ) | | | (12,309 | ) | | | (6,532 | ) | | | 2,609 | | | | (96,210 | ) |
| Basic net (loss) income from continuing operations per common share | | $ | (2.61 | ) | | $ | (0.41 | ) | | $ | (0.26 | ) | | $ | 0.06 | | | $ | (3.52 | ) |
| Basic net income from discontinued operations per common share | | $ | — | | | $ | 0.01 | | | $ | — | | | $ | 0.04 | | | $ | 0.01 | |
| Basic net (loss) income per common share | | $ | (2.61 | ) | | $ | (0.40 | ) | | $ | (0.26 | ) | | $ | 0.10 | | | $ | (3.51 | ) |
| Diluted net (loss) income from continuing operations per common share | | $ | (2.61 | ) | | $ | (0.41 | ) | | $ | (0.26 | ) | | $ | 0.06 | | | $ | (3.52 | ) |
| Diluted net income from discontinued operations per common share | | $ | — | | | $ | 0.01 | | | $ | — | | | $ | 0.04 | | | $ | 0.01 | |
| Diluted net (loss) income per common share | | $ | (2.61 | ) | | $ | (0.40 | ) | | $ | (0.26 | ) | | $ | 0.10 | | | $ | (3.51 | ) |
| Basic weighted average common shares outstanding | | | 46,892 | | | | 30,675 | | | | 25,515 | | | | 25,312 | | | | 27,398 | |
| Diluted weighted average common shares outstanding | | | 46,892 | | | | 30,675 | | | | 25,515 | | | | 26,985 | | | | 27,398 | |
25
TABLE OF CONTENTS
| | | | | | | | | | |
| | As of December 31, |
| | | 2012(1,3,5) | | 2011(2-3,5) | | 2010(2-3,5) | | 2009 | | 2008(4) |
| | | (in thousands) |
Consolidated Balance Sheet Data:
| | | | | | | | | | | | | | | | | | | | |
| Cash and cash equivalents | | $ | 15,181 | | | $ | 13,364 | | | $ | 16,307 | | | $ | 39,427 | | | $ | 34,127 | |
| Working capital (deficiency)(5) | | $ | (113,875 | ) | | $ | (78,843 | ) | | $ | (22,133 | ) | | $ | 32,171 | | | $ | 23,971 | |
| Total assets | | $ | 1,327,270 | | | $ | 1,399,480 | | | $ | 299,489 | | | $ | 122,885 | | | $ | 122,495 | |
| Long-term debt | | $ | 688,140 | | | $ | 714,703 | | | $ | 93,623 | | | $ | 198 | | | $ | — | |
| Accumulated deficit | | $ | (292,463 | ) | | $ | (170,246 | ) | | $ | (157,937 | ) | | $ | (151,405 | ) | | $ | (154,014 | ) |
| Total stockholders’ equity | | $ | 161,613 | | | $ | 271,756 | | | $ | 103,607 | | | $ | 103,696 | | | $ | 99,293 | |
| (1) | The Consolidated Statement of Comprehensive Loss includes a $42.0 million loss from extinguishing long-term debt during the year ended December 31, 2012. In addition, a $5.2 million gain from the sale of an equity method investment was also recorded during the year ended December 31, 2012. See Note 11,Long-Term Debt and Note 4,Sale of Equity Method Investment for more information on both of these transactions. |
| (2) | The 2011 Consolidated Statement of Comprehensive Loss and Consolidated Balance Sheet data above includes the acquisition of Network Solutions from October 28, 2011 through December 31, 2011 and as of December 31, 2011, respectively. In addition, the 2010 Consolidated Statement of Comprehensive Loss and Consolidated Balance Sheet data above includes the acquisition of Register.com LP from July 30, 2010 through December 31, 2010 and as of December 31, 2010, respectively. For information on the unaudited pro forma combined condensed statement of operations for the two years ended December 31, 2011 and 2010, see Note 7,Business Combinations. |
| (3) | Included in the net loss for the year ended December 31, 2010, 2011 and 2012, is a tax benefit of $10.7 million, $50.1 million, and $16.7 million, respectively. See Note 15,Income Taxes, for information on these transactions. |
| (4) | Included in the net loss for the year ended December 31, 2008 is a goodwill and intangible asset impairment charge of $102.6 million. The primary reason for the impairment charge was the decline of the Company’s stock price during the fourth quarter of 2008. |
| (5) | The working capital deficiency at December 31, 2012, 2011 and 2010 is due to the current portion of deferred revenue increases of $49.0 million, $105.5 million and $30.5 million, respectively, primarily arising from the October 27, 2011 acquisition of Network Solutions and the July 29, 2010 acquisition of Register.com LP. The change in current deferred revenue in 2012 is due to replacing deferred revenue that was written down for purchase accounting with post-acquisition deferred revenue that has been recorded at full contract value. The increase in 2012 was partially offset by lower accrued expenses and accrued restructuring. In 2011, accrued expenses were up $19.8 million due to the Networks Solutions acquisition in 2011. |
Item 7. Management’s Discussion and Analysis of Financial Condition and Results of Operation.
Safe Harbor
In the following discussion and analysis of results of operations and financial condition, certain financial measures may be considered “non-GAAP financial measures” under Securities and Exchange Commission rules. These rules require supplemental explanation and reconciliation, which is provided in this Annual Report on Form 10-K.
We believe presenting non-GAAP net income attributable to common stockholders, non-GAAP net income per share attributable to common stockholders and non-GAAP operating income is useful to investors, because it describes the operating performance of the company, excluding some recurring charges that are included in the most directly comparable measures calculated and presented in accordance with GAAP. We use these non-GAAP measures as important indicators of our past performance and in planning and forecasting performance in future periods. The non-GAAP financial information we present may not be comparable to similarly-titled financial measures used by other companies, and investors should not consider non-GAAP financial measures in isolation from, or in substitution for, financial information presented in compliance with GAAP.
26
TABLE OF CONTENTS
Overview
We are a leading provider of a full line of internet services for small to medium-sized businesses (“SMBs”). Web.com is a global domain name registrar which seeks to further meet the internet needs of SMBs anywhere along their lifecycle with affordable subscription solutions including domain name registration, website design and related services, search engine optimization, search engine marketing, social media and mobile products, local sales leads, eCommerce solutions and call center services. We offer SMBs a single point of entry to an array of effective, affordable online products and services that will help drive their business. The breadth and flexibility of our offerings allow us to address the web services needs of a wide variety of customers, ranging from those just establishing their websites to those that want to enhance their existing online presence with more sophisticated marketing and lead generation services. We offer our customers a full range of web services and products on an affordable subscription basis. With just over 3 million subscribers as of December 31, 2012, we are one of the industry’s largest providers of domain names, affordable web services and products that enable SMBs to have an effective online presence.
Key Business Metrics
Management periodically reviews certain key business metrics to evaluate the effectiveness of our operational strategies, allocate resources and maximize the financial performance of our business. These key business metrics include:
Net Subscriber Additions
We maintain and grow our subscriber base through a combination of adding new subscribers and retaining existing subscribers. We define net subscriber additions in a particular period as the gross number of new subscribers added during the period, less subscriber cancellations during the period. For this purpose, we only count as new subscribers those customers whose subscriptions have extended beyond the free trial period, if applicable.
We review this metric to evaluate whether we are performing to our business plan. An increase in net subscriber additions could signal an increase in subscription revenue, higher customer retention, and an increase in the effectiveness of our sales efforts. Similarly, a decrease in net subscriber additions could signal decreased subscription revenue, lower customer retention, and a decrease in the effectiveness of our sales efforts. Net subscriber additions above or below our business plan could have a long-term impact on our operating results due to the subscription nature of our business.
Monthly Turnover (Churn)
Monthly turnover, or churn, is a metric we measure each quarter, and which we define as customer cancellations in the quarter divided by the sum of the number of subscribers at the beginning of the quarter and the gross number of new subscribers added during the quarter, divided by three months. Customer cancellations in the quarter include cancellations from gross subscriber additions, which is why we include gross subscriber additions in the denominator. In measuring monthly turnover, we use the same conventions with respect to free trials and subscribers who are not current in their payments as described above for net subscriber additions. Monthly turnover is the key metric that allows management to evaluate whether we are retaining our existing subscribers in accordance with our business plan.
Average Revenue per User
Monthly average revenue per user, or ARPU, is a metric we measure on a quarterly basis. We define ARPU as quarterly subscription revenue divided by the average of the number of subscribers at the beginning of the quarter and the number of subscribers at the end of the quarter, divided by three months. We exclude from subscription revenue the impact of the fair value adjustments to deferred revenue resulting from acquisition related write downs. The fair market value adjustment was $83.7 million and $35.2 million for the year ended December 31, 2012 and 2011, respectively. ARPU is the key metric that allows management to evaluate the impact on monthly revenue from product pricing, product sales mix trends, and up-sell/cross-sell effectiveness.
27
TABLE OF CONTENTS
Sources of Revenue
Subscription Revenue
We currently derive a substantial majority of our revenue from fees associated with our subscription services, which are generally sold through our web services, online marketing, eCommerce, and domain name registration offerings. A portion of our services are offered free of charge for a 30-day trial period during which the customer can cancel at any time. After the 30-day trial period has ended, the revenue is recognized on a daily basis over the life of the contract. We bill a majority of our customers in advance through their credit cards, bank accounts, or business merchant accounts, and revenue is recognized on a daily basis over the life of the contract which can range from monthly up to 100 years.
Professional Services and Other Revenue
We generate professional services revenue from custom website design, eCommerce store design and support services, and Do It Yourself logo design. Our custom website design and eCommerce store design work is typically billed on a fixed price basis and over very short periods. Our Do It Yourself logo design is typically billed upon the point-of-sale of the final product, which is created by the customer. Other revenue consists of all fees earned from granting customers licenses to use our patents.
Cost of Revenue
Cost of Subscription Revenue
Cost of subscription revenue consists of expenses related to compensation expenses related to our web page development staff, domain name registration fees, directory listing fees, customer support costs, search engine registration fees, billing costs, hosting expenses, marketing fees, and allocated overhead costs. We allocate overhead costs such as rent and utilities to all departments based on headcount. Accordingly, general overhead expenses are reflected in each cost of revenue and operating expense category. As our customer base and web services usage grows, we intend to continue to invest additional resources in our website development and support staff.
Cost of Professional Services and Other Revenue
Cost of professional services revenue primarily consists of compensation expenses related to our web page development staff, eCommerce store design, logo design, and allocated overhead costs. While in the near term, we expect to maintain or reduce costs in this area, in the long term, we may add additional resources in this area to support the growth in our professional services and custom design functions.
Operating Expenses
Sales and Marketing Expense
Our largest direct marketing expenses are the costs associated with the online marketing channels we use to acquire and promote our services. These channels include search marketing, affiliate marketing, direct television advertising and online partnerships. Sales costs consist primarily of compensation and related expenses for our sales and marketing staff. Sales and marketing expenses also include marketing programs, including advertising, events, corporate sponsorships and other corporate events and communications.
We plan to continue to invest in sales and marketing by increasing the number of direct sales personnel in order to add new subscription customers as well as increase sales of additional and new services and products to our existing customer base. We also plan to expand our resources to direct response television advertising to further increase revenue growth. As part of our stated objective to use our larger scale to create a brand, we have invested a portion of our incremental marketing budget in branding activities such as the umbrella sponsorship of the newly re-named Web.com Tour and other sports marketing activities.
Our investments in all of these areas are expected to help us expand our customer base, increase revenue per subscriber, build brand awareness and grow our strategic marketing relationships. Accordingly, we expect that, in the future, sales and marketing expenses will increase in absolute dollars.
28
TABLE OF CONTENTS
Research and Development Expense
Research and development expenses consist primarily of compensation and related expenses for our research and development staff and allocated overhead costs. We have historically focused our research and development efforts on increasing the functionality of the technologies that enable our web-based services and products. Our technology architecture enables us to provide all of our customers with a service based on a single version of the applications that serve each of our product offerings. We do not anticipate significant increases in our research and development costs in the near term.
General and Administrative Expense
General and administrative expenses consist of compensation and related expenses for executive, finance, administration, and management information systems personnel, as well as professional fees, corporate development costs, other corporate expenses, and allocated overhead costs. General and administrative expenses are not expected to materially increase in the near term.
Depreciation and Amortization Expense
Depreciation and amortization expenses relate primarily to our intangible assets recorded due to the acquisitions we have completed, as well as computer equipment and other equipment, furniture and fixtures, and building and improvement expenditures.
Critical Accounting Policies and Estimates
Our discussion and analysis of our financial condition and results of operations are based on our consolidated financial statements, which have been prepared in accordance with accounting principles generally accepted in the United States. The preparation of these financial statements requires us to make estimates and judgments that affect the reported amounts of assets, liabilities, and expenses and related disclosure of contingent assets and liabilities. We review our estimates on an ongoing basis. We base our estimates on historical experience and on various other assumptions that we believe to be reasonable under the circumstances, the results of which form the basis for making judgments about the carrying values of assets and liabilities. Actual results may differ from these estimates under different assumptions or conditions. While our significant accounting policies and estimates are described in more detail in Note 1,The Company andSummary of Significant Accounting Policies, to our consolidated financial statements included in this report, we believe the following accounting policies to be critical to the judgments and estimates used in the preparation of our consolidated financial statements.
Revenue Recognition
We recognize revenue in accordance with Accounting Standards Codification, or (“ASC”), 605,Revenue Recognition. We recognize revenue when all of the following conditions are satisfied: (1) there is persuasive evidence of an arrangement; (2) the service has been provided to the customer; (3) the amount of fees to be paid by the customer is fixed or determinable; and (4) the collection of our fees is reasonably assured.
Thus, we recognize subscription revenue on a daily basis, as services are provided. Customers are billed for the subscription on a monthly, quarterly, semi-annual, annual or on a multi-year basis, at the customer’s option. For all of our customers, regardless of the method we use to bill them, subscription revenue is recorded as deferred revenue in the accompanying consolidated balance sheets. As services are performed, we recognize subscription revenue on a daily basis over the applicable service period. When we provide a free trial period, we do not begin to recognize subscription revenue until the trial period has ended and the customer has been billed for the services.
We account for our multi-element arrangements in accordance with ASC 605-25,Revenue Recognition: Multiple-Element Arrangement. We may sell multiple products or services to customers at the same time. For example, we may design a customer website and separately offer other services such as hosting and marketing or a customer may combine a domain registration with other services such as private registration or e-mail. In accordance with ASC 605-25, each element is accounted for as a separate unit of accounting provided the following criteria is met: the delivered products or services has value to the customer on a standalone basis; and for an arrangement that includes a general right of return relative to the delivered products or services, delivery or performance of the undelivered product or service is considered probable and is substantially
29
TABLE OF CONTENTS
controlled by the Company. We consider a deliverable to have standalone value if the product or service is sold separately by us or another vendor or could be resold by the customer. Our products and services do not include a general right of return relative to the delivered products. In cases where the delivered products or services do not meet the separate unit of accounting criteria, the deliverables are combined and treated as one single unit of accounting for revenue recognition. We assign value to the separate units of accounting in multiple-element arrangements based on proportionate standalone unit value to the total value of the arrangement, multiplied by the actual selling price. Typically, the deliverables within multiple-element arrangements are provided over the same service period, and therefore revenue is recognized over the same period.
Allowance for Doubtful Accounts
In accordance with our revenue recognition policy, our accounts receivable are based on customers whose payment is reasonably assured. We monitor collections from our customers and maintain an allowance for estimated credit losses based on historical experience as well as specific customer collection issues. While credit losses have historically been within our expectations and the provisions established in our financial statements, we cannot guarantee that we will continue to experience the same credit loss rates that we have in the past. We do not believe a change in liquidity of any one customer or our inability to collect from any one customer would have a material adverse impact on our consolidated financial position.
We also monitor failed direct debit billing transactions and customer refunds and maintain an allowance for estimated losses based upon historical experience. These provisions to our allowance are recorded as an adjustment to revenue.
Accounting for Stock-Based Compensation
We grant to our employees and directors options to purchase common stock at exercise prices equal to the quoted market values of the underlying stock at the time of each grant. We determine the fair value of each option award as of the grant date using the Black Scholes option pricing valuation model in accordance with ASC 718,Compensation-Stock Compensation.
The determination of the fair value of stock-based payment awards on the date of grant using an option-pricing model will be affected by our stock price as well as assumptions regarding a number of complex and subjective variables. These variables include our expected stock price volatility over the term of the awards, actual and projected employee stock option exercise behaviors, risk-free interest rates, forfeitures and expected dividends.
Goodwill and Intangible Assets
In September 2011, the Financial Accounting Standards Board (“FASB”) issued Accounting Standards Update (“ASU”) 2011-08,Intangibles–Goodwill and Other (Topic 350): Testing Goodwill for Impairment, and in July 2012, the FASB issued ASU 2012-02,Intangibles-Goodwill and Other (Topic 350): Testing Indefinite-Lived Intangible Assets for Impairment in ccordance with ASC 350. These new standards update the impairment testing of goodwill and indefinite–lived intangible assets by permitting an entity to first assess qualitative factors to determine whether it is more likely than not (likelihood of greater than 50%) that the fair value of indefinite-lived intangible assets and goodwill balances are less than their carrying amount as a basis for determining whether it is necessary to perform the quantitative test as described in ASC 350.
We continued to perform the quantitative tests to determine if it is more likely than not that the carrying value of our indefinite-lived intangible assets and our goodwill is impaired during the year ended December 31, 2012. We test goodwill and intangible assets using one reporting unit. We typically use a market approach to test our goodwill for impairment, while our intangible asset test uses the income approach. The following is not a complete discussion of our calculation, but outlines the general assumptions and steps for testing goodwill and intangible assets for impairment:
30
TABLE OF CONTENTS
Goodwill
The first step involves comparing the fair value of our reporting unit to their carrying value, including goodwill. We use a market capitalization approach after considering an estimated control premium.
Intangible Assets
We estimate the fair value of indefinite-lived intangibles using the relief-from-royalty method, a form of the income approach. It is based on the principle that ownership of the intangible asset relieves the owner of the need to pay a royalty to another party in exchange for rights to use the asset. Key assumptions in estimating the fair value include, among other items, forecasted revenue, royalty rates, tax rate, and the benefit of tax amortization. We employ a weighted average cost of capital approach to determine the discount rates used in our projections. The determination of the discount rate includes certain factors such as, but not limited to, the risk-free rate of return, entity specific risk, size premium, and the overall level of inherent risk.
If the carrying value of the reporting unit exceeds its fair value, the second step of the test is performed by comparing the carrying value of goodwill or intangible asset to its implied fair value. An impairment charge is recognized for the excess of the carrying value over its implied fair value.
The results of these analyses indicated that our indefinite-lived intangible assets and our goodwill were not impaired at December 31, 2012. See Note 9,Goodwill and Intangible Assets, in the consolidated financial statements for additional information.
Accounting for Purchase Business Combinations
All of our acquisitions have been accounted for as purchase transactions, and the purchase price is allocated based on the fair value of the assets acquired and liabilities assumed. The excess of the purchase price over the fair value of net assets acquired or net liabilities assumed is allocated to goodwill. Management weighs several factors in determining the fair value. The analysis typically considers, but is not limited to, the nature of the acquired company’s business, its competitive position, strengths, and challenges; its operating and non-operating assets, if any; its historical financial position and performance; and future plans for the combined entity. Amortizable intangibles, which primarily consists of developed technology, customer relationships, non-compete agreements and trade names, are typically valued using third-party valuation experts, valuation studies and other tools in determining the fair value of amortizable intangibles. While we use our best estimates and assumptions as a part of the purchase price allocation process to accurately value assets acquired and liabilities assumed at the acquisition date, our estimates are inherently uncertain and subject to refinement.
In addition, uncertain tax positions and tax related valuation allowances assumed in connection with a business combination are initially estimated as of the acquisition date and we reevaluate these items quarterly with any adjustments to our preliminary estimates being recorded to goodwill provided that we are within the measurement period and we continue to collect information in order to determine their estimated values. Subsequent to the measurement period or our final determination of the uncertain tax positions estimated value or tax related valuation allowances, changes to these uncertain tax positions and tax related valuation allowances will affect our provision for income taxes in our consolidated statement of operations and could have a material impact on our results of operations and financial position.
Provision for Income Taxes
We account for income taxes under the provisions of ASC 740,Income Taxes, using the liability method. ASC 740 requires recognition of deferred tax liabilities and assets for the expected future tax consequences of events that have been included in the financial statements or tax returns. Under this method, deferred tax liabilities and assets are determined based on the difference between the financial statement and tax basis of assets and liabilities using enacted tax rates in effect for the year in which the difference is expected to reverse.
31
TABLE OF CONTENTS
Further, deferred tax assets are recognized for the expected realization of available deductible temporary differences and net operating loss and tax credit carry forwards. ASC 740 requires companies to assess whether a valuation allowance should be established against deferred tax assets based on consideration of all available evidence using a “more likely than not” threshold. In making such assessments, the Company considers the expected reversals of our existing deferred tax liabilities within the applicable jurisdictions and carry forward periods, based on our existing Section 382 limitations. The Company does not consider deferred tax liabilities related to indefinite lived intangibles or tax deductible goodwill as a source of future taxable income. Additionally, the Company does not consider future taxable income (exclusive of the reversal of existing deferred tax liabilities and carry forwards) because we continue to be in a three-year cumulative loss position.
A valuation allowance is recorded to reduce our deferred tax assets to the amount that is “more likely than not” to be realized based on the above methodology. We review the adequacy of the valuation allowance on an ongoing basis and adjust our valuation allowance in the appropriate period, if applicable.
The Company records liabilities for uncertain tax positions related to federal, state and foreign income taxes in accordance with ASC 740. These liabilities reflect the Company’s best estimate of its ultimate income tax liability based on the tax code, regulations, and pronouncements of the jurisdictions in which we do business. Estimating our ultimate tax liability involves significant judgments regarding the application of complex tax regulations across many jurisdictions. If the Company’s actual results differ from estimated results, our effective tax rate and tax balances could be affected. As such, these estimates may require adjustment in the future as additional facts become known or as circumstances change. If applicable, we will adjust the tax provision in the appropriate period.
New Accounting Pronouncements
See Note 2,New Accounting Standards, for information on recently issued accounting guidance.
Results of Operations
The following table presents our selected consolidated statement of comprehensive loss for the periods indicated (in thousands):
| | | | | | |
| | Year Ended December 31, |
| | | 2012 | | 2011 | | 2010 |
Revenue:
| | | | | | | | | | | | |
| Subscription | | $ | 396,687 | | | $ | 195,645 | | | $ | 117,691 | |
| Professional services and other | | | 10,959 | | | | 3,560 | | | | 2,598 | |
| Total revenue | | | 407,646 | | | | 199,205 | | | | 120,289 | |
Cost of revenue (excluding depreciation and amortization shown separately below):
| | | | | | | | | | | | |
| Subscription | | | 153,417 | | | | 83,406 | | | | 51,371 | |
| Professional services and other | | | 6,913 | | | | 1,415 | | | | 1,861 | |
| Total cost of revenue | | | 160,330 | | | | 84,821 | | | | 53,232 | |
| Gross profit | | | 247,316 | | | | 114,384 | | | | 67,057 | |
Operating expenses:
| | | | | | | | | | | | |
| Sales and marketing | | | 117,811 | | | | 51,743 | | | | 28,678 | |
| Research and development | | | 34,258 | | | | 19,252 | | | | 10,910 | |
| General and administrative | | | 49,807 | | | | 45,164 | | | | 24,110 | |
| Restructuring charges | | | 2,469 | | | | 9,536 | | | | 2,171 | |
| Depreciation and amortization | | | 78,981 | | | | 29,456 | | | | 15,724 | |
| Total operating expenses | | | 283,326 | | | | 155,151 | | | | 81,593 | |
| Net loss from operations | | | (36,010 | ) | | | (40,767 | ) | | | (14,536 | ) |
| Interest expense, net | | | (66,124 | ) | | | (18,020 | ) | | | (2,832) | |
32
TABLE OF CONTENTS
| | | | | | |
| | Year Ended December 31, |
| | | 2012 | | 2011 | | 2010 |
| Loss on debt extinguishment | | | (41,977 | ) | | | (3,806 | ) | | | — | |
| Gain on sale of equity method investment | | | 5,156 | | | | — | | | | — | |
Loss before income taxes from continuing
operations | | | (138,955 | ) | | | (62,593 | ) | | | (17,368 | ) |
| Income tax benefit | | | 16,738 | | | | 50,084 | | | | 10,720 | |
| Net loss from continuing operations | | | (122,217 | ) | | | (12,509 | ) | | | (6,648 | ) |
| Discontinued operations, net of tax | | | | | | | | | | | | |
| Gain on sale of discontinued operations, net of tax | | | — | | | | 200 | | | | 116 | |
| Income from discontinued operations, net of tax | | | — | | | | 200 | | | | 116 | |
| Net loss | | $ | (122,217 | ) | | $ | (12,309 | ) | | $ | (6,532 | ) |
Comparison of Years Ended December 31, 2012 and 2011
The year ended December 31, 2011 included approximately two months of activity from the Network Solutions acquisition as compared to full year activity during the year ended December 31, 2012. The operations of Network Solutions began integrating with the existing legacy Web.com operations immediately following the closing of the acquisition on October 27, 2011. As such, revenue, ARPU or gross margin is not specifically segregated subsequent to the acquisition, nor would it be indicative of each of the standalone entities.
The following table sets forth our key business metrics for the year ended December 31, 2012 and 2011:
| | | | |
| | 2012 | | 2011(1) |
| Net subscriber additions (reductions) | | | 51,639 | | | | (51,097 | ) |
| Churn | | | 1 | % | | | 2 | % |
| Average revenue per unit | | $ | 13.44 | | | $ | 13.36 | |
| (1) | The metrics for the year ended December 31, 2011 include the operating results of Network Solutions from October 28, 2011 through December 31, 2011. |
Net subscribers increased by 51,639 customers during the year ended December 31, 2012 as compared to a decrease of 51,097 during the same prior period ended December 31, 2011. In addition, due to a continued downward trend in churn as well as the acquisition of Network Solutions’ lower churning significant customer base, churn continued to decrease down to approximately 1% in 2012 as compared to approximately 2% in 2011. The net increase in subscribers is primarily due to our increased marketing efforts throughout the year ended December 31, 2012.
The average revenue per unit was $13.44 during the year ended December 31, 2012 as compared to $13.36 during the same prior year period. The year ended December 31, 2012 includes a full year of the Network Solutions lower monthly ARPU generating customers compared to approximately two months during the same prior year ended December 31, 2011. The average revenue per unit of $13.77 for the three months ended December 31, 2012 represents an increase of 7 percent over the pro forma average revenue per unit of $12.86 for the three months ended December 31, 2011 giving effect to the Network Solutions acquisition.
The average revenue per unit during the year ended December 31, 2012 and 2011 is adjusted to exclude the unfavorable impact of $83.7 million and $35.2 million, respectively, from amortizing into revenue, deferred revenue that was recorded at fair value at the acquisition date. The fair value of the acquired deferred revenue was approximately 51 percent less than the pre-acquisition historical basis of Network Solutions. The unfavorable impact to our revenue declines on a monthly basis as the acquired deferred revenue becomes fully recognized.
33
TABLE OF CONTENTS
Revenue
| | | | |
| | For the Year Ended
December 31, |
| | | 2012 | | 2011 |
| | | (in thousands) |
Revenue:
| | | | | | | | |
| Subscription | | $ | 396,687 | | | $ | 195,645 | |
| Professional services and other | | | 10,959 | | | | 3,560 | |
| Total revenue | | $ | 407,646 | | | $ | 199,205 | |
Total revenue increased 105% to $407.6 million in the year ended December 31, 2012 from $199.2 million in the year ended December 31, 2011. A full year of Networks Solutions’ revenue is the primary driver of the increase during the year ended December 31, 2012 as only two months of their revenue was reflected during the same prior year period ended. The growth in average revenue per unit during 2012 continues to be driven principally by our up-sell and cross-sell campaigns focused on selling higher revenue products to our existing customers as well as the introduction of new product offerings and sales channels oriented toward acquiring higher value customers.
Subscription Revenue. Subscription revenue increased 103% during the year ended December 31, 2012 to $396.7 million from $195.6 million during the year ended December 31, 2011. The increase is due to the overall revenue drivers discussed above.
Professional Services and Other Revenue. Professional services revenue increased to $11.0 million in the year ended December 31, 2012 from $3.6 million in the year ended December 31, 2011. Professional services revenue increased primarily due to non-recurring website design revenue generated from increased custom website development service volume, in addition to a full year of the Network Solutions acquisition being reflected in 2012.
Cost of Revenue
| | | | |
| | For the Year Ended December 31, |
| | | 2012 | | 2011 |
| | | (in thousands) |
Cost of revenue:
| | | | | | | | |
| Subscription | | $ | 153,417 | | | $ | 83,406 | |
| Professional services and other | | | 6,913 | | | | 1,415 | |
| Total cost of revenue | | $ | 160,330 | | | $ | 84,821 | |
Cost of Subscription Revenue. Cost of subscription revenue increased 84% during the year ended December 31, 2012 compared to the same prior year period. A majority of the increase was due to a full year of costs associated with the additional revenue due to the Network Solutions’ acquisition in 2011.
Our gross margin on subscription revenue increased from 57% during the year ended December 31, 2011 to 61% during the year ended December 31, 2012 primarily due to favorable product mix. The gross margin was negatively impacted by amortizing into revenue, deferred revenue that was written down to fair value at the acquisition date which was approximately 50% and 51% lower than the historical basis of Register.com LP and Network Solutions, respectively. Excluding the $83.7 million and $35.2 million effect of the adjustment related to the fair value of acquired deferred revenue for the year ended December 31, 2012 and 2011, respectively, the gross margin was 68% and 64%, respectively. The increase is also related to a favorable product mix, such as domain name registration and related services. As the impact of the fair market value adjustment to deferred revenue acquired in the Networks Solutions and Register.com LP transactions continues to decrease over the course of 2013, we expect gross margins to improve.
Cost of Professional Services and Other Revenue. Cost of professional services revenue increased by $5.5 million to $6.9 million in the year ended December 31, 2012 up from $1.4 million in the year ended
34
TABLE OF CONTENTS
December 31, 2011. Professional services costs increased primarily due to the increase in the non-recurring website design revenue and a full year of the Network Solutions acquisition being reflected in 2012.
Operating Expenses
| | | | |
| | For the Year Ended December 31, |
| | | 2012 | | 2011 |
| | | (in thousands) |
Operating expenses:
| | | | | | | | |
| Sales and marketing | | $ | 117,811 | | | $ | 51,743 | |
| Research and development | | | 34,258 | | | | 19,252 | |
| General and administrative | | | 49,807 | | | | 45,164 | |
| Restructuring charges | | | 2,469 | | | | 9,536 | |
| Depreciation and amortization | | | 78,981 | | | | 29,456 | |
| Total operating expenses | | $ | 283,326 | | | $ | 155,151 | |
Sales and Marketing Expenses. Sales and marketing expenses increased 128% to $117.8 million and were 29% of total revenue during the year ended December 31, 2012, up from $51.7 million or 26% of revenue during the year ended December 31, 2011. Sales and marketing expense increased approximately $66.1 million primarily due to the full year of sales and marketing expenses of Network Solutions. Other increases are from our additional investments in sales and marketing activities including direct response television advertising, corporate sponsorships, additional sales resources and online marketing. Overall, compensation and benefits increased $21.2 million and customer acquisition and marketing expenses increased $42.0 million.
Research and Development Expenses. Research and development expenses increased 78% to $34.3 million, or 8% of total revenue, during the year ended December 31, 2012 up from $19.3 million, or 10% of total revenue during the year ended December 31, 2011. Research and development expense increased primarily from recognizing a full year of research and development expenses of Network Solutions. Overall, compensation and benefits increased $6.3 million and data center and software support increased $7.0 million. In addition, facility-related expenses increased by $0.8 million.
General and Administrative Expenses. General and administrative expenses increased 10% to $49.8 million, or 12% of total revenue, during the year ended December 31, 2012, up from $45.2 million, or 23% of total revenue during the year ended December 31, 2011. General and administrative expense increased due to recognizing a full year of Network Solutions. The increase was partially offset by the absence of $12.2 million of acquisition-related expenses that were included during the year ended December 31, 2011. Overall, during the year ended December 31, 2012, employee-related compensation and benefits expense increased approximately $9.2 million, technology and telephone expenses were up by $3.7 million and legal and professional fees increased by $1.9 million when compared to the prior year.
Restructuring Charges. Restructuring charges decreased $7.0 million during the year ended December 31, 2012 to $2.5 million, down from $9.5 million during the year ended December 31, 2011. The 2011 restructuring charges included employee-related termination costs and relocation expenses resulting from the integration of Network Solutions, in addition to the lease restructure of the Herndon, Virginia office also stemming from 2011 acquisition. In 2012, a $1.5 million contract termination fee and other employee-related termination costs and relocation expenses primarily resulting from the acquisition of Network Solutions were recorded. See Note 8,Restructuring Costs, for additional information surrounding our restructuring charges and reserves.
Depreciation and Amortization Expense. Depreciation and amortization expense increased to $79.0 million during the year ended December 31, 2012 up from $29.5 million during the comparable prior year period. The increase was primarily due to $45.0 million of intangible asset amortization resulting from a full year of amortization from the Network Solutions acquisition. Depreciation expense increased $4.6 million primarily from an increase in internally developed software projects as well as the build out of two central locations for our data centers.
35
TABLE OF CONTENTS
Interest Expense, Net. Net interest expense of $66.1 million during the year ended December 31, 2012 reflects a full year of interest and amortization expense related to the term loans and credit facility issued to finance the acquisition of Network Solutions. Included in the interest expense for 2012 is approximately $11.0 million of amortizing deferred financing fees and loan origination discounts. Our interest expense is expected to decrease during 2013 as we realize the benefits of the lower interest rates from the November 2012 refinance, as well as the further repricing consummated in March 2013. See Note 19,Subsequent Events.
Loss on Debt Extinguishment. In November 2012, we repriced our First Lien Term Loan (defined below in Liquidity and Capital Resources section) and increased the outstanding principal by $60 million to $629.5 million in order to realize decreased interest rates as well as pay down the higher interest rate Second Lien Term Loan (also defined below). In addition, we have obtained a lower interest rate and a $10 million increase in the amount of available borrowings on our revolving credit facility. The repricing was accounted for as debt extinguishment in accordance with Accounting Standards Codification (“ASC”) 470,Debt. As a result of the repricing and the repayment of $88 million on the Second Lien Term Loan, we recorded a $42.0 million loss from accelerating unamortized deferred financing fees and loan origination discounts during the year ended December 31, 2012. In addition, $2.6 million of prepayment penalties on the Second Lien Term Loan that were paid in 2012 are reflected in the loss. During the year ended December 31, 2011, we recorded a $3.8 million loss from accelerating deferred financing fees on debt that was extinguished prior to our entry into the credit agreements in October 2011.
Gain on Sale of Equity Method Investment. On May 31, 2012, we sold our interest in an equity method investment named OrangeSoda, Inc., a Nevada corporation in the business of developing, marketing, selling and providing search engine marketing and optimization services for small businesses. We acquired the 25.3 percent interest in OrangeSoda, Inc. as part of the Network Solutions acquisition on October 27, 2011. Proceeds of $7.2 million were received from the buyer and a gain of $5.2 million was recorded during the year ended December 31, 2012. Approximately $0.4 million of additional proceeds from the sale is held in escrow until the standard representations and warranties have been satisfied. These proceeds, if received, will be recorded as additional gain from the sale of the equity method investment.
Income Tax Benefit. We recorded a net tax benefit from continuing operations of $16.7 million during the year ended December 31, 2012. This benefit includes a federal and state benefit of approximately $54.6 million related to our current year net loss which was offset by a $38.4 million increase in our valuation allowance for the year. The change in valuation allowance includes $3.1 million associated with the deferred tax effect of the final purchase accounting adjustments from the Network Solutions acquisition. Our tax rate was benefitted by approximately $2.1 million related to a change in our estimated state deferred tax rate and was partially offset by approximately $1.6 million related to various other items.
Outlook.
We continue to believe we have the potential for additional revenue growth as we increase our investments in sales and marketing and further execute our cross-sell/up-sell strategies. As we fully integrate our operations and realize the significant post-merger cost savings and benefits from increased scale, we believe that we have the opportunity to generate increased shareholder value. We expect to strengthen our operating cash flows with lower interest rates as a result of the November 2012 and March 2013 repricings of our First Lien Term Loan and subsequent pay down of our Second Lien Term Loan,which bore a higher interest rate. We will use additional cash flows to pay down debt and fund incremental marketing investments. We expect to increase ARPU through our cross-sell/up-sell activities. As the impact of the fair market value adjustment to deferred revenue acquired in the Networks Solutions and Register.com LP transactions continue to decrease over the course of 2013, we expect gross margins to improve.
36
TABLE OF CONTENTS
Comparison of Years Ended December 31, 2011 and 2010
The year ended December 31, 2010 included approximately five months of activity from the Register.com LP acquisition as compared to full year activity during the year ended December 31, 2011. In addition, there are approximately two months of the Network Solutions’ operations that were included in the results for the year ended December 31, 2011. The operations of Register.com LP and Network Solutions began integrating with the existing legacy Web.com operations immediately following the closing of the acquisitions on July 29, 2010 and October 27, 2011, respectively. As such, revenue, ARPU or gross margin is not specifically segregated subsequent to the acquisitions, nor would it be indicative of each of the standalone entities.
The following table sets forth our key business metrics for the year ended December 31, 2011 and 2010:
| | | | |
| | 2011(1) | | 2010(2) |
| Net subscriber reductions | | | (51,097 | ) | | | (21,067 | ) |
| Churn | | | 2 | % | | | 2 | % |
| Average revenue per unit | | $ | 13.36 | | | $ | 20.30 | |
| (1) | The metrics for the year ended December 31, 2011 include the operating results of Network Solutions from October 28, 2011 through December 31, 2011. |
| (2) | The metrics for the year ended December 31, 2010 include the operating results of Register.com LP from July 30, 2010 through December 31, 2010. |
Net subscriber reductions increased by 30,030 customers during the year ended December 31, 2011 when compared to same prior year period, however, due to Register.com LP’s and Network Solutions’ lower churning and substantially larger customer base, churn actually decreased slightly from 2.2% in 2010 to 1.5% in 2011.
The average revenue per unit was $13.36 during the year ended December 31, 2011 as compared to $20.30 during the same prior year period. The decrease is primarily due to the addition of approximately two million customers from Network Solutions with a lower monthly ARPU. Excluding the impact from the Network Solutions acquisition, ARPU decreased to $16.48 for the year ended December 31, 2011 from $20.20 for the year ended December 31, 2010. This decrease is due to the full year impact of the lower ARPU subscribers acquired from Register.com LP in July 2010, offset slightly from the increase in ARPU from legacy products.
The average revenue per unit and pro forma average revenue per unit during the year ended December 31, 2011 and 2010 is adjusted to exclude the unfavorable impact of $35.2 million and $13.1 million, respectively, from amortizing into revenue, deferred revenue that was recorded at fair value at the acquisition date. The fair value of the acquired deferred revenue was approximately 51 percent and 50 percent less than the pre-acquisition historical basis of Network Solutions and Register.com LP, respectively. The unfavorable impact to our revenue declines on a monthly basis as the acquired deferred revenue becomes fully recognized.
Revenue
| | | | |
| | For the Year Ended December 31, |
| | | 2011 | | 2010 |
| | | (in thousands) |
Revenue:
| | | | | | | | |
| Subscription | | $ | 195,645 | | | $ | 117,691 | |
| Professional services and other | | | 3,560 | | | | 2,598 | |
| Total revenue | | $ | 199,205 | | | $ | 120,289 | |
Total revenue increased 66% to $199.2 million in the year ended December 31, 2011 from $120.3 million in the year ended December 31, 2010. We acquired Network Solutions on October 27, 2011 which increased revenue by approximately $28.0 million during the period October 28, 2011 to December 31, 2011. There was also approximately an increase of $48.4 million in revenue over prior year resulting from the full year impact of the Register.com LP acquisition. Furthermore, we increased revenue by up-selling our Do It For Me
37
TABLE OF CONTENTS
products to the acquired Register.com LP and Network Solutions customer base, direct advertising television campaigns, and increased marketing efforts focused on our online marketing products.
Subscription Revenue. Subscription revenue increased 66% during the year ended December 31, 2011 to $195.6 million from $117.7 million during the year ended December 31, 2010. The increase is due to the overall revenue drivers discussed above.
Professional Services and Other Revenue. Professional services revenue increased 37% to $3.6 million in the year ended December 31, 2011 from $2.6 million in the year ended December 31, 2010. We acquired Network Solutions on October 27, 2011 which increased professional services revenue by approximately $0.6 million during the period October 28, 2011 to December 31, 2011. In addition, we had an increase in web support services of approximately $0.9 million, offset by a reduction of logo sales of $0.3 million.
Cost of Revenue
| | | | |
| | For the Year Ended December 31, |
| | | 2011 | | 2010 |
| | | (in thousands) |
Cost of revenue:
| | | | | | | | |
| Subscription | | $ | 83,406 | | | $ | 51,371 | |
| Professional services and other | | | 1,415 | | | | 1,861 | |
| Total cost of revenue | | $ | 84,821 | | | $ | 53,232 | |
Cost of Subscription Revenue. Cost of subscription revenue increased 62% during the year ended December 31, 2011 compared to the same prior year period. A majority of the increase was due to the costs associated with the additional revenue due to the Network Solutions’ acquisition in 2011 and a full year of the costs associated with the additional revenue due to the Register.com LP acquisition in 2010 of approximately $29.3 million. There were additional online marketing costs related to the increase in revenue of online marketing services, such as Pay-Per-Click and Comparison Shopping products.
Our gross margin on subscription revenue increased to 57% during the year ended December 31, 2011 from 56% during the year ended December 31, 2010. The gross margin was negatively impacted by amortizing into revenue, deferred revenue that was written down to fair value at the acquisition date which was approximately 50% lower than the historical basis of Register.com LP and Network Solutions. Excluding the $35.2 million and $13.1 million effect of the adjustment related to the fair value of acquired deferred revenue for the year ended December 31, 2011 and 2010, respectively, the gross margin was 64% and 61%, respectively. The increase in this gross margin is related to the higher gross margin products, such as domain name registration and related services.
Cost of Professional Services and Other Revenue. Cost of professional services revenue decreased 24% to $1.4 million in the year ended December 31, 2011 from $1.9 million in the year ended December 31, 2010.
Operating Expenses
| | | | |
| | For the Year Ended December 31, |
| | | 2011 | | 2010 |
| | | (in thousands) |
Operating expenses:
| | | | | | | | |
| Sales and marketing | | $ | 51,743 | | | $ | 28,678 | |
| Research and development | | | 19,252 | | | | 10,910 | |
| General and administrative | | | 45,164 | | | | 24,110 | |
| Restructuring charges | | | 9,536 | | | | 2,171 | |
| Depreciation and amortization | | | 29,456 | | | | 15,724 | |
| Total operating expenses | | $ | 155,151 | | | $ | 81,593 | |
38
TABLE OF CONTENTS
Sales and Marketing Expenses. Sales and marketing expenses increased 80% to $51.7 million and were 26% of total revenue during the year ended December 31, 2011, up from $28.7 million or 24% of revenue during the year ended December 31, 2010. Sales and marketing expense increased approximately $17.9 million primarily due to the acquisition of Network Solutions in October 2011 and full year of sales and marketing expenses of Register.com LP from the acquisition in July 2010. The remaining increase in expense was primarily the result of a direct advertising television campaign that was launched in the first quarter of 2011 and continued throughout the year, as well as an overall increase in marketing related compensation expense and online marketing spending due to increased focus and efforts in this area.
Research and Development Expenses. Research and development expenses increased 76% to $19.3 million, or 10% of total revenue, during the year ended December 31, 2011 up from $10.9 million or 9% of total revenue during the year ended December 31, 2010. Research and development expense increased approximately $7.8 million due to the acquisition of Network Solutions in October 2011 and recognizing a full year of research and development expenses of Register.com LP from the acquisition in July 2010.
General and Administrative Expenses. General and administrative expenses increased 87% to $45.2 million, or 23% of total revenue, during the year ended December 31, 2011, up from $24.1 million, or 20% of total revenue during the year ended December 31, 2010. General and administrative expense increased approximately $3.6 million due to the acquisition of Network Solutions in October 2011 and recognizing a full year of general and administrative expenses of Register.com LP from the acquisition in July 2010. Due to the acquisition of Network Solutions, we incurred corporate development expenses including $3.3 million of legal, professional and administrative fees related to the October 2011 acquisition of Network Solutions and $7.6 million for investment banking and due diligence services. In addition, due to the successful integration of Register.com LP, a one-time bonus of $1.5 million was awarded in 2011. Furthermore, employee-related compensation and benefits expense increased approximately $5.2 million in the current year when compared to the prior year.
Restructuring Charges. Restructuring charges increased $7.4 million during the year ended December 31, 2011 to $9.5 million, up from $2.2 million during the year ended December 31, 2010. The 2011 restructuring charges are primarily for employee-related termination costs and relocation expenses, in addition to the lease restructure of the Herndon, Virginia office stemming from the Network Solutions acquisition. See Note 8,Restructuring Costs, for additional information surrounding our restructuring charges and reserves.
Depreciation and Amortization Expense. Depreciation and amortization expense increased 87% to $29.5 million during the year ended December 31, 2011 up from $15.7 million during the comparable prior year period. Amortization of intangible assets from the Network Solutions and Register.com LP acquisitions contributed $13.1 million of additional expense in 2011 and depreciation expense related to acquired property and equipment added another $1.5 million.
Interest Expense, Net. Net interest expense of $18.0 million during the year ended December 31, 2011 is primarily from the term loans and credit facility issued to finance the acquisition of Network Solutions and Register.com LP. In addition, amortization of deferred financing fees during the year contributed $2.8 million to total interest expense.
Loss on Debt Extinguishment
In October 2011, we paid off the loans used to finance the acquisition of Register.com LP and immediately recognized the previously recorded deferred financing fees of approximately $3.8 million into interest expense.
Income Tax Benefit (Expense). We recorded a net tax benefit from continuing operations of $50.1 million during the year ended December 31, 2011, of which $28.4 million was associated with the net change in our valuation allowance during the year. As a result of the Network Solutions acquisition, we determined that a portion of our pre-existing deferred tax assets will more likely than not be realized by the combined entity through the reversal of the deferred tax liabilities acquired from Network Solutions. ASC 805-740 requires that changes in an acquirer’s valuation allowance stemming from a business combination should be recognized as an element of income tax benefit (expense). Other items that benefited our tax rate for the 2011 include a net $4.2 million favorable adjustment associated with certain prior year deferred tax adjustments and a federal and state benefit of approximately $24 million related to our current year loss. Offsetting this benefit was
39
TABLE OF CONTENTS
$2.3 million of non-deductible transaction costs associated with the Network Solutions acquisition, $1.3 million related to a change in our deferred tax rate and $1.3 million related to unremitted foreign earnings associated with Register.com LP that are not considered to be indefinitely reinvested.
Discontinued Operations. On May 26, 2009, we sold our NetObjects Fusion software business for approximately $4.0 million. During the years ended December 31, 2011 and 2010, we recorded a gain of $0.2 million and $0.1 million, respectively, from net proceeds received based on the terms in the NetObjects Fusion sales agreement. Income tax expense allocated to discontinued operations was $0.1 million and $0 for 2011 and 2010, respectively. Income tax expense for 2010 was $0 due to our valuation allowance in this period.
Liquidity and Capital Resources
The following table summarizes total cash flows for the operating, investing and financing activities for the years ended December 31 (in thousands):
| | | | | | |
| | 2012 | | 2011 | | 2010 |
| Net Cash Provided by Operating Activities | | $ | 77,965 | | | $ | 14,924 | | | $ | 15,751 | |
| Net Cash Used in Investing Activities | | $ | (15,177 | ) | | $ | (408,982 | ) | | $ | (133,069 | ) |
| Net Cash (Used in) Provided by Financing Activities | | $ | (60,971 | ) | | $ | 391,115 | | | $ | 94,198 | |
| Increase (Decrease) in Cash and Cash Equivalents | | $ | 1,817 | | | $ | (2,943) | | | $ | (23,120) | |
Cash Flows
As of December 31, 2012, we had $15.2 million of cash and cash equivalents and negative $113.9 million in working capital, as compared to $13.4 million of cash and cash equivalents and a negative $78.8 million in working capital as of December 31, 2011. The unfavorable change in working capital during the year is primarily due to a $49.0 million increase in current deferred revenue is primarily from amortizing deferred revenue that was written down for purchase accounting from the acquisitions of Network Solutions and Register.com LP and replacing with deferred revenue that is reflected at full contract value. The unfavorable change in working capital was partially offset by a decrease in accrued expenses and restructuring as acquisition related accruals were paid in 2012. The majority of the negative working capital is due primarily from the non-cash balances of deferred revenue, deferred expenses and deferred tax assets. The Company expects cash generated from operating activities to be more than sufficient to meet future working capital and debt servicing requirements.
Net cash provided by operations for the year ended December 31, 2012 increased $63.0 million due to reflecting a full year of Network Solutions during 2012, primarily cash receipts from revenue that have been deferred and amortized over the related service period. This was partially offset by $3.9 million of additional restructuring related payments, an increase in prepaid and deferred expense spending and certain acquisition-related payments that were made during 2012. The net loss of $122.2 million adjusted for non-cash items including depreciation and amortization, stock-based compensation expense, gain from the sale of an equity method investment, loss from debt extinguishment and deferred income taxes resulted in net cash outflows of $2.9 million which improved $16.8 million from the twelve months ended December 31, 2011.
Net cash used in investing activities in the year ended December 31, 2012 was $15.2 million as compared to $409.0 million in 2011. Included in the 2012 investing cash flows was $7.2 million of proceeds from the sale of an equity method investment. In addition, capital expenditures increased by $18.0 million to $22.3 million during 2012 due to costs incurred from building out two centralized data centers as well as increased efforts to improve internally developed software and websites. The acquisition of Network Solutions outflow of $405.1 million was reflected in 2011.
Net cash used in financing activities of $61.0 million included net debt repayments and reductions of approximately $52.1 million during the year ended December 31, 2012. Also included was $10.0 million of payments for debt issuance and origination discount fees related to the refinancing of the First Lien Term Loan. Proceeds from the exercise of stock options decreased $3.3 million to $5.8 million in 2012 when compared to the same prior year period ended. Approximately $4.7 million and $0.5 million of cash was used
40
TABLE OF CONTENTS
to pay employee minimum tax withholding requirements in lieu of receiving common shares during the year ended December 31, 2012 and 2011, respectively.
Financing Network Solutions Acquisition
On October 27, 2011, the Company entered into credit facilities, pursuant to (i) a First Lien Credit Agreement, dated as of October 27, 2011, by and among the Company, J. P. Morgan Securities LLC and Deutsche Bank Securities Inc., as Co-Syndication Agents; Goldman Sachs Lending Partners LLC and SunTrust Bank, as Co-Documentation Agents; and JPMorgan Chase Bank, N.A., as Administrative Agent, and the lenders from time to time party thereto (the “First Lien Credit Agreement”) and (ii) a Second Lien Credit Agreement, dated as of October 27, 2011, (the “Second Lien Credit Agreement”). The First Lien Credit Agreement provides for (i) a six-year $600 million first lien loan facility (the “First Lien Term Loan”) and (ii) a five-year revolving credit facility of $50 million (the “Revolving Credit Facility”). The Second Lien Credit Agreement provides for a seven-year $150 million second lien loan facility (the “Second Lien Term Loan”).
Repricing Long Term Debt
In November 2012, we repriced our First Lien Term Loan and increased the outstanding balance by $60 million to $629.5 million. In addition, we increased the maximum amount of available borrowings under the revolving credit facility from $50 million to $60 million. After the repricing, the First Lien Term Loan bears an interest rate of LIBOR plus 4.25%, with a 1.25% LIBOR floor, and the revolving credit facility’s interest rate is LIBOR plus 3.75%. The proceeds received from the additional First Lien Term Loan were used to pay down the Second Lien Term Loan. During the year ended December 31, 2012, a total of $88.0 million was paid down on the $120 million Second Lien Term Loan. See Note 11,Long-Term Debt, for additional information. In addition, in March 2013, we further repriced and increased our First Lien Term Loan, repriced and increased the maximum amount of available borrowings under our revolving credit facility and repaid the Second Lien Term Loan in full. See Note 19,Subsequent Events.
Debt Covenants
The credit agreements entered into on October 27, 2011 and subsequently amended in connection with the repricing became effective on November 20, 2012, as discussed above, require that we maintain a First Lien Net Leverage Ratio (in the case of the First Lien Credit Agreement) and a Total Net Leverage Ratio (in the case of the Second Lien Credit Agreement), as specified in the table below. The First Lien Net Leverage Ratio is defined as the total of the outstanding First Lien Credit Agreement and Revolving Credit Facility less up to $50.0 million of unrestricted cash and cash equivalents, divided by Consolidated EBITDA. Consolidated EBITDA is defined as consolidated net income before (among other things) interest expense, income tax expense, depreciation and amortization, impairment charges, restructuring costs, changes in deferred revenue and deferred expenses, stock-based compensation expense, acquisition related costs and includes the benefit of annualized synergies due to the Network Solutions integration. Total Net Leverage Ratio is defined as the total debt outstanding on the credit agreements less up to $50.0 million of unrestricted cash and cash equivalents, divided by Consolidated EBITDA (as defined herein).
Outstanding debt amounts for purposes of the First Lien Net Leverage Ratio and the Total Net Leverage Ratio as of December 31, 2012 were approximately $653.7 million and $685.7 million, respectively. The covenant calculations as of December 31, 2012 are calculated on a trailing 12-month basis:
| | | | | | |
| Covenant Description | | Covenant Requirement | | Ratio at
December 31, 2012 | | Favorable/
(Unfavorable) |
| First Lien Net Leverage Ratio | | | Not greater than 5.25 | | | | 3.89 | | | | 1.36 | |
| Total Net Leverage Ratio | | | Not greater than 7.00 | | | | 4.08 | | | | 2.92 | |
In addition to the financial covenants listed above, the credit agreements include customary covenants that limit (among other things) the incurrence of debt, the disposition of assets, and making of certain payments. Substantially all of our tangible and intangible assets collateralize the long-term debt as required by the Credit Agreement.
41
TABLE OF CONTENTS
Comparison of Years Ended December 31, 2011 and 2010
Cash Flows
As of December 31, 2011, we had $13.4 million of cash and cash equivalents and negative $78.8 million in working capital, as compared to $16.3 million of cash and cash equivalents and a negative $22.1 million in working capital as of December 31, 2010. The unfavorable change in working capital during the year is primarily due to a $105.5 million increase in current deferred revenue primarily resulting from the October 27, 2011 acquisition of Network Solutions. In addition, accrued expenses, including compensation and benefits related costs, have increased by $19.8 million associated primarily with higher volume resulting from the Network Solutions acquisition. This was partially offset by a $43.1 million and $18.3 million increase in deferred expenses and deferred tax assets, respectively, also resulting from the Network Solutions acquisition. The majority of the negative working capital is due primarily from the non cash balances of deferred revenue, deferred expenses and deferred tax assets, and the Company expects cash generated from operating activities to be more than sufficient to meet future working capital and debt servicing requirements.
Net cash provided by operations for the year ended December 31, 2011 decreased 5%, or $0.8 million, compared to the year ended December 31, 2010. Acquisition-related transaction costs during the year ended December 31, 2011 increased approximately $8.6 million. In addition, restructuring-related severance payments from both the Register.com LP and Network Solutions acquisitions increased by $0.9 million in 2011. Finally, accrued compensation related payments contributed to the year over year change in cash provided by operating activities. These cash outflow increases were partially offset by a $17.6 million increase in deferred revenue in 2011.
Net cash used in investing activities in the year ended December 31, 2011 was $409.0 million as compared to $133.1 million in 2010. The acquisition of Network Solutions was an investment of $405.1 million and Register.com LP was $130.1 million in 2011 and 2010, respectively. Property and equipment purchases increased $2.6 million as a result of the data center consolidation following the Register.com LP acquisition, in addition to the initial capital expenditures in connection with the planned Network Solutions integration. In addition, we acquired a customer base at a cost of $1.4 million in 2010.
Net cash provided by financing activities included $733.5 million of proceeds from the credit agreements entered into on October 27, 2011, as discussed below. The proceeds are net of $37.5 million of loan origination discounts and include $21.0 million of initial borrowings from the $50.0 million revolving credit facility. In addition to the loan origination discount, approximately $21.2 million of other related debt issuance costs were incurred in 2011. The net proceeds were used to fund the acquisition of Network Solutions and to repay the outstanding debt of the Company and the assumed debt of Network Solutions as of October 27, 2011. In December 2011, $30 million of outstanding Second Lien Term Loan debt was repaid using cash generated after the acquisition and an additional $12 million of lower interest bearing revolving credit facility proceeds. Proceeds from the exercise of stock options of $9.1 million were received during the year ended December 31, 2011 compared to $1.8 million in the prior year ended.
42
TABLE OF CONTENTS
Contractual Obligations and Commitments
Our principal commitments consist of long-term debt and interest payments, obligations under operating leases for office space and other unconditional marketing-related purchase obligations. The following summarizes our contractual obligations as of December 31, 2012 (in thousands):
| | | | | | | | | | | | | | |
| | | | Payment Due by Period |
| Contractual Obligations (000’s) | | Total | | 2013 | | 2014 | | 2015 | | 2016 | | 2017 | | Thereafter |
| Long-term debt(2) | | $ | 694,631 | | | $ | — | | | $ | 54,739 | | | $ | 6,295 | | | $ | 47,295 | | | $ | 554,302 | | | $ | 32,000 | |
Current maturities of
long-term debt | | | 6,295 | | | | 6,295 | | | | — | | | | — | | | | — | | | | — | | | | — | |
Interest payments on
long-term debt(2) | | | 179,997 | | | | 39,549 | | | | 37,204 | | | | 36,192 | | | | 35,562 | | | | 28,586 | | | | 2,904 | |
| Operating lease obligations(1) | | | 52,077 | | | | 6,728 | | | | 6,541 | | | | 6,420 | | | | 6,342 | | | | 6,452 | | | | 19,594 | |
| Uncertain tax positions(3) | | | — | | | | — | | | | — | | | | — | | | | — | | | | — | | | | — | |
| Purchase obligations(4) | | | 111,641 | | | | 8,810 | | | | 12,134 | | | | 12,702 | | | | 12,702 | | | | 12,293 | | | | 53,000 | |
| Total | | $ | 1,044,641 | | | $ | 61,382 | | | $ | 110,618 | | | $ | 61,609 | | | $ | 101,901 | | | $ | 601,633 | | | $ | 107,498 | |
| (1) | Operating lease obligations are shown net of sublease rentals for the amounts related to each period presented. |
| (2) | The First Lien Term Loan requires mandatory repayments that are based on the “excess cash flow” (as defined in the First Lien Credit Agreement) generated by the Company during each fiscal year. Excess cash flow payments are required to be made during the quarter following each fiscal year end. We have forecasted the excess cash flows that we expect to generate during the year ending December 31, 2013 that we expect to be payable during the first quarter of 2014 and reflected this forecast in the table above. Subsequent to 2013’s excess cash flow calculation, only the scheduled principal payment requirements, excluding the excess cash flow payments, are presented due to the significant uncertainty that would be present in making the estimates required to determine such amounts. Projected interest payments for the revolving credit facility were calculated based on outstanding principal amounts using interest rates in effect as of December 31, 2012. |
| (3) | The settlement date is unknown for approximately $2.5 million of uncertain tax positions and has been excluded from the table above. See Note 15 — Income Taxes for additional information on uncertain tax positions. |
| (4) | Purchase obligations include corporate sponsorships and long-term service contracts for data storage. |
In February 2012, we completed a Form S-3 registration statement to offer and issue 7,000,000 shares of common shares. The proceeds from these common shares are to be used for the repayment of outstanding debt, general corporate purposes and funding for potential acquisitions. In addition, the registration statement also included the resale of 16,434,692 common shares that were issued to General Atlantic, LLC in connection with the October 27, 2011 acquisition of Network Solutions. We will not receive any proceeds from the resale of these common shares. Subsequent to the registration statement, none of the 7 million common shares have been issued, however 8 million of the common shares that were issued to the General Atlantic, LLC resold during 2012.
In February 2013, General Atlantic, LLC sold an additional 2.3 million of the common shares that were issued in connection with the October 27, 2011 acquisition. Subsequent to this transaction, they held approximately 11% of the Company’s outstanding common shares.
43
TABLE OF CONTENTS
Off-Balance Sheet Obligations
As of December 31, 2012 and 2011, we did not have any relationships with unconsolidated entities or financial partnerships, such as entities often referred to as structured finance or special purpose entities, which would have been established for the purpose of facilitating off-balance sheet arrangements or other contractually narrow or limited purposes.
Summary
Our future capital uses and requirements depend on numerous forward-looking factors. These factors include but are not limited to the following:
| • | the costs involved in the expansion of our customer base (including through acquisitions of other businesses or assets); |
| • | the costs associated with the principal and interest payments of future debt service; |
| • | the costs involved with investment in our servers, storage and network capacity; |
| • | the costs associated with the expansion of our domestic and international activities; |
| • | the costs involved with our research and development activities to upgrade and expand our service offerings; and |
| • | the extent to which we acquire or invest in other technologies and businesses. |
We believe that our existing cash and cash equivalents at December 31, 2012 in addition to 2013 operating cash flows will be sufficient to meet our projected operating requirements for at least the next 12 months.
New Accounting Standards
See Note 2,New Accounting Standards, for a discussion of recently issued accounting pronouncements that may affect our financial results and disclosures in future periods.
Item 7A. Quantitative and Qualitative Disclosures About Market Risk.
Foreign Currency Exchange Risk
The majority of our subscription agreements and operating expenses are denominated in U.S. dollars. However, we have sales and customer support operations in Canada and a technology administrative center in Argentina and are exposed to fluctuations in the Canadian dollar and Argentina peso. Exchange rate fluctuations have historically had little impact on our operating results and cash flows; however we continue to analyze our exposure to currency fluctuations and may engage in financial hedging techniques in the future to reduce the effect of these potential fluctuations.
Interest Rate Sensitivity
We had unrestricted cash and cash equivalents totaling $15.2 million and $13.4 million at December 31, 2012 and 2011, respectively. These amounts were invested primarily in money market funds. The unrestricted cash, cash equivalents and short-term marketable securities are held for working capital purposes. We do not enter into investments for trading or speculative purposes. Due to the short-term nature of these investments, we do not anticipate that the interest rates will materially fluctuate. Therefore, we believe we do not have any material exposure to changes in the fair value of our investment portfolio as a result of changes in interest rates. Declines in interest rates, however, will reduce future investment income.
We had $700.9 million of long-term debt outstanding as of December 31, 2012. We have exposure to market risk for changes in interest rates related to these borrowings. Our variable rate debt is based on LIBOR plus 4.25 percent on the First Lien Term Loan and LIBOR plus 9.5 percent on the Second Lien Term Loan, which are subject to 1.25 percent and 1.5 percent LIBOR floors, respectively. A hypothetical 10 percent increase in the LIBOR rate and the LIBOR floors as of December 31, 2012 would result in additional interest expense of $0.8 million during the year ended December 31, 2013, assuming principal balances remain unchanged.
Non-GAAP Financial Measures
In addition to our financial information presented in accordance with U.S. GAAP, management uses certain “non-GAAP financial measures” within the meaning of the SEC Regulation G. Generally, a non-GAAP
44
TABLE OF CONTENTS
financial measure is a numerical measure of a company’s operating performance, financial position or cash flows that excludes or includes amounts that are included in or excluded from the most directly comparable measure calculated and presented in accordance with U.S. GAAP.
We believe presenting non-GAAP measures is useful to investors because it describes the operating performance of the company, excluding some recurring charges that are included in the most directly comparable measures calculated and presented in accordance with GAAP. Our management uses these non-GAAP measures as important indicators of the Company’s past performance and in planning and forecasting performance in future periods. The non-GAAP financial information we present may not be comparable to similarly-titled financial measures used by other companies, and investors should not consider non-GAAP financial measures in isolation from, or in substitution for, financial information presented in compliance with GAAP. You are encouraged to review the reconciliation of non-GAAP financial measures to GAAP financial measures included elsewhere in this press release.
Relative to each of the non-GAAP measures Web.com presents above, management further sets forth its rationale as follows:
| • | Non-GAAP Revenue. We exclude from non-GAAP revenue the impact of the fair value adjustment to deferred revenue because we believe that excluding such measures helps management and investors better understand our revenue trends. |
| • | Non-GAAP Operating Income and Non-GAAP Operating Margin. We exclude from non-GAAP operating income amortization of intangibles, fair value adjustment to deferred revenue and deferred expense, restructuring charges, corporate development expenses, stock-based compensation charges, and gains or losses from asset sales. Management believes that excluding these items assists investors in evaluating period-over-period changes in our operating income without the impact of items that are not a result of the Company’s day-to-day business and operations. |
| • | Non-GAAP Net Income and Non-GAAP Net Income Per Diluted Share. We exclude from non-GAAP net income and non-GAAP net income per diluted share amortization of intangibles, income tax benefit, fair value adjustment to deferred revenue and deferred expense, restructuring charges, corporate development expenses, amortization of deferred financing fees, stock-based compensation, gain on sale of equity method investment, loss on debt extinguishment, gains or losses from asset sales and includes cash income tax expense, because management believes that excluding such measures helps investors better understand the Company’s operating activities. |
| • | Adjusted EBITDA. We exclude from Adjusted EBITDA depreciation expense, amortization of intangibles, income tax, interest expense, interest income, stock-based compensation, gains or losses from asset sales, corporate development expenses, and restructuring charges, because management believes that excluding such items helps investors better understand our operating activities. |
In respect of the foregoing, we provide the following supplemental information to provide additional context for the use and consideration of the non-GAAP financial measures used elsewhere in this press release:
| • | Stock-based compensation. These expenses consist of expenses for employee stock options and employee awards under ASC 718-10. While stock-based compensation expense calculated in accordance with ASC 718-10 constitutes an ongoing and recurring expense, such expense is excluded from non-GAAP results because it is not an expense that typically requires or will require cash settlement by the Company and because such expense is not used by management to assess the core profitability of our business operations. |
| • | Amortization of intangibles. We incur amortization of acquired intangibles under ASC 805-10-65. Acquired intangibles primarily consist of customer relationships, non-compete agreements, trade names, and developed technology. Web.com expects to amortize for accounting purposes the fair value of the acquired intangibles based on the pattern in which the economic benefits of the intangible assets will be consumed as revenue is generated. Although the intangible assets generate revenue, the item is excluded because this expense is non-cash in nature and because the Company believes the non-GAAP financial measures excluding this item provide meaningful supplemental |
45
TABLE OF CONTENTS
| | information regarding the Company’s operational performance. In addition, excluding this item from various non-GAAP measures facilitates management’s internal comparisons to our historical operating results and comparisons to the Company’s competitors’ operating results. |
| • | Depreciation expense. We record depreciation expense associated with its fixed assets. Although the fixed assets generate revenue for Web.com, the item is excluded because the Company believes the non-GAAP financial measures excluding this item provide meaningful supplemental information regarding the Company’s operational performance, and its ability to invest in research and development and fund acquisitions and capital expenditures. In addition, excluding this item from certain non-GAAP measures facilitates management’s internal comparisons to our historical operating results and comparisons to the Company’s competitors’ operating results. |
| • | Amortization of deferred financing fees. We incur amortization expense related to deferred financing fees. This item is excluded because Web.com believes the non-GAAP measures excluding this item provide meaningful supplemental information regarding the Company’s operational performance. In addition, excluding this item from various non-GAAP measures facilitates management’s internal comparisons to our historical operating results and comparisons to the Company’s competitors’ operating results. |
| • | Restructuring charges. We have recorded restructuring charges and exclude the impact of these expenses from its non-GAAP measures, because such expense is not used by management to assess the core profitability of the Company’s business operations. |
| • | Income tax expense. Due to the magnitude of our historical net operating losses and related deferred tax asset, the Company excludes income tax expense from its non-GAAP measures primarily because they are not indicative of the cash tax paid by the Company and therefore are not reflective of ongoing operating results. Further, excluding this item from non-GAAP measures facilitates management’s internal comparisons to the Company’s historical operating results. Web.com also excludes income tax expense altogether from certain non-GAAP financial measures because the Company believes that the non-GAAP measures excluding this item provide meaningful supplemental information regarding the Company’s operational performance and facilitates management’s internal comparisons to the Company’s historical operating results and comparisons to the Company’s competitors’ operating results. |
| • | Fair value adjustment to deferred revenue and deferred expense. We have recorded a fair value adjustment to acquired deferred revenue and deferred expense in accordance with ASC 805-10-65. We exclude the impact of this adjustment from its non-GAAP measures, because doing so results in non-GAAP revenue and non-GAAP net income which are reflective of ongoing operating results and more comparable to historical operating results, since the majority of the Company’s revenue is recurring subscription revenue. Excluding the fair value adjustment to deferred revenue and deferred expense therefore facilitates management’s internal comparisons to our historical operating results. |
| • | Corporate development expenses. We incur expenses relating to acquisitions and successful integration of acquisitions. Web.com excludes the impact of these expenses from its non-GAAP measures, because such expense is not used by management to assess the core profitability of the Company’s business operations. |
| • | Gains or losses from asset sales and certain other transactions. Web.com excludes the impact of asset sales and certain other transactions including debt extinguishments and the sale of equity method investments from its non-GAAP measures because the impact of this item is not considered part of our ongoing operations. |
46
TABLE OF CONTENTS
The following table presents our non-GAAP measures for the periods indicated (in thousands):
| | | | | | |
| | Twelve Months Ended December 31, |
| | | 2012 | | 2011 | | 2010 |
Reconciliation of GAAP revenue to
non-GAAP revenue
| | | | | | | | | | | | |
| GAAP revenue | | $ | 407,646 | | | $ | 199,205 | | | $ | 120,289 | |
| Fair value adjustment to deferred revenue | | | 83,732 | | | | 35,238 | | | | 13,080 | |
| Non-GAAP revenue | | $ | 491,378 | | | $ | 234,443 | | | $ | 133,369 | |
Reconciliation of GAAP net (loss) income to
non-GAAP net income
| | | | | | | | | | | | |
| GAAP net (loss) income | | $ | (122,217 | ) | | $ | (12,309 | ) | | $ | (6,532 | ) |
| Amortization of intangibles | | | 70,350 | | | | 25,389 | | | | 12,879 | |
| Loss on sale of assets | | | 403 | | | | 10 | | | | 6 | |
| Stock based compensation | | | 11,927 | | | | 6,933 | | | | 4,711 | |
| Income tax benefit | | | (16,738 | ) | | | (49,958 | ) | | | (10,720 | ) |
| Restructuring charges | | | 2,469 | | | | 9,536 | | | | 2,171 | |
| Corporate development | | | 660 | | | | 13,083 | | | | 2,892 | |
| Amortization of deferred financing fees | | | 11,017 | | | | 6,856 | | | | 573 | | | | | |
| Cash income tax expense | | | (1,044 | ) | | | (214 | ) | | | (845 | ) |
| Fair value adjustment to deferred revenue | | | 83,732 | | | | 35,238 | | | | 13,080 | |
| Fair value adjustment to deferred expense | | | 2,376 | | | | 739 | | | | 214 | |
| Loss on debt extinguishment | | | 41,977 | | | | — | | | | — | |
| Gain on sale of equity method investment | | | (5,156 | ) | | | — | | | | — | |
| Non-GAAP net income | | $ | 79,756 | | | $ | 35,303 | | | $ | 18,429 | |
Reconciliation of GAAP diluted net (loss) income per share to non-GAAP net income per share
| | | | | | | | | | | | |
| Diluted GAAP net (loss) income | | $ | (2.61 | ) | | $ | (0.40 | ) | | $ | (0.26 | ) |
| Diluted equity | | | 0.17 | | | | 0.04 | | | | 0.02 | |
| Amortization of intangibles | | | 1.40 | | | | 0.76 | | | | 0.47 | |
| Loss on sale of assets | | | 0.01 | | | | — | | | | — | |
| Stock based compensation | | | 0.24 | | | | 0.21 | | | | 0.17 | |
| Income tax benefit | | | (0.33 | ) | | | (1.48 | ) | | | (0.39 | ) |
| Restructuring charges | | | 0.05 | | | | 0.28 | | | | 0.08 | |
| Corporate development | | | 0.01 | | | | 0.39 | | | | 0.11 | |
| Amortization of deferred financing fees | | | 0.22 | | | | 0.20 | | | | 0.02 | |
| Cash income tax expense | | | (0.02 | ) | | | (0.01 | ) | | | (0.03 | ) |
| Fair value adjustment to deferred revenue | | | 1.67 | | | | 1.04 | | | | 0.48 | |
| Fair value adjustment to deferred expense | | | 0.05 | | | | 0.02 | | | | 0.01 | |
| Loss on debt extinguishment | | | 0.84 | | | | — | | | | — | |
| Gain on sale of equity method investment | | | (0.11 | ) | | | — | | | | — | |
| Diluted Non-GAAP net income | | $ | 1.59 | | | $ | 1.05 | | | $ | 0.68 | |
Reconciliation of GAAP operating loss to non-GAAP operating income
| | | | | | | | | | | | |
| GAAP operating loss | | $ | (36,010 | ) | | $ | (40,767 | ) | | $ | (14,536 | ) |
| Amortization of intangibles | | | 70,350 | | | | 25,389 | | | | 12,879 | |
| Loss on sale of assets | | | 403 | | | | 10 | | | | — | |
| Stock based compensation | | | 11,927 | | | | 6,933 | | | | 4,711 | |
47
TABLE OF CONTENTS
| | | | | | |
| | Twelve Months Ended December 31, |
| | | 2012 | | 2011 | | 2010 |
| Restructuring charges | | | 2,469 | | | | 9,536 | | | | 2,171 | |
| Corporate development | | | 660 | | | | 13,083 | | | | 2,892 | |
| Fair value adjustment to deferred revenue | | | 83,732 | | | | 35,238 | | | | 13,080 | |
| Fair value adjustment to deferred expense | | | 2,376 | | | | 739 | | | | 214 | |
| Non-GAAP operating income | | $ | 135,907 | | | $ | 50,161 | | | $ | 21,411 | |
Reconciliation of GAAP operating margin to
non-GAAP operating margin
| | | | | | | | | | | | |
| GAAP operating margin | | | -9 | % | | | -20 | % | | | -12 | % |
| Amortization of intangibles | | | 14 | % | | | 11 | % | | | 10 | % |
| Restructuring charges | | | 1 | % | | | 4 | % | | | 2 | % |
| Corporate development | | | 0 | % | | | 6 | % | | | 2 | % |
| Fair value adjustment to deferred revenue | | | 21 | % | | | 17 | % | | | 10 | % |
| Fair value adjustment to deferred expense | | | 0 | % | | | 0 | % | | | 0 | % |
| Stock based compensation | | | 1 | % | | | 3 | % | | | 4 | % |
| Non-GAAP operating margin | | | 28 | % | | | 21 | % | | | 16 | % |
Reconciliation of GAAP operating loss to adjusted EBITDA
| | | | | | | | | | | | |
| GAAP operating loss | | $ | (36,010 | ) | | $ | (40,767 | ) | | $ | (14,536 | ) |
| Depreciation and amortization | | | 78,981 | | | | 29,456 | | | | 15,724 | |
| Loss on sale of assets | | | 403 | | | | 10 | | | | — | |
| Stock based compensation | | | 11,927 | | | | 6,933 | | | | 4,711 | |
| Restructuring charges | | | 2,469 | | | | 9,536 | | | | 2,171 | |
| Corporate development | | | 660 | | | | 13,083 | | | | 2,892 | |
| Fair value adjustment to deferred revenue | | | 83,732 | | | | 35,238 | | | | 13,080 | |
| Fair value adjustment to deferred expense | | | 2,376 | | | | 739 | | | | 214 | |
| Adjusted EBITDA | | $ | 144,538 | | | $ | 54,228 | | | $ | 24,256 | |
Item 8. Financial Statements and Supplementary Data.
Quarterly Results of Operations
The following tables set forth selected unaudited quarterly consolidated statement of operations data for the eight most recent quarters. The information for each of these quarters has been prepared on the same basis as the audited consolidated financial statements, and in the opinion of management, includes all adjustments necessary for the fair presentation of the results of operations for such periods. This data should be read in conjunction with the audited consolidated financial statements and the related notes included in this annual report. These quarterly operating results are not necessarily indicative of our operating results for any future period.
48
TABLE OF CONTENTS
| | | | | | | | | | | | | | | | |
| | | | | | | | | | | | | | | | |
| | Three Months Ended |
| | | Mar 31, 2012 | | Jun 30, 2012(1) | | Sept 30, 2012 | | Dec 31, 2012(2) | | Mar 31,
2011 | | Jun 30,
2011 | | Sept 30,
2011 | | Dec 31, 2011(3)(4) |
| | | (in thousands) |
| Total revenue | | $ | 91,514 | | | $ | 98,947 | | | $ | 105,753 | | | $ | 111,432 | | | $ | 39,481 | | | $ | 42,241 | | | $ | 43,903 | | | $ | 73,580 | |
| Total cost of revenue | | | 38,608 | | | | 39,801 | | | | 40,195 | | | | 41,726 | | | | 17,707 | | | | 17,636 | | | | 17,361 | | | | 32,117 | |
| Gross profit | | | 52,906 | | | | 59,146 | | | | 65,558 | | | | 69,706 | | | | 21,774 | | | | 24,605 | | | | 26,542 | | | | 41,463 | |
| Total operating expenses | | | 71,448 | | | | 70,388 | | | | 71,179 | | | | 70,311 | | | | 25,352 | | | | 25,159 | | | | 30,332 | | | | 74,308 | |
| Loss from operations | | | (18,542 | ) | | | (11,242 | ) | | | (5,621 | ) | | | (605 | ) | | | (3,578 | ) | | | (554 | ) | | | (3,790 | ) | | | (32,845 | ) |
| Net (loss) income from continuing operations | | | (29,779 | ) | | | (19,059 | ) | | | (21,502 | ) | | | (51,877 | ) | | | (5,735 | ) | | | (1,972 | ) | | | (5,471 | ) | | | 669 | |
| Income (loss) from discontinued operations | | | — | | | | — | | | | — | | | | — | | | | 125 | | | | 125 | | | | 75 | | | | (125 | ) |
| Net (loss) income | | $ | (29,779 | ) | | $ | (19,059 | ) | | $ | (21,502 | ) | | $ | (51,877 | ) | | $ | (5,610 | ) | | $ | (1,847 | ) | | $ | (5,396 | ) | | $ | 544 | |
Net (loss) income per
common share:
| | | | | | | | | | | | | | | | | | | | | | | | | | | | | | | | |
| Basic continuing operations | | $ | (0.65 | ) | | $ | (0.41 | ) | | $ | (0.45 | ) | | $ | (1.10 | ) | | $ | (0.21 | ) | | $ | (0.07 | ) | | $ | (0.19 | ) | | $ | 0.02 | |
| Basic discontinued operations | | $ | — | | | $ | — | | | $ | — | | | $ | — | | | $ | — | | | $ | — | | | $ | — | | | $ | — | |
| Diluted continuing operations | | $ | (0.65 | ) | | $ | (0.41 | ) | | $ | (0.45 | ) | | $ | (1.10 | ) | | $ | (0.21 | ) | | $ | (0.07 | ) | | $ | (0.19 | ) | | $ | 0.02 | |
| Diluted discontinued operations | | $ | — | | | $ | — | | | $ | — | | | $ | — | | | $ | — | | | $ | — | | | $ | — | | | $ | — | |
| (1) | On May 31, 2012, the Company sold its interest in an equity method investment named OrangeSoda, Inc., a Nevada corporation in the business of developing, marketing, selling and providing search engine marketing and optimization services for small businesses. In June 2012, the Company received proceeds of $7.2 million from the buyer and recorded a gain of $5.2 million. |
| (2) | Included in the fourth quarter ended December 31, 2012 is a $42.0 million loss on debt extinguishment. In November 2012, the Company repriced its First Lien Term Loan and increased the amount of available borrowings under its revolving credit facility. The terms of the Second Lien Term Loan were unchanged by the repricing. However, the Company used the $60 million of proceeds from increasing the First Lien Term Loan, $20 million from the revolving credit facility and $8 million of cash on hand to repay $88 million of the Second Lien Term Loan. |
| (3) | The Company completed its acquisition of Network Solutions on October 27, 2011. The earnings per share amounts shown for the fourth quarter ended December 31, 2011 reflect the impact of issuing 18 million common shares to the sellers on October 27, 2011. In addition, the fourth quarter 2011 results of operations include the results of Network Solutions from October 28, 2011 through December 31, 2011. |
| (4) | Included in the fourth quarter ended December 31, 2011 is a $28.4 million tax benefit due to a reduction in the deferred tax asset valuation allowance resulting from the acquisition of Network Solutions that occurred on October 27, 2011. |
Item 9. Changes in and Disagreements With Accountants on Accounting and Financial Disclosure.
None.
49
TABLE OF CONTENTS
Item 9A. Controls and Procedures.
Evaluation of disclosure controls and procedures.
Based on their evaluation as of December 31, 2012, our Chief Executive Officer and Chief Financial Officer, have concluded that our disclosure controls and procedures (as defined in Rules 13a-15(e) and 15d-15(e) under the Securities Exchange Act of 1934, as amended) were effective at the reasonable assurance level to ensure that the information required to be disclosed by us in this annual report on Form 10-K was recorded, processed, summarized and reported within the time periods specified in the Securities and Exchange Commission’s rules, and that such information is accumulated and communicated to us to allow timely decisions regarding required disclosures.
Our disclosure controls and procedures are designed to provide reasonable assurance of achieving their objectives. Our management, including our Chief Executive Officer and Chief Financial Officer, does not expect that our disclosure controls and procedures or our internal controls will prevent all errors and all fraud. A control system, no matter how well conceived and operated, can provide only reasonable, not absolute, assurance that the objectives of the control system are met. Further, the design of a control system must reflect the fact that there are resource constraints, and the benefits of controls must be considered relative to their costs. Because of the inherent limitations in all control systems, no evaluation of controls can provide absolute assurance that all control issues and instances of fraud, if any, within our Company have been detected.
Management’s Report on Internal Control over Financial Reporting.
The management of Web.com Group, Inc. is responsible for establishing and maintaining adequate internal control over financial reporting as such term is defined in Rules 13a-15(f) and 15d-15(f) under the Securities Exchange Act of 1934, as amended. The Company’s internal control over financial reporting is designed to provide reasonable assurance, based on an appropriate cost-benefit analysis, regarding the reliability of our financial reporting and the preparation of financial statements for external purposes in accordance with U.S. generally accepted accounting principles. The Company’s internal control over financial reporting includes those policies and procedures that: (i) pertain to the maintenance of records that, in reasonable detail, accurately and fairly reflect the transactions and dispositions of the assets of the Company; (ii) provide reasonable assurance that transactions are recorded as necessary to permit preparation of financial statements in accordance with U.S. generally accepted accounting principles, and that receipts and expenditures of the Company are being made only in accordance with authorizations of management and directors of the Company; and (iii) provide reasonable assurance regarding prevention or timely detection of unauthorized acquisition, use or disposition of the Company’s assets that could have a material effect on the financial statements.
Because of its inherent limitations, internal control over financial reporting may not prevent or detect misstatements. Therefore, even those systems determined to be effective can provide only reasonable assurance with respect to financial statement preparation and presentation. Also, projections of any evaluation of effectiveness to future periods are subject to risk that controls may become inadequate because of changes in conditions, or that the degree of compliance with the policies or procedures may deteriorate.
Management assessed the effectiveness of the Company’s internal control over financial reporting as of December 31, 2012. In making this assessment, management used the criteria set forth by the Committee of Sponsoring Organizations of the Treadway Commission (COSO) inInternal Control-Integrated Framework. Based on management’s assessment and those criteria, management concluded that the Company maintained effective internal control over financial reporting as of December 31, 2012.
The Company’s independent registered public accounting firm, Ernst & Young LLP, has issued an audit report on the effectiveness of the Company’s internal control over financial reporting.
50
TABLE OF CONTENTS
Report of Independent Registered Public Accounting Firm
The Board of Directors and Shareholders of Web.com Group, Inc.
We have audited Web.com Group Inc.’s internal control over financial reporting as of December 31, 2012, based on criteria established in Internal Control — Integrated Framework issued by the Committee of Sponsoring Organizations of the Treadway Commission (the COSO criteria). Web.com Group, Inc.’s management is responsible for maintaining effective internal control over financial reporting, and for its assessment of the effectiveness of internal control over financial reporting included in the accompanying Management’s Report on Internal Control over Financial Reporting. Our responsibility is to express an opinion on the company’s internal control over financial reporting based on our audit.
We conducted our audit in accordance with the standards of the Public Company Accounting Oversight Board (United States). Those standards require that we plan and perform the audit to obtain reasonable assurance about whether effective internal control over financial reporting was maintained in all material respects. Our audit included obtaining an understanding of internal control over financial reporting, assessing the risk that a material weakness exists, testing and evaluating the design and operating effectiveness of internal control based on the assessed risk, and performing such other procedures as we considered necessary in the circumstances. We believe that our audit provides a reasonable basis for our opinion.
A company’s internal control over financial reporting is a process designed to provide reasonable assurance regarding the reliability of financial reporting and the preparation of financial statements for external purposes in accordance with generally accepted accounting principles. A company’s internal control over financial reporting includes those policies and procedures that (1) pertain to the maintenance of records that, in reasonable detail, accurately and fairly reflect the transactions and dispositions of the assets of the company; (2) provide reasonable assurance that transactions are recorded as necessary to permit preparation of financial statements in accordance with generally accepted accounting principles, and that receipts and expenditures of the company are being made only in accordance with authorizations of management and directors of the company; and (3) provide reasonable assurance regarding prevention or timely detection of unauthorized acquisition, use, or disposition of the company’s assets that could have a material effect on the financial statements.
Because of its inherent limitations, internal control over financial reporting may not prevent or detect misstatements. Also, projections of any evaluation of effectiveness to future periods are subject to the risk that controls may become inadequate because of changes in conditions, or that the degree of compliance with the policies or procedures may deteriorate.
In our opinion, Web.com Group, Inc. maintained, in all material respects, effective internal control over financial reporting as of December 31, 2012, based on the COSO criteria.
We also have audited, in accordance with the standards of the Public Company Accounting Oversight Board (United States), the consolidated balance sheets of Web.com Group, Inc. as of December 31, 2012 and 2011, and the related consolidated statements of comprehensive loss, stockholders’ equity, and cash flows for each of the three years in the period ended December 31, 2012 of Web.com Group, Inc. and our report dated March 6, 2013 expressed an unqualified opinion thereon.
/s/ Ernst & Young LLP
Certified Public Accountants
Orlando, Florida
March 6, 2013
51
TABLE OF CONTENTS
Changes in internal control over financial reporting.
There were no changes in our internal controls over financial reporting (as defined in Rules 13a-15(f) and 15d-15(f)) during the quarter ended December 31, 2012 that have materially affected, or are reasonably likely to materially affect, our internal controls over financial reporting.
Item 9B. Other Information.
None.
52
TABLE OF CONTENTS
PART III
Item 10. Directors, Executive Officers and Corporate Governance.
The information required by this item, including such information regarding our directors and executive officers and compliance with Section 16(a) of the Securities Exchange act of 1934, is incorporated herein by reference from the Proxy Statement. We have adopted a written code of conduct that applies to our principal executive officer, principal financial officer and principal accounting officer, or persons performing similar functions. The code of conduct is posted on our website at http://ir.web.com/documents.cfm. Amendments to, and waivers from, the code of conduct that applies to any of these officers, or persons performing similar functions, and that relates to any element of the code of ethics definition enumerated in Item 406(b) of Regulation S-K, will be disclosed at the website address provided above and, to the extent required by applicable regulations, on a current report on Form 8-K.
Item 11. Executive Compensation.
The information required by this item is incorporated herein by reference from the section entitled “Executive Compensation Discussion and Analysis” in the Proxy Statement.
Item 12. Security Ownership of Certain Beneficial Owners and Management and Related Stockholder Matters.
The information required by this item is incorporated herein by reference from the sections entitled “Security Ownership of Certain Beneficial Owners and Management” and “Equity Compensation Plan Information” in the Proxy Statement.
Item 13. Certain Relationships and Related Transactions, and Director Independence.
The information required by this item is incorporated herein by reference from the section entitled “Certain Relationships and Related Transactions” in the Proxy Statement.
Item 14. Principal Accounting Fees and Services.
The information required by this item is incorporated herein by reference from the section entitled “Ratification of Selection of Independent Registered Public Accounting Firm” in the Proxy Statement.
Item 15. Exhibits, Financial Statement Schedules.
The following documents are filed as part of this Form 10-K:
53
54
TABLE OF CONTENTS
Report of Independent Registered Public Accounting Firm
The Board of Directors and Shareholders of Web.com Group, Inc.
We have audited the accompanying consolidated balance sheets of Web.com Group, Inc. as of December 31, 2012 and 2011, and the related consolidated statements of comprehensive loss, stockholders’ equity, and cash flows for each of the three years in the period ended December 31, 2012. These financial statements are the responsibility of the Company’s management. Our responsibility is to express an opinion on these financial statements based on our audits.
We conducted our audits in accordance with the standards of the Public Company Accounting Oversight Board (United States). Those standards require that we plan and perform the audit to obtain reasonable assurance about whether the financial statements are free of material misstatement. An audit includes examining, on a test basis, evidence supporting the amounts and disclosures in the financial statements. An audit also includes assessing the accounting principles used and significant estimates made by management, and evaluating the overall financial statement presentation. We believe that our audits provide a reasonable basis for our opinion.
In our opinion, the consolidated financial statements referred to above present fairly, in all material respects, the consolidated financial position of Web.com Group, Inc. at December 31, 2012 and 2011, and the consolidated results of its operations and its cash flows for each of the three years in the period ended December 31, 2012, in conformity with U.S. generally accepted accounting principles.
We also have audited, in accordance with the standards of the Public Company Accounting Oversight Board (United States), Web.com Group, Inc.’s internal control over financial reporting as of December 31, 2012, based on criteria established in Internal Control — Integrated Framework issued by the Committee of Sponsoring Organizations of the Treadway Commission and our report dated March 6, 2013 expressed an unqualified opinion thereon.
/s/ Ernst & Young LLP
Certified Public Accountants
Orlando, Florida
March 6, 2013
55
TABLE OF CONTENTS
Web.com Group, Inc.
Consolidated Balance Sheets
(in thousands, except share amounts)
| | | | |
| | December 31, |
| | | 2012 | | 2011 |
Assets
| | | | | | | | |
Current assets:
| | | | | | | | |
| Cash and cash equivalents | | $ | 15,181 | | | $ | 13,364 | |
| Accounts receivable, net of allowance of $2,337 and $1,560, respectively | | | 15,007 | | | | 13,094 | |
| Prepaid expenses | | | 6,697 | | | | 5,184 | |
| Deferred expenses, current | | | 59,255 | | | | 57,302 | |
| Deferred taxes | | | 18,092 | | | | 18,563 | |
| Other current assets | | | 5,116 | | | | 5,012 | |
| Total current assets | | | 119,348 | | | | 112,519 | |
| Property and equipment, net | | | 40,079 | | | | 25,696 | |
| Deferred expenses, non-current | | | 63,147 | | | | 68,136 | |
| Goodwill | | | 628,176 | | | | 631,362 | |
| Intangible assets, net | | | 469,703 | | | | 539,979 | |
| Other assets | | | 6,817 | | | | 21,788 | |
| Total assets | | $ | 1,327,270 | | | $ | 1,399,480 | |
Liabilities and stockholders’ equity
| | | | | | | | |
Current liabilities:
| | | | | | | | |
| Accounts payable | | $ | 6,385 | | | $ | 4,931 | |
| Accrued expenses | | | 11,562 | | | | 15,953 | |
| Accrued compensation and benefits | | | 15,413 | | | | 15,956 | |
| Accrued restructuring costs and other reserves | | | 1,477 | | | | 5,687 | |
| Deferred revenue | | | 191,149 | | | | 142,157 | |
| Current portion of debt and capital lease obligations | | | 4,681 | | | | 4,182 | |
| Other liabilities | | | 2,556 | | | | 2,496 | |
| Total current liabilities | | | 233,223 | | | | 191,362 | |
| Deferred revenue | | | 175,816 | | | | 132,814 | |
| Long-term debt and capital lease obligations | | | 688,140 | | | | 714,703 | |
| Deferred tax liabilities | | | 64,126 | | | | 84,832 | |
| Other long-term liabilities | | | 4,352 | | | | 4,013 | |
| Total liabilities | | | 1,165,657 | | | | 1,127,724 | |
Stockholders’ equity:
| | | | | | | | |
| Common stock, $0.001 par value; 150,000,000 shares authorized, 49,175,642 and 47,359,304 shares issued and outstanding at December 31, 2012 and 2011, respectively | | | 49 | | | | 47 | |
| Additional paid-in capital | | | 454,022 | | | | 441,955 | |
| Accumulated other comprehensive income | | | 5 | | | | — | |
| Accumulated deficit | | | (292,463 | ) | | | (170,246 | ) |
| Total stockholders’ equity | | | 161,613 | | | | 271,756 | |
| Total liabilities and stockholders’ equity | | $ | 1,327,270 | | | $ | 1,399,480 | |
See accompanying notes to consolidated financial statements.
56
TABLE OF CONTENTS
Web.com Group, Inc.
Consolidated Statements of Comprehensive Loss
(in thousands, except per share amounts)
| | | | | | |
| | Year Ended December 31, |
| | | 2012 | | 2011 | | 2010 |
Revenue:
| | | | | | | | | | | | |
| Subscription | | $ | 396,687 | | | $ | 195,645 | | | $ | 117,691 | |
| Professional services and other | | | 10,959 | | | | 3,560 | | | | 2,598 | |
| Total revenue | | | 407,646 | | | | 199,205 | | | | 120,289 | |
Cost of revenue (excluding depreciation and amortization shown separately below):
| | | | | | | | | | | | |
| Subscription | | | 153,417 | | | | 83,406 | | | | 51,371 | |
| Professional services and other | | | 6,913 | | | | 1,415 | | | | 1,861 | |
| Total cost of revenue | | | 160,330 | | | | 84,821 | | | | 53,232 | |
| Gross profit | | | 247,316 | | | | 114,384 | | | | 67,057 | |
Operating expenses:
| | | | | | | | | | | | |
| Sales and marketing | | | 117,811 | | | | 51,743 | | | | 28,678 | |
| Research and development | | | 34,258 | | | | 19,252 | | | | 10,910 | |
| General and administrative | | | 49,807 | | | | 45,164 | | | | 24,110 | |
| Restructuring charges | | | 2,469 | | | | 9,536 | | | | 2,171 | |
| Depreciation and amortization | | | 78,981 | | | | 29,456 | | | | 15,724 | |
| Total operating expenses | | | 283,326 | | | | 155,151 | | | | 81,593 | |
| Loss from operations | | | (36,010 | ) | | | (40,767 | ) | | | (14,536 | ) |
| Interest expense, net | | | (66,124 | ) | | | (18,020 | ) | | | (2,832 | ) |
| Loss on debt extinguishment | | | (41,977 | ) | | | (3,806 | ) | | | — | |
| Gain on sale of equity method investment | | | 5,156 | | | | — | | | | — | |
| Loss before income taxes from continuing operations | | | (138,955 | ) | | | (62,593 | ) | | | (17,368 | ) |
| Income tax benefit | | | 16,738 | | | | 50,084 | | | | 10,720 | |
| Net loss from continuing operations | | | (122,217 | ) | | | (12,509 | ) | | | (6,648 | ) |
Discontinued operations:
| | | | | | | | | | | | |
| Loss from discontinued operations, net of tax | | | — | | | | — | | | | (9 | ) |
| Gain on sale of discontinued operations, net of tax | | | — | | | | 200 | | | | 125 | |
| Income from discontinued operations | | | — | | | | 200 | | | | 116 | |
| Net loss | | $ | (122,217 | ) | | $ | (12,309 | ) | | $ | (6,532 | ) |
Other comprehensive income (loss):
| | | | | | | | | | | | |
| Interest rate swap gain (loss), net of tax | | | — | | | | 40 | | | | (40 | ) |
| Unrealized gains on investments, net of tax | | | 5 | | | | — | | | | — | |
| Total comprehensive loss | | $ | (122,212 | ) | | $ | (12,269 | ) | | $ | (6,572 | ) |
Basic earnings per share:
| | | | | | | | | | | | |
| Loss from continuing operations per common share | | $ | (2.61 | ) | | $ | (0.41 | ) | | $ | (0.26 | ) |
| Income from discontinued operations per common share | | $ | — | | | $ | 0.01 | | | $ | — | |
| Net loss per common share | | $ | (2.61 | ) | | $ | (0.40 | ) | | $ | (0.26 | ) |
Diluted earnings per share:
| | | | | | | | | | | | |
| Loss from continuing operations per common share | | $ | (2.61 | ) | | $ | (0.41 | ) | | $ | (0.26 | ) |
| Income from discontinued operations per common share | | $ | — | | | $ | 0.01 | | | $ | — | |
| Net loss per common share | | $ | (2.61 | ) | | $ | (0.40 | ) | | $ | (0.26 | ) |
| Basic weighted average common shares outstanding | | | 46,892 | | | | 30,675 | | | | 25,515 | |
| Diluted weighted average common shares outstanding | | | 46,892 | | | | 30,675 | | | | 25,515 | |
See accompanying notes to consolidated financial statements.
57
TABLE OF CONTENTS
Web.com Group, Inc. Consolidated Statements of Stockholders’ Equity
(In thousands, except share amounts)
| | | | | | | | | | | | | | | | |
| | Common Stock | | Treasury Stock | | Additional Paid-in Capital | | Accumulated Other Comprehensive Income | | Accumulated Deficit | | Total Stockholders’ Equity (Deficit) |
| | | Shares | | Amount | | Shares | | Amount |
| Balance, December 31, 2009 | | | 26,176,967 | | | $ | 26 | | | | 1,619,857 | | | $ | (5,477 | ) | | $ | 260,552 | | | $ | — | | | $ | (151,405 | ) | | $ | 103,696 | |
Comprehensive loss:
| | | | | | | | | | | | | | | | | | | | | | | | | | | | | | | | |
| Net loss | | | — | | | | — | | | | — | | | | — | | | | — | | | | — | | | | (6,532 | ) | | | (6,532 | ) |
| Other comprehensive loss, net of income taxes | | | — | | | | — | | | | — | | | | — | | | | — | | | | (40 | ) | | | — | | | | (40 | ) |
| Total comprehensive loss | | | — | | | | — | | | | — | | | | — | | | | — | | | | — | | | | — | | | | (6,572 | ) |
| Exercise of stock options | | | 535,442 | | | | 1 | | | | (535,442 | ) | | | 1,718 | | | | 120 | | | | — | | | | — | | | | 1,839 | |
| Issuance of restricted stock | | | 668,250 | | | | — | | | | (668,250 | ) | | | 1,863 | | | | (1,863 | ) | | | — | | | | — | | | | — | |
| Stock compensation expense | | | — | | | | — | | | | — | | | | — | | | | 4,711 | | | | — | | | | — | | | | 4,711 | |
| Common stock repurchased | | | (40,597 | ) | | | — | | | | — | | | | — | | | | (53 | ) | | | — | | | | — | | | | (53 | ) |
| Issuance costs of common stock | | | — | | | | — | | | | — | | | | — | | | | (14 | ) | | | — | | | | — | | | | (14 | ) |
| Balance, December 31, 2010 | | | 27,340,062 | | | | 27 | | | | 416,165 | | | | (1,896 | ) | | | 263,453 | | | | (40 | ) | | | (157,937 | ) | | | 103,607 | |
Comprehensive loss:
| | | | | | | | | | | | | | | | | | | | | | | | | | | | | | | | |
| Net loss | | | — | | | | — | | | | — | | | | — | | | | — | | | | — | | | | (12,309 | ) | | | (12,309 | ) |
| Other comprehensive income, net of tax | | | — | | | | — | | | | — | | | | — | | | | — | | | | 40 | | | | — | | | | 40 | |
| Total comprehensive loss | | | — | | | | — | | | | — | | | | — | | | | — | | | | — | | | | — | | | | (12,269 | ) |
| Issuance of common stock for acquisition (Note 7) | | | 18,000,000 | | | | 18 | | | | — | | | | — | | | | 164,862 | | | | — | | | | — | | | | 164,880 | |
| Exercise of stock options | | | 1,707,613 | | | | 2 | | | | (416,165 | ) | | | 1,896 | | | | 7,175 | | | | — | | | | — | | | | 9,073 | |
| Issuance of restricted stock | | | 342,000 | | | | — | | | | — | | | | — | | | | — | | | | — | | | | — | | | | — | |
| Stock compensation expense | | | — | | | | — | | | | — | | | | — | | | | 6,933 | | | | — | | | | — | | | | 6,933 | |
| Common stock repurchased | | | (30,371 | ) | | | — | | | | — | | | | — | | | | (452 | ) | | | — | | | | — | | | | (452 | ) |
| Issuance costs of common stock | | | — | | | | — | | | | — | | | | — | | | | (16 | ) | | | — | | | | — | | | | (16 | ) |
| Balance, December 31, 2011 | | | 47,359,304 | | | | 47 | | | | — | | | | — | | | | 441,955 | | | | — | | | | (170,246 | ) | | | 271,756 | |
Comprehensive loss:
| | | | | | | | | | | | | | | | | | | | | | | | | | | | | | | | |
| Net loss | | | — | | | | — | | | | — | | | | — | | | | — | | | | — | | | | (122,217 | ) | | | (122,217 | ) |
| Other comprehensive income, net of tax | | | — | | | | — | | | | — | | | | — | | | | — | | | | 5 | | | | — | | | | 5 | |
| Total comprehensive loss | | | — | | | | — | | | | — | | | | — | | | | — | | | | — | | | | — | | | | (122,212 | ) |
| Exercise of stock options | | | 1,718,766 | | | | 2 | | | | — | | | | — | | | | 7,026 | | | | — | | | | — | | | | 7,028 | |
| Common stock repurchased | | | (413,678 | ) | | | — | | | | — | | | | — | | | | (5,896 | ) | | | — | | | | — | | | | (5,896 | ) |
| Stock compensation expense | | | — | | | | — | | | | — | | | | — | | | | 11,927 | | | | — | | | | — | | | | 11,927 | |
| Issuance of restricted stock | | | 511,250 | | | | — | | | | — | | | | — | | | | — | | | | — | | | | — | | | | — | |
| Issuance costs of common stock | | | — | | | | — | | | | — | | | | — | | | | (990 | ) | | | — | | | | — | | | | (990 | ) |
| Balance, December 31, 2012 | | | 49,175,642 | | | $ | 49 | | | | — | | | $ | — | | | $ | 454,022 | | | $ | 5 | | | $ | (292,463 | ) | | $ | 161,613 | |
58
TABLE OF CONTENTS
Web.com Group, Inc.
Consolidated Statements of Cash Flows
(In thousands)
| | | | | | |
| | Year Ended December 31, |
| | | 2012 | | 2011 | | 2010 |
Cash flows from operating activities
| | | | | | | | | | | | |
| Net loss | | $ | (122,217 | ) | | $ | (12,309 | ) | | $ | (6,532 | ) |
Adjustments to reconcile net loss to net cash provided by operating activities:
| | | | | | | | | | | | |
| Gain on sale of discontinued operations | | | — | | | | (200 | ) | | | (125 | ) |
| Gain on sale of equity method investment | | | (5,156 | ) | | | — | | | | — | |
| Loss from debt extinguishment | | | 39,331 | | | | 3,806 | | | | — | |
| Depreciation and amortization | | | 78,981 | | | | 29,456 | | | | 15,724 | |
| Stock based compensation | | | 11,927 | | | | 6,933 | | | | 4,711 | |
| Deferred income tax benefit | | | (17,829 | ) | | | (50,112 | ) | | | (12,274 | ) |
| Amortization of debt issuance costs and other | | | 11,420 | | | | 2,766 | | | | 578 | |
Changes in operating assets and liabilities:
| | | | | | | | | | | | |
| Accounts receivable, net | | | (1,906 | ) | | | (407 | ) | | | 389 | |
| Prepaid expenses and other assets | | | (3,020 | ) | | | 1,711 | | | | 2,272 | |
| Deferred expenses | | | 3,004 | | | | 2,025 | | | | (963 | ) |
| Accounts payable | | | 295 | | | | (1,509 | ) | | | 1,010 | |
| Accrued expenses and other liabilities | | | (4,105 | ) | | | 1,694 | | | | (3,103 | ) |
| Accrued compensation and benefits | | | (577 | ) | | | (2,897 | ) | | | 3,492 | |
| Accrued restructuring | | | (4,176 | ) | | | 5,199 | | | | (585 | ) |
| Deferred revenue | | | 91,993 | | | | 28,768 | | | | 11,157 | |
| Net cash provided by operating activities | | | 77,965 | | | | 14,924 | | | | 15,751 | |
Cash flows from investing activities
| | | | | | | | | | | | |
| Business acquisitions, net of cash acquired | | | — | | | | (405,120 | ) | | | (130,142 | ) |
| Proceeds from sale of discontinued operations | | | — | | | | 325 | | | | 125 | |
| Proceeds from sale of equity method investment | | | 7,197 | | | | — | | | | — | |
| Investment in intangible assets | | | — | | | | — | | | | (1,396 | ) |
| Capital expenditures | | | (22,298 | ) | | | (4,270 | ) | | | (1,656 | ) |
| Other | | | (76 | ) | | | 83 | | | | — | |
| Net cash used in investing activities | | | (15,177 | ) | | | (408,982 | ) | | | (133,069 | ) |
Cash flows from financing activities
| | | | | | | | | | | | |
| Stock issuance costs | | | (21 | ) | | | (16 | ) | | | (14 | ) |
| Common stock repurchased | | | (4,683 | ) | | | (452 | ) | | | (53 | ) |
| Proceeds from long-term debt | | | 643,205 | | | | 745,500 | | | | 110,000 | |
| Payments of long-term debt | | | (701,574 | ) | | | (341,748 | ) | | | (12,256 | ) |
| Debt issuance costs | | | (3,720 | ) | | | (21,242 | ) | | | (5,318 | ) |
| Proceeds from exercise of stock options and other | | | 5,822 | | | | 9,073 | | | | 1,839 | |
| Net cash (used in) provided by financing activities | | | (60,971 | ) | | | 391,115 | | | | 94,198 | |
| Net increase (decrease) in cash and cash equivalents | | | 1,817 | | | | (2,943 | ) | | | (23,120 | ) |
| Cash and cash equivalents, beginning of year | | | 13,364 | | | | 16,307 | | | | 39,427 | |
| Cash and cash equivalents, end of year | | $ | 15,181 | | | $ | 13,364 | | | $ | 16,307 | |
Supplemental cash flow information
| | | | | | | | | | | | |
| Interest paid | | $ | 57,293 | | | $ | 14,364 | | | $ | 2,605 | |
| Income tax paid | | $ | 252 | | | $ | 1,089 | | | $ | 287 | |
Supplemental disclosure of non-cash transactions
| | | | | | | | | | | | |
| Acquisition-related note payable | | $ | — | | | $ | — | | | $ | 5,000 | |
59
TABLE OF CONTENTS
Web.com Group, Inc.
Notes to Consolidated Financial Statements
December 31, 2012
1. The Company and Summary of Significant Accounting Policies
Description of Company
Web.com Group, Inc. (referred to as “the Company”, “Web.com Group, Inc.” or “Web.com” herein) is a leading provider of a full line of internet services for small to medium-sized businesses (“SMBs”). Web.com is a global domain name registrar and further meets the internet needs of SMBs anywhere along their lifecycle with affordable subscription solutions including website design and related services, search engine optimization, search engine marketing, social media and mobile products, local sales leads, eCommerce solutions and call center services.
On October 27, 2011, the Company completed its acquisition of 100% of the equity interests in Net Sol Parent LLC (formerly known as GA-Net Sol Parent LLC) (“Network Solutions”), a provider of domain names, web hosting and online marketing services. On July 30, 2010, the Company completed its acquisition of the partnership interests in Register.com LP, another provider of domain names, online marketing and web services. Collectively, these acquisitions brought approximately 2.7 million subscribers that present substantial cross- and up-sell opportunities. See Note 7,Business Combinations, for additional information on these acquisitions.
The Company has reviewed the criteria of Accounting Standards Codification (“ASC”) 280-10,Segment Reporting, and has determined that the Company is comprised of only one segment, Web services and products.
Certain prior year amounts have been reclassified to break out additional information and conform to current year presentation.
Use of Estimates
The preparation of the consolidated financial statements in conformity with accounting principles generally accepted in the United States requires management to make estimates and assumptions that affect the reported amounts of assets and liabilities and disclosure of contingent assets and liabilities at the date of the financial statements and reported amounts of revenue and expenses during the reporting period. Actual results could differ from those estimates.
Principles of Consolidation
The Company’s consolidated financial statements include the assets, liabilities and the operating results of the Company and its wholly owned subsidiaries. All significant intercompany accounts and transactions have been eliminated. The consolidated financial statements include the assets and liabilities of Register.com LP as of December 31, 2010, 2011, and 2012, and the results of operations and cash flows beginning on July 30, 2010. The consolidated financial statements include the assets and liabilities of Network Solutions as of December 31, 2011 and 2012, and the results of operations and cash flows beginning on October 28, 2011.
Revenue Recognition and Deferred Revenue
The Company recognizes revenue in accordance with ASC 605,Revenue Recognition. The Company recognizes revenue when all of the following conditions are satisfied: (1) there is persuasive evidence of an arrangement; (2) the service has been provided to the customer; (3) the amount of fees to be paid by the customer is fixed or determinable; and (4) the collection of our fees is reasonably assured.
Thus, the Company recognizes subscription revenue on a daily basis, as services are provided. Customers are billed for the subscription on a monthly, quarterly, semi-annual, annual or on a multi-year basis, at the customer’s option. For all of the Company’s customers, regardless of the method the Company uses to bill them, subscription revenue is recorded as deferred revenue in the accompanying consolidated balance sheets. As services are performed, the Company recognizes subscription revenue on a daily basis over the applicable service period. When the Company provides a free trial period, the Company does not begin to recognize subscription revenue until the trial period has ended and the customer has been billed for the services.
60
TABLE OF CONTENTS
Web.com Group, Inc.
Notes to Consolidated Financial Statements
December 31, 2012
1. The Company and Summary of Significant Accounting Policies – (continued)
The Company accounts for multi-element arrangements, such as in the instances where the Company designs a custom website and separately offers other services such as hosting and marketing, in accordance with ASC 605-25,Revenue Recognition: Multiple-Element Arrangement (ASC 605-25). The Company may sell products or services to customers at the same time. For example, the Company may design a customer website and separately offer other services such as hosting and marketing or a customer may combine a domain registration with other services such as private registration or e-mail. In accordance with ASC 605-25, each element is accounted for as a separate unit of accounting provided the following criteria is met: the delivered products or services has value to the customer on a standalone basis; and for an arrangement that includes a general right of return relative to the delivered products or services, delivery or performance of the undelivered product or service is considered probable and is substantially controlled by the Company. The Company considers a deliverable to have standalone value if the product or service is sold separately by us or another vendor or could be resold by the customer. The Company’s products and services do not include a general right of return relative to the delivered products. In cases where the delivered products or services do not meet the separate unit of accounting criteria, the deliverables are combined and treated as one single unit of accounting for revenue recognition. We assign value to the separate units of accounting in multiple-element arrangements based on proportionate standalone unit value to the total value of the arrangement, multiplied by the actual selling price. Typically, the deliverables within multiple-element arrangements are provided over the same service period, and therefore revenue is recognized over the same period.
The Company incurs direct costs, primarily related to outbound and inbound sales call centers, to acquire new customers. Frequently, these new customers purchase products that result in the deferral of revenue by the Company. All direct costs related to acquiring new customers are expensed in the period incurred and not deferred over the related deferred revenue contract term.
Cash and Cash Equivalents
Cash and cash equivalents include cash on hand, bank demand deposit accounts, and money market accounts. For purposes of presentation in the Consolidated Balance Sheets, the Company considers all highly liquid investments with a maturity of three months or less when purchased to be cash equivalents.
Concentrations of Credit Risk
Financial instruments that potentially subject the Company to concentration of credit risk consist principally of cash and cash equivalents and trade receivables. The Company invests its cash in credit instruments of highly rated financial institutions; four institutions hold 98% of the total cash and cash equivalents.
Concentrations of credit risk with respect to trade accounts receivable are limited due to the large number of customers comprising the Company’s customer base and their geographic dispersion. The Company has not incurred any significant credit related losses.
Accounts Receivable
Accounts receivable are recorded on the balance sheet at net realizable value. The Company’s management uses historical collection percentages and customer-specific information, when available, to estimate the amount of trade receivables that are uncollectible and establishes reserves for uncollectible balances based on this information. Generally receivables are classified as past due after 60 days. Trade receivables are written off once collection efforts are exhausted. The Company does not generally require deposits or other collateral from customers. Bad debt expense reported in operating expenses excludes provisions made to the allowance for doubtful accounts for anticipated refunds and automated clearinghouse returns that are recorded as an adjustment to revenue.
Included in the accounts receivable line item in the consolidated balance sheet as of each of the years ended December 31, 2012 and 2011 is approximately $1.5 million of receivables primarily due from the Canadian government for job creation incentive rebates as well as for sales and use tax.
61
TABLE OF CONTENTS
Web.com Group, Inc.
Notes to Consolidated Financial Statements
December 31, 2012
1. The Company and Summary of Significant Accounting Policies – (continued)
Deferred Expenses
Deferred expenses primarily consist of prepaid domain name registry fees that are paid in full at the time a domain name is registered. The registry fees are recognized on a straight-line basis over the term of the domain registration period.
Debt Issuance Costs
The Company records certain loan origination discounts and other fees in connection with the issuance of long term debt. The loan origination discounts are recorded as a reduction in the carrying amount of the underlying debt and all other deferred costs are in other current or non-current assets. Debt issuance costs are amortized to interest expense over the life of the underlying debt using the effective interest method. In determining the periodic amortization expense, the Company includes estimates of prepayments based on the excess cash flow requirements as defined in the credit agreements. See Note 11,Long-term debt, for additional information.
Goodwill and Other Intangible Assets
In September 2011, the Financial Accounting Standards Board (“FASB”) issued Accounting Standards Update (“ASU”) 2011-08,Intangibles — Goodwill and Other (Topic 350): Testing Goodwill for Impairment, and in July 2012, the FASB issued ASU 2012-02,Intangibles-Goodwill and Other (Topic 350): Testing Indefinite-Lived Intangible Assets for Impairment in accordance with ASC 350. These new standards update the testing of goodwill and indefinite–lived intangible assets by permitting an entity to first assess qualitative factors to determine whether it is more likely than not (likelihood of greater than 50%) that the fair value of indefinite-lived intangible assets and goodwill balances are less than their carrying amount as a basis for determining whether it is necessary to perform the quantitative test as described in ASC 350.
The Company continues to perform the quantitative tests to determine if it is more likely than not that the carrying value of our indefinite-lived intangible assets and our goodwill is impaired during the year ended December 31, 2012. The Company tests goodwill and intangible assets for impairment using one reporting unit. A market approach is typically used to test goodwill for impairment, while our intangible asset test uses the income approach. The following is not a complete discussion of the Company’s calculation, but outlines the general assumptions and steps for testing goodwill and intangible assets for impairment:
Goodwill
The first step involves comparing the fair value of our reporting unit to their carrying value, including goodwill. The Company uses a market capitalization approach after considering an estimated control premium.
Intangible Assets
The Company estimates the fair value of indefinite-lived intangibles using the relief-from-royalty method, a form of the income approach. It is based on the principle that ownership of the intangible asset relieves the owner of the need to pay a royalty to another party in exchange for rights to use the asset. Key assumptions in estimating the fair value include, among other items, forecasted revenue, royalty rates, tax rate, and the benefit of tax amortization. The Company employs a weighted-average cost of capital approach to determine the discount rates used in our projections. The determination of the discount rate includes certain factors such as, but not limited to, the risk-free rate of return, entity specific risk, size premium, and the overall level of inherent risk.
If the carrying value of the reporting unit exceeds its fair value, the second step of the test is performed by comparing the carrying value of goodwill or intangible asset to its implied fair value. An impairment charge is recognized for the excess of the carrying value over its implied fair value.
62
TABLE OF CONTENTS
Web.com Group, Inc.
Notes to Consolidated Financial Statements
December 31, 2012
1. The Company and Summary of Significant Accounting Policies – (continued)
The results of these analyses indicated that the Company’s indefinite-lived intangible assets and goodwill were not impaired at December 31, 2012. See Note 9,Goodwill and Intangible Assets, in the consolidated financial statements for additional information.
Research and Development Costs
The Company expenses research and development costs as incurred.
Property and Equipment
Property and equipment, including software, are stated at cost less accumulated depreciation and amortization. Depreciation and amortization are provided over the estimated useful lives of the assets using the straight-line method. Depreciation expense includes the amortization of assets recorded under capital leases.
The asset lives used are presented in the table below:
| | |
| | Average Life in
Years |
| Computer equipment | | | 3 – 5 | |
| Software | | | 2 – 3 | |
| Furniture and fixtures | | | 5 | |
| Other equipment | | | 5 – 6 | |
| Buildings | | | 30 | |
| Building improvements | | | 15 | |
| Leasehold improvements | | | Shorter of asset’s life
or life of the lease | |
Advertising
Advertising costs are charged to operations as incurred. Included in advertising are general marketing and advertising costs, as well as online marketing and banner advertisements. Total advertising expense was $52.0 million, $15.8 million and $8.0 million for the years ending December 31, 2012, 2011 and 2010, respectively.
Income Taxes
The Company accounts for income taxes under the provisions of ASC 740,Income Taxes, using the liability method. ASC 740 requires recognition of deferred tax liabilities and assets for the expected future tax consequences of events that have been included in the financial statements or tax returns. Under this method, deferred tax liabilities and assets are determined based on the difference between the financial statement and tax basis of assets and liabilities using enacted tax rates in effect for the year in which the difference is expected to reverse.
Further, deferred tax assets are recognized for the expected realization of available deductible temporary differences and net operating loss and tax credit carry forwards. ASC 740 requires companies to assess whether a valuation allowance should be established against deferred tax assets based on consideration of all available evidence using a “more likely than not” threshold. In making such assessments, the Company considers the expected reversals of our existing deferred tax liabilities within the applicable jurisdictions and carry forward periods, based on our existing Section 382 limitations. The Company does not consider deferred tax liabilities related to indefinite lived intangibles or tax deductible goodwill as a source of future taxable income. Additionally, the Company does not consider future taxable income (exclusive of the reversal of existing deferred tax liabilities and carry forwards) because we continue to be in a three-year cumulative loss position.
A valuation allowance is recorded to reduce our deferred tax assets to the amount that is “more likely than not” to be realized based on the above methodology. The Company reviews the adequacy of the valuation allowance on an ongoing basis and adjust our valuation allowance in the appropriate period, if applicable.
63
TABLE OF CONTENTS
Web.com Group, Inc.
Notes to Consolidated Financial Statements
December 31, 2012
1. The Company and Summary of Significant Accounting Policies – (continued)
The Company records liabilities for uncertain tax positions related to federal, state and foreign income taxes in accordance with ASC 740. These liabilities reflect the Company’s best estimate of its ultimate income tax liability based on the tax code, regulations, and pronouncements of the jurisdictions in which we do business. Estimating our ultimate tax liability involves significant judgments regarding the application of complex tax regulations across many jurisdictions. If the Company’s actual results differ from estimated results, our effective tax rate and tax balances could be affected. As such, these estimates may require adjustment in the future as additional facts become known or as circumstances change. If applicable, the Company will adjust the income tax provision in the appropriate period.
Stock-Based Employee Compensation
The Company accounts for stock-based compensation to employees in accordance with ASC 718, Compensation — Stock Compensation. Accordingly, the fair value of all stock awards is recognized in compensation expense over the requisite service period for awards expected to vest.
Net Income (Loss) Per Common Share
The Company computes net income (loss) per common share in accordance with ASC 260, Earnings Per Share. Basic net income (loss) per common share includes no dilution and is computed by dividing net income (loss) to common stockholders by the weighted average number of common shares outstanding for the period. Diluted net income (loss) per common share includes the potential dilution that could occur if securities or other contracts to issue common stock were exercised or converted into common stock.
2. New Accounting Standards
In July 2012, the Financial Accounting Standards Board (“FASB”) issued an Accounting Standards Update (“ASU”) 2012-02Intangibles — Goodwill and Other (Topic 350): Testing Indefinite-Lived Intangible Assets for Impairment. The amendments permit an entity first to assess qualitative factors to determine whether it is more likely than not that an indefinite-lived intangible asset is impaired as a basis for determining whether it is necessary to perform the quantitative impairment test in accordance with Subtopic 350-30, Intangibles-Goodwill and Other-General Intangibles Other than Goodwill. An entity will have an option not to annually calculate the fair value of an indefinite-lived intangible asset if the entity determines that it is not more likely than not that the asset is impaired. ASU 2012-02 is effective for annual and interim impairment tests performed for fiscal years beginning after September 15, 2012 and early adoption is permitted. The Company early adopted ASU 2012-02 and continued to perform the quantitative impairment test which results had no impact to the consolidated financial position, results of operations or cash flows upon adoption.
In 2011, the FASB issued an ASU to theComprehensive Income Topic in the ASC aimed at increasing the prominence of items reported in other comprehensive income in the financial statements. This update requires companies to present components of net income and other comprehensive income and a total for comprehensive income in a single continuous statement below net income or in two separate but consecutive statements of net income and comprehensive income. Companies will no longer be allowed to present components of comprehensive income solely on the statement of changes in stockholders' equity. In both options, companies must present the components of net income, the components of other comprehensive income, total other comprehensive income and total comprehensive income. This update does not change which items are reported in other comprehensive income or the requirement to report reclassifications of items from other comprehensive income to net income. This requirement became effective for the Company beginning with the first quarter 2012 10-Q filing. The Company has elected to present comprehensive income in a single continuous statement. This update requires retrospective application for all periods presented.
64
TABLE OF CONTENTS
Web.com Group, Inc.
Notes to Consolidated Financial Statements
December 31, 2012
3. Net Loss Per Common Share
Basic net loss per common share is calculated using net income and the weighted-average number of shares outstanding during the reporting period. Diluted net income per common share includes the effect from the potential issuance of common stock, such as common stock issued pursuant to the exercise of stock options or warrants.
The following table sets forth the computation of basic and diluted net loss per common share for the years ended December 31, 2012, 2011 and 2010 (in thousands except per share amounts):
| | | | | | |
| | 2012 | | 2011 | | 2010 |
| Loss from continuing operations | | $ | (122,217 | ) | | $ | (12,509 | ) | | $ | (6,648 | ) |
| Income from discontinued operations | | | — | | | | 200 | | | | 116 | |
| Net loss | | $ | (122,217 | ) | | $ | (12,309 | ) | | $ | (6,532 | ) |
Weighted-average outstanding shares of
common stock | | | 46,892 | | | | 30,675 | | | | 25,515 | |
| Dilutive effect of stock options and restricted stock | | | — | | | | — | | | | — | |
| Dilutive effect of warrants | | | — | | | | — | | | | — | |
| Common stock and common stock equivalents | | | 46,892 | | | | 30,675 | | | | 25,515 | |
Basic loss per share:
| | | | | | | | | | | | |
| Loss from continuing operations | | $ | (2.61 | ) | | $ | (0.41 | ) | | $ | (0.26 | ) |
| Income from discontinued operations | | | — | | | | 0.01 | | | | — | |
| Net loss | | $ | (2.61 | ) | | $ | (0.40 | ) | | $ | (0.26 | ) |
Diluted loss per share:
| | | | | | | | | | | | |
| Loss from continuing operations | | $ | (2.61 | ) | | $ | (0.41 | ) | | $ | (0.26 | ) |
| Income from discontinued operations | | | — | | | | 0.01 | | | | — | |
| Net loss | | $ | (2.61 | ) | | $ | (0.40 | ) | | $ | (0.26 | ) |
On October 27, 2011 the Company issued 18 million shares of common stock and paid $405.1 million in cash to complete the acquisition of Network Solutions. In conjunction with ASC 260,Earnings Per Share, these shares were included between October 27, 2011 and December 31, 2011 in the calculation of basic and diluted shares outstanding.
During the years ended December 31, 2012, 2011 and 2010, 8.3 million, 7.1 million, and 7.0 million of stock options and restricted share awards, respectively, have been excluded from the calculation of diluted common shares because including those securities would have been antidilutive.
4. Sale of Equity Method Investment
On May 31, 2012, the Company sold its interest in an equity method investment named OrangeSoda, Inc., a Nevada corporation in the business of developing, marketing, selling and providing search engine marketing and optimization services for small businesses. The Company acquired its 25.3 percent interest in OrangeSoda, Inc. as part of the Network Solutions acquisition on October 27, 2011. In June 2012, the Company received proceeds of $7.2 million from the buyer and recorded a gain of $5.2 million. Approximately $0.4 million of additional proceeds from the sale is held in escrow until the standard representations and warranties have been satisfied. The Company will record these proceeds, if received, as additional gain from the sale of the equity method investment.
The Company’s equity in earnings from OrangeSoda, Inc. during years ended December 31, 2012 and 2011 have been presented in the general and administrative line item in the consolidated statement of comprehensive loss. These earnings were considered deminimus for separate line item disclosure.
65
TABLE OF CONTENTS
Web.com Group, Inc.
Notes to Consolidated Financial Statements
December 31, 2012
5. Valuation Accounts
The Company’s accounts receivable allowance is summarized as follows (in thousands):
| | | | | | | | |
| | Beginning of Year Balance | | Provision | | Charge-off | | End of Year Balance |
| 2010 | | $ | 428 | | | $ | 1,596 | | | $ | (1,501 | ) | | $ | 523 | |
| 2011 | | $ | 523 | | | $ | 3,812 | | | $ | (2,775 | ) | | $ | 1,560 | |
| 2012 | | $ | 1,560 | | | $ | 7,875 | | | $ | (7,098 | ) | | $ | 2,337 | |
6. Property and Equipment
The Company’s property and equipment are summarized as follows (in thousands):
| | | | |
| | December 31, |
| | | 2012 | | 2011 |
| Land | | $ | 416 | | | $ | 416 | |
Depreciable assets:
| | | | | | | | |
| Software | | | 14,625 | | | | 7,662 | |
| Computer equipment | | | 34,083 | | | | 22,812 | |
| Other equipment | | | 6,331 | | | | 1,655 | |
| Furniture and fixtures | | | 4,640 | | | | 4,394 | |
| Building and improvements | | | 2,300 | | | | 2,299 | |
| Leasehold improvements | | | 2,392 | | | | 2,604 | |
| Total depreciable assets | | | 64,371 | | | | 41,426 | |
| Accumulated depreciation | | | (24,708 | ) | | | (16,146 | ) |
| Property and equipment, net | | $ | 40,079 | | | $ | 25,696 | |
Depreciation expense relating to depreciable assets amounted to $8.6 million, $4.1 million, and $2.8 million for the years ended December 31, 2012, 2011 and 2010, respectively.
As of December 31, 2012 and 2011, the Company had unamortized computer software costs of $8.0 million and $4.4 million, respectively. For the years ended December 31, 2012, 2011 and 2010, respectively, approximately $3.4 million, $0.7 million and $0.3 million of depreciation expense related to computer software was recorded.
7. Business Combinations
The Company has accounted for the acquisitions of Networks Solutions and Register.com LP using the acquisition method as required in ASC 805,Business Combinations. As such, fair values have been assigned to the assets and liabilities acquired and the excess of the total purchase price over the fair value of the net assets acquired is recorded as goodwill. The Company, with the assistance of independent valuation professionals, has estimated fair value of certain intangible assets. The goodwill from both of these acquisitions represents business benefits the Company anticipates realizing from optimizing resources and cross-sale opportunities. The goodwill from these acquisitions is not expected to be deductible for tax purposes.
Acquisition of Network Solutions
On October 27, 2011, the Company completed its acquisition (the “Acquisition”) of 100% of the equity interests in Net Sol Parent LLC (formerly known as GA-Net Sol Parent LLC) (“Network Solutions”), a provider of global domain names, web hosting and online marketing services, pursuant to the Purchase Agreement (the “Purchase Agreement”) dated August 3, 2011 by and among Web.com Group, Inc., a Delaware corporation, Net Sol Holdings LLC, a Delaware limited liability company, and GA-Net Sol Parent
66
TABLE OF CONTENTS
Web.com Group, Inc.
Notes to Consolidated Financial Statements
December 31, 2012
7. Business Combinations – (continued)
LLC, a Delaware limited liability company and wholly-owned subsidiary of Net Sol Holdings LLC (collectively, the “Sellers”). The purchase price paid to the Sellers was $569.0 million consisting of $405.1 million in cash and the issuance of 18 million shares of Web.com common stock valued at $9.16 per share. In connection with the Acquisition, the Company assumed the obligation to pay approximately $211.7 million of outstanding debt of Network Solutions and paid off such liabilities at closing with borrowings from the Company’s new credit facilities, and assumed certain other liabilities. In connection with the acquisition, the Company incurred approximately $11.6 million of acquisition related transaction costs during the year ended December 31, 2011. These expenses were recorded in the General and Administrative line item in the Consolidated Statement of Comprehensive Loss.
Goodwill decreased by approximately $3.2 million during the year ended December 31, 2012 primarily due to finalizing the Network Solutions’ income tax returns. The following table summarizes the Company’s final purchase price allocation based on the fair values of the assets acquired and liabilities assumed on October 27, 2011 (in thousands):
| | |
| Tangible current assets | | $ | 14,910 | |
| Property and equipment | | | 17,506 | |
| Other non-current assets | | | 6,068 | |
| Deferred expenses, current and non-current | | | 99,670 | |
| Developed technology | | | 129,640 | |
| Customer relationships | | | 230,140 | |
| Domain/trade names | | | 98,230 | |
| Non-compete agreements | | | 600 | |
| Goodwill | | | 504,991 | |
| Current liabilities | | | (26,528 | ) |
| Long-term debt | | | (211,672 | ) |
| Deferred revenue, current and non-current | | | (184,391 | ) |
| Deferred tax liability | | | (110,138 | ) |
| Net assets acquired | | $ | 569,026 | |
The customer relationships and developed technology intangible assets are being amortized over a weighted average period of 144 months and 47 months, respectively. The non-compete agreements were amortized over 12 months and are fully amortized as of December 31, 2012. The domain/trade names have indefinite lives and are not amortized.
The operations of Network Solutions have been incorporated with the existing Web.com Group Inc. operations subsequent to the transaction closing. As such, the determination of revenue, operating income and net income is not readily available nor would it be indicative of the standalone entity if presented.
The fair value and gross contractual amount of acquired accounts receivable was $5.3 million.
Pro Forma Condensed Consolidated Results of Operations
The Company has prepared unaudited condensed pro forma financial information to reflect the consolidated results of operations of the combined entities as though the Network Solutions acquisition had occurred on January 1, 2010 for the years ended December 31, 2011 and 2010. The Company has made adjustments to the historical Web.com and Network Solutions financial statements that are directly attributable to the acquisition, factually supportable and expected to have a continuing impact on the combined results. This pro forma presentation does not include any impact of transaction costs or expected synergies. The pro forma results are not necessarily indicative of our results of operations had the Company owned Network Solutions for the entire periods presented.
67
TABLE OF CONTENTS
Web.com Group, Inc.
Notes to Consolidated Financial Statements
December 31, 2012
7. Business Combinations – (continued)
The Company has adjusted the results of operations to reflect the impact of amortizing into revenue, deferred revenue that was recorded at fair value. The fair value of the acquired deferred revenue was approximately 51 percent less than the pre-acquisition historical basis of Network Solutions. In addition, interest expense and amortization of intangible assets were adjusted to reflect the cost of the October 27, 2011 debt issued to finance the acquisition and the fair value of the intangible assets on the acquisition date, respectively. Finally, non-recurring acquisition related transaction and compensation costs were excluded. Basic weighted-average common shares have been calculated as though the issuance of 18 million shares had occurred on January 1, 2010.
The following summarizes unaudited pro forma total revenue and net loss (in thousands, except per share amounts):
| | | | |
| | Twelve months
ended
December 31, 2011 | | Twelve months
ended
December 31, 2010 |
| Revenue | | $ | 401,401 | | | $ | 297,978 | |
| Net loss | | $ | (128,200 | ) | | $ | (170,032 | ) |
Basic loss per share:
| | | | | | | | |
| Net loss per share | | $ | (2.82 | ) | | $ | (3.91 | ) |
Diluted loss per share:
| | | | | | | | |
| Net loss per share | | $ | (2.82 | ) | | $ | (3.91 | ) |
| Basic weighted-average common shares outstanding | | | 45,470 | | | | 43,515 | |
| Diluted weighted-average common shares outstanding | | | 45,470 | | | | 43,515 | |
Acquisition of Register.com LP
On July 30, 2010, the Company completed its acquisition of the partnership interests in Register.com LP, a provider of global domain name registration and complementary website design and management services. The Company believes that the acquisition further enhances the Company’s position as a leading provider of online marketing and web services to small businesses. In addition to bringing approximately 787,000 subscribers, which subscribers present substantial cross- and up-sell opportunities, Register.com LP brings highly complementary products, sales channels and operating capabilities. Consideration for the interests in Register.com LP was approximately $135.1 million financed with a $95 million term loan, a $15 million revolving credit facility, approximately $20 million in cash and a $5 million seller note. In connection with the acquisition, the Company incurred approximately $2.9 million of acquisition costs during the year ended December 31, 2010 and recorded the expenses in the General and administrative expense line in the Consolidated Statement of Comprehensive Loss. These costs primarily include investment banking, legal and other professional services.
68
TABLE OF CONTENTS
Web.com Group, Inc.
Notes to Consolidated Financial Statements
December 31, 2012
7. Business Combinations – (continued)
The following table summarizes the Company’s purchase price allocation based on the fair values of the assets acquired and liabilities assumed on July 29, 2010 (in thousands):
| | |
| Tangible current assets | | $ | 13,401 | |
| Tangible non-current assets | | | 1,808 | |
| Deferred expenses | | | 26,799 | |
| Developed technology | | | 28,720 | |
| Customer relationships | | | 20,570 | |
| Domain/trade names | | | 15,890 | |
| Goodwill | | | 110,305 | |
| Current liabilities | | | (14,892 | ) |
| Deferred revenue | | | (44,243 | ) |
| Deferred tax liability | | | (22,198 | ) |
| Non-current liabilities | | | (1,018 | ) |
| Net assets acquired | | $ | 135,142 | |
The developed technology and the customer relationships intangible assets will be amortized over a weighted-average period of 96 months and 116 months, respectively. The domain/trade names have indefinite lives and are not amortized.
The fair value of accounts receivables acquired is $3.9 million, with the gross contractual amount being $4.0 million.
Register.com LP contributed approximately $22.3 million in revenue during July 30, 2010 through December 31, 2010. Register.com LP has been incorporated with the existing Web.com Group Inc. operations subsequent to the transaction closing. As such, the determination of operating income and net income of Register.com LP is not readily available nor would it be indicative of the standalone entity if presented.
Pro Forma Condensed Consolidated Results of Operations
The Company has prepared unaudited condensed pro forma financial information to reflect the consolidated results of operations of the combined entities as though the acquisition had occurred at the beginning of each year presented. The Company has made adjustments to the historical Web.com Group, Inc. and Register.com, LP financial statements that are directly attributable to the acquisition, factually supportable and expected to have a continuing impact on the combined results. This pro forma presentation does not include any impact of transaction costs or expected synergies. The pro forma results are not necessarily indicative of our results of operations had the Company owned Register.com LP for the entire period presented.
The Company has adjusted the results of operations to reflect the impact of amortizing into revenue, deferred revenue that was recorded at fair value. The fair value of the acquired deferred revenue was approximately 50 percent less than the pre-acquisition historical basis of Register.com LP. In addition, interest expense and amortization of intangible assets were adjusted to reflect the cost of the July 29, 2010 debt issued to finance the acquisition and the fair value of the intangible assets on the acquisition date, respectively. Finally, non-recurring acquisition related transaction and compensation costs were excluded.
69
TABLE OF CONTENTS
Web.com Group, Inc.
Notes to Consolidated Financial Statements
December 31, 2012
7. Business Combinations – (continued)
The following summarizes unaudited pro forma total revenue, operating loss and net loss for the year ended December 31, 2010:
| | |
| | 2010 |
| Revenue | | $ | 157,722 | |
| Net loss | | $ | (24,443 | ) |
Basic earnings per share:
| | | | |
| Net loss per share | | $ | (0.96 | ) |
Diluted earnings per share:
| | | | |
| Net loss per share | | $ | (0.96 | ) |
| Basic weighted-average common shares outstanding | | | 25,515 | |
| Diluted weighted-average common shares outstanding | | | 25,515 | |
8. Restructuring Costs
In 2012, the Company exited the sales and customer support call center located in Belleville, Illinois. A $0.2 million reserve for the future minimum lease payments was recorded as restructuring expense during the year ended December 31, 2012. In addition, the net book value of the furniture and leasehold improvements was written off, resulting in a loss of $0.4 million which was also recorded during the year ended December 31, 2012 in the general and administrative line item in the consolidated statement of comprehensive loss.
The Company early terminated its contract for telesales and marketing services with Red Ventures LLC in 2012 and incurred a $1.5 million charge to exit the agreement. General Atlantic LLC is one of the Company’s greater than 5 percent shareholders and also has a 25 percent ownership interest in Red Ventures, see Note 17,Related Party Transactions, for additional information on the total expenses between the Company and Red Ventures. The Company recorded the $1.5 million as restructuring charges in the Consolidated Statement of Comprehensive Loss during the year ended December 31, 2012. The Company may continue to incur minimal charges for transitional call center services to be received by Red Ventures through the first quarter of 2013 and will expense such costs as incurred.
The Company continued to incur restructuring charges for future service required by certain Network Solutions employees up to their scheduled termination dates throughout 2012 as well as for relocating employees. Additional severance and relocation expense of $0.8 million was recorded during the year ended December 31, 2012.
During 2011, the Company incurred approximately $9.5 million in restructuring costs primarily related to the Network Solutions acquisition. Approximately $5.0 million of severance expense was recorded from terminating employees. In addition, the Company recorded $4.2 million of restructuring expense from exiting approximately 54 percent of Network Solutions headquarters office lease located in Herndon, Virginia. The cease use date was December 31, 2011. The reserve that has been established includes the present value of the future minimum lease payments related to the exited area offset by estimated sublease payments based on market values of comparable spaces in the region. The Company recorded another $0.3 million of severance related liabilties that were included in the purchase price allocation.
The Company incurred approximately $0.3 million and $4.0 million in restructuring costs during the year ended December 31, 2011 and 2010, respectively, primarily related to the Register.com LP acquisition. The majority of the costs are for relocating and terminating former Register.com LP employees. Approximately $1.8 million of the total restructuring cost represented existing Register.com LP severance related liabilities that were included in the purchase price allocation as required by ASC 805. The remaining $2.2 million was
70
TABLE OF CONTENTS
Web.com Group, Inc.
Notes to Consolidated Financial Statements
December 31, 2012
8. Restructuring Costs – (continued)
recorded as a period expense in restructuring charges in the Consolidated Statement of Comprehensive Loss for the year ended December 31, 2010.
The tables below summarize the activity of accrued restructuring costs and other reserves during the years ended December 31, 2012 and 2011 (in thousands):
| | | | | | | | | | |
| | Balance as of December 31, 2011 | | Additions | | Cash Payments | | Change in Estimates/Other | | Balance as of December 31, 2012 |
| Contract termination costs | | $ | 3,341 | | | $ | 1,672 | | | $ | (2,663 | ) | | $ | 119 | | | $ | 2,469 | |
| Employee termination benefits and other restructuring costs | | | 4,308 | | | | 797 | | | | (4,833 | ) | | | — | | | | 272 | |
| Non-current portion | | | (1,962 | ) | | | | | | | | | | | | | | | (1,264 | ) |
| Current portion | | $ | 5,687 | | | $ | 2,469 | | | $ | (7,496 | ) | | $ | 119 | | | $ | 1,477 | |
| | | | | | | | | | |
| | Balance as of December 31, 2010 | | Additions | | Cash Payments | | Change in Estimates/Other | | Balance as of December 31, 2011 |
| Contract termination costs | | $ | 449 | | | $ | 3,339 | | | $ | (778 | ) | | $ | 331 | | | $ | 3,341 | |
| Employee termination benefits and other restructuring costs | | | 1,876 | | | | 5,292 | | | | (2,860 | ) | | | — | | | | 4,308 | |
| Non-current portion | | | | | | | | | | | | | | | | | | | (1,962 | ) |
| Current portion | | $ | 2,325 | | | $ | 8,631 | | | $ | (3,638 | ) | | $ | 331 | | | $ | 5,687 | |
9. Goodwill and Intangible Assets
The Company’s intangible assets are summarized as follows (in thousands):
| | | | | | |
| | December 31, | | Weighted-average Amortization period |
| | | 2012 | | 2011 |
Indefinite-lived intangible assets:
| | | | | | | | | | | | |
| Domain/Trade names | | $ | 128,075 | | | $ | 128,000 | | | | | |
Definite-lived intangible assets:
| | | | | | | | | | | | |
| Customer relationships | | | 285,135 | | | | 285,135 | | | | 124 months | |
| Developed technology | | | 187,563 | | | | 187,563 | | | | 40 months | |
| Non-compete agreements and other * | | | 4,108 | | | | 4,108 | | | | | |
| Accumulated amortization | | | (135,178 | ) | | | (64,827 | ) | | | | |
| *Fully amortized at December 31, 2012 | | $ | 469,703 | | | $ | 539,979 | | | | | |
71
TABLE OF CONTENTS
Web.com Group, Inc.
Notes to Consolidated Financial Statements
December 31, 2012
9. Goodwill and Intangible Assets – (continued)
The weighted-average amortization period for the amortizable intangible assets as of December 31, 2012 is approximately 8 years. Total amortization expense was $70.3 million, $25.4 million, and $12.9 million for the years ended December 31, 2012, 2011, and 2010, respectively. Non-compete agreements, customer relationships and developed technology have original useful lives between one and three years, one and 16 years, and three and eight years, respectively. The other intangible assets have useful lives of between two and three years. Expected amortization expense for the next five years and thereafter is as follows (in thousands):
| | |
| 2013 | | $ | 67,833 | |
| 2014 | | | 59,200 | |
| 2015 | | | 36,543 | |
| 2016 | | | 34,593 | |
| 2017 | | | 25,446 | |
| Thereafter | | | 118,013 | |
| Total | | $ | 341,628 | |
The following table summarizes changes in the Company’s goodwill balances as required by ASC 350-20 for the years ended (in thousands):
| | | | |
| | December 31, |
| | | 2012* | | 2011* |
| Goodwill balance at beginning of year | | $ | 733,656 | | | $ | 224,806 | |
| Accumulated impaired goodwill at beginning of year | | | (102,294 | ) | | | (102,294 | ) |
| Goodwill balance at beginning of year, net | | | 631,362 | | | | 122,512 | |
| Goodwill acquired during the year | | | — | | | | 508,176 | |
| Goodwill adjusted during the year(1) | | | (3,186 | ) | | | 674 | |
| Goodwill balance at end of year, net | | $ | 628,176 | | | $ | 631,362 | |
| * | Gross goodwill balances were $730,470 and $733,656 as of December 31, 2012 and 2011, respectively. This excludes accumulated impairment losses of $102,294 as of December 31, 2012 and 2011. |
| (1) | See Note 7, Business Combinations for information surrounding the changes to goodwill during the year ended December 31, 2012. |
In accordance with ASC 350, the Company reviews goodwill and other indefinite-lived intangible asset balances for indicators of impairment on an annual basis and between annual tests if an event occurs or circumstances change that would more likely than not reduce the fair value of goodwill below its carrying amount. As of December 31, 2012 and 2011, the Company completed its annual impairment test of goodwill and other indefinite-lived intangible assets and determined there were no indicators of impairment.
72
TABLE OF CONTENTS
Web.com Group, Inc.
Notes to Consolidated Financial Statements
December 31, 2012
10. Commitments
Operating Leases
The table below summarizes the Company’s principal operating leases as of December 31, 2012:
| | | | | | |
| | Location | | Square Feet
(Unaudited) | | Lease Expiration |
| Headquarters and principal administrative, finance, and marketing operations | | | Jacksonville, FL | | | | 112,306 | | | | July 2019 | |
| Technology administrative center | | | Herndon, VA | | | | 96,304 | | | | December 2020 | |
| Technology administrative center | | | Buenos Aires,
Argentina | | | | 10,000 | | | | December 2014 | |
| eCommerce operations center | | | Barrie, Ontario,
Canada | | | | 8,301 | | | | May 2015 | |
| Sales and customer support operations center | | | Hazleton, PA | | | | 39,429 | | | | January 2013* | |
| Sales and customer support operations center | | | Yarmouth, Nova Scotia,
Canada | | | | 30,400 | | | | February 2014 | |
| Sales and customer support operations center | | | Belleville, IL | | | | 19,428 | | | | May 2013 | |
| Sales and customer support operations center | | | Halifax, Nova Scotia,
Canada | | | | 13,500 | | | | April 2017 | |
| Sales operations center | | | Scottsdale, AZ | | | | 8,280 | | | | May 2013 | |
| eCommerce operations center | | | Shavertown, PA | | | | 15,641 | | | | March 2013 | |
| Technology administrative center | | | Atlanta, GA | | | | 10,235 | | | | December 2015 | |
| Technology data center | | | Atlanta, GA | | | | 4,000 | | | | May 2021 | |
* In January 2013, the lease was renewed through January 2018.
Rental expense for the leased facilities and equipment amounted to approximately $6.4 million, $4.7 million and $4.1 million for the years ended December 31, 2012, 2011 and 2010, respectively. Accrued rent expense was $1.3 million and $1.2 million as of December 31, 2012 and 2011, respectively.
As of December 31, 2012, future minimum rental payments required under operating leases that have initial or remaining non-cancelable terms in excess of one year, including the leases described above, are as follows (in thousands):
| | |
| | Net Minimum Rental Payments |
| 2013 | | $ | 6,728 | |
| 2014 | | | 6,541 | |
| 2015 | | | 6,420 | |
| 2016 | | | 6,342 | |
| 2017 | | | 6,452 | |
| Thereafter | | | 19,594 | |
| | | $ | 52,077 | |
73
TABLE OF CONTENTS
Web.com Group, Inc.
Notes to Consolidated Financial Statements
December 31, 2012
10. Commitments – (continued)
Purchase Obligations
Purchase obligations include corporate and marketing related sponsorships and long-term service contracts for data storage. As of December 31, 2012, the Company’s unconditional purchase obligations are as follows:
| | |
| | Payment Due |
| 2013 | | $ | 8,810 | |
| 2014 | | | 12,134 | |
| 2015 | | | 12,702 | |
| 2016 | | | 12,702 | |
| 2017 | | | 12,293 | |
| Thereafter | | | 53,000 | |
| | | $ | 111,641 | |
Standby Letters of Credit
The Company utilizes letters of credit to back certain payment obligations relating to its facility operating leases. The Company had approximately $3.3 million in standby letters of credit as of December 31, 2012, $2.0 million of which was drawn against the Company’s revolving credit facility.
11. Long-term debt
Financing Network Solutions Acquisition
On October 27, 2011, the Company entered into credit facilities, pursuant to (i) a First Lien Credit Agreement, dated as of October 27, 2011, by and among the Company, J. P. Morgan Securities LLC and Deutsche Bank Securities Inc., as Co-Syndication Agents; Goldman Sachs Lending Partners LLC and SunTrust Bank, as Co-Documentation Agents; and JPMorgan Chase Bank, N.A., as Administrative Agent, and the lenders from time to time party thereto (the “First Lien Credit Agreement”) and (ii) a Second Lien Credit Agreement, dated as of October 27, 2011, (the “Second Lien Credit Agreement”). The First Lien Credit Agreement originally provided for (i) a six-year $600 million first lien loan facility (the “First Lien Term Loan”) and (ii) a five-year revolving credit facility of $50 million (the “Revolving Credit Facility”). The Second Lien Credit Agreement originally provided for a seven-year $150 million second lien loan facility (the “Second Lien Term Loan”).
The Company is required to maintain certain covenant ratios under the First and Second Lien Agreements. In addition, such agreements contain customary covenants that limit (among other things) the incurrence of debt, the payment of dividends, the disposition of assets, and making of certain payments. Substantially all of the Company’s and certain of its subsidiaries’ tangible and intangible assets are pledged to secure its obligations under the credit agreements.
November 2012 Repricing/Extinguishments
In November 2012, the Company repriced its First Lien Term Loan and increased the outstanding balance of $569.5 million by $60 million to $629.5 million. In addition, the Company increased the maximum amount of available borrowings under the revolving credit facility from $50 million to $60 million. After giving effect to the repricing, the First Lien Term Loan had an interest rate of LIBOR plus 4.25%, with a 1.25% LIBOR floor, and the revolving credit facility’s interest rate is now 3.75% plus LIBOR. The proceeds received from the additional First Lien Term Loan as well as funds drawn from revolving credit facility and cash on hand were used to pay down the Second Lien Term Loan. During the year ended December 31, 2012, the Company paid down a total of $88.0 million of principal on the Second Lien Term Loan.
The repricing of the First Lien Term Loan and the repayment of $88 million of Second Lien Term Loan were both accounted for as debt extinguishments in accordance with ASC 470,Debt. As a result of the
74
TABLE OF CONTENTS
Web.com Group, Inc.
Notes to Consolidated Financial Statements
December 31, 2012
11. Long-term debt – (continued)
extinguishments, the Company recorded a $42.0 million loss from accelerating unamortized deferred financing fees and loan origination discounts during the year ended December 31, 2012 related to both instruments. Also included in the loss is $2.6 million of prepayment penalties from the Second Lien Term Loan that were paid during the fourth quarter of 2012.
Origination Issuance Discounts
As of December 31, 2012 and 2011, the Company had $8.1 million and $34.2 million of unamortized originating loan discounts, respectively. Approximately $26.0 million of the total outstanding as of December 31, 2011 related to the First Lien Term Loan, of which approximately $20.0 million was written off as Loss from Debt Extinguishment as a result of the repricing in November 2012. The remaining $6.2 million was recorded as amortization expense. The repriced First Lien Term Loan was issued at a 1% discount of $6.3 million which was recorded as a reduction of long-term debt and is being amortized over the remaining term using the effective interest method. The remaining $8.2 million of the outstanding loan origination discounts as of December 31, 2011 related to the Second Lien Term Loan, of which approximately $5.5 million was reflected as Loss from Debt Extinguishment. An additional $0.7 million was recorded to amortization expense.
As of December 31, 2012 and 2011, the current portion of unamortized loan origination costs were $1.6 million and $6.8 million, respectively. The non-current portion of loan origination costs were $6.5 million and $27.3 million at December 31, 2012 and 2011, respectively.
Debt Issuance Costs
As of December 31, 2012 and 2011, the Company had approximately $5.5 million and $19.7 million of unamortized debt issuance costs, respectively. These costs related to the 2011 debt issued to complete the Network Solutions acquisition and the repricing of such debt that took place in November 2012. Approximately $13.9 million of the original issuance costs were written off as Loss from Debt Extinguishment as a result of the refinance of the First Lien Term Loan and the repayment of $88 million of the Second Lien Term Loan. In addition, approximately $4.1 million was recorded as amortization expense. The Company also incurred $3.7 million of debt issuance costs from the November 2012 repricing and is amortizing these costs using the effective interest method.
As of December 31, 2012 and 2011, the current portion of debt issuance costs was $1.2 million and $4.0 million, respectively. The non-current portion at December 31, 2012 and 2011 was $4.3 million and $15.7 million, respectively.
Outstanding long-term debt and the interest rates in effect at December 31, 2012 consist of the following:
| | | | |
| | December 31, 2012 | | December 31, 2011 |
| Revolving Credit Facility maturing 2016, 3.96% at December 31, 2012, based on LIBOR plus 3.75% | | $ | 41,000 | | | $ | 33,000 | |
| First Lien Term due 2017, 5.50%, based on 1.25% LIBOR floor plus 4.25%, less unamortized discount of $6,142 at December 31, 2012, effective rate of 5.94%. | | | 621,784 | | | | 574,026 | |
| Second Lien Term due 2018, 11.00%, based on 1.50% LIBOR floor plus 9.5%, less unamortized discount of $1,989 at December 31, 2012, effective rate of 13.29%. | | | 30,011 | | | | 111,778 | |
| Capital Lease Obligations | | | 26 | | | | 81 | |
| Total Long-Term Debt | | | 692,821 | | | | 718,885 | |
| Less: Current Portion of Long-Term Debt | | | (4,681 | ) | | | (4,182 | ) |
| Long-Term Portion | | $ | 688,140 | | | $ | 714,703 | |
75
TABLE OF CONTENTS
Web.com Group, Inc.
Notes to Consolidated Financial Statements
December 31, 2012
11. Long-term debt – (continued)
The First Lien Term Loan requires mandatory repayments that are based on the annual “excess cash flow” (as defined in the credit agreement) generated by the Company during each fiscal year. Excess cash flow payments are required to be made during the quarter following the fiscal year ended.
The Company has forecasted the excess cash flows that it expects to generate during the year ended December 31, 2013 that would be payable during the first quarter of 2014 and reflected this forecast in the table below. Subsequent to 2013’s excess cash flow calculation, only the scheduled principal payment requirements, excluding the excess cash flow payments, are presented due to the significant uncertain that would be present in making the estimates required in determining such amounts. As of December 31, 2012, total estimated principal payments due for the next five years and thereafter are as follows:
| | |
| 2013 | | $ | 6,295 | |
| 2014 | | | 54,739 | |
| 2015 | | | 6,295 | |
| 2016 | | | 47,295 | |
| 2017 | | | 554,302 | |
| Thereafter | | | 32,000 | |
| Total long-term portion | | $ | 700,926 | |
| Less current portion | | | (6,295 | ) |
| Long-term principal payments | | $ | 694,631 | |
In addition, in March 2013, the Company further repriced its First Lien Term Loan, added additional term loans, repriced and increased the maximum amount of available borrowings under its revolving credit facility and fully repaid its Second Lien Term Loan. See Note 19,Subsequent Events, for additional information.
12. Fair Value Measurements
The Company defines fair value as the price that would be received from selling an asset or paid to transfer a liability in an orderly transaction between market participants at the measurement date. The Company applies the following fair value hierarchy, which prioritizes the inputs used to measure fair value into three levels as follows:
Level 1 — Quoted prices in active markets for identical assets or liabilities.
Level 2 — Observable inputs other than quoted prices in active markets for identical assets and liabilities, quoted prices for identical or similar assets or liabilities in inactive markets, or other inputs that are observable or can be corroborated by observable market data for substantially the full term of the assets or liabilities.
Level 3 — Inputs that are generally unobservable and typically reflect management’s estimates of assumptions that market participants would use in pricing the asset or liability.
The Company has financial assets and liabilities that are not required to be remeasured to fair value on a recurring basis. The Company’s cash and cash equivalents carrying value approximates fair market value as of December 31, 2012 and December 31, 2011 due to the short maturity of these items. As of December 31, 2012 and 2011, the combined fair value of the Company’s First Lien and Second Lien Term Loans was $657.2 million and $658.2 million, respectively, based on a Level 2 fair value hierarchy calculation obtained from quoted market prices of the Company’s long-term debt instruments that may not be actively traded at each respective period end. The revolving credit facility is a variable rate debt instrument indexed to LIBOR that resets monthly and the fair value approximates the carrying value as of December 31, 2012 and December 31, 2011.
76
TABLE OF CONTENTS
Web.com Group, Inc.
Notes to Consolidated Financial Statements
December 31, 2012
13. Stock-Based Compensation
The Company records compensation expense for employee and director stock-based compensation plans based upon the fair value of the award in accordance with ASC 718,Compensation-Stock Compensation.
Equity Incentive Plans
At December 31, 2012, the Company had multiple stock-based compensation plans that issue common stock options and restricted shares to employees. In addition, the Company’s plans provide for grants of non-statutory stock options and restricted shares awards (“RSA’s”) to non-employee directors. The Company issues new shares of common stock upon the exercise of stock options and the granting of restricted shares. At December 31, 2012, approximately 3.3 million shares remain available for future issuance under these plans.
In addition, the Company has additional equity incentive plans that are established in conjunction with its acquisitions. These plans are considered one-time, inducement awards of incentive stock options, non-statutory stock options and restricted shares. Once the inducement awards are granted, no additional shares, including forfeitures and cancellations, are available for future grant under these plans.
Incentive stock options and non-statutory stock options issued generally vest ratably over three to four years, are contingent upon continued employment and expire ten years from the grant date. Restricted share awards generally vest 25 percent each year over a four year period.
The Board of Directors or a committee thereof, administers all of the equity incentive plans and establishes the terms of options granted, including the exercise price, the number of shares subject to individual option awards and the vesting period of options, within the limits set forth in the plans. Options have a maximum term of 10 years and vest as determined by the Board of Directors.
Stock Options
Compensation expense from stock options was $7.6 million, $4.0 million, and $3.0 million for the years ended December 31, 2012, 2011, and 2010, respectively. As of December 31, 2012, the Company had $15.1 million of unrecognized compensation costs related to stock options, which is expected to be recognized over a weighted average period of 2.5 years. During each of the years ended December 31, 2012 and 2011, 1.7 million common shares were issued from stock options exercised.
The total intrinsic value of options exercised during the years ended December 31, 2012, 2011, and 2010 was$18.0 million, $11.5 million, and $2.1 million, respectively.The fair value of shares vested during the years ended December 31, 2012, 2011, and 2010 was $7.0 million, $3.8 million, and $3.4 million, respectively.The weighted-average grant-date fair value of options granted during the years ended December 31, 2012, 2011, and 2010 was $7.81, $5.69, and $2.88, respectively. In the year ended December 31, 2012, approximately 265 thousand common shares totaling $3.6 million were forfeited in lieu of option strike price and income taxes.
The fair value of each option award is estimated on the date of the grant using the Black-Scholes option valuation model and the assumptions noted in the following table. Expected volatility rates are based on the Company’s historical volatility, since the Company’s initial public offering, on the date of the grant. The expected term of options granted represents the period of time that they are expected to be outstanding. The risk-free rate for periods within the contractual life of the option is based on the U.S. Treasury yield curve in effect at the time of the grant. Below are the assumption ranges used in calculating the fair value of options granted during the following periods:
| | | | | | |
| | Year Ended December 31, |
| | | 2012 | | 2011 | | 2010 |
| Risk-free interest rate | | | 0.76 – 0.82 | % | | | 0.88 – 2.10 | % | | | 1.04 – 2.75 | % |
| Dividend yield | | | 0 | % | | | 0 | % | | | 0 | % |
| Expected life (in years) | | | 5 | | | | 5 | | | | 5 | |
| Volatility | | | 70 – 71 | % | | | 61 – 70 | % | | | 59 – 61 | % |
77
TABLE OF CONTENTS
Web.com Group, Inc.
Notes to Consolidated Financial Statements
December 31, 2012
13. Stock-Based Compensation – (continued)
The following table summarizes option activity for all of the Company’s stock options:
| | | | | | | | | | |
| | Shares Covered by Options | | Exercise Price
per Share | | Weighted- Average Exercise Price | | Weighted- Average Remaining Contractual Term (in years) | | Aggregate Intrinsic Value (in thousands) |
| Balance, December 31, 2011 | | | 7,117,787 | | | | $ 0.50 to 40.15 | | | $ | 7.35 | | | | | | | | | |
| Granted | | | 1,894,350 | | | | $13.16 to 17.81 | | | $ | 13.59 | | | | | | | | | |
| Exercised | | | (1,715,502 | ) | | | $ 0.50 to 16.00 | | | $ | 4.05 | | | | | | | | | |
| Forfeited | | | (461,945 | ) | | | $ 3.43 to 17.81 | | | $ | 11.10 | | | | | | | | | |
| Expired | | | (22,111 | ) | | | $ 3.43 to 40.15 | | | $ | 17.37 | | | | | | | | | |
| Balance, December 31, 2012 | | | 6,812,579 | | | | $ 2.00 to 17.81 | | | $ | 9.63 | | | | 6.75 | | | $ | 35,529 | |
| Exercisable at December 31, 2012 | | | 3,836,677 | | | | $ 2.00 to 17.81 | | | $ | 8.55 | | | | 5.34 | | | $ | 24,080 | |
Price ranges of outstanding and exercisable options as of December 31, 2012 are summarized below:
| | | | | | | | | | |
| | Outstanding Options | | Exercisable Options |
| Exercise Price | | Number of Options | | Weighted- Average Remaining Life (Years) | | Weighted- Average Exercise Price | | Number of Options | | Weighted- Average Exercise Price |
| $2.00 – $6.21 | | | 1,431,362 | | | | 6.30 | | | $ | 4.84 | | | | 998,807 | | | $ | 4.65 | |
| $6.27 – $9.00 | | | 1,876,911 | | | | 4.16 | | | $ | 8.74 | | | | 1,782,244 | | | $ | 8.80 | |
| $9.01 – $10.95 | | | 1,574,674 | | | | 7.95 | | | $ | 10.38 | | | | 450,847 | | | $ | 10.05 | |
| $10.98 – $13.24 | | | 318,697 | | | | 6.33 | | | $ | 12.19 | | | | 226,029 | | | $ | 11.79 | |
| $13.29 – $17.81 | | | 1,610,935 | | | | 9.07 | | | $ | 13.67 | | | | 378,750 | | | $ | 13.88 | |
| | | | 6,812,579 | | | | | | | | | | | | 3,836,677 | | | | | |
Restricted Stock
Restricted stock is not transferable until vested and the restrictions lapse upon the completion of a certain time period. The fair value of each restricted stock grant is based on the closing price of the Company’s stock on the date of grant and is amortized to compensation expense over its vesting period, which generally ranges between one and four years.
Compensation expense for the years ended December 31, 2012, 2011 and 2010 was approximately $4.3 million, $2.9 million, and $1.7 million, respectively. As of December 31, 2012, there was approximately $6.8 million of total unrecognized compensation cost related to the restricted stock outstanding, which is expected to be recognized over a weighted average period of 1.7 years. The intrinsic value and fair value of outstanding restricted stock as of December 31, 2012 is $22.5 million and $12.6 million, respectively. During the year ended December 31, 2012, approximately 149 thousand shares totaling $2.3 million were forfeited in lieu of income tax withholding requirements.
78
TABLE OF CONTENTS
Web.com Group, Inc.
Notes to Consolidated Financial Statements
December 31, 2012
13. Stock-Based Compensation – (continued)
The following restricted stock activity occurred under the Company’s equity incentive plans during the year ended December 31, 2012:
| | | | |
| Restricted Stock Activity | | Shares | | Weighted- Average Grant-Date Fair Value |
| Restricted stock outstanding at December 31, 2011 | | | 1,634,434 | | | $ | 5.98 | |
| Granted | | | 498,750 | | | $ | 13.40 | |
| Lapse of restriction | | | (613,433 | ) | | $ | 6.34 | |
| Restricted stock outstanding at December 31, 2012 | | | 1,519,751 | | | $ | 8.27 | |
14. Common Shares Reserved
The Company had reserved the following number of shares of common stock for future issuance:
| | | | | | |
| | December 31, |
| | | 2012 | | 2011 | | 2010 |
| Outstanding stock options | | | 6,812,579 | | | | 7,117,787 | | | | 6,995,021 | |
| Options available for future grants and other awards | | | 3,261,242 | | | | 4,641,074 | | | | 1,721,427 | |
| Total common shares reserved | | | 10,073,821 | | | | 11,758,861 | | | | 8,716,448 | |
15. Income Taxes
The provision (benefit) for income taxes from continuing operations consisted of the following for the years ended December 2012, 2011, and 2010:
| | | | | | |
| | 2012 | | 2011 | | 2010 |
Current (benefit) expense:
| | | | | | | | | | | | |
| Federal | | $ | 4 | | | $ | (325 | ) | | $ | 1,014 | |
| State | | | 134 | | | | (60 | ) | | | 238 | |
| Foreign | | | 953 | | | | 413 | | | | 340 | |
Deferred (benefit) expense:
| | | | | | | | | | | | |
| Federal | | | (13,500 | ) | | | (47,234 | ) | | | (13,136 | ) |
| State | | | (4,000 | ) | | | (3,140 | ) | | | 491 | |
| Foreign | | | (329 | ) | | | 262 | | | | 333 | |
| Total tax benefit | | $ | (16,738 | ) | | $ | (50,084 | ) | | $ | (10,720 | ) |
Gain on sale of discontinued operations included in the Consolidated Statements of Comprehensive Loss includes income tax expense of $0, $125 thousand, and $0, for 2012, 2011, and 2010, respectively.
As of December 31, 2012 and 2011, the Company had federal net operating loss carry forwards (“NOLs”) of approximately $331.2 million and $276.3 million, respectively, which expire in varying amounts beginning in 2020 through 2032. Included in the amount of NOLs as of December 31, 2012 and 2011 is $30.8 million and $18.1 million of stock-based compensation tax deductions in excess of book compensation expense (“APIC NOLs”), respectively, which will be credited to additional paid-in-capital when such deductions reduce taxes payable as determined on a “with-and-without” basis. Accordingly, these APIC NOLs will reduce federal taxes payable if realized in future periods, but NOLs related to such benefits are not included in the table below. The NOLs are subject to various limitations under Section 382 of the Internal Revenue Code. Accordingly, the Company estimates that at least $246.8 million and $204.6 million of the NOLs at December 31, 2012 and 2011, respectively, will be available during the carry forward period. The deferred tax
79
TABLE OF CONTENTS
Web.com Group, Inc.
Notes to Consolidated Financial Statements
December 31, 2012
15. Income Taxes – (continued)
asset related to the net federal NOL carry forward values of $246.8 million and $204.6 million related to December 31, 2012 and 2011, respectively, is included in the table below.
As of December 31, 2012, the Company had state NOLs of approximately $336.6 million, the substantial portion of which expires in varying amounts beginning in 2020 through 2032. As of December 31, 2011, the Company had state NOLs of approximately $247.4 million.
As of December 31, 2012 and 2011, the Company had a Foreign Tax Credit (“FTC”) carry forward of approximately $1.3 million. The FTCs are related to taxes paid in Canada and begin to expire in 2018. As of December 31, 2012 and 2011, the Company had a Research & Development (“R&D”) Tax Credit carry forward of approximately $0.5 million and $0.4 million, respectively. The R&D credits begin to expire in 2028. As of December 31, 2012 and 2011, the Company had an Alternative Minimum Tax (“AMT”) Credit carry forward of approximately $1.6 million which do not expire.
In establishing its deferred income tax assets and liabilities, the Company makes judgments and interpretations based on the enacted tax laws and published tax guidance that are applicable to its operations. Deferred tax assets and liabilities are measured and recorded using currently enacted tax rates, which the Company expects will apply to taxable income in the years in which those temporary differences are recovered or settled.
Deferred income taxes reflect the net tax effects of temporary differences between the carrying amounts of assets and liabilities for financial reporting purposes and the amounts used for income tax purposes. Significant components of the Company’s deferred tax assets and liabilities are as follows at December 31 (in thousands):
| | | | |
| | 2012 | | 2011 |
Deferred tax assets:
| | | | | | | | |
Current:
| | | | | | | | |
| NOLs | | $ | 12,774 | | | $ | 13,856 | |
| Deferred revenue | | | 40,886 | | | | 42,862 | |
| Compensation accruals | | | 4,084 | | | | 4,624 | |
| Other current deferred tax assets | | | 2,545 | | | | 3,639 | |
| | | | 60,289 | | | | 64,981 | |
| Less: valuation allowance | | | (14,968 | ) | | | (4,995 | ) |
| Net current deferred tax assets | | | 45,321 | | | | 59,986 | |
Noncurrent:
| | | | | | | | |
| Intangible basis | | | 8,349 | | | | 9,124 | |
| Deferred revenue | | | 48,230 | | | | 45,753 | |
| NOLs | | | 85,338 | | | | 65,681 | |
| Other deferred tax assets | | | 11,752 | | | | 12,253 | |
| | | | 153,669 | | | | 132,811 | |
| Less: valuation allowance | | | (38,874 | ) | | | (10,441 | ) |
| Net noncurrent deferred tax assets | | | 114,795 | | | | 122,370 | |
Deferred tax liabilities:
| | | | | | | | |
Current:
| | | | | | | | |
| Prepaid registry fees | | | 2,096 | | | | 2,554 | |
| Deferred revenue | | | 15,830 | | | | 32,348 | |
| Deferred expenses | | | 5,108 | | | | 3,535 | |
80
TABLE OF CONTENTS
Web.com Group, Inc.
Notes to Consolidated Financial Statements
December 31, 2012
15. Income Taxes – (continued)
| | | | |
| | 2012 | | 2011 |
| Unremitted foreign earnings | | | 1,647 | | | | 1,341 | |
| Other liabilities | | | 2,548 | | | | 1,645 | |
| Total current deferred tax liabilities | | | 27,229 | | | | 41,423 | |
Noncurrent:
| | | | | | | | |
| Intangible basis | | | 149,964 | | | | 159,683 | |
| Deferred revenue | | | 23,001 | | | | 40,414 | |
| Other liabilities | | | 5,956 | | | | 7,105 | |
| Total noncurrent deferred tax liabilities | | | 178,921 | | | | 207,202 | |
| Net current deferred tax asset | | | 18,092 | | | | 18,563 | |
| Net noncurrent deferred tax liability | | | (64,126 | ) | | | (84,832 | ) |
| Net deferred tax liability | | $ | (46,034 | ) | | $ | (66,269 | ) |
The valuation allowance increased by $38.4 million and decreased by $26.4 million, during the year ended December 31, 2012 and 2011, respectively. The change in valuation allowance in 2012 of $38.4 million includes $3.1 million associated with the deferred tax effect of the final purchase accounting adjustments from the Network Solutions acquisition. The Company’s net DTL of $46.0 million at December 31, 2012, consists of non-reversing DTLs and net foreign DTLs.
The change in valuation allowance in 2011 of $26.4 million is comprised of a tax benefit of $28.4 million reduced by the $2 million valuation allowance recorded through purchase accounting related to the Network Solutions acquisition. The change in valuation allowance from 2010 to 2011 was primarily due to the release of the valuation allowance as a result of the Network Solutions acquisition. As a result of the acquisition, the Company determined that some of our existing DTAs will more likely than not be realized by the combined enterprise through the reversal of the DTLs. Under ASC 805-740, a change in an acquirer’s valuation allowance for a deferred tax asset that results from a change in the acquirer’s circumstances caused by a business combination should be accounted for as an event separate from the business combination. As a result, changes in an acquirer’s valuation allowances that stem from a business combination should be recognized as an element of the acquirer’s deferred income tax expense (benefit) in the reporting period that includes the business combination. Therefore, the Company released $32.7 million of the pre-acquisition valuation allowance in recognition of the Network Solutions net DTLs that are projected to be realized within the relevant reversal period.
The change in valuation allowance from 2009 to 2010 was primarily due to the release of the valuation allowance as a result of the acquisition of Register.com LP. The Company determined that some of the pre-existing DTAs will more likely than not be realized by the combined enterprise through the reversal of the DTLs. Therefore, the Company released $16.6 million of the pre-acquisition valuation allowance in recognition of the Register.com net DTLs that are projected to be realized within the relevant reversal period.
The valuation allowance at December 31, 2012 of $53.8 million relates to the portion of federal and state NOLs and certain capital loss and tax credit carry forwards that are not more likely than not to be realized based on the expected reversals of our DTLs within the applicable carry forward periods and existing Section 382 limitations.
81
TABLE OF CONTENTS
Web.com Group, Inc.
Notes to Consolidated Financial Statements
December 31, 2012
15. Income Taxes – (continued)
The provision (benefit) for income taxes from continuing operations differs from the amount computed by applying the statutory U.S. federal income tax rates as a result of the following:
| | | | | | |
| | 2012 | | 2011 | | 2010 |
| U.S. statutory rate | | | (34.0 | )% | | | (34.0 | )% | | | (34.0 | )% |
| State income taxes (net of federal tax benefit) | | | (5.3 | ) | | | (4.4 | ) | | | (5.0 | ) |
| Foreign rate differential | | | (0.4 | ) | | | (0.8 | ) | | | (4.4 | ) |
| Stock-based compensation | | | 0.6 | | | | 0.5 | | | | 4.4 | |
| Change in valuation allowance | | | 27.6 | | | | (45.4 | ) | | | (54.9 | ) |
| Prior year adjustments | | | 0.2 | | | | (6.8 | ) | | | (8.9 | ) |
| Transaction costs | | | — | | | | 3.7 | | | | — | |
| Change in tax rate | | | (1.5 | ) | | | 2.0 | | | | 20.4 | |
| Deemed Dividend under Subpart F | | | — | | | | 1.2 | | | | 7.0 | |
| Repatriating foreign earnings and profits | | | — | | | | — | | | | 8.3 | |
| Unremitted foreign earnings and profits | | | 0.2 | | | | 2.1 | | | | — | |
| FIN48 Reserve | | | — | | | | 0.1 | | | | 4.1 | |
| Other | | | 0.6 | | | | 1.8 | | | | 0.9 | |
| Income tax benefit | | | (12.0 | )% | | | (80.0 | )% | | | (62.1 | )% |
The Company applies ASC 740, Income Taxes, which clarifies the accounting for uncertainty in income tax positions recognized in financial statements. The Company is subject to audit by the IRS and various states generally for all years since inception. The Company is subject to audit by the Canada Revenue Agency generally for four years. The Company does not believe there will be any material changes in its unrecognized tax positions over the next 12 months. The Company’s policy is that it recognizes interest and penalties accrued on any unrecognized tax benefits as a component of income tax expense.
The Company’s unrecognized tax benefits are summarized as follows:
| | |
| Balance at December 31, 2009 | | $ | 209 | |
| Additions in unrecognized tax benefits – prior year tax positions | | | — | |
| Additions in unrecognized tax benefits – current year tax positions | | | 689 | |
| Reductions in unrecognized tax benefits – current year tax positions | | | (39 | ) |
| Foreign exchange gains and losses | | | 10 | |
| Balance at December 31, 2010 | | $ | 869 | |
| Additions in unrecognized tax benefits – prior year tax positions | | | 791 | |
| Additions in unrecognized tax benefits – current year tax positions | | | 93 | |
| Reductions in unrecognized tax benefits – current year tax positions | | | — | |
| Foreign exchange gains and losses | | | (4 | ) |
| Balance at December 31, 2011 | | $ | 1,749 | |
| Additions in unrecognized tax benefits – prior year tax positions | | | 697 | |
| Additions in unrecognized tax benefits – current year tax positions | | | 24 | |
| Foreign exchange gains and losses | | | 6 | |
| Balance at December 31, 2012 | | $ | 2,476 | |
As of December 31, 2012 and 2011, the Company had approximately $0.7 million and $1.7 million, respectively, of total unrecognized tax benefits, which could favorably affect the effective rate. The change from 2011 to 2012 primarily relates to the impact of the change in our valuation allowance in 2012 on certain positions. If these positions were favorably settled, the favorable impact would be offset by a corresponding
82
TABLE OF CONTENTS
Web.com Group, Inc.
Notes to Consolidated Financial Statements
December 31, 2012
15. Income Taxes – (continued)
increase in our valuation allowance. In addition, the Company recorded $58 thousand, $27 thousand, and $25 thousand during 2012, 2011, and 2010, respectively, of accrued interest and penalties on the unrecognized tax benefits. The total amount of accrued interest and penalties as of December 31, 2012 and December 31, 2011, was $225 thousand and $167 thousand, respectively. Included in the December 31, 2011 amount was $82 thousand previously recorded by Network Solutions.
The Company’s undistributed foreign earnings of approximately $1.8 million as of December 31, 2012 related to its Canadian subsidiary, Web.com Canada, Inc., and its Argentine subsidiary, NCIT S.R.L., are considered to be indefinitely reinvested into these foreign jurisdictions. Accordingly, the Company has not provided deferred taxes on these earnings. If these earnings were repatriated, the incremental US tax liability would not be material given the Company’s current US tax position and related valuation allowance.
16. Employee Savings Plans
The Company has a qualifying defined contribution 401(k) plan under the Internal Revenue Code. All employees at the date of hire are eligible to participate in the plan. Each participant may contribute to the plan up to the maximum allowable amount as determined by the Federal Government. Employee 401(k) deferrals are 100% vested. Company contributions are subject to a vesting schedule based on years of service. The Company recorded contribution expense of $0.8 million, $0.5 million and $0.2 million for 2012, 2011, and 2010, respectively.
Effective July 1, 2012, the Company established an unfunded deferred compensation defined contribution plan for key management and highly compensated employees. The purpose of the plan is to provide a select group of employees who contribute significantly to the future business success of the Company with supplemental retirement income benefits through the deferral of base salary and other compensation and through additional discretionary company matching contributions. Deferral elections are made at the discretion of the employee and would be an amount or percentage of the employee’s compensation. Each plan year, the Company may, but need not, make a matching contribution to the plan on behalf of the participant. In addition, matching contributions need not be uniform among participants. The Company recorded contribution expense of $0.1 million for the year ended December 31, 2012.
Also, effective July 1, 2012, the Company established an unfunded supplemental retirement defined contribution plan for key management. The purpose of the plan is to provide a select group of management or highly compensated employees who contribute significantly to the future business of the company with supplemental retirement income through discretionary company contributions. Each plan year, the Company may, but is not required to, make a discretionary contribution to the plan on behalf of a participant. The Company is under no obligation to make a contribution for the plan year and contributions need not be uniform among participants. The Company recorded contribution expense of $0.6 million for the year ended December 31, 2012.
17. Related Party Transactions
The Company leases data center services from Quality Technology Services LLC (“QTS”). General Atlantic LLC is one of the Company’s greater than 5 percent shareholders, and has approximately a 50 percent ownership interest in QTS. This business relationship was an agreement between QTS and Network Solutions and was acquired by the Company as a result of the acquisition and commenced on October 27, 2011 upon the consummation of the acquisition. The Company incurred approximately $0.9 million and $0.2 million of expense for data center services provided by QTS during the years ended December 31, 2012 and 2011, respectively.
The Company outsources telesales and marketing expenses to Red Ventures LLC (“Red Ventures”). General Atlantic LLC is one of the Company’s greater than 5 percent shareholders, and also has a 25 percent
83
TABLE OF CONTENTS
Web.com Group, Inc.
Notes to Consolidated Financial Statements
December 31, 2012
17. Related Party Transactions – (continued)
ownership interest in Red Ventures. The Company incurred approximately $18.0 million and $2.8 million of expense for sales and marketing services provided by Red Ventures during the years ended December 31, 2012 and 2011, respectively. Effective September 30, 2012, the Company elected to terminate its agreement with Red Ventures and transfer responsibility for Telesales operations from Red Ventures to Network Solutions. Red Ventures has transferred the responsibility for conducting pay-per-click services and related services, including but not limited to ownership of the relevant paid search accounts on September 30, 2012. The Company has paid and will continue to pay a transition buy-out fee of $1.5 million during the following five month period. The $1.5 million is recorded in the restructuring charges in the Consolidated Statement of Comprehensive Loss for the year ended December 31, 2012. As of December 31, 2012 and 2011, the Company had $0.4 million and $2.7 million payable to Red Ventures, respectively.
18. Contingencies
The Company and our subsidiaries are named from time to time as defendants in various legal actions that are incidental to our business and arise out of or are related to claims made in connection with intellectual property, our customer and vendor contracts or employment related disputes. We believe that the resolution of these legal actions will not have a material adverse effect on our financial position or results of operations. There were no material legal matters that were reasonably possible and estimable at December 31, 2012. In addition, there were no material legal matters for which an estimate could not be made.
19. Subsequent Events (Unaudited)
In March 2013, we repriced our First Lien Term Loan and increased its outstanding balance by $32.1 million to $660.0 million. In addition, the Company increased the maximum amount of borrowings available under our revolving credit facility from $60 million to $70 million. After giving effect to the repricing, the First Lien Term Loan has an interest rate of LIBOR plus 3.50%, with a 1.00% LIBOR floor, and the revolving credit facility has an interest rate of LIBOR plus 3.25%. The additional proceeds received from the First Lien Term Loan were used to pay in full the outstanding balance of the Second Lien Term Loan. In connection with such repayment, the collateral securing such loan was released.
The repricing of the First Lien Term Loan and the repayment of Second Lien Term Loan will both be accounted for as debt extinguishments in accordance with ASC 470,Debt. The Company estimates the loss from extinguishing the debt to be $19.5 million. Included in the loss is $7.2 million of prepayment penalties paid at closing and $12.3 million from accelerating existing loan origination discounts and debt issuance costs. The Company expects to incur an additional $4.1 million of administrative bank fees, loan origination discounts and legal fees that will be deferred and amortized over the remaining life of the First Lien Term Loan.
84
TABLE OF CONTENTS
2. Financial Statement Schedules
The information required by Schedule II, Valuation and Qualifying Accounts, is included in Note 5 to the Consolidated Financial Statements. All other financial statement schedules are not applicable.
3. Exhibits.
| | |
| Exhibit No. | | Description of Document |
| 2.1 | | Agreement and Plan of Merger and Reorganization dated June 26, 2007 by and among Web.com Group, Inc. Augusta Acquisition Sub, Inc., and Web.com, Inc.(1) |
| 2.2 | | Purchase Agreement among Web.com Group, Inc., Register.com GP (Cayman) Ltd, each seller named therein and Register.com (Cayman) Limited Partnership, dated June 17, 2010.(2) |
| 3.1 | | Amended and Restated Certificate of Incorporation of Web.com Group, Inc.(3) |
| 3.2 | | Amended and Restated Bylaws of Web.com Group, Inc.(4) |
| 3.3 | | Certificate of Ownership and Merger of Registrant.(5) |
| 4.1 | | Reference is made to Exhibits 3.1 and 3.2 |
| 4.2 | | Specimen Stock Certificate.(5) |
| 4.3 | | Stockholder Agreement dated October 27, 2011 by and among Web.com Group, Inc., NWS Holdings LLC (f/k/a Net Sol Holdings LLC), and GA-NWS Investor LLC (f/k/a GA-Net Sol Investor LLC)(14) |
| 4.4 | | Amendment to Stockholder Agreement dated as of January 23, 2012 Web.com Group, Inc., NWS Holdings LLC and GA-NWS Investor LLC(15) |
| 10.1 | | 1999 Equity Incentive Plan and forms of related agreements.(3) |
| 10.2 | | 2005 Equity Incentive Plan and forms of related agreements.(3) |
| 10.3 | | 2005 Non-Employee Directors’ Stock Option Plan and forms of related agreements.(3) |
| 10.4 | | 2005 Employee Stock Purchase Plan.(3) |
| 10.5(a) | | 2008 Equity Incentive Plan.(6)+ |
| 10.5(b) | | 2008 Equity Incentive Plan forms of related agreements. |
| 10.6 | | 2009 Inducement Award Plan.(7) |
| 10.7 | | Form of Option Grant Notice under 2009 Inducement Award Plan.(7) |
| 10.8 | | 2010 Inducement Award Plan.(8) |
| 10.9 | | Form of Option Grant Notice under Web.com Group, Inc. 2010 Inducement Award Plan.(8) |
| 10.10 | | Form of Restricted Stock Grant Notice under Web.com Group, Inc. 2010 Inducement Award Plan.(8) |
| 10.11 | | Executive Severance Benefit Plan.(9)+ |
| 10.12 | | Form of Indemnity Agreement entered into between the registrant and certain of its officers and directors.(3) |
| 10.13 | | Compensatory Arrangements of certain officers.(9)+ |
| 10.14 | | Lease agreement dated December 4, 2007 between the Company and FDG Flagler Center I, LLC.(10) |
| 10.15 | | Amended and Restated Employment Agreement by and between the Company and David L. Brown.(11)+ |
| 10.16 | | Amended and Restated Employment Agreement by and between the Company and Kevin Carney.(11) + |
| 10.17 | | Transition Agreement by and between Jeffrey M. Stibel and the Company, dated August 13, 2009.(12)+ |
| 10.18 | | Form of Restricted Stock Unit Grant Notice and Restricted Stock Unit Agreement.(4)+ |
| 10.20 | | 2011 Inducement Award Plan.(16) |
85
TABLE OF CONTENTS
| | |
| Exhibit No. | | Description of Document |
| 10.21 | | Amendment to First Lien Credit Facility dated November 20, 2012(17) |
| 10.22 | | Letter Agreement by and between Jason Teichman and the Company. |
| 10.23 | | Web.com Group, Inc. Supplemental Executive Retirement Plan.(18) |
| 10.24 | | Web.com Group, Inc. Non-qualified Deferred Compensation Plan.(18) |
| 10.25 | | Trust Agreement between Web.com Group, Inc. and Reliance Trust Company.(18) |
| 21.1 | | Subsidiaries of the registrant. |
| 23.1 | | Consent of Ernst & Young, LLP, Independent Registered Public Accounting Firm. |
| 24.1 | | Power of Attorney (included in the signature page hereto). |
| 31.1 | | CEO Certification required by Rule 13a-14(a) or Rule 15d-14(a). |
| 31.2 | | CFO Certification required by Rule 13a-14(a) or Rule 15d-14(a). |
| 32.1 | | Certification required by Rule 13a-14(b) or Rule 15d-14(b) and Section 1350 of Chapter 63 of Title 18 of the United States Code (18 U.S.C. §1350).(13) |
| 101.1 | | XBRL Instance Document.* |
| 101.2 | | XBRL Taxonomy Extension Schema Document.* |
| 101.3 | | XBRL Taxonomy Extension Calculation Linkbase Document.* |
| 101.4 | | XBRL Taxonomy Extension Definition Linkbase Document.* |
| 101.5 | | XBRL Taxonomy Extension Label Linkbase Document.* |
| (1) | Filed as an exhibit to the Registrant's current report on Form 8-K (No. 000-51595), filed with the SEC on June 27, 2007, and incorporated herein by reference. |
| (2) | Filed as an exhibit the Registrant’s quarterly report on Form 10-Q (No. 000-51595), filed with the SEC on August 4, 2010, and incorporated herein by reference. |
| (3) | Filed as an exhibit to the Registrant’s registration statement on Form S-1 (No. 333-124349), filed with the SEC on April 27, 2005, as amended, and incorporated herein by reference. |
| (4) | Filed as an exhibit to the Registrant's current report on Form 8-K (No.000-51595), filed with the SEC on February 10, 2009, and incorporated herein by reference. |
| (5) | Filed as an exhibit to the Registrant's current report on Form 8-K (No. 000-51595), filed with the SEC on October 30, 2008, and incorporated herein by reference. |
| (6) | Filed as Appendix B to Company’s Proxy Statement on Schedule 14A, filed with the SEC on April 14, 2008, and incorporated herein by reference. |
| (7) | Filed as an exhibit to the Registrant’s registration statement on Form S-8 (No. 333-158819), filed with the SEC on April 27, 2009, and incorporated herein by reference. |
| (8) | Filed as an exhibit to the Registrant’s registration statement on Form S-8 (No. 333-168641), filed with the SEC on August 9, 2010, and incorporated herein by reference. |
| (9) | Filed as Item 5.02 to the Registrant's current report on Form 8-K (No. 000-51595), filed with the SEC on February 9, 2012, and incorporated herein by reference. |
| (10) | Filed as an exhibit to the Registrant’s quarterly report on Form 10-Q (No. 000-51595), filed with the SEC on May 12, 2008, and incorporated herein by reference. |
| (11) | Filed as an exhibit to the Registrant’s current report on Form 8-K (No. 000-51595), filed with the SEC on March 11, 2011, and incorporated herein by reference. |
| (12) | Filed as an exhibit to the Registrant’s current report on Form 8-K (No. 000-51595), filed with the SEC on August 17, 2009, and incorporated herein by reference. |
| (13) | The certification attached as Exhibit 32.1 accompanying this Annual Report on Form 10-K, is not deemed filed with the Securities and Exchange Commission and is not to be incorporated by reference into any filing of Web.com Group, Inc. under the Securities Act of 1933, as amended, or the Securities Exchange Act of 1934, as amended, whether made before or after the date of this Annual Report on Form 10-K, irrespective of any general incorporation language contained in such filing. |
86
TABLE OF CONTENTS
| (14) | Filed as an exhibit to the Registrant’s current report on Form 8-K (No. 000-51595), filed with the SEC on October 28, 2011, and incorporated herein by reference. |
| (15) | Filed as an exhibit to the Registrant’s registration statement on Form S-3 (No. 333-179553), filed with the SEC on February 16, 2012, and incorporated herein by reference. |
| (16) | Filed as an exhibit to the Registrant’s registration statement on Form S-8 (No. 333-177610), filed with the SEC on October 31, 2011, and incorporated herein by reference. |
| (17) | Filed as an exhibit to the Registrant’s current report on Form 8-K (No. 000-51595), filed with the SEC on November 23, 2012, and incorporated herein by reference. |
| (18) | Filed as an exhibit to the Registrant’s quarterly report on Form 10-Q (No. 000-51595), filed with the SEC on June 19, 2012, and incorporated herein by reference. |
| * | The XBRL information is being furnished with this Form 10-K, not filed. |
| + | Indicates management contract or compensatory plan. |
87
TABLE OF CONTENTS
SIGNATURES
Pursuant to the requirements of the Securities Exchange Act of 1934, the registrant has duly caused this report to be signed on its behalf by the undersigned thereunto duly authorized.
| | |
| | Web.com Group, Inc.
(Registrant) |
| | | |
| Date: March 6, 2013 | | /s/ Kevin M. Carney
Kevin M. Carney
Chief Financial Officer
(Principal Financial and Accounting Officer) |
POWER OF ATTORNEY
KNOW ALL PERSONS BY THESE PRESENTS, that each person whose signature appears below constitutes and appoints David L. Brown and Kevin M. Carney, and each of them, as his true and lawful attorneys-in-fact and agents, with full power of substitution for him, and in his name in any and all capacities, to sign any and all amendments to this Form 10-K, and to file the same, with exhibits thereto and other documents in connection therewith, with the Securities and Exchange Commission, granting unto said attorneys-in-fact and agents, and each of them, full power and authority to do and perform each and every act and thing requisite and necessary to be done therewith, as fully to all intents and purposes as he might or could do in person, hereby ratifying and confirming all that said attorneys-in-fact and agents, and any of them or his or her substitute or substitutes, may lawfully do or cause to be done by virtue hereof.
Pursuant to the requirements of the Securities Act of 1934, this report has been signed by the following persons on behalf of the Registrant in the capacities indicated on March 6, 2013:
| | |
| Name | | Title |
/s/ David L. Brown
David L. Brown | | Chairman, President, Chief Executive Officer
(Principal Executive Officer) |
/s/ Kevin M. Carney
Kevin M. Carney | | Chief Financial Officer
(Principal Financial and Accounting Officer) |
/s/ Timothy I. Maudlin
Timothy I. Maudlin | | Lead Director |
/s/ Hugh M. Durden
Hugh M. Durden | | Director |
/s/ Philip J. Facchina
Philip J. Facchina | | Director |
/s/ Anton J. Levy
Anton J. Levy | | Director |
/s/ Robert S. McCoy, Jr.
Robert S. McCoy, Jr. | | Director |
/s/ Deborah H. Quazzo
Deborah H. Quazzo | | Director |
TABLE OF CONTENTS
EXHIBIT INDEX
| | |
| Exhibit No. | | Description of Document |
| 2.1 | | Agreement and Plan of Merger and Reorganization dated June 26, 2007 by and among Web.com Group, Inc. Augusta Acquisition Sub, Inc., and Web.com, Inc.(1) |
| 2.2 | | Purchase Agreement among Web.com Group, Inc., Register.com GP (Cayman) Ltd, each seller named therein and Register.com (Cayman) Limited Partnership, dated June 17, 2010.(2) |
| 3.1 | | Amended and Restated Certificate of Incorporation of Web.com Group, Inc.(3) |
| 3.2 | | Amended and Restated Bylaws of Web.com Group, Inc.(4) |
| 3.3 | | Certificate of Ownership and Merger of Registrant(5) |
| 4.1 | | Reference is made to Exhibits 3.1 and 3.2 |
| 4.2 | | Specimen Stock Certificate.(5) |
| 4.3 | | Stockholder Agreement dated October 27, 2011 by and among Web.com Group, Inc., NWS Holdings LLC (f/k/a Net Sol Holdings LLC), and GA-NWS Investor LLC (f/k/a GA-Net Sol Investor LLC).(14) |
| 4.4 | | Amendment to Stockholder Agreement dated as of January 23, 2012 Web.com Group, Inc., NWS Holdings LLC and GA-NWS Investor LLC.(15) |
| 10.1 | | 1999 Equity Incentive Plan and forms of related agreements.(3) |
| 10.2 | | 2005 Equity Incentive Plan and forms of related agreements.(3) |
| 10.3 | | 2005 Non-Employee Directors’ Stock Option Plan and forms of related agreements.(3) |
| 10.4 | | 2005 Employee Stock Purchase Plan.(3) |
| 10.5(a) | | 2008 Equity Incentive Plan.(6)+ |
| 10.5(b) | | 2008 Equity Incentive Plan forms of related agreements. |
| 10.6 | | 2009 Inducement Award Plan.(7) |
| 10.7 | | Form of Option Grant Notice under 2009 Inducement Award Plan.(7) |
| 10.8 | | 2010 Inducement Award Plan.(8) |
| 10.9 | | Form of Option Grant Notice under Web.com Group, Inc. 2010 Inducement Award Plan.(8) |
| 10.10 | | Form of Restricted Stock Grant Notice under Web.com Group, Inc. 2010 Inducement Award Plan.(8) |
| 10.11 | | Executive Severance Benefit Plan.(9)+ |
| 10.12 | | Form of Indemnity Agreement entered into between the registrant and certain of its officers and directors.(3) |
| 10.13 | | Compensatory Arrangements of certain officers.(9)+ |
| 10.14 | | Lease agreement dated December 4, 2007 between the Company and FDG Flagler Center I, LLC.(10) |
| 10.15 | | Amended and Restated Employment Agreement by and between the Company and
David L. Brown.(11)+ |
| 10.16 | | Amended and Restated Employment Agreement by and between the Company and
Kevin Carney. (11)+ |
| 10.17 | | Transition Agreement by and between Jeffrey M. Stibel and the Company, dated August 13, 2009.(12)+ |
| 10.18 | | Form of Restricted Stock Unit Grant Notice and Restricted Stock Unit Agreement.(4)+ |
| 10.20 | | 2011 Inducement Award Plan.(16) |
| 10.21 | | Amendment to First Lien Credit Facility dated November 20, 2012.(17) |
| 10.22 | | Letter Agreement by and between Jason Teichman and the Company. |
| 10.23 | | Web.com Group, Inc. Supplemental Executive Retirement Plan.(18) |
TABLE OF CONTENTS
| | |
| Exhibit No. | | Description of Document |
| 10.24 | | Web.com Group, Inc. Non-Qualified Deferred Compensation Plan.(18) |
| 10.25 | | Trust Agreement between Web.com Group, Inc. and Reliance Trust Company.(18) |
| 21.1 | | Subsidiaries of the registrant. |
| 23.1 | | Consent of Ernst & Young, LLP, Independent Registered Public Accounting Firm. |
| 24.1 | | Power of Attorney (included in the signature page hereto). |
| 31.1 | | CEO Certification required by Rule 13a-14(a) or Rule 15d-14(a). |
| 31.2 | | CFO Certification required by Rule 13a-14(a) or Rule 15d-14(a). |
| 32.1 | | Certification required by Rule 13a-14(b) or Rule 15d-14(b) and Section 1350 of Chapter 63 of Title 18 of the United States Code (18 U.S.C. §1350).(12) |
| 101.1 | | XBRL Instance Document.* |
| 101.2 | | XBRL Taxonomy Extension Schema Document.* |
| 101.3 | | XBRL Taxonomy Extension Calculation Linkbase Document.* |
| 101.4 | | XBRL Taxonomy Extension Definition Linkbase Document.* |
| 101.5 | | XBRL Taxonomy Extension Label Linkbase Document.* |
| (1) | Filed as an exhibit to the Registrant's current report on Form 8-K (No. 000-51595), filed with the SEC on June 27, 2007, and incorporated herein by reference. |
| (2) | Filed as an exhibit the Registrant’s quarterly report on Form 10-Q (No. 000-51595), filed with the SEC on August 4, 2010, and incorporated herein by reference. |
| (3) | Filed as an exhibit to the Registrant’s registration statement on Form S-1 (No. 333-124349), filed with the SEC on April 27, 2005, as amended, and incorporated herein by reference. |
| (4) | Filed as an exhibit to the Registrant's current report on Form 8-K (No.000-51595), filed with the SEC on February 10, 2009, and incorporated herein by reference. |
| (5) | Filed as an exhibit to the Registrant's current report on Form 8-K (No. 000-51595), filed with the SEC on October 30, 2008, and incorporated herein by reference. |
| (6) | Filed as Appendix B to Company’s Proxy Statement on Schedule 14A, filed with the SEC on April 14, 2008, and incorporated herein by reference. |
| (7) | Filed as an exhibit to the Registrant’s registration statement on Form S-8 (No. 333-158819), filed with the SEC on April 27, 2009, and incorporated herein by reference. |
| (8) | Filed as an exhibit to the Registrant’s registration statement on Form S-8 (No. 333-168641), filed with the SEC on August 9, 2010, and incorporated herein by reference. |
| (9) | Filed as Item 5.02 to the Registrant's current report on Form 8-K (No. 000-51595), filed with the SEC on February 9, 2010, and incorporated herein by reference. |
| (10) | Filed as an exhibit to the Registrant’s Quarterly Report on Form 10-Q (No. 000-51595), filed with the SEC on May 12, 2008, and incorporated herein by reference. |
| (11) | Filed as an exhibit to the Registrant’s current report on Form 8-K (No. 000-51595), filed with the SEC on March 11, 2011, and incorporated herein by reference. |
| (12) | Filed as an exhibit to the Registrant’s current report on Form 8-K (No. 000-51595), filed with the SEC on August 17, 2009, and incorporated herein by reference. |
| (13) | The certification attached as Exhibit 32.1 accompanying this Annual Report on Form 10-K, is not deemed filed with the Securities and Exchange Commission and is not to be incorporated by reference into any filing of Web.com Group, Inc. under the Securities Act of 1933, as amended, or the Securities Exchange Act of 1934, as amended, whether made before or after the date of this Annual Report on Form 10-K, irrespective of any general incorporation language contained in such filing. |
| (14) | Filed as an exhibit to the Registrant’s current report on Form 8-K (No. 000-51595), filed with the SEC on October 28, 2011, and incorporated herein by reference. |
| (15) | Filed as an exhibit to the Registrant’s registration statement on Form S-3 (No. 333-179553), filed with the SEC on February 16, 2012, and incorporated herein by reference. |
TABLE OF CONTENTS
| (16) | Filed as an exhibit to the Registrant’s registration statement on Form S-8 (No. 333-177610), filed with the SEC on October 31, 2011, and incorporated herein by reference. |
| (17) | Filed as an exhibit to the Registrant’s current report on Form 8-K (No. 000-51595), filed with the SEC on November 23, 2012, and incorporated herein by reference. |
| (18) | Filed as an exhibit to the Registrant’s quarterly report on Form 10-Q (No. 000-51595), filed with the SEC on June 19, 2012, and incorporated herein by reference. |
| * | The XBRL information is being furnished with this Form 10-K, not filed. |
| + | Indicates management contract or compensatory plan. |