UNITED STATES
SECURITIES AND EXCHANGE COMMISSION
WASHINGTON, D.C. 20549
FORM 10-K
(MARK ONE)
| x | ANNUAL REPORT PURSUANT TO SECTION 13 OR 15(d) OF THE SECURITIES EXCHANGE ACT OF 1934 |
FOR THE FISCAL YEAR ENDED APRIL 30, 2008
OR
| ¨ | TRANSITION REPORT PURSUANT TO SECTION 13 OR 15(d) OF THE SECURITIES EXCHANGE ACT OF 1934 |
FOR THE TRANSITION PERIOD FROM TO
COMMISSION FILE NUMBER 000-28139
BLUE COAT SYSTEMS, INC.
(Exact Name of Registrant as Specified In Its Charter)
| | |
| DELAWARE | | 91-1715963 |
(State or Other Jurisdiction of Incorporation or Organization) | | (IRS Employer Identification) |
420 NORTH MARY AVENUE
SUNNYVALE, CALIFORNIA 94085
(Address of Principal Executive Offices and Zip Code)
Registrant’s Telephone Number, Including Area Code: (408) 220-2200
Securities Registered Pursuant to Section 12(b) of the Act:
| | |
Title of Each Class | | Name of Exchange on Which Registered |
| Common Stock, $.0001 Par Value | | The NASDAQ Stock Market LLC |
Securities Registered Pursuant to Section 12(g) of the Act:
None
Indicate by check mark if the registrant is a well-known seasoned issuer, as defined in Rule 405 of the Securities Act. YES ¨ NO x
Indicate by check mark if the registrant is not required to file reports pursuant to Section 13 or Section 15(d) of the Act. YES ¨ NO x
Indicate by check mark whether the registrant (1) has filed all reports required to be filed by Section 13 or 15(d) of the Securities Exchange Act of 1934 during the preceding 12 months (or for such shorter period than the registrant was required to file such reports), and (2) has been subject to such filing requirements for the past 90 days. YES x NO ¨
Indicate by check mark if disclosure of delinquent filers pursuant to Item 405 of Regulation S-K is not contained herein, and will not be contained, to the best of registrant’s knowledge, in definitive proxy or information statements incorporated by reference in Part III of this Form 10-K or any amendment to this Form 10-K. ¨
Indicate by check mark whether the registrant is a large accelerated filer, an accelerated filer, a non-accelerated filer, or a smaller reporting company. See the definitions of “large accelerated filer,” “accelerated filer” and “smaller reporting company” in Rule 12b-2 of the Exchange Act.
| | | | | | | |
| Large accelerated filer x | | Accelerated filer ¨ | | Non-accelerated filer ¨ | | Smaller Reporting Company | ¨ |
Indicate by check mark whether the registrant is a shell company (as defined in Rule 12b-2 of the Act). YES ¨ NO x
The aggregate market value of the voting and non-voting common equity stock held by non-affiliates of the registrant was $1,483,329,971 as of October 31, 2007, the last day of the registrant’s second fiscal quarter during its fiscal year ended April 30, 2008, based upon the closing sale price on The NASDAQ Stock Market LLC reported for such date. Shares of Common Stock held by each officer and director and by each person who may be deemed to be an affiliate have been excluded. This determination of affiliate status is not necessarily a conclusive determination for other purposes.
There were 38,356,564 of the registrant’s Common Stock issued and outstanding as of June 20, 2008.
Documents Incorporated by Reference:
Part III—Portions of the registrant’s definitive proxy statement to be issued in conjunction with registrant’s annual stockholders’ meeting to be held on October 2, 2008.
BLUE COAT SYSTEMS, INC.
ANNUAL REPORT ON FORM 10-K
TABLE OF CONTENTS
2
FORWARD-LOOKING STATEMENTS
This Annual Report on Form 10-K, and other materials accompanying this Annual Report on Form 10-K contain forward-looking statements within the meaning of Section 27A of the Securities Act of 1933 and Section 21E of the Securities Exchange Act of 1934. These statements relate to our future plans, objectives, expectations, intentions and financial performance and the assumptions that underlie these statements. These forward-looking statements include, but are not limited to, statements concerning the following: expectations with respect to future market growth opportunities; changes in and expectations with respect to revenues and gross margins; future operating expense levels; the impact of quarterly fluctuations of revenue and operating results; our ability to achieve expected levels of revenues and profit contributions from acquired businesses; the impact of macroeconomic conditions on our business; the adequacy of our capital resources to fund operations and growth; investments or potential investments in acquired businesses and technologies (including our recent acquisition of Packeteer, Inc.), as well as internally developed technologies; the expansion and effectiveness of our direct sales force, distribution channel, and marketing activities; the recording of amortization of acquired technology and stock-based compensation; the impact of recent changes in accounting standards and assumptions underlying any of the foregoing. In some cases, forward-looking statements are identified by the use of terminology such as “anticipate,” “expect,” “intend,” “plan,” “predict,” “believe,” “estimate,” “may,” “will,” “should,” “would,” “could,” “potential,” “continue,” “ongoing,” or negatives or derivatives of the foregoing, or other comparable terminology.
The forward-looking statements in this Annual Report on Form 10-K involve known and unknown risks, uncertainties and other factors that may cause industry and market trends, or our actual results, level of activity, performance or achievements, to be materially different from any future trends, results, level of activity, performance or achievements expressed or implied by these statements. For a detailed discussion of these risks, uncertainties and other factors, see the “Risk Factors” section in Item 1A of this Annual Report on Form 10-K. We undertake no obligation to revise or update forward-looking statements to reflect new information or events or circumstances occurring after the date of this Annual Report on Form 10-K, except as required by applicable law.
3
PART I.
Item 1.Business
Blue Coat Systems, Inc., also referred to in this report as “we” or “us,” sells a family of products, including both intelligent hardware appliances and software, that secure and accelerate the delivery of business applications and other information over a Wide Area Network (“WAN”), or the public Internet (also known as the Web). Our products are designed to accelerate the performance of our customers’ business applications, and work with both applications on a customer’s computer systems and applications hosted by external providers. In addition to enhancing the performance of applications, our products also are designed to allow customers to more safely use the Internet by providing security from malicious code and inappropriate content. Our appliances also enable policy-based control and centralized management of communications between users and applications across the WAN, Internet and customers’ internal networks.
On June 6, 2008, subsequent to our fiscal year end, we acquired Packeteer Inc., a pioneer in delivering sophisticated WAN traffic prioritization through the development and sale of application classification and performance management technologies and products. As a consequence of that acquisition, we have added the PacketShaper, Policy Center and Intelligence Center products formerly sold by Packeteer to our product line. See further discussion of the Packeteer acquisition in Item 7, Management’s Discussion and Analysis of Financial Condition and Results of Operation, of this report.
Our principal markets include the market for Secure Web Gateway products, and the newly evolving WAN Application Delivery market, which includes products that both enhance WAN security and WAN performance, and improve the availability of business applications, where network users are distributed across multiple locations.
Our primary end user customers are medium and large distributed organizations, including finance, government, healthcare, education and other business enterprises. Enterprises deploy our products in their data centers, branch offices, and Internet gateways and mobile devices worldwide.
We were incorporated in Delaware on March 13, 1996 as Web Appliance Inc. We changed our name to CacheFlow, Inc. on March 25, 1996, and completed our initial public offering on November 19, 1999. On August 21, 2002, we changed our name to Blue Coat Systems, Inc., and our ticker symbol for our common stock from CFLO to BCSI.
On September 16, 2002, we filed an amendment to our Certificate of Incorporation, implementing a one-for-five reverse split of our outstanding common stock. Our common stock began trading under the split adjustment at the opening of The NASDAQ Stock Market on September 16, 2002. On August 16, 2007, our Board of Directors approved a two-for-one forward stock split of our common stock. The stock split was effected by the issuance of a stock dividend of one share of our common stock for each share of our common stock issued and outstanding as of the record date of September 13, 2007. Our common stock began trading under that split adjustment at the opening of the NASDAQ Global Market on October 4, 2007. In January 2008, we commenced trading on the NASDAQ Global Select Market. Our number of authorized shares of common stock and preferred stock has remained at 200 million and 10 million, respectively, since our incorporation. All share and per share amounts in this Annual Report on Form 10-K, and in the accompanying consolidated financial statements and notes thereto, reflect the reverse stock split and subsequent forward split for all periods presented.
Overview
During the past few years, certain trends have fundamentally changed the basic architecture of the corporate enterprise network—and the way users and applications communicate across a distributed enterprise.
| | • | | The number of enterprise branch offices and mobile network users has continued to increase. As a result, a growing number of employees, and in some cases the majority of an enterprise’s employees, now work outside the corporate headquarters, or away from its data centers. |
4
| | • | | Data centers, servers, storage and applications are increasingly being consolidated at enterprise headquarters in order to reduce costs, optimize use of resources, better safeguard critical business information, and comply with new regulatory requirements requiring greater control over IT systems. As a result, a growing number of users must now connect securely and efficiently to the enterprise headquarters through a WAN to access the business applications and business information systems required to be productive. |
| | • | | There is an increasing number of threats to the security and availability of corporate networks, including those resulting from malicious code, viruses, Trojans, spam, spyware, and the use of instant messaging. |
| | • | | Most business applications are designed to perform optimally over a local area network (“LAN”) and are not designed or architected to be accessed over a WAN. As a consequence, these applications, although often critical to the enterprise, perform very inefficiently and slowly when used by remote and mobile users. In addition, other commonly used applications, such as Web protocols, video/streaming, and Secure Sockets Layer (“SSL”), consume large amounts of bandwidth, causing further degradation of application performance for the remote and mobile users of a corporate network. Where employees do not experience an acceptable level of network performance, their productivity may suffer and they may even cease to use an application altogether. |
| | • | | Many companies are now outsourcing one or more critical business applications, such as customer relationship management or “CRM”, enterprise resource planning or “ERP”, human resources, and procurement applications. In such circumstances, the application is hosted remotely by the service provider and is typically accessed through the Internet. Since corporate IT organizations do not control these applications or the Internet, it is more difficult to ensure that these applications perform well and are secure, especially for remote and mobile users. |
| | • | | The Web browser is becoming the ubiquitous user interface for many applications, and provides virtually all users of a corporate network with access to the Web itself. The amount of Internet traffic on the corporate WAN has increased dramatically. |
As a consequence of this evolution, IT organizations must address three distinct requirements to ensure that all network users remain productive:
| | • | | They must be able to block Internet security threats and inappropriate content, prevent leakage of sensitive information, and grant authorized users timely access to necessary applications and content. |
| | • | | They must significantly improve the performance of critical business applications being delivered to remote users in branch offices and to mobile users. These applications can include ERP, CRM, and productivity and office applications; e-mail; file systems; streaming media; and Web-based applications, including encrypted SSL applications. |
| | • | | They must be able to monitor the specific activities and performance of users and applications, as well as be able to implement and enforce access and security policies, to ensure that the business is providing an acceptable and cost effective level of application performance and network security for all users, including those located outside of enterprise headquarters. |
We offer a family of appliances and software products that assist IT organizations in addressing the challenges of the distributed enterprise and meeting the above requirements. These appliances and software help secure and accelerate application delivery to all users connected over a private WAN or the public Internet, regardless of whether the applications are hosted internally or externally. Our Blue Coat ProxySG®, ProxyAV, and ProxyRA appliances, and our Blue Coat ProxySG® Client software, are available in a wide range of configurations and work together as a centrally managed, policy-controlled system that is sufficiently flexible to be scaled to support large complex organizations.
5
Secure Web Gateway Solutions
During the past several years, our primary business focus has been to offer proxy appliances used to control and secure communications for users of a corporate network accessing content on the Internet. These appliances are located at the customer’s Internet gateway, which is the point where the network connects to the Internet. The performance of our proxy appliances has enabled us to establish a leadership position in the market for Secure Web Gateway products.
One of the key strengths of our appliances is our advanced proxy technology. Our proxy appliance acts as a middleman between users and various applications or Internet content. Users communicate with the proxy appliance on one side of the transaction, and applications and Internet content communicate with the proxy appliance on the other side of the transaction. There are two separate connections, both controlled and managed by the proxy appliance. Consequently, no content can get past the appliance unless it is in accordance with a policy that is created by the customer’s IT organization and that is automatically enforced by the appliance. This enables our proxy appliances to protect businesses from many of the dangers of the Internet.
Our appliances offer a number of important features that enable more secure communication with the Internet, including:
| | • | | Web content filtering—the ability to allow or block specific types of Web content from entering the corporate network. The use of Web content filtering can prevent potential security breaches and can block employees from viewing inappropriate content when using the company’s computer system. |
| | • | | Web anti-virus (“AV”) protection—the ability to automatically scan and block viruses and other potentially malicious network traffic using leading third party anti-virus products. |
| | • | | Spyware prevention—the ability to prevent installation of spyware and other malicious code on individual user computers, and eliminate that as a cause of performance problems and security vulnerabilities. |
| | • | | Instant messaging (“IM”) and Skype control—the ability to prevent these types of peer-to-peer (“P2P”) applications from creating an opportunity for leakage of sensitive, confidential information, as well as managing IM content and blocking inappropriate use of such applications. |
| | • | | Prevention of rogue streaming media applications—the ability to limit or block the use of unauthorized P2P applications, which often degrade network performance, by network users. |
| | • | | SSL threat protection—the ability to identify and block threats presented by the use of the SSL, or Secure Sockets Layer, protocol. While use of SSL improves security by encrypting confidential data communicated over the Internet, it may also provide a means for hidden viruses, worms, and other security threats to enter the network. |
| | • | | User authentication—the ability to automatically validate a user who requests access to secure corporate content. Our appliances interface with virtually all leading authentication systems, including NT LAN Manager, RADIUS, LDAP and Active Directory, to provide user validation. |
Wide Area Network Application Delivery Solutions
During fiscal 2007, we extended our focus to address the need to improve performance and availability of critical business applications delivered across the WAN to remote and mobile users (commonly known as “WAN optimization” or “WAN acceleration”), while simultaneously securing the delivery of those applications and content. This market has been defined by IDC, a leading provider of IT market intelligence services, as the “WAN Application Delivery” market.
Our WAN Application Delivery products are delivered by the same proxy appliances that enable our Secure Web Gateway products. Our MACH5 (Multiprotocol Accelerated Caching Hierarchy) technology, which is
6
integrated into our appliances, provides five key capabilities that accelerate the delivery of business applications to remote users of a WAN, including:
| | • | | Bandwidth management—the ability to assign a set level of bandwidth to specific users and applications and prioritize delivery of that traffic over the WAN. |
| | • | | Protocol optimization—a technique that enhances the efficiency of protocols by reducing the communication required between the user and the application. |
| | • | | Object caching—a technique where reusable content is stored on the appliance which eliminates the need to repeatedly transfer that information across the WAN. |
| | • | | Byte caching—a technique that assigns, stores and uses abbreviated expressions that represent repetitive WAN traffic, which conserves bandwidth and accelerates delivery of the application. |
| | • | | Compression—a technique that uses an industry standard algorithm to package and unpackage information for efficient transmission across a WAN. |
Our MACH5 technology is also designed to improve the performance of business applications, including streaming video, encrypted SSL applications, and applications hosted by third parties and accessed through the Internet.
Our appliances are deployed in both the centralized data centers and in the branch office. In addition, we make MACH5 functionality available as client-based software in our SG Client for users requiring accelerated application performance while working outside of the corporate network.
Products
As of April 30, 2008, we offered the following products:
ProxySG Appliances
Our Blue Coat ProxySG® family of proxy appliances serves as the foundation for both our Secure Web Gateway products and our WAN Application Delivery products. The appliance, when appropriately configured, may be placed at the Internet gateway, to provide security with respect to Web-based communications, or may be placed at connection points for entry to or exit from a WAN (or “WAN links”) to enhance and accelerate the performance of business applications over that WAN.
ProxySG appliances are designed for simple management and installation by our customers, and easily integrate with the customer’s existing security and network infrastructure. They are ICSA-certified and are available in four different models.
Our ProxySG appliances use our proprietary SGOS operating system, which is specifically designed to support the security, acceleration, and policy control features of those appliances. They are available in a broad range of configurations to support all network users in an organization, regardless of their physical location.
ProxySG Client
Our Blue Coat ProxySG® Client is software that is installed on a desktop or laptop computer that is located at a remote site without a ProxySG Appliance or that is used by a mobile user. The software uses our MACH5 technology, including caching, compression and protocol optimization, to accelerate the delivery of Web and office applications used by these remote computers. This provides the user with performance that is similar to that provided by a large WAN that uses a ProxySG appliance.
7
ProxyAV Appliances
Our Blue Coat ProxyAV family of Web anti-virus appliances enable organizations to scan for viruses, worms, spyware and Trojans at the Internet gateway before permitting communications to enter the enterprise’s network. Such infected communications frequently arrive through so-called “backdoors,” such as personal Web email accounts, Web spam or email spam (that activates Trojan downloads without the user’s consent), and browser-based file downloads that bypass existing virus scanning mechanisms. A ProxyAV appliance, when implemented in combination with a ProxySG appliance, provides scalable virus scanning, and also provides the IT administrator with comprehensive visibility and control of enterprise Web communications. The ProxyAV appliance uses virus scanning software from such vendors as Sophos, McAfee, Symantec, Panda, and Kaspersky Lab.
ProxyRA Appliances
Our Blue Coat ProxyRA appliances are installed at the headquarters of an enterprise and enable authorized mobile users to securely connect to a corporate network through a mobile client device (such as a laptop, PDA or airport kiosk computer). Our ProxyRA appliances use application-independent proxy architecture and proprietary connector technology to provide the following features:
| | • | | On-demand access to Web and non-Web applications without the need to install virtual private network (“VPN”) or other special software on the client device. |
| | • | | Comprehensive support for client devices not managed by the enterprise’s IT department, including features to block inadvertent or malicious information leakage to or from the client device. |
| | • | | Integrated security services with respect to communications between the corporate network and the client device, including monitoring for encryption and spyware and implementing policy-based controls. |
Blue Coat WebFilter
Our Blue Coat WebFilter is a Web filtering product that operates on our ProxySG appliances and helps enterprises and service providers protect their users and networks from Internet threats and inappropriate content and traffic, such as adult content, spyware, phishing attacks, P2P traffic, IM and streaming traffic. Our WebFilter product includes a comprehensive database that is organized into relevant and useful categories. The WebFilter database continues to be developed and enhanced in response to the actual Web usage patterns of customers, including through use of our Dynamic Real-Time Rating (DRTR™) technology, which enables us to categorize Web sites that are not in our database, but to which a user sought access.
In addition to our proprietary WebFilter product, our ProxySG appliances also support the use of third party content filtering databases, including those offered by Secure Computing Corporation and Websense, Inc.
Blue Coat Reporter
Blue Coat Reporter uses transaction log data captured by an appliance to produce both pre-defined and custom reports relating to the performance and security of user activities on the enterprise’s WAN. The information in these reports can be used by the IT administrator to appropriately adjust policies or take other actions to enhance the security or performance of the WAN.
Blue Coat Director
Blue Coat Director is an appliance that provides centralized management of an enterprise’s Blue Coat ProxySG appliances.
8
Sales and Marketing
Our products are delivered to end user customers in many countries worldwide. We also maintain a worldwide service and support organization that provides a broad range of service options to our customers, including 24x7 technical support and product education.
Our worldwide sales strategy is based upon the use of multiple methods and sales tiers to market and sell our products. We maintain a direct sales organization of highly skilled sales representatives and systems engineers. They are assigned to general territories covering defined geographic areas and to territories focused on a select number of large enterprise customers, or “Named Accounts.”
Our direct sales organization is complemented by a large channel of third party resellers and distributors. Our resellers are responsible for identifying and closing business on an independent basis. Our resellers are supported by our global distributors, many of whom provide education, co-marketing, demonstration equipment and support to our end user customers, and our internal channel sales specialists. During fiscal 2008, one customer, a distributor, accounted for 12% of our net revenue. Within each geographic area we also have a team of sales and technical specialists focused on the development of relationships with, and sales to, service providers and value-added resellers.
We employ a team of inside sales representatives in each geographic area to support both the direct sales organization and channel partners. The primary function of our inside sales representatives is to develop and qualify leads identified from our marketing activities and to forward those leads to the appropriate sales channel.
Our marketing efforts focus on increasing the awareness of our Blue Coat brand, educating the market on issues and challenges associated with WAN Application Delivery and Secure Web Gateway products, and creating demand for our products and technology. We develop marketing programs to support the sale and distribution of our products and to inform existing and potential customers within our target market segments about the capabilities and benefits of our products. Our marketing efforts include participation in industry trade shows, informational seminars, preparation of competitive analyses, sales training, maintenance of our Web site, advertising, public relations, and collateral solution documentation and enablement. In addition, we provide similar types of marketing support for our major sales channel partners worldwide.
Research and Development
We believe that strong product development capabilities are essential to our continued success and growth. Our current research and development efforts are primarily focused on adding new features and strengthening existing features that extend the acceleration and security capabilities of our WAN Application Delivery products and enhancing the reliability, ease of use and installation and support of those products. At the same time, we are continuing to enhance the capabilities of our Secure Web Gateway products by adding new features and strengthening existing features.
Our research and development team consists of engineers with extensive technical backgrounds in relevant disciplines. We believe that the experience and capabilities of our research and development professionals is one of our significant competitive advantages. We also work closely with our customers to understand their business needs and to focus our development of new products and product enhancements to better meet customer needs.
While we anticipate that most enhancements to our existing and future products will be accomplished by internal development, we currently license certain technologies from third parties and will continue to evaluate externally developed products and technology for integration into our products. As well, we have acquired third party businesses, technologies and products to expand our capabilities and market, and may continue to do so in the future.
9
Research and development expense was $51.6 million, $39.9 million, and $26.8 million for the fiscal years 2008, 2007, and 2006, respectively, including stock-based compensation expense attributable to our research and development organization of $5.0 million, $3.3 million, and $0.9 million, respectively.
Manufacturing
We currently outsource the manufacturing of our appliances and principally use standard parts and components that are available from multiple vendors. This approach allows us to reduce our investment in manufacturing equipment, facilities, and inventory, and to take advantage of the expertise of our vendors. We rely primarily on two original design manufacturers and one business service process partner to assist in the design of our products and to manufacture and test our products. We have contracted with MiTAC International Corporation to design and manufacture our current product offerings and have contracted with Synnex Corporation to do final assembly and testing of those products. We also have contracted with Inventec Enterprise System Corporation to design and manufacture certain new high performance products that are not yet commercially available. All of these agreements are non-exclusive.
Our internal manufacturing operations consist primarily of project management, prototype development, materials and production planning, quality and reliability assurance and procurement as required in support of our relationships with our outsourced manufacturing partners.
Backlog
Our backlog is comprised of amounts for orders that we have accepted, but not shipped, and deferred revenue. Deferred revenue includes revenue from products that have shipped to distributors, but have not yet shipped to end customers; product shipments that do not yet qualify as revenue in accordance with our revenue recognition policy; and the unearned portion of service and maintenance contracts. Our backlog was approximately $92.8 million at April 30, 2008 as compared to $71.9 million at April 30, 2007, which represented an increase of $20. 9 million. The deferred revenue portion of our backlog increased by $33.8 million, primarily as a result of an increase in new service contracts sold with our appliances, as well as the renewal of service contracts, while our backlog of orders accepted, but not shipped, declined by $12.9 million due primarily to a decline in the growth rate of our North American business in the fourth quarter of fiscal 2008. However, due to occasional customer changes in delivery schedules or cancellation of orders prior to shipment (which can be made without significant penalty), we do not believe this backlog to be firm or that backlog is a reliable indicator of future revenue levels.
A significant portion of our quarterly sales typically occurs during the last month of the quarter, which we believe reflects customer buying patterns of products similar to ours and other products in the technology industry generally.
Competition
We are a market leader in the Secure Internet Web market, although we may face increased competition in this market given recent consolidations. Our principal competitors in this market are Secure Computing Corporation, through its acquisitions of CyberGuard Corp. and CipherTrust, Inc.; and Websense, Inc., through its acquisition of PortAuthority Technologies, Inc. and SurfControl PLC; and Cisco Systems, Inc. through its acquisition of Ironport.
We commercially released our first WAN Application Delivery product in May 2006. This is a market that is intensely competitive, and it is evolving and subject to rapid technological change. We expect competition to increase in the future. Our principal competitors in this market are Riverbed Technology, Inc., Juniper Networks, Inc., Cisco Systems, Inc. and Citrix Systems, Inc. through its acquisition of Orbital Data Corp. In addition, we expect additional competition from other established and emerging companies as the WAN Application Delivery market continues to develop and expand, and as consolidation occurs.
10
The primary factors considered by our customers in selecting an appropriate solution include product characteristics such as reliability, feature sets, scalability and ease of use, as well as factors such as price and the availability and quality of customer support.
Intellectual Property and Other Proprietary Rights
Our success is heavily dependent on our ability to create proprietary technology and to protect and enforce our intellectual property rights in that technology, as well as our ability to defend against adverse claims of third parties with respect to our technology and intellectual property. To protect our proprietary technology, we rely primarily on a combination of contractual provisions and confidentiality procedures to protect trade secrets, copyright and trademark laws, and patents. Despite our efforts to protect our proprietary rights, unauthorized parties may attempt to copy aspects of our products or obtain and use information that we regard as proprietary. Policing unauthorized use of our products is difficult. In addition, the laws of some foreign countries do not protect our proprietary rights to as great an extent as do the laws of the United States. Our means of protecting our proprietary rights may not be adequate and unauthorized third parties, including our competitors, may independently develop similar or superior technology, duplicate or reverse engineer aspects of our products, or design around our patented technology or other intellectual property.
As of April 30, 2008, we had 18 issued U.S. patents, 34 pending U.S. patent applications (provisional and non-provisional), and 1 pending foreign patent application. There can be no assurance that any of our pending patent applications will issue or that the patent examination process will not result in our narrowing the claims applied for. Furthermore, there can be no assurance that we will be able to detect any infringement of our existing or future patents (if any); or, if infringement is detected, that our patents will be enforceable or that any damages awarded to us will be sufficient to adequately compensate us.
There can be no assurance or guarantee that any products, services or technologies that we are presently developing, or will develop in the future, will result in intellectual property that is protectable under law, whether in the United States or a foreign jurisdiction, that such intellectual property will produce competitive advantage for us, or that the intellectual property of competitors will not restrict our freedom to operate or put us at a competitive disadvantage.
From time to time we may and do receive notices from third parties alleging infringement of patents or other intellectual property rights or offering licenses under such intellectual property rights. While it is our policy to respect the legitimate intellectual property rights of others, we may defend against such claims or seek to negotiate licenses on commercially reasonable terms or otherwise settle such claims, where appropriate. Nevertheless, there has been a substantial amount of litigation over intellectual property rights in our industry and we expect this to continue. Hence, third parties may claim that we, or our current or potential future products, infringe their intellectual property rights, and any such claims, whether with or without merit, could be time-consuming, result in costly litigation, result in the assessment of damages, result in management distraction, cause product shipment delays or require us to enter into royalty or licensing agreements. Royalty or licensing agreements, if required, may not be available on terms acceptable to us or at all, which could seriously harm our business.
Employees
As of April 30, 2008, we had a total of 1,033 employees, comprised of 351 in sales, 281 in research and development, 186 in customer support, 124 in general and administrative, 44 in manufacturing and 47 in marketing. Of these employees, 754 were located in North America and 279 were located in various other international locations. None of our employees are represented by collective bargaining agreements, nor have we experienced any work stoppages. We consider our relations with our employees to be good.
11
Available Information
Our Annual Report on Form 10-K, Quarterly Reports on Form 10-Q, Current Reports on Form 8-K and amendments to reports filed pursuant to Sections 13(a) and 15(d) of the Securities Exchange Act of 1934, as amended, are available free of charge on our Investor Relations Web site at www.bluecoat.com as soon as reasonably practicable after we file such material with the SEC. The other information posted on our Web site is not incorporated into this Annual Report.
Item 1A.Risk Factors
FACTORS AFFECTING FUTURE OPERATING RESULTS
In addition to the other information contained in this Annual Report on Form 10-K, the following risk factors should be carefully considered by investors before making an investment decision. Our business, financial condition and results of operations could be seriously harmed as a consequence of any of the following risks and uncertainties. The trading price of our common stock could decline due to any of these risks, and investors may lose all or part of their investment. These risks and uncertainties are not the only ones we face. Additional risks and uncertainties not presently known to us or that we currently deem less significant also may impair our business, financial condition and results of operations, or result in a decline in the trading price of our common stock.
Our quarterly operating results fluctuate significantly and our ability to forecast our quarterly operating results is limited, so our operating results may not meet our guidance or third party expectations.
Our net revenue and operating results have in the past, and may in the future, vary significantly from quarter to quarter due to a number of factors, many of which are outside of our control. These factors limit our ability to accurately predict our operating results on a quarterly basis, and include factors discussed elsewhere in this “Risk Factors” section together with the following:
| | • | | The timing, size and mix of orders from customers; |
| | • | | Fluctuations in demand for our products and services; |
| | • | | Certain markets in which we compete are relatively new and are evolving; |
| | • | | Variability and unpredictability in the rate of growth in the markets in which we compete; |
| | • | | Our ability to continue to increase our respective market shares consistent with past rates of increase; |
| | • | | Our variable sales cycles, which may lengthen as the complexity of products and competition in our markets increases; |
| | • | | The level of competition in our target product markets, including new entrants or substantial discounting; |
| | • | | Market acceptance of our new products and product enhancements; |
| | • | | Announcements, introductions and transitions of new products or product enhancements by us or our competitors, and deferrals of customer orders which may result from such announcements, introductions and transitions; |
| | • | | Technological changes in our product target markets; |
| | • | | Future accounting pronouncements and changes in accounting policies; |
| | • | | Our recognition of revenue in accordance with Statement of Position (“SOP”) 97-2 requires that some product revenue be recognized ratably over a defined period or deferred to a future period if we are unable to establish fair value for the undelivered element, such as support; and |
12
| | • | | Future macroeconomic conditions in our domestic and international markets, as well as the level of discretionary IT spending generally. |
A high percentage of our expenses, including those related to manufacturing overhead, technical support, research and development, sales and marketing, and general and administrative functions, are essentially fixed in the short term. As a result, if our net revenue is less than forecast, such expenses cannot effectively be reduced and our quarterly operating results will be adversely affected.
We believe that quarter-to-quarter comparisons of our operating results should not necessarily be relied upon as indicators of future performance. In the past our quarterly results have on occasion failed to meet our quarterly guidance and the expectations of public market analysts or investors, and it is likely that this will occur in the future. If this occurs our stock price likely will decline, and may decline significantly. Such a decline may also occur even when we meet our guidance but our results or future guidance fail to meet third party expectations.
We must anticipate market needs, and develop and introduce new products and enhance existing products to rapidly meet those needs, or we will lose market share and our operating results will be adversely affected.
To maintain our competitive position in a market characterized by rapid rates of technological advancement, we must correctly anticipate market requirements and invest our research and development resources to meet those requirements. The introduction of new products by others, market acceptance of products based on new or alternative technologies, or the emergence of new industry standards, could render our existing products obsolete or make it easier for other products to compete with our products. Our future success will depend in part upon our ability to:
| | • | | develop and maintain competitive products; |
| | • | | enhance our products by adding innovative features that differentiate our products from those of our competitors; |
| | • | | bring products to market on a timely basis at competitive prices; |
| | • | | identify and respond to emerging technological trends in the market; and |
| | • | | respond effectively to new technological changes or new product announcements by others. |
There is no guarantee that we will accurately predict the direction in which the Secure Web Gateway and WAN Application Delivery markets will evolve. Failure on our part to anticipate the direction of our markets and to develop products and enhancements that meet the needs of those markets will significantly impair our business, financial condition and results of operations.
The WAN Applications Delivery market is intensely competitive and certain of our competitors have greater financial, technical, sales and marketing resources, and may take actions that could weaken our competitive position or reduce our net revenue.
We have increasingly invested in and focused on the WAN Application Delivery market. This market is intensely competitive, and the intensity of this competition is expected to increase in the future. Such increased competition is likely to result in price reductions, reduced gross margins and loss of market share, any one of which could seriously harm our business, financial condition and operating results. We may not be able to compete successfully against current or future competitors and we cannot be certain that competitive pressures we face will not seriously harm our business. Our competitors vary in size and in the scope and breadth of the products and services they offer. In addition, we expect that there will be competition from other established and emerging companies as the market for WAN Application Delivery products continues to develop and expand.
13
Many of our current and potential competitors have longer operating histories; significantly greater financial, technical, sales and marketing resources; significantly greater name recognition; and a larger installed base of customers than we do. Such competitors also may have well-established relationships with our current and potential customers and extensive knowledge of our industry. As a result, those competitors may be able to respond more quickly to new or emerging technologies and changes in customer requirements, or to devote greater resources to the development, marketing, promotion and sale of their products than we can. They also may make strategic acquisitions or establish cooperative relationships among themselves or with other providers, thereby increasing their ability to provide a broader suite of products, and potentially causing customers to defer purchasing decisions. Also, larger competitors may be able to integrate some of the functionality of our products into existing infrastructure products or to bundle WAN Application Delivery products with other product offerings. Finally, they may engage in aggressive pricing strategies or discounting. Any of the foregoing may limit our ability to compete effectively in the market and adversely affect our business, financial condition and operating results.
Our acquisitions may not provide the anticipated benefits and may disrupt our existing business.
In June of 2008, we completed our acquisition of Packeteer, Inc. (“Packeteer”). We have also acquired other businesses in the past, including our acquisition of Permeo Technologies, Inc. (“Permeo”) and our acquisition of certain assets of the NetCache business from Network Appliance. It is likely we will acquire additional businesses or assets in the future. There is no guaranty that such acquisitions will yield the benefits we anticipate. The success of any acquisition is impacted by a number of factors, and may be subject to the following risks:
| | • | | inability to successfully integrate the operations, technologies, products and personnel of the acquired companies; |
| | • | | diversion of management’s attention from normal daily operations of the business; |
| | • | | loss of key employees; and |
| | • | | substantial transaction costs. |
Acquisitions may also result in risks to our existing business, including:
| | • | | dilution of our current stockholders’ percentage ownership to the extent we issue new equity; |
| | • | | assumption of additional liabilities; |
| | • | | incurrence of additional debt or a decline in available cash; |
| | • | | adverse effects to our financial statements, such as the need to make large and immediate write-offs or the incurrence of restructuring and other related expenses; |
| | • | | liability for intellectual property infringement and other litigation claims, which we may or may not be aware of at the time of acquisition; and |
| | • | | creation of goodwill or other intangible assets that could result in significant amortization expense or impairment charges. |
The occurrence of any of the above risks could seriously harm our business.
Economic uncertainty and adverse macroeconomic conditions may harm our business.
Our revenues and margins are dependent on various economic factors, including rates of inflation, currency fluctuations, energy costs, levels of consumer sentiment, and other macroeconomic factors which may impact levels of business spending. These conditions may affect corporate spending for IT products and services in specific geographies or more broadly. A decrease in corporate spending or demand for our products and services could result in:
| | • | | a reduction in our net revenue, gross margin and operating margin; |
14
| | • | | increased price competition for our products and services; |
| | • | | risk of excess and obsolete inventory; |
| | • | | higher overhead costs as a percentage of net revenue, and |
| | • | | a reduced ability to collect customer receivables. |
In addition, a significant percentage of our operating expenses are fixed in nature and based on forecasted revenue trends, which could limit our ability to mitigate the negative impact on margins in the short term.
Recent adverse economic and market conditions in the United States have resulted in delays in closing customer orders in that region, and further uncertainty or deterioration in these conditions could materially impact our business, operating results and financial condition.
Our internal investments in research and development may not yield the anticipated benefits.
The success of our business is predicated on our ability to create new products and technologies and to anticipate future market requirements and applicable industry standards. The process of developing new technologies is time consuming, complex and uncertain, and requires commitment of significant resources well in advance of being able to fully determine market requirements and industry standards. Furthermore, we may not be able to timely execute new product or technical initiatives because of errors in product planning or timing, technical difficulties that we cannot timely resolve, or a lack of appropriate resources. This could result in competitors bringing products to market before we do and a consequent decrease in our market share and net revenue. Our inability to timely and cost-effectively introduce new products and product enhancements, or the failure of these new products or enhancements to achieve market acceptance and comply with industry standards, could seriously harm our business, financial condition and operating results. Additionally, our introduction of new products and product enhancements could result in the obsolescence of previously purchased or committed inventory, potentially requiring the recording of material charges, which would reduce our net income.
Unless we develop better market awareness of our company and our products, our net revenue may not grow as anticipated.
We are a relatively new entrant in the WAN Application Delivery market and, in our opinion, have not yet established sufficient market awareness of our participation in that market. Market awareness of our capabilities and products is essential to our continued growth and our success in all of our markets, particularly in the WAN Application Delivery market. If our advertising and marketing programs are not successful in creating market awareness of our company and products, our business, financial condition and results of operations will be adversely affected, and we will not be able to achieve sustained growth.
If the market for WAN Application Delivery products does not develop as we anticipate, we may not be able to achieve an acceptable increase of our net revenue, and the price of our stock may decline.
We have increasingly invested in and focused on the WAN Application Delivery market. However, that is a new and rapidly evolving market. If this market fails to grow as we anticipate, or grows more slowly than we anticipate, we may not be able to sell as many of our WAN Application Delivery products as we currently project, which would result in a decline in our anticipated net revenue and could result in a decline in our stock price.
Third party product developments may impact the value of our products to users.
Our WAN Application Delivery appliances are purchased to secure, accelerate and control the delivery of third party software applications and content. It is possible that the providers of software applications and operating systems which operate with the software applications and content accelerated by our appliances may
15
enhance the performance of their software, such that further acceleration of affected applications and content is not necessary. This would make our products less valuable to users of that software. In addition, manufacturers of hardware or software may incorporate functionality similar to that offered by our WAN Application Delivery or Secure Web Gateway products directly into their products, which would make our products less valuable to users of those products. Any of the foregoing may limit our ability to sell our products and adversely affect our business, financial condition and operating results.
Forecasting our estimated annual effective tax rate is complex and subject to uncertainty, and material differences between forecasted and actual tax rates could have a material impact on our results of operations.
Forecasts of our income tax position and effective tax rate are complex and subject to uncertainty because our income tax position for each year combines the effects of a mix of profits and losses earned by us and our subsidiaries in various tax jurisdictions with a broad range of income tax rates, as well as changes in the valuation of deferred tax assets and liabilities, the impact of various accounting rules and changes to these rules, the results of examinations by various tax authorities, and the impact of any acquisition, business combination or other reorganization or financing transaction. To forecast our global tax rate, we estimate our pre-tax profits and losses by jurisdiction and calculate our tax expense by jurisdiction. If the mix of profits and losses, our ability to use tax credits, or effective tax rates by jurisdiction is different than those estimated, our actual tax rate could be materially different than forecasted, which could have a material impact on our results of operations.
In addition, we may be subject to examination of our income tax returns by the Internal Revenue Service and other tax authorities. While we regularly assess the likelihood of adverse outcomes from such examinations and the adequacy of our provision for income taxes, there can be no assurance that such provision is sufficient and that a determination by a tax authority will not have an adverse effect on our results of operations.
We issued convertible notes and warrants to fund our acquisition of Packeteer which could impact our liquidity.
We issued warrants and zero coupon senior convertible notes in an aggregate principal amount of $80 million that mature in 2013, in order to acquire Packeteer. If these notes are not converted prior to maturity we will be required to repay the principal amount, and may not have funds available to do so. As well, the notes contain certain conditions of default and, should a default occur, the holders of the notes may be able to require early payment of the notes.
If we are unable to raise additional capital, our business could be harmed.
We believe that our available cash, cash equivalents and short term investments will enable us to meet our capital requirements for at least the next 12 months. However, if cash is required for unanticipated needs, we may need additional capital during that period. The development and marketing of new products, the investment in our sales and marketing efforts, and the integration of the Packeteer business will require a significant commitment of resources. If the market for our products develops at a slower pace than anticipated, we could be required to raise substantial additional capital. We cannot be certain that additional capital will be available to us on favorable terms, or at all. If we were unable to raise additional capital when required, our business could be seriously harmed.
We have a history of losses and profitability could be difficult to sustain.
While we have been profitable in certain quarters, we have not been able to maintain consistent profitability on a quarterly basis. Although we were profitable in all four quarters of fiscal 2008, we were not profitable in three of the four fiscal quarters in fiscal 2007, and may not be profitable on a quarterly or annual basis in the future. Our ability to achieve, sustain or increase profitability on a quarterly or annual basis will be affected by changes in our business and the demand for our products and services. We expect our operating expenses to
16
increase as we endeavor to grow revenue, and we anticipate that we will make investments in our business. Our results of operations will be harmed if our revenue does not increase at a rate commensurate with the rate of increase in our expenses. If our revenue is less than anticipated or if our operating expenses exceed our expectations or cannot be adjusted quickly and efficiently, we may continue to experience losses on a quarterly and annual basis.
We must attract, assimilate and retain key personnel on a cost-effective basis, or our ability to execute our business strategy and generate sales could be harmed.
We depend on key management, research and development, and sales personnel, and our ability to attract and retain highly qualified and skilled personnel on an ongoing basis. Our success will depend in part on our ability to recruit and retain key personnel.
We have seen an increase in competition with respect to cash and equity compensation offered by employers in the Silicon Valley, and in other areas where we have operations, that may make it more difficult to attract and retain highly qualified employees. The majority of our employees, including our senior management personnel, are employed on an “at-will” basis, which may make it easier for key employees to leave us and move to new employment. Our inability to timely hire replacement or additional employees may impact our operations, since new hires frequently require extensive training before they achieve desired levels of productivity. This may affect our ability to grow our net revenue. In particular, new sales personnel typically take a number of months to achieve acceptable productivity and generate the expected level of sales.
We rely significantly on third party sales channel partners to sell our products.
A significant amount of our revenue is generated through sales by our sales channel partners, which include distributors and resellers. During fiscal 2008, approximately 96.4% of our revenue was generated through our indirect sales channels. We depend upon these partners to generate sales opportunities and to independently manage the sales process for opportunities with which they are involved. In order to increase our net revenue, we will need to maintain our existing sales channel partners and add new sales channel partners and effectively train and integrate them with our sales process. If we are unsuccessful in those efforts, our business will not grow and our operating results will be adversely affected.
Our products are complex, and there can be no assurance that the sales training programs that are offered to our sales channel partners will be effective. In addition, our sales channel partners may be unsuccessful in marketing, selling and supporting our products and services for reasons unrelated to training. Most of our sales channel partners do not have minimum purchase or resale requirements, and may cease selling our products at any time. They may also market, sell and support products and services that are competitive with ours, and may devote more resources to the marketing, sales and support of products competitive to ours. There is no assurance that we will retain these sales channel partners or that we will be able to secure additional or replacement sales channel partners in the future. The loss of one or more of our key sales channel partners in a given geographic area could harm our operating results within that area, as new sales channel partners typically require extensive training and take several months to achieve acceptable productivity.
We also depend on many of our sales channel partners to deliver first line service and support for our products. Any significant failure on their part to provide such service and support could impact customer satisfaction and future sales of our products. In addition, we recognize a portion of our revenue based on a sell-through model using information provided by our sales channel partners. If we are provided with inaccurate or untimely information, the amount, timing or accuracy of our reported net revenue could be affected.
17
If we are unable to establish fair value for any undelivered element of a customer order, revenue relating to the entire order may be deferred until the revenue recognition criteria for all elements of the customer order are met. This could lower our net revenue in one period and increase it in future periods, resulting in greater variability in net revenue and income period to period.
In the course of our sales efforts, we often enter into arrangements with our customers that require us to deliver a combination of different appliances, software products or services. We refer to each individual appliance, software product or service as an “element” of the overall arrangement with our customer. In some cases, these arrangements may require us to deliver particular elements in a future period. We do not recognize revenue on any element until it has been delivered. In addition, we do not recognize revenue on any delivered element until we can determine the fair value of all undelivered elements in the arrangement. If evidence of the fair value of one or more undelivered elements does not exist, all revenue is generally deferred and recognized at the earlier of when delivery of those elements occurs or when fair value can be determined. When the undelivered element for which we do not have a fair value is maintenance, revenue for the entire arrangement is recognized ratably over the maintenance period. As a result, a portion of the revenue we recognize in each quarter could relate to previously delivered products. Consequently, an increase in the number of multiple element arrangements with undelivered elements for which we cannot determine the fair value would negatively impact our net revenue in the current period, while increasing net revenue in future periods. In addition, we may not adjust our cost structure commensurately with the reduction in net revenue recognized in the current period, which would reduce our income for the current period. If there is a significant increase in sales related to multiple element arrangements with undelivered elements for which we cannot determine the fair value, we may not meet current revenue expectations since revenue associated with such arrangements will be recognized in future periods.
We are dependent on original design manufacturers and contract manufacturers to design and manufacture our products, and changes to those relationships, expected or unexpected, may result in delays or disruptions that could cause us to lose revenue and damage our customer relationships.
We depend primarily on original design manufacturers (each of whom is a third party original design manufacturer for numerous companies) to co-design and co-develop the hardware platform for our products. We also depend on independent contract manufacturers (each of whom is a third party manufacturer for numerous companies) to manufacture our products and the assemblies and components contained in our products. These manufacturers are not committed to design or manufacture our products on a long-term basis in any specific quantity or at any specific price. Also, from time to time, we may be required to add new manufacturers or manufacturing sites to accommodate growth in orders or the addition of new products. It is time consuming and costly to qualify and implement new original design manufacturer and contract manufacturer relationships and sites, and such additions increase the complexity of our supply chain management. Our ability to ship products to our customers could be delayed if we fail to effectively manage our contract manufacturer relationships; if one or more of our design manufacturers does not meet our development schedules; if one or more of our contract manufacturers experiences delays, disruptions or quality control problems in manufacturing our products; or if we are required to add or replace design manufacturers or contract manufacturers or sites. In addition, these manufacturers have access to certain of our critical intellectual property and could wrongly disclose or misappropriate such property. Moreover, an increasing portion of our manufacturing is performed in China and Taiwan and other countries and is, therefore, subject to risks associated with doing business in those countries. Each of these factors could adversely affect our business, financial condition and operating results.
If we fail to accurately predict our manufacturing requirements and manage our supply chain we could incur additional costs or experience manufacturing delays that could harm our business.
We provide forecasts of our requirements to our contract manufacturers on a rolling 12-month basis. If our forecast exceeds our actual requirements, the contract manufacturers may assess charges or we may have liability for excess inventory, each of which could negatively affect our gross margin. If our forecast is less than our
18
actual requirements, the contract manufacturers may have insufficient time and components to produce our product requirements, which could delay or interrupt manufacturing of our products and result in delays in shipments, customer dissatisfaction, and deferral or loss of revenue. As well, we may be required to purchase sufficient inventory to satisfy our future needs in situations where a component is being discontinued. If we fail to accurately predict our requirements, we may become liable for excess inventory that we and our contract manufacturers cannot use or we may be unable to fulfill customer orders. Any of the foregoing could adversely affect our business, financial condition and operating results.
We depend on single and, in some cases, sole and limited source suppliers for several key components, so our business is susceptible to shortages, unavailability, or price fluctuations.
We have limited sources of supply for certain key components of our products, which exposes us to the risk of component shortages or unavailability. In addition, we are unable to rapidly change quantities and delivery schedules because the procurement of certain components is subject to lengthy lead times and the qualification of additional or alternate sources is time consuming, costly and difficult. In the event our business growth exceeds our projections, or required components are otherwise in scarce supply, we may be subject to shortages, delays or unavailability of such components, or potential price increases, which may be substantial. If we are unable to secure sufficient components at reasonable prices in order to timely build our products, customer shipments may be delayed. This would adversely affect both our relationships with those customers and our net revenue. Alternatively, we may pay increased prices, which would impact our gross margin. Any of the foregoing could adversely affect our business, financial condition and operating results.
Our gross margin is affected by a number of factors, and may be below our expectations or the expectations of investors and analysts, which could cause a decline in our stock price.
Our gross margin percentage has been and will continue to be affected by a variety of factors, including:
| | • | | market acceptance of our products and fluctuations in demand; |
| | • | | the timing and size of customer orders and product implementations; |
| | • | | increased price competition and changes in product pricing; |
| | • | | actions taken by our competitors; |
| | • | | new product introductions and enhancements; |
| | • | | manufacturing and component costs; |
| | • | | availability of sufficient inventory to meet demand; |
| | • | | purchase of inventory in excess of demand; |
| | • | | our execution of our strategy and operating plans; |
| | • | | changes in our sales model; |
| | • | | geographies in which sales are made; and |
| | • | | revenue recognition rules. |
For example, we have in the past entered into large revenue transactions with certain customers that, because of the product mix and volume discount, have decreased our gross margin percentage. We may, in the future, enter into similar transactions. As well, our lower end appliances have lower margins than our higher end appliances, and if our customers submit a large order or orders for our lower end appliances, the combination of lower margins and the volume discount provided to those customers would negatively impact our gross margin percentage.
19
Even if we achieve our net revenue and operating expense objectives, our net income and operating results may be below our expectations and the expectations of investors and analysts if our gross margins are below expectations. This could cause our stock price to decline.
Our international operations expose us to risks.
We currently have operations in a number of foreign countries. In fiscal 2008, 53.2% of our total net revenue was derived from customers outside of North America; thus, our business is substantially dependent on economic conditions and IT spending in markets outside North America. The expansion of our international operations and entry into additional international markets requires significant management attention and financial resources, and subjects us to certain inherent risks including:
| | • | | technical difficulties and costs associated with product localization; |
| | • | | challenges associated with coordinating product development efforts among geographically dispersed areas; |
| | • | | potential loss of proprietary information due to piracy, misappropriation, or laws that may be less protective of our intellectual property rights; |
| | • | | our limited experience in establishing a sales and marketing presence, together with the appropriate internal systems, processes and controls, in certain geographic markets; |
| | • | | longer payment cycles for sales in certain foreign countries; |
| | • | | seasonal reductions in business activity in the summer months in Europe and at other times in various countries; |
| | • | | the significant presence of some of our competitors in some international markets; |
| | • | | potentially adverse tax consequences; |
| | • | | import and export restrictions and tariffs and other trade protection initiatives; |
| | • | | potential failures of our foreign employees to comply with both U.S. and foreign laws, including antitrust laws, trade regulations and the Foreign Corrupt Practices Act; |
| | • | | compliance with foreign laws and other government controls, such as those affecting trade, privacy, the environment and employment; |
| | • | | management, staffing, legal and other costs of operating an enterprise spread over various countries; |
| | • | | fluctuations in foreign exchange rates; |
| | • | | political or economic instability, war or terrorism in the countries where we are doing business; and |
| | • | | fears concerning travel or health risks that may adversely affect our ability to sell our products and services in any country in which the business sales culture encourages face-to-face interactions. |
To the extent we are unable to effectively manage our international operations and these risks, our international sales may be adversely affected, we may incur additional and unanticipated costs, and we may be subject to litigation or regulatory action. As a consequence, our business, financial condition and operating results could be seriously harmed.
The matters relating to our historical stock granting practices and the restatement of our consolidated financial statements in March 2007 have required us to incur substantial expenses, have resulted in litigation and regulatory inquiries, and may result in additional litigation, regulatory proceedings and governmental enforcement actions.
Our historical stock granting practices and the consequent restatement of our financial statements have exposed us to greater risks associated with litigation, regulatory and government enforcement actions. On
20
March 28, 2007, in our Form 10-K for the year ended April 30, 2006, we restated our consolidated financial statements as of April 30, 2005, and for the years ended April 30, 2005 and 2004, to correctly account for stock option grants for which we had determined that the measurement date for accounting purposes was different from the stated grant date (the “March 2007 Restatement”). In addition, we also restated our selected consolidated financial data as of and for the years ended April 30, 2005, 2004, 2003 and 2002, and the unaudited quarterly financial data for each of the quarters in the years ended April 30, 2006 and 2005, with the exception of the fourth quarter of fiscal 2006 (which had not then been filed). For more information on these matters, see Item 7, “Management’s Discussion and Analysis of Financial Condition and Results of Operations—Background of the Stock Option Investigation, Findings, Restatement of Consolidated Financial Statements, Remedial Measures and Related Proceedings,” and Item 9A, “Controls and Procedures” in our Annual Report on Form 10-K for the year ended April 30, 2006, and Item 2, “Management’s Discussion and Analysis of Financial Condition and Results of Operations—Background of the Stock Option Investigation, Findings, Restatement of Consolidated Financial Statements, Remedial Measures and Related Proceedings,” and Item 4, “Controls and Procedures,” on Form 10-Q for the quarter ended January 31, 2007, each of which was filed with the SEC on March 28, 2007.
The matters addressed in the March 2007 Restatement have exposed us to greater risks associated with litigation, regulatory proceedings and government enforcement actions. As described in Note 10 of Notes to Consolidated Financial Statements, multiple derivative complaints have been filed in state and federal courts against our directors and certain of our executive officers pertaining to allegations relating to stock option grants, and certain proceedings with respect to such matters are ongoing at the SEC and the U.S. Attorney’s Office for the Northern District of California. We also may become the subject of, or otherwise be required to incur legal fees and costs in connection with, additional private litigation, regulatory proceedings, or government enforcement actions in connection with the March 2007 Restatement. No assurance can be given regarding the outcomes of such activities or that such outcomes will be consistent with the findings of our Special Committee reported in our Annual Report on Form 10-K for the year ended April 30, 2006. The resolution of these matters has been, and will continue to be, time consuming and expensive, and will distract management from the conduct of our business. Our available directors’ and officers’ liability insurance may not be sufficient to cover our legal expenses or those of persons we are obligated to indemnify, and may not cover all items for which we must procure representation or for which we are obligated to provide indemnification. Furthermore, if we are subject to adverse findings in litigation, regulatory proceedings or government enforcement actions, we could be required to pay damages or penalties or have other remedies imposed, which could harm our business, financial condition, results of operations and cash flows. In addition, the March 2007 Restatement and the related litigation and regulatory proceedings, and any negative outcome that may occur from them, could impact our relationships with customers and our ability to generate future net revenue.
In fiscal 2008, we continued to incur substantial expenses for legal, accounting, tax and other professional services related to the matters addressed above. In addition, we incurred expenses in connection with our resolution of issues related to the March 2007 Restatement that affected our international and domestic employees, including payment of taxes due under Internal Revenue Code Section 409A.
We may not be able to successfully manage the growth of our business if we are unable to improve our internal systems, processes and controls.
Our growth, as well as recent regulatory requirements and changes in financial standards, has placed increased demands on our management and our infrastructure. The acquisition of Packeteer, or any other acquisitions we may make, also will place increased demands on us. We need to continue to improve our internal systems, processes and controls to effectively manage our operations and growth, including our international growth into new geographies. We may not be able to successfully implement improvements to these systems, processes and controls in a timely or efficient manner, and we may discover deficiencies in existing systems, processes and controls. Our failure to improve our systems, processes and controls may result in our inability to manage the growth of our business and to accurately forecast our revenue, expenses and earnings, which could adversely affect our business, financial condition, operating results and stock price.
21
We rely on technology that we license from third parties, including software that is integrated with internally developed software and used with our products.
We rely on technology that we license from third parties, including third party software and open source software that is used with certain of our products. If we are unable to continue to license any of this software on commercially reasonable terms, we will face delays in releases of our software or we will be required to delete this functionality from our software until equivalent technology can be licensed or developed and integrated into our current product. In addition, the inability to obtain certain licenses or other rights might require us to engage in litigation regarding these matters, which could have a material adverse effect on our financial condition. Any of these developments could seriously harm our business.
Undetected product errors, or failures found in new products may result in a loss of or delay in market acceptance of our products, which could cause us to incur significant costs, reduce our sales or result in litigation.
Our products are highly complex and may contain undetected operating errors when first introduced or as new versions or enhancements are released. Despite testing by us and by current and potential customers, errors may not be found in new products or new versions until after commencement of commercial shipments, resulting in customer dissatisfaction and loss of or delay in market acceptance and sales opportunities. This could materially adversely affect our operating results. These errors could also cause us to incur significant warranty and repair costs, divert the attention of our engineering personnel from our product development efforts and cause significant customer relations problems. In addition, all of our products operate on our internally developed operating system. As a result, any error in the operating system will affect all of our products. We have experienced minor errors in the past in connection with new products and enhancements to existing products. We expect that errors will be found from time to time in new or enhanced products after commencement of commercial shipments, which could seriously harm our business.
Since our end user customers install our appliances directly into their network infrastructures, any errors, defects or other performance problems with our products could negatively impact their networks or other Internet users, resulting in financial or other losses. While we typically seek by contract to limit our exposure to damages, it is possible that such limitations might not exist or might not be enforced in the event of a product liability claim. Moreover, a product liability claim brought against us, even if not successful, would likely be time-consuming and costly and could seriously harm our business reputation.
We are the target of various litigation and regulatory proceedings, which could result in substantial costs, divert management attention and resources, and have a material adverse effect on our results of operations or financial position.
As described in Note 10 of Notes to Consolidated Financial Statements, we are a party to various litigation, including class action litigation arising out of our initial public offering in 1999 and stockholder derivative actions arising out of allegedly misleading statements about our prospects made between February 20, 2004 and May 27, 2004, which actions were subsequently amended to seek relief on our behalf from certain defendants with respect to our historical stock option practices.
As described in Note 10 of Notes to Consolidated Financial Statements, we are the subject of inquiries and investigations conducted by the SEC and the U.S. Attorney’s Office for the Northern District of California.
Any material litigation and regulatory proceeding inevitably results in the diversion of our management’s attention and expenditure of our resources. As well, any negative result or publicity could have a material adverse effect on our results of operations and financial condition.
22
If the protection of our proprietary technology is inadequate, our competitors may gain access to our technology, and our market share could decline.
Our success is heavily dependent on our ability to create proprietary technology and to protect and enforce our intellectual property rights in that technology, as well as our ability to defend against adverse claims of third parties with respect to our technology and intellectual property. To protect our proprietary technology, we rely primarily on a combination of contractual provisions, confidentiality procedures, trade secrets, copyright and trademark laws, and patents. Despite our efforts to protect our proprietary rights, unauthorized parties may attempt to copy aspects of our products or obtain and use information that we regard as proprietary. Policing unauthorized use of our products is difficult. In addition, the laws of some foreign countries do not protect our proprietary rights to as great an extent as do the laws of the United States. Our means of protecting our proprietary rights may not be adequate and unauthorized third parties, including our competitors, may independently develop similar or superior technology, duplicate or reverse engineer aspects of our products, or design around our patented technology or other intellectual property.
As of April 30, 2008, we had 18 issued U.S. patents, 34 pending U.S. patent applications (provisional and non-provisional), and 1 pending foreign patent application.There can be no assurance that any of our pending patent applications will issue or that the patent examination process will not result in our narrowing the claims applied for. Furthermore, there can be no assurance that we will be able to detect any infringement of our existing or future patents (if any) or, if infringement is detected, that our patents will be enforceable or that any damages awarded to us will be sufficient to adequately compensate us.
There can be no assurance or guarantee that any products, services or technologies that we are presently developing, or will develop in the future, will result in intellectual property that is subject to legal protection under the laws of the United States or a foreign jurisdiction and that produces a competitive advantage for us.
Third parties could assert that our products infringe their intellectual property rights.
Third parties have in the past and may in the future claim that our current or future products infringe their intellectual property rights, and these claims, even if without merit, could harm our business by increasing our costs, reducing our net revenue or by creating customer concerns that result in reduced sales. This is particularly true in the patent area, as an increasing number of U.S. patents covering computer networking and Internet technology have been issued in recent years. Patent owners, including those that do not commercially manufacture or sell products, may claim that one or more of our products infringes a patent they own. For example, on or about April 18, 2008, Realtime Data, LLC d/b/a IXO filed a patent infringement lawsuit against Packeteer, Inc., a company we acquired on June 6, 2008, and subsequently amended the complaint and named us as a defendant on June 20, 2008, (see Note 10 in the Consolidated Financial Statements).
We expect that companies in the Internet and networking industries will increasingly be subject to infringement claims as the number of products and competitors in our industry segment grows and the functionality of products in different industry segments overlaps. Any such claims could be time-consuming, result in costly litigation, cause product shipment delays or require us to enter into royalty or licensing agreements. Royalty or licensing agreements, if required, may not be available on terms acceptable to us or at all, which could seriously harm our business.
The market price of our stock is volatile, and is likely to be volatile in the future.
Since our initial public offering, the market price of our common stock has experienced significant fluctuations and is likely to continue to fluctuate significantly. Such volatility in the trading price of our stock can occur in response to general market conditions, changes in the IT or technology market generally or changes in the specific markets in which we operate, and cause an increase or decline in our stock price without regard to our operating performance. The market price of our common stock could decline quickly and significantly if we
23
fail to achieve our guidance or if our performance fails to meet the expectation of public market analysts or investors.
The market price of our common stock may fluctuate significantly in response to the following factors, among others:
| | • | | variations in our quarterly operating results; |
| | • | | changes in financial estimates or investment recommendations by securities analysts; |
| | • | | changes in macroeconomic conditions; |
| | • | | the introduction of new products by our competitors; |
| | • | | our ability to keep pace with changing technological requirements; |
| | • | | changes in market valuations of Internet-related and networking companies; |
| | • | | announcements by us or our competitors of significant contracts, acquisitions, strategic partnerships, joint ventures or capital commitments; |
| | • | | loss of a major customer; |
| | • | | additions or departures of key personnel; |
| | • | | fluctuations in stock market volumes; |
| | • | | investor confidence in our stock, technology stocks and the stock market in general; |
| | • | | speculation in the press or investment communication about our strategic position, financial condition, results of operations, or business; |
| | • | | significant transactions; and |
| | • | | regulatory or litigation matters. |
It is not uncommon for securities class actions or other litigation to be brought against a company after periods of volatility in the market price of a company’s stock, and we have been subject to such litigation in the past. Such actions could result in management distraction and expense and, further, result in a decline in our stock price.
We are subject to governmental export and import controls that could subject us to liability or impair our ability to compete in international markets.
Our products are subject to U.S. export controls and may be exported outside the U.S. only with the required level of export license or under an export license exception, because we incorporate encryption technology into our products. In addition, various countries regulate the import of certain encryption technology and have enacted laws that could limit our ability to distribute our products or could limit our customers’ ability to implement our products in those countries. Changes in our products or changes in export and import regulations may create delays in the introduction of our products in international markets, prevent our customers with international operations from deploying our products globally or, in some cases, prevent the export or import of our products to certain countries altogether. Any change in export or import regulations or related legislation, shift in the enforcement or scope of existing regulations, or change in the countries, persons or technologies targeted by such regulations, could result in decreased use of our products by, or in our decreased ability to export or sell our products to, existing or potential customers with international operations. Any decreased use of our products or limitation on our ability to export or sell our products would likely adversely affect our business, financial condition and operating results.
24
Our operations could be significantly hindered by the occurrence of a natural disaster, terrorist attack or other catastrophic event.
Our business operations are susceptible to outages due to fire, floods, power loss, telecommunications failures, terrorist attacks and other events beyond our control. In addition, a substantial portion of our facilities, including our headquarters, are located in Northern California, an area susceptible to earthquakes. We do not carry earthquake insurance for earthquake-related losses. Despite our implementation of network security measures, our servers are vulnerable to computer viruses, break-ins, and similar disruptions from unauthorized tampering with our computer systems. We may not carry sufficient business interruption insurance to compensate us for losses that may occur as a result of any of these events. To the extent that such events disrupt our business or adversely impact our reputation, such events could adversely affect our operating results and financial condition.
The legal environment in which we operate is uncertain and claims against us could cause our business to suffer.
Our products operate in part by storing material available on the Internet and making this material available to end users from our appliance. As well, our appliance may be used to block content from being accessed. This creates the potential for claims to be made against us, either directly or through contractual indemnification provisions with our customers, for defamation, negligence, intellectual property infringement, personal injury, censorship, invasion of privacy or other legal theories based on the nature, content, copying or modification of this content. As of April 30, 2008, we have not accrued any liabilities relating to indemnification provisions with our customers. It is also possible that if any information provided through any of our products contains errors, third parties could make claims against us for losses incurred in reliance on this information. Our insurance may not cover potential claims of this type or be adequate to protect us from all liability that may be imposed.
Item 1B.Unresolved Staff Comments
None.
Item 2.Properties
We are headquartered in Sunnyvale, California, where we lease two buildings consisting of an aggregate of approximately 234,000 square feet of office space pursuant to leases effective through November 2015. The second building was leased subsequent to our fiscal year end under a First Amendment to Lease, which added the additional premises and extended the term of the lease. As a result of our acquisition of Packeteer subsequent to our fiscal year end, we also lease an administrative office consisting of approximately 105,000 square feet in Cupertino, California, under a lease expiring in December 2014. We also lease space for research and development in Draper, Utah; Austin, Texas; Waterloo, Ontario in Canada; and Riga, Latvia. In addition, we lease space for sales and support in several metropolitan areas in North America and in several other countries outside the United States.
We believe that our existing facilities are adequate to meet our current requirements, and that suitable additional or substitute space will be available, if necessary.
Item 3.Legal Proceedings
The information set forth under Note 10 of Notes to Consolidated Financial Statements, included in Part II, Item 8 of this Report, is incorporated herein by reference. For an additional discussion of certain risks associated with legal proceedings, see the section entitled “Risk Factors” in Item 1A of this Report.
Item 4.Submission of Matters to a Vote of Security Holders
None.
25
PART II.
Item 5.Market for Registrant’s Common Equity, Related Stockholder Matters and Issuer Purchases of Equity Securities
Price Range of Common Stock
Our common stock has been quoted on The NASDAQ Stock Market since November 19, 1999, and we are currently traded under the symbol “BCSI.” The following table sets forth, for the periods indicated, the high and low closing prices of our common stock as reported on the NASDAQ Stock Market.
| | | | | | |
| | | High | | Low |
For the year ended April 30, 2008: | | | | | | |
First Quarter | | $ | 27.77 | | $ | 17.10 |
Second Quarter | | $ | 51.56 | | $ | 24.68 |
Third Quarter | | $ | 39.20 | | $ | 24.58 |
Fourth Quarter | | $ | 29.58 | | $ | 19.50 |
For the year ended April 30, 2007: | | | | | | |
First Quarter | | $ | 11.27 | | $ | 6.84 |
Second Quarter | | $ | 11.38 | | $ | 6.44 |
Third Quarter | | $ | 13.04 | | $ | 10.93 |
Fourth Quarter | | $ | 19.34 | | $ | 12.94 |
At April 30, 2008, there were 505 stockholders of record and the price of our common stock was $21.11. We believe that a significant number of beneficial owners of our common stock hold shares in street name.
Dividend Policy
Our present policy is to retain earnings, if any, to finance future growth. We have never paid cash dividends and have no present intention to pay cash dividends.
26
Stock Performance Graph
The following graph compares the cumulative five-year total return provided shareholders on our common stock relative to the cumulative total returns of the NASDAQ Composite index and the NASDAQ Computer Manufacturers index. An investment of $100 (with reinvestment of all dividends) is assumed to have been made in our common stock and in each of the indexes on April 30, 2003 and its relative performance is tracked through April 30, 2008.
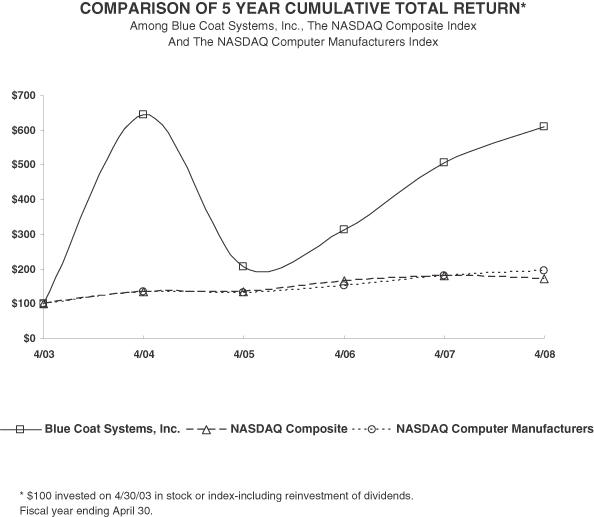
| | | | | | | | | | | | | | | | | | |
| | | 4/03 | | 4/04 | | 4/05 | | 4/06 | | 4/07 | | 4/08 |
Blue Coat Systems, Inc. | | $ | 100.00 | | $ | 646.25 | | $ | 208.70 | | $ | 315.36 | | $ | 508.12 | | $ | 611.88 |
NASDAQ Composite | | | 100.00 | | | 134.18 | | | 134.93 | | | 165.79 | | | 181.16 | | | 173.24 |
NASDAQ Computer Manufacturers | | | 100.00 | | | 134.03 | | | 131.10 | | | 151.30 | | | 180.32 | | | 194.76 |
The stock price performance included in this graph is not necessarily indicative of future stock price performance.
27
Sale of Convertible Notes and Warrants
On April 20, 2008, we entered into a note purchase agreement (the “Note Purchase Agreement”) pursuant to which we agreed to sell $80 million aggregate principal amount of Zero Coupon Convertible Senior Notes due 2013 (the “Notes”) and warrants (the “Warrants”) to purchase an aggregate of 385,356 shares of common stock of Blue Coat at an exercise price of $20.76 to Manchester Securities Corp. (“Manchester”) and Francisco Partners II, L.P. (“FP”) in a private placement. The Notes do not bear interest.
On June 2, 2008, the Notes and the Warrants were issued to Manchester, FP and an entity affiliated with FP (collectively, the “Purchasers”). We offered and sold the Notes and the Warrants to the Purchasers in reliance on the exemption from registration provided by Section 4(2) of the Securities Act. We relied on this exemption from registration based in part on representations made by the Purchasers in the Note Purchase Agreement.
Significant rights and obligations of the Purchasers and holders of the Notes (“Holders”) are as follows:
Conversion feature. The Notes are initially convertible into 3,853,564 shares of Blue Coat’s common stock at the Holders’ option at any time prior to maturity at the initial conversion price of $20.76.
Senior Debt. The Notes rank equal in right of payment to all of Blue Coat’s other existing and future senior unsecured indebtedness.
Put Right. The Notes provide that if our common stock is suspended from trading or ceases to be listed on an eligible market for a period of five (5) consecutive trading days or for more than an aggregate of fifteen (15) trading days in any 365 day period, a Holder may require us to repurchase for cash all or a portion of the Note at a purchase price equal to the principal amount of the Note, plus any late fees.
Registration Rights.On June 2, 2008, pursuant to the Note Purchase Agreement, we entered into a Registration Rights Agreement with FP and an entity affiliated with FP, which contained customary terms and conditions and provided for the registration of our common stock underlying the Notes and Warrants issued to FP and the entity affiliated with FP.
Sales of Series A Redeemable Convertible Preferred Stock
On June 22, 2006, we sold an aggregate of $42.1 million of Series A Preferred Redeemable Convertible Stock (“Series A Preferred Stock”) to entities affiliated with Francisco Partners and Sequoia Capital Growth. The aggregate proceeds were reduced by $0.2 million of transactional costs, resulting in net proceeds of $41.9 million. The financing consisted of 42,060 shares of our Series A Preferred Stock.
During September 2007, the 42,060 shares of Series A Redeemable Convertible Preferred Stock were converted into 4.8 million shares of our Common Stock. The conversions were exempt from registration under Section 3(a)(9) of the Securities Act of 1933. The conversion price of each share of Series A Redeemable Convertible Preferred Stock was $8.7625 per share, such that the conversion rate of the Series A Redeemable Convertible Preferred Stock was approximately 114.12-to-1.0. The conversions resulted in a $41.9 million reduction of Series A Redeemable Convertible Preferred Stock, a $0.2 million increase in interest expense attributable to unamortized issuance costs, and a $42.1 million increase in stockholders’ equity.
On November 19, 2007, we filed a Certificate of Elimination of Series A Preferred Stock with the Delaware Secretary of State to eliminate the Series A Preferred Stock, as no shares of such series remained outstanding.
Significant rights and obligations of the Series A Preferred Stock were as follows:
Conversion feature. The 42,060 shares of Series A Preferred Stock were initially convertible at the option of the holders into approximately 4.8 million shares of our common stock. The conversion price of each share of Series A Preferred Stock was $8.7625 per share, or a conversion rate of approximately 114.12-to-1.0. Each share
28
of Series A Preferred Stock would be automatically converted into shares of Common Stock at the then effective conversion rate for such share upon the approval of the holders of at least a majority of the then-outstanding Series A Preferred Stock.
Redemption features. In the event that we did not complete an acquisition, whether by merger, consolidation, the purchase of assets or otherwise, of another entity or of certain assets of another entity, for at least $18,000,000 in cash within 150 days of June 22, 2006 (the “Closing Date”), the Series A Preferred Stock would have been redeemable at the option of either the holder or us during a 30 day period thereafter. This condition was satisfied with our acquisition of certain assets of the NetCache business from Network Appliance on September 11, 2006. The Series A Preferred Stock matured six years from the issuance and we would have been required to redeem the Series A Preferred Stock at that time. The redemption price is the price paid plus an amount equal to declared but unpaid dividends.
Liquidation preference. Upon liquidation of our business, the holders of Series A Preferred Stock would have been entitled to be paid an amount equal to the price paid, plus an amount equal to declared but unpaid dividends, before we made any distribution to the holders of any other class of stock that is junior in ranking, including our Common Stock.
Voting rights.Each holder of Series A Preferred Stock was entitled to that number of votes equal to the number of shares of Common Stock into which the shares of Series A Preferred Stock held by such holder could be converted as of the record date. The holders of shares of Series A Preferred Stock were entitled to vote on all matters on which the holders of the Common Stock were entitled to vote. In addition, until June 22, 2007, the holders of at least a majority of the then-outstanding Series A Preferred Stock, voting as a separate class, were entitled to elect one (1) director to the Board of Directors at each meeting of, or pursuant to each consent of, our stockholders for the election of directors.
Dividends.The Series A Preferred Stock participated equally with the holders of Common Stock in all dividends paid on the Common Stock, when, as and if declared by the Board of Directors, out of funds legally available, as if such shares of Series A Preferred Stock had been converted to shares of Common Stock immediately prior to the record date for the payment of such dividend. No dividends were declared during such time as the Series A Preferred Stock existed.
Purchases of Equity Securities by the Issuer and Affiliated Purchasers
None.
29
Item 6.Selected Consolidated Financial Data
The following tables set forth our selected consolidated balance sheet data as of April 30, 2008, 2007, 2006, 2005, 2004 and our statement of operations data for each of the five years ended April 30, 2008. The selected consolidated financial statement data include the results of operations of acquired businesses commencing on their respective acquisition dates.
The tables below should be read in conjunction with, and are qualified by reference to, “Management’s Discussion and Analysis of Financial Condition and Results of Operations” and our consolidated financial statements and related notes, which are included in this Form 10-K.
Except for per share information, amounts reported below are in thousands.
| | | | | | | | | | | | | | | | | | | | |
| | | Year Ended April 30, | |
| | | 2008 | | | 2007 | | | 2006 | | | 2005 | | | 2004 | |
Consolidated Statements of Operations | | | | | | | | | | | | | | | | | | | | |
Net revenue: | | | | | | | | | | | | | | | | | | | | |
Product | | $ | 233,858 | | | $ | 136,770 | | | $ | 116,083 | | | $ | 78,495 | | | $ | 52,251 | |
Service | | | 71,581 | | | | 40,930 | | | | 25,639 | | | | 17,691 | | | | 13,817 | |
| | | | | | | | | | | | | | | | | | | | |
Total net revenue | | | 305,439 | | | | 177,700 | | | | 141,722 | | | | 96,186 | | | | 66,068 | |
Cost of net revenue: | | | | | | | | | | | | | | | | | | | | |
Product (1) | | | 48,056 | | | | 31,779 | | | | 33,207 | | | | 25,726 | | | | 17,214 | |
Service (1) | | | 23,389 | | | | 13,969 | | | | 9,841 | | | | 5,784 | | | | 4,142 | |
| | | | | | | | | | | | | | | | | | | | |
Total cost of net revenue | | | 71,445 | | | | 45,748 | | | | 43,048 | | | | 31,510 | | | | 21,356 | |
Gross profit | | | 233,994 | | | | 131,952 | | | | 98,674 | | | | 64,676 | | | | 44,712 | |
Operating expenses: | | | | | | | | | | | | | | | | | | | | |
Research and development (1) | | | 51,587 | | | | 39,882 | | | | 26,785 | | | | 17,881 | | | | 13,454 | |
Sales and marketing (1) | | | 128,927 | | | | 73,083 | | | | 52,829 | | | | 35,334 | | | | 25,664 | |
General and administrative (1) | | | 27,909 | | | | 28,072 | | | | 13,593 | | | | 6,703 | | | | 8,149 | |
In-process technology (2) | | | — | | | | — | | | | 3,300 | | | | — | | | | 151 | |
Amortization of intangible assets (3) | | | 450 | | | | 619 | | | | 706 | | | | 648 | | | | 305 | |
Restructuring reversal (4) | | | — | | | | (19 | ) | | | (48 | ) | | | (96 | ) | | | 1,536 | |
Legal settlement | | | — | | | | — | | | | — | | | | — | | | | 1,100 | |
| | | | | | | | | | | | | | | | | | | | |
Total operating expense | | | 208,873 | | | | 141,637 | | | | 97,165 | | | | 60,470 | | | | 50,359 | |
| | | | | | | | | | | | | | | | | | | | |
Operating income (loss) | | | 25,121 | | | | (9,685 | ) | | | 1,509 | | | | 4,206 | | | | (5,647 | ) |
Interest income | | | 5,870 | | | | 3,922 | | | | 2,055 | | | | 691 | | | | 295 | |
Other income (expense) | | | (461 | ) | | | (311 | ) | | | (349 | ) | | | (124 | ) | | | 115 | |
| | | | | | | | | | | | | | | | | | | | |
Income (loss) before income taxes | | | 30,530 | | | | (6,074 | ) | | | 3,215 | | | | 4,773 | | | | (5,237 | ) |
Provision (benefit) for income taxes | | | (2,038 | ) | | | 1,124 | | | | 275 | | | | 117 | | | | 124 | |
| | | | | | | | | | | | | | | | | | | | |
Net income (loss) | | $ | 32,568 | | | $ | (7,198 | ) | | $ | 2,940 | | | $ | 4,656 | | | $ | (5,361 | ) |
| | | | | | | | | | | | | | | | | | | | |
Net income (loss) per common share: | | | | | | | | | | | | | | | | | | | | |
Basic | | $ | 0.93 | | | $ | (0.25 | ) | | $ | 0.11 | | | $ | 0.20 | | | $ | (0.27 | ) |
| | | | | | | | | | | | | | | | | | | | |
Diluted | | $ | 0.82 | | | $ | (0.25 | ) | | $ | 0.10 | | | $ | 0.18 | | | $ | (0.27 | ) |
| | | | | | | | | | | | | | | | | | | | |
Weighted average shares used in computing net income (loss) per common share: | | | | | | | | | | | | | | | | | | | | |
Basic | | | 35,179 | | | | 29,188 | | | | 25,930 | | | | 23,256 | | | | 19,912 | |
| | | | | | | | | | | | | | | | | | | | |
Diluted | | | 39,659 | | | | 29,188 | | | | 29,284 | | | | 25,816 | | | | 19,912 | |
| | | | | | | | | | | | | | | | | | | | |
30
| | | | | | | | | | | | | | | |
| | | As of April 30, |
| | | 2008 | | 2007 | | 2006 | | 2005 | | 2004 |
Consolidated Balance Sheet Data | | | | | | | | | | | | | | | |
Cash, cash equivalents and short-term investments | | $ | 162,178 | | $ | 93,887 | | $ | 57,190 | | $ | 47,264 | | $ | 39,504 |
Investment in Packeteer, Inc. | | | 25,092 | | | — | | | — | | | — | | | — |
Working capital | | | 123,561 | | | 66,394 | | | 40,725 | | | 34,213 | | | 26,683 |
Total assets | | | 387,768 | | | 248,674 | | | 164,164 | | | 97,862 | | | 67,669 |
Series A redeemable convertible preferred stock | | | — | | | 41,879 | | | — | | | — | | | — |
Other long-term liabilities | | | 23,915 | | | 16,489 | | | 10,130 | | | 4,232 | | | 5,289 |
Total stockholders’ equity | | | 251,461 | | | 118,589 | | | 109,958 | | | 65,228 | | | 36,061 |
| (1) | Includes stock-based compensation expense. |
| (2) | Acquired in-process technology relates to certain research and development projects assumed in the Permeo and Ositis acquisitions in fiscal 2006 and fiscal 2004, respectively, that had not yet reached technological feasibility and were deemed to have no alternative future use. |
| (3) | Amortization of intangible assets relates to identifiable intangible assets obtained through the NetCache, Permeo, Cerberian and Ositis acquisitions on September 11, 2006, March 3, 2006, November 16, 2004 and November 14, 2003, respectively. |
| (4) | Restructuring expenses in fiscal 2004 included costs associated with severance, abandoned lease space, and other charges. Reversal of restructuring reserves in fiscal 2005, 2006 and 2007 resulted from reductions in the estimated costs required to restore leased facilities to the condition stipulated in the related lease agreements. |
The following table presents details of the total stock-based compensation expense that is included in each functional line item in the consolidated statements of operations above:
| | | | | | | | | | | | | | | | |
| | | Year Ended April 30, |
| | | 2008 (1) | | 2007 (1) | | 2006 | | 2005 | | | 2004 |
Supplementary Data on Stock-Based Compensation (reversal) | | | | | | | | | | | | | | | | |
Cost of product | | $ | 775 | | $ | 468 | | $ | 31 | | $ | 114 | | | $ | 73 |
Cost of service | | | 808 | | | 471 | | | 57 | | | 60 | | | | 42 |
Research and development | | | 4,986 | | | 3,325 | | | 866 | | | 1,505 | | | | 1,923 |
Sales and marketing | | | 5,593 | | | 3,169 | | | 618 | | | 1,191 | | | | 1,124 |
General and administrative | | | 4,644 | | | 2,067 | | | 1,809 | | | (2,126 | ) | | | 2,942 |
| | | | | | | | | | | | | | | | |
Total stock-based compensation | | $ | 16,806 | | $ | 9,500 | | $ | 3,381 | | $ | 744 | | | $ | 6,104 |
| | | | | | | | | | | | | | | | |
| (1) | Amounts included in 2008 and 2007 reflect the adoption of Statement of Financial Accounting Standards (SFAS) No. 123(R),“Share-Based Payment”, which was effective for us on May 1, 2006. |
31
Item 7.Management’s Discussion and Analysis of Financial Condition and Results of Operations
This Annual Report on Form 10-K, and other materials accompanying this Annual Report on Form 10-K contain forward-looking statements within the meaning of Section 27A of the Securities Act of 1933 and Section 21E of the Securities Exchange Act of 1934. These statements relate to our future plans, objectives, expectations, intentions and financial performance and the assumptions that underlie these statements. These forward-looking statements include, but are not limited to, statements concerning the following: expectations with respect to future market growth opportunities; changes in and expectations with respect to revenues and gross margins; future operating expense levels; the impact of quarterly fluctuations of revenue and operating results; our ability to achieve expected levels of revenues and profit contributions from acquired businesses; the impact of macroeconomic conditions on our business; the adequacy of our capital resources to fund operations and growth; investments or potential investments in acquired businesses and technologies, including our recent acquisition of Packeteer, Inc. as well as internally developed technologies; the expansion and effectiveness of our direct and indirect sales forces and marketing activities; the recording of amortization of acquired technology and stock-based compensation; the impact of recent changes in accounting standards and assumptions underlying any of the foregoing. In some cases, forward-looking statements are identified by the use of terminology such as “anticipate,” “expect,” “intend,” “plan,” “predict,” “believe,” “estimate,” “may,” “will,” “should,” “would,” “could,” “potential,” “continue,” “ongoing,” or negatives or derivatives of the foregoing, or other comparable terminology.
The forward-looking statements in this Annual Report on Form 10-K involve known and unknown risks, uncertainties and other factors that may cause industry and market trends, or our actual results, level of activity, performance or achievements, to be materially different from any future trends, results, level of activity, performance or achievements expressed or implied by these statements. For a detailed discussion of these risks, uncertainties and other factors, see the “Risk Factors” section in Item 1A of this Annual Report on Form 10-K. We undertake no obligation to revise or update forward-looking statements to reflect new information or events or circumstances occurring after the date of this Annual Report on Form 10-K, except as required by applicable law.
Overview
We sell a family of proxy appliances and related software and services. Proxy appliances are computer hardware devices that, together with internal software, secure, accelerate and control the delivery of business applications and other information over a WAN or across an enterprise’s Internet gateway, where its local computer network links to the public Internet. Our goal is to provide intelligent application delivery solutions to optimize the flow of information throughout an enterprise, without compromising the integrity of that information.
When we first introduced our proxy appliances with WAN acceleration capability in fiscal 2007, we anticipated that the market for Web security and WAN acceleration products, each of which was then viewed as a separate market, would converge in the future. We believed that IT departments would be required to manage both functions and would select a single solution, where it met appropriate criteria. IDC, a leading information and technology research and advisory firm, defines that converged Web security market and WAN acceleration market as the WAN Application Delivery market.
We have increasingly seen the anticipated convergence of Web security and WAN acceleration and optimization, such that now many of our customers that purchase our products for their WAN acceleration and optimization capability are also implementing our Web security functionality. Similarly, our Web security customers are also implementing our WAN acceleration and optimization capabilities. We believe that enterprises are being driven by the need to centralize their IT operations, while simultaneously managing mobile employees and remote locations and dealing with global business needs and requirements. These trends, together with new types of applications (such as remotely hosted software-as-a-service and Web 2.0 applications), should create demand for the application delivery network that we envision and upon which we are focusing
32
development of our products. This network layer would monitor and control all information flowing between the communications network and the application servers and end users that it serves.
We continue to monitor domestic and global macroeconomic conditions, and their actual and anticipated impact on IT spending, including on spending for proxy appliances. In the fourth quarter of fiscal 2008, we had certain large sales transactions that failed to close, particularly in the U.S. We believe that these largely were delays, resulting from increased scrutiny of spending decisions, and that these sales opportunities will continue to be available to us. We have observed a lengthening of our average sales cycle, which means that sales take longer to close. In light of the difficult U.S. market and economic environment, we recently have been focusing more of our sales and marketing efforts on international transactions, and anticipate that a greater proportion of our revenue will be derived from such transactions in the near term, provided such markets do not suffer a material decline in IT spending.
We track financial metrics, including net revenue, operating margin, deferred revenue, cash flow from operations, and cash position, as key measures of our business performance.
Net Revenue
Net revenue, which includes both product revenue and service revenue, increased to $305.4 million in fiscal 2008 from $177.7 million in fiscal 2007, an increase of 72%. Our product revenue, consisting of sales of our proxy appliances and perpetual licenses to our Blue Coat WebFilter product, was $233.9 million in fiscal 2008. This was an increase of 71% compared with product revenue in fiscal 2007. We recognized $71.6 million in service revenue in fiscal 2008, a 75% increase compared with service revenue recognized in fiscal 2007.
Operating Margin
In fiscal 2008, our operating income increased to $25.1 million from an operating loss of $9.7 million in fiscal 2007. Our operating results during the year benefited from a decrease in our operating expenses as a percentage of revenue when compared with the prior year. Total operating expenses increased to $208.9 million during fiscal 2008 from $141.6 million in fiscal 2007, which was largely attributable to our continued investment in headcount to expand our sales force and marketing functions. Total operating expenses declined to 68% of net revenue in fiscal 2008 compared with 80% of net revenue in fiscal 2007.
Deferred Revenue
Net deferred revenue was $89.6 million at April 30, 2008 compared with $55.8 million at April 30, 2007. The increase was attributable to both an increase in the sales of new maintenance and renewal contracts to our customers and an increased level of inventory held by our stocking distributors. This increase was partially offset by the continued amortization of subscription-based revenue associated with our Blue Coat Web Filter product, which was sold on a subscription-basis until November 2006.
Cash Flow From Operations and Cash Position
During fiscal 2008, we generated cash flow from operations of $56.9 million, compared with $28.0 million generated during fiscal 2007. Our cash, restricted cash and short-term investments were $163.0 million at the end of fiscal 2008, compared with $98.9 million at the previous fiscal year end of April 30, 2007.
On August 16, 2007, our Board of Directors approved a two-for-one forward stock split of our common stock. The stock split was effected by the issuance of a stock dividend of one share of our common stock for each share of our common stock issued and outstanding as of the record date of September 13, 2007. The split-adjusted stock began trading on the NASDAQ Global Market on October 4, 2007. Our stock currently trades on the NASDAQ Global Select Market. All share numbers in this document reflect our capital structure as of the end of the fiscal year and are therefore on a post-split basis. Shares authorized and par value were not adjusted as they were not affected by the stock split.
33
Packeteer Acquisition
On June 6, 2008, after the close of fiscal 2008, we acquired Packeteer, Inc. (“Packeteer”), a pioneer in delivering sophisticated WAN traffic prioritization through the development and sale of application classification and performance management technologies and products. We believe that acquiring Packeteer will accelerate our ability to offer a comprehensive platform to address the application delivery and security challenges confronting today’s distributed enterprise. We intend to continue to sell the PacketShaper®, Intelligence Center and Policy Center products formerly offered by Packeteer and to rebrand them as Blue Coat products. We also intend to enhance the technologies developed and owned by Packeteer and to integrate them into our current and future products. The acquisition of Packeteer should provide us with increased sales resources, through the addition of Packeteer sales teams and channels; additional revenue, through sales of the additional products; and added cost efficiencies that result from scaling our business.
Our acquisition of Packeteer was effected through a tender offer, followed by a merger of our wholly-owned subsidiary into Packeteer. As a result of the transaction, Packeteer became our wholly owned subsidiary and each outstanding share of Packeteer that was not tendered in the tender offer (other than restricted shares; shares already held by us, Packeteer or our respective wholly-owned subsidiaries; or shares held by stockholders who properly perfect appraisal rights under Delaware law) was converted into the right to receive $7.10 per share in cash. The aggregate purchase price, which has not yet been determined, will consist of $264 million in cash paid for Packeteer’s common stock, plus the value of assumed stock options and direct transaction costs. To date, the acquisition has been funded by approximately $188 million in cash from internal sources and $80 million in cash from the issuance of convertible notes.
On April 20, 2008, we entered into a note purchase agreement, pursuant to which we agreed to sell $80 million of Zero Coupon Convertible Senior Notes due 2013 and warrants to purchase shares of our common stock to Manchester Securities Corp. (“Manchester”) and, Francisco Partners II, LP (“FP”) in a private placement. The notes and the warrants were issued to Manchester, FP and an affiliate of FP (the “Purchasers”) on June 2, 2008, following the expiration of the initial offering period of our tender offer. The notes do not bear interest, and are convertible into shares of our common stock at the initial conversion price of $20.76, which represents a 5% conversion premium based on the closing price of our common stock on April 18, 2008. The warrants permit the Purchasers to purchase an aggregate of 385,356 shares of our common stock at an exercise price of $20.76. The warrants expire in June 2013. We used the proceeds from the private placement to partially fund the acquisition of Packeteer.
The operations of Packeteer and Blue Coat will be reported on a combined basis commencing with our financial statements for the quarter ending July 31, 2008.
Critical Accounting Policies and Estimates
Our discussion and analysis of financial condition and results of operations is based upon our consolidated financial statements, which have been prepared in accordance with accounting principles generally accepted in the United States. The preparation of our consolidated financial statements requires us to make estimates and judgments that affect the reported amounts of assets, liabilities, net revenue and expenses, and related disclosure of contingent assets and liabilities. On an ongoing basis, we evaluate our estimates, including those related to Revenue Recognition and related Allowance for Doubtful Accounts, Stock-Based Compensation, Valuation of Inventories, Valuation of Goodwill, Valuation of Long-Lived and Identifiable Intangible Assets and Income Taxes. We base our estimates on historical experience and various other assumptions that are believed to be reasonable under the circumstances, the results of which form the basis for making judgments about the carrying values of assets and liabilities that are not readily apparent from other sources. Actual results may differ from these estimates under different assumptions or conditions, and such differences could be material.
34
We have discussed the development and selection of critical accounting policies and estimates with our audit committee. We believe the accounting policies described below are those that most frequently require us to make estimates and judgments that materially affect our financial statements, and therefore are critical to the understanding of our financial condition and results of operations:
| | • | | Revenue Recognition and Allowance for Doubtful Accounts |
| | • | | Stock-Based Compensation |
| | • | | Valuation of Inventories |
| | • | | Valuation of Long-Lived and Identifiable Intangible Assets |
Revenue Recognition and Allowance for Doubtful Accounts
Our products include software that is essential to the functionality of the appliances. Additionally, we provide unspecified software upgrades and enhancements related to the appliances through our maintenance contracts for most of our products. Accordingly, we account for revenue in accordance with SOP No. 97-2, and all related interpretations. We recognize revenue when all of the following criteria are met: when persuasive evidence of an arrangement exists; delivery or performance has occurred; the sales price is fixed or determinable and collectibility is reasonably assured. However, determining whether and when some of these criteria have been satisfied often involves assumptions and judgments that can have a significant impact on the timing and amount of revenue we recognize.
We define each of the four criteria above as follows:
Persuasive evidence of an arrangement exists. Evidence of an arrangement generally consists of customer purchase orders and, in certain instances, sales contracts or agreements.
Delivery or performance has occurred.Shipping terms and related documents, or written evidence of customer acceptance, when applicable, are used to verify delivery or performance. Most of our sales are made through distributors under agreements allowing for certain stock rotation rights. Net revenue and the related cost of net revenue resulting from shipments to distributors are deferred until the distributors report that our products have been sold to a customer. Product revenue in China is deferred until the customer registers the proxy appliance.
For sales made direct to end-users and value-added resellers, we recognize product revenue upon transfer of title and risk of loss, which generally is upon shipment. We do not accept orders from these value-added resellers when we are aware that the value-added reseller does not have an order from an end user customer. We do not have significant obligations for future performance, such as rights of return or pricing credits, associated with sales to end users and value-added resellers.
The sales price is fixed or determinable. We assess whether the sales price is fixed or determinable based on payment terms and whether the sales price is subject to refund or adjustment.
Collectibility is reasonably assured. Probability of collection is assessed on a customer-by-customer basis. Our customers are subjected to a credit review process that evaluates the customers’ financial condition and ability to pay for our products and services. If it is determined from the outset of an arrangement that collection is not probable based upon the review process, revenue is not recognized until cash receipt.
For products in an arrangement that includes multiple elements, such as appliances, maintenance, content filtering software or anti-virus software, we use the residual method to recognize revenue for the delivered
35
elements. Under the residual method, the amount of revenue allocated to delivered elements equals the total arrangement consideration less the aggregate fair value of any undelivered elements, provided that Vendor Specific Objective Evidence (“VSOE”) exists for all undelivered elements. VSOE of fair value is based on the price charged when the element is sold separately. We analyze our stand alone maintenance renewals by sales channel and geography (strata). We determine the VSOE of fair value for maintenance by analyzing our stand alone maintenance renewals noting that a substantial majority of transactions fall within a narrow range for each stratum. In limited cases, vendor specific objective evidence of fair value is based on management determined prices. If evidence of the fair value of one or more undelivered elements does not exist, all revenue is generally deferred and recognized at the earlier of when delivery of those elements occurs or when fair value can be established for the remaining undelivered elements. When VSOE of fair value cannot be determined for an undelivered element, revenue for the entire arrangement is recognized ratably over the maintenance or subscription period.
Maintenance and subscription revenue is initially deferred and recognized ratably over the life of the contract, with the related expenses recognized as incurred. Maintenance and subscription contracts usually have a term of one to three years. Unearned maintenance and subscription revenue is included in deferred revenue. All shipping costs are charged to cost of net revenue. When we bill customers for shipping, we record the invoice amount for shipping costs in net revenue.
We perform ongoing credit evaluations of our customers’ financial condition and maintain an allowance for doubtful accounts. We analyze accounts receivable and historical bad debts, customer concentrations, customer solvency, current economic and geographic trends, and changes in customer payment terms and practices when evaluating the adequacy of such allowance, and any required changes in the allowance are recorded to general and administrative expense. We write off accounts receivable when they are deemed uncollectible.
Stock-Based Compensation
Effective May 1, 2006, we adopted the fair value recognition provisions of SFAS No. 123(R) using the modified prospective transition method. Under that transition method, compensation expenses recognized beginning on that date include: (a) compensation expense for all share-based payments granted prior to, but not yet vested as of May 1, 2006, based on the grant date fair value estimated in accordance with the original provisions of SFAS No. 123, and (b) compensation expense for all share-based payments granted on or after May 1, 2006, based on the grant date fair value estimated in accordance with the provisions of SFAS No. 123(R). Because we elected to use the modified prospective transition method, results for prior periods have not been restated.
We estimate the fair value of options granted using the Black-Scholes option valuation model. We estimate the expected term of options granted based on our historical experience of grants, exercises and post-vesting cancellations. We estimate the volatility of our stock options at the date of grant using a combination of historical and implied volatilities, consistent with SFAS No. 123(R) and SAB No. 107. We base the risk-free rate that we use in the Black-Scholes option valuation model on the implied yield in effect at the time of option grant based on U.S. Treasury zero-coupon issues with a remaining term equivalent to the expected term of our option grants. We have never paid any cash dividends on our common stock and we do not anticipate paying any cash dividends in the foreseeable future. Consequently, we use an expected dividend yield of zero in the Black-Scholes option valuation model. Stock-based compensation expense under SFAS No. 123(R) is based on awards ultimately expected to vest, which requires us to estimate forfeitures at the time of grant and revise those estimates in subsequent periods if actual forfeitures differ from those estimates. We estimated our forfeiture rate at 10% based on an analysis of historical pre-vesting forfeitures, and have reduced stock-based compensation expense accordingly. For options granted before May 1, 2006, we amortize the fair value on a graded basis. For options granted on or after May 1, 2006, we amortize the fair value on a straight-line basis. The fair value of all options are amortized over the requisite service periods of the awards, which are generally the vesting periods. We may elect to use different assumptions under the Black-Scholes option valuation model in the future, which could materially affect our net income or loss and net income or loss per share.
36
Valuation of Inventories
Inventories consist of raw materials and finished goods. Inventories are recorded at the lower of cost, using the first-in, first-out method, or market after appropriate consideration has been given to obsolescence and inventory in excess of anticipated future demand. In assessing the ultimate recoverability of inventories, we are required to make estimates regarding future customer demand and market conditions.
Valuation of Goodwill
We perform annual goodwill impairment tests in accordance with FASB SFAS No. 142,Goodwill and Other Intangible Assets, during our fourth fiscal quarter, or whenever events or changes in circumstances indicate that the carrying amount of goodwill may not be recoverable. The first step of the test identifies whether potential impairment may have occurred, while the second step of the test measures the amount of the impairment, if any. Impairment is recognized when the carrying amount of goodwill exceeds its fair value. The process of evaluating the potential impairment of goodwill is highly subjective and requires significant judgment. For purposes of the annual impairment test, we consider our market capitalization on the date of the impairment test since we have only one reporting unit. We performed our recurring annual review of goodwill in the fourth quarter of fiscal 2008 and concluded that no impairment existed at the end of our fiscal year 2008.
Valuation of Long-Lived and Identifiable Intangible Assets
We periodically evaluate potential impairments of our long-lived assets, including identifiable intangible assets, in accordance with FASB SFAS No. 144,Accounting for the Impairment or Disposal of Long-Lived Assets. We evaluate long-lived assets, including identifiable intangible assets, for impairment whenever events or changes in circumstances indicate that the carrying amount of the assets may not be recoverable. Events or changes in circumstances that could result in an impairment review include, but are not limited to, significant underperformance relative to historical or projected future operating results, significant changes in the manner of use of the acquired assets or the strategy for our overall business and significant negative industry or economic trends. The process of evaluating the potential impairment of long-lived assets is subjective and requires significant judgment. Variances in our assumptions could have a significant impact on our conclusions as to whether an asset is impaired or the amount of the impairment charge. Impairment is recognized when the carrying amount of an asset exceeds its fair value as calculated on a discounted cash flow basis.
Income Taxes
We use the liability method to account for income taxes as required by SFAS No. 109,Accounting for Income Taxes. As part of the process of preparing our consolidated financial statements, we are required to estimate income taxes in each of the jurisdictions in which we operate. This process involves determining our income tax expense together with calculating the deferred income tax expense related to temporary difference resulting from the differing treatment of items for tax and accounting purposes, such as deferred revenue or deductibility of certain intangible assets. These temporary differences result in deferred tax assets or liabilities, which are included within the consolidated balance sheets.
On May 1, 2007, we adopted Financial Accounting Standards Board Interpretation No. 48 “Accounting for Uncertainty in Income Taxes” (FIN 48), issued in June 2006. FIN 48 prescribes a recognition threshold that a tax position is required to meet before being recognized in the financial statements and provides guidance on derecognition, measurement, classification, interest and penalties, accounting in interim periods, disclosure and transition issues. See Note 7—“Income Taxes” for additional information.
We record a valuation allowance to reduce our deferred tax assets to an amount that we estimate is more likely than not to be realized. We consider estimated future taxable income and prudent tax planning strategies in determining the need for a valuation allowance. When we determine that it is more likely than not that some or all of our tax attributes will be realizable by either refundable income taxes or future taxable income, the
37
valuation allowance will be reduced and the related tax impact will be recorded to the provision in that quarter. Likewise, should we determine that we are not likely to realize all or part of our deferred tax assets in the future, an increase to the valuation allowance would be recorded to the provision in the period such determination was made.
Results of Operations
Net Revenue
The following is a summary of net revenue and the changes in net revenue by fiscal year (dollars in thousands):
| | | | | | | | | | | | |
| | | Year Ended April 30, | |
| | | 2008 | | | 2007 | | | 2006 | |
Total net revenue | | $ | 305,439 | | | $ | 177,700 | | | $ | 141,722 | |
Change from prior year ($) | | $ | 127,739 | | | $ | 35,978 | | | $ | 45,536 | |
Change from prior year (%) | | | 71.9 | % | | | 25.4 | % | | | 47.3 | % |
Demand for our products and related services continued to be strong in fiscal 2008, with net revenue increasing by 71.9% to $305.4 million as compared to $177.7 million in fiscal 2007. The growth in net revenue from fiscal 2007 to fiscal 2008 is attributable to the following factors: 1) continued market acceptance of our products, including the renewal of service contracts from our expanding installed base; 2) demand generated from our expansion into the WAN Application Delivery market; and 3) increased sales and marketing efforts to broaden our market presence and expand our distribution channels. Service revenue increased 74.9% in fiscal 2008 as compared to the prior year as a result of new service contracts sold with our appliances in fiscal 2008 coupled with revenue recognized in the current year from service contracts sold with our appliances in prior years.
Net revenue increased by 25.4% to $177.7 million in fiscal 2007 from $141.7 million in fiscal 2006. The growth in net revenue from fiscal 2006 to fiscal 2007 was primarily attributable to continued market acceptance of our products, including the renewal of service contracts from our expanding installed base, coupled with investments in our sales and marketing organizations.
Alternative Data Technology, Inc. (a distributor) accounted for 12.2% of our net revenue during the fiscal year 2008. Computerlinks AG (a distributor) accounted for 11.2% of our net revenue during fiscal 2007. Westcon Group, Inc. (a distributor) accounted for 10.2% and 15.9% of our net revenue during the fiscal years 2007 and 2006, respectively. As of April 30, 2008 and 2007, no customer accounted for more than 10.0% of gross accounts receivable.
The following is a summary of net revenue by geographic area (dollars in thousands):
| | | | | | | | | | | | | | | | | | |
| | | Year Ended April 30, | |
| | | 2008 | | | 2007 | | | 2006 | |
| | | $ | | % | | | $ | | % | | | $ | | % | |
North America | | $ | 142,934 | | 46.8 | % | | $ | 82,812 | | 46.6 | % | | $ | 70,866 | | 50.0 | % |
EMEA (1) | | | 112,110 | | 36.7 | | | | 66,323 | | 37.3 | | | | 53,858 | | 38.0 | |
LATAM (2) | | | 3,850 | | 1.3 | | | | 1,611 | | 0.9 | | | | 377 | | 0.3 | |
APAC (3) | | | 46,545 | | 15.2 | | | | 26,954 | | 15.2 | | | | 16,621 | | 11.7 | |
| | | | | | | | | | | | | | | | | | |
Total net revenue | | $ | 305,439 | | 100.0 | % | | $ | 177,700 | | 100.0 | % | | $ | 141,722 | | 100.0 | % |
| | | | | | | | | | | | | | | | | | |
| (1) | Europe, Middle East, and Africa (“EMEA”) |
| (2) | Central America and Latin America (“LATAM”) |
| (3) | Asia and Pacific regions (“APAC”) |
38
On a geographic basis, revenue in North America increased $60.1 million in fiscal 2008, up 72.6% from fiscal 2007; Net revenue in North America increased $11.9 million in fiscal 2007, up 16.9% from fiscal 2006. The year-over-year increases in net revenue in North America for both fiscal 2008 and 2007 were primarily related to increased demand for our WAN Application Delivery products and a larger installed base of customers. Revenues from outside of North America continued to be a significant part of our revenue mix. For the fiscal years 2008, 2007 and 2006, approximately 53.2%, 53.4% and 50.0%, respectively, of our total net revenue were derived from customers outside of North America.
Net revenue in Europe, Middle East, and Africa (“EMEA”) increased $45.8 million in fiscal 2008, up 69.0% from fiscal 2007. Net revenue in EMEA increased $12.5 million in fiscal 2007, up 23.1% from fiscal 2006. The year-over-year increases in net revenue in EMEA for both fiscal 2008 and 2007 were primarily related to investments in our sales and marketing organizations in the region and broader market acceptance of our products, coupled with continued leverage from our channel distribution model.
Net revenue in Central America and Latin America (“LATAM”) increased $2.2 million in fiscal 2008, up 139.0% from fiscal 2007, due to a focused effort to develop the business through investment in sales and marketing personnel and activities. Net revenue in LATAM increased $1.2 million in fiscal 2007 from fiscal 2006.
Net revenue in the Asia and Pacific region (“APAC”) increased $19.6 million in fiscal 2008, up 72.7% from fiscal 2007. Net revenue in Asia increased $10.3 million in fiscal 2007, up 62.2% from fiscal 2006. The year over year increases in net revenue in Asia for both fiscal 2008 and 2007 were a result of increased demand for our products and related services, as well as increased investment in our sales and marketing organization in APAC.
Gross Profit
The following is a summary of gross profit by fiscal year (dollars in thousands):
| | | | | | | | | | | | |
| | | Year Ended April 30, | |
| | | 2008 | | | 2007 | | | 2006 | |
Gross profit (1) | | $ | 233,994 | | | $ | 131,952 | | | $ | 98,674 | |
Gross profit as a percentage of net revenue (1) | | | 76.6 | % | | | 74.3 | % | | | 69.6 | % |
| (1) | Includes stock-based compensation expense. For a further discussion of stock-based compensation expense, see the section entitled “Stock-Based Compensation Expense” below. |
Gross profit increased $102.0 million, or 77.3%, to $234.0 million in fiscal 2008 from $132.0 million in fiscal 2007, which was consistent with the increase in net revenue. As a percentage of net revenue, gross profit in fiscal 2008 increased to 76.6% from 74.3% in fiscal 2007, primarily due to more favorable product pricing, a product mix favoring higher margin products such as Blue Coat WebFilter, and higher overall revenue resulting in more effective leverage on fixed product costs, partially offset by higher royalty expense.
Gross profit increased $33.3 million, or 33.7%, to $132.0 million in fiscal 2007 from $98.7 million in fiscal 2006, primarily due to higher net revenue. Gross profit as a percent of net revenue increased to 74.3% in fiscal 2007 from 69.6% in fiscal 2006, which was primarily attributable to product price increases and increased absorption of fixed manufacturing and service costs resulting from the increase in net revenue.
39
Research and Development
The following is a summary of research and development expense by fiscal year (dollars in thousands):
| | | | | | | | | | | | |
| | | Year Ended April 30, | |
| | | 2008 | | | 2007 | | | 2006 | |
Research and development (1) | | $ | 51,587 | | | $ | 39,882 | | | $ | 26,785 | |
Research and development as a percentage of net revenue (1) | | | 16.9 | % | | | 22.4 | % | | | 18.9 | % |
| (1) | Includes stock-based compensation expense. For a further discussion of stock-based compensation expense, see the section entitled “Stock-Based Compensation Expense” below. |
Research and development expense consists primarily of salaries and benefits, prototype costs, and testing equipment costs.
Research and development expense increased $11.7 million in fiscal 2008. The increase in research and development expense from the prior year is largely attributable to an $8.5 million increase in salaries and benefits as a result of higher headcount. The increase was also partially attributable to stock-based compensation expense of $5.0 million recorded under SFAS No. 123(R) in fiscal 2008, as compared to $3.3 million recorded in fiscal 2007.
Research and development expense increased $13.1 million in fiscal 2007. The increase in research and development expense primarily resulted from higher expenditures on development of our WAN Application Delivery products and an increase in stock-based compensation expense of $2.4 million.
Research and development headcount was 281 at April 30, 2008, 205 at April 30, 2007, and 176 at April 30, 2006. We believe that continued investment in product enhancements and new product development is critical to achieving our strategic objectives. As a result, we expect research and development expense to continue to increase in absolute dollars.
Sales and Marketing
The following is a summary of sales and marketing expense by fiscal year (dollars in thousands):
| | | | | | | | | | | | |
| | | Year Ended April 30, | |
| | | 2008 | | | 2007 | | | 2006 | |
Sales and marketing (1) | | $ | 128,927 | | | $ | 73,083 | | | $ | 52,829 | |
Sales and marketing as a percentage of net revenue (1) | | | 42.2 | % | | | 41.1 | % | | | 37.3 | % |
| (1) | Includes stock-based compensation expense. For a further discussion of stock-based compensation expense, see the section entitled “Stock-Based Compensation Expense” below. |
Sales and marketing expense consists primarily of salaries and benefits, commissions, travel, advertising and promotional expenses.
Sales and marketing expense increased $55.8 million to $128.9 million in fiscal 2008 from $73.1 million in fiscal 2007. Sales and marketing expense increased as we continued to expand our sales force and invest in marketing personnel. Salaries and benefits increased by approximately $19.0 million as a result of this activity. In addition, commission expense increased by $18.3 million due primarily to the increase in revenue, coupled with more aggressive sales incentives for WAN acceleration deployments and further development of emerging markets. Also contributing to the increase in sales and marketing expense was an increase in stock-based compensation expense of $2.4 million and an increase in advertising of $1.8 million.
Sales and marketing expense increased $20.3 million to $73.1 million in 2007 from $52.8 million in fiscal 2006. The increase in sales and marketing expense was primarily attributable to increases in sales personnel, marketing program spending, and volume-related expenses such as commission payments and higher travel costs.
40
Sales and marketing headcount was 398 at April 30, 2008, 285 at April 30, 2007 and 189 at April 30, 2006. We expect sales and marketing expense to increase in absolute dollars because we intend to seek to increase sales in both domestic and international markets, establish and expand new distribution channels, and introduce new products.
General and Administrative
The following is a summary of general and administrative expense by fiscal year (dollars in thousands):
| | | | | | | | | | | | |
| | | Year Ended April 30, | |
| | | 2008 | | | 2007 | | | 2006 | |
General and administrative (1) | | $ | 27,909 | | | $ | 28,072 | | | $ | 13,593 | |
General and administrative as a percentage of net revenue (1) | | | 9.1 | % | | | 15.8 | % | | | 9.6 | % |
| (1) | Includes stock-based compensation expense resulting. For a further discussion of stock-based compensation expense, see the section entitled “Stock-Based Compensation Expense” below. |
General and administrative expense consists primarily of salaries and benefits, legal services, accounting and audit services, and other general corporate expenses.
General and administrative expense decreased $0.2 million to $27.9 million in fiscal 2008 from $28.1 million in fiscal 2007. The decrease was largely attributable to an $8.7 million decrease in legal and accounting expenses associated with our March 2007 Restatement, offset by an increase of $6.0 million in payroll-related expenses and $2.6 million related to stock-based compensation.
General and administrative expense increased $14.5 million to $28.1 million in fiscal 2007 from $13.6 million in fiscal 2006. The increase in general and administrative expense was largely attributable to the legal, auditing and other professional fees of approximately $13.0. The increase was also attributable to stock-based compensation expense within general and administrative expense increasing to $2.1 million in fiscal 2007 from $1.8 million in fiscal 2006.
Stock-Based Compensation
The following summarizes stock-based compensation expense included in the cost classifications in our consolidated statement of operations for fiscal 2008, 2007 and 2006, respectively (in thousands):
| | | | | | | | | |
| | | Year Ended April 30, |
| | | 2008 (1) | | 2007 (1) | | 2006 |
Stock-based compensation: | | | | | | | | | |
Classified in cost of goods sold | | | | | | | | | |
Cost of product | | $ | 775 | | $ | 468 | | $ | 31 |
Cost of service | | | 808 | | | 471 | | | 57 |
| | | | | | | | | |
Subtotal | | | 1,583 | | | 939 | | | 88 |
Classified in operating expense: | | | | | | | | | |
Research and development | | | 4,986 | | | 3,325 | | | 866 |
Sales and marketing | | | 5,593 | | | 3,169 | | | 618 |
General and administrative | | | 4,644 | | | 2,067 | | | 1,809 |
| | | | | | | | | |
Subtotal | | | 15,223 | | | 8,561 | | | 3,293 |
| | | | | | | | | |
Total stock-based compensation expense | | $ | 16,806 | | $ | 9,500 | | $ | 3,381 |
| | | | | | | | | |
| (1) | Amounts included in 2007 and 2008 reflect the adoption of SFAS No. 123(R). In accordance with the modified prospective transition method, our consolidated statement of income for fiscal 2006 has not been restated to reflect, and does not include, the impact of SFAS No. 123(R). |
41
Restructuring Charges
As of April 30, 2008, all actions under our February 2002, August 2001, and February 2001 restructuring plans were completed.
The following summarizes the restructuring reversal and changes in restructuring reserve by fiscal year (in thousands):
| | | | | | | | | | | |
| | | Year Ended April 30, | |
| | | 2008 | | 2007 | | | 2006 | |
Restructuring reversal | | $ | — | | $ | (19 | ) | | $ | (48 | ) |
Change in restructuring reversal | | $ | — | | $ | 29 | | | $ | 48 | |
The following table summarizes activity related to restructuring activity during the three years ended April 30, 2008 (in thousands):
| | | | |
Balances as of April 30, 2005 | | $ | 3,643 | |
Cash payments | | | (2,701 | ) |
Reversals | | | (48 | ) |
| | | | |
Balances as of April 30, 2006 | | | 894 | |
Cash payments | | | (637 | ) |
Reversals | | | (19 | ) |
| | | | |
Balances as of April 30, 2007 | | | 238 | |
Cash payments | | | (238 | ) |
| | | | |
Balances as of April 30, 2008 | | $ | — | |
| | | | |
In fiscal 2007 and 2006, we reduced the restructuring accrual by $19,000 and $48,000, respectively, due to decreases in the estimated costs required to restore the leased facilities to the condition stipulated in the related lease agreements.
Acquired In-Process Technology
We recorded a non-cash charge of $3.3 million in fiscal 2006 for the value of in-process technology acquired in the Permeo acquisition, which relates to research and development projects that had not yet reached technological feasibility and had no future use in our development activities.
To establish the value of the in-process technology acquired from Permeo we used an income approach, which values an asset based on the earnings capacity of such asset considering the future cash flows that could potentially be generated by the asset over its estimated remaining life. These cash flows were discounted to their present value using a discount rate of 29.0%, which is equal to a rate that would theoretically provide sufficient return to a potential investor at an appropriate level of risk. The present value of the cash flows over the life of the asset is summed to equal the estimated value of the asset.
42
Interest Income and Other Expense
The following summarizes interest income and other income (expense) and changes in interest income and other income (expense) by fiscal year (dollars in thousands):
| | | | | | | | | | | | |
| | | Year Ended April 30, | |
| | | 2008 | | | 2007 | | | 2006 | |
Interest income | | $ | 5,870 | | | $ | 3,922 | | | $ | 2,055 | |
Other expense | | $ | (461 | ) | | $ | (311 | ) | | $ | (349 | ) |
% Change in interest income | | | 49.7 | % | | | 90.9 | % | | | 197.4 | % |
% Change in other income (expense) | | | 48.2 | % | | | (10.9 | )% | | | (181.5 | )% |
Interest income increased for the fiscal years ended April 30, 2008, 2007 and 2006 as a result of higher average cash and investment balances throughout the year.
Other expense consists primarily of foreign currency exchange gains or losses, banking fees, and non-recurring gains or losses realized outside our normal course of business. In addition, other expense for fiscal 2008, 2007 and 2006 included payroll taxes and related penalties for the disqualification of stock options caused by the revised measurement dates determined during the investigation of historical stock option granting practices.
Provision for Income Taxes
The following summarizes the provision for income taxes and changes in the provision for income taxes by fiscal year (dollars in thousands):
| | | | | | | | | | | | |
| | | Year Ended April 30, | |
| | | 2008 | | | 2007 | | | 2006 | |
Provision (benefit) for income taxes | | $ | (2,038 | ) | | $ | 1,124 | | | $ | 275 | |
Change in provision | | $ | (3,162 | ) | | $ | 849 | | | $ | 158 | |
% Change in provision | | | (281.3 | )% | | | 308.7 | % | | | 135.0 | % |
The benefit for income taxes of $2.0 million for fiscal 2008 is primarily related to a partial reversal of a valuation allowance on deferred tax assets that was recorded as a reduction to income tax expense, offset by foreign income taxes and the current tax provision for U.S. and state taxes due primarily from a prepayment of certain intercompany expenses associated with our international tax structure established in fiscal 2008. The provision for income taxes of $1.1 million for fiscal 2007, is primarily related to foreign income taxes currently due, and a deferred tax liability recorded for the tax amortization of goodwill related to the acquisition of the NetCache business from Network Appliance. The provision for income taxes of $0.3 million for fiscal 2006 is primarily foreign corporate income taxes.
We record a valuation allowance to reduce our deferred tax assets to the amount that is more likely than not to be realized in future periods. In evaluating our ability to recover our deferred tax assets, we consider all available positive and negative evidence, including operating results, our history of losses and forecasts of future taxable income.
At April 30, 2008, our projections of future taxable income enabled us to conclude that it is more likely than not that we will have future taxable income sufficient to realize a portion of our net deferred tax asset. Accordingly, $19.6 million ($17.4 million of federal and $2.2 million of state) of the valuation allowance on our deferred tax assets was reversed as a credit to the provision for income taxes. Our conclusion that a portion of our deferred tax assets is more likely than not to be realized is strongly influenced by our projections of future taxable income. Our estimate of future taxable income considers all available positive and negative evidence regarding our current and future operations, including projections of income in various states and foreign jurisdictions. We believe our estimate of future taxable income is reasonable; however, it is inherently uncertain,
43
and if our future operations generate taxable income greater than projected, further adjustments to reduce the valuation allowance are possible. Conversely, if we realize unforeseen material losses in the future, or our ability to generate future taxable income necessary to realize a portion of the deferred tax asset is materially reduced, additions to the valuation allowance could be recorded. At April 30, 2008, the balance of the deferred tax valuation allowance was approximately $23.1 million.
As of April 30, 2008, we had net operating loss carryforwards for federal income tax purposes of approximately $108.5 million, which will expire in fiscal years ending in 2011 through 2027 if not utilized. We also had net operating loss carryforwards for state income tax purposes of approximately $45.2 million, which will expire in fiscal 2009 through 2027 if not utilized. We also had federal and California research credit carryforwards of approximately $1.2 million and $6.7 million respectively. The federal credit will expire in fiscal 2027 and 2028 if not utilized. The California credit is not subject to expiration.
Utilization of our net operating loss and credit carryforwards are subject to substantial annual limitations due to the ownership change provisions of the Internal Revenue Code and similar state provisions. Annual limitations have resulted in the expiration of net operating loss and tax credit carryforwards before utilization of approximately $60.9 million and $3.6 million, respectively. Utilization of federal and state net operating losses of approximately $108.5 million and $37.3 million, respectively, as well as $.1 million and $4.6 million of federal and state credits, respectively, are subject to annual limitations ranging from approximately $1.0 million to $13.7 million. See Note 7—“Income Taxes” for additional information.
On May 1, 2007, we adopted Financial Accounting Standards Board Interpretation No. 48Accounting for Uncertainty in Income Taxes (FIN 48), issued in June 2006. FIN 48 applies to all tax positions related to income taxes subject to SFAS No. 109. Under FIN 48 we recognize the benefit from a tax position only if it is more likely than not that the position would be sustained upon audit based solely on the technical merits of the tax position. As a result of the implementation of FIN 48, we did not recognize a cumulative adjustment to the May 1, 2007 balance of retained earnings as the amount was deemed immaterial. The cumulative effect of adoption of FIN 48 did not result in a material adjustment to our tax liability for unrecognized income tax benefits. We classify interest and penalties related to uncertain tax positions as a component of our provision for income taxes. Accrued interest relating to the income tax on the unrecognized tax benefits as of May 1, 2007 and April 30, 2008, was approximately $19,000 and $34,000, respectively, with approximately $15,000 being included as a component of provision for income taxes in the year ended April 30, 2008. See Note 7—“Income Taxes” for additional information.
Acquisitions
Packeteer, Inc.On June 6, 2008, after the close of fiscal 2008, we completed the acquisition of Packeteer, Inc. (“Packeteer”), a provider of products for WAN traffic prioritization and acceleration. The transaction was effected through a tender offer, followed by a merger of our wholly-owned subsidiary, with and into Packeteer. As a result of the transaction, Packeteer became our wholly-owned subsidiary and each outstanding share of Packeteer common stock that was not tendered in the tender offer (other than restricted shares; shares already held by us, Packeteer or our respective wholly-owned subsidiaries; or shares held by stockholders who properly perfect appraisal rights under Delaware law) was converted into the right to receive $7.10 per share. We will pay approximately $269 million in total consideration for the acquisition of Packeteer common stock, which includes shares purchased privately on April 20, 2008, shares purchased through the tender offer and payments made as a consequence of the merger. We believe that acquiring Packeteer will accelerate our ability to offer a comprehensive platform to address the application delivery and security challenges confronting today’s distributed enterprise.
On April 20, 2008, we entered into a note purchase agreement, pursuant to which we agreed to sell $80 million of Zero Coupon Convertible Senior Notes due 2013 and warrants to purchase shares of our common stock to Manchester Securities Corp. (“Manchester”) and Francisco Partners II, L.P. (“FP”) in a private
44
placement. The notes and the warrants were issued to Manchester, FP and an affiliate of FP (the “Purchasers”) on June 2, 2008, following the expiration of the initial offering period of our tender offer. The notes do not bear interest, and are convertible into shares of our common stock at the initial conversion price of $20.76, which represents a 5% conversion premium based on the closing price of our common stock on April 18, 2008. The warrants permit the Purchasers to purchase an aggregate of 385,356 shares of our common stock at an exercise price of $20.76. We used the proceeds from the private placement to partially fund the acquisition of Packeteer.
NetCache business from Network Appliance, Inc. On September 11, 2006, we completed the acquisition of certain assets of the NetCache business from Network Appliance. The final consideration for the transaction consisted of $23.9 million cash consideration, an aggregate of 720,000 shares of our common stock valued at $5.7 million and $1.0 million in direct transaction costs. Of the total purchase price, $0.7 million has been allocated to the intangible assets acquired, with the balance of $29.9 million allocated to goodwill. The NetCache business previously provided products to large enterprises to manage internet access and security and control Web content and application acceleration. NetCache was a business unit previously owned by Network Appliance, Inc. Our primary purpose for acquiring certain assets of the NetCache business was to increase our potential customer base through the conversion of existing NetCache customers to our proxy appliances.
Permeo Technologies, Inc.On March 3, 2006, we completed the acquisition of Permeo, Inc. (“Permeo”). The purchase price of $45.3 million consisted of $15.0 million in cash consideration, 2.6 million shares of our common stock valued at $28.7 million, $1.0 million in direct transaction costs which had been fully paid as of April 30, 2007, and Permeo stock options assumed by us valued at $0.6 million. Identifiable intangible assets acquired included developed technology and customer relationships, which are being amortized into “Cost of revenue—Product” and “Operating expenses,” respectively. Permeo was a provider of on-demand information security, providing a comprehensive remote access and information protection product that secured and extended corporate applications to mobile workers, business partners and customers. Permeo’s operations were assumed as of the date of the acquisition and are included in our results of operations beginning on March 3, 2006.
All acquisitions are accounted for as purchases in accordance with SFAS No. 141,Accounting for Business Combinations (“SFAS No. 141”); accordingly, we allocate the purchase price to the fair value of net tangible and intangible assets acquired, with the excess purchase price allocated to goodwill.
Recent Accounting Pronouncements
In September 2006, the FASB issued SFAS No. 157,Fair Value Measurements(“SFAS No. 157”). SFAS No. 157 provides a framework for measuring fair value, clarifies the definition of fair value, and expands disclosures regarding fair value measurements. SFAS No. 157 does not require any new fair value measurements and eliminates inconsistencies in guidance found in various prior accounting pronouncements. We are required to adopt SFAS No. 157 for our fiscal year beginning May 1, 2008. The adoption of SFAS 157 is not expected to have a significant impact on our consolidated financial statements.
In February 2007, the FASB issued SFAS No. 159,The Fair Value Option for Financial Assets and Financial Liabilities—Including an Amendment of FASB Statement No. 115(“SFAS No. 159”). SFAS No. 159 allows measurement at fair value of eligible financial assets and liabilities that are not otherwise measured at fair value. If the fair value option for an eligible item is elected, unrealized gains and losses for that item will be reported in current earnings at each subsequent reporting date. SFAS No. 159 also establishes presentation and disclosure requirements designed to draw comparison between the different measurement attributes a company elects for similar types of assets and liabilities. This statement is effective for our fiscal year beginning May 1, 2008. The adoption of SFAS 159 is not expected to have a significant impact on our consolidated financial statements.
In June 2007, the FASB ratified a consensus opinion reached by the Emerging Issues Task Force (“EITF”) on EITF Issue 07-3, “Accounting for Nonrefundable Advance Payments for Goods or Services Received for Usein Future Research and Development Activities.” (“EITF 07-3”). The guidance in EITF 07-3 requires us to defer and capitalize nonrefundable advance payments made for goods or services to be used in research and
45
development activities until the goods have been delivered or the related services have been performed. If the goods are no longer expected to be delivered or the services are no longer expected to be performed, we would be required to expense the related capitalized advance payments. EITF 07-3 is effective for fiscal years beginning after December 15, 2007 and is to be applied prospectively to new contracts entered into on or after the commencement of that fiscal year. Early adoption is not permitted. Retrospective application of EITF 07-3 also is not permitted. We intend to adopt EITF 07-3 effective May 1, 2008 and do not expect the pronouncement to have a material effect on our consolidated financial statements.
In December 2007, the FASB issued SFAS No. 141R, “Business Combinations” (“SFAS No. 141R”). SFAS No. 141R amends SFAS 141 and provides revised guidance for recognizing and measuring identifiable assets and goodwill acquired, liabilities assumed, and any noncontrolling interest in the acquiree. It also provides disclosure requirements to enable users of the financial statements to evaluate the nature and financial effects of the business combination. SFAS No. 141R is effective for fiscal years beginning on or after December 15, 2008 and will be applied prospectively. This statement is effective for our fiscal year beginning May 1, 2009. We are currently evaluating the impact of adopting SFAS 141R on our consolidated financial statements.
In December 2007, the FASB issued SFAS No. 160, “Noncontrolling Interests in Consolidated Financial Statements—an amendment of Accounting Research Bulletin No. 51” (“SFAS No. 160”). SFAS 160 establishes accounting and reporting standards for ownership interests in subsidiaries held by parties other than the parent, the amount of consolidated net income attributable to the parent and to the noncontrolling interest, changes in a parent’s ownership interest and the valuation of retained noncontrolling equity investments when a subsidiary is deconsolidated. SFAS 160 also establishes disclosure requirements that clearly identify and distinguish between the interests of the parent and the interests of the noncontrolling owners. SFAS No. 160 is effective for fiscal years beginning on or after December 15, 2008. This statement is effective for our fiscal year beginning May 1, 2009. The adoption of SFAS No. 160 is not expected to have a significant impact on our consolidated financial statements.
Liquidity and Capital Resources
Since our inception, we have financed our operations and capital expenditures through cash provided by operating activities, private sales of preferred and common stock and convertible debt, bank loans, equipment leases, and an initial public offering of our common stock. We believe our existing cash, cash equivalents, short-term investments and cash generated from operations, if any, will be sufficient to meet our operating requirements for at least the next twelve months, including working capital requirements and capital expenditures. We may choose at any time to raise additional capital to strengthen our financial condition, facilitate expansion, pursue strategic acquisitions or investments, or to take advantage of business opportunities as they arise.
| | | | | | | | | | | | |
| | | April 30, | |
(Dollars In thousands) | | 2008 | | | 2007 | | | 2006 | |
Cash, cash equivalents and short-term investments | | $ | 162,178 | | | $ | 93,887 | | | $ | 57,190 | |
Restricted cash and cash equivalents | | | 861 | | | | 4,981 | | | | 1,357 | |
| | | | | | | | | | | | |
| | $ | 163,039 | | | $ | 98,868 | | | $ | 58,547 | |
| | | | | | | | | | | | |
Percentage of total assets | | | 42.0 | % | | | 39.8 | % | | | 35.7 | % |
| | | | | | | | | | | | |
| |
| | | Year Ended April 30, | |
(In thousands) | | 2008 | | | 2007 | | | 2006 | |
Cash provided by operating activities | | $ | 56,901 | | | $ | 27,960 | | | $ | 22,422 | |
Cash provided by (used in) investing activities | | | 10,267 | | | | (67,465 | ) | | | (32,102 | ) |
Cash provided by financing activities | | | 43,793 | | | | 42,528 | | | | 9,486 | |
| | | | | | | | | | | | |
Net increase (decrease) in cash and cash equivalents | | $ | 110,961 | | | $ | 3,023 | | | $ | (194 | ) |
| | | | | | | | | | | | |
46
Net cash provided by operating activities was $56.9 million for the fiscal 2008, compared with $28.0 million for fiscal 2007. This increase was largely attributable to the growth in net income for the fiscal year. Working capital sources of cash in fiscal 2008 included increases in deferred revenue of $33.8 million, accounts payable of $6.6 million, accrued payroll and related benefits of $2.1 million and other accrued liabilities of $3.7 million. Deferred revenue increased primarily as a result of an increase in new service contracts sold with our appliances as well as the renewal of service contracts from our expanding installed base, both of which are recognized ratably over the service period. Accounts payable and accrued liabilities increased during fiscal 2008 due to an increase in operating expenses. Accrued payroll and related benefits increased primarily due to increased headcount and a higher commission accrual. Working capital uses of cash during fiscal 2008 included an increase in our accounts receivable balance of $27.0 million. This increase was largely due to higher net revenues in fiscal 2008 and an increase in our days sales outstanding (“DSO”). Our DSO increased from 51 days at April 30, 2007 to 60 days at April 30, 2008, which was largely attributable to a greater concentration of revenues recognized in the last month of the quarter of fiscal 2008 as compared to fiscal 2007. Also contributing to working capital uses of cash was an increase in net deferred tax assets of $19.6 million as a result of the partial release in our valuation allowance.
Net cash provided by investing activities was $10.3 million for fiscal 2008, compared with $67.5 million used in investing activities for fiscal 2007. Net cash used in investing activities for fiscal 2008 included $121.8 million for the purchase of investment securities, $25.3 million for the purchase of Packeteer common stock, and $11.2 million for the purchase of property and equipment. This was offset by the sale of investment securities of $164.5 million. The increased use of cash for property and equipment, as compared to the prior year, was primarily related to purchases of computer equipment, software, furniture and leasehold improvements associated with the growth in our business. Net cash used in investing activities for fiscal 2007 included $124.4 million for the purchase of investment securities, $24.9 million in cash consideration and direct costs related to the acquisition of certain assets of the NetCache business, and $5.3 million for the purchase of property and equipment. In the future, we expect that any cash in excess of current requirements will continue to be invested in short-term investment grade, interest-bearing securities. Through the date of this report, the acquisition of Packeteer has been funded by approximately $188 million in cash from internal sources and $80 million in cash from the issuance of convertible notes.
Net cash provided by financing activities was $43.8 million for fiscal 2008, compared with $42.5 million net cash provided by financing activities for fiscal 2007. The net cash provided by financing activities in fiscal 2008 was attributable to proceeds from the issuance of common stock of $29.8 million and a tax benefit related to stock-based compensation of $14.0 million. The net cash provided by financing activities in fiscal 2007 was primarily related to the net proceeds received from our sale of Series A preferred stock of $41.9 million.
On June 2, 2008, we issued $80 million in Zero Coupon Convertible Senior Notes (the “Notes”) as well as warrants to purchase an aggregate of 385,356 shares of our common stock at an exercise price of $20.76 in a private placement. The Notes are convertible into 3,853,564 shares of our common stock at the holders’ option at any time prior to maturity at a conversion price of $20.76. The Notes do not bear interest. We used the $80 million proceeds from the private placement to partially fund the acquisition of Packeteer, Inc. The Notes mature in June of 2013 unless converted into common stock or accelerated as a result of our default under the Notes prior to such date.
Our long-term strategy is to maintain a minimum amount of cash and cash equivalents for operational purposes and to invest the remaining amount of our cash in interest bearing and highly liquid cash equivalents and marketable debt securities. As of April 30, 2008, cash, cash equivalents, short-term investments, and restricted cash totaled $163.0 million.
47
Contractual Obligations
Below is a summary of fixed payments related to certain contractual obligations as of April 30, 2008 (in thousands):
| | | | | | | | | | | | | | | | | | | | | |
| | | Year Ended April 30, |
| | | 2009 | | 2010 | | 2011 | | 2012 | | 2013 | | Thereafter | | Total |
Future minimum lease payments | | $ | 5,136 | | $ | 3,667 | | $ | 1,967 | | $ | 951 | | $ | 713 | | $ | 81 | | $ | 12,515 |
Purchase and other commitments | | | 8,926 | | | 100 | | | 100 | | | 200 | | | 200 | | | — | | | 9,526 |
| | | | | | | | | | | | | | | | | | | | | |
Total | | $ | 14,062 | | $ | 3,767 | | $ | 2,067 | | $ | 1,151 | | $ | 913 | | $ | 81 | | $ | 22,041 |
| | | | | | | | | | | | | | | | | | | | | |
We lease certain equipment and office facilities under non-cancelable operating leases that expire at various dates through fiscal year 2014. The facility leases generally require us to pay operating costs, including property taxes, insurance and maintenance, and contain scheduled rent increases and certain other rent escalation clauses. Rent expense is recognized in our consolidated financial statements on a straight-line basis over the terms of the respective leases after consideration of rent holidays and improvement allowances, if applicable, with any assets purchased using a lessee improvement allowance capitalized as fixed assets and depreciated over the shorter of their useful lives or the lease term.
In September 2005, we commenced a five-year operating lease of a building that serves as our headquarters in Sunnyvale, California. As part of this agreement, we are required to maintain a $0.4 million irrevocable standby letter of credit with a major financial institution as a form of security. The letter of credit is secured by deposits and provides for automatic annual extensions, without amendment, through the end of the lease term in August 2010. The amount of the letter of credit did not change during fiscal 2008. The deposits securing the letter of credit are classified as long-term restricted cash in the accompanying consolidated balance sheets as of April 30, 2008 and 2007, respectively. We amended this lease subsequent to the end of fiscal 2008, as described in Note 13, Subsequent Events (Unaudited).
In addition, we have firm purchase and other commitments with various suppliers and contract manufacturers to purchase component inventory, manufacturing material and equipment. These agreements are enforceable and legally binding against us in the short-term and a majority of the amounts under these arrangements are due within one year. Our minimum obligation at April 30, 2008 under these arrangements was $9.5 million.
After the close of fiscal 2008, we completed the acquisition of Packeteer, and assumed responsibility for outstanding lease and purchase obligations existing at the time of the acquisition. We have not completed our review of these agreements, and cannot reasonably estimate the future contractual obligations at this time.
On April 20, 2008, we entered into a note purchase agreement pursuant to which we agreed to sell $80 million aggregate principal amount of Zero Coupon Convertible Senior Notes due 2013 (the “Notes”) in a private placement. We also agreed to issue warrants to purchase an aggregate of 385,356 shares of our common stock at an exercise price of $20.76. The convertible notes and warrants were issued on June 2, 2008 and expire in June of 2013.
The Notes are convertible into shares of our common stock at the holders’ option at any time prior to maturity at the initial conversion price of $20.76, which represents a 5% conversion premium based on the closing price of Blue Coat’s common stock of $19.77 per share on April 18, 2008. The Notes do not bear interest.
In connection with our NetCache asset acquisition in September 2006, we entered into an escrow agreement pursuant to which we deposited in escrow $4.0 million, primarily to secure certain indemnification obligations to Network Appliance related to this transaction until December 2007. As of April 30, 2007, the balance in this
48
escrow account had grown to $4.1 million and was classified as short-term restricted cash equivalents. As of April 30, 2008, the escrow agreement had expired, the amounts held in escrow were released, and the related balance was reclassified to cash and cash equivalents in the consolidated balance sheet at April 30, 2008.
At April 30, 2008, we had a liability for unrecognized tax benefits of $2.8 million. Due to uncertainties with respect to the timing of future cash flows associated with our unrecognized tax benefits at April 30, 2008, we are unable to make reasonably reliable estimates of the period of cash settlement with the respective taxing authority. Therefore, $2.8 million of unrecognized tax benefits have been excluded from the contractual obligations table above. See “Note 7—Income Taxes” to our consolidated financial statements for a discussion of income taxes.
Off-Balance Sheet Arrangements
As of April 30, 2008, we did not have any relationships with unconsolidated entities or financial partnerships, such as entities often referred to as structured finance or special purpose entities, which would have been established for the purpose of facilitating off-balance sheet arrangements or for other contractually narrow or limited purposes. Further, we have not guaranteed any obligations of unconsolidated entities, nor do we have any commitment or intent to provide funding to any such entities. As such, we are not materially exposed to any market, credit, liquidity or financing risk that could arise if we had engaged in such relationships.
We did not have any off-balance sheet transactions, arrangements, or obligations that are reasonably likely to have a material current or future effect on our financial condition, results of operations, liquidity, or capital resources.
Item 7A.Quantitative and Qualitative Disclosures about Market Risk
Interest Rate Risk
We are subject to certain market risks, including changes in exchange rates and interest rates. We do not undertake any specific actions to cover our exposures to exchange and interest rate risks, and we are not a party to any interest and exchange rate risk management transactions. We also do not purchase or hold any derivative financial instruments for speculative or trading purposes.
As of April 30, 2008, cash, cash equivalents and short-term investments totaled $163.0 million, $0.9 million of which is classified as restricted. These investments are primarily held in money market funds, commercial paper and corporate securities. We adhere to an investment policy that is intended to ensure the safety and preservation of our invested funds by limiting default risk, market risk and reinvestment risk. The fair value of our investment portfolio would not be significantly impacted by either a 100 basis point increase or decrease in market interest rates, due principally to the short-term nature of the majority of our investment portfolio.
Foreign Currency Exchange Rate Risk
We sell our products throughout the world. As a result, our financial results could be affected by factors such as changes in foreign currency exchange rates or weak economic conditions in foreign markets. Because all of our sales are currently billed and collected in U.S. dollars, a strengthening of the dollar could make our products less price-competitive in foreign markets. On the other hand, a weakening of the dollar could make our products more price-competitive in foreign markets. If the events described above were to occur, our net revenue and earnings could be materially affected, since a significant portion of our net revenue and earnings are derived from international operations. For the fiscal years 2008, 2007 and 2006, approximately 53.2%, 53.4% and 50.0% respectively, of our total net revenue were derived from customers outside of North America. Further, substantially all of the expenses of operating our foreign subsidiaries are incurred in foreign currencies. As a result, our U.S. dollar earnings and net cash flows from international operations may be affected by changes in foreign currency exchange rates. However, we do not consider the market risk associated with our international operations to be material. We do not currently use derivative financial instruments for hedging or speculative purposes.
49
Item 8. Financial Statements and Supplementary Data
Index to Consolidated Financial Statements
50
REPORT OF INDEPENDENT REGISTERED PUBLIC ACCOUNTING FIRM
The Board of Directors and Stockholders of Blue Coat Systems, Inc.
We have audited the accompanying consolidated balance sheets of Blue Coat Systems, Inc. as of April 30, 2008 and 2007, and the related consolidated statements of operations, stockholders’ equity, and cash flows for each of the three years in the period ended April 30, 2008. Our audits also included the financial statement schedule listed in the index at Item 15(2). These financial statements and schedule are the responsibility of the Company’s management. Our responsibility is to express an opinion on these financial statements and schedule based on our audits.
We conducted our audits in accordance with the standards of the Public Company Accounting Oversight Board (United States). Those standards require that we plan and perform the audit to obtain reasonable assurance about whether the financial statements are free of material misstatement. An audit includes examining, on a test basis, evidence supporting the amounts and disclosures in the financial statements. An audit also includes assessing the accounting principles used and significant estimates made by management, as well as evaluating the overall financial statement presentation. We believe that our audits provide a reasonable basis for our opinion.
In our opinion, the financial statements referred to above present fairly, in all material respects, the consolidated financial position of Blue Coat Systems, Inc. at April 30, 2008 and 2007, and the consolidated results of its operations and its cash flows for each of the three years in the period ended April 30, 2008, in conformity with U.S. generally accepted accounting principles. Also, in our opinion, the related financial statement schedule, when considered in relation to the basic financial statements taken as a whole, presents fairly in all material respects the information set forth therein.
As discussed in Notes 2, 6 and 7, to the consolidated financial statements, Blue Coat Systems, Inc. adopted Financial Accounting Standards Board Interpretation No. 48,Accounting for Uncertainty in Income Taxes, on May 1, 2007, and Statement of Financial Accounting Standards No. 123 (R) Share Based Payment, on May 1, 2006.
We also have audited, in accordance with the standards of the Public Company Accounting Oversight Board (United States), Blue Coat Systems, Inc.’s internal control over financial reporting as of April 30, 2008, based on criteria established in Internal Control—Integrated Framework issued by the Committee of Sponsoring Organizations of the Treadway Commission and our report dated June 27, 2008 expressed an unqualified opinion thereon.
/s/ ERNST & YOUNG LLP
San Jose, California
June 27, 2008
51
BLUE COAT SYSTEMS, INC.
CONSOLIDATED BALANCE SHEETS
(In thousands, except par value)
| | | | | | | | |
| | | April 30,
2008 | | | April 30,
2007 | |
ASSETS | | | | | | | | |
Current assets: | | | | | | | | |
Cash and cash equivalents | | $ | 160,974 | | | $ | 50,013 | |
Short-term investments | | | 1,204 | | | | 43,874 | |
Restricted cash equivalents | | | — | | | | 4,120 | |
Accounts receivable, net of allowance of $176 and $160, respectively | | | 59,056 | | | | 32,079 | |
Inventories | | | 262 | | | | 489 | |
Prepaid expenses and other current assets | | | 7,163 | | | | 7,536 | |
Current portion of deferred tax asset | | | 7,294 | | | | — | |
| | | | | | | | |
Total current assets | | | 235,953 | | | | 138,111 | |
Property and equipment, net | | | 14,975 | | | | 9,309 | |
Restricted cash | | | 861 | | | | 861 | |
Goodwill | | | 92,243 | | | | 92,243 | |
Identifiable intangible assets, net | | | 5,010 | | | | 6,650 | |
Other assets | | | 1,767 | | | | 1,500 | |
Non-current deferred income tax asset | | | 11,867 | | | | — | |
Investment in Packeteer | | | 25,092 | | | | — | |
| | | | | | | | |
Total assets | | $ | 387,768 | | | $ | 248,674 | |
| | | | | | | | |
LIABILITIES, REDEEMABLE CONVERTIBLE PREFERRED STOCK AND STOCKHOLDERS’ EQUITY | | | | | | | | |
Current liabilities: | | | | | | | | |
Accounts payable | | $ | 18,695 | | | $ | 12,051 | |
Accrued payroll and related benefits | | | 16,464 | | | | 11,710 | |
Deferred revenue | | | 68,242 | | | | 41,910 | |
Accrued restructuring | | | — | | | | 238 | |
Other accrued liabilities | | | 8,991 | | | | 5,808 | |
| | | | | | | | |
Total current liabilities | | | 112,392 | | | | 71,717 | |
Deferred revenue, less current portion | | | 21,318 | | | | 13,858 | |
Deferred rent, less current portion | | | 1,349 | | | | 1,585 | |
Deferred income taxes | | | — | | | | 483 | |
Other non-current liabilities | | | 1,248 | | | | 563 | |
Series A redeemable convertible preferred stock; $0.0001 par value; 0 and 42 authorized; none at April 30, 2008, 42 issued and outstanding at April 30, 2007 (Aggregate liquidation preference $42,060 at April 30, 2007) | | | — | | | | 41,879 | |
Commitments and contingencies | | | | | | | | |
Stockholders’ equity: | | | | | | | | |
Preferred stock: $0.0001 par value; issuable in series; 9,958 shares authorized; none issued or outstanding | | | — | | | | — | |
Common stock: $0.0001 par value; 200,000 shares authorized; 38,267 and 29,942 shares issued and outstanding at April 30, 2008 and 2007, respectively | | | 2 | | | | 2 | |
Additional paid-in capital | | | 1,128,903 | | | | 1,028,409 | |
Treasury stock, at cost; 276 shares held at April 30, 2008 and 2007, respectively | | | (903 | ) | | | (903 | ) |
Accumulated deficit | | | (876,362 | ) | | | (908,930 | ) |
Accumulated other comprehensive income (loss) | | | (179 | ) | | | 11 | |
| | | | | | | | |
Total stockholders’ equity | | | 251,461 | | | | 118,589 | |
| | | | | | | | |
Total liabilities, redeemable convertible preferred stock and stockholders’ equity | | $ | 387,768 | | | $ | 248,674 | |
| | | | | | | | |
The accompanying notes are an integral part of these Consolidated Financial Statements.
52
BLUE COAT SYSTEMS, INC.
CONSOLIDATED STATEMENTS OF OPERATIONS
(In thousands, except per share data)
| | | | | | | | | | | | |
| | | Year Ended April 30, | |
| | | 2008 | | | 2007 | | | 2006 | |
Net revenue: | | | | | | | | | | | | |
Product | | $ | 233,858 | | | $ | 136,770 | | | $ | 116,083 | |
Service | | | 71,581 | | | | 40,930 | | | | 25,639 | |
| | | | | | | | | | | | |
Total net revenue | | | 305,439 | | | | 177,700 | | | | 141,722 | |
Cost of net revenue: | | | | | | | | | | | | |
Product | | | 48,056 | | | | 31,779 | | | | 33,207 | |
Service | | | 23,389 | | | | 13,969 | | | | 9,841 | |
| | | | | | | | | | | | |
Total cost of net revenue | | | 71,445 | | | | 45,748 | | | | 43,048 | |
Gross profit | | | 233,994 | | | | 131,952 | | | | 98,674 | |
Operating expenses: | | | | | | | | | | | | |
Research and development | | | 51,587 | | | | 39,882 | | | | 26,785 | |
Sales and marketing | | | 128,927 | | | | 73,083 | | | | 52,829 | |
General and administrative | | | 27,909 | | | | 28,072 | | | | 13,593 | |
Amortization of intangible assets | | | 450 | | | | 619 | | | | 706 | |
Restructuring reversal | | | — | | | | (19 | ) | | | (48 | ) |
In-process technology | | | — | | | | — | | | | 3,300 | |
| | | | | | | | | | | | |
Total operating expenses | | | 208,873 | | | | 141,637 | | | | 97,165 | |
| | | | | | | | | | | | |
Operating income (loss) | | | 25,121 | | | | (9,685 | ) | | | 1,509 | |
Interest income | | | 5,870 | | | | 3,922 | | | | 2,055 | |
Other expense | | | (461 | ) | | | (311 | ) | | | (349 | ) |
| | | | | | | | | | | | |
Income (loss) before income taxes | | | 30,530 | | | | (6,074 | ) | | | 3,215 | |
Provision (benefit) for income taxes | | | (2,038 | ) | | | 1,124 | | | | 275 | |
| | | | | | | | | | | | |
Net income (loss) | | $ | 32,568 | | | $ | (7,198 | ) | | $ | 2,940 | |
| | | | | | | | | | | | |
Net income (loss) per common share: | | | | | | | | | | | | |
Basic | | $ | 0.93 | | | $ | (0.25 | ) | | $ | 0.11 | |
| | | | | | | | | | | | |
Diluted | | $ | 0.82 | | | $ | (0.25 | ) | | $ | 0.10 | |
| | | | | | | | | | | | |
Weighted average shares used in computing net income (loss) per common share: | | | | | | | | | | | | |
Basic | | | 35,179 | | | | 29,188 | | | | 25,930 | |
| | | | | | | | | | | | |
Diluted | | | 39,659 | | | | 29,188 | | | | 29,284 | |
| | | | | | | | | | | | |
The accompanying notes are an integral part of these Consolidated Financial Statements.
53
BLUE COAT SYSTEMS, INC.
CONSOLIDATED STATEMENTS OF STOCKHOLDERS’ EQUITY
(In thousands)
| | | | | | | | | | | | | | | | | | | | | | | | | | | | | | | | |
| | | Common Stock | | Additional
Paid-In
Capital | | | Treasury
Stock | | | Deferred
Stock-Based
Compensation | | | Accumulated
Deficit | | | Accumulated
Other
Comprehensive
Income (Loss) | | | Total | |
| | Shares | | Amount | | | Shares | | | Amount | | | | | |
Balances at April 30, 2005 | | 24,872 | | $ | 1 | | $ | 973,530 | | | (280 | ) | | $ | (903 | ) | | $ | (2,729 | ) | | $ | (904,672 | ) | | $ | 1 | | | $ | 65,228 | |
Components of comprehensive income: | | | | | | | | | | | | | | | | | | | | | | | | | | | | | | | | |
Net income | | — | | | — | | | — | | | — | | | | — | | | | — | | | | 2,940 | | | | — | | | | 2,940 | |
Net unrealized loss on available for sale securities | | — | | | — | | | — | | | — | | | | — | | | | — | | | | — | | | | (2 | ) | | | (2 | ) |
| | | | | | | | | | | | | | | | | | | | | | | | | | | | | | | | |
Total comprehensive income | | | | | | | | | | | | | | | | | | | | | | | | | | | | | | | 2,938 | |
| | | | | | | | | | | | | | | | | | | | | | | | | | | | | | | | |
Issuance of common stock under employee stock option and employee stock purchase plans | | 1,804 | | | 1 | | | 9,484 | | | — | | | | — | | | | — | | | | — | | | | — | | | | 9,485 | |
Deferred stock-based compensation | | — | | | — | | | 487 | | | — | | | | — | | | | (487 | ) | | | — | | | | — | | | | — | |
Common stock issued in Permeo acquisition | | 2,638 | | | — | | | 29,350 | | | — | | | | — | | | | — | | | | — | | | | — | | | | 29,350 | |
Deferred stock-based compensation related to Permeo acquisition | | — | | | — | | | — | | | — | | | | — | | | | (426 | ) | | | — | | | | — | | | | (426 | ) |
Amortization of deferred stock-based compensation | | — | | | — | | | — | | | — | | | | — | | | | 1,741 | | | | — | | | | — | | | | 1,741 | |
Stock-based compensation related to modified employee stock options | | — | | | — | | | 1,642 | | | — | | | | — | | | | — | | | | — | | | | — | | | | 1,642 | |
Exercise of Ositis warrants | | — | | | — | | | — | | | 4 | | | | — | | | | — | | | | — | | | | — | | | | — | |
| | | | | | | | | | | | | | | | | | | | | | | | | | | | | | | | |
Balances at April 30, 2006 | | 29,314 | | | 2 | | | 1,014,493 | | | (276 | ) | | | (903 | ) | | | (1,901 | ) | | | (901,732 | ) | | | (1 | ) | | | 109,958 | |
Components of comprehensive loss: | | | | | | | | | | | | | | | | | | | | | | | | | | | | | | | | |
Net loss | | — | | | — | | | — | | | — | | | | — | | | | — | | | | (7,198 | ) | | | — | | | | (7,198 | ) |
Net unrealized gain on available for sale securities | | — | | | — | | | — | | | — | | | | — | | | | — | | | | — | | | | 12 | | | | 12 | |
| | | | | | | | | | | | | | | | | | | | | | | | | | | | | | | | |
Total comprehensive loss | | | | | | | | | | | | | | | | | | | | | | | | | | | | | | | (7,186 | ) |
| | | | | | | | | | | | | | | | | | | | | | | | | | | | | | | | |
Issuance of common stock under employee stock option | | 184 | | | — | | | 649 | | | — | | | | — | | | | — | | | | — | | | | — | | | | 649 | |
Common stock issued in the acquisition of certain assets of the NetCache business | | 720 | | | — | | | 5,668 | | | — | | | | — | | | | — | | | | — | | | | — | | | | 5,668 | |
Elimination of deferred compensation related to adoption of SFAS 123(R) | | — | | | — | | | (1,901 | ) | | — | | | | — | | | | 1,901 | | | | — | | | | — | | | | — | |
Stock-based compensation expenses | | — | | | — | | | 9,500 | | | — | | | | — | | | | — | | | | — | | | | — | | | | 9,500 | |
| | | | | | | | | | | | | | | | | | | | | | | | | | | | | | | | |
Balances at April 30, 2007 | | 30,218 | | | 2 | | | 1,028,409 | | | (276 | ) | | | (903 | ) | | | — | | | | (908,930 | ) | | | 11 | | | | 118,589 | |
Components of comprehensive income: | | | | | | | | | | | | | | | | | | | | | | | | | | | | | | | | |
Net income | | — | | | — | | | — | | | — | | | | — | | | | — | | | | 32,568 | | | | — | | | | 32,568 | |
Net unrealized (loss) on available for sale securities | | — | | | — | | | — | | | — | | | | — | | | | — | | | | — | | | | (190 | ) | | | (190 | ) |
| | | | | | | | | | | | | | | | | | | | | | | | | | | | | | | | |
Total comprehensive gain | | | | | | | | | | | | | | | | | | | | | | | | | | | | | | | 32,378 | |
| | | | | | | | | | | | | | | | | | | | | | | | | | | | | | | | |
Common shares issued under stock option and stock purchase plans | | 3,525 | | | — | | | 29,793 | | | — | | | | — | | | | — | | | | — | | | | — | | | | 29,793 | |
Tender offer | | | | | | | | (2,683 | ) | | — | | | | — | | | | — | | | | — | | | | — | | | | (2,683 | ) |
Tax benefit from stock-based awards | | — | | | — | | | 14,518 | | | — | | | | — | | | | — | | | | — | | | | — | | | | 14,518 | |
Stock-based compensation expenses | | — | | | — | | | 16,806 | | | — | | | | — | | | | — | | | | — | | | | — | | | | 16,806 | |
Conversion of preferred stock into common | | 4,800 | | | — | | | 42,060 | | | — | | | | — | | | | — | | | | — | | | | — | | | | 42,060 | |
| | | | | | | | | | | | | | | | | | | | | | | | | | | | | | | | |
Balances at April 30, 2008 | | 38,543 | | $ | 2 | | $ | 1,128,903 | | | (276 | ) | | $ | (903 | ) | | $ | — | | | $ | (876,362 | ) | | $ | (179 | ) | | $ | 251,461 | |
| | | | | | | | | | | | | | | | | | | | | | | | | | | | | | | | |
The accompanying notes are an integral part of these Consolidated Financial Statements.
54
BLUE COAT SYSTEMS, INC.
CONSOLIDATED STATEMENTS OF CASH FLOWS
(In thousands)
| | | | | | | | | | | | |
| | | Year Ended April 30, | |
| | | 2008 | | | 2007 | | | 2006 | |
Operating Activities | | | | | | | | | | | | |
Net income (loss) | | $ | 32,568 | | | $ | (7,198 | ) | | $ | 2,940 | |
Adjustments to reconcile net income (loss) to net cash provided by operating activities: | | | | | | | | | | | | |
Depreciation | | | 5,557 | | | | 3,919 | | | | 2,440 | |
Amortization | | | 1,845 | | | | 2,000 | | | | 1,514 | |
Stock-based compensation | | | 16,806 | | | | 9,500 | | | | 3,381 | |
Accretion of preferred stock issuance costs | | | 181 | | | | — | | | | — | |
Tax benefit of stock option deduction | | | 14,518 | | | | — | | | | — | |
Excess tax benefit of stock option deductions | | | (14,000 | ) | | | — | | | | — | |
Restructuring reversal | | | — | | | | (19 | ) | | | (48 | ) |
In-process technology | | | — | | | | — | | | | 3,300 | |
Loss (gain) on disposition of equipment | | | 18 | | | | (35 | ) | | | 230 | |
Changes in operating assets and liabilities: | | | | | | | | | | | | |
Accounts receivable | | | (26,977 | ) | | | (9,794 | ) | | | (10,573 | ) |
Inventories | | | 227 | | | | (54 | ) | | | (85 | ) |
Prepaid expenses and other current assets | | | 373 | | | | (3,641 | ) | | | (298 | ) |
Other assets | | | (472 | ) | | | (969 | ) | | | (19 | ) |
Accounts payable | | | 6,644 | | | | 6,614 | | | | 1,839 | |
Accrued payroll and related benefits | | | 2,071 | | | | 4,259 | | | | 2,050 | |
Accrued restructuring | | | (238 | ) | | | (637 | ) | | | (2,701 | ) |
Other accrued liabilities | | | 3,715 | | | | 1,422 | | | | (259 | ) |
Deferred rent | | | (83 | ) | | | 132 | | | | 1,996 | |
Deferred income taxes | | | (19,644 | ) | | | 483 | | | | — | |
Deferred revenue | | | 33,792 | | | | 21,978 | | | | 16,715 | |
| | | | | | | | | | | | |
Net cash provided by operating activities | | | 56,901 | | | | 27,960 | | | | 22,422 | |
Investing Activities | | | | | | | | | | | | |
Proceeds from sale of equipment | | | — | | | | 148 | | | | 35 | |
Purchases of property and equipment | | | (11,241 | ) | | | (5,282 | ) | | | (6,717 | ) |
Proceeds from sale and maturities of short-term investments | | | 164,489 | | | | 87,082 | | | | 576 | |
Purchases of short-term investments | | | (121,831 | ) | | | (124,368 | ) | | | (10,200 | ) |
Investment in Packeteer | | | (25,270 | ) | | | — | | | | — | |
Acquisition of Permeo, net of cash acquired | | | — | | | | (151 | ) | | | (15,796 | ) |
Release of escrow from NetCache acquisition | | | 4,120 | | | | — | | | | — | |
Acquisition of NetCache | | | — | | | | (24,894 | ) | | | — | |
| | | | | | | | | | | | |
Net cash provided by (used in) investing activities | | | 10,267 | | | | (67,465 | ) | | | (32,102 | ) |
Financing Activities | | | | | | | | | | | | |
Net proceeds from issuance of common stock | | | 29,793 | | | | 649 | | | | 9,486 | |
Excess tax benefit from stock-based compensation | | | 14,000 | | | | — | | | | — | |
Net proceeds from sales of Series A redeemable convertible preferred stock | | | — | | | | 41,879 | | | | — | |
| | | | | | | | | | | | |
Net cash provided by financing activities | | | 43,793 | | | | 42,528 | | | | 9,486 | |
| | | | | | | | | | | | |
Net increase (decrease) in cash and cash equivalents | | | 110,961 | | | | 3,023 | | | | (194 | ) |
Cash and cash equivalents at beginning of period | | | 50,013 | | | | 46,990 | | | | 47,184 | |
| | | | | | | | | | | | |
Cash and cash equivalents at end of period | | $ | 160,974 | | | $ | 50,013 | | | $ | 46,990 | |
| | | | | | | | | | | | |
Supplemental schedule of non-cash investing and financing activities | | | | | | | | | | | | |
Conversion of Series A redeemable convertible preferred stock | | $ | 42,060 | | | $ | — | | | $ | — | |
Cash paid for interest | | $ | 257 | | | $ | 248 | | | $ | 6 | |
Issuance of common stock for acquisitions | | $ | — | | | $ | 5,668 | | | $ | 29,350 | |
Cash paid for income taxes, net of refunds | | $ | 916 | | | $ | 315 | | | $ | 110 | |
The accompanying notes are an integral part of these Consolidated Financial Statements.
55
Note 1. Business
Blue Coat Systems, Inc., also referred to in this report as “we,” “us” or the “Company,” was incorporated in Delaware on March 13, 1996. We sell a family of products, including both intelligent hardware appliances and client software, that secure and accelerate the delivery of business applications and other information over a Wide Area Network (“WAN”), or the public Internet (also known as the Web). Our products accelerate the performance of our customers’ business applications, and work with both applications on a customer’s computer systems and applications hosted by external providers. In addition to enhancing the performance of applications, our products also allow customers to safely use the Internet by providing security from malicious code and inappropriate content. Our appliances also enable policy-based control and centralized management of communications between users and applications across the WAN, Internet and across customers’ internal networks, and are delivered to end users in several countries worldwide.
Note 2. Summary of Significant Accounting Policies
Basis of Presentation
The consolidated financial statements include the accounts of Blue Coat Systems, Inc. and those of our subsidiaries, all of which are wholly owned. All inter-company balances and transactions have been eliminated.
The functional currency of our domestic and foreign operations is the United States dollar. Accordingly, the effects of foreign currency transactions, and of remeasuring the financial condition and results of operations from local currencies into the functional currency, are included in “other income (expense)” in the accompanying consolidated statements of operations. These amounts were not material during any of the three years in the period ended April 30, 2008. In management’s opinion, the accompanying financial statements reflect all adjustments, consisting of normal recurring accruals, considered necessary for a fair presentation of the results for the periods presented.
The consolidated financial statements for the fiscal years ended April 30, 2008, 2007 and 2006 include the accounts and operating results of the NetCache business acquired from Network Appliance, Inc., and Permeo Technologies, Inc., beginning September 11, 2006, and March 3, 2006, respectively.
On August 16, 2007, our Board of Directors approved a two-for-one forward stock split of our common stock. The stock split was effected by the issuance of a stock dividend of one share of our common stock for each share of our common stock issued and outstanding as of the record date of September 13, 2007. The split-adjusted stock began trading on the NASDAQ Global Market on October 4, 2007. Our stock is listed on the NASDAQ Global Select Market. All share numbers in this document reflect our capital structure as of the end of the fiscal year and are therefore on a post-split basis. Shares authorized and par value were not adjusted as they were not affected by the stock split.
Reclassifications
Certain prior year amounts have been reclassified to conform to the current period’s presentation.
Use of Estimates
The preparation of consolidated financial statements and related disclosures in conformity with accounting principles generally accepted in the United States requires management to make estimates and assumptions that affect the reported amounts of assets and liabilities, and disclosure of contingent assets and liabilities, at the dates of the consolidated financial statements, and the reported amounts of net revenue and expenses during the reporting periods. Actual results may differ from these estimates, and such differences could be material to our consolidated financial condition and results of operations.
56
Revenue Recognition
Our products include software that is essential to the functionality of the appliances. Additionally, we provide unspecified software upgrades and enhancements related to the appliances through maintenance contracts for most of our products. Accordingly, we account for revenue in accordance with Statement of Position No. 97-2, “Software Revenue Recognition,” (“SOP 97-2”) and all related interpretations. We recognize revenue when all of the following criteria are met: persuasive evidence of an arrangement exists; delivery or performance has occurred; the sales price is fixed or determinable and collectibility is reasonably assured.
We define each of the four criteria above as follows:
Persuasive evidence of an arrangement exists. Evidence of an arrangement generally consists of customer purchase orders and, in certain instances, sales contracts or agreements.
Delivery or performance has occurred.Shipping terms and related documents, or written evidence of customer acceptance, when applicable, are used to verify delivery or performance. Most of our sales are made through distributors under agreements allowing for certain stock rotation rights. Net revenue and the related cost of net revenue resulting from shipments to distributors are deferred until the distributors report that our products have been sold to a customer. Product revenue in China is deferred until the customer registers the proxy appliance.
For sales made direct to end-users and value-added resellers, we recognize product revenue upon transfer of title and risk of loss, which generally is upon shipment. We do not accept orders from value-added resellers when we are aware that the value-added reseller does not have an order from an end user customer. We do not have significant obligations for future performance, such as rights of return or pricing credits, associated with sales to end users and value-added resellers.
The sales price is fixed or determinable. We assess whether the sales price is fixed or determinable based on payment terms and whether the sales price is subject to refund or adjustment.
Collectibility is reasonably assured. Probability of collection is assessed on a customer-by-customer basis. Our customers are subjected to a credit review process that evaluates the customers’ financial condition and ability to pay for our products and services. If it is determined from the outset of an arrangement that collection is not probable based upon the review process, revenue is not recognized until cash receipt.
For products in an arrangement that includes multiple elements, such as appliances, maintenance, content filtering software or anti-virus software, we use the residual method to recognize revenue for the delivered elements. Under the residual method, the amount of revenue allocated to delivered elements equals the total arrangement consideration less the aggregate fair value of any undelivered elements. Provided that VSOE exists for all undelivered elements, vendor specific objective evidence of fair value is based on the price charged when the element is sold separately. We analyze our stand alone maintenance renewals by sales channel and geography (strata). We determine the VSOE of fair value for maintenance by analyzing our stand alone maintenance renewals noting that a substantial majority of transactions fall within a narrow range for each stratum. In limited cases, vendor specific objective evidence of fair value is based on management determined prices. If evidence of the fair value of one or more undelivered elements does not exist, all revenue is generally deferred and recognized at the earlier of delivery of those elements or when fair value can be established for the remaining undelivered elements. When VSOE of fair value cannot be determined for an undelivered element, revenue for the entire arrangement is recognized ratably over the maintenance or subscription period.
Maintenance and subscription revenue is initially deferred and recognized ratably over the life of the contract, with the related expenses recognized as incurred. Maintenance and subscription contracts usually have a term of one to three years. Unearned maintenance and subscription revenue is included in deferred revenue.
57
Shipping Costs
When we bill customers for shipping, we record shipping costs in both net revenue and cost of net revenue. If we do not charge customers for shipping, the cost incurred for shipping are reflected in cost of net revenue.
Allowance for Doubtful Accounts
We perform ongoing credit evaluations of our customers’ financial condition and maintain an allowance for doubtful accounts. We analyze accounts receivable and historical bad debts, customer concentrations, customer solvency, current economic and geographic trends, and changes in customer payment terms and practices when evaluating the adequacy of such allowance, and any required changes in the allowance are recorded as general and administrative expense.
Stock-Based Compensation
At April 30, 2008, we have two active stock-based employee compensation plans, which are described more fully in Note 6. Prior to May 1, 2006, we accounted for stock-based employee compensation plans under the recognition and measurement provisions of Accounting Principles Board (APB) Opinion No. 25,“Accounting for Stock Issued to Employees,”and related Interpretations, as permitted by FASB Statement (SFAS) 123,“Accounting for Stock-Based Compensation.”
Effective May 1, 2006, we adopted the fair value recognition provisions of SFAS No. 123(R), “Share-Based Payment,” using the modified prospective transition method. Under that transition method, stock-based compensation cost recognized after May 1, 2006 includes: (a) compensation cost for all share-based payments granted prior to, but not yet vested as of, May 1, 2006, based on the grant date fair value estimated in accordance with the original provisions of SFAS No. 123, and (b) compensation cost for all share-based payments granted on or after May 1, 2006, based on the grant date fair value estimated in accordance with the provisions of SFAS No. 123(R). We estimate the fair value of stock options granted using the Black-Scholes option valuation model. Further, we have elected to use the straight-line method of amortization for stock-based compensation related to stock options granted after May 1, 2006. We will continue to amortize stock-based compensation using the graded method for stock options granted prior to May 1, 2006. In March 2005, the Securities and Exchange Commission issued Staff Accounting Bulletin (SAB) No. 107, which provides supplemental implementation guidance for SFAS No. 123(R). We have applied the provisions of SAB 107 in our adoption of SFAS No. 123(R).
In November 2005, the FASB issued FASB Staff Position No. FAS 123(R)-3, “Transition Election Related to Accounting for the Tax Effects of Share-Based Payment Awards” (“SFAS No. 123(R)-3”). We have adopted the simplified method to calculate the beginning balance of the additional paid-in-capital (“APIC”) pool of the excess tax benefit, and to determine the subsequent impact on the APIC pool and our Statements of Cash Flows of the tax effects of employee stock-based compensation awards that were outstanding upon our adoption of SFAS No. 123(R).
58
The following table illustrates the effect on our net income (loss) and net income (loss) per share for the year ended April 30, 2006 as if the Company had applied the fair value recognition provisions of SFAS No. 123 to stock-based compensation using the Black-Scholes valuation model (in thousands, except per share amounts):
| | | | |
| | | Year Ended
April 30, 2006 | |
Net income, as reported | | $ | 2,940 | |
Stock-based employee compensation expense included in the determination of net income, as reported | | | 3,381 | |
Stock-based compensation for stock awards issued related to Ositis acquisition | | | — | |
Stock-based employee compensation expense that would have been included in the determination of net loss if the fair value method had been applied to all awards | | | (13,669 | ) |
| | | | |
Pro forma net loss | | $ | (7,348 | ) |
| | | | |
Basic net income (loss) per common share: | | | | |
As reported | | $ | 0.11 | |
| | | | |
Pro forma | | $ | (0.29 | ) |
| | | | |
Diluted net income (loss) per common share: | | | | |
As reported | | $ | 0.10 | |
| | | | |
Pro forma | | $ | (0.29 | ) |
| | | | |
Cash Equivalents and Short-Term Investments
We consider all highly liquid investments with insignificant interest rate risk and original maturities of three months or less to be cash equivalents.
Short-term investments consist primarily of money market funds, commercial paper and corporate securities with original maturities between three months and one year. We determine the appropriate classification of our investments at the time of purchase and evaluate such designation as of each balance sheet date based on our intent and ability to use such funds for current operations. To date, all of our investments have been classified as available-for-sale and are carried at fair value, with unrealized gains and losses, if any, included in accumulated other comprehensive income (loss) in stockholders’ equity. The fair value of these securities is based on quoted market prices. Realized gains and losses and declines in value of securities judged to be other than temporary are included in other expense. The cost of securities sold is based on a specific identification methodology. Interest and dividends on all securities are included in interest income.
Fair Value of Financial Instruments
The carrying amounts of our financial instruments, which include cash, cash equivalents, short-term investments and restricted cash and cash equivalents, approximate their respective fair values based on quoted market prices.
Concentration and Other Risks
Financial instruments that potentially subject us to credit risk consist of demand deposit accounts, money market accounts, commercial paper, corporate debt securities and trade receivables. We maintain demand deposit and money market accounts with financial institutions of high credit standing. We invest only in high-quality, investment grade securities and limit investment exposure in any one issue. Investments are classified as cash equivalents or short-term investments in our consolidated balance sheets for the years ended April 30, 2008 and
59
2007. We believe the financial risks associated with these financial instruments are minimal. We have not experienced material losses from our investments in these securities.
Generally, we do not require collateral for sales to customers. However, we perform on-going credit valuations of our customers’ financial condition and maintain an allowance for doubtful accounts. Alternative Data Technology, Inc. accounted for 12.2% of our net revenue during the year ended April 30, 2008. ComputerLinks AG accounted for 11.2% of our net revenue during the years ended April 30, 2007. Westcon Group, Inc. accounted for 10.2% of our net revenue during the year ended April 30, 2006. As of April 30, 2008 and 2007, no customer accounted for more than 10.0% of gross accounts receivable.
We currently purchase several key parts and components used in the manufacture of our products from a limited number of suppliers. Generally we have been able to obtain an adequate supply of such parts and components. However, an extended interruption in the supply of parts and components currently obtained from our suppliers could adversely affect our business and consolidated financial statements.
Inventories
Inventories consist of raw materials and finished goods. Inventories are recorded at the lower of cost, using the first-in, first-out method, or market after appropriate consideration has been given to obsolescence and inventory in excess of anticipated future demand. In assessing the ultimate recoverability of inventories, we are required to make estimates regarding future customer demand and market conditions.
Property and Equipment
Property and equipment are stated at cost, subject to adjustments for impairment, less accumulated depreciation and amortization. Depreciation and amortization are provided on a straight-line basis over the following estimated useful lives:
| | |
Software | | 3 years |
Furniture and fixtures | | 3 years |
Computer and office equipment | | 3-5 years |
Leasehold improvements | | Shorter of useful life or remaining lease term |
Valuation of Goodwill
We perform annual goodwill impairment tests in accordance with FASB SFAS No. 142,Goodwill and Other Intangible Assets, during our fourth fiscal quarter, or whenever events or changes in circumstances indicate that the carrying amount of goodwill may not be recoverable. The first step of the test identifies whether potential impairment may have occurred, while the second step of the test measures the amount of the impairment, if any. Impairment is recognized when the carrying amount of goodwill exceeds its fair value. The process of evaluating the potential impairment of goodwill is highly subjective and requires significant judgment. For purposes of the annual impairment test, we consider our market capitalization on the date of the impairment test since we have only one reporting unit. We performed our recurring annual review of goodwill in the fourth quarter of fiscal 2008 and concluded that no impairment existed at the end of our fiscal year 2008.
Long-Lived and Identifiable Intangible Assets
We periodically evaluate potential impairments of our long-lived assets, including identifiable intangible assets, in accordance with FASB SFAS No. 144,Accounting for the Impairment or Disposal of Long-Lived Assets. We evaluate long-lived assets, including identifiable intangible assets, for impairment whenever events or changes in circumstances indicate that the carrying amount of the assets may not be recoverable. Events or
60
changes in circumstances that could result in an impairment review include, but are not limited to, significant underperformance relative to historical or projected future operating results, significant changes in the manner of use of the acquired assets or the strategy for our overall business and significant negative industry or economic trends. Impairment is recognized when the carrying amount of an asset exceeds its fair value as calculated on a discounted cash flow basis.
Acquisition-related identified intangible assets are amortized on a straight-line basis over their estimated economic lives of three to seven years for purchased technology, five years for core technology and five to seven years for customer contracts.
Restructuring Liabilities
We initiated certain restructuring activities prior to December 31, 2002 and have recorded them in accordance with EITF Issue No. 94-3,Liability Recognition for Certain Employee Termination Benefits and Other Costs to Exit an Activity (Including Certain Costs Incurred in a Restructuring).We have accrued through charges to restructuring in our consolidated financial statements, various restructuring liabilities related to employee severance costs, facilities closure and lease abandonment costs, and contract termination costs. All restructuring activities were completed by the end of the second quarter of fiscal 2008.
Research and Development
We account for costs related to research, design and development of our products in accordance with Statement of Financial Accounting Standards (“SFAS”) No. 86, “Accounting for Costs of Computer Software to be Sold, Leased, or Otherwise Marketed”.Development costs for software to be sold or otherwise marketed are included in research and development.
Guarantees, Indemnifications and Warranty Obligations
Our customer agreements generally include certain provisions for indemnifying such customers against liabilities if our products infringe a third party’s intellectual property rights. To date, we have not incurred any material costs as a result of such indemnification provisions and have not accrued any liabilities related to such obligations in the accompanying consolidated financial statements.
Our Bylaws provide that we shall indemnify our directors and officers to the fullest extent permitted by Delaware law, including in circumstances in which indemnification is otherwise discretionary under Delaware law. We have also entered into indemnification agreements with each of our executive officers and directors containing provisions that may require us, among other things, to indemnify such officers and directors against certain liabilities that may arise by reason of their status or service as directors or officers and to advance their expenses incurred as a result of any proceeding against them as to which they could be indemnified. We expect to have indemnification obligations to certain current and former officers and directors and other employees in connection with the regulatory investigations and litigation relating to our historical stock option granting practices.
We accrue for warranty expenses in our cost of revenue at the time revenue is recognized and maintain an accrual for estimated future warranty obligations based upon the relationship between historical and anticipated warranty costs and revenue volumes. If actual warranty expenses are greater than those projected, additional charges against earnings would be required. If actual warranty expenses are less than projected, obligations would be reduced, providing a positive impact on our reported results. We generally provide a one-year warranty on hardware products and a 90-day warranty on software products.
61
Contingencies
From time to time we are involved in various claims and legal proceedings. If management believes that a loss arising from a matter is probable and can be reasonably estimated, we record the amount of the loss, or the minimum estimated liability when the loss is estimated using a range and no point within the range is more probable than any other. As additional information becomes available, any potential liability related to the matter is assessed and the estimate is revised, if necessary. Litigation is subject to inherent uncertainties, and unfavorable rulings could occur. An unfavorable ruling could result in a material adverse impact on the results of operations for the period in which the ruling occurs, or future periods.
Advertising Costs
Advertising costs are charged to sales and marketing expense as incurred. Advertising costs were $2.1 million for the year ended April 30, 2008 and $0.3 million for each of the years ended April 30, 2007 and 2006.
Comprehensive Income
We report comprehensive income in accordance with FASB SFAS No. 130,Reporting Comprehensive Income. Included in other comprehensive income are adjustments to record unrealized gains and losses on available-for-sale securities. These adjustments are aggregated in accumulated other comprehensive income (loss) in the stockholders’ equity section of the balance sheet.
Per Share Amounts
Basic net income per common share and diluted net income per common share are presented in conformity with FASB SFAS No. 128,Earnings Per Share, for all periods presented. Basic net income per share is computed by dividing net income (loss) by the weighted-average number of shares outstanding during the period. Diluted net income per share is computed using the weighted-average number of shares of common stock outstanding, including dilutive common shares subject to repurchase and potential shares assuming the (i) exercise of dilutive stock options and warrants using the treasury stock method; (ii) issuance of committed but unissued stock awards; and (iii) shares issuable upon the assumed conversion of outstanding Series A Redeemable Convertible Preferred Stock.
Under the treasury stock method, outstanding options are assumed to be exercised if their exercise price is below the average fair market value of our common stock for a given period, and the proceeds from the exercise of such options are assumed to be used by us to repurchase shares of our common stock on the open market. Additionally, unearned stock-based compensation, significant amounts of which was recorded as part of our restatement and has been presented in stockholders’ equity, is considered proceeds for purposes of applying the treasury stock method to determine incremental common shares to be included in diluted shares in periods in which we have reported net income. For fiscal years 2008, 2007 and 2006, options to purchase 1,435,938,3,699,230 and 988,854 shares of common stock, respectively, were considered anti-dilutive and, therefore, were not included in the computation of diluted earnings per share.
62
The following table presents the calculation of weighted average common shares used in the computations of basic and diluted per share amounts presented in the accompanying consolidated statements of operations (in thousands, except for per share data):
| | | | | | | | | | |
| | | Year Ended April 30, |
| | | 2008 | | 2007 | | | 2006 |
Net income (loss) | | $ | 32,568 | | $ | (7,198 | ) | | $ | 2,940 |
Basic: | | | | | | | | | | |
Weighted-average shares of common stock outstanding | | | 35,179 | | | 29,188 | | | | 25,930 |
| | | | | | | | | | |
Basic net income (loss) per share | | $ | 0.93 | | $ | (0.25 | ) | | $ | 0.11 |
| | | | | | | | | | |
Diluted: | | | | | | | | | | |
Weighted-average common shares used in computing basic net income per share | | | 35,179 | | | 29,188 | | | | 25,930 |
Add: Weighted average employee stock options and warrants | | | 2,527 | | | — | | | | 3,216 |
Add: Weighted average dilutive effect of escrow shares | | | — | | | — | | | | 56 |
Add: Other weighted average dilutive potential common stock | | | 153 | | | — | | | | 82 |
Add: Series A Preferred weighted average dilutive potential common stock | | | 1,800 | | | — | | | | — |
| | | | | | | | | | |
Weighted average common shares used in computing diluted net income (loss) per share | | | 39,659 | | | 29,188 | | | | 29,284 |
| | | | | | | | | | |
Diluted net income (loss) per share | | $ | 0.82 | | $ | (0.25 | ) | | $ | 0.10 |
| | | | | | | | | | |
Recent Accounting Pronouncements
In September 2006, the FASB issued SFAS No. 157,Fair Value Measurements(“SFAS No. 157”). SFAS No. 157 provides a framework for measuring fair value, clarifies the definition of fair value, and expands disclosures regarding fair value measurements. SFAS No. 157 does not require any new fair value measurements and eliminates inconsistencies in guidance found in various prior accounting pronouncements. We are required to adopt SFAS No. 157 for our fiscal year beginning May 1, 2008. The adoption of SFAS 157 is not expected to have a significant impact on our consolidated financial statements.
In February 2007, the FASB issued SFAS No. 159,The Fair Value Option for Financial Assets and Financial Liabilities—Including an Amendment of FASB Statement No. 115(“SFAS No. 159”). SFAS No. 159 allows measurement at fair value of eligible financial assets and liabilities that are not otherwise measured at fair value. If the fair value option for an eligible item is elected, unrealized gains and losses for that item shall be reported in current earnings at each subsequent reporting date. SFAS No. 159 also establishes presentation and disclosure requirements designed to draw comparison between the different measurement attributes a company elects for similar types of assets and liabilities. This statement is effective for our fiscal year beginning May 1, 2008. The adoption of SFAS 159 is not expected to have a significant impact on our consolidated financial statements.
In June 2007, the FASB ratified a consensus opinion reached by the EITF on EITF Issue 07-3, “Accounting for Nonrefundable Advance Payments for Goods or Services Received for Use in Future Research and Development Activities” (“EITF 07-3”). The guidance in EITF 07-3 requires us to defer and capitalize nonrefundable advance payments made for goods or services to be used in research and development activities until the goods have been delivered or the related services have been performed. If the goods are no longer expected to be delivered or the services are no longer expected to be performed, we would be required to expense the related capitalized advance payments. EITF 07-3 is effective for fiscal years beginning after December 15, 2007 and is to be applied prospectively to new contracts entered into on or after the commencement of that fiscal year. Early adoption is not permitted. Retrospective application of EITF 07-3 also is not permitted. We intend to
63
adopt EITF 07-3 effective May 1, 2008 and do not expect the pronouncement to have a material effect on our consolidated financial statements.
In December 2007, the FASB issued SFAS No. 141R, “Business Combinations” (“SFAS No. 141R”). SFAS No. 141R amends SFAS 141 and provides revised guidance for recognizing and measuring identifiable assets and goodwill acquired, liabilities assumed, and any noncontrolling interest in the acquiree. It also provides disclosure requirements to enable users of the financial statements to evaluate the nature and financial effects of the business combination. SFAS No. 141R is effective for fiscal years beginning on or after December 15, 2008 and will be applied prospectively. This statement is effective for our fiscal year beginning May 1, 2009. We are currently evaluating the impact of adopting SFAS No. 141R on our consolidated financial statements.
In December 2007, the FASB issued SFAS No. 160, “Noncontrolling Interests in Consolidated Financial Statements—an amendment of Accounting Research Bulletin No. 51” (“SFAS 160”). SFAS 160 establishes accounting and reporting standards for ownership interests in subsidiaries held by parties other than the parent, the amount of consolidated net income attributable to the parent and to the noncontrolling interest, changes in a parent’s ownership interest and the valuation of retained noncontrolling equity investments when a subsidiary is deconsolidated. SFAS 160 also establishes disclosure requirements that clearly identify and distinguish between the interests of the parent and the interests of the noncontrolling owners. SFAS No. 160 is effective for fiscal years beginning on or after December 15, 2008. This statement is effective for our fiscal year beginning May 1, 2009. The adoption of SFAS No. 160 is not expected to have a significant impact on our consolidated financial statements.
In December 2007, the U.S. Securities and Exchange Commission (SEC) issued Staff Accounting Bulletin 110 (SAB 110) to amend the SEC’s views discussed in Staff Accounting Bulletin 107 (SAB 107) regarding the use of the simplified method in developing an estimate of the expected life of stock options in accordance with SFAS No. 123(R). SAB 110 is effective for us beginning in the first quarter of fiscal 2009. The adoption of SAB 110 is not expected to have a significant impact on our consolidated financial statements.
Note 3. Acquisitions
NetCache business from Network Appliance, Inc.
On September 11, 2006, we completed the acquisition of certain assets of the NetCache business from Network Appliance. The final consideration for the transaction consisted of $23.9 million cash consideration, an aggregate of 720,000 shares of our common stock valued at $5.7 million and $1.0 million in direct transaction costs. Of the total purchase price, $0.7 million has been allocated to the intangible assets acquired, with the balance of $29.9 million allocated to goodwill.
The NetCache business previously provided products to large enterprises to manage internet access and security and control Web content and application acceleration. NetCache was a business unit previously owned by Network Appliance, Inc. Our primary purpose for acquiring certain assets of the NetCache business was to increase our potential customer base through the conversion of existing NetCache customers to our proxy appliances. One employee joined us from Network Appliance as a result of the acquisition. Accordingly, our operating costs were not materially impacted. We have not generated a significant amount of revenue from the sale of NetCache appliances. Net revenue for the fiscal year ended April 30, 2007 and April 30, 2008 reported on our Consolidated Statement of Operations includes $1.7 million and zero, respectively, related to the sale of NetCache appliances and related service.
64
The final allocation of the estimated purchase price, based on the fair value of certain components, consisted of the following at April 30, 2008 (in thousands):
| | | |
Consideration and direct transaction costs: | | | |
Cash | | $ | 23,914 |
Fair value of Blue Coat common stock | | | 5,668 |
Direct transaction costs | | | 980 |
| | | |
Total purchase price | | $ | 30,562 |
| | | |
Allocation of purchase price: | | | |
Identifiable intangible assets | | $ | 700 |
Goodwill | | | 29,862 |
| | | |
Total purchase price | | $ | 30,562 |
| | | |
To establish the value of the intangible asset, we used an income approach and utilized a five-step process to value the intangible asset: (i) revenue associated with the intangible assets was projected; (ii) cost of goods sold was then estimated for each period in which revenue was projected; (iii) the resulting net cash flow was tax effected and reduced further by charges for the use of fixed assets, working capital and other assets necessary to generate these cash flows; (iv) the resulting net cash flows were discounted at a rate commensurate with their risk; and (v) we summed the discounted cash flows to estimate their fair market values. We then estimated the tax benefits associated with the intangible asset and this benefit was included in the value of the intangible asset.
As part of the valuation analysis, we reviewed the technology acquired and its future use after the acquisition. Several factors were considered: (i) whether or not the acquired technology had achieved technological feasibility; (ii) the time, costs and risks to complete the development of the technology; (iii) the roadmap for the technology post acquisition; (iv) the existence of any alternative use for the technology; (v) the additional use of any core technology; and (vi) the results of any enhancements or embellishments to the technology.
Using the above guidelines at the time of the acquisition, we identified one intangible asset that was valued separately from goodwill using the income approach as described above. The intangible asset identified was customer relationships. The cash flows were discounted to their present value using a discount rate of approximately 19%. As of April 30, 2008, the acquired intangible asset and its estimated useful life are as follows (in thousands):
| | | | | | | | | | | | |
Identifiable intangible assets | | Amortization
period | | Gross
Amount | | Accumulated
Amortization | | | Net Carrying
Value |
Customer relationships | | 5 years | | $ | 700 | | $ | (227 | ) | | $ | 473 |
| | | | | | | | | | | | |
Amortization expense related to the acquired intangible was $0.2 million and $87 thousand during the years ended April 30, 2008 and 2007, respectively. The amortization for customer relationships is recorded as an operating expense. Amortization expense in future periods is expected to be as follows (in thousands):
| | | |
Year Ended April 30, | | Total Amortization |
2009 | | $ | 140 |
2010 | | | 140 |
2011 | | | 140 |
2012 | | | 53 |
| | | |
| | $ | 473 |
| | | |
The acquisition of NetCache did not result in the creation of a new business segment.
65
Permeo Technologies, Inc.
On March 3, 2006, we completed the acquisition of Permeo Technologies, Inc. (“Permeo”). The purchase price of $45.3 million consisted of $15.0 million in cash consideration, 2.6 million shares of our common stock valued at $28.7 million, $1.0 million in direct transaction costs, which was fully paid as of April 30, 2007, and Permeo stock options assumed by us valued at $0.6 million. The purchase price has been allocated to the tangible and intangible assets acquired, with the excess purchase price being allocated to goodwill. Identifiable intangible assets include developed technology and customer relationships, which are being amortized to “Cost of revenue—Product” and “Operating expenses,” respectively.
The final allocation of the purchase price, based on the fair value of certain components, consisted of the following at April 30, 2008 (in thousands):
| | | | |
Consideration and direct transaction costs: | | | | |
Cash | | $ | 14,946 | |
Fair value of Blue Coat common stock | | | 28,720 | |
Direct transaction costs | | | 1,009 | |
Fair value of assumed Permeo options | | | 630 | |
| | | | |
Total purchase price | | $ | 45,305 | |
| | | | |
Allocation of purchase price: | | | | |
Cash and cash equivalents | | $ | 8 | |
Accounts receivable | | | 171 | |
Other current assets | | | 126 | |
Property and equipment | | | 429 | |
Other assets | | | 12 | |
Liabilities assumed | | | (1,895 | ) |
Deferred stock compensation | | | 426 | |
Identifiable intangible assets | | | 5,100 | |
In-process technology | | | 3,300 | |
Goodwill | | | 37,628 | |
| | | | |
Total purchase price | | $ | 45,305 | |
| | | | |
Note 4. Consolidated Balance Sheet Data
Cash, Cash equivalents and Investments
The carrying amount of cash and cash equivalents reported on the balance sheet approximates its fair value. Short-term investments consist of marketable debt securities. The fair values of investments are based upon quoted market prices.
66
The following is a summary of cash, cash equivalents and available-for-sale securities as of April 30, 2008 and 2007, respectively (in thousands):
| | | | | | | | | | | | | | | | | | | |
| | | As of April 30, |
| | | 2008 | | 2007 |
| | | Amortized
Cost | | Unrealized
Loss | | | Estimated
Fair Value | | Amortized
Cost | | Unrealized
Gain | | Estimated
Fair Value |
Cash | | $ | 1,285 | | $ | — | | | $ | 1,285 | | $ | 737 | | $ | — | | $ | 737 |
Money market funds | | | 160,550 | | | — | | | | 160,550 | | | 37,500 | | | — | | | 37,500 |
Commercial paper | | | — | | | — | | | | — | | | 33,675 | | | — | | | 33,675 |
Corporate securities | | | 1,205 | | | (1 | ) | | | 1,204 | | | 16,244 | | | 1 | | | 16,245 |
Government securities | | | — | | | — | | | | — | | | 2,977 | | | 9 | | | 2,986 |
Auction rate preferred securities | | | — | | | — | | | | — | | | 7,724 | | | 1 | | | 7,725 |
Investment in Packeteer, Inc. | | | 25,270 | | | (178 | ) | | | 25,092 | | | — | | | — | | | — |
| | | | | | | | | | | | | | | | | | | |
| | $ | 188,310 | | $ | (179 | ) | | $ | 188,131 | | $ | 98,857 | | $ | 11 | | $ | 98,868 |
| | | | | | | | | | | | | | | | | | | |
Reported as: | | | | | | | | | | | | | | | | | | | |
Cash and cash equivalents | | | | | | | | | $ | 160,974 | | | | | | | | $ | 50,013 |
Short-term investments | | | | | | | | | | 1,204 | | | | | | | | | 43,874 |
Short-term restricted cash equivalents | | | | | | | | | | — | | | | | | | | | 4,120 |
Long-term restricted cash | | | | | | | | | | 861 | | | | | | | | | 861 |
Investment in Packeteer, Inc. | | | | | | | | | | 25,092 | | | | | | | | | — |
| | | | | | | | | | | | | | | | | | | |
| | | | | | | | | $ | 188,131 | | | | | | | | $ | 98,868 |
| | | | | | | | | | | | | | | | | | | |
The following is a summary of the cost and estimated fair value of cash, cash equivalents and available-for-sale securities at April 30, 2008, by contractual maturity (in thousands):
| | | | | | |
| | | April 30, 2008 |
| | | Amortized Cost | | Estimated Fair value |
Mature in one year or less | | $ | 163,040 | | $ | 163,039 |
| | | | | | |
On April 20, 2008, the Company entered into a Stock Purchase Agreement pursuant to which it acquired 3,559,117 shares of Packeteer’s common stock for $7.10 per share from the Liverpool Limited Partnership and Elliot International, L.P. for a total of approximately $25.3 million. This investment has been classified as a long-term investment on the balance sheet at April 30, 2008 at its fair value of $25.1 million. Subsequent to this purchase, we entered into a merger agreement among us, Cooper Acquisition, Inc., a Delaware corporation and our wholly-owned subsidiary (“Merger Subsidiary”) and Packeteer, Inc., which transaction was completed on June 6, 2008, subsequent to our fiscal year end. See additional discussion of this transaction in Note 13 Subsequent Events (Unaudited).
To date we have not recorded any impairment charges on marketable securities related to other-than-temporary declines in market value. We recognize an impairment charge when the decline in the estimated fair value of a marketable security below the amortized cost is determined to be other-than-temporary. We consider various factors in determining whether to recognize an impairment charge, including the duration of time and the severity to which the fair value has been less than our amortized cost, any adverse changes in the investees’ financial condition and our intent and ability to hold the marketable security for a period of time sufficient to allow for any anticipated recovery in market value.
67
Inventories
Inventories, net consist of the following (in thousands):
| | | | | | |
| | | April 30, |
| | | 2008 | | 2007 |
Raw materials | | $ | — | | $ | 262 |
Finished goods | | | 262 | | | 227 |
| | | | | | |
Total | | $ | 262 | | $ | 489 |
| | | | | | |
Property and Equipment
Property and equipment, net consist of the following (in thousands):
| | | | | | | | |
| | | April 30, | |
| | | 2008 | | | 2007 | |
Computer and office equipment | | $ | 18,293 | | | $ | 13,509 | |
Software | | | 9,885 | | | | 6,709 | |
Furniture and fixtures | | | 1,532 | | | | 882 | |
Leasehold improvements | | | 5,119 | | | | 2,788 | |
Construction in progress | | | 491 | | | | 521 | |
| | | | | | | | |
| | | 35,320 | | | | 24,409 | |
Less accumulated depreciation and amortization | | | (20,345 | ) | | | (15,100 | ) |
| | | | | | | | |
| | $ | 14,975 | | | $ | 9,309 | |
| | | | | | | | |
Depreciation expense was $5.6 million, $3.9 million and $2.4 million for the years ended April 30, 2008, 2007 and 2006, respectively.
Goodwill
For the years ended April 30, 2008 and 2007, changes in goodwill are as follows (in thousands):
| | | | | | | |
| | | Year Ended April 30, | |
| | | 2008 | | 2007 | |
Balance, beginning of year | | $ | 92,243 | | $ | 62,462 | |
Permeo acquisition adjustment | | | — | | | (81 | ) |
NetCache acquisition | | | — | | | 29,862 | |
| | | | | | | |
Balance, end of year | | $ | 92,243 | | $ | 92,243 | |
| | | | | | | |
Intangible Assets
Our acquired intangible assets are as follows (in thousands):
| | | | | | | | | | | | |
April 30, 2008 | | Amortization
period | | Gross
Amount | | Accumulated
Amortization | | | Net Carrying
Value |
Developed technology | | 3-7 years | | $ | 6,031 | | $ | (2,785 | ) | | $ | 3,246 |
Core technology | | 5 years | | | 2,929 | | | (2,097 | ) | | | 832 |
Customer relationships | | 5-7 years | | | 2,023 | | | (1,091 | ) | | | 932 |
| | | | | | | | | | | | |
Total | | | | $ | 10,983 | | $ | (5,973 | ) | | $ | 5,010 |
| | | | | | | | | | | | |
68
| | | | | | | | | | | | |
April 30, 2007 | | Amortization
period | | Gross
Amount | | Accumulated
Amortization | | | Net Carrying
Value |
Developed technology | | 3-7 years | | $ | 6,031 | | $ | (2,114 | ) | | $ | 3,917 |
Core technology | | 5 years | | | 2,929 | | | (1,511 | ) | | | 1,418 |
Customer relationships | | 5-7 years | | | 2,023 | | | (708 | ) | | | 1,315 |
| | | | | | | | | | | | |
Total | | | | $ | 10,983 | | $ | (4,333 | ) | | $ | 6,650 |
| | | | | | | | | | | | |
Total amortization expense for the identifiable intangible assets was approximately $1.6 million, $1.8 million and $1.3 million for the years ended April 30, 2008, 2007 and 2006, respectively. As of April 30, 2008, we had no identifiable intangible assets with indefinite lives. The weighted average life of identifiable intangible assets was 4.0 years and 6.3 years as of April 30, 2008 and 2007, respectively.
Amortization expense related to intangible assets in future periods is as follows (in thousands):
| | | |
Year Ended April 30, | | Amortization |
2009 | | $ | 1,557 |
2010 | | | 1,197 |
2011 | | | 868 |
2012 | | | 781 |
2013 | | | 607 |
Thereafter | | | — |
| | | |
| | $ | 5,010 |
| | | |
Other assets
In April 2007, we entered into a license agreement under which we received a nonexclusive, perpetual, worldwide, royalty-free license to use software for a total purchase price of approximately $1.0 million. In accordance with SFAS No. 86,Accounting for the Cost of Software to be Sold, Leased or Otherwise Marketed, we capitalized the total purchase price and are amortizing it over its estimated useful life of seven years. For the year ended April 30, 2008 and 2007, amortization expense related to this capitalized software was $154,000 and $13,000, respectively and were included in the “Cost of revenue—Product” in our consolidated statement of operations.
As of April 30, 2008, amortization expense in future periods for this capitalized software is expected to be as follows (in thousands):
| | | |
Year Ended April 30, | | Amortization |
2009 | | $ | 154 |
2010 | | | 154 |
2011 | | | 154 |
2012 | | | 154 |
2013 | | | 154 |
Thereafter | | | 101 |
| | | |
| | $ | 871 |
| | | |
Accrued payroll and related benefits
| | | | | | |
| | | April 30, |
| | | 2008 | | 2007 |
Accrued payroll and related benefits | | $ | 16,464 | | $ | 11,710 |
| | | | | | |
69
At April 30, 2008 and 2007, accrued payroll and related benefits included approximately $3.3 million and $3.8 million in payroll tax accruals resulting from the disqualification of stock options caused by the revised measurement dates determined during the investigation of historical stock option granting practices.
Current Other Accrued Liabilities
Current other accrued liabilities consisted of the following (in thousands):
| | | | | | |
| | | April 30, |
| | | 2008 | | 2007 |
Professional and consulting fees | | $ | 1,410 | | $ | 625 |
Accrued royalty | | | 939 | | | 416 |
Warranty obligations | | | 434 | | | 459 |
Sales and marketing costs | | | 157 | | | 162 |
Federal and State income tax payable | | | 1,824 | | | 23 |
Foreign income tax payable | | | 430 | | | 580 |
Deferred rent | | | 697 | | | 544 |
Other | | | 3,100 | | | 2,999 |
| | | | | | |
Total current other accrued liabilities | | $ | 8,991 | | $ | 5,808 |
| | | | | | |
Warranty Obligations
Changes in our warranty obligations, which are included in the “Current other accrued liabilities” table above, for the years ended April 30, 2008 and 2007 were as follows (in thousands):
| | | | | | | | |
| | | Year Ended April 30, | |
| | | 2008 | | | 2007 | |
Beginning balances | | $ | 459 | | | $ | 319 | |
Warranties issued during the year | | | 2,055 | | | | 1,534 | |
Settlements made during the year | | | (2,080 | ) | | | (1,394 | ) |
| | | | | | | | |
Ending balances | | $ | 434 | | | $ | 459 | |
| | | | | | | | |
Deferred revenue
Deferred revenue consists of the following (in thousands):
| | | | | | |
| | | April 30, |
| | | 2008 | | 2007 |
Deferred product revenue, current | | $ | 11,178 | | $ | 5,654 |
Deferred service revenue, current | | | 57,064 | | | 36,256 |
| | | | | | |
Total deferred revenue, current | | | 68,242 | | $ | 41,910 |
Deferred service revenue, long-term | | | 21,318 | | | 13,858 |
| | | | | | |
Total deferred revenue | | $ | 89,560 | | $ | 55,768 |
| | | | | | |
70
Note 5. Restructuring Charges (Reversal)
As of April 30, 2008, all actions under the February 2002, August 2001, and February 2001 restructuring plans were completed. The following table summarizes our abandoned lease space accrual related to restructuring activity during the three years ended April 30, 2008 (in thousands):
| | | | |
Balances as of April 30, 2005 | | $ | 3,643 | |
Cash payments | | | (2,701 | ) |
Reversals | | | (48 | ) |
| | | | |
Balances as of April 30, 2006 | | | 894 | |
| | | | |
Cash payments | | | (637 | ) |
Reversals | | | (19 | ) |
| | | | |
Balances as of April 30, 2007 | | | 238 | |
Cash payments | | | (238 | ) |
| | | | |
Balances as of April 30, 2008 | | $ | — | |
| | | | |
Note 6. Stockholders’ Equity
Preferred Stock
During September 2007, the 42,060 shares of Series A Redeemable Convertible Preferred Stock were converted into 4,800,000 shares of our Common Stock. The conversions were exempt from registration under Section 3(a)(9) of the Securities Act of 1933. The conversion price of each share of Series A Redeemable Convertible Preferred Stock was $17.525 per share, such that the conversion rate of the Series A Redeemable Convertible Preferred Stock was approximately 114.12-to-1.0. The conversions resulted in a $41.9 million reduction of Series A Redeemable Convertible Preferred Stock, a $0.2 million increase in interest expense attributable to unamortized issuance costs, and a $42.1 million increase in stockholders’ equity. On November 19, 2007, we filed a Certificate of Elimination of Series A Preferred Stock with the Delaware Secretary of State to eliminate the Series A Preferred Stock, as no shares of such series remained outstanding.
Significant rights and obligations of the Series A Redeemable Convertible Preferred Stock included the following:
Liquidation preference. Upon liquidation of our business, the holders were entitled to be paid an amount equal to the price paid, plus an amount equal to declared but unpaid dividends, before we made any distribution to the holders of any other class of stock that is junior in ranking, including our Common Stock.
Dividends.The Series A Redeemable Convertible Preferred Stock participated equally with the holders of Common Stock in all dividends paid on the Common Stock, when, as and if declared by the Board of Directors, out of funds legally available, as if such shares had been converted to shares of Common Stock immediately prior to the record date for the payment of such dividend. No such dividends were declared.
Voting rights.Each holder of Series A Redeemable Convertible Preferred Stock was entitled to that number of votes equal to the number of shares of Common Stock into which the shares of Series A Redeemable Convertible Preferred Stock held by such holder could be converted as of the record date.
Restricted Common Stock
We have either assumed or entered into Stock Purchase Agreements in connection with the sale of common stock to employees. We have the right to repurchase, at the original issue price, a declining percentage of certain of the shares of common stock issued based on the service periods related to restricted stock awards.
71
Restricted stock awards as of April 30, 2008 and 2007 and changes during fiscal 2008 and 2007, respectively, were as follows:
| | | | | | |
| | | Shares | | | Weighted Average
Grant Date Fair Value |
Balance at April 30, 2006 | | 12,600 | | | $ | 8.50 |
Granted | | 100,800 | | | $ | 17.58 |
| | | | | | |
Balance at April 30, 2007 | | 113,400 | | | $ | 16.57 |
Granted | | 221,534 | | | $ | 25.83 |
Vested | | (29,020 | ) | | $ | 17.58 |
Cancelled | | (5,498 | ) | | $ | 24.57 |
| | | | | | |
Balance at April 30, 2008 | | 300,416 | | | $ | 23.15 |
| | | | | | |
Warrants
In connection with the acquisition of Ositis in November 2003, we assumed warrants outstanding to purchase Ositis common stock using an exchange ratio contained in the Ositis merger agreement. Based on this exchange ratio, the total number of our shares that may be purchased by warrant holders of Ositis common stock is 5,608. Using the Black Scholes valuation model, we valued these shares at $43,000, which was included as part of the total purchase consideration for Ositis.
Outstanding warrants at April 30, 2008, 2007 and 2006, comprised 1,252 shares with an exercise price of $45.74 and an expiration of July 2008.
Description of Stock-Based Compensation Plans
2007 Stock Incentive Plan
On August 27, 2007, our Board of Directors approved the 2007 Stock Incentive Plan (the “2007 Stock Incentive Plan”), under which 2,000,000 shares of common stock were reserved for issuance, together with shares reserved against options or awards made under the 1999 Stock Incentive Plan, 2000 Supplemental Stock Option Plan, 1999 Director Option Plan or 2007 New Employee Stock Incentive Plan (the “Prior Plans”) as of the date of effectiveness of the 2007 Stock Incentive Plan. The 2007 Stock Incentive Plan provides for five different types of equity compensation awards: stock options, restricted stock; stock appreciation rights; stock units; and certain automatic stock option grants to non-employee members of our Board of Directors. The 2007 Stock Incentive Plan was approved by our stockholders on October 2, 2007, and became effective at that time. The Prior Plans were terminated upon the effectiveness of the 2007 Stock Incentive Plan and options and awards made under the Prior Plans are deemed incorporated into the 2007 Stock Incentive Plan, but shall remain outstanding in accordance with their original terms. On October 4, 2007, the effective date of our stock dividend, the shares of common stock reserved for issuance under the 2007 Stock Incentive Plan increased to 4,000,000 shares, and shares reserved against outstanding options or awards under the Prior Plans increased by twice the amount then reserved. The 2007 Stock Incentive Plan will automatically terminate on the tenth anniversary of the adoption of the 2007 Stock Incentive Plan by the Board of Directors (August 27, 2017).
As of April 30, 2008, 3,528,079 shares of our common stock were available for future equity awards under the 2007 Stock Incentive Plan and 5,742,562 shares of common stock were outstanding under the aforementioned equity incentive plans, including the 2007 Stock Incentive Plan and the Prior Plans.
Employee Stock Purchase Plan
In September 1999, our Board of Directors adopted the Employee Stock Purchase Plan (“ESPP”), which became effective upon our initial public offering. Under the ESPP, eligible employees may purchase common
72
stock through payroll deductions, not to exceed 15% of an employee’s compensation, at a price equal to 85% of the closing fair market value of our common stock on the lower of the day prior to the beginning of the offering or the last day of the applicable six-month purchase period. The number of shares reserved under the ESPP automatically increased each year since inception and will increase on an annual basis by 200,000 shares annually. Our Board of Directors, at its discretion, may reduce the automatic annual increase in reserved shares. Effective March 1, 2006, the ESPP was modified to reduce offering periods to six months from a prior maximum of two years. In addition, a contribution limitation of $10,000 per six-month offering period was established and the ability to change contributions during an offering period, other than in conjunction with a withdrawal from the ESPP, was eliminated.
As of April 30, 2008, 1,349,972 shares of common stock were available for future purchase and 1,250,028 shares of common stock have been issued under the employee stock purchase plan.
Impact of the Adoption of SFAS No. 123(R)
See Note 2 for a description of our adoption of SFAS No. 123(R),“Share-Based Payment,”on May 1, 2006. The following table summarizes the stock-based compensation expense for stock options, our employee stock purchase plan, and our 2007 Tender Offer that we recorded in the statements of operations in accordance with SFAS No. 123(R) for the years ended April 30, 2008 and 2007 (in thousands).
| | | | | | | | | |
| | | Year Ended
April 30, 2008 | | Year Ended
April 30, 2007 | | Year Ended
April 30, 2006 (1) |
Stock-based compensation expense: | | | | | | | | | |
Cost of product | | $ | 775 | | $ | 468 | | $ | 31 |
Cost of service | | | 808 | | | 471 | | | 57 |
Research and development | | | 4,986 | | | 3,325 | | | 866 |
Sales and marketing | | | 5,593 | | | 3,169 | | | 618 |
General and administrative | | | 4,644 | | | 2,067 | | | 1,809 |
| | | | | | | | | |
Total | | $ | 16,806 | | $ | 9,500 | | $ | 3,381 |
| | | | | | | | | |
| (1) | Represents stock based compensation recorded under APB 25 prior to adoption of FAS123(R). |
Determining Fair Value under SFAS No. 123(R)
| | • | | Valuation and Amortization Method.We estimate the fair value of stock options granted using the Black-Scholes option valuation model. For options granted before May 1, 2006, we amortize the fair value on a graded basis. For options granted on or after May 1, 2006, we amortize the fair value of stock-based compensation on a straight-line basis for options expected to vest. All options are amortized over the requisite service periods of the awards, which are generally the vesting periods. |
| | • | | Expected Term. The expected term of options granted represents the period of time that they are expected to be outstanding. We estimate the expected term of options granted based on our historical experience of grants, exercises and post-vesting cancellations. Contractual term expirations have not been significant. |
| | • | | Expected Volatility. We estimate the volatility of our stock options at the date of grant using a combination of historical and implied volatilities, consistent with SFAS No. 123(R) and SEC Staff Accounting Bulletin No. 107. Historical volatilities are calculated based on the historical prices of our common stock over a period equal to the expected term of our option grants, while implied volatilities are derived from publicly traded options of our common stock. Prior to the adoption of SFAS No. 123(R), we relied exclusively on the historical prices of our common stock in the calculation of expected volatility. |
73
| | • | | Expected Forfeitures. Stock-based compensation expense under SFAS No. 123(R) is based on awards ultimately expected to vest, and requires that forfeitures be estimated at the time of grant and revised, if necessary, if actual forfeitures differ from those estimates. We estimated our forfeiture rate at 10% based on an analysis of historical pre-vesting forfeitures, and have reduced stock-based compensation expense accordingly. |
| | • | | Risk-Free Rate.The risk-free interest rate that we use in the Black-Scholes option valuation model is the implied yield in effect at the time of option grant based on U.S. Treasury zero-coupon issues with a remaining term equivalent to the expected term of our option grants. |
| | • | | Dividends.We have never paid any cash dividends on our common stock and we do not anticipate paying any cash dividends in the foreseeable future. Consequently, we use an expected dividend yield of zero in the Black-Scholes option valuation model. |
We used the following assumptions to estimate the fair value of options granted and shares purchased under our employee stock plans and stock purchase plan for fiscal years ended April 30, 2008, 2007 and 2006:
| | | | | | | | | |
| | | Year Ended April 30, | |
Stock Options | | 2008 | | | 2007 | | | 2006 | |
Risk-free rate | | 4.30 | % | | 4.90 | % | | 4.38 | % |
Expected life (in years) | | 4.63 | | | 4.63 | | | 4.14 | |
Expected volatility | | 0.68 | | | 0.68 | | | 0.95 | |
Expected forfeitures | | 10.00 | % | | 10.00 | % | | 10.00 | % |
| | | | | | | | | |
| | | Year Ended April 30, | |
Employee Stock Purchase Plan | | 2008 | | | 2007 | | | 2006 | |
Risk-free rate | | 2.56 | % | | 5.06 | % | | 4.38 | % |
Expected life (in years) | | 0.50 | | | 0.50 | | | 1.25 | |
Expected volatility | | 0.67 | | | 0.41 | | | 0.71 | |
The total number of unvested options outstanding as of April 30, 2008 and 2007 was 3,516,110 and 3,596,363 respectively. The total fair value of options vested during fiscal years ended April 30, 2008 and 2007 was $9.0 million, and $10.1 million, respectively.
There were 241,866, zero, and 284,708 shares purchased through our employee stock purchase plan during the fiscal years ended April 30, 2008, 2007 and 2006, respectively. Included in the consolidated statement of operations for the year ended April 30, 2008 and 2007 was $1.8 million and $110,000, respectively, in stock-based compensation expense related to the amortization of expenses related to shares granted under our employee stock purchase plan.
As of April 30, 2008, $29.8 million of total unrecognized compensation costs related to non-vested awards is expected to be recognized over the respective vesting terms of each award through 2012. The weighted average term of the unrecognized stock-based compensation expense is 2.51 years.
74
The following table provides segregated ranges of stock options outstanding at April 30, 2008:
| | | | | | | | | | | | | |
Range of
Exercise Prices | | Options Outstanding | | Options Exercisable |
| | Number of
Options
Outstanding | | Weighted
Average
Contractual
Life (Years) | | Weighted
Average
Exercise
Price | | Number of
Options
Exercisable | | Weighted
Average
Exercise
Price |
| $ | 0.03–$ 2.80 | | 293,504 | | 4.93 | | $ | 2.28 | | 287,442 | | $ | 2.29 |
| $ | 2.87–$ 6.97 | | 169,133 | | 6.42 | | $ | 6.18 | | 109,991 | | $ | 5.79 |
| $ | 7.09–$ 8.35 | | 826,632 | | 7.10 | | $ | 7.93 | | 452,810 | | $ | 7.68 |
| $ | 8.38–$ 10.00 | | 494,471 | | 5.98 | | $ | 9.36 | | 333,209 | | $ | 9.39 |
| $ | 10.08–$ 12.03 | | 330,955 | | 7.31 | | $ | 10.51 | | 155,515 | | $ | 10.57 |
| $ | 12.12–$ 15.00 | | 399,294 | | 4.77 | | $ | 14.15 | | 380,743 | | $ | 14.20 |
| $ | 15.25–$ 17.58 | | 743,002 | | 8.48 | | $ | 17.34 | | 284,940 | | $ | 17.20 |
| $ | 18.95–$ 25.77 | | 1,418,781 | | 8.62 | | $ | 22.88 | | 370,103 | | $ | 22.32 |
| $ | 26.00–$ 40.96 | | 496,584 | | 8.79 | | $ | 31.44 | | 47,901 | | $ | 28.62 |
| $ | 41.32–$262.50 | | 570,206 | | 4.53 | | $ | 83.68 | | 367,985 | | $ | 103.32 |
| | | | | | | | | | | | | |
| $ | 0.03–$262.50 | | 5,742,562 | | 7.17 | | $ | 22.76 | | 2,790,639 | | $ | 24.19 |
| | | | | | | | | | | | | |
We received $29.8 million, $0.6 million and $9.5 million in cash from the issuance of common stock under all employee stock plans for the fiscal years ended April 30, 2008, 2007 and 2006, respectively.
We historically estimated the expected life of options using our best estimate of employee exercise behavior at the time. This estimate considered the vesting period for the employee stock options and assumptions we believed reasonable about the post-vesting holding period. Upon adoption of SFAS No. 123(R) on May 1, 2006, we updated this estimate to reflect more recent historical experience of employee stock option exercises and cancellations.
We historically relied exclusively on the historical prices of our common stock in the calculation of expected volatility. Upon adoption of SFAS No. 123(R) on May 1, 2006, we updated this calculation to reflect the volatility of our stock options at the date of grant using a combination of historical and implied volatilities. Historical volatilities are calculated based on the historical prices of our common stock over a period equal to the expected term of our option grants, while implied volatilities are derived from publicly traded options of our common stock.
For the purposes of pro forma disclosures, the estimated fair value of the stock based awards is amortized to expense over the vesting period for options and the offering period for stock purchases under the Employee Stock Purchase Plan.
As of April 30, 2008, shares of common stock reserved for future issuance consisted of the following:
| | |
| | | April 30, 2008 |
Warrants outstanding | | 1,252 |
Stock options outstanding | | 5,742,562 |
Stock options available for grant | | 3,528,079 |
Employee stock purchase plan | | 1,349,972 |
| | |
Total | | 10,621,865 |
| | |
75
A summary of stock option activity under all stock-based compensation plans during the year ended April 30, 2008 is as follows:
| | | | | | | | | | | |
| | | Options outstanding |
| | | Number of
Options | | | Weighted
Average
exercise
price Per
share | | Weighted
Average
Remaining
Contractual
term
(in Years) | | Aggregate
Intrinsic
Value
(in million) |
Balance at April 30, 2005 | | 6,284,004 | | | $ | 13.23 | | | | | |
Options granted | | 2,268,100 | | | $ | 12.65 | | | | | |
Options exercised | | (1,518,224 | ) | | $ | 4.96 | | | | | |
Options forfeited | | (486,278 | ) | | $ | 13.45 | | | | | |
Options assumed | | 113,196 | | | $ | 3.50 | | | | | |
| | | | | | | | | | | |
Balance at April 30, 2006 | | 6,660,798 | | | $ | 14.73 | | | | | |
Options granted | | 1,693,690 | | | $ | 12.93 | | | | | |
Options exercised | | (83,562 | ) | | $ | 7.77 | | | | | |
Options forfeited | | (697,148 | ) | | $ | 20.73 | | | | | |
| | | | | | | | | | | |
Balance at April 30, 2007 | | 7,573,778 | | | $ | 14.11 | | | | | |
Options granted | | 1,747,072 | | | $ | 28.81 | | | | | |
Options exercised | | (3,066,832 | ) | | $ | 8.34 | | | | | |
Options forfeited | | (511,456 | ) | | $ | 18.37 | | | | | |
| | | | | | | | | | | |
Outstanding at April 30, 2008 | | 5,742,562 | | | $ | 22.76 | | 7.22 | | $ | 34.33 |
| | | | | | | | | | | |
Exercisable at April 30, 2008 | | 2,790,652 | | | $ | 24.19 | | 5.61 | | $ | 22.57 |
| | | | | | | | | | | |
Vested and expected to vest at April 30, 2008 | | 5,371,235 | | | $ | 22.77 | | 7.05 | | $ | 33.18 |
| | | | | | | | | | | |
The weighted average grant date fair value of stock options granted to employees was $16.84, $14.69 and $17.71 per share during the years ended April 30, 2008, 2007 and 2006, respectively. The aggregate intrinsic value in the table above represents the total pretax intrinsic value (i.e., the difference between our closing stock price on the last trading day of the fourth quarter of 2008 and the exercise price, multiplied by the number of in-the-money options) that would have been received by the option holders had all option holders exercised their options on April 30, 2008. As the fair market value of our common stock changes, the above amount will change as well. Total intrinsic value of options exercised was $74 million, $0.8 million, and $20.1 million for the years ended April 30, 2008, 2007 and 2006, respectively.
| | | | | | | | | | | | | | | |
| | | Year Ended April 30, |
| | | 2008 | | 2007 | | 2006 |
| | | Number of
shares | | Weighted
Average
Price per
Share | | Number of
shares | | Weighted
Average
Price per
Share | | Number of
shares | | Weighted
Average
Price per
Share |
Options granted with an exercise price equal to fair value at date of grant | | 1,747,072 | | $ | 28.81 | | 1,623,390 | | $ | 13.06 | | 318,900 | | $ | 10.26 |
| | | | | | | | | | | | | | | |
Options granted with an exercise price greater than fair value at date of grant | | — | | $ | — | | 34,600 | | $ | 8.90 | | 663,950 | | $ | 13.53 |
| | | | | | | | | | | | | | | |
Options granted with an exercise price less than fair value at date of grant | | — | | $ | — | | 35,700 | | $ | 10.58 | | 1,285,250 | | $ | 12.78 |
| | | | | | | | | | | | | | | |
76
As of April 30, 2008, we had two active stock-based employee compensation plans, which are described below. We also had awards issued under four other stock-based compensation plans, which have been terminated and are identified below.
2007 Tender Offer
We conducted an investigation into our historical stock option granting processes which led to the Fiscal 2007 Restatement. As a consequence of that investigation, we determined that the measurement dates for a number of stock option grants made by us during the period from November 1999 to May 2006 differed from the measurement dates previously used to account for such grants. This resulted in a lower exercise price for those options than the fair market value on the actual grant date and, for accounting purposes, such options were deemed to have been issued at a discount, which could expose the holders of those options to potentially adverse tax consequences under Section 409A of the Internal Revenue Code and state law equivalents. We made a tender offer to certain individuals and provided them the opportunity to increase the exercise price of the discounted options to the fair market value on the actual grant date of that option, in order to avoid the potentially adverse tax consequences (the “2007 Tender Offer”). The 2007 Tender Offer was completed on May 29, 2007. As a result of the 2007 Tender Offer, we amended outstanding options covering 1,788,080 shares of our common stock. In addition, under the terms of the 2007 Tender Offer, the participants whose options were amended received a special cash bonus, in the aggregate amount of $2.7 million, to compensate them for the higher exercise prices per share in effect for their amended options. The bonus costs, which were recorded during the first quarter of fiscal 2008, resulted in a decrease to additional paid-in capital of $1.2 million, an increase in stock-based compensation expense of $1.5 million and an increase in payroll tax expenses of $0.2 million. Under Section 409A of the Internal Revenue Code, the cash bonus could not be paid in the same calendar year in which the options were amended. Accordingly, the cash bonuses were paid in January 2008.
Note 7. Income Taxes
The domestic and foreign components of income (loss) before income taxes were as follows (in thousands):
| | | | | | | | | | | |
| | | Year Ended April 30, |
| | | 2008 | | | 2007 | | | 2006 |
U.S. | | $ | 72,375 | | | $ | (7,843 | ) | | $ | 2,899 |
Non-U.S. | | | (41,845 | ) | | | 1,769 | | | | 316 |
| | | | | | | | | | | |
Total pre-tax earnings (losses) | | $ | 30,530 | | | $ | (6,074 | ) | | $ | 3,215 |
| | | | | | | | | | | |
The provision for taxes on earnings was as follows (in thousands):
| | | | | | | | | | |
| | | Year Ended April 30, |
| | | 2008 | | | 2007 | | 2006 |
U.S. federal taxes: | | | | | | | | | | |
Current | | $ | 15,785 | | | $ | — | | $ | — |
Deferred | | | (17,353 | ) | | | 435 | | | — |
Non-U.S. taxes: | | | | | | | | | | |
Current | | | 995 | | | | 641 | | | 275 |
Deferred | | | — | | | | — | | | — |
State taxes: | | | | | | | | | | |
Current | | | 827 | | | | — | | | — |
Deferred | | | (2,292 | ) | | | 48 | | | — |
| | | | | | | | | | |
Provision (benefit) for income taxes | | $ | (2,038 | ) | | $ | 1,124 | | $ | 275 |
| | | | | | | | | | |
77
A reconciliation of the income tax provision to the amount computed by applying the statutory federal income tax rate to net income (loss) before income tax provision is summarized as follows (in thousands):
| | | | | | | | | | | | |
| | | Year Ended April 30, | |
| | | 2008 | | | 2007 | | | 2006 | |
Provision at statutory rate | | $ | 10,686 | | | $ | (2,126 | ) | | $ | 1,125 | |
State & Local income taxes | | | (952 | ) | | | — | | | | — | |
Acquired in-process technology | | | — | | | | — | | | | 1,155 | |
Foreign losses not benefited | | | 15,750 | | | | — | | | | — | |
Net operating loss utilization | | | (10,382 | ) | | | — | | | | — | |
Valuation allowance | | | (17,603 | ) | | | 979 | | | | (2,547 | ) |
Stock compensation | | | 2,032 | | | | 1,639 | | | | 115 | |
Foreign taxes | | | (109 | ) | | | 22 | | | | 275 | |
Meals & entertainment | | | 161 | | | | 131 | | | | 145 | |
R & D Credit | | | (1,663 | ) | | | — | | | | — | |
Other | | | 42 | | | | 479 | | | | 7 | |
| | | | | | | | | | | | |
Provision (benefit) for income taxes | | $ | (2,038 | ) | | $ | 1,124 | | | $ | 275 | |
| | | | | | | | | | | | |
The benefit for income taxes of $2.0 million for fiscal 2008, is primarily related to foreign income taxes, the current tax provision for US and state taxes due primarily to a prepayment of certain intercompany expenses associated with our international structure put in place during 2008, netted with a partial valuation allowance release that was recorded as a credit to income tax expense.
Deferred income taxes reflect the net tax effects of temporary differences between the carrying amounts of assets and liabilities for financial reporting purposes and the amounts used for income tax purposes. Significant components of our deferred tax assets and liabilities are as follows (in thousands):
| | | | | | | | |
| | | April 30, | |
| | | 2008 | | | 2007 | |
Deferred tax assets: | | | | | | | | |
Net operating loss carryforwards | | $ | 11,658 | | | $ | 39,777 | |
Stock compensation | | | 7,177 | | | | 6,146 | |
Other accruals/reserves | | | 10,115 | | | | 7,721 | |
Fixed assets | | | 906 | | | | 890 | |
Tax credits | | | 3,390 | | | | 4,395 | |
Capitalized research and development | | | 11,929 | | | | 14,818 | |
| | | | | | | | |
| | | 45,175 | | | | 73,747 | |
Valuation allowance | | | (23,072 | ) | | | (71,404 | ) |
| | | | | | | | |
Total deferred tax assets | | $ | 22,103 | | | $ | 2,343 | |
| | | | | | | | |
Deferred tax liabilities: | | | | | | | | |
Intangible assets | | $ | (1,676 | ) | | $ | (2,343 | ) |
Goodwill | | | (1,266 | ) | | | (483 | ) |
| | | | | | | | |
Total deferred tax liabilities | | | (2,942 | ) | | | (2,826 | ) |
| | | | | | | | |
Net deferred tax assets (liabilities) | | $ | 19,161 | | | $ | (483 | ) |
| | | | | | | | |
We record a valuation allowance to reduce our deferred tax assets to the amount that is more likely than not to be realized in future periods. In evaluating our ability to recover our deferred tax assets, we consider all available positive and negative evidence, including operating results, our history of losses and forecasts of future taxable income.
78
At April 30, 2008, our projections of future taxable income enabled us to conclude that it is more likely than not that we will have future taxable income sufficient to realize a portion of our net deferred tax asset. Accordingly, $19.6 million ($17.4 million of federal and $2.2 million of state) of the valuation allowance on our deferred tax assets was reversed as a credit to income tax expense. Our conclusion that a portion of our deferred tax assets is more likely than not to be realized is strongly influenced by our projections of future taxable income. Our estimate of future taxable income considers all available positive and negative evidence regarding our current and future operations, including projections of income in various states and foreign jurisdictions. We believe our estimate of future taxable income is reasonable, but is inherently uncertain, and if our future operations generate taxable income greater than the projected amounts, further adjustments to reduce the valuation allowance are possible. Conversely, if we realize unforeseen material losses in the future, or our ability to generate future taxable income necessary to realize a portion of the deferred tax asset is materially reduced, additions to the valuation allowance could be recorded. At April 30, 2008, the balance of the deferred tax valuation allowance was approximately $23.1 million.
As of April 30, 2008, we had net operating loss carryforwards for federal income tax purposes of approximately $108.5 million, which will expire in fiscal years ending in 2011 through 2027 if not utilized. We also had net operating loss carryforwards for state income tax purposes of approximately $45.2 million, which will expire in fiscal years ending in 2009 through 2027 if not utilized. The Company has $75.6 million of federal net operating loss and $42.2 million of state net operating loss that are where no deferred tax asset was recorded pursuant to Footnote 82 of SFAS 123(R). We also had federal and California research credit carryforwards of approximately $1.2 million and $6.7 million respectively. The federal credit will expire in fiscal years ending in 2027 through 2028 if not utilized. The California credit is not subject to expiration.
Utilization of our net operating loss and credit carryforwards are subject to substantial annual limitations due to the ownership change provisions of the Internal Revenue Code and similar state provisions. Annual limitations have resulted in the expiration of the net operating loss and tax credit carryforwards before utilization of approximately $60.9 million and $3.6 million, respectively. Utilization of federal and state net operating losses of approximately $108.5 million and $37.3 million, respectively, as well as $0.1 million and $4.6 million of federal and state credits, respectively, are subject to an annual limitation ranging from approximately $1.0 million to $13.7 million.
Federal and state income taxes have not been provided on accumulated but undistributed earnings of certain foreign subsidiaries aggregating approximately $5.9 million at April 30, 2008; as such earnings have been indefinitely reinvested in the business. If such earnings were not indefinitely reinvested, a deferred tax liability of approximately $0.3 million would have been required.
We adopted FIN 48 effective May 1, 2007. As a result of the implementation of FIN 48, we did not recognize a cumulative adjustment to the May 1, 2007 balance of retained earnings as the amount was deemed immaterial.
As of May 1, 2007, we had gross unrecognized tax benefits of approximately $2.2 million. Included in the balance of unrecognized tax benefits as of May 1, 2007, is approximately $1.4 million of tax benefits that, if recognized, would result in an adjustment to our effective tax rate, and approximately $0.2 million of tax benefits that, if recognized, would result in an adjustment to goodwill.
As of April 30, 2008, we had gross unrecognized tax benefits of approximately $2.8 million. Included in the balance of unrecognized tax benefits as of April 30, 2008 is approximately $1.8 million of tax benefits that if recognized, would result in an adjustment to our effective tax rate and $0.3 million that would impact paid-in-capital. We do not anticipate the total amount of our unrecognized tax benefits to significantly change over the next twelve months.
In accordance with FIN 48, paragraph 19, we have decided to classify interest and penalties related to uncertain tax positions as a component of our provision for income taxes. Accrued interest and penalties relating
79
to the income tax on the unrecognized tax benefits as of May 1, 2007 and April 30, 2008, were approximately $19,000 and $34,000, respectively, with approximately $15,000 being included as a component of provision for income taxes in the year ended April 30, 2008.
Total amount of gross unrecognized tax benefits (in thousands):
| | | | |
Opening balance at May 1, 2007 | | $ | 2,247 | |
Increase in balance due to current year tax positions | | | 971 | |
Reductions for prior year tax positions | | | (373 | ) |
| | | | |
Closing balance at April 30, 2008 | | $ | 2,845 | |
| | | | |
Due to our taxable loss position in prior years, all tax years are open to examination in the U.S. and state jurisdictions. We are also open to examination in various foreign jurisdictions for tax years 2000 and forward, none of which were individually material.
Note 8. Defined Contribution Benefit Plan
We have a defined contribution benefit plan under Section 401(k) of the Internal Revenue Code, which covers substantially all United States employees. Eligible employees may contribute pre-tax amounts to the plan via payroll withholdings, subject to certain limitations. Effective January 1, 2006, we began matching participant contributions on a dollar for dollar basis up to the lower of 3% of a participant’s eligible compensation or $1,500 per calendar year. Matching contributions are invested in accordance with a participant’s existing investment elections and become fully vested after four years of service. The matching contributions for the year ended April 30, 2008 were approximately $0.8 million.
Note 9. Commitments and Contingencies
Guarantees, Indemnifications and Warranty Obligations
Our customer agreements generally include certain provisions for indemnifying such customers against liabilities if our products infringe a third party’s intellectual property rights. To date, we have not incurred any material costs as a result of such indemnification provisions and have not accrued any liabilities related to such obligations in the accompanying consolidated financial statements.
Our Bylaws provide that we shall indemnify our directors and officers to the fullest extent permitted by Delaware law, including in circumstances in which indemnification is otherwise discretionary under Delaware law. We have also entered into indemnification agreements with each of our executive officers and directors containing provisions that may require us, among other things, to indemnify such officers and directors against certain liabilities that may arise by reason of their status or service as directors or officers and to advance their expenses incurred as a result of any proceeding against them as to which they could be indemnified. We expect to have indemnification obligations to certain current and former officers and directors and other employees in connection with the regulatory investigations and litigation relating to the matters covered in our Fiscal 2007 Restatement, and have made advances to such parties to cover attorneys’ fees that they incurred in connection with such matters.
We accrue for warranty expenses in our cost of revenue at the time revenue is recognized and maintain an accrual for estimated future warranty obligations based upon the relationship between historical and anticipated warranty costs and revenue volumes. If actual warranty expenses are greater than those projected, additional charges against earnings would be required. If actual warranty expenses are less than projected, obligations would be reduced, providing a positive impact on our reported results. We generally provide a one-year warranty on hardware products and a 90-day warranty on software products.
80
Leases
We lease certain equipment and office facilities under non-cancelable operating leases that expire at various dates through 2014. The facility leases generally require us to pay operating costs, including property taxes, insurance and maintenance, and contain scheduled rent increases and certain other rent escalation clauses. Rent expense is recognized in our consolidated financial statements on a straight-line basis over the terms of the respective leases after consideration of rent holidays and improvement allowances, if applicable, with any assets purchased using a lessee improvement allowance capitalized as fixed assets and depreciated over the shorter of their useful lives or the lease term.
Rent expense was $4.5 million, $3.5 million and $3.1 million for the years ended April 30, 2008, 2007 and 2006, respectively.
As of April 30, 2008, future minimum lease payments under non-cancelable operating leases with initial or remaining terms in excess of one year are as follows (in thousands):
| | | |
Year ending April 30, | | Amount |
2009 | | $ | 5,136 |
2010 | | | 3,667 |
2011 | | | 1,967 |
2012 | | | 951 |
2013 | | | 713 |
Thereafter | | | 81 |
| | | |
Total minimum lease payments | | $ | 12,515 |
| | | |
In September 2005, we commenced a five-year operating lease of a building that serves as our headquarters in Sunnyvale, California. As part of this agreement, we are required to maintain a $0.4 million irrevocable standby letter of credit with a major financial institution as a form of security. The letter of credit is secured by deposits and provides for automatic annual extensions, without amendment, through the end of the lease term in August 2010. During fiscal year 2007, the letter of credit was increased by $0.5 million due to a leasehold improvement, resulting in a balance of $0.9 million as of April 30, 2007. The letter of credit is classified as “Long-term restricted cash” in the accompanying consolidated balance sheets as of April 30, 2008 and April 30, 2007, respectively.
Other
In connection with our NetCache asset acquisition in September 2006, we entered into an escrow agreement pursuant to which we deposited in escrow $4.0 million, primarily to secure certain indemnification obligations to Network Appliance related to this transaction. As of April 30, 2007, the balance in this escrow account was $4.1 million and classified as “Short-term restricted cash equivalents” in the accompanying consolidated balance sheets. In fiscal year 2008, the escrow agreement had expired, the amounts held in escrow were released, and the related balance was reclassified to cash and cash equivalents in the consolidated balance sheet at April 30, 2008.
We have firm purchase and other commitments with various suppliers and contract manufacturers to purchase component inventory, manufacturing material and equipment. These agreements are enforceable and legally binding against us in the short-term and all amounts under these arrangements are due through August 30, 2013. Our minimum obligation at April 30, 2008 under these arrangements was $9.5 million.
Legal settlement expenses are included in general and administrative expenses in the Consolidated Statement of Operations.
81
Note 10. Litigation
With regard to the matters discussed below, although we cannot predict whether the IPO allocation cases will settle as proposed, and cannot predict the outcome of the derivative litigation, the SEC and other regulatory investigations, or the patent litigation, the costs of defending these matters (including, as applicable, our obligations to indemnify current or former officers, directors, employees or customers) could have a material adverse effect on our results of operations and financial condition.
Periodically, we review the status of each significant matter and assess potential financial exposure. Because of the uncertainties related to the (i) determination of the probability of an unfavorable outcome and (ii) amount and range of loss in the event of an unfavorable outcome, we are unable to make a reasonable estimate of the liability that could result from any pending litigation described below and no accrual has been recorded in our balance sheet as of April 30, 2008. As additional information becomes available, we will reassess the probability and potential liability related to pending litigation, which could materially impact our results of operations and financial condition.
From time to time and in the ordinary course of business, we may be subject to various other claims and litigation. Such claims could result in the expenditure of significant financial and other resources.
IPO Allocation Litigation
Beginning on May 16, 2001, a series of putative securities class actions were filed in the United States District Court for the Southern District of New York against the firms that underwrote our initial public offering, us, and some of our officers and directors. These cases have been consolidated under the case captionedIn re CacheFlow, Inc. Initial Public Offering Securities Litigation, Civil Action No. 1-01-CV-5143. This is one of a number of actions coordinated for pretrial purposes asIn re Initial Public Offering Securities Litigation, 21 MC 92, with the first action filed on January 12, 2001. Plaintiffs in the coordinated proceeding are bringing claims under the federal securities laws against numerous underwriters, companies, and individuals, alleging generally that defendant underwriters engaged in improper and undisclosed activities concerning the allocation of shares in the IPO’s of more than 300 companies during late 1998 through 2000. Among other things, the plaintiffs allege that the underwriters’ customers had to pay excessive brokerage commissions and purchase additional shares of stock in the aftermarket in order to receive favorable allocations of shares in an IPO.
The consolidated amended complaint in our case seeks unspecified damages on behalf of a purported class of purchasers of our common stock between December 9, 1999 and December 6, 2000. Pursuant to a tolling agreement, the individual defendants were dismissed without prejudice. On February 19, 2003, the court denied our motion to dismiss the claims against us.
In June 2004, a stipulation of settlement and release of claims against the issuer defendants, including us, was submitted to the Court for approval. On August 31, 2005, the Court preliminarily approved the settlement. In December 2006, the appellate court overturned the certification of classes in the six test cases that were selected by the underwriter defendants and plaintiffs in the coordinated proceedings. Because class certification was a condition of the settlement, it was deemed unlikely that the settlement would receive final Court approval. On June 25, 2007, the Court entered an order terminating the proposed settlement based upon a stipulation among the parties to the settlement. Plaintiffs have filed amended master allegations and amended complaints in the six focus cases, which the defendants in those cases have moved to dismiss. Plaintiffs have also moved, for class certification in the six focus cases, which the defendants in those cases have opposed. It is uncertain whether there will be any revised or future settlement.
Derivative Litigation
On May 18, 2005, a purported shareholder derivative action was filed in the Superior Court of California, Santa Clara County, alleging that certain of our officers and directors violated their fiduciary duties to the
82
Company by making false or misleading statements about our prospects between February 20, 2004 and May 27, 2004. On July 17, 2006, plaintiffs filed a consolidated amended complaint, adding allegations that certain current and former officers and directors violated their fiduciary duties to us since our initial public offering by granting and failing to account correctly for stock options. That amended complaint sought various types of relief on our behalf from the individual defendants. On September 8, 2006, another and substantively identical purported shareholder derivative action was filed against certain of our current and former officers and directors. Both of these state derivative cases have been consolidated.
On August 8 and September 5, 2006, two purported shareholder derivative actions were filed in the United States District Court for the Northern District of California against certain of our current and former officers and directors. Like the state derivative actions, the federal derivative actions allege that certain of our current and former officers and directors violated their fiduciary duties since our initial public offering by granting and failing to account correctly for stock options and seek various relief on our behalf from the individual defendants. Both of these federal cases have been consolidated.
On November 30, 2007, the federal and state plaintiffs each filed consolidated amended complaints in their respective actions, which focus on our historical stock option granting practices and assert claims for breach of fiduciary duty and other state and federal law claims against certain of our current and former officers and directors.
In the federal action, the Company and the individual defendants filed motions to dismiss on the grounds that plaintiffs had failed to make a pre-suit demand on our Board of Directors and had failed to state actionable claims. The federal plaintiffs thereafter advised defendants that they would make a demand on our Board of Directors. On June 12, 2008, the federal court entered an order requiring plaintiffs to make a demand by June 20, 2008, and staying the action until early October 2008 to permit our Board of Directors to consider the demand. The federal plaintiffs submitted their demand letter to our Board of Directors on June 20, 2008. The demand letter largely repeats the allegations and requested relief in the federal and state derivative actions. In response to the demand letter, on June 25, 2008, our Board of Directors formed a special committee, composed of directors James R. Tolonen and Keith Geeslin. The special committee was granted plenary authority to decide whether it is in the best interests of the Company and its shareholders to pursue or otherwise resolve the claims raised in the demand letter and in the federal and state derivative actions, and any other claims of the Company that the special committee deems necessary or appropriate to consider concerning our historical stock option practices.
In the state action, the Company and the individual defendants have moved to stay the action on the ground that the state action is duplicative of the broader federal action and have demurred on the grounds that the state plaintiffs failed to make a pre-suit demand on our Board of Directors and failed to state actionable claims.
Regulatory Investigations
In July 2006, we were advised that the SEC was conducting an informal inquiry into our historical stock option granting practices and related accounting,In the Matter of Blue Coat Systems, Inc.,SF-3165. We have been voluntarily cooperating with the investigation. In May 2008, the SEC issued a formal order of nonpublic investigation in connection with this investigation and issued a subpoena to a former officer of the Company. The Company and its current directors, officers, and employees continue to cooperate with the SEC on a voluntary basis. The SEC’s investigation is a nonpublic, fact-finding inquiry to determine if there have been violations of the federal securities laws.
Patent Litigation
On April 18, 2008, Realtime Data, LLC d/b/a IXO (“Realtime”) filed a patent infringement lawsuit against Packeteer, Inc. (“Packeteer”), a company that we acquired on June 6, 2008, and eleven other companies, including five customers of Packeteer (Realtime Data, LLC d/b/a IXO v. Packeteer, Inc. et al. in the United
83
States District Court, Eastern District of Texas, Civil Action No. 6:08-cv-144). The complaint asserted infringement of seven patents, five of which were asserted against Packeteer. On June 20, 2008, Realtime filed a First Amended Complaint which asserts infringement of two additional patents, one of which is asserted against Packeteer. The First Amended Complaint also names us as a defendant and asserts that we infringe the same six patents that allegedly are infringed by Packeteer.
Note 11. Geographic and Product Category Information Reporting
We conduct business in one operating segment to design, develop, market and support proxy appliances in support of the Wide Area Network (“WAN”) Application Delivery market, which includes products with secure web gateway and WAN acceleration functionality. Our chief operating decision maker, our chief executive officer, allocates resources and makes operating decisions based on financial data consistent with the presentation in the accompanying consolidated financial statements. Our revenue consists of two product categories: product and service. Total international revenue consists of sales by our U.S. operations to non-affiliated customers in other geographic regions. During fiscal year 2008, 2007 and 2006, there were no intra-company sales.
Operating decisions regarding the costs of our products and services are made with information that is consistent with the presentation in the accompanying consolidated statements of operations. Therefore, we currently believe it is impractical to separately present such costs.
Net revenue is attributed to geographic areas based on the location of the customers. The following is a summary of net revenue by geographic area (in thousands):
| | | | | | | | | | | | | | | | | | |
| | | Year Ended April 30, | |
| | | 2008 | | | 2007 | | | 2006 | |
| | | $ | | % | | | $ | | % | | | $ | | % | |
North America | | $ | 142,934 | | 46.8 | % | | $ | 82,812 | | 46.6 | % | | $ | 70,866 | | 50.0 | % |
EMEA (1) | | | 112,110 | | 36.7 | | | | 66,323 | | 37.3 | | | | 53,858 | | 38.0 | |
LATAM (2) | | | 3,850 | | 1.3 | | | | 1,611 | | 0.9 | | | | 377 | | 0.3 | |
APAC (3) | | | 46,545 | | 15.2 | | | | 26,954 | | 15.2 | | | | 16,621 | | 11.7 | |
| | | | | | | | | | | | | | | | | | |
Total net revenue | | $ | 305,439 | | 100.0 | % | | $ | 177,700 | | 100.0 | % | | $ | 141,722 | | 100.0 | % |
| | | | | | | | | | | | | | | | | | |
| (1) | Europe, Middle East, and Africa (“EMEA”) |
| (2) | Central America and Latin America (“LATAM”) |
| (3) | Asia and Pacific regions (“APAC”) |
The following is a summary of net revenue by product category (in thousands):
| | | | | | | | | | | | | | | | | | |
| | | Year Ended April 30, | |
| | | 2008 | | | 2007 | | | 2006 | |
| | | $ | | % | | | $ | | % | | | $ | | % | |
Product | | $ | 233,858 | | 76.6 | % | | $ | 136,770 | | 77.0 | % | | $ | 116,083 | | 81.9 | % |
Service | | | 71,581 | | 23.4 | | | | 40,930 | | 23.0 | | | | 25,639 | | 18.1 | |
| | | | | | | | | | | | | | | | | | |
Total net revenue | | $ | 305,439 | | 100.0 | % | | $ | 177,700 | | 100.0 | % | | $ | 141,722 | | 100.0 | % |
| | | | | | | | | | | | | | | | | | |
84
The following table presents a summary of long-lived assets as of April 30, 2008 and 2007 by geographic area:
| | | | | | |
| | | April 30, |
| | | 2008 | | 2007 |
Long-Lived Assets: | | | | | | |
Property and equipment, net | | | | | | |
United States | | $ | 12,253 | | $ | 8,102 |
International | | | 2,722 | | | 1,207 |
| | | | | | |
Subtotal | | | 14,975 | | | 9,309 |
Identifiable intangible assets, net United States | | | 5,010 | | | 6,650 |
| | | | | | |
Total Long-Lived Assets | | $ | 19,985 | | $ | 15,959 |
| | | | | | |
Note 12. Selected Quarterly Financial Data (Unaudited)
A summary of our quarterly consolidated financial results is as follows (in thousands, except per share data):
| | | | | | | | | | | | | | | |
| | | Three Months Ended | |
| | | July 31,
2007
(restated) (1) | | | October 31,
2007 | | | January 31,
2008 | | April 30,
2008 | |
Net revenue | | $ | 62,403 | | | $ | 73,425 | | | $ | 81,381 | | $ | 88,230 | |
Gross profit | | | 47,792 | | | | 57,047 | | | | 62,082 | | | 67,073 | |
Net income | | | 2,642 | | | | 6,953 | | | | 10,490 | | | 12,483 | |
Basic net income per common share | | $ | 0.08 | | | $ | 0.20 | | | $ | 0.28 | | $ | 0.33 | |
Diluted net income per common share | | $ | 0.07 | | | $ | 0.17 | | | $ | 0.26 | | $ | 0.32 | |
| |
| | | Three Months Ended | |
| | | July 31,
2006 (2) | | | October 31,
2006 (2) | | | January 31,
2007 (2) | | April 30,
2007 (2) | |
Net revenue | | $ | 36,415 | | | $ | 39,705 | | | $ | 47,108 | | $ | 54,472 | |
Gross profit | | | 26,165 | | | | 29,583 | | | | 34,868 | | | 41,336 | |
Net income (loss) | | | (3,137 | ) | | | (3,344 | ) | | | 42 | | | (759 | ) |
Basic net income (loss) per common share | | $ | (0.11 | ) | | $ | (0.12 | ) | | $ | 0.00 | | $ | (0.03 | ) |
Diluted net income (loss) per common share | | $ | (0.11 | ) | | $ | (0.12 | ) | | $ | 0.00 | | $ | (0.03 | ) |
| (1) | Basic net income per common share and diluted net income per common share are presented in conformity with FASB SFAS No. 128,Earnings Per Share, for all periods presented. Basic net income per share is computed by dividing net income (loss) by the weighted-average number of shares outstanding during the period. Diluted net income per share is computed using the weighted-average number of shares of common stock outstanding, including dilutive common shares subject to repurchase and potential shares assuming the (i) exercise of dilutive stock options and warrants using the treasury stock method; (ii) issuance of committed but unissued stock awards; and (iii) shares issuable upon the assumed conversion of outstanding Series A Redeemable Convertible Preferred Stock. The company has restated the earnings per share for the first quarter of fiscal 2008 in accordance with EITF 03-6,Participating Securities and the Two-Class Method under SFAS No. 128, in order to include the Series A Redeemable Convertible Preferred Stock in the computation of basic earnings per share using the two-class method. All shares of such preferred stock were converted into common stock by the end of September 2007. |
| (2) | Basic and diluted per share amounts have been adjusted to reflect the 2 for 1 stock split in October 2007. |
85
Note 13. Subsequent Events (Unaudited)
On June 6, 2008, we completed the acquisition of Packeteer, Inc. (“Packeteer”), a provider of products for WAN traffic prioritization and acceleration. The transaction was effected through a tender offer, followed by a merger of our wholly-owned subsidiary, Cooper Acquisition, Inc., with and into Packeteer. As a result of the transaction, Packeteer became our wholly-owned subsidiary and each outstanding share of Packeteer common stock that was not tendered in the tender offer (other than restricted shares; shares already held by us, Packeteer or our respective wholly-owned subsidiaries; or shares held by stockholders who properly perfect appraisal rights under Delaware law) was converted into the right to receive $7.10 per share. The aggregate purchase price, which has not yet been determined, will consist of $264 million in cash paid for Packeteer’s common stock, plus the value of assumed stock options and direct transaction costs. To date, the acquisition has been funded by approximately $188 million in cash from internal sources and $80 million in cash from the issuance of convertible notes. The operations of Packeteer and Blue Coat will be reported on a combined basis commencing with our financial statements for the quarter ending July 31, 2008.
On June 2, 2008, we issued $80 million in Zero Coupon Convertible Senior Notes (the “Notes”) as well as warrants to purchase an aggregate of 385,356 shares of our common stock at an exercise price of $20.76 to Manchester Securities Corp., Francisco Partners II, L.P. and an affiliate of Francisco Partners II, L.P. in a private placement. The Notes are convertible into 3,853,564 shares of our common stock at the holders’ option at any time prior to maturity at a conversion price of $20.76. The Notes do not bear interest. We used the $80 million proceeds from the private placement to partially fund the acquisition of Packeteer, Inc. The Notes mature in June of 2013 unless converted into common stock prior to such date.
On June 9, 2008, in connection with our acquisition of Packeteer, Inc. we committed to a plan of termination that will result in a reduction of approximately 130 employees of the Company, Packeteer and various affiliates worldwide. The plan includes workforce reductions, the acceleration of certain employee benefits, and outplacement assistance.
The Company expects to complete the termination plan by the end of the first fiscal quarter ending July 31, 2008. The Company expects total costs in the range of $10.0 million to $12.0 million, of which $1.2 million to $1.4 million will be recorded as a charge in accordance with SFAS 146, “Accounting for Costs Associated with Exit or Disposal Activities.” In addition, $8.8 million to $10.6 million will be recorded as an assumed liability. We also expect to incur additional costs related to approximately 36 employees on transition assignments. The significant majority of the charges are expected to be cash expenditures.
On June 20, 2008, we amended the lease for our corporate headquarters. Pursuant to the lease amendment, we added 116,586 additional square feet of space and extended the term of the original lease through November 30, 2015. The lease amendment provides for an annualized base rent ranging from $2.7 million to $3.4 million for the new premises during the term of the lease, which commences on the earlier of November 1, 2008 or our occupancy of the new premises for the conduct of business. The lease amendment provides for an annualized base rent ranging from $2.9 million to $3.4 million for the existing premises during the extension term, which commences on September 1, 2010.
On April 18, 2008, Realtime Data, LLC d/b/a IXO (“Realtime”) filed a patent infringement lawsuit against Packeteer, Inc. (“Packeteer”), a company that we acquired on June 6, 2008, and eleven other companies, including five customers of Packeteer (Realtime Data, LLC d/b/a IXO v. Packeteer, Inc. et al. in the United States District Court, Eastern District of Texas, Civil Action No. 6:08-cv-144). The complaint asserted infringement of seven patents, five of which were asserted against Packeteer. On June 20, 2008, Realtime filed a First Amended Complaint which asserts infringement of two additional patents, one of which is asserted against Packeteer. The First Amended Complaint also names us as a defendant and asserts that we infringe the same six patents that allegedly are infringed by Packeteer.
Item 9. Changes in and Disagreements with Accountants on Accounting and Financial Disclosure.
None.
86
Item 9A. Controls and Procedures
Evaluation of Disclosure Controls and Procedures
We are committed to maintaining disclosure controls and procedures designed to ensure that information required to be disclosed in our periodic reports filed under the Securities Exchange Act of 1934, as amended (the “Exchange Act”), is recorded, processed, summarized and reported within the time periods specified in the SEC’s rules and forms, and that such information is accumulated and communicated to our management, including our Chief Executive Officer and Chief Financial Officer, as appropriate, to allow for timely decisions regarding required disclosure.
Under the supervision and with the participation of our management, including our Chief Executive Officer and Chief Financial Officer, we conducted an evaluation of our disclosure controls and procedures, as such term is defined under Rule 13a-15(e) promulgated under the Exchange Act. Based on this evaluation, our Chief Executive Officer and our Chief Financial Officer concluded that our disclosure controls and procedures were effective as of April 30, 2008, the end of the period covered by this Annual Report on Form 10-K.
Inherent Limitations on Internal Control
A control system, no matter how well conceived and operated, can provide only reasonable, not absolute, assurance that the objectives of the control system are met. Further, the benefits of controls must be considered relative to their costs. Because of the inherent limitations in all control systems, no evaluation of controls can provide absolute assurance that all control issues and instances of fraud, if any, have been detected. These inherent limitations include the realities that judgments in decision making can be faulty, and that breakdowns can occur because of simple errors or mistakes. Additionally, controls can be circumvented by the individual acts of some persons, by collusion of two or more people, or by management override of the control. The design of any system of controls is also based in part upon certain assumptions about the likelihood of future events, and there can be no assurance that any design will succeed in achieving its stated goals under all potential future conditions. Because of the inherent limitations in a cost-effective control system, misstatements due to error or fraud may occur and not be detected. In designing and evaluating our disclosure controls and procedures, management recognizes that any controls and procedures, no matter how well designed and operated, can provide only reasonable assurance of achieving the desired control objectives, and management necessarily is required to apply its judgment in evaluating the cost-benefit relationship of possible controls and procedures and implementing controls and procedures based on the application of management’s judgment.
Management’s Report on Internal Control over Financial Reporting
Our management is responsible for establishing and maintaining adequate internal control over financial reporting, as such term is defined in Exchange Act Rule 13a-15(f). Under the supervision and with the participation of our management, including our Chief Executive Officer and Chief Financial Officer, we conducted an evaluation of the effectiveness of our internal control over financial reporting based on the framework set forth inInternal Control—Integrated Frameworkissued by the Committee of Sponsoring Organizations of the Treadway Commission. Based on our evaluation under the framework set forth inInternal Control—Integrated Framework,our management concluded that our internal control over financial reporting was effective as of April 30, 2008.
The effectiveness of our internal control over financial reporting as of April 30, 2008 has been audited by Ernst & Young LLP, an independent registered public accounting firm, as stated in their report, which follows.
Changes in Internal Control Over Financial Reporting
There was no change in our internal control over financial reporting that occurred during our most recent fiscal quarter that has materially affected, or is reasonably likely to materially affect, our internal control over financial reporting.
87
REPORT OF INDEPENDENT REGISTERED PUBLIC ACCOUNTING FIRM
The Board of Directors and Stockholders of Blue Coat Systems, Inc.
We have audited Blue Coat Systems, Inc.’s internal control over financial reporting as of April 30, 2008, based on criteria established in Internal Control—Integrated Framework issued by the Committee of Sponsoring Organizations of the Treadway Commission (the COSO criteria). Blue Coat Systems, Inc.’s management is responsible for maintaining effective internal control over financial reporting, and for its assessment of the effectiveness of internal control over financial reporting included in the accompanying Management’s Report on Internal Control Over Financial Reporting. Our responsibility is to express an opinion on the company’s internal control over financial reporting based on our audit.
We conducted our audit in accordance with the standards of the Public Company Accounting Oversight Board (United States). Those standards require that we plan and perform the audit to obtain reasonable assurance about whether effective internal control over financial reporting was maintained in all material respects. Our audit included obtaining an understanding of internal control over financial reporting, assessing the risk that a material weakness exists, testing and evaluating the design and operating effectiveness of internal control based on the assessed risk, and performing such other procedures as we considered necessary in the circumstances. We believe that our audit provides a reasonable basis for our opinion.
A company’s internal control over financial reporting is a process designed to provide reasonable assurance regarding the reliability of financial reporting and the preparation of financial statements for external purposes in accordance with generally accepted accounting principles. A company’s internal control over financial reporting includes those policies and procedures that (1) pertain to the maintenance of records that, in reasonable detail, accurately and fairly reflect the transactions and dispositions of the assets of the company; (2) provide reasonable assurance that transactions are recorded as necessary to permit preparation of financial statements in accordance with generally accepted accounting principles, and that receipts and expenditures of the company are being made only in accordance with authorizations of management and directors of the company; and (3) provide reasonable assurance regarding prevention or timely detection of unauthorized acquisition, use, or disposition of the company’s assets that could have a material effect on the financial statements.
Because of its inherent limitations, internal control over financial reporting may not prevent or detect misstatements. Also, projections of any evaluation of effectiveness to future periods are subject to the risk that controls may become inadequate because of changes in conditions, or that the degree of compliance with the policies or procedures may deteriorate.
In our opinion, Blue Coat Systems, Inc. maintained, in all material respects, effective internal control over financial reporting as of April 30, 2008, based on the COSO criteria.
We also have audited, in accordance with the standards of the Public Company Accounting Oversight Board (United States), the consolidated balance sheets of Blue Coat Systems, Inc. as of April 30, 2008 and April 30, 2007, and the related consolidated statements of income, stockholders’ equity, and cash flows for each of the three years in the period ended April 30, 2008 of Blue Coat Systems, Inc. and our report dated June 27, 2008 expressed an unqualified opinion thereon.
/s/ Ernst & Young LLP
San Jose, California
June 27, 2008
Item 9B. Other Information
None
88
PART III.
Item 10. Directors, Executive Officers and Corporate Governance
(a) Identification of Directors. The information required by this Item is incorporated by reference from the responsive information to be contained in our Proxy Statement.
(b) Identification of Executive Officers and Certain Significant Employees. The information required by this Item is incorporated by reference from the responsive information to be contained in our Proxy Statement.
(c) Compliance with Section 16(a) of the Exchange Act. The information required by this Item is incorporated by reference from the responsive information to be contained in our Proxy Statement.
(d) Code of Ethics. The information required by this Item is incorporated by reference from the responsive information to be contained in our Proxy Statement.
(e) Audit Committee. The information required by this Item is incorporated by reference from the responsive information to be contained in our Proxy Statement.
Item 11. Executive Compensation
The information required by this Item is incorporated by reference from the responsive information to be contained in our Proxy Statement.
Item 12. Security Ownership of Certain Beneficial Owners and Management and Related Stockholder Matters
The information required by this Item is incorporated by reference from the responsive information to be contained in our Proxy Statement.
Item 13. Certain Relationships and Related Transactions, and Director Independence
The information required by this Item is incorporated by reference from the responsive information to be contained in our Proxy Statement.
Item 14. Principal Accounting Fees and Services
The information required by this Item is incorporated by reference from the responsive information to be contained in our Proxy Statement.
89
PART IV.
Item 15. Exhibits and Financial Statement Schedules
1. Financial Statements
See Item 8 of this Annual Report on Form 10-K
2. Financial Statement Schedules
The following financial statement schedule of Blue Coat Systems, Inc. is filed as part of this Report and should be read in conjunction with the Financial Statements of Blue Coat Systems, Inc.
Schedule II Valuation and Qualifying Accounts
Schedules not listed above have been omitted because the information required to be set forth therein is not applicable or is shown in the financial statements or notes thereto.
3. Exhibits
See Exhibit Index. The Exhibits listed in the accompanying Exhibit Index are filed as part of this report.
90
SIGNATURES
Pursuant to the requirements of Section 13 or 15(d) of the Securities Exchange Act of 1934, the registrant has duly caused this report to be signed on its behalf by the undersigned, thereunto duly authorized.
| | | | | | | | |
| | | | BLUE COAT SYSTEMS, INC. |
| | | | (Registrant) |
| | | |
| June 30, 2008 | | | | By: | | /s/ BRIAN M. NESMITH |
| | | | | | | | Brian M. NeSmith |
| | | | | | | | President, Chief Executive Officer and Director |
KNOW ALL PERSONS BY THESE PRESENTS, that each person whose signature appears below constitutes and appoints Brian M. NeSmith and Kevin S. Royal, or either of them, each with the power of substitution, his attorney-in-fact, to sign any amendments to this Form 10-K, and to file the same, with exhibits thereto and other documents in connection therewith, with the Securities and Exchange Commission, hereby ratifying and confirming all that each of said attorneys-in-fact, or his substitute or substitutes, may do or cause to be done by virtue hereof.
Pursuant to the requirements of the Securities Exchange Act of 1934, this report has been signed below by the following persons on behalf of the Registrant and in the capacities and on the dates indicated:
| | | | |
Signature | | Title | | Date |
| | |
/s/ BRIAN M. NESMITH Brian M. NeSmith | | President, Chief Executive Officer and Director (Principal Executive Officer) | | June 30, 2008 |
| | |
/s/ KEVIN S. ROYAL Kevin S. Royal | | Senior Vice President, Chief Financial Officer (Principal Financial and Accounting Officer) | | June 30, 2008 |
| | |
/s/ DAVID W. HANNA David W. Hanna | | Chairman of the Board and Director | | June 30, 2008 |
| | |
/s/ JAMES A. BARTH James A. Barth | | Director | | June 30, 2008 |
| | |
/s/ KEITH B. GEESLIN Keith B. Geeslin | | Director | | June 30, 2008 |
| | |
/s/ TIMOTHY A. HOWES Timothy A. Howes | | Director | | June 30, 2008 |
| | |
/s/ JAMES R. TOLONEN James R. Tolonen | | Director | | June 30, 2008 |
91
EXHIBIT INDEX
| | |
Number | | Description |
| 2.1 | | Agreement and Plan of Merger and Reorganization, dated as of October 28, 2003, by and among Blue Coat Systems, Inc., Riga Corp., Ositis Software, Inc., Vilis Ositis and Liana Abele (which is incorporated herein by reference to Exhibit 2.1 of Form 8-K filed by the Registrant with the Commission on November 28, 2003) |
| |
| 2.2 | | Agreement and Plan of Merger and Reorganization, dated as of July 16, 2004, by and among Blue Coat Systems, Inc., Utah Merger Corporation, Cerberian, Inc., and Scott Petty, as Stockholders’ Representative (which is incorporated herein by reference to Exhibit 2.1 of Form 8-K filed by the Registrant with the Commission on November 23, 2004) |
| |
| 2.3 | | Amendment Number 1 to Agreement and Plan of Merger and Reorganization, dated as of October 5, 2004, by and among Blue Coat Systems, Inc., Utah Merger Corporation, Cerberian, Inc., and Scott Petty, as Stockholders’ Representative (which is incorporated herein by reference to Exhibit 2.2 of Form 8-K filed by the Registrant with the Commission on November 23, 2004) |
| |
| 2.4 | | Agreement and Plan of Merger and Reorganization, dated as of December 30, 2005, by and among Blue Coat Systems, Inc., Permeo Technologies, Inc., Pivot Acquisition Corp., and Chris Pacitti, as Stockholders’ Representative (which is incorporated herein by reference to Exhibit 2.1 of Form 8-K filed by the Registrant with the Commission on January 4, 2006) |
| |
| 2.5 | | Asset Purchase Agreement, dated as of June 22, 2006, between Blue Coat Systems, Inc. and Network Appliance, Inc. (which is incorporated herein by reference to Exhibit 2.1 of Form 8-K filed by the Registrant with the Commission on June 23, 2006) |
| |
| 2.6 | | Amendment to Asset Purchase Agreement, dated as of September 8, 2006, between Blue Coat Systems, Inc. and Network Appliance, Inc. (which is incorporated herein by reference to Exhibit 2.1 of Form 8-K filed by the Registrant with the Commission on September 11, 2006) |
| |
| 2.7 | | Agreement and Plan of Merger, dated as of April 20, 2008, among Packeteer, Inc., Blue Coat Systems, Inc. and Cooper Acquisition, Inc. (which is incorporated herein by reference to Exhibit 2.01 to the Registrant’s 8-K filed with the Commission on April 23, 2008) |
| |
| 3.1 | | Amended and Restated Certificate of Incorporation of the Registrant (which is incorporated herein by reference to Exhibit 3.2 to the Registrant’s Registration Statement on Form S-1 No. 333-87997) |
| |
| 3.2 | | Amended and Restated Bylaws of the Registrant (which is incorporated herein by reference to Exhibit 3.4 to the Registrant’s Registration Statement on Form S-1 No. 333-87997) |
| |
| 3.3 | | Certificate of Ownership and Merger of Blue Coat Systems, Inc. with and into CacheFlow Inc. (which is incorporated herein by reference to Exhibit 3.3 of Form 10-Q filed by the Registrant with the Commission on December 16, 2002) |
| |
| 3.4 | | Certificate of Amendment to Amended and Restated Certificate of Incorporation of Blue Coat Systems, Inc. dated September 12, 2002 (which is incorporated herein by reference to Exhibit 3.4 of Form 10-Q filed by the Registrant with the Commission on December 16, 2002) |
| |
| 3.5 | | Certificate of Designation, Preferences, and Rights of Series A Preferred Stock (which is incorporated herein by reference to Exhibit 4.1 of Form 8-K filed by the Registrant with the Commission on June 23, 2006) |
| |
| 3.6 | | Amended and Restated Bylaws (which is incorporated herein by reference to Exhibit 99.1 to the Registrant’s 8-K filed with the Commission on November 19, 2007) |
| |
| 3.7 | | Certificate of Elimination of Series A Preferred Stock (which is incorporated herein by reference to Exhibit 99.1 to the Registrant’s 8-K filed with the Commission on November 21, 2007) |
92
| | |
Number | | Description |
| 4.1 | | Reference is made to Exhibits 3.1, 3.2, 3.3, 3.4, 3.5, 3.6 and 3.7 |
| |
| 4.2 | | Specimen Certificate of the Registrant’s Common Stock (which is incorporated herein by reference to Exhibit 4.3 of Form 10-K filed by the Registrant with the Commission on July 29, 2003) |
| |
| 9.1 | | Voting Agreement, dated as of June 22, 2006, by and among Blue Coat Systems, Inc., Francisco Partners II, L.P., Francisco Partners Parallel Fund II, L.P., Sequoia Capital Growth Fund III, Sequoia Capital Growth Partners III and Sequoia Capital Growth III Principals Fund (which is incorporated herein by reference to Exhibit 9.1 of Form 8-K filed by the Registrant with the Commission on June 23, 2006) |
| |
| 10.1 | | Form of Indemnification Agreement (which is incorporated herein by reference to Exhibit 10.1 to the Registrant’s Registration Statement on Form S-1/A No. 333-87997) |
| |
| 10.2 | | 1996 Stock Option Plan (which is incorporated herein by reference to Exhibit 10.2 to the Registrant’s Registration Statement on Form S-1 No. 333-87997) |
| |
| 10.3* | | 1999 Stock Incentive Plan (which is incorporated herein by reference to Exhibit 10.3 to the Registrant’s Registration Statement on Form S-1 No. 333-87997) |
| |
| 10.4* | | 1999 Director Option Plan (which is incorporated herein by reference to Exhibit 10.4 to the Registrant’s Registration Statement on Form S-1 No. 333-87997) |
| |
| 10.5* | | 1999 Employee Stock Purchase Plan (which is incorporated herein by reference to Exhibit 10.5 to the Registrant’s Registration Statement on Form S-1 No. 333-87997) |
| |
| 10.6 | | Reserved |
| |
| 10.7 | | Reserved |
| |
| 10.8 | | Commercial lease agreement between CacheFlow Canada and Wiebe Property Corporation Ltd., dated May 1, 1999 (which is incorporated herein by reference to Exhibit 10.8 to the Registrant’s Registration Statement on Form S-1 No. 333-87997) |
| |
| 10.9* | | Offer Letter with Brian NeSmith (which is incorporated herein by reference to Exhibit 10.9 to the Registrant’s Registration Statement on Form S-1/A No. 333-87997) |
| |
| 10.10 | | 2000 Supplemental Stock Option Plan (which is incorporated herein by reference to Exhibit 99.1 of Form S-8 filed by the Registrant with the Commission on April 11, 2000) |
| |
| 10.11 | | SpringBank Networks, Inc. 2000 Stock Incentive Plan (which is incorporated herein by reference to Exhibit 99.2 of Form S-8 filed by the Registrant with the Commission on September 8, 2000) |
| |
| 10.12 | | Entera, Inc. 1999 Equity Incentive Plan (which is incorporated herein by reference to Exhibit 99.1 of Form S-8 filed by the Registrant with the Commission on December 18, 2000) |
| |
| 10.13 | | Entera, Inc. 2000 Equity Incentive Plan (which is incorporated herein by reference to Exhibit 99.2 of Form S-8 filed by the Registrant with the Commission on December 18, 2000) |
| |
| 10.14* | | Offer Letter with David de Simone (which is incorporated herein by reference to Exhibit 10.24 of Form 10-Q filed by the Registrant with the Commission on December 12, 2003) |
| |
| 10.15 | | Common Stock Purchase Agreement dated September 18, 2003 (which is incorporated herein by reference to Exhibit 10.1 of Form 8-K filed by the Registrant with the Commission on September 22, 2003) |
93
| | |
Number | | Description |
| 10.16 | | Registration Rights Agreement dated September 18, 2003 (which is incorporated herein by reference to Exhibit 10.2 of Form 8-K filed by the Registrant with the Commission on September 22, 2003) |
| |
| 10.17 | | Technology License And Settlement Agreement dated October 29, 2003 by and between Network Caching Technology L.L.C and Blue Coat Systems, Inc. (which is incorporated herein by reference to Exhibit 10.27 of Form 10-Q filed by the Registrant with the Commission on December 12, 2003) |
| |
| 10.18 | | Source Code License & Services Agreement, effective August 12, 2004, by and between Blue Coat Systems, Inc. and Flowerfire, Inc. (which is incorporated herein by reference to Exhibit 10.1 of Form 10-Q filed by the Registrant with the Commission on September 9, 2004) |
| |
| 10.19* | | Form of Notice of Grant of Stock Option and Stock Option Agreement used to evidence options granted under the Blue Coat Systems, Inc. 1999 Stock Incentive Plan (which is incorporated herein by reference to Exhibit 10.2 of Form 10-Q filed by the Registrant with the Commission on December 9, 2004) |
| |
| 10.20* | | Employment Agreement between Blue Coat Systems, Inc. and Kevin Royal dated as of March 31, 2005 (which is incorporated herein by reference to Exhibit 10.32 of Form 10-K filed by the Registrant with the Commission on July 14, 2005) |
| |
| 10.21 | | Triple Net Space Lease between Mary Avenue LLC as Lessor and Blue Coat Systems, Inc. , a Delaware corporation, as Lessee, dated April 21, 2005 ( which is incorporated by reference to the Registrant’s Form 8-K filed with the Commission on April 26, 2005) |
| |
| 10.22 | | Cerberian, Inc. 2000 Stock Option Plan (which is incorporated herein by reference to Exhibit 10.22 of Form 10-K filed by the Registrant with the Commission on March 28, 2007) |
| |
| 10.23 | | Permeo Technologies, Inc. 2001 Stock Option Plan (which is incorporated herein by reference to Exhibit 10.23 of Form 10-K filed by the Registrant with the Commission on March 28, 2007) |
| |
| 10.24 | | Series A Preferred Stock Purchase Agreement dated as of June 22, 2006, by and among Blue Coat Systems, Inc., Francisco Partners II, L.P., Francisco Partners Parallel Fund II, L.P., Sequoia Capital Growth Fund III, Sequoia Capital Growth Partners III and Sequoia Capital Growth III Principals Fund (which is incorporated herein by reference to Exhibit 10.1 of Form 8-K filed by the Registrant with the Commission on June 23, 2006) |
| |
| 10.25 | | Investors’ Rights Agreement dated as of June 22, 2006, by and among Blue Coat Systems, Inc., Francisco Partners II, L.P., Francisco Partners Parallel Fund II, L.P., Sequoia Capital Growth Fund III, Sequoia Capital Growth Partners III and Sequoia Capital Growth III Principals Fund (which is incorporated herein by reference to Exhibit 10.2 of Form 8-K filed by the Registrant with the Commission on June 23, 2006) |
| |
| 10.27 | | Design and Manufacturing Services Agreement, effective as of June 11, 2008, between MiTAC International Corporation and Blue Coat Systems, Inc. |
| |
| 10.28* | | 2006 Profit Sharing Plan (which is incorporated by reference to Exhibit 10.28 of Form 10-Q for the period ending January 31, 2007, filed by the Registrant with the Commission on March 28, 2007) |
| |
| 10.29* | | Offer Letter with Kevin Biggs, dated as of December 3, 2006 (which is incorporated by reference to Exhibit 10.29 of Form 10-Q for the period ending January 31, 2007, filed by the Registrant with the Commission on March 28, 2007) |
| |
| 10.30* | | Offer Letter with Betsy E. Bayha, dated as of March 27, 2007 (which is incorporated herein by reference to Exhibit 10.30 of Form 10-K filed by the Registrant with the Commission on July 13, 2007) |
| |
| 10.31* | | 2007 New Employee Stock Incentive Plan (which is incorporated by reference to Exhibit 10.1 of Form 8-K filed by the Registrant with the Commission on June 18, 2007) |
94
| | |
Number | | Description |
| 10.32* | | Form of Notice of Grant of Stock Option and Stock Option Agreement used to evidence options granted under Blue Coat Systems, Inc. 2007 New Employee Stock Incentive Plan (which is incorporated by reference to Exhibit 10.2 of Form 8-K filed by the Registrant with the Commission on June 18, 2007) |
| |
| 10.33* | | Form of Notice of Award of Restricted Stock and Restricted Stock Agreement used to evidence restricted stock awarded under Blue Coat Systems, Inc. 2007 New Employee Stock Incentive Plan (which is incorporated by reference to Exhibit 10.3 of Form 8-K filed by the Registrant with the Commission on June 18, 2007) |
| |
| 10.34* | | Form of Notice of Award of Restricted Stock and Restricted Stock Agreement used to evidence restricted stock awarded under Blue Coat Systems, Inc. 1999 Stock Incentive Plan (which is incorporated herein by reference to Exhibit 10.34 of Form 10-K filed by the Registrant with the Commission on July 13, 2007) |
| |
| 10.35 | | Form of Notice of Grant of Stock Option and Stock Option Agreement used to evidence options granted under Blue Coat Systems, Inc. 2000 Supplemental Stock Option Plan (which is incorporated herein by reference to Exhibit 10.35 of Form 10-K filed by the Registrant with the Commission on July 13, 2007) |
| |
| 10.36* | | Form of Notice of Grant of Stock Option and Stock Option Agreement used to evidence options granted under Blue Coat Systems, Inc. 1999 Director Option Plan (which is incorporated herein by reference to Exhibit 10.36 of Form 10-K filed by the Registrant with the Commission on July 13, 2007) |
| |
| 10.37 | | Form of Amended and Restated Indemnification Agreement |
| |
| 10.38* | | 2007 Stock Incentive Plan |
| |
| 10.39* | | Restricted Stock Agreement used to evidence restricted stock awarded under Blue Coat Systems, Inc. 2007 Stock Incentive Plan |
| |
| 10.40* | | Stock Option Agreement used to evidence options granted under Blue Coat Systems, Inc. 2007 Stock Incentive Plan |
| |
| 10.41* | | Executive Separation Policy, effective November 15, 2007 |
| |
| 10.42 | | Design and Manufacturing Services Agreement, effective as of February 15, 2008, between Inventec Enterprise System Corporation and Blue Coat Systems, Inc. |
| |
| 10.43 | | Amended and Restated Supply Agreement, effective as of September 8, 2005, between SYNNEX Corporation and Blue Coat Systems, Inc. |
| |
| 10.44 | | Note Purchase Agreement among Blue Coat Systems, Inc., Manchester Securities Corp. and Francisco Partners II, L.P., dated April 20, 2008 (which is incorporated herein by reference to Exhibit 10.01 to the Registrant’s 8-K filed with the Commission on April 23, 2008) |
| |
| 10.45 | | Final Form of Warrant (which is incorporated herein by reference to Exhibit 10.01 to the Registrant’s 8-K filed with the Commission on June 3, 2008) |
| |
| 10.46 | | Stock Purchase Agreement, dated as of April 20, 2008, among The Liverpool Limited Partnership, Elliott International, L.P. and Blue Coat Systems, Inc. (which is incorporated herein by reference to Exhibit 10.02 to the Registrant’s 8-K filed with the Commission on April 23, 2008) |
| |
| 10.47 | | Tender and Support Agreement, dated as of April 20, 2008, among Blue Coat Systems, Inc., Cooper Acquisition, Inc. and the individuals listed on the signature page thereto (which is incorporated herein by reference to Exhibit 2.02 to the Registrant’s 8-K filed with the Commission on April 23, 2008) |
95
| | |
Number | | Description |
| 10.48* | | Profit Sharing Plan, as amended effective May 1, 2008 |
| |
| 10.49 | | Final Form of Note (which is incorporated herein by reference to Exhibit 10.02 to the Registrant’s 8-K filed with the Commission on June 3, 2008) |
| |
| 10.50 | | Registration Rights Agreement by and between Blue Coat Systems, Inc. and Francisco Partners II, L.P. and Francisco Partners Parallel Fund, L.P. (as Investors), dated June 2, 2008 (which is incorporated herein by reference to Exhibit 4.01 to the Registrant’s 8-K filed with the Commission on June 3, 2008) |
| |
| 23.1 | | Consent of Ernst & Young, LLP, Independent Registered Public Accounting Firm. |
| |
| 31.1 | | Chief Executive Officer Certification pursuant to Section 302 of the Sarbanes-Oxley Act of 2002. |
| |
| 31.2 | | Chief Financial Officer Certification pursuant to Section 302 of the Sarbanes-Oxley Act of 2002. |
| |
| 32.1 | | Chief Executive Officer and Chief Financial Officer Certification pursuant to Section 906 of the Sarbanes-Oxley Act of 2002. |
| * | Management contract or compensatory plan or arrangement required to be filed as an exhibit to the Company’s Annual Report on Form 10-K pursuant to Item 15(b). |
96
Schedule II
BLUE COAT SYSTEMS, INC.
VALUATION AND QUALIFYING ACCOUNTS
Allowance for Doubtful Accounts
| | | | | | | | | | | | | | |
Year Ended April 30, | | Balance at
Beginning of
Period | | Additions-
(Reductions) to
Costs and
Expenses | | | Deductions | | | Balance at
End of
Period |
2006 | | $ | 235,000 | | $ | (19,468 | ) | | $ | (70,532 | ) | | $ | 145,000 |
2007 | | | 145,000 | | | 15,000 | | | | — | | | | 160,000 |
2008 | | | 160,000 | | | 76,000 | | | | (60,000 | ) | | | 176,000 |
97