| Q2 ‘22Earnings Results (NYSE: STAR) |
| Statementsinthispresentationwhicharenothistoricalfactmaybedeemedforward-lookingstatementswithinthemeaningofSection27AoftheSecuritiesActof1933andSection21EoftheSecuritiesExchangeActof1934.AlthoughiStarbelievestheexpectationsreflectedinanyforward-lookingstatementsarebasedonreasonableassumptions,theCompanycangivenoassurancethatitsexpectationswillbeattained.TheCompanyundertakesnoobligationtoupdateorpubliclyreviseanyforward-lookingstatement,whetherasaresultofnewinformation,futureeventsorotherwise.ThispresentationshouldbereadinconjunctionwithourconsolidatedfinancialstatementsandrelatednotesinourQuarterlyReportonForm10-QforthequarterendedJune30,2022andourAnnualReportonForm10-KfortheyearendedDecember31,2021.Inassessingallforward-lookingstatementsherein,readersareurgedtoreadcarefullytheRiskFactorssectionandothercautionarystatementsinourForm10-K.FactorsthatcouldcauseactualresultstodiffermateriallyfromiStar’sexpectationsincludegeneraleconomicconditionsandconditionsinthecommercialrealestateandcreditmarketsincluding,withoutlimitation,theimpactofinflationonrisinginterestrates,theeffectoftheCOVID-19pandemiconourbusinessandgrowthprospects,theperformanceofSAFE,theCompany’sabilitytogrowitsgroundleasebusinessdirectlyandthroughSAFE,theCompany’sabilitytogenerateliquidityandtorepayindebtednessasitcomesdue,additionalloanlossprovisionsandthepricingandtimingofanysuchsales,assetimpairments,themarketdemandforlegacyassetstheCompanyseekstosellandthepricingandtimingofsuchsales,changesinNPLs,repaymentlevels,theCompany'sabilitytomakenewinvestments,theCompany’sabilitytomaintaincompliancewithitsdebtcovenants,theCompany’sabilitytogenerateincomeandgainsfromitsportfolioandotherrisksdetailedin“RiskFactors”inour2021AnnualReportonForm10-K,andanyupdatestheretomadeinoursubsequentfillingswiththeSEC. Note re iStar / Safehold Transaction : iStarreportedina13D/AfiledwiththeSEConAugust2,2022,aspecialcommitteeoftheBoardofDirectorsofiStarandaspecialcommitteeoftheBoardofDirectorsofSafeholdareinadvanceddiscussionswithrespecttoapotentialstrategiccorporatetransactionandareproceedingtonegotiatedefinitivetransactionagreements.Nodefinitiveagreementswithrespecttothepotentialtransactionhavebeenexecuted,andtherecanbenoassurancethatdefinitiveagreementswillbeexecuted.iStardoesnotintendtoprovidefurtherinformationastodevelopments,ifany,intheparties'discussionsuntildefinitivetransactionagreementsareexecuted,orasmayotherwiseberequiredbylawordeterminedinitsdiscretion.Thefinancialinformationinthispresentationgivesnoeffecttoanypotentialtransaction. Pleaserefertothe“Glossary”sectionintheAppendixforalistofdefinedtermsandmetrics.Forward-Looking Statements and Other Matters1 Investor Relations Contact Jason FooksSenior Vice President212.930.9400investors@istar.com |
| I. Highlights 2 |
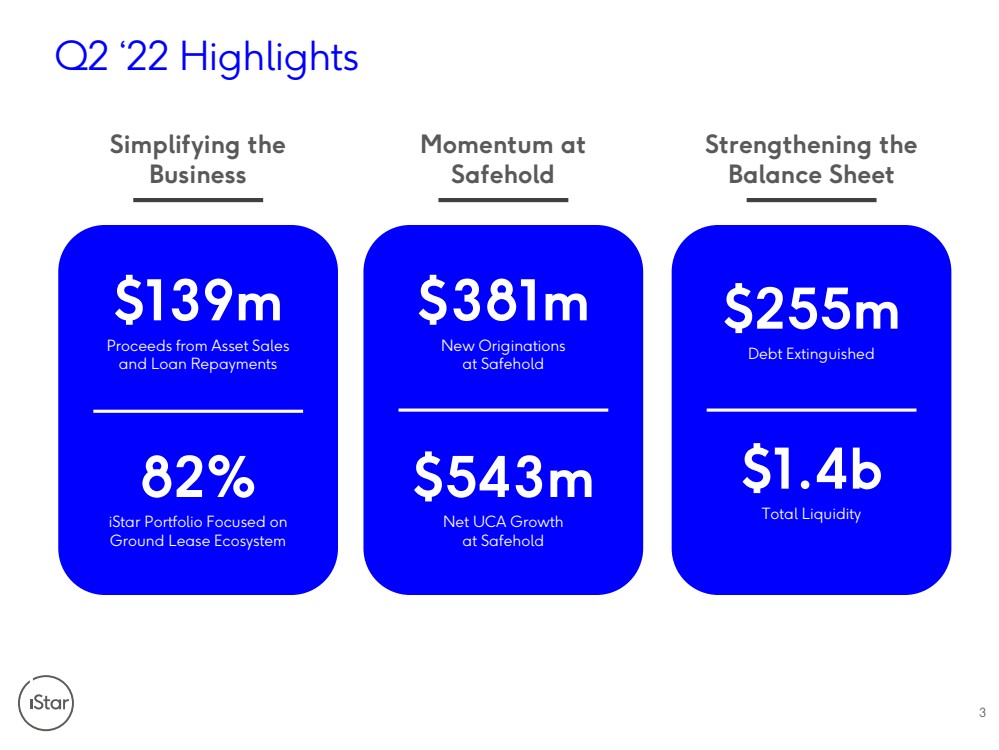
| Q2 ‘22 Highlights3 $381mNew Originations at Safehold$543mNet UCA Growthat Safehold $255mDebt Extinguished$1.4bTotal Liquidity Simplifying the Business Momentum at Safehold Strengthening the Balance Sheet $139mProceeds from Asset Salesand Loan Repayments82%iStar Portfolio Focused on Ground Lease Ecosystem |
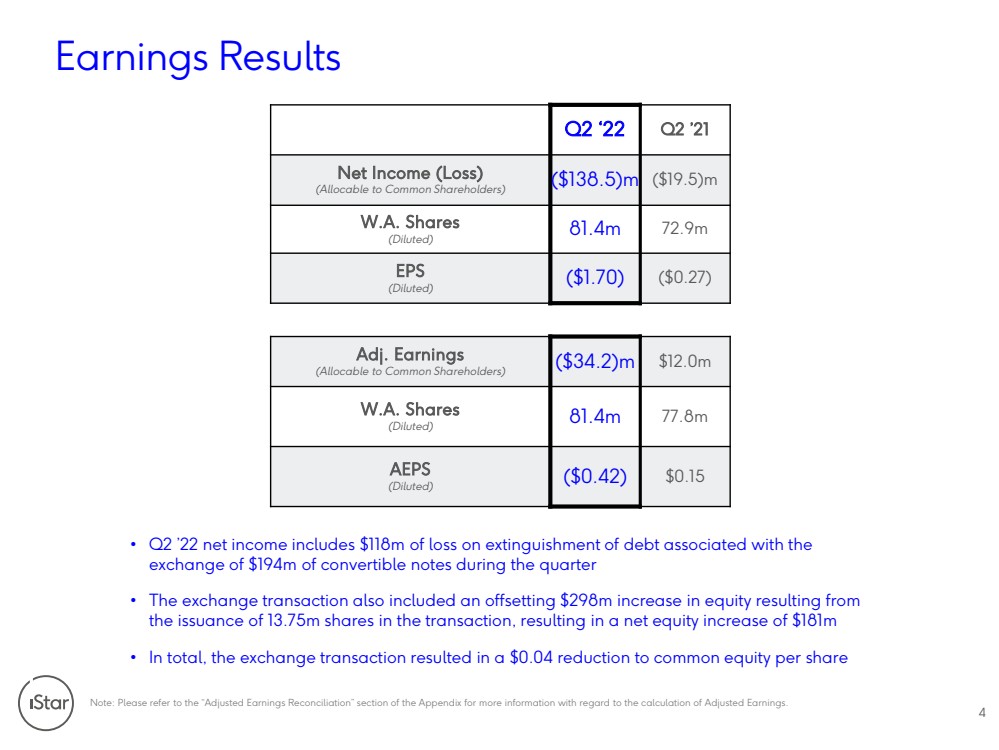
| Earnings Results4 Q2 ‘22 Q2 ’ n 4$g2 (Allocable to Common Shareholders)($138.5)m($19.5)m W.A. Shares (Diluted)81.4m72.9m EPS (Diluted)($1.70)($0.27) Adj. Earnings (Allocable to Common Shareholders)($34.2)m$12.0m W.A. Shares (Diluted)81.4m77.8m AEPS (Diluted)($0.42)$0.15Note: Please refer to the “Adjusted Earnings Reconciliation” section of the Appendix for more information with regard to the calculation of Adjusted Earnings.•Q2 ’22 net income includes $118m of loss on extinguishment of debt associated with the exchange of $194m of convertible notes during the quarter•The exchange transaction also included an offsetting $298m increase in equity resulting from the issuance of 13.75m shares in the transaction, resulting in a net equity increase of $181m•In total, the exchange transaction resulted in a $0.04 reduction to common equity per share |
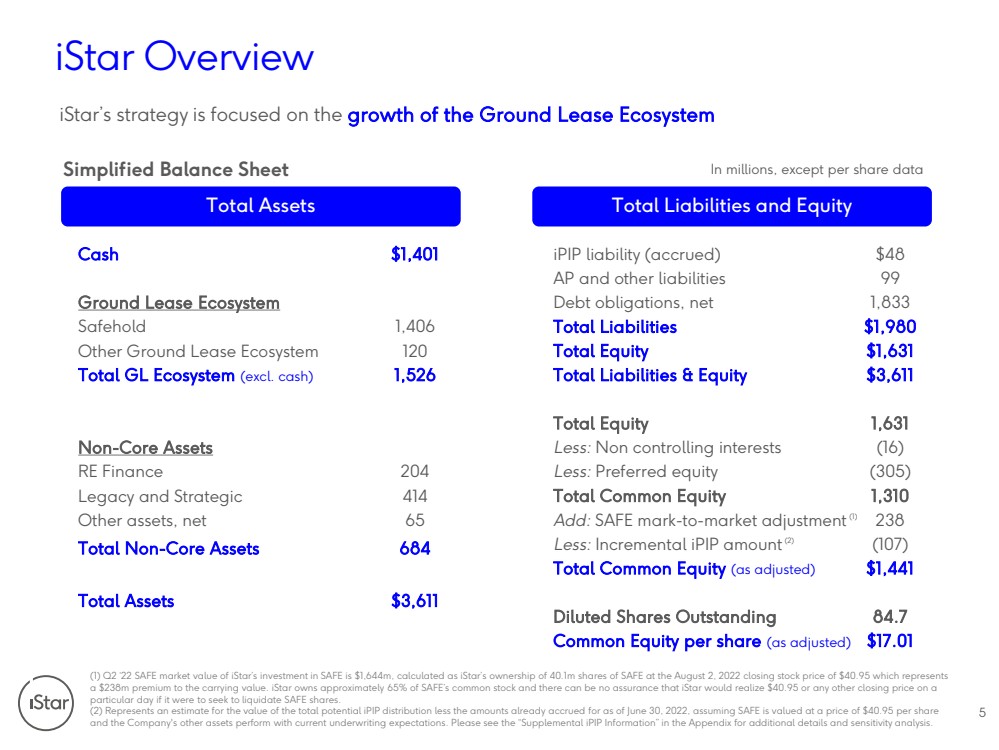
| iStar Overview iStar’s strategy is focused on the growth of the Ground Lease Ecosystem 5(1) Q2 ‘22 SAFE market value of iStar’s investment in SAFE is $1,644m, calculated as iStar’s ownership of 40.1m shares of SAFE at the August 2, 2022closing stock price of $40.95 which represents a $238m premium to the carrying value. iStar owns approximately 65% of SAFE’s common stock and there can be no assurance thatiStar would realize $40.95 or any other closing price on a particular day if it were to seek to liquidate SAFE shares.(2) Represents an estimate for the value of the total potential iPIP distribution less the amounts already accrued for as of June 30, 2022, assuming SAFE is valued at a price of $40.95 per share and the Company's other assets perform with current underwriting expectations. Please see the “Supplemental iPIP Information”inthe Appendix for additional details and sensitivity analysis. Cash $1,401 Ground Lease Ecosystem Safehold1,406Other Ground Lease Ecosystem120 Total GL Ecosystem (excl. cash) 1,526 4$ 8$$np2$9pp5i$65 Total Non - Core Assets PRN Total Assets nMPKK iPIP liability (accrued)$48AP and other liabilities99Debt obligations, net1,833 Total Liabilities $1,980 Total Equity $1,631 e $3,611 1,631 Less:Non controlling interests(16)Less: Preferred equity(305) Total Common Equity 1,310 Add:SAFE mark-to-market adjustment(1)238Less: Incremental iPIP amount(2)(107) Total Common Equity (as adjusted) $1,441 Diluted Shares Outstanding 84.7 Common Equity per share (as adjusted) $17.01 Total Assets Total Liabilities and EquitySimplified Balance SheetIn millions, except per share data |
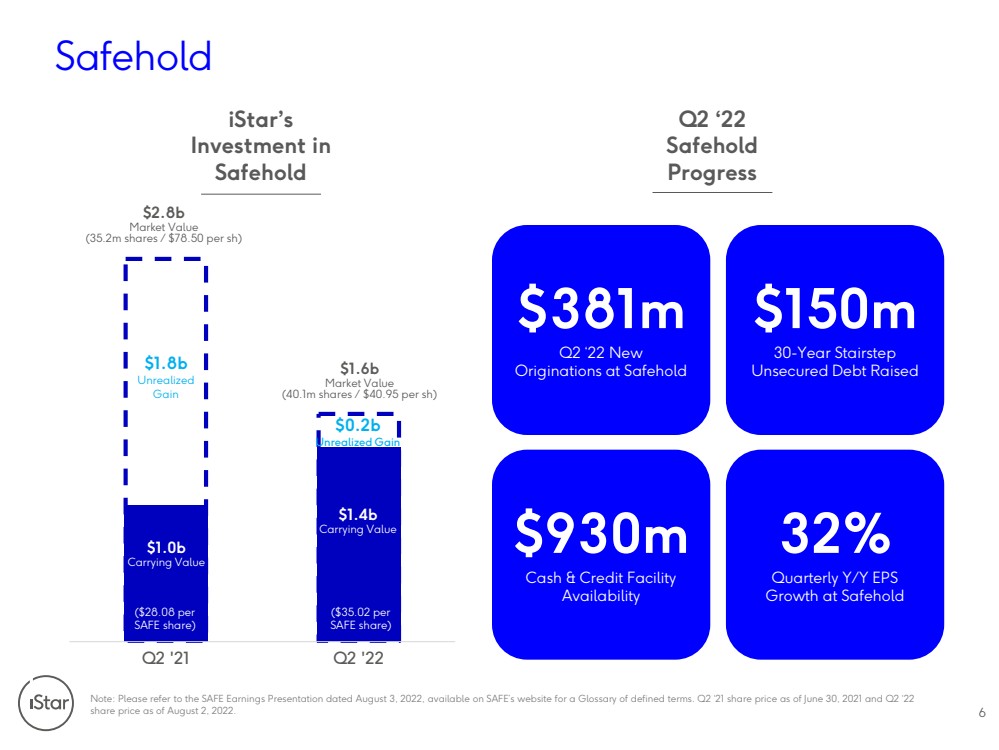
| $2.8bMarket Value(35.2m shares / $78.50 per sh)$1.6bMarket Value(40.1m shares / $40.95 per sh)$1.0bCarrying Value$1.4bCarrying Value Q2 '21 Q2 '22 aehold6Note: Please refer to the SAFE Earnings Presentation dated August 3, 2022, available on SAFE’s website for a Glossary of definedterms. Q2 ‘21 share price as of June 30, 2021and Q2 ‘22 share price as of August 2, 2022. iStar’s Investment in Safehold $381mQ2 ‘22 New Originations at Safehold $150m30-Year StairstepUnsecured Debt Raised $930mCash & Credit Facility Availability 32%Quarterly Y/Y EPS Growth at Safehold$1.8bUnrealizedGain Q2 ‘22 Safehold Progress ($28.08 per SAFE share)($35.02 per SAFE share)$0.2bUnrealized Gain |
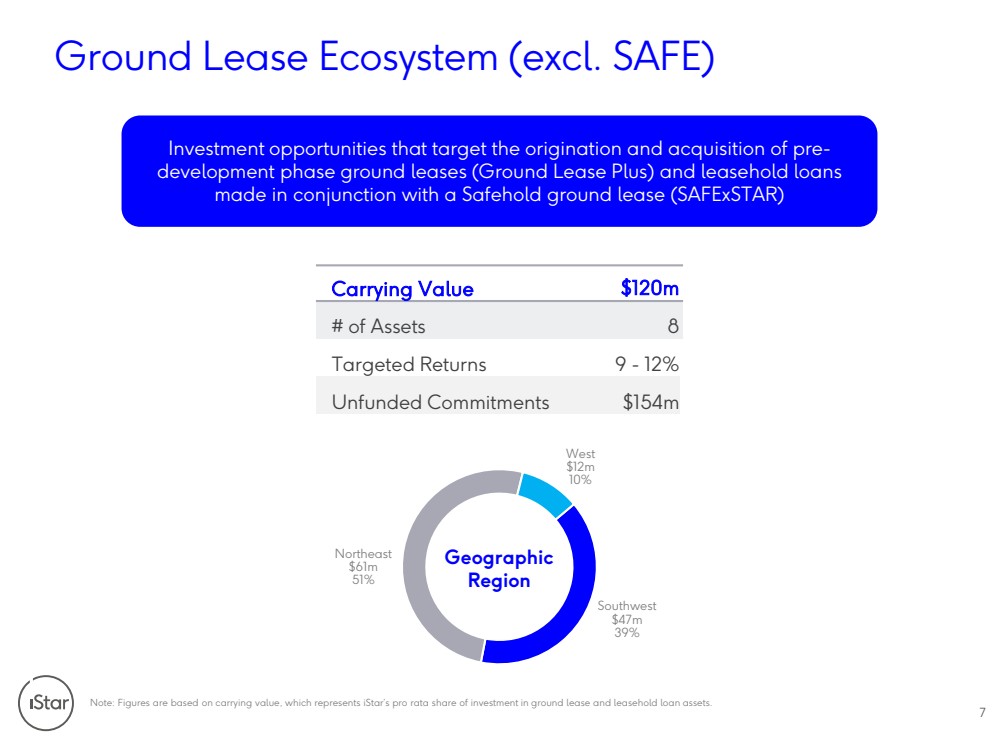
| 7Note: Figures are based on carrying value, which represents iStar’s pro rata share of investment in ground lease and leasehold loan assets.Ground Lease Ecosystem (excl. SAFE) Investment opportunities that target the origination and acquisition of pre-development phase ground leases (Ground Lease Plus) and leasehold loans made in conjunction with a Safehold ground lease (SAFExSTAR) Carrying Value $120m # of Assets8Targeted Returns9 -12%Unfunded Commitments$154mGeographic Region Southwest$47m39%Northeast$61m51%West$12m10% |
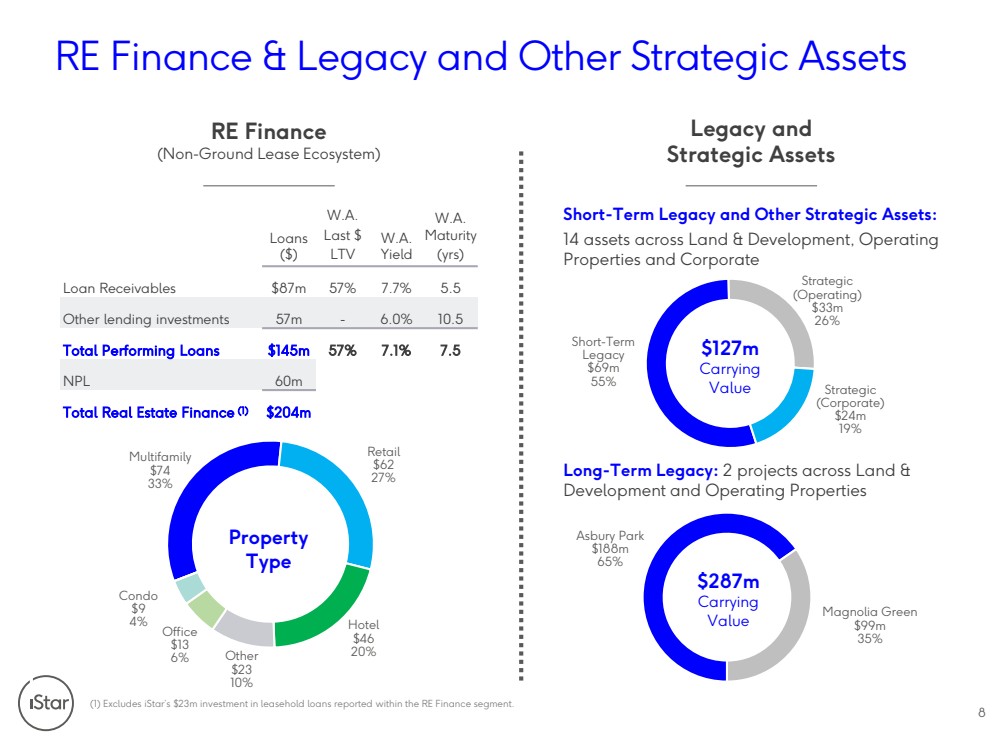
| Short-Term Legacy$69m55%Strategic (Operating)$33m26%Strategic (Corporate)$24m19% Asbury Park$188m65%Magnolia Green$99m35%RE Finance & Legacy and Other Strategic Assets8 RE Finance(Non-Ground Lease Ecosystem)Legacy and Strategic Assets Loans ($)W.A. W.A. YieldW.A. MaturityLast $ LTV(yrs)Loan Receivables$87m57%7.7%5.5Other lending investments57m-6.0%10.5 Total Performing Loans $145m 57% 7.1% sj 4260m Total Real Estate Finance (1) $204m $287mCarrying Value$127mCarrying ValueProperty Type Short-Term Legacy and Other Strategic Assets:14 assets across Land & Development, Operating Properties and Corporate(1) Excludes iStar’s $23m investment in leasehold loans reported within the RE Finance segment.Long-Term Legacy:2 projects across Land & Development and Operating Properties Multifamily$7433%Retail$6227%Hotel$4620%Other$2310%Office$136%Condo$94% |
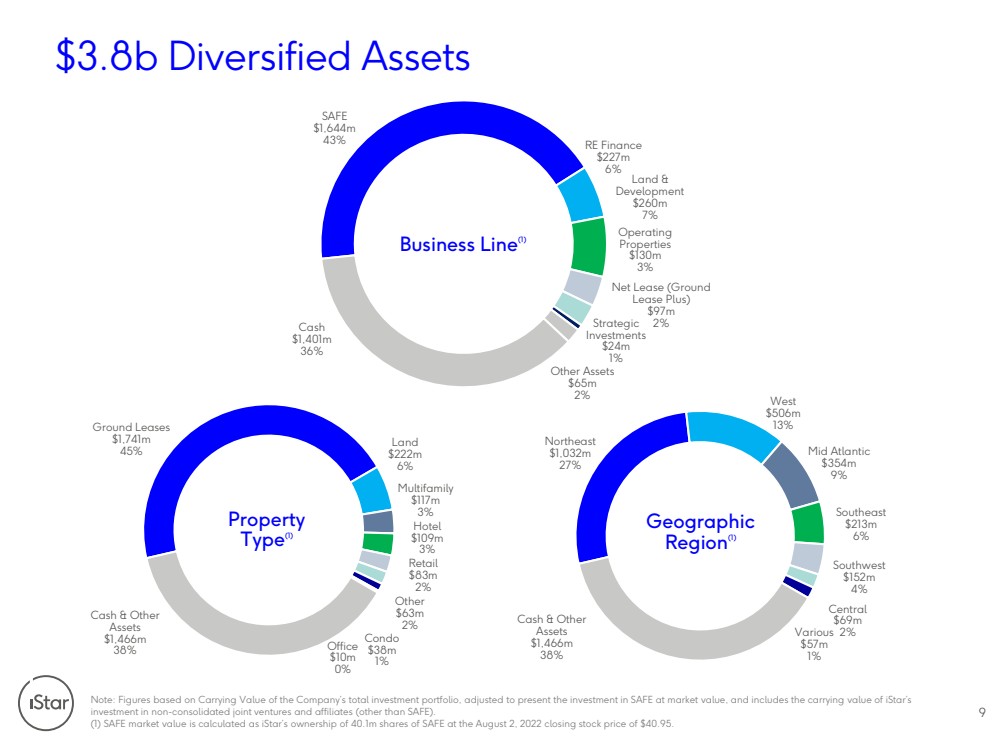
| $3.8b Diversified AssetsNote: Figures based on Carrying Value of the Company’s total investment portfolio, adjusted to present the investment in SAFEatmarket value, and includes the carrying value of iStar’s investment in non-consolidated joint ventures and affiliates (other than SAFE).(1) SAFE market value is calculated as iStar’s ownership of 40.1m shares of SAFE at the August 2, 2022 closing stock price of$40.95. 9 SAFE$1,644m43%RE Finance$227m6%Land & Development$260m7%Operating Properties$130m3%Net Lease (Ground Lease Plus)$97m2%Strategic Investments$24m1%Other Assets$65m2%Cash$1,401m36%Business Line(1) Northeast$1,032m27%West$506m13%Mid Atlantic$354m9%Southeast$213m6%Southwest$152m4%Central$69m2%Various$57m1%Cash & Other Assets$1,466m38%GeographicRegion(1) Ground Leases$1,741m45%Land$222m6%Multifamily$117m3%Hotel$109m3%Retail$83m2%Other$63m2%Condo$38m1%Office$10m0%Cash & Other Assets$1,466m38%PropertyType(1) |
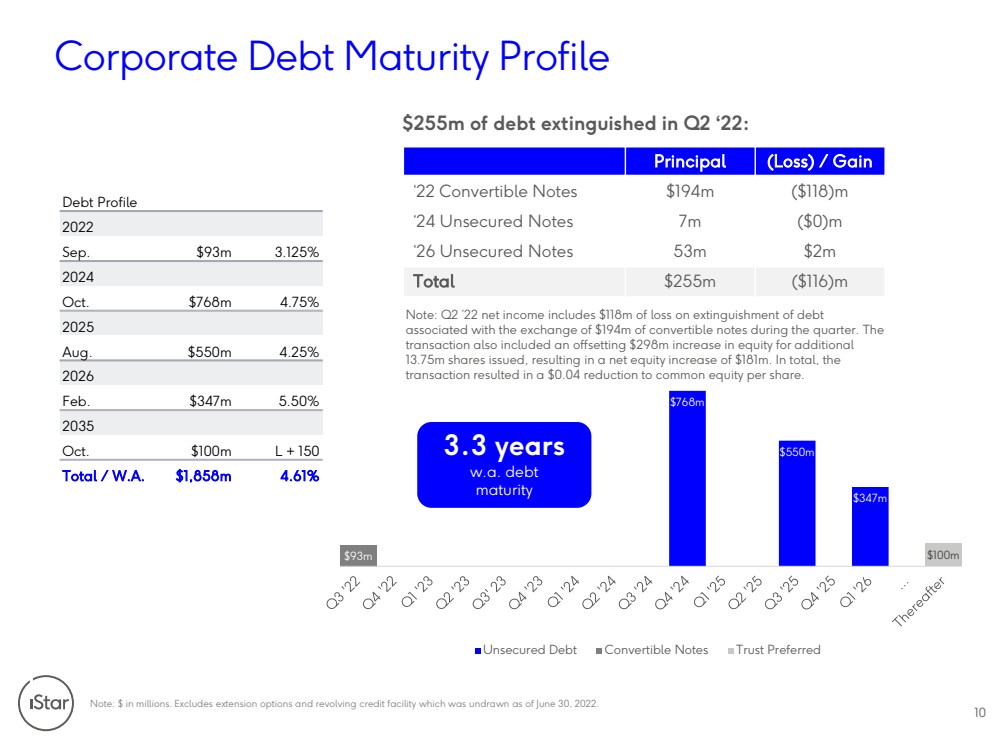
| $768m$550m$347m$93m$100m Unsecured Debt Convertible Notes Trust Preferred Debt Profile2022 Sep. $93m 3.125%2024Oct. $768m 4.75%2025 Aug. $550m 4.25%2026Feb. $347m 5.50%2035Oct. $100m L + 150 Total / W.A. $1,858m 4.61% 36%4vcj$$$$%$$0$olinlnnjm 3.3 yearsw.a. debtmaturity$255m of debt extinguished in Q2 ‘22: Principal (Loss) / Gain ‘22 Convertible Notes$194m($118)m‘24 Unsecured Notes7m($0)m‘26 Unsecured Notes53m$2m Total $255m($116)mNote: Q2 ’22 net income includes $118m of loss on extinguishment of debt associated with the exchange of $194m of convertible notes during the quarter. The transaction also included an offsetting $298m increase in equity for additional 13.75m shares issued, resulting in a net equity increase of $181m. In total, the transaction resulted in a $0.04 reduction to common equity per share. |
| II. Capital Structure11 |
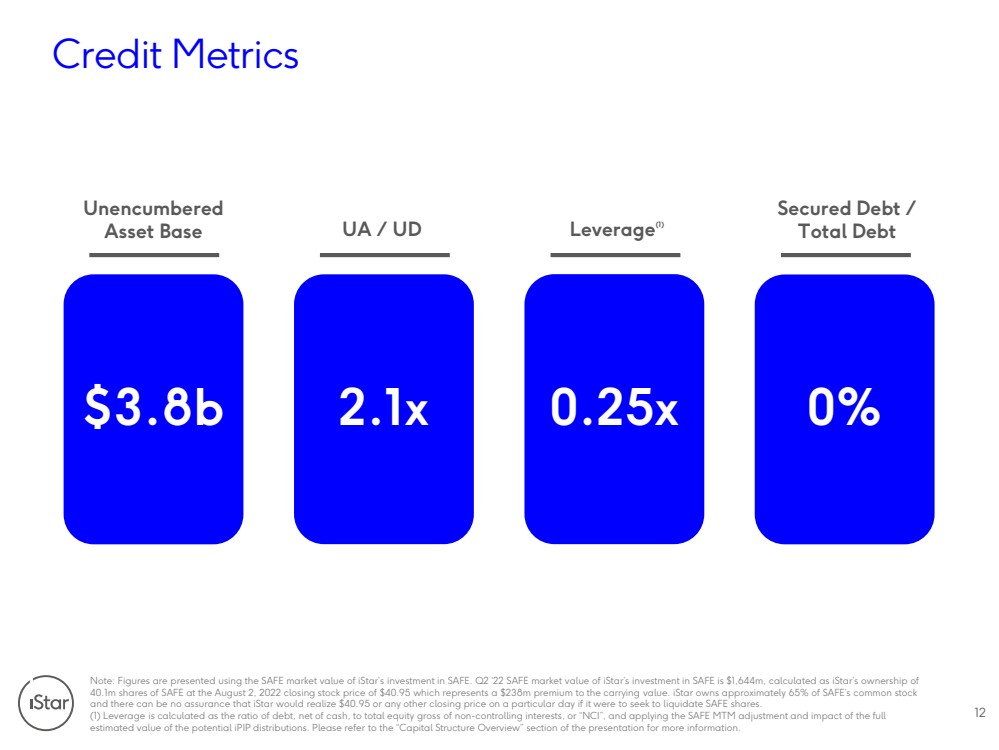
| Credit Metrics12Note: Figures are presented using the SAFE market value of iStar’s investment in SAFE. Q2 ‘22 SAFE market value of iStar’s investment in SAFE is $1,644m, calculated as iStar’s ownership of 40.1m shares of SAFE at the August 2, 2022 closing stock price of $40.95 which represents a $238m premium to the carrying value.iStar owns approximately 65% of SAFE’s common stock and there can be no assurance that iStar would realize $40.95 or any other closing price on a particular day if it were to seek to liquidate SAFE shares.(1) Leverage is calculated as the ratio of debt, net of cash, to total equity gross of non-controlling interests, or “NCI”, and applying the SAFE MTM adjustment and impact of the full estimated value of the potential iPIP distributions. Please refer to the “Capital Structure Overview” section of the presentation for more information.Unencumbered Asset Base Secured Debt / Total DebtUA / UDLeverage(1) $3.8b 2.1x1.2x1.6x 0.25x 0% |
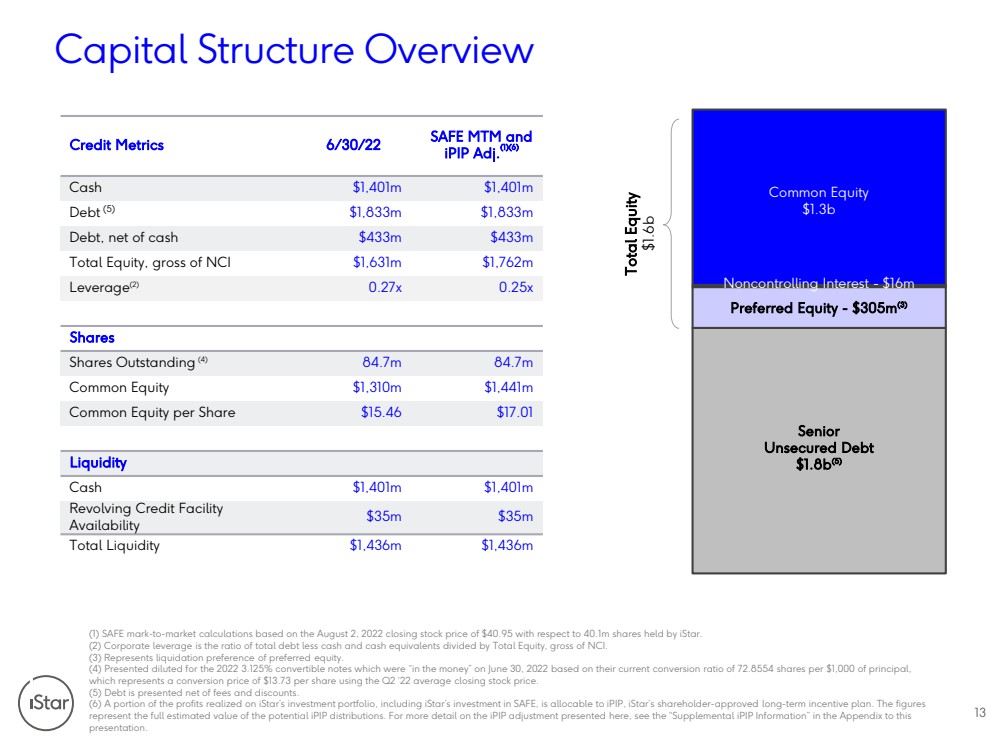
| Common Equity$1.3bNoncontrolling Interest -$16m Preferred Equity - $305m (3) Senior Unsecured Debt $1.8b (5) Capital Structure Overview(1) SAFE mark-to-market calculations based on the August 2, 2022closing stock price of $40.95 with respect to 40.1m shares held by iStar.(2) Corporate leverage is the ratio of total debt less cash and cash equivalents divided by Total Equity, gross of NCI.(3) Represents liquidation preference of preferred equity.(4) Presented diluted for the 2022 3.125% convertible notes which were “in the money” on June 30, 2022based on their current conversion ratio of 72.8554 shares per $1,000 of principal, which represents a conversion price of $13.73 per share using the Q2 ‘22 average closing stock price.(5) Debt is presented net of fees and discounts.(6) A portion of the profits realized on iStar’s investment portfolio, including iStar’s investment in SAFE, is allocable to iPIP, iStar’s shareholder-approved long-term incentive plan. The figures represent the full estimated value of the potential iPIP distributions. For more detail on the iPIP adjustment presented here, see the “Supplemental iPIP Information” in the Appendix to this presentation. Total Equity $1.6b13 Credit Metrics 6/30/22 933$ 6 (1)(6) cmplmcmplmgcmitoocmitoo$%cpoocpooi4$1,631m$1,762mLeverage(2)0.27x0.25x Shares Shares Outstanding(4)84.7m84.7mCommon Equity$1,310m$1,441mCommon Equity per Share$15.46$17.01 Liquidity Cash$1,401m$1,401mRevolving Credit Facility Availability$35m$35mTotal Liquidity$1,436m$1,436m |
| III. Appendix14 |
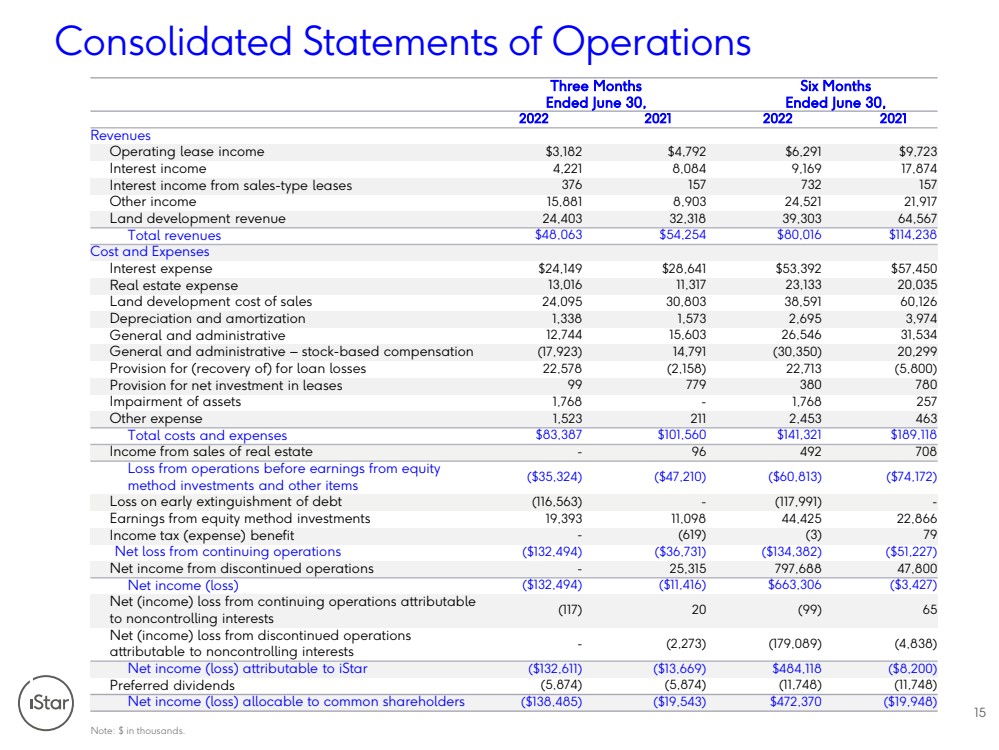
| Consolidated Statements of OperationsNote:$inthousands.15 Three Months Six Months Ended June 30, Ended June 30, 2022 2021 2022 2021 Revenues Operating lease income $3,182 $4,792 $6,291 cuisno $$ pinnm tiltp 9,169 msts $$% 376 ms so ms 5$ mittm til niqn nmum 2$ npil oiot oioo 64,567 $48,063 cqinq $80,016 cmmpinot $ $ cnpmp $28,641 cqoon cqipq 8 13,016 mmiom nomoo nllq 2$% npiluq olitl otqu 60,126 $$$ mioot miqso 2,695 ousp $$ mnispp 15,603 26,546 oiqo $$ :$$ gmsiuno misum golioql nlinuu 6%g%$ nniqst gnimt nnismo gqill 6$%$$$ uu ssu ol stl % 1,768 1,768 nq 5 miqno nmm nipqo 463 $ ctoos $101,560 cmmonm cmuimmt $%% 96 pu sl 2%$%$%$$ gcoiop gcpsinml ($60,813) gcspimsn 2$$% (116,563) gmmsiuum $$%$ muioo mmilut ppipq 22,866 $g (619) go su 4%$$$$ gcmonipup ($36,731) gcmoion gcqminns 4$%$$$ nqomq 797,688 psill 4$g gcmonipup ($11,416) $663,306 gcoipns 4g$%$$$$ $$$$$ gmms nl guu 65 4g$%$$$ $$$$$ gnno gmsultu gpitt 4$g9 ($132,611) ($13,669) cptpimmt gctill 6 gitsp gitsp gmmispt gmmispt 4$g$ gcmotiptq gcmuiqpo cpsnisl gcmuut |
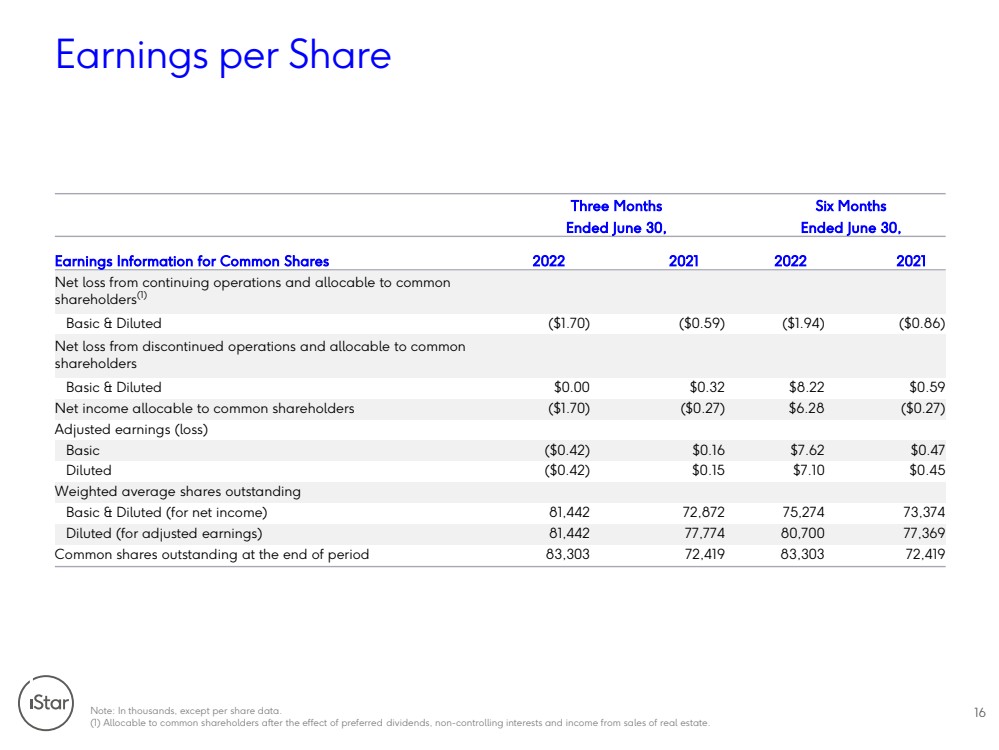
| Earnings per ShareNote:Inthousands,exceptpersharedata.(1)Allocabletocommonshareholdersaftertheeffectofpreferreddividends,non-controllinginterestsandincomefromsalesofrealestate.16 Three Months Six Months Ended June 30, Ended June 30, Earnings Information for Common Shares 2022 2021 2022 2021 Net loss from continuing operations and allocable to common shareholders (1) Basic & Diluted ($1.70) ($0.59) ($1.94) ($0.86) 4%$$$$ e clll cljon ctjnn cljqu 4$$ gcmjl gcljs $6.28 gcljs $g gcljp $0.16 $7.62 cljp gcljp cljq csjl cljp $$ eg%$ tmippn sits sins soop g%$$ tmippn ssissp tlisl 77,369 $$$% tooo snipu tooo snipu |
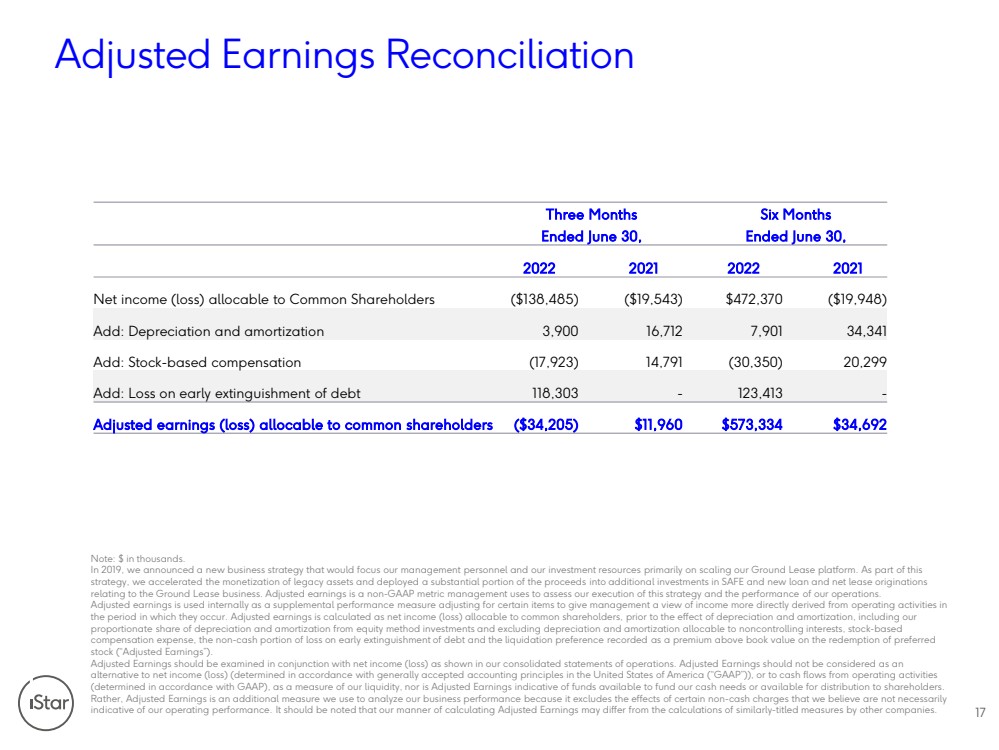
| Adjusted Earnings Reconciliation17Note: $ in thousands. In 2019, we announced a new business strategy that would focus our management personnel and our investment resources primarily on scaling our Ground Lease platform. As part of this strategy, we accelerated the monetization of legacy assets and deployed a substantial portion of the proceeds into additionalinvestments in SAFE and new loan and net lease originations relating to the Ground Lease business. Adjusted earnings is a non-GAAP metric management uses to assess our execution of this strategy and the performance of our operations.Adjusted earnings is used internally as a supplemental performance measure adjusting for certain items to give management a viewof income more directly derived from operating activities in the period in which they occur. Adjusted earnings is calculated as net income (loss) allocable to common shareholders, prior to the effect of depreciation and amortization, including our proportionate share of depreciation and amortization from equity method investments and excluding depreciation and amortization allocable to noncontrolling interests, stock-based compensation expense, the non-cash portion of loss on early extinguishment of debt and the liquidation preference recorded as a premium above book value on the redemption of preferred stock (“Adjusted Earnings”). Adjusted Earnings should be examined in conjunction with net income (loss) as shown in our consolidated statements of operations. Adjusted Earnings should not be considered as an alternative to net income (loss) (determined in accordance with generally accepted accounting principles in the United StatesofAmerica (“GAAP”)), or to cash flows from operating activities (determined in accordance with GAAP), as a measure of our liquidity, nor is Adjusted Earnings indicative of funds available to fund our cash needs or available for distribution to shareholders. Rather, Adjusted Earnings is an additional measure we use to analyze our business performance because it excludes the effectsofcertain non-cash charges that we believe are not necessarily indicative of our operating performance. It should be noted that our manner of calculating Adjusted Earnings may differ from thecalculations of similarly-titled measures by other companies. Three Months Six Months Ended June 30, Ended June 30, 2022 2021 2022 2021 Net income (loss) allocable to Common Shareholders ($138,485) ($19,543) $472,370 ($19,948) Add: Depreciation and amortization 3,900 16,712 sium opop v9 $$ gmsiuno misum goiol nlinuu v2$$% mmtiolo mnoipmo $$g$ gcoinq $11,960 cqsooop $34,692 |
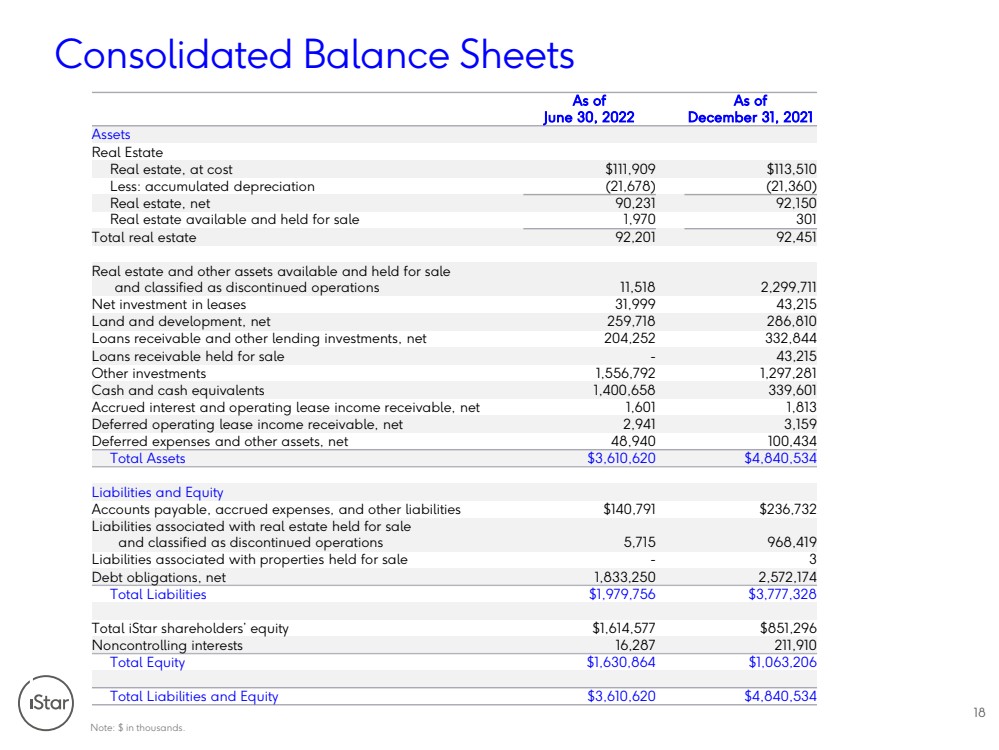
| Consolidated Balance SheetsNote:$inthousands.18 As of As of June 30, 2022 December 31, 2021 Assets Real Estate Real estate, at cost $111,909 $113,510 Less: accumulated depreciation (21,678) (21,360) 8i$ ulinom uimql 8% miul om unnm uipqm 8$$% $%$$$ mmiqm ninuuismm 4$$ omiuuu ponq 2$$$i$ nqusmt 286,810 2$$$$i$ npinn ontpp 2% ponq 5$ 1,556,792 miusitm $ 1,400,658 339,601 $$$$$ 1,601 mtm $$$ nium oiqu $i$ piup mllipop $3,610,620 cptpiqop 2$ $i$i cmlisum $236,732 2% $%$$$ qsmq 968,419 2% o $i$ mitooinl nisnisp 2 $1,979,756 coissont Total iStar shareholders’ equity $1,614,577 $851,296 4$$$$ 16,287 nmmium $1,630,864 $1,063,206 2$ $3,610,620 cptpiqop |
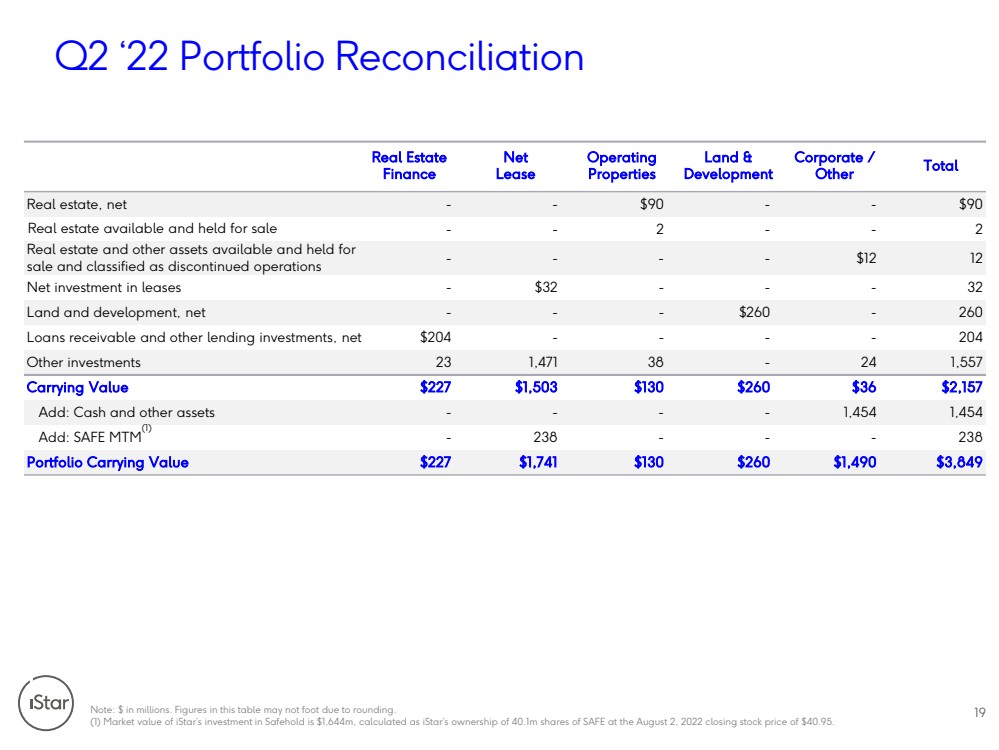
| Q2 ‘22 Portfolio ReconciliationNote: $ in millions. Figures in this table may not foot due to rounding.(1) Market value of iStar’s investment in Safehold is $1,644m, calculated as iStar’s ownership of 40.1m shares of SAFE at theAugust 2, 2022 closing stock price of $40.95.19 Real Estate Finance Net Lease Operating Properties Land & Development Corporate / Other Total Real estate, net-- $90 --$90Real estate available and held for sale--2--2Real estate and other assets available and held for sale and classified as discontinued operations----$1212Net investment in leases-$32---32Land and development, net---$260-260Loans receivable and other lending investments, net$204----204Other investments231,47138-241,557 Carrying Value $227 $1,503 $130 $260 $36 cniqs $mippmippv933gnotnot 6$ cnns cmipm cmol $260 cmiul coipu |
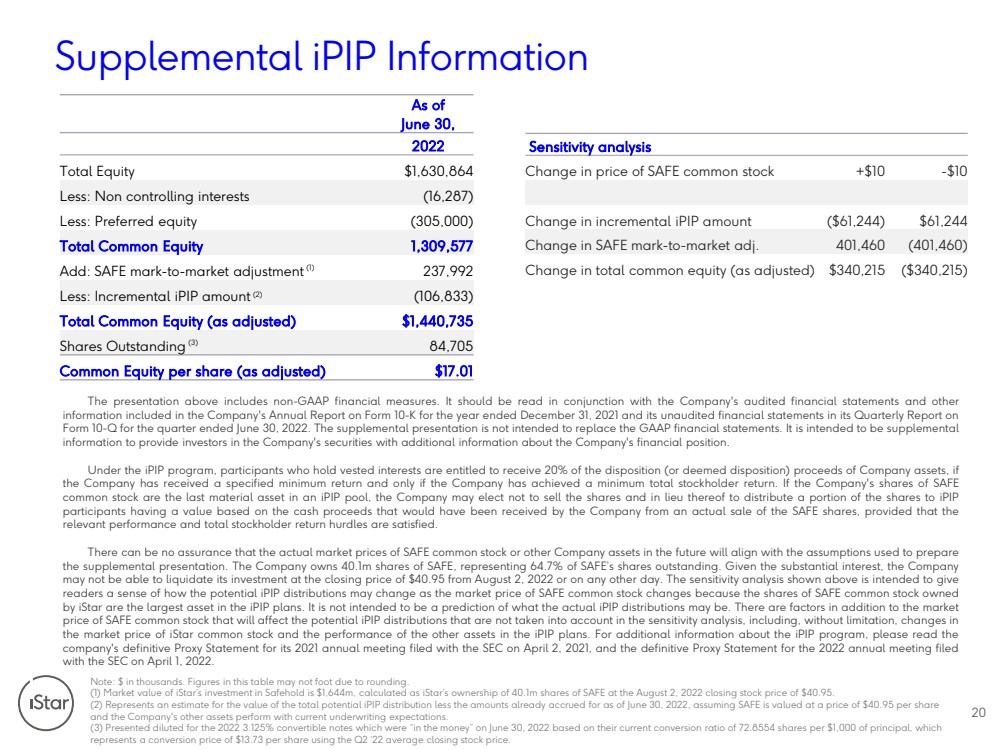
| Supplemental iPIP InformationNote: $ in thousands. Figures in this table may not foot due to rounding.(1) Market value of iStar’s investment in Safehold is $1,644m, calculated as iStar’s ownership of 40.1m shares of SAFE at theAugust 2, 2022 closing stock price of $40.95.(2) Represents an estimate for the value of the total potential iPIP distribution less the amounts already accrued for as of June 30, 2022, assuming SAFE is valued at a price of $40.95 per share and the Company's other assets perform with current underwriting expectations. (3) Presented diluted for the 2022 3.125% convertible notes which were “in the money” on June 30, 2022 based on their currentconversion ratio of 72.8554 shares per $1,000 of principal, which represents a conversion price of $13.73 per share using the Q2 ‘22 average closing stock price.20 As of June 30, 2022 Total Equity $1,630,864 2v4$$$$ (16,287) 2v6 golill $ miluiss v9 gm nosiuun 2v$66$ gn (106,833) $g cmiplioq 95$$ go tpisq $g csjlm 9$$ $%9$ hm cm $$$$66$ ($61,244) $61,244 $9 j 401,460 (401,460) Change in total common equity (as adjusted) $340,215 ($340,215) Thepresentationaboveincludesnon-GAAPfinancialmeasures.ItshouldbereadinconjunctionwiththeCompany'sauditedfinancialstatementsandotherinformationincludedintheCompany'sAnnualReportonForm10-KfortheyearendedDecember31,2021anditsunauditedfinancialstatementsinitsQuarterlyReportonForm10-QforthequarterendedJune30,2022.ThesupplementalpresentationisnotintendedtoreplacetheGAAPfinancialstatements.ItisintendedtobesupplementalinformationtoprovideinvestorsintheCompany'ssecuritieswithadditionalinformationabouttheCompany'sfinancialposition.UndertheiPIPprogram,participantswhoholdvestedinterestsareentitledtoreceive20%ofthedisposition(ordeemeddisposition)proceedsofCompanyassets,iftheCompanyhasreceivedaspecifiedminimumreturnandonlyiftheCompanyhasachievedaminimumtotalstockholderreturn.IftheCompany'ssharesofSAFEcommonstockarethelastmaterialassetinaniPIPpool,theCompanymayelectnottosellthesharesandinlieuthereoftodistributeaportionofthesharestoiPIPparticipantshavingavaluebasedonthecashproceedsthatwouldhavebeenreceivedbytheCompanyfromanactualsaleoftheSAFEshares,providedthattherelevantperformanceandtotalstockholderreturnhurdlesaresatisfied.TherecanbenoassurancethattheactualmarketpricesofSAFEcommonstockorotherCompanyassetsinthefuturewillalignwiththeassumptionsusedtopreparethesupplementalpresentation.TheCompanyowns40.1msharesofSAFE,representing64.7%ofSAFE’ssharesoutstanding.Giventhesubstantialinterest,theCompanymaynotbeabletoliquidateitsinvestmentattheclosingpriceof$40.95fromAugust2,2022oronanyotherday.ThesensitivityanalysisshownaboveisintendedtogivereadersasenseofhowthepotentialiPIPdistributionsmaychangeasthemarketpriceofSAFEcommonstockchangesbecausethesharesofSAFEcommonstockownedbyiStararethelargestassetintheiPIPplans.ItisnotintendedtobeapredictionofwhattheactualiPIPdistributionsmaybe.TherearefactorsinadditiontothemarketpriceofSAFEcommonstockthatwillaffectthepotentialiPIPdistributionsthatarenottakenintoaccountinthesensitivityanalysis,including,withoutlimitation,changesinthemarketpriceofiStarcommonstockandtheperformanceoftheotherassetsintheiPIPplans.ForadditionalinformationabouttheiPIPprogram,pleasereadthecompany'sdefinitiveProxyStatementforits2021annualmeetingfiledwiththeSEConApril2,2021,andthedefinitiveProxyStatementforthe2022annualmeetingfiledwiththeSEConApril1,2022. |
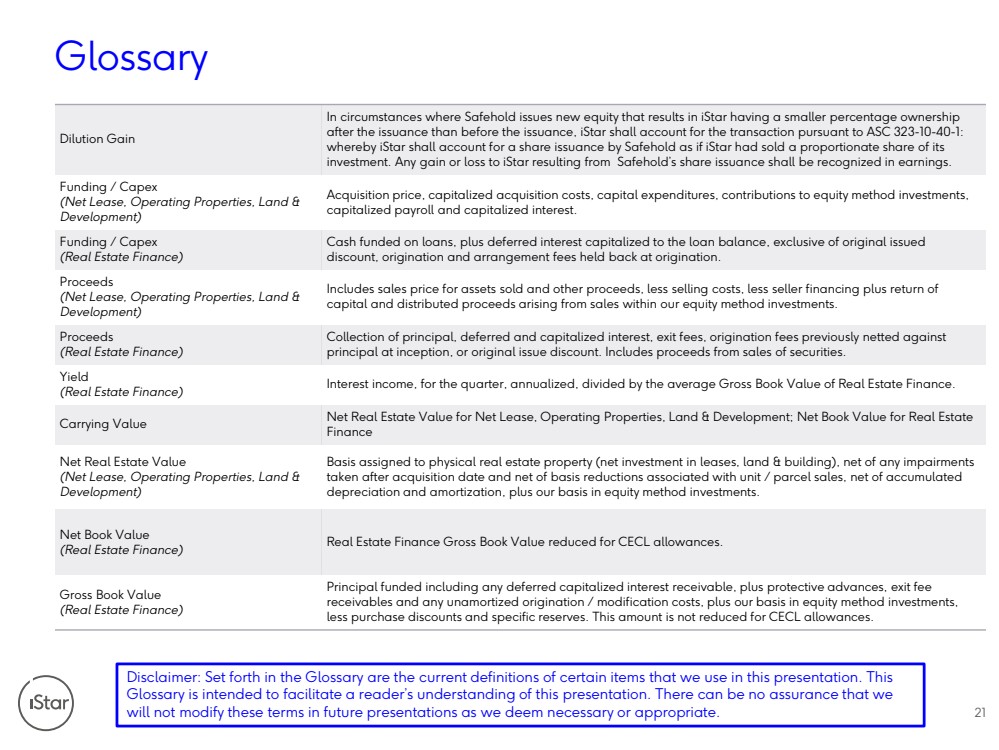
| Glossary Dilution GainIn circumstances where Safehold issues new equity that results in iStar having a smaller percentage ownership after the issuance than before the issuance, iStar shall account for the transaction pursuant to ASC 323-10-40-1: whereby iStar shall account for a share issuance by Safehold as if iStar had sold a proportionate share of its investment. Any gain or loss to iStar resulting from Safehold’s share issuance shall be recognized in earnings.Funding / Capex (NetLease, Operating Properties, Land & Development)Acquisition price, capitalized acquisition costs, capital expenditures,contributions to equity method investments, capitalized payroll and capitalized interest.Funding / Capex (Real Estate Finance)Cash funded on loans, plus deferredinterest capitalized to the loan balance, exclusive of original issued discount, origination and arrangement fees held back at origination.Proceeds (Net Lease, OperatingProperties, Land & Development)Includes sales price for assets sold and other proceeds, less selling costs, less seller financing plus return of capital and distributed proceeds arising from sales within our equity method investments.Proceeds (Real Estate Finance)Collection of principal, deferred and capitalized interest, exit fees, origination fees previously netted against principal at inception, or original issue discount. Includes proceeds from sales of securities.Yield (Real Estate Finance)Interest income, for the quarter, annualized, divided by the average Gross Book Value of Real Estate Finance.Carrying ValueNet Real Estate Value for Net Lease, Operating Properties, Land & Development; Net Book Value for Real Estate FinanceNet Real Estate Value (Net Lease, Operating Properties, Land & Development)Basis assigned to physical real estate property (net investment in leases, land & building), net of any impairments taken after acquisition date and net of basis reductions associated with unit / parcel sales, net of accumulated depreciation and amortization, plus our basisin equity method investments.Net Book Value (Real Estate Finance)Real Estate Finance Gross Book Value reduced for CECL allowances.Gross Book Value(RealEstate Finance)Principal funded including any deferred capitalized interest receivable, plus protective advances, exit fee receivables and any unamortized origination / modification costs,plus our basis in equity method investments, less purchase discounts and specific reserves. This amount is not reduced for CECL allowances.21 Disclaimer: Set forth in the Glossary are the current definitions of certain items that we use in this presentation. This Glossary is intended to facilitate a reader’s understanding of this presentation. There can be no assurance that we will not modify these terms in future presentations as we deem necessary or appropriate. |
