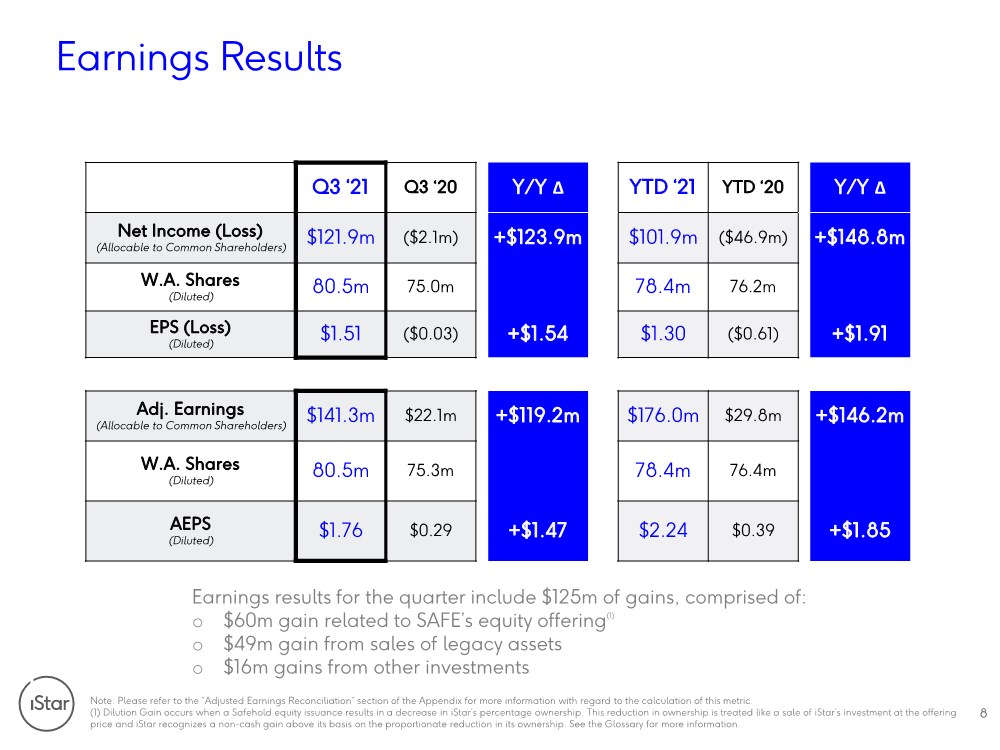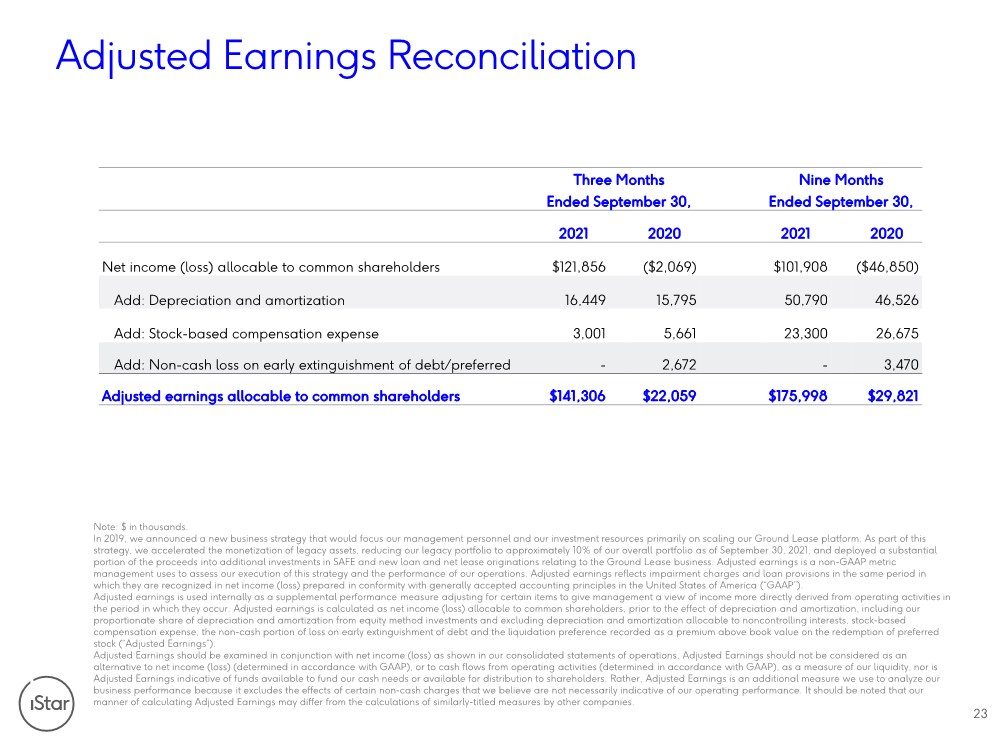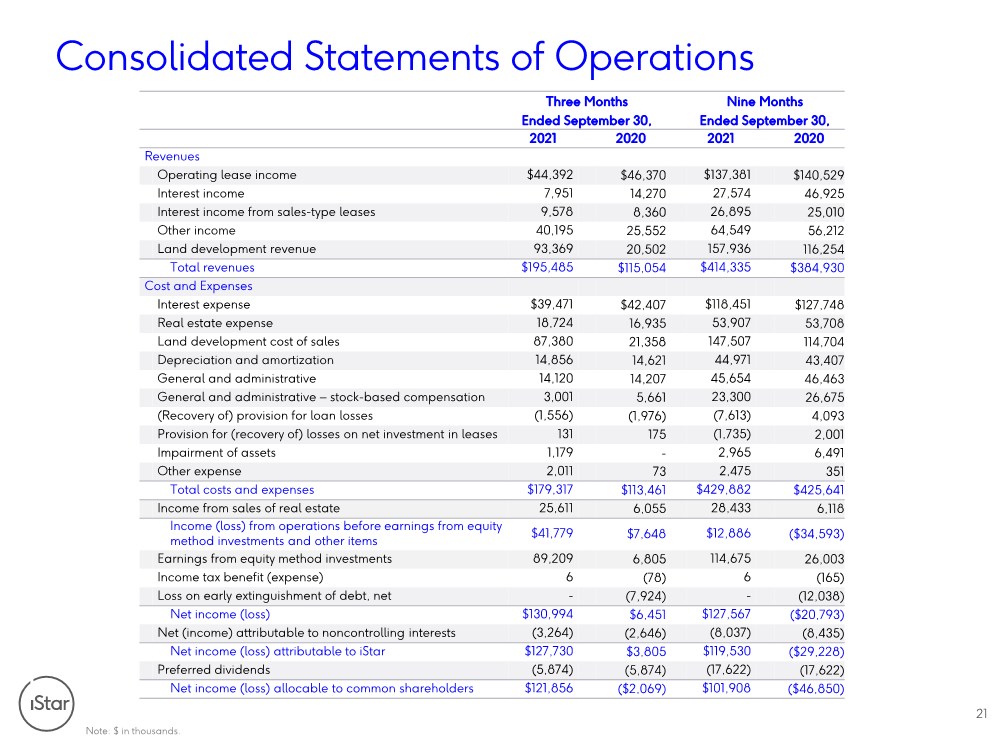
| Consolidated Statements of Operations Note: $ in thousands. 21 Three Months Nine Months Ended September 30, Ended September 30, 2021 2020 2021 2020 Revenues Operating lease income $44,392 $46,370 $137,381 $140,529 Interest income 7,951 14,270 27,574 46,925 Interest income from sales-type leases 9,578 8,360 26,895 25,010 Other income 40,195 25,552 64,549 56,212 Land development revenue 93,369 20,502 157,936 116,254 Total revenues $195,485 $115,054 $414,335 $384,930 Cost and Expenses Interest expense $39,471 $42,407 $118,451 $127,748 Real estate expense 18,724 16,935 53,907 53,708 Land development cost of sales 87,380 21,358 147,507 114,704 Depreciation and amortization 14,856 14,621 44,971 43,407 General and administrative 14,120 14,207 45,654 46,463 General and administrative – stock-based compensation 3,001 5,661 23,300 26,675 (Recovery of) provision for loan losses (1,556) (1,976) (7,613) 4,093 Provision for (recovery of) losses on net investment in leases 131 175 (1,735) 2,001 Impairment of assets 1,179 - 2,965 6,491 Other expense 2,011 73 2,475 351 Total costs and expenses $179,317 $113,461 $429,882 $425,641 Income from sales of real estate 25,611 6,055 28,433 6,118 Income (loss) from operations before earnings from equity method investments and other items $41,779 $7,648 $12,886 ($34,593) Earnings from equity method investments 89,209 6,805 114,675 26,003 Income tax benefit (expense) 6 (78) 6 (165) Loss on early extinguishment of debt, net - (7,924) - (12,038) Net income (loss) $130,994 $6,451 $127,567 ($20,793) Net (income) attributable to noncontrolling interests (3,264) (2,646) (8,037) (8,435) Net income (loss) attributable to iStar $127,730 $3,805 $119,530 ($29,228) Preferred dividends (5,874) (5,874) (17,622) (17,622) Net income (loss) allocable to common shareholders $121,856 ($2,069) $101,908 ($46,850) |