May 25, 2021
U.S. Securities and Exchange Commission
Division of Investment Management
100 F Street, NE
Washington, DC 20549-0504
Attention: Elena Stojic, Esq.
VIA EDGAR
Re: | Registrant: | Natixis Funds Trust IV |
| File No.: | 811-09945 |
| Filing Type: | Form N-1A |
Dear Ms. Stojic:
This letter responds to comments of the staff (the "Staff") of the Securities and Exchange Commission (the "Commission") received by telephone on May 18, 2021, regarding the post-effective amendment to Natixis Funds Trust IV (the "Registrant") registration statement on Form N-1A for each of the Natixis Sustainable Future Funds (each a "Fund" and together the "Funds"), which was filed with the Commission on April 1, 2021 (the "Registration Statement"). For your convenience, we have summarized each comment below, followed by the Registrant's response. Any term that is used, but not defined, in this letter retains the same meaning as used by the Registrant in the Registration Statement. Unless otherwise noted, comments and responses relate to each Fund.
Please note that the Registration Statement is scheduled to become effective automatically on June
1, 2021.
Prospectus – Item 4 Disclosure
1.Comment. Please provide within the correspondence the completed Fund Fees, Expense tables, performance and complete bracketed information for each Fund.
Response. The Registrant has included completed Fund Fees, Expense tables, performance and complete bracketed information for each Fund below:
Natixis Sustainable Future 2015 Fund®
Fund Fees & Expenses
The following table describes the fees and expenses that you may pay if you buy, hold, and sell shares of the Fund. You may pay other fees, such as brokerage commissions and other fees to financial intermediaries, which are not reflected in this table.
Shareholder Fees
(fees paid directly from your investment) | Class N | Class Y |
Maximum sales charge (load) imposed on purchases (as a percentage of offering price) | None | None |
Maximum deferred sales charge (load) (as a percentage of original purchase price or redemption proceeds, |
|
|
as applicable) | None | None |
|
|
|
Redemption fees | None | None |
|
|
|
Annual Fund Operating Expenses
(expenses that you pay each year as a percentage of the value of your investment) | Class N | Class Y |
Management fees | 0.14% | 0.14% |
|
|
|
Distribution and/or service (12b-1) fees | 0.00% | 0.00% |
Other expenses | 2.49% | 2.59%1 |
|
|
|
Acquired fund fees and expenses | 0.24% | 0.24% |
Total annual fund operating expenses | 2.87% | 2.97% |
|
|
|
Fee waiver and/or expense reimbursement2 | 2.32% | 2.37% |
Total annual fund operating expenses after fee waiver and/or expense reimbursement | 0.55% | 0.60% |
|
|
|
1Other expenses are estimated for the current fiscal year, as this share class is not currently available for purchase.
2Natixis Advisors, L.P. (the "Adviser") has given a binding contractual undertaking to the Fund to limit the amount of the Fund's total annual fund operating expenses, including expenses of the underlying funds in which the Fund invests, to 0.55% and 0.60% of the Fund's average daily net assets for Class N and Y shares, respectively, exclusive of brokerage expenses, interest expense, taxes, organizational and extraordinary expenses, such as litigation and indemnification expenses. This undertaking is in effect through May 31, 2022 and may be terminated before then only with the consent of the Fund's Board of Trustees. The Adviser will be permitted to recover, on a class-by-class basis, management fees waived and/or expenses reimbursed to the extent that expenses in later periods fall below the applicable expense limitation for Class N and Y shares. The Fund will not be obligated to repay any such waived/reimbursed fees and expenses mor e than one year after the end of the fiscal year in which the fees or expenses were waived/reimbursed.
Example
This example is intended to help you compare the cost of investing in the Fund with the cost of investing in other mutual funds. The example assumes that you invest $10,000 in the Fund for the time periods indicated and then redeem all of your shares at the end of those periods (except where indicated). The example also assumes that your investment has a 5% return each year and that the Fund's operating expenses remain the same, except that the example is based on the Total Annual Fund Operating Expenses After Fee Waiver and/or Expense Reimbursement assuming that such waiver and/or reimbursement will only be in place through the date noted above and on the Total Annual Fund Operating Expenses for the remaining periods. The example does not take into account brokerage commissions and other fees to financial intermediaries that you may pay on your purchases and sales of shares of the Fund. Although your actual costs may be higher or lower, based on these assumptions your costs would be:
|
| 1 year |
| 3 years |
| 5 years |
| 10 years |
|
|
|
|
|
|
|
|
|
Class N | $ | 56 | $ | 669 | $ | 1,307 | $ | 3,027 |
|
|
|
|
|
|
|
|
|
Class Y | $ | 61 | $ | 694 | $ | 1,353 | $ | 3,120 |
|
|
|
|
|
|
|
|
|
Portfolio Turnover
The Fund pays transaction costs, such as commissions, when it buys and sells securities (or "turns over" its portfolio). A higher portfolio turnover rate may indicate higher transaction costs and may result in higher taxes for you if your Fund shares are held in a taxable account. These costs, which are not reflected in annual fund operating expenses or in the example, affect the Fund's performance. During its most recently ended fiscal year, the Fund's portfolio turnover rate was 61% of the average value of its portfolio.
Risk/Return Bar Chart and Table
The bar chart and table shown below provide some indication of the risks of investing in the Fund by comparing the Fund's one-year and life-of-fund performance with a broad measure of market performance. The Fund's past performance (before and after taxes) does not necessarily indicate how the Fund will perform in the future. Updated performance information is available online at im.natixis.com and/or by calling the Fund toll-free at 800-225-5478.
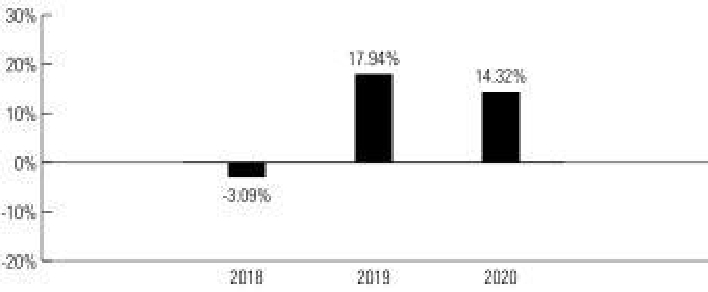
Total Returns for Class N Shares

Highest Quarterly Return:
Second Quarter 2020, 11.42%
Lowest Quarterly Return:
First Quarter 2020, -9.34%
The Fund's Class N shares total return year-to-date as of March 31, 2021 was 2.02%.
Average Annual Total Returns |
|
|
|
| Life of Fund |
(for the periods ended December 31, 2020) | Past 1 Year | (2/28/17) |
Return Before Taxes | 13.41% | 9.59% |
Return After Taxes on Distributions | 8.47% | 6.99% |
Return After Taxes on Distributions and Sale of Fund Shares | 9.54% | 6.75% |
S&P Target Date 2015® Index | 10.28% | 7.65% |
|
|
|
Natixis Sustainable Future 2020 Fund®
Fund Fees & Expenses
The following table describes the fees and expenses that you may pay if you buy, hold, and sell shares of the Fund. You may pay other fees, such as brokerage commissions and other fees to financial intermediaries, which are not reflected in this table.
Shareholder Fees
(fees paid directly from your investment) | Class N | Class Y |
Maximum sales charge (load) imposed on purchases (as a percentage of offering price) | None | None |
Maximum deferred sales charge (load) (as a percentage of original purchase price or redemption proceeds, |
|
|
as applicable) | None | None |
Redemption fees | None | None |
|
|
|
Annual Fund Operating Expenses
(expenses that you pay each year as a percentage of the value of your investment) | Class N | Class Y |
Management fees | 0.16% | 0.16% |
Distribution and/or service (12b-1) fees | 0.00% | 0.00% |
Other expenses | 3.27% | 3.37%1 |
Acquired fund fees and expenses | 0.23% | 0.23% |
Total annual fund operating expenses | 3.66% | 3.76% |
|
|
|
Fee waiver and/or expense reimbursement2 | 3.11% | 3.16% |
Total annual fund operating expenses after fee waiver and/or expense reimbursement | 0.55% | 0.60% |
|
|
|
1Other expenses are estimated for the current fiscal year, as this share class is not currently available for purchase.
2Natixis Advisors, L.P. (the "Adviser") has given a binding contractual undertaking to the Fund to limit the amount of the Fund's total annual fund operating expenses, including expenses of the underlying funds in which the Fund invests, to 0.55% and 0.60% of the Fund's average daily net assets for Class N and Y shares, respectively, exclusive of brokerage expenses, interest expense, taxes, organizational and extraordinary expenses, such as litigation and indemnification expenses. This undertaking is in effect through May 31, 2022 and may be terminated before then only with the consent of the Fund's Board of Trustees. The Adviser will be permitted to recover, on a class-by-class
basis, management fees waived and/or expenses reimbursed to the extent that expenses in later periods fall below the applicable expense limitation for Class N and Y shares. The Fund will not be obligated to repay any such waived/reimbursed fees and expenses mor e than one year after the end of the fiscal year in which the fees or expenses were waived/reimbursed.
Example
This example is intended to help you compare the cost of investing in the Fund with the cost of investing in other mutual funds. The example assumes that you invest $10,000 in the Fund for the time periods indicated and then redeem all of your shares at the end of those periods (except where indicated). The example also assumes that your investment has a 5% return each year and that the Fund's operating expenses remain the same, except that the example is based on the Total Annual Fund Operating Expenses After Fee Waiver and/or Expense Reimbursement assuming that such waiver and/or reimbursement will only be in place through the date noted above and on the Total Annual Fund Operating Expenses for the remaining periods. The example does not take into account brokerage commissions and other fees to financial intermediaries that you may pay on your purchases and sales of shares of the Fund. Although your actual costs may be higher or lower, based on these assumptions your costs would be:
|
| 1 year |
| 3 years |
| 5 years |
| 10 years |
|
|
|
|
|
|
|
|
|
Class N | $ | 56 | $ | 831 | $ | 1,627 | $ | 3,711 |
|
|
|
|
|
|
|
|
|
Class Y | $ | 61 | $ | 856 | $ | 1,671 | $ | 3,798 |
|
|
|
|
|
|
|
|
|
Portfolio Turnover
The Fund pays transaction costs, such as commissions, when it buys and sells securities (or "turns over" its portfolio). A higher portfolio turnover rate may indicate higher transaction costs and may result in higher taxes for you if your Fund shares are held in a taxable account. These costs, which are not reflected in annual fund operating expenses or in the example, affect the Fund's performance. During its most recently ended fiscal year, the Fund's portfolio turnover rate was 95% of the average value of its portfolio.
Risk/Return Bar Chart and Table
The bar chart and table shown below provide some indication of the risks of investing in the Fund by comparing the Fund's one-year and life-of-fund performance with a broad measure of market performance. The Fund's past performance (before and after taxes) does not necessarily indicate how the Fund will perform in the future. Updated performance information is available online at im.natixis.com and/or by calling the Fund toll-free at 800-225-5478.
Total Returns for Class N Shares
Highest Quarterly Return:
Second Quarter 2020, 12.20%
Lowest Quarterly Return:
First Quarter 2020, -10.93%
The Fund's Class N shares total return year-to-date as of March 31, 2021 was 2.98%.
Average Annual Total Returns |
|
|
|
| Life of Fund |
(for the periods ended December 31, 2020) | Past 1 Year | (2/28/17) |
Return Before Taxes | 14.32% | 10.41% |
Return After Taxes on Distributions | 5.92% | 6.76% |
Return After Taxes on Distributions and Sale of Fund Shares | 10.81% | 7.10% |
S&P Target Date 2020® Index | 10.24% | 8.03% |
|
|
|
Natixis Sustainable Future 2025 Fund®
Fund Fees & Expenses
The following table describes the fees and expenses that you may pay if you buy, hold, and sell shares of the Fund. You may pay other fees, such as brokerage commissions and other fees to financial intermediaries, which are not reflected in this table.
Shareholder Fees
(fees paid directly from your investment) | Class N | Class Y |
Maximum sales charge (load) imposed on purchases (as a percentage of offering price) | None | None |
Maximum deferred sales charge (load) (as a percentage of original purchase price or redemption proceeds, |
|
|
as applicable) | None | None |
Redemption fees | None | None |
|
|
|
Annual Fund Operating Expenses
(expenses that you pay each year as a percentage of the value of your investment) | Class N | Class Y |
|
|
|
Management fees | 0.17% | 0.17% |
Distribution and/or service (12b-1) fees | 0.00% | 0.00% |
|
|
|
Other expenses | 2.40% | 2.50%1 |
Acquired fund fees and expenses | 0.23% | 0.23% |
|
|
|
Total annual fund operating expenses | 2.80% | 2.90% |
Fee waiver and/or expense reimbursement2 | 2.24% | 2.29% |
|
|
|
Total annual fund operating expenses after fee waiver and/or expense reimbursement | 0.56% | 0.61% |
|
|
|
1Other expenses are estimated for the current fiscal year, as this share class is not currently available for purchase.
2Natixis Advisors, L.P. (the "Adviser") has given a binding contractual undertaking to the Fund to limit the amount of the Fund's total annual fund operating expenses, including expenses of the underlying funds in which the Fund invests, to 0.56% and 0.61% of the Fund's average daily net assets for Class N and Y shares, respectively, exclusive of brokerage expenses, interest expense, taxes, organizational and extraordinary expenses, such as litigation and indemnification expenses. This undertaking is in effect through May 31, 2022 and may be terminated before then only with the consent of the Fund's Board of Trustees. The Adviser will be permitted to recover, on a class-by-class basis, management fees waived and/or expenses reimbursed to the extent that expenses in later periods fall below the applicable expense limitation for Class N and Y shares. The Fund will not be obligated to repay any such waived/reimbursed fees and expenses more than one year after the end of the fiscal year in which the fees or expenses were waived/reimbursed.
Example
This example is intended to help you compare the cost of investing in the Fund with the cost of investing in other mutual funds. The example assumes that you invest $10,000 in the Fund for the time periods indicated and then redeem all of your shares at the end of those periods (except where indicated). The example also assumes that your investment has a 5% return each year and that the Fund's operating expenses remain the same, except that the example is based on the Total Annual Fund Operating Expenses After Fee Waiver and/or Expense Reimbursement assuming that such waiver and/or reimbursement will only be in place through the date noted above and on the Total Annual Fund Operating Expenses for the remaining periods. The example does not take into account brokerage commissions and other fees to financial intermediaries that you may pay on your purchases and sales of shares of the Fund. Although your actual costs may be higher or lower, based on these assumptions your costs would be:
|
| 1 year |
| 3 years |
| 5 years |
| 10 years |
|
|
|
|
|
|
|
|
|
Class N | $ | 57 | $ | 655 | $ | 1,279 | $ | 2,965 |
|
|
|
|
|
|
|
|
|
Class Y | $ | 62 | $ | 681 | $ | 1,325 | $ | 3,058 |
|
|
|
|
|
|
|
|
|
Portfolio Turnover
The Fund pays transaction costs, such as commissions, when it buys and sells securities (or "turns over" its portfolio). A higher portfolio turnover rate may indicate higher transaction costs and may result in higher taxes for you if your Fund shares are held in a taxable account. These costs, which are not reflected in annual fund operating expenses or in the example, affect the Fund's performance. During its most recently ended fiscal year, the Fund's portfolio turnover rate was 84% of the average value of its portfolio.
Risk/Return Bar Chart and Table
The bar chart and table shown below provide some indication of the risks of investing in the Fund by comparing the Fund's one-year and life-of-fund performance with a broad measure of market performance. The Fund's past performance (before and after taxes) does not necessarily indicate how the Fund will perform in the future. Updated performance information is available online at im.natixis.com and/or by calling the Fund toll-free at 800-225-5478.
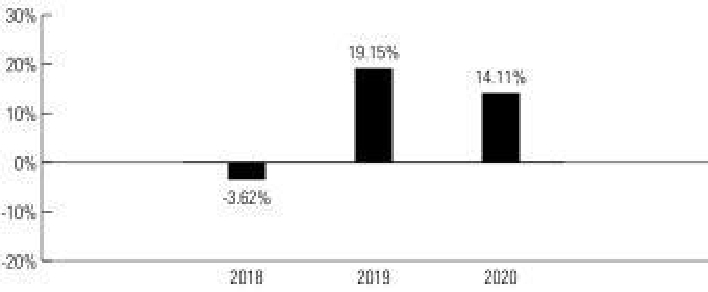
Total Returns for Class N Shares
Highest Quarterly Return:
Second Quarter 2020, 14.19%
Lowest Quarterly Return:
First Quarter 2020, -13.58%
The Fund's Class N shares total return year-to-date as of March 31, 2021 was 3.22%.
Average Annual Total Returns |
|
|
|
| Life of Fund |
(for the periods ended December 31, 2020) | Past 1 Year | (2/28/17) |
|
|
|
Return Before Taxes | 14.11% | 10.81% |
Return After Taxes on Distributions | 11.16% | 8.66% |
|
|
|
Return After Taxes on Distributions and Sale of Fund Shares | 9.21% | 7.83% |
S&P Target Date 2025® Index | 11.22% | 8.81% |
|
|
|
Natixis Sustainable Future 2030 Fund®
Fund Fees & Expenses
The following table describes the fees and expenses that you may pay if you buy, hold, and sell shares of the Fund. You may pay other fees, such as brokerage commissions and other fees to financial intermediaries, which are not reflected in this table.
Shareholder Fees
(fees paid directly from your investment) | Class N | Class Y |
Maximum sales charge (load) imposed on purchases (as a percentage of offering price) | None | None |
|
|
|
Maximum deferred sales charge (load) (as a percentage of original purchase price or redemption proceeds, |
|
|
as applicable) | None | None |
Redemption fees | None | None |
|
|
|
Annual Fund Operating Expenses
(expenses that you pay each year as a percentage of the value of your investment) | Class N | Class Y |
Management fees | 0.19% | 0.19% |
|
|
|
Distribution and/or service (12b-1) fees | 0.00% | 0.00% |
Other expenses | 2.26% | 2.36%1 |
Acquired fund fees and expenses | 0.23% | 0.23% |
Total annual fund operating expenses | 2.68% | 2.78% |
Fee waiver and/or expense reimbursement2 | 2.11% | 2.16% |
Total annual fund operating expenses after fee waiver and/or expense reimbursement | 0.57% | 0.62% |
|
|
|
1Other expenses are estimated for the current fiscal year, as this share class is not currently available for purchase.
2Natixis Advisors, L.P. (the "Adviser") has given a binding contractual undertaking to the Fund to limit the amount of the Fund's total annual fund operating expenses, including expenses of the underlying funds in which the Fund invests, to 0.57% and 0.62% of the Fund's average daily net assets for Class N and Y shares, respectively, exclusive of brokerage expenses, interest expense, taxes, organizational and extraordinary expenses, such as litigation and indemnification expenses. This undertaking is in effect through May 31, 2022 and may be terminated before then only with the consent of the Fund's Board of Trustees. The Adviser will be permitted to recover, on a class-by-class basis, management fees waived and/or expenses reimbursed to the extent that expenses in later periods fall below the applicable expense limitation for Class N and Y shares. The Fund will not be obligated to repay any such waived/reimbursed fees and expenses more than one year after the end of the fiscal year in which the fees or expenses were waived/reimbursed.
Example
This example is intended to help you compare the cost of investing in the Fund with the cost of investing in other mutual funds. The example assumes that you invest $10,000 in the Fund for the time periods indicated and then redeem all of your shares at the end of those periods (except where indicated). The example also assumes that your investment has a 5% return each year and that the Fund's operating expenses remain the same, except that the example is based on the Total Annual Fund Operating Expenses After Fee Waiver and/or Expense Reimbursement assuming that such waiver and/or reimbursement will only be in place through the date noted above and on the Total Annual Fund Operating Expenses for the remaining periods. The example does not take into account brokerage commissions and other fees to financial intermediaries that you may pay on your purchases and sales of shares of the Fund. Although your actual costs may be higher or lower, based on these assumptions your costs would be:
| 1 year | 3 years | 5 years | 10 years | ||||
|
|
|
|
|
|
|
|
|
Class N | $ | 58 | $ | 631 | $ | 1,231 | $ | 2,856 |
|
|
|
|
|
|
|
|
|
Class Y | $ | 63 | $ | 657 | $ | 1,277 | $ | 2,951 |
|
|
|
|
|
|
|
|
|
Portfolio Turnover
The Fund pays transaction costs, such as commissions, when it buys and sells securities (or "turns over" its portfolio). A higher portfolio turnover rate may indicate higher transaction costs and may result in higher taxes for you if your Fund shares are held in a taxable account. These costs, which are not reflected in annual fund operating expenses or in the example, affect the Fund's performance. During its most recently ended fiscal year, the Fund's portfolio turnover rate was 69% of the average value of its portfolio.

Risk/Return Bar Chart and Table
The bar chart and table shown below provide some indication of the risks of investing in the Fund by comparing the Fund's one-year and life-of-fund performance with a broad measure of market performance. The Fund's past performance (before and after taxes) does not necessarily indicate how the Fund will perform in the future. Updated performance information is available online at im.natixis.com and/or by calling the Fund toll-free at 800-225-5478.
Total Returns for Class N Shares
Highest Quarterly Return:
Second Quarter 2020, 14.94%
Lowest Quarterly Return:
First Quarter 2020, -15.01%
The Fund's Class N shares total return year-to-date as of March 31, 2021 was 4.07%.
Average Annual Total Returns |
|
|
|
| Life of Fund |
(for the periods ended December 31, 2020) | Past 1 Year | (2/28/17) |
Return Before Taxes | 15.32% | 11.76% |
|
|
|
Return After Taxes on Distributions | 12.54% | 9.72% |
Return After Taxes on Distributions and Sale of Fund Shares | 9.63% | 8.61% |
S&P Target Date 2030® Index | 11.91% | 9.49% |
|
|
|
Natixis Sustainable Future 2035 Fund®
Fund Fees & Expenses
The following table describes the fees and expenses that you may pay if you buy, hold, and sell shares of the Fund. You may pay other fees, such as brokerage commissions and other fees to financial intermediaries, which are not reflected in this table.
Shareholder Fees
(fees paid directly from your investment) | Class N | Class Y |
Maximum sales charge (load) imposed on purchases (as a percentage of offering price) | None | None |
Maximum deferred sales charge (load) (as a percentage of original purchase price or redemption proceeds, |
|
|
as applicable) | None | None |
|
|
|
Redemption fees | None | None |
|
|
|
Annual Fund Operating Expenses
(expenses that you pay each year as a percentage of the value of your investment) | Class N | Class Y |
Management fees | 0.21% | 0.21% |
Distribution and/or service (12b-1) fees | 0.00% | 0.00% |
Other expenses | 2.42% | 2.52%1 |
|
|
|
Acquired fund fees and expenses | 0.22% | 0.22% |
Total annual fund operating expenses | 2.85% | 2.95% |
|
|
|
Fee waiver and/or expense reimbursement2 | 2.27% | 2.32% |
Total annual fund operating expenses after fee waiver and/or expense reimbursement | 0.58% | 0.63% |
|
|
|

1Other expenses are estimated for the current fiscal year, as this share class is not currently available for purchase.
2Natixis Advisors, L.P. (the "Adviser") has given a binding contractual undertaking to the Fund to limit the amount of the Fund's total annual fund operating expenses, including expenses of the underlying funds in which the Fund invests, to 0.58% and 0.63% of the Fund's average daily net assets for Class N and Y shares, respectively, exclusive of brokerage expenses, interest expense, taxes, organizational and extraordinary expenses, such as litigation and indemnification expenses. This undertaking is in effect through May 31, 2022 and may be terminated before then only with the consent of the Fund's Board of Trustees. The Adviser will be permitted to recover, on a class-by-class basis, management fees waived and/or expenses reimbursed to the extent that expenses in later periods fall below the applicable expense limitation for Class N and Y shares. The Fund will not be obligated to repay any such waived/reimbursed fees and expenses mor e than one year after the end of the fiscal year in which the fees or expenses were waived/reimbursed.
Example
This example is intended to help you compare the cost of investing in the Fund with the cost of investing in other mutual funds. The example assumes that you invest $10,000 in the Fund for the time periods indicated and then redeem all of your shares at the end of those periods (except where indicated). The example also assumes that your investment has a 5% return each year and that the Fund's operating expenses remain the same, except that the example is based on the Total Annual Fund Operating Expenses After Fee Waiver and/or Expense Reimbursement assuming that such waiver and/or reimbursement will only be in place through the date noted above and on the Total Annual Fund Operating Expenses for the remaining periods. The example does not take into account brokerage commissions and other fees to financial intermediaries that you may pay on your purchases and sales of shares of the Fund. Although your actual costs may be higher or lower, based on these assumptions your costs would be:
|
| 1 year |
| 3 years |
| 5 years |
| 10 years |
|
|
|
|
|
|
|
|
|
Class N | $ | 59 | $ | 667 | $ | 1,302 | $ | 3,011 |
|
|
|
|
|
|
|
|
|
Class Y | $ | 64 | $ | 693 | $ | 1,347 | $ | 3,105 |
|
|
|
|
|
|
|
|
|
Portfolio Turnover
The Fund pays transaction costs, such as commissions, when it buys and sells securities (or "turns over" its portfolio). A higher portfolio turnover rate may indicate higher transaction costs and may result in higher taxes for you if your Fund shares are held in a taxable account. These costs, which are not reflected in annual fund operating expenses or in the example, affect the Fund's performance. During its most recently ended fiscal year, the Fund's portfolio turnover rate was 89% of the average value of its portfolio.
Risk/Return Bar Chart and Table
The bar chart and table shown below provide some indication of the risks of investing in the Fund by comparing the Fund's one-year and life-of-fund performance with a broad measure of market performance. The Fund's past performance (before and after taxes) does not necessarily indicate how the Fund will perform in the future. Updated performance information is available online at im.natixis.com and/or by calling the Fund toll-free at 800-225-5478.
Total Returns for Class N Shares
Highest Quarterly Return:
Second Quarter 2020, 17.06%
Lowest Quarterly Return:
First Quarter 2020, -17.91%
The Fund's Class N shares total return year-to-date as of March 31, 2021 was 5.05%.
Average Annual Total Returns |
|
|
|
| Life of Fund |
(for the periods ended December 31, 2020) | Past 1 Year | (2/28/17) |
Return Before Taxes | 15.56% | 12.51% |
Return After Taxes on Distributions | 12.57% | 10.32% |
Return After Taxes on Distributions and Sale of Fund Shares | 10.03% | 9.20% |
S&P Target Date 2035® Index | 12.79% | 10.18% |
|
|
|
Natixis Sustainable Future 2040 Fund®
Fund Fees & Expenses
The following table describes the fees and expenses that you may pay if you buy, hold, and sell shares of the Fund. You may pay other fees, such as brokerage commissions and other fees to financial intermediaries, which are not reflected in this table.
Shareholder Fees
(fees paid directly from your investment) | Class N | Class Y |
Maximum sales charge (load) imposed on purchases (as a percentage of offering price) | None | None |
Maximum deferred sales charge (load) (as a percentage of original purchase price or redemption proceeds, |
|
|
as applicable) | None | None |
Redemption fees | None | None |
|
|
|
Annual Fund Operating Expenses
(expenses that you pay each year as a percentage of the value of your investment) | Class N | Class Y |
Management fees | 0.22% | 0.22% |
|
|
|
Distribution and/or service (12b-1) fees | 0.00% | 0.00% |
Other expenses | 2.73% | 2.83%1 |
Acquired fund fees and expenses | 0.23% | 0.23% |
Total annual fund operating expenses | 3.18% | 3.28% |
Fee waiver and/or expense reimbursement2 | 2.59% | 2.64% |
|
|
|
Total annual fund operating expenses after fee waiver and/or expense reimbursement | 0.59% | 0.64% |
|
|
|
1Other expenses are estimated for the current fiscal year, as this share class is not currently available for purchase.
2Natixis Advisors, L.P. (the "Adviser") has given a binding contractual undertaking to the Fund to limit the amount of the Fund's total annual fund operating expenses, including expenses of the underlying funds in which the Fund invests, to 0.59% and 0.64% of the Fund's average daily net assets for Class N and Y shares, respectively, exclusive of brokerage expenses, interest expense, taxes, organizational and extraordinary expenses, such as litigation and indemnification expenses. This undertaking is in effect through May 31, 2022 and may be terminated before then only with the consent of the Fund's Board of Trustees. The Adviser will be permitted to recover, on a class-by-class basis, management fees waived and/or expenses reimbursed to the extent that expenses in later periods fall below the applicable expense limitation for Class N and Y shares. The Fund will not be obligated to repay any such waived/reimbursed fees and expenses mor e than one year after the end of the fiscal year in which the fees or expenses were waived/reimbursed.
Example
This example is intended to help you compare the cost of investing in the Fund with the cost of investing in other mutual funds. The example assumes that you invest $10,000 in the Fund for the time periods indicated and then redeem all of your shares at the end of those periods (except where indicated). The example also assumes that your investment has a 5% return each year and that the Fund's operating expenses remain the same, except that the example is based on the Total Annual Fund Operating Expenses After Fee Waiver and/or Expense Reimbursement assuming that such waiver and/or reimbursement will only be in place through the date noted above and on the Total Annual Fund Operating Expenses for the remaining periods. The example does not take into account brokerage
commissions and other fees to financial intermediaries that you may pay on your purchases and sales of shares of the Fund. Although your actual costs may be higher or lower, based on these assumptions your costs would be:
|
| 1 year |
| 3 years |
| 5 years |
| 10 years |
|
|
|
|
|
|
|
|
|
Class N | $ | 60 | $ | 736 | $ | 1,438 | $ | 3,305 |
|
|
|
|
|
|
|
|
|
Class Y | $ | 65 | $ | 762 | $ | 1,482 | $ | 3,395 |
|
|
|
|
|
|
|
|
|
Portfolio Turnover
The Fund pays transaction costs, such as commissions, when it buys and sells securities (or "turns over" its portfolio). A higher portfolio turnover rate may indicate higher transaction costs and may result in higher taxes for you if your Fund shares are held in a taxable account. These costs, which are not reflected in annual fund operating expenses or in the example, affect the Fund's performance. During its most recently ended fiscal year, the Fund's portfolio turnover rate was 64% of the average value of its portfolio.
Risk/Return Bar Chart and Table
The bar chart and table shown below provide some indication of the risks of investing in the Fund by comparing the Fund's one-year and life-of-fund performance with a broad measure of market performance. The Fund's past performance (before and after taxes) does not necessarily indicate how the Fund will perform in the future. Updated performance information is available online at im.natixis.com and/or by calling the Fund toll-free at 800-225-5478.
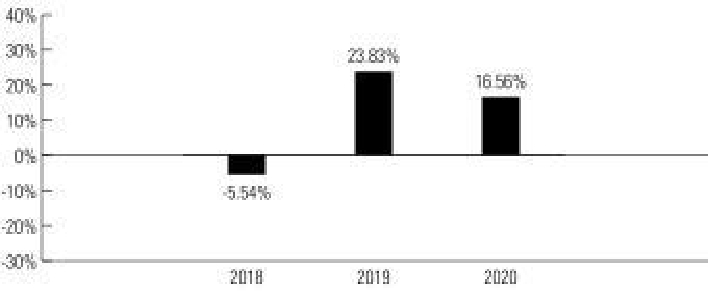
Total Returns for Class N Shares
Highest Quarterly Return:
Second Quarter 2020, 18.63%
Lowest Quarterly Return:
First Quarter 2020, -19.35%
The Fund's Class N shares total return year-to-date as of March 31, 2021 was 5.45%.
Average Annual Total Returns |
|
|
|
| Life of Fund |
(for the periods ended December 31, 2020) | Past 1 Year | (2/28/17) |
|
|
|
Return Before Taxes | 16.56% | 13.09% |
|
|
|
Return After Taxes on Distributions | 12.59% | 10.61% |
Return After Taxes on Distributions and Sale of Fund Shares | 11.15% | 9.66% |
|
|
|
S&P Target Date 2040® Index | 13.37% | 10.65% |
|
|
|
Natixis Sustainable Future 2045 Fund®
Fund Fees & Expenses
The following table describes the fees and expenses that you may pay if you buy, hold, and sell shares of the Fund. You may pay other fees, such as brokerage commissions and other fees to financial intermediaries, which are not reflected in this table.
Shareholder Fees
(fees paid directly from your investment) | Class N | Class Y |
Maximum sales charge (load) imposed on purchases (as a percentage of offering price) | None | None |
Maximum deferred sales charge (load) (as a percentage of original purchase price or redemption proceeds, |
|
|
as applicable) | None | None |
|
|
|
Redemption fees | None | None |
|
|
|
Annual Fund Operating Expenses
(expenses that you pay each year as a percentage of the value of your investment) | Class N | Class Y |
Management fees | 0.22% | 0.22% |
Distribution and/or service (12b-1) fees | 0.00% | 0.00% |
Other expenses | 2.98% | 3.08%1 |
|
|
|
Acquired fund fees and expenses | 0.22% | 0.22% |
Total annual fund operating expenses | 3.42% | 3.52% |
|
|
|
Fee waiver and/or expense reimbursement2 | 2.83% | 2.88% |
Total annual fund operating expenses after fee waiver and/or expense reimbursement | 0.59% | 0.64% |
|
|
|
1Other expenses are estimated for the current fiscal year, as this share class is not currently available for purchase.
2Natixis Advisors, L.P. (the "Adviser") has given a binding contractual undertaking to the Fund to limit the amount of the Fund's total annual fund operating expenses, including expenses of the underlying funds in which the Fund invests, to 0.59% and 0.64% of the Fund's average daily net assets for Class N and Y shares, respectively, exclusive of brokerage expenses, interest expense, taxes, organizational and extraordinary expenses, such as litigation and indemnification expenses. This undertaking is in effect through May 31, 2022 and may be terminated before then only with the consent of the Fund's Board of Trustees. The Adviser will be permitted to recover, on a class-by-class basis, management fees waived and/or expenses reimbursed to the extent that expenses in later periods fall below the applicable expense limitation for Class N and Y shares. The Fund will not be obligated to repay any such waived/reimbursed fees and expenses more than one year after the end of the fiscal year in which the fees or expenses were waived/reimbursed.
Example
This example is intended to help you compare the cost of investing in the Fund with the cost of investing in other mutual funds. The example assumes that you invest $10,000 in the Fund for the time periods indicated and then redeem all of your shares at the end of those periods (except where indicated). The example also assumes that your investment has a 5% return each year and that the Fund's operating expenses remain the same, except that the example is based on the Total Annual Fund Operating Expenses After Fee Waiver and/or Expense Reimbursement assuming that such waiver and/or reimbursement will only be in place through the date noted above and on the Total Annual Fund Operating Expenses for the remaining periods. The example does not take into account brokerage commissions and other fees to financial intermediaries that you may pay on your purchases and sales of shares of the Fund. Although your actual costs may be higher or lower, based on these assumptions your costs would be:
|
| 1 year |
| 3 years |
| 5 years |
| 10 years |
|
|
|
|
|
|
|
|
|
Class N | $ | 60 | $ | 786 | $ | 1,534 | $ | 3,512 |
|
|
|
|
|
|
|
|
|
Class Y | $ | 65 | $ | 811 | $ | 1,579 | $ | 3,600 |
|
|
|
|
|
|
|
|
|
Portfolio Turnover
The Fund pays transaction costs, such as commissions, when it buys and sells securities (or "turns over" its portfolio). A higher portfolio turnover rate may indicate higher transaction costs and may result in higher taxes for you if your Fund shares are held in a taxable account. These costs, which are not reflected in annual fund operating expenses or in the example, affect the Fund's performance. During its most recently ended fiscal year, the Fund's portfolio turnover rate was 72% of the average value of its portfolio.
Risk/Return Bar Chart and Table
The bar chart and table shown below provide some indication of the risks of investing in the Fund by comparing the Fund's one-year and life-of-fund performance with a broad measure of market performance. The Fund's past performance (before and after taxes) does not necessarily indicate how the Fund will perform in the future. Updated performance information is available online at im.natixis.com and/or by calling the Fund toll-free at 800-225-5478.
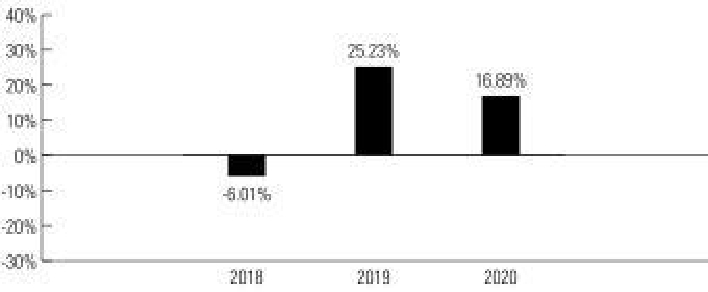
Total Returns for Class N Shares
Highest Quarterly Return:
Second Quarter 2020, 19.22%
Lowest Quarterly Return:
First Quarter 2020, -20.32%
The Fund's Class N shares total return year-to-date as of March 31, 2021 was 5.82%.
Average Annual Total Returns |
|
|
|
| Life of Fund |
(for the periods ended December 31, 2020) | Past 1 Year | (2/28/17) |
|
|
|
Return Before Taxes | 16.89% | 13.54% |
Return After Taxes on Distributions | 13.97% | 11.27% |
|
|
|
Return After Taxes on Distributions and Sale of Fund Shares | 10.91% | 10.08% |
S&P Target Date 2045® Index | 13.66% | 10.89% |
|
|
|
Natixis Sustainable Future 2050 Fund®
Fund Fees & Expenses
The following table describes the fees and expenses that you may pay if you buy, hold, and sell shares of the Fund. You may pay other fees, such as brokerage commissions and other fees to financial intermediaries, which are not reflected in this table.
Shareholder Fees
(fees paid directly from your investment) | Class N | Class Y |
Maximum sales charge (load) imposed on purchases (as a percentage of offering price) | None | None |
Maximum deferred sales charge (load) (as a percentage of original purchase price or redemption proceeds, |
|
|
as applicable) | None | None |
|
|
|
Redemption fees | None | None |
|
|
|
Annual Fund Operating Expenses
(expenses that you pay each year as a percentage of the value of your investment) | Class N | Class Y |
Management fees | 0.23% | 0.23% |
Distribution and/or service (12b-1) fees | 0.00% | 0.00% |
Other expenses | 3.34% | 3.44%1 |
Acquired fund fees and expenses | 0.22% | 0.22% |
Total annual fund operating expenses | 3.79% | 3.89% |
|
|
|
Fee waiver and/or expense reimbursement2 | 3.19% | 3.24% |
Total annual fund operating expenses after fee waiver and/or expense reimbursement | 0.60% | 0.65% |
|
|
|

1Other expenses are estimated for the current fiscal year, as this share class is not currently available for purchase.
2Natixis Advisors, L.P. (the "Adviser") has given a binding contractual undertaking to the Fund to limit the amount of the Fund's total annual fund operating expenses, including expenses of the underlying funds in which the Fund invests, to 0.60% and 0.65% of the Fund's average daily net assets for Class N and Y shares, respectively, exclusive of brokerage expenses, interest expense, taxes, organizational and extraordinary expenses, such as litigation and indemnification expenses. This undertaking is in effect through May 31, 2022 and may be terminated before then only with the consent of the Fund's Board of Trustees. The Adviser will be permitted to recover, on a class-by-class basis, management fees waived and/or expenses reimbursed to the extent that expenses in later periods fall below the applicable expense limitation for Class N and Y shares. The Fund will not be obligated to repay any such waived/reimbursed fees and expenses more than one year after the end of the fiscal year in which the fees or expenses were waived/reimbursed.
Example
This example is intended to help you compare the cost of investing in the Fund with the cost of investing in other mutual funds. The example assumes that you invest $10,000 in the Fund for the time periods indicated and then redeem all of your shares at the end of those periods (except where indicated). The example also assumes that your investment has a 5% return each year and that the Fund's operating expenses remain the same, except that the example is based on the Total Annual Fund Operating Expenses After Fee Waiver and/or Expense Reimbursement assuming that such waiver and/or reimbursement will only be in place through the date noted above and on the Total Annual Fund Operating Expenses for the remaining periods. The example does not take into account brokerage commissions and other fees to financial intermediaries that you may pay on your purchases and sales of shares of the Fund. Although your actual costs may be higher or lower, based on these assumptions your costs would be:
| 1 year | 3 years | 5 years | 10 years | ||||
|
|
|
|
|
|
|
|
|
Class N | $ | 61 | $ | 862 | $ | 1,683 | $ | 3,822 |
|
|
|
|
|
|
|
|
|
Class Y | $ | 66 | $ | 887 | $ | 1,726 | $ | 3,907 |
|
|
|
|
|
|
|
|
|
Portfolio Turnover
The Fund pays transaction costs, such as commissions, when it buys and sells securities (or "turns over" its portfolio). A higher portfolio turnover rate may indicate higher transaction costs and may result in higher taxes for you if your Fund shares are held in a taxable account. These costs, which are not reflected in annual fund operating expenses or in the example, affect the Fund's performance. During its most recently ended fiscal year, the Fund's portfolio turnover rate was 80% of the average value of its portfolio.
Total Returns for Class N Shares
Highest Quarterly Return:
Second Quarter 2020, 19.95%
Lowest Quarterly Return:
First Quarter 2020, -20.86%
The Fund's Class N shares total return year-to-date as of March 31, 2021 was 6.09%.
Average Annual Total Returns |
|
|
|
| Life of Fund |
(for the periods ended December 31, 2020) | Past 1 Year | (2/28/17) |
Return Before Taxes | 17.44% | 13.75% |
Return After Taxes on Distributions | 13.32% | 11.13% |
Return After Taxes on Distributions and Sale of Fund Shares | 11.50% | 10.14% |
S&P Target Date 2050® Index | 13.86% | 11.06% |
|
|
|
Natixis Sustainable Future 2055 Fund®
Fund Fees & Expenses
The following table describes the fees and expenses that you may pay if you buy, hold, and sell shares of the Fund. You may pay other fees, such as brokerage commissions and other fees to financial intermediaries, which are not reflected in this table.
Shareholder Fees
(fees paid directly from your investment) | Class N | Class Y |
Maximum sales charge (load) imposed on purchases (as a percentage of offering price) | None | None |
Maximum deferred sales charge (load) (as a percentage of original purchase price or redemption proceeds, |
|
|
as applicable) | None | None |
Redemption fees | None | None |
|
|
|
Annual Fund Operating Expenses
(expenses that you pay each year as a percentage of the value of your investment) | Class N | Class Y |
Management fees | 0.23% | 0.23% |
Distribution and/or service (12b-1) fees | 0.00% | 0.00% |
|
|
|
Other expenses | 3.83% | 3.93%1 |
Acquired fund fees and expenses | 0.21% | 0.21% |
|
|
|
Total annual fund operating expenses | 4.27% | 4.37% |
Fee waiver and/or expense reimbursement2 | 3.67% | 3.72% |
Total annual fund operating expenses after fee waiver and/or expense reimbursement | 0.60% | 0.65% |
|
|
|
1Other expenses are estimated for the current fiscal year, as this share class is not currently available for purchase.
2Natixis Advisors, L.P. (the "Adviser") has given a binding contractual undertaking to the Fund to limit the amount of the Fund's total annual fund operating expenses, including expenses of the underlying funds in which the Fund invests, to 0.60% and 0.65% of the Fund's average daily net assets for Class N and Y shares, respectively, exclusive of brokerage expenses, interest expense, taxes, organizational and extraordinary expenses, such as litigation and indemnification expenses. This undertaking is in effect through May 31, 2022 and may be terminated before then only with the consent of the Fund's Board of Trustees. The Adviser will be permitted to recover, on a class-by-class basis, management fees waived and/or expenses reimbursed to the extent that expenses in later periods fall below the applicable expense limitation for Class N and Y shares. The Fund will not be obligated to repay any such waived/reimbursed fees and expenses mor e than one year after the end of the fiscal year in which the fees or expenses were waived/reimbursed.
Example
This example is intended to help you compare the cost of investing in the Fund with the cost of investing in other mutual funds. The example assumes that you invest $10,000 in the Fund for the time periods indicated and then redeem all of your shares at the end of those periods (except where indicated). The example also assumes that your investment has a 5% return each year and that the Fund's operating expenses remain the same, except that the example is based on the Total Annual Fund Operating Expenses After Fee Waiver and/or Expense Reimbursement assuming that such waiver and/or reimbursement will only be in place through the date noted above and on the Total Annual Fund Operating Expenses for the remaining periods. The example does not take into account brokerage

commissions and other fees to financial intermediaries that you may pay on your purchases and sales of shares of the Fund. Although your actual costs may be higher or lower, based on these assumptions your costs would be:
|
| 1 year |
| 3 years |
| 5 years |
| 10 years |
|
|
|
|
|
|
|
|
|
Class N | $ | 61 | $ | 959 | $ | 1,871 | $ | 4,208 |
|
|
|
|
|
|
|
|
|
Class Y | $ | 66 | $ | 984 | $ | 1,914 | $ | 4,289 |
|
|
|
|
|
|
|
|
|
Portfolio Turnover
The Fund pays transaction costs, such as commissions, when it buys and sells securities (or "turns over" its portfolio). A higher portfolio turnover rate may indicate higher transaction costs and may result in higher taxes for you if your Fund shares are held in a taxable account. These costs, which are not reflected in annual fund operating expenses or in the example, affect the Fund's performance. During its most recently ended fiscal year, the Fund's portfolio turnover rate was 71% of the average value of its portfolio.
Risk/Return Bar Chart and Table
The bar chart and table shown below provide some indication of the risks of investing in the Fund by comparing the Fund's one-year and life-of-fund performance with a broad measure of market performance. The Fund's past performance (before and after taxes) does not necessarily indicate how the Fund will perform in the future. Updated performance information is available online at im.natixis.com and/or by calling the Fund toll-free at 800-225-5478.
Total Returns for Class N Shares
Highest Quarterly Return:
Second Quarter 2020, 19.68%
Lowest Quarterly Return:
First Quarter 2020, -21.18%
The Fund's Class N shares total return year-to-date as of March 31, 2021 was 5.95%.
Average Annual Total Returns |
|
|
|
| Life of Fund |
(for the periods ended December 31, 2020) | Past 1 Year | (2/28/17) |
|
|
|
Return Before Taxes | 16.48% | 13.63% |
Return After Taxes on Distributions | 12.28% | 10.93% |
|
|
|
Return After Taxes on Distributions and Sale of Fund Shares | 11.20% | 10.07% |
S&P Target Date 2055® Index | 13.86% | 11.12% |
|
|
|
Natixis Sustainable Future 2060 Fund®
Fund Fees & Expenses
The following table describes the fees and expenses that you may pay if you buy, hold, and sell shares of the Fund. You may pay other fees, such as brokerage commissions and other fees to financial intermediaries, which are not reflected in this table.
Shareholder Fees
(fees paid directly from your investment) | Class N | Class Y |
Maximum sales charge (load) imposed on purchases (as a percentage of offering price) | None | None |
Maximum deferred sales charge (load) (as a percentage of original purchase price or redemption proceeds, |
|
|
as applicable) | None | None |
|
|
|
Redemption fees | None | None |
|
|
|
Annual Fund Operating Expenses
(expenses that you pay each year as a percentage of the value of your investment) | Class N | Class Y |
Management fees | 0.23% | 0.23% |
Distribution and/or service (12b-1) fees | 0.00% | 0.00% |
Other expenses | 4.60% | 4.70%1 |
|
|
|
Acquired fund fees and expenses | 0.22% | 0.22% |
Total annual fund operating expenses | 5.05% | 5.15% |
|
|
|
Fee waiver and/or expense reimbursement2 | 4.45% | 4.50% |
Total annual fund operating expenses after fee waiver and/or expense reimbursement | 0.60% | 0.65% |
|
|
|
1Other expenses are estimated for the current fiscal year, as this share class is not currently available for purchase.
2Natixis Advisors, L.P. (the "Adviser") has given a binding contractual undertaking to the Fund to limit the amount of the Fund's total annual fund operating expenses, including expenses of the underlying funds in which the Fund invests, to 0.60% and 0.65% of the Fund's average daily net assets for Class N and Y shares, respectively, exclusive of brokerage expenses, interest expense, taxes, organizational and extraordinary expenses, such as litigation and indemnification expenses. This undertaking is in effect through May 31, 2022 and may be terminated before then only with the consent of the Fund's Board of Trustees. The Adviser will be permitted to recover, on a class-by-class basis, management fees waived and/or expenses reimbursed to the extent that expenses in later periods fall below the applicable expense limitation for Class N and Y shares. The Fund will not be obligated to repay any such waived/reimbursed fees and expenses more than one year after the end of the fiscal year in which the fees or expenses were waived/reimbursed.
Example
This example is intended to help you compare the cost of investing in the Fund with the cost of investing in other mutual funds. The example assumes that you invest $10,000 in the Fund for the time periods indicated and then redeem all of your shares at the end of those periods (except where indicated). The example also assumes that your investment has a 5% return each year and that the Fund's operating expenses remain the same, except that the example is based on the Total Annual Fund Operating Expenses After Fee Waiver and/or Expense Reimbursement assuming that such waiver and/or reimbursement will only be in place through the date noted above and on the Total Annual Fund Operating Expenses for the remaining periods. The example does not take into account brokerage commissions and other fees to financial intermediaries that you may pay on your purchases and sales of shares of the Fund. Although your actual costs may be higher or lower, based on these assumptions your costs would be:
|
| 1 year |
| 3 years |
| 5 years |
| 10 years |
|
|
|
|
|
|
|
|
|
Class N | $ | 61 | $ | 1,115 | $ | 2,168 | $ | 4,796 |
|
|
|
|
|
|
|
|
|
Class Y | $ | 66 | $ | 1,140 | $ | 2,210 | $ | 4,871 |
|
|
|
|
|
|
|
|
|
Portfolio Turnover
The Fund pays transaction costs, such as commissions, when it buys and sells securities (or "turns over" its portfolio). A higher portfolio turnover rate may indicate higher transaction costs and may result in higher taxes for you if your Fund shares are held in a taxable account. These costs, which are not reflected in annual fund operating expenses or in the example, affect the Fund's performance. During its most recently ended fiscal year, the Fund's portfolio turnover rate was 79% of the average value of its portfolio.
Risk/Return Bar Chart and Table
The bar chart and table shown below provide some indication of the risks of investing in the Fund by comparing the Fund's one-year and life-of-fund performance with a broad measure of market performance. The Fund's past performance (before and after taxes) does not necessarily indicate how the Fund will perform in the future. Updated

performance information is available online at im.natixis.com and/or by calling the Fund toll-free at 800-225-5478.
Total Returns for Class N Shares
Highest Quarterly Return:
Second Quarter 2020, 20.10%
Lowest Quarterly Return:
First Quarter 2020, -21.51%
The Fund's Class N shares total return year-to-date as of March 31, 2021 was 6.24%.
Average Annual Total Returns |
|
|
|
| Life of Fund |
(for the periods ended December 31, 2020) | Past 1 Year | (2/28/17) |
Return Before Taxes | 17.36% | 13.88% |
|
|
|
Return After Taxes on Distributions | 13.44% | 11.23% |
Return After Taxes on Distributions and Sale of Fund Shares | 11.69% | 10.30% |
S&P Target Date 2060+® Index | 13.99% | 11.32% |
|
|
|
2.Comment. Each Fund's name includes the word "Sustainable." The Staff believes the word "Sustainable" suggests a type of investment and therefore the Funds should include an 80% name rule policy for each Fund for the word "Sustainable" in the section entitled "Principal Investment Strategies."
Response. The Registrant fully appreciates the Staff's comment regarding Rule 35d-1 and has evaluated the comment with regards to the Funds and has considered the broader implications of this comment on a number of other funds within the fund complex. The Registrant will continue to evaluate the comment with respect to each fund's annual registration update.
Based on considerable legal research and analysis, the Registrant respectfully submits that an 80% policy with respect to the term "sustainable" is not required because such term refers to an investment strategy of the Funds, rather than a type of investment. The Registrant notes that Rule 35d-1 requires that a fund with a name that suggests that the fund focuses its investments in a particular type of investment or industry adopt a policy to invest, under normal circumstances, at least 80% of its net assets in the particular type of investment or industry suggested by the fund's name. However, the Staff stated in the releases proposing and adopting Rule 35d-1 that the rule does not apply to a fund name that connotes a type of investment strategy. The Registrant notes that the term "sustainable" in each Fund's name refers to the Fund's investment strategy that considers such factors as the environmental, social and governance practices of issuers. Further, the Registrant notes that the Staff recently published a request for comments on Rule 35d-1, in which the Staff sought comments as to whether "the Names Rule [should] apply to terms such as 'ESG' or 'sustainable' that reflect certain qualitative characteristics of an investment." See Request for Comments on Fund Names, Investment Company Act Rel. No. 33809 (Mar. 2, 2020). The Registrant believes this request for comment further demonstrates that Rule 35d-1 does not currently require funds with "sustainable" in their name to adopt an 80% policy. If the SEC amends
Rule 35d-1 to specifically include "sustainable" as a term subject to Rule 35d-1, the Registrant will respond accordingly.
3.Comment. In the "Principal Investment Strategies" section for each of the Funds' Item 4 disclosure, please explain what the Funds mean by a "segment" versus an "underlying fund."
Response. In response to this comment, the Registrant has modified the second sentence of
the first paragraph of the "Principal Investment Strategies" section of each of the Funds' Item 4 disclosure and to the second sentence of the first paragraph of the "Principal Investment Strategies" section within the "More About Goals and Strategies" section of the statutory prospectus' Item 9 disclosure as follows:
"Each Fund allocates its assets among investments in segments (or allocable portions of the fund's assets) and underlying funds managed by the adviser or affiliated advisers and subadvisers that invest directly in securities."
4.Comment. In the second paragraph of the "Principal Investment Strategies" section of each of the Funds' Item 4 disclosure, please provide greater detail relative to the following statement:
"For example, there may be differences in how [the advisers or subadvisers to each of the Funds' segments and underlying funds] source ESG-related research""
Please provide greater detail regarding the Funds' underlying funds and their approaches to ESG investing and identify examples of the ESG factors and focus areas of the underlying funds. Please also explain with greater specificity whether the Funds will invest in underlying funds that exclude certain industries.
Response. The Registrant respectfully submits that the detail requested by the Staff is already contained in the paragraphs that follow the sub-headers "Equity" and "Fixed Income" within the Item 9 "Principal Investment Strategies" section disclosure.
5.Comment. Relative to the "ESG Investing Risk" within the "Principal Investment Risks" section of each Fund's Fund Summary, please consider whether additional risk disclosure is appropriate here to address the potential for variability and differing approaches to ESG by the underlying funds, particularly with respect to the ESG data and scores that they use and its sources (i.e., the third party data and scoring providers).
Response. The Registrant has carefully considered the Staff's comment. The Registrant notes that the "Principal Investment Strategies" section of each Fund's Summary Prospectus includes the following disclosure:
"Consistent with the Fund's multi-disciplinary structure and as described in more detail below, the advisers or subadvisers to the Fund's segments and underlying funds may consider material ESG factors differently in their investment processes. For example, there may be differences in how they source ESG-related research (proprietary versus third party), the extent to which they actively engage with company management, and/or their focus on companies whose products and services are designed to directly address and/or benefit from long-term environmental, social or governance trends."
The Registrant respectfully submits that the potential for variability and differing approaches to ESG by the underlying funds, including ESG-related research, is appropriately disclosed in each
Fund's Summary Prospectus. Accordingly, the Registrant respectfully declines to revise the disclosure under "ESG Investing Risk."
Prospectus – Item 9 Disclosure: More About Goals and Strategies
6.Comment. Under the "Principal Investment Strategies" section of the prospectus, for the Active Index Advisors® ("AIA") U.S. Large Cap Value ESG Segment, please identify the primary provider used by AIA in analyzing potential investments. Please also briefly summarize the methodology of the provider at a high level.
Response. MSCI ESG Data and Analytics is the primary provider used by AIA to analyze potential investments for the U.S. Large Cap Value ESG segment. MSCI ESG ratings assess the extent to which companies are positioned to manage ESG risks and take advantage of ESG opportunities, within an industry specific framework of forward-looking financial materiality. MSCI analysts transform company disclosures and information about a company published by sources outside of a company into ESG ratings and controversy scores. MSCI analysis is additionally used to identify business involvement with gambling, firearms, nuclear, tobacco, and alcohol. The AIA segments exclude businesses involved with gambling, firearms, nuclear, tobacco, and alcohol; securities in these industries generally are excluded from this strategy's investment universe.
7.Comment. Under the "Principal Investment Strategies" section of the prospectus, for the AIA
U.S. Large Cap Value ESG Segment, the last sentence of the paragraph references the term "tracking error." The disclosure indicates that AIA applies an optimization process to construct a portfolio that replicates the characteristics and returns of the index while aiming to keep tracking error low. It is unclear how this approach would not undermine the ESG screens that are employed. Please advise or revise as appropriate.
Response. AIA's process begins by identifying companies with attractive ESG characteristics. The particular securities and weight that AIA holds in each security are managed in a systematic process that uses a risk model and optimization. The optimization function seeks to replicate the characteristics and returns of the index (i.e., minimize tracking error) while exclusively investing in the universe of companies selected on the basis of ESG characteristics.
8.Comment. Under the "Principal Investment Strategies" section of the prospectus, relative to the Loomis Sayles All Cap Growth Segment, the first paragraph references the term "sustainable competitive advantages." Revise or remove the term "sustainable" unless this term relates to ESG characteristics in which case the Fund should make it clear that this analysis involves ESG/sustainability factors.
Response. The Registrant has amended the first paragraph of the Loomis Sayles All Cap Growth Segment description as follows:
"The segment's portfolio manager employs a growth style of equity management that emphasizes companies with sustainable (or enduring) competitive advantages, long-term structural growth drivers, attractive cash flow returns on invested capital, and management teams focused on creating long-term value for shareholders."
9.Comment. Under the "Principal Investment Strategies" section of the prospectus, for the
Loomis Sayles All Cap Growth Segment, the last sentence of the second paragraph states:
"Materiality of ESG issues are determined on a company-by-company basis."
Please revise as this strategy disclosure is vague/generic. Please provide examples of the types of ESG criteria that the adviser considers.
Response. In response to this comment, the Registrant has amended the second paragraph of the Loomis Sayles All Cap Growth Segment's "Principal Investment Strategies" disclosure as follows:
"With an owner's mindset, the portfolio manager seeks to develop a deep understanding of the drivers, opportunities, and limits of each company, including material ESG elements, through a disciplined and thorough bottom-up fundamental analysis. As with all components of its rigorous research, the portfolio manager seeks to understand the effect of material ESG elements on the sustainability of a company's competitive advantages, its intrinsic value, and ultimately long-term investment performance. Rather than applying fixed rules or quantitative screens, ESG issues are viewed through an independent and forward-looking analysis. The portfolio manager's proprietary research framework represents long-standing insights about investing and is structured around three key criteria: quality, growth, and valuation. ESG considerations are integral to the analysis of business models, competitive advantages, operating efficiency, corporate management integrity, profitable growth, and valuation. The portfolio manager believes a long-term orientation is fundamental to favorable decision-making framework in regards to ESG issues and opportunities. The majority of material ESG considerations is embedded in the quality assessment phase of the research framework. Materiality of ESG issues are determined on a company-by-company basis. ESG factors considered during this phase of the research framework include how company management teams weigh the interests of various stakeholders; resource stewardship; governance practices including reporting, transparency, incentive structures, ethics and ownership structures; and alignment of the business to meet climate objectives and reporting transparency for ESG targets."
10.Comment. Under the "Principal Investment Strategies" section of the prospectus, for the
Mirova US Climate Ambition Equity Segment, the second sentence of the first paragraph refers to "high positive climate impact". Please explain further the criteria that the adviser considers in determining whether an investment has a high positive climate impact. Please also explain the threshold for high positive climate impact.
Response. The Registrant submits that, more specifically, the term "high positive climate impact" means a strategy that is considered aligned with the Paris agreement, or more generally a
1.5°C scenario. More concretely, this means that the strategy demonstrates a much better climate impact than its underlying benchmark, a market cap weighted index. This translates in two fundamental metrics: (i) an important reduction in negative impact on climate change, shown by the reduction in induced emissions (or carbon footprint) compared to the benchmark and in (ii) an important increase in saved emissions compared to the benchmark. These emissions are calculated on a life-cycle basis, which means that globally, companies heavily reliant on fossil fuels across their entire value chain are downweighted or excluded from the strategy while companies at the forefront of the energy transition (renewables, energy efficiency) are overweighted compared to the current economy, in line with the main existing 1.5°C scenarios available, notably from the International Energy Agency.
The segment therefore divides by at least two the negative impact (induced carbon emissions) compared to its benchmark while increasing its positive impact (saved carbon emissions).
11.Comment. Under the "Principal Investment Strategies" section of the prospectus, for the AIA
International Developed Markets Equity ESG Segment, please identify the primary provider used by AIA in analyzing potential investments. Please also briefly summarize the methodology of the provider at a high level.
Response. The International Developed Markets Equity ESG segment uses the iShares ESG Aware Developed (ESGD) ETF. MSCI ESG Data and Analytics is the primary provider of ESG analysis used in the management of the ESGD ETF and its underlying MSCI EAFE Extended ESG Focus Index. MSCI ESG ratings assess the extent to which companies are positioned to manage ESG risks and take advantage of ESG opportunities, within an industry specific framework of forward-looking financial materiality. MSCI analysts transform company disclosures and information about a company published by sources outside of a company into ESG ratings and controversy scores. MSCI analysis is additionally used to identify business involvement with gambling, firearms, nuclear, tobacco, and alcohol. The segments exclude businesses involved with gambling, firearms, nuclear, tobacco, and alcohol; securities in these industries generally are excluded from the fund's investment universe.
12.Comment. Under the "Principal Investment Strategies" section of the prospectus, for the WCM Focused International Growth Fund, please explain supplementally whether the WCM
Focused International Growth Fund's investments in underlying funds that are ESG integration funds are considered ESG investments. Please also explain why it would be appropriate to consider these funds ESG investments for purposes of determining compliance with the required 80% names rule policy.
Response. As noted above, the adviser sometimes may allocate a portion of the fund's assets to underlying funds whose managers integrate ESG factors into their investment processes; the WCM Focused International Growth Fund is such an underlying fund. Also as noted in the response to Comment 2 above, the Registrant respectfully submits that an 80% test is not required under Rule 35d-1 because the word "Sustainable," as used in each Fund's name, refers to an investment strategy rather than a type of investment.
13.Comment. Under the "Principal Investment Strategies" section of the prospectus, for the Loomis Sayles Limited Term Government and Agency Fund, please explain supplementally how the Fund evaluates an underlying fund that is heavily invested in ESG neutral investments.
Response. The Registrant submits that the Loomis Sayles Limited Term Government and Agency Fund is comprised primarily of U.S. government securities which offer ballast to the overall portfolios and offer diversification to the equity allocation in the funds. This helps the adviser in the portfolio construction process and with the design of the overall glide path. The allocation to U.S government securities is considered by the adviser to be "neutral" from an ESG standpoint and therefore does not necessarily enhance or detract from the overall portfolio (with respect to ESG factors), yet they are a necessary and an important component of building a diversified portfolio.
Statement of Additional Information
14.Comment. Please provide in correspondence the completed Advisory Fees section.
Response. The completed Advisory Fees section is included below:
ADVISORY FEES
Pursuant to an advisory agreement, Natixis Advisors, L.P., ("Natixis Advisors" or the "Adviser") has agreed, subject to the supervision of the Board, to manage the investment and reinvestment of the assets of the Funds, and to provide a range of administrative services to the Funds.
For the services described in the advisory agreement, each Fund has agreed to pay Natixis Advisors an advisory fee at the annual rate set forth below, reduced by the amount of any subadvisory fees payable directly by a Fund to its subadvisers pursuant to any subadvisory agreement:
The maximum aggregate advisory fee payable by each Fund is equal to the sum of: (i) 0.25% of the average daily net assets of each segment managed directly by Natixis Advisors and (ii) 0.70% of the average daily net assets of any segment managed by any subadviser. The advisory fee rates currently paid with respect to the AIA U.S. Large Cap Value ESG Segment, the AIA U.S. Small/Mid Cap ESG Segment, and the AIA International Developed Markets Equity ESG Segment, each managed directly by Natixis Advisors, are 0.165%, 0.20% and 0.20%, respectively, of the average daily net assets of such segments. The advisory fee rate currently paid with respect to the Mirova US Climate Ambition Equity Segment is 0.25%, respectively, of the average daily net assets of such segments. The advisory fee rate currently paid with respect to the Harris Associates Large Cap Value Segment is 0.52% of the average daily net assets of such segment. The advisory fee rate currently paid with respect to the Loomis Sayles All Cap Growth Segment and the Loomis Sayles Core Fixed Income Segment are 0.35% and 0.15%, respectively, of the average daily net assets of such segments. Each Fund may add additional segments to be managed by either Natixis Advisors or a subadviser in the future, provided that the advisory fee rates applicable to such segments do not exceed 0.25% of the average daily net assets of any segment managed directly by Natixis Advisors and 0.70% of the average daily net assets of any segment managed by any subadviser.
Natixis Advisors has given a binding contractual undertaking for all classes of the Funds in the table below to waive its advisory fee and, if necessary, to reimburse certain expenses, related to operating the Funds in order to limit each Fund's expenses, including expenses of the underlying funds in which the Funds invest, exclusive of brokerage expenses, interest expense, taxes and organizational and extraordinary expenses, such as litigation and indemnification expenses, to the annual rates indicated below. The undertakings are in effect through May 31, 2022 and will be reevaluated on an annual basis and may be terminated before then only with the consent of the Funds' Board. Natixis Advisors will be permitted to recover, on a class-by-class basis, expenses it has borne through the undertaking described above (whether through waiver of its advisory fee or otherwise) to the extent that a class's expenses fall below the annual rate set forth in the relevant undertaking. Each Fund will not be obligated to repay any such waived/reimbursed fees and expenses more than one year after the end of the fiscal year in which the fee/expense was waived/reimbursed.
Fund | Expense Limit | Date of Undertaking |
2015 Fund |
|
|
Class N | 0.55% | June 1, 2021 |
Class Y | 0.60% | June 1, 2021 |
2020 Fund |
|
|
Class N | 0.55% | June 1, 2021 |
Class Y | 0.60% | June 1, 2021 |
2025 Fund |
|
|
Class N | 0.56% | June 1, 2021 |
Class Y | 0.61% | June 1, 2021 |
2030 Fund |
|
|
Fund | Expense Limit | Date of Undertaking |
Class N | 0.57% | June 1, 2021 |
Class Y | 0.62% | June 1, 2021 |
2035 Fund |
|
|
Class N | 0.58% | June 1, 2021 |
Class Y | 0.63% | June 1, 2021 |
2040 Fund |
|
|
Class N | 0.59% | June 1, 2021 |
Class Y | 0.64% | June 1, 2021 |
2045 Fund |
|
|
Class N | 0.59% | June 1, 2021 |
Class Y | 0.64% | June 1, 2021 |
2050 Fund |
|
|
Class N | 0.60% | June 1, 2021 |
Class Y | 0.65% | June 1, 2021 |
2055 Fund |
|
|
Class N | 0.60% | June 1, 2021 |
Class Y | 0.65% | June 1, 2021 |
2060 Fund |
|
|
Class N | 0.60% | June 1, 2021 |
Class Y | 0.65% | June 1, 2021 |
Natixis Advisors will voluntarily waive its advisory fee for the management of a segment for any period during which the segment is invested entirely in unaffiliated exchange-traded funds.
SUBADVISORY FEES
The advisory agreement between Natixis Advisors and the Funds provides that Natixis Advisors may delegate its responsibilities thereunder to other parties. Pursuant to separate subadvisory agreements, Natixis Advisors has delegated certain responsibilities to three subadvisers, Harris Associates L.P. ("Harris Associates"), Loomis, Sayles & Company, L.P. ("Loomis Sayles") and Mirova US LLC ("Mirova US") (each a "Subadviser").
Pursuant to a subadvisory agreement, Natixis Advisors has delegated portfolio management responsibilities with respect to the Harris Associates Large Cap Value Segment (described in the Prospectuses) to Harris Associates. For the services described in the subadvisory agreement, each Fund has agreed to pay Harris Associates a subadvisory fee not to exceed an annual rate of 0.70% of the average daily net assets of any segment managed by Harris Associates. The subadvisory fee for the segment currently managed by Harris Associates is set forth in the following table:
Segment | Subadvisory fee payable to Harris Associates (as a |
| % of average daily net assets of the Segment) |
Harris Associates Large Cap Value Segment | 0.52% |
Pursuant to a subadvisory agreement, Natixis Advisors has delegated portfolio management responsibilities with respect to the Loomis Sayles All Cap Growth Segment and Loomis Sayles Core Fixed Income Segment (each described in the Prospectuses) to Loomis Sayles. For the services described in the subadvisory agreement, each Fund has agreed to pay Loomis Sayles a subadvisory fee not to exceed an annual rate of 0.70% of the average daily net assets of any segment managed by Loomis Sayles. The subadvisory fee for the segments currently managed by Loomis Sayles are set forth in the following table:
Segment | Subadvisory fee payable to Loomis Sayles (as a % |
| of average daily net assets of the Segment) |
Loomis Sayles All Cap Growth Segment | 0.35% |
Loomis Sayles Core Fixed Income Segment | 0.15% |

Pursuant to a subadvisory agreement, Natixis Advisors has delegated portfolio management responsibilities with respect to the Mirova US Climate Ambition Equity Segment (described in the Prospectuses) to Mirova US. For the services described in the subadvisory agreement, each Fund has agreed to pay Mirova US a subadvisory fee not to exceed an annual rate of 0.70% of the average daily net assets of any segment managed by Mirova US. The subadvisory fee for the segments currently managed by Mirova US are set forth in the following table:
Segment | Subadvisory fee payable to Mirova US (as a % of |
| average daily net assets of the Segment) |
Mirova US Climate Ambition Equity Segment | 0.25% |
If you have any questions or require any clarification concerning the foregoing, please call me at 617-449-2818.
Very truly yours,
/s/ John M. DelPrete
John M. DelPrete
Assistant Secretary
Natixis Funds Trust IV
cc:Natalie Wagner, Esq. Michael G. Doherty, Esq. John M. Loder, Esq.