At an in-person meeting held on April 17, 2012, the Boards reviewed materials relating to their consideration of the Agreements. As a result of the discussions that occurred during the April 17, 2012 meeting, and as a culmination of each Board’s year-long deliberative process, the Boards presented BlackRock with questions and requests for additional information. BlackRock responded to these requests with additional written information in advance of the May 15–16, 2012 Board meeting.
At an in-person meeting held on May 15–16, 2012, (a) the Board of the Master LLC, including all the Independent Board Members, unanimously approved the continuation of (i) the Master LLC Advisory Agreement between the Manager and the Master LLC with respect to each Master Portfolio and (ii) the Master LLC Sub-Advisory Agreement between the Manager and the Sub-Advisor with respect to each Master Portfolio; and (b) the Board of the Corporation, including all the Independent Board Members, unanimously approved the continuation of (i) the Core Plus Fund Advisory Agreement between the Manager and the Corporation on behalf of Core Plus Fund and (ii) the Core Plus Fund Sub-Advisory Agreement between the Manager and the Sub-Advisor with respect to Core Plus Fund, each for a one-year term ending June 30, 2013. The Board Members of the Corporation, including the Independent Board Members, also considered the continuation of the Master LLC Agreements and found these Agreements to be satisfactory. In approving the continuation of the Agreements, each Board considered, with respect to the applicable Master Portfolio and/or Fund: (a) the nature, extent and quality of the services provided by BlackRock; (b) the investment performance of the Master Portfolio and/or Fund and BlackRock; (c) the advisory fee and the cost of the services and profits to be realized by BlackRock and its affiliates from their relationship with the Master Portfolio and/or Fund; (d) economies of scale; (e) fall-out benefits to BlackRock as a result of its relationship with the Master Portfolio and/or Fund; and (f) other factors deemed relevant by the Board Members.
Each Board also considered other matters it deemed important to the approval process, as pertinent, such as payments made to BlackRock or its affiliates relating to the distribution of the applicable Fund’s shares and securities lending, services related to the valuation and pricing of portfolio holdings of the applicable Master Portfolio or Fund, direct and indirect benefits to BlackRock and its affiliates from their relationship with the applicable Master Portfolios and/or Funds and advice from independent legal counsel with respect to the review process and materials submitted for the Board’s review. The Boards noted the willingness of BlackRock personnel to engage in open, candid discussions with the Boards. The Boards did not identify any particular information as controlling, and each Board Member may have attributed different weights to the various items considered.
The Boards considered, among other factors, the number, education and experience of BlackRock’s investment personnel generally and, as applicable, the portfolio management team of each Master Portfolio and/or Core Plus Fund, investments by portfolio managers in the funds they manage, BlackRock’s portfolio trading capabilities, BlackRock’s use of technology, BlackRock’s commitment to compliance, BlackRock’s credit analysis capabilities, BlackRock’s risk analysis and oversight capabilities and BlackRock’s approach to training and retaining portfolio managers and other research, advisory and management personnel. The Boards engaged in a review, as applicable, of BlackRock’s compensation structure with respect to the portfolio management team of each Master Portfolio and/or Core Plus Fund and BlackRock’s ability to attract and retain high-quality talent and create performance incentives.
In addition to advisory services, the Boards considered the quality of the administrative and non-investment advisory services provided to each Master Portfolio and Fund. BlackRock and its affiliates provide each Master Portfolio and Fund with certain administrative, shareholder and other services (in addition to any such services provided to the Master Portfolio and Fund by third parties) and officers and other personnel as are necessary for the operations of the Master Portfolio and the Fund. In particular, BlackRock and its affiliates provide each Master Portfolio and Fund with the following administrative services, including, among others: (i) preparing disclosure documents, such as the prospectus, the statement of additional information and periodic shareholder reports; (ii) assisting with daily accounting and pricing; (iii) overseeing and coordinating the activities of other service providers; (iv) organizing Board meetings and preparing the materials for such Board meetings; (v) providing legal and compliance support; and (vi) performing other administrative functions necessary for the operation of the Master Portfolio and the Fund, such as tax reporting, fulfilling regulatory filing requirements and call center services. The Boards reviewed the structure and duties of BlackRock’s fund administration, accounting, legal and compliance departments and considered BlackRock’s policies and procedures for assuring compliance with applicable laws and regulations.
|
|
Disclosure of Investment Advisory Agreement and Sub-Advisory Agreement (continued) |
B. The Investment Performance of each Master Portfolio, each Fund and BlackRock: Each Board, including the Independent Board Members, also reviewed and considered the performance history of each Master Portfolio and/or Fund, as applicable. The Boards noted that each Master Portfolio’s investment results correspond directly to the investment results of the applicable Feeder Fund. In preparation for the April 17, 2012 meeting, the Boards worked with their independent legal counsel, BlackRock and Lipper to develop a template for, and were provided with, reports independently prepared by Lipper, which included a comprehensive analysis of each Fund’s performance. The Boards also reviewed a narrative and statistical analysis of the Lipper data that was prepared by BlackRock, which analyzed various factors that affect Lipper’s rankings. In connection with their review, the Boards received and reviewed information regarding the investment performance of each applicable Fund as compared to funds in such Fund’s applicable Lipper category. The Boards were provided with a description of the methodology used by Lipper to select peer funds and periodically meet with Lipper representatives to review their methodology. Each Board and the Board’s Performance Oversight and Contract Committee regularly review, and meet with the management of each Master Portfolio and/or Core Plus Fund, as applicable, to discuss the performance of the Master Portfolios and/or Funds throughout the year.
The Board of the Corporation noted that, in general, Core Plus Fund performed better than its Peers in that the Fund’s performance was at or above the median of its Lipper Performance Universe in two of the one-year, three-year and since-inception periods reported.
The Boards noted that, in general, Growth Fund performed better than its Peers in that the Fund’s performance was at or above the median of its Lipper Performance Universe in two of the one-, three- and five-year periods reported.
The Boards noted that Core Fund performed below the median of its Lipper Performance Universe in the three- and five-year periods reported, but that the Fund performed at or above the median of its Lipper Performance Universe in the one-year period reported. The Boards and BlackRock reviewed and discussed the reasons for the Fund’s underperformance during the three- and five-year periods compared with its Peers. BlackRock informed the Boards that, among other things, stock selection within information technology and industrials was the greatest detractor from performance over the three- and five-year periods.
The Boards noted that Value Fund performed below the median of its Lipper Performance Universe in the three- and five-year periods reported, but that the Fund performed at or above the median of its Lipper Performance Universe in the one-year period reported. The Boards and BlackRock reviewed and discussed the reasons for the Fund’s underperformance during the three- and five-year periods compared with its Peers. BlackRock informed the Boards that, among other things, stock selection within the financial sector was the largest detractor over the three-year period, while stock selection within the utilities sector was the largest detractor from performance over the five-year period.
The Boards and BlackRock discussed BlackRock’s strategy for improving the performance of Master Large Cap Core Portfolio/Core Fund and Master Large Cap Value Portfolio/Value Fund and BlackRock’s commitment to providing the resources necessary to assist the portfolio managers of these Master Portfolios and to improve these Master Portfolios’/Funds’ performance.
C. Consideration of the Advisory/Management Fees and the Cost of the Services and Profits to be Realized by BlackRock and its Affiliates from their Relationship with each Master Portfolio and Fund: Each Board, including the Independent Board Members, reviewed, as applicable, the contractual management fee rate of each Master Portfolio/Feeder Fund and/or Core Plus Fund compared with the other funds in the Fund’s Lipper category. Each board also compared, as applicable, each Fund’s total expense ratio, as well as the actual management fee rate of each Master Portfolio/Feeder Fund and Core Plus Fund, to those of other funds in the Fund’s Lipper category. The Board considered the services provided and the fees charged by BlackRock to other types of clients with similar investment mandates, including separately managed institutional accounts.
The Boards received and reviewed statements relating to BlackRock’s financial condition and profitability with respect to the services it provided each Master Portfolio and Fund. The Boards were also provided with a profitability analysis that detailed the revenues earned and the expenses incurred by BlackRock for services provided to the Master Portfolios and the Funds. The Boards reviewed BlackRock’s profitability with respect to each Master Portfolio and Fund, as applicable, and other funds the Board currently oversees for the year ended December 31, 2011 compared to available aggregate profitability data provided for the years ended December 31, 2010 and December 31, 2009. The Boards reviewed BlackRock’s profitability with respect to other fund complexes managed by the Manager and/or its affiliates. The Boards reviewed BlackRock’s assumptions and methodology of allocating expenses in the profitability analysis, noting the inherent limitations in allocating costs among various advisory products. The Boards recognized that profitability may be affected by numerous factors including, among other things, fee waivers and expense reimbursements by the Manager, the types of funds managed, expense allocations and business mix, and the difficulty of comparing profitability as a result of those factors.
The Boards noted that, in general, individual fund or product line profitability of other advisors is not publicly available. The Boards considered BlackRock’s operating margin, in general, compared to the operating margin for leading investment management firms whose operations include advising open-end funds, among other product types. In addition, the Boards considered, among other things, certain third party data comparing BlackRock’s operating margin with that of other publicly-traded asset management firms. The Boards considered the differences between BlackRock and these other firms, including the contribution of technology at BlackRock, BlackRock’s expense management and the relative product mix.
In addition, the Boards considered the cost of the services provided to each Master Portfolio and Fund by BlackRock, and BlackRock’s and its affiliates’ profits relating to the management and distribution of each Master Portfolio and Fund and the other funds advised by BlackRock and its affiliates. As part of their analysis, the Boards reviewed BlackRock’s methodology in allocating its costs to the management of the Master Portfolios and the Funds. The Boards also considered whether BlackRock has the financial resources necessary to attract and retain high quality investment management personnel to perform its obligations under the Agreements and to continue to provide the high quality of services that is expected by the Boards.
The Boards noted that Master Large Cap Growth Portfolio’s/Growth Fund’s contractual management fee ratio (a combination of the advisory fee and the administration fee, if any) was above the median contractual management fee ratio paid by the Fund’s Peers, in each case before taking into account any expense reimbursements or fee waivers. The Boards also noted,
| | |
| | |
76 | BLACKROCK LARGE CAP SERIES FUNDS, INC. | SEPTEMBER 30, 2012 |
|
|
Disclosure of Investment Advisory Agreement and Sub-Advisory Agreement (concluded) |
however, that Master Large Cap Growth Portfolio’s/Growth Fund’s contractual management fee ratio was reasonable relative to the median contractual management fee ratio paid by the Fund’s Peers.
The Boards noted that the contractual management fee ratio (a combination of the advisory fee and the administration fee, if any) of each of Master Large Cap Core Portfolio/Core Fund and Master Large Cap Value Portfolio/Value Fund was above the median contractual management fee ratio paid by the corresponding Fund’s Peers, in each case before taking into account any expense reimbursements or fee waivers. The Boards also noted, however, that each Fund’s actual total expense ratio, after giving effect to any expense reimbursements or fee waivers by BlackRock, was reasonable relative to the median actual total expense ratio paid by the Fund’s Peers, after giving effect to any expense reimbursements or fee waivers.
The Board of the Corporation noted that Core Plus Fund’s contractual management fee ratio (a combination of the advisory fee and the administration fee, if any) was above the median contractual management fee ratio paid by the Fund’s Peers, in each case before taking into account any expense reimbursements or fee waivers.
The Boards also noted, as applicable, that each Master Portfolio and Core Plus Fund has an advisory fee arrangement that includes breakpoints that adjust the fee rate downward as the size of the Master Portfolio or Core Plus Fund increases above certain contractually specified levels.
The Boards further noted that BlackRock has (i) with respect to Core Fund, contractually agreed to waive fees and/or reimburse expenses in order to limit, to a specified amount, the total operating expenses of Core Fund as a percentage of the Fund’s average daily net assets on a class-by-class basis, as applicable and (ii) with respect to Core Plus Fund, voluntarily agreed to waive fees and/or reimburse expenses in order to limit, to a specified amount, the total operating expenses of Core Plus Fund as a percentage of the Fund’s average daily net assets on a class-by-class basis, as applicable. With respect to Value Fund, the Boards noted that after discussions between the Boards, including the Independent Board Members, and BlackRock, the Boards and BlackRock agreed to a voluntary administration fee reduction effective June 1, 2012.
D. Economies of Scale: Each Board, including the Independent Board Members, considered, as applicable, the extent to which economies of scale might be realized as the assets of each Master Portfolio and Fund increase, as well as the existence of expense caps. The Boards also considered the extent to which each Master Portfolio and Fund benefit from such economies and whether there should be changes in the advisory fee rate or structure in order to enable each Master Portfolio and Fund to participate in these economies of scale, for example through the use of revised breakpoints in the advisory fee based upon the asset level of the Master Portfolio or Core Plus Fund, as applicable. In their consideration, the Board Members took into account the existence of expense caps and further considered the continuation and/or implementation, as applicable, of such caps.
E. Other Factors Deemed Relevant by the Board Members: Each Board, including the Independent Board Members, also took into account other ancillary or “fall-out” benefits that BlackRock or its affiliates may derive from their respective relationships with the Master Portfolios and the Funds, both tangible and intangible, such as BlackRock’s ability to leverage its investment professionals who manage other portfolios and risk management personnel, an increase in BlackRock’s profile in the investment advisory community, and the engagement of BlackRock’s affiliates as service providers to the Master Portfolios and the Funds, including for administrative, distribution, securities lending and cash management services. The Boards also considered BlackRock’s overall operations and its efforts to expand the scale of, and improve the quality of, its operations. The Boards also noted that BlackRock may use and benefit from third party research obtained by soft dollars generated by certain registered fund transactions to assist in managing all or a number of its other client accounts. The Boards further noted that they had considered the investment by BlackRock’s funds in ETFs without any offset against the management fees payable by the funds to BlackRock.
In connection with their consideration of the pertinent Agreements, the Boards also received information regarding BlackRock’s brokerage and soft dollar practices. The Boards received reports from BlackRock which included information on brokerage commissions and trade execution practices throughout the year.
The Boards noted the competitive nature of the open-end fund marketplace, and that shareholders are able to redeem their Fund shares if they believe that the applicable Fund’s and/or Master Portfolio’s fees and expenses are too high or if they are dissatisfied with the performance of the Fund.
Conclusion
The Board of the Master LLC, including all the Independent Board Members, unanimously approved the continuation of the Master LLC Advisory Agreement between the Manager and the Master LLC, with respect to each Master Portfolio, for a one-year term ending June 30, 2013 and the Master LLC Sub-Advisory Agreement between the Manager and the Sub-Advisor, with respect to each Master Portfolio, for a one-year term ending June 30, 2013. Based upon its evaluation of all of the aforementioned factors in their totality, the Board of the Master LLC, including the Independent Board Members, was satisfied that the terms of the Master LLC Agreements were fair and reasonable and in the best interest of each Master Portfolio and its shareholders. The Board of the Corporation, including the Independent Board Members, also considered the continuation of the Master LLC Agreements with respect to each Master Portfolio and found the Agreements to be satisfactory.
The Board of the Corporation, including all the Independent Board Members, unanimously approved the continuation of the Core Plus Fund Advisory Agreement between the Manager and the Corporation on behalf of Core Plus Fund, for a one-year term ending June 30, 2013 and the Core Plus Fund Sub-Advisory Agreement between the Manager and the Sub-Advisor with respect to Core Plus Fund, for a one-year term ending June 30, 2013. Based upon its evaluation of all of the aforementioned factors in their totality, the Board of the Corporation, including the Independent Board Members, was satisfied that the terms of the Core Plus Fund Agreements were fair and reasonable and in the best interest of Core Plus Fund and its shareholders.
In arriving at its decision to approve the applicable Agreements, each Board did not identify any single factor or group of factors as all-important or controlling, but considered all factors together, and different Board Members may have attributed different weights to the various factors considered. The Independent Board Members were also assisted by the advice of independent legal counsel in making this determination. The contractual fee arrangements for each Master Portfolio and Core Plus Fund reflect the results of several years of review by the Board Members and predecessor Board Members, and discussions between such Board Members (and predecessor Board Members) and BlackRock. As a result, the Board Members’ conclusions may be based in part on their consideration of these arrangements in prior years.
| | | |
| | | |
| BLACKROCK LARGE CAP SERIES FUNDS, INC. | SEPTEMBER 30, 2012 | 77 |
| | | | | | | | | | |
Name, Address
and Year of Birth | | Position(s)
Held with
Corporation/
Master LLC | | Length
of Time
Served as
a Director2 | | Principal Occupation(s) During Past Five Years | | Number of BlackRock-
Advised Registered
Investment Companies
(“RICs”) Consisting of
Investment Portfolios
(“Portfolios”) Overseen | | Public
Directorships |
Independent Directors1 | | | | | | | | |
Ronald W. Forbes
55 East 52nd Street
New York, NY 10055
1940 | | Co-Chairman of the Board and Director | | Since
2007 | | Professor Emeritus of Finance, School of Business, State University of New York at Albany since 2000. | | 33 RICs consisting of 102 Portfolios | | None |
Rodney D. Johnson
55 East 52nd Street
New York, NY 10055
1941 | | Co-Chairman of the Board and Director | | Since
2007 | | President, Fairmount Capital Advisors, Inc. since 1987; Member of the Archdiocesan Investment Committee of the Archdiocese of Philadelphia since 2004; Director, The Committee of Seventy (civic) since 2006; Director, Fox Chase Cancer Center 2004 to 2011. | | 33 RICs consisting of 102 Portfolios | | None |
David O. Beim
55 East 52nd Street
New York, NY 10055
1940 | | Director | | Since
2007 | | Professor of Professional Practice at the Columbia University Graduate School of Business since 1991; Trustee, Phillips Exeter Academy since 2002; Chairman, Wave Hill, Inc. (public garden and cultural center) from 1990 to 2006. | | 33 RICs consisting of 102 Portfolios | | None |
Dr. Matina S. Horner
55 East 52nd Street
New York, NY 10055
1939 | | Director | | Since
2007 | | Executive Vice President of Teachers Insurance and Annuity Association and College Retirement Equities Fund from 1989 to 2003. | | 33 RICs consisting of 102 Portfolios | | NSTAR (electric and gas utility) |
Herbert I. London
55 East 52nd Street
New York, NY 10055
1939 | | Director | | Since
19993
and
20074 | | Professor Emeritus, New York University since 2005; John M. Olin Professor of Humanities, New York University from 1993 to 2005 and Professor thereof from 1980 to 2005; President Emeritus, Hudson Institute (policy research organization) since 2011, President thereof from 1997 to 2011 and Trustee since 1980; Chairman of the Board of Trustees for Grantham University since 2006; Director, InnoCentive, Inc. (strategic solutions company) since 2005; Director, Cerego, LLC (software development and design) since 2005; Director, Cybersettle (dispute resolution technology) since 2009. | | 33 RICs consisting of 102 Portfolios | | AIMS Worldwide, Inc. (marketing) |
Ian A. MacKinnon
55 East 52nd Street
New York, NY 10055
1948 | | Director | | Since
2012 | | Director, Kennett Capital, Inc. (investments) since 2006; Director, Free Library of Philadelphia from 1999 to 2008. | | 33 RICs consisting of 102 Portfolios | | None |
Cynthia A. Montgomery
55 East 52nd Street
New York, NY 10055
1952 | | Director | | Since
2007 | | Professor, Harvard Business School since 1989; Director, McLean Hospital since 2005; Director, Harvard Business School Publishing from 2005 to 2010. | | 33 RICs consisting of 102 Portfolios | | Newell Rubbermaid, Inc. (manufacturing) |
Joseph P. Platt
55 East 52nd Street
New York, NY 10055
1947 | | Director | | Since
2007 | | Director, The West Penn Allegheny Health System (a not-for-profit health system) since 2008; Director, Jones and Brown (Canadian insurance broker) since 1998; General Partner, Thorn Partners, LP (private investments) since 1998; Director, WQED Multi-Media (public broadcasting not-for-profit) since 2001; Partner, Amarna Corporation, LLC (private investment company) from 2002 to 2008. | | 33 RICs consisting of 102 Portfolios | | Greenlight Capital Re, Ltd. (reinsurance company) |
Robert C. Robb, Jr.
55 East 52nd Street
New York, NY 10055
1945 | | Director | | Since
2007 | | Partner, Lewis, Eckert, Robb and Company (management and financial consulting firm) since 1981. | | 33 RICs consisting of 102 Portfolios | | None |
| | |
| | |
78 | BLACKROCK LARGE CAP SERIES FUNDS, INC. | SEPTEMBER 30, 2012 |
|
|
Officers and Directors (continued) |
| | | | | | | | | | |
Name, Address
and Year of Birth | | Position(s)
Held with
Corporation/
Master LLC | | Length
of Time
Served as
a Director2 | | Principal Occupation(s) During Past Five Years | | Number of BlackRock-
Advised Registered
Investment Companies
(“RICs”) Consisting of
Investment Portfolios
(“Portfolios”) Overseen | | Public
Directorships |
Independent Directors1 (concluded) |
Toby Rosenblatt
55 East 52nd Street
New York, NY 10055
1938 | | Director | | Since
2007 | | President, Founders Investments Ltd. (private investments) since 1999; Director, Forward Management, LLC since 2007; Director, College Access Foundation of California (philanthropic foundation) since 2009; Director, A.P. Pharma, Inc. (specialty pharmaceuticals) from 1983 to 2011; Director, The James Irvine Foundation (philanthropic foundation) from 1998 to 2008. | | 33 RICs consisting of 102 Portfolios | | None |
Kenneth L. Urish
55 East 52nd Street
New York, NY 10055
1951 | | Director | | Since
2007 | | Managing Partner, Urish Popeck & Co., LLC (certified public accountants and consultants) since 1976; Chairman Elect of the Professional Ethics Committee of the Pennsylvania Institute of Certified Public Accountants and Committee Member thereof since 2007; Member of External Advisory Board, The Pennsylvania State University Accounting Department since 2001; Trustee, The Holy Family Institute from 2001 to 2010; President and Trustee, Pittsburgh Catholic Publishing Associates from 2003 to 2008; Director, Inter-Tel from 2006 to 2007. | | 33 RICs consisting of 102 Portfolios | | None |
Frederick W. Winter
55 East 52nd Street
New York, NY 10055
1945 | | Director | | Since
2007 | | Professor and Dean Emeritus of the Joseph M. Katz School of Business, University of Pittsburgh since 2005 and Dean thereof from 1997 to 2005; Director, Alkon Corporation (pneumatics) since 1992; Director, Tippman Sports (recreation) since 2005; Director, Indotronix International (IT services) from 2004 to 2008. | | 33 RICs consisting of 102 Portfolios | | None |
| | |
| 1 | Directors serve until their resignation, removal or death, or until December 31 of the year in which they turn 72. The Board has approved extensions in terms of Directors who turn 72 prior to December 31, 2013. |
| | |
| 2 | Date shown is the earliest date a person has served for the Corporation/Master LLC covered by this annual report. Following the combination of Merrill Lynch Investment Managers, L.P. (“MLIM”) and BlackRock, Inc. (“BlackRock”) in September 2006, the various legacy MLIM and legacy BlackRock Fund boards were realigned and consolidated into three new Fund boards in 2007. As a result, although the chart shows certain Directors as joining the Corporation’s/Master LLC’s board in 2007, each Director first became a member of the board of other legacy MLIM or legacy BlackRock Funds as follows: David O. Beim, 1998; Ronald W. Forbes, 1977; Dr. Matina S. Horner, 2004; Rodney D. Johnson, 1995; Herbert I. London, 1987; Cynthia A. Montgomery, 1994; Joseph P. Platt, 1999; Robert C. Robb, Jr., 1998; Toby Rosenblatt, 2005; Kenneth L. Urish, 1999; and Frederick W. Winter, 1999. |
| | |
| 3 | For BlackRock Large Cap Core Fund, BlackRock Large Cap Growth Fund, BlackRock Large Cap Value Fund and the Master LLC. |
| | |
| 4 | For BlackRock Large Cap Core Plus Fund. |
| | | | | | | | | | |
Interested Directors5 |
Paul L. Audet
55 East 52nd Street
New York, NY 10055
1953 | | Director | | Since
2011 | | Senior Managing Director of BlackRock and Head of U.S. Mutual Funds since 2011; Chair of the U.S. Mutual Funds Committee reporting to the Global Executive Committee since 2011; Head of BlackRock’s Real Estate business from 2008 to 2011; Member of BlackRock’s Global Operating and Corporate Risk Management Committees and of the BlackRock Alternative Investors Executive Committee and Investment Committee for the Private Equity Fund of Funds business since 2008; Head of BlackRock’s Global Cash Management business from 2005 to 2010; Acting Chief Financial Officer of BlackRock from 2007 to 2008; Chief Financial Officer of BlackRock from 1998 to 2005. | | 160 RICs consisting of 278 Portfolios | | None |
Henry Gabbay
55 East 52nd Street
New York, NY 10055
1947 | | Director | | Since
2007 | | Consultant, BlackRock from 2007 to 2008; Managing Director, BlackRock from 1989 to 2007; Chief Administrative Officer, BlackRock Advisors, LLC from 1998 to 2007; President of BlackRock Funds and BlackRock Bond Allocation Target Shares from 2005 to 2007 and Treasurer of certain closed-end funds in the BlackRock fund complex from 1989 to 2006. | | 160 RICs consisting of 278 Portfolios | | None |
| | |
| 5 | Mr. Audet is an “interested person,” as defined in the 1940 Act, of the Corporation/Master LLC based on his position with BlackRock and its affiliates. Mr. Gabbay is an “interested person” of the Corporation/Master LLC based on his former positions with BlackRock and its affiliates as well as his ownership of BlackRock and The PNC Financial Services Group, Inc. securities. Mr. Audet and Mr. Gabbay are also Directors of the BlackRock registered closed-end funds and Directors of other BlackRock registered open-end funds. Directors serve until their resignation, removal or death, or until December 31 of the year in which they turn 72. |
| | | |
| | | |
| BLACKROCK LARGE CAP SERIES FUNDS, INC. | SEPTEMBER 30, 2012 | 79 |
|
|
Officers and Directors (concluded) |
| | | | | | |
Name, Address
and Year of Birth | | Position(s)
Held with
Corporation/
Master LLC | | Length
of Time
Served | | Principal Occupation(s) During Past Five Years |
Officers1 | | | | | | |
John M. Perlowski
55 East 52nd Street
New York, NY 10055
1964 | | President and Chief Executive Officer | | Since
2010 | | Managing Director of BlackRock since 2009; Global Head of BlackRock Fund Administration since 2009; Managing Director and Chief Operating Officer of the Global Product Group at Goldman Sachs Asset Management, L.P. from 2003 to 2009; Treasurer of Goldman Sachs Mutual Funds from 2003 to 2009 and Senior Vice President thereof from 2007 to 2009; Director of Goldman Sachs Offshore Funds from 2002 to 2009; Director of Family Resource Network (charitable foundation) since 2009. |
Brendan Kyne
55 East 52nd Street
New York, NY 10055
1977 | | Vice President | | Since
2009 | | Managing Director of BlackRock since 2010; Director of BlackRock from 2008 to 2009; Head of Product Development and Management for BlackRock’s U.S. Retail Group since 2009 and Co-head thereof from 2007 to 2009; Vice President of BlackRock from 2005 to 2008. |
Neal Andrews
55 East 52nd Street
New York, NY 10055
1966 | | Chief Financial Officer | | Since
2007 | | Managing Director of BlackRock since 2006; Senior Vice President and Line of Business Head of Fund Accounting and Administration at PNC Global Investment Servicing (U.S.) Inc. from 1992 to 2006. |
Jay Fife
55 East 52nd Street
New York, NY 10055
1966 | | Treasurer | | Since
2007 | | Managing Director of BlackRock since 2007; Director of BlackRock in 2006; Assistant Treasurer of the MLIM and Fund Asset Management, L.P. advised funds from 2005 to 2006; Director of MLIM Fund Services Group from 2001 to 2006. |
Brian Kindelan
55 East 52nd Street
New York, NY 10055
1959 | | Chief Compliance Officer and Anti-Money Laundering Officer | | Since
2007 | | Chief Compliance Officer of the BlackRock-advised funds since 2007; Managing Director and Senior Counsel of BlackRock since 2005. |
Benjamin Archibald
55 East 52nd Street
New York, NY 10055
1975 | | Secretary | | Since
2012 | | Director of BlackRock since 2010; Assistant Secretary to the funds from 2010 to 2012; General Counsel and Chief Operating Officer of Uhuru Capital Management from 2009 to 2010; Executive Director and Counsel of Goldman Sachs Asset Management from 2005 to 2009. |
| | |
| 1 | Officers of the Corporation/Master LLC serve at the pleasure of the Board. |
| Further information about the Corporation’s Officers and Directors is available in the Corporation’s Statement of Additional Information, which can be obtained without charge by calling (800) 441-7762. |
|
Investment Advisor |
BlackRock Advisors, LLC |
Wilmington, DE 19809 |
|
Sub-Advisor |
BlackRock Investment |
Management, LLC |
Princeton, NJ 08540 |
|
Custodian |
Brown Brothers Harriman & Co. |
Boston, MA 02109 |
|
Transfer Agent |
BNY Mellon Investment |
Servicing (US) Inc. |
Wilmington, DE 19809 |
|
Accounting Agent |
State Street Bank and |
Trust Company |
Boston, MA 02110 |
|
Distributor |
BlackRock Investments, LLC |
New York, NY 10022 |
|
Legal Counsel |
Sidley Austin LLP |
New York, NY 10019 |
|
Independent Registered Public Accounting Firm |
Deloitte & Touche LLP |
Boston, MA 02116 |
|
Address of the Corporation |
100 Bellevue Parkway |
Wilmington, DE 19809 |
|
Effective May 15, 2012, Ian A. MacKinnon became a Director of the Corporation and Master LLC. |
|
Effective May 16, 2012, Ira P. Shapiro resigned as Secretary of the Corporation and Master LLC, and Benjamin Archibald became Secretary of the Corporation and Master LLC. |
|
| | |
| | |
80 | BLACKROCK LARGE CAP SERIES FUNDS, INC. | SEPTEMBER 30, 2012 |
Electronic Delivery
Electronic copies of most financial reports and prospectuses are available on the Funds’ website or shareholders can sign up for e-mail notifications of quarterly statements, annual and semi-annual reports and prospectuses by enrolling in the Funds’ electronic delivery program.
To enroll:
Shareholders Who Hold Accounts with Investment Advisors, Banks or Brokerages:
Please contact your financial advisor. Please note that not all investment advisors, banks or brokerages may offer this service.
Shareholders Who Hold Accounts Directly with BlackRock:
1) Access the BlackRock website at http://www.blackrock.com/edelivery
2) Select “eDelivery” under the “More Information” section
3) Log into your account
Householding
The Funds will mail only one copy of shareholder documents, including prospectuses, annual and semi-annual reports and proxy statements, to shareholders with multiple accounts at the same address. This practice is commonly called “householding” and is intended to reduce expenses and eliminate duplicate mailings of shareholder documents. Mailings of your shareholder documents may be householded indefinitely unless you instruct us otherwise. If you do not want the mailing of these documents to be combined with those for other members of your household, please call the Funds at (800) 441-7762.
Availability of Quarterly Schedule of Investments
The Corporation/Master LLC file their complete schedule of portfolio holdings with the SEC for the first and third quarters of each fiscal year on Form N-Q. The Corporation’s/Master LLC’s Forms N-Q are available on the SEC’s website at http://www.sec.gov and may also be reviewed and copied at the SEC’s Public Reference Room in Washington, DC. Information on how to access documents on the SEC’s website without charge may be obtained by calling (800) SEC-0330. The Corporation’s/Master LLC’s Forms N-Q may also be obtained upon request and without charge by calling (800) 441-7762.
Availability of Proxy Voting Policies and Procedures
A description of the policies and procedures that the Corporation/ Master LLC use to determine how to vote proxies relating to portfolio securities is available (1) without charge, upon request, by calling (800) 441-7762; (2) at http://www.blackrock.com; and (3) on the SEC’s website at http://www.sec.gov.
Availability of Proxy Voting Record
Information about how the Corporation/Master LLC voted proxies relating to securities held in the Corporation’s/Master LLC’s portfolios during the most recent 12-month period ended June 30 is available upon request and without charge (1) at http://www.blackrock.com or by calling (800) 441-7762 and (2) on the SEC’s website at http://www.sec.gov.
| | | |
|
| BLACKROCK LARGE CAP SERIES FUNDS, INC. | SEPTEMBER 30, 2012 | 81 |
|
|
Additional Information (concluded) |
Account Information
Call us at (800) 441-7762 from 8:00 AM to 6:00 PM EST on any business day to get information about your account balances, recent transactions and share prices. You can also reach us on the Web at http://www.blackrock.com/funds.
Automatic Investment Plans
Investor Class shareholders who want to invest regularly can arrange to have $50 or more automatically deducted from their checking or savings account and invested in any of the BlackRock funds.
Systematic Withdrawal Plans
Investor Class shareholders can establish a systematic withdrawal plan and receive periodic payments of $50 or more from their BlackRock funds, as long as their account balance is at least $10,000.
Retirement Plans
Shareholders may make investments in conjunction with Traditional, Rollover, Roth, Coverdell, Simple IRAs, SEP IRAs and 403(b) Plans.
|
BlackRock Privacy Principles |
BlackRock is committed to maintaining the privacy of its current and former fund investors and individual clients (collectively, “Clients”) and to safeguarding their non-public personal information. The following information is provided to help you understand what personal information BlackRock collects, how we protect that information and why in certain cases we share such information with select parties.
If you are located in a jurisdiction where specific laws, rules or regulations require BlackRock to provide you with additional or different privacy-related rights beyond what is set forth below, then BlackRock will comply with those specific laws, rules or regulations.
BlackRock obtains or verifies personal non-public information from and about you from different sources, including the following: (i) information we receive from you or, if applicable, your financial intermediary, on applications, forms or other documents; (ii) information about your transactions with us, our affiliates, or others; (iii) information we receive from a consumer reporting agency; and (iv) from visits to our websites.
BlackRock does not sell or disclose to non-affiliated third parties any non-public personal information about its Clients, except as permitted by law or as is necessary to respond to regulatory requests or to service Client accounts. These non-affiliated third parties are required to protect the confidentiality and security of this information and to use it only for its intended purpose.
We may share information with our affiliates to service your account or to provide you with information about other BlackRock products or services that may be of interest to you. In addition, BlackRock restricts access to non-public personal information about its Clients to those BlackRock employees with a legitimate business need for the information. BlackRock maintains physical, electronic and procedural safeguards that are designed to protect the non-public personal information of its Clients, including procedures relating to the proper storage and disposal of such information.
| | | |
|
82 | BLACKROCK LARGE CAP SERIES FUNDS, INC. | SEPTEMBER 30, 2012 | |
|
|
A World-Class Mutual Fund Family |
BlackRock offers a diverse lineup of open-end mutual funds crossing all investment styles and managed by experts in equity, fixed income and tax-exempt investing.
|
Equity Funds |
|
BlackRock ACWI ex-US Index Fund |
BlackRock All-Cap Energy & Resources Portfolio |
BlackRock Balanced Capital Fund† |
BlackRock Basic Value Fund |
BlackRock Capital Appreciation Fund |
BlackRock China Fund |
BlackRock Commodity Strategies Fund |
BlackRock Emerging Markets Fund |
BlackRock Emerging Markets Long/Short Equity Fund |
BlackRock Energy & Resources Portfolio |
BlackRock Equity Dividend Fund |
BlackRock EuroFund |
BlackRock Flexible Equity Fund |
BlackRock Focus Growth Fund |
BlackRock Global Allocation Fund† |
BlackRock Global Dividend Income Portfolio |
BlackRock Global Opportunities Portfolio |
BlackRock Global SmallCap Fund |
BlackRock Health Sciences Opportunities Portfolio |
BlackRock Index Equity Portfolio |
BlackRock India Fund |
BlackRock International Fund |
BlackRock International Index Fund |
BlackRock International Opportunities Portfolio |
BlackRock Large Cap Core Fund |
BlackRock Large Cap Core Plus Fund |
BlackRock Large Cap Growth Fund |
BlackRock Large Cap Value Fund |
BlackRock Latin America Fund |
BlackRock Long-Horizon Equity Fund |
BlackRock Managed Volatility Portfolio† |
BlackRock Mid-Cap Growth Equity Portfolio |
BlackRock Mid Cap Value Opportunities Fund |
BlackRock Natural Resources Trust |
BlackRock Pacific Fund |
BlackRock Real Estate Securities Fund |
BlackRock Russell 1000 Index Fund |
BlackRock Science & Technology Opportunities Portfolio |
BlackRock Small Cap Growth Equity Portfolio |
BlackRock Small Cap Growth Fund II |
BlackRock Small Cap Index Fund |
BlackRock S&P 500 Index Fund |
BlackRock S&P 500 Stock Fund |
BlackRock U.S. Opportunities Portfolio |
BlackRock Value Opportunities Fund |
BlackRock World Gold Fund |
|
|
Taxable Fixed Income Funds |
|
BlackRock Bond Index Fund |
BlackRock Core Bond Portfolio |
BlackRock CoreAlpha Bond Fund |
BlackRock Emerging Market Local Debt Portfolio |
BlackRock Floating Rate Income Portfolio |
BlackRock Global Long/Short Credit Fund |
BlackRock GNMA Portfolio |
BlackRock High Yield Bond Portfolio |
BlackRock Inflation Protected Bond Portfolio |
BlackRock International Bond Portfolio |
BlackRock Long Duration Bond Portfolio |
BlackRock Low Duration Bond Portfolio |
BlackRock Multi-Asset Income Portfolio† |
BlackRock Secured Credit Portfolio |
BlackRock Strategic Income Opportunities Portfolio |
BlackRock Total Return Fund |
BlackRock US Government Bond Portfolio |
BlackRock US Mortgage Portfolio |
BlackRock World Income Fund |
|
|
Municipal Fixed Income Funds |
|
BlackRock California Municipal Bond Fund |
BlackRock High Yield Municipal Fund |
BlackRock Intermediate Municipal Fund |
BlackRock National Municipal Fund |
BlackRock New Jersey Municipal Bond Fund |
BlackRock New York Municipal Bond Fund |
BlackRock Pennsylvania Municipal Bond Fund |
BlackRock Short-Term Municipal Fund |
|
|
Target Risk & Target Date Funds† |
|
BlackRock Prepared Portfolios |
Conservative Prepared Portfolio |
Moderate Prepared Portfolio |
Growth Prepared Portfolio |
Aggressive Growth Prepared Portfolio |
|
LifePath Active Portfolios |
2015 |
2020 |
2025 |
2030 |
2035 |
2040 |
2045 |
2050 |
|
LifePath Portfolios |
Retirement |
2020 |
2025 |
2030 |
2035 |
2040 |
2045 |
2050 |
2055 |
|
LifePath Index Portfolios |
Retirement |
2020 |
2025 |
2030 |
2035 |
2040 |
2045 |
2050 |
2055 |
BlackRock mutual funds are currently distributed by BlackRock Investments, LLC. You should consider the investment objectives, risks, charges and expenses of the funds under consideration carefully before investing. Each fund’s prospectus contains this and other information and is available at www.blackrock.com or by calling (800) 441-7762 or from your financial advisor. The prospectus should be read carefully before investing.
| | | |
| | | |
| BLACKROCK LARGE CAP SERIES FUNDS, INC. | SEPTEMBER 30, 2012 | 83 |
These reports are not authorized for use as an offer of sale or a solicitation of an offer to buy shares of the Funds unless accompanied or preceded by the Funds’ current prospectus. Past performance results shown in these reports should not be considered a representation of future performance. Investment returns and principal value of shares will fluctuate so that shares, when redeemed, may be worth more or less than their original cost. Statements and other information herein are as dated and are subject to change.
| |

|
#CAPSERIESCP-9/12-AR | 
|
| |

| September 30, 2012 |
Annual Report
BlackRock Large Cap Series Funds, Inc.
|
• BlackRock Large Cap Core Retirement Portfolio
|
• BlackRock Large Cap Growth Retirement Portfolio
|
• BlackRock Large Cap Value Retirement Portfolio |
|
Not FDIC Insured §No Bank Guarantee §May Lose Value |
| | | |
| | | |
2 | BLACKROCK LARGE CAP SERIES FUNDS, INC. | SEPTEMBER 30, 2012 | |
Late in the summer of 2011, financial markets were upended by sovereign debt turmoil in the United States and Europe as well as growing concerns about the future of the global economy. Investor confidence had crumbled. However, the fourth quarter of 2011 brought improving economic data and more concerted efforts among European leaders toward stemming the region’s debt crisis, gradually drawing investors back to the markets. Improving sentiment carried over into early 2012 as investors felt some relief from the world’s financial woes. Volatility abated and risk assets (including stocks, commodities and high yield bonds) moved boldly higher through the first two months of 2012, while climbing Treasury yields pressured higher-quality fixed income assets.
Markets reversed course in the spring when Europe’s debt problems boiled over once again. High levels of volatility returned as political instability in Greece threatened the country’s membership in the eurozone. Spain faced severe deficit issues while the nation’s banks clamored for liquidity. Yields on Spanish and Italian government debt rose to levels deemed unsustainable. European leaders conferred and debated vehemently over the need for fiscal integration among the 17 nations comprising the euro currency bloc as a means to resolve the crisis for the long term.
Alongside the drama in Europe, investors were discouraged by gloomy economic reports from various parts of the world. A slowdown in China, a key powerhouse for global growth, became particularly worrisome. In the United States, disappointing jobs reports dealt a crushing blow to investor sentiment. Risk assets sold off in the second quarter as investors again retreated to safe haven assets.
Despite ongoing concerns about the health of the global economy and the debt crisis in Europe, most asset classes enjoyed a robust summer rally powered mainly by expectations for policy stimulus from central banks in Europe and the United States. Although global economic data continued to be mixed, the spate of downside surprises seen in the second quarter had receded and, outside of Europe, the risk of recession largely subsided. Additionally, in response to growing debt pressures, the European Central Bank allayed investors’ fears by stating its conviction to hold the eurozone together. Early in September, the European Central Bank announced a plan to purchase sovereign debt in the eurozone’s most troubled nations. Later that month, the US Federal Reserve announced its long-awaited — and surprisingly aggressive — stimulus program, committing to purchase $40 billion of agency mortgage-backed securities per month until the US economy exhibits enough strength to sustain real growth and improving labor market conditions. These central bank actions boosted risk assets globally as investors increased their risk appetites in their search for higher returns.
All asset classes performed well for the 12-month period ended September 30, 2012, with particularly strong returns from US stocks and high yield bonds. For the six-month period ended September 30, 2012, fixed income investments outperformed equities. US Treasury bonds posted exceptional gains by historical standards and outperformed investment-grade corporate bonds and tax-exempt municipals. High yield bonds also generated solid returns. US stocks finished the six-month period with modest gains, while international and emerging market stocks lagged other asset classes amid ongoing uncertainty. Near-zero short term interest rates continued to keep yields on money market securities near their all-time lows.
The financial world is more uncertain than ever, but there are new avenues of opportunity — new ways to invest and new markets in which to invest. We believe it’s our responsibility to help investors adapt to today’s new world of investing and build the portfolios these times require. We encourage you to visit www.blackrock.com/newworld for more information.
Sincerely,

Rob Kapito
President, BlackRock Advisors, LLC

“The financial world is more uncertain than ever, but there are new avenues of opportunity.”
|
Rob Kapito |
President, BlackRock Advisors, LLC |
|
|
Total Returns as of September 30, 2012 |
| | | | | | | |
| | 6-month | | 12-month | |
US large cap equities
(S&P 500® Index) | | 3.43 | % | | 30.20 | % | |
US small cap equities
(Russell 2000® Index) | | 1.60 | | | 31.91 | | |
International equities
(MSCI Europe, Australasia,
Far East Index) | | (0.70 | ) | | 13.75 | | |
Emerging market
equities (MSCI Emerging
Markets Index) | | (1.84 | ) | | 16.93 | | |
3-month Treasury bill
(BofA Merrill Lynch
3-Month US Treasury
Bill Index) | | 0.06 | | | 0.07 | | |
US Treasury securities
(BofA Merrill Lynch 10-
Year US Treasury Index) | | 6.78 | | | 5.66 | | |
US investment grade
bonds (Barclays US
Aggregate Bond Index) | | 3.68 | | | 5.16 | | |
Tax-exempt municipal
bonds (S&P Municipal
Bond Index) | | 4.50 | | | 8.84 | | |
US high yield bonds
(Barclays US Corporate
High Yield 2% Issuer
Capped Index) | | 6.40 | | | 19.35 | | |
| | | | | | | |
Past performance is no guarantee of future results. Index performance is shown for illustrative purposes only. You cannot invest directly in an index. |
| | | |
| | | |
| THIS PAGE NOT PART OF YOUR FUND REPORT | | 3 |
| |
| |
Fund Summary as of September 30, 2012 | BlackRock Large Cap Core Retirement Portfolio |
| |
| |
Investment Objective |
|
BlackRock Large Cap Core Retirement Portfolio’s (the “Fund”) investment objective is to seek long-term capital growth. In other words, the Fund tries to choose investments that will increase in value. |
|
|
Portfolio Management Commentary |
|
How did the Fund perform? |
| | |
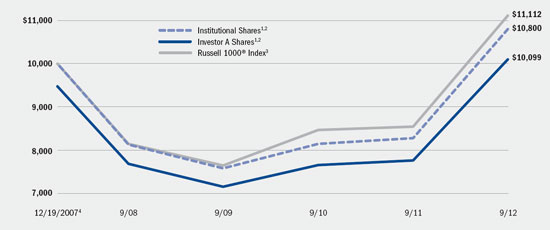
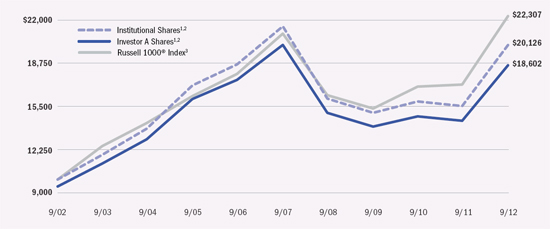
• | For the 12-month period ended September 30, 2012, the Fund, through its investment in Master Large Cap Core Portfolio (the “Portfolio”), generated a positive double-digit return, but underperformed its benchmark, the Russell 1000® Index. |
| | |
What factors influenced performance? |
|
• | Stock selection in the information technology (“IT”) sector was the leading contributor to the Fund’s positive performance during the period. In the internet software & services industry, the Portfolio’s position in Google, Inc. delivered a strong return as higher click-through rates and pricing stabilization helped drive robust revenue growth for the company. Shares of AOL, Inc. also surged as the company began returning patent proceeds to shareholders via stock repurchases while continuing to transform its business model to focus on internet advertising. In the semiconductor space, a bias toward names with exposure to hard disk drives proved beneficial, with consolidation in the semiconductor equipment arena boosting returns for select holdings as well. In materials, the Portfolio’s positioning in the chemicals industry had a positive impact on performance. Specifically, the Portfolio was overweight in CF Industries Holdings, Inc., a key fertilizer holding, which experienced soaring profit margins due to lower input costs (i.e., natural gas) coupled with increasing demand and rising prices for its nitrogen-based crop nutrients. Portfolio holdings of select commodity chemical producers also benefited from lower natural gas prices during the period. |
| |
• | The largest detractor from performance relative to the benchmark index came from the industrials sector, where the Portfolio’s underweight to the machinery industry hindered returns. Machinery stocks are highly sensitive to economic growth and thus surged early in the reporting period. Stock selection in telecommunication services also had a negative impact on relative returns as the Portfolio preferred wireless holdings, which underperformed over the period amid continued competitive pressures, especially within the prepaid space. |
| | |
Describe recent portfolio activity. |
|
• | During the 12-month period, the Portfolio significantly increased exposure to the financials sector, and also added to energy and industrials. The Portfolio reduced its allocations to IT, health care and materials. |
| | |
Describe portfolio positioning at period end. |
|
• | Portfolio management continues to believe equities offer good value, especially relative to bonds. Company margins remain high in an environment marked by slow economic growth. Going forward, the companies best able to differentiate themselves will likely have the following characteristics: strong free cash flow, the ability to sustain or even improve their margins, and/or the ability to grow their business. Portfolio management does not believe any one group or sector has a monopoly on these characteristics and, as such, is looking across the market to identify stock-specific investments to emphasize the view within the portfolio. Relative to the Russell 1000® Index, the Portfolio ended the period with its largest sector overweight in health care, followed by energy and consumer discretionary, and its most significant underweights in consumer staples and industrials. |
| | |
| | The views expressed reflect the opinions of BlackRock as of the date of this report and are subject to change based on changes in market, economic or other conditions. These views are not intended to be a forecast of future events and are no guarantee of future results. |
| | | |
| | | |
4 | BLACKROCK LARGE CAP SERIES FUNDS, INC. | SEPTEMBER 30, 2012 | |
|
|
BlackRock Large Cap Core Retirement Portfolio |
|
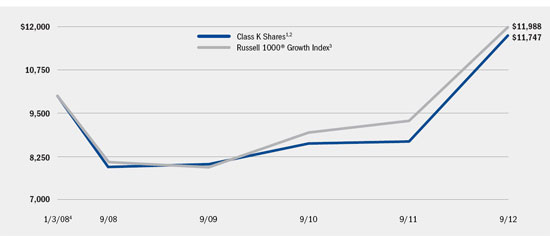
Total Return Based on a $10,000 Investment |
| | |
| | 
|
| | |
| 1 | Assuming transaction costs and other operating expenses, including administration fees, if any. |
| | |
| 2 | The Fund invests all of its assets in the Portfolio, a series of Master Large Cap Series LLC. The Portfolio invests at least 80% of its assets in equity securities of large cap companies located in the United States that the investment advisor selects from among those that are, at the time of purchase, included in the Russell 1000® Index. |
| | |
| 3 | This unmanaged broad-based index measures the performance of the 1,000 largest companies in the Russell 3000® Index, which represents approximately 90% of the total market capitalization of the Russell 3000® Index. |
| | |
| 4 | Commencement of operations. |
|
Performance Summary for the Period Ended September 30, 2012 |
| | | | | | | | | | |
| | 6-Month
Total Returns | | Average Annual Total Returns5 | |
| | | 1 Year | | Since Inception6 | |
Class K | | 1.38 | % | | 29.67 | % | | (0.20 | )% | |
Russell 1000® Index | | 2.99 | | | 30.06 | | | 2.31 | | |
| | |
| 5 | See “About Fund Performance” on page 10 for a detailed description of the share class, including any related sales charges and fees. |
| | |
| 6 | The Fund commenced operations on January 3, 2008.
Past performance is not indicative of future results. |
| | | | | | | | | | | | | | | | | | | | | | |
| | Actual | | Hypothetical8 | | | |
| | Beginning
Account Value
April 1, 2012 | | Ending
Account Value
September 30, 2012 | | Expenses Paid
During the Period7 | | Beginning
Account Value
April 1, 2012 | | Ending
Account Value
September 30, 2012 | | Expenses Paid
During the Period7 | | Annualized
Expense Ratio | |
Class K | | | $1,000.00 | | | $1,013.80 | | | $2.42 | | | $1,000.00 | | | $1,022.60 | | | $2.43 | | | 0.48% | |
| | |
| 7 | Expenses are equal to the Fund’s annualized expense ratio, multiplied by the average account value over the period, multiplied by 183/366 (to reflect the one-half year period shown). Because the Fund invests significantly in the Portfolio, the expense example reflects the net expenses of both the Fund and the Portfolio in which it invests. |
| | |
| 8 | Hypothetical 5% annual return before expenses is calculated by pro rating the number of days in the most recent fiscal half year divided by 366.
See “Disclosure of Expenses” on page 10 for further information on how expenses were calculated. |
| | | |
| | | |
| BLACKROCK LARGE CAP SERIES FUNDS, INC. | SEPTEMBER 30, 2012 | 5 |
| |
| |
Fund Summary as of September 30, 2012 | BlackRock Large Cap Growth Retirement Portfolio |
BlackRock Large Cap Growth Retirement Portfolio’s (the “Fund”) investment objective is to seek long-term capital growth. In other words, the Fund tries to choose investments that will increase in value.
|
Portfolio Management Commentary |
| |
How did the Fund perform? |
|
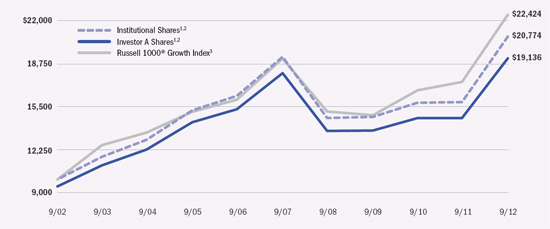
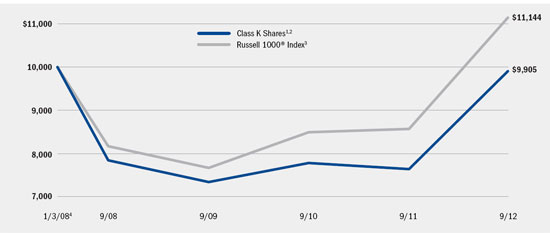
• | For the 12-month period ended September 30, 2012, the Fund, through its investment in Master Large Cap Growth Portfolio (the “Portfolio”), outperformed its benchmark, the Russell 1000® Growth Index. |
| |
What factors influenced performance? |
|
• | The Fund’s outperformance was attributable to the Portfolio’s stock selection across several sectors. In materials, the Portfolio’s positioning in the chemicals industry had a positive impact on performance. Specifically, the Portfolio was overweight in CF Industries Holdings, Inc., a key fertilizer holding, which experienced soaring profit margins due to lower input costs (i.e., natural gas) coupled with increasing demand and rising prices for its nitrogen-based crop nutrients. Portfolio holdings of select commodity chemical producers also benefited from lower natural gas prices during the period. In the IT sector, a bias toward semiconductor names with exposure to hard disk drives proved beneficial, as did the avoidance of Intel Corp., which lagged during the period. In the internet software & services industry, the Portfolio’s position in Google, Inc. delivered a strong return as higher click-through rates and pricing stabilization helped drive robust revenue growth. In consumer discretionary, strength was especially notable among the Portfolio’s travel-related holdings, which outperformed on earnings results that handily beat very low expectations, as well as very strong forward hotel bookings in the United States and abroad (including Europe). An overweight to media names also aided relative results, as did favorable selection in the hotels, restaurants & leisure industry. |
| |
• | Detracting from performance relative to the benchmark index was positioning in the industrials sector, where the Portfolio’s underweight to the machinery industry hindered returns. Machinery stocks are highly sensitive to economic growth and thus surged early in the reporting period. Stock selection in telecommunication services also had a negative impact on relative returns as the Portfolio preferred wireless holdings, which underperformed over the period amid continued competitive pressures, especially within the prepaid space. |
| |
Describe recent portfolio activity. |
|
• | During the 12-month period, the Portfolio significantly increased its weightings in the industrials and consumer staples sectors and reduced allocations to health care, IT and consumer discretionary. |
| |
Describe portfolio positioning at period end. |
| |
• | Portfolio management continues to believe equities offer good value, especially relative to bonds. Company margins remain high in an environment marked by slow economic growth. Going forward, the companies best able to differentiate themselves will likely have the following characteristics: strong free cash flow, the ability to sustain or even improve their margins, and/or the ability to grow their business. Portfolio management does not believe any one group or sector has a monopoly on these characteristics and, as such, is looking across the market to identify stock-specific investments to emphasize the view within the portfolio. Relative to the Russell 1000® Growth Index, the Portfolio ended the period with its largest sector overweights in energy and health care, and its most significant underweights in consumer discretionary, financials and IT. |
| |
| The views expressed reflect the opinions of BlackRock as of the date of this report and are subject to change based on changes in market, economic or other conditions. These views are not intended to be a forecast of future events and are no guarantee of future results. |
| | |
| | |
6 | BLACKROCK LARGE CAP SERIES FUNDS, INC. | SEPTEMBER 30, 2012 |
|
|
BlackRock Large Cap Growth Retirement Portfolio |
|
Total Return Based on a $10,000 Investment |
| | |
| | 
|
| | |
| 1 | Assuming transaction costs and other operating expenses, including administration fees, if any. |
| | |
| 2 | The Fund invests all of its assets in the Portfolio, a series of Master Large Cap Series LLC. The Portfolio invests at least 80% of its assets in equity securities of large cap companies located in the United States that the investment advisor selects from among those that are, at the time of purchase, included in the Russell 1000® Growth Index. |
| | |
| 3 | This unmanaged broad-based index is a subset of the Russell 1000® Index consisting of those Russell 1000® securities with a greater-than-average growth orientation. |
| | |
| 4 | Commencement of operations. |
|
Performance Summary for the Period Ended September 30, 2012 |
| | | | | | | | | | |
| | | | Average Annual Total Returns5 | |
| | 6-Month
Total Returns | | 1 Year | | Since Inception6 | |
Class K | | 2.08 | % | | 35.29 | % | | 3.45 | % | |
Russell 1000® Growth Index | | 1.84 | | | 29.19 | | | 3.90 | | |
| | |
| 5 | See “About Fund Performance” on page 10 for a detailed description of the share class, including any related sales charges and fees. |
| | |
| 6 | The Fund commenced operations on January 3, 2008.
Past performance is not indicative of future results. |
| | | | | | | | | | | | | | | | | | | | | | |
| | Actual | | Hypothetical8 | | | | |
| | Beginning
Account Value
April 1, 2012 | | Ending
Account Value
September 30, 2012 | | Expenses Paid
During the Period7 | | Beginning
Account Value
April 1, 2012 | | Ending
Account Value
September 30, 2012 | | Expenses Paid
During the Period7 | | Annualized
Expense Ratio | |
Class K | | | $1,000.00 | | | $1,020.00 | | | $3.23 | | | $1,000.00 | | | $1,021.80 | | | $3.23 | | | 0.64% | |
| | |
| 7 | Expenses are equal to the Fund’s annualized expense ratio, multiplied by the average account value over the period, multiplied by 183/366 (to reflect the one-half year period shown). Because the Fund invests significantly in the Portfolio, the expense example reflects the net expenses of both the Fund and the Portfolio in which it invests. |
| | |
| 8 | Hypothetical 5% annual return before expenses is calculated by pro rating the number of days in the most recent fiscal half year divided by 366.
See “Disclosure of Expenses” on page 10 for further information on how expenses were calculated. |
| | | |
| | | |
| BLACKROCK LARGE CAP SERIES FUNDS, INC. | SEPTEMBER 30, 2012 | 7 |
| |
| |
Fund Summary as of September 30, 2012 | BlackRock Large Cap Value Retirement Portfolio |
BlackRock Large Cap Value Retirement Portfolio’s (the “Fund”) investment objective is to seek long-term capital growth. In other words, the Fund tries to choose investments that will increase in value.
|
Portfolio Management Commentary |
| |
How did the Fund perform? |
|
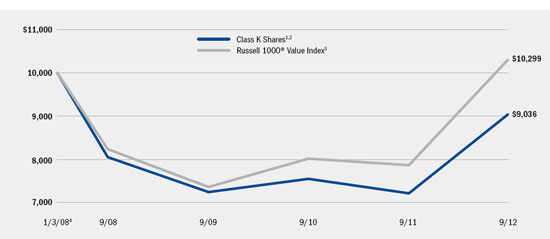
• | For the 12-month period ended September 30, 2012, the Fund, through its investment in Master Large Cap Value Portfolio (the “Portfolio”), generated a positive double-digit return, but underperformed its benchmark, the Russell 1000® Value Index. |
| |
What factors influenced performance? |
|
• | The Portfolio’s positioning within materials was the leading contributor to the Fund’s positive performance during the period. Specifically, the Portfolio was overweight in CF Industries Holdings, Inc., a key fertilizer holding, which experienced soaring profit margins due to lower input costs (i.e., natural gas) coupled with increasing demand and rising prices for its nitrogen-based crop nutrients. Portfolio holdings of select commodity chemical producers also benefited from lower natural gas prices during the period. An overall sector underweight in utilities also proved beneficial, especially with respect to traditional regulated utilities. Utilities trailed other sectors over the period as investors moved out of the defensive group to take advantage of the broader market turnaround. |
| |
• | The largest detractor from performance relative to the benchmark index was stock selection in the consumer discretionary sector, with underperformance concentrated in education services providers and consumer electronics retailers. Ongoing weakness in new student enrollments hampered the results of education services providers, as changes to company business models in response to regulatory pressures drove increased competition for higher quality students. The Portfolio’s holdings in consumer electronics retailers lagged on product cycle weakness and competitive pressures. Core business segments such as televisions and gaming are in secular decline, while at the same time, big-ticket purchases are increasingly moving online. This toxic combination has hurt pricing and margins for companies in the industry. Elsewhere, an underweight allocation to the financials sector hurt relative returns, especially in commercial banks. The sector surged during the reporting period as investor confidence improved, spurring demand for higher-risk investments. In addition, the Portfolio was overexposed to select life insurers that struggled amid the sharp declines in interest rates and concerns about underwriting quality. Stock selection in telecommunication services also had a negative impact on relative returns as the Portfolio preferred wireless holdings, which underperformed over the period amid continued competitive pressures, especially within the prepaid space. |
| |
Describe recent portfolio activity. |
| |
• | During the 12-month period, the Portfolio significantly increased exposure to the financials and energy sectors, while also adding to industrials. The Portfolio reduced its weightings in information technology, health care, materials and consumer staples. |
| |
Describe portfolio positioning at period end. |
| |
• | Portfolio management continues to believe equities offer good value, especially relative to bonds. Company margins remain high in an environment marked by slow economic growth. Going forward, the companies best able to differentiate themselves will likely have the following characteristics: strong free cash flow, the ability to sustain or even improve their margins, and/or the ability to grow their business. Portfolio management does not believe any one group or sector has a monopoly on these characteristics and, as such, is looking across the market to identify stock-specific investments to emphasize the view within the portfolio. Relative to the Russell 1000® Value Index, the Portfolio ended the period with its largest sector overweights in health care and consumer discretionary, and its most significant underweights in utilities and consumer staples. |
| |
| The views expressed reflect the opinions of BlackRock as of the date of this report and are subject to change based on changes in market, economic or other conditions. These views are not intended to be a forecast of future events and are no guarantee of future results. |
| | |
| | |
8 | BLACKROCK LARGE CAP SERIES FUNDS, INC. | SEPTEMBER 30, 2012 |
|
|
BlackRock Large Cap Value Retirement Portfolio |
|
Total Return Based on a $10,000 Investment |
| | |
| | 
|
| | |
| 1 | Assuming transaction costs and other operating expenses, including administration fees, if any. |
| | |
| 2 | The Fund invests all of its assets in the Portfolio, a series of Master Large Cap Series LLC. The Portfolio invests at least 80% of its assets in equity securities of large cap companies located in the United States that the investment advisor selects from among those that are, at the time of purchase, included in the Russell 1000® Value Index. |
| | |
| 3 | This unmanaged broad-based index is a subset of the Russell 1000® Index consisting of those Russell 1000® securities with lower price/book ratios and lower forecasted growth values. |
| | |
| 4 | Commencement of operations. |
|
Performance Summary for the Period Ended September 30, 2012 |
| | | | | | | | | | |
| | 6-Month
Total Returns | | Average Annual Total Returns5 | |
| | | 1 Year | | Since Inception6 | |
Class K | | (0.99 | )% | | 25.23 | % | | (2.11 | )% | |
Russell 1000® Value Index | | 4.16 | | | 30.92 | | | 0.62 | | |
| | |
| 5 | See “About Fund Performance” on page 10 for a detailed description of the share class, including any related sales charges and fees. |
| | |
| 6 | The Fund commenced operations on January 3, 2008.
Past performance is not indicative of future results. |
| | | | | | | | | | | | | | | | | | | | | | |
| | Actual | | Hypothetical8 | | | | |
| | Beginning
Account Value
April 1, 2012 | | Ending
Account Value
September 30, 2012 | | Expenses Paid
During the Period7 | | Beginning
Account Value
April 1, 2012 | | Ending
Account Value
September 30, 2012 | | Expenses Paid
During the Period7 | | Annualized
Expense Ratio | |
Class K | | | $1,000.00 | | | $990.10 | | | $2.64 | | | $1,000.00 | | | $1,022.30 | | | $2.68 | | | 0.53% | |
| | |
| 7 | Expenses are equal to the Fund’s annualized expense ratio, multiplied by the average account value over the period, multiplied by 183/366 (to reflect the one-half year period shown). Because the Fund invests significantly in the Portfolio, the expense example reflects the net expenses of both the Fund and the Portfolio in which it invests. |
| | |
| 8 | Hypothetical 5% annual return before expenses is calculated by pro rating the number of days in the most recent fiscal half year divided by 366.
See “Disclosure of Expenses” on page 10 for further information on how expenses were calculated. |
| | | |
| | | |
| BLACKROCK LARGE CAP SERIES FUNDS, INC. | SEPTEMBER 30, 2012 | 9 |
| |
| |
About Fund Performance | BlackRock Large Cap Series Funds, Inc. |
| |
• | Class K Shares are not subject to any sales charge. These shares bear no ongoing distribution or service fees and are available only to eligible investors. |
| |
| Performance information reflects past performance and does not guarantee future results. Current performance may be lower or higher than the performance data quoted. Refer to www.blackrock.com/funds to obtain performance data current to the most recent month end. Performance results do not reflect the deduction of taxes that a shareholder would pay on fund distributions or the redemption of fund shares. Figures shown in each of the performance tables on the previous pages assume reinvestment of all dividends and capital gain distributions, if any, at net asset value (“NAV”) on the ex-dividend date. Investment return and principal value of shares will fluctuate so that shares, when redeemed, may be worth more or less than their original cost. The Funds’ administrator waived and/or reimbursed a portion of each of the Fund’s expenses. Without such waiver and/or reimbursement, the Funds’ performance would have been lower. The administrator is under no obligation to waive and/or reimburse or continue waiving and/or reimbursing its fees. |
Shareholders of these Funds may incur the following charges: (a) expenses related to transactions, including sales charges and exchange fees; and (b) operating expenses, including administration fees, service and distribution fees, including 12b-1 fees, and other Fund expenses. The expense examples shown on the previous pages (which are based on a hypothetical investment of $1,000 invested on April 1, 2012 and held through September 30, 2012) are intended to assist shareholders both in calculating expenses based on an investment in each Fund and in comparing these expenses with similar costs of investing in other mutual funds.
The expense examples provide information about actual account values and actual expenses. In order to estimate the expenses a shareholder paid during the period covered by this report, shareholders can divide their account value by $1,000 and then multiply the result by the number corresponding to their Fund under the heading entitled “Expenses Paid During the Period.”
The expense examples also provide information about hypothetical account values and hypothetical expenses based on a Fund’s actual expense ratio and an assumed rate of return of 5% per year before expenses. In order to assist shareholders in comparing the ongoing expenses of investing in these Funds and other funds, compare the 5% hypothetical examples with the 5% hypothetical examples that appear in other funds’ shareholder reports.
The expenses shown in the expense examples are intended to highlight shareholders’ ongoing costs only and do not reflect any transactional expenses, such as sales charges or exchange fees, if any. Therefore, the hypothetical examples are useful in comparing ongoing expenses only, and will not help shareholders determine the relative total expenses of owning different funds. If these transactional expenses were included, shareholder expenses would have been higher.
|
|
Derivative Financial Instruments |
The Portfolios may invest in various derivative financial instruments, including foreign currency exchange contracts, as specified in Note 2 of the Portfolios’ Notes to Financial Statements, which may constitute forms of economic leverage. Such derivative financial instruments are used to obtain exposure to a market without owning or taking physical custody of securities or to hedge market and foreign currency exchange rate risks. Derivative financial instruments involve risks, including the imperfect correlation between the value of a derivative financial instrument and the underlying asset, possible default of the counterparty to the transaction or illiquidity of the derivative financial instrument. The Portfolios’ ability to use a derivative financial instrument successfully depends on the investment advisor’s ability to predict pertinent market movements accurately, which cannot be assured. The use of derivative financial instruments may result in losses greater than if they had not been used, may require the Portfolios to sell or purchase portfolio investments at inopportune times or for distressed values, may limit the amount of appreciation the Portfolios can realize on an investment, may result in lower dividends paid to shareholders or may cause the Portfolios to hold an investment that it might otherwise sell. The Portfolios’ investments in these instruments are discussed in detail in the Portfolios’ Notes to Financial Statements.
| | | |
| | | |
10 | BLACKROCK LARGE CAP SERIES FUNDS, INC. | SEPTEMBER 30, 2012 | |
| |
| |
Statements of Assets and Liabilities | BlackRock Large Cap Series Funds, Inc. |
| | | | | | | | | | |
September 30, 2012 | | BlackRock
Large Cap Core
Retirement
Portfolio | | BlackRock
Large Cap Growth
Retirement
Portfolio | | BlackRock
Large Cap Value
Retirement
Portfolio | |
Assets | | | | | | | | | | |
Investments at value — Master Large Cap Core Portfolio, Master Large Cap Growth Portfolio and Master Large Cap Value Portfolio (each a “Portfolio”), respectively1 | | $ | 81,240,853 | | $ | 2,219,564 | | $ | 103,677,670 | |
Capital shares sold receivable | | | 126,997 | | | — | | | 140,855 | |
Receivable from administrator | | | 79 | | | 49,748 | | | 3,021 | |
Total assets | | | 81,367,929 | | | 2,269,312 | | | 103,821,546 | |
| | | | | | | | | | |
Liabilities | | | | | | | | | | |
Capital shares redeemed payable | | | 7,556 | | | — | | | 87,361 | |
Officer’s fees payable | | | 22 | | | 47 | | | 37 | |
Contributions payable to the Portfolio | | | 119,441 | | | — | | | 53,494 | |
Other accrued expenses payable | | | 19,515 | | | 26,522 | | | 44,266 | |
Total liabilities | | | 146,534 | | | 26,569 | | | 185,158 | |
Net Assets | | $ | 81,221,395 | | $ | 2,242,743 | | $ | 103,636,388 | |
| | | | | | | | | | |
Net Assets Consist of | | | | | | | | | | |
Paid-in capital2 | | $ | 90,751,048 | | $ | (267,918 | ) | $ | 97,418,183 | |
Undistributed net investment income | | | 1,026,025 | | | 238,710 | | | 1,168,442 | |
Accumulated net realized gain (loss) allocated from the Portfolio | | | (34,975,086 | ) | | 648,394 | | | 1,747,750 | |
Net unrealized appreciation/depreciation allocated from the Portfolio | | | 24,419,408 | | | 1,623,557 | | | 3,302,013 | |
Net Assets | | $ | 81,221,395 | | $ | 2,242,743 | | $ | 103,636,388 | |
Class K — Net asset value per common share, 200 million shares authorized, $0.10 par value | | $ | 12.51 | | $ | 12.78 | | $ | 15.93 | |
| | | | | | | | | | |
1 Investments at cost | | $ | 56,821,445 | | $ | 596,007 | | $ | 100,375,657 | |
2 Shares outstanding | | | 6,492,606 | | | 175,512 | | | 6,504,673 | |
| | | |
See Notes to Financial Statements. |
| | | |
| BLACKROCK LARGE CAP SERIES FUNDS, INC. | SEPTEMBER 30, 2012 | 11 |
| |
| |
Statements of Operations | BlackRock Large Cap Series Funds, Inc. |
| | | | | | | | | | |
Year Ended September 30, 2012 | | BlackRock
Large Cap Core
Retirement
Portfolio | | BlackRock
Large Cap Growth
Retirement
Portfolio | | BlackRock
Large Cap Value
Retirement
Portfolio | |
Investment Income | | | | | | | | | | |
Net investment income allocated from the Portfolio: | | | | | | | | | | |
Dividends — unaffiliated | | $ | 2,524,457 | | $ | 1,142,562 | | $ | 2,886,760 | |
Foreign taxes withheld | | | (32,159 | ) | | (23,120 | ) | | (38,742 | ) |
Securities lending — affiliated | | | 101,436 | | | 34,777 | | | 143,456 | |
Dividends — affiliated | | | 691 | | | 167 | | | 1,058 | |
Expenses | | | (597,217 | ) | | (312,427 | ) | | (722,205 | ) |
Fees waived | | | 336 | | | 92 | | | — | |
Total income | | | 1,997,544 | | | 842,051 | | | 2,270,327 | |
| | | | | | | | | | |
Fund Expenses | | | | | | | | | | |
Transfer agent | | | 76,587 | | | 46,000 | | | 127,001 | |
Professional | | | 23,212 | | | 22,619 | | | 21,593 | |
Registration | | | 9,234 | | | 18,492 | | | 8,301 | |
Printing | | | 1,035 | | | 154 | | | 867 | |
Officer | | | 64 | | | 63 | | | 60 | |
Miscellaneous | | | 6,418 | | | 6,332 | | | 6,446 | |
Total expenses | | | 116,550 | | | 93,660 | | | 164,268 | |
Less fees reimbursed by administrator | | | (11,271 | ) | | (34,196 | ) | | (63,932 | ) |
Total expenses after reimbursement | | | 105,279 | | | 59,464 | | | 100,336 | |
Net investment income | | | 1,892,265 | | | 782,587 | | | 2,169,991 | |
| | | | | | | | | | |
Realized and Unrealized Gain (Loss) | | | | | | | | | | |
Net realized gain from: | | | | | | | | | | |
Investments | | | — | | | 17,918,817 | | | — | |
Investments and foreign currency transactions allocated from the Portfolio | | | 9,881,530 | | | 3,952,687 | | | 10,293,461 | |
| | | 9,881,530 | | | 21,871,504 | | | 10,293,461 | |
Net change in unrealized appreciation/depreciation on: | | | | | | | | | | |
Investments | | | — | | | (17,918,817 | ) | | — | |
Investments allocated from the Portfolio | | | 28,239,687 | | | 25,283,037 | | | 24,642,875 | |
| | | 28,239,687 | | | 7,364,220 | | | 24,642,875 | |
Total realized and unrealized gain | | | 38,121,217 | | | 29,235,724 | | | 34,936,336 | |
Net Increase in Net Assets Resulting from Operations | | $ | 40,013,482 | | $ | 30,018,311 | | $ | 37,106,327 | |
| | | |
See Notes to Financial Statements. |
| | | |
12 | BLACKROCK LARGE CAP SERIES FUNDS, INC. | SEPTEMBER 30, 2012 | |
| |
| |
Statements of Changes in Net Assets | BlackRock Large Cap Series Funds, Inc. |
| | | | | | | | | | | | | |
| | BlackRock
Large Cap Core
Retirement
Portfolio | | BlackRock
Large Cap Growth
Retirement
Portfolio | |
| | Year Ended
September 30, | | Year Ended
September 30, | |
Increase (Decrease) in Net Assets: | | 2012 | | 2011 | | 2012 | | 2011 | |
Operations | | | | | | | | | | | | | |
Net investment income | | $ | 1,892,265 | | $ | 1,289,709 | | $ | 782,587 | | $ | 829,462 | |
Net realized gain | | | 9,881,530 | | | 6,820,142 | | | 21,871,504 | | | 9,241,396 | |
Net change in unrealized appreciation/depreciation | | | 28,239,687 | | | (14,449,811 | | | 7,364,220 | | | (12,013,168 | ) |
Net increase (decrease) in net assets resulting from operations | | | 40,013,482 | | | (6,339,960 | | | 30,018,311 | | | (1,942,310 | ) |
| | | | | | | | | | | | | |
Dividends to Shareholders From | | | | | | | | | | | | | |
Net investment income | | | (1,597,998 | ) | | (1,200,010 | | | (950,003 | ) | | (750,002 | ) |
| | | | | | | | | | | | | |
Capital Share Transactions | | | | | | | | | | | | | |
Net increase (decrease) in net assets derived from capital share transactions | | | (86,685,132 | ) | | 23,789,672 | | | (126,994,986 | ) | | 16,200,136 | |
| | | | | | | | | | | | | |
Net Assets | | | | | | | | | | | | | |
Total increase (decrease) in net assets | | | (48,269,648 | ) | | 16,249,702 | | | (97,926,678 | ) | | 13,507,824 | |
Beginning of year | | | 129,491,043 | | | 113,241,341 | | | 100,169,421 | | | 86,661,597 | |
End of year | | $ | 81,221,395 | | $ | 129,491,043 | | $ | 2,242,743 | | $ | 100,169,421 | |
Undistributed net investment income | | $ | 1,026,025 | | $ | 732,750 | | $ | 238,710 | | $ | 406,145 | |
| | | | | | | |
| | BlackRock
Large Cap Value
Retirement
Portfolio | |
| | Year Ended
September 30, | |
Increase (Decrease) in Net Assets: | | 2012 | | 2011 | |
Operations | | | | | | | |
Net investment income | | $ | 2,169,991 | | $ | 2,029,580 | |
Net realized gain | | | 10,293,461 | | | 14,573,605 | |
Net change in unrealized appreciation/depreciation | | | 24,642,875 | | | (20,336,791 | ) |
Net increase (decrease) in net assets resulting from operations | | | 37,106,327 | | | (3,733,606 | ) |
| | | | | | | |
Dividends to Shareholders From | | | | | | | |
Net investment income | | | (2,300,002 | ) | | (2,100,008 | ) |
| | | | | | | |
Capital Share Transactions | | | | | | | |
Net decrease in net assets derived from capital share transactions | | | (76,133,782 | ) | | (16,085,289 | ) |
| | | | | | | |
Net Assets | | | | | | | |
Total decrease in net assets | | | (41,327,457 | ) | | (21,918,903 | ) |
Beginning of year | | | 144,963,845 | | | 166,882,748 | |
End of year | | $ | 103,636,388 | | $ | 144,963,845 | |
Undistributed net investment income | | $ | 1,168,442 | | $ | 1,299,288 | |
| | | |
See Notes to Financial Statements. |
| | | |
| BLACKROCK LARGE CAP SERIES FUNDS, INC. | SEPTEMBER 30, 2012 | 13 |
| |
| |
Financial Highlights | BlackRock Large Cap Series Funds, Inc. |
| | | | | | | | | | | | | | | | |
| | BlackRock Large Cap Core Retirement Portfolio | |
| | Class K | |
| | | | Period
November 1,
2008 to
September 30,
2009 | | Period
January 3,
20081 to
October 31,
2008 | |
| | | | | |
| | | | | |
| | Year Ended September 30, | | | |
| | 2012 | | 2011 | | 2010 | | | |
Per Share Operating Performance | | | | | | | | | | | | | | | | |
Net asset value, beginning of period | | $ | 9.78 | | $ | 10.06 | | $ | 9.61 | | $ | 8.64 | | $ | 13.25 | |
Net investment income2 | | | 0.18 | | | 0.11 | | | 0.09 | | | 0.11 | | | 0.07 | |
Net realized and unrealized gain (loss) | | | 2.69 | | | (0.28 | ) | | 0.49 | | | 0.96 | | | (4.68 | ) |
Net increase (decrease) from investment operations | | | 2.87 | | | (0.17 | ) | | 0.58 | | | 1.07 | | | (4.61 | ) |
Dividends from net investment income | | | (0.14 | ) | | (0.11 | ) | | (0.13 | ) | | (0.10 | ) | | — | |
Net asset value, end of period | | $ | 12.51 | | $ | 9.78 | | $ | 10.06 | | $ | 9.61 | | $ | 8.64 | |
| | | | | | | | | | | | | | | | |
Total Investment Return3 | | | | | | | | | | | | | | | | |
Based on net asset value | | | 29.67 | % | | (1.81 | )% | | 6.01 | % | | 12.55 | %4,5 | | (34.79 | )%4 |
| | | | | | | | | | | | | | | | |
Ratios to Average Net Assets6 | | | | | | | | | | | | | | | | |
Total expenses | | | 0.60 | %7 | | 0.67 | %7 | | 0.68 | % | | 0.73 | %8 | | 0.71 | %8 |
Total expenses after reimbursement | | | 0.59 | %7 | | 0.67 | %7 | | 0.67 | % | | 0.66 | %8 | | 0.62 | %8 |
Net investment income | | | 1.59 | %7 | | 0.96 | %7 | | 0.93 | % | | 1.39 | %8 | | 0.76 | %8 |
| | | | | | | | | | | | | | | | |
Supplemental Data | | | | | | | | | | | | | | | | |
Net assets, end of period (000) | | $ | 81,221 | | $ | 129,491 | | $ | 113,241 | | $ | 109,188 | | $ | 105,224 | |
Portfolio turnover of the Portfolio | | | 128 | % | | 129 | % | | 173 | % | | 168 | % | | 109 | % |
| | |
| 1 | Commencement of operations.
|
| 2 | Based on average shares outstanding.
|
| 3 | Where applicable, total investment returns include the reinvestment of dividends and distributions.
|
| 4 | Aggregate total investment return.
|
| 5 | Includes proceeds received from a settlement of litigation, through its investment in the Portfolio, which impacted the Fund’s total investment return. Not including these proceeds, the total investment return would have been 12.08%.
|
| 6 | Includes the Fund’s share of the Portfolio’s allocated expenses and/or net investment income.
|
| 7 | Includes the Fund’s share of the Portfolio’s allocated fees waived of less than 0.01%.
|
| 8 | Annualized. |
| | | |
See Notes to Financial Statements. |
|
14 | BLACKROCK LARGE CAP SERIES FUNDS, INC. | SEPTEMBER 30, 2012 | |
| |
| |
Financial Highlights (continued) | BlackRock Large Cap Series Funds, Inc. |
| | | | | | | | | | | | | | | | |
| | BlackRock Large Cap Growth Retirement Portfolio | |
| | Class K | |
| | | | | | | | | | | Period
November 1,
2008 to
September 30,
2009 | | Period
January 3,
20081 to
October 31,
2008 | |
| | | | | | | | | | | | |
| | | | | | | | | | | | |
| | Year Ended September 30, | | | |
| | 2012 | | 2011 | | 2010 | | | |
Per Share Operating Performance | | | | | | | | | | | | | | | | |
Net asset value, beginning of period | | $ | 9.53 | | $ | 9.54 | | $ | 8.93 | | $ | 7.45 | | $ | 11.20 | |
Net investment income2 | | | 0.15 | | | 0.08 | | | 0.06 | | | 0.05 | | | 0.02 | |
Net realized and unrealized gain (loss) | | | 3.19 | | | (0.01 | ) | | 0.61 | | | 1.48 | | | (3.77 | ) |
Net increase (decrease) from investment operations | | | 3.34 | | | 0.07 | | | 0.67 | | | 1.53 | | | (3.75 | ) |
Dividends from net investment income | | | (0.09 | ) | | (0.08 | ) | | (0.06 | ) | | (0.05 | ) | | — | |
Net asset value, end of period | | $ | 12.78 | | $ | 9.53 | | $ | 9.54 | | $ | 8.93 | | $ | 7.45 | |
| | | | | | | | | | | | | | | | |
Total Investment Return3 | | | | | | | | | | | | | | | | |
Based on net asset value | | | 35.29 | % | | 0.68 | % | | 7.46 | % | | 20.66 | %4,5 | | (33.48 | )%4 |
| | | | | | | | | | | | | | | | |
Ratios to Average Net Assets6 | | | | | | | | | | | | | | | | |
Total expenses | | | 0.70 | %7 | | 0.71 | %7 | | 0.79 | % | | 0.88 | %8 | | 0.81 | %8 |
Total expenses after reimbursement | | | 0.64 | %7 | | 0.67 | %7 | | 0.67 | % | | 0.66 | %8 | | 0.65 | %8 |
Net investment income | | | 1.35 | %7 | | 0.77 | %7 | | 0.62 | % | | 0.73 | %8 | | 0.30 | %8 |
| | | | | | | | | | | | | | | | |
Supplemental Data | | | | | | | | | | | | | | | | |
Net assets, end of period (000) | | $ | 2,243 | | $ | 100,169 | | $ | 86,662 | | $ | 83,098 | | $ | 80,882 | |
Portfolio turnover of the Portfolio | | | 132 | % | | 169 | % | | 232 | % | | 242 | % | | 144 | % |
| | |
| 1 | Commencement of operations.
|
| 2 | Based on average shares outstanding.
|
| 3 | Where applicable, total investment returns include the reinvestment of dividends and distributions.
|
| 4 | Aggregate total investment return.
|
| 5 | Includes proceeds received from a settlement of litigation, through its investment in the Portfolio, which impacted the Fund’s total investment return. Not including these proceeds, the total investment return would have been 20.25%.
|
| 6 | Includes the Fund’s share of the Portfolio’s allocated expenses and/or net investment income.
|
| 7 | Includes the Fund’s share of the Portfolio’s allocated fees waived of less than 0.01%.
|
| 8 | Annualized. |
| | | |
See Notes to Financial Statements. |
| | | |
| BLACKROCK LARGE CAP SERIES FUNDS, INC. | SEPTEMBER 30, 2012 | 15 |
| |
| |
Financial Highlights (concluded) | BlackRock Large Cap Series Funds, Inc. |
| | | | | | | | | | | | | | | | |
| | BlackRock Large Cap Value Retirement Portfolio | |
| | Class K | |
| | | | Period
November 1,
2008 to
September 30,
2009 | | Period
January 3,
20081 to
October 31,
2008 | |
| | | | | |
| | | | | |
| | Year Ended September 30, | | | |
| | 2012 | | 2011 | | 2010 | | | |
Per Share Operating Performance | | | | | | | | | | | | | | | | |
Net asset value, beginning of period | | $ | 12.91 | | $ | 13.67 | | $ | 13.28 | | $ | 12.33 | | $ | 18.54 | |
Net investment income2 | | | 0.24 | | | 0.17 | | | 0.17 | | | 0.18 | | | 0.13 | |
Net realized and unrealized gain (loss) | | | 2.99 | | | (0.76 | ) | | 0.39 | | | 0.91 | | | (6.34 | ) |
Net increase (decrease) from investment operations | | | 3.23 | | | (0.59 | ) | | 0.56 | | | 1.09 | | | (6.21 | ) |
Dividends from net investment income | | | (0.21 | ) | | (0.17 | ) | | (0.17 | ) | | (0.14 | ) | | — | |
Net asset value, end of period | | $ | 15.93 | | $ | 12.91 | | $ | 13.67 | | $ | 13.28 | | $ | 12.33 | |
| | | | | | | | | | | | | | | | |
Total Investment Return3 | | | | | | | | | | | | | | | | |
Based on net asset value | | | 25.23 | % | | (4.44 | )% | | 4.23 | % | | 8.93 | %4,5 | | (33.50 | )%4 |
| | | | | | | | | | | | | | | | |
Ratios to Average Net Assets6 | | | | | | | | | | | | | | | | |
Total expenses | | | 0.67 | % | | 0.70 | % | | 0.72 | % | | 0.77 | %7 | | 0.78 | %7 |
Total expenses after reimbursement | | | 0.62 | % | | 0.67 | % | | 0.67 | % | | 0.66 | %7 | | 0.63 | %7 |
Net investment income | | | 1.63 | % | | 1.13 | % | | 1.21 | % | | 1.74 | %7 | | 1.03 | %7 |
| | | | | | | | | | | | | | | | |
Supplemental Data | | | | | | | | | | | | | | | | |
Net assets, end of period (000) | | $ | 103,636 | | $ | 144,964 | | $ | 166,883 | | $ | 132,560 | | $ | 128,159 | |
Portfolio turnover of the Portfolio | | | 147 | % | | 156 | % | | 183 | % | | 151 | % | | 108 | % |
| | |
| 1 | Commencement of operations.
|
| 2 | Based on average shares outstanding.
|
| 3 | Where applicable, total investment returns include the reinvestment of dividends and distributions.
|
| 4 | Aggregate total investment return.
|
| 5 | Includes proceeds received from a settlement of litigation, through its investment in the Portfolio, which impacted the Fund’s total investment return. Not including these proceeds, the total investment return would have been 8.52%.
|
| 6 | Includes the Fund’s share of the Portfolio’s allocated expenses and/or net investment income.
|
| 7 | Annualized.
|
| | | |
See Notes to Financial Statements. |
| | | |
16 | BLACKROCK LARGE CAP SERIES FUNDS, INC. | SEPTEMBER 30, 2012 | |
| |
| |
Notes to Financial Statements | BlackRock Large Cap Series Funds, Inc. |
1. Organization and Significant Accounting Policies:
BlackRock Large Cap Core Retirement Portfolio, BlackRock Large Cap Growth Retirement Portfolio and BlackRock Large Cap Value Retirement Portfolio (collectively the “Funds” or individually a “Fund”) constitute three series of BlackRock Large Cap Series Funds, Inc. (the “Corporation”), which is registered under the Investment Company Act of 1940, as amended (the “1940 Act”), as an open-end management investment company. The Corporation is organized as a Maryland corporation. Each Fund is classified as diversified. Each Fund seeks to achieve its investment objective by investing all of its assets in Master Large Cap Core Portfolio, Master Large Cap Growth Portfolio and Master Large Cap Value Portfolio (collectively the “Portfolios” or individually a “Portfolio”), respectively, constituting Master Large Cap Series LLC (the “Master LLC”), an affiliate of the Funds, each of which has the same investment objective and strategies as the corresponding Fund. The value of a Fund’s investment in the applicable Portfolio reflects the Fund’s proportionate interest in the net assets of such Portfolio. As of September 30, 2012, the percentages of Master Large Cap Core Portfolio, Master Large Cap Growth Portfolio and Master Large Cap Value Portfolio owned by BlackRock Large Cap Core Retirement Portfolio, BlackRock Large Cap Growth Retirement Portfolio and BlackRock Large Cap Value Retirement Portfolio were 3.5%, 0.2% and 9.7%, respectively. The performance of a Fund is directly affected by the performance of the applicable Portfolio. The financial statements of the Portfolios, including the Schedules of Investments, are included elsewhere in this report and should be read in conjunction with the Funds’ financial statements. The Funds’ financial statements are prepared in conformity with accounting principles generally accepted in the United States of America (“US GAAP”), which may require management to make estimates and assumptions that affect the reported amounts of assets and liabilities in the financial statements and the reported amounts of increases and decreases in net assets from operations during the reported period. Actual results could differ from those estimates.
The following is a summary of significant accounting policies followed by the Funds:
Valuation: US GAAP defines fair value as the price the Funds would receive to sell an asset or pay to transfer a liability in an orderly transaction between market participants at the measurement date. Each Fund records its investment in the corresponding Portfolio at fair value based on the Fund’s proportionate interest in the net assets of the corresponding Portfolio. Valuation of securities held by a Portfolio is discussed in Note 1 of the Master LLC’s Notes to Financial Statements, which are included elsewhere in this report.
Investment Transactions and Investment Income: For financial reporting purposes, contributions to and withdrawals from the corresponding Portfolio are accounted for on a trade date basis. Each Fund records daily its proportionate share of the corresponding Portfolio’s income, expenses and realized and unrealized gains and losses. In addition, each Fund accrues its own expenses.
During the year ended September 30, 2012, there was a large shareholder redemption in BlackRock Large Cap Growth Retirement Portfolio. Accordingly, a portion of the accumulated unrealized gains allocated from Master Large Cap Growth Portfolio was realized by BlackRock Large Cap Growth Retirement Portfolio. The gain is shown as net realized gain from investments on the Statements of Operations.
Dividends and Distributions: Dividends and distributions paid by the Funds are recorded on the ex-dividend dates. The portion of distributions that exceeds a Fund’s current and accumulated earnings and profits, which are measured on a tax basis, will constitute a nontaxable return of capital. Distributions in excess of a Fund’s taxable income and net capital gains, but not in excess of a Fund’s earnings and profits, will be taxable to shareholders as ordinary income and will not constitute a nontaxable return of capital. Capital losses carried forward from years beginning before 2011 do not reduce earnings and profits, even if such carried forward losses offset current year realized gains. The character and timing of dividends and distributions are determined in accordance with federal income tax regulations, which may differ from US GAAP.
Income Taxes: It is each Fund’s policy to comply with the requirements of the Internal Revenue Code of 1986, as amended, applicable to regulated investment companies (“RIC”) and to distribute substantially all of its taxable income to its shareholders. Therefore, no federal income tax provision is required.
Each Fund files US federal and various state and local tax returns. No income tax returns are currently under examination. The statute of limitations on each Fund’s US federal tax returns remains open for the three years ended September 30, 2012 and the period ended September 30, 2009. The statutes of limitations on each Fund’s state and local tax returns may remain open for an additional year depending upon the jurisdiction. Management does not believe there are any uncertain tax positions that require recognition of a tax liability.
Other: Expenses directly related to a Fund are charged to that Fund. Other operating expenses shared by several funds are pro rated among those funds on the basis of relative net assets or other appropriate methods.
2. Administration Agreement and Other Transactions with Affiliates:
The PNC Financial Services Group, Inc. (“PNC”) is the largest stockholder and an affiliate, for 1940 Act purposes, of BlackRock, Inc. (“BlackRock”).
The Corporation, on behalf of each Fund, entered into an Administration Agreement with BlackRock Advisors, LLC (the “Administrator”), an indirect, wholly owned subsidiary of BlackRock, to provide administrative services (other than investment advice and related portfolio activities).
The Administrator does not receive an administration fee. The Administrator has contractually agreed to waive and/or reimburse fees or expenses, excluding interest expense, dividend expense, acquired fund fees and expenses and certain other fund expenses, which constitute extraordinary expenses not incurred in the ordinary course of the Funds’ business, in order to limit expenses. The expense limitation of each Fund is 0.67% of the percentage of average daily net assets of such Fund. The Administrator has agreed not to reduce or discontinue this contractual waiver or reimbursement prior to February 1, 2013 unless approved by the Board, including a
| | | |
| | | |
| BLACKROCK LARGE CAP SERIES FUNDS, INC. | SEPTEMBER 30, 2012 | 17 |
| |
| |
Notes to Financial Statements (continued) | BlackRock Large Cap Series Funds, Inc. |
majority of the Independent Directors. These amounts are shown as fees reimbursed by administrator in the Statements of Operations.
The Administrator maintains a call center, which is responsible for providing certain shareholder services to the Funds, such as responding to shareholder inquiries and processing transactions based upon instructions from shareholders with respect to the subscription and redemption of Fund shares. For the year ended September 30, 2012, each Fund reimbursed the Administrator the following amounts for costs incurred in running the call center, which are included in transfer agent in the Statements of Operations:
| | | | |
BlackRock Large Cap Core Retirement Portfolio | | $ | 163 | |
BlackRock Large Cap Growth Retirement Portfolio | | $ | 143 | |
BlackRock Large Cap Value Retirement Portfolio | | $ | 208 | |
Certain officers and/or directors of the Corporation are officers and/or directors of BlackRock or its affiliates. The Funds reimburse the Administrator for compensation paid to the Corporation’s Chief Compliance Officer.
3. Income Tax Information:
US GAAP requires that certain components of net assets be adjusted to reflect permanent differences between financial and tax reporting. These reclassifications have no effect on net assets or net asset values per share. The following permanent differences as of September 30, 2012 attributable to foreign currency transactions, the sale of contributed securities and the use of equalization were reclassified to the following accounts:
| | | | | | | | | | |
| | BlackRock
Large Cap
Core
Retirement
Portfolio | | BlackRock
Large Cap
Growth
Retirement
Portfolio | | BlackRock
Large Cap
Value
Retirement
Portfolio | |
Paid-in capital | | $ | 9,233 | | $ | 1,907,705 | | | — | |
Undistributed net
investment income | | $ | (992 | ) | $ | (19 | ) | $ | (835 | ) |
Accumulated net
realized gain (loss) allocated
from the Portfolio | | $ | (8,241 | ) | $ | (1,907,686 | ) | $ | 835 | |
The tax character of distributions paid during the fiscal years ended September 30, 2012 and September 30, 2011 was as follows:
| | | | | | | | | | | | | |
| | | | BlackRock
Large Cap
Core
Retirement
Portfolio | | BlackRock
Large Cap
Growth
Retirement
Portfolio | | BlackRock
Large Cap
Value
Retirement
Portfolio | |
Ordinary income | | | 9/30/2012 | | $ | 1,597,998 | | $ | 950,003 | | $ | 2,300,002 | |
| | | 9/30/2011 | | | 1,200,010 | | | 750,002 | | | 2,100,008 | |
Long-term
capital gains1 | | | 9/30/2012 | | | — | | | 1,907,705 | | | — | |
Total | | | 9/30/2012 | | $ | 1,597,998 | | $ | 2,857,708 | | $ | 2,300,002 | |
| | | 9/30/2011 | | $ | 1,200,010 | | $ | 750,002 | | $ | 2,100,008 | |
| | |
| 1 | Distribution amount includes a portion of the proceeds from redeemed shares. |
As of September 30, 2012, the tax components of accumulated net gains (losses) were as follows:
| | | | | | | | | | |
| | BlackRock
Large Cap
Core
Retirement
Portfolio | | BlackRock
Large Cap
Growth
Retirement
Portfolio | | BlackRock
Large Cap
Value
Retirement
Portfolio | |
Undistributed ordinary
income | | $ | 1,026,025 | | $ | 238,710 | | $ | 1,168,442 | |
Undistributed long-term
capital gains | | | — | | | 602,522 | | | — | |
Capital loss carryforwards | | | (34,065,881 | ) | | — | | | (6,909,730 | ) |
Net unrealized gains2 | | | 23,510,203 | | | 1,669,429 | | | 11,959,493 | |
Total | | $ | (9,529,653 | ) | $ | 2,510,661 | | $ | 6,218,205 | |
| | |
| 2 | The difference between book-basis and tax-basis net unrealized gains was attributable primarily to the tax deferral of losses on wash sales, the amount of gain recognized on a distribution from a partnership and basis differences on contributed securities. |
As of September 30, 2012, the Funds had capital loss carryforwards available to offset future realized capital gains through the indicated expiration dates as follows:
| | | | | | | |
Expires September 30, | | BlackRock
Large Cap Core
Retirement
Portfolio | | BlackRock
Large Cap Value
Retirement
Portfolio | |
2016 | | $ | 9,577,005 | | | — | |
2017 | | | 24,488,876 | | $ | 6,909,730 | |
Total | | $ | 34,065,881 | | $ | 6,909,730 | |
During the year ended September 30, 2012, the Funds listed below utilized the following amounts of their respective capital loss carryforward:
| | | | |
BlackRock Large Cap Core Retirement Portfolio | | $ | 9,455,657 | |
BlackRock Large Cap Growth Retirement Portfolio | | $ | 18,344,461 | |
BlackRock Large Cap Value Retirement Portfolio | | $ | 8,796,774 | |
| | |
| | |
18 | BLACKROCK LARGE CAP SERIES FUNDS, INC. | SEPTEMBER 30, 2012 |
| |
| |
Notes to Financial Statements (concluded) | BlackRock Large Cap Series Funds, Inc. |
4. Capital Share Transactions:
Transactions in capital shares for Class K were as follows:
| | | | | | | | | | | | | |
BlackRock Large Cap Core
Retirement Portfolio | | Year Ended
September 30, 2012 | | Year Ended
September 30, 2011 | |
| Shares | | Amount | | Shares | | Amount | |
Class K | | | | | | | | | | | | | |
Shares sold | | | 8,082,849 | | $ | 90,932,022 | | | 5,752,366 | | $ | 66,509,887 | |
Shares issued to shareholders in reinvestment of dividends | | | 146,850 | | | 1,539,158 | | | 105,992 | | | 1,157,136 | |
Shares redeemed | | | (14,978,366 | ) | | (179,156,312 | ) | | (3,874,726 | ) | | (43,877,351 | ) |
Net increase (decrease) | | | (6,748,667 | ) | $ | (86,685,132 | ) | | 1,983,632 | | $ | 23,789,672 | |
| | | | | | | | | | | | | |
BlackRock Large Cap Growth
Retirement Portfolio | | | | | | | | | | | | | |
Class K | | | | | | | | | | | | | |
Shares sold | | | 2,138,394 | | $ | 24,055,829 | | | 4,007,792 | | $ | 44,093,163 | |
Shares issued to shareholders in reinvestment of dividends | | | 88,991 | | | 899,819 | | | 67,861 | | | 711,630 | |
Shares redeemed | | | (12,559,957 | ) | | (151,950,634 | ) | | (2,647,144 | ) | | (28,604,657 | ) |
Net increase (decrease) | | | (10,332,572 | ) | $ | (126,994,986 | ) | | 1,428,509 | | $ | 16,200,136 | |
| | | | | | | | | | | | | |
BlackRock Large Cap Value
Retirement Portfolio | | | | | | | | | | | | | |
Class K | | | | | | | | | | | | | |
Shares sold | | | 1,811,314 | | $ | 27,122,890 | | | 2,518,610 | | $ | 38,683,662 | |
Shares issued to shareholders in reinvestment of dividends | | | 163,003 | | | 2,254,488 | | | 140,336 | | | 2,062,642 | |
Shares redeemed | | | (6,698,808 | ) | | (105,511,160 | ) | | (3,634,075 | ) | | (56,831,593 | ) |
Net decrease | | | (4,724,491 | ) | $ | (76,133,782 | ) | | (975,129 | ) | $ | (16,085,289 | ) |
5. Subsequent Events:
Management has evaluated the impact of all subsequent events on each Fund through the date the financial statements were issued and has determined that there were no subsequent events requiring adjustment or additional disclosure in the financial statements.
| | | |
| | | |
| BLACKROCK LARGE CAP SERIES FUNDS, INC. | SEPTEMBER 30, 2012 | 19 |
| |
| |
Report of Independent Registered Public Accounting Firm | BlackRock Large Cap Series Funds, Inc. |
To the Shareholders and Board of Directors of BlackRock Large Cap Series Funds, Inc.:
We have audited the accompanying statements of assets and liabilities of BlackRock Large Cap Core Retirement Portfolio, BlackRock Large Cap Growth Retirement Portfolio and BlackRock Large Cap Value Retirement Portfolio, three of the series included in BlackRock Large Cap Series Funds, Inc. (collectively the “Funds”), as of September 30, 2012, and the related statements of operations for the year then ended, the statements of changes in net assets for each of the two years in the period then ended, and the financial highlights for each of the periods presented. These financial statements and financial highlights are the responsibility of the Funds’ management. Our responsibility is to express an opinion on these financial statements and financial highlights based on our audits.
We conducted our audits in accordance with the standards of the Public Company Accounting Oversight Board (United States). Those standards require that we plan and perform the audit to obtain reasonable assurance about whether the financial statements and financial highlights are free of material misstatement. The Funds are not required to have, nor were we engaged to perform, an audit of their internal control over financial reporting. Our audits included consideration of internal control over financial reporting as a basis for designing audit procedures that are appropriate in the circumstances, but not for the purpose of expressing an opinion on the effectiveness of the Funds’ internal control over financial reporting. Accordingly, we express no such opinion. An audit also includes examining, on a test basis, evidence supporting the amounts and disclosures in the financial statements, assessing the accounting principles used and significant estimates made by management, as well as evaluating the overall financial statement presentation. We believe that our audits provide a reasonable basis for our opinion.
In our opinion, the financial statements and financial highlights referred to above present fairly, in all material respects, the financial positions of BlackRock Large Cap Core Retirement Portfolio, BlackRock Large Cap Growth Retirement Portfolio and BlackRock Large Cap Value Retirement Portfolio, each a series of BlackRock Large Cap Series Funds, Inc., as of September 30, 2012, the results of their operations for the year then ended, the changes in their net assets for each of the two years in the period then ended, and the financial highlights for each of the periods presented, in conformity with accounting principles generally accepted in the United States of America.
Deloitte & Touche LLP
Boston, Massachusetts
November 28, 2012
|
|
Important Tax Information (Unaudited) |
The entire amount of the ordinary income distribution paid by BlackRock Large Cap Core Retirement Portfolio, BlackRock Large Cap Growth Retirement Portfolio and BlackRock Large Cap Value Retirement Portfolio of the BlackRock Large Cap Series Funds, Inc. during the fiscal year ended September 30, 2012 qualifies for the dividends received deduction for corporations and consists entirely of qualified dividend income for individuals.
| | |
| | |
20 | BLACKROCK LARGE CAP SERIES FUNDS, INC. | SEPTEMBER 30, 2012 |
| |
| |
Portfolio Information as of September 30, 2012 | Master Large Cap Series LLC |
| | | | |
Master Large Cap Core Portfolio | | Percent of
Long-Term Investments | |
Apple, Inc. | | 5 | % | |
Exxon Mobil Corp. | | 4 | | |
Google, Inc., Class A | | 4 | | |
JPMorgan Chase & Co. | | 3 | | |
Chevron Corp. | | 3 | | |
Pfizer, Inc. | | 3 | | |
Wal-Mart Stores, Inc. | | 3 | | |
Citigroup, Inc. | | 3 | | |
Comcast Corp., Class A | | 3 | | |
Microsoft Corp. | | 2 | | |
| | | | |
Master Large Cap Growth Portfolio | | Percent of
Long-Term Investments | |
Apple, Inc. | | 10 | % | |
Google, Inc., Class A | | 5 | | |
International Business Machines Corp. | | 5 | | |
Microsoft Corp. | | 4 | | |
Wal-Mart Stores, Inc. | | 4 | | |
Coca-Cola Co. | | 3 | | |
Abbott Laboratories | | 3 | | |
Philip Morris International, Inc. | | 3 | | |
3M Co. | | 3 | | |
Express Scripts Holding Co. | | 3 | | |
| | | | |
Master Large Cap Value Portfolio | | Percent of
Long-Term Investments | |
Exxon Mobil Corp. | | 8 | % | |
Chevron Corp. | | 5 | | |
Pfizer, Inc. | | 4 | | |
JPMorgan Chase & Co. | | 4 | | |
Citigroup, Inc. | | 3 | | |
Merck & Co., Inc. | | 3 | | |
Comcast Corp., Class A | | 3 | | |
US Bancorp | | 3 | | |
Walmart Stores, Inc. | | 2 | | |
News Corp., Class A | | 2 | | |
| | | | |
Master Large Cap Core Portfolio | | Percent of
Long-Term Investments | |
Information Technology | | 18 | % | |
Health Care | | 17 | | |
Financials | | 16 | | |
Consumer Discretionary | | 14 | | |
Energy | | 12 | | |
Industrials | | 8 | | |
Consumer Staples | | 7 | | |
Materials | | 4 | | |
Utilities | | 3 | | |
Telecommunication Services | | 1 | | |
| | | | |
Master Large Cap Growth Portfolio | | Percent of
Long-Term Investments | |
Information Technology | | 31 | % | |
Consumer Discretionary | | 15 | | |
Health Care | | 14 | | |
Consumer Staples | | 13 | | |
Industrials | | 12 | | |
Energy | | 6 | | |
Materials | | 5 | | |
Financials | | 2 | | |
Telecommunication Services | | 2 | | |
| | | | |
Master Large Cap Value Portfolio | | Percent of
Long-Term Investments | |
Financials | | 27 | % | |
Energy | | 17 | | |
Health Care | | 16 | | |
Consumer Discretionary | | 11 | | |
Industrials | | 10 | | |
Information Technology | | 6 | | |
Consumer Staples | | 5 | | |
Materials | | 4 | | |
Utilities | | 2 | | |
Telecommunication Services | | 2 | | |
| |
| For Portfolio compliance purposes, the Portfolio’s sector classifications refer to any one or more of the sector sub-classifications used by one or more widely recognized market indexes or rating group indexes, and/or as defined by Portfolio management. These definitions may not apply for purposes of this report, which may combine such sector sub-classifications for reporting ease. |
| | | |
| | | |
| BLACKROCK LARGE CAP SERIES FUNDS, INC. | SEPTEMBER 30, 2012 | 21 |
| |
| |
Schedule of Investments September 30, 2012 | Master Large Cap Core Portfolio |
(Percentages shown are based on Net Assets) |
| | | | | | | |
Common Stocks | | Shares | | Value | |
Consumer Discretionary — 13.7% | | | | | | | |
Auto Components — 0.9% | | | | | | | |
Lear Corp. | | | 547,900 | | $ | 20,705,141 | |
Diversified Consumer Services — 0.5% | | | | | | | |
Apollo Group, Inc., Class A (a)(b) | | | 397,770 | | | 11,555,218 | |
Internet & Catalog Retail — 1.2% | | | | | | | |
Expedia, Inc. | | | 491,315 | | | 28,417,660 | |
Media — 8.2% | | | | | | | |
Comcast Corp., Class A | | | 1,643,700 | | | 58,795,149 | |
DISH Network Corp., Class A | | | 568,175 | | | 17,391,837 | |
The McGraw-Hill Cos., Inc. | | | 399,800 | | | 21,825,082 | |
News Corp., Class A | | | 2,089,250 | | | 51,249,302 | |
Time Warner Cable, Inc. | | | 428,280 | | | 40,712,297 | |
| | | | | | 189,973,667 | |
Multiline Retail — 0.8% | | | | | | | |
Dillard’s, Inc., Class A | | | 261,965 | | | 18,945,309 | |
Specialty Retail — 2.1% | | | | | | | |
Foot Locker, Inc. | | | 287,318 | | | 10,199,789 | |
The Gap, Inc. | | | 375,755 | | | 13,444,514 | |
PetSmart, Inc. | | | 342,635 | | | 23,634,962 | |
| | | | | | 47,279,265 | |
Total Consumer Discretionary | | | | | | 316,876,260 | |
Consumer Staples — 7.0% | | | | | | | |
Beverages — 2.7% | | | | | | | |
The Coca-Cola Co. | | | 1,180,875 | | | 44,790,589 | |
Constellation Brands, Inc., Class A (a) | | | 516,700 | | | 16,715,245 | |
| | | | | | 61,505,834 | |
Food & Staples Retailing — 4.2% | | | | | | | |
CVS Caremark Corp. | | | 689,325 | | | 33,377,116 | |
Wal-Mart Stores, Inc. | | | 879,350 | | | 64,896,030 | |
| | | | | | 98,273,146 | |
Tobacco — 0.1% | | | | | | | |
Philip Morris International, Inc. | | | 36,475 | | | 3,280,562 | |
Total Consumer Staples | | | | | | 163,059,542 | |
Energy — 12.1% | | | | | | | |
Energy Equipment & Services — 1.1% | | | | | | | |
Oceaneering International, Inc. | | | 455,800 | | | 25,182,950 | |
Oil, Gas & Consumable Fuels — 11.0% | | | | | | | |
Chevron Corp. | | | 561,675 | | | 65,468,838 | |
Exxon Mobil Corp. | | | 1,031,600 | | | 94,339,820 | |
Marathon Oil Corp. | | | 540,675 | | | 15,987,760 | |
Marathon Petroleum Corp. | | | 645,650 | | | 35,246,033 | |
Suncor Energy, Inc. | | | 1,371,540 | | | 45,055,089 | |
| | | | | | 256,097,540 | |
Total Energy | | | | | | 281,280,490 | |
Financials — 15.8% | | | | | | | |
Capital Markets — 1.8% | | | | | | | |
The Goldman Sachs Group, Inc. | | | 366,431 | | | 41,655,876 | |
Commercial Banks — 2.1% | | | | | | | |
US Bancorp | | | 1,312,675 | | | 45,024,752 | |
Wells Fargo & Co. | | | 156,250 | | | 5,395,313 | |
| | | | | | 50,420,065 | |
Consumer Finance — 1.2% | | | | | | | |
Discover Financial Services | | | 686,200 | | | 27,262,726 | |
Diversified Financial Services — 5.7% | | | | | | | |
Citigroup, Inc. | | | 1,878,625 | | | 61,468,610 | |
JPMorgan Chase & Co. | | | 1,733,624 | | | 70,177,100 | |
| | | | | | 131,645,710 | |
| | | | | | | |
Common Stocks | | Shares | | Value | |
Financials (concluded) | | | | | | | |
Insurance — 5.0% | | | | | | | |
Allied World Assurance Co. Holdings AG | | | 76,900 | | $ | 5,940,525 | |
American Financial Group, Inc. | | | 124,900 | | | 4,733,710 | |
American International Group, Inc. (a) | | | 1,103,600 | | | 36,187,044 | |
The Chubb Corp. | | | 175,000 | | | 13,349,000 | |
Everest Re Group Ltd. | | | 9,700 | | | 1,037,512 | |
MetLife, Inc. | | | 457,900 | | | 15,779,234 | |
PartnerRe Ltd. | | | 144,200 | | | 10,711,176 | |
The Travelers Cos., Inc. | | | 413,600 | | | 28,232,336 | |
| | | | | | 115,970,537 | |
Total Financials | | | | | | 366,954,914 | |
Health Care — 16.2% | | | | | | | |
Health Care Equipment & Supplies — 1.1% | | | | | | | |
Zimmer Holdings, Inc. | | | 390,000 | | | 26,371,800 | |
Health Care Providers & Services — 5.1% | | | | | | | |
Express Scripts Holding Co. (a) | | | 673,525 | | | 42,209,811 | |
HCA Holdings, Inc. | | | 146,200 | | | 4,861,150 | |
Humana, Inc. | | | 185,300 | | | 12,998,795 | |
McKesson Corp. | | | 300,025 | | | 25,811,151 | |
UnitedHealth Group, Inc. | | | 588,075 | | | 32,585,236 | |
| | | | | | 118,466,143 | |
Life Sciences Tools & Services — 1.1% | | | | | | | |
Agilent Technologies, Inc. | | | 653,700 | | | 25,134,765 | |
Pharmaceuticals — 8.9% | | | | | | | |
Abbott Laboratories | | | 565,500 | | | 38,770,680 | |
Eli Lilly & Co. | | | 409,775 | | | 19,427,433 | |
Forest Laboratories, Inc. (a) | | | 682,700 | | | 24,310,947 | |
Johnson & Johnson | | | 126,625 | | | 8,725,729 | |
Merck & Co., Inc. | | | 1,078,550 | | | 48,642,605 | |
Pfizer, Inc. | | | 2,631,275 | | | 65,387,183 | |
| | | | | | 205,264,577 | |
Total Health Care | | | | | | 375,237,285 | |
Industrials — 7.7% | | | | | | | |
Airlines — 1.8% | | | | | | | |
Copa Holdings SA, Class A | | | 115,300 | | | 9,370,431 | |
Delta Air Lines, Inc. (a) | | | 2,056,325 | | | 18,835,937 | |
United Continental Holdings, Inc. (a)(b) | | | 630,239 | | | 12,289,660 | |
| | | | | | 40,496,028 | |
Construction & Engineering — 0.7% | | | | | | | |
KBR, Inc. | | | 553,790 | | | 16,514,018 | |
Industrial Conglomerates — 3.7% | | | | | | | |
3M Co. | | | 493,475 | | | 45,606,959 | |
General Electric Co. | | | 616,750 | | | 14,006,393 | |
Tyco International Ltd. | | | 477,800 | | | 26,881,028 | |
| | | | | | 86,494,380 | |
Machinery — 1.5% | | | | | | | |
Ingersoll-Rand Plc | | | 546,100 | | | 24,476,202 | |
Oshkosh Corp. (a) | | | 395,200 | | | 10,840,336 | |
| | | | | | 35,316,538 | |
Total Industrials | | | | | | 178,820,964 | |
| | |
See Notes to Financial Statements. |
| | |
22 | BLACKROCK LARGE CAP SERIES FUNDS, INC. | SEPTEMBER 30, 2012 |
| |
| |
Schedule of Investments (continued) | Master Large Cap Core Portfolio |
(Percentages shown are based on Net Assets) |
| | | | | | | |
Common Stocks | | Shares | | Value | |
Information Technology — 17.8% | | | | | | | |
Computers & Peripherals — 7.1% | | | | | | | |
Apple, Inc. | | | 185,150 | | $ | 123,543,189 | |
EMC Corp. (a) | | | 740,000 | | | 20,179,800 | |
Western Digital Corp. | | | 540,750 | | | 20,943,247 | |
| | | | | | 164,666,236 | |
Internet Software & Services — 4.9% | | | | | | | |
AOL, Inc. (a)(b) | | | 624,800 | | | 22,011,704 | |
Google, Inc., Class A (a) | | | 112,375 | | | 84,786,938 | |
IAC/InterActiveCorp. | | | 105,800 | | | 5,507,948 | |
| | | | | | 112,306,590 | |
IT Services — 2.1% | | | | | | | |
International Business Machines Corp. | | | 110,650 | | | 22,954,342 | |
Total System Services, Inc. | | | 278,800 | | | 6,607,560 | |
The Western Union Co. | | | 1,079,825 | | | 19,674,412 | |
| | | | | | 49,236,314 | |
Semiconductors & Semiconductor
Equipment — 1.3% | | | | | | | |
KLA-Tencor Corp. | | | 634,475 | | | 30,267,630 | |
Software — 2.4% | | | | | | | |
Microsoft Corp. | | | 1,895,050 | | | 56,434,589 | |
Total Information Technology | | | | | | 412,911,359 | |
Materials — 3.7% | | | | | | | |
Chemicals — 0.9% | | | | | | | |
CF Industries Holdings, Inc. | | | 91,475 | | | 20,329,404 | |
Containers & Packaging — 1.9% | | | | | | | |
Packaging Corp. of America | | | 639,513 | | | 23,214,322 | |
Rock-Tenn Co., Class A | | | 289,094 | | | 20,866,805 | |
| | | | | | 44,081,127 | |
Paper & Forest Products — 0.9% | | | | | | | |
Domtar Corp. | | | 259,500 | | | 20,316,255 | |
Total Materials | | | | | | 84,726,786 | |
Telecommunication Services — 1.3% | | | | | | | |
Diversified Telecommunication
Services — 1.3% | | | | | | | |
Verizon Communications, Inc. | | | 672,800 | | | 30,659,496 | |
Utilities — 2.7% | | | | | | | |
Independent Power Producers &
Energy Traders — 1.7% | | | | | | | |
The AES Corp. | | | 1,804,500 | | | 19,795,365 | |
NRG Energy, Inc. | | | 906,400 | | | 19,387,896 | |
| | | | | | 39,183,261 | |
Multi-Utilities — 1.0% | | | | | | | |
Ameren Corp. | | | 680,700 | | | 22,238,469 | |
Total Utilities | | | | | | 61,421,730 | |
Total Long-Term Investments
(Cost — $1,851,884,342) — 98.0% | | | | | | 2,271,948,826 | |
| | | | | | | |
Short-Term Securities | | Shares | | Value | |
BlackRock Liquidity Funds, TempFund,
Institutional Class, 0.15% (c)(d) | | | 40,033,302 | | $ | 40,033,302 | |
| | | | | | | |
| | Beneficial
Interest
(000) | | | | |
BlackRock Liquidity Series, LLC
Money Market Series, 0.29% (c)(d)(e) | | $ | 22,803 | | | 22,802,709 | |
Total Short-Term Securities
(Cost — $62,836,011) — 2.7% | | | | | | 62,836,011 | |
Total Investments (Cost — $1,914,720,353*) — 100.7% | | | | | | 2,334,784,837 | |
Liabilities in Excess of Other Assets — (0.7)% | | | | | | (15,934,084 | ) |
Net Assets — 100.0% | | | | | $ | 2,318,850,753 | |
| |
* | As of September 30, 2012, gross unrealized appreciation and gross unrealized depreciation based on cost for federal income tax purposes were as follows: |
| | | | |
Tax cost | | $ | 1,912,833,819 | |
Gross unrealized appreciation | | $ | 439,609,343 | |
Gross unrealized depreciation | | | (17,658,325 | ) |
Net unrealized appreciation | | $ | 421,951,018 | |
| |
(a) | Non-income producing security. |
| |
(b) | Security, or a portion of security, is on loan. |
| |
(c) | Investments in issuers considered to be an affiliate of the Portfolio during the year ended September 30, 2012, for purposes of Section 2(a)(3) of the Investment Company Act of 1940, as amended, were as follows: |
| | | | | | | | | | | | | |
Affiliate | | Shares/
Beneficial
Interest Held at
September 30,
2011 | | Net
Activity | | Shares/
Beneficial
Interest Held at
September 30,
2012 | | Income | |
BlackRock Liquidity
Funds, TempFund,
Institutional Class | | | — | | | 40,033,302 | | | 40,033,302 | | $ | 19,320 | |
BlackRock Liquidity
Series LLC, Money
Market Series | | $ | 72,082,895 | | $ | (49,280,186 | ) | $ | 22,802,709 | | $ | 2,346,365 | |
| |
(d) | Represents the current yield as of report date. |
| |
(e) | Security was purchased with the cash collateral from loaned securities. The Portfolio may withdraw up to 25% of its investment daily, although the manager of the Money Market Series, in its sole discretion, may permit an investor to withdraw more than 25% on any one day. |
| |
• | For Portfolio compliance purposes, the Portfolio’s sector and industry classifications refer to any one or more of the sector and industry sub-classifications used by one or more widely recognized market indexes or rating group indexes, and/or as defined by Portfolio management. These definitions may not apply for purposes of this report, which may combine such sector and industry sub-classifications for reporting ease. |
| | | |
See Notes to Financial Statements. |
| | | |
| BLACKROCK LARGE CAP SERIES FUNDS, INC. | SEPTEMBER 30, 2012 | 23 |
| |
| |
Schedule of Investments (concluded) | Master Large Cap Core Portfolio |
| | |
• | Fair Value Measurements — Various inputs are used in determining the fair value of investments. These inputs to valuation techniques are categorized into a disclosure hierarchy consisting of three broad levels for financial statement purposes as follows: |
| | |
| • | Level 1 — unadjusted price quotations in active markets/exchanges for identical assets and liabilities that the Portfolio has the ability to access |
| | |
| • | Level 2 — other observable inputs (including, but not limited to: quoted prices for similar assets or liabilities in markets that are active, quoted prices for identical or similar assets or liabilities in markets that are not active, inputs other than quoted prices that are observable for the assets or liabilities (such as interest rates, yield curves, volatilities, prepayment speeds, loss severities, credit risks and default rates) or other market-corroborated inputs) |
| | |
| • | Level 3 — unobservable inputs based on the best information available in the circumstances, to the extent observable inputs are not available (including the Portfolio’s own assumptions used in determining the fair value of investments) |
| | |
The hierarchy gives the highest priority to unadjusted quoted prices in active markets for identical assets or liabilities (Level 1 measurements) and the lowest priority to unobservable inputs (Level 3 measurements). Accordingly, the degree of judgment exercised in determining fair value is greatest for instruments categorized in Level 3. The inputs used to measure fair value may fall into different levels of the fair value hierarchy. In such cases, for disclosure purposes, the level in the fair value hierarchy within which the fair value measurement falls in its entirety is determined based on the lowest level input that is significant to the fair value measurement in its entirety. |
| | |
Changes in valuation techniques may result in transfers into or out of an assigned level within the disclosure hierarchy. In accordance with the Portfolio’s policy, transfers between different levels of the fair value disclosure hierarchy are deemed to have occurred as of the beginning of the reporting period. The categorization of a value determined for investments is based on the pricing transparency of the investment and is not necessarily an indication of the risks associated with investing in those securities. For information about the Portfolio’s policy regarding valuation of investments and other significant accounting policies, please refer to Note 1 of the Notes to Financial Statements. |
The following table summarizes the Portfolio’s investments categorized in the disclosure hierarchy as of September 30, 2012:
| | | | | | | | | | | | | |
| | Level 1 | | Level 2 | | Level 3 | | Total | |
Assets: | | | | | | | | | | | | | |
Investments: | | | | | | | | | | | | | |
Long-Term
Investments1 | | $ | 2,271,948,826 | | | — | | | — | | $ | 2,271,948,826 | |
Short-Term
Securities | | | 40,033,302 | | $ | 22,802,709 | | | — | | | 62,836,011 | |
Total | | $ | 2,311,982,128 | | $ | 22,802,709 | | | — | | $ | 2,334,784,837 | |
| | |
| 1 | See above Schedule of Investments for values in each industry. |
Certain of the Portfolio’s liabilities are held at carrying amount, which approximates fair value for financial statement purposes. As of September 30, 2012, collateral on securities loaned at value of $22,802,709 is categorized as Level 2 within the disclosure hierarchy.
There were no transfers between levels during the year ended September 30, 2012.
| | |
See Notes to Financial Statements. |
| | |
24 | BLACKROCK LARGE CAP SERIES FUNDS, INC. | SEPTEMBER 30, 2012 |
| |
| |
Schedule of Investments September 30, 2012 | Master Large Cap Growth Portfolio |
(Percentages shown are based on Net Assets) |
| | | | | | | |
Common Stocks | | Shares | | Value | |
Consumer Discretionary — 14.4% | | | | | | | |
Diversified Consumer Services — 0.5% | | | | | | | |
Apollo Group, Inc., Class A (a)(b) | | | 173,130 | | $ | 5,029,426 | |
Hotels, Restaurants & Leisure — 1.1% | | | | | | | |
Brinker International, Inc. | | | 292,250 | | | 10,316,425 | |
Internet & Catalog Retail — 1.3% | | | | | | | |
Expedia, Inc. | | | 198,395 | | | 11,475,167 | |
Media — 9.1% | | | | | | | |
Comcast Corp., Class A | | | 641,500 | | | 22,946,455 | |
DISH Network Corp., Class A | | | 245,675 | | | 7,520,112 | |
The McGraw-Hill Cos., Inc. | | | 242,225 | | | 13,223,063 | |
News Corp., Class A | | | 783,225 | | | 19,212,509 | |
Time Warner Cable, Inc. | | | 214,500 | | | 20,390,370 | |
| | | | | | 83,292,509 | |
Multiline Retail — 0.4% | | | | | | | |
Dollar Tree, Inc. (a) | | | 71,800 | | | 3,466,145 | |
Specialty Retail — 2.0% | | | | | | | |
PetSmart, Inc. | | | 169,825 | | | 11,714,528 | |
TJX Cos., Inc. | | | 144,125 | | | 6,455,359 | |
| | | | | | 18,169,887 | |
Total Consumer Discretionary | | | | | | 131,749,559 | |
Consumer Staples — 12.4% | | | | | | | |
Beverages — 3.2% | | | | | | | |
The Coca-Cola Co. | | | 754,400 | | | 28,614,392 | |
Food & Staples Retailing — 5.0% | | | | | | | |
CVS Caremark Corp. | | | 295,200 | | | 14,293,584 | |
Wal-Mart Stores, Inc. | | | 424,500 | | | 31,328,100 | |
| | | | | | 45,621,684 | |
Personal Products — 1.2% | | | | | | | |
Herbalife Ltd. | | | 235,150 | | | 11,146,110 | |
Tobacco — 3.0% | | | | | | | |
Philip Morris International, Inc. | | | 307,700 | | | 27,674,538 | |
Total Consumer Staples | | | | | | 113,056,724 | |
Energy — 6.4% | | | | | | | |
Energy Equipment & Services — 1.2% | | | | | | | |
Oceaneering International, Inc. | | | 202,050 | | | 11,163,262 | |
Oil, Gas & Consumable Fuels — 5.2% | | | | | | | |
Chevron Corp. | | | 90,025 | | | 10,493,314 | |
Exxon Mobil Corp. | | | 112,000 | | | 10,242,400 | |
Marathon Oil Corp. | | | 249,450 | | | 7,376,237 | |
Suncor Energy, Inc. | | | 576,165 | | | 18,927,020 | |
| | | | | | 47,038,971 | |
Total Energy | | | | | | 58,202,233 | |
Financials — 2.4% | | | | | | | |
Consumer Finance — 1.1% | | | | | | | |
Discover Financial Services | | | 252,125 | | | 10,016,926 | |
Insurance — 1.3% | | | | | | | |
The Travelers Cos., Inc. | | | 168,950 | | | 11,532,527 | |
Total Financials | | | | | | 21,549,453 | |
Health Care — 13.4% | | | | | | | |
Biotechnology — 0.3% | | | | | | | |
Myriad Genetics, Inc. (a)(b) | | | 115,100 | | | 3,106,549 | |
Health Care Providers & Services — 7.3% | | | | | | | |
Express Scripts Holding Co. (a) | | | 389,825 | | | 24,430,333 | |
HCA Holdings, Inc. | | | 184,500 | | | 6,134,625 | |
McKesson Corp. | | | 171,850 | | | 14,784,255 | |
Patterson Cos., Inc. | | | 299,225 | | | 10,245,464 | |
UnitedHealth Group, Inc. | | | 202,700 | | | 11,231,607 | |
| | | | | | 66,826,284 | |
| | | | | | | |
Common Stocks | | Shares | | Value | |
Health Care (concluded) | | | | | | | |
Life Sciences Tools & Services — 1.2% | | | | | | | |
Agilent Technologies, Inc. | | | 293,550 | | $ | 11,286,998 | |
Pharmaceuticals — 4.6% | | | | | | | |
Abbott Laboratories | | | 410,050 | | | 28,113,028 | |
Eli Lilly & Co. | | | 152,450 | | | 7,227,654 | |
Warner Chilcott Plc, Class A | | | 460,550 | | | 6,217,425 | |
| | | | | | 41,558,107 | |
Total Health Care | | | | | | 122,777,938 | |
Industrials — 11.6% | | | | | | | |
Aerospace & Defense — 1.2% | | | | | | | |
The Boeing Co. | | | 150,375 | | | 10,469,108 | |
Airlines — 2.6% | | | | | | | |
Copa Holdings SA, Class A | | | 131,300 | | | 10,670,751 | |
Delta Air Lines, Inc. (a) | | | 869,700 | | | 7,966,452 | |
United Continental Holdings, Inc. (a)(b) | | | 281,739 | | | 5,493,911 | |
| | | | | | 24,131,114 | |
Commercial Services & Supplies — 0.9% | | | | | | | |
Covanta Holding Corp. | | | 471,475 | | | 8,090,511 | |
Construction & Engineering — 1.5% | | | | | | | |
AECOM Technology Corp. (a) | | | 222,800 | | | 4,714,448 | |
KBR, Inc. | | | 312,700 | | | 9,324,714 | |
| | | | | | 14,039,162 | |
Industrial Conglomerates — 2.8% | | | | | | | |
3M Co. | | | 278,875 | | | 25,773,627 | |
Machinery — 2.6% | | | | | | | |
Cummins, Inc. | | | 73,400 | | | 6,768,214 | |
Ingersoll-Rand Plc | | | 240,500 | | | 10,779,210 | |
Parker Hannifin Corp. | | | 70,950 | | | 5,930,001 | |
| | | | | | 23,477,425 | |
Total Industrials | | | | | | 105,980,947 | |
Information Technology — 30.9% | | | | | | | |
Computers & Peripherals — 12.0% | | | | | | | |
Apple, Inc. | | | 133,375 | | | 88,995,802 | |
EMC Corp. (a) | | | 433,000 | | | 11,807,910 | |
Western Digital Corp. | | | 223,200 | | | 8,644,536 | |
| | | | | | 109,448,248 | |
Internet Software & Services — 5.0% | | | | | | | |
Google, Inc., Class A (a) | | | 61,075 | | | 46,081,087 | |
IT Services — 8.4% | | | | | | | |
Alliance Data Systems Corp. (a)(b) | | | 84,925 | | | 12,055,104 | |
DST Systems, Inc. | | | 196,950 | | | 11,139,493 | |
International Business Machines Corp. | | | 198,400 | | | 41,158,080 | |
The Western Union Co. | | | 655,350 | | | 11,940,477 | |
| | | | | | 76,293,154 | |
Semiconductors & Semiconductor | | | | | | | |
Equipment — 1.3% | | | | | | | |
KLA-Tencor Corp. | | | 246,300 | | | 11,749,742 | |
Software — 4.2% | | | | | | | |
Microsoft Corp. | | | 1,290,350 | | | 38,426,623 | |
Total Information Technology | | | | | | 281,998,853 | |
Materials — 4.7% | | | | | | | |
Chemicals — 1.9% | | | | | | | |
CF Industries Holdings, Inc. | | | 35,850 | | | 7,967,304 | |
PPG Industries, Inc. | | | 82,375 | | | 9,459,945 | |
| | | | | | 17,427,249 | |
Containers & Packaging — 1.6% | | | | | | | |
Packaging Corp. of America | | | 398,810 | | | 14,476,803 | |
Paper & Forest Products — 1.2% | | | | | | | |
International Paper Co. | | | 296,125 | | | 10,755,260 | |
Total Materials | | | | | | 42,659,312 | |
| | | |
See Notes to Financial Statements. | | |
| | | |
| BLACKROCK LARGE CAP SERIES FUNDS, INC. | SEPTEMBER 30, 2012 | 25 |
| |
| |
Schedule of Investments (concluded) | Master Large Cap Growth Portfolio
(Percentages shown are based on Net Assets) |
| | | | | | | |
Common Stocks | | Shares | | Value | |
Telecommunication Services — 1.6% | | | | | | | |
Diversified Telecommunication Services — 1.6% | | | | | | | |
Verizon Communications, Inc. | | | 332,075 | | $ | 15,132,658 | |
Total Long-Term Investments | | | | | | | |
(Cost — $720,936,790) — 97.8% | | | | | | 893,107,678 | |
| | | | | | | |
| | | | | | | |
| | | | | | | |
Short-Term Securities | | | | | | | |
BlackRock Liquidity Funds, TempFund,
Institutional Class, 0.15% (c)(d) | | | 16,880,866 | | | 16,880,866 | |
| | | | | | | |
| | Beneficial
Interest
(000) | | | | |
BlackRock Liquidity Series LLC,
Money Market Series, 0.29% (c)(d)(e) | | $ | 17,168 | | | 17,167,563 | |
Total Short-Term Securities | | | | | | | |
(Cost — $34,048,429) — 3.7% | | | | | | 34,048,429 | |
Total Investments (Cost — $754,985,219*) — 101.5% | | | | | | 927,156,107 | |
Liabilities in Excess of Other Assets — (1.5)% | | | | | | (13,524,359 | ) |
Net Assets — 100.0% | | | | | $ | 913,631,748 | |
| |
*
|
As of September 30, 2012, gross unrealized appreciation and gross unrealized depreciation based on cost for federal income tax purposes were as follows:
|
| | | | |
Tax cost | | $ | 758,522,516 | |
Gross unrealized appreciation | | $ | 178,526,082 | |
Gross unrealized depreciation | | | (9,892,491 | ) |
Net unrealized appreciation | | $ | 168,633,591 | |
| |
(a) | Non-income producing security. |
| |
(b) | Security, or a portion of security, is on loan. |
| |
(c) | Investments in issuers considered to be an affiliate of the Portfolio during the year ended September 30, 2012, for purposes of Section 2(a)(3) of the Investment Company Act of 1940, as amended, were as follows: |
| | | | | | | | | | | | | |
Affiliate | | Shares/
Beneficial
Interest Held at
September 30,
2011 | | Net
Activity | | Shares/
Beneficial
Interest Held at
September 30,
2012 | | Income | |
BlackRock Liquidity
Funds, TempFund,
Institutional Class | | | 2,585,122 | | | 14,295,744 | | | 16,880,866 | | $ | 14,198 | |
BlackRock Liquidity
Series LLC, Money
Market Series | | $ | 24,184,509 | | $ | (7,016,946 | ) | $ | 17,167,563 | | $ | 1,088,969 | |
| | |
(d) | Represents the current yield as of report date. |
| |
(e) | Security was purchased with the cash collateral from loaned securities. The Portfolio may withdraw up to 25% of its investment daily, although the manager of the Money Market Series, in its sole discretion, may permit an investor to withdraw more than 25% on any one day. |
| |
• | For Portfolio compliance purposes, the Portfolio’s sector and industry classifications refer to any one or more of the sector and industry sub-classifications used by one or more widely recognized market indexes or rating group indexes, and/or as defined by Portfolio management. These definitions may not apply for purposes of this report, which may combine such sector and industry sub-classifications for reporting ease. |
| |
• | Fair Value Measurements — Various inputs are used in determining the fair value of investments. These inputs to valuation techniques are categorized into a disclosure hierarchy consisting of three broad levels for financial statement purposes as follows: |
| |
| • | Level 1 — unadjusted price quotations in active markets/exchanges for identical assets and liabilities that the Portfolio has the ability to access |
| | |
| • | Level 2 — other observable inputs (including, but not limited to: quoted prices for similar assets or liabilities in markets that are active, quoted prices for identical or similar assets or liabilities in markets that are not active, inputs other than quoted prices that are observable for the assets or liabilities (such as interest rates, yield curves, volatilities, prepayment speeds, loss severities, credit risks and default rates) or other market-corroborated inputs) |
| | |
| • | Level 3 — unobservable inputs based on the best information available in the circumstances, to the extent observable inputs are not available (including the Portfolio’s own assumptions used in determining the fair value of investments) |
| | |
The hierarchy gives the highest priority to unadjusted quoted prices in active markets for identical assets or liabilities (Level 1 measurements) and the lowest priority to unobservable inputs (Level 3 measurements). Accordingly, the degree of judgment exercised in determining fair value is greatest for instruments categorized in Level 3. The inputs used to measure fair value may fall into different levels of the fair value hierarchy. In such cases, for disclosure purposes, the level in the fair value hierarchy within which the fair value measurement falls in its entirety is determined based on the lowest level input that is significant to the fair value measurement in its entirety. |
| |
Changes in valuation techniques may result in transfers into or out of an assigned level within the disclosure hierarchy. In accordance with the Portfolio’s policy, transfers between different levels of the fair value disclosure hierarchy are deemed to have occurred as of the beginning of the reporting period. The categorization of a value determined for investments is based on the pricing transparency of the investment and is not necessarily an indication of the risks associated with investing in those securities. For information about the Portfolio’s policy regarding valuation of investments and other significant accounting policies, please refer to Note 1 of the Notes to Financial Statements. |
The following table summarizes the Portfolio’s investments categorized in the disclosure hierarchy as of September 30, 2012:
| | | | | | | | | | | | | |
| | Level 1 | | Level 2 | | Level 3 | | Total | |
Assets: | | | | | | | | | | | | | |
Investments: | | | | | | | | | | | | | |
Long-Term
Investments1 | | $ | 893,107,678 | | | — | | | — | | $ | 893,107,678 | |
Short-Term
Securities | | | 16,880,866 | | $ | 17,167,563 | | | — | | | 34,048,429 | |
Total | | $ | 909,988,544 | | $ | 17,167,563 | | | — | | $ | 927,156,107 | |
| | |
| 1 | See above Schedule of Investments for values in each sector and industry. |
Certain of the Portfolio’s liabilities are held at carrying amount, which approximates fair value for financial statement purposes. As of September 30, 2012, collateral on securities loaned of $17,167,563 is categorized as Level 2 within the disclosure hierarchy.
There were no transfers between levels during the year ended September 30, 2012.
| | |
See Notes to Financial Statements. | |
| | |
| | |
26 | BLACKROCK LARGE CAP SERIES FUNDS, INC. | SEPTEMBER 30, 2012 |
| |
| |
Schedule of Investments September 30, 2012 | Master Large Cap Value Portfolio |
(Percentages shown are based on Net Assets) |
| | | | | | | |
Common Stocks | | Shares | | Value | |
Consumer Discretionary — 11.1% | | | | | | | |
Auto Components — 1.1% | | | | | | | |
Lear Corp. | | | 317,625 | | $ | 12,003,049 | |
Internet & Catalog Retail — 1.2% | | | | | | | |
Expedia, Inc. | | | 228,400 | | | 13,210,656 | |
Media — 7.2% | | | | | | | |
Comcast Corp., Class A | | | 762,000 | | | 27,256,740 | |
DISH Network Corp., Class A | | | 259,925 | | | 7,956,304 | |
News Corp., Class A | | | 1,005,075 | | | 24,654,490 | |
Time Warner Cable, Inc. | | | 174,800 | | | 16,616,488 | |
| | | | | | 76,484,022 | |
Multiline Retail — 0.9% | | | | | | | |
Dillard’s, Inc., Class A | | | 128,200 | | | 9,271,424 | |
Specialty Retail — 0.7% | | | | | | | |
Foot Locker, Inc. | | | 137,757 | | | 4,890,373 | |
The Gap, Inc. | | | 54,325 | | | 1,943,749 | |
| | | | | | 6,834,122 | |
Total Consumer Discretionary | | | | | | 117,803,273 | |
Consumer Staples — 4.6% | | | | | | | |
Food & Staples Retailing — 4.3% | | | | | | | |
CVS Caremark Corp. | | | 402,650 | | | 19,496,313 | |
Wal-Mart Stores, Inc. | | | 351,750 | | | 25,959,150 | |
| | | | | | 45,455,463 | |
Household Products — 0.3% | | | | | | | |
The Procter & Gamble Co. | | | 55,200 | | | 3,828,672 | |
Total Consumer Staples | | | | | | 49,284,135 | |
Energy — 16.6% | | | | | | | |
Oil, Gas & Consumable Fuels — 16.6% | | | | | | | |
Chevron Corp. | | | 447,975 | | | 52,215,966 | |
Exxon Mobil Corp. | | | 881,525 | | | 80,615,461 | |
Marathon Petroleum Corp. | | | 396,225 | | | 21,629,923 | |
Suncor Energy, Inc. | | | 661,590 | | | 21,733,231 | |
Total Energy | | | | | | 176,194,581 | |
Financials — 27.1% | | | | | | | |
Capital Markets — 2.3% | | | | | | | |
The Goldman Sachs Group, Inc. | | | 214,878 | | | 24,427,331 | |
Commercial Banks — 2.8% | | | | | | | |
US Bancorp | | | 773,075 | | | 26,516,473 | |
Wells Fargo & Co. | | | 102,625 | | | 3,543,641 | |
| | | | | | 30,060,114 | |
Consumer Finance — 1.4% | | | | | | | |
Discover Financial Services | | | 371,600 | | | 14,763,668 | |
Diversified Financial Services — 7.7% | | | | | | | |
Citigroup, Inc. | | | 1,123,000 | | | 36,744,560 | |
JPMorgan Chase & Co. | | | 1,117,165 | | | 45,222,839 | |
| | | | | | 81,967,399 | |
Insurance — 11.8% | | | | | | | |
Allied World Assurance Co. Holdings AG | | | 161,500 | | | 12,475,875 | |
American Financial Group, Inc. | | | 308,925 | | | 11,708,257 | |
American International Group, Inc. (a) | | | 577,400 | | | 18,932,946 | |
Berkshire Hathaway, Inc., Class B (a) | | | 25,800 | | | 2,275,560 | |
The Chubb Corp. | | | 219,375 | | | 16,733,925 | |
Everest Re Group Ltd. | | | 115,600 | | | 12,364,576 | |
HCC Insurance Holdings, Inc. | | | 74,000 | | | 2,507,860 | |
MetLife, Inc. | | | 510,600 | | | 17,595,276 | |
PartnerRe Ltd. | | | 171,100 | | | 12,709,308 | |
RenaissanceRe Holdings Ltd. | | | 26,325 | | | 2,028,078 | |
The Travelers Cos., Inc. | | | 240,800 | | | 16,437,008 | |
| | | | | | 125,768,669 | |
| | | | | | | |
Common Stocks | | Shares | | Value | |
Financials (concluded) | | | | | | | |
Thrifts & Mortgage Finance — 1.1% | | | | | | | |
Washington Federal, Inc. | | | 665,000 | | $ | 11,092,200 | |
Total Financials | | | | | | 288,079,381 | |
Health Care — 15.6% | | | | | | | |
Health Care Equipment & Supplies — 1.5% | | | | | | | |
Zimmer Holdings, Inc. | | | 230,425 | | | 15,581,339 | |
Health Care Providers & Services — 2.8% | | | | | | | |
Humana, Inc. | | | 120,200 | | | 8,432,030 | |
UnitedHealth Group, Inc. | | | 395,750 | | | 21,928,508 | |
| | | | | | 30,360,538 | |
Pharmaceuticals — 11.3% | | | | | | | |
Abbott Laboratories | | | 200,900 | | | 13,773,704 | |
Eli Lilly & Co. | | | 217,275 | | | 10,301,008 | |
Forest Laboratories, Inc. (a) | | | 314,650 | | | 11,204,686 | |
Johnson & Johnson | | | 27,300 | | | 1,881,243 | |
Merck & Co., Inc. | | | 811,650 | | | 36,605,415 | |
Pfizer, Inc. | | | 1,870,825 | | | 46,490,001 | |
| | | | | | 120,256,057 | |
Total Health Care | | | | | | 166,197,934 | |
Industrials — 10.3% | | | | | | | |
Aerospace & Defense — 0.8% | | | | | | | |
Raytheon Co. | | | 144,550 | | | 8,262,478 | |
Airlines — 1.6% | | | | | | | |
Copa Holdings SA, Class A | | | 38,000 | | | 3,088,260 | |
Delta Air Lines, Inc. (a) | | | 965,500 | | | 8,843,980 | |
United Continental Holdings, Inc. (a)(b) | | | 279,086 | | | 5,442,177 | |
| | | | | | 17,374,417 | |
Construction & Engineering — 1.2% | | | | | | | |
AECOM Technology Corp. (a) | | | 247,000 | | | 5,226,520 | |
KBR, Inc. | | | 265,751 | | | 7,924,695 | |
| | | | | | 13,151,215 | |
Industrial Conglomerates — 4.7% | | | | | | | |
3M Co. | | | 200,675 | | | 18,546,383 | |
General Electric Co. | | | 661,375 | | | 15,019,826 | |
Tyco International Ltd. | | | 288,925 | | | 16,254,921 | |
| | | | | | 49,821,130 | |
Machinery — 2.0% | | | | | | | |
Ingersoll-Rand Plc | | | 285,300 | | | 12,787,146 | |
Oshkosh Corp. (a) | | | 288,725 | | | 7,919,727 | |
| | | | | | 20,706,873 | |
Total Industrials | | | | | | 109,316,113 | |
Information Technology — 5.9% | | | | | | | |
Communications Equipment — 0.2% | | | | | | | |
Cisco Systems, Inc. | | | 96,300 | | | 1,838,367 | |
Computers & Peripherals — 1.2% | | | | | | | |
Hewlett-Packard Co. | | | 173,500 | | | 2,959,910 | |
Western Digital Corp. | | | 265,025 | | | 10,264,418 | |
| | | | | | 13,224,328 | |
Electronic Equipment, Instruments &
Components — 1.8% | | | | | | | |
Avnet, Inc. (a) | | | 289,600 | | | 8,424,464 | |
Tech Data Corp. (a)(b) | | | 237,500 | | | 10,758,750 | |
| | | | | | 19,183,214 | |
IT Services — 1.2% | | | | | | | |
DST Systems, Inc. | | | 227,900 | | | 12,890,024 | |
Semiconductors & Semiconductor
Equipment — 1.5% | | | | | | | |
KLA-Tencor Corp. | | | 337,200 | | | 16,086,126 | |
Total Information Technology | | | | | | 63,222,059 | |
| | | |
See Notes to Financial Statements. |
|
| BLACKROCK LARGE CAP SERIES FUNDS, INC. | SEPTEMBER 30, 2012 | 27 |
| |
| |
Schedule of Investments (continued) | Master Large Cap Value Portfolio |
(Percentages shown are based on Net Assets) |
| | | | | | | |
Common Stocks | | Shares | | Value | |
Materials — 3.9% | | | | | | | |
Chemicals — 1.0% | | | | | | | |
CF Industries Holdings, Inc. | | | 47,200 | | $ | 10,489,728 | |
Containers & Packaging — 1.8% | | | | | | | |
Rock-Tenn Co., Class A | | | 264,967 | | | 19,125,318 | |
Paper & Forest Products — 1.1% | | | | | | | |
Domtar Corp. | | | 149,900 | | | 11,735,671 | |
Total Materials | | | | | | 41,350,717 | |
Telecommunication Services — 1.9% | | | | | | | |
Diversified Telecommunication Services — 1.9% | | | | | | | |
AT&T, Inc. | | | 293,550 | | | 11,066,835 | |
Verizon Communications, Inc. | | | 214,350 | | | 9,767,930 | |
Total Telecommunication Services | | | | | | 20,834,765 | |
Utilities — 2.0% | | | | | | | |
Independent Power Producers &
Energy Traders — 2.0% | | | | | | | |
The AES Corp. | | | 1,115,400 | | | 12,235,938 | |
NRG Energy, Inc. | | | 433,900 | | | 9,281,121 | |
Total Utilities | | | | | | 21,517,059 | |
Total Long-Term Investments
(Cost — $908,400,328) — 99.0% | | | | | | 1,053,800,017 | |
| | | | | | | |
| | | | | | | |
| | | | | | | |
Short-Term Securities | | | | | | | |
BlackRock Liquidity Funds, TempFund,
Institutional Class, 0.15% (c)(d) | | | 10,713,064 | | | 10,713,064 | |
| | | | | | | |
| | Beneficial
Interest
(000) | | | | |
BlackRock Liquidity Series LLC,
Money Market Series, 0.29% (c)(d)(e) | | $ | 9,361 | | | 9,360,700 | |
Total Short-Term Securities
(Cost — $20,073,764) — 1.9% | | | | | | 20,073,764 | |
Total Investments (Cost — $928,474,092*) — 100.9% | | | | | | 1,073,873,781 | |
Liabilities in Excess of Other Assets — (0.9)% | | | | | | (10,050,257 | ) |
Net Assets — 100.0% | | | | | $ | 1,063,823,524 | |
| |
* | As of September 30, 2012, gross unrealized appreciation and gross unrealized depreciation based on cost for federal income tax purposes were as follows: |
| | | | |
Tax cost | | $ | 956,623,270 | |
Gross unrealized appreciation | | $ | 153,931,341 | |
Gross unrealized depreciation | | | (36,680,830 | ) |
Net unrealized appreciation | | $ | 117,250,511 | |
| |
(a) | Non-income producing security. |
| |
(b) | Security, or a portion of security, is on loan. |
| |
(c) | Investments in issuers considered to be an affiliate of the Portfolio during the year ended September 30, 2012, for purposes of Section 2(a)(3) of the Investment Company Act of 1940, as amended, were as follows: |
| | | | | | | | | | | | | |
Affiliate | | Shares/
Beneficial
Interest Held at
September 30,
2011 | | Net
Activity | | Shares/
Beneficial
Interest Held at
September 30,
2012 | | Income | |
BlackRock Liquidity
Funds, TempFund,
Institutional Class | | | — | | | 10,713,064 | | | 10,713,064 | | $ | 11,265 | |
BlackRock Liquidity
Series LLC, Money
Market Series | | $ | 23,226,367 | | $ | (13,865,667 | ) | $ | 9,360,700 | | $ | 1,338,578 | |
| | |
(d) | Represents the current yield as of report date. |
| | |
(e) | Security was purchased with the cash collateral from loaned securities. The Portfolio may withdraw up to 25% of its investment daily, although the manager of the Money Market Series, in its sole discretion, may permit an investor to withdraw more than 25% on any one day. |
| |
• | For Portfolio compliance purposes, the Portfolio’s sector and industry classifications refer to any one or more of the sector and industry sub-classifications used by one or more widely recognized market indexes or rating group indexes, and/or as defined by Portfolio management. These definitions may not apply for purposes of this report, which may combine such sector and industry sub-classifications for reporting ease. |
| |
• | Fair Value Measurements — Various inputs are used in determining the fair value of investments. These inputs to valuation techniques are categorized into a disclosure hierarchy consisting of three broad levels for financial statement purposes as follows: |
| |
| • | Level 1 — unadjusted price quotations in active markets/exchanges for identical assets and liabilities that the Portfolio has the ability to access |
| | |
| • | Level 2 — other observable inputs (including, but not limited to: quoted prices for similar assets or liabilities in markets that are active, quoted prices for identical or similar assets or liabilities in markets that are not active, inputs other than quoted prices that are observable for the assets or liabilities (such as interest rates, yield curves, volatilities, prepayment speeds, loss severities, credit risks and default rates) or other market-corroborated inputs) |
| | |
| • | Level 3 — unobservable inputs based on the best information available in the circumstances, to the extent observable inputs are not available (including the Portfolio’s own assumptions used in determining the fair value of investments) |
| | |
The hierarchy gives the highest priority to unadjusted quoted prices in active markets for identical assets or liabilities (Level 1 measurements) and the lowest priority to unobservable inputs (Level 3 measurements). Accordingly, the degree of judgment exercised in determining fair value is greatest for instruments categorized in Level 3. The inputs used to measure fair value may fall into different levels of the fair value hierarchy. In such cases, for disclosure purposes, the level in the fair value hierarchy within which the fair value measurement falls in its entirety is determined based on the lowest level input that is significant to the fair value measurement in its entirety. |
| |
Changes in valuation techniques may result in transfers into or out of an assigned level within the disclosure hierarchy. In accordance with the Portfolio’s policy, transfers between different levels of the fair value disclosure hierarchy are deemed to have occurred as of the beginning of the reporting period. The categorization of a value determined for investments is based on the pricing transparency of the investment and is not necessarily an indication of the risks associated with investing in those securities. For information about the Portfolio’s policy regarding valuation of investments and other significant accounting policies, please refer to Note 1 of the Notes to Financial Statements. |
| | |
See Notes to Financial Statements. |
| | |
28 | BLACKROCK LARGE CAP SERIES FUNDS, INC. | SEPTEMBER 30, 2012 |
| |
| |
Schedule of Investments (concluded) | Master Large Cap Value Portfolio |
The following table summarizes the Portfolio’s investments categorized in the disclosure hierarchy as of September 30, 2012:
| | | | | | | | | | | | | |
Valuation Inputs | | Level 1 | | Level 2 | | Level 3 | | Total | |
Assets: | | | | | | | | | | | | | |
Investments: | | | | | | | | | | | | | |
Long-Term
Investments1 | | $ | 1,053,800,017 | | | — | | | — | | $ | 1,053,800,017 | |
Short-Term
Securities | | | 10,713,064 | | $ | 9,360,700 | | | — | | | 20,073,764 | |
Total | | $ | 1,064,513,081 | | $ | 9,360,700 | | | — | | $ | 1,073,873,781 | |
| | |
| 1 | See above Schedule of Investments for values in each sector and industry. |
Certain of the Portfolio’s liabilities are held at carrying amount, which approximates fair value for financial statement purposes. As of September 30, 2012, collateral on securities loaned at value of $9,360,700 is categorized as Level 2 within the disclosure hierarchy.
There were no transfers between levels during the year ended September 30, 2012.
| | | |
See Notes to Financial Statements. |
| | | |
| BLACKROCK LARGE CAP SERIES FUNDS, INC. | SEPTEMBER 30, 2012 | 29 |
| |
| |
Statements of Assets and Liabilities | Master Large Cap Series LLC |
| | | | | | | | | | |
September 30, 2012 | | Master Large
Cap Core
Portfolio | | Master Large
Cap Growth
Portfolio | | Master Large
Cap Value
Portfolio | |
Assets | | | | | | | | | | |
Investments at value — unaffiliated1,2 | | $ | 2,271,948,826 | | $ | 893,107,678 | | $ | 1,053,800,017 | |
Investments at value — affiliated3 | | | 62,836,011 | | | 34,048,429 | | | 20,073,764 | |
Investments sold receivable | | | 34,499,638 | | | 21,362,690 | | | 20,044,472 | |
Dividends receivable | | | 2,131,225 | | | 877,183 | | | 1,025,365 | |
Securities lending income receivable — affiliated | | | 3,682 | | | 2,531 | | | 1,638 | |
Prepaid expenses | | | 32,429 | | | 7,088 | | | 30,977 | |
Total assets | | | 2,371,451,811 | | | 949,405,599 | | | 1,094,976,233 | |
| | | | | | | | | | |
Liabilities | | | | | | | | | | |
Collateral on securities loaned at value | | | 22,802,709 | | | 17,167,563 | | | 9,360,700 | |
Investments purchased payable | | | 25,071,902 | | | 17,956,215 | | | 17,873,636 | |
Withdrawals payable to investors | | | 3,533,604 | | | 65,476 | | | 3,290,672 | |
Investment advisory fees payable | | | 899,525 | | | 420,690 | | | 441,585 | |
Other affiliates payable | | | 21,087 | | | 9,101 | | | 12,083 | |
Directors’ fees payable | | | 16,683 | | | 7,888 | | | 8,688 | |
Other accrued expenses payable | | | 255,548 | | | 146,918 | | | 164,426 | |
Total liabilities | | | 52,601,058 | | | 35,773,851 | | | 31,151,790 | |
Net Assets | | $ | 2,318,850,753 | | $ | 913,631,748 | | $ | 1,063,823,524 | |
| | | | | | | | | | |
Net Assets Consist of | | | | | | | | | | |
Investors’ capital | | $ | 1,898,786,269 | | $ | 741,460,860 | | $ | 918,423,835 | |
Net unrealized appreciation/depreciation | | | 420,064,484 | | | 172,170,888 | | | 145,399,689 | |
Net Assets | | $ | 2,318,850,753 | | $ | 913,631,748 | | $ | 1,063,823,524 | |
| | | | | | | | | | |
1 Investments at cost — unaffiliated | | $ | 1,851,884,342 | | $ | 720,936,790 | | $ | 908,400,328 | |
2 Securities loaned at value | | $ | 22,282,639 | | $ | 16,808,667 | | $ | 9,057,000 | |
3 Investments at cost — affiliated | | $ | 62,836,011 | | $ | 34,048,429 | | $ | 20,073,764 | |
| | | |
See Notes to Financial Statements. |
| | | |
30 | BLACKROCK LARGE CAP SERIES FUNDS, INC. | SEPTEMBER 30, 2012 | |
| |
| |
Statements of Operations | Master Large Cap Series LLC |
| | | | | | | | | | |
Year Ended September 30, 2012 | | Master Large
Cap Core
Portfolio | | Master Large
Cap Growth
Portfolio | | Master Large
Cap Value
Portfolio | |
Investment Income | | | | | | | | | | |
Dividends — unaffiliated | | $ | 51,275,739 | | $ | 22,963,210 | | $ | 28,100,552 | |
Foreign taxes withheld | | | (580,216 | ) | | (241,565 | ) | | (347,169 | ) |
Securities lending — affiliated | | | 2,346,365 | | | 1,088,969 | | | 1,338,578 | |
Dividends — affiliated | | | 19,320 | | | 14,198 | | | 11,265 | |
Total income | | | 53,061,208 | | | 23,824,812 | | | 29,103,226 | |
| | | | | | | | | | |
Expenses | | | | | | | | | | |
Investment advisory | | | 11,473,651 | | | 5,538,086 | | | 6,460,929 | |
Accounting services | | | 442,419 | | | 252,297 | | | 281,782 | |
Custodian | | | 125,522 | | | 79,689 | | | 59,555 | |
Professional | | | 107,939 | | | 111,591 | | | 105,694 | |
Directors | | | 81,672 | | | 38,622 | | | 45,664 | |
Printing | | | 12,024 | | | 11,546 | | | 11,025 | |
Miscellaneous | | | 46,622 | | | 21,263 | | | 36,101 | |
Total expenses | | | 12,289,849 | | | 6,053,094 | | | 7,000,750 | |
Less fees waived by Manager | | | (9,138 | ) | | (6,706 | ) | | — | |
Total expenses after fees waived | | | 12,280,711 | | | 6,046,388 | | | 7,000,750 | |
Net investment income | | | 40,780,497 | | | 17,778,424 | | | 22,102,476 | |
| | | | | | | | | | |
Realized and Unrealized Gain (Loss) | | | | | | | | | | |
Net realized gain (loss) from: | | | | | | | | | | |
Investments | | | 115,018,419 | | | 68,729,046 | | | 55,256,631 | |
Foreign currency transactions | | | (16,762 | ) | | (8,043 | ) | | (7,848 | ) |
| | | 115,001,657 | | | 68,721,003 | | | 55,248,783 | |
Net change in unrealized appreciation/depreciation on investments | | | 492,381,340 | | | 224,038,951 | | | 230,561,018 | |
Total realized and unrealized gain | | | 607,382,997 | | | 292,759,954 | | | 285,809,801 | |
Net Increase in Net Assets Resulting from Operations | | $ | 648,163,494 | | $ | 310,538,378 | | $ | 307,912,277 | |
| | | |
See Notes to Financial Statements. |
| | | |
| BLACKROCK LARGE CAP SERIES FUNDS, INC. | SEPTEMBER 30, 2012 | 31 |
| |
| |
Statements of Changes in Net Assets | Master Large Cap Series LLC |
| | | | | | | | | | | | | |
| | Master Large Cap Core Portfolio | | Master Large Cap Growth Portfolio | |
| | Year Ended September 30, | | Year Ended September 30, | |
Increase (Decrease) in Net Assets: | | 2012 | | 2011 | | 2012 | | 2011 | |
Operations | | | | | | | | | | | | | |
Net investment income | | $ | 40,780,497 | | $ | 36,709,241 | | $ | 17,778,424 | | $ | 9,136,074 | |
Net realized gain | | | 115,001,657 | | | 416,733,032 | | | 68,721,003 | | | 98,414,186 | |
Net change in unrealized appreciation/depreciation | | | 492,381,340 | | | (385,934,163 | ) | | 224,038,951 | | | (104,232,883 | ) |
Net increase in net assets resulting from operations | | | 648,163,494 | | | 67,508,110 | | | 310,538,378 | | | 3,317,377 | |
| | | | | | | | | | | | | |
Capital Transactions | | | | | | | | | | | | | |
Proceeds from contributions | | | 328,459,593 | | | 406,268,108 | | | 283,535,489 | | | 735,119,380 | |
Value of withdrawals | | | (964,485,911 | ) | | (1,376,548,462 | ) | | (675,721,332 | ) | | (414,991,509 | ) |
Net increase (decrease) in net assets derived from capital transactions | | | (636,026,318 | ) | | (970,280,354 | ) | | (392,185,843 | ) | | 320,127,871 | |
| | | | | | | | | | | | | |
Net Assets | | | | | | | | | | | | | |
Total increase (decrease) in net assets | | | 12,137,176 | | | (902,772,244 | ) | | (81,647,465 | ) | | 323,445,248 | |
Beginning of year | | | 2,306,713,577 | | | 3,209,485,821 | | | 995,279,213 | | | 671,833,965 | |
End of year | | $ | 2,318,850,753 | | $ | 2,306,713,577 | | $ | 913,631,748 | | $ | 995,279,213 | |
| | | | | | | |
| | Master Large Cap Value Portfolio | |
| | Year Ended September 30, | |
Increase (Decrease) in Net Assets: | | 2012 | | 2011 | |
Operations | | | | | | | |
Net investment income | | $ | 22,102,476 | | $ | 25,257,741 | |
Net realized gain | | | 55,248,783 | | | 213,756,849 | |
Net change in unrealized appreciation/depreciation | | | 230,561,018 | | | (191,911,553 | ) |
Net increase in net assets resulting from operations | | | 307,912,277 | | | 47,103,037 | |
| | | | | | | |
Capital Transactions | | | | | | | |
Proceeds from contributions | | | 186,480,972 | | | 499,193,583 | |
Value of withdrawals | | | (761,671,551 | ) | | (1,388,336,955 | ) |
Net decrease in net assets derived from capital transactions | | | (575,190,579 | ) | | (889,143,372 | ) |
| | | | | | | |
Net Assets | | | | | | | |
Total decrease in net assets | | | (267,278,302 | ) | | (842,040,335 | ) |
Beginning of year | | | 1,331,101,826 | | | 2,173,142,161 | |
End of year | | $ | 1,063,823,524 | | $ | 1,331,101,826 | |
| | | |
See Notes to Financial Statements. |
| | | |
32 | BLACKROCK LARGE CAP SERIES FUNDS, INC. | SEPTEMBER 30, 2012 | |
| |
| |
Financial Highlights | Master Large Cap Series LLC |
| | | | | | | | | | | | | | | | | | | |
| | Master Large Cap Core Portfolio | |
| | | | | | | | | | | Period
November 1,
2008 to
September 30,
2009 | | | | | | | |
| | | | | | | | | | | | | | | | | |
| | | | | | | | | | | | Year Ended | |
| | Year Ended September 30, | | | October 31, | |
| | 2012 | | 2011 | | 2010 | | | 2008 | | 2007 | |
Total Investment Return | | | | | | | | | | | | | | | | | | | |
Total investment return | | | 29.97 | % | | (1.61 | )% | | 6.16 | % | | 12.63 | %1,2 | | (38.84 | )% | | 13.94 | % |
| | | | | | | | | | | | | | | | | | | |
Ratios to Average Net Assets | | | | | | | | | | | | | | | | | | | |
Total expenses | | | 0.50 | % | | 0.49 | % | | 0.49 | % | | 0.50 | %3 | | 0.50 | % | | 0.49 | % |
Total expenses after fees waived | | | 0.50 | % | | 0.49 | % | | 0.49 | % | | 0.50 | %3 | | 0.50 | % | | 0.49 | % |
Net investment income | | | 1.67 | % | | 1.13 | % | | 1.11 | % | | 1.56 | %3 | | 0.93 | % | | 0.63 | % |
| | | | | | | | | | | | | | | | | | | |
Supplemental Data | | | | | | | | | | | | | | | | | | | |
Net assets, end of period (000) | | $ | 2,318,851 | | $ | 2,306,714 | | $ | 3,209,486 | | $ | 3,946,322 | | $ | 2,843,515 | | $ | 5,649,731 | |
Portfolio turnover | | | 128 | % | | 129 | % | | 173 | % | | 168 | % | | 109 | % | | 96 | % |
| | |
| 1 | Aggregate total investment return. |
| | |
| 2 | Includes proceeds received from a settlement of litigation, which impacted the Portfolio’s total investment return. Not including these proceeds, the Portfolio’s total investment return would have been 12.39%. |
| | |
| 3 | Annualized. |
| | | |
See Notes to Financial Statements. |
| | | |
| BLACKROCK LARGE CAP SERIES FUNDS, INC. | SEPTEMBER 30, 2012 | 33 |
| |
| |
Financial Highlights (continued) | Master Large Cap Series LLC |
| | | | | | | | | | | | | | | | | | | |
| | Master Large Cap Growth Portfolio | |
| | | | | | | | | | | Period
November 1,
2008 to
September 30,
2009 | | | | | | | |
| | | | | | | | | | | | | | | | | |
| | | | | | | | | | | | Year Ended | |
| | Year Ended September 30, | | | October 31, | |
| | 2012 | | 2011 | | 2010 | | | 2008 | | 2007 | |
Total Investment Return | | | | | | | | | | | | | | | | | | | |
Total investment return | | | 31.61 | % | | 0.72 | % | | 7.68 | % | | 20.49 | %1,2 | | (37.96 | )% | | 17.47 | % |
| | | | | | | | | | | | | | | | | | | |
Ratios to Average Net Assets | | | | | | | | | | | | | | | | | | | |
Total expenses | | | 0.55 | % | | 0.54 | % | | 0.56 | % | | 0.57 | %3 | | 0.56 | % | | 0.56 | % |
Total expenses after fees waived | | | 0.55 | % | | 0.54 | % | | 0.56 | % | | 0.57 | %3 | | 0.56 | % | | 0.56 | % |
Net investment income | | | 1.61 | % | | 0.93 | % | | 0.73 | % | | 0.81 | %3 | | 0.54 | % | | 0.25 | % |
| | | | | | | | | | | | | | | | | | | |
Supplemental Data | | | | | | | | | | | | | | | | | | | |
Net assets, end of period (000) | | $ | 913,632 | | $ | 995,279 | | $ | 671,834 | | $ | 733,888 | | $ | 665,963 | | $ | 1,233,995 | |
Portfolio turnover | | | 132 | % | | 169 | % | | 232 | % | | 242 | % | | 144 | % | | 87 | % |
| | |
| 1 | Aggregate total investment return. |
| | |
| 2 | Includes proceeds received from a settlement of litigation, which impacted the Portfolio’s total investment return. Not including these proceeds, the Portfolio’s total investment return would have been 20.23%. |
| | |
| 3 | Annualized. |
| | | |
See Notes to Financial Statements. |
| | | |
34 | BLACKROCK LARGE CAP SERIES FUNDS, INC. | SEPTEMBER 30, 2012 | |
| |
| |
Financial Highlights (concluded) | Master Large Cap Series LLC |
| | | | | | | | | | | | | | | | | | | |
| | Master Large Cap Value Portfolio | |
| | | | | | | | | | | Period
November 1,
2008 to
September 30,
2009 | | | | | | | |
| | | | | | | | | | | | | | | | | |
| | | | | | | | | | | | Year Ended | |
| | Year Ended September 30, | | | October 31, | |
| | 2012 | | 2011 | | 2010 | | | 2008 | | 2007 | |
Total Investment Return | | | | | | | | | | | | | | | | | | | |
Total investment return | | | 25.26 | % | | (4.34 | )% | | 4.36 | % | | 9.03 | %1,2 | | (36.54 | )% | | 12.72 | % |
| | | | | | | | | | | | | | | | | | | |
Ratios to Average Net Assets | | | | | | | | | | | | | | | | | | | |
Total expenses | | | 0.54 | % | | 0.54 | % | | 0.53 | % | | 0.54 | %3 | | 0.51 | % | | 0.51 | % |
Total expenses after fees waived | | | 0.54 | % | | 0.54 | % | | 0.53 | % | | 0.54 | %3 | | 0.51 | % | | 0.51 | % |
Net investment income | | | 1.71 | % | | 1.28 | % | | 1.35 | % | | 1.88 | %3 | | 1.22 | % | | 0.95 | % |
| | | | | | | | | | | | | | | | | | | |
Supplemental Data | | | | | | | | | | | | | | | | | | | |
Net assets, end of period (000) | | $ | 1,063,824 | | $ | 1,331,102 | | $ | 2,173,142 | | $ | 2,645,858 | | $ | 3,063,116 | | $ | 5,392,155 | |
Portfolio turnover | | | 147 | % | | 156 | % | | 183 | % | | 151 | % | | 108 | % | | 72 | % |
| | |
| 1 | Aggregate total investment return. |
| | |
| 2 | Includes proceeds received from a settlement of litigation, which impacted the Portfolio’s total investment return. Not including these proceeds, the Portfolio’s total investment return would have been 8.61%. |
| | |
| 3 | Annualized. |
| | | |
See Notes to Financial Statements. |
| | | |
| BLACKROCK LARGE CAP SERIES FUNDS, INC. | SEPTEMBER 30, 2012 | 35 |
| |
| |
Notes to Financial Statements | Master Large Cap Series LLC |
1. Organization and Significant Accounting Policies:
Master Large Cap Core Portfolio, Master Large Cap Growth Portfolio and Master Large Cap Value Portfolio (collectively the “Portfolios” or individually a “Portfolio”) are each series of Master Large Cap Series LLC (the “Master LLC”). The Master LLC is registered under the Investment Company Act of 1940, as amended (the “1940 Act”), as an open-end management investment company and is organized as a Delaware limited liability company. Each Portfolio is classified as diversified. The Limited Liability Company Agreement permits the Board of Directors of the Master LLC (the “Board”) to issue nontransferable interests in the Master LLC, subject to certain limitations. The Portfolios’ financial statements are prepared in conformity with accounting principles generally accepted in the United States of America (“US GAAP”), which may require management to make estimates and assumptions that affect the reported amounts of assets and liabilities in the financial statements and the reported amount of increases and decreases in net assets from operations during the reporting period. Actual results could differ from those estimates.
The following is a summary of significant accounting policies followed by the Portfolios:
Valuation: US GAAP defines fair value as the price the Portfolios would receive to sell an asset or pay to transfer a liability in an orderly transaction between market participants at the measurement date. The Portfolios fair value their financial instruments at market value using independent dealers or pricing services under policies approved by the Board. The BlackRock Global Valuation Methodologies Committee (the “Global Valuation Committee”) is the committee formed by management to develop global pricing policies and procedures and to provide oversight of the pricing function for the Portfolios for all financial instruments.
Equity investments traded on a recognized securities exchange or the NASDAQ Global Market System (“NASDAQ”) are valued at the last reported sale price that day or the NASDAQ official closing price, if applicable. For equity investments traded on more than one exchange, the last reported sale price on the exchange where the stock is primarily traded is used. Equity investments traded on a recognized exchange for which there were no sales on that day are valued at the last available bid (long positions) or ask (short positions) price. If no bid or ask price is available, the prior day’s price will be used, unless it is determined that such prior day’s price no longer reflects the fair value of the security. Investments in open-end registered investment companies are valued at NAV each business day. Short-term securities with remaining maturities of 60 days or less may be valued at amortized cost, which approximates fair value.
The Portfolios value their investments in BlackRock Liquidity Series, LLC Money Market Series (the “Money Market Series”) at fair value, which is ordinarily based upon their pro rata ownership in the underlying fund’s net assets. The Money Market Series seeks current income consistent with maintaining liquidity and preserving capital. Although the Money Market Series is not registered under the 1940 Act, its investments will follow the parameters of investments by a money market fund that is subject to Rule 2a-7 under the 1940 Act. The Portfolios may withdraw up to 25% of their investment daily, although the manager of the Money Market Series, in its sole discretion, may permit an investor to withdraw more than 25% on any one day.
In the event that application of these methods of valuation results in a price for an investment which is deemed not to be representative of the market value of such investment or if a price is not available, the investment will be valued by the Global Valuation Committee, or its delegate, in accordance with a policy approved by the Board as reflecting fair value (“Fair Value Assets”). When determining the price for Fair Value Assets, the Global Valuation Committee, or its delegate, seeks to determine the price that the Portfolios might reasonably expect to receive from the current sale of that asset in an arm’slength transaction. Fair value determinations shall be based upon all available factors that the investment advisor and/or sub-advisor deems relevant consistent with the principles of fair value measurement which include the market approach, income approach and/or cost approach, as appropriate. A market approach generally consists of using comparable market transactions. The income approach generally is used to discount future cash flows to present value and adjusted for liquidity as appropriate. These factors include but are not limited to (i) attributes specific to the investment or asset; (ii) the principal market for the investment or asset; (iii) the customary participants in the principal market for the investment or asset; (iv) data assumptions by market participants for the investment or asset, if reasonably available; (v) quoted prices for similar investments or assets in active markets; and (vi) other factors, such as future cash flows, interest rates, yield curves, volatilities, prepayment speeds, loss severities, credit risks, recovery rates, liquidation amounts and/or default rates. Due to the inherent uncertainty of valuations of such investments, the fair values may differ from the values that would have been used had an active market existed. The Global Valuation Committee, or its delegate, employs various methods for calibrating valuation approaches for investments where an active market does not exist including regular due diligence of the Portfolios’ pricing vendors, a regular review of key inputs and assumptions, transactional back-testing or disposition analysis to compare unrealized gains and losses to realized gains and losses, reviews of missing or stale prices and large movements in market values and reviews of any market related activity. The pricing of all Fair Value Assets is subsequently reported to the Board or a committee thereof on a quarterly basis.
Foreign Currency: The Portfolios’ books and records are maintained in US dollars. Purchases and sales of investment securities are recorded at the rates of exchange prevailing on the respective date of such transactions. Generally, when the US dollar rises in value against a foreign currency, the Portfolios’ investments denominated in that currency will lose value because that currency is worth fewer US dollars; the opposite effect occurs if the US dollar falls in relative value.
Segregation and Collateralization: In cases in which the 1940 Act and the interpretive positions of the Securities and Exchange Commission (“SEC”) require that the Portfolios either deliver collateral or segregate assets in connection with certain investments (e.g., foreign currency exchange contracts), the Portfolios will, consistent with SEC rules and/or certain interpretive letters issued by the SEC, segregate collateral or designate on its books and records cash or liquid securities having a market value at least equal to the amount that would otherwise be required to be physically segregated. Furthermore, based on requirements and agreements with certain exchanges and third party broker-dealers, each party to the Portfolios engaging in such transactions may have requirements to deliver/deposit securities to/with an exchange or broker-dealer as collateral for certain investments.
| | |
| | |
36 | BLACKROCK LARGE CAP SERIES FUNDS, INC. | SEPTEMBER 30, 2012 |
| |
| |
Notes to Financial Statements (continued) | Master Large Cap Series LLC |
Investment Transactions and Investment Income: For financial reporting purposes, investment transactions are recorded on the dates the transactions are entered into (the trade dates). Realized gains and losses on investment transactions are determined on the identified cost basis. Dividend income is recorded on the ex-dividend dates. Dividends from foreign securities where the ex-dividend date may have passed are subsequently recorded when the Portfolios are informed of the ex-dividend date. Under the applicable foreign tax laws, a withholding tax at various rates may be imposed on capital gains, dividends and interest. Upon notification from issuers, some of the dividend income received from a real estate investment trust may be redesignated as a reduction of cost of the related investment and/or realized gain. Interest income, including amortization and accretion of premiums and discounts on debt securities, is recognized on the accrual basis.
Securities Lending: The Portfolios may lend securities to approved borrowers, such as banks, brokers and other financial institutions. The borrower pledges cash, securities issued or guaranteed by the US government or irrevocable letters of credit issued by a bank as collateral, which will be maintained at all times in an amount equal to at least 100% of the current market value of the loaned securities. The market value of the loaned securities is determined at the close of business of the Portfolios and any additional required collateral is delivered to the Portfolios on the next business day. Securities lending income, as disclosed in the Statements of Operations, represents the income earned from the investment of the cash collateral, net of rebates paid to, or fees paid by, borrowers and less the fees paid to the securities lending agent. During the term of the loan, the Portfolios earn dividend or interest income on the securities loaned but do not receive interest income on the securities received as collateral. Loans of securities are terminable at any time and the borrower, after notice, is required to return borrowed securities within the standard time period for settlement of securities transactions. In the event that the borrower defaults on its obligation to return borrowed securities because of insolvency or for any other reason, the Portfolios could experience delays and costs in gaining access to the collateral. The Portfolios also could suffer a loss if the value of an investment purchased with cash collateral falls below the market value of loaned securities or if the value of an investment purchased with cash collateral falls below the value of the original cash collateral received. During the year ended September 30, 2012, any securities on loan were collateralized by cash.
Income Taxes: The Portfolios are classified as a partnership for federal income tax purposes. As such, each investor in the Portfolios is treated as the owner of its proportionate share of net assets, income, expenses and realized and unrealized gains and losses of the Portfolios. Therefore, no federal income tax provision is required. It is intended that the Portfolios’ assets will be managed so an investor in the Portfolios can satisfy the requirements of Subchapter M of the Internal Revenue Code of 1986, as amended.
The Portfolios file US federal and various state and local tax returns. The statute of limitations on the Portfolios’ US federal tax returns remains open for each of the three years ended September 30, 2012 and the period ended September 30, 2009. In May 2011, the Internal Revenue Service commenced an examination of Master Large Cap Growth Portfolio’s US federal tax return for the year ended September 30, 2009. The examination was completed in February 2012 and did not result in any adjustments to the tax return. The statutes of limitations on the Portfolios’ state and local tax returns may remain open for an additional year depending upon the jurisdiction. Management does not believe there are any uncertain tax positions that require recognition of a tax liability.
Recent Accounting Standard: In December 2011, the Financial Accounting Standards Board issued guidance that will expand current disclosure requirements on the offsetting of certain assets and liabilities. The new disclosures will be required for investments and derivative financial instruments subject to master netting or similar agreements which are eligible for offset in the Statements of Assets and Liabilities and will require an entity to disclose both gross and net information about such investments and transactions in the financial statements. The guidance is effective for financial statements with fiscal years beginning on or after January 1, 2013, and interim periods within those fiscal years. Management is evaluating the impact of this guidance on the Portfolios’ financial statement disclosures.
Other: Expenses directly related to one of the Portfolios is charged to that Portfolio. Other operating expenses shared by several funds are pro rated among those funds on the basis of relative net assets or other appropriate methods.
Each Portfolio has an arrangement with the custodian whereby fees may be reduced by credits earned on uninvested cash balances, which, if applicable, are shown as fees paid indirectly in the Statements of Operations. The custodian imposes fees on overdrawn cash balances, which can be offset by accumulated credits earned or may result in additional custody charges.
2. Derivative Financial Instruments:
The Portfolios engage in various portfolio investment strategies using derivative contracts both to increase the returns of the Portfolios and/or to economically hedge, or protect, their exposure to certain risks such as foreign currency exchange rate risk. These contracts may be transacted on an exchange or OTC.
Losses may arise if the value of the contract decreases due to an unfavorable change in the market rates or values of the underlying instrument or if the counterparty does not perform under the contract. The Portfolios’ maximum risk of loss from counterparty credit risk on OTC derivatives is generally the aggregate unrealized gain netted against any collateral pledged by/posted to the counterparty.
The Portfolios may mitigate counterparty risk by procuring collateral and through netting provisions included within an International Swaps and Derivatives Association, Inc. master agreement (“ISDA Master Agreement”) implemented between the Portfolios and each of its respective counterparties. An ISDA Master Agreement allows each Portfolio to offset with each separate counterparty certain derivative financial instrument’s payables and/or receivables with collateral held. The amount of collateral moved to/from applicable counterparties is generally based upon minimum transfer amounts of up to $500,000. To the extent amounts due to the Portfolios from their counterparties are not fully collateralized, contractually or otherwise, the Portfolios bear the risk of loss from counterparty non-performance. See Note 1 “Segregation and Collateralization” for information with respect
| | | |
| | | |
| BLACKROCK LARGE CAP SERIES FUNDS, INC. | SEPTEMBER 30, 2012 | 37 |
| |
| |
Notes to Financial Statements (continued) | Master Large Cap Series LLC |
to collateral practices. In addition, the Portfolios manage counterparty risk by entering into agreements only with counterparties that it believes have the financial resources to honor their obligations and by monitoring the financial stability of those counterparties.
Certain ISDA Master Agreements allow counterparties to OTC derivatives to terminate derivative contracts prior to maturity in the event the Portfolios’ net assets decline by a stated percentage or the Portfolios fail to meet the terms of its ISDA Master Agreements, which would cause the Portfolios to accelerate payment of any net liability owed to the counterparty.
Foreign Currency Exchange Contracts: The Portfolios enter into foreign currency exchange contracts as an economic hedge against either specific transactions or portfolio instruments or to obtain exposure to foreign currencies (foreign currency exchange rate risk). A foreign currency exchange contract is an agreement between two parties to buy and sell a currency at a set exchange rate on a future date. Foreign currency exchange contracts, when used by the Portfolios, help to manage the overall exposure to the currencies in which some of the investments held by the Portfolios are denominated. The contract is marked-to-market daily and the change in market value is recorded by the Portfolios as an unrealized gain or loss. When the contract is closed, the Portfolios record a realized gain or loss equal to the difference between the value at the time it was opened and the value at the time it was closed. The use of foreign currency exchange contracts involves the risk that the value of a foreign currency exchange contract changes unfavorably due to movements in the value of the referenced foreign currencies and the risk that the counterparty to the contract does not perform its obligations under the agreement.
| | | | | | | | | | |
Derivative Financial Instruments Categorized by Risk Exposure: | |
| |
The Effect of Derivative Financial Instruments in the Statements of Operations
Year Ended September 30, 2012 | |
| | Net Realized Loss From | |
| | Master
Large Cap
Core
Portfolio | | Master
Large Cap
Growth
Portfolio | | Master
Large Cap
Value
Portfolio | |
Foreign currency exchange contracts: | | | | | | | | | | |
Foreign currency transactions | | $ | (18,655 | ) | $ | (8,951 | ) | $ | (8,734 | ) |
For the year ended September 30, 2012, the average quarterly balances of outstanding derivative financial instruments were as follows:
| | | | | | | | | | |
| | Master
Large Cap
Core
Portfolio | | Master
Large Cap
Growth
Portfolio | | Master
Large Cap
Value
Portfolio | |
Foreign currency exchange contracts: | | | | | | | | | | |
Average number of contracts —
US dollars sold1 | | | 1 | | | 1 | | | 1 | |
Average US dollar amounts sold1 | | $ | 140,578 | | $ | 67,453 | | $ | 65,814 | |
| | |
| 1 | Average contract amount shown due to limited activity. |
3. Investment Advisory Agreement and Other Transactions with Affiliates:
The PNC Financial Services Group, Inc. (“PNC”) is the largest stockholder and an affiliate, for 1940 Act purposes, of BlackRock, Inc. (“BlackRock”).
The Master LLC, on behalf of each Portfolio, entered into an Investment Advisory Agreement with BlackRock Advisors, LLC (the “Manager”), the Portfolios’ investment advisor, an indirect, wholly owned subsidiary of BlackRock, to provide investment advisory and administration services. The Manager is responsible for the management of each Portfolio and provides the necessary personnel, facilities, equipment and certain other services necessary to the operations of each Portfolio. For such services, each Portfolio pays the Manager a monthly fee based on a percentage of each Portfolio’s average daily net assets at the following annual rates:
| | | | |
Master Large Cap Core Portfolio | | | | |
| | | | |
Average Daily Net Assets | | | Rate | |
Not exceeding $1 Billion | | | 0.50 | % |
In excess of $1 Billion, but not exceeding $5 Billion | | | 0.45 | % |
In excess of $5 Billion | | | 0.40 | % |
| | | | |
Master Large Cap Growth Portfolio | | | | |
| | | | |
Average Daily Net Assets | | | Rate | |
Not exceeding $5 Billion | | | 0.50 | % |
In excess of $5 Billion | | | 0.45 | % |
| | | | |
Master Large Cap Value Portfolio | | | | |
| | | | |
Average Daily Net Assets | | | Rate | |
Not exceeding $3 Billion | | | 0.50 | % |
In excess of $3 Billion | | | 0.45 | % |
The Manager voluntarily agreed to waive its investment advisory fees by the amount of investment advisory fees each Portfolio pays to the Manager indirectly through its investment in affiliated money market funds. However, the Manager does not waive its investment advisory fees by the amount of investment advisory fees paid in connection with each Portfolio’s investment in other affiliated investment companies, if any. These amounts are included in fees waived by Manager in the Statements of Operations.
The Manager entered into a sub-advisory agreement with BlackRock Investment Management LLC (“BIM”), an affiliate of the Manager. The Manager pays BIM, for services it provides, a monthly fee that is a percentage of the investment advisory fees paid by each Portfolio to the Manager.
For the year ended September 30, 2012, the Portfolios reimbursed the Manager for certain accounting services, which is included in accounting services in the Statements of Operations. The reimbursements were as follows:
| | | | |
Master Large Cap Core Portfolio | | $ | 26,212 | |
Master Large Cap Growth Portfolio | | $ | 12,224 | |
Master Large Cap Value Portfolio | | $ | 13,777 | |
| | |
| | |
38 | BLACKROCK LARGE CAP SERIES FUNDS, INC. | SEPTEMBER 30, 2012 |
| |
| |
Notes to Financial Statements (concluded) | Master Large Cap Series LLC |
The Portfolios received an exemptive order from the SEC permitting them, among other things, to pay an affiliated securities lending agent a fee based on a share of the income derived from the securities lending activities and has retained BIM as the securities lending agent. BIM may, on behalf of the Portfolios, invest cash collateral received by the Portfolios for such loans, among other things, in a private investment company managed by the Manager or in registered money market funds advised by the Manager or its affiliates. As securities lending agent, BIM is responsible for all transaction fees and all other operational costs relating to securities lending activities, other than extraordinary expenses. BIM does not receive any fees for managing the cash collateral. The market value of securities on loan and the value of the related collateral, if applicable, are shown in the Statements of Assets and Liabilities as securities loaned at value and collateral on securities loaned at value, respectively. The cash collateral invested by BIM is disclosed in the Schedules of Investments, if any. Securities lending income is equal to the total of income earned from the reinvestment of cash collateral, net of rebates paid to, or fees paid by, borrowers of securities. The Portfolios retain 65% of securities lending income and pay a fee to BIM equal to 35% of such income. The share of income earned by the Portfolios on the reinvestment of cash collateral is shown as securities lending — affiliated in the Statements of Operations. For the year ended September 30, 2012, BIM received the following in securities lending agent fees related to securities lending activities for the Portfolios:
| | | | |
Master Large Cap Core Portfolio | | $ | 1,264,206 | |
Master Large Cap Growth Portfolio | | $ | 586,658 | |
Master Large Cap Value Portfolio | | $ | 717,015 | |
Certain officers and/or directors of the Master LLC are officers and/or directors of BlackRock or its affiliates.
4. Investments:
Purchases and sales of investments, excluding short-term securities for the year ended September 30, 2012, were as follows:
| | | | | | | |
| | Purchases | | Sales | |
Master Large Cap Core Portfolio | | $ | 3,101,051,925 | | $ | 3,747,027,615 | |
Master Large Cap Growth Portfolio | | $ | 1,430,353,381 | | $ | 1,824,270,240 | |
Master Large Cap Value Portfolio | | $ | 1,883,007,619 | | $ | 2,447,617,697 | |
5. Borrowings:
The Master LLC, on behalf of the Portfolios, along with certain other funds managed by the Manager and its affiliates, is a party to a $500 million credit agreement with a group of lenders. Each Portfolio may borrow under the credit agreement to fund shareholder redemptions. Effective November 2010 to November 2011, the credit agreement had the following terms: a commitment fee of 0.08% per annum based on each Portfolio’s pro rata share of the unused portion of the credit agreement and interest at a rate equal to the higher of (a) the one-month London Interbank Offered Rate (“LIBOR”) plus 1.00% per annum or (b) the Fed Funds rate plus 1.00% per annum on amounts borrowed. In addition, each Portfolio paid administration and arrangement fees which were allocated to each Portfolio based on its net assets as of October 31, 2010. The credit agreement, which expired in November 2011, was renewed until November 2012. Effective November 2011 to November 2012, the credit agreement has the following terms: a commitment fee of 0.065% per annum based on each Portfolio’s pro rata share of the unused portion of the credit agreement and interest at a rate equal to the higher of (a) the one-month LIBOR plus 0.80% per annum or (b) the Fed Funds rate plus 0.80% per annum on amounts borrowed. In addition, each Portfolio paid administration and arrangement fees which were allocated to the Portfolios based on their net assets as of October 31, 2011. The Portfolios did not borrow under the credit agreement during the year ended September 30, 2012.
6. Concentration, Market and Credit Risk:
In the normal course of business, the Portfolios invest in securities and enter into transactions where risks exist due to fluctuations in the market (market risk) or failure of the issuer of a security to meet all its obligations (issuer credit risk). The value of securities held by the Portfolios may decline in response to certain events, including those directly involving the issuers whose securities are owned by the Portfolios; conditions affecting the general economy; overall market changes; local, regional or global political, social or economic instability; and currency and interest rate and price fluctuations. Similar to issuer credit risk, the Portfolios may be exposed to counterparty credit risk, or the risk that an entity with which the Portfolios have unsettled or open transactions may fail to or be unable to perform on its commitments. The Portfolios manage counterparty credit risk by entering into transactions only with counterparties that they believe have the financial resources to honor their obligations and by monitoring the financial stability of those counterparties. Financial assets, which potentially expose the Portfolios to market, issuer and counterparty credit risks, consist principally of financial instruments and receivables due from counterparties. The extent of the Portfolios’ exposure to market, issuer and counterparty credit risks with respect to these financial assets is generally approximated by their value recorded in the Statements of Assets and Liabilities, less any collateral held by the Portfolios.
As of September 30, 2012, Master Large Cap Growth Portfolio invested a significant portion of its assets in securities in the information technology sector and Master Large Cap Value Portfolio invested a significant portion of its assets in securities in the financials sector. Changes in economic conditions affecting the information technology and financial sectors would have a greater impact on the Portfolios and could affect the value, income and/or liquidity of positions in such securities.
7. Subsequent Events:
Management has evaluated the impact of all subsequent events on each Portfolio through the date the financial statements were issued and has determined that there were no subsequent events requiring adjustment or additional disclosure in the financial statements.
| | | |
| | | |
| BLACKROCK LARGE CAP SERIES FUNDS, INC. | SEPTEMBER 30, 2012 | 39 |
| |
| |
Report of Independent Registered Public Accounting Firm | Master Large Cap Series LLC |
To the Investors and Board of Directors of Master Large Cap Series LLC:
We have audited the accompanying statements of assets and liabilities of Master Large Cap Series LLC (the “Master LLC”), comprised of Master Large Cap Core Portfolio, Master Large Cap Growth Portfolio and Master Large Cap Value Portfolio, including the schedules of investments, as of September 30, 2012, and the related statements of operations for the year then ended, the statements of changes in net assets for each of the two years in the period then ended, and the financial highlights for each of the periods presented. These financial statements and financial highlights are the responsibility of the Master LLC’s management. Our responsibility is to express an opinion on these financial statements and financial highlights based on our audits.
We conducted our audits in accordance with the standards of the Public Company Accounting Oversight Board (United States). Those standards require that we plan and perform the audit to obtain reasonable assurance about whether the financial statements and financial highlights are free of material misstatement. The Master LLC is not required to have, nor were we engaged to perform, an audit of their internal control over financial reporting. Our audits included consideration of internal control over financial reporting as a basis for designing audit procedures that are appropriate in the circumstances, but not for the purpose of expressing an opinion on the effectiveness of the Master LLC’s internal control over financial reporting. Accordingly, we express no such opinion. An audit also includes examining, on a test basis, evidence supporting the amounts and disclosures in the financial statements, assessing the accounting principles used and significant estimates made by management, as well as evaluating the overall financial statement presentation. Our procedures included confirmation of securities owned as of September 30, 2012, by correspondence with the custodian and brokers; where replies were not received from brokers, we performed other auditing procedures. We believe that our audits provide a reasonable basis for our opinion.
In our opinion, the financial statements and financial highlights referred to above present fairly, in all material respects, the financial positions of Master Large Cap Core Portfolio, Master Large Cap Growth Portfolio and Master Large Cap Value Portfolio, each a series of Master Large Cap Series LLC, as of September 30, 2012, the results of their operations for the year then ended, the changes in their net assets for each of the two years in the period then ended, and the financial highlights for each of the periods presented, in conformity with accounting principles generally accepted in the United States of America.
Deloitte & Touche LLP
Boston, Massachusetts
November 21, 2012
| | |
| | |
40 | BLACKROCK LARGE CAP SERIES FUNDS, INC. | SEPTEMBER 30, 2012 |
|
|
Disclosure of Investment Advisory Agreement and Sub-Advisory Agreement |
The Board of Directors of Master Large Cap Series LLC (the “Master LLC”) met on April 17, 2012 and May 15–16, 2012 to consider the approval of the Master LLC’s investment advisory agreement (the “Advisory Agreement”) with BlackRock Advisors, LLC (the “Manager”), the Master LLC’s investment advisor, on behalf of each of Master Large Cap Core Portfolio, Master Large Cap Growth Portfolio and Master Large Cap Value Portfolio (each a “Master Portfolio,” and together, the “Master Portfolios”), each a series of the Master LLC. The Board of Directors of the Master LLC also considered the approval of the sub-advisory agreement (the “Sub-Advisory Agreement”) between the Manager and BlackRock Investment Management, LLC (the “Sub-Advisor”), with respect to each Master Portfolio. Each of BlackRock Large Cap Core Retirement Portfolio, BlackRock Large Cap Growth Retirement Portfolio and BlackRock Large Cap Value Retirement Portfolio (each, a “Feeder Fund,” and together, the “Feeder Funds”), each a series of BlackRock Large Cap Series Funds, Inc. (the “Corporation”), is a “feeder” fund that invests all of its investable assets in the corresponding Master Portfolio. Accordingly, the Board of Directors of the Corporation also considered the approval of the Advisory Agreement and the Sub-Advisory Agreement with respect to the Master Portfolios. The Manager and the Sub-Advisor are referred to herein as “BlackRock.” The Advisory Agreement and the Sub-Advisory Agreement are referred to herein as the “Agreements.” For simplicity, the Board of Directors of the Master LLC and the Board of Directors of the Corporation are referred to herein collectively as the “Board,” and the members are referred to as “Board Members.”
Activities and Composition of the Board
The Board consists of fourteen individuals, twelve of whom are not “interested persons” of the Master LLC or the Corporation as defined in the Investment Company Act of 1940, as amended (the “1940 Act”) (the “Independent Board Members”). The Board Members are responsible for the oversight of the operations of the Master LLC or the Corporation, as pertinent, and perform the various duties imposed on the directors of investment companies by the 1940 Act. The Independent Board Members have retained independent legal counsel to assist them in connection with their duties. The Co-Chairs of the Board are each Independent Board Members. The Board has established five standing committees: an Audit Committee, a Governance and Nominating Committee, a Compliance Committee, a Performance Oversight and Contract Committee and an Executive Committee, each of which is chaired by an Independent Board Member and composed of Independent Board Members (except for the Executive Committee, which also has one interested Board Member).
The Agreements
Pursuant to the 1940 Act, the Board is required to consider the continuation of the Agreements on an annual basis. The Board has four quarterly meetings per year, each extending over two days, and a fifth meeting to consider specific information surrounding the consideration of renewing the Agreements. In connection with this process, the Board assessed, among other things, the nature, scope and quality of the services provided to each Master Portfolio and Feeder Fund by BlackRock, its personnel and its affiliates, including investment management, administrative and shareholder services, oversight of fund accounting and custody, marketing services, risk oversight, compliance and assistance in meeting applicable legal and regulatory requirements.
The Board, acting directly and through its committees, considers at each of its meetings, and from time to time as appropriate, factors that are relevant to its annual consideration of the renewal of the Agreements, including the services and support provided by BlackRock to each Master Portfolio, each Feeder Fund and their respective shareholders. Among the matters the Board considered were: (a) investment performance for one-, three- and five-year periods, as applicable, against peer funds, and applicable benchmarks, if any, as well as senior management’s and portfolio managers’ analysis of the reasons for any over performance or underperformance against its peers and/or benchmark, as applicable; (b) fees, including advisory, administration, if applicable, and other amounts paid to BlackRock and its affiliates by each Master Portfolio and/or Feeder Fund for services, such as marketing and distribution, call center and fund accounting; (c) each Master Portfolio’s and/or Feeder Fund’s operating expenses and how BlackRock allocates expenses to the Master Portfolios and the Feeder Funds; (d) the resources devoted to, risk oversight of, and compliance reports relating to, implementation of each Master Portfolio’s and each Feeder Fund’s investment objective, policies and restrictions; (e) the Master LLC’s and the Corporation’s compliance with its respective Code of Ethics and other compliance policies and procedures; (f) the nature, cost and character of non-investment management services provided by BlackRock and its affiliates; (g) BlackRock’s and other service providers’ internal controls and risk and compliance oversight mechanisms; (h) BlackRock’s implementation of the proxy voting policies approved by the Board; (i) the use of brokerage commissions and execution quality of portfolio transactions; (j) BlackRock’s implementation of the Master LLC’s and/or the Corporation’s valuation and liquidity procedures; (k) an analysis of management fees for products with similar investment objectives across the open-end fund, exchange traded fund (“ETF”), closed-end fund and institutional account product channels, as applicable; (l) BlackRock’s compensation methodology for its investment professionals and the incentives it creates; and (m) periodic updates on BlackRock’s business.
The Board has engaged in an ongoing strategic review with BlackRock of opportunities to consolidate funds and of BlackRock’s commitment to investment performance. In addition, the Board requested, to the extent reasonably possible, an analysis of the risk and return relative to selected funds in peer groups. BlackRock provides information to the Board in response to specific questions. These questions covered issues such as profitability, investment performance and management fee levels. The Board considered the importance of: (i) managing fixed income assets with a view toward preservation of capital; (ii) portfolio managers’ investments in the funds they manage; (iii) BlackRock’s controls surrounding the coding of quantitative investment models; (iv) and BlackRock’s oversight of relationships with third party service providers.
Board Considerations in Approving the Agreements
The Approval Process: Prior to the April 17, 2012 meeting, the Board requested and received materials specifically relating to the Agreements. The Board is engaged in a process with its independent legal counsel and BlackRock to review periodically the nature and scope of the information provided to better assist its deliberations. The materials provided in connection with the April meeting included (a) information independently compiled and prepared by Lipper, Inc. (“Lipper”) on fees and expenses of each Master Portfolio and Feeder Fund, as applicable, and the investment
| | | |
| | | |
| BLACKROCK LARGE CAP SERIES FUNDS, INC. | SEPTEMBER 30, 2012 | 41 |
|
|
Disclosure of Investment Advisory Agreement and Sub-Advisory Agreement (continued) |
performance of each Feeder Fund as compared with a peer group of funds as determined by Lipper (collectively, “Peers”); (b) information on the profitability of the Agreements to BlackRock and a discussion of fall-out benefits to BlackRock and its affiliates; (c) a general analysis provided by BlackRock concerning investment management fees (a combination of the advisory fee and the administration fee, if any) charged to other clients, such as institutional clients, ETFs and closed-end funds, under similar investment mandates, as well as the performance of such other clients, as applicable; (d) the existence, impact and sharing of potential economies of scale; (e) a summary of aggregate amounts paid by each Master Portfolio and/or Fund to BlackRock; (f) sales and redemption data regarding each Feeder Fund’s shares; and (g) if applicable, a comparison of management fees to similar BlackRock open-end funds, as classified by Lipper.
At an in-person meeting held on April 17, 2012, the Board reviewed materials relating to its consideration of the Agreements. As a result of the discussions that occurred during the April 17, 2012 meeting, and as a culmination of the Board’s year-long deliberative process, the Board presented BlackRock with questions and requests for additional information. BlackRock responded to these requests with additional written information in advance of the May 15–16, 2012 Board meeting.
At an in-person meeting held on May 15–16, 2012, the Board of the Master LLC, including all the Independent Board Members, unanimously approved the continuation of the Advisory Agreement between the Manager and the Master LLC with respect to each Master Portfolio and the Sub-Advisory Agreement between the Manager and the Sub-Advisor with respect to each Master Portfolio, each for a one-year term ending June 30, 2013. The Board of the Corporation, including the Independent Board Members, also considered the continuation of the Agreements and found the Agreements to be satisfactory. In approving the continuation of the Agreements, the Board of the Master LLC considered: (a) the nature, extent and quality of the services provided by BlackRock; (b) the investment performance of each Master Portfolio, each Feeder Fund and BlackRock; (c) the advisory fee and the cost of the services and profits to be realized by BlackRock and its affiliates from their relationship with each Master Portfolio and Feeder Fund; (d) economies of scale; (e) fall-out benefits to BlackRock as a result of its relationship with the Master Portfolios and the Feeder Funds; and (f) other factors deemed relevant by the Board Members.
The Board also considered other matters it deemed important to the approval process, such as payments made to BlackRock or its affiliates relating to the distribution of Feeder Fund shares and securities lending, services related to the valuation and pricing of portfolio holdings of each Master Portfolio, direct and indirect benefits to BlackRock and its affiliates from their relationship with the Master Portfolios and the Feeder Funds and advice from independent legal counsel with respect to the review process and materials submitted for the Board’s review. The Board noted the willingness of BlackRock personnel to engage in open, candid discussions with the Board. The Board did not identify any particular information as controlling, and each Board Member may have attributed different weights to the various items considered.
A. Nature, Extent and Quality of the Services Provided by BlackRock: The Board, including the Independent Board Members, reviewed the nature, extent and quality of services provided by BlackRock, including the investment advisory services and the resulting performance of each Feeder Fund. Throughout the year, the Board compared each Feeder Fund’s performance to the performance of a comparable group of mutual funds and/or the performance of a relevant benchmark, if any. The Board met with BlackRock’s senior management personnel responsible for investment operations, including the senior investment officers. The Board also reviewed the materials provided by each Master Portfolio’s portfolio management team discussing Master Portfolio performance and the Master Portfolio’s investment objective, strategies and outlook.
The Board considered, among other factors, the number, education and experience of BlackRock’s investment personnel generally and each Master Portfolio’s portfolio management team, investments by portfolio managers in the funds they manage, BlackRock’s portfolio trading capabilities, BlackRock’s use of technology, BlackRock’s commitment to compliance, BlackRock’s credit analysis capabilities, BlackRock’s risk analysis and oversight capabilities and BlackRock’s approach to training and retaining portfolio managers and other research, advisory and management personnel. The Board engaged in a review of BlackRock’s compensation structure with respect to each Master Portfolio’s portfolio management team and BlackRock’s ability to attract and retain high-quality talent and create performance incentives.
In addition to advisory services, the Board considered the quality of the administrative and non-investment advisory services provided to each Master Portfolio and Feeder Fund. BlackRock and its affiliates provide each Master Portfolio and Feeder Fund with certain administrative, shareholder and other services (in addition to any such services provided to the Master Portfolio and Feeder Fund by third parties) and officers and other personnel as are necessary for the operations of the Master Portfolio and the Feeder Fund. In particular, BlackRock and its affiliates provide each Master Portfolio and Feeder Fund with the following administrative services, including, among others: (i) preparing disclosure documents, such as the prospectus, the statement of additional information and periodic shareholder reports; (ii) assisting with daily accounting and pricing; (iii) overseeing and coordinating the activities of other service providers; (iv) organizing Board meetings and preparing the materials for such Board meetings; (v) providing legal and compliance support; and (vi) performing other administrative functions necessary for the operation of the Master Portfolio and the Feeder Fund, such as tax reporting, fulfilling regulatory filing requirements and call center services. The Board reviewed the structure and duties of BlackRock’s fund administration, accounting, legal and compliance departments and considered BlackRock’s policies and procedures for assuring compliance with applicable laws and regulations.
B. The Investment Performance of each Master Portfolio, each Feeder Fund and BlackRock: The Board, including the Independent Board Members, also reviewed and considered the performance history of each Master Portfolio and Feeder Fund, as applicable. The Board noted that each Master Portfolio’s investment results correspond directly to the investment results of the applicable Feeder Fund. In preparation for the April 17, 2012 meeting, the Board worked with its independent legal counsel, BlackRock and Lipper to develop a template for, and was provided with, reports independently prepared by Lipper, which included a comprehensive analysis of each Feeder
| | |
| | |
42 | BLACKROCK LARGE CAP SERIES FUNDS, INC. | SEPTEMBER 30, 2012 |
|
|
Disclosure of Investment Advisory Agreement and Sub-Advisory Agreement (continued) |
Fund’s performance. The Board also reviewed a narrative and statistical analysis of the Lipper data that was prepared by BlackRock, which analyzed various factors that affect Lipper’s rankings. In connection with its review, the Board received and reviewed information regarding the investment performance of each Feeder Fund as compared to funds in such Feeder Fund’s applicable Lipper category. The Board was provided with a description of the methodology used by Lipper to select peer funds and periodically meets with Lipper representatives to review their methodology. The Board and the Board’s Performance Oversight and Contract Committee regularly review, and meet with the management of each Master Portfolio to discuss the performance of the Master Portfolio and Feeder Fund, as applicable, throughout the year.
The Board noted that, in general, BlackRock Large Cap Growth Retirement Portfolio performed better than its Peers in that the Feeder Fund’s performance was at or above the median of its Lipper Performance Universe in each of the one-year, three-year and since-inception periods reported.
The Board noted that, in general, BlackRock Large Cap Core Retirement Portfolio performed better than its Peers in that the Feeder Fund’s performance was at or above the median of its Lipper Performance Universe in two of the one-year, three-year and since-inception periods reported.
The Board noted that BlackRock Large Cap Value Retirement Portfolio performed below the median of its Lipper Performance Universe in each of the one-year, three-year and since-inception periods reported. The Board and BlackRock reviewed and discussed the reasons for the Feeder Fund’s underperformance during these periods compared with its Peers. BlackRock informed the Board that, among other things, stock selection within the financial sector was the largest detractor over the three-year period, while stock selection within the utilities sector was the largest detractor from performance over the since-inception period. The Board and BlackRock discussed BlackRock’s strategy for improving the Master Portfolio’s/Feeder Fund’s performance and BlackRock’s commitment to providing the resources necessary to assist the Master Portfolio’s portfolio managers and to improve the Master Portfolio’s/Feeder Fund’s performance.
C. Consideration of the Advisory/Management Fees and the Cost of the Services and Profits to be Realized by BlackRock and its Affiliates from their Relationship with each Master Portfolio and Feeder Fund: The Board, including the Independent Board Members, reviewed each Master Portfolio’s/Feeder Fund’s contractual management fee rate compared with the other funds in the Feeder Fund’s Lipper category. It also compared each Feeder Fund’s total expense ratio, as well as each Master Portfolio’s/Feeder Fund’s actual management fee rate, to those of other funds in the Feeder Fund’s Lipper category. The Board considered the services provided and the fees charged by BlackRock to other types of clients with similar investment mandates, including separately managed institutional accounts.
The Board received and reviewed statements relating to BlackRock’s financial condition and profitability with respect to the services it provided each Master Portfolio and Feeder Fund. The Board was also provided with a profitability analysis that detailed the revenues earned and the expenses incurred by BlackRock for services provided to the Master Portfolios and the Feeder Funds. The Board reviewed BlackRock’s profitability with respect to each Master Portfolio and Feeder Fund, as applicable, and other funds the Board currently oversees for the year ended December 31, 2011 compared to available aggregate profitability data provided for the years ended December 31, 2010 and December 31, 2009. The Board reviewed BlackRock’s profitability with respect to other fund complexes managed by the Manager and/or its affiliates. The Board reviewed BlackRock’s assumptions and methodology of allocating expenses in the profitability analysis, noting the inherent limitations in allocating costs among various advisory products. The Board recognized that profitability may be affected by numerous factors including, among other things, fee waivers and expense reimbursements by the Manager, the types of funds managed, expense allocations and business mix, and the difficulty of comparing profitability as a result of those factors.
The Board noted that, in general, individual fund or product line profitability of other advisors is not publicly available. The Board considered BlackRock’s operating margin, in general, compared to the operating margin for leading investment management firms whose operations include advising open-end funds, among other product types. In addition, the Board considered, among other things, certain third party data comparing BlackRock’s operating margin with that of other publicly-traded asset management firms. The Board considered the differences between BlackRock and these other firms, including the contribution of technology at BlackRock, BlackRock’s expense management and the relative product mix.
In addition, the Board considered the cost of the services provided to each Master Portfolio and Feeder Fund by BlackRock, and BlackRock’s and its affiliates’ profits relating to the management and distribution of each Master Portfolio and Feeder Fund and the other funds advised by BlackRock and its affiliates. As part of its analysis, the Board reviewed BlackRock’s methodology in allocating its costs to the management of the Master Portfolios and Feeder Funds. The Board also considered whether BlackRock has the financial resources necessary to attract and retain high quality investment management personnel to perform its obligations under the Agreements and to continue to provide the high quality of services that is expected by the Board.
The Board noted that each Master Portfolio’s/Feeder Fund’s contractual management fee ratio (a combination of the advisory fee and the administration fee, if any) was lower than or equal to the median contractual management fee ratio paid by the Feeder Fund’s Peers, in each case before taking into account any expense reimbursements or fee waivers. The Board also noted that each Master Portfolio has an advisory fee arrangement that includes breakpoints that adjust the fee rate downward as the size of the Master Portfolio increases above certain contractually specified levels. The Board further noted that BlackRock has contractually agreed to waive fees and/or reimburse expenses in order to limit, to a specified amount, the total operating expenses of each Feeder Fund as a percentage of the Feeder Fund’s average daily net assets on a class-by-class basis, as applicable.
D. Economies of Scale: The Board, including the Independent Board Members, considered the extent to which economies of scale might be realized as the assets of each Master Portfolio and Feeder Fund increase, as well as the existence of expense caps. The Board also considered the extent to which each Master Portfolio and Feeder Fund benefit from such economies and whether there should be changes in the advisory fee rate or structure in order
| | | |
| | | |
| BLACKROCK LARGE CAP SERIES FUNDS, INC. | SEPTEMBER 30, 2012 | 43 |
|
|
Disclosure of Investment Advisory Agreement and Sub-Advisory Agreement (concluded) |
to enable each Master Portfolio and Feeder Fund to participate in these economies of scale, for example through the use of revised breakpoints in the advisory fee based upon the asset level of the Master Portfolio. In its consideration, the Board Members took into account the existence of expense caps and further considered the continuation and/or implementation, as applicable, of such caps.
E. Other Factors Deemed Relevant by the Board Members: The Board, including the Independent Board Members, also took into account other ancillary or “fall-out” benefits that BlackRock or its affiliates may derive from their respective relationships with the Master Portfolios and the Feeder Funds, both tangible and intangible, such as BlackRock’s ability to leverage its investment professionals who manage other portfolios and risk management personnel, an increase in BlackRock’s profile in the investment advisory community, and the engagement of BlackRock’s affiliates as service providers to the Master Portfolios and the Feeder Funds, including for administrative, distribution, securities lending and cash management services. The Board also considered BlackRock’s overall operations and its efforts to expand the scale of, and improve the quality of, its operations. The Board also noted that BlackRock may use and benefit from third party research obtained by soft dollars generated by certain registered fund transactions to assist in managing all or a number of its other client accounts. The Board further noted that it had considered the investment by BlackRock’s funds in ETFs without any offset against the management fees payable by the funds to BlackRock.
In connection with its consideration of the Agreements, the Board also received information regarding BlackRock’s brokerage and soft dollar practices. The Board received reports from BlackRock which included information on brokerage commissions and trade execution practices throughout the year.
The Board noted the competitive nature of the open-end fund marketplace, and that shareholders are able to redeem their Feeder Fund shares if they believe that the applicable Feeder Fund’s and/or Master Portfolio’s fees and expenses are too high or if they are dissatisfied with the performance of the Feeder Fund.
Conclusion
The Board of the Master LLC, including all the Independent Board Members, unanimously approved the continuation of the Advisory Agreement between the Manager and the Master LLC, with respect to each Master Portfolio, for a one-year term ending June 30, 2013 and the Sub-Advisory Agreement between the Manager and the Sub-Advisor, with respect to each Master Portfolio, for a one-year term ending June 30, 2013. Based upon its evaluation of all of the aforementioned factors in their totality, the Board of the Master LLC, including the Independent Board Members, was satisfied that the terms of the Agreements were fair and reasonable and in the best interest of each Master Portfolio and its shareholders. The Board of the Corporation, including the Independent Board Members, also considered the continuation of the Agreements with respect to each Master Portfolio and found the Agreements to be satisfactory. In arriving at its decision to approve the Agreements, the Board of the Master LLC did not identify any single factor or group of factors as all-important or controlling, but considered all factors together, and different Board Members may have attributed different weights to the various factors considered. The Independent Board Members were also assisted by the advice of independent legal counsel in making this determination. The contractual fee arrangements for each Master Portfolio reflect the results of several years of review by the Board Members and predecessor Board Members, and discussions between such Board Members (and predecessor Board Members) and BlackRock. As a result, the Board Members’ conclusions may be based in part on their consideration of these arrangements in prior years.
| | |
| | |
44 | BLACKROCK LARGE CAP SERIES FUNDS, INC. | SEPTEMBER 30, 2012 |
| | | | | | | | | | |
Name, Address
and Year of Birth | | Position(s)
Held with
Corporation/
Master LLC | | Length
of Time
Served as
a Director2 | | Principal Occupation(s) During Past Five Years | | Number of BlackRock-
Advised Registered
Investment Companies
(“RICs”) Consisting of
Investment Portfolios
(“Portfolios”) Overseen | | Public
Directorships |
Independent Directors1 | | | | | | | | |
Ronald W. Forbes
55 East 52nd Street
New York, NY 10055
1940 | | Co-Chairman of the Board and Director | | Since
2007 | | Professor Emeritus of Finance, School of Business, State University of New York at Albany since 2000. | | 33 RICs consisting of
102 Portfolios | | None |
Rodney D. Johnson
55 East 52nd Street
New York, NY 10055
1941 | | Co-Chairman of the Board and Director | | Since
2007 | | President, Fairmount Capital Advisors, Inc. since 1987; Member of the Archdiocesan Investment Committee of the Archdiocese of Philadelphia since 2004; Director, The Committee of Seventy (civic) since 2006; Director, Fox Chase Cancer Center 2004 to 2011. | | 33 RICs consisting of
102 Portfolios | | None |
David O. Beim
55 East 52nd Street
New York, NY 10055
1940 | | Director | | Since
2007 | | Professor of Professional Practice at the Columbia University Graduate School of Business since 1991; Trustee, Phillips Exeter Academy since 2002; Chairman, Wave Hill, Inc. (public garden and cultural center) from 1990 to 2006. | | 33 RICs consisting of
102 Portfolios | | None |
Dr. Matina S. Horner
55 East 52nd Street
New York, NY 10055
1939 | | Director | | Since
2007 | | Executive Vice President of Teachers Insurance and Annuity Association and College Retirement Equities Fund from 1989 to 2003. | | 33 RICs consisting of
102 Portfolios | | NSTAR (electric and gas utility) |
Herbert I. London
55 East 52nd Street
New York, NY 10055
1939 | | Director | | Since
1999 | | Professor Emeritus, New York University since 2005; John M. Olin Professor of Humanities, New York University from 1993 to 2005 and Professor thereof from 1980 to 2005; President Emeritus, Hudson Institute (policy research organization) since 2011, President thereof from 1997 to 2011 and Trustee since 1980; Chairman of the Board of Trustees for Grantham University since 2006; Director, InnoCentive, Inc. (strategic solutions company) since 2005; Director, Cerego, LLC (software development and design) since 2005; Director, Cybersettle (dispute resolution technology) since 2009. | | 33 RICs consisting of
102 Portfolios | | AIMS Worldwide, Inc. (marketing) |
Ian A. MacKinnon
55 East 52nd Street
New York, NY 10055
1948 | | Director | | Since
2012 | | Director, Kennett Capital, Inc. (investments) since 2006; Director, Free Library of Philadelphia from 1999 to 2008. | | 33 RICs consisting of
102 Portfolios | | None |
Cynthia A. Montgomery
55 East 52nd Street
New York, NY 10055
1952 | | Director | | Since
2007 | | Professor, Harvard Business School since 1989; Director, McLean Hospital since 2005; Director, Harvard Business School Publishing from 2005 to 2010. | | 33 RICs consisting of
102 Portfolios | | Newell Rubbermaid, Inc. (manufacturing) |
Joseph P. Platt
55 East 52nd Street
New York, NY 10055
1947 | | Director | | Since
2007 | | Director, The West Penn Allegheny Health System (a not-for-profit health system) since 2008; Director, Jones and Brown (Canadian insurance broker) since 1998; General Partner, Thorn Partners, LP (private investments) since 1998; Director, WQED Multi-Media (public broadcasting not-for-profit) since 2001; Partner, Amarna Corporation, LLC (private investment company) from 2002 to 2008. | | 33 RICs consisting of
102 Portfolios | | Greenlight Capital Re, Ltd. (reinsurance company) |
Robert C. Robb, Jr.
55 East 52nd Street
New York, NY 10055
1945 | | Director | | Since
2007 | | Partner, Lewis, Eckert, Robb and Company (management and financial consulting firm) since 1981. | | 33 RICs consisting of
102 Portfolios | | None |
| | | |
| | | |
| BLACKROCK LARGE CAP SERIES FUNDS, INC. | SEPTEMBER 30, 2012 | 45 |
|
|
Officers and Directors (continued) |
| | | | | | | | | | |
Name, Address
and Year of Birth | | Position(s)
Held with
Corporation/
Master LLC | | Length
of Time
Served as
a Director2 | | Principal Occupation(s) During Past Five Years | | Number of BlackRock-
Advised Registered
Investment Companies
(“RICs”) Consisting of
Investment Portfolios
(“Portfolios”) Overseen | | Public
Directorships |
Independent Directors1 (concluded) |
Toby Rosenblatt
55 East 52nd Street
New York, NY 10055
1938 | | Director | | Since
2007 | | President, Founders Investments Ltd. (private investments) since 1999; Director, Forward Management, LLC since 2007; Director, College Access Foundation of California (philanthropic foundation) since 2009; Director, A.P. Pharma, Inc. (specialty pharmaceuticals) from 1983 to 2011; Director, The James Irvine Foundation (philanthropic foundation) from 1998 to 2008. | | 33 RICs consisting of
102 Portfolios | | None |
Kenneth L. Urish
55 East 52nd Street
New York, NY 10055
1951 | | Director | | Since
2007 | | Managing Partner, Urish Popeck & Co., LLC (certified public accountants and consultants) since 1976; Chairman Elect of the Professional Ethics Committee of the Pennsylvania Institute of Certified Public Accountants and Committee Member thereof since 2007; Member of External Advisory Board, The Pennsylvania State University Accounting Department since 2001; Trustee, The Holy Family Institute from 2001 to 2010; President and Trustee, Pittsburgh Catholic Publishing Associates from 2003 to 2008; Director, Inter-Tel from 2006 to 2007. | | 33 RICs consisting of
102 Portfolios | | None |
Frederick W. Winter
55 East 52nd Street
New York, NY 10055
1945 | | Director | | Since
2007 | | Professor and Dean Emeritus of the Joseph M. Katz School of Business, University of Pittsburgh since 2005 and Dean thereof from 1997 to 2005; Director, Alkon Corporation (pneumatics) since 1992; Director, Tippman Sports (recreation) since 2005; Director, Indotronix International (IT services) from 2004 to 2008. | | 33 RICs consisting of
102 Portfolios | | None |
| | |
| 1 | Directors serve until their resignation, removal or death, or until December 31 of the year in which they turn 72. The Board has approved extensions in terms of Directors who turn 72 prior to December 31, 2013. |
| | |
| 2 | Date shown is the earliest date a person has served for the Corporation/Master LLC covered by this annual report. Following the combination of Merrill Lynch Investment Managers, L.P. (“MLIM”) and BlackRock, Inc. (“BlackRock”) in September 2006, the various legacy MLIM and legacy BlackRock Fund boards were realigned and consolidated into three new Fund boards in 2007. As a result, although the chart shows certain Directors as joining the Corporation’s/Master LLC’s board in 2007, each Director first became a member of the board of other legacy MLIM or legacy BlackRock Funds as follows: David O. Beim, 1998; Ronald W. Forbes, 1977; Dr. Matina S. Horner, 2004; Rodney D. Johnson, 1995; Herbert I. London, 1987; Cynthia A. Montgomery, 1994; Joseph P. Platt, 1999; Robert C. Robb, Jr., 1998; Toby Rosenblatt, 2005; Kenneth L. Urish, 1999; and Frederick W. Winter, 1999. |
| | | | | | | | | | |
Interested Directors3 |
Paul L. Audet
55 East 52nd Street
New York, NY 10055
1953 | | Director | | Since
2011 | | Senior Managing Director of BlackRock and Head of U.S. Mutual Funds since 2011; Chair of the U.S. Mutual Funds Committee reporting to the Global Executive Committee since 2011; Head of BlackRock’s Real Estate business from 2008 to 2011; Member of BlackRock’s Global Operating and Corporate Risk Management Committees and of the BlackRock Alternative Investors Executive Committee and Investment Committee for the Private Equity Fund of Funds business since 2008; Head of BlackRock’s Global Cash Management business from 2005 to 2010; Acting Chief Financial Officer of BlackRock from 2007 to 2008; Chief Financial Officer of BlackRock from 1998 to 2005. | | 160 RICs consisting of
278 Portfolios | | None |
Henry Gabbay
55 East 52nd Street
New York, NY 10055
1947 | | Director | | Since
2007 | | Consultant, BlackRock from 2007 to 2008; Managing Director, BlackRock from 1989 to 2007; Chief Administrative Officer, BlackRock Advisors, LLC from 1998 to 2007; President of BlackRock Funds and BlackRock Bond Allocation Target Shares from 2005 to 2007 and Treasurer of certain closed-end funds in the BlackRock fund complex from 1989 to 2006. | | 160 RICs consisting of
278 Portfolios | | None |
| | |
| 3 | Mr. Audet is an “interested person,” as defined in the 1940 Act, of the Corporation/Master LLC based on his position with BlackRock and its affiliates.
Mr. Gabbay is an “interested person” of the Corporation/Master LLC based on his former positions with BlackRock and its affiliates as well as his ownership of BlackRock and The PNC Financial Services Group, Inc. securities. Mr. Audet and Mr. Gabbay are also Directors of the BlackRock registered closed-end funds and Directors of other BlackRock registered open-end funds. Directors serve until their resignation, removal or death, or until December 31 of the year in which they turn 72. |
| | |
| | |
46 | BLACKROCK LARGE CAP SERIES FUNDS, INC. | SEPTEMBER 30, 2012 |
|
|
Officers and Directors (concluded) |
| | | | | | |
Name, Address
and Year of Birth | | Position(s)
Held with
Corporation/
Master LLC | | Length
of Time
Served | | Principal Occupation(s) During Past Five Years |
Officers1 | | | | | | |
John M. Perlowski
55 East 52nd Street
New York, NY 10055
1964 | | President and Chief Executive Officer | | Since
2010 | | Managing Director of BlackRock since 2009; Global Head of BlackRock Fund Administration since 2009; Managing Director and Chief Operating Officer of the Global Product Group at Goldman Sachs Asset Management, L.P. from 2003 to 2009; Treasurer of Goldman Sachs Mutual Funds from 2003 to 2009 and Senior Vice President thereof from 2007 to 2009; Director of Goldman Sachs Offshore Funds from 2002 to 2009; Director of Family Resource Network (charitable foundation) since 2009. |
Brendan Kyne
55 East 52nd Street
New York, NY 10055
1977 | | Vice President | | Since
2009 | | Managing Director of BlackRock since 2010; Director of BlackRock from 2008 to 2009; Head of Product Development and Management for BlackRock’s U.S. Retail Group since 2009 and Co-head thereof from 2007 to 2009; Vice President of BlackRock from 2005 to 2008. |
Neal Andrews
55 East 52nd Street
New York, NY 10055
1966 | | Chief Financial Officer | | Since
2007 | | Managing Director of BlackRock since 2006; Senior Vice President and Line of Business Head of Fund Accounting and Administration at PNC Global Investment Servicing (U.S.) Inc. from 1992 to 2006. |
Jay Fife
55 East 52nd Street
New York, NY 10055
1970 | | Treasurer | | Since
2007 | | Managing Director of BlackRock since 2007; Director of BlackRock in 2006; Assistant Treasurer of the MLIM and Fund Asset Management, L.P. advised funds from 2005 to 2006; Director of MLIM Fund Services Group from 2001 to 2006. |
Brian Kindelan
55 East 52nd Street
New York, NY 10055
1959 | | Chief Compliance Officer and Anti-Money Laundering Officer | | Since
2007 | | Chief Compliance Officer of the BlackRock-advised funds since 2007; Managing Director and Senior Counsel of BlackRock since 2005. |
Benjamin Archibald
55 East 52nd Street
New York, NY 10055
1975 | | Secretary | | Since
2012 | | Director of BlackRock since 2010; Assistant Secretary to the funds from 2010 to 2012; General Counsel and Chief Operating Officer of Uhuru Capital Management from 2009 to 2010; Executive Director and Counsel of Goldman Sachs Asset Management from 2005 to 2009. |
| | |
| 1 | Officers of the Corporation/Master LLC serve at the pleasure of the Board. |
|
Further information about the Officers and Directors is available in the Corporation’s/Master LLC’s Statement of Additional Information, which can be obtained without charge by calling (800) 441-7762.
|
|
Investment Advisor |
BlackRock Advisors, LLC |
Wilmington, DE 19809 |
|
Sub-Advisor |
BlackRock Investment |
Management, LLC |
Princeton, NJ 08540 |
|
Custodian |
Brown Brothers Harriman & Co. |
Boston, MA 02109 |
|
Transfer Agent |
BNY Mellon Investment |
Servicing (US) Inc. |
Wilmington, DE 19809 |
|
Accounting Agent |
State Street Bank and |
Trust Company |
Boston, MA 02110 |
|
Distributor |
BlackRock Investments, LLC |
New York, NY 10022 |
|
Independent Registered
Public Accounting Firm |
Deloitte & Touche LLP |
Boston, MA 02116 |
|
Legal Counsel |
Sidley Austin LLP |
New York, NY 10019 |
|
Address of the Corporation |
100 Bellevue Parkway |
Wilmington, DE 19809 |
|
Effective May 15, 2012, Ian A. MacKinnon became a Director of the Corporation and Master LLC. |
|
Effective May 16, 2012, Ira P. Shapiro resigned as Secretary of the Corporation and Master LLC, and Benjamin Archibald became Secretary of the Corporation and Master LLC. |
|
| | | |
| | | |
| BLACKROCK LARGE CAP SERIES FUNDS, INC. | SEPTEMBER 30, 2012 | 47 |
Electronic Delivery
Electronic copies of most financial reports and prospectuses are available on the Funds’ website or shareholders can sign up for e-mail notifications of quarterly statements, annual and semi-annual reports and prospectuses by enrolling in the Funds’ electronic delivery program.
To enroll:
Shareholders Who Hold Accounts with Investment Advisors, Banks or Brokerages:
Please contact your financial advisor. Please note that not all investment advisors, banks or brokerages may offer this service.
Shareholders Who Hold Accounts Directly with BlackRock:
1) Access the BlackRock website at http://www.blackrock.com/edelivery
2) Select “eDelivery” under the “More Information” section
3) Log into your account
Householding
The Funds will mail only one copy of shareholder documents, including prospectuses, annual and semi-annual reports and proxy statements, to shareholders with multiple accounts at the same address. This practice is commonly called “householding” and is intended to reduce expenses and eliminate duplicate mailings of shareholder documents. Mailings of your shareholder documents may be householded indefinitely unless you instruct us otherwise. If you do not want the mailing of these documents to be combined with those for other members of your household, please call the Funds at (800) 441-7762.
Availability of Quarterly Schedule of Investments
The Corporation/Master LLC file their complete schedule of portfolio holdings with the SEC for the first and third quarters of each fiscal year on Form N-Q. The Corporation’s/Master LLC’s Forms N-Q are available on the SEC’s website at http://www.sec.gov and may also be reviewed and copied at the SEC’s Public Reference Room in Washington, DC. Information on how to access documents on the SEC’s website without charge may be obtained by calling (800) SEC-0330. The Corporation’s/Master LLC’s Forms N-Q may also be obtained upon request and without charge by calling (800) 441-7762.
Availability of Proxy Voting Policies and Procedures
A description of the policies and procedures that the Corporation/ Master LLC use to determine how to vote proxies relating to portfolio securities is available (1) without charge, upon request, by calling (800) 441-7762; (2) at http://www.blackrock.com; and (3) on the SEC’s website at http://www.sec.gov.
Availability of Proxy Voting Record
Information about how the Corporation/Master LLC voted proxies relating to securities held in the Corporation’s/Master LLC’s portfolios, during the most recent 12-month period ended June 30 is available upon request and without charge (1) at http://www.blackrock.com or by calling (800) 441-7762 and (2) on the SEC’s website at http://www.sec.gov.
| | |
| | |
48 | BLACKROCK LARGE CAP SERIES FUNDS, INC. | SEPTEMBER 30, 2012 |
|
|
Additional Information (concluded) |
Account Information
Call us at (800) 441-7762 from 8:00 AM to 6:00 PM EST on any business day to get information about your account balances, recent transactions and share prices. You can also reach us on the Web at http://www.blackrock.com/funds.
Automatic Investment Plans
Investor Class shareholders who want to invest regularly can arrange to have $50 or more automatically deducted from their checking or savings account and invested in any of the BlackRock funds.
Systematic Withdrawal Plans
Investor Class shareholders can establish a systematic withdrawal plan and receive periodic payments of $50 or more from their BlackRock funds, as long as their account balance is at least $10,000.
Retirement Plans
Shareholders may make investments in conjunction with Traditional, Rollover, Roth, Coverdell, Simple IRAs, SEP IRAs and 403(b) Plans.
|
BlackRock Privacy Principles |
BlackRock is committed to maintaining the privacy of its current and former fund investors and individual clients (collectively, “Clients”) and to safeguarding their non-public personal information. The following information is provided to help you understand what personal information BlackRock collects, how we protect that information and why in certain cases we share such information with select parties.
If you are located in a jurisdiction where specific laws, rules or regulations require BlackRock to provide you with additional or different privacy-related rights beyond what is set forth below, then BlackRock will comply with those specific laws, rules or regulations.
BlackRock obtains or verifies personal non-public information from and about you from different sources, including the following: (i) information we receive from you or, if applicable, your financial intermediary, on applications, forms or other documents; (ii) information about your transactions with us, our affiliates, or others; (iii) information we receive from a consumer reporting agency; and (iv) from visits to our websites.
BlackRock does not sell or disclose to non-affiliated third parties any non-public personal information about its Clients, except as permitted by law or as is necessary to respond to regulatory requests or to service Client accounts. These non-affiliated third parties are required to protect the confidentiality and security of this information and to use it only for its intended purpose.
We may share information with our affiliates to service your account or to provide you with information about other BlackRock products or services that may be of interest to you. In addition, BlackRock restricts access to non-public personal information about its Clients to those BlackRock employees with a legitimate business need for the information. BlackRock maintains physical, electronic and procedural safeguards that are designed to protect the non-public personal information of its Clients, including procedures relating to the proper storage and disposal of such information.
| | | |
| | | |
| BLACKROCK LARGE CAP SERIES FUNDS, INC. | SEPTEMBER 30, 2012 | 49 |
|
|
AWorld-Class Mutual Fund Family |
BlackRock offers a diverse lineup of open-end mutual funds crossing all investment styles and managed by experts in equity, fixed income and tax-exempt investing.
|
Equity Funds |
|
BlackRock ACWI ex-US Index Fund |
BlackRock All-Cap Energy & Resources Portfolio |
BlackRock Balanced Capital Fund† |
BlackRock Basic Value Fund |
BlackRock Capital Appreciation Fund |
BlackRock China Fund |
BlackRock Commodity Strategies Fund |
BlackRock Emerging Markets Fund |
BlackRock Emerging Markets Long/Short Equity Fund |
BlackRock Energy & Resources Portfolio |
BlackRock Equity Dividend Fund |
BlackRock EuroFund |
BlackRock Flexible Equity Fund |
BlackRock Focus Growth Fund |
BlackRock Global Allocation Fund† |
BlackRock Global Dividend Income Portfolio |
BlackRock Global Opportunities Portfolio |
BlackRock Global SmallCap Fund |
BlackRock Health Sciences Opportunities Portfolio |
BlackRock Index Equity Portfolio |
BlackRock India Fund |
BlackRock International Fund |
BlackRock International Index Fund |
BlackRock International Opportunities Portfolio |
BlackRock Large Cap Core Fund |
BlackRock Large Cap Core Plus Fund |
BlackRock Large Cap Growth Fund |
BlackRock Large Cap Value Fund |
BlackRock Latin America Fund |
BlackRock Long-Horizon Equity Fund |
BlackRock Managed Volatility Portfolio† |
BlackRock Mid-Cap Growth Equity Portfolio |
BlackRock Mid Cap Value Opportunities Fund |
BlackRock Natural Resources Trust |
BlackRock Pacific Fund |
BlackRock Real Estate Securities Fund |
BlackRock Russell 1000 Index Fund |
BlackRock Science & Technology Opportunities Portfolio |
BlackRock Small Cap Growth Equity Portfolio |
BlackRock Small Cap Growth Fund II |
BlackRock Small Cap Index Fund |
BlackRock S&P 500 Index Fund |
BlackRock S&P 500 Stock Fund |
BlackRock U.S. Opportunities Portfolio |
BlackRock Value Opportunities Fund |
BlackRock World Gold Fund |
|
|
Taxable Fixed Income Funds |
|
BlackRock Bond Index Fund |
BlackRock Core Bond Portfolio |
BlackRock CoreAlpha Bond Fund |
BlackRock Emerging Market Local Debt Portfolio |
BlackRock Floating Rate Income Portfolio |
BlackRock Global Long/Short Credit Fund |
BlackRock GNMA Portfolio |
BlackRock High Yield Bond Portfolio |
BlackRock Inflation Protected Bond Portfolio |
BlackRock International Bond Portfolio |
BlackRock Long Duration Bond Portfolio |
BlackRock Low Duration Bond Portfolio |
BlackRock Multi-Asset Income Portfolio† |
BlackRock Secured Credit Portfolio |
BlackRock Strategic Income Opportunities Portfolio |
BlackRock Total Return Fund |
BlackRock US Government Bond Portfolio |
BlackRock US Mortgage Portfolio |
BlackRock World Income Fund |
|
|
Municipal Fixed Income Funds |
|
BlackRock California Municipal Bond Fund |
BlackRock High Yield Municipal Fund |
BlackRock Intermediate Municipal Fund |
BlackRock National Municipal Fund |
BlackRock New Jersey Municipal Bond Fund |
BlackRock New York Municipal Bond Fund |
BlackRock Pennsylvania Municipal Bond Fund |
BlackRock Short-Term Municipal Fund |
|
|
Target Risk & Target Date Funds† |
|
BlackRock Prepared Portfolios |
Conservative Prepared Portfolio |
Moderate Prepared Portfolio |
Growth Prepared Portfolio |
Aggressive Growth Prepared Portfolio |
|
LifePath Active Portfolios |
2015 |
2020 |
2025 |
2030 |
2035 |
2040 |
2045 |
2050 |
|
LifePath Portfolios |
Retirement |
2020 |
2025 |
2030 |
2035 |
2040 |
2045 |
2050 |
2055 |
|
LifePath Index Portfolios |
Retirement |
2020 |
2025 |
2030 |
2035 |
2040 |
2045 |
2050 |
2055 |
BlackRock mutual funds are currently distributed by BlackRock Investments, LLC. You should consider the investment objectives, risks, charges and expenses of the funds under consideration carefully before investing. Each fund’s prospectus contains this and other information and is available at www.blackrock.com or by calling (800) 441-7762 or from your financial advisor. The prospectus should be read carefully before investing.
| | |
| | |
50 | BLACKROCK LARGE CAP SERIES FUNDS, INC. | SEPTEMBER 30, 2012 |
These reports are not authorized for use as an offer of sale or a solicitation of an offer to buy shares of the Funds unless accompanied or preceded by the Funds’ current prospectus. Past performance results shown in these reports should not be considered a representation of future performance. Investment returns and principal value of shares will fluctuate so that shares, when redeemed, may be worth more or less than their original cost. Statements and other information herein are as dated and are subject to change.
| |

|
#LCSRP-9/12-AR | 
|
Item 2 – | Code of Ethics – Each registrant (or “Fund”) has adopted a code of ethics, as of the end of the period covered by this report, applicable to the registrants’ principal executive officer, principal financial officer, principal accounting officer or controller, or persons performing similar functions. During the period covered by this report, there have been no amendments to or waivers granted under the code of ethics. A copy of the code of ethics is available without charge at www.blackrock.com. |
| |
Item 3 – | Audit Committee Financial Expert – The registrants’ board of directors (the “board of directors”), has determined that (i) the registrant has the following audit committee financial expert serving on its audit committee and (ii) each audit committee financial expert is independent: |
| Kenneth L. Urish |
| |
| Under applicable securities laws, a person determined to be an audit committee financial expert will not be deemed an “expert” for any purpose, including without limitation for the purposes of Section 11 of the Securities Act of 1933, as a result of being designated or identified as an audit committee financial expert. The designation or identification of a person as an audit committee financial expert does not impose on such person any duties, obligations, or liabilities greater than the duties, obligations, and liabilities imposed on such person as a member of the audit committee and board of directors in the absence of such designation or identification. |
| |
Item 4 – | Principal Accountant Fees and Services |
| |
| The following table presents fees billed by Deloitte & Touche LLP (“D&T”) in each of the last two fiscal years for the services rendered to the Funds: |
| (a) Audit Fees | (b) Audit-Related Fees1 | (c) Tax Fees2 | (d) All Other Fees3 |
Entity Name | Current
Fiscal Year
End | Previous
Fiscal Year
End | Current
Fiscal Year
End | Previous
Fiscal Year
End | Current
Fiscal Year
End | Previous
Fiscal Year
End | Current
Fiscal Year
End | Previous
Fiscal Year
End |
BlackRock Large Cap Core Fund | $7,100 | $7,000 | $2,500 | $0 | $12,350 | $12,350 | $0 | $0 |
BlackRock Large Cap Core Plus Fund | $31,000 | $31,000 | $2,500 | $0 | $6,600 | $6,600 | $0 | $0 |
BlackRock Large Cap Core Retirement Portfolio | $7,100 | $7,000 | $2,500 | $0 | $11,400 | $11,400 | $0 | $0 |
BlackRock Large Cap Growth Fund | $7,100 | $7,000 | $2,500 | $0 | $12,350 | $12,350 | $0 | $0 |
BlackRock Large Cap Growth Retirement Portfolio | $7,100 | $7,000 | $2,500 | $0 | $10,000 | $10,000 | $0 | $0 |
BlackRock Large Cap Value Fund | $7,100 | $7,000 | $2,500 | $0 | $12,350 | $12,350 | $0 | $0 |
BlackRock Large Cap Value Retirement Portfolio | $7,100 | $7,000 | $2,500 | $0 | $12,350 | $12,350 | $0 | $0 |
Master Large Cap Core Portfolio | $35,900 | $35,500 | $2,500 | $0 | $13,250 | $13,250 | $0 | $0 |
Master Large Cap Growth Portfolio | $32,900 | $32,500 | $2,500 | $0 | $13,250 | $13,250 | $0 | $0 |
Master Large Cap Value Portfolio | $32,900 | $25,300 | $2,500 | $0 | $13,250 | $13,250 | $0 | $0 |
| The following table presents fees billed by D&T that were required to be approved by the registrants’ audit committees (the “Committee”) for services that relate directly to the operations or financial reporting of the Fund and that are rendered on behalf of BlackRock Advisors, LLC (“Investment Adviser” or “BlackRock”) and entities controlling, controlled by, or under common control with BlackRock (not including any sub-adviser whose role is primarily portfolio management and is subcontracted with or overseen by another investment adviser) that provide ongoing services to the Fund (“Fund Service Providers”): |
| Current Fiscal Year End | Previous Fiscal Year End |
(b) Audit-Related Fees1 | $0 | $0 |
(c) Tax Fees2 | $0 | $0 |
(d) All Other Fees3 | $2,970,000 | $3,030,000 |
1 The nature of the services includes assurance and related services reasonably related to the performance of the audit of financial statements not included in Audit Fees.
2 The nature of the services includes tax compliance, tax advice and tax planning.
3 Aggregate fees borne by BlackRock in connection with the review of compliance procedures and attestation thereto performed by D&T with respect to all of the registered closed-end funds and some of the registered open-end funds advised by BlackRock.
| (e)(1) Audit Committee Pre-Approval Policies and Procedures: |
| |
| The Committee has adopted policies and procedures with regard to the pre-approval of services. Audit, audit-related and tax compliance services provided to the registrant on an annual basis require specific pre-approval by the Committee. The Committee also must approve other non-audit services provided to the registrant and those non-audit services provided to the Investment Adviser and Fund Service Providers that relate directly to the operations and the financial reporting of the registrant. Certain of these non-audit services that the Committee believes are a) consistent with the SEC’s auditor independence rules and b) routine and recurring services that will not impair the independence of the independent accountants may be approved by the Committee without consideration on a specific case-by-case basis (“general pre-approval”). The term of any general pre-approval is 12 months from the date of the pre-approval, unless the Committee provides for a different period. Tax or other non-audit services provided to the registrant which have a direct impact on the operations or financial reporting of the registrant will only be deemed pre-approved provided that any individual project does not exceed $10,000 attributable to the registrant or $50,000 per project. For this purpose, multiple projects will be aggregated to determine if they exceed the previously mentioned cost levels. |
| |
| Any proposed services exceeding the pre-approved cost levels will require specific pre-approval by the Committee, as will any other services not subject to general pre-approval (e.g., unanticipated but permissible services). The Committee is informed of each service approved subject to general pre-approval at the next regularly scheduled in-person board meeting. At this meeting, an analysis of such services is presented to the Committee for ratification. The Committee may delegate to the Committee Chairman the authority to approve the provision of and fees for any specific engagement of permitted non-audit services, including services exceeding pre-approved cost levels. |
| |
| (e)(2) None of the services described in each of Items 4(b) through (d) were approved by the Committee pursuant to the de minimus exception in paragraph (c)(7)(i)(C) of Rule 2-01 of Regulation S-X. |
| |
| (f) Not Applicable |
| |
| (g) The aggregate non-audit fees paid to the accountant for services rendered by the accountant to the registrant, the Investment Adviser and the Fund Service Providers were: |
| | Entity Name | Current Fiscal Year End | Previous Fiscal Year End |
| | BlackRock Large Cap Core Fund | $14,850 | $12,350 |
| | BlackRock Large Cap Core Plus Fund | $9,100 | $6,600 |
| | BlackRock Large Cap Core Retirement Portfolio | $13,900 | $11,400 |
| | BlackRock Large Cap Growth Fund | $14,850 | $12,350 |
| | BlackRock Large Cap Growth Retirement Portfolio | $12,500 | $10,000 |
| | BlackRock Large Cap Value Fund | $14,850 | $12,350 |
| | BlackRock Large Cap Value Retirement Portfolio | $14,850 | $12,350 |
| | Master Large Cap Core Portfolio | $15,750 | $13,250 |
| | Master Large Cap Growth Portfolio | $15,750 | $13,250 |
| | Master Large Cap Value Portfolio | $15,750 | $13,250 |
| Additionally, SSAE 16 Review (Formerly, SAS No. 70) fees for the current and previous fiscal years of $2,970,000 and $3,030,000, respectively, were billed by D&T to the Investment Adviser. |
| |
| (h) The Committee has considered and determined that the provision of non-audit services that were rendered to the Investment Adviser, and the Fund Service Providers that were not pre-approved pursuant to paragraph (c)(7)(ii) of Rule 2-01 of Regulation S-X is compatible with maintaining the principal accountant’s independence. |
| |
Item 5 – | Audit Committee of Listed Registrants – Not Applicable |
| |
Item 6 – | Investments |
| (a) The registrants’ Schedules of Investments are included as part of the Report to Stockholders filed under Item 1 of this Form. |
| (b) Not Applicable due to no such divestments during the semi-annual period covered since the previous Form N-CSR filing. |
| |
Item 7 – | Disclosure of Proxy Voting Policies and Procedures for Closed-End Management Investment Companies – Not Applicable |
| |
Item 8 – | Portfolio Managers of Closed-End Management Investment Companies – Not Applicable |
| |
Item 9 – | Purchases of Equity Securities by Closed-End Management Investment Company and Affiliated Purchasers – Not Applicable |
| |
Item 10 – | Submission of Matters to a Vote of Security Holders – There have been no material changes to these procedures. |
Item 11 – | Controls and Procedures |
| |
11(a) – | The registrants’ principal executive and principal financial officers, or persons performing similar functions, have concluded that the registrants’ disclosure controls and procedures (as defined in Rule 30a-3(c) under the Investment Company Act of 1940, as amended (the “1940 Act”)) are effective as of a date within 90 days of the filing of this report based on the evaluation of these controls and procedures required by Rule 30a-3(b) under the 1940 Act and Rule 15d-15(b) under the Securities Exchange Act of 1934, as amended. |
| |
11(b) – | There were no changes in the registrants’ internal control over financial reporting (as defined in Rule 30a-3(d) under the 1940 Act) that occurred during the second fiscal quarter of the period covered by this report that have materially affected, or are reasonably likely to materially affect, the registrants’ internal control over financial reporting. |
| |
Item 12 – | Exhibits attached hereto |
| |
12(a)(1) – | Code of Ethics – See Item 2 |
| |
12(a)(2) – | Certifications – Attached hereto |
| |
12(a)(3) – | Not Applicable |
| |
12(b) – | Certifications – Attached hereto |
| Pursuant to the requirements of the Securities Exchange Act of 1934 and the Investment Company Act of 1940, each registrant has duly caused this report to be signed on its behalf by the undersigned, thereunto duly authorized. |
| |
| BlackRock Large Cap Series Funds, Inc. and Master Large Cap Series LLC |
| |
| | By: | /s/ John M. Perlowski | |
| | | John M. Perlowski |
| | | Chief Executive Officer (principal executive officer) of |
| | | BlackRock Large Cap Series Funds, Inc. and Master Large Cap Series LLC |
| | |
| | Date: December 4, 2012 |
| | |
| | Pursuant to the requirements of the Securities Exchange Act of 1934 and the Investment Company Act of 1940, this report has been signed below by the following persons on behalf of each registrant and in the capacities and on the dates indicated. |
| | |
| | By: | /s/ John M. Perlowski | |
| | | John M. Perlowski |
| | | Chief Executive Officer (principal executive officer) of |
| | | BlackRock Large Cap Series Funds, Inc. and Master Large Cap Series LLC |
| | |
| | Date: December 4, 2012 |
| | |
| | By: | /s/ Neal J. Andrews | |
| | | Neal J. Andrews |
| | | Chief Financial Officer (principal financial officer) of |
| | | BlackRock Large Cap Series Funds, Inc. and Master Large Cap Series LLC |
| | | |
| | Date: December 4, 2012 |