UNITED STATES
SECURITIES AND EXCHANGE COMMISSION
Washington, D.C. 20549
FORM N-CSR
CERTIFIED SHAREHOLDER REPORT OF REGISTERED MANAGEMENT INVESTMENT COMPANIES
Investment Company Act file number: 811-02405, 811-09739 and 811-21434
Name of Fund: BlackRock Balanced Capital Fund, Inc., Master Large Cap Core Portfolio of Master Large Cap Series LLC and Master Total Return Portfolio of Master Bond LLC
Fund Address: 100 Bellevue Parkway, Wilmington, DE 19809
Name and address of agent for service: John M. Perlowski, Chief Executive Officer, BlackRock Balanced Capital Fund, Inc., Master Large Cap Core Portfolio of Master Large Cap Series LLC and Master Total Return Portfolio of Master Bond LLC, 55 East 52nd Street, New York, NY 10055
Registrants’ telephone number, including area code: (800) 441-7762
Date of fiscal year end: 09/30/2017
Date of reporting period: 03/31/2017
Item 1 – Report to Stockholders
MARCH 31, 2017
| | | | |
SEMI-ANNUAL REPORT (UNAUDITED) | | | | BLACKROCK® |
BlackRock Balanced Capital Fund, Inc.
| | |
| Not FDIC Insured ◾May Lose Value ◾ No Bank Guarantee | | |
Dear Shareholder,
In the 12 months ended March 31, 2017, risk assets, such as stocks and high-yield bonds, delivered strong performance, while U.S. Treasuries and other higher-quality assets generated negative returns. Markets showed great resilience during a period with big surprises, including the United Kingdom’s vote to leave the European Union and the outcome of the U.S. presidential election, which brought only brief spikes in equity market volatility. The more rate-sensitive high-quality assets, however, struggled as rising energy prices, modest wage increases and steady U.S. job growth led to expectations of higher inflation and anticipation of interest rate increases by the U.S. Federal Reserve (the “Fed”).
The global reflationary theme – rising nominal growth, wages and inflation – was the dominant driver of asset returns during the period, outweighing significant political upheavals and uncertainty. Reflationary expectations accelerated after the U.S. election and continued into the beginning of 2017, stoked by expectations for an extra boost to U.S. growth via fiscal policy. The primary tension surfacing in markets in 2017 has been between reflationary expectations and the realities of fiscal and monetary policy. Markets have been turning their attention to the Fed’s outlook for additional interest rate hikes, while assessing the probability of Congress passing meaningful fiscal stimulus amid political division and a limited budget.
Although economic momentum is gaining traction, the capacity for rapid global growth is restrained by structural factors, including an aging population, low productivity growth and excess savings, as well as cyclical factors, like the Fed leaning toward higher interest rates and the length of the current expansion. Tempered economic growth and high valuations across most assets have set the stage for muted long-term investment returns going forward.
Equity markets still present opportunities, although the disparity between winners and losers is widening–a dynamic that increases the risk and return potential of active investing. Fixed income investors are also facing challenges as bond markets recalibrate for higher inflation expectations after eight years of deflationary concerns. And in a world where political risk and policy uncertainty abound, there is no lack of potential catalysts for higher volatility.
In this environment, investors need to think globally, extend their scope across a broad array of asset classes and be nimble as market conditions change. We encourage you to talk with your financial advisor and visit blackrock.com for further insight about investing in today’s markets.
Sincerely,

Rob Kapito
President, BlackRock Advisors, LLC

Rob Kapito
President, BlackRock Advisors, LLC
| | | | | | |
| Total Returns as of March 31, 2017 |
| | | 6-month | | | 12-month |
U.S. large cap equities (S&P 500® Index) | | | 10.12 | % | | 17.17% |
U.S. small cap equities (Russell 2000® Index) | | | 11.52 | | | 26.22 |
International equities (MSCI Europe, Australasia, Far East Index) | | | 6.48 | | | 11.67 |
Emerging market equities (MSCI Emerging Markets Index) | | | 6.80 | | | 17.21 |
3-month Treasury bills (BofA Merrill Lynch 3-Month U.S. Treasury Bill Index) | | | 0.19 | | | 0.36 |
U.S. Treasury securities (BofA Merrill Lynch 10- Year U.S. Treasury Index) | | | (6.08 | ) | | (3.97) |
U.S. investment grade bonds (Bloomberg Barclays U.S. Aggregate Bond Index) | | | (2.18 | ) | | 0.44 |
Tax-exempt municipal bonds (S&P Municipal Bond Index) | | | (1.93 | ) | | 0.55 |
U.S. high yield bonds (Bloomberg Barclays U.S. Corporate High Yield 2% Issuer Capped Index) | | | 4.50 | | | 16.39 |
| | | | |
|
| Past performance is no guarantee of future results. Index performance is shown for illustrative purposes only. You cannot invest directly in an index. |
| | | | | | |
| 2 | | THIS PAGE NOT PART OF YOUR FUND REPORT | | | | |
| | | | | | |
| | | BLACKROCK BALANCED CAPITAL FUND, INC. | | MARCH 31, 2017 | | 3 |
| | | | |
| Fund Summary as of March 31, 2017 | | | | |
BlackRock Balanced Capital Fund, Inc.’s (the “Fund”) investment objective is to seek the highest total investment return through a fully managed investment policy utilizing equity, debt (including money market) and convertible securities.
|
Portfolio Management Commentary |
How did the Fund perform?
| • | | For the six-month period ended March 31, 2017, through its investments in Master Large Cap Core Portfolio of Master Large Cap Series LLC (the “equity allocation” or the “Master Large Cap Core Portfolio”) and Master Total Return Portfolio of Master Bond LLC (the “fixed income allocation” or the “Master Total Return Portfolio”) (collectively, the “Master Portfolios”), the Fund outperformed the blended reference benchmark (60% Russell 1000® Index/40% Bloomberg Barclays U.S. Aggregate Bond Index). For the same period, the Fund outperformed the fixed income portion of the benchmark, the Bloomberg Barclays U.S. Aggregate Bond Index, and underperformed the equity portion of the benchmark, the Russell 1000® Index. |
What factors influenced performance?
| • | | The Fund is structured largely as a fund of funds, with the majority of Fund assets allocated between Master Large Cap Core Portfolio and Master Total Return Portfolio, and the balance used for tactical asset allocation. The Fund’s equity allocation was the largest positive contributor to Fund performance, followed by tactical asset allocation, followed by the fixed income allocation. Within the equity allocation, information technology (“IT”) contributed to performance as the sector outperformed due to high growth expectations from favorable secular trends towards digital consumption. Consumer discretionary also added to returns as higher consumer confidence and increased wage growth boosted the sector. With respect to the tactical asset allocation, an underweight to U.S. 30-year bond futures in the early part of the period benefited from increased investor expectations for rising inflation. Within the fixed income allocation, positioning in high yield and an overweight to emerging markets debt added to returns as the search for yield and rising consumer confidence drove investors towards higher risk sectors of the market. Exposure to non-agency mortgage-backed securities (“MBS”) also contributed to performance. |
| • | | In terms of detractors within the equity allocation, selection within the health care sector was the most significant constraint on performance. The sector was a drag on returns for much of 2016 before outperforming in the first quarter of 2017. However, company-specific concerns with |
respect to a generic pharmaceutical company and a large biotech company held by Master Large Cap Core Portfolio more than offset the sector’s rebound. Within fixed income, an underweight to investment grade credit detracted from performance as the sector outperformed. Positioning with respect to duration and corresponding interest rate sensitivity as well as positioning along the yield curve also weighed on returns.
Describe recent portfolio activity.
| • | | Overall, the Fund began the period with an overweight position in equities and an underweight position in U.S. fixed income on the investment adviser’s expectations for global reflation, the key risk allocation theme throughout 2016. As market pricing of risk assets moved in a favorable direction following the U.S. election, the risk allocated to this theme was reduced during the first quarter of 2017. |
| • | | Within equities, following the U.S. election, the Master Large Cap Core Portfolio moved to overweight U.S. and Japanese equities given strength in macroeconomic data. These overweight positions were subsequently removed after equity markets rallied, adding to performance. Later in the period, the Master Large Cap Core Portfolio initiated a pair trade designed to benefit from any outperformance of European equities versus U.S. equities, based upon the view that the European economy would remain resilient in a period of notable political uncertainty. This stance added to returns as European equities outperformed. Conversely, the Master Large Cap Core Portfolio’s underweight to U.S. equities dampened returns as that market rallied. |
Describe portfolio positioning at period end.
| • | | The Fund ended the period neutral overall on risk assets, with a tactical overweight to European equities paired against an underweight to U.S. equities. Through its investment in the Master Large Cap Core Portfolio, the Fund ended the period overweight in financials, IT and health care, while maintaining underweights to consumer staples and utilities. Through its investment in the Master Total Return Portfolio, the Fund ended the period overweight in non-agency MBS, commercial MBS, collateralized loan obligations and emerging markets debt, while maintaining underweights to U.S. and European sovereign debt. |
The views expressed reflect the opinions of BlackRock as of the date of this report and are subject to change based on changes in market, economic or other conditions. These views are not intended to be a forecast of future events and are no guarantee of future results.
| | |
Portfolio Composition | | Percent of
Total Investments |
| | | | |
Mutual Funds. | | | 88% | |
Investment Companies | | | 10 | |
Short-Term Securities | |
| 2
|
|
| | | | | | |
| 4 | | BLACKROCK BALANCED CAPITAL FUND, INC. | | MARCH 31, 2017 | | |
|
Total Return Based on a $10,000 Investment |
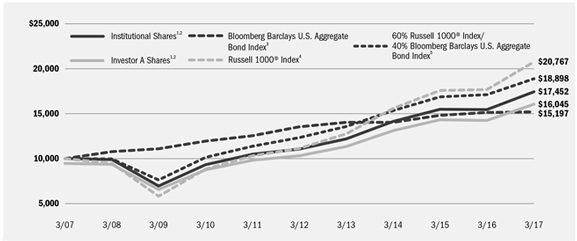
| | 1 | Assuming maximum sales charges, if any, transaction costs and other operating expenses, including investment advisory and administration fees. Institutional Shares do not have a sales charge. |
| | 2 | The Fund invests in equity securities (including common stock, preferred stock, securities convertible into common stock, or securities or other instruments whose price is linked to the value of common stock) and fixed-income securities (including debt securities, convertible securities and short term securities). |
| | 3 | A widely recognized unmanaged market-weighted index, comprised of investment-grade corporate bonds rated BBB or better, mortgages and U.S. Treasury and U.S. Government agency issues with at least one year to maturity. |
| | 4 | An index that measures the performance of the large cap segment of the U.S. equity universe. It is a subset of the Russell 3000® Index and includes approximately 1,000 of the largest securities based on a combination of their market capitalization and current index membership. The index represents approximately 92% of the total market capitalization of the Russell 3000® Index. |
| | 5 | A customized weighted index comprised of the returns of the Russell 1000® Index (60%) and Bloomberg Barclays U.S. Aggregate Bond Index (40%). |
|
Performance Summary for the Period Ended March 31, 2017 |
| | | | | | | | | | | | | | | | | | | | | | | | | | | | | | | | | | | |
| | | | | Average Annual Total Returns6 |
| | | | | 1 Year | | 5 Years | | 10 Years |
| | | 6-Month
Total Returns | | w/o sales
charge | | w/ sales
charge | | w/o sales
charge | | w/ sales
charge | | w/o sales
charge | | w/ sales
charge |
Institutional | | | | 8.18 | % | | | | 12.79 | % | | | | N/A | | | | | 9.57 | % | | | | N/A | | | | | 5.73 | % | | | | N/A | |
Investor A | | | | 8.05 | | | | | 12.47 | | | | | 6.57 | % | | | | 9.24 | | | | | 8.07 | % | | | | 5.41 | | | | | 4.84 | % |
Investor B | | | | 7.03 | | | | | 10.64 | | | | | 6.14 | | | | | 7.99 | | | | | 7.69 | | | | | 4.59 | | | | | 4.59 | |
Investor C | | | | 7.65 | | | | | 11.62 | | | | | 10.62 | | | | | 8.41 | | | | | 8.41 | | | | | 4.59 | | | | | 4.59 | |
Class R | | | | 7.89 | | | | | 12.09 | | | | | N/A | | | | | 8.87 | | | | | N/A | | | | | 5.00 | | | | | N/A | |
60% Russell 1000® Index/40% Bloomberg Barclays U.S. Aggregate Bond Index | | | | 5.08 | | | | | 10.41 | | | | | N/A | | | | | 8.92 | | | | | N/A | | | | | 6.57 | | | | | N/A | |
Bloomberg Barclays U.S. Aggregate Bond Index | | | | (2.18 | ) | | | | 0.44 | | | | | N/A | | | | | 2.34 | | | | | N/A | | | | | 4.27 | | | | | N/A | |
Russell 1000® Index | | | | 10.09 | | | | | 17.43 | | | | | N/A | | | | | 13.26 | | | | | N/A | | | | | 7.58 | | | | | N/A | |
| | 6 | | Assuming maximum sales charges, if any. Average annual total returns with and without sales charges reflect reductions for distribution and service fees. See “About Fund Performance” on page 6 for a detailed description of share classes, including any related sales charges and fees. |
| | | | N/A—Not applicable as share class and index do not have a sales charge. |
| | | | Past performance is not indicative of future results. |
| | | | Performance results may include adjustments made for financial reporting purposes in accordance with U.S. generally accepted accounting principles. |
| | | | | | | | | | | | | | | | |
Expense Example | | | | | | | | | | | | | | | | |
| | | Actual | | Hypothetical8 | | | |
| | | Beginning
Account Value
October 1, 2016 | | Ending
Account Value
March 31, 2017 | | Expenses Paid
During the Period7 | | Beginning
Account Value
October 1, 2016 | | Ending
Account Value
March 31, 2017 | | Expenses Paid
During the Period7 | | Annualized
Expense Ratio | |
Institutional | | $1,000.00 | | $1,081.80 | | $ 3.06 | | $1,000.00 | | $1,021.99 | | $ 2.97 | | | 0.59 | % |
Investor A | | $1,000.00 | | $1,080.50 | | $ 4.56 | | $1,000.00 | | $1,020.54 | | $ 4.43 | | | 0.88 | % |
Investor B | | $1,000.00 | | $1,070.30 | | $14.81 | | $1,000.00 | | $1,010.62 | | $14.39 | | | 2.87 | % |
Investor C | | $1,000.00 | | $1,076.50 | | $ 8.44 | | $1,000.00 | | $1,016.80 | | $ 8.20 | | | 1.63 | % |
Class R | | $1,000.00 | | $1,078.90 | | $ 6.32 | | $1,000.00 | | $1,018.85 | | $ 6.14 | | | 1.22 | % |
| | 7 | | For each class of the Fund, expenses are equal to the annualized expense ratio for the class, multiplied by the average account value over the period, multiplied by 182/365 (to reflect the one-half year period shown). Because the Fund invests significantly in the Master Portfolios, the expense example reflects the net expenses of both the Fund and the Master Portfolios in which it invests. |
| | 8 | | Hypothetical 5% annual return before expenses is calculated by prorating the number of days in the most recent fiscal half year divided by 365. |
| | | | See “Disclosure of Expenses” on page 6 for further information on how expenses were calculated. |
| | | | | | |
| | | BLACKROCK BALANCED CAPITAL FUND, INC. | | MARCH 31, 2017 | | 5 |
| • | | Institutional Shares are not subject to any sales charge. These shares bear no ongoing distribution or service fees and are available only to certain eligible investors. |
| • | | Investor A Shares are subject to a maximum initial sales charge (front-end load) of 5.25% and a service fee of 0.25% per year (but no distribution fee). Certain redemptions of these shares may be subject to a contingent deferred sales charge (“CDSC”) where no initial sales charge was paid at the time of purchase. These shares are generally available through financial intermediaries. |
| • | | Investor B Shares are subject to a maximum CDSC of 4.50% declining to 0% after six years. In addition, these shares are subject to a distribution fee of 0.75% per year and a service fee of 0.25% per year. These shares automatically convert to Investor A Shares after approximately eight years. (There is no initial sales charge for automatic share conversions.) All returns for periods greater than eight years reflect this conversion. These shares are only available through exchanges and distribution reinvestments by current holders and for purchase by certain employer-sponsored retirement plans. |
| • | | Investor C Shares are subject to a 1.00% CDSC if redeemed within one year of purchase. In addition, these shares are subject to a distribution fee of 0.75% per year and a service fee of 0.25% per year. These shares are generally available through financial intermediaries. |
| • | | Class R Shares are not subject to any sales charge. These shares are subject to a distribution fee of 0.25% per year and a service fee of 0.25% per year. These shares are available only to certain employer-sponsored retirement plans. |
Performance information reflects past performance and does not guarantee future results. The performance information for periods prior to February 2009 does not reflect any investment by the Fund in the Master Large Cap Core Portfolio. Current performance may be lower or higher than the performance data quoted. Refer to www.blackrock.com/funds to obtain performance data current to the most recent month end. Performance results do not reflect the deduction of taxes that a shareholder would pay on fund distributions or the redemption of fund shares. Figures shown in the performance tables on the previous page assume reinvestment of all distributions, if any, at net asset value (“NAV”) on the ex-dividend dates. Investment return and principal value of shares will fluctuate so that shares, when redeemed, may be worth more or less than their original cost. Distributions paid to each class of shares will vary because of the different levels of service, distribution and transfer agency fees applicable to each class, which are deducted from the income available to be paid to shareholders.
BlackRock Advisors, LLC (the “Manager”), the Fund’s investment adviser, has contractually agreed to waive and/or reimburse a portion of the Fund’s expenses. Without such waiver and/or reimbursement, the Fund’s performance would have been lower. The Manager is under no obligation to continue waiving and/or reimbursing its fees after the applicable termination date of such agreement. See Note 5 of the Notes to Financial Statements for additional information on waivers and/or reimbursements.
Shareholders of the Fund may incur the following charges: (a) transactional expenses, such as sales charges; and (b) operating expenses, including investment advisory fees, service and distribution fees, including 12b-1 fees, acquired fund fees and expenses and other fund expenses. The expense example shown on the previous page (which is based on a hypothetical investment of $1,000 invested on October 1, 2016 and held through March 31, 2017) is intended to assist shareholders both in calculating expenses based on an investment in the Fund and in comparing these expenses with similar costs of investing in other mutual funds.
The expense example provides information about actual account values and actual expenses. In order to estimate the expenses a shareholder paid during the period covered by this report, shareholders can divide their account value by $1,000 and then multiply the result by the number corresponding to their share class under the heading entitled “Expenses Paid During the Period.”
The expense example also provides information about hypothetical account values and hypothetical expenses based on the Fund’s actual expense ratio and an assumed rate of return of 5% per year before expenses. In order to assist shareholders in comparing the ongoing expenses of investing in the Fund and other funds, compare the 5% hypothetical examples with the 5% hypothetical examples that appear in shareholder reports of other funds.
The expenses shown in the expense example are intended to highlight shareholders’ ongoing costs only and do not reflect any transactional expenses, such as sales charges, if any. Therefore, the hypothetical examples are useful in comparing ongoing expenses only, and will not help shareholders determine the relative total expenses of owning different funds. If these transactional expenses were included, shareholder expenses would have been higher.
| | | | | | |
| 6 | | BLACKROCK BALANCED CAPITAL FUND, INC. | | MARCH 31, 2017 | | |
| | | | |
| The Benefits and Risks of Leveraging | | | | |
The Master Total Return Portfolio may utilize leverage to seek to enhance returns and net asset value (“NAV”). However, these objectives cannot be achieved in all interest rate environments.
The Master Total Return Portfolio may utilize leverage by entering into reverse repurchase agreements and/or treasury roll transactions. In general, the concept of leveraging is based on the premise that the financing cost of leverage, which is based on short-term interest rates, is normally lower than the income earned by the Master Total Return Portfolio on its longer-term portfolio investments purchased with the proceeds from leverage. To the extent that the total assets of the Master Total Return Portfolio (including the assets obtained from leverage) are invested in higher-yielding portfolio investments, the Master Total Return Portfolio’s shareholders benefit from the incremental net income.
The interest earned on securities purchased with the proceeds from leverage is distributed to the Master Total Return Portfolio’s shareholders, and the value of these portfolio holdings is reflected in the Master Total Return Portfolio’s per share NAV. However, in order to benefit shareholders, the return on assets purchased with leverage proceeds must exceed the ongoing costs associated with the leverage. If interest and other ongoing costs of leverage exceed the Master Total Return Portfolio’s return on assets purchased with leverage proceeds, income to shareholders is lower than if the Master Total Return Portfolio had not used leverage.
Furthermore, the value of the Master Total Return Portfolio’s investments generally varies inversely with the direction of long-term interest rates, although other factors can also influence the value of portfolio investments. As a result, changes in interest rates can influence the Master Total Return Portfolio’s NAV positively or negatively in addition to the impact on the Master Total Return Portfolio’s performance from leverage. Changes in the direction of interest rates are difficult to predict accurately, and there is no assurance that the Master Total Return Portfolio’s leveraging strategy will be successful.
The use of leverage also generally causes greater changes in the Master Total Return Portfolio’s NAV and dividend rates than comparable portfolios without leverage. In a declining market, leverage is likely to cause a greater decline in the NAV of the Master Total Return Portfolio’s shares than if the Master Total Return Portfolio was not leveraged. In addition, the Master Total Return Portfolio may be required to sell portfolio securities at inopportune times or at distressed values in order to comply with regulatory requirements applicable to the use of leverage or as required by the terms of the leverage instruments, which may cause the Master Total Return Portfolio to incur losses. The use of leverage may limit the Master Total Return Portfolio’s ability to invest in certain types of securities or use certain types of hedging strategies. The Master Total Return Portfolio incurs expenses in connection with the use of leverage, all of which are borne by the Master Total Return Portfolio’s shareholders and may reduce income.
|
Derivative Financial Instruments |
The Fund and/or the Master Portfolios may invest in various derivative financial instruments. These instruments are used to obtain exposure to a security, commodity, index, market, and/or other asset without owning or taking physical custody of securities, commodities and/or other referenced assets or to manage market, equity, credit, interest rate, foreign currency exchange rate, commodity and/or other risks. Derivative financial instruments may give rise to a form of economic leverage and involve risks, including the imperfect correlation between the value of a derivative financial instrument and the underlying asset, possible default of the counterparty to the transaction or illiquidity of the instrument. The Fund
and/or the Master Portfolios’ successful use of a derivative financial instrument depends on the investment adviser’s ability to predict pertinent market movements accurately, which cannot be assured. The use of these instruments may result in losses greater than if they had not been used, may limit the amount of appreciation the Fund and/or the Master Portfolios can realize on an investment and/or may result in lower distributions paid to shareholders. The Fund and/or the Master Portfolios’ investments in these instruments, if any, are discussed in detail in the Fund and the Master Portfolios’ Notes to Financial Statements.
| | | | | | |
| | | BLACKROCK BALANCED CAPITAL FUND, INC. | | MARCH 31, 2017 | | 7 |
| | | | |
| Schedule of Investments March 31, 2017 (Unaudited) | | | BlackRock Balanced Capital Fund, Inc. | |
| | | (Percentages shown are based on Net Assets) | |
| | | | | | | | |
| Investment Companies | | Shares | | | Value | |
iShares Core S&P 500 ETF (a) | | | 71,336 | | | $ | 16,925,893 | |
iShares Core U.S. Aggregate Bond ETF (a) | | | 433,593 | | | | 47,040,504 | |
Vanguard Total Bonds Market ETF | | | 472,301 | | | | 38,294,164 | |
Total Investment Companies — 9.9% | | | | | | | 102,260,561 | |
| | | | | | | | |
| | | | | | | |
Mutual Funds | | | | | | | | |
Master Large Cap Core Portfolio of Master Large Cap Series LLC (a) | | | — | | | | 591,910,593 | |
Master Total Return Portfolio of Master Bond LLC (a) | | | — | | | | 320,721,842 | |
Total Mutual Funds — 87.8% | | | | | | | 912,632,435 | |
| | | | | | | | |
Total Long-Term Investments (Cost — $879,263,674) — 97.7% | | | | | 1,014,892,996 | |
| | | | | | | | |
| Short-Term Securities | | Shares | | | Value | |
BlackRock Liquidity Funds, T-Fund, Institutional Class, 0.60% (a)(b) | | | 23,004,742 | | | | $ 23,004,742 | |
Total Short-Term Securities (Cost — $23,004,742) — 2.2% | | | | | | | 23,004,742 | |
| | | | | | | | |
Total Investments (Cost — $902,268,416) — 99.9% | | | 1,037,897,738 | |
Other Assets Less Liabilities — 0.1% | | | | | | | 1,115,284 | |
| | | | | | | | |
Net Assets — 100.0% | | | | | | | $1,039,013,022 | |
| | | | | | | | |
|
Notes to Schedule of Investments |
| (a) | During the six months ended March 31, 2017, investments in issuers considered to be affiliates of the Fund for purposes of Section 2(a)(3) of the Investment Company Act of 1940, as amended, were as follows: |
| | | | | | | | | | | | | | | | | | | | | | | | | | | | | | | | |
| Affiliate | | Shares/
Investment
Value Held at
September 30,
2016 | | | Shares/
Investment
Value
Purchased | | | Shares/
Investment
Value Sold | | | Shares/
Investment
Value Held
at March 31,
2017 | | | Value at
March 31, 2017 | | | Income | | | Net
Realized
Gain
(Loss)1 | | | Change in
Unrealized
Appreciation
(Depreciation) | |
BlackRock Liquidity Funds, T-Fund, Institutional Class | | | 17,294,562 | | | | 5,710,180 | 2 | | | — | | | | 23,004,742 | | | $ | 23,004,742 | | | $ | 36,397 | | | $ | 164 | | | | — | |
iShares Core S&P 500 ETF | | | 104,400 | | | | 105,779 | | | | (138,843 | ) | | | 71,336 | | | | 16,925,893 | | | | 73,631 | | | | 822,047 | | | | $ (549,640) | |
iShares Core U.S. Aggregate Bond ETF | | | 360,230 | | | | 73,363 | | | | — | | | | 433,593 | | | | 47,040,504 | | | | 520,071 | | | | — | | | | (1,390,490) | |
Master Large Cap Core Portfolio of Master Large Cap Series LLC | | | $567,148,794 | | | $ | 24,761,799 | 2,3 | | | — | | | $ | 591,910,593 | | | | 591,910,593 | | | | 5,586,607 | | | | 41,772,976 | | | | 35,450,872 | |
Master Total Return Portfolio of Master Bond LLC | | | $324,410,915 | | | | — | | | $ | (3,689,073 | )3,4 | | $ | 320,721,842 | | | | 320,721,842 | | | | 5,275,961 | | | | (1,820,189 | ) | | | (6,847,229) | |
Total | | | | | | | | | | | | | | | | | | $ | 999,603,574 | | | $ | 11,492,667 | | | $ | 40,774,998 | | | | $26,663,513 | |
| | | | | | | | | | | | | | | | | | | | |
| | 1 | | Includes net capital gain distributions. |
| | 2 | | Represents net shares/investment value purchased. |
| | 3 | | Inclusive of income, expense, realized and unrealized gains and losses allocated from the Master Portfolio. |
| | 4 | | Represents net investment value sold. |
| (b) | Current yield as of period end. |
ETF Exchange-Traded Fund
S&P Standard & Poor’s
USD U.S. Dollar
See Notes to Financial Statements.
| | | | | | |
| 8 | | BLACKROCK BALANCED CAPITAL FUND, INC. | | MARCH 31, 2017 | | |
| | | | |
| Schedule of Investments (continued) | | | BlackRock Balanced Capital Fund, Inc. | |
| | | | | | | | | | |
Derivative Financial Instruments Outstanding as of Period End | | | | | | | | |
| | | | | | | | | | |
| Futures Contracts | | | | | | | |
Contracts Long | | Issue | | Expiration | | Notional Value | | Unrealized
Appreciation
(Depreciation) | |
| 99 | | CAC 40 10 Euro Index | | April 2017 | | USD 5,402,660 | | | $147,198 | |
| 17 | | DAX Index | | June 2017 | | USD 5,590,089 | | | 147,198 | |
| 92 | | Euro Currency | | June 2017 | | USD 12,330,300 | | | 133,606 | |
| 76 | | U.S. Treasury Notes (10 Year) | | June 2017 | | USD 9,466,750 | | | (32,178 | ) |
Total | | | | | | | | | $395,824 | |
| | | | | | | | | | |
Derivative Financial Instruments Categorized by Risk Exposure | | | | | | | | |
As of period end, the fair values of derivative financial instruments located in the Statement of Assets and Liabilities were as follows:
| | | | | | | | | | | | | | | | | | | | | | | | | | | | | | | | | | | | | |
| Assets - Derivative Financial Instruments | | | | Commodity
Contracts | | Credit
Contracts | | Equity
Contracts | | Foreign
Currency
Exchange
Contracts | | Interest
Rate
Contracts | | Other
Contracts | | Total |
Futures contracts | | Net unrealized appreciation1 | | | | — | | | | | — | | | | | $294,396 | | | | | $133,606 | | | | | — | | | | | — | | | | $ | 428,002 | |
| | | | | | | |
Liabilities - Derivative Financial Instruments | | | | | | | | | | | | | | | | | | | | | | | | | | | | | | | | | | | |
Futures contracts | | Net unrealized depreciation1 | | | | — | | | | | — | | | | | — | | | | | — | | | | | $32,178 | | | | | — | | | | $ | 32,178 | |
| | 1 | | Includes cumulative appreciation (depreciation) on futures, if any, as reported in the Schedule of Investments. Only current day’s variation margin is reported within the Statement of Assets and Liabilities. |
For the six months ended March 31, 2017, the effect of derivative financial instruments in the Statement of Operations were as follows:
| | | | | | | | | | | | | | | | | | | | | | | | | | | | | | | | | | | |
| Net Realized Gain (Loss) from: | | Commodity
Contracts | | Credit
Contracts | | Equity
Contracts | | Foreign
Currency
Exchange
Contracts | | Interest
Rate
Contracts | | Other
Contracts | | Total |
Futures contracts | | | | — | | | | | — | | | | | $280,030 | | | | | $(167,769) | | | | | $3,111,039 | | | | | — | | | | | $3,223,300 | |
Net Change in Unrealized Appreciation (Depreciation) on: | | | | | | | | | | | | | | | | | | | | | | | | | | | | | | | | | | | |
Futures contracts | | | | — | | | | | — | | | | | $294,396 | | | | | $133,606 | | | | | $ (458,014) | | | | | — | | | | | $ (30,012 | ) |
| | | | | | | | | | | | | | | | | | | | | | | | | | | | | | | | | | | |
Average Quarterly Balances of Outstanding Derivative Financial Instruments | |
| | | | | | | | | | | | | | | | | | | | | | | | | | |
Futures contracts: | |
Average notional value of contracts - long | | | | | | | | | | | | | | | | | | | | | | | | | | | | | | | | | $ | 37,326,559 | |
For more information about the Fund’s investment risks regarding derivative financial instruments, refer to the Notes to Financial Statements.
| | | | | | | | | | |
Fair Value Hierarchy as of Period End | | | | | | | | |
Various inputs are used in determining the fair value of investments and derivative financial instruments. For more information about the Fund’s policy regarding valuation of investments and derivative financial instruments, refer to the Notes to Financial Statements.
The following tables summarize the Fund’s investments and derivative financial instruments in the disclosure hierarchy:
| | | | | | | | | | | | | | | | |
| | | Level 1 | | | Level 2 | | | Level 3 | | | Total | |
Assets: | | | | | | | | | | | | | | | | |
Investments: | | | | | | | | | | | | | | | | |
Investment Companies | | $ | 102,260,561 | | | | — | | | | — | | | | 102,260,561 | |
Short-Term Securities | | | 23,004,742 | | | | — | | | | — | | | | 23,004,742 | |
| | | | |
Subtotal | | $ | 125,265,303 | | | | — | | | | — | | | | $ 125,265,303 | |
| | | | |
Investments Valued at NAV1 | | | | | | | | | | | | | | | 912,632,435 | |
Total Investments | | | | | | | | | | | | | | | $ 1,037,897,738 | |
| | | | | | | | | | | | | | | | |
| 1 | | As of March 31, 2017, certain investments of the Fund were fair valued using NAV per share or its equivalent as no quoted market value is available and therefore have been excluded from the fair value hierarchy. |
See Notes to Financial Statements.
| | | | | | |
| | | BLACKROCK BALANCED CAPITAL FUND, INC. | | MARCH 31, 2017 | | 9 |
| | | | |
| Schedule of Investments (concluded) | | | BlackRock Balanced Capital Fund, Inc. | |
| | | | | | | | | | | | | | | | |
| | | Level 1 | | | Level 2 | | | Level 3 | | | Total | |
Derivative Financial Instruments1 | | | | | | | | | | | | | | | | |
Assets: | | | | | | | | | | | | | | | | |
Equity contracts | | $ | 294,396 | | | | — | | | | — | | | $ | 294,396 | |
Foreign currency exchange contracts | | | 133,606 | | | | — | | | | — | | | | 133,606 | |
Liabilities: | | | | | | | | | | | | | | | | |
Interest rate contracts | | | (32,178 | ) | | | — | | | | — | | | | (32,178 | ) |
| | | | |
Total | | $ | 395,824 | | | | — | | | | — | | | $ | 395,824 | |
| | | | |
| | 1 | | Derivative financial instruments are futures contracts, which are valued at the unrealized appreciation (depreciation) on the instrument. |
During the six months ended March 31, 2017, there were no transfers between levels.
See Notes to Financial Statements.
| | | | | | |
| 10 | | BLACKROCK BALANCED CAPITAL FUND, INC. | | MARCH 31, 2017 | | |
| | | | |
| Statement of Assets and Liabilities | | | BlackRock Balanced Capital Fund, Inc. | |
| | | | |
| March 31, 2017 (Unaudited) | | | |
| | | | |
Assets | | | | |
Investments at value — affiliated (cost — $864,033,230) | | $ | 999,603,574 | |
Investments at value — unaffiliated (cost — $38,235,186) | | | 38,294,164 | |
Cash pledged for futures contracts | | | 1,136,000 | |
Foreign currency at value (cost — $1,489,399) | | | 1,497,183 | |
Receivable: | | | | |
Capital shares sold | | | 1,107,035 | |
Dividends — affiliated | | | 10,328 | |
Variation margin on futures contracts | | | 73,166 | |
Prepaid expenses | | | 45,631 | |
| | | | |
Total assets | | | 1,041,767,081 | |
| | | | |
| | | | |
Liabilities | | | | |
Payable: | | | | |
Capital shares redeemed | | | 1,979,115 | |
Investment advisory fees | | | 100,376 | |
Officer’s fees | | | 9,675 | |
Other accrued expenses | | | 88,173 | |
Other affiliates | | | 41,350 | |
Service and distribution fees | | | 222,847 | |
Transfer agent fees | | | 305,048 | |
Variation margin on futures contracts | | | 7,475 | |
| | | | |
Total liabilities | | | 2,754,059 | |
| | | | |
Net Assets | | $ | 1,039,013,022 | |
| | | | |
| | | | |
Net Assets Consist of | | | | |
Paid-in capital | | $ | 841,532,689 | |
Undistributed net investment income | | | 2,842,480 | |
Accumulated net realized gain | | | 58,604,923 | |
Net unrealized appreciation (depreciation) | | | 136,032,930 | |
| | | | |
Net Assets | | $ | 1,039,013,022 | |
| | | | |
| | | | |
Net Asset Value | | | | |
Institutional — Based on net assets of $381,632,611 and 15,416,562 shares outstanding, 400 million shares authorized, $0.10 par value | | $ | 24.75 | |
| | | | |
Investor A — Based on net assets of $516,415,996 and 20,929,899 shares outstanding, 200 million shares authorized, $0.10 par value | | $ | 24.67 | |
| | | | |
Investor B — Based on net assets of $277,248 and 11,641 shares outstanding, 500 million shares authorized, $0.10 par value | | $ | 23.82 | |
| | | | |
Investor C — Based on net assets of $126,068,811 and 5,722,718 shares outstanding, 200 million shares authorized, $0.10 par value | | $ | 22.03 | |
| | | | |
Class R — Based on net assets of $14,618,356 and 633,262 shares outstanding, 500 million shares authorized, $0.10 par value | | $ | 23.08 | |
| | | | |
See Notes to Financial Statements.
| | | | | | |
| | | BLACKROCK BALANCED CAPITAL FUND, INC. | | MARCH 31, 2017 | | 11 |
| | | | |
| Statement of Operations | | | BlackRock Balanced Capital Fund, Inc. | |
| | | | |
| Six Months Ended March 31, 2017 (Unaudited) | | | |
| | | | |
Investment Income | | | | |
Dividends — unaffiliated | | $ | 81,248 | |
Dividends — affiliated | | | 630,099 | |
Net investment income allocated from the affiliated Master Portfolios: | | | | |
Interest — unaffiliated | | | 5,246,143 | |
Dividends — unaffiliated | | | 5,633,525 | |
Dividends — affiliated | | | 28,438 | |
Securities lending income — affiliated — net | | | 6,432 | |
Foreign taxes withheld | | | (51,970 | ) |
Total expenses | | | (1,821,873 | ) |
Fees waived | | | 5,504 | |
| | | | |
Total investment income | | | 9,757,546 | |
| | | | |
| | | | |
Fund Expenses | | | | |
Investment advisory | | | 2,152,570 | |
Service and distribution — class specific | | | 1,277,277 | |
Transfer agent — class specific | | | 530,952 | |
Professional | | | 73,285 | |
Registration | | | 54,522 | |
Printing | | | 47,389 | |
Officer | | | 17,167 | |
Miscellaneous | | | 17,644 | |
| | | | |
Total expenses | | | 4,170,806 | |
Less fees waived by the Manager | | | (1,609,946 | ) |
| | | | |
Total expenses after fees waived | | | 2,560,860 | |
| | | | |
Net investment income | | | 7,196,686 | |
| | | | |
| | | | |
Realized and Unrealized Gain (Loss) | | | | |
Net realized gain from: | | | | |
Investments — unaffiliated | | | 96,600 | |
Investments — affiliated | | | 822,047 | |
Capital gain distributions from investment companies — affiliated | | | 164 | |
Foreign currency translations | | | 15,630 | |
Futures contracts | | | 3,223,300 | |
Net realized gain from investments, futures contracts, options written, swaps, forward foreign currency exchange contracts, foreign currency transactions, interest rate caps, borrowed bonds, litigation proceeds and capital gain distributions received from affiliated investment companies allocated from the affiliated Master Portfolios | | | 39,952,787 | |
| | | | |
| | | 44,110,528 | |
| | | | |
| |
Net change in unrealized appreciation (depreciation) on: | | | | |
Investments — unaffiliated | | | 58,978 | |
Investments — affiliated | | | (1,940,130 | ) |
Futures contracts | | | (30,012 | ) |
Foreign currency translations | | | 7,784 | |
Net change in unrealized appreciation (depreciation) on investments, futures contracts, options written, swaps, forward foreign currency exchange contracts, foreign currency transactions, interest rate caps and borrowed bonds allocated from the affiliated Master Portfolios | | | 28,603,643 | |
| | | | |
| | | 26,700,263 | |
| | | | |
Total realized and unrealized gain | | | 70,810,791 | |
| | | | |
Net Increase in Net Assets Resulting from Operations | | $ | 78,007,477 | |
| | | | |
See Notes to Financial Statements.
| | | | | | |
| 12 | | BLACKROCK BALANCED CAPITAL FUND, INC. | | MARCH 31, 2017 | | |
| | | | |
| Statements of Changes in Net Assets | | | BlackRock Balanced Capital Fund, Inc. | |
| | | | | | | | |
| Increase (Decrease) in Net Assets: | | Six Months Ended
March 31, 2017
(Unaudited) | | | Year Ended
September 30, 2016 | |
| | | | | | | | |
Operations | | | | | | | | |
Net investment income | | $ | 7,196,686 | | | $ | 12,881,830 | |
Net realized gain | | | 44,110,528 | | | | 27,349,959 | |
Net change in unrealized appreciation (depreciation) | | | 26,700,263 | | | | 37,045,428 | |
| | | | |
Net increase in net assets resulting from operations | | | 78,007,477 | | | | 77,277,217 | |
| | | | |
| | | | | | | | |
Distributions to Shareholders1 | | | | | | | | |
From net investment income: | | | | | | | | |
Institutional | | | (3,322,181 | ) | | | (5,858,618 | ) |
Investor A | | | (3,947,372 | ) | | | (6,986,219 | ) |
Investor B | | | — | | | | (4,343 | ) |
Investor C | | | (639,285 | ) | | | (1,004,416 | ) |
Class R | | | (91,195 | ) | | | (146,472 | ) |
From net realized gain: | | | | | | | | |
Institutional | | | (11,650,226 | ) | | | (11,859,346 | ) |
Investor A | | | (16,359,474 | ) | | | (16,712,647 | ) |
Investor B | | | (13,851 | ) | | | (59,792 | ) |
Investor C | | | (4,424,571 | ) | | | (3,851,175 | ) |
Class R | | | (455,657 | ) | | | (416,488 | ) |
| | | | |
Decrease in net assets resulting from distributions to shareholders | | | (40,903,812 | ) | | | (46,899,516 | ) |
| | | | |
| | | | | | | | |
Capital Share Transactions | | | | | | | | |
Net increase in net assets derived from capital share transactions | | | 30,452,356 | | | | 39,316,921 | |
| | | | |
| | | | | | | | |
Net Assets | | | | | | | | |
Total increase in net assets | | | 67,556,021 | | | | 69,694,622 | |
Beginning of period | | | 971,457,001 | | | | 901,762,379 | |
| | | | |
End of period | | $ | 1,039,013,022 | | | $ | 971,457,001 | |
| | | | |
Undistributed net investment income, end of period | | $ | 2,842,480 | | | $ | 3,645,827 | |
| | | | |
| | 1 | | Distributions for annual periods determined in accordance with U.S. federal income tax regulations. |
See Notes to Financial Statements.
| | | | | | |
| | | BLACKROCK BALANCED CAPITAL FUND, INC. | | MARCH 31, 2017 | | 13 |
| | | | |
| Financial Highlights | | | BlackRock Balanced Capital Fund, Inc. | |
| | | | | | | | | | | | | | | | | | | | | | | | | | | | |
| | | Institutional | |
| | | Six Months Ended
March 31, 2017 (Unaudited) | | | Year Ended September 30, | |
| | | | 2016 | | | 2015 | | | 2014 | | | 2013 | | | 2012 | | | | |
| | | | | | | | | | | | | | | | | | | | | | | | | | | | |
Per Share Operating Performance | | | | | | | | | | | | | | | | | | | | | | | | | | | | |
Net asset value, beginning of period | | $ | 23.86 | | | $ | 23.09 | | | $ | 26.07 | | | $ | 25.16 | | | $ | 23.77 | | | $ | 20.18 | | | | | |
| | | | |
Net investment income1 | | | 0.21 | | | | 0.38 | | | | 0.37 | | | | 0.48 | | | | 0.47 | | | | 0.55 | | | | | |
Net realized and unrealized gain (loss) | | | 1.70 | | | | 1.64 | | | | (0.03 | ) | | | 3.05 | | | | 2.35 | | | | 3.55 | | | | | |
| | | | |
Net increase from investment operations | | | 1.91 | | | | 2.02 | | | | 0.34 | | | | 3.53 | | | | 2.82 | | | | 4.10 | | | | | |
| | | | |
Distributions:2 | | | | | | | | | | | | | | | | | | | | | | | | | | | | |
From net investment income | | | (0.23 | ) | | | (0.41 | ) | | | (0.43 | ) | | | (0.56 | ) | | | (0.53 | ) | | | (0.51) | | | | | |
From net realized gain | | | (0.79 | ) | | | (0.84 | ) | | | (2.89 | ) | | | (2.06 | ) | | | (0.90 | ) | | | — | | | | | |
| | | | |
Total distributions | | | (1.02 | ) | | | (1.25 | ) | | | (3.32 | ) | | | (2.62 | ) | | | (1.43 | ) | | | (0.51) | | | | | |
| | | | |
Net asset value, end of period | | $ | 24.75 | | | $ | 23.86 | | | $ | 23.09 | | | $ | 26.07 | | | $ | 25.16 | | | $ | 23.77 | | | | | |
| | | | |
| | | | | | | | | | | | | | | | | | | | | | | | | | | | |
Total Return3 | | | | | | | | | | | | | | | | | | | | | | | | | | | | |
Based on net asset value | | | 8.18 | %4,5 | | | 8.93 | %4 | | | 0.82 | % | | | 14.77 | % | | | 12.42 | % | | | 20.52% | | | | | |
| | | | |
| | | | | | | | | | | | | | | | | | | | | | | | | | | | |
Ratios to Average Net Assets6 | | | | | | | | | | | | | | | | | | | | | | | | | | | | |
Total expenses7 | | | 0.92 | %8 | | | 0.94 | % | | | 0.92 | % | | | 0.95 | % | | | 0.98 | % | | | 0.96% | | | | | |
| | | | |
Total expenses after fees waived and/or reimbursed7 | | | 0.59 | %8 | | | 0.63 | % | | | 0.59 | % | | | 0.63 | % | | | 0.66 | % | | | 0.66% | | | | | |
| | | | |
Net investment income7 | | | 1.72 | %8 | | | 1.64 | % | | | 1.52 | % | | | 1.88 | % | | | 1.87 | % | | | 2.45% | | | | | |
| | | | |
| | | | | | | | | | | | | | | | | | | | | | | | | | | | |
Supplemental Data | | | | | | | | | | | | | | | | | | | | | | | | | | | | |
Net assets, end of period (000) | | $ | 381,633 | | | $ | 348,430 | | | $ | 341,225 | | | $ | 348,345 | | | $ | 317,572 | | | $ | 426,027 | | | | | |
| | | | |
Portfolio turnover rate of the Fund9 | | | 45 | % | | | — | | | | — | | | | — | | | | — | | | | — | | | | | |
| | | | |
Portfolio turnover rate of the Master Total Return Portfolio10 | | | 487 | % | | | 841 | % | | | 1,015 | % | | | 750 | % | | | 777 | % | | | 1,346% | | | | | |
| | | | |
Portfolio turnover rate of the Master Large Cap Core Portfolio | | | 22 | % | | | 39 | % | | | 41 | % | | | 40 | % | | | 50 | % | | | 128% | | | | | |
| | | | |
| | 1 | | Based on average shares outstanding. |
| | 2 | | Distributions for annual periods determined in accordance with U.S. federal income tax regulations. |
| | 3 | | Where applicable, assumes the reinvestment of distributions. |
| | 4 | | Includes proceeds received from a settlement of litigation, which had no impact on the Fund’s total return. |
| | 5 | | Aggregate total return. |
| | 6 | | Includes the Fund’s share of the Master Portfolios’ allocated expenses and/or net investment income. |
| | 7 | | Excludes expenses incurred indirectly as a result of investments in underlying funds as follows: |
| | | | | | | | | | | | | | |
| | | |
| | | Six Months Ended March 31, 2017 (Unaudited) | | | Year Ended September 30, |
| | | | 2016 | | 2015 | | 2014 | | 2013 | | 2012 |
| | | |
Investments in underlying funds | | | 0.01 | % | | 0.01% | | — | | — | | — | | — |
| | 9 | | Excludes transactions in the Master Portfolios. |
| | 10 | | Includes mortgage dollar roll transactions. Additional information regarding portfolio turnover rate is as follows: |
| | | | | | | | | | | | | | |
| | | |
| | | Six Months Ended
March 31, 2017 (Unaudited) | | | Year Ended September 30, |
| | | | 2016 | | 2015 | | 2014 | | 2013 | | 2012 |
| | | |
Portfolio turnover rate (excluding mortgage dollar roll transactions) | | | 333 | % | | 598% | | 725% | | 529% | | 450% | | 752% |
See Notes to Financial Statements.
| | | | | | |
| 14 | | BLACKROCK BALANCED CAPITAL FUND, INC. | | MARCH 31, 2017 | | |
| | | | |
| Financial Highlights (continued) | | | BlackRock Balanced Capital Fund, Inc. | |
| | | | | | | | | | | | | | | | | | | | | | | | | | | | |
| | | Investor A | |
| | | Six Months Ended
March 31, 2017 (Unaudited) | | | Year Ended September 30, | |
| | | | 2016 | | | 2015 | | | 2014 | | | 2013 | | | 2012 | | | | |
| | | | | | | | | | | | | | | | | | | | | | | | | | | | |
Per Share Operating Performance | | | | | | | | | | | | | | | | | | | | | | | | | | | | |
Net asset value, beginning of period | | $ | 23.78 | | | $ | 23.03 | | | $ | 26.00 | | | $ | 25.11 | | | $ | 23.68 | | | $ | 20.10 | | | | | |
| | | | |
Net investment income1 | | | 0.17 | | | | 0.31 | | | | 0.30 | | | | 0.40 | | | | 0.38 | | | | 0.47 | | | | | |
Net realized and unrealized gain (loss) | | | 1.70 | | | | 1.62 | | | | (0.02 | ) | | | 3.03 | | | | 2.37 | | | | 3.55 | | | | | |
| | | | |
Net increase from investment operations | | | 1.87 | | | | 1.93 | | | | 0.28 | | | | 3.43 | | | | 2.75 | | | | 4.02 | | | | | |
| | | | |
Distributions:2 | | | | | | | | | | | | | | | | | | | | | | | | | | | | |
From net investment income | | | (0.19 | ) | | | (0.34 | ) | | | (0.36 | ) | | | (0.48 | ) | | | (0.42 | ) | | | (0.44) | | | | | |
From net realized gain | | | (0.79 | ) | | | (0.84 | ) | | | (2.89 | ) | | | (2.06 | ) | | | (0.90 | ) | | | — | | | | | |
| | | | |
Total distributions | | | (0.98 | ) | | | (1.18 | ) | | | (3.25 | ) | | | (2.54 | ) | | | (1.32 | ) | | | (0.44) | | | | | |
| | | | |
Net asset value, end of period | | $ | 24.67 | | | $ | 23.78 | | | $ | 23.03 | | | $ | 26.00 | | | $ | 25.11 | | | $ | 23.68 | | | | | |
| | | | |
| | | | |
Total Return3 | | | | | | | | | | | | | | | | | | | | | | | | | | | | |
Based on net asset value | | | 8.05 | %4,5 | | | 8.57 | %4 | | | 0.57 | % | | | 14.39 | % | | | 12.14 | % | | | 20.16% | | | | | |
| | | | |
| | | | | | | | | | | | | | | | | | | | | | | | | | | | |
Ratios to Average Net Assets6 | | | | | | | | | | | | | | | | | | | | | | | | | | | | |
Total expenses7 | | | 1.20 | %8 | | | 1.22 | % | | | 1.20 | % | | | 1.25 | % | | | 1.29 | % | | | 1.28% | | | | | |
| | | | |
Total expenses after fees waived and/or reimbursed7 | | | 0.88 | %8 | | | 0.91 | % | | | 0.88 | % | | | 0.92 | % | | | 0.97 | % | | | 0.97% | | | | | |
| | | | |
Net investment income7 | | | 1.43 | %8 | | | 1.35 | % | | | 1.23 | % | | | 1.58 | % | | | 1.51 | % | | | 2.12% | | | | | |
| | | | |
| | | | | | | | | | | | | | | | | | | | | | | | | | | | |
Supplemental Data | | | | | | | | | | | | | | | | | | | | | | | | | | | | |
Net assets, end of period (000) | | $ | 516,416 | | | $ | 491,889 | | | $ | 461,642 | | | $ | 476,919 | | | $ | 445,295 | | | $ | 447,620 | | | | | |
| | | | |
Portfolio turnover rate of the Fund9 | | | 45 | % | | | — | | | | — | | | | — | | | | — | | | | — | | | | | |
| | | | |
Portfolio turnover rate of the Master Total Return Portfolio10 | | | 487 | % | | | 841 | % | | | 1,015 | % | | | 750 | % | | | 777 | % | | | 1,346% | | | | | |
| | | | |
Portfolio turnover rate of the Master Large Cap Core Portfolio | | | 22 | % | | | 39 | % | | | 41 | % | | | 40 | % | | | 50 | % | | | 128% | | | | | |
| | | | |
| | 1 | | Based on average shares outstanding. |
| | 2 | | Distributions for annual periods determined in accordance with U.S. federal income tax regulations. |
| | 3 | | Where applicable, excludes the effects of any sales charges and assumes the reinvestment of distributions. |
| | 4 | | Includes proceeds received from a settlement of litigation, which had no impact on the Fund’s total return. |
| | 5 | | Aggregate total return. |
| | 6 | | Includes the Fund’s share of the Master Portfolios’ allocated expenses and/or net investment income. |
| | 7 | | Excludes expenses incurred indirectly as a result of investments in underlying funds as follows: |
| | | | | | | | | | | | | | |
| | | |
| | | Six Months Ended
March 31, 2017 (Unaudited) | | | Year Ended September 30, |
| | | | 2016 | | 2015 | | 2014 | | 2013 | | 2012 |
| | | |
Investments in underlying funds | | | 0.01 | % | | 0.01% | | — | | — | | — | | — |
| | 9 | | Excludes transactions in the Master Portfolios. |
| | 10 | | Includes mortgage dollar roll transactions. Additional information regarding portfolio turnover rate is as follows: |
| | | | | | | | | | | | | | |
| | | |
| | | Six Months Ended
March 31, 2017 (Unaudited) | | | Year Ended September 30, |
| | | | 2016 | | 2015 | | 2014 | | 2013 | | 2012 |
| | | |
Portfolio turnover rate (excluding mortgage dollar roll transactions) | | | 333 | % | | 598% | | 725% | | 529% | | 450% | | 752% |
See Notes to Financial Statements.
| | | | | | |
| | | BLACKROCK BALANCED CAPITAL FUND, INC. | | MARCH 31, 2017 | | 15 |
| | | | |
| Financial Highlights (continued) | | | BlackRock Balanced Capital Fund, Inc. | |
| | | | | | | | | | | | | | | | | | | | | | | | | | | | |
| | | Investor B | |
| | | Six Months Ended
March 31, 2017 (Unaudited) | | | Year Ended September 30, | |
| | | | 2016 | | | 2015 | | | 2014 | | | 2013 | | | 2012 | | | | |
| | | | | | | | | | | | | | | | | | | | | | | | | | | | |
Per Share Operating Performance | | | | | | | | | | | | | | | | | | | | | | | | | | | | |
Net asset value, beginning of period | | $ | 22.99 | | | $ | 22.31 | | | $ | 25.30 | | | $ | 24.47 | | | $ | 23.07 | | | $ | 19.55 | | | | | |
| | | | |
Net investment income (loss)1 | | | (0.07 | ) | | | 0.02 | | | | 0.03 | | | | 0.14 | | | | 0.13 | | | | 0.24 | | | | | |
Net realized and unrealized gain (loss) | | | 1.66 | | | | 1.56 | | | | (0.02 | ) | | | 2.96 | | | | 2.29 | | | | 3.46 | | | | | |
| | | | |
Net increase from investment operations | | | 1.59 | | | | 1.58 | | | | 0.01 | | | | 3.10 | | | | 2.42 | | | | 3.70 | | | | | |
| | | | |
Distributions:2 | | | | | | | | | | | | | | | | | | | | | | | | | | | | |
From net investment income | | | — | | | | (0.06 | ) | | | (0.11 | ) | | | (0.21 | ) | | | (0.12 | ) | | | (0.18) | | | | | |
From net realized gain | | | (0.76 | ) | | | (0.84 | ) | | | (2.89 | ) | | | (2.06 | ) | | | (0.90 | ) | | | — | | | | | |
| | | | |
Total distributions | | | (0.76 | ) | | | (0.90 | ) | | | (3.00 | ) | | | (2.27 | ) | | | (1.02 | ) | | | (0.18) | | | | | |
| | | | |
Net asset value, end of period | | $ | 23.82 | | | $ | 22.99 | | | $ | 22.31 | | | $ | 25.30 | | | $ | 24.47 | | | $ | 23.07 | | | | | |
| | | | |
| | | | | | | | | | | | | | | | | | | | | | | | | | | | |
Total Return3 | | | | | | | | | | | | | | | | | | | | | | | | | | | | |
Based on net asset value | | | 7.03 | %4,5 | | | 7.19 | %4 | | | (0.54 | )% | | | 13.27 | % | | | 10.94 | % | | | 19.01% | | | | | |
| | | | |
| | | | |
Ratios to Average Net Assets6 | | | | | | | | | | | | | | | | | | | | | | | | | | | | |
Total expenses7 | | | 3.19 | %8 | | | 2.49 | % | | | 2.28 | % | | | 2.26 | % | | | 2.33 | % | | | 2.29% | | | | | |
| | | | |
Total expenses after fees waived and/or reimbursed7 | | | 2.87 | %8 | | | 2.18 | % | | | 1.96 | % | | | 1.93 | % | | | 2.01 | % | | | 1.98% | | | | | |
| | | | |
Net investment income (loss)7 | | | (0.58 | )%8 | | | 0.09 | % | | | 0.14 | % | | | 0.56 | % | | | 0.51 | % | | | 1.13% | | | | | |
| | | | |
| | | | | | | | | | | | | | | | | | | | | | | | | | | | |
Supplemental Data | | | | | | | | | | | | | | | | | | | | | | | | | | | | |
Net assets, end of period (000) | | $ | 277 | | | $ | 756 | | | $ | 2,049 | | | $ | 3,633 | | | $ | 4,926 | | | $ | 7,128 | | | | | |
| | | | |
Portfolio turnover rate of the Fund9 | | | 45 | % | | | — | | | | — | | | | — | | | | — | | | | — | | | | | |
| | | | |
Portfolio turnover rate of the Master Total Return Portfolio10 | | | 487 | % | | | 841 | % | | | 1,015 | % | | | 750 | % | | | 777 | % | | | 1,346% | | | | | |
| | | | |
Portfolio turnover rate of the Master Large Cap Core Portfolio | | | 22 | % | | | 39 | % | | | 41 | % | | | 40 | % | | | 50 | % | | | 128% | | | | | |
| | | | |
| | 1 | | Based on average shares outstanding. |
| | 2 | | Distributions for annual periods determined in accordance with U.S. federal income tax regulations. |
| | 3 | | Where applicable, excludes the effects of any sales charges and assumes the reinvestment of distributions. |
| | 4 | | Includes proceeds received from a settlement of litigation, which had no impact on the Fund’s total return. |
| | 5 | | Aggregate total return. |
| | 6 | | Includes the Fund’s share of the Master Portfolios’ allocated expenses and/or net investment income. |
| | 7 | | Excludes expenses incurred indirectly as a result of investments in underlying funds as follows: |
| | | | | | | | | | | | | | |
| | | |
| | | Six Months Ended
March 31, 2017 (Unaudited) | | | Year Ended September 30, |
| | | | 2016 | | 2015 | | 2014 | | 2013 | | 2012 |
| | | |
Investments in underlying funds | | | 0.01 | % | | 0.01% | | — | | — | | — | | — |
| | 9 | | Excludes transactions in the Master Portfolios. |
| | 10 | | Includes mortgage dollar roll transactions. Additional information regarding portfolio turnover rate is as follows: |
| | | | | | | | | | | | | | |
| | | |
| | | Six Months Ended
March 31, 2017 (Unaudited) | | | Year Ended September 30, |
| | | | 2016 | | 2015 | | 2014 | | 2013 | | 2012 |
| | | |
Portfolio turnover rate (excluding mortgage dollar roll transactions) | | | 333 | % | | 598% | | 725% | | 529% | | 450% | | 752% |
See Notes to Financial Statements.
| | | | | | |
| 16 | | BLACKROCK BALANCED CAPITAL FUND, INC. | | MARCH 31, 2017 | | |
| | |
| Financial Highlights (continued) | | BlackRock Balanced Capital Fund, Inc. |
| | | | | | | | | | | | | | | | | | | | | | | | | | | | |
| | | Investor C | |
| | | Six Months Ended
March 31, 2017 (Unaudited) | | | Year Ended September 30, | |
| | | | 2016 | | | 2015 | | | 2014 | | | 2013 | | | 2012 | | | | |
| | | | | | | | | | | | | | | | | | | | | | | | | | | | |
Per Share Operating Performance | | | | | | | | | | | | | | | | | | | | | | | | | | | | |
Net asset value, beginning of period | | $ | 21.34 | | | $ | 20.80 | | | $ | 23.80 | | | $ | 23.20 | | | $ | 21.92 | | | $ | 18.64 | | | | | |
| | | | |
Net investment income1 | | | 0.07 | | | | 0.12 | | | | 0.10 | | | | 0.19 | | | | 0.18 | | | | 0.28 | | | | | |
Net realized and unrealized gain (loss) | | | 1.52 | | | | 1.47 | | | | (0.01 | ) | | | 2.79 | | | | 2.17 | | | | 3.28 | | | | | |
| | | | |
Net increase from investment operations | | | 1.59 | | | | 1.59 | | | | 0.09 | | | | 2.98 | | | | 2.35 | | | | 3.56 | | | | | |
| | | | |
Distributions:2 | | | | | | | | | | | | | | | | | | | | | | | | | | | | |
From net investment income | | | (0.11 | ) | | | (0.21 | ) | | | (0.20 | ) | | | (0.32 | ) | | | (0.17 | ) | | | (0.28 | ) | | | | |
From net realized gain | | | (0.79 | ) | | | (0.84 | ) | | | (2.89 | ) | | | (2.06 | ) | | | (0.90 | ) | | | — | | | | | |
| | | | |
Total distributions | | | (0.90 | ) | | | (1.05 | ) | | | (3.09 | ) | | | (2.38 | ) | | | (1.07 | ) | | | (0.28 | ) | | | | |
| | | | |
Net asset value, end of period | | $ | 22.03 | | | $ | 21.34 | | | $ | 20.80 | | | $ | 23.80 | | | $ | 23.20 | | | $ | 21.92 | | | | | |
| | | | |
| | | | | | | | | | | | | | | | | | | | | | | | | | | | |
Total Return3 | | | | | | | | | | | | | | | | | | | | | | | | | | | | |
Based on net asset value | | | 7.65 | %4,5 | | | 7.78 | %4 | | | (0.21 | )% | | | 13.51 | % | | | 11.22 | % | | | 19.22 | % | | | | |
| | | | |
| | | | | | | | | | | | | | | | | | | | | | | | | | | | |
Ratios to Average Net Assets6 | | | | | | | | | | | | | | | | | | | | | | | | | | | | |
Total expenses7 | | | 1.96 | %8 | | | 1.98 | % | | | 1.97 | % | | | 2.02 | % | | | 2.07 | % | | | 2.06 | % | | | | |
| | | | |
Total expenses after fees waived and/or reimbursed7 | | | 1.63 | %8 | | | 1.67 | % | | | 1.65 | % | | | 1.69 | % | | | 1.75 | % | | | 1.75 | % | | | | |
| | | | |
Net investment income7 | | | 0.68 | %8 | | | 0.60 | % | | | 0.47 | % | | | 0.81 | % | | | 0.72 | % | | | 1.33 | % | | | | |
| | | | |
| | | | | | | | | | | | | | | | | | | | | | | | | | | | |
Supplemental Data | | | | | | | | | | | | | | | | | | | | | | | | | | | | |
Net assets, end of period (000) | | $ | 126,069 | | | $ | 117,651 | | | $ | 86,397 | | | $ | 74,908 | | | $ | 63,952 | | | $ | 61,541 | | | | | |
| | | | |
Portfolio turnover rate of the Fund9 | | | 45 | % | | | — | | | | — | | | | — | | | | — | | | | — | | | | | |
| | | | |
Portfolio turnover rate of the Master Total Return Portfolio10 | | | 487 | % | | | 841 | % | | | 1,015 | % | | | 750 | % | | | 777 | % | | | 1,346 | % | | | | |
| | | | |
Portfolio turnover rate of the Master Large Cap Core Portfolio | | | 22 | % | | | 39 | % | | | 41 | % | | | 40 | % | | | 50 | % | | | 128 | % | | | | |
| | | | |
| | 1 | | Based on average shares outstanding. |
| | 2 | | Distributions for annual periods determined in accordance with U.S. federal income tax regulations. |
| | 3 | | Where applicable, excludes the effects of any sales charges and assumes the reinvestment of distributions. |
| | 4 | | Includes proceeds received from a settlement of litigation, which had no impact on the Fund’s total return. |
| | 5 | | Aggregate total return. |
| | 6 | | Includes the Fund’s share of the Master Portfolios’ allocated expenses and/or net investment income. |
| | 7 | | Excludes expenses incurred indirectly as a result of investments in underlying funds as follows: |
| | | | | | | | | | | | |
| | | Six Months Ended
March 31, 2017 (Unaudited) | | Year Ended September 30, |
| | | | 2016 | | 2015 | | 2014 | | 2013 | | 2012 |
Investments in underlying funds | | 0.01% | | 0.01% | | — | | — | | — | | — |
| | 9 | | Excludes transactions in the Master Portfolios. |
| | 10 | | Includes mortgage dollar roll transactions. Additional information regarding portfolio turnover rate is as follows: |
| | | | | | | | | | | | |
| | | Six Months Ended
March 31, 2017 (Unaudited) | | Year Ended September 30, |
| | | | 2016 | | 2015 | | 2014 | | 2013 | | 2012 |
| | |
Portfolio turnover rate (excluding mortgage dollar roll transactions) | | 333% | | 598% | | 725% | | 529% | | 450% | | 752% |
See Notes to Financial Statements.
| | | | | | |
| | | BLACKROCK BALANCED CAPITAL FUND, INC. | | MARCH 31, 2017 | | 17 |
| | | | |
| Financial Highlights (concluded) | | | BlackRock Balanced Capital Fund, Inc. | |
| | | | | | | | | | | | | | | | | | | | | | | | | | | | |
| | | Class R | |
| | | Six Months Ended
March 31, 2017 (Unaudited) | | | Year Ended September 30, | |
| | | | 2016 | | | 2015 | | | 2014 | | | 2013 | | | 2012 | | | | |
| | | | | | | | | | | | | | | | | | | | | | | | | | | | |
Per Share Operating Performance | | | | | | | | | | | | | | | | | | | | | | | | | | | | |
Net asset value, beginning of period | | $ | 22.31 | | | $ | 21.70 | | | $ | 24.68 | | | $ | 23.96 | | | $ | 22.63 | | | $ | 19.22 | | | | | |
| | | | |
Net investment income1 | | | 0.12 | | | | 0.22 | | | | 0.21 | | | | 0.30 | | | | 0.28 | | | | 0.37 | | | | | |
Net realized and unrealized gain (loss) | | | 1.60 | | | | 1.52 | | | | (0.02 | ) | | | 2.89 | | | | 2.24 | | | | 3.39 | | | | | |
| | | | |
Net increase from investment operations | | | 1.72 | | | | 1.74 | | | | 0.19 | | | | 3.19 | | | | 2.52 | | | | 3.76 | | | | | |
| | | | |
Distributions:2 | | | | | | | | | | | | | | | | | | | | | | | | | | | | |
From net investment income | | | (0.16 | ) | | | (0.29 | ) | | | (0.28 | ) | | | (0.41 | ) | | | (0.29 | ) | | | (0.35) | | | | | |
From net realized gain | | | (0.79 | ) | | | (0.84 | ) | | | (2.89 | ) | | | (2.06 | ) | | | (0.90 | ) | | | — | | | | | |
| | | | |
Total distributions | | | (0.95 | ) | | | (1.13 | ) | | | (3.17 | ) | | | (2.47 | ) | | | (1.19 | ) | | | (0.35) | | | | | |
| | | | |
Net asset value, end of period | | $ | 23.08 | | | $ | 22.31 | | | $ | 21.70 | | | $ | 24.68 | | | $ | 23.96 | | | $ | 22.63 | | | | | |
| | | | |
| | | | | | | | | | | | | | | | | | | | | | | | | | | | |
Total Return3 | | | | | | | | | | | | | | | | | | | | | | | | | | | | |
Based on net asset value | | | 7.89 | %4,5 | | | 8.15 | %4 | | | 0.23 | % | | | 14.03 | % | | | 11.66 | % | | | 19.73% | | | | | |
| | | | |
| | | | | | | | | | | | | | | | | | | | | | | | | | | | |
Ratios to Average Net Assets6 | | | | | | | | | | | | | | | | | | | | | | | | | | | | |
Total expenses7 | | | 1.54 | %8 | | | 1.58 | % | | | 1.53 | % | | | 1.59 | % | | | 1.66 | % | | | 1.67% | | | | | |
| | | | |
Total expenses after fees waived and/or reimbursed7 | | | 1.22 | %8 | | | 1.27 | % | | | 1.21 | % | | | 1.27 | % | | | 1.33 | % | | | 1.36% | | | | | |
| | | | |
Net investment income7 | | | 1.09 | %8 | | | 0.99 | % | | | 0.91 | % | | | 1.23 | % | | | 1.16 | % | | | 1.73% | | | | | |
| | | | |
| | | | | | | | | | | | | | | | | | | | | | | | | | | | |
Supplemental Data | | | | | | | | | | | | | | | | | | | | | | | | | | | | |
Net assets, end of period (000) | | $ | 14,618 | | | $ | 12,731 | | | $ | 10,448 | | | $ | 9,322 | | | $ | 8,542 | | | $ | 8,963 | | | | | |
| | | | |
Portfolio turnover rate of the Fund9 | | | 45 | % | | | — | | | | — | | | | — | | | | — | | | | — | | | | | |
| | | | |
Portfolio turnover rate of the Master Total Return Portfolio10 | | | 487 | % | | | 841 | % | | | 1,015 | % | | | 750 | % | | | 777 | % | | | 1,346% | | | | | |
| | | | |
Portfolio turnover rate of the Master Large Cap Core Portfolio | | | 22 | % | | | 39 | % | | | 41 | % | | | 40 | % | | | 50 | % | | | 128% | | | | | |
| | | | |
| | 1 | | Based on average shares outstanding. |
| | 2 | | Distributions for annual periods determined in accordance with U.S. federal income tax regulations. |
| | 3 | | Where applicable, assumes the reinvestment of distributions. |
| | 4 | | Includes proceeds received from a settlement of litigation, which had no impact on the Fund’s total return. |
| | 5 | | Aggregate total return. |
| | 6 | | Includes the Fund’s share of the Master Portfolios’ allocated expenses and/or net investment income. |
| | 7 | | Excludes expenses incurred indirectly as a result of investments in underlying funds as follows: |
| | | | | | | | | | | | | | |
| | | |
| | | Six Months Ended
March 31, 2017 (Unaudited) | | | Year Ended September 30, |
| | | | 2016 | | 2015 | | 2014 | | 2013 | | 2012 |
| | | |
Investments in underlying funds | | | 0.01 | % | | 0.01% | | — | | — | | — | | — |
| | 9 | | Excludes transactions in the Master Portfolios. |
| | 10 | | Includes mortgage dollar roll transactions. Additional information regarding portfolio turnover rate is as follows: |
| | | | | | | | | | | | | | |
| | | |
| | | Six Months Ended
March 31, 2017 (Unaudited) | | | Year Ended September 30, |
| | | | 2016 | | 2015 | | 2014 | | 2013 | | 2012 |
| | | |
Portfolio turnover rate (excluding mortgage dollar roll transactions) | | | 333 | % | | 598% | | 725% | | 529% | | 450% | | 752% |
See Notes to Financial Statements.
| | | | | | |
| 18 | | BLACKROCK BALANCED CAPITAL FUND, INC. | | MARCH 31, 2017 | | |
| | |
| Notes to Financial Statements (Unaudited) | | BlackRock Balanced Capital Fund, Inc. |
1. Organization:
BlackRock Balanced Capital Fund, Inc. (the “Fund”) is registered under the Investment Company Act of 1940, as amended (the “1940 Act”), as an open-end management investment company. The Fund is classified as diversified. The Fund is organized as a Maryland corporation. The Fund seeks to achieve its investment objective by investing directly in equity and fixed-income securities, indirectly through one or more funds that invest in such securities, or in a combination of securities and funds. The Fund intends to invest a significant portion of its fixed-income assets in Master Total Return Portfolio (the “Master Total Return Portfolio”) of Master Bond LLC, a mutual fund that has an investment objective and strategy consistent with that of the fixed-income portion of the Fund. The Fund intends to invest a significant portion of its equity assets in Master Large Cap Core Portfolio (the “Master Large Cap Core Portfolio”) of Master Large Cap Series LLC, a mutual fund that has an investment objective and strategy consistent with that of the equity portion of the Fund. Master Total Return Portfolio and Master Large Cap Core Portfolio, both affiliates of the Fund, are collectively referred to as the “Master Portfolios.” The value of the Fund’s investment in the Master Portfolios reflects the Fund’s proportionate interest in the net assets of the Master Portfolios. The performance of the Fund is directly affected by the performance of the Master Portfolios as well as the Fund’s direct investments. At March 31, 2017, the percentages of the Master Large Cap Core Portfolio and Master Total Return Portfolio owned by the Fund were 26.6% and 3.3%, respectively. The financial statements of the Master Portfolios, including the Schedules of Investments, are included elsewhere in this report and should be read in conjunction with the Fund’s financial statements. The Fund offers multiple classes of shares. All classes of shares have identical voting, dividend, liquidation and other rights and are subject to the same terms and conditions, except that certain classes bear expenses related to the shareholder servicing and distribution of such shares. Institutional Shares are sold only to certain eligible investors. Class R shares are available only to certain employer-sponsored retirement plans. Investor A and Investor C Shares are generally available through financial intermediaries. Investor B Shares are only available through exchanges and dividend and capital gain reinvestments by existing shareholders, and for purchase by certain employer-sponsored retirement plans. Each class has exclusive voting rights with respect to matters relating to its shareholder servicing and distribution expenditures (except that Investor B shareholders may vote on material changes to the Investor A distribution and service plan). The Board of Trustees of the Fund and Boards of Directors of the Master Portfolios are referred to throughout this report as the “Board of Directors” or the “Board” and the members are referred to as “Directors.”
| | | | | | |
| Share Class | | Initial Sales Charge | | CDSC | | Conversion Privilege |
Institutional and Class R Shares | | No | | No | | None |
Investor A Shares | | Yes | | No1 | | None |
Investor B Shares | | No | | Yes | | To Investor A Shares after approximately 8 years |
Investor C Shares | | No | | Yes | | None |
| | 1 | | Investor A Shares may be subject to a contingent deferred sales charge (“CDSC”) for certain redemptions where no initial sales charge was paid at the time of purchase. |
The Fund, together with certain other registered investment companies advised by BlackRock Advisors, LLC (the “Manager”) or its affiliates, is included in a complex of open-end funds referred to as the Equity-Bond Complex.
2. Significant Accounting Policies:
The financial statements are prepared in conformity with accounting principles generally accepted in the United States of America (“U.S. GAAP”), which may require management to make estimates and assumptions that affect the reported amounts of assets and liabilities in the financial statements, disclosure of contingent assets and liabilities at the date of the financial statements and the reported amounts of increases and decreases in net assets from operations during the reporting period. Actual results could differ from those estimates. The Fund is considered an investment company under U.S. GAAP and follows the accounting and reporting guidance applicable to investment companies. Below is a summary of significant accounting policies:
Foreign Currency: The Fund’s books and records are maintained in U.S. dollars. Purchases and sales of investments are recorded at the rates of exchange prevailing on the respective dates of such transactions. Generally, when the U.S. dollar rises in value against a foreign currency, the investments denominated in that currency will lose value; the opposite effect occurs if the U.S. dollar falls in relative value.
The Fund does not isolate the portion of the results of operations arising as a result of changes in the exchange rates from the changes in the market prices of investments held or sold for financial reporting purposes. Accordingly, the effects of changes in exchange rates on investments are not segregated in the Statement of Operations from the effects of changes in market prices of those investments, but are included as a component of net realized and unrealized gain (loss) from investments. The Fund reports realized currency gains (losses) on foreign currency related transactions as components of net realized gain (loss) for financial reporting purposes, whereas such components are generally treated as ordinary income for federal income tax purposes.
Segregation and Collateralization: In cases where the Fund enters into certain investments (e.g., futures contracts) that would be treated as “senior securities” for 1940 Act purposes, the Fund may segregate or designate on its books and records cash or liquid assets having a market value at least
| | | | | | |
| | | BLACKROCK BALANCED CAPITAL FUND, INC. | | MARCH 31, 2017 | | 19 |
| | |
| Notes to Financial Statements (continued) | | BlackRock Balanced Capital Fund, Inc. |
equal to the amount of its future obligations under such investments. Doing so allows the investment to be excluded from treatment as a “senior security.” Furthermore, if required by an exchange or counterparty agreement, the Fund may be required to deliver/deposit cash and/or securities to/with an exchange, or broker-dealer or custodian as collateral for certain investments or obligations.
Investment Transactions and Investment Income: For financial reporting purposes, investment transactions are recorded on the dates the transactions are entered into (the trade dates). Realized gains and losses on investment transactions are determined on the identified cost basis. Dividend income is recorded on the ex-dividend date. Interest income, including amortization and accretion of premiums and discounts on debt securities, is recognized on the accrual basis. Income, expenses and realized and unrealized gains and losses are allocated daily to each class based on its relative net assets.
Distributions: Distributions paid by the Fund are recorded on the ex-dividend date. The character and timing of distributions are determined in accordance with federal income tax regulations, which may differ from U.S. GAAP.
Net income and realized gains from investments held by the Master Total Return Portfolio’s investment in BlackRock Cayman Master Total Return Portfolio I, Ltd. (the “Subsidiary”) are treated as ordinary income for tax purposes. If a net loss is realized by the Subsidiary in any taxable year, the loss will generally not be available to offset the Fund’s ordinary income and/or capital gains for that year.
Recent Accounting Standards: In April 2015, the Financial Accounting Standards Board issued “Disclosures for Investments in Certain Entities that Calculate Net Asset Value (“NAV”) per Share” which eliminates the requirement to categorize investments within the fair value hierarchy when fair value is based on the NAV per share and no quoted market value is available. As of March 31, 2017, certain investments of the Fund were valued using NAV per share or its equivalent as no quoted market value is available and therefore have been excluded from the fair value hierarchy.
In March 2017, the Financial Accounting Standards Board issued Premium Amortization of Purchased Callable Debt Securities, which amends the amortization period for certain purchased callable debt securities. Under the new guidance, premium amortization of purchased callable debt securities that have explicit, non-contingent call features and are callable at fixed prices will be amortized to the earliest call date. The guidance will be on a modified applied retrospective basis and is effective for fiscal years, and their interim periods, beginning after December 15, 2018. Management is currently evaluating the impact of this guidance to the Fund.
Indemnifications: In the normal course of business, the Fund enters into contracts that contain a variety of representations that provide general indemnification. The Fund’s maximum exposure under these arrangements is unknown because it involves future potential claims against the Fund, which cannot be predicted with any certainty.
Other: Expenses directly related to the Fund or its classes are charged to the Fund or the applicable class. Other operating expenses shared by several funds, including other funds managed by the Manager, are prorated among those funds on the basis of relative net assets or other appropriate methods. Expenses directly related to the Fund and other shared expenses prorated to the Fund are allocated daily to each class based on its relative net assets or other appropriate methods.
The Fund has an arrangement with its custodian whereby credits are earned on uninvested cash balances, which could be used to reduce custody fees and/or overdraft charges. The Fund may incur charges on certain uninvested cash balances and overdrafts, subject to certain conditions.
3. Investment Valuation and Fair Value Measurements:
Investment Valuation Policies: The Fund’s investments are valued at fair value (also referred to as “market value” within the financial statements) as of the close of trading on the New York Stock Exchange (“NYSE”) (generally 4:00 p.m., Eastern time). U.S. GAAP defines fair value as the price the Fund would receive to sell an asset or pay to transfer a liability in an orderly transaction between market participants at the measurement date. The Fund determines the fair values of its financial instruments using various independent dealers or pricing services under policies approved by the Board. The BlackRock Global Valuation Methodologies Committee (the “Global Valuation Committee”) is the committee formed by management to develop global pricing policies and procedures and to oversee the pricing function for all financial instruments.
Fair Value Inputs and Methodologies: The following methods and inputs are used to establish the fair value of the Fund’s assets and liabilities:
| | • | | Equity investments traded on a recognized securities exchange are valued at the official closing price each day, if available. For equity investments traded on more than one exchange, the official closing price on the exchange where the stock is primarily traded is used. Equity investments traded on a recognized exchange for which there were no sales on that day may be valued at the last available bid (long positions) or ask (short positions) price. |
| | • | | Investments in open-end U.S. mutual funds are valued at NAV each business day. |
| | | | | | |
| 20 | | BLACKROCK BALANCED CAPITAL FUND, INC. | | MARCH 31, 2017 | | |
| | |
| Notes to Financial Statements (continued) | | BlackRock Balanced Capital Fund, Inc. |
| | • | | Futures contracts traded on exchanges are valued at their last sale price. |
| | • | | Securities and other assets and liabilities denominated in foreign currencies are translated into U.S. dollars using exchange rates determined as of the close of trading on the NYSE. Forward foreign currency exchange contracts are valued at the mean between the bid and ask prices and are determined as of the close of trading on the NYSE. Interpolated values are derived when the settlement date of the contract is an interim date for which quotations are not available. |
If events (e.g., a company announcement, market volatility or a natural disaster) occur that are expected to materially affect the value of such investments, or in the event that the application of these methods of valuation results in a price for an investment that is deemed not to be representative of the market value of such investment, or if a price is not available, the investment will be valued by the Global Valuation Committee, or its delegate, in accordance with a policy approved by the Board as reflecting fair value (“Fair Valued Investments”). The fair valuation approaches that may be used by the Global Valuation Committee will include Market approach, Income approach and Cost approach. Valuation techniques such as discounted cash flow, use of market comparables and matrix pricing are types of valuation approaches and typically used in determining fair value. When determining the price for Fair Valued Investments, the Global Valuation Committee, or its delegate, seeks to determine the price that the Fund might reasonably expect to receive or pay from the current sale or purchase of that asset or liability in an arm’s-length transaction. Fair value determinations shall be based upon all available factors that the Global Valuation Committee, or its delegate, deems relevant and consistent with the principles of fair value measurement. The pricing of all Fair Valued Investments is subsequently reported to the Board or a committee thereof on a quarterly basis..
Fair Value Hierarchy: Various inputs are used in determining the fair value of investments and derivative financial instruments. These inputs to valuation techniques are categorized into a fair value hierarchy consisting of three broad levels for financial statement purposes as follows:
| | • | | Level 1 – unadjusted price quotations in active markets/exchanges for identical assets or liabilities that the Fund has the ability to access |
| | • | | Level 2 – other observable inputs (including, but not limited to, quoted prices for similar assets or liabilities in markets that are active, quoted prices for identical or similar assets or liabilities in markets that are not active, inputs other than quoted prices that are observable for the assets or liabilities (such as interest rates, yield curves, volatilities, prepayment speeds, loss severities, credit risks and default rates) or other market–corroborated inputs) |
| | • | | Level 3 – unobservable inputs based on the best information available in the circumstances, to the extent observable inputs are not available (including the Fund’s own assumptions used in determining the fair value of investments and derivative financial instruments) |
The hierarchy gives the highest priority to unadjusted quoted prices in active markets for identical assets or liabilities (Level 1 measurements) and the lowest priority to unobservable inputs (Level 3 measurements). Accordingly, the degree of judgment exercised in determining fair value is greatest for instruments categorized in Level 3. The inputs used to measure fair value may fall into different levels of the fair value hierarchy. In such cases, for disclosure purposes, the fair value hierarchy classification is determined based on the lowest level input that is significant to the fair value measurement in its entirety. Investments classified within Level 3 have significant unobservable inputs used by the Global Valuation Committee in determining the price for Fair Valued Investments. Level 3 investments include equity or debt issued by privately held companies or funds. There may not be a secondary market, and/or there are a limited number of investors. Level 3 investments may also be adjusted to reflect illiquidity and/or non-transferability, with the amount of such discount estimated by the Global Valuation Committee in the absence of market information.
Changes in valuation techniques may result in transfers into or out of an assigned level within the hierarchy. In accordance with the Fund’s policy, transfers between different levels of the fair value hierarchy are deemed to have occurred as of the beginning of the reporting period. The categorization of a value determined for investments and derivative financial instruments is based on the pricing transparency of the investments and derivative financial instruments and is not necessarily an indication of the risks associated with investing in those securities.
4. Derivative Financial Instruments:
The Fund engages in various portfolio investment strategies using derivative contracts both to increase the returns of the Fund and/or to manage its exposure to certain risks such as credit risk, equity risk, interest rate risk, foreign currency exchange rate risk, commodity price risk or other risks (e.g., inflation risk). Derivative financial instruments categorized by risk exposure are included in the Schedule of Investments. These contracts may be transacted on an exchange or over-the-counter (“OTC”).
Futures Contracts: The Fund invests in long and/or short positions in futures and options on futures contracts to gain exposure to, or manage exposure to, changes in interest rates (interest rate risk), changes in the value of equity securities (equity risk) or foreign currencies (foreign currency exchange rate risk).
| | | | | | |
| | | BLACKROCK BALANCED CAPITAL FUND, INC. | | MARCH 31, 2017 | | 21 |
| | |
| Notes to Financial Statements (continued) | | BlackRock Balanced Capital Fund, Inc. |
Futures contracts are agreements between the Fund and a counterparty to buy or sell a specific quantity of an underlying instrument at a specified price and on a specified date. Depending on the terms of a contract, it is settled either through physical delivery of the underlying instrument on the settlement date or by payment of a cash amount on the settlement date. Upon entering into a futures contract, the Fund is required to deposit initial margin with the broker in the form of cash or securities in an amount that varies depending on a contract’s size and risk profile. The initial margin deposit must then be maintained at an established level over the life of the contract.
Securities deposited as initial margin are designated in the Schedule of Investments and cash deposited, if any, is shown as cash pledged for futures contracts in the Statement of Assets and Liabilities. Pursuant to the contract, the Fund agrees to receive from or pay to the broker an amount of cash equal to the daily fluctuation in market value of the contract (“variation margin”). Variation margin is recorded as unrealized appreciation (depreciation) and, if any, shown as variation margin receivable (or payable) on futures contracts in the Statement of Assets and Liabilities. When the contract is closed, a realized gain or loss is recorded in the Statement of Operations equal to the difference between the value of the contract at the time it was opened and the value at the time it was closed. The use of futures contracts involves the risk of an imperfect correlation in the movements in the price of futures contracts and interest, foreign currency exchange rates or underlying assets.
Collateral Requirements: For derivatives traded under an ISDA Master Agreement, the collateral requirements are typically calculated by netting the mark-to-market amount for each transaction under such agreement and comparing that amount to the value of any collateral currently pledged by the Fund and the counterparty.
Cash collateral that has been pledged to cover obligations of the Fund and cash collateral received from the counterparty, if any, is reported separately on the Statement of Assets and Liabilities as cash pledged as collateral and cash received as collateral, respectively. Non-cash collateral pledged by the Fund, if any, is noted in the Schedule of Investments. Generally, the amount of collateral due from or to a counterparty is subject to a certain minimum transfer amount threshold before a transfer is required, which is determined at the close of business of the Fund. Any additional required collateral is delivered to/pledged by the Fund on the next business day. Typically, the counterparty is not permitted to sell, re-pledge or use cash and non-cash collateral it receives. The Fund generally agrees not to use non-cash collateral that it receives but may, absent default or certain other circumstances defined in the underlying ISDA Master Agreement, be permitted to use cash collateral received. In such cases, interest may be paid pursuant to the collateral arrangement with the counterparty. To the extent amounts due to the Fund from its counterparties are not fully collateralized, it bears the risk of loss from counterparty non-performance. Likewise, to the extent the Fund has delivered collateral to a counterparty and stands ready to perform under the terms of its agreement with such counterparty, it bears the risk of loss from a counterparty in the amount of the value of the collateral in the event the counterparty fails to return such collateral. Based on the terms of agreements, collateral may not be required for all derivative contracts.
For financial reporting purposes, the Fund does not offset derivative assets and derivative liabilities that are subject to netting arrangements, if any, in the Statement of Assets and Liabilities.
5. Investment Advisory Agreement and Other Transactions with Affiliates:
The PNC Financial Services Group, Inc. is the largest stockholder and an affiliate of BlackRock, Inc. (“BlackRock”) for 1940 Act purposes.
Investment Advisory: The Fund entered into an Investment Advisory Agreement with the Manager, the Fund’s investment adviser, an indirect, wholly-owned subsidiary of BlackRock, to provide investment advisory and administration services. The Manager is responsible for the management of the Fund’s portfolio and provides the personnel, facilities, equipment and certain other services necessary to the operations of the Fund.
For such services, the Fund pays the Manager a monthly fee at an annual rate equal to the following percentages of the average daily value of the Fund’s net assets:
| | | | |
| Average Daily Net Assets | | Investment
Advisory Fee | |
First $250 million | | | 0.500% | |
$250 million — $300 million | | | 0.450% | |
$300 million — $400 million | | | 0.425% | |
Greater than $400 million | | | 0.400% | |
The Fund also pays an investment advisory fee to the Manager, which is the investment adviser of Master Total Return Portfolio and Master Large Cap Core Portfolio, to the extent it invests in the Master Total Return Portfolio and Master Large Cap Core Portfolio.
Service and Distribution Fees: The Fund entered into a Distribution Agreement and a Distribution and Service Plan with BlackRock Investments, LLC (“BRIL”), an affiliate of the Manager. Pursuant to the Distribution and Service Plan and in accordance with Rule 12b-1 under the 1940 Act, the Fund
| | | | | | |
| 22 | | BLACKROCK BALANCED CAPITAL FUND, INC. | | MARCH 31, 2017 | | |
| | |
| Notes to Financial Statements (continued) | | BlackRock Balanced Capital Fund, Inc. |
pays BRIL ongoing service and distribution fees. The fees are accrued daily and paid monthly at annual rates based upon the average daily net assets of the relevant share class of the Fund as follows:
| | | | | | | | |
| | | Service
Fee | | | Distribution
Fee | |
Investor A | | | 0.25% | | | | — | |
Investor B | | | 0.25% | | | | 0.75% | |
Investor C | | | 0.25% | | | | 0.75% | |
Class R | | | 0.25% | | | | 0.25% | |
BRIL and broker-dealers, pursuant to sub-agreements with BRIL, provide shareholder servicing and distribution services to the Fund. The ongoing service and/or distribution fee compensates BRIL and each broker-dealer for providing shareholder servicing and/or distribution related services to the shareholders.
For the six months ended March 31, 2017, the following table shows the class specific service and distribution fees borne directly by each share class of the Fund:
| | | | |
Investor A | | | $ 630,738 | |
Investor B | | | 2,251 | |
Investor C | | | 610,523 | |
Class R | | | 33,765 | |
| | | | |
Total | | | $1,277,277 | |
| | | | |
Transfer Agent: Pursuant to written agreements, certain financial intermediaries, some of which may be affiliates, provide the Fund with sub-accounting, recordkeeping, sub-transfer agency and other administrative services with respect to sub-accounts they service. For these services, these entities receive an asset-based fee or an annual fee per shareholder account, which will vary depending on share class and/or net assets. For the six months ended March 31, 2017, the Fund paid the following amounts to affiliates of BlackRock in return for these services, which are included in transfer agent — class specific in the Statement of Operations:
The Manager maintains a call center that is responsible for providing certain shareholder services to the Fund. Shareholder services include responding to inquiries and processing subscriptions and redemptions based upon instructions from shareholders. For the six months ended March 31, 2017, the Fund reimbursed the Manager the following amounts for costs incurred in running the call center, which are included in transfer agent — class specific in the Statement of Operations:
| | | | |
Institutional | | $ | 8,995 | |
Investor A | | $ | 12,778 | |
Investor B | | $ | 241 | |
Investor C | | $ | 3,444 | |
Class R | | $ | 50 | |
For the six months ended March 31, 2017, the following table shows the class specific transfer agent fees borne directly by each class of the Fund:
| | | | |
Institutional | | | $144,616 | |
Investor A | | | 296,739 | |
Investor B | | | 3,033 | |
Investor C | | | 72,674 | |
Class R | | | 13,890 | |
| | | | |
Total | | | $530,952 | |
| | | | |
Other Fees: For the six months ended March 31, 2017, affiliates earned underwriting discounts, direct commissions and dealer concessions on sales of the Fund’s Investor A Shares, which totaled $18,137.
For the six months ended March 31, 2017, affiliates received CDSCs as follows:
| | | | |
Investor A | | $ | 9,572 | |
Investor C | | $ | 10,747 | |
Expense Limitations, Waivers and Reimbursements: The Manager contractually agreed to waive its investment advisory fee by the amount of any management fees the Fund pays indirectly through its investments in the Master Portfolios. For the six months ended March 31, 2017, the Manager waived $1,495,774, which is included in fees waived by the Manager in the Statement of Operations.
| | | | | | |
| | | BLACKROCK BALANCED CAPITAL FUND, INC. | | MARCH 31, 2017 | | 23 |
| | |
| Notes to Financial Statements (continued) | | BlackRock Balanced Capital Fund, Inc. |
With respect to the Fund, the Manager voluntarily agreed to waive its investment advisory fees by the amount of investment advisory fees the Fund pays to the Manager indirectly through its investment in affiliated money market funds (the “affiliated money market waiver”). This amount is included in fees waived by the Manager in the Statement of Operations. For the six months ended March 31, 2017, the amount waived was $6,843.
The Manager voluntarily agreed to waive its investment advisory fee with respect to any portion of the Fund’s assets invested in affiliated equity and fixed-income mutual funds and affiliated exchange-traded funds that have a contractual management fee. Effective January 27, 2017, the waiver became contractual through January 31, 2018. The contractual agreement may be terminated upon 90 days’ notice by a majority of the non-interested directors of the Fund or by a vote of a majority of the outstanding voting securities of the Fund. This amount is included in fees waived by the Manager in the Statement of Operations. For the six months ended March 31, 2017, the Fund waived $107,329 in investment advisory fees pursuant to these arrangements.
Interfund Lending: In accordance with an exemptive order (the “Order”) from the U.S. Securities and Exchange Commission, the Fund may participate in a joint lending and borrowing facility for temporary purposes (the “Interfund Lending Program”), subject to compliance with the terms and conditions of the Order, and to the extent permitted by the Fund’s investment policies and restrictions. The Fund is currently permitted to borrow and lend under the Interfund Lending Program.
A lending BlackRock fund may lend in aggregate up to 15% of its net assets, but may not lend more than 5% of its net assets, to any one borrowing fund through the Interfund Lending Program. A borrowing BlackRock fund may not borrow through the Interfund Lending Program or from any other source more than 33 1/3% of its total assets (or any lower threshold provided for by the fund’s investment restrictions). If a borrowing BlackRock fund’s total outstanding borrowings exceed 10% of its total assets, each of its outstanding interfund loans will be subject to collateralization of at least 102% of the outstanding principal value of the loan. All interfund loans are for temporary or emergency purposes and the interest rate to be charged will be the average of the highest current overnight repurchase agreement rate available to a lending fund and the bank loan rate, as calculated according to a formula established by the Board.
During the period ended March 31, 2017, the Fund did not participate in the Interfund Lending Program.
Officers and Directors: Certain officers and/or directors of the Fund are officers and/or directors of BlackRock or its affiliates. The Fund reimburses the Manager for a portion of the compensation paid to the Fund’s Chief Compliance Officer, which is included in Officer in the Statement of Operations.
6. Purchases and Sales:
For the six months ended March 31, 2017, purchases and sales of investments, excluding short-term securities, were $71,313,345 and $31,203,999, respectively.
The Fund received proceeds from settlement of litigation where it was able to recover a portion of investment losses previously realized by the Fund through its investment in the Master Portfolios. This amount is shown as Litigation proceeds in the Statement of Operations.
7. Income Tax Information:
It is the Fund’s policy to comply with the requirements of the Internal Revenue Code of 1986, as amended, applicable to regulated investment companies, and to distribute substantially all of its taxable income to its shareholders. Therefore, no U.S. federal income tax provision is required.
The Fund files U.S. federal and various state and local tax returns. No income tax returns are currently under examination. The statute of limitations on the Fund’s U.S. federal tax returns generally remains open for each of the four years ended September 30, 2016. The statutes of limitations on the Fund’s state and local tax returns may remain open for an additional year depending upon the jurisdiction.
Management has analyzed tax laws and regulations and their application to the Fund as of March 31, 2017, inclusive of the open tax return years, and does not believe that there are any uncertain tax positions that require recognition of a tax liability in the Fund’s financial statements.
As of March 31, 2017, gross unrealized appreciation and depreciation based on cost for U.S. federal income tax purposes were as follows:
| | | | |
Tax cost | | | $879,140,484 | |
| | | | |
Gross unrealized appreciation | | | $161,314,784 | |
Gross unrealized depreciation | | | (2,557,530 | ) |
| | | | |
Net unrealized appreciation | | | $158,757,254 | |
| | | | |
8. Bank Borrowings:
The Fund, along with certain other funds managed by the Manager and its affiliates (“Participating Funds”), is a party to a 364-day, $2.1 billion credit agreement with a group of lenders. Under this agreement, the Fund may borrow to fund shareholder redemptions. Excluding commitments designated
| | | | | | |
| 24 | | BLACKROCK BALANCED CAPITAL FUND, INC. | | MARCH 31, 2017 | | |
| | |
| Notes to Financial Statements (continued) | | BlackRock Balanced Capital Fund, Inc. |
for certain individual funds, the Participating Funds, including the Fund, can borrow up to an aggregate commitment amount of $1.6 billion at any time outstanding, subject to asset coverage and other limitations as specified in the agreement. The credit agreement has the following terms: a fee of 0.12% per annum on unused commitment amounts and interest at a rate equal to the higher of (a) one-month LIBOR (but, in any event, not less than 0.00%) on the date the loan is made plus 0.80% per annum or (b) the Fed Funds rate (but, in any event, not less than 0.00%) in effect from time to time plus 0.80% per annum on amounts borrowed. The agreement expires in April 2017 unless extended or renewed. Participating Funds paid administration, legal and arrangement fees, which, if applicable, are included in miscellaneous expenses in the Statement of Operations. These fees were allocated among such funds based upon portions of the aggregate commitment available to them and relative net assets of Participating Funds. During the six months ended March 31, 2017, the Fund did not borrow under the credit agreement.
9. Principal Risks:
In the normal course of business, the Fund invests in securities and enters into transactions where risks exist due to fluctuations in the market (market risk) or failure of the issuer to meet all its obligations, including the ability to pay principal and interest when due (issuer credit risk). The value of securities held by the Fund may decline in response to certain events, including those directly involving the issuers of securities owned by the Fund. Changes arising from the general economy, the overall market and local, regional or global political and/or social instability, as well as currency, interest rate and price fluctuations, may also affect the securities’ value.
Valuation Risk: The market values of equities, such as common stocks and preferred securities or equity related investments, such as futures and options, may decline due to general market conditions which are not specifically related to a particular company. They may also decline due to factors which affect a particular industry or industries. The Fund may invest in illiquid investments and may experience difficulty in selling those investments in a timely manner at the price that it believes the investments are worth. Prices may fluctuate widely over short or extended periods in response to company, market or economic news. Markets also tend to move in cycles, with periods of rising and falling prices. This volatility may cause the Fund’s NAV to experience significant increases or decreases over short periods of time. If there is a general decline in the securities and other markets, the NAV of the Fund may lose value, regardless of the individual results of the securities and other instruments in which the Fund invests.
The price the Fund could receive upon the sale of any particular portfolio investment may differ from the Fund’s valuation of the investment, particularly for securities that trade in thin or volatile markets or that are valued using a fair valuation technique or a price provided by an independent pricing service. Changes to significant unobservable inputs and assumptions (i.e., publicly traded company multiples, growth rate, time to exit) due to the lack of observable inputs may significantly impact the resulting fair value and therefore the Fund’s results of operations. As a result, the price received upon the sale of an investment may be less than the value ascribed by the Fund, and the Fund could realize a greater than expected loss or lesser than expected gain upon the sale of the investment. The Fund’s ability to value its investments may also be impacted by technological issues and/or errors by pricing services or other third party service providers.
Counterparty Credit Risk: Similar to issuer credit risk, the Fund may be exposed to counterparty credit risk, or the risk that an entity may fail to or be unable to perform on its commitments related to unsettled or open transactions. The Fund manages counterparty credit risk by entering into transactions only with counterparties that the Manager believes have the financial resources to honor their obligations and by monitoring the financial stability of those counterparties. Financial assets, which potentially expose the Fund to market, issuer and counterparty credit risks, consist principally of financial instruments and receivables due from counterparties. The extent of the Fund’s exposure to market, issuer and counterparty credit risks with respect to these financial assets is approximately their value recorded in the Statement of Assets and Liabilities, less any collateral held by the Fund.
A derivative contract may suffer a mark-to-market loss if the value of the contract decreases due to an unfavorable change in the market rates or values of the underlying instrument. Losses can also occur if the counterparty does not perform under the contract..
With exchange-traded futures, there is less counterparty credit risk to the Fund since the exchange or clearinghouse, as counterparty to such instruments, guarantees against a possible default. The clearinghouse stands between the buyer and the seller of the contract; therefore, credit risk is limited to failure of the clearinghouse. While offset rights may exist under applicable law, the Fund does not have a contractual right of offset against a clearing broker or clearinghouse in the event of a default (including the bankruptcy or insolvency). Additionally, credit risk exists in exchange-traded futures with respect to initial and variation margin that is held in a clearing broker’s customer accounts. While clearing brokers are required to segregate customer margin from their own assets, in the event that a clearing broker becomes insolvent or goes into bankruptcy and at that time there is a shortfall in the aggregate amount of margin held by the clearing broker for all its clients, typically the shortfall would be allocated on a pro rata basis across all the clearing broker’s customers, potentially resulting in losses to the Fund.
| | | | | | |
| | | BLACKROCK BALANCED CAPITAL FUND, INC. | | MARCH 31, 2017 | | 25 |
| | | | |
| Notes to Financial Statements (concluded) | | | BlackRock Balanced Capital Fund, Inc. | |
10. Capital Share Transactions:
Transactions in capital shares for each class were as follows:
| | | | | | | | | | | | | | | | | | | | |
| | | Six Months Ended
March 31, 2017 | | | | | | Year Ended
September 30, 2016 | |
| | | Shares | | | Amount | | | | | | Shares | | | Amount | |
Institutional | | | | | | | | | | | | | | | | | | | | |
Shares sold | | | 1,375,555 | | | $ | 33,460,219 | | | | | | | | 2,490,769 | | | $ | 57,837,939 | |
Shares issued to shareholders in reinvestment of distributions | | | 523,109 | | | | 12,438,270 | | | | | | | | 637,852 | | | | 14,745,255 | |
Shares redeemed | | | (1,087,944 | ) | | | (26,416,012 | ) | | | | | | | (3,299,125 | ) | | | (77,069,098 | ) |
| | | | | | | | | | | | |
Net increase (decrease) | | | 810,720 | | | $ | 19,482,477 | | | | | | | | (170,504 | ) | | $ | (4,485,904 | ) |
| | | | | | | | | | | | |
| | | | | | | | | | | | | | | | | | | | |
Investor A | | | | | | | | | | | | | | | | | | | | |
Shares sold and automatic conversion of shares | | | 1,763,629 | | | $ | 42,740,895 | | | | | | | | 3,332,072 | | | $ | 76,884,894 | |
Shares issued to shareholders in reinvestment of distributions | | | 760,411 | | | | 18,033,037 | | | | | | | | 920,964 | | | | 21,233,971 | |
Shares redeemed | | | (2,278,549 | ) | | | (55,187,434 | ) | | | | | | | (3,617,241 | ) | | | (83,511,990 | ) |
| | | | | | | | | | | | |
Net increase | | | 245,491 | | | $ | 5,586,498 | | | | | | | | 635,795 | | | $ | 14,606,875 | |
| | | | | | | | | | | | |
| | | | | | | | | | | | | | | | | | | | |
Investor B | | | | | | | | | | | | | | | | | | | | |
Shares sold | | | 2,217 | | | $ | 52,847 | | | | | | | | 12,097 | | | $ | 271,632 | |
Shares issued to shareholders in reinvestment of distributions | | | 492 | | | | 11,320 | | | | | | | | 2,207 | | | | 49,320 | |
Shares redeemed and automatic conversion of shares | | | (23,934 | ) | | | (557,576 | ) | | | | | | | (73,295 | ) | | | (1,640,340 | ) |
| | | | | | | | | | | | |
Net decrease | | | (21,225 | ) | | $ | (493,409 | ) | | | | | | | (58,991 | ) | | $ | (1,319,388 | ) |
| | | | | | | | | | | | |
| | | | | | | | | | | | | | | | | | | | |
Investor C | | | | | | | | | | | | | | | | | | | | |
Shares sold | | | 959,531 | | | $ | 20,787,546 | | | | | | | | 2,447,411 | | | $ | 51,005,868 | |
Shares issued to shareholders in reinvestment of distributions | | | 220,629 | | | | 4,679,729 | | | | | | | | 217,213 | | | | 4,502,079 | |
Shares redeemed | | | (971,123 | ) | | | (21,004,955 | ) | | | | | | | (1,304,676 | ) | | | (26,991,177 | ) |
| | | | | | | | | | | | |
Net increase | | | 209,037 | | | $ | 4,462,320 | | | | | | | | 1,359,948 | | | $ | 28,516,770 | |
| | | | | | | | | | | | |
| | | | | | | | | | | | | | | | | | | | |
Class R | | | | | | | | | | | | | | | | | | | | |
Shares sold | | | 98,144 | | | $ | 2,216,631 | | | | | | | | 279,308 | | | $ | 6,047,674 | |
Shares issued to shareholders in reinvestment of distributions | | | 24,404 | | | | 542,261 | | | | | | | | 25,968 | | | | 562,526 | |
Shares redeemed | | | (59,836 | ) | | | (1,344,422 | ) | | | | | | | (216,263 | ) | | | (4,611,632 | ) |
| | | | | | | | | | | | |
Net increase | | | 62,712 | | | $ | 1,414,470 | | | | | | | | 89,013 | | | $ | 1,998,568 | |
| | | | | | | | | | | | |
Total Net Increase | | | 1,306,735 | | | $ | 30,452,356 | | | | | | | | 1,855,261 | | | $ | 39,316,921 | |
| | | | | | | | | | | | |
11. Subsequent Events:
Management’s evaluation of the impact of all subsequent events on the Fund’s financial statements was completed through the date the financial statements were issued and the following item was noted:
Effective April 20, 2017, the credit agreement was extended until April 2018 under the same terms.
| | | | | | |
| 26 | | BLACKROCK BALANCED CAPITAL FUND, INC. | | MARCH 31, 2017 | | |
| | | | |
| Master Portfolio Information | | | Master Large Cap Core Portfolio | |
| | | | | |
| Ten Largest Holdings | | Percent of
Net Assets |
Apple Inc. | | | | 5 | % |
JPMorgan Chase & Co. | | | | 4 | |
Microsoft Corp. | | | | 4 | |
Bank of America Corp. | | | | 3 | |
Comcast Corp., Class A | | | | 3 | |
Dow Chemical Co. | | | | 3 | |
Carnival Corp. | | | | 2 | |
U.S. Bancorp | | | | 2 | |
Lam Research Corp. | | | | 2 | |
Lowe’s Cos., Inc. | | | | 2 | |
| | | | | |
| Sector Allocations | | Percent of
Net Assets |
Information Technology | | | | 26 | % |
Financials | | | | 16 | |
Consumer Discretionary | | | | 16 | |
Health Care | | | | 15 | |
Consumer Staples | | | | 7 | |
Energy. | | | | 7 | |
Industrials | | | | 6 | |
Materials | | | | 5 | |
Utilities | | | | 1 | |
Short-Term Securities | | | | 1 | |
| | For Portfolio compliance purposes, the Portfolio’s sector classifications refer to one or more of the sector sub-classifications used by one or more widely recognized market indexes or ratings group indexes, and/or as defined by the investment adviser. These definitions may not apply for purposes of this report, which may combine sector sub-classifications for reporting ease. |
| | | | | | |
| | | BLACKROCK BALANCED CAPITAL FUND, INC. | | MARCH 31, 2017 | | 27 |
| | | | |
| Schedule of Investments March 31, 2017 (Unaudited) | | | Master Large Cap Core Portfolio | |
| | | (Percentages shown are based on Net Assets) | |
| | | | | | | | |
| Common Stocks | | Shares | | | Value | |
Aerospace & Defense — 0.1% | | | | | | | | |
Huntington Ingalls Industries, Inc. | | | 6,011 | | | $ | 1,203,643 | |
Airlines — 1.7% | | | | | | | | |
Delta Air Lines, Inc. | | | 756,082 | | | | 34,749,529 | |
Southwest Airlines Co. | | | 47,156 | | | | 2,535,107 | |
| | | | | | | | |
| | | | | | | | 37,284,636 | |
Auto Components — 2.8% | | | | | | | | |
Goodyear Tire & Rubber Co. | | | 892,151 | | | | 32,117,436 | |
Lear Corp. | | | 214,574 | | | | 30,379,387 | |
| | | | | | | | |
| | | | | | | | 62,496,823 | |
Banks — 12.9% | | | | | | | | |
Bank of America Corp. | | | 3,252,965 | | | | 76,737,444 | |
Citigroup, Inc. | | | 291,262 | | | | 17,423,293 | |
JPMorgan Chase & Co. | | | 1,003,452 | | | | 88,143,224 | |
Regions Financial Corp. | | | 861,571 | | | | 12,518,627 | |
SunTrust Banks, Inc. | | | 724,767 | | | | 40,079,615 | |
U.S. Bancorp | | | 1,000,729 | | | | 51,537,543 | |
| | | | | | | | |
| | | | | | | | 286,439,746 | |
Beverages — 0.9% | | | | | | | | |
Dr. Pepper Snapple Group, Inc. | | | 212,246 | | | | 20,783,128 | |
Biotechnology — 4.2% | | | | | | | | |
Biogen, Inc. (a) | | | 175,940 | | | | 48,105,515 | |
Bioverativ, Inc. (a) | | | 53,738 | | | | 2,926,571 | |
Gilead Sciences, Inc. | | | 629,439 | | | | 42,751,497 | |
| | | | | | | | |
| | | | | | | | 93,783,583 | |
Building Products — 0.2% | | | | | | | | |
Owens Corning | | | 84,986 | | | | 5,215,591 | |
Capital Markets — 2.1% | | | | | | | | |
Goldman Sachs Group, Inc. | | | 200,143 | | | | 45,976,850 | |
Chemicals — 2.5% | | | | | | | | |
Dow Chemical Co. | | | 886,015 | | | | 56,297,393 | |
Communications Equipment — 2.2% | | | | | | | | |
Cisco Systems, Inc. | | | 1,455,257 | | | | 49,187,687 | |
Construction & Engineering — 0.4% | | | | | | | | |
EMCOR Group, Inc. | | | 128,500 | | | | 8,089,075 | |
Consumer Finance — 1.1% | | | | | | | | |
SLM Corp. (a) | | | 1,996,648 | | | | 24,159,441 | |
Containers & Packaging — 1.7% | | | | | | | | |
Avery Dennison Corp. | | | 162,848 | | | | 13,125,549 | |
Packaging Corp. of America | | | 261,244 | | | | 23,935,175 | |
| | | | | | | | |
| | | | | | | | 37,060,724 | |
Diversified Telecommunication Services — 0.3% | | | | | | | | |
AT&T Inc. | | | 126,000 | | | | 5,235,300 | |
Verizon Communications, Inc. | | | 49,151 | | | | 2,396,111 | |
| | | | | | | | |
| | | | | | | | 7,631,411 | |
| | | | | | | | |
| Common Stocks | | Shares | | | Value | |
Electric Utilities — 0.6% | | | | | | | | |
FirstEnergy Corp. | | | 403,662 | | | $ | 12,844,525 | |
Electronic Equipment, Instruments & Components — 2.0% | | | | | |
CDW Corp. | | | 352,925 | | | | 20,367,302 | |
Flex Ltd. (a) | | | 1,500,983 | | | | 25,216,514 | |
| | | | | | | | |
| | | | | | | | 45,583,816 | |
Food & Staples Retailing — 4.6% | | | | | | | | |
CVS Health Corp. | | | 454,673 | | | | 35,691,831 | |
Walgreens Boots Alliance, Inc. | | | 569,635 | | | | 47,308,187 | |
Wal-Mart Stores, Inc. | | | 264,185 | | | | 19,042,455 | |
| | | | | | | | |
| | | | | | | | 102,042,473 | |
Health Care Providers & Services — 7.2% | | | | | | | | |
Aetna, Inc. | | | 28,071 | | | | 3,580,456 | |
Anthem, Inc. | | | 58,075 | | | | 9,604,443 | |
Centene Corp. (a) | | | 310,605 | | | | 22,133,712 | |
Cigna Corp. | | | 59,322 | | | | 8,690,080 | |
Humana, Inc. | | | 212,865 | | | | 43,879,991 | |
Laboratory Corp. of America Holdings (a) | | | 124,278 | | | | 17,830,165 | |
McKesson Corp. | | | 59,515 | | | | 8,823,694 | |
UnitedHealth Group, Inc. | | | 276,773 | | | | 45,393,540 | |
| | | | | | | | |
| | | | | | | | 159,936,081 | |
Hotels, Restaurants & Leisure — 2.4% | | | | | | | | |
Carnival Corp. | | | 904,638 | | | | 53,292,225 | |
Household Durables — 1.9% | | | | | | | | |
DR Horton, Inc. | | | 645,925 | | | | 21,515,762 | |
Lennar Corp., Class A | | | 198,536 | | | | 10,163,058 | |
NVR, Inc. (a) | | | 4,700 | | | | 9,902,336 | |
| | | | | | | | |
| | | | | | | | 41,581,156 | |
Insurance — 0.1% | | | | | | | | |
Prudential Financial, Inc. | | | 11,559 | | | | 1,233,114 | |
Internet Software & Services — 4.1% | | | | | | | | |
Alphabet, Inc., Class A (a) | | | 54,537 | | | | 46,236,469 | |
Alphabet, Inc., Class C (a) | | | 55,465 | | | | 46,011,545 | |
| | | | | | | | |
| | | | | | | | 92,248,014 | |
IT Services — 2.3% | | | | | | | | |
Amdocs Ltd. | | | 332,704 | | | | 20,291,617 | |
Cognizant Technology Solutions Corp., Class A (a) | | | 529,479 | | | | 31,514,590 | |
| | | | | | | | |
| | | | | | | | 51,806,207 | |
Life Sciences Tools & Services — 0.1% | | | | | | | | |
Quintiles IMS Holdings, Inc. (a) | | | 14,467 | | | | 1,165,027 | |
Machinery — 1.9% | | | | | | | | |
Stanley Black & Decker, Inc. | | | 259,274 | | | | 34,449,736 | |
WABCO Holdings, Inc. (a) | | | 73,337 | | | | 8,611,230 | |
| | | | | | | | |
| | | | | | | | 43,060,966 | |
| | |
| Portfolio Abbreviation |
| ADR | | American Depositary Receipts |
See Notes to Financial Statements.
| | | | | | |
| 28 | | BLACKROCK BALANCED CAPITAL FUND, INC. | | MARCH 31, 2017 | | |
| | | | |
| Schedule of Investments (continued) | | | Master Large Cap Core Portfolio | |
| | | | | | | | |
| Common Stocks | | Shares | | | Value | |
Media — 3.3% | | | | | | | | |
Comcast Corp., Class A | | | 1,933,800 | | | $ | 72,691,542 | |
Metals & Mining — 0.9% | | | | | | | | |
Rio Tinto PLC — ADR | | | 519,935 | | | | 21,150,956 | |
Multiline Retail — 0.0% | | | | | | | | |
Kohl’s Corp. | | | 19,077 | | | | 759,455 | |
Multi-Utilities — 0.7% | | | | | | | | |
Ameren Corp. | | | 41,161 | | | | 2,246,979 | |
Public Service Enterprise Group, Inc. | | | 290,465 | | | �� | 12,882,123 | |
| | | | | | | | |
| | | | | | | | 15,129,102 | |
Oil, Gas & Consumable Fuels — 6.6% | | | | | | | | |
Anadarko Petroleum Corp. | | | 114,744 | | | | 7,114,128 | |
BP PLC — ADR | | | 687,375 | | | | 23,728,185 | |
Chevron Corp. | | | 438,394 | | | | 47,070,364 | |
Hess Corp. | | | 170,806 | | | | 8,234,557 | |
Marathon Oil Corp. | | | 431,411 | | | | 6,816,294 | |
Statoil ASA — ADR | | | 474,600 | | | | 8,153,628 | |
Suncor Energy, Inc. | | | 714,034 | | | | 21,956,545 | |
TOTAL SA — ADR | | | 295,494 | | | | 14,898,807 | |
Valero Energy Corp. | | | 115,500 | | | | 7,656,495 | |
| | | | | | | | |
| | | | | | | | 145,629,003 | |
Pharmaceuticals — 3.4% | | | | | | | | |
Allergan PLC | | | 56,427 | | | | 13,481,539 | |
Mallinckrodt PLC (a) | | | 300,088 | | | | 13,374,922 | |
Merck & Co., Inc. | | | 326,929 | | | | 20,773,069 | |
Mylan NV (a) | | | 55,717 | | | | 2,172,406 | |
Pfizer, Inc. | | | 436,116 | | | | 14,919,528 | |
Teva Pharmaceutical Industries Ltd. — ADR | | | 355,532 | | | | 11,409,022 | |
| | | | | | | | |
| | | | | | | | 76,130,486 | |
Professional Services — 0.8% | | | | | | | | |
Robert Half International, Inc. | | | 357,480 | | | | 17,455,748 | |
Road & Rail — 0.9% | | | | | | | | |
Norfolk Southern Corp. | | | 182,443 | | | | 20,428,143 | |
Semiconductors & Semiconductor Equipment — 4.5% | | | | | |
Applied Materials, Inc. | | | 173,168 | | | | 6,736,235 | |
| | | | | | | | |
| Common Stocks | | Shares | | | Value | |
Semiconductors & Semiconductor Equipment (continued) | | | | | |
Intel Corp. | | | 892,387 | | | $ | 32,188,399 | |
Lam Research Corp. | | | 398,236 | | | | 51,117,573 | |
Qorvo, Inc. (a) | | | 136,413 | | | | 9,352,475 | |
| | | | | | | | |
| | | | | | | | 99,394,682 | |
Software — 5.7% | | | | | | | | |
Activision Blizzard, Inc. | | | 643,637 | | | | 32,091,741 | |
Dell Technologies, Inc., Class V (a) | | | 119,626 | | | | 7,665,634 | |
Microsoft Corp. | | | 1,323,950 | | | | 87,195,347 | |
| | | | | | | | |
| | | | | | | | 126,952,722 | |
Specialty Retail — 4.9% | | | | | | | | |
Home Depot, Inc. | | | 342,707 | | | | 50,319,669 | |
Lowe’s Cos., Inc. | | | 616,989 | | | | 50,722,666 | |
Urban Outfitters, Inc. (a) | | | 377,566 | | | | 8,970,968 | |
| | | | | | | | |
| | | | | | | | 110,013,303 | |
Technology Hardware, Storage & Peripherals — 5.3% | | | | | |
Apple Inc. | | | 818,550 | | | | 117,592,893 | |
Tobacco — 1.7% | | | | | | | | |
Altria Group, Inc. | | | 525,739 | | | | 37,548,279 | |
Total Long-Term Investments (Cost — $1,605,896,624) — 99.0% | | | | | | | 2,201,279,649 | |
| | | | | | | | |
| Short-Term Securities | | | | | | |
BlackRock Liquidity Funds, T-Fund, Institutional Class, 0.60% (b)(c) | | | 23,077,061 | | | | 23,077,061 | |
Total Short-Term Securities (Cost — $23,077,061) — 1.1% | | | | | | | 23,077,061 | |
Total Investments (Cost — $1,628,973,685) — 100.1% | | | | 2,224,356,710 | |
Liabilities in Excess of Other Assets — (0.1)% | | | | | | | (1,666,292 | ) |
| | | | | | | | |
Net Assets — 100.0% | | | | | | $ | 2,222,690,418 | |
| | | | | | | | |
|
| Notes to Schedule of Investments |
| (a) | Non-income producing security. |
| (b) | During the period ended March 31, 2017, investments in issuers considered to be affiliates of the Portfolio for purposes of Section 2(a)(3) of the Investment Company Act of 1940, as amended, were as follows: |
| | | | | | | | | | | | | | | | | | | | | | | | | | |
| Affiliate | | Shares Held at
September 30,
2016 | | | Net
Activity | | | Shares Held at
March 31,
2017 | | | Value at
March 31,
2017 | | | Income | | | Net
Realized
Gain1 | | | Change in
Unrealized
Appreciation
(Depreciation) |
BlackRock Liquidity Funds, T-Fund, Institutional Class | | | 73,479,703 | | | | (50,402,642 | ) | | | 23,077,061 | | | | $23,077,061 | | | | $ 96,962 | | | | $ 350 | | | — |
SL Liquidity Series, LLC, Money Market Series | | | 5,154,808 | | | | (5,154,808 | ) | | | — | | | | — | | | | 18,495 | 2 | | | 757 | | | — |
Total | | | | | | | | | | | | | | | $23,077,061 | | | | $115,457 | | | | $1,107 | | | — |
| | | | | | | | | | | | | | | |
| | 1 | | Includes net capital gain distributions. |
| | 2 | | Represents securities lending income earned from the reinvestment of cash collateral from loaned securities, net of fees and collateral investment expenses, and other payments to and from borrowers of securities. |
See Notes to Financial Statements.
| | | | | | |
| | | BLACKROCK BALANCED CAPITAL FUND, INC. | | MARCH 31, 2017 | | 29 |
| | | | |
| Schedule of Investments (concluded) | | | Master Large Cap Core Portfolio | |
| (c) | Current yield as of period end. |
| • | | For Portfolio compliance purposes, the Portfolio’s industry classifications refer to one or more of the industry sub-classifications used by one or more widely recognized market indexes or ratings group indexes, and/or as defined by the investment adviser. These definitions may not apply for purposes of this report, which may combine such industry sub-classifications for reporting ease. |
|
Derivative Financial Instruments Categorized by Risk Exposure |
| | | | | | | | | | | | | | | | | | | | | | | | | | | | |
| For the six months ended March 31, 2017, the effect of derivative financial instruments in the Statements of Operation was as follows: | |
| | | Commodity
Contracts | | | Credit
Contracts | | | Equity
Contracts | | | Foreign
Currency
Exchange
Contracts | | | Interest
Rate
Contracts | | | Other
Contracts | | | Total | |
Net Realized Gain from: | | | | | | | | | | | | | | | | | | | | | | | | | | | | |
Futures contracts | | | — | | | | — | | | | $689,716 | | | | — | | | | — | | | | — | | | $ | 689,716 | |
|
Average Quarterly Balances of Outstanding Derivative Financial Instruments |
| | | | |
Futures contracts: | | | | |
Average notional value of contracts — long | | $ | 13,384,422 | 1 |
|
1 Actual amounts for the period are shown due to limited outstanding derivative financial instruments as of each quarter end. | |
| For more information about the Portfolio’s investment risks regarding derivative financial instruments, refer to the Notes to Financial Statements. | |
|
Fair Value Hierarchy as of Period End |
Various inputs are used in determining the fair value of investments. For information about the Portfolio’s policy regarding valuation of investments, refer to the Notes to Financial Statements.
The following table summarizes the Portfolio’s investments categorized in the disclosure hierarchy:
| | | | | | | | | | | | | | | | | | | | | | | | | | |
| | | Level 1 | | | | Level 2 | | | | Level 3 | | | | Total |
Assets: | | | | | | | | | | | | | | | | | | | | | | | | | | |
Investments: | | | | | | | | | | | | | | | | | | | | | | | | | | |
Long-Term Investments: | | | | | | | | | | | | | | | | | | | | | | | | | | |
Common Stocks1 | | | | $2,201,279,649 | | | | | | | — | | | | | | | — | | | | | | | $2,201,279,649 | |
Short-Term Securities | | | | 23,077,061 | | | | | | | — | | | | | | | — | | | | | | | 23,077,061 | |
| | | | | |
Total | | | | $2,224,356,710 | | | | | | | — | | | | | | | — | | | | | | | $2,224,356,710 | |
| | | | | |
| | 1 | See above Schedule of Investments for values in each industry |
During the six months ended March 31, 2017, there were no transfers between levels.
See Notes to Financial Statements.
| | | | | | |
| 30 | | BLACKROCK BALANCED CAPITAL FUND, INC. | | MARCH 31, 2017 | | |
| | | | |
| Statement of Assets and Liabilities | | | Master Large Cap Core Portfolio | |
| | | | |
| March 31, 2017 (Unaudited) | | | |
| | | | |
| Assets | | | | |
Investments at value — unaffiliated (cost — $1,605,896,624) | | $ | 2,201,279,649 | |
Investments at value — affiliated (cost — $23,077,061) | | | 23,077,061 | |
Receivables: | | | | |
Investments sold | | | 1,831,841 | |
Securities lending income — affiliated | | | 98 | |
Contributions from investors | | | 1,799,992 | |
Dividends — affiliated | | | 13,915 | |
Dividends — unaffiliated | | | 2,849,792 | |
Prepaid expenses | | | 6,888 | |
| | | | |
Total assets | | | 2,230,859,236 | |
| | | | |
| | | | |
| Liabilities | | | | |
Payables: | | | | |
Investments purchased | | | 1,508,219 | |
Directors’ fees | | | 20,989 | |
Investment advisory fees | | | 900,607 | |
Other accrued expenses | | | 82,526 | |
Other affiliates | | | 13,570 | |
Withdrawals to investors | | | 5,642,907 | |
| | | | |
Total liabilities | | | 8,168,818 | |
| | | | |
Net Assets | | $ | 2,222,690,418 | |
| | | | |
| | | | |
| Net Assets Consist of | | | | |
Investors’ capital | | $ | 1,627,307,393 | |
Net unrealized appreciation (depreciation) | | | 595,383,025 | |
| | | | |
Net Assets | | $ | 2,222,690,418 | |
| | | | |
See Notes to Financial Statements.
| | | | | | |
| | | BLACKROCK BALANCED CAPITAL FUND, INC. | | MARCH 31, 2017 | | 31 |
| | | | |
| Statement of Operations | | | Master Large Cap Core Portfolio | |
| | | | |
| Six Months Ended March 31, 2017 (Unaudited) | | | |
| | | | |
| Investment Income | | | | |
Dividends — affiliated | | $ | 96,962 | |
Dividends — unaffiliated | | | 20,766,953 | |
Securities lending income — affiliated — net | | | 18,495 | |
Foreign taxes withheld | | | (189,427 | ) |
| | | | |
Total income | | | 20,692,983 | |
| | | | |
| | | | |
| Expenses | | | | |
Investment advisory | | | 5,196,204 | |
Accounting services | | | 182,294 | |
Directors | | | 33,277 | |
Custodian | | | 29,887 | |
Professional | | | 29,299 | |
Printing | | | 1,229 | |
Miscellaneous | | | 16,305 | |
| | | | |
Total expenses | | | 5,488,495 | |
Less fees waived by the Manager | | | (19,373 | ) |
| | | | |
Total expenses after fees waived | | | 5,469,122 | |
| | | | |
Net investment income | | | 15,223,861 | |
| | | | |
| | | | |
| Realized and Unrealized Gain (Loss) | | | | |
Net realized gain from: | | | | |
Capital gain distributions received from affiliated investment companies | | | 350 | |
Futures contracts | | | 689,716 | |
Investments — affiliated | | | 757 | |
Investments — unaffiliated | | | 153,121,702 | |
Litigation proceeds | | | 80,099 | |
| | | | |
| | | 153,892,624 | |
| | | | |
Net change in unrealized appreciation (depreciation) on investments | | | 128,067,634 | |
| | | | |
Total realized and unrealized gain | | | 281,960,258 | |
| | | | |
Net Increase in Net Assets Resulting from Operations | | $ | 297,184,119 | |
| | | | |
See Notes to Financial Statements.
| | | | | | |
| 32 | | BLACKROCK BALANCED CAPITAL FUND, INC. | | MARCH 31, 2017 | | |
| | | | |
| Statements of Changes in Net Assets | | | Master Large Cap Core Portfolio | |
| | | | | | | | |
| Increase (Decrease) in Net Assets: | | Six Months Ended
March 31, 2017
(Unaudited) | | | Year Ended
September 30,
2016 | |
| | | | |
| | | | | | | | |
| Operations | | | | | | | | |
Net investment income | | $ | 15,223,861 | | | $ | 27,236,092 | |
Net realized gain | | | 153,892,624 | | | | 103,719,289 | |
Net change in unrealized appreciation (depreciation) | | | 128,067,634 | | | | 86,807,504 | |
| | | | |
Net increase (decrease) in net assets resulting from operations | | | 297,184,119 | | | | 217,762,885 | |
| | | | |
| | | | | | | | |
| Capital Transactions | | | | | | | | |
Proceeds from contributions | | | 65,106,411 | | | | 202,368,749 | |
Value of withdrawals | | | (272,304,751 | ) | | | (440,758,156 | ) |
| | | | |
Net decrease in net assets derived from capital transactions | | | (207,198,340 | ) | | | (238,389,407 | ) |
| | | | |
| | | | | | | | |
| Net Assets | | | | | | | | |
Total decrease in net assets | | | 89,985,779 | | | | (20,626,522 | ) |
Beginning of period | | | 2,132,704,639 | | | | 2,153,331,161 | |
| | | | |
End of period | | $ | 2,222,690,418 | | | $ | 2,132,704,639 | |
| | | | |
See Notes to Financial Statements.
| | | | | | |
| | | BLACKROCK BALANCED CAPITAL FUND, INC. | | MARCH 31, 2017 | | 33 |
| | | | |
| Financial Highlights | | | Master Large Cap Core Portfolio | |
| | | | | | | | | | | | | | | | | | | | | | | | | | | | |
| | | Master Large Cap Core Portfolio | |
| | | Six Months
Ended
March 31, 2017 (Unaudited) | | | Year Ended September 30, | |
| | | | 2016 | | | 2015 | | | 2014 | | | 2013 | | | 2012 | | | | |
| | | | | | | | | | | | | | | | | | | | | | | | | | | | |
| Total Return | | | | | | | | | | | | | | | | | | | | | | | | | | | | |
Total return | | | 14.38 | %1,2 | | | 10.34 | %1 | | | (0.89 | )% | | | 19.44 | % | | | 20.39 | % | | | 29.97 | % | | | | |
| | | | |
| | | | | | | | | | | | | | | | | | | | | | | | | | | | |
| Ratios to Average Net Assets | | | | | | | | | | | | | | | | | | | | | | | | | | | | |
Total expenses | | | 0.50 | %3 | | | 0.50 | % | | | 0.50 | % | | | 0.50 | % | | | 0.50 | % | | | 0.50 | % | | | | |
| | | | |
Total expenses after fees waived | | | 0.50 | %3 | | | 0.50 | % | | | 0.50 | % | | | 0.50 | % | | | 0.50 | % | | | 0.50 | % | | | | |
| | | | |
Net investment income (loss) | | | 1.38 | %3 | | | 1.25 | % | | | 1.09 | % | | | 1.08 | % | | | 1.29 | % | | | 1.67 | % | | | | |
| | | | |
| | | | | | | | | | | | | | | | | | | | | | | | | | | | |
| Supplemental Data | | | | | | | | | | | | | | | | | | | | | | | | | | | | |
Net assets, end of period (000) | | | $2,222,690 | | | $ | 2,132,705 | | | $ | 2,153,331 | | | $ | 2,335,503 | | | $ | 2,308,896 | | | $ | 2,318,851 | | | | | |
| | | | |
Portfolio turnover rate | | | 22 | % | | | 39 | % | | | 41 | % | | | 40 | % | | | 50 | % | | | 128 | % | | | | |
| | | | |
| | 1 | | Includes proceeds received from a settlement of litigation, which had no impact on the Portfolio’s total return. |
| | 2 | | Aggregate total return. |
See Notes to Financial Statements.
| | | | | | |
| 34 | | BLACKROCK BALANCED CAPITAL FUND, INC. | | MARCH 31, 2017 | | |
| | |
| Notes to Financial Statements (Unaudited) | | Master Large Cap Core Portfolio |
1. Organization:
Master Large Cap Core Portfolio (the “Portfolio”) is a series of Master Large Cap Series LLC (the “Master LLC”). The Master LLC is registered under the Investment Company Act of 1940, as amended (the “1940 Act”), as an open-end management investment company and is organized as a Delaware limited liability company. The Portfolio is classified as diversified. The Limited Liability Company Agreement of the Master LLC permits the Board of Directors of the Master LLC (the “Board”) to issue non-transferable interests in the Master LLC, subject to certain limitations.
The Portfolio, together with certain other registered investment companies advised by BlackRock Advisors, LLC (the “Manager”) or its affiliates, is included in a complex of open-end funds referred to as the Equity-Liquidity Complex.
2. Significant Accounting Policies:
The financial statements are prepared in conformity with accounting principles generally accepted in the United States of America (“U.S. GAAP”), which may require management to make estimates and assumptions that affect the reported amounts of assets and liabilities in the financial statements, disclosure of contingent assets and liabilities at the date of the financial statements and the reported amounts of increases and decreases in net assets from operations during the reporting period. Actual results could differ from those estimates. The Portfolio is considered an investment company under U.S. GAAP and follows the accounting and reporting guidance applicable to investment companies. Below is a summary of significant accounting policies:
Segregation and Collateralization: In cases where the Portfolio enters into certain investments (e.g., futures contracts) that would be treated as “senior securities” for 1940 Act purposes, the Portfolio may segregate or designate on its books and records cash or liquid assets having a market value at least equal to the amount of its future obligations under such investments. Doing so allows the investment to be excluded from treatment as a “senior security.” Furthermore, if required by an exchange or counterparty agreement, the Portfolio may be required to deliver/deposit cash and/or securities to/with an exchange, or broker-dealer or custodian as collateral for certain investments or obligations.
Investment Transactions and Investment Income: For financial reporting purposes, investment transactions are recorded on the dates the transactions are entered into (the trade dates). Realized gains and losses on investment transactions are determined on the identified cost basis. Dividend income is recorded on the ex-dividend date. Dividends from foreign securities where the ex-dividend date may have passed are subsequently recorded when the Portfolio is informed of the ex-dividend date. Under the applicable foreign tax laws, a withholding tax at various rates may be imposed on capital gains, dividends and interest. Upon notification from issuers, some of the dividend income received from a real estate investment trust may be redesignated as a reduction of cost of the related investment and/or realized gain.
Recent Accounting Standards: In April 2015, the Financial Accounting Standards Board issued “Disclosures for Investments in Certain Entities that Calculate Net Asset Value (“NAV”) per Share” which eliminates the requirement to categorize investments within the fair value hierarchy when fair value is based on the NAV per share and no quoted market value is available. As of March 31, 2017, certain investments of the Fund were valued using NAV per share (or its equivalent) as no quoted market value is available and therefore have been excluded from the fair value hierarchy.
Indemnifications: In the normal course of business, the Portfolio enters into contracts that contain a variety of representations that provide general indemnification. The Portfolio’s maximum exposure under these arrangements is unknown because it involves future potential claims against the Portfolio, which cannot be predicted with any certainty.
Other: Expenses directly related to the Portfolio are charged to the Portfolio. Other operating expenses shared by several funds, including other funds managed by the Manager, are prorated among those funds on the basis of relative net assets or other appropriate methods.
The Portfolio has an arrangement with its custodian whereby credits are earned on uninvested cash balances, which could be used to reduce custody fees and/or overdraft charges. The Portfolio may incur charges on certain uninvested cash balances and overdrafts, subject to certain conditions.
3. Investment Valuation and Fair Value Measurements:
Investment Valuation Policies: The Portfolio’s investments are valued at fair value (also referred to as “market value” within the financial statements) as of the close of trading on the New York Stock Exchange (“NYSE”) (generally 4:00 p.m., Eastern time). U.S. GAAP defines fair value as the price the Portfolio would receive to sell an asset or pay to transfer a liability in an orderly transaction between market participants at the measurement date. The Portfolio determines the fair values of its financial instruments using various independent dealers or pricing services under policies approved by Board of Directors of the Portfolio (“the Board”). The BlackRock Global Valuation Methodologies Committee (the “Global Valuation Committee”) is the committee formed by management to develop global pricing policies and procedures and to oversee the pricing function for all financial instruments.
Fair Value Inputs and Methodologies: The following methods and inputs are used to establish the fair value of the Portfolio’s assets and liabilities:
| | | | | | |
| | | BLACKROCK BALANCED CAPITAL FUND, INC. | | MARCH 31, 2017 | | 35 |
| | | | |
| Notes to Financial Statements (continued) | | | Master Large Cap Core Portfolio | |
| | • | | Equity investments traded on a recognized securities exchange are valued at the official closing price each day, if available. For equity investments traded on more than one exchange, the official closing price on the exchange where the stock is primarily traded is used. Equity investments traded on a recognized exchange for which there were no sales on that day may be valued at the last available bid (long positions) or ask (short positions) price. |
| | • | | Investments in open-end U.S. mutual funds are valued at net asset value (“NAV”) each business day. |
| | • | | The Portfolio values its investment in SL Liquidity Series, LLC, Money Market Series (the “Money Market Series”) at fair value, which is ordinarily based upon its pro rata ownership in the underlying fund’s net assets. The Money Market Series seeks current income consistent with maintaining liquidity and preserving capital. Although the Money Market Series is not registered under the 1940 Act, its investments may follow the parameters of investments by a money market fund that is subject to Rule 2a-7 under the 1940 Act. The Portfolio may withdraw up to 25% of its investment daily, although the manager of the Money Market Series, in its sole discretion, may permit an investor to withdraw more than 25% on any one day. |
| | • | | Futures contracts traded on exchanges are valued at their last sale price. |
If events (e.g., a company announcement, market volatility or a natural disaster) occur that are expected to materially affect the value of such investments, or in the event that the application of these methods of valuation results in a price for an investment that is deemed not to be representative of the market value of such investment, or if a price is not available, the investment will be valued by the Global Valuation Committee, or its delegate, in accordance with a policy approved by the Board as reflecting fair value (“Fair Valued Investments”). The fair valuation approaches that may be used by the Global Valuation Committee will include Market approach, Income approach and Cost approach. Valuation techniques such as discounted cash flow, use of market comparables and matrix pricing are types of valuation approaches and typically used in determining fair value. When determining the price for Fair Valued Investments, the Global Valuation Committee, or its delegate, seeks to determine the price that the Portfolio might reasonably expect to receive or pay from the current sale or purchase of that asset or liability in an arm’s-length transaction. Fair value determinations shall be based upon all available factors that the Global Valuation Committee, or its delegate, deems relevant and consistent with the principles of fair value measurement. The pricing of all Fair Valued Investments is subsequently reported to the Board or a committee thereof on a quarterly basis.
Fair Value Hierarchy: Various inputs are used in determining the fair value of investments and derivative financial instruments. These inputs to valuation techniques are categorized into a fair value hierarchy consisting of three broad levels for financial statement purposes as follows:
| | • | | Level 1 — unadjusted price quotations in active markets/exchanges for identical assets or liabilities that the Portfolio has the ability to access |
| | • | | Level 2 — other observable inputs (including, but not limited to, quoted prices for similar assets or liabilities in markets that are active, quoted prices for identical or similar assets or liabilities in markets that are not active, inputs other than quoted prices that are observable for the assets or liabilities (such as interest rates, yield curves, volatilities, prepayment speeds, loss severities, credit risks and default rates) or other market-corroborated inputs) |
| | • | | Level 3 — unobservable inputs based on the best information available in the circumstances, to the extent observable inputs are not available (including the Portfolio’s own assumptions used in determining the fair value of investments and derivative financial instruments) |
The hierarchy gives the highest priority to unadjusted quoted prices in active markets for identical assets or liabilities (Level 1 measurements) and the lowest priority to unobservable inputs (Level 3 measurements). Accordingly, the degree of judgment exercised in determining fair value is greatest for instruments categorized in Level 3. The inputs used to measure fair value may fall into different levels of the fair value hierarchy. In such cases, for disclosure purposes, the fair value hierarchy classification is determined based on the lowest level input that is significant to the fair value measurement in its entirety. Investments classified within Level 3 have significant unobservable inputs used by the Global Valuation Committee in determining the price for Fair Valued Investments. Level 3 Investments include equity or debt issued by privately held companies or portfolios. There may not be a secondary market, and/or there are a limited number of investors. Level 3 investments may also be adjusted to reflect illiquidity and/or non-transferability, with the amount of such discount estimated by the Global Valuation Committee in the absence of market information.
Changes in valuation techniques may result in transfers into or out of an assigned level within the hierarchy. In accordance with the Portfolio’s policy, transfers between different levels of the fair value hierarchy are deemed to have occurred as of the beginning of the reporting period. The categorization of a value determined for investments and derivative financial instruments is based on the pricing transparency of the investments and derivative financial instruments and is not necessarily an indication of the risks associated with investing in those securities.
4. Securities and Other Investments:
Securities Lending: The Portfolio may lend its securities to approved borrowers, such as brokers, dealers and other financial institutions. The borrower pledges and maintains with the Portfolio collateral consisting of cash, an irrevocable letter of credit issued by a bank, or securities issued or guaranteed by the U.S. Government. The initial collateral received by the Portfolio is required to have a value of at least 102% of the current value of the loaned securities for securities traded on U.S. exchanges and a value of at least 105% for all other securities. The collateral is maintained thereafter at
| | | | | | |
| 36 | | BLACKROCK BALANCED CAPITAL FUND, INC. | | MARCH 31, 2017 | | |
| | | | |
| Notes to Financial Statements (continued) | | | Master Large Cap Core Portfolio | |
a value equal to at least 100% of the current market value of the securities on loan. The market value of the loaned securities is determined at the close of each business day of the Portfolio and any additional required collateral is delivered to the Portfolio, or excess collateral returned by the Portfolio, on the next business day. During the term of the loan, the Portfolio is entitled to all distributions made on or in respect of the loaned securities but does not receive interest income on securities received as collateral. Loans of securities are terminable at any time and the borrower, after notice, is required to return borrowed securities within the standard time period for settlement of securities transactions.
The market value of any securities on loan, all of which were classified as common stocks in the Portfolio’s Schedule of Investments, and the value of any related collateral are shown separately in the Statement of Assets and Liabilities as a component of investments at value – unaffiliated, and collateral on securities loaned at value, respectively. As of period end, any securities on loan were collateralized by cash and/or U.S. Government obligations. Cash collateral invested by the securities lending agent, BlackRock Investment Management, LLC (“BIM”), if any, is disclosed in the Schedule of Investments.
Securities lending transactions are entered into by the Portfolio under Master Securities Lending Agreements (each, an “MSLA”), which provide the right, in the event of default (including bankruptcy or insolvency), for the non-defaulting party to liquidate the collateral and calculate a net exposure to the defaulting party or request additional collateral. In the event that a borrower defaults, the Portfolio, as lender, would offset the market value of the collateral received against the market value of the securities loaned. When the value of the collateral is greater than that of the market value of the securities loaned, the lender is left with a net amount payable to the defaulting party. However, bankruptcy or insolvency laws of a particular jurisdiction may impose restrictions on or prohibitions against such a right of offset in the event of an MSLA counterparty’s bankruptcy or insolvency. Under the MSLA, absent an event of default the borrower can resell or re-pledge the loaned securities, and the Portfolio can reinvest cash collateral received in connection with loaned securities. Upon an event of default, the parties’ obligations to return the securities or collateral to the other party are extinguished, and the parties can resell or re-pledge the loaned securities or the collateral received in connection with the loaned securities in order to satisfy the defaulting party’s net payment obligation for all transactions under the MSLA. The defaulting party remains liable for any deficiency.
The risks of securities lending include the risk that the borrower may not provide additional collateral when required or may not return the securities when due. To mitigate these risks, the Portfolio benefits from a borrower default indemnity provided by BIM. BIM’s indemnity allows for full replacement of the securities loaned if the collateral received does not cover the value on the securities loaned in the event of borrower default. The Portfolio could suffer a loss if the value of an investment purchased with cash collateral falls below the market value of loaned securities or if the value of an investment purchased with cash collateral falls below the value of the original cash collateral received.
5. Derivative Financial Instruments:
The Portfolio engages in various portfolio investment strategies using derivative contracts both to increase the returns of the Portfolio and/or to manage its exposure to certain risks such as credit risk, equity risk, interest rate risk, foreign currency exchange rate risk, commodity price risk or other risks (e.g., inflation risk). Derivative financial instruments categorized by risk exposure are included in the Schedule of Investments. These contracts may be transacted on an exchange or over-the-counter (“OTC”).
Futures Contracts: The Portfolio invest in long and/or short positions in futures contracts and options on futures contracts to gain exposure to, or manage exposure to, changes in interest rates (interest rate risk), changes in the value of equity securities (equity risk) or foreign currencies (foreign currency exchange rate risk).
Futures contracts are agreements between the Portfolio and a counterparty to buy or sell a specific quantity of an underlying instrument at a specified price and on specified date. Depending on the terms of a contract, it is settled either through physical delivery of the underlying instrument on the settlement date or by payment of a cash amount on the settlement date. Upon entering into a futures contract, the Portfolio is required to deposit initial margin with the broker in the form of cash or securities in an amount that varies depending on a contract’s size and risk profile. The initial margin deposit must then be maintained at an established level over the life of the contract.
Securities deposited as initial margin are designated in the Schedule of Investments and cash deposited, if any, is shown as cash pledged for futures contracts in the Statement of Assets and Liabilities. Pursuant to the contract, the Portfolio agrees to receive from or pay to the broker an amount of cash equal to the daily fluctuation in market value of the contract (“variation margin”). Variation margin is recorded as unrealized appreciation (depreciation) and, if any, shown as variation margin receivable (or payable) on futures contracts in the Statement of Assets and Liabilities. When the contract is closed, a realized gain or loss is recorded in the Statement of Operations equal to the difference between the value of the contract at the time it was opened and the value at the time it was closed. The use of futures contracts involves the risk of an imperfect correlation in the movements in the price of futures contracts and interest, foreign currency exchange rates or underlying assets.
6. Investment Advisory Agreement and Other Transactions with Affiliates:
The PNC Financial Services Group, Inc. is the largest stockholder and an affiliate of BlackRock, Inc. (“BlackRock”) for 1940 Act purposes.
| | | | | | |
| | | BLACKROCK BALANCED CAPITAL FUND, INC. | | MARCH 31, 2017 | | 37 |
| | |
| Notes to Financial Statements (continued) | | Master Large Cap Core Portfolio |
Investment Advisory: The Master LLC, on behalf of the Portfolio, entered into an Investment Advisory Agreement with the Manager, the Portfolio’s investment adviser, an indirect, wholly-owned subsidiary of BlackRock, to provide investment advisory and administration services. The Manager is responsible for the management of the Portfolio and provides the personnel, facilities, equipment and certain other services necessary to the operations of the Portfolio.
For such services, the Portfolio pays the Manager a monthly fee at an annual rate equal to the average daily value of the Portfolio’s net assets at the following annual rates:
| | | | | |
| Average Daily Net Assets | | Investment
Advisory Fee |
Not exceeding $1 Billion | | | | 0.50 | % |
In excess of $1 Billion, but not exceeding $5 Billion | | | | 0.45 | % |
In excess of $5 Billion | | | | 0.40 | % |
Expense Limitations, Waivers and Reimbursements: With respect to the Portfolio, the Manager voluntarily agreed to waive its investment advisory fees by the amount of investment advisory fees the Portfolio pays to the Manager indirectly through its investment in affiliated money market funds (the “affiliated money market fund waiver”). This amount is included in fees waived by the Manager in the Statement of Operations.
The Manager voluntarily agreed to waive the investment advisory fee with respect to any portion of the Portfolio’s assets invested in affiliated equity or fixed-income mutual funds or affiliated exchange-traded funds that have a contractual management fee. Effective January 27, 2017, the waiver became contractual through January 31, 2018. This contractual agreement may be terminated upon 90 days’ notice by a majority of the Independent Directors or by a vote of a majority of the outstanding voting securities of the Portfolios. For the six months ended March 31, 2017, there were no fees waived by the Manager.
For the six months ended March 31, 2017, the Portfolio reimbursed the Manager $12,918 for certain accounting services, which is included in accounting services in the Statement of Operations.
Securities Lending: The U.S. Securities and Exchange Commission has issued an exemptive order which permits BIM, an affiliate of the Manager, to serve as securities lending agent for the Portfolio, subject to applicable conditions. As securities lending agent, BIM bears all operational costs directly related to securities lending. The Portfolio is responsible for expenses in connection with the investment of cash collateral received for securities on loan (the “collateral investment expenses”). The cash collateral is invested in a private investment company managed by the Manager or its affiliates. However, BIM has agreed to cap the collateral investment expenses of the private investment company to an annual rate of 0.04%. The investment adviser to the private investment company will not charge any advisory fees with respect to shares purchased by the Portfolio. If the private investment company’s weekly liquid assets fall below 30% of its total assets, BIM, as managing member of the private investment company, is permitted at any time, if it determines it to be in the best interests of the private investment company, to impose a liquidity fee of up to 2% of the value of units withdrawn or impose a redemption gate that temporarily suspends the right of withdrawal out of the private investment company. In addition, if the private investment company’s weekly liquid assets fall below 10% of its total assets at the end of any business day, the private investment company will impose a liquidity fee in the default amount of 1% of the amount withdrawn, generally effective as of the next business day, unless BIM determines that a higher (not to exceed 2%) or lower fee level or not imposing a liquidity fee is in the best interests of the private investment company. The shares of the private investment company purchased by the Portfolio would be subject to any such liquidity fee or redemption gate imposed.
Securities lending income is equal to the total of income earned from the reinvestment of cash collateral, net of fees and other payments to and from borrowers of securities, and less the collateral investment expenses. The Portfolio retains a portion of securities lending income and remits a remaining portion to BIM as compensation for its services as securities lending agent. Pursuant to a securities lending agreement, BIM may lend securities only when the difference between the borrower rebate rate and the risk free rate exceeds a certain level (such securities, the “specials only securities”).
Pursuant to such agreement, the Portfolio retains 80% of securities lending income. In addition, commencing the business day following the date that the aggregate securities lending income earned across certain funds in the Equity-Liquidity Complex in a calendar year exceeds a specified threshold, the Portfolio, pursuant to the securities lending agreement, will retain for the remainder of the calendar year securities lending income in an amount equal to 85% of securities lending income.
The share of securities lending income earned by the Portfolio is shown as securities lending income – affiliated – net in the Statement of Operations. For the six months ended March 31, 2017, the Portfolio paid BIM $4,624 for securities lending agent services.
Interfund Lending: In accordance with an exemptive order (the “Order”) from the U.S. Securities and Exchange Commission, the Portfolio may participate in a joint lending and borrowing facility for temporary purposes (the “Interfund Lending Program”), subject to compliance with the terms and conditions of the Order, and to the extent permitted by the Portfolio’s investment policies and restrictions. The Portfolio is currently permitted to borrow under the Interfund Lending Program.
| | | | | | |
| 38 | | BLACKROCK BALANCED CAPITAL FUND, INC. | | MARCH 31, 2017 | | |
| | | | |
| Notes to Financial Statements (continued) | | | Master Large Cap Core Portfolio | |
A lending BlackRock portfolio may lend in aggregate up to 15% of its net assets, but may not lend more than 5% of its net assets to any one borrowing portfolio through the Interfund Lending Program. A borrowing BlackRock portfolio may not borrow through the Interfund Lending Program or from any other source more than 33 1/3% of its total assets (or any lower threshold provided for by the portfolio’s investment restrictions). If a borrowing BlackRock portfolio’s total outstanding borrowings exceed 10% of its total assets, each of its outstanding interfund loans will be subject to collateralization of at least 102% of the outstanding principal value of the loan. All interfund loans are for temporary or emergency purposes and the interest rate to be charged will be the average of the highest current overnight repurchase agreement rate available to a lending portfolio and the bank loan rate, as calculated according to a formula established by the Board.
During the period ended March 31, 2017, the Portfolio did not participate in the Interfund Lending Program.
Officers and Directors: Certain officers and/or directors of the Master LLC are officers and/or directors of BlackRock or its affiliates.
The Portfolio may purchase securities from, or sell securities to, an affiliated fund provided the affiliation is due solely to having a common investment adviser, common officers, or common directors. For the six months ended March 31, 2017, the purchase and sale transactions and any net realized gains (losses) with an affiliated fund in compliance with Rule 17a-7 under the 1940 Act were as follows:
| | | | | | | | |
| | | Purchases | | | Sales | | Net Realized Gain (Loss) |
Master Large Cap Core Portfolio | | $ | 1,024,298 | | | — | | — |
7. Purchases and Sales:
Purchases and sales of investments, excluding short-term securities, for the year ended March 31, 2017, were $462,062,919 and $605,167,988, respectively.
The Portfolio received proceeds from settlement of litigation where they were able to recover a portion of investment losses previously realized by the Portfolio. This amount is shown as litigation proceeds in the Statement of Operations.
8. Income Tax Information
The Portfolio is classified as a partnership for U.S. federal income tax purposes. As such, each investor in the Portfolio is treated as the owner of its proportionate share of net assets, income, expenses and realized and unrealized gains and losses of the Portfolio. Therefore, no U.S. federal income tax provision is required. It is intended that the Portfolio’s assets will be managed so an investor in the Portfolio can satisfy the requirements of Subchapter M of the Internal Revenue Code of 1986, as amended.
The Portfolio files U.S. federal and various state and local tax returns. No income tax returns are currently under examination. The statute of limitations on the Portfolio’s U.S. federal tax returns generally remains open for each of the four years ended September 30, 2016. The statutes of limitations on the Portfolio’s state and local tax returns may remain open for an additional year depending upon the jurisdiction.
Management has analyzed tax laws and regulations and their application to the Portfolio as of March 31, 2017, inclusive of the open tax return years, and does not believe that there are any uncertain tax positions that require recognition of a tax liability in the Portfolio’s financial statements.
As of March 31, 2017, gross unrealized appreciation and depreciation based on cost for U.S. federal income tax purposes were as follows:
| | | | |
Tax cost | | $ | 1,633,905,787 | |
| | | | |
Gross unrealized appreciation | | $ | 626,785,073 | |
Gross unrealized depreciation | | | (36,334,150 | ) |
| | | | |
Net unrealized appreciation | | $ | 590,450,923 | |
9. Bank Borrowings:
The Master LLC, on behalf of the Portfolio, along with certain other funds managed by the Manager and its affiliates (“Participating Funds”), is a party to a 364-day, $2.1 billion credit agreement with a group of lenders. Under this agreement, the Portfolio may borrow to fund shareholder redemptions. Excluding commitments designated for certain individual funds, the Participating Funds, including the Portfolio, can borrow up to an aggregate commitment amount of $1.6 billion at any time outstanding, subject to asset coverage and other limitations as specified in the agreement. The credit agreement has the following terms: a fee of 0.12% per annum on unused commitment amounts and interest at a rate equal to the higher of (a) one-month LIBOR (but, in any event, not less than 0.00%) on the date the loan is made plus 0.80% per annum or (b) the Fed Funds rate (but, in any event, not less than 0.00%) in effect from time to time plus 0.80% per annum on amounts borrowed. The agreement expires in April 2017 unless extended or renewed. Participating Funds paid administration, legal and arrangement fees, which, if applicable, are included in miscellaneous expenses in the Statement of Operations. These fees were allocated among such funds based upon portions of the aggregate commitment available to them and relative net assets of Participating Funds. During the six months ended March 31, 2017, the Portfolio did not borrow under the credit agreement.
| | | | | | |
| | | BLACKROCK BALANCED CAPITAL FUND, INC. | | MARCH 31, 2017 | | 39 |
| | | | |
| Notes to Financial Statements (concluded) | | | Master Large Cap Core Portfolio | |
10. Principal Risks:
In the normal course of business, the Portfolio invests in securities and enters into transactions where risks exist due to fluctuations in the market (market risk) or failure of the issuer to meet all its obligations, including the ability to pay principal and interest when due (issuer credit risk). The value of securities held by the Portfolio may decline in response to certain events, including those directly involving the issuers of securities owned by the Portfolio. Changes arising from the general economy, the overall market and local, regional or global political and/or social instability, as well as currency, interest rate and price fluctuations, may also affect the securities’ value.
On October 11, 2016, BlackRock implemented certain changes required by amendments to Rule 2a-7 under the 1940 Act, which governs the operations of U.S. money market funds. The Portfolio may be exposed to additional risks when reinvesting cash collateral in money market funds that do not seek to maintain a stable NAV per share of $1.00 and which may be subject to redemption gates or liquidity fees under certain circumstances.
Valuation Risk: The market values of equities, such as common stocks and preferred securities or equity related investments, such as futures and options may decline due to general market conditions which are not specifically related to a particular company. They may also decline due to factors which affect a particular industry or industries. The Portfolio may invest in illiquid investments and may experience difficulty in selling those investments in a timely manner at the price that they believe the investments are worth. Prices may fluctuate widely over short or extended periods in response to company, market or economic news. Markets also tend to move in cycles, with periods of rising and falling prices. This volatility may cause the Portfolio’s NAV to experience significant increases or decreases over short periods of time. If there is a general decline in the securities and other markets, the NAV of the Portfolio may lose value, regardless of the individual results of the securities and other instruments in which the Portfolio invests.
Counterparty Credit Risk: Similar to issuer credit risk, the Portfolio may be exposed to counterparty credit risk, or the risk that an entity may fail to or be unable to perform on its commitments related to unsettled or open transactions. The Portfolio manages counterparty credit risk by entering into transactions only with counterparties that the Manager believes have the financial resources to honor their obligations and by monitoring the financial stability of those counterparties. Financial assets, which potentially expose the Portfolio to market, issuer and counterparty credit risks, consist principally of financial instruments and receivables due from counterparties. The extent of the Portfolio’s exposure to market, issuer and counterparty credit risks with respect to these financial assets is approximately their value recorded in the Statement of Assets and Liabilities, less any collateral held by the Portfolio.
A derivative contract may suffer a mark-to-market loss if the value of the contract decreases due to an unfavorable change in the market rates or values of the underlying instrument. Losses can also occur if the counterparty does not perform under the contract.
With futures, there is less counterparty credit risk to the Portfolio since the exchange or clearinghouse, as counterparty to such instruments, guarantees against a possible default. The clearinghouse stands between the buyer and the seller of the contract; therefore, credit risk is limited to failure of the clearinghouse. While offset rights may exist under applicable law, the Portfolio does not have a contractual right of offset against a clearing broker or clearinghouse in the event of a default (including the bankruptcy or insolvency). Additionally, credit risk exists in exchange-traded futures with respect to initial and variation margin that is held in a clearing broker’s customer accounts. While clearing brokers are required to segregate customer margin from their own assets, in the event that a clearing broker becomes insolvent or goes into bankruptcy and at that time there is a shortfall in the aggregate amount of margin held by the clearing broker for all its clients, typically the shortfall would be allocated on a pro rata basis across all the clearing broker’s customers, potentially resulting in losses to the Portfolio.
11. Subsequent Events:
Management’s evaluation of the impact of all subsequent events on the Portfolio’s financial statements was completed through the date the financial statements were issued and the following item was noted:
Effective April 20, 2017, the credit agreement was extended until April 2018 under the same terms.
| | | | | | |
| 40 | | BLACKROCK BALANCED CAPITAL FUND, INC. | | MARCH 31, 2017 | | |
| | | | |
| Officers and Directors of Master Large Cap Series LLC | | | | |
Rodney D. Johnson, Chair of the Board and Director
Susan J. Carter, Director
Collette Chilton, Director
Neil A. Cotty, Director
Cynthia A. Montgomery, Director
Barbara G. Novick, Director
Joseph P. Platt, Director
Robert C. Robb, Jr., Director
Mark Stalnecker, Director
Kenneth L. Urish, Director
Claire A. Walton, Director
Frederick W. Winter, Director
John M. Perlowski, Director, President and Chief Executive Officer
Jennifer McGovern, Vice President
Neal J. Andrews, Chief Financial Officer
Jay M. Fife, Treasurer
Charles Park, Chief Compliance Officer
Fernanda Piedra, Anti-Money Laundering Compliance Officer
Benjamin Archibald, Secretary
Effective December 31, 2016, David O. Beim and Dr. Matina S. Horner resigned as Directors of the Master LLC.
| | | | | | |
| | | | |
Investment Adviser BlackRock Advisors, LLC Wilmington, DE 19809 | | Accounting Agent and Transfer Agent BNY Mellon Investment Servicing (U.S.) Inc. Wilmington, DE 19809 | | Custodian Brown Brothers Harriman & Co. Boston, MA 02109 | | Address of the Master LLC 100 Bellevue Parkway Wilmington, DE 19809 |
| | | | | | |
Legal Counsel Sidley Austin LLP New York, NY 10019 | | Independent Registered Public Accounting Firm Deloitte & Touche LLP Philadelphia, PA 19103 | | Distributor BlackRock Investments, LLC New York, NY 10022 | | |
| | | | | | |
| | | BLACKROCK BALANCED CAPITAL FUND, INC. | | MARCH 31, 2017 | | 41 |
| | | | |
| Master Portfolio Information | | | Master Total Return Portfolio | |
| | | | | |
| Portfolio Composition | | Percent of
Total Investments1 |
U.S. Government Sponsored Agency Securities | | | | 46 | % |
Corporate Bonds | | | | 18 | |
U.S. Treasury Obligations | | | | 16 | |
Asset-Backed Securities | | | | 7 | |
Non-Agency Mortgage-Backed Securities | | | | 4 | |
Foreign Government Obligations | | | | 4 | |
Taxable Municipal Bonds | | | | 2 | |
Investment Companies | | | | 1 | |
Foreign Agency Obligations | | | | 1 | |
Other2 | | | | 1 | |
| | 1 | | Total investments exclude short-term securities, options purchased, options written, TBA sale commitments and borrowed bonds. |
| | 2 | | Includes common stock, floating rate loan interests, other interests and preferred securities, which are less than 1%. |
| | | | | |
| Credit Quality Allocation1 | | Percent of
Total Investments2 |
AAA/Aaa | | | | 67 | % |
AA/Aa | | | | 3 | |
A | | | | 9 | |
BBB/Baa | | | | 10 | |
BB/Ba | | | | 4 | |
B | | | | 3 | |
CCC/Caa | | | | 1 | |
N/R3 | | | | 3 | |
| | 1 | | For financial reporting purposes, credit quality ratings shown above reflect the highest rating assigned by either Standard & Poor’s (“S&P”) or Moody’s Investors Service if ratings differ. These rating agencies are independent, nationally recognized statistical rating organizations and are widely used. Investment grade ratings are credit ratings of BBB/Baa or higher. Below investment grade ratings are credit ratings of BB/Ba or lower. Investments designated N/R are not rated by either rating agency. Unrated investments do not necessarily indicate low credit quality. Credit quality ratings are subject to change. |
| | 2 | | Total investments exclude short-term securities, options purchased, options written, TBA sale commitments and borrowed bonds. |
| | 3 | | The investment adviser evaluates the credit quality of unrated investments based upon certain factors including, but not limited to, credit ratings for similar investments and financial analysis of sectors, individual investments and/or issuers. Using this approach, the investment adviser has deemed unrated U.S. Government Sponsored Agency Securities and U.S. Treasury Obligations to be of similar credit quality as investments rated AAA/Aaa. |
| | | | | | |
| 42 | | BLACKROCK BALANCED CAPITAL FUND, INC. | | MARCH 31, 2017 | | |
| | | | |
| Consolidated Schedule of Investments March 31, 2017 (Unaudited) | | | Master Total Return Portfolio | |
| | | (Percentages shown are based on Net Assets) | |
| | | | | | | | | | | | |
| Asset-Backed Securities | | | | | Par
(000) | | | Value | |
ACE Securities Corp. Home Equity Loan Trust: | | | | | | | | | | | | |
Series 2003-OP1, Class A2, 1.50%, 12/25/33 (a) | | | USD | | | | 581 | | | $ | 498,369 | |
Series 2006-CW1, Class A2C, 1.12%, 7/25/36 (a) | | | | | | | 786 | | | | 535,516 | |
Series 2007-HE4, Class A2A, 1.11%, 5/25/37 (a) | | | | | | | 3,096 | | | | 1,015,018 | |
Adagio IV CLO Ltd., Series IV-X, Class F, 6.65%, 10/15/29 (a) | | | EUR | | | | 400 | | | | 398,043 | |
Adagio V CLO DAC, Series V-X, Class E, 6.70%, 10/15/29 (a) | | | | | | | 340 | | | | 361,734 | |
Adirondack Park CLO Ltd., Series 2013-1A, Class B, 3.02%, 4/15/24 (a)(b) | | | USD | | | | 330 | | | | 330,252 | |
Ajax Mortgage Loan Trust: | | | | | | | | | | | | |
Series 2016-1, Class A,
4.25%, 7/25/47 (b)(c) | | | | | | | 2,599 | | | | 2,567,853 | |
Series 2016-B, Class A,
4.00%, 9/25/65 (b)(c) | | | | | | | 3,358 | | | | 3,351,204 | |
Series 2016-C, Class A,
4.00%, 10/25/57 (b)(c) | | | | | | | 2,281 | | | | 2,270,377 | |
Allegro CLO II Ltd., Series 2014-1A, Class A1R, 2.33%, 1/21/27 (a)(b) | | | | | | | 2,340 | | | | 2,340,538 | |
ALM V Ltd., Series 2012-5A, Class A2R, 3.17%, 10/18/27 (a)(b) | | | | | | | 1,600 | | | | 1,616,469 | |
ALM XII Ltd., Series 2015-12A, Class B, 4.27%, 4/16/27 (a)(b) | | | | | | | 1,505 | | | | 1,510,173 | |
ALM XIV Ltd.: | | | | | | | | | | | | |
Series 2014-14A, Class A1, 2.47%, 7/28/26 (a)(b) | | | | | | | 10,785 | | | | 10,786,117 | |
Series 2014-14A, Class B,
3.99%, 7/28/26 (a)(b) | | | | | | | 1,236 | | | | 1,236,246 | |
ALME Loan Funding V BV, Series 5X, Class E, 6.00%, 7/15/29 (a) | | | EUR | | | | 1,080 | | | | 1,133,842 | |
American Homes 4 Rent, Series 2014-SFR1, Class A, 1.77%, 6/17/31 (a)(b) | | | USD | | | | 1,997 | | | | 1,997,330 | |
AMMC CLO 17 Ltd., Series 2015-17A, Class B, 3.34%, 11/15/27 (a)(b) | | | | | | | 1,180 | | | | 1,189,997 | |
AMMC CLO 18 Ltd., Series 2016-18A, Class AL1, 2.62%, 5/26/28 (a)(b) | | | | | | | 5,320 | | | | 5,358,591 | |
AMMC CLO 19 Ltd., Series 2016-19A, Class C, 3.68%, 10/15/28 (a)(b) | | | | | | | 720 | | | | 727,848 | |
| | | | | | | | | | | | |
| Asset-Backed Securities | | | | | Par
(000) | | | Value | |
AMMC CLO IX Ltd.: | | | | | | | | | | | | |
Series 2011-9A, Class B1R,
3.52%, 1/15/22 (a)(b) | | | USD | | | | 8,590 | | | $ | 8,651,671 | |
Series 2011-9A, Class CR,
4.62%, 1/15/22 (a)(b) | | | | | | | 2,490 | | | | 2,496,694 | |
AMMC CLO XII Ltd., Series 2013-12A, Class B, 2.93%, 5/10/25 (a)(b) | | | | | | | 1,612 | | | | 1,612,656 | |
Anchorage Capital CLO 3 Ltd.: | | | | | | | | | | | | |
Series 2014-3A, Class A2AR,
3.09%, 4/28/26 (a)(b) | | | | | | | 1,620 | | | | 1,619,960 | |
Series 2014-3A, Class BR,
3.69%, 4/28/26 (a)(b) | | | | | | | 500 | | | | 501,375 | |
Anchorage Capital CLO 6 Ltd., Series 2015-6A, Class A1, 2.56%, 4/15/27 (a)(b) | | | | | | | 2,020 | | | | 2,031,209 | |
Anchorage Capital CLO Ltd.: | | | | | | | | | | | | |
Series 2013-1A, Class A1, 2.21%, 7/13/25 (a)(b) | | | | | | | 2,005 | | | | 2,006,072 | |
Series 2013-1A, Class A2A,
2.77%, 7/13/25 (a)(b) | | | | | | | 1,050 | | | | 1,051,443 | |
Series 2013-1A, Class B, 3.72%, 7/13/25 (a)(b) | | | | | | | 1,410 | | | | 1,416,403 | |
Apidos CLO IX, Series 2012-9AR, Class BR, 2.87%, 7/15/23 (a)(b) | | | | | | | 3,035 | | | | 3,036,308 | |
Apidos CLO XII, Series 2013-12A, Class A, 2.12%, 4/15/25 (a)(b) | | | | | | | 18,861 | | | | 18,885,519 | |
Apidos CLO XV, Series 2013-15A, Class A1R, 1.97%, 10/20/25 (a)(b) | | | | | | | 1,080 | | | | 1,080,000 | |
Apidos CLO XVI, Series 2013-16A, Class A1, 2.47%, 1/19/25 (a)(b) | | | | | | | 2,965 | | | | 2,973,955 | |
Apidos CLO XVIII, Series 2014-18A, Class A1, 2.45%, 7/22/26 (a)(b) | | | | | | | 880 | | | | 880,019 | |
Apidos CLO XX, Series 2015-20A, Class A1R, 2.35%, 1/16/27 (a)(b) | | | | | | | 1,750 | | | | 1,753,371 | |
Arbor Realty CLO Ltd., Series 2015-FL2A, Class A, 2.52%, 9/15/25 (a)(b) | | | | | | | 2,220 | | | | 2,225,550 | |
Arbor Realty Commercial Real Estate Notes Ltd., Series 2016-FL1A, Class A, 2.47%, 9/15/26 (a)(b) | | | | | | | 3,940 | | | | 3,940,000 | |
Arbour CLO IV DAC: | | | | | | | | | | | | |
Series 4X, Class E, 5.60%, 1/15/30 (a) | | | EUR | | | | 550 | | | | 576,495 | |
Series 4X, Class F, 8.15%, 1/15/30 (a) | | | | | | | 450 | | | | 468,009 | |
| | | | | | | | | | |
| Portfolio Abbreviations |
| ABS | | Asset-Backed Security | | EUR | | Euro | | PLN | | Polish Zloty |
| ADR | | American Depositary Receipt | | FKA | | Formerly Known As | | RB | | Revenue Bonds |
| AGM | | Assured Guaranty Municipal Corp. | | GBP | | British Pound | | REIT | | Real Estate Investment Trust |
| AKA | | Also Known As | | GO | | General Obligation | | REMIC | | Real Estate Mortgage Investment Conduit |
| AMBAC | | American Municipal Bond Assurance Corporation | | HKD | | Hong Kong Dollar | | RUB | | Russian Ruble |
| AUD | | Australian Dollar | | HUF | | Hungarian Forint | | S&P | | Standard & Poor’s |
| BRL | | Brazilian Real | | INR | | Indian Rupee | | SEK | | Swedish Krona |
| BZDIOVER | | Overnight Brazil CETIP - Interbank Rate | | JPY | | Japanese Yen | | SGD | | Singapore Dollar |
| CAD | | Canadian Dollar | | KRW | | South Korean Won | | SPDR | | Standard & Poor’s Depositary Receipts |
| CBOE | | Chicago Board Options Exchange | | LIBOR | | London Interbank Offered Rate | | TBA | | To-be-announced |
| CDO | | Collateralized Debt Obligation | | MXIBTIIE | | Mexico Interbank TIIE 28-Day Rate | | TRY | | Turkish Lira |
| CHF | | Swiss Franc | | MXN | | Mexican Peso | | TWD | | Taiwan New Dollar |
| CLO | | Collateralized Loan Obligation | | NOK | | Norwegian Krone | | UK RPI | | United Kingdom Retail Price Index |
| CLP | | Chilean Peso | | NZD | | NewZealandDollar | | USD | | U.S. Dollar |
| CNH | | Chinese Yuan Offshore | | OTC | | Over-the-counter | | WTI | | West Texas Intermediate |
| COP | | Columbian Peso | | PIK | | Payment-in-kind | | ZAR | | South African Rand |
| ETF | | Exchange-Traded Fund | | | | | | | | |
See Notes to Consolidated Financial Statements.
| | | | | | |
| | | BLACKROCK BALANCED CAPITAL FUND, INC. | | MARCH 31, 2017 | | 43 |
| | | | |
| Consolidated Schedule of Investments (continued) | | | Master Total Return Portfolio | |
| | | | |
| | | | | | | | | | | | |
| Asset-Backed Securities | | | | | Par
(000) | | | Value | |
Arbour CLO Ltd.: | | | | | | | | | | | | |
Series 2014-1X, Class E, 5.00%, 6/16/27 (a) | | | EUR | | | | 238 | | | $ | 250,850 | |
Series 2014-1X, Class F, 5.75%, 7/15/27 (a) | | | | | | | 336 | | | | 328,520 | |
ARES CLO Ltd.: | | | | | | | | | | | | |
Series 2012-2A, Class AR, 2.31%, 10/12/23 (a)(b) | | | USD | | | | 871 | | | | 870,854 | |
Series 2012-2A, Class CR, 3.72%, 10/12/23 (a)(b) | | | | | | | 300 | | | | 300,598 | |
ARES IIIR/IVR CLO Ltd., Series 2007-3RA, Class A2, 1.24%, 4/16/21 (a)(b) | | | | | | | 624 | | | | 624,343 | |
ARES XXV CLO Ltd.: | | | | | | | | | | | | |
Series 2012-3A, Class BR, 2.77%, 1/17/24 (a)(b) | | | | | | | 7,230 | | | | 7,229,596 | |
Series 2012-3A, Class CR, 3.52%, 1/17/24 (a)(b) | | | | | | | 2,110 | | | | 2,116,423 | |
ARES XXVIII CLO Ltd.: | | | | | | | | | | | | |
Series 2013-3A, Class B1R,
0.00%, 10/17/24 (a)(b) | | | | | | | 2,150 | | | | 2,150,000 | |
Series 2013-3A, Class C1R,
0.00%, 10/17/24 (a)(b) | | | | | | | 1,850 | | | | 1,850,000 | |
ARES XXXIII CLO Ltd.: | | | | | | | | | | | | |
Series 2015-1A, Class A2R,
3.05%, 12/05/25 (a)(b) | | | | | | | 1,420 | | | | 1,417,202 | |
Series 2015-1A, Class B2R,
3.94%, 12/05/25 (a)(b) | | | | | | | 500 | | | | 501,250 | |
Argent Mortgage Loan Trust, Series 2005-W1, Class A2, 1.46%, 5/25/35 (a) | | | | | | | 5,365 | | | | 4,273,638 | |
Arianna SPV Srl, Series 1, Class A, 3.60%, 10/20/30 | | | EUR | | | | 338 | | | | 363,583 | |
Atlas Senior Loan Fund III Ltd., Series 2013-1A, Class B, 2.74%, 8/18/25 (a)(b) | | | USD | | | | 750 | | | | 744,816 | |
Atlas Senior Loan Fund IV Ltd., Series 2013-2A, Class A1L, 2.54%, 2/17/26 (a)(b) | | | | | | | 7,030 | | | | 7,030,095 | |
Atlas Senior Loan Fund V Ltd.: | | | | | | | | | | | | |
Series 2014-1A, Class AR, 2.45%, 7/16/26 (a)(b) | | | | | | | 1,630 | | | | 1,633,135 | |
Series 2014-1A, Class BR, 3.02%, 7/16/26 (a)(b) | | | | | | | 2,370 | | | | 2,368,887 | |
Atlas Senior Loan Fund VI Ltd., Series 2014-6A, Class CR, 3.38%, 10/15/26 (a)(b) | | | | | | | 930 | | | | 932,889 | |
Atrium XII, Series 12A, Class C, 4.09%, 10/22/26 (a)(b) | | | | | | | 881 | | | | 885,031 | |
Aurium CLO III DAC: | | | | | | | | | | | | |
Series 3X, Class E, 0.00%, 4/15/30 (a) | | | EUR | | | | 100 | | | | 101,346 | |
Series 3X, Class F, 0.00%, 4/15/30 (a) | | | | | | | 100 | | | | 97,719 | |
Avoca CLO XIII Ltd., Series 13X, Class E,
5.17%, 12/29/27 (a) | | | | | | | 430 | | | | 454,478 | |
Avoca CLO XIV Ltd.: | | | | | | | | | | | | |
Series 14X, Class E, 4.75%, 7/12/28 (a) | | | | | | | 490 | | | | 501,924 | |
Series 14X, Class F, 5.75%, 7/12/28 (a) | | | | | | | 900 | | | | 866,412 | |
Series 14X, Class SUB, 0.00%, 7/12/28 | | | | | | | 1,290 | | | | 1,234,841 | |
Avoca CLO XV Ltd.: | | | | | | | | | | | | |
Series 15X, Class E, 5.00%, 1/15/29 (a) | | | | | | | 970 | | | | 995,285 | |
Series 15X, Class F, 6.75%, 1/15/29 (a) | | | | | | | 585 | | | | 587,677 | |
Series 15X, Class M1, 0.00%, 1/15/29 (a) | | | | | | | 1,100 | | | | 1,082,540 | |
Avoca CLO XVII DAC, Series 17X, Class E,
5.95%, 1/15/30 (a) | | | | | | | 546 | | | | 580,650 | |
B2R Mortgage Trust: | | | | | | | | | | | | |
Series 2015-1, Class A1, 2.52%, 5/15/48 (b) | | | USD | | | | 899 | | | | 887,815 | |
Series 2015-2, Class A, 3.34%, 11/15/48 (b) | | | | | | | 1,197 | | | | 1,203,553 | |
Babson CLO Ltd.: | | | | | | | | | | | | |
Series 2012-2A, Class A1R, 2.28%, 5/15/23 (a)(b) | | | | | | | 384 | | | | 384,361 | |
| | | | | | | | | | | | |
| Asset-Backed Securities | | | | | Par
(000) | | | Value | |
Series 2013-IA, Class A, 2.13%, 4/20/25 (a)(b) | | | USD | | | | 4,560 | | | $ | 4,564,657 | |
Ballyrock CLO Ltd., Series 2016-1A, Class A,
2.41%, 10/15/28 (a)(b) | | | | | | | 1,935 | | | | 1,959,152 | |
BankAmerica Manufactured Housing Contract Trust, Series 1998-2, Class B1, 7.94%, 12/10/25 (a) | | | | | | | 2,790 | | | | 2,285,091 | |
Battalion CLO IV Ltd.: | | | | | | | | | | | | |
Series 2013-4A, Class A1,
2.44%, 10/22/25 (a)(b) | | | | | | | 4,715 | | | | 4,714,972 | |
Series 2013-4A, Class A1R,
0.00%, 10/22/25 (a)(b) | | | | | | | 4,715 | | | | 4,715,000 | |
Bayview Financial Revolving Asset Trust: | | | | | | | | | | | | |
Series 2004-B, Class A1, 1.98%, 5/28/39 (a)(b) | | | | | | | 8,067 | | | | 5,812,392 | |
Series 2005-E, Class A1, 1.78%, 12/28/40 (a)(b) | | | | | | | 1,734 | | | | 1,448,578 | |
Bayview Opportunity Master Fund IIIB RPL Trust, Series 2015-3, Class A1, 3.62%, 4/28/30 (b)(c) | | | | | | | 429 | | | | 431,318 | |
BCMSC Trust: | | | | | | | | | | | | |
Series 1999-A, Class M1, 6.79%, 3/15/29 (a) | | | | | | | 656 | | | | 556,499 | |
Series 2000-A, Class A2, 7.58%, 6/15/30 (a) | | | | | | | 1,675 | | | | 743,836 | |
Series 2000-A, Class A3, 7.83%, 6/15/30 (a) | | | | | | | 1,555 | | | | 713,407 | |
Series 2000-A, Class A4, 8.29%, 6/15/30 (a) | | | | | | | 2,662 | | | | 1,292,865 | |
Bear Stearns Asset-Backed Securities I Trust: | | | | | | | | | | | | |
Series 2006-HE7, Class 1A2, 1.15%, 9/25/36 (a) | | | | | | | 4,832 | | | | 4,839,122 | |
Series 2006-HE9, Class 2A, 1.12%, 11/25/36 (a) | | | | | | | 4,427 | | | | 3,842,262 | |
Series 2007-AQ2, Class A2, 1.15%, 1/25/37 (a) | | | | | | | 1,630 | | | | 1,568,741 | |
Series 2007-FS1, Class 1A3, 1.15%, 5/25/35 (a) | | | | | | | 1,229 | | | | 1,068,905 | |
Series 2007-HE1, Class 21A2, 1.14%, 1/25/37 (a) | | | | | | | 1,009 | | | | 939,308 | |
Series 2007-HE2, Class 22A, 1.12%, 3/25/37 (a) | | | | | | | 1,283 | | | | 1,036,700 | |
Series 2007-HE2, Class 23A, 1.12%, 3/25/37 (a) | | | | | | | 2,571 | | | | 2,018,620 | |
Series 2007-HE3, Class 1A4, 1.33%, 4/25/37 (a) | | | | | | | 6,568 | | | | 4,128,446 | |
Bear Stearns Asset-Backed Securities Trust, Series 2005-4, Class M2, 2.18%, 1/25/36 (a) | | | | | | | 648 | | | | 619,960 | |
Bear Stearns Second Lien Trust, | | | | | | | | | | | | |
Series 2007-SV1A, Class M1,
2.18%, 12/25/36 (a)(b) | | | | | | | 1,200 | | | | 1,147,691 | |
Benefit Street Partners CLO II Ltd., Series 2013-IIA, Class A1, 2.22%, 7/15/24 (a)(b) | | | | | | | 2,090 | | | | 2,090,386 | |
Benefit Street Partners CLO IV Ltd., Series 2014-IVA, Class A1R, 2.23%, 1/20/29 (a)(b) | | | | | | | 4,020 | | | | 4,047,613 | |
Benefit Street Partners CLO Ltd., Series 2012-IA, Class A2R, 3.27%, 10/15/25 (a)(b) | | | | | | | 7,450 | | | | 7,497,124 | |
Benefit Street Partners CLO VIII Ltd., Series 2015-8A, Class A2, 3.28%, 1/20/28 (a)(b) | | | | | | | 3,990 | | | | 4,042,032 | |
Betony CLO Ltd., Series 2015-1A, Class CR, 3.87%, 4/15/27 (a)(b) | | | | | | | 1,230 | | | | 1,235,184 | |
BlueMountain CLO II Ltd., Series 2006-2A, Class B, 1.49%, 7/15/18 (a)(b) | | | | | | | 680 | | | | 679,308 | |
See Notes to Consolidated Financial Statements.
| | | | | | |
| 44 | | BLACKROCK BALANCED CAPITAL FUND, INC. | | MARCH 31, 2017 | | |
| | | | |
| Consolidated Schedule of Investments (continued) | | | Master Total Return Portfolio | |
| | | | |
| | | | | | | | | | | | |
| Asset-Backed Securities | | | | | Par
(000) | | | Value | |
BlueMountain CLO Ltd.: | | | | | | | | | | | | |
Series 2012-1A, Class B, 3.58%, 7/20/23 (a)(b) | | | USD | | | | 580 | | | $ | 581,957 | |
Series 2012-1A, Class C, 4.28%, 7/20/23 (a)(b) | | | | | | | 350 | | | | 350,492 | |
Series 2013-2A, Class A, 2.24%, 1/22/25 (a)(b) | | | | | | | 850 | | | | 850,779 | |
Series 2013-3A, Class A, 2.44%, 10/29/25 (a)(b) | | | | | | | 2,480 | | | | 2,486,185 | |
Series 2013-4A, Class A, 2.52%, 4/15/25 (a)(b) | | | | | | | 7,590 | | | | 7,590,307 | |
Series 2013-4A, Class AR, 2.17%, 4/15/25 (a)(b) | | | | | | | 7,590 | | | | 7,590,000 | |
Series 2014-1A, Class A1R, 2.28%, 4/30/26 (a)(b) | | | | | | | 2,400 | | | | 2,408,734 | |
Series 2014-2A, Class A, 2.49%, 7/20/26 (a)(b) | | | | | | | 670 | | | | 671,780 | |
Series 2014-4A, Class A1R,
2.40%, 11/30/26 (a)(b) | | | | | | | 3,020 | | | | 3,020,302 | |
Series 2015-3A, Class A1, 2.51%, 10/20/27 (a)(b) | | | | | | | 2,000 | | | | 2,006,156 | |
BlueMountain EUR CLO DAC, Series 2016-1X, Class E, 6.60%, 4/25/30 (a) | | | EUR | | | | 1,200 | | | | 1,257,517 | |
Cadogan Square CLO VII BV, Series 7X, Class E,
6.00%, 5/25/29 (a) | | | | | | | 1,000 | | | | 1,058,348 | |
Cairn CLO VI BV, Series 2016-6X, Class E,
6.25%, 7/25/29 (a) | | | | | | | 600 | | | | 631,990 | |
Canyon Capital CLO Ltd., Series 2006-1A, Class A1, 1.21%, 12/15/20 (a)(b) | | | USD | | | | 1,159 | | | | 1,151,780 | |
Carlyle Global Market Strategies CLO Ltd.: | | | | | | | | | | | | |
Series 2012-2A, Class B1R, 3.13%, 7/20/23 (a)(b) | | | | | | | 2,880 | | | | 2,891,372 | |
Series 2012-4A, Class AR, 2.48%, 1/20/29 (a)(b) | | | | | | | 6,630 | | | | 6,664,179 | |
Series 2013-3A, Class B, 3.67%, 7/15/25 (a)(b) | | | | | | | 730 | | | | 732,287 | |
Series 2013-4A, Class A1, 2.49%, 10/15/25 (a)(b) | | | | | | | 1,630 | | | | 1,634,041 | |
Series 2014-1A, Class CR, 3.77%, 4/17/25 (a)(b) | | | | | | | 1,740 | | | | 1,747,584 | |
Series 2014-3A, Class BR, 3.30%, 2/24/29 | | | | | | | 750 | | | | 750,000 | |
Carlyle Global Market Strategies Euro CLO: | | | | | | | | | | | | |
Series 2015-2X, Class D, 5.50%, 9/21/29 (a) | | | EUR | | | | 400 | | | | 420,182 | |
Series 2015-2X, Class E, 6.50%, 9/21/29 (a) | | | | | | | 370 | | | | 371,813 | |
Series 2015-3X, Class D, 5.55%, 1/15/29 (a) | | | | | | | 1,200 | | | | 1,262,221 | |
Carrington Mortgage Loan Trust: | | | | | | | | | | | | |
Series 2006-FRE2, Class A2, 1.10%, 10/25/36 (a) | | | USD | | | | 1,192 | | | | 781,462 | |
Series 2006-FRE2, Class A3, 1.14%, 10/25/36 (a) | | | | | | | 3,966 | | | | 2,613,456 | |
Series 2006-FRE2, Class A5, 1.06%, 10/25/36 (a) | | | | | | | 1,006 | | | | 656,628 | |
Series 2006-NC2, Class A3, 1.13%, 6/25/36 (a) | | | | | | | 5,716 | | | | 5,424,885 | |
Series 2006-NC3, Class A4, 1.22%, 8/25/36 (a) | | | | | | | 2,003 | | | | 1,223,415 | |
Series 2006-NC4, Class A3, 0.94%, 10/25/36 (a) | | | | | | | 1,180 | | | | 860,615 | |
Series 2006-NC5, Class A3, 0.93%, 1/25/37 (a) | | | | | | | 7,250 | | | | 4,878,291 | |
Series 2006-NC5, Class A5, 1.04%, 1/25/37 (a) | | | | | | | 463 | | | | 374,880 | |
Series 2007-HE1, Class A2, 1.13%, 6/25/37 (a) | | | | | | | 1,178 | | | | 1,099,906 | |
| | | | | | | | | | | | |
| Asset-Backed Securities | | | | | Par
(000) | | | Value | |
Series 2007-RFC1, Class A4, 1.20%, 12/25/36 (a) | | | USD | | | | 1,440 | | | $ | 946,019 | |
Catamaran CLO Ltd., Series 2012-1A, Class BR, 2.87%, 12/20/23 (a)(b) | | | | | | | 2,830 | | | | 2,826,837 | |
C-BASS Trust: | | | | | | | | | | | | |
Series 2006-CB7, Class A4,
1.14%, 10/25/36 (a) | | | | | | | 785 | | | | 540,522 | |
Series 2006-CB9, Class A2,
1.09%, 11/25/36 (a) | | | | | | | 1,302 | | | | 752,293 | |
Series 2006-CB9, Class A4,
1.21%, 11/25/36 (a) | | | | | | | 219 | | | | 129,194 | |
Series 2007-CB1, Class AF2,
3.85%, 1/25/37 (c) | | | | | | | 6,440 | | | | 2,790,284 | |
Series 2007-CB5, Class A2,
1.15%, 4/25/37 (a) | | | | | | | 1,208 | | | | 902,760 | |
Cedar Funding IV CLO Ltd., Series 2014-4A, Class A1, 2.54%, 10/23/26 (a)(b) | | | | | | | 1,200 | | | | 1,199,949 | |
Cedar Funding V CLO Ltd., Series 2016-5A, Class A1, 2.63%, 7/17/28 (a)(b) | | | | | | | 1,880 | | | | 1,892,486 | |
CHLUPA Trust, Series 2013-VM, Class A, 3.33%, 8/15/20 (b) | | | | | | | 374 | | | | 373,867 | |
CIFC Funding Ltd.: | | | | | | | | | | | | |
Series 2012-2A, Class A1R, 2.46%, 12/05/24 (a)(b) | | | | | | | 3,754 | | | | 3,755,168 | |
Series 2012-3A, Class A3R, 3.74%, 1/29/25 (a)(b) | | | | | | | 1,340 | | | | 1,343,290 | |
Series 2013-1A, Class A2,
2.92%, 4/16/25 (a)(b) | | | | | | | 4,440 | | | | 4,444,626 | |
Series 2013-4A, Class B1R,
0.00%, 11/27/24 (a)(b) | | | | | | | 4,270 | | | | 4,270,000 | |
Series 2014-1A, Class A,
2.52%, 4/18/25 (a)(b) | | | | | | | 1,720 | | | | 1,723,962 | |
Series 2014-2A, Class A1LR,
2.23%, 5/24/26 (a)(b) | | | | | | | 8,484 | | | | 8,484,000 | |
Series 2014-3A, Class B1,
2.88%, 7/22/26 (a)(b) | | | | | | | 710 | | | | 711,870 | |
Series 2014-3A, Class C1,
3.84%, 7/22/26 (a)(b) | | | | | | | 1,120 | | | | 1,124,871 | |
Series 2014-4A, Class A1R, 2.38%, 10/17/26 (a)(b) | | | | | | | 6,270 | | | | 6,291,514 | |
Series 2014-5A, Class A1R, 2.42%, 1/17/27 (a)(b) | | | | | | | 15,535 | | | | 15,586,865 | |
Series 2014-5A, Class CR,
3.72%, 1/17/27 (a)(b) | | | | | | | 710 | | | | 713,342 | |
Series 2015-1A, Class A1R, 2.09%, 1/22/27 (a)(b) | | | | | | | 1,520 | | | | 1,521,976 | |
Series 2015-3A, Class A,
2.44%, 10/19/27 (a)(b) | | | | | | | 3,160 | | | | 3,160,062 | |
Citigroup Mortgage Loan Trust, Series 2006-NC1, Class A2D, 1.03%, 8/25/36 (a) | | | | | | | 3,550 | | | | 2,809,503 | |
Colony American Homes, Series 2015-1A, Class A, 1.97%, 7/17/32 (a)(b) | | | | | | | 8,396 | | | | 8,420,199 | |
Conseco Finance Securitizations Corp.: | | | | | | | | | | | | |
Series 2000-1, Class A5, 8.06%, 9/01/29 | | | | | | | 1,665 | | | | 968,997 | |
Series 2000-4, Class A5, 7.97%, 3/01/25 | | | | | | | 5,592 | | | | 3,053,072 | |
Series 2000-4, Class A6, 8.31%, 5/01/32 (a) | | | | | | | 1,404 | | | | 797,973 | |
Series 2000-5, Class A6, 7.96%, 5/01/31 | | | | | | | 2,467 | | | | 1,735,975 | |
Series 2000-5, Class A7, 8.20%, 5/01/31 | | | | | | | 4,501 | | | | 3,247,187 | |
Conseco Financial Corp.: | | | | | | | | | | | | |
Series 1997-3, Class M1, 7.53%, 3/15/28 (a) | | | | | | | 2,197 | | | | 2,175,310 | |
See Notes to Consolidated Financial Statements.
| | | | | | |
| | | BLACKROCK BALANCED CAPITAL FUND, INC. | | MARCH 31, 2017 | | 45 |
| | | | |
| Consolidated Schedule of Investments (continued) | | | Master Total Return Portfolio | |
| | | | |
| | | | | | | | | | | | |
| Asset-Backed Securities | | | | | Par
(000) | | | Value | |
Series 1997-6, Class M1, 7.21%, 1/15/29 (a) | | | USD | | | | 470 | | | $ | 461,185 | |
Series 1998-4, Class M1, 6.83%, 4/01/30 (a) | | | | | | | 364 | | | | 311,545 | |
Series 1998-8, Class A1, 6.28%, 9/01/30 | | | | | | | 1,453 | | | | 1,525,673 | |
Series 1998-8, Class M1, 6.98%, 9/01/30 (a) | | | | | | | 2,922 | | | | 2,391,338 | |
Series 1999-5, Class A5, 7.86%, 3/01/30 (a) | | | | | | | 1,730 | | | | 1,402,307 | |
Series 1999-5, Class A6, 7.50%, 3/01/30 (a) | | | | | | | 1,266 | | | | 994,373 | |
Countrywide Asset-Backed Certificates: | | | | | | | | | | | | |
Series 2003-BC3, Class A2, 1.40%, 9/25/33 (a) | | | | | | | 672 | | | | 633,920 | |
Series 2004-5, Class A, 1.68%, 10/25/34 (a) | | | | | | | 752 | | | | 723,195 | |
Series 2006-17, Class 2A2, 1.13%, 3/25/47 (a) | | | | | | | 400 | | | | 373,407 | |
Series 2006-8, Class 2A3, 0.94%, 1/25/46 (a) | | | | | | | 1,099 | | | | 1,043,781 | |
Series 2006-S10, Class A3, 1.10%, 10/25/36 (a) | | | | | | | 10,716 | | | | 9,327,904 | |
Series 2006-S3, Class A4, 6.41%, 1/25/29 (c) | | | | | | | 883 | | | | 879,005 | |
Series 2006-SPS1, Class A, 1.00%, 12/25/25 (a) | | | | | | | 324 | | | | 343,907 | |
Series 2007-S3, Class A3, 1.16%, 5/25/37 (a) | | | | | | | 3,554 | | | | 2,921,399 | |
Credit Suisse First Boston Mortgage Securities Corp., Series 2001-MH29, Class B1, 8.10%, 9/25/31 (a) | | | | | | | 1,750 | | | | 1,903,822 | |
Credit-Based Asset Servicing & Securitization LLC: | | | | | | | | | | | | |
Series 2006-CB2, Class AF4, 3.46%, 12/25/36 (c) | | | | | | | 619 | | | | 450,542 | |
Series 2006-MH1, Class B1, 6.25%, 10/25/36 (b)(c) | | | | | | | 852 | | | | 884,632 | |
Series 2006-SL1, Class A2,
5.56%, 9/25/36 (b)(c) | | | | | | | 3,459 | | | | 818,854 | |
Series 2007-CB6, Class A4,
1.32%, 7/25/37 (a)(b) | | | | | | | 854 | | | | 548,059 | |
Series 2007-RP1, Class A,
1.29%, 5/25/46 (a)(b) | | | | | | | 778 | | | | 637,692 | |
CVC Cordatus Loan Fund VII DAC, Series 7X, Class E, 7.00%, 8/15/29 (a) | | | EUR | | | | 560 | | | | 606,652 | |
CVC Cordatus Loan Fund VIII DAC: | | | | | | | | | | | | |
Series 8X, Class E, 5.70%, 4/23/30 (a) | | | | | | | 300 | | | | 313,640 | |
Series 8X, Class F, 7.65%, 4/23/20 (a) | | | | | | | 200 | | | | 199,492 | |
CWABS Asset-Backed Certificates Trust, Series 2006-11, Class 3AV2, 1.14%, 9/25/46 (a) | | | USD | | | | 404 | | | | 378,581 | |
CWABS Revolving Home Equity Loan Trust, Series 2004-U, Class 2A, 1.18%, 3/15/34 (a) | | | | | | | 1,641 | | | | 1,319,753 | |
CWHEQ Home Equity Loan Trust: | | | | | | | | | | | | |
Series 2006-S5, Class A4, 5.84%, 6/25/35 | | | | | | | 993 | | | | 1,027,785 | |
Series 2006-S5, Class A5, 6.16%, 6/25/35 | | | | | | | 712 | | | | 711,979 | |
Series 2007-S1, Class A3, 5.81%, 11/25/36 (a) | | | | | | | 1,849 | | | | 1,834,872 | |
CWHEQ Revolving Home Equity Loan Resuritization Trust: | | | | | | | | | | | | |
Series 2006-RES, Class 4Q1B, 1.21%, 12/15/33 (a)(b) | | | | | | | 1,504 | | | | 1,300,880 | |
Series 2006-RES, Class 5B1B, 1.10%, 5/15/35 (a)(b) | | | | | | | 533 | | | | 446,097 | |
CWHEQ Revolving Home Equity Loan Trust, Series 2005-B, Class 2A, 1.09%, 5/15/35 (a) | | | | | | | 1,320 | | | | 1,146,260 | |
| | | | | | | | | | | | |
| Asset-Backed Securities | | | | | Par
(000) | | | Value | |
DCP Rights LLC, Series 2014-1A, Class A, 5.46%, 10/25/44 (b) | | | USD | | | | 7,971 | | | $ | 7,986,179 | |
Dryden 34 Senior Loan Fund, Series 2014-34A, Class AR, 0.00%, 10/15/26 (a)(b) | | | | | | | 1,250 | | | | 1,250,000 | |
Dryden 41 Senior Loan Fund, Series 2015-41A, Class A, 2.52%, 1/15/28 (a)(b) | | | | | | | 2,250 | | | | 2,258,900 | |
Dryden 46 Euro CLO BV, Series 2016-46X, Class E, 5.75%, 1/15/30 (a) | | | EUR | | | | 364 | | | | 381,257 | |
Dryden XXV Senior Loan Fund: | | | | | | | | | | | | |
Series 2012-25A, Class AR, 2.22%, 1/15/25 (a)(b) | | | USD | | | | 9,270 | | | | 9,271,921 | |
Series 2012-25A, Class CR, 3.52%, 1/15/25 (a)(b) | | | | | | | 670 | | | | 671,828 | |
Dryden XXVIII Senior Loan Fund, Series 2013-28A, Class A1L, 2.14%, 8/15/25 (a)(b) | | | | | | | 2,090 | | | | 2,093,362 | |
ECP CLO Ltd., Series 2012-4A, Class A1,
2.50%, 6/19/24 (a)(b) | | | | | | | 1,553 | | | | 1,553,586 | |
Euro-Galaxy IV CLO BV: | | | | | | | | | | | | |
Series 2015-4X, Class D, 3.35%, 7/30/28 (a) | | | EUR | | | | 270 | | | | 286,447 | |
Series 2015-4X, Class E, 4.50%, 7/30/28 (a) | | | | | | | 165 | | | | 166,336 | |
Series 2015-4X, Class F, 6.25%, 7/30/28 (a) | | | | | | | 380 | | | | 369,090 | |
Euro-Galaxy V CLO BV, Series 2016-5X, Class E,
6.30%, 11/10/30 (a) | | | | | | | 400 | | | | 429,372 | |
Fannie Mae REMIC Trust, Series 2003-W5, Class A, 1.20%, 4/25/33 (a) | | | USD | | | | 3 | | | | 2,986 | |
Finn Square CLO Ltd.: | | | | | | | | | | | | |
Series 2012-1A, Class A1R,
2.21%, 12/24/23 (a)(b) | | | | | | | 821 | | | | 821,120 | |
Series 2012-1A, Class A2R,
2.86%, 12/24/23 (a)(b) | | | | | | | 880 | | | | 871,329 | |
First Franklin Mortgage Loan Trust, Series 2006-FF5, Class 2A3, 1.14%, 4/25/36 (a) | | | | | | | 1,393 | | | | 1,265,095 | |
Flatiron CLO Ltd., Series 2011-1A, Class A,
2.57%, 1/15/23 (a)(b) | | | | | | | 602 | | | | 602,089 | |
Fraser Sullivan CLO VII Ltd.: | | | | | | | | | | | | |
Series 2012-7A, Class A1R, 2.11%, 4/20/23 (a)(b) | | | | | | | 1,789 | | | | 1,789,014 | |
Series 2012-7A, Class A2R, 2.83%, 4/20/23 (a)(b) | | | | | | | 3,500 | | | | 3,496,144 | |
Series 2012-7A, Class BR, 3.53%, 4/20/23 (a)(b) | | | | | | | 2,870 | | | | 2,874,167 | |
Galaxy XV CLO Ltd., Series 2013-15A, Class A, 2.27%, 4/15/25 (a)(b) | | | | | | | 1,350 | | | | 1,350,411 | |
Galaxy XVI CLO Ltd., Series 2013-16A, Class CR,
3.40%, 11/16/25 (a)(b) | | | | | | | 1,000 | | | | 999,500 | |
GE-WMC Asset-Backed Pass-Through Certificates,
Series 2005-2, Class A2C, 1.23%, 12/25/35 (a) | | | | | | | 733 | | | | 699,945 | |
GMACM Home Equity Loan Trust, Series 2006-HE4,
Class A2, 1.16%, 12/25/36 (a) | | | | | | | 194 | | | | 181,392 | |
Greenpoint Manufactured Housing: | | | | | | | | | | | | |
Series 1999-5, Class M1B, 8.29%, 12/15/29 (a) | | | | | | | 870 | | | | 940,748 | |
Series 1999-5, Class M2, 9.23%, 12/15/29 (a) | | | | | | | 1,352 | | | | 1,148,469 | |
Greystone Commercial Real Estate Notes Ltd., Series
2017-FL1A, Class A, 2.49%, 3/15/27 (a)(b) | | | | | | | 1,010 | | | | 1,009,434 | |
GSAA Home Equity Trust, Series 2006-5, Class 2A1, 0.85%, 3/25/36 (a) | | | | | | | 20 | | | | 11,851 | |
GSAA Trust, Series 2007-2, Class AF3, 5.92%, 3/25/37 (a) | | | | | | | 592 | | | | 260,096 | |
GSAMP Trust: | | | | | | | | | | | | |
Series 2006-FM2, Class A2B, 1.10%, 9/25/36 (a) | | | | | | | 3,018 | | | | 1,384,491 | |
See Notes to Consolidated Financial Statements.
| | | | | | |
| 46 | | BLACKROCK BALANCED CAPITAL FUND, INC. | | MARCH 31, 2017 | | |
| | | | |
| Consolidated Schedule of Investments (continued) | | | Master Total Return Portfolio | |
| | | | |
| | | | | | | | | | | | |
| Asset-Backed Securities | | | | | Par
(000) | | | Value | |
Series 2007-H1, Class A1B, 1.18%, 1/25/47 (a) | | | USD | | | | 1,202 | | | $ | 787,378 | |
GT Loan Financing I Ltd., Series 2013-1A, Class A, 2.31%, 10/28/24 (a)(b) | | | | | | | 5,105 | | | | 5,115,927 | |
Harvest CLO, Series 11X, Class E, 5.34%, 3/26/29 (a) | | | EUR | | | | 170 | | | | 178,756 | |
Harvest CLO XVI DAC, Series 16X, Class E,
6.40%, 10/15/29 (a) | | | | | | | 480 | | | | 510,022 | |
Highbridge Loan Management Ltd., Series 6A-2015, Class A, 2.48%, 5/05/27 (a)(b) | | | USD | | | | 6,750 | | | | 6,761,573 | |
Home Equity Mortgage Loan Asset-Backed Trust, Series 2004-A, Class M2, 2.80%, 7/25/34 (a) | | | | | | | 802 | | | | 757,407 | |
Home Equity Mortgage Trust, Series 2006-2, Class 1A1, 5.87%, 7/25/36 (c) | | | | | | | 3,145 | | | | 1,354,162 | |
Home Loan Mortgage Loan Trust, Series 2005-1, Class A3, 1.27%, 4/15/36 (a) | | | | | | | 1,681 | | | | 1,532,739 | |
Invitation Homes Trust: | | | | | | | | | | | | |
Series 2014-SFR1, Class A, 1.77%, 6/17/31 (a)(b) | | | | | | | 988 | | | | 988,084 | |
Series 2014-SFR2, Class A, 1.87%, 9/17/31 (a)(b) | | | | | | | 2,958 | | | | 2,960,984 | |
Series 2014-SFR2, Class C, 2.97%, 9/17/31 (a)(b) | | | | | | | 1,650 | | | | 1,651,623 | |
Series 2014-SFR2, Class E, 4.35%, 9/17/31 (a)(b) | | | | | | | 1,460 | | | | 1,462,814 | |
Series 2014-SFR3, Class A,
1.97%, 12/17/31 (a)(b) | | | | | | | 1,745 | | | | 1,745,535 | |
Series 2014-SFR3, Class D,
3.94%, 12/17/31 (a)(b) | | | | | | | 1,170 | | | | 1,169,997 | |
Series 2015-SFR3, Class A, 2.07%, 8/17/32 (a)(b) | | | | | | | 9,317 | | | | 9,380,558 | |
Series 2015-SFR3, Class E, 4.69%, 8/17/17 (a)(b) | | | | | | | 1,582 | | | | 1,605,164 | |
Irwin Home Equity Loan Trust, Series 2006-2, Class 2A2, 6.24%, 2/25/36 (b)(c) | | | | | | | 523 | | | | 532,902 | |
JPMorgan Mortgage Acquisition Trust: | | | | | | | | | | | | |
Series 2006-CW1, Class M1, 1.25%, 5/25/36 (a) | | | | | | | 1,170 | | | | 965,107 | |
Series 2006-WF1, Class A3A, 5.83%, 7/25/36 (c) | | | | | | | 852 | | | | 488,813 | |
Series 2006-WF1, Class A5, 6.41%, 7/25/36 (c) | | | | | | | 1,161 | | | | 665,960 | |
Series 2006-WF1, Class A6, 6.00%, 7/25/36 (c) | | | | | | | 853 | | | | 489,559 | |
Jubilee CDO BV, Series VIII-X, Class Sub,
4.81%, 1/15/24 (a) | | | EUR | | | | 880 | | | | 600,132 | |
KKR Financial CLO Ltd., Series 2013-1A, Class A1,
2.17%, 7/15/25 (a)(b) | | | USD | | | | 4,515 | | | | 4,514,970 | |
LCM XIV LP, Series 14A, Class A, 2.17%, 7/15/25 (a)(b) | | | | | | | 320 | | | | 320,226 | |
LCM XV LP, Series 15A, Class C, 4.15%, 8/25/24 (a)(b) | | | | | | | 1,070 | | | | 1,074,135 | |
LCM XVIII LP: | | | | | | | | | | | | |
Series 18A, Class B1, 3.33%, 4/20/27 (a)(b) | | | | | | | 2,400 | | | | 2,399,800 | |
Series 18A, Class C1, 4.18%, 4/20/27 (a)(b) | | | | | | | 500 | | | | 501,990 | |
Lehman ABS Manufactured Housing Contract Trust: | | | | | | | | | | | | |
Series 2001-B, Class M1, 6.63%, 4/15/40 (a) | | | | | | | 4,790 | | | | 5,140,473 | |
Series 2001-B, Class M2, 7.17%, 4/15/40 (a) | | | | | | | 741 | | | | 509,539 | |
Series 2002-A, Class C, 0.00%, 6/15/33 (a) | | | | | | | 478 | | | | 354,666 | |
Lehman ABS Mortgage Loan Trust, Series 2007-1, Class 2A1, 1.07%, 6/25/37 (a)(b) | | | | | | | 586 | | | | 367,574 | |
| | | | | | | | | | | | |
| Asset-Backed Securities | | | | | Par
(000) | | | Value | |
Lime Street CLO Ltd., Series 2007-1A, Class B,
1.55%, 6/20/21 (a)(b) | | | USD | | | | 900 | | | $ | 896,413 | |
Litigation Fee Residual Funding LLC, Series 2015-1, Class A, 4.00%, 10/01/27 (b) | | | | | | | 5,660 | | | | 5,555,347 | |
Long Beach Mortgage Loan Trust: | | | | | | | | | | | | |
Series 2006-1, Class 1A, 1.20%, 2/25/36 (a) | | | | | | | 4,303 | | | | 3,876,909 | |
Series 2006-2, Class 2A3, 1.17%, 3/25/46 (a) | | | | | | | 9,068 | | | | 4,227,866 | |
Series 2006-2, Class 2A4, 1.27%, 3/25/46 (a) | | | | | | | 2,073 | | | | 983,068 | |
Series 2006-3, Class 2A3, 1.16%, 5/25/46 (a) | | | | | | | 6,113 | | | | 2,649,453 | |
Series 2006-3, Class 2A4, 1.25%, 5/25/46 (a) | | | | | | | 1,202 | | | | 530,480 | |
Series 2006-4, Class 2A4, 1.24%, 5/25/36 (a) | | | | | | | 2,229 | | | | 1,109,648 | |
Series 2006-9, Class 2A3, 1.14%, 10/25/36 (a) | | | | | | | 4,187 | | | | 1,814,760 | |
Series 2006-9, Class 2A4, 1.21%, 10/25/36 (a) | | | | | | | 1,872 | | | | 818,456 | |
Series 2006-10, Class 2A3, 1.14%, 11/25/36 (a) | | | | | | | 4,333 | | | | 1,996,394 | |
Series 2006-10, Class 2A4, 1.20%, 11/25/36 (a) | | | | | | | 2,575 | | | | 1,196,457 | |
Madison Avenue Manufactured Housing Contract Trust, Series 2002-A, Class B2, 4.23%, 3/25/32 (a) | | | | | | | 1,510 | | | | 1,523,543 | |
Madison Park Funding Ltd.: | | | | | | | | | | | | |
Series 2012-9A, Class AR, 2.33%, 8/15/22 (a)(b) | | | | | | | 1,638 | | | | 1,638,191 | |
Series 2012-9A, Class B1R, 2.91%, 8/15/22 (a)(b) | | | | | | | 3,000 | | | | 2,995,522 | |
Series 2012-9A, Class C1R, 3.89%, 8/15/22 (a)(b) | | | | | | | 580 | | | | 581,032 | |
Madison Park Funding XI Ltd., Series 2013-11A, Class A1B, 2.49%, 10/23/25 (a)(b) | | | | | | | 1,518 | | | | 1,524,286 | |
MASTR Asset-Backed Securities Trust: | | | | | | | | | | | | |
Series 2006-AM2, Class A4, 1.24%, 6/25/36 (a)(b) | | | | | | | 2,059 | | | | 1,379,841 | |
Series 2007-HE1, Class A4, 1.26%, 5/25/37 (a) | | | | | | | 1,318 | | | | 800,891 | |
MASTR Specialized Loan Trust, Series 2006-3, Class A, 1.24%, 6/25/46 (a)(b) | | | | | | | 739 | | | | 649,097 | |
Merrill Lynch Mortgage Investors Trust: | | | | | | | | | | | | |
Series 2006-OPT1, Class M1, 1.24%, 8/25/37 (a) | | | | | | | 605 | | | | 184,796 | |
Series 2006-RM3, Class A2B, 1.07%, 6/25/37 (a) | | | | | | | 1,026 | | | | 319,325 | |
Morgan Stanley ABS Capital I, Inc., Trust, Series 2005-HE1, Class A2MZ, 1.38%, 12/25/34 (a) | | | | | | | 820 | | | | 761,350 | |
Morgan Stanley IXIS Real Estate Capital Trust, Series 2006-2, Class A2, 1.09%, 11/25/36 (a) | | | | | | | 1,280 | | | | 612,335 | |
Mountain Hawk I CLO Ltd., Series 2013-1A, Class B1, 3.21%, 1/20/24 (a)(b) | | | | | | | 3,020 | | | | 3,014,505 | |
MP CLO IV Ltd., Series 2013-2A, Class A2BR,
3.24%, 10/25/25 (a)(b) | | | | | | | 750 | | | | 756,934 | |
MP CLO VIII Ltd., Series 2015-2A, Class B,
3.29%, 10/28/27 (a)(b) | | | | | | | 3,250 | | | | 3,252,666 | |
Nationstar Home Equity Loan Trust, Series 2007-C, Class 2AV3, 1.16%, 6/25/37 (a) | | | | | | | 450 | | | | 426,610 | |
Navient Private Education Loan Trust: Series 2014-AA, Class B, 3.50%, 8/15/44 (b) | | | | | | | 6,000 | | | | 5,525,634 | |
See Notes to Consolidated Financial Statements.
| | | | | | |
| | | BLACKROCK BALANCED CAPITAL FUND, INC. | | MARCH 31, 2017 | | 47 |
| | | | |
| Consolidated Schedule of Investments (continued) | | | Master Total Return Portfolio | |
| | | | |
| | | | | | | | | | | | |
| Asset-Backed Securities | | | | | Par
(000) | | | Value | |
Series 2014-CTA, Class B, 2.52%, 10/17/44 (a)(b) | | | USD | | | | 8,550 | | | $ | 8,169,141 | |
Series 2016-AA, Class A2B,
2.92%, 12/15/45 (a)(b) | | | | | | | 4,260 | | | | 4,429,154 | |
Series 2016-AA, Class B, 3.50%, 12/16/58 (a)(b) | | | | | | | 2,040 | | | | 1,832,942 | |
Neuberger Berman CLO XIII Ltd.: | | | | | | | | | | | | |
Series 2012-13A, Class B, 3.34%, 1/23/24 (a)(b) | | | | | | | 9,375 | | | | 9,372,976 | |
Series 2012-13A, Class C, 3.89%, 1/23/24 (a)(b) | | | | | | | 1,500 | | | | 1,502,760 | |
Neuberger Berman CLO XVI Ltd., Series 2014-16A, Class B2R, 3.05%, 4/15/26 (a)(b) | | | | | | | 1,875 | | | | 1,874,905 | |
NextGear Floorplan Master Owner Trust, Series 2015-1A, Class B, 2.66%, 7/15/19 (a)(b) | | | | | | | 1,150 | | | | 1,150,342 | |
Nomura Asset Acceptance Corp. Alternative Loan Trust, Series 2006-S5, Class A1, 1.38%, 10/25/36 (a)(b) | | | | | | | 497 | | | | 452,988 | |
North Westerly CLO BV, Series IV-X, Class A-1,
1.22%, 1/15/26 (a) | | | EUR | | | | 2,500 | | | | 2,683,761 | |
Northwoods Capital IX Ltd., Series 2012-9A, Class A, 2.44%, 1/18/24 (a)(b) | | | USD | | | | 4,550 | | | | 4,550,292 | |
Oak Hill Credit Partners IX Ltd., Series 2013-9A, Class DR, 1.40%, 10/20/25 (a)(b) | | | | | | | 540 | | | | 540,000 | |
Oak Hill European Credit Partners IV Designated Activity Co.: | | | | | | | | | | | | |
Series 2015-4X, Class E, 5.06%, 1/20/30 (a) | | | EUR | | | | 1,540 | | | | 1,604,584 | |
Series 2015-4X, Class F, 6.65%, 1/20/30 (a) | | | | | | | 670 | | | | 662,623 | |
Oaktree EIF II Ltd., Series 2014-A2, Class B,
3.34%, 11/15/25 (a)(b) | | | USD | | | | 1,640 | | | | 1,634,183 | |
Oakwood Mortgage Investors, Inc.: | | | | | | | | | | | | |
Series 2001-D, Class A2, 5.26%, 1/15/19 (a) | | | | | | | 978 | | | | 770,215 | |
Series 2001-D, Class A4, 6.93%, 9/15/31 (a) | | | | | | | 622 | | | | 555,673 | |
OCP CLO Ltd.: | | | | | | | | | | | | |
Series 2013-3A, Class B, 3.77%, 1/17/25 (a)(b) | | | | | | | 1,000 | | | | 1,003,487 | |
Series 2014-5A, Class A1, 2.03%, 4/26/26 (a)(b) | | | | | | | 330 | | | | 329,406 | |
Series 2015-8A, Class A1, 2.55%, 4/17/27 (a)(b) | | | | | | | 5,530 | | | | 5,529,886 | |
Series 2016-12A, Class A1, 2.46%, 10/18/28 (a)(b) | | | | | | | 1,350 | | | | 1,359,555 | |
Octagon Investment Partners XIX Ltd., Series 2014-1A, Class AR, 2.07%, 4/15/26 (a)(b) | | | | | | | 1,500 | | | | 1,500,000 | |
Octagon Investment Partners XVI Ltd., Series 2013-1A, Class A, 2.14%, 7/17/25 (a)(b) | | | | | | | 5,195 | | | | 5,198,440 | |
Octagon Investment Partners XVII Ltd., Series 2013-1A, Class A2R, 2.72%, 10/25/25 (a)(b) | | | | | | | 7,240 | | | | 7,243,620 | |
OFSI Fund VI Ltd., Series 2014-6A, Class A2,
2.92%, 3/20/25 (a)(b) | | | | | | | 2,909 | | | | 2,901,355 | |
OHA Credit Partners IX Ltd., Series 2013-9A, Class A1, 2.43%, 10/20/25 (a)(b) | | | | | | | 540 | | | | 540,055 | |
OHA Credit Partners VIII Ltd., Series 2013-8A, Class A, 2.15%, 4/20/25 (a)(b) | | | | | | | 4,130 | | | | 4,133,496 | |
OHA Loan Funding Ltd., Series 2013-2A, Class A,
2.32%, 8/23/24 (a)(b) | | | | | | | 5,315 | | | | 5,312,069 | |
OneMain Financial Issuance Trust: Series 2014-1A, Class A, 2.43%, 6/18/24 (b) | | | | | | | 876 | | | | 875,685 | |
| | | | | | | | | | | | |
| Asset-Backed Securities | | | | | Par
(000) | | | Value | |
Series 2014-1A, Class B, 3.24%, 6/18/24 (b) | | | USD | | | | 2,820 | | | $ | 2,825,136 | |
Series 2014-2A, Class B, 3.02%, 9/18/24 (b) | | | | | | | 2,805 | | | | 2,800,016 | |
Series 2014-2A, Class D, 5.31%, 9/18/24 (b) | | | | | | | 1,885 | | | | 1,900,670 | |
Series 2015-1A, Class C, 5.12%, 3/18/26 (b) | | | | | | | 1,536 | | | | 1,551,849 | |
Series 2015-2A, Class C, 4.32%, 7/18/25 (b) | | | | | | | 4,830 | | | | 4,821,880 | |
Series 2016-2A, Class A, 4.10%, 3/20/28 (b) | | | | | | | 3,248 | | | | 3,326,210 | |
Option One Mortgage Acceptance Corp. Asset-Backed Certificates, Series 2003-4, Class A2,
1.42%, 7/25/33 (a) | | | | | | | 1,087 | | | | 1,014,197 | |
Option One Mortgage Loan Trust, Series 2007-CP1, Class 2A3, 1.19%, 3/25/37 (a) | | | | | | | 2,360 | | | | 1,509,563 | |
Origen Manufactured Housing Contract Trust, Series 2001-A, Class M1, 7.82%, 3/15/32 (a) | | | | | | | 1,593 | | | | 1,576,607 | |
OZLM Funding II Ltd., Series 2012-2A, Class A1R, 2.48%, 10/30/27 (a)(b) | | | | | | | 19,348 | | | | 19,351,902 | |
OZLM Funding IV Ltd., Series 2013-4A, Class A1, 2.19%, 7/22/25 (a)(b) | | | | | | | 9,995 | | | | 10,001,582 | |
OZLM Funding V Ltd., Series 2013-5A, Class BR,
3.49%, 1/17/26 (a)(b) | | | | | | | 3,720 | | | | 3,720,000 | |
OZLM IX Ltd., Series 2014-9A, Class CR,
4.38%, 1/20/27 (a)(b) | | | | | | | 4,360 | | | | 4,364,609 | |
OZLM VI Ltd., Series 2014-6A, Class BR,
3.60%, 4/17/26 (a)(b) | | | | | | | 2,360 | | | | 2,370,459 | |
OZLM VII Ltd.: | | | | | | | | | | | | |
Series 2014-7A, Class A1A,
2.44%, 7/17/26 (a)(b) | | | | | | | 4,740 | | | | 4,740,030 | |
Series 2014-7A, Class A1B,
2.51%, 7/17/26 (a)(b) | | | | | | | 250 | | | | 249,999 | |
Series 2014-7A, Class A1BR,
0.00%, 7/17/26 (a)(b) | | | | | | | 250 | | | | 250,000 | |
Series 2014-7A, Class A2A,
3.07%, 7/17/26 (a)(b) | | | | | | | 2,450 | | | | 2,450,074 | |
Series 2014-7A, Class B1R,
0.00%, 7/17/26 (a)(b) | | | | | | | 1,400 | | | | 1,400,000 | |
OZLM XI Ltd., Series 2015-11A, Class A1A,
2.59%, 1/30/27 (a)(b) | | | | | | | 9,258 | | | | 9,300,234 | |
OZLM XII Ltd., Series 2015-12A, Class A1,
2.49%, 4/30/27 (a)(b) | | | | | | | 570 | | | | 572,450 | |
OZLM XV Ltd.: | | | | | | | | | | | | |
Series 2016-15A, Class A1,
2.41%, 1/20/29 (a)(b) | | | | | | | 4,740 | | | | 4,762,320 | |
Series 2016-15A, Class A2A,
3.02%, 1/20/29 (a)(b) | | | | | | | 1,940 | | | | 1,933,434 | |
OZLME BV, Series 1X, Class E, 6.45%, 1/18/30 (a) | | | EUR | | | | 475 | | | | 507,998 | |
Palmer Square CLO Ltd.: | | | | | | | | | | | | |
Series 2013-2A, Class A1AR,
0.00%, 10/17/27 (a)(b) | | | USD | | | | 2,280 | | | | 2,280,000 | |
Series 2013-2A, Class B, 4.07%, 10/17/25 (a)(b) | | | | | | | 890 | | | | 890,035 | |
Series 2013-2A, Class BR,
0.00%, 10/17/27 (a)(b) | | | | | | | 890 | | | | 890,000 | |
Palmer Square Loan Funding Ltd.: | | | | | | | | | | | | |
Series 2016-2A, Class A2, 3.14%, 6/21/24 (a)(b) | | | | | | | 3,800 | | | | 3,805,451 | |
Series 2016-2A, Class B, 4.19%, 6/21/24 (a)(b) | | | | | | | 3,970 | | | | 3,995,233 | |
See Notes to Consolidated Financial Statements.
| | | | | | |
| 48 | | BLACKROCK BALANCED CAPITAL FUND, INC. | | MARCH 31, 2017 | | |
| | | | |
| Consolidated Schedule of Investments (continued) | | | Master Total Return Portfolio | |
| | | | | | | | | | | | |
| Asset-Backed Securities | | | | | Par
(000) | | | Value | |
Preston Ridge Partners Mortgage LLC, Series 2017-1A, Class A1, 4.25%, 1/25/22 (b)(c) | | | USD | | | | 849 | | | $ | 849,048 | |
Pretium Mortgage Credit Partners I LLC: | | | | | | | | | | | | |
Series 2015-NPL4, Class A1,
4.38%, 11/27/30 (b)(c) | | | | | | | 2,188 | | | | 2,194,508 | |
Series 2016-NPL3, Class A1,
4.38%, 5/27/31 (b)(c) | | | | | | | 5,811 | | | | 5,846,729 | |
Series 2016-NPL6, Class A1,
3.50%, 10/27/31 (b)(c) | | | | | | | 3,945 | | | | 3,955,512 | |
Progress Residential Trust: | | | | | | | | | | | | |
Series 2015-SFR2, Class A,
2.74%, 6/12/32 (b) | | | | | | | 1,731 | | | | 1,722,955 | |
Series 2015-SFR3, Class F,
6.64%, 11/12/32 (b) | | | | | | | 500 | | | | 517,879 | |
Series 2016-SFR1, Class A,
2.27%, 9/17/33 (a)(b) | | | | | | | 4,334 | | | | 4,389,801 | |
Series 2016-SFR1, Class E,
4.79%, 9/17/33 (a)(b) | | | | | | | 2,940 | | | | 3,005,298 | |
Series 2016-SFR2, Class E,
4.49%, 1/17/34 (a)(b) | | | | | | | 1,590 | | | | 1,613,991 | |
Race Point IX CLO Ltd., Series 2015-9A, Class A1, 2.53%, 4/15/27 (a)(b) | | | | | | | 1,780 | | | | 1,783,043 | |
Race Point VII CLO Ltd., Series 2012-7A, Class CR, 3.69%, 11/08/24 (a)(b) | | | | | | | 3,180 | | | | 3,187,319 | |
Race Point X CLO Ltd., Series 2016-10A, Class A, 2.64%, 7/25/28 (a)(b) | | | | | | | 5,550 | | | | 5,576,926 | |
RASC Trust, Series 2003-KS5, Class AIIB,
1.36%, 7/25/33 (a) | | | | | | | 398 | | | | 360,130 | |
RCO Mortgage LLC, Series 2015-NQM1, Class A, 4.48%, 11/25/45 (a)(b) | | | | | | | 896 | | | | 895,411 | |
SACO I Trust, Series 2006-9, Class A1,
1.28%, 8/25/36 (a) | | | | | | | 904 | | | | 1,373,534 | |
Shackleton II CLO Ltd.: | | | | | | | | | | | | |
Series 2012-2A, Class B1R,
2.88%, 10/20/23 (a)(b) | | | | | | | 1,910 | | | | 1,903,158 | |
Series 2012-2A, Class CR,
3.68%, 10/20/23 (a)(b) | | | | | | | 750 | | | | 751,564 | |
Sheridan Square CLO Ltd., Series 2013-1A, Class A2, 2.19%, 4/15/25 (a)(b) | | | | | | | 6,210 | | | | 6,214,478 | |
Silvermore CLO Ltd., Series 2014-1A, Class A1, 2.49%, 5/15/26 (a)(b) | | | | | | | 3,667 | | | | 3,670,472 | |
SLC Private Student Loan Trust, Series 2006-A, Class C, 1.47%, 7/15/36 (a) | | | | | | | 2,010 | | | | 1,808,670 | |
SLM Private Credit Student Loan Trust: | | | | | | | | | | | | |
Series 2004-A, Class A3, 1.36%, 6/15/33 (a) | | | | | | | 3,643 | | | | 3,527,806 | |
Series 2004-B, Class A3, 1.29%, 3/15/24 (a) | | | | | | | 18,312 | | | | 17,870,910 | |
Series 2006-B, Class A4, 1.14%, 3/15/24 (a) | | | | | | | 8 | | | | 7,689 | |
Series 2006-B, Class A5, 1.40%, 12/15/39 (a) | | | | | | | 830 | | | | 786,825 | |
Series 2006-C, Class A4, 1.13%, 3/15/23 (a) | | | | | | | 136 | | | | 136,148 | |
Series 2007-A, Class A2, 1.25%, 9/15/25 (a) | | | | | | | 372 | | | | 371,233 | |
SLM Private Education Loan Trust: | | | | | | | | | | | | |
Series 2013-A, Class B, 2.50%, 3/15/47 (b) | | | | | | | 620 | | | | 597,732 | |
Series 2013-B, Class B, 3.00%, 5/16/44 (b) | | | | | | | 2,095 | | | | 2,089,099 | |
Series 2013-C, Class A2B,
2.17%, 10/15/31 (a)(b) | | | | | | | 478 | | | | 484,125 | |
SMB Private Education Loan Trust, Series 2015-B, Class B, 3.50%, 12/17/40 (b) | | | | | | | 3,830 | | | | 3,789,949 | |
Sorrento Park CLO Ltd., Series 1X, Class E,
5.92%, 11/16/27 (a) | | | EUR | | | | 340 | | | | 333,138 | |
| | | | | | | | | | | | |
| Asset-Backed Securities | | | | | Par (000) | | | Value | |
Sound Point CLO I Ltd., Series 2012-1A, Class B, 3.73%, 10/20/23 (a)(b) | | | USD | | | | 500 | | | $ | 501,007 | |
Sound Point CLO II Ltd., Series 2013-1A, Class A1L, 2.23%, 4/26/25 (a)(b) | | | | | | | 500 | | | | 500,397 | |
Sound Point CLO IV Ltd., Series 2013-3A, Class A, 2.41%, 1/21/26 (a)(b) | | | | | | | 2,385 | | | | 2,387,874 | |
Sound Point CLO V Ltd., Series 2014-1A, Class CR, 3.42%, 4/18/26 (a)(b) | | | | | | | 937 | | | | 939,343 | |
Sound Point CLO VI Ltd., Series 2014-2A, Class A1, 2.39%, 10/20/26 (a)(b) | | | | | | | 3,560 | | | | 3,564,367 | |
Sound Point CLO VII Ltd., Series 2014-3A, Class AR, 2.32%, 1/23/27 (a)(b) | | | | | | | 6,225 | | | | 6,240,563 | |
Sound Point CLO XI Ltd., Series 2016-1A, Class A, 2.68%, 7/20/28 (a)(b) | | | | | | | 5,730 | | | | 5,773,996 | |
Sound Point CLO XII Ltd., Series 2016-2A, Class A, 2.69%, 10/20/28 (a)(b) | | | | | | | 3,010 | | | | 3,027,458 | |
Sound Point CLO XIV Ltd.: | | | | | | | | | | | | |
Series 2016-3A, Class A,
2.41%, 1/23/29 (a)(b) | | | | | | | 7,330 | | | | 7,371,494 | |
Series 2016-3A, Class C,
3.53%, 1/23/29 (a)(b) | | | | | | | 1,000 | | | | 1,007,396 | |
Sound Point CLO XV Ltd., Series 2017-1A, Class A, 2.43%, 1/23/29 (a)(b) | | | | | | | 1,240 | | | | 1,242,480 | |
Soundview Home Loan Trust, Series 2004-WMC1, Class M2, 1.78%, 1/25/35 (a) | | | | | | | 195 | | | | 184,914 | |
SpringCastle America Funding LLC, Series 2016-AA, Class A, 3.05%, 4/25/29 (b) | | | | | | | 12,811 | | | | 12,889,968 | |
Springleaf Funding Trust, Series 2015-AA, Class B, 3.62%, 11/15/24 (b) | | | | | | | 3,952 | | | | 3,947,401 | |
St. Paul’s CLO VI DAC, Series 6X, Class D,
6.50%, 7/22/29 (a) | | | EUR | | | | 680 | | | | 728,038 | |
Stanwich Mortgage Loan Co. LLC, Series 2016-NPL2, Class NOTE, 3.72%, 8/16/46 (b)(c) | | | USD | | | | 4,243 | | | | 4,221,350 | |
Structured Asset Securities Corp. Assistance Loan Trust, Series 2003-AL2, Class A,
3.36%, 1/25/31 (b) | | | | | | | 549 | | | | 533,680 | |
Structured Asset Securities Corp. Mortgage Pass-Through Certificates, Series 2004-23XS, Class 2A1, 1.08%, 1/25/35 (a) | | | | | | | 943 | | | | 875,647 | |
Sunset Mortgage Loan Co. LLC, Series 2014-NPL2, Class A, 3.72%, 11/16/44 (b)(c) | | | | | | | 468 | | | | 468,247 | |
SWAY Residential Trust, Series 2014-1, Class A, 2.07%, 1/17/32 (a)(b) | | | | | | | 9,696 | | | | 9,716,690 | |
Symphony CLO VIII LP, Series 2012-8A, Class CR, 4.06%, 1/09/23 (a)(b) | | | | | | | 750 | | | | 751,005 | |
Symphony CLO XI Ltd., Series 2013-11A, Class B1, 3.22%, 1/17/25 (a)(b) | | | | | | | 890 | | | | 900,646 | |
Symphony CLO XII Ltd.: | | | | | | | 3,000 | | | | 3,000,084 | |
Series 2013-12A, Class A,
2.32%, 10/15/25 (a)(b) | | | | | | | | | | | | |
Series 2013-12A, Class C,
3.77%, 10/15/25 (a)(b) | | | | | | | 3,655 | | | | 3,655,160 | |
THL Credit Wind River CLO Ltd., Series 2014-2A, Class A2, 2.47%, 7/15/26 (a)(b) | | | | | | | 5,080 | | | | 5,087,607 | |
TIAA CLO II Ltd., Series 2017-1A, Class A,
0.00%, 4/20/29 (a)(b) | | | | | | | 2,340 | | | | 2,340,000 | |
TICP CLO I Ltd., Series 2015-1A, Class A,
2.53%, 7/20/27 (a)(b) | | | | | | | 1,000 | | | | 999,695 | |
TICP CLO III Ltd.: | | | | | | | | | | | | |
Series 2014-3A, Class A,
2.57%, 1/20/27 (a)(b) | | | | | | | 4,474 | | | | 4,474,062 | |
Series 2014-3A, Class AR,
2.57%, 1/20/27 (a)(b) | | | | | | | 4,474 | | | | 4,474,000 | |
Series 2014-3A, Class B1,
3.38%, 1/20/27 (a)(b) | | | | | | | 374 | | | | 373,996 | |
See Notes to Consolidated Financial Statements.
| | | | | | |
| | | BLACKROCK BALANCED CAPITAL FUND, INC. | | MARCH 31, 2017 | | 49 |
| | | | |
| Consolidated Schedule of Investments (continued) | | | Master Total Return Portfolio | |
| | | | |
| | | | | | | | | | | | |
| Asset-Backed Securities | | | | | Par
(000) | | | Value | |
Tikehau CLO BV, Series 2015-1X, Class E,
4.60%, 8/04/28 (a) | | | EUR | | | | 300 | | | $ | 309,184 | |
Tricon American Homes Trust, Series 2015-SFR1, Class A, 2.02%, 5/17/32 (a)(b) | | | USD | | | | 1,085 | | | | 1,082,956 | |
U.S. Residential Opportunity Fund II Trust: | | | | | | | | | | | | |
Series 2016-1II, Class A,
3.47%, 7/27/36 (b)(c) | | | | | | | 1,356 | | | | 1,344,827 | |
Series 2016-2II, Class A,
3.47%, 8/27/36 (b)(c) | | | | | | | 6,566 | | | | 6,525,433 | |
Series 2016-3II, Class A,
3.60%, 10/27/36 (b)(c) | | | | | | | 2,311 | | | | 2,299,658 | |
U.S. Residential Opportunity Fund III Trust: | | | | | | | | | | | | |
Series 2016-1III, Class A,
3.47%, 7/27/36 (b)(c) | | | | | | | 7,650 | | | | 7,611,418 | |
Series 2016-2III, Class A,
3.47%, 8/27/36 (b)(c) | | | | | | | 17,217 | | | | 17,110,158 | |
Series 2016-3III, Class A,
3.60%, 10/27/36 (b)(c) | | | | | | | 10,926 | | | | 10,866,705 | |
U.S. Residential Opportunity Fund IV Trust: | | | | | | | | | | | | |
Series 2016-1IV, Class A,
3.47%, 7/27/36 (b)(c) | | | | | | | 13,226 | | | | 13,261,089 | |
Series 2016-2IV, Class A,
3.47%, 8/27/36 (b)(c) | | | | | | | 10,845 | | | | 10,777,911 | |
Series 2016-3IV, Class A,
3.60%, 10/27/36 (b)(c) | | | | | | | 5,504 | | | | 5,530,253 | |
Venture X CLO Ltd., Series 2012-10A, Class BR,
2.86%, 7/20/22 (a)(b) | | | | | | | 3,830 | | | | 3,835,789 | |
Venture XIX CLO Ltd.: | | | | | | | | | | | | |
Series 2014-19A, Class AR,
2.11%, 1/15/27 (a)(b) | | | | | | | 1,020 | | | | 1,021,275 | |
Series 2014-19A, Class BR,
3.02%, 1/15/27 (a)(b) | | | | | | | 1,800 | | | | 1,804,500 | |
Venture XVI CLO Ltd., Series 2014-16A, Class A2L,
3.02%, 4/15/26 (a)(b) | | | | | | | 1,050 | | | | 1,049,969 | |
Venture XVII CLO Ltd., Series 2014-17A, Class B1,
3.12%, 7/15/26 (a)(b) | | | | | | | 1,220 | | | | 1,222,751 | |
Venture XVIII CLO Ltd., Series 2014-18A, Class A,
2.47%, 10/15/26 (a)(b) | | | | | | | 9,820 | | | | 9,819,969 | |
Venture XXI CLO Ltd., Series 2015-21A, Class A,
2.51%, 7/15/27 (a)(b) | | | | | | | 2,630 | | | | 2,636,623 | |
Vibrant CLO III Ltd.: | | | | | | | | | | | | |
Series 2015-3A, Class A1R,
2.51%, 4/20/26 (a)(b) | | | | | | | 1,390 | | | | 1,390,585 | |
Series 2015-3A, Class A2R,
3.08%, 4/20/26 (a)(b) | | | | | | | 710 | | | | 709,397 | |
Vibrant CLO V Ltd., Series 2016-5A, Class A,
2.55%, 1/20/29 (a)(b) | | | | | | | 2,480 | | | | 2,490,800 | |
VOLT XLVI LLC, Series 2016-NPL6, Class A1,
3.84%, 6/25/46 (b)(c) | | | | | | | 10,478 | | | | 10,497,628 | |
Voya CLO Ltd.: | | | | | | | | | | | | |
Series 2012-2A, Class BR,
2.97%, 10/15/22 (a)(b) | | | | | | | 2,470 | | | | 2,468,352 | |
Series 2012-3A, Class AR,
2.34%, 10/15/22 (a)(b) | | | | | | | 1,660 | | | | 1,660,712 | |
Series 2013-3A, Class A1,
2.47%, 1/18/26 (a)(b) | | | | | | | 7,925 | | | | 7,925,438 | |
Series 2013-3A, Class A1R,
0.00%, 1/18/26 (a)(b) | | | | | | | 7,925 | | | | 7,925,000 | |
Series 2013-3A, Class A2,
2.82%, 1/18/26 (a)(b) | | | | | | | 3,145 | | | | 3,144,993 | |
Series 2013-3A, Class A2R,
2.66%, 1/18/26 (a)(b) | | | | | | | 3,145 | | | | 3,145,000 | |
Series 2014-4A, Class A1,
2.52%, 10/14/26 (a)(b) | | | | | | | 4,740 | | | | 4,741,431 | |
Voya Investment Management CLO Ltd., Series 2013-2A, Class A1, 2.19%, 4/25/25 (a)(b) | | | | | | | 1,815 | | | | 1,817,485 | |
Wachovia Asset Securitization Issuance II LLC Trust, Series 2007-HE2A, Class A, 1.11%, 7/25/37 (a)(b) | | | | | | | 2,681 | | | | 2,398,304 | |
| | | | | | | | | | | | |
| Asset-Backed Securities | | | | | Par
(000) | | | Value | |
Washington Mutual Asset-Backed Certificates, Series 2006-HE4, Class 2A2, 1.16%, 9/25/36 (a) | | | USD | | | | 6,015 | | | $ | 2,837,079 | |
Washington Mutual Asset-Backed Certificates Trust: | | | | | | | | | | | | |
Series 2006-HE5, Class 1A,
1.14%, 10/25/36 (a) | | | | | | | 2,545 | | | | 1,943,096 | |
Series 2007-HE2, Class 2A2,
1.20%, 2/25/37 (a) | | | | | | | 5,996 | | | | 2,473,860 | |
Wellfleet CLO Ltd., Series 2017-1A, Class A1, 0.00%, 4/20/29 (a)(b) | | | | | | | 2,160 | | | | 2,160,000 | |
World Financial Network Credit Card Master Trust: | | | | | | | | | | | | |
Series 2012-C, Class B,
3.57%, 8/15/22 | | | | | | | 3,000 | | | | 3,057,167 | |
Series 2012-C, Class C,
4.55%, 8/15/22 | | | | | | | 5,030 | | | | 5,146,193 | |
Series 2012-D, Class B,
3.34%, 4/17/23 | | | | | | | 3,551 | | | | 3,610,243 | |
Series 2012-D, Class M,
3.09%, 4/17/23 | | | | | | | 2,725 | | | | 2,764,030 | |
WVUE, Series 2015-1A, Class A,
4.50%, 9/25/20 (b)(c) | | | | | | | 1,306 | | | | 1,326,311 | |
Ziggurat CLO I Ltd., Series 2014-1A, Class A1, 2.60%, 10/17/26 (a)(b) | | | | | | | 12,445 | | | | 12,475,236 | |
Total Asset-Backed Securities — 11.1% | | | | | | | | | | | 1,095,726,675 | |
| | | | | | | | | | | | |
| Common Stocks | | | | | Shares | | | | |
Airlines — 0.1% | | | | | | | | | |
Delta Air Lines, Inc. | | | | | | | 76,788 | | | | 3,529,176 | |
United Continental Holdings, Inc. (d) | | | | | | | 18,818 | | | | 1,329,304 | |
| | | | | | | | | | | | |
| | | | | | | | | | | | 4,858,480 | |
Banks — 0.2% | | | | | | | | | |
Bank of America Corp. | | | | | | | 274,531 | | | | 6,476,186 | |
Citigroup, Inc. | | | | | | | 104,453 | | | | 6,248,378 | |
JPMorgan Chase & Co. | | | | | | | 68,489 | | | | 6,016,074 | |
Wells Fargo & Co. | | | | | | | 64,383 | | | | 3,583,558 | |
| | | | | | | | | | | | |
| | | | | | | | | | | | 22,324,196 | |
Capital Markets — 0.0% | | | | | | | | | |
Goldman Sachs Group, Inc. | | | | | | | 11,890 | | | | 2,731,371 | |
Morgan Stanley | | | | | | | 47,182 | | | | 2,021,277 | |
| | | | | | | | | | | | |
| | | | | | | | | | | | 4,752,648 | |
Diversified Financial Services — 0.0% | | | | | | | | | |
Concrete Investment I SCA (d)(e) | | | | | | | 11,296 | | | | 1,259,289 | |
Concrete Investment I SCA (d)(e) | | | | | | | 11,296 | | | | — | |
Concrete Investment II SCA (d)(e) | | | | | | | 12,471 | | | | — | |
| | | | | | | | | | | | |
| | | | | | | | | | | | 1,259,289 | |
Diversified Telecommunication Services — 0.0% | | | | | |
Telecom Italia SpA (d) | | | | | | | 786,112 | | | | 707,649 | |
Energy Equipment & Services — 0.0% | | | | | | | | | |
Vantage Drilling Co. (d) | | | | | | | 311,000 | | | | 6,220 | |
Health Care Providers & Services — 0.1% | | | | | |
UnitedHealth Group, Inc. | | | | | | | 30,145 | | | | 4,944,081 | |
Hotels, Restaurants & Leisure — 0.0% | | | | | |
Boyd Gaming Corp. (d) | | | | | | | 92,678 | | | | 2,039,843 | |
Metals & Mining — 0.0% | | | | | |
Northern Graphite Corp. (d) | | | | | | | 99,612 | | | | 23,595 | |
Multiline Retail — 0.0% | | | | | |
Dollar General Corp. | | | | | | | 25,184 | | | | 1,756,080 | |
See Notes to Consolidated Financial Statements.
| | | | | | |
| 50 | | BLACKROCK BALANCED CAPITAL FUND, INC. | | MARCH 31, 2017 | | |
| | | | |
| Consolidated Schedule of Investments (continued) | | | Master Total Return Portfolio | |
| | | | | | | | | | | | |
| Common Stocks | | | | | Shares | | | Value | |
Oil, Gas & Consumable Fuels — 0.1% | | | | | | | | | | | | |
Concho Resources, Inc. (d) | | | | | | | 17,039 | | | $ | 2,186,785 | |
Matador Resources Co. (d)(f) | | | | | | | 103,340 | | | | 2,458,459 | |
Pioneer Natural Resources Co. | | | | | | | 11,639 | | | | 2,167,531 | |
| | | | | | | | | | | | |
| | | | | | | | | | | | 6,812,775 | |
Technology Hardware, Storage & Peripherals — 0.0% | | | | | | | | | |
Apple Inc. | | | | | | | 22,084 | | | | 3,172,587 | |
Thrifts & Mortgage Finance — 0.1% | | | | | | | | | | | | |
MGIC Investment Corp. | | | | | | | 520,689 | | | | 5,274,580 | |
Total Common Stocks — 0.6% | | | | | | | | | | | 57,932,023 | |
| | | | | | | | | | | | |
| Corporate Bonds | | | | | Par (000) | | | | |
Aerospace & Defense — 0.4% | | | | | | | | | | | | |
BAE Systems Holdings, Inc.: | | | | | | | | | | | | |
2.85%, 12/15/20 (b) | | | USD | | | | 1,372 | | | | 1,385,105 | |
4.75%, 10/07/44 (b) | | | | | | | 259 | | | | 270,186 | |
Lockheed Martin Corp.: | | | | | | | | | | | | |
3.55%, 1/15/26 | | | | | | | 1,596 | | | | 1,622,085 | |
3.60%, 3/01/35 | | | | | | | 2,117 | | | | 2,018,183 | |
4.50%, 5/15/36 | | | | | | | 632 | | | | 671,204 | |
4.07%, 12/15/42 | | | | | | | 2,100 | | | | 2,061,492 | |
4.70%, 5/15/46 | | | | | | | 1,837 | | | | 1,989,754 | |
Meccanica Holdings USA, Inc.: | | | | | | | | | | | | |
6.25%, 7/15/19 (b) | | | | | | | 1,254 | | | | 1,351,185 | |
7.38%, 7/15/39 (b) | | | | | | | 150 | | | | 170,250 | |
6.25%, 1/15/40 (b) | | | | | | | 1,220 | | | | 1,287,100 | |
Northrop Grumman Corp., 3.85%, 4/15/45 | | | | | | | 2,310 | | | | 2,174,627 | |
Rockwell Collins, Inc., 3.20%, 3/15/24 | | | | | | | 10,688 | | | | 10,675,794 | |
United Technologies Corp.: | | | | | | | | | | | | |
1.78%, 5/04/18 (c) | | | | | | | 8,656 | | | | 8,653,550 | |
4.15%, 5/15/45 | | | | | | | 2,411 | | | | 2,416,504 | |
| | | | | | | | | | | | |
| | | | | | | | | | | | 36,747,019 | |
Air Freight & Logistics — 0.2% | | | | | | | | | | | | |
FedEx Corp.: | | | | | | | | | | | | |
4.90%, 1/15/34 | | | | | | | 2,970 | | | | 3,182,753 | |
3.90%, 2/01/35 | | | | | | | 392 | | | | 376,772 | |
4.10%, 2/01/45 | | | | | | | 2,759 | | | | 2,555,309 | |
4.75%, 11/15/45 | | | | | | | 7,278 | | | | 7,453,829 | |
4.55%, 4/01/46 | | | | | | | 3,298 | | | | 3,295,523 | |
4.40%, 1/15/47 | | | | | | | 4,784 | | | | 4,651,110 | |
| | | | | | | | | | | | |
| | | | | | | | | | | | 21,515,296 | |
Airlines — 0.4% | | | | | | | | | | | | |
American Airlines Group, Inc.,
4.63%, 3/01/20 (b) | | | | | | | 3,144 | | | | 3,195,090 | |
American Airlines Pass-Through Trust, Series 2015-1, Class A, 3.38%, 5/01/27 | | | | | | | 8,392 | | | | 8,224,010 | |
Avianca Holdings SA/Avianca Leasing LLC/Grupo Taca Holdings Ltd.,
8.38%, 5/10/20 | | | | | | | 1,017 | | | | 1,010,389 | |
Delta Air Lines, Inc., 2.88%, 3/13/20 | | | | | | | 23,797 | | | | 23,989,651 | |
Turkish Airlines Pass-Through Trust, Series 2015-1, Class A, 4.20%, 9/15/28 (b) | | | | | | | 1,760 | | | | 1,653,965 | |
United Airlines Pass-Through Trust, Series 2014-1, Class B, 4.75%, 10/11/23 | | | | | | | 455 | | | | 463,624 | |
Virgin Australia Holdings Ltd.,
7.88%, 10/15/21 | | | | | | | 1,200 | | | | 1,245,000 | |
| | | | | | | | | | | | |
| | | | | | | | | | | | 39,781,729 | |
Auto Components — 0.1% | | | | | | | | | | | | |
Delphi Automotive PLC: | | | | | | | | | | | | |
4.25%, 1/15/26 | | | | | | | 3,630 | | | | 3,789,433 | |
| | | | | | | | | | | | |
| Corporate Bonds | | | | | Par
(000) | | | Value | |
Auto Components (continued) | | | | | | | | | | | | |
4.40%, 10/01/46 | | | USD | | | | 1,845 | | | $ | 1,757,910 | |
Federal-Mogul Holdings LLC, 4.55%, 4/15/24 (a) | | | EUR | | | | 986 | | | | 1,046,893 | |
ZF North America Capital, Inc., 2.75%, 4/27/23 | | | | | | | 800 | | | | 908,703 | |
| | | | | | | | | | | | |
| | | | | | | | | | | | 7,502,939 | |
Automobiles — 0.3% | | | | | | | | | | | | |
Ford Motor Credit Co. LLC, 3.81%, 1/09/24 | | | USD | | | | 20,953 | | | | 21,019,840 | |
Volkswagen International Finance NV: | | | | | | | | | | | | |
0.02%, 3/30/19 (a) | | | EUR | | | | 2,900 | | | | 3,098,395 | |
0.50%, 3/30/21 | | | | | | | 2,600 | | | | 2,775,502 | |
| | | | | | | | | | | | |
| | | | | | | | | | | | 26,893,737 | |
Banks — 7.1% | | | | | | | | | | | | |
Al Ahli Bank of Kuwait KSCP, 3.50%, 4/05/22 | | | USD | | | | 600 | | | | 599,370 | |
Allied Irish Banks PLC, 4.13%, 11/26/25 (a) | | | EUR | | | | 825 | | | | 922,182 | |
Banco Espirito Santo SA: | | | | | | | | | | | | |
2.63%, 5/08/17 (d)(g) | | | | | | | 400 | | | | 123,749 | |
4.75%, 1/15/18 (d)(g) | | | | | | | 2,200 | | | | 680,620 | |
4.00%, 1/21/19 (d)(g) | | | | | | | 6,300 | | | | 1,949,049 | |
Bank of America Corp.: | | | | | | | | | | | | |
2.25%, 4/21/20 | | | USD | | | | 7,485 | | | | 7,465,165 | |
3.30%, 1/11/23 | | | | | | | 7,777 | | | | 7,825,264 | |
3.88%, 8/01/25 | | | | | | | 13,368 | | | | 13,604,975 | |
3.50%, 4/19/26 | | | | | | | 10,681 | | | | 10,532,855 | |
3.25%, 10/21/27 | | | | | | | 4,930 | | | | 4,692,561 | |
4.88%, 4/01/44 | | | | | | | 901 | | | | 971,766 | |
4.44%, 1/20/48 (a) | | | | | | | 17,820 | | | | 17,935,188 | |
Bank of Ireland, 4.25%, 6/11/24 (a) | | | EUR | | | | 1,170 | | | | 1,306,199 | |
Bankia SA: | | | | | | | | | | | | |
4.00%, 5/22/24 (a) | | | | | | | 4,800 | | | | 5,289,186 | |
3.38%, 3/15/27 (a) | | | | | | | 400 | | | | 430,266 | |
Barclays PLC: | | | | | | | | | | | | |
2.63%, 11/11/25 (a) | | | | | | | 420 | | | | 451,740 | |
4.95%, 1/10/47 | | | USD | | | | 7,178 | | | | 7,170,198 | |
BB&T Corp.: | | | | | | | | | | | | |
2.45%, 1/15/20 | | | | | | | 4,200 | | | | 4,242,874 | |
2.75%, 4/01/22 | | | | | | | 41,470 | | | | 41,723,465 | |
BNP Paribas SA, 3.80%, 1/10/24 (b) | | | | | | | 5,362 | | | | 5,335,866 | |
Branch Banking & Trust Co., 2.30%, 10/15/18 | | | | | | | 1,855 | | | | 1,867,926 | |
Citigroup, Inc.: | | | | | | | | | | | | |
1.80%, 2/05/18 | | | | | | | 6,961 | | | | 6,964,578 | |
2.50%, 9/26/18 | | | | | | | 8,073 | | | | 8,145,165 | |
2.50%, 7/29/19 | | | | | | | 10,612 | | | | 10,707,773 | |
2.90%, 12/08/21 | | | | | | | 59,540 | | | | 59,767,086 | |
3.50%, 5/15/23 | | | | | | | 4,389 | | | | 4,420,877 | |
3.88%, 3/26/25 | | | | | | | 4,740 | | | | 4,709,005 | |
3.89%, 1/10/28 (a) | | | | | | | 10,521 | | | | 10,567,892 | |
4.13%, 7/25/28 | | | | | | | 7,648 | | | | 7,520,653 | |
4.75%, 5/18/46 | | | | | | | 12,750 | | | | 12,595,445 | |
Citizens Bank N.A.: | | | | | | | | | | | | |
2.30%, 12/03/18 | | | | | | | 2,754 | | | | 2,767,742 | |
2.25%, 3/02/20 | | | | | | | 14,776 | | | | 14,754,782 | |
Dah Sing Bank Ltd., 4.25%, 11/30/26 (a) | | | | | | | 700 | | | | 706,535 | |
Fifth Third Bank, 2.25%, 6/14/21 | | | | | | | 7,204 | | | | 7,122,263 | |
HSBC Holdings PLC: | | | | | | | | | | | | |
2.65%, 1/05/22 | | | | | | | 26,189 | | | | 25,855,457 | |
4.04%, 3/13/28 (a) | | | | | | | 8,877 | | | | 8,973,067 | |
ICICI Bank Ltd., 4.00%, 3/18/26 | | | | | | | 229 | | | | 227,940 | |
ING Groep NV, 3.95%, 3/29/27 | | | | | | | 7,837 | | | | 7,855,542 | |
Intesa Sanpaolo SpA: | | | | | | | | | | | | |
6.63%, 9/13/23 | | | EUR | | | | 2,575 | | | | 3,247,193 | |
3.93%, 9/15/26 | | | | | | | 1,790 | | | | 1,965,299 | |
JPMorgan Chase & Co.: | | | | | | | | | | | | |
2.20%, 10/22/19 | | | USD | | | | 3,691 | | | | 3,708,905 | |
See Notes to Consolidated Financial Statements.
| | | | | | |
| | | BLACKROCK BALANCED CAPITAL FUND, INC. | | MARCH 31, 2017 | | 51 |
| | |
| Consolidated Schedule of Investments (continued) | | Master Total Return Portfolio |
| | | | | | | | | | | | |
| Corporate Bonds | | | | | Par
(000) | | | Value | |
Banks (continued) | | | | | | | | | | | | |
2.75%, 6/23/20 | | | USD | | | | 3,909 | | | $ | 3,959,981 | |
2.55%, 10/29/20 | | | | | | | 7,880 | | | | 7,915,113 | |
2.97%, 1/15/23 | | | | | | | 32,480 | | | | 32,454,211 | |
3.88%, 9/10/24 | | | | | | | 8,950 | | | | 9,071,559 | |
3.90%, 7/15/25 | | | | | | | 4,236 | | | | 4,378,656 | |
3.20%, 6/15/26 | | | | | | | 6,593 | | | | 6,401,513 | |
4.25%, 10/01/27 | | | | | | | 3,750 | | | | 3,841,957 | |
3.78%, 2/01/28 (a) | | | | | | | 21,780 | | | | 21,985,516 | |
Lloyds Banking Group PLC, 3.75%, 1/11/27 | | | | | | | 5,024 | | | | 4,938,949 | |
Mitsubishi UFJ Financial Group, Inc.,
3.00%, 2/22/22 | | | | | | | 12,326 | | | | 12,406,513 | |
Mizuho Financial Group, Inc., 2.95%, 2/28/22 | | | | | | | 36,366 | | | | 36,379,019 | |
Royal Bank of Scotland Group PLC,
3.88%, 9/12/23 | | | | | | | 19,834 | | | | 19,547,597 | |
Santander UK Group Holdings PLC,
2.88%, 8/05/21 | | | | | | | 14,289 | | | | 14,103,043 | |
Shinhan Bank, 3.88%, 12/07/26 (a) | | | | | | | 1,060 | | | | 1,076,251 | |
Sumitomo Mitsui Trust Bank Ltd.,
2.05%, 3/06/19 (b) | | | | | | | 44,355 | | | | 44,289,931 | |
Turkiye Sinai Kalkinma Bankasi AS,
7.63%, 3/29/27 (a) | | | | | | | 333 | | | | 337,995 | |
U.S. Bancorp, 2.95%, 7/15/22 | | | | | | | 7,244 | | | | 7,313,209 | |
UniCredit SpA: | | | | | | | | | | | | |
6.95%, 10/31/22 | | | EUR | | | | 200 | | | | 250,641 | |
5.75%, 10/28/25 (a) | | | | | | | 3,840 | | | | 4,411,998 | |
Unione di Banche Italiane SpA,
4.45%, 9/15/27 (a) | | | | | | | 550 | | | | 588,344 | |
Vietnam Joint Stock Commercial Bank for Industry and Trade, 8.00%, 5/17/17 | | | USD | | | | 200 | | | | 201,000 | |
Washington Mutual Bank: | | | | | | | | | | | | |
0.00%, 5/01/09 (d)(g) | | | | | | | 13,308 | | | | 2,944,395 | |
0.00%, 11/06/09 (d)(g) | | | | | | | 11,911 | | | | 2,635,309 | |
0.00%, 6/16/10 (d)(g) | | | | | | | 3,115 | | | | 689,194 | |
0.00%, 2/04/11 (d)(g) | | | | | | | 2,570 | | | | 568,613 | |
Wells Fargo & Co.: | | | | | | | | | | | | |
2.60%, 7/22/20 | | | | | | | 4,233 | | | | 4,274,856 | |
2.55%, 12/07/20 | | | | | | | 3,376 | | | | 3,393,120 | |
2.10%, 7/26/21 | | | | | | | 19,710 | | | | 19,304,408 | |
3.55%, 9/29/25 | | | | | | | 5,795 | | | | 5,837,854 | |
3.00%, 10/23/26 | | | | | | | 6,839 | | | | 6,548,021 | |
3.90%, 5/01/45 | | | | | | | 4,985 | | | | 4,772,898 | |
4.90%, 11/17/45 | | | | | | | 1,903 | | | | 1,984,119 | |
4.75%, 12/07/46 | | | | | | | 10,124 | | | | 10,342,871 | |
Westpac Banking Corp., 2.15%, 3/06/20 | | | | | | | 61,510 | | | | 61,546,598 | |
Woori Bank, 4.75%, 4/30/24 | | | | | | | 1,800 | | | | 1,857,643 | |
Yamaguchi Financial Group, Inc.,
0.65%, 3/26/20 (a)(h) | | | | | | | 1,000 | | | | 1,034,750 | |
| | | | | | | | | | | | |
| | | | | | | | | | | | 701,291,308 | |
Beverages — 0.6% | | | | | | | | | | | | |
Anheuser-Busch InBev Finance, Inc.: | | | | | | | | | | | | |
2.65%, 2/01/21 | | | | | | | 11,072 | | | | 11,155,261 | |
3.30%, 2/01/23 | | | | | | | 6,425 | | | | 6,539,436 | |
4.70%, 2/01/36 | | | | | | | 2,580 | | | | 2,729,534 | |
4.90%, 2/01/46 | | | | | | | 26,463 | | | | 28,599,199 | |
Anheuser-Busch InBev SA/NV,
2.00%, 3/17/28 | | | EUR | | | | 1,400 | | | | 1,561,201 | |
Anheuser-Busch InBev Worldwide, Inc.,
3.75%, 7/15/42 | | | USD | | | | 1,513 | | | | 1,385,622 | |
Central American Bottling Corp.,
5.75%, 1/31/27 (b) | | | | | | | 1,098 | | | | 1,138,033 | |
Molson Coors Brewing Co.: | | | | | | | | | | | | |
5.00%, 5/01/42 | | | | | | | 1,111 | | | | 1,171,998 | |
4.20%, 7/15/46 | | | | | | | 2,303 | | | | 2,156,557 | |
| | | | | | | | | | | | |
| | | | | | | | | | | | 56,436,841 | |
| | | | | | | | | | | | |
| Corporate Bonds | | | | | Par
(000) | | | Value | |
Biotechnology — 0.5% | | | | | | | | | | | | |
AbbVie, Inc.: | | | | | | | | | | | | |
2.50%, 5/14/20 | | | USD | | | | 6,302 | | | $ | 6,344,967 | |
2.90%, 11/06/22 | | | | | | | 5,173 | | | | 5,153,601 | |
4.50%, 5/14/35 | | | | | | | 2,860 | | | | 2,840,283 | |
Amgen, Inc.: | | | | | | | | | | | | |
2.13%, 5/01/20 | | | | | | | 4,058 | | | | 4,058,069 | |
4.40%, 5/01/45 | | | | | | | 6,271 | | | | 6,086,890 | |
Gilead Sciences, Inc.: | | | | | | | | | | | | |
2.35%, 2/01/20 | | | | | | | 1,209 | | | | 1,218,470 | |
2.50%, 9/01/23 | | | | | | | 3,486 | | | | 3,372,722 | |
3.65%, 3/01/26 | | | | | | | 931 | | | | 939,450 | |
4.60%, 9/01/35 | | | | | | | 1,057 | | | | 1,088,943 | |
4.80%, 4/01/44 | | | | | | | 6,729 | | | | 6,950,633 | |
4.50%, 2/01/45 | | | | | | | 2,446 | | | | 2,413,038 | |
4.75%, 3/01/46 | | | | | | | 2,685 | | | | 2,738,679 | |
4.15%, 3/01/47 | | | | | | | 5,361 | | | | 4,999,524 | |
| | | | | | | | | | | | |
| | | | | | | | | | | | 48,205,269 | |
Building Products — 0.1% | | | | | | | | | | | | |
Johnson Controls International PLC: | | | | | | | | | | | | |
5.13%, 9/14/45 | | | | | | | 5,000 | | | | 5,528,945 | |
4.50%, 2/15/47 | | | | | | | 1,625 | | | | 1,649,312 | |
LIXIL Group Corp., 0.00%, 3/04/20 (h)(i) | | | JPY | | | | 60,000 | | | | 553,624 | |
| | | | | | | | | | | | |
| | | | | | | | | | | | 7,731,881 | |
Capital Markets — 2.4% | | | | | | | | | | | | |
Bagan Capital Ltd., 0.00%, 9/23/21 (h)(i) | | | USD | | | | 1,800 | | | | 1,854,000 | |
Bank of New York Mellon Corp.: | | | | | | | | | | | | |
2.10%, 1/15/19 | | | | | | | 6,780 | | | | 6,830,247 | |
2.05%, 5/03/21 | | | | | | | 28,042 | | | | 27,672,210 | |
Credit Suisse AG: | | | | | | | | | | | | |
3.00%, 10/29/21 | | | | | | | 2,841 | | | | 2,866,910 | |
5.75%, 9/18/25 (a) | | | EUR | | | | 1,530 | | | | 1,828,074 | |
Credit Suisse Group AG, 4.28%, 1/09/28 (b) | | | USD | | | | 2,313 | | | | 2,302,941 | |
Credit Suisse Group Funding Guernsey Ltd.: | | | | | | | | | | | | |
2.75%, 3/26/20 | | | | | | | 7,681 | | | | 7,692,644 | |
4.88%, 5/15/45 | | | | | | | 2,635 | | | | 2,681,202 | |
Goldman Sachs Group, Inc.: | | | | | | | | | | | | |
2.63%, 1/31/19 | | | | | | | 10,208 | | | | 10,323,116 | |
2.00%, 4/25/19 | | | | | | | 2,308 | | | | 2,303,737 | |
2.60%, 4/23/20 | | | | | | | 5,099 | | | | 5,127,723 | |
2.75%, 9/15/20 | | | | | | | 2,492 | | | | 2,512,644 | |
2.63%, 4/25/21 | | | | | | | 4,993 | | | | 4,979,334 | |
2.35%, 11/15/21 | | | | | | | 14,988 | | | | 14,678,992 | |
3.50%, 1/23/25 | | | | | | | 3,983 | | | | 3,967,665 | |
3.75%, 5/22/25 | | | | | | | 5,768 | | | | 5,839,108 | |
3.85%, 1/26/27 | | | | | | | 16,188 | | | | 16,266,949 | |
4.80%, 7/08/44 | | | | | | | 1,798 | | | | 1,898,668 | |
4.75%, 10/21/45 | | | | | | | 1,231 | | | | 1,296,914 | |
Haitong International Securities Group Ltd.,
0.00%, 10/25/21 (h)(i) | | | HKD | | | | 12,000 | | | | 1,567,265 | |
Jefferies Group LLC, 6.50%, 1/20/43 | | | USD | | | | 1,239 | | | | 1,343,992 | |
Moody’s Corp., 2.75%, 12/15/21 | | | | | | | 6,246 | | | | 6,236,300 | |
Morgan Stanley: | | | | | | | | | | | | |
2.80%, 6/16/20 | | | | | | | 8,614 | | | | 8,718,488 | |
2.63%, 11/17/21 | | | | | | | 35,559 | | | | 35,324,666 | |
3.75%, 2/25/23 | | | | | | | 5,956 | | | | 6,150,785 | |
3.70%, 10/23/24 | | | | | | | 6,314 | | | | 6,404,745 | |
4.00%, 7/23/25 | | | | | | | 11,093 | | | | 11,438,536 | |
3.88%, 1/27/26 | | | | | | | 2,070 | | | | 2,097,531 | |
4.38%, 1/22/47 | | | | | | | 17,686 | | | | 17,698,805 | |
State Street Corp., 2.65%, 5/19/26 | | | | | | | 9,906 | | | | 9,490,047 | |
UBS AG, 4.75%, 5/22/23 (a) | | | | | | | 625 | | | | 639,063 | |
See Notes to Consolidated Financial Statements.
| | | | | | |
| 52 | | BLACKROCK BALANCED CAPITAL FUND, INC. | | MARCH 31, 2017 | | |
| | | | |
| Consolidated Schedule of Investments (continued) | | | Master Total Return Portfolio | |
| | | | | | | | | | | | |
| Corporate Bonds | | | | | Par
(000) | | | Value | |
Capital Markets (continued) | | | | | | | | | | | | |
UBS Group Funding Jersey Ltd.,
4.13%, 9/24/25 (b) | | | USD | | | | 2,534 | | | $ | 2,576,873 | |
| | | | | | | | | | | | |
| | | | | | | | | | | | 232,610,174 | |
Chemicals — 0.1% | | | | | | | | | | | | |
Agrium, Inc., 4.13%, 3/15/35 (j) | | | | | | | 2,135 | | | | 2,045,785 | |
Dow Chemical Co.: | | | | | | | | | | | | |
4.38%, 11/15/42 | | | | | | | 1,370 | | | | 1,346,610 | |
4.63%, 10/01/44 | | | | | | | 2,072 | | | | 2,125,012 | |
Eastman Chemical Co., 4.80%, 9/01/42 | | | | | | | 2,205 | | | | 2,260,981 | |
Kansai Paint Co. Ltd.: | | | | | | | | | | | | |
0.00%, 6/17/19 (h)(i) | | | JPY | | | | 50,000 | | | | 483,922 | |
0.00%, 6/17/22 (h)(i) | | | | | | | 30,000 | | | | 281,258 | |
Mitsubishi Chemical Holdings Corp.: | | | | | | | | | | | | |
0.00%, 3/30/22 (h)(i) | | | | | | | 50,000 | | | | 461,241 | |
0.00%, 3/29/24 (h)(i) | | | | | | | 40,000 | | | | 369,263 | |
Monsanto Co., 3.60%, 7/15/42 | | | USD | | | | 2,845 | | | | 2,415,579 | |
PSPC Escrow Corp., 6.00%, 1/02/23 | | | EUR | | | | 181 | | | | 198,438 | |
Rock International Investment, Inc.,
6.63%, 3/27/20 | | | USD | | | | 760 | | | | 761,850 | |
Sherwin-Williams Co., 4.00%, 12/15/42 | | | | | | | 971 | | | | 897,577 | |
| | | | | | | | | | | | |
| | | | | | | | | | | | 13,647,516 | |
Commercial Services & Supplies — 0.1% | | | | | | | | | |
Aviation Capital Group Corp., 2.88%, 9/17/18 (b) | | | | | | | 6,335 | | | | 6,398,521 | |
Bilbao Luxembourg SA, 10.50% (10.50% Cash or 11.25% PIK), 12/01/18 (k) | | | EUR | | | | 295 | | | | 323,402 | |
Cia Latinoamericana de Infraestructura & Servicios SA, 9.50%, 7/20/23 (b) | | | USD | | | | 102 | | | | 104,550 | |
Transfield Services Ltd.,
8.38%, 5/15/20 (b) | | | | | | | 200 | | | | 209,000 | |
Waste Management, Inc., 3.90%, 3/01/35 | | | | | | | 2,526 | | | | 2,508,699 | |
| | | | | | | | | | | | |
| | | | | | | | | | | | 9,544,172 | |
Communications Equipment — 0.0% | | | | | | | | | |
Harris Corp., 2.70%, 4/27/20 | | | | | | | 1,299 | | | | 1,310,946 | |
Juniper Networks, Inc., 3.30%, 6/15/20 | | | | | | | 2,728 | | | | 2,790,250 | |
| | | | | | | | | | | | |
| | | | | | | | | | | | 4,101,196 | |
Construction & Engineering — 0.0% | | | | | | | | | | | | |
China City Construction International Co. Ltd., 5.35%, 7/03/17 (d)(g) | | | CNH | | | | 676 | | | | 59,572 | |
China Singyes Solar Technologies Holdings Ltd., 7.95%, 2/15/19 | | | USD | | | | 550 | | | | 563,558 | |
GS Engineering & Construction Corp.,
4.50%, 7/21/21 (h) | | | | | | | 600 | | | | 645,000 | |
Kandenko Co. Ltd., 0.00%, 3/31/21 (h)(i) | | | JPY | | | | 30,000 | | | | 292,374 | |
Shimizu Corp., 0.00%, 10/16/20 (h)(i) | | | | | | | 50,000 | | | | 480,441 | |
| | | | | | | | | | | | |
| | | | | | | | | | | | 2,040,945 | |
Construction Materials — 0.1% | | | | | | | | | | | | |
Cemex Finance LLC, 9.38%, 10/12/22 (b) | | | USD | | | | 697 | | | | 753,109 | |
LafargeHolcim Finance U.S. LLC,
4.75%, 9/22/46 (b) | | | | | | | 6,995 | | | | 7,002,611 | |
Tecnoglass, Inc., 8.20%, 1/31/22 (b) | | | | | | | 2,091 | | | | 2,185,095 | |
| | | | | | | | | | | | |
| | | | | | | | | | | | 9,940,815 | |
Consumer Finance — 1.2% | | | | | | | | | | | | |
American Express Credit Corp.: | | | | | | | | | | | | |
1.13%, 6/05/17 | | | | | | | 10,032 | | | | 10,032,391 | |
2.25%, 8/15/19 | | | | | | | 6,261 | | | | 6,310,362 | |
Capital One Bank USA N.A., 2.30%, 6/05/19 | | | | | | | 1,000 | | | | 1,002,113 | |
Capital One Financial Corp.: | | | | | | | | | | | | |
4.75%, 7/15/21 | | | | | | | 160 | | | | 172,079 | |
3.75%, 7/28/26 | | | | | | | 2,692 | | | | 2,606,874 | |
Capital One N.A., 2.40%, 9/05/19 | | | | | | | 650 | | | | 652,043 | |
Discover Bank, 3.45%, 7/27/26 | | | | | | | 4,992 | | | | 4,792,005 | |
| | | | | | | | | | | | |
| Corporate Bonds | | | | | Par
(000) | | | Value | |
Consumer Finance (continued) | | | | | | | | | | | | |
Discover Financial Services, 4.10%, 2/09/27 | | | USD | | | | 10,132 | | | $ | 10,135,414 | |
Ford Motor Credit Co. LLC: | | | | | | | | | | | | |
1.72%, 12/06/17 | | | | | | | 24,350 | | | | 24,349,683 | |
2.15%, 1/09/18 | | | | | | | 5,342 | | | | 5,355,574 | |
General Motors Financial Co., Inc.: | | | | | | | | | | | | |
2.63%, 7/10/17 | | | | | | | 6,640 | | | | 6,658,712 | |
4.75%, 8/15/17 | | | | | | | 4,115 | | | | 4,159,722 | |
3.10%, 1/15/19 | | | | | | | 1,546 | | | | 1,570,940 | |
3.70%, 11/24/20 | | | | | | | 4,313 | | | | 4,440,682 | |
3.20%, 7/06/21 | | | | | | | 15,382 | | | | 15,440,359 | |
4.00%, 1/15/25 | | | | | | | 6,362 | | | | 6,393,899 | |
Synchrony Financial: | | | | | | | | | | | | |
2.60%, 1/15/19 | | | | | | | 3,356 | | | | 3,382,210 | |
2.70%, 2/03/20 | | | | | | | 1,986 | | | | 1,993,964 | |
4.50%, 7/23/25 | | | | | | | 4,007 | | | | 4,112,144 | |
| | | | | | | | | | | | |
| | | | | | | | | | | | 113,561,170 | |
Containers & Packaging — 0.0% | | | | | | | | | |
Ball Corp., 4.38%, 12/15/23 | | | EUR | | | | 300 | | | | 354,109 | |
Diversified Consumer Services — 0.1% | | | | | | | | | | | | |
Massachusetts Institute of Technology: | | | | | | | | | | | | |
3.96%, 7/01/38 | | | USD | | | | 1,385 | | | | 1,464,423 | |
3.89%, 7/01/99 | | | | | | | 1,585 | | | | 1,376,790 | |
University of Southern California, 3.03%, 10/01/39 | | | | | | | 5,336 | | | | 4,815,174 | |
Wesleyan University, 4.78%, 7/01/16 | | | | | | | 2,607 | | | | 2,414,025 | |
| | | | | | | | | | | | |
| | | | | | | | | | | | 10,070,412 | |
Diversified Financial Services — 1.6% | | | | | | | | | |
ABQ Finance Ltd., 3.50%, 2/22/22 | | | | | | | 1,700 | | | | 1,690,429 | |
AerCap Ireland Capital DAC/AerCap Global Aviation Trust: | | | | | | | | | | | | |
4.63%, 10/30/20 | | | | | | | 12,390 | | | | 13,093,913 | |
3.50%, 5/26/22 | | | | | | | 14,561 | | | | 14,672,013 | |
Annington Finance No. 4 PLC,
1.33%, 1/10/23 (a) | | | GBP | | | | 1 | | | | 795 | |
AYC Finance Ltd., 0.50%, 5/02/19 (h) | | | USD | | | | 600 | | | | 606,750 | |
BHP Billiton Finance USA Ltd.,
5.00%, 9/30/43 (l) | | | | | | | 5,540 | | | | 6,203,936 | |
BP Capital Markets PLC, 2.24%, 5/10/19 | | | | | | | 8,103 | | | | 8,153,344 | |
BPE Financiaciones SA, 2.00%, 2/03/20 | | | EUR | | | | 4,000 | | | | 4,277,454 | |
CK Hutchison International 17 Ltd.: | | | | | | | | | | | | |
2.88%, 4/05/22 | | | USD | | | | 2,550 | | | | 2,551,369 | |
3.50%, 4/05/27 | | | | | | | 1,500 | | | | 1,495,609 | |
Garfunkelux Holdco 3 SA, 8.50%, 11/01/22 | | | GBP | | | | 325 | | | | 431,786 | |
Glencore Funding LLC, 4.00%, 3/27/27 (b) | | | USD | | | | 12,200 | | | | 12,044,377 | |
Gohl Capital Ltd., 4.25%, 1/24/27 | | | | | | | 1,100 | | | | 1,111,003 | |
HNAG Funding Ltd., 2.87%, 2/04/20 | | | | | | | 225 | | | | 224,559 | |
Hyundai Capital America, 2.55%, 4/03/20 (b) | | | | | | | 21,316 | | | | 21,316,320 | |
Iceland Bondco PLC, 6.75%, 7/15/24 | | | GBP | | | | 400 | | | | 534,987 | |
Jerrold Finco PLC, 6.13%, 1/15/24 | | | | | | | 1,100 | | | | 1,369,012 | |
Mercury Bondco PLC, 7.13% (7.13% Cash or 7.88% PIK), 5/30/21 (k) | | | EUR | | | | 1,400 | | | | 1,499,125 | |
Prime Bloom Holdings Ltd., 7.50%, 12/19/19 | | | USD | | | | 400 | | | | 413,797 | |
Reward International Investment Ltd.,
7.25%, 1/25/20 | | | | | | | 245 | | | | 248,674 | |
Santander Issuances SAU, 3.25%, 4/04/26 | | | EUR | | | | 1,100 | | | | 1,220,861 | |
Shell International Finance BV: | | | | | | | | | | | | |
3.25%, 5/11/25 | | | USD | | | | 2,075 | | | | 2,095,140 | |
4.13%, 5/11/35 | | | | | | | 7,018 | | | | 7,071,449 | |
3.63%, 8/21/42 | | | | | | | 2,135 | | | | 1,926,601 | |
Siemens Financieringsmaatschappij NV,
3.13%, 3/16/24 (b) | | | | | | | 31,758 | | | | 31,985,133 | |
UBS Group Funding Switzerland AG,
4.25%, 3/23/28 (b) | | | | | | | 16,431 | | | | 16,666,440 | |
See Notes to Consolidated Financial Statements.
| | | | | | |
| | | BLACKROCK BALANCED CAPITAL FUND, INC. | | MARCH 31, 2017 | | 53 |
| | | | |
| Consolidated Schedule of Investments (continued) | | | Master Total Return Portfolio | |
| | | | | | | | | | | | |
| Corporate Bonds | | | | | Par (000) | | | Value | |
Diversified Financial Services (continued) | | | | | | | | | | | | |
Virgin Media Secured Finance PLC,
6.25%, 3/28/29 | | | GBP | | | | 1,434 | | | $ | 1,941,734 | |
Volcan Holdings PLC, 4.13%, 4/11/20 (h) | | | | | | | 2,000 | | | | 2,524,587 | |
Woodside Finance Ltd., 3.65%, 3/05/25 (b) | | | USD | | | | 562 | | | | 553,401 | |
| | | | | | | | | | | | |
| | | | | | | | | | | | 157,924,598 | |
Diversified Telecommunication Services — 0.8% | | | | | |
AT&T Inc.: | | | | | | | | | | | | |
3.80%, 3/01/24 | | | | | | | 6,495 | | | | 6,594,828 | |
5.25%, 3/01/37 | | | | | | | 6,954 | | | | 7,089,283 | |
6.38%, 3/01/41 | | | | | | | 1,994 | | | | 2,278,079 | |
4.30%, 12/15/42 | | | | | | | 1,640 | | | | 1,458,162 | |
4.75%, 5/15/46 | | | | | | | 5,672 | | | | 5,292,469 | |
Bharti Airtel International Netherlands BV,
5.13%, 3/11/23 | | | | | | | 1,071 | | | | 1,123,078 | |
Orange SA: | | | | | | | | | | | | |
3.38%, 9/16/22 | | | EUR | | | | 2,750 | | | | 3,373,396 | |
5.50%, 2/06/44 | | | | | | | 2,305 | | | | 2,620,720 | |
Telecom Italia Capital SA: | | | | | | | | | | | | |
6.38%, 11/15/33 | | | USD | | | | 709 | | | | 716,530 | |
6.00%, 9/30/34 | | | | | | | 595 | | | | 587,563 | |
Telecom Italia Finance SA, 7.75%, 1/24/33 | | | EUR | | | | 730 | | | | 1,026,305 | |
Telecom Italia SpA: | | | | | | | | | | | | |
1.13%, 3/26/22 (h) | | | | | | | 4,600 | | | | 4,801,788 | |
3.25%, 1/16/23 | | | | | | | 540 | | | | 611,214 | |
3.63%, 1/19/24 | | | | | | | 500 | | | | 565,696 | |
Telefonica Emisiones SAU, 4.10%, 3/08/27 | | | USD | | | | 9,300 | | | | 9,365,630 | |
Telenet Finance V Luxembourg SCA,
6.25%, 8/15/22 | | | EUR | | | | 100 | | | | 111,957 | |
Verizon Communications, Inc.: | | | | | | | | | | | | |
4.40%, 11/01/34 | | | USD | | | | 2,549 | | | | 2,412,098 | |
5.25%, 3/16/37 | | | | | | | 10,632 | | | | 10,992,106 | |
3.85%, 11/01/42 | | | | | | | 6,499 | | | | 5,441,359 | |
4.86%, 8/21/46 | | | | | | | 16,397 | | | | 15,764,059 | |
Ziggo Bond Finance BV, 4.63%, 1/15/25 | | | EUR | | | | 255 | | | | 282,237 | |
| | | | | | | | | | | | |
| | | | | | | | | | | | 82,508,557 | |
Electric Utilities — 0.5% | | | | | | | | | | | | |
1MDB Energy Ltd., 5.99%, 5/11/22 | | | USD | | | | 2,000 | | | | 2,159,460 | |
Baltimore Gas & Electric Co., 3.50%, 8/15/46 | | | | | | | 2,327 | | | | 2,109,595 | |
Chugoku Electric Power Co., Inc.: | | | | | | | | | | | | |
0.00%, 3/23/18 (h)(i) | | | JPY | | | | 20,000 | | | | 179,017 | |
0.00%, 3/25/20 (h)(i) | | | | | | | 10,000 | | | | 89,823 | |
Commonwealth Edison Co., 4.70%, 1/15/44 | | | USD | | | | 2,910 | | | | 3,175,607 | |
Emera U.S. Finance LP: | | | | | | | | | | | | |
2.15%, 6/15/19 | | | | | | | 4,838 | | | | 4,836,539 | |
2.70%, 6/15/21 | | | | | | | 7,299 | | | | 7,257,644 | |
Exelon Corp.: | | | | | | | | | | | | |
2.85%, 6/15/20 | | | | | | | 6,160 | | | | 6,240,758 | |
2.45%, 4/15/21 | | | | | | | 1,306 | | | | 1,290,366 | |
Generacion Mediterranea SA/Generacion Frias SA/Central Termica Roca SA,
9.63%, 7/27/23 (b) | | | | | | | 1,657 | | | | 1,757,514 | |
Great Plains Energy, Inc., 2.50%, 3/09/20 | | | | | | | 8,672 | | | | 8,708,509 | |
Kyushu Electric Power Co., Inc.,
0.00%, 3/31/22 (h)(i) | | | JPY | | | | 30,000 | | | | 280,046 | |
Pampa Energia SA, 7.50%, 1/24/27 (b) | | | USD | | | | 1,398 | | | | 1,415,825 | |
Puget Sound Energy, Inc., 4.30%, 5/20/45 | | | | | | | 4,431 | | | | 4,630,891 | |
Southern California Edison Co., 1.25%, 11/01/17 | | | | | | | 1,306 | | | | 1,304,802 | |
Tohoku Electric Power Co., Inc.: | | | | | | | | | | | | |
0.00%, 12/03/18 (h)(i) | | | JPY | | | | 10,000 | | | | 90,003 | |
0.00%, 12/03/20 (h)(i) | | | | | | | 110,000 | | | | 1,002,874 | |
Trans-Allegheny Interstate Line Co.,
3.85%, 6/01/25 (b) | | | USD | | | | 6,547 | | | | 6,706,118 | |
| | | | | | | | | | | | |
| | | | | | | | | | | | 53,235,391 | |
| | | | | | | | | | | | |
| Corporate Bonds | | | | | Par
(000) | | | Value | |
Electrical Equipment — 0.0% | | | | | | | | | | | | |
AE-Rotor Holding BV, 4.97%, 3/28/18 | | | USD | | | | 35 | | | $ | 35,004 | |
Electronic Equipment, Instruments & Components — 0.1% | | | | | |
Amphenol Corp., 3.20%, 4/01/24 | | | | | | | 3,096 | | | | 3,100,217 | |
TPK Holding Co. Ltd., 0.00%, 4/08/20 (h)(i) | | | | | | | 1,750 | | | | 1,747,813 | |
| | | | | | | | | | | | |
| | | | | | | | | | | | 4,848,030 | |
Energy Equipment & Services — 0.2% | | | | | | | | | | | | |
Halliburton Co., 3.80%, 11/15/25 | | | | | | | 6,000 | | | | 6,075,564 | |
Nabors Industries, Inc., 5.50%, 1/15/23 (b) | | | | | | | 2,547 | | | | 2,599,532 | |
Schlumberger Holdings Corp.,
3.00%, 12/21/20 (b) | | | | | | | 5,877 | | | | 6,009,379 | |
| | | | | | | | | | | | |
| | | | | | | | | | | | 14,684,475 | |
Equity Real Estate Investment Trusts (REITs) — 0.2% | | | | | |
American Tower Corp.: | | | | | | | | | | | | |
3.30%, 2/15/21 | | | | | | | 2,758 | | | | 2,796,714 | |
3.45%, 9/15/21 | | | | | | | 2,787 | | | | 2,837,269 | |
3.50%, 1/31/23 | | | | | | | 783 | | | | 787,630 | |
5.00%, 2/15/24 | | | | | | | 785 | | | | 847,751 | |
4.40%, 2/15/26 | | | | | | | 541 | | | | 559,651 | |
Cromwell SPV Finance Property Ltd.,
2.00%, 2/04/20 (h) | | | EUR | | | | 800 | | | | 849,175 | |
Crown Castle International Corp.: | | | | | | | | | | | | |
3.40%, 2/15/21 | | | USD | | | | 1,628 | | | | 1,656,013 | |
2.25%, 9/01/21 | | | | | | | 5,986 | | | | 5,819,266 | |
Suntec Real Estate Investment Trust,
1.75%, 9/05/21 (h) | | | SGD | | | | 750 | | | | 528,112 | |
Trust F/1401, 6.95%, 1/30/44 | | | USD | | | | 700 | | | | 708,050 | |
| | | | | | | | | | | | |
| | | | | | | | | | | | 17,389,631 | |
Food & Staples Retailing — 0.1% | | | | | | | | | | | | |
CVS Health Corp., 5.30%, 12/05/43 | | | | | | | 1,855 | | | | 2,073,701 | |
Walgreens Boots Alliance, Inc.: | | | | | | | | | | | | |
4.80%, 11/18/44 | | | | | | | 9,857 | | | | 10,054,564 | |
4.65%, 6/01/46 | | | | | | | 267 | | | | 265,635 | |
| | | | | | | | | | | | |
| | | | | | | | | | | | 12,393,900 | |
Food Products — 0.0% | | | | | |
Arcor SAIC, 6.00%, 7/06/23 (b) | | | | | | | 802 | | | | 852,125 | |
CP Foods Holdings Ltd., 0.50%, 9/22/21 (h) | | | | | | | 800 | | | | 801,800 | |
Ezaki Glico Co. Ltd., 0.00%, 1/30/24 (h)(i) | | | JPY | | | | 10,000 | | | | 94,314 | |
Japfa Comfeed Indonesia Tbk PT, 5.50%, 3/31/22 | | | USD | | | | 400 | | | | 398,852 | |
Marfrig Holdings Europe BV, 8.00%, 6/08/23 (b) | | | | | | | 451 | | | | 471,205 | |
Minerva Luxembourg SA, 6.50%, 9/20/26 (b) | | | | | | | 429 | | | | 419,189 | |
| | | | | | | | | | | | |
| | | | | | | | | | | | 3,037,485 | |
Gas Utilities — 0.0% | | | | | |
ENN Energy Holdings Ltd., 0.00%, 2/26/18 (h)(i) | | | | | | | 1,000 | | | | 1,065,000 | |
Health Care Equipment & Supplies — 0.3% | | | | | | | | | | | | |
Abbott Laboratories: | | | | | | | | | | | | |
2.80%, 9/15/20 | | | | | | | 2,980 | | | | 3,005,926 | |
3.88%, 9/15/25 | | | | | | | 952 | | | | 967,278 | |
Becton Dickinson and Co.: | | | | | | | | | | | | |
1.80%, 12/15/17 | | | | | | | 1,183 | | | | 1,183,883 | |
2.68%, 12/15/19 | | | | | | | 4,549 | | | | 4,613,791 | |
4.69%, 12/15/44 | | | | | | | 703 | | | | 733,828 | |
Boston Scientific Corp., 2.65%, 10/01/18 | | | | | | | 3,738 | | | | 3,774,883 | |
Medtronic, Inc.: | | | | | | | | | | | | |
2.50%, 3/15/20 | | | | | | | 3,561 | | | | 3,612,325 | |
3.63%, 3/15/24 | | | | | | | 8,093 | | | | 8,396,487 | |
4.63%, 3/15/44 | | | | | | | 3,245 | | | | 3,465,774 | |
See Notes to Consolidated Financial Statements.
| | | | | | |
| 54 | | BLACKROCK BALANCED CAPITAL FUND, INC. | | MARCH 31, 2017 | | |
| | | | |
| Consolidated Schedule of Investments (continued) | | | Master Total Return Portfolio | |
| | | | | | | | | | | | |
| Corporate Bonds | | | | | Par (000) | | | Value | |
Health Care Equipment & Supplies (continued) | | | | | | | | | |
Stryker Corp., 4.63%, 3/15/46 | | | USD | | | | 2,325 | | | $ | 2,390,851 | |
| | | | | | | | | | | | |
| | | | | | | | | | | | 32,145,026 | |
Health Care Providers & Services — 0.7% | | | | | | | | | | | | |
Aetna, Inc.: | | | | | | | | | | | | |
4.50%, 5/15/42 | | | | | | | 2,824 | | | | 2,940,888 | |
4.13%, 11/15/42 | | | | | | | 1,329 | | | | 1,307,559 | |
4.75%, 3/15/44 | | | | | | | 1,703 | | | | 1,843,337 | |
AmerisourceBergen Corp., 1.15%, 5/15/17 | | | | | | | 5,031 | | | | 5,029,440 | |
Anthem, Inc.: | | | | | | | | | | | | |
1.88%, 1/15/18 | | | | | | | 9,949 | | | | 9,956,601 | |
2.30%, 7/15/18 | | | | | | | 14,113 | | | | 14,175,775 | |
Baylor Scott & White Holdings, 4.19%, 11/15/45 | | | | | | | 1,525 | | | | 1,513,479 | |
Catholic Health Initiatives, 4.35%, 11/01/42 | | | | | | | 1,075 | | | | 916,515 | |
Cigna Corp., 3.25%, 4/15/25 | | | | | | | 7,074 | | | | 6,992,380 | |
Express Scripts Holding Co., 1.25%, 6/02/17 | | | | | | | 4,006 | | | | 4,004,438 | |
Laboratory Corp. of America Holdings,
2.63%, 2/01/20 | | | | | | | 2,946 | | | | 2,961,534 | |
New York & Presbyterian Hospital, 3.56%, 8/01/36 | | | | | | | 1,321 | | | | 1,235,111 | |
Ochsner Clinic Foundation, 5.90%, 5/15/45 | | | | | | | 1,305 | | | | 1,487,579 | |
RWJ Barnabas Health, Inc., 3.95%, 7/01/46 | | | | | | | 2,342 | | | | 2,207,187 | |
Southern Baptist Hospital of Florida, Inc.,
4.86%, 7/15/45 | | | | | | | 1,250 | | | | 1,350,065 | |
UnitedHealth Group, Inc.: | | | | | | | | | | | | |
2.70%, 7/15/20 | | | | | | | 1,721 | | | | 1,755,596 | |
4.63%, 7/15/35 | | | | | | | 689 | | | | 751,170 | |
4.20%, 1/15/47 | | | | | | | 3,410 | | | | 3,462,650 | |
| | | | | | | | | | | | |
| | | | | | | | | | | | 63,891,304 | |
Hotels, Restaurants & Leisure — 0.2% | | | | | | | | | | | | |
Cirsa Funding Luxembourg SA,
5.88%, 5/15/23 | | | EUR | | | | 500 | | | | 560,072 | |
HIS Co. Ltd., 0.00%, 8/30/19 (h)(i) | | | JPY | | | | 110,000 | | | | 992,994 | |
McDonald’s Corp.: | | | | | | | | | | | | |
4.70%, 12/09/35 | | | USD | | | | 853 | | | | 893,817 | |
4.60%, 5/26/45 | | | | | | | 1,081 | | | | 1,098,767 | |
4.88%, 12/09/45 | | | | | | | 1,005 | | | | 1,068,921 | |
4.45%, 3/01/47 | | | | | | | 4,274 | | | | 4,288,232 | |
Pizzaexpress Financing 2 PLC, 6.63%, 8/01/21 | | | GBP | | | | 700 | | | | 898,940 | |
Punch Taverns Finance B Ltd., 5.94%, 9/30/22 | | | | | | | 1,268 | | | | 1,660,280 | |
Punch Taverns Finance PLC: | | | | | | | | | | | | |
0.36%, 7/15/21 (a) | | | | | | | 58 | | | | 71,106 | |
Series M3, 5.86%, 10/15/27 (a)(b) | | | | | | | 1,145 | | | | 1,434,567 | |
Resorttrust, Inc., 0.00%, 12/01/21 (h)(i) | | | JPY | | | | 120,000 | | | | 1,088,655 | |
Stonegate Pub Co. Financing PLC,
4.88%, 3/15/22 | | | GBP | | | | 900 | | | | 1,133,245 | |
Studio City Co. Ltd., 7.25%, 11/30/21 | | | USD | | | | 600 | | | | 639,750 | |
Unique Pub Finance Co. PLC: | | | | | | | | | | | | |
Series M, 7.40%, 3/28/24 | | | GBP | | | | 1,150 | | | | 1,604,258 | |
Series A4, 5.66%, 6/30/27 | | | | | | | 2,838 | | | | 3,935,955 | |
Series N, 6.46%, 3/30/32 | | | | | | | 1,273 | | | | 1,546,913 | |
| | | | | | | | | | | | |
| | | | | | | | | | | | 22,916,472 | |
Household Durables — 0.1% | | | | | | | | | | | | |
Iida Group Holdings Co. Ltd.,
0.00%, 6/18/20 (h)(i) | | | JPY | | | | 30,000 | | | | 273,174 | |
Newell Brands, Inc., 2.88%, 12/01/19 | | | USD | | | | 6,986 | | | | 7,110,141 | |
PB International BV, 7.63%, 1/26/22 | | | | | | | 300 | | | | 310,487 | |
| | | | | | | | | | | | |
| | | | | | | | | | | | 7,693,802 | |
Household Products — 0.0% | | | | | | | | | | | | |
Unicharm Corp., 0.00%, 9/25/20 (h)(i) | | | JPY | | | | 20,000 | | | | 216,743 | |
Independent Power and Renewable Electricity Producers — 0.1% | | | | | |
AES Panama SRL, 6.00%, 6/25/22 (b) | | | USD | | | | 527 | | | | 542,810 | |
| | | | | | | | | | | | |
| Corporate Bonds | | | | | Par
(000) | | | Value | |
Independent Power and Renewable Electricity Producers (continued) | | | | | |
China Yangtze Power International BVI 1 Ltd.,
0.00%, 11/09/21 (h)(i) | | | USD | | | | 1,600 | | | $ | 1,640,000 | |
Genneia SA, 8.75%, 1/20/22 (b) | | | | | | | 700 | | | | 729,750 | |
Greenko Dutch BV, 8.00%, 8/01/19 | | | | | | | 200 | | | | 211,200 | |
Inkia Energy Ltd., 8.38%, 4/04/21 (b) | | | | | | | 702 | | | | 719,550 | |
Neerg Energy Ltd., 6.00%, 2/13/22 | | | | | | | 1,500 | | | | 1,522,433 | |
Stoneway Capital Corp., 10.00%, 3/01/27 (b) | | | | | | | 2,820 | | | | 2,940,640 | |
United Photovoltaics Group Ltd.,
8.25%, 1/25/20 | | | | | | | 207 | | | | 214,244 | |
| | | | | | | | | | | | |
| | | | | | | | | | | | 8,520,627 | |
Industrial Conglomerates — 0.3% | | | | | | | | | | | | |
Eaton Corp., 2.75%, 11/02/22 | | | | | | | 19,769 | | | | 19,631,269 | |
General Electric Co., 4.50%, 3/11/44 | | | | | | | 8,268 | | | | 8,894,706 | |
Roper Technologies, Inc., 2.80%, 12/15/21 | | | | | | | 3,867 | | | | 3,871,362 | |
Tewoo Group Finance No. 3 Ltd.,
4.63%, 4/06/20 | | | | | | | 735 | | | | 729,936 | |
| | | | | | | | | | | | |
| | | | | | | | | | | | 33,127,273 | |
Insurance — 0.7% | | | | | | | | | | | | |
Allstate Corp., 4.20%, 12/15/46 | | | | | | | 3,745 | | | | 3,787,015 | |
American International Group, Inc.: | | | | | | | | | | | | |
3.75%, 7/10/25 | | | | | | | 2,831 | | | | 2,815,212 | |
3.88%, 1/15/35 | | | | | | | 2,099 | | | | 1,917,978 | |
4.50%, 7/16/44 | | | | | | | 2,823 | | | | 2,693,924 | |
Aon PLC, 4.75%, 5/15/45 | | | | | | | 5,012 | | | | 5,006,372 | |
Assicurazioni Generali SpA,
5.50%, 10/27/47 (a) | | | EUR | | | | 1,400 | | | | 1,584,848 | |
BNP Paribas Cardif SA, 4.03% (a)(m) | | | | | | | 700 | | | | 747,270 | |
Credit Agricole Assurances SA, 4.25% (a)(m) | | | | | | | 1,100 | | | | 1,187,416 | |
ELM BV for Helvetia Schweizerische Versich- erungsgesellschaft AG,
3.38%, 9/29/47 (a) | | | | | | | 700 | | | | 741,117 | |
Marsh & McLennan Cos., Inc.: | | | | | | | | | | | | |
3.75%, 3/14/26 | | | USD | | | | 672 | | | | 691,281 | |
4.35%, 1/30/47 | | | | | | | 1,476 | | | | 1,494,843 | |
Metropolitan Life Global Funding I,
1.30%, 4/10/17 (b) | | | | | | | 24,105 | | | | 24,105,434 | |
Pension Insurance Corp. PLC,
6.50%, 7/03/24 | | | GBP | | | | 125 | | | | 159,758 | |
Principal Financial Group, Inc.,
4.30%, 11/15/46 | | | USD | | | | 7,100 | | | | 7,145,831 | |
Prudential Financial, Inc.,
4.60%, 5/15/44 | | | | | | | 5,738 | | | | 6,053,114 | |
Qatar Reinsurance Co. Ltd., 4.95% (a)(m) | | | | | | | 650 | | | | 655,779 | |
QBE Insurance Group Ltd.,
5.88%, 6/17/46 (a) | | | | | | | 450 | | | | 470,152 | |
Travelers Cos., Inc., 4.60%, 8/01/43 | | | | | | | 3,289 | | | | 3,575,748 | |
Union Life Insurance Co. Ltd.,
3.00%, 9/19/21 | | | | | | | 1,900 | | | | 1,800,864 | |
XLIT Ltd., 2.30%, 12/15/18 | | | | | | | 3,195 | | | | 3,215,224 | |
| | | | | | | | | | | | |
| | | | | | | | | | | | 69,849,180 | |
Internet & Direct Marketing Retail — 0.0% | | | | | | | | | | | | |
Ctrip.com International Ltd.,
1.25%, 9/15/22 (b)(h) | | | | | | | 400 | | | | 414,000 | |
IT Services — 0.3% | | | | | | | | | | | | |
DXC Technology Co., 2.88%, 3/27/20 (b) | | | | | | | 3,373 | | | | 3,401,262 | |
Fidelity National Information Services, Inc.: | | | | | | | | | | | | |
3.63%, 10/15/20 | | | | | | | 495 | | | | 514,389 | |
4.50%, 8/15/46 | | | | | | | 11,359 | | | | 10,962,662 | |
Total System Services, Inc., 4.80%, 4/01/26 | | | | | | | 8,040 | | | | 8,654,505 | |
Transcosmos, Inc., 0.00%, 12/22/20 (h)(i) | | | JPY | | | | 40,000 | | | | 363,783 | |
Visa, Inc., 4.15%, 12/14/35 | | | USD | | | | 1,919 | | | | 2,007,602 | |
| | | | | | | | | | | | |
| | | | | | | | | | | | 25,904,203 | |
Leisure Products — 0.0% | | | | | | | | | | | | |
Universal Entertainment Corp., 8.50% (6.00% Cash and 2.50% PIK), 8/24/20 (b)(k) | | | | | | | 2,362 | | | | 2,445,083 | |
See Notes to Consolidated Financial Statements.
| | | | | | |
| | | BLACKROCK BALANCED CAPITAL FUND, INC. | | MARCH 31, 2017 | | 55 |
| | | | |
| Consolidated Schedule of Investments (continued) | | | Master Total Return Portfolio | |
| | | | | | | | | | | | |
| Corporate Bonds | | | | | Par (000) | | | Value | |
Machinery — 0.0% | | | | | | | | | | | | |
CRRC Corp Ltd., 0.00%, 2/05/21 (h)(i) | | | USD | | | | 1,250 | | | $ | 1,313,750 | |
Ingersoll-Rand Luxembourg Finance SA,
4.65%, 11/01/44 | | | | | | | 598 | | | | 620,117 | |
| | | | | | | | | | | | |
| | | | | | | | | | | | 1,933,867 | |
Media — 1.5% | | | | | | | | | | | | |
21st Century Fox America, Inc.: | | | | | | | | | | | | |
4.75%, 9/15/44 | | | | | | | 1,468 | | | | 1,482,617 | |
4.95%, 10/15/45 | | | | | | | 425 | | | | 439,878 | |
Cablevision SA, 6.50%, 6/15/21 (b) | | | | | | | 661 | | | | 696,363 | |
CBS Corp., 2.30%, 8/15/19 | | | | | | | 4,291 | | | | 4,307,555 | |
Charter Communications Operating LLC/Charter Communications Operating Capital: | | | | | | | | | | | | |
4.46%, 7/23/22 | | | | | | | 13,691 | | | | 14,437,584 | |
4.91%, 7/23/25 | | | | | | | 2,254 | | | | 2,381,730 | |
6.38%, 10/23/35 | | | | | | | 4,126 | | | | 4,690,239 | |
6.48%, 10/23/45 | | | | | | | 13,335 | | | | 15,353,066 | |
Comcast Corp.: | | | | | | | | | | | | |
3.38%, 8/15/25 | | | | | | | 5,533 | | | | 5,582,703 | |
4.25%, 1/15/33 | | | | | | | 1,265 | | | | 1,302,411 | |
4.40%, 8/15/35 | | | | | | | 5,694 | | | | 5,901,945 | |
4.75%, 3/01/44 | | | | | | | 9,088 | | | | 9,587,858 | |
4.60%, 8/15/45 | | | | | | | 1,887 | | | | 1,951,133 | |
3.40%, 7/15/46 | | | | | | | 2,021 | | | | 1,729,234 | |
Discovery Communications LLC: | | | | | | | | | | | | |
3.80%, 3/13/24 | | | | | | | 8,437 | | | | 8,365,235 | |
4.88%, 4/01/43 | | | | | | | 4,734 | | | | 4,288,308 | |
Interpublic Group of Cos., Inc.: | | | | | | | | | | | | |
4.00%, 3/15/22 | | | | | | | 2,564 | | | | 2,670,611 | |
3.75%, 2/15/23 | | | | | | | 1,814 | | | | 1,840,370 | |
ITV PLC, 2.00%, 12/01/23 | | | EUR | | | | 3,700 | | | | 4,024,947 | |
Kakao Corp., 0.00%, 5/11/21 (h)(i) | | | KRW | | | | 1,000,000 | | | | 919,923 | |
LGE HoldCo VI BV, 7.13%, 5/15/24 | | | EUR | | | | 2,786 | | | | 3,339,913 | |
NBCUniversal Media LLC, 4.45%, 1/15/43 | | | USD | | | | 3,047 | | | | 3,067,217 | |
Time Warner Cable LLC: | | | | | | | | | | | | |
5.00%, 2/01/20 | | | | | | | 2,900 | | | | 3,084,356 | |
4.13%, 2/15/21 | | | | | | | 5,862 | | | | 6,098,426 | |
4.00%, 9/01/21 | | | | | | | 911 | | | | 944,351 | |
5.50%, 9/01/41 | | | | | | | 2,025 | | | | 2,076,733 | |
4.50%, 9/15/42 | | | | | | | 314 | | | | 284,573 | |
Time Warner, Inc.: | | | | | | | | | | | | |
2.10%, 6/01/19 | | | | | | | 9,144 | | | | 9,158,603 | |
3.60%, 7/15/25 | | | | | | | 2,168 | | | | 2,143,632 | |
4.85%, 7/15/45 | | | | | | | 4,515 | | | | 4,391,158 | |
Unitymedia Hessen GmbH & Co. KG/Unitymedia NRW GmbH: | | | | | | | | | | | | |
4.00%, 1/15/25 | | | EUR | | | | 1,015 | | | | 1,124,764 | |
4.63%, 2/15/26 | | | | | | | 300 | | | | 341,852 | |
3.50%, 1/15/27 | | | | | | | 1,920 | | | | 2,075,402 | |
6.25%, 1/15/29 | | | | | | | 770 | | | | 929,293 | |
Viacom, Inc.: | | | | | | | | | | | | |
2.75%, 12/15/19 | | | USD | | | | 3,111 | | | | 3,133,729 | |
4.50%, 3/01/21 | | | | | | | 3,389 | | | | 3,575,351 | |
2.25%, 2/04/22 | | | | | | | 6,013 | | | | 5,771,217 | |
3.45%, 10/04/26 | | | | | | | 2,166 | | | | 2,060,206 | |
5.25%, 4/01/44 | | | | | | | 2,338 | | | | 2,293,029 | |
Virgin Media Receivables Financing Notes I DAC,
5.50%, 9/15/24 | | | GBP | | | | 1,100 | | | | 1,430,904 | |
| | | | | | | | | | | | |
| | | | | | | | | | | | 149,278,419 | |
Metals & Mining — 0.3% | | | | | | | | | | | | |
Barrick Gold Corp., 5.25%, 4/01/42 | | | USD | | | | 5,990 | | | | 6,512,807 | |
China Precious Metal Resources Holdings Co. Ltd., 7.25%, 2/04/18 (h) | | | HKD | | | | 4,588 | | | | 463,483 | |
Fortune Star BVI Ltd., 5.25%, 3/23/22 | | | USD | | | | 945 | | | | 957,557 | |
Hesteel Hong Kong Co. Ltd., 4.25%, 4/07/20 | | | | | | | 900 | | | | 911,250 | |
| | | | | | | | | | | | |
| Corporate Bonds | | | | | Par (000) | | | Value | |
Metals & Mining (continued) | | | | | | | | | | | | |
HTA Group Ltd., 9.13%, 3/08/22 | | | USD | | | | 600 | | | $ | 594,120 | |
Mongolian Mining Corp., 8.88%, 3/29/17 (d)(g) | | | | | | | 306 | | | | 194,310 | |
Newmont Mining Corp.: | | | | | | | | | | | | |
3.50%, 3/15/22 | | | | | | | 6,890 | | | | 7,084,753 | |
4.88%, 3/15/42 | | | | | | | 5,045 | | | | 5,041,988 | |
Nucor Corp., 5.20%, 8/01/43 | | | | | | | 1,640 | | | | 1,863,908 | |
Nyrstar NV, 4.25%, 9/25/18 | | | EUR | | | | 400 | | | | 430,988 | |
Rio Tinto Finance USA PLC, 4.13%, 8/21/42 (l) | | | USD | | | | 3,660 | | | | 3,638,388 | |
Shougang Corp., 3.38%, 12/09/19 | | | | | | | 800 | | | | 801,740 | |
Steel Dynamics, Inc., 6.38%, 8/15/22 | | | | | | | 1,345 | | | | 1,400,481 | |
thyssenkrupp AG, 1.38%, 3/03/22 | | | EUR | | | | 725 | | | | 760,733 | |
Vedanta Resources PLC: | | | | | | | | | | | | |
6.00%, 1/31/19 | | | USD | | | | 775 | | | | 797,281 | |
8.25%, 6/07/21 | | | | | | | 970 | | | | 1,042,265 | |
6.38%, 7/30/22 | | | | | | | 800 | | | | 804,000 | |
| | | | | | | | | | | | |
| | | | | | | | | | | | 33,300,052 | |
Multiline Retail — 0.0% | | | | | | | | | | | | |
Marks & Spencer PLC, 3.00%, 12/08/23 | | | GBP | | | | 750 | | | | 952,165 | |
New Look Secured Issuer PLC, 6.50%, 7/01/22 | | | | | | | 1,280 | | | | 1,409,419 | |
Takashimaya Co. Ltd., 0.00%, 12/11/18 (h)(i) | | | JPY | | | | 30,000 | | | | 269,132 | |
| | | | | | | | | | | | |
| | | | | | | | | | | | 2,630,716 | |
Multi-Utilities — 0.2% | | | | | | | | | | | | |
CenterPoint Energy Houston Electric LLC,
4.50%, 4/01/44 | | | USD | | | | 1,838 | | | | 2,013,625 | |
Consumers Energy Co., 3.95%, 5/15/43 | | | | | | | 1,730 | | | | 1,738,442 | |
Dominion Gas Holdings LLC, 4.60%, 12/15/44 | | | | | | | 2,822 | | | | 2,829,707 | |
Pacific Gas & Electric Co.: | | | | | | | | | | | | |
4.75%, 2/15/44 | | | | | | | 2,305 | | | | 2,531,888 | |
4.30%, 3/15/45 | | | | | | | 1,509 | | | | 1,553,597 | |
Virginia Electric & Power Co.: | | | | | | | | | | | | |
3.50%, 3/15/27 | | | | | | | 7,943 | | | | 8,106,308 | |
4.45%, 2/15/44 | | | | | | | 1,674 | | | | 1,766,149 | |
4.20%, 5/15/45 | | | | | | | 2,462 | | | | 2,507,451 | |
| | | | | | | | | | | | |
| | | | | | | | | | | | 23,047,167 | |
Oil, Gas & Consumable Fuels — 1.2% | | | | | | | | | | | | |
Anadarko Petroleum Corp.: | | | | | | | | | | | | |
7.95%, 6/15/39 | | | | | | | 2,217 | | | | 2,847,907 | |
4.50%, 7/15/44 | | | | | | | 2,215 | | | | 2,089,396 | |
Apache Corp., 4.25%, 1/15/44 | | | | | | | 3,348 | | | | 3,140,421 | |
Bukit Makmur Mandiri Utama PT,
7.75%, 2/13/22 | | | | | | | 700 | | | | 724,427 | |
Bumi Investment Property Ltd.,
10.75%, 10/06/17 (d)(g) | | | | | | | 1,521 | | | | 817,537 | |
Devon Energy Corp., 5.60%, 7/15/41 | | | | | | | 5,533 | | | | 5,851,402 | |
Enercoal Resources Pte Ltd.,
9.25%, 4/07/18 (d)(g)(h) | | | | | | | 300 | | | | 133,500 | |
Energy Transfer Partners LP, 6.13%, 12/15/45 | | | | | | | 6,642 | | | | 7,106,229 | |
Enterprise Products Operating LLC: | | | | | | | | | | | | |
5.10%, 2/15/45 | | | | | | | 1,248 | | | | 1,303,494 | |
4.90%, 5/15/46 | | | | | | | 5,273 | | | | 5,397,285 | |
EOG Resources, Inc.: | | | | | | | | | | | | |
4.15%, 1/15/26 | | | | | | | 2,601 | | | | 2,717,236 | |
3.90%, 4/01/35 | | | | | | | 1,670 | | | | 1,598,624 | |
Exxon Mobil Corp.: | | | | | | | | | | | | |
1.82%, 3/15/19 | | | | | | | 7,393 | | | | 7,421,116 | |
4.11%, 3/01/46 | | | | | | | 4,075 | | | | 4,189,267 | |
GNL Quintero SA: | | | | | | | | | | | | |
4.63%, 7/31/29 (b) | | | | | | | 482 | | | | 492,845 | |
4.63%, 7/31/29 | | | | | | | 290 | | | | 296,525 | |
Kinder Morgan Energy Partners LP:
3.50%, 3/01/21 | | | | | | | 12,179 | | | | 12,377,055 | |
See Notes to Consolidated Financial Statements.
| | | | | | |
| 56 | | BLACKROCK BALANCED CAPITAL FUND, INC. | | MARCH 31, 2017 | | |
| | | | |
| Consolidated Schedule of Investments (continued) | | | Master Total Return Portfolio | |
| | | | | | | | | | | | |
| Corporate Bonds | | | | | Par
(000) | | | Value | |
Oil, Gas & Consumable Fuels (continued) | | | | | | | | | |
3.95%, 9/01/22 | | | USD | | | | 2,176 | | | $ | 2,223,080 | |
Kinder Morgan, Inc.: | | | | | | | | | | | | |
3.05%, 12/01/19 | | | | | | | 1,411 | | | | 1,434,758 | |
5.05%, 2/15/46 | | | | | | | 3,690 | | | | 3,581,957 | |
MPLX LP, 5.20%, 3/01/47 | | | | | | | 1,844 | | | | 1,855,555 | |
Noble Energy, Inc., 5.05%, 11/15/44 | | | | | | | 2,626 | | | | 2,685,306 | |
Petro-Canada, 6.80%, 5/15/38 (j) | | | | | | | 2,780 | | | | 3,573,145 | |
Pioneer Natural Resources Co., 4.45%, 1/15/26 | | | | | | | 1,600 | | | | 1,684,019 | |
Plains All American Pipeline LP/PAA Finance Corp., 4.65%, 10/15/25 | | | | | | | 3,700 | | | | 3,811,359 | |
Raizen Fuels Finance SA, 5.30%, 1/20/27 (b) | | | | | | | 1,008 | | | | 1,020,600 | |
Reliance Industries Ltd., 5.88% (m) | | | | | | | 579 | | | | 589,133 | |
Sabine Pass Liquefaction LLC: | | | | | | | | | | | | |
5.63%, 4/15/23 | | | | | | | 4,188 | | | | 4,543,570 | |
4.20%, 3/15/28 (b) | | | | | | | 4,106 | | | | 4,055,960 | |
Spectra Energy Partners LP, 4.50%, 3/15/45 | | | | | | | 6,470 | | | | 6,044,494 | |
Sunoco Logistics Partners Operations LP: | | | | | | | | | | | | |
3.90%, 7/15/26 | | | | | | | 1,019 | | | | 984,554 | |
5.35%, 5/15/45 | | | | | | | 1,620 | | | | 1,580,389 | |
TransCanada PipeLines Ltd.: | | | | | | | | | | | | |
1.88%, 1/12/18 | | | | | | | 2,030 | | | | 2,032,081 | |
2.50%, 8/01/22 | | | | | | | 2,481 | | | | 2,443,229 | |
Tullow Oil Jersey Ltd., 6.63%, 7/12/21 (h) | | | | | | | 1,400 | | | | 1,634,500 | |
Tullow Oil PLC: | | | | | | | | | | | | |
6.00%, 11/01/20 (b) | | | | | | | 600 | | | | 580,500 | |
6.25%, 4/15/22 | | | | | | | 1,300 | | | | 1,215,500 | |
6.25%, 4/15/22 (b) | | | | | | | 200 | | | | 187,000 | |
Williams Partners LP, 4.00%, 9/15/25 | | | | | | | 8,350 | | | | 8,385,170 | |
| | | | | | | | | | | | |
| | | | | | | | | | | | 114,650,125 | |
Paper & Forest Products — 0.1% | | | | | | | | | | | | |
Georgia-Pacific LLC, 7.38%, 12/01/25 | | | | | | | 3,288 | | | | 4,162,937 | |
Suzano Austria GmbH, 5.75%, 7/14/26 (b) | | | | | | | 661 | | | | 673,229 | |
Suzano Trading Ltd., 5.88%, 1/23/21 (b) | | | | | | | 995 | | | | 1,059,973 | |
| | | | | | | | | | | | |
| | | | | | | | | | | | 5,896,139 | |
Pharmaceuticals — 0.8% | | | | | | | | | | | | |
Actavis Funding SCS: | | | | | | | | | | | | |
2.35%, 3/12/18 | | | | | | | 9,237 | | | | 9,277,273 | |
3.00%, 3/12/20 | | | | | | | 21,662 | | | | 22,031,727 | |
3.80%, 3/15/25 | | | | | | | 22,467 | | | | 22,671,966 | |
4.75%, 3/15/45 | | | | | | | 11,100 | | | | 11,147,519 | |
Mylan NV, 5.25%, 6/15/46 | | | | | | | 1,599 | | | | 1,637,451 | |
Teva Pharmaceutical Finance Co. BV,
3.65%, 11/10/21 | | | | | | | 1,237 | | | | 1,256,928 | |
Teva Pharmaceutical Finance Netherlands III BV,
2.80%, 7/21/23 | | | | | | | 6,877 | | | | 6,531,836 | |
United Laboratories International Holdings Ltd.,
4.50%, 12/05/21 (h) | | | | | | | 400 | | | | 477,700 | |
| | | | | | | | | | | | |
| | | | | | | | | | | | 75,032,400 | |
Real Estate Management & Development — 0.3% | | | | | | | | | |
Annington Finance No. 5 PLC, 13.00% (13.00% Cash or 13.50% PIK), 1/15/23 (k) | | | GBP | | | | 198 | | | | 286,801 | |
Aroundtown Property Holdings PLC,
3.00%, 5/05/20 (h) | | | EUR | | | | 2,600 | | | | 3,682,071 | |
China Aoyuan Property Group Ltd.,
6.35%, 1/11/20 | | | USD | | | | 693 | | | | 716,418 | |
China Evergrande Group: | | | | | | | | | | | | |
8.75%, 10/30/18 | | | | | | | 200 | | | | 207,750 | |
7.00%, 3/23/20 | | | | | | | 685 | | | | 702,080 | |
China Overseas Finance Investment Cayman V Ltd., 0.00%, 1/05/23 (h)(i) | | | | | | | 1,400 | | | | 1,425,900 | |
Easy Tactic Ltd., 5.75%, 1/13/22 | | | | | | | 900 | | | | 921,219 | |
Ezdan Sukuk Co. Ltd., 4.88%, 4/05/22 | | | | | | | 750 | | | | 749,100 | |
Future Land Development Holdings Ltd.,
5.00%, 2/16/20 | | | | | | | 400 | | | | 402,979 | |
| | | | | | | | | | | | |
| Corporate Bonds | | | | | Par
(000) | | | Value | |
Real Estate Management & Development (continued) | | | | | |
FUXIANG Investment Management Ltd.,
3.63%, 11/30/19 | | | USD | | | | 750 | | | $ | 752,568 | |
Guorui Properties Ltd., 7.00%, 3/21/20 | | | | | | | 450 | | | | 451,659 | |
Kaisa Group Holdings Ltd.: | | | | | | | | | | | | |
Series B, 7.56% (7.56% Cash or
7.56% PIK), 6/30/20 (k) | | | | | | | 601 | | | | 595,435 | |
Series C, 7.56% (7.56% Cash or
7.56% PIK), 12/31/20 (k) | | | | | | | 151 | | | | 149,487 | |
Series D, 7.56% (7.56% Cash or
7.56% PIK), 6/30/21 (k) | | | | | | | 210 | | | | 209,194 | |
Scentre Group Trust 1/Scentre Group Trust
2, 3.75%, 3/23/27 (b) | | | | | | | 11,510 | | | | 11,569,518 | |
Shui On Development Holding Ltd.,
7.50% (a)(h)(m) | | | | | | | 500 | | | | 530,500 | |
Times Property Holdings Ltd., 6.25%, 1/23/20 | | | | | | | 760 | | | | 783,649 | |
Xinhu BVI Holding Co. Ltd., 6.00%, 3/01/20 | | | | | | | 300 | | | | 302,608 | |
Xinyuan Real Estate Co. Ltd., 7.75%, 2/28/21 | | | | | | | 275 | | | | 272,234 | |
Yuzhou Properties Co. Ltd., 6.00%, 1/25/22 | | | | | | | 425 | | | | 437,707 | |
| | | | | | | | | | | | |
| | | | | | | | | | | | 25,148,877 | |
Road & Rail — 0.4% | | | | | | | | | | | | |
Burlington Northern Santa Fe LLC: | | | | | | | | | | | | |
4.15%, 4/01/45 | | | | | | | 1,419 | | | | 1,417,130 | |
4.70%, 9/01/45 | | | | | | | 1,265 | | | | 1,374,333 | |
4.13%, 6/15/47 | | | | | | | 11,500 | | | | 11,467,581 | |
CSX Corp., 4.25%, 11/01/66 | | | | | | | 3,523 | | | | 3,196,911 | |
Norfolk Southern Corp.: | | | | | | | | | | | | |
6.00%, 5/23/11 | | | | | | | 4,145 | | | | 4,804,872 | |
4.45%, 6/15/45 | | | | | | | 2,169 | | | | 2,256,324 | |
Penske Truck Leasing Co. LP/PTL Finance Corp., 3.40%, 11/15/26 (b) | | | | | | | 7,682 | | | | 7,384,676 | |
Union Pacific Corp.: | | | | | �� | | | | | | | |
3.38%, 2/01/35 | | | | | | | 1,864 | | | | 1,797,520 | |
3.88%, 2/01/55 | | | | | | | 4,114 | | | | 3,834,079 | |
Union Pacific Railroad Co. Pass-Through Trust, Series 2014-1, 3.23%, 5/14/26 | | | | | | | 3,124 | | | | 3,063,731 | |
| | | | | | | | | | | | |
| | | | | | | | | | | | 40,597,157 | |
Semiconductors & Semiconductor Equipment — 1.5% | | | | | |
Advanced Semiconductor Engineering, Inc.,
0.00%, 3/27/18 (h)(i) | | | | | | | 1,000 | | | | 1,000,000 | |
Analog Devices, Inc.: | | | | | | | | | | | | |
3.90%, 12/15/25 | | | | | | | 680 | | | | 696,540 | |
3.50%, 12/05/26 | | | | | | | 12,390 | | | | 12,270,746 | |
5.30%, 12/15/45 | | | | | | | 694 | | | | 768,248 | |
Applied Materials, Inc.: | | | | | | | | | | | | |
3.30%, 4/01/27 | | | | | | | 5,932 | | | | 5,955,562 | |
4.35%, 4/01/47 | | | | | | | 3,508 | | | | 3,551,415 | |
Broadcom Corp./Broadcom Cayman Finance Ltd.: | | | | | | | | | | | | |
2.38%, 1/15/20 (b) | | | | | | | 36,649 | | | | 36,644,565 | |
3.00%, 1/15/22 (b) | | | | | | | 48,373 | | | | 48,311,373 | |
3.63%, 1/15/24 (b) | | | | | | | 24,993 | | | | 25,177,198 | |
Lam Research Corp.: | | | | | | | | | | | | |
2.75%, 3/15/20 | | | | | | | 3,359 | | | | 3,398,028 | |
2.80%, 6/15/21 | | | | | | | 3,933 | | | | 3,947,340 | |
Nanya Technology Corp., 0.00%, 1/24/22 (h)(i) | | | | | | | 400 | | | | 434,500 | |
Neo Solar Power Corp., 0.00%, 10/27/19 (h)(i) | | | | | | | 500 | | | | 506,250 | |
QUALCOMM, Inc., 4.80%, 5/20/45 | | | | | | | 2,164 | | | | 2,246,676 | |
| | | | | | | | | | | | |
| | | | | | | | | | | | 144,908,441 | |
Software — 0.6% | | | | | | | | | | | | |
Microsoft Corp.: | | | | | | | | | | | | |
3.50%, 2/12/35 | | | | | | | 5,373 | | | | 5,169,616 | |
3.70%, 8/08/46 | | | | | | | 25,464 | | | | 23,903,311 | |
4.25%, 2/06/47 | | | | | | | 17,280 | | | | 17,712,864 | |
Oracle Corp.: | | | | | | | | | | | | |
3.25%, 5/15/30 | | | | | | | 6,354 | | | | 6,270,108 | |
See Notes to Consolidated Financial Statements.
| | | | | | |
| | | BLACKROCK BALANCED CAPITAL FUND, INC. | | MARCH 31, 2017 | | 57 |
| | | | |
| Consolidated Schedule of Investments (continued) | | | Master Total Return Portfolio | |
| | | | |
| | | | | | | | | | | | |
| Corporate Bonds | | | | | Par (000) | | | Value | |
Software (continued) | | | | | | | | | | | | |
4.00%, 7/15/46 | | | USD | | | | 5,854 | | | $ | 5,584,827 | |
4.38%, 5/15/55 | | | | | | | 2,451 | | | | 2,393,762 | |
| | | | | | | | | | | | |
| | | | | | | | | | | | 61,034,488 | |
Specialty Retail — 0.0% | | | | | | | | | | | | |
Baoxin Auto Finance I Ltd., 8.75% (a)(m) | | | | | | | 400 | | | | 419,445 | |
GOME Electrical Appliances Holding Ltd.,
5.00%, 3/10/20 | | | | | | | 750 | | | | 760,520 | |
| | | | | | | | | | | | |
| | | | | | | | | | | | 1,179,965 | |
Technology Hardware, Storage & Peripherals — 0.5% | | | | | |
Apple Inc.: | | | | | | | | | | | | |
3.00%, 2/09/24 | | | | | | | 7,371 | | | | 7,434,317 | |
3.45%, 2/09/45 | | | | | | | 1,934 | | | | 1,723,857 | |
4.65%, 2/23/46 | | | | | | | 16,929 | | | | 18,164,851 | |
Diamond 1 Finance Corp./Diamond 2 Finance Corp., 8.35%, 7/15/46 (b) | | | | | | | 6,760 | | | | 8,730,513 | |
Hewlett Packard Enterprise Co.: | | | | | | | | | | | | |
2.85%, 10/05/18 | | | | | | | 7,345 | | | | 7,433,500 | |
3.85%, 10/15/20 | | | | | | | 6,500 | | | | 6,684,463 | |
HP, Inc., 3.75%, 12/01/20 | | | | | | | 728 | | | | 757,499 | |
Proven Glory Capital Ltd.: | | | | | | | | | | | | |
3.25%, 2/21/22 | | | | | | | 1,875 | | | | 1,865,306 | |
4.00%, 2/21/27 | | | | | | | 1,050 | | | | 1,038,282 | |
| | | | | | | | | | | | |
| | | | | | | | | | | | 53,832,588 | |
Tobacco — 0.0% | | | | | | | | | | | | |
Reynolds American, Inc.: | | | | | | | | | | | | |
2.30%, 6/12/18 | | | | | | | 2,460 | | | | 2,474,777 | |
3.25%, 6/12/20 | | | | | | | 1,044 | | | | 1,071,207 | |
| | | | | | | | | | | | |
| | | | | | | | | | | | 3,545,984 | |
Trading Companies & Distributors — 0.3% | | | | | |
Air Lease Corp.: | | | | | | | | | | | | |
3.00%, 9/15/23 | | | | | | | 14,602 | | | | 14,269,235 | |
3.63%, 4/01/27 | | | | | | | 5,569 | | | | 5,412,773 | |
GATX Corp.: | | | | | | | | | | | | |
2.60%, 3/30/20 | | | | | | | 2,962 | | | | 3,001,063 | |
3.85%, 3/30/27 | | | | | | | 2,336 | | | | 2,317,398 | |
Iwatani Corp., 0.00%, 10/22/20 (h)(i) | | | JPY | | | | 120,000 | | | | 1,137,160 | |
Loxam SAS, 4.25%, 4/15/24 | | | EUR | | | | 513 | | | | 554,614 | |
Noble Group Ltd., 3.63%, 3/20/18 | | | USD | | | | 207 | | | | 203,377 | |
| | | | | | | | | | | | |
| | | | | | | | | | | | 26,895,620 | |
Transportation Infrastructure — 0.0% | | | | | | | | | | | | |
Adani Ports & Special Economic Zone Ltd.,
3.95%, 1/19/22 (b) | | | | | | | 1,100 | | | | 1,112,653 | |
Aeropuertos Argentina 2000 SA,
6.88%, 2/01/27 (b) | | | | | | | 706 | | | | 728,945 | |
Aeropuertos Dominicanos Siglo XXI SA,
6.75%, 3/30/29 (b) | | | | | | | 706 | | | | 736,739 | |
Rumo Luxembourg Sàrl, 7.38%, 2/09/24 (b) | | | | | | | 1,909 | | | | 1,966,270 | |
| | | | | | | | | | | | |
| | | | | | | | | | | | 4,544,607 | |
Wireless Telecommunication Services — 0.3% | | | | | | | | | |
Digicel Group Ltd., 8.25%, 9/30/20 (b) | | | | | | | 1,061 | | | | 911,823 | |
Rogers Communications, Inc.,
5.00%, 3/15/44 | | | | | | | 775 | | | | 833,271 | |
Sprint Spectrum Co. LLC/Sprint Spectrum Co. II LLC/Sprint Spectrum Co. III LLC,
3.36%, 9/20/21 (b) | | | | | | | 18,905 | | | | 18,857,737 | |
Vodafone Group PLC, 4.38%, 2/19/43 | | | | | | | 6,470 | | | | 5,915,631 | |
| | | | | | | | | | | | |
| | | | | | | | | | | | 26,518,462 | |
Total Corporate Bonds — 27.9% | | | | | | | | | | | 2,750,197,386 | |
| | | | | | | | | | | | |
| | | | | | | | | | |
| | | | | | | | | | | | |
| Floating Rate Loan Interests (a) | | | | | Par
(000) | | | Value | |
Airlines — 0.1% | | | | | | | | | | | | |
Gol Luxco SA, Term Loan, 6.50%, 8/31/20 | | | USD | | | | 7,462 | | | $ | 7,611,240 | |
Chemicals — 0.1% | | | | | | | | | | | | |
Axalta Coating Systems Dutch Holding B BV (Axalta Coating Systems U.S. Holdings, Inc.), Term B-1 Euro Loan, 3.00%, 2/01/23 | | | EUR | | | | 998 | | | | 1,069,457 | |
Chemours Co., Term Loan B, 3.00%, 5/12/22 | | | | | | | 1,000 | | | | 1,073,503 | |
MacDermid Agricultural Solutions Holdings BV, Term Loan C, 3.50%, 7/06/23 | | | | | | | 1,000 | | | | 1,066,803 | |
MacDermid European Holdings BV (MacDermid Funding LLC), Euro Tranche C-4 Term Loan, 4.25%, 6/07/20 | | | | | | | 1,791 | | | | 1,916,911 | |
| | | | | | | | | | | | |
| | | | | | | | | | | | 5,126,674 | |
Diversified Telecommunication Services — 0.0% | | | | | | | | | |
Eircom Finco S.a r.l., Term Loan, 3.25%, 3/08/24 | | | | | | | 1,899 | | | | 2,019,437 | |
Equity Real Estate Investment Trusts (REITs) — 0.0% | | | | | | | | | |
Equinix, Inc., Term B-2 Loan, 3.25%, 12/22/23 | | | | | | | 1,000 | | | | 1,075,562 | |
Media — 0.1% | | | | | | | | | | | | |
SFR Group SA (Ypso France SAS): | | | | | | | | | | | | |
EUR TLB-10 Incremental Term Loan,
3.75%, 1/14/25 | | | | | | | 173 | | | | 183,897 | |
EUR TLB-10 Refinancing Term Loan,
3.75%, 1/14/25 | | | | | | | 825 | | | | 878,462 | |
Springer SBM Two GmbH: | | | | | | | | | | | | |
Term Loan, 9.00%, 8/16/21 | | | | | | | 344 | | | | 370,381 | |
Term Loan B11, 3.75%, 8/14/20 | | | | | | | 1,000 | | | | 1,065,470 | |
Technicolor SA (FKA Thomson), Euro Term Loan, 3.50%, 12/06/23 | | | | | | | 2,400 | | | | 2,564,450 | |
UPC Financing Partnership, Facility AO,
3.00%, 1/15/26 | | | | | | | 1,250 | | | | 1,331,010 | |
| | | | | | | | | | | | |
| | | | | | | | | | | | 6,393,670 | |
Road & Rail — 0.0% | | | | | | | | | | | | |
Car Rentals Subsidiary, S.L.U. (AKA Goldcar),
Facility B, 6.00%, 6/18/20 | | | | | | | 2,080 | | | | 2,232,819 | |
Software — 0.0% | | | | | | | | | | | | |
Veritas U.S., Inc., Initial Euro Term B-1 Loan,
6.63%, 1/27/23 | | | | | | | 674 | | | | 716,286 | |
Specialty Retail — 0.0% | | | | | | | | | | | | |
Intervias Finco Ltd. (FKA Optima Sub-Finco Ltd.): | | | | | | | | | | | | |
Term Facility B2 (EUR), 5.00%, 1/30/23 | | | | | | | 768 | | | | 827,203 | |
Term Facility C2 (EUR), 5.00%, 1/30/23 | | | | | | | 1,250 | | | | 1,343,745 | |
| | | | | | | | | | | | |
| | | | | | | | | | | | 2,170,948 | |
Trading Companies & Distributors — 0.0% | | | | | | | | | | | | |
Azelis Finance SA (Azelis U.S. Holding, Inc.), Euro Term Loan (Second Lien), 9.50%, 12/18/23 | | | | | | | 720 | | | | 768,098 | |
Total Floating Rate Loan Interests — 0.3% | | | | | | | | | | | 28,114,734 | |
| | | | | | | | | | | | |
| Foreign Agency Obligations | | | | | | | | | |
Argentina — 0.1% | | | | | | | | | | | | |
Petrobras Argentina SA, 7.38%, 7/21/23 (b) | | | USD | | | | 1,527 | | | | 1,593,806 | |
YPF SA: | | | | | | | | | | | | |
8.88%, 12/19/18 (b) | | | | | | | 2,628 | | | | 2,859,264 | |
8.50%, 3/23/21 (b) | | | | | | | 336 | | | | 368,152 | |
8.50%, 7/28/25 | | | | | | | 174 | | | | 188,738 | |
| | | | | | | | | | | | |
| | | | | | | | | | | | 5,009,960 | |
See Notes to Consolidated Financial Statements.
| | | | | | |
| 58 | | BLACKROCK BALANCED CAPITAL FUND, INC. | | MARCH 31, 2017 | | |
| | | | |
| Consolidated Schedule of Investments (continued) | | | Master Total Return Portfolio | |
| | | | | | | | | | | | |
| Foreign Agency Obligations | | | | | Par
(000) | | | Value | |
Brazil — 0.3% | | | | | | | | | | | | |
Petrobras Global Finance BV: | | | | | | | | | | | | |
5.75%, 1/20/20 | | | USD | | | | 699 | | | $ | 733,950 | |
4.88%, 3/17/20 | | | | | | | 699 | | | | 716,894 | |
5.38%, 1/27/21 | | | | | | | 13,445 | | | | 13,801,293 | |
8.38%, 5/23/21 | | | | | | | 12,399 | | | | 14,004,671 | |
4.75%, 1/14/25 | | | EUR | | | | 1,500 | | | | 1,644,210 | |
8.75%, 5/23/26 | | | USD | | | | 336 | | | | 388,920 | |
7.38%, 1/17/27 | | | | | | | 755 | | | | 798,186 | |
5.38%, 10/01/29 | | | GBP | | | | 185 | | | | 213,055 | |
6.63%, 1/16/34 | | | | | | | 230 | | | | 280,256 | |
6.85%, 6/05/15 | | | USD | | | | 706 | | | | 629,223 | |
| | | | | | | | | | | | |
| | | | | | | | | | | | 33,210,658 | |
British Virgin Islands — 0.0% | | | | | | | | | | | | |
Bluestar Finance Holdings Ltd.: | | | | | | | | | | | | |
3.13%, 9/30/19 | | | | | | | 900 | | | | 902,219 | |
3.50%, 9/30/21 | | | | | | | 900 | | | | 896,911 | |
| | | | | | | | | | | | |
| | | | | | | | | | | | 1,799,130 | |
Chile — 0.0% | | | | | | | | | | | | |
Empresa de Transporte de Pasajeros Metro SA, 5.00%, 1/25/47 (b) | | | | | | | 487 | | | | 509,719 | |
China — 0.1% | | | | | | | | | | | | |
Chang Development International Ltd., 3.63%, 1/20/20 | | | | | | | 1,500 | | | | 1,483,764 | |
China Railway Construction Corp. Ltd.,
1.50%, 12/21/21 (h) | | | CNH | | | | 4,000 | | | | 585,038 | |
Huarong Finance II Co. Ltd.: | | | | | | | | | | | | |
4.63%, 6/03/26 | | | USD | | | | 476 | | | | 480,391 | |
4.88%, 11/22/26 | | | | | | | 204 | | | | 209,897 | |
ICBCIL Finance Co. Ltd., 3.38%, 4/05/22 | | | | | | | 1,785 | | | | 1,785,246 | |
Jinan West City Investment & Development Group Co. Ltd., 3.13%, 10/11/21 | | | | | | | 300 | | | | 288,155 | |
Tewoo Group Finance No. 2 Ltd., 4.50%, 12/16/19 | | | | | | | 500 | | | | 496,257 | |
| | | | | | | | | | | | |
| | | | | | | | | | | | 5,328,748 | |
France — 0.1% | | | | | | | | | | | | |
Areva SA, 4.88%, 9/23/24 | | | EUR | | | | 3,550 | | | | 3,853,427 | |
Electricite de France SA, 3.63%, 10/13/25 | | | USD | | | | 3,075 | | | | 3,078,321 | |
| | | | | | | | | | | | |
| | | | | | | | | | | | 6,931,748 | |
Hong Kong — 0.0% | | | | | | | | | | | | |
China Cinda Finance 2015 I Ltd., 4.25%, 4/23/25 | | | | | | | 1,000 | | | | 1,004,796 | |
China Cinda Finance 2017 I Ltd., 4.40%, 3/09/27 | | | | | | | 700 | | | | 699,784 | |
China Great Wall International Holdings III Ltd.,
2.63%, 10/27/21 | | | | | | | 600 | | | | 579,613 | |
| | | | | | | | | | | | |
| | | | | | | | | | | | 2,284,193 | |
India — 0.0% | | | | | | | | | | | | |
BPRL International Singapore Pte Ltd., 4.38%, 1/18/27 | | | | | | | 1,400 | | | | 1,425,661 | |
Greenko Investment Co., 4.88%, 8/16/23 | | | | | | | 550 | | | | 538,325 | |
| | | | | | | | | | | | |
| | | | | | | | | | | | 1,963,986 | |
Indonesia — 0.1% | | | | | | | | | | | | |
Lembaga Pembiayaan Ekspor Indonesia,
3.88%, 4/06/24 | | | | | | | 380 | | | | 379,430 | |
Pertamina Persero PT: | | | | | | | | | | | | |
5.63%, 5/20/43 | | | | | | | 1,148 | | | | 1,179,019 | |
6.45%, 5/30/44 | | | | | | | 1,890 | | | | 2,132,512 | |
Perusahaan Gas Negara Persero Tbk, 5.13%, 5/16/24 | | | | | | | 550 | | | | 583,372 | |
| | | | | | | | | | | | |
| | | | | | | | | | | | 4,274,333 | |
| | | | | | | | | | | | |
| Foreign Agency Obligations | | | | | Par
(000) | | | Value | |
Mexico — 0.1% | | | | | | | | | | | | |
Petroleos Mexicanos: | | | | | | | | | | | | |
4.63%, 9/21/23 | | | USD | | | | 526 | | | $ | 529,025 | |
6.50%, 3/13/27 (b) | | | | | | | 7,519 | | | | 8,088,564 | |
| | | | | | | | | | | | |
| | | | | | | | | | | | 8,617,589 | |
Mongolia — 0.0% | | | | | | | | | | | | |
Trade & Development Bank of Mongolia LLC,
9.38%, 5/19/20 | | | | | | | 1,427 | | | | 1,522,820 | |
Norway — 0.0% | | | | | | | | | | | | |
Eksportfinans ASA, 5.50%, 6/26/17 | | | | | | | 275 | | | | 276,858 | |
Panama — 0.0% | | | | | | | | | | | | |
Aeropuerto Internacional de Tocumen SA,
5.63%, 5/18/36 (b) | | | | | | | 1,806 | | | | 1,878,240 | |
South Korea — 0.0% | | | | | | | | | | | | |
Korea National Oil Corp., 3.38%, 3/27/27 | | | | | | | 787 | | | | 787,657 | |
United Arab Emirates — 0.0% | | | | | | | | | | | | |
Abu Dhabi National Energy Co. PJSC, 3.63%, 1/12/23 | | | | | | | 1,000 | | | | 1,011,250 | |
Total Foreign Agency Obligations — 0.8% | | | | | | | | | | | 75,406,889 | |
| | | | | | | | | | | | |
| Foreign Government Obligations | | | | | | | | | |
Argentina — 0.5% | | | | | | | | | | | | |
Republic of Argentina: | | | | | | | | | | | | |
6.25%, 4/22/19 (b) | | | | | | | 29,130 | | | | 30,732,150 | |
6.88%, 4/22/21 | | | | | | | 1,748 | | | | 1,877,352 | |
3.88%, 1/15/22 | | | EUR | | | | 1,341 | | | | 1,418,194 | |
5.63%, 1/26/22 (b) | | | USD | | | | 9,806 | | | | 10,041,344 | |
7.82%, 12/31/33 | | | | | | | 1,264 | | | | 1,410,526 | |
7.82%, 12/31/33 | | | EUR | | | | 1,061 | | | | 1,195,991 | |
| | | | | | | | | | | | |
| | | | | | | | | | | | 46,675,557 | |
Brazil — 0.1% | | | | | | | | | | | | |
Brazil Notas do Tesouro Nacional Inflation | | | | | | | | | | | | |
Linked Bonds, Series B, 6.00%, 5/15/21 | | | BRL | | | | 9 | | | | 8,702,887 | |
Federative Republic of Brazil, 2.88%, 4/01/21 | | | EUR | | | | 4,500 | | | | 5,034,788 | |
| | | | | | | | | | | | |
| | | | | | | | | | | | 13,737,675 | |
China — 0.0% | | | | | | | | | | | | |
People’s Republic of China, 3.30%, 7/04/23 | | | CNH | | | | 3,500 | | | | 480,368 | |
Colombia — 0.3% | | | | | | | | | | | | |
Republic of Colombia: | | | | | | | | | | | | |
11.75%, 2/25/20 | | | USD | | | | 79 | | | | 99,698 | |
4.38%, 7/12/21 | | | | | | | 4,841 | | | | 5,131,460 | |
4.00%, 2/26/24 | | | | | | | 22,810 | | | | 23,471,490 | |
| | | | | | | | | | | | |
| | | | | | | | | | | | 28,702,648 | |
Egypt — 0.1% | | | | | | | | | | | | |
Arab Republic of Egypt: | | | | | | | | | | | | |
5.75%, 4/29/20 | | | | | | | 3,857 | | | | 4,011,280 | |
8.50%, 1/31/47 (b) | | | | | | | 2,781 | | | | 2,989,575 | |
| | | | | | | | | | | | |
| | | | | | | | | | | | 7,000,855 | |
France — 0.1% | | | | | | | | | | | | |
Republic of France, 0.25%, 11/25/26 | | | EUR | | | | 9,100 | | | | 9,068,818 | |
Greece — 0.0% | | | | | | | | | | | | |
Hellenic Republic, 4.75%, 4/17/19 | | | | | | | 695 | | | | 702,214 | |
Hungary — 0.1% | | | | | | | | | | | | |
Republic of Hungary, 5.38%, 3/25/24 | | | USD | | | | 8,660 | | | | 9,638,043 | |
See Notes to Consolidated Financial Statements.
| | | | | | |
| | | BLACKROCK BALANCED CAPITAL FUND, INC. | | MARCH 31, 2017 | | 59 |
| | | | |
| Consolidated Schedule of Investments (continued) | | | Master Total Return Portfolio | |
| | | | | | | | | | | | |
| Foreign Government Obligations | | | | | Par (000) | | | Value | |
Indonesia — 0.2% | | | | | | | | | | | | |
Perusahaan Penerbit SBSN Indonesia III,
4.15%, 3/29/27 | | | USD | | | | 1,675 | | | $ | 1,682,035 | |
Republic of Indonesia: | | | | | | | | | | | | |
5.88%, 3/13/20 | | | | | | | 2,420 | | | | 2,646,263 | |
3.38%, 4/15/23 (b) | | | | | | | 4,060 | | | | 4,054,815 | |
5.38%, 10/17/23 (b) | | | | | | | 1,480 | | | | 1,636,541 | |
5.88%, 1/15/24 (b) | | | | | | | 7,210 | | | | 8,176,219 | |
| | | | | | | | | | | | |
| | | | | | | | | | | | 18,195,873 | |
Italy — 0.0% | | | | | | | | | | | | |
Buoni Poliennali Del Tesoro, 1.25%, 12/01/26 | | | EUR | | | | 2,800 | | | | 2,760,272 | |
Kuwait — 0.2% | | | | | | | | | | | | |
State of Kuwait: | | | | | | | | | | | | |
2.75%, 3/20/22 | | | | | | | 1,500 | | | | 1,503,075 | |
2.75%, 3/20/22 (b) | | | USD | | | | 10,636 | | | | 10,657,804 | |
3.50%, 3/20/27 (b) | | | | | | | 4,277 | | | | 4,325,116 | |
| | | | | | | | | | | | |
| | | | | | | | | | | | 16,485,995 | |
Lebanon — 0.0% | | | | | | | | | | | | |
Lebanese Republic, 6.85%, 3/23/27 | | | | | | | 4,893 | | | | 4,990,860 | |
Mexico — 0.7% | | | | | | | | | | | | |
United Mexican States: | | | | | | | | | | | | |
4.75%, 6/14/18 | | | MXN | | | | 1,119 | | | | 5,851,691 | |
4.13%, 1/21/26 | | | USD | | | | 9,457 | | | | 9,721,796 | |
5.75%, 3/05/26 | | | MXN | | | | 777 | | | | 3,798,667 | |
4.15%, 3/28/27 | | | USD | | | | 47,639 | | | | 48,448,863 | |
5.75%, 10/12/10 | | | | | | | 1,210 | | | | 1,203,950 | |
United Mexican States Inflation Linked Bonds,
3.50%, 12/14/17 | | | MXN | | | | 74 | | | | 2,256,868 | |
| | | | | | | | | | | | |
| | | | | | | | | | | | 71,281,835 | |
Mongolia — 0.0% | | | | | | | | | | | | |
Mongolian People’s Republic: | | | | | | | | | | | | |
7.50%, 6/30/18 | | | CNH | | | | 2,000 | | | | 286,698 | |
5.13%, 12/05/22 | | | USD | | | | 338 | | | | 318,071 | |
| | | | | | | | | | | | |
| | | | | | | | | | | | 604,769 | |
Oman — 0.0% | | | | | | | | | | | | |
Sultanate of Oman: | | | | | | | | | | | | |
5.38%, 3/08/27 | | | | | | | 950 | | | | 992,750 | |
6.50%, 3/08/47 | | | | | | | 550 | | | | 580,250 | |
| | | | | | | | | | | | |
| | | | | | | | | | | | 1,573,000 | |
Panama — 0.1% | | | | | | | | | | | | |
Republic of Panama, 3.75%, 3/16/25 | | | | | | | 8,640 | | | | 8,823,600 | |
Peru — 0.1% | | | | | | | | | | | | |
Republic of Peru, 7.35%, 7/21/25 | | | | | | | 6,920 | | | | 8,961,400 | |
Portugal — 0.0% | | | | | | | | | | | | |
Republic of Portugal, 5.13%, 10/15/24 | | | | | | | 875 | | | | 848,050 | |
Russia — 0.8% | | | | | | | | | | | | |
Russian Federation: | | | | | | | | | | | | |
7.50%, 8/18/21 | | | RUB | | | | 1,986,728 | | | | 34,840,948 | |
7.75%, 9/16/26 | | | | | | | 249,074 | | | | 4,383,773 | |
8.15%, 2/03/27 | | | | | | | 1,254,621 | | | | 22,862,136 | |
7.05%, 1/19/28 | | | | | | | 855,680 | | | | 14,280,836 | |
| | | | | | | | | | | | |
| | | | | | | | | | | | 76,367,693 | |
South Africa — 0.1% | | | | | | | | | | | | |
Republic of South Africa, 4.88%, 4/14/26 | | | USD | | | | 5,820 | | | | 5,846,190 | |
| | | | | | | | | | | | |
| Foreign Government Obligations | | | | | Par (000) | | | Value | |
Sri Lanka — 0.0% | | | | | | | | | | | | |
Republic of Sri Lanka: | | | | | | | | | | | | |
6.25%, 7/27/21 | | | USD | | | | 443 | | | $ | 466,179 | |
5.75%, 1/18/22 | | | | | | | 600 | | | | 615,625 | |
6.13%, 6/03/25 | | | | | | | 900 | | | | 899,876 | |
6.85%, 11/03/25 | | | | | | | 1,750 | | | | 1,810,067 | |
6.83%, 7/18/26 | | | | | | | 900 | | | | 930,251 | |
| | | | | | | | | | | | |
| | | | | | | | | | | | 4,721,998 | |
Tunisia — 0.0% | | | | | | | | | | | | |
Banque Centrale de Tunisie International Bond, 4.50%, 6/22/20 | | | EUR | | | | 1,176 | | | | 1,298,721 | |
Turkey — 0.1% | | | | | | | | | | | | |
Republic of Turkey: | | | | | | | | | | | | |
7.00%, 6/05/20 | | | USD | | | | 6,619 | | | | 7,222,189 | |
8.80%, 9/27/23 | | | TRY | | | | 18,730 | | | | 4,679,343 | |
| | | | | | | | | | | | |
| | | | | | | | | | | | 11,901,532 | |
United Kingdom — 1.9% | | | | | | | | | | | | |
United Kingdom Gilt, 0.50%, 7/22/22 | | | GBP | | | | 151,599 | | | | 189,463,276 | |
Uruguay — 0.1% | | | | | | | | | | | | |
Republic of Uruguay, 4.38%, 10/27/27 | | | USD | | | | 8,100 | | | | 8,456,400 | |
Total Foreign Government Obligations — 5.5% | | | | | | | | 548,587,642 | |
| | | | | | | | | | | | |
| Investment Companies | | | | | Shares | | | | |
iShares iBoxx $ High Yield Corporate Bond ETF (f)(n) | | | | | | | 1,119,344 | | | | 98,256,016 | |
iShares MSCI Emerging Markets ETF (f)(n) | | | | | | | 224,137 | | | | 8,828,756 | |
Total Investment Companies — 1.1% | | | | | | | | | | | 107,084,772 | |
| | | | | | | | | | | | |
| Non-Agency Mortgage-Backed Securities | | | | | Par (000) | | | | |
Collateralized Mortgage Obligations — 2.1% | | | | | | | | | |
Ajax Mortgage Loan Trust: | | | | | | | | | | | | |
Series 2015-C, Class A,
3.88%, 3/25/57 (b)(c) | | | USD | | | | 8,494 | | | | 8,300,908 | |
Series 2016-A, Class A,
4.25%, 8/25/64 (b)(c) | | | | | | | 4,326 | | | | 4,342,731 | |
American Home Mortgage Assets Trust: | | | | | | | | | | | | |
Series 2006-3, Class 2A11,
1.58%, 10/25/46 (a) | | | | | | | 1,244 | | | | 979,905 | |
Series 2006-4, Class 1A12,
1.19%, 10/25/46 (a) | | | | | | | 3,621 | | | | 2,392,360 | |
Series 2006-5, Class A1,
1.56%, 11/25/46 (a) | | | | | | | 4,282 | | | | 2,187,624 | |
Series 2007-1, Class A1,
1.34%, 2/25/47 (a) | | | | | | | 1,028 | | | | 595,890 | |
Angel Oak Mortgage Trust I LLC, Series 2016-1, Class A1, 3.50%, 7/25/46 (b)(c) | | | | | | | 2,713 | | | | 2,706,395 | |
Angel Oak Mortgage Trust LLC, Series 2015-1, Class A, 4.50%, 11/25/45 (b)(c) | | | | | | | 689 | | | | 691,640 | |
APS Resecuritization Trust: | | | | | | | | | | | | |
Series 2016-3, Class 3A,
3.62%, 9/27/46 (a)(b) | | | | | | | 8,999 | | | | 9,021,868 | |
Series 2016-3, Class 4A,
3.37%, 4/27/47 (a)(b) | | | | | | | 2,591 | | | | 2,597,128 | |
Banc of America Funding Trust, Series 2016-R2, Class 1A1, 4.70%, 5/01/33 (a)(b) | | | | | | | 1,846 | | | | 1,856,626 | |
Bear Stearns ALT-A Trust II, Series 2007-1, Class 1A1, 3.23%, 9/25/47 (a) | | | | | | | 4,376 | | | | 3,086,847 | |
Bear Stearns Asset-Backed Securities I Trust, Series 2005-AC9, Class A5,
6.25%, 12/25/35 (c) | | | | | | | 377 | | | | 328,806 | |
See Notes to Consolidated Financial Statements.
| | | | | | |
| 60 | | BLACKROCK BALANCED CAPITAL FUND, INC. | | MARCH 31, 2017 | | |
| | | | |
| Consolidated Schedule of Investments (continued) | | | Master Total Return Portfolio | |
| | | | | | | | | | | | |
| Non-Agency Mortgage-Backed Securities | | | | | Par
(000) | | | Value | |
Collateralized Mortgage Obligations (continued) | | | | | | | | | |
Bear Stearns Mortgage Funding Trust: | | | | | | | | | | | | |
Series 2007-AR2, Class A1,
1.15%, 3/25/37 (a) | | | USD | | | | 655 | | | $ | 539,470 | |
Series 2007-AR3, Class 1A1,
1.12%, 3/25/37 (a) | | | | | | | 961 | | | | 799,081 | |
Series 2007-AR4, Class 1A1,
0.98%, 9/25/47 (a) | | | | | | | 3,736 | | | | 3,218,905 | |
Series 2007-AR4, Class 2A1,
0.99%, 6/25/37 (a) | | | | | | | 1,058 | | | | 877,749 | |
Berica 8 Residential MBS Srl, Series 8, Class A,
0.00%, 3/31/48 (a) | | | EUR | | | | 193 | | | | 204,674 | |
BlackRock Capital Finance LP, Series 1997-R2, Class AP, 1.48%, 12/25/35 (a)(b)(n) | | | USD | | | | 3 | | | | 3,125 | |
Citigroup Mortgage Loan Trust, Series 2007-2, Class 2A, 6.00%, 11/25/36 | | | | | | | 41 | | | | 42,464 | |
Collateralized Mortgage Obligation Trust, Series 57, Class D, 9.90%, 2/01/19 | | | | | | | 1 | | | | 1,282 | |
COLT LLC, Series 2015-1, Class A1V,
3.98%, 12/26/45 (a)(b) | | | | | | | 1,100 | | | | 1,093,233 | |
Countrywide Alternative Loan Trust: | | | | | | | | | | | | |
Series 2005-56, Class 4A1,
1.29%, 11/25/35 (a) | | | | | | | 2,733 | | | | 2,255,033 | |
Series 2005-72, Class A3,
1.08%, 1/25/36 (a) | | | | | | | 1,069 | | | | 929,567 | |
Series 2005-76, Class 2A1,
1.64%, 2/25/36 (a) | | | | | | | 1,290 | | | | 1,143,478 | |
Series 2006-15CB, Class A1,
6.50%, 6/25/36 | | | | | | | 573 | | | | 443,137 | |
Series 2006-23CB, Class 2A5,
1.38%, 8/25/36 (a) | | | | | | | 8,215 | | | | 2,988,792 | |
Series 2006-OA14, Class 1A1,
2.37%, 11/25/46 (a) | | | | | | | 5,346 | | | | 4,403,590 | |
Series 2006-OA21, Class A1,
1.17%, 3/20/47 (a) | | | | | | | 13,784 | | | | 9,528,564 | |
Series 2006-OA6, Class 1A2,
1.19%, 7/25/46 (a) | | | | | | | 4,876 | | | | 4,138,407 | |
Series 2006-OA8, Class 1A1,
0.97%, 7/25/46 (a) | | | | | | | 790 | | | | 653,333 | |
Series 2007-OA2, Class 1A1,
1.48%, 3/25/47 (a) | | | | | | | 9,621 | | | | 6,672,717 | |
Series 2007-OA3, Class 1A1,
1.12%, 4/25/47 (a) | | | | | | | 1,623 | | | | 1,388,834 | |
Countrywide Home Loan Mortgage Pass-Through Trust: | | | | | | | | | | | | |
Series 2004-29, Class 1A1,
1.32%, 2/25/35 (a) | | | | | | | 491 | | | | 463,441 | |
Series 2006-OA4, Class A1,
1.60%, 4/25/46 (a) | | | | | | | 1,742 | | | | 868,117 | |
Credit Suisse Commercial Mortgage Trust: | | | | | | | | | | | | |
Series 2014-4R, Class 16A3,
0.98%, 2/27/36 (a)(b) | | | | | | | 830 | | | | 709,515 | |
Series 2014-9R, Class 9A1,
0.89%, 8/27/36 (a)(b) | | | | | | | 1,978 | | | | 1,540,471 | |
Credit Suisse Mortgage Capital Certificates: | | | | | | | | | | | | |
Series 2010-20R, Class 9A1,
3.24%, 1/27/36 (a)(b) | | | | | | | 2,912 | | | | 2,901,521 | |
Series 2011-5R, Class 3A1,
3.42%, 9/27/47 (a)(b) | | | | | | | 2,114 | | | | 2,067,830 | |
Series 2013-5R, Class 1A6,
1.03%, 2/27/36 (a)(b) | | | | | | | 1,755 | | | | 1,474,200 | |
Series 2014-11R, Class 16A1,
3.17%, 9/27/47 (a)(b) | | | | | | | 3,030 | | | | 3,022,687 | |
Series 2015-6R, Class 5A1,
0.96%, 3/27/36 (a)(b) | | | | | | | 1,250 | | | | 1,180,258 | |
Series 2015-6R, Class 5A2,
0.96%, 3/27/36 (a)(b) | | | | | | | 2,721 | | | | 1,412,714 | |
| | | | | | | | | | | | |
| Non-Agency Mortgage-Backed Securities | | | | | Par
(000) | | | Value | |
Collateralized Mortgage Obligations (continued) | | | | | | | | | |
Deephaven Residential Mortgage Trust, Series 2016-1A, Class A1, 4.00%, 7/25/46 (b) | | | USD | | | | 3,881 | | | $ | 3,890,502 | |
Deutsche Alt-A Securities Mortgage Loan Trust: | | | | | | | | | | | | |
Series 2007-OA4, Class 1A1B,
0.91%, 8/25/47 (a) | | | | | | | 939 | | | | 829,267 | |
Series 2007-RMP1, Class A2,
0.93%, 12/25/36 (a) | | | | | | | 3,353 | | | | 2,712,909 | |
Deutsche ALT-A Securities, Inc., Series 2007-RS1, Class A2, 1.48%, 1/27/37 (a)(b) | | | | | | | 575 | | | | 1,171,782 | |
Deutsche Alt-B Securities Mortgage Loan Trust: | | | | | | | | | | | | |
Series 2006-AB3, Class A3,
6.51%, 7/25/36 (a) | | | | | | | 866 | | | | 709,406 | |
Series 2006-AB3, Class A8,
6.36%, 7/25/36 (a) | | | | | | | 552 | | | | 452,396 | |
GreenPoint Mortgage Funding Trust, Series 2006-AR2, Class 4A1, 2.64%, 3/25/36 (a) | | | | | | | 1,207 | | | | 1,017,998 | |
GSMPS Mortgage Loan Trust: | | | | | | | | | | | | |
Series 2005-RP1, Class 1AF,
1.13%, 1/25/35 (a)(b) | | | | | | | 1,980 | | | | 1,703,822 | |
Series 2005-RP2, Class 1AF,
1.33%, 3/25/35 (a)(b) | | | | | | | 2,483 | | | | 2,193,076 | |
Series 2006-RP1, Class 1AF1,
1.33%, 1/25/36 (a)(b) | | | | | | | 1,873 | | | | 1,569,074 | |
HomeBanc Mortgage Trust, Series 2005-4, Class A1, 1.05%, 10/25/35 (a) | | | | | | | 5,917 | | | | 5,709,989 | |
Impac CMB Trust, Series 2005-7, Class A1,
1.50%, 11/25/35 (a) | | | | | | | 4,618 | | | | 3,746,872 | |
Impac Secured Assets CMN Owner Trust, Series 2004-3, Class 1A4, 1.58%, 11/25/34 (a) | | | | | | | 333 | | | | 328,695 | |
JPMorgan Alternative Loan Trust: | | | | | | | | | | | | |
Series 2007-A1, Class 1A4,
1.19%, 3/25/37 (a) | | | | | | | 2,485 | | | | 1,855,118 | |
Series 2007-A2, Class 2A1,
3.31%, 5/25/37 (a) | | | | | | | 627 | | | | 527,804 | |
JPMorgan Resecuritization Trust, Series 2015-3, Class 1A7, 0.90%, 6/26/37 (a)(b) | | | | | | | 1,852 | | | | 1,730,103 | |
Lehman XS Trust, Series 2007-20N, Class A1,
2.13%, 12/25/37 (a) | | | | | | | 1,621 | | | | 1,344,882 | |
LSTAR Securities Investment Ltd.: | | | | | | | | | | | | |
Series 2016-3, Class A,
2.78%, 9/01/21 (a)(b) | | | | | | | 10,929 | | | | 10,791,012 | |
Series 2017-2, Class A1,
2.78%, 2/01/22 (a)(b) | | | | | | | 12,325 | | | | 12,172,818 | |
LSTAR Securities Investment Trust: | | | | | | | | | | | | |
Series 2016-5, Class A1,
2.78%, 11/01/21 (a)(b) | | | | | | | 9,814 | | | | 9,834,769 | |
Series 2015-8, Class A1,
2.78%, 8/01/20 (a)(b) | | | | | | | 1,015 | | | | 1,011,801 | |
Series 2015-10, Class A1,
2.78%, 11/01/20 (a)(b) | | | | | | | 1,014 | | | | 1,013,319 | |
Series 2015-10, Class A2,
4.28%, 11/01/20 (a)(b) | | | | | | | 680 | | | | 679,150 | |
Series 2016-2, Class A,
2.78%, 3/01/21 (a)(b) | | | | | | | 11,842 | | | | 11,794,818 | |
MASTR Resecuritization Trust, Series 2008-3, Class A1, 1.19%, 8/25/37 (a)(b) | | | | | | | 2,031 | | | | 1,400,259 | |
Merrill Lynch Mortgage Investors Trust, Series 2006-A3, Class 6A1, 3.58%, 5/25/36 (a) | | | | | | | 3,340 | | | | 3,076,545 | |
Morgan Stanley Resecuritization Trust, Series 2014-R8, Class 3B1, 1.36%, 6/26/47 (a)(b) | | | | | | | 1,058 | | | | 974,336 | |
See Notes to Consolidated Financial Statements.
| | | | | | |
| | | BLACKROCK BALANCED CAPITAL FUND, INC. | | MARCH 31, 2017 | | 61 |
| | | | |
| Consolidated Schedule of Investments (continued) | | | Master Total Return Portfolio | |
| | | | | | | | | | | | |
| Non-Agency Mortgage-Backed Securities | | | | | Par
(000) | | | Value | |
Collateralized Mortgage Obligations (continued) | | | | | | | | | |
Mortgage Loan Resecuritization Trust, Series 2009-RS1, Class A85, 1.11%, 4/16/36 (a)(b) | | | USD | | | | 10,961 | | | $ | 9,076,471 | |
Nomura Asset Acceptance Corp. Alternative Loan Trust, Series 2006-AF1, Class 1A4, 6.63%, 5/25/36 (c) | | | | | | | 700 | | | | 300,871 | |
Nomura Resecuritization Trust, Series 2014-3R, Class 3A9, 2.30%, 11/26/35 (a)(b) | | | | | | | 1,700 | | | | 1,527,917 | |
Paragon Mortgages No. 13 PLC, Series 13X, Class A2C, 1.20%, 1/15/39 (a) | | | | | | | 402 | | | | 372,342 | |
RALI Series Trust, Series 2006-QO6, Class A2, 1.21%, 6/25/46 (a) | | | | | | | 1,628 | | | | 704,813 | |
RALI Trust: | | | | | | | | | | | | |
Series 2007-QH1, Class A1,
1.14%, 2/25/37 (a) | | | | | | | 1,426 | | | | 1,172,958 | |
Series 2007-QH6, Class A1,
1.17%, 7/25/37 (a) | | | | | | | 2,102 | | | | 1,801,822 | |
Series 2007-QH9, Class A1,
1.97%, 11/25/37 (a) | | | | | | | 1,324 | | | | 1,038,940 | |
RBSSP Resecuritization Trust, Series 2013-2, Class 1A2, 0.97%, 12/26/36 (a)(b) | | | | | | | 1,092 | | | | 1,028,526 | |
Reperforming Loan REMIC Trust: | | | | | | | | | | | | |
Series 2005-R2, Class 1AF1,
1.32%, 6/25/35 (a)(b) | | | | | | | 844 | | | | 767,257 | |
Series 2005-R3, Class AF,
1.38%, 9/25/35 (a)(b) | | | | | | | 274 | | | | 236,362 | |
Structured Asset Mortgage Investments II Trust: | | | | | | | | | | | | |
Series 2006-AR4, Class 3A1,
1.17%, 6/25/36 (a) | | | | | | | 2,239 | | | | 1,836,610 | |
Series 2006-AR5, Class 2A1,
1.19%, 5/25/46 (a) | | | | | | | 836 | | | | 630,482 | |
Structured Asset Securities Corp. Mortgage Loan Trust, Series 2006-RF4, Class 2A1,
6.00%, 10/25/36 (b) | | | | | | | 1,725 | | | | 1,484,362 | |
Thornburg Mortgage Securities Trust, Series 2007-3, Class 4A1, 5.75%, 6/25/47 (a) | | | | | | | 1,503 | | | | 1,331,256 | |
Washington Mutual Mortgage Pass-Through Certificates, Series 2006-4, Class 3A1,
6.04%, 5/25/36 (c) | | | | | | | 2,256 | | | | 1,663,782 | |
| | | | | | | | | | | | |
| | | | | | | | | | | | 205,272,210 | |
Commercial Mortgage-Backed Securities — 3.7% | | | | | | | | | |
Banc of America Commercial Mortgage Trust: | | | | | | | | | | | | |
Series 2007-1, Class AMFX,
5.48%, 1/15/49 (a) | | | | | | | 266 | | | | 265,350 | |
Series 2007-3, Class AJ,
5.63%, 6/10/49 (a) | | | | | | | 275 | | | | 275,974 | |
Series 2007-5, Class AM,
5.77%, 2/10/51 (a) | | | | | | | 2,030 | | | | 2,071,357 | |
Series 2008-1, Class A4,
6.23%, 2/10/51 (a) | | | | | | | 314 | | | | 318,868 | |
Banc of America Merrill Lynch Commercial Mortgage Securities Trust: | | | | | | | | | | | | |
Series 2013-DSNY, Class A,
1.82%, 9/15/26 (a)(b) | | | | | | | 1,204 | | | | 1,205,017 | |
Series 2013-DSNY, Class E,
3.37%, 9/15/26 (a)(b) | | | | | | | 100 | | | | 99,912 | |
Series 2013-DSNY, Class F,
4.41%, 9/15/26 (a)(b) | | | | | | | 2,303 | | | | 2,295,905 | |
Series 2015-200P, Class F,
3.60%, 4/14/33 (a)(b) | | | | | | | 2,231 | | | | 2,107,281 | |
Series 2016-ISQ, Class E,
3.61%, 8/14/34 (a)(b) | | | | | | | 6,140 | | | | 5,354,694 | |
Banc of America Merrill Lynch Commercial Mortgage, Inc., Series 2005-3, Class AM, 4.73%, 7/10/43 | | | | | | | 724 | | | | 723,349 | |
| | | | | | | | | | | | |
| Non-Agency Mortgage-Backed Securities | | | | | Par
(000) | | | Value | |
Commercial Mortgage-Backed Securities (continued) | | | | | | | | | |
Barclays Commercial Mortgage Trust: | | | | | | | | | | | | |
Series 2015-SLP, Class D,
3.97%, 2/15/28 (a)(b) | | | USD | | | | 1,410 | | | $ | 1,387,762 | |
Series 2015-SRCH, Class A1,
3.31%, 8/10/35 (b) | | | | | | | 2,730 | | | | 2,773,787 | |
Bayview Commercial Asset Trust: | | | | | | | | | | | | |
Series 2005-2A, Class A1,
1.29%, 8/25/35 (a)(b) | | | | | | | 1,941 | | | | 1,769,863 | |
Series 2006-1A, Class A2,
1.34%, 4/25/36 (a)(b) | | | | | | | 537 | | | | 469,732 | |
Series 2006-3A, Class A2,
1.28%, 10/25/36 (a)(b) | | | | | | | 647 | | | | 567,976 | |
Series 2007-2A, Class A1,
1.05%, 7/25/37 (a)(b) | | | | | | | 1,775 | | | | 1,559,304 | |
Series 2007-4A, Class A1,
1.43%, 9/25/37 (a)(b) | | | | | | | 7,990 | | | | 6,982,547 | |
Series 2007-5A, Class A3,
1.78%, 10/25/37 (a)(b) | | | | | | | 553 | | | | 534,554 | |
Series 2008-4, Class A3, 3.73%, 7/25/38 (a)(b) | | | | | | | 959 | | | | 990,781 | |
BB-UBS Trust, Series 2012-SHOW, Class E,
4.03%, 11/05/36 (a)(b) | | | | | | | 790 | | | | 764,691 | |
Bear Stearns Commercial Mortgage Securities Trust: | | | | | | | | | | | | |
Series 2007-PW16, Class AM,
5.70%, 6/11/40 (a) | | | | | | | 2,324 | | | | 2,329,057 | |
Series 2007-PW17, Class AMFL,
1.46%, 6/11/50 (a)(b) | | | | | | | 775 | | | | 775,071 | |
Series 2007-PW18, Class A1A,
5.60%, 6/11/50 | | | | | | | 152 | | | | 154,727 | |
Series 2007-PW18, Class AM,
6.08%, 6/11/50 (a) | | | | | | | 2,720 | | | | 2,775,928 | |
Series 2007-PW18, Class AMA,
6.09%, 6/11/50 (a) | | | | | | | 4,033 | | | | 4,119,201 | |
BHMS Mortgage Trust, Series 2014-ATLS, Class AFL, 2.27%, 7/05/33 (a)(b) | | | | | | | 3,565 | | | | 3,570,587 | |
BWAY Mortgage Trust: | | | | | | | | | | | | |
Series 2013-1515, Class D,
3.63%, 3/10/33 (b) | | | | | | | 1,400 | | | | 1,375,801 | |
Series 2013-1515, Class F,
3.93%, 3/10/33 (a)(b) | | | | | | | 3,720 | | | | 3,590,051 | |
BXHTL Mortgage Trust: | | | | | | | | | | | | |
Series 2015-JWRZ, Class A,
2.00%, 5/15/29 (a)(b) | | | | | | | 2,990 | | | | 2,996,594 | |
Series 2015-JWRZ, Class GL2,
4.60%, 5/15/29 (a)(b) | | | | | | | 480 | | | | 482,709 | |
CCRESG Commercial Mortgage Trust, Series 2016-HEAT, Class D, 5.49%, 4/10/29 (a)(b) | | | | | | | 560 | | | | 548,627 | |
CDGJ Commercial Mortgage Trust, Series 2014-BXCH, Class A, 2.17%, 12/15/27 (a)(b) | | | | | | | 5,103 | | | | 5,112,399 | |
CFCRE Mortgage Trust, Series 2015-RUM, Class A, 2.61%, 7/15/30 (a)(b) | | | | | | | 1,440 | | | | 1,442,090 | |
CGBAM Commercial Mortgage Trust: | | | | | | | | | | | | |
Series 2015-SMRT, Class E,
3.79%, 4/10/28 (a)(b) | | | | | | | 770 | | | | 768,292 | |
Series 2015-SMRT, Class F,
3.79%, 4/10/28 (a)(b) | | | | | | | 230 | | | | 225,406 | |
CGGS Commercial Mortgage Trust: | | | | | | | | | | | | |
Series 2016-RNDB, Class CFL,
4.27%, 2/15/33 (a)(b) | | | | | | | 327 | | | | 328,045 | |
Series 2016-RNDB, Class DFL,
5.52%, 2/15/33 (a)(b) | | | | | | | 4,004 | | | | 4,015,293 | |
See Notes to Consolidated Financial Statements.
| | | | | | |
| 62 | | BLACKROCK BALANCED CAPITAL FUND, INC. | | MARCH 31, 2017 | | |
| | | | |
| Consolidated Schedule of Investments (continued) | | | Master Total Return Portfolio | |
| | | | |
| | | | | | | | | | | | |
| Non-Agency Mortgage-Backed Securities | | | | | Par
(000) | | | Value | |
Commercial Mortgage-Backed Securities (continued) | | | | | | | | | |
Chicago Skyscraper Trust: | | | | | | | | | | | | |
Series 2017-SKY, Class D,
3.16%, 4/15/30 (a)(b) | | | USD | | | | 1,580 | | | $ | 1,580,000 | |
Series 2017-SKY, Class E,
4.21%, 4/15/30 (a)(b) | | | | | | | 3,390 | | | | 3,390,000 | |
Series 2017-SKY, Class F,
5.01%, 4/15/30 (a)(b) | | | | | | | 420 | | | | 420,000 | |
Citigroup Commercial Mortgage Trust: | | | | | | | | | | | | |
Series 16-SMPL, 3.52%, 9/08/31 (b) | | | | | | | 320 | | | | 317,204 | |
Series 16-SMPL, 4.51%, 9/08/31 (b) | | | | | | | 620 | | | | 601,976 | |
Series 2013-375P, Class D,
3.52%, 5/10/35 (a)(b) | | | | | | | 240 | | | | 236,134 | |
Series 2013-375P, Class E,
3.52%, 5/10/35 (a)(b) | | | | | | | 1,115 | | | | 1,069,056 | |
Series 2013-GC11, Class D,
4.46%, 4/10/46 (a)(b) | | | | | | | 1,125 | | | | 1,022,334 | |
Series 2014-GC19, Class A4, 4.02%, 3/10/47 | | | | | | | 3,525 | | | | 3,733,539 | |
Series 2015-SHP2, Class F,
6.11%, 7/15/27 (a)(b) | | | | | | | 370 | | | | 370,712 | |
Series 2015-SSHP, Class A,
2.06%, 9/15/27 (a)(b) | | | | | | | 4,370 | | | | 4,358,956 | |
Series 2016-C1, Class C, 4.95%, 5/10/49 (a) | | | | | | | 1,290 | | | | 1,271,328 | |
Series 2016-GC37, Class C, 4.92%, 2/10/26 (a) | | | | | | | 640 | | | | 622,655 | |
Series 2016-GC37, Class D, 2.79%, 4/10/49 (b) | | | | | | | 3,050 | | | | 2,041,030 | |
Series 2017-P7, Class A4, 3.71%, 3/14/27 (a) | | | | | | | 3,360 | | | | 3,460,611 | |
Citigroup/Deutsche Bank Commercial Mortgage Trust: | | | | | | | | | | | | |
Series 2006-CD3, Class AM, 5.65%, 10/15/48 | | | | | | | 5,442 | | | | 5,550,588 | |
Series 2007-CD5, Class AMA,
6.12%, 11/15/44 (a) | | | | | | | 4,308 | | | | 4,392,226 | |
Series 2017-CD3, Class A4, 3.63%, 2/10/50 | | | | | | | 850 | | | | 875,781 | |
COBALT CMBS Commercial Mortgage Trust, Series 2007-C3, Class AM, 5.77%, 5/15/46 (a) | | | | | | | 2,088 | | | | 2,120,418 | |
COMM Mortgage Trust: | | | | | | | | | | | | |
Series 2005-C6, Class F, 5.66%, 6/10/44 (a)(b) | | | | | | | 470 | | | | 489,169 | |
Series 2014-CR16, Class A4, 4.05%, 4/10/47 | | | | | | | 4,806 | | | | 5,092,021 | |
Series 2014-CR17, Class A5, 3.98%, 5/10/47 | | | | | | | 7,062 | | | | 7,451,346 | |
Series 2014-CR18, Class A4, 3.55%, 5/15/24 | | | | | | | 390 | | | | 400,623 | |
Series 2014-LC15, Class A4, 4.01%, 4/10/47 | | | | | | | 1,020 | | | | 1,077,600 | |
Commercial Mortgage Pass-Through Certificates: | | | | | | | | | | | | |
Series 2007-C9, Class AJFL,
1.55%, 12/10/49 (a)(b) | | | | | | | 7,617 | | | | 7,519,602 | |
Series 2007-GG11, Class AM,
5.87%, 12/10/49 (a) | | | | | | | 600 | | | | 607,100 | |
Series 2010-RR1, Class GEB,
5.54%, 12/11/49 (a)(b) | | | | | | | 68 | | | | 68,378 | |
Series 2013-GAM, Class A2,
3.37%, 2/10/28 (b) | | | | | | | 1,656 | | | | 1,686,126 | |
Series 2013-WWP, Class D, 3.90%, 3/10/31 (b) | | | | | | | 2,090 | | | | 2,093,917 | |
Series 2014-CR18, Class C, 4.74%, 7/15/47 (a) | | | | | | | 2,974 | | | | 3,045,345 | |
Series 2014-CR19, Class A5, 3.80%, 8/10/24 | | | | | | | 1,391 | | | | 1,454,933 | |
| | | | | | | | | | | | |
| Non-Agency Mortgage-Backed Securities | | | | | Par
(000) | | | Value | |
Commercial Mortgage-Backed Securities (continued) | | | | | | | | | |
Series 2014-CR21, Class C,
4.42%, 12/10/24 (a) | | | USD | | | | 1,010 | | | $ | 995,405 | |
Series 2014-FL4, Class D,
3.22%, 7/13/31 (a)(b) | | | | | | | 660 | | | | 645,411 | |
Series 2014-PAT, Class A,
1.57%, 8/13/27 (a)(b) | | | | | | | 2,788 | | | | 2,787,126 | |
Series 2014-PAT, Class E,
4.03%, 8/13/27 (a)(b) | | | | | | | 540 | | | | 541,594 | |
Series 2014-TWC, Class A,
1.73%, 2/13/17 (a)(b) | | | | | | | 1,715 | | | | 1,719,302 | |
Series 2014-TWC, Class B,
2.48%, 2/13/17 (a)(b) | | | | | | | 3,190 | | | | 3,205,991 | |
Series 2015-CR23, Class CMD,
3.68%, 5/10/48 (a)(b) | | | | | | | 2,890 | | | | 2,783,912 | |
Series 2015-CR25, Class C,
4.55%, 8/10/48 (a) | | | | | | | 1,740 | | | | 1,705,335 | |
Series 2015-CR25, Class D,
3.80%, 8/10/48 (a) | | | | | | | 790 | | | | 609,121 | |
Series 2015-LC19, Class D,
2.87%, 2/10/48 (b) | | | | | | | 2,280 | | | | 1,757,877 | |
Series 2015-LC21, Class C,
4.31%, 7/10/48 (a) | | | | | | | 1,600 | | | | 1,507,525 | |
Series 2016-667M, Class D,
3.18%, 10/10/36 (a)(b) | | | | | | | 630 | | | | 561,683 | |
Core Industrial Trust: | | | | | | | | | | | | |
Series 2015-CALW, Class G,
3.85%, 2/10/34 (a)(b) | | | | | | | 1,971 | | | | 1,906,406 | |
Series 2015-TEXW, Class A,
3.08%, 2/10/34 (b) | | | | | | | 2,970 | | | | 3,033,438 | |
Series 2015-TEXW, Class D,
3.85%, 2/10/34 (a)(b) | | | | | | | 1,330 | | | | 1,342,285 | |
Series 2015-TEXW, Class E,
3.85%, 2/10/34 (a)(b) | | | | | | | 250 | | | | 245,379 | |
Series 2015-TEXW, Class F,
3.85%, 2/10/34 (a)(b) | | | | | | | 5,869 | | | | 5,603,046 | |
Cosmopolitan Hotel Trust, Series 2016-CSMO, Class A, 2.31%, 11/15/33 (a)(b) | | | | | | | 4,990 | | | | 5,030,593 | |
Countrywide Commercial Mortgage Trust, Series 2007-MF1, Class A,
6.21%, 11/12/43 (a)(b) | | | | | | | 974 | | | | 979,080 | |
Credit Suisse Commercial Mortgage Trust: | | | | | | | | | | | | |
Series 2007-C2, Class AMFL,
1.17%, 1/15/49 (a) | | | | | | | 446 | | | | 446,102 | |
Series 2007-C4, Class A1AM,
5.94%, 9/15/39 (a) | | | | | | | 1,236 | | | | 1,243,915 | |
Series 2008-C1, Class A3,
6.06%, 2/15/41 (a) | | | | | | | 1,579 | | | | 1,596,572 | |
Series 2014-TIKI, Class E,
4.06%, 9/15/38 (a)(b) | | | | | | | 730 | | | | 723,304 | |
Series 2015-DEAL, Class A,
2.23%, 4/15/29 (a)(b) | | | | | | | 5,251 | | | | 5,257,928 | |
Credit Suisse Mortgage Capital Certificates: | | | | | | | | | | | | |
Series 17-1, Class A, 4.50%, 3/25/21 (b) | | | | | | | 25,910 | | | | 25,925,600 | |
Series 17-1, Class CERT,
8.75%, 3/25/21 (b) | | | | | | | 13,452 | | | | 9,292,800 | |
Series 2010-RR1, Class 2A,
5.70%, 9/15/40 (a)(b) | | | | | | | 2,019 | | | | 2,016,108 | |
Series 2010-RR2, Class 2A,
5.94%, 9/15/39 (a)(b) | | | | | | | 551 | | | | 550,924 | |
Series 2014-TIKI, Class D,
3.02%, 9/15/38 (a)(b) | | | | | | | 560 | | | | 555,555 | |
Series 2015-DEAL, Class D,
4.01%, 4/15/29 (a)(b) | | | | | | | 1,205 | | | | 1,208,760 | |
Series 2015-GLPB, Class A,
3.64%, 11/15/34 (b) | | | | | | | 2,730 | | | | 2,856,723 | |
Series 2016-MFF, Class A,
2.37%, 11/15/33 (a)(b) | | | | | | | 690 | | | | 691,598 | |
See Notes to Consolidated Financial Statements.
| | | | | | |
| | | BLACKROCK BALANCED CAPITAL FUND, INC. | | MARCH 31, 2017 | | 63 |
| | | | |
| Consolidated Schedule of Investments (continued) | | | Master Total Return Portfolio | |
| | | | |
| | | | | | | | | | | | |
| Non-Agency Mortgage-Backed Securities | | | | | Par
(000) | | | Value | |
Commercial Mortgage-Backed Securities (continued) | |
CSAIL Commercial Mortgage Trust, Series 2015-C3, Class C, 4.36%, 8/15/48 (a) | | | USD | | | | 780 | | | $ | 758,728 | |
Deutsche Bank JPMorgan Mortgage Trust, Series 2016-C3, Class D, 3.49%, 9/10/49 (a)(b) | | | | | | | 3,608 | | | | 2,785,573 | |
Deutsche Bank Re-REMIC Trust, Series 2011-C32, Class A3A, 5.21%, 6/17/49 (a)(b) | | | | | | | 519 | | | | 518,654 | |
GAHR Commercial Mortgage Trust: | | | | | | | | | | | | |
Series 2015-NRF, Class AFL1, 2.07%, 12/15/34 (a)(b) | | | | | | | 610 | | | | 612,503 | |
Series 2015-NRF, Class EFX, 3.38%, 12/15/34 (a)(b) | | | | | | | 2,571 | | | | 2,549,129 | |
Series 2015-NRF, Class FFX, 3.38%, 12/15/34 (a)(b) | | | | | | | 4,750 | | | | 4,635,966 | |
Series 2015-NRF, Class GFX, 3.38%, 12/15/19 (a)(b) | | | | | | | 4,082 | | | | 3,926,896 | |
GS Mortgage Securities Trust: | | | | | | | | | | | | |
Series 2007-GG10, Class A4, 5.87%, 8/10/45 (a) | | | | | | | 1,234 | | | | 1,232,297 | |
Series 2010-C1, Class A1, 3.68%, 8/10/43 (b) | | | | | | | 686 | | | | 702,317 | |
Series 2014-GC22, Class D,
4.65%, 6/10/47 (a)(b) | | | | | | | 420 | | | | 348,128 | |
Series 2014-GC24, Class A5, 3.93%, 9/10/47 | | | | | | | 882 | | | | 927,664 | |
Series 2015-GC32, Class D, 3.35%, 7/10/48 | | | | | | | 1,240 | | | | 954,798 | |
Series 2016-RENT, Class C,
4.07%, 2/10/29 (a)(b) | | | | | | | 1,850 | | | | 1,908,427 | |
Hudson Yards Mortgage Trust, Series 2016-10HY, Class A, 2.84%, 8/10/38 (b) | | | | | | | 760 | | | | 732,372 | |
Impac CMB Trust: | | | | | | | | | | | | |
Series 2004-11, Class 1A2, 1.50%, 3/25/35 (a) | | | | | | | 2,478 | | | | 2,146,832 | |
Series 2005-6, Class 1A1, 1.48%, 10/25/35 (a) | | | | | | | 1,654 | | | | 1,415,294 | |
JPMBB Commercial Mortgage Securities Trust: | | | | | | | | | | | | |
Series 2014-C26, Class A4, 3.49%, 1/15/48 | | | | | | | 1,247 | | | | 1,274,887 | |
Series 2015-C28, Class B, 3.99%, 3/15/25 (a) | | | | | | | 3,000 | | | | 2,903,365 | |
JPMorgan Chase Commercial Mortgage Securities Corp., Series 2017-JP5, Class D,
4.80%, 3/15/50 (a)(b) | | | | | | | 1,650 | | | | 1,557,175 | |
JPMorgan Chase Commercial Mortgage Securities Trust: | | | | | | | | | | | | |
Series 2007-CB20, Class AM, 5.97%, 2/12/51 (a) | | | | | | | 1,000 | | | | 1,014,383 | |
Series 2007-LD11, Class A4, 5.84%, 5/15/17 (a) | | | | | | | 3,059 | | | | 3,060,333 | |
Series 2008-C2, Class A4FL, 2.27%, 2/12/51 (a) | | | | | | | 2,188 | | | | 2,118,335 | |
Series 2008-C2, Class ASB, 6.13%, 2/12/51 (a) | | | | | | | 70 | | | | 69,775 | |
Series 2014-C21, Class A5, 3.77%, 6/15/24 | | | | | | | 1,420 | | | | 1,479,878 | |
Series 2014-C22, Class A4, 3.80%, 9/15/47 | | | | | | | 563 | | | | 583,697 | |
Series 2014-C22, Class D,
4.56%, 9/15/47 (a)(b) | | | | | | | 800 | | | | 644,798 | |
Series 2014-CBM, Class E,
4.76%, 10/15/29 (a)(b) | | | | | | | 670 | | | | 674,659 | |
Series 2014-DSTY, Class A, 3.43%, 6/10/27 (b) | | | | | | | 885 | | | | 900,263 | |
| | | | | | | | | | | | |
| Non-Agency Mortgage-Backed Securities | | | | | Par
(000) | | | Value | |
Commercial Mortgage-Backed Securities (continued) | |
Series 2014-DSTY, Class D,
3.80%, 6/10/27 (a)(b) | | | USD | | | | 1,780 | | | $ | 1,706,393 | |
Series 2014-FL6, Class A,
2.31%, 11/15/31 (a)(b) | | | | | | | 584 | | | | 584,499 | |
Series 2015-SGP, Class A,
2.61%, 7/15/36 (a)(b) | | | | | | | 6,206 | | | | 6,237,096 | |
Series 2015-UES, Class E,
3.62%, 9/05/32 (a)(b) | | | | | | | 3,880 | | | | 3,765,032 | |
Series 2016-ATRM, Class D,
5.35%, 10/05/28 (b) | | | | | | | 1,470 | | | | 1,501,175 | |
Series 2016-WPT, Class A,
2.22%, 10/15/33 (a)(b) | | | | | | | 2,200 | | | | 2,217,859 | |
JPMorgan Commercial Mortgage-Backed Securities Trust, Series 2009-RR1, Class A4B, 5.84%, 11/18/17 (a)(b) | | | | | | | 277 | | | | 277,462 | |
LB Commercial Mortgage Trust, Series 2007-C3, Class AM, 5.97%, 7/15/44 (a) | | | | | | | 820 | | | | 824,027 | |
LB-UBS Commercial Mortgage Trust, Series 2007-C7, Class A1A, 5.68%, 9/15/45 (a) | | | | | | | 446 | | | | 453,391 | |
Lehman Brothers Small Balance Commercial Mortgage Trust, Series 2007-1A, Class 1A,
1.23%, 3/25/37 (a)(b) | | | | | | | 2,177 | | | | 2,009,392 | |
Lone Star Portfolio Trust: | | | | | | | | | | | | |
Series 2015-LSP, Class A1A2, 2.57%, 9/15/28 (a)(b) | | | | | | | 782 | | | | 785,731 | |
Series 2015-LSP, Class D,
4.77%, 9/15/28 (a)(b) | | | | | | | 691 | | | | 700,594 | |
Series 2015-LSP, Class E,
6.51%, 9/15/28 (a)(b) | | | | | | | 1,007 | | | | 1,021,875 | |
Merrill Lynch Mortgage Investors Trust, Series 1998-C3, Class G, 6.00%, 12/15/30 (b) | | | | | | | 2,336 | | | | 2,323,650 | |
Merrill Lynch Mortgage Trust: | | | | | | | | | | | | |
Series 2007-C1, Class A1A, 5.83%, 6/12/50 (a) | | | | | | | 2,287 | | | | 2,293,603 | |
Series 2008-C1, Class AJ, 6.30%, 2/12/51 (a) | | | | | | | 720 | | | | 729,844 | |
ML-CFC Commercial Mortgage Trust: | | | | | | | | | | | | |
Series 2007-7, Class A4, 5.75%, 6/12/50 (a) | | | | | | | 1,323 | | | | 1,322,767 | |
Series 2007-9, Class AM, 5.86%, 9/12/49 (a) | | | | | | | 1,890 | | | | 1,918,609 | |
Morgan Stanley Bank of America Merrill Lynch Trust: | | | | | | | | | | | | |
Series 2014-C16, Class A5, 3.89%, 6/15/47 | | | | | | | 2,530 | | | | 2,661,003 | |
Series 2015-C23, Class D,
4.13%, 7/15/50 (a)(b) | | | | | | | 970 | | | | 800,435 | |
Series 2015-C24, Class A4, 3.73%, 5/15/48 | | | | | | | 840 | | | | 870,529 | |
Series 2015-C25, Class C, 4.53%, 10/15/48 (a) | | | | | | | 220 | | | | 223,335 | |
Series 2015-C25, Class D, 3.07%, 10/15/48 | | | | | | | 1,060 | | | | 786,591 | |
Series 2015-C26, Class A5, 3.53%, 10/15/48 | | | | | | | 810 | | | | 827,496 | |
Series 2015-C26, Class D, 3.06%, 10/15/48 (b) | | | | | | | 1,935 | | | | 1,430,894 | |
Morgan Stanley Capital I Trust: | | | | | | | | | | | | |
Series 2007-IQ13, Class AM, 5.41%, 3/15/44 | | | | | | | 346 | | | | 345,052 | |
Series 2007-IQ16, Class A4, 5.81%, 12/12/49 | | | | | | | 3,309 | | | | 3,328,794 | |
Series 2008-T29, Class A4, 6.29%, 1/11/43 (a) | | | | | | | 1,258 | | | | 1,288,561 | |
See Notes to Consolidated Financial Statements.
| | | | | | |
| 64 | | BLACKROCK BALANCED CAPITAL FUND, INC. | | MARCH 31, 2017 | | |
| | | | |
| Consolidated Schedule of Investments (continued) | | | Master Total Return Portfolio | |
| | | | |
| | | | | | | | | | | | |
| Non-Agency Mortgage-Backed Securities | | | | | Par
(000) | | | Value | |
Commercial Mortgage-Backed Securities (continued) | | | | | | | | | |
Series 2014-CPT, Class G, 3.45%, 7/13/29 (a)(b) | | | USD | | | | 1,290 | | | $ | 1,253,048 | |
Series 2015-MS1, Class C, 4.03%, 5/15/48 (a) | | | | | | | 560 | | | | 527,044 | |
Series 2015-XLF2, Class AFSB, 3.52%, 8/15/26 (a)(b) | | | | | | | 600 | | | | 600,000 | |
Series 2017-PRME, Class D, 4.17%, 2/15/34 (a)(b) | | | | | | | 700 | | | | 700,184 | |
Morgan Stanley Re-REMIC Trust: | | | | | | | | | | | | |
Series 2009-GG10
5.95%, 8/12/45 (a)(b) | | | | | | | 6,666 | | | | 6,667,702 | |
Series 2010-GG10, Class A4B, 5.87%, 8/15/45 (a)(b) | | | | | | | 6,998 | | | | 6,995,689 | |
Series 2012-XA, Class A,
2.00%, 7/27/49 (b) | | | | | | | 407 | | | | 406,732 | |
Resource Capital Corp. Ltd., Series 2014-CRE2, Class A, 1.82%, 4/15/32 (a)(b) | | | | | | | 593 | | | | 592,420 | |
STRIPs Ltd., Series 2012-1A, Class B, 0.50%, 12/25/44 (b) | | | | | | | 2,949 | | | | 2,875,625 | |
Velocity Commercial Capital Loan Trust: | | | | | | | | | | | | |
Series 2015-1, Class AFL, 3.21%, 6/25/45 (a)(b) | | | | | | | 2,086 | | | | 2,091,559 | |
Series 2016-2, Class AFL, 2.58%, 10/25/46 (a) | | | | | | | 1,497 | | | | 1,498,854 | |
Series 2016-2, Class M1, 3.66%, 10/25/46 (a) | | | | | | | 360 | | | | 349,740 | |
Series 2016-2, Class M2, 4.46%, 10/25/46 (a) | | | | | | | 200 | | | | 194,818 | |
Series 2016-2, Class M3, 5.50%, 10/25/46 (a) | | | | | | | 340 | | | | 330,711 | |
Series 2016-2, Class M4, 7.23%, 10/25/46 (a) | | | | | | | 370 | | | | 358,341 | |
VNDO Trust, Series 2016-350P, Class E, 3.90%, 1/10/35 (a)(b) | | | | | | | 2,300 | | | | 2,116,551 | |
Wachovia Bank Commercial Mortgage Trust: | | | | | | | | | | | | |
Series 2006-C28, Class AJ, 5.63%, 10/15/48 (a) | | | | | | | 300 | | | | 300,555 | |
Series 2007-C32, Class AMFL, 0.99%, 6/15/49 (a)(b) | | | | | | | 1,930 | | | | 1,906,045 | |
Series 2007-C32, Class AMFX, 5.70%, 6/15/49 (b) | | | | | | | 3,533 | | | | 3,568,429 | |
Waldorf Astoria Boca Raton Trust, Series 2016-BOCA, Class A, 2.12%, 6/15/29 (a)(b) | | | | | | | 3,870 | | | | 3,882,837 | |
WaMu Mortgage Pass-Through Certificates Trust, Series 2006-AR13, Class 2A, 2.12%, 10/25/46 (a) | | | | | | | 6,421 | | | | 5,961,964 | |
Wells Fargo Commercial Mortgage Trust: | | | | | | | | | | | | |
Series 2014-TISH, Class SCH1, 3.52%, 1/15/27 (a)(b) | | | | | | | 8,224 | | | | 8,047,492 | |
Series 2015-C27, Class C, 3.89%, 2/15/48 | | | | | | | 1,402 | | | | 1,230,259 | |
Series 2015-C31, Class A4, 3.70%, 11/15/48 | | | | | | | 130 | | | | 133,785 | |
Series 2015-C31, Class D, 3.85%, 11/15/48 | | | | | | | 720 | | | | 523,977 | |
WF-RBS Commercial Mortgage Trust, Series 2014-C21, Class A5, 3.68%, 7/15/24 | | | | | | | 1,515 | | | | 1,568,546 | |
| | | | | | | | | | | | |
| | | | | | | | | | | | 365,231,410 | |
Interest Only Commercial Mortgage-Backed Securities — 0.5% | | | | | |
Banc of America Commercial Mortgage Trust: | | | | | | | | | | | | |
Series 2015-UBS7, Class XA, 0.92%, 9/15/48 (a) | | | | | | | 1,195 | | | | 68,600 | |
| | | | | | | | | | | | |
| Non-Agency Mortgage-Backed Securities | | | | | Par
(000) | | | Value | |
Interest Only Commercial Mortgage-Backed Securities (continued) | | | | | |
Series 2017-BNK3, Class XB, 0.63%, 2/15/50 (a) | | | USD | | | | 23,000 | | | $ | 1,228,890 | |
Series 2017-BNK3, Class XD, 1.29%, 2/15/50 (a)(b) | | | | | | | 5,000 | | | | 475,750 | |
Barclays Commercial Mortgage Trust, Series 2015-SRCH, Class XA, 0.96%, 8/10/35 (a)(b) | | | | | | | 17,710 | | | | 1,289,819 | |
CFCRE Commercial Mortgage Trust: | | | | | | | | | | | | |
Series 2016-C3, Class XD, 1.71%, 1/10/48 (a)(b) | | | | | | | 5,497 | | | | 640,620 | |
Series 2016-C4, Class XA, 1.77%, 5/10/58 (a) | | | | | | | 6,282 | | | | 719,022 | |
Series 2016-C4, Class XB, 0.73%, 5/10/58 (a) | | | | | | | 5,810 | | | | 326,115 | |
Citigroup Commercial Mortgage Trust: | | | | | | | | | | | | |
Series 2014-GC25, Class XE, 1.23%, 10/10/47 (a)(b) | | | | | | | 2,760 | | | | 195,974 | |
Series 2016-P3, Class XA, 1.71%, 4/15/49 (a) | | | | | | | 8,632 | | | | 957,522 | |
Citigroup/Deutsche Bank Mortgage Trust, Series 2017-CD3, Class XA, 1.05%, 2/10/50 (a) | | | | | | | 13,993 | | | | 1,108,840 | |
Commercial Mortgage Pass-Through Certificates: | | | | | | | | | | | | |
Series 2013-CR6, Class XA, 1.46%, 3/10/46 (a) | | | | | | | 30,757 | | | | 1,080,387 | |
Series 2014-CR14, Class XA, 0.83%, 2/10/47 (a) | | | | | | | 47,139 | | | | 1,510,584 | |
Series 2015-3BP, Class XA, 0.06%, 2/10/35 (a)(b) | | | | | | | 150,000 | | | | 1,050,000 | |
Series 2015-CR22, Class XA, 1.01%, 3/10/48 (a) | | | | | | | 28,560 | | | | 1,519,829 | |
Series 2015-CR23, Class XA, 1.00%, 5/10/48 (a) | | | | | | | 29,355 | | | | 1,572,388 | |
Series 2015-CR25, Class XA, 0.96%, 8/10/48 (a) | | | | | | | 23,809 | | | | 1,426,465 | |
Series 2015-LC21, Class XA, 0.86%, 7/10/48 (a) | | | | | | | 82,217 | | | | 3,553,458 | |
Series 2016-DC2, Class XA, 1.07%, 2/10/26 (a) | | | | | | | 11,123 | | | | 766,142 | |
Core Industrial Trust: | | | | | | | | | | | | |
Series 2015-TEXW, Class XA, 0.77%, 2/10/34 (a)(b) | | | | | | | 12,909 | | | | 431,583 | |
Series 2015-WEST, Class XA, 0.93%, 2/10/37 (a)(b) | | | | | | | 9,900 | | | | 609,632 | |
CSAIL Commercial Mortgage Trust: | | | | | | | | | | | | |
Series 2016-C5, Class XA, 1.06%, 11/15/48 (a) | | | | | | | 7,106 | | | | 434,485 | |
Series 2016-C6, Class XA, 1.81%, 1/15/49 (a) | | | | | | | 8,275 | | | | 942,637 | |
FREMF Mortgage Trust, Series 2015-K718, Class X2A, 0.10%, 2/25/22 (a)(b) | | | | | | | 94,384 | | | | 372,422 | |
GS Mortgage Securities Trust: | | | | | | | | | | | | |
Series 2016-GS3, Class XA, 1.28%, 10/10/49 (a) | | | | | | | 4,948 | | | | 435,634 | |
Series 2017-GS5, Class XA, 0.97%, 3/10/50 (a) | | | | | | | 10,400 | | | | 696,821 | |
JPMBB Commercial Mortgage Securities Trust: | | | | | | | | | | | | |
Series 2014-C23, Class XA, 0.84%, 9/15/47 (a) | | | | | | | 59,591 | | | | 2,067,148 | |
Series 2015-C28, Class XA, 1.19%, 10/15/48 (a) | | | | | | | 7,526 | | | | 435,070 | |
Series 2015-C29, Class XA, 0.94%, 5/15/48 (a) | | | | | | | 3,053 | | | | 117,867 | |
See Notes to Consolidated Financial Statements.
| | | | | | |
| | | BLACKROCK BALANCED CAPITAL FUND, INC. | | MARCH 31, 2017 | | 65 |
| | | | |
| Consolidated Schedule of Investments (continued) | | | Master Total Return Portfolio | |
| | | | |
| | | | | | | | | | | | |
| Non-Agency Mortgage-Backed Securities | | | | | Par
(000) | | | Value | |
Interest Only Commercial Mortgage-Backed Securities (continued) | | | | | |
Series 2015-C33, Class XA,
1.04%, 12/15/48 (a) | | | USD | | | | 15,625 | | | $ | 1,031,421 | |
Series 2016-C1, Class XA,
1.40%, 3/15/49 (a) | | | | | | | 18,088 | | | | 1,549,955 | |
JPMDB Commercial Mortgage Securities Trust, Series 2016-C4, Class XC,
0.75%, 12/15/49 (a)(b) | | | | | | | 4,940 | | | | 274,664 | |
JPMorgan Chase Commercial Mortgage Securities Trust: | | | | | | | | | | | | |
Series 2013-LC11, Class XB,
0.61%, 4/15/46 (a) | | | | | | | 4,570 | | | | 135,290 | |
Series 2014-C20, Class XA,
1.13%, 7/15/47 (a) | | | | | | | 5,034 | | | | 227,944 | |
Series 2014-C21, Class XA,
1.09%, 8/15/47 (a) | | | | | | | 8,076 | | | | 467,260 | |
Series 2014-C22, Class XA,
0.94%, 9/15/47 (a) | | | | | | | 7,660 | | | | 402,793 | |
Series 2015-C27, Class XA,
1.37%, 2/15/48 (a) | | | | | | | 37,570 | | | | 2,609,786 | |
Series 2016-JP3, Class XC,
0.75%, 8/15/49 (a)(b) | | | | | | | 13,040 | | | | 580,280 | |
Series 2016-JP4, Class XA,
0.82%, 12/15/49 (a) | | | | | | | 2,995 | | | | 149,720 | |
LSTAR Commercial Mortgage Trust, Series 2017-5, Class X, 1.39%, 3/10/50 (a)(b) | | | | | | | 4,000 | | | | 233,860 | |
Morgan Stanley Bank of America Merrill Lynch Trust: | | | | | | | | | | | | |
Series 2014-C19, Class XA,
1.14%, 12/15/47 (a) | | | | | | | 5,931 | | | | 322,704 | |
Series 2014-C19, Class XF,
1.19%, 12/15/47 (a)(b) | | | | | | | 4,370 | | | | 275,131 | |
Series 2015-C22, Class XA,
1.16%, 4/15/48 (a) | | | | | | | 4,627 | | | | 298,122 | |
Series 2015-C26, Class XA,
1.12%, 10/15/48 (a) | | | | | | | 12,160 | | | | 848,163 | |
Series 2015-C26, Class XD, 1.35%, 10/15/48 (a)(b) | | | | | | | 4,490 | | | | 436,159 | |
Series 2016-C28, Class XA,
1.29%, 1/15/49 (a) | | | | | | | 4,090 | | | | 338,342 | |
Series 2016-C29, Class XA,
1.66%, 5/15/49 (a) | | | | | | | 7,848 | | | | 848,305 | |
Series 2016-C29, Class XB,
0.96%, 5/15/49 (a) | | | | | | | 9,126 | | | | 699,096 | |
Series 2016-C31, Class XA,
1.47%, 11/15/49 (a) | | | | | | | 2,661 | | | | 260,690 | |
Series 2016-C32, Class XA,
0.78%, 12/15/49 (a) | | | | | | | 5,988 | | | | 331,535 | |
Morgan Stanley Capital I Trust, Series 2016-UBS9, Class XD, 1.55%, 3/15/49 (a)(b) | | | | | | | 13,984 | | | | 1,504,818 | |
One Market Plaza Trust, Series 2017-1MKT, Class XCP, 0.09%, 2/10/32 (a)(b) | | | | | | | 53,230 | | | | 349,721 | |
WaMu Commercial Mortgage Securities Trust, Series 2005-C1A, Class X, 1.49%, 5/25/36 (a)(b) | | | | | | | 125 | | | | 630 | |
Wells Fargo Commercial Mortgage Trust: | | | | | | | | | | | | |
Series 2015-C27, Class XA,
0.99%, 2/15/48 (a) | | | | | | | 17,127 | | | | 970,899 | |
Series 2015-C30, Class XA,
1.01%, 9/15/58 (a) | | | | | | | 3,525 | | | | 220,639 | |
Series 2015-NXS1, Class XB,
0.36%, 5/15/48 (a) | | | | | | | 3,210 | | | | 107,599 | |
Series 2015-NXS4, Class XA,
0.96%, 12/15/48 (a) | | | | | | | 3,234 | | | | 191,967 | |
Series 2016-BNK1, Class XB,
1.34%, 8/15/49 (a) | | | | | | | 6,800 | | | | 705,228 | |
| | | | | | | | | | | | |
| Non-Agency Mortgage-Backed Securities | | | | | Par
(000) | | | Value | |
Interest Only Commercial Mortgage-Backed Securities (continued) | | | | | |
Series 2016-BNK1, Class XD,
1.27%, 8/15/49 (a)(b) | | | USD | | | | 3,420 | | | $ | 308,929 | |
Series 2016-C33, 1.81%, 3/17/59 (a) | | | | | | | 16,261 | | | | 1,772,315 | |
Series 2016-LC25, Class XA,
1.10%, 12/15/59 (a) | | | | | | | 12,372 | | | | 863,034 | |
WF-RBS Commercial Mortgage Trust: | | | | | | | | | | | | |
Series 2012-C8, Class XA,
1.98%, 8/15/45 (a)(b) | | | | | | | 989 | | | | 69,225 | |
Series 2012-C9, Class XA,
2.09%, 11/15/45 (a)(b) | | | | | | | 11,284 | | | | 822,232 | |
Series 2014-C20, Class XA,
1.17%, 5/15/47 (a) | | | | | | | 4,977 | | | | 269,343 | |
Series 2014-C24, Class XA,
0.97%, 11/15/47 (a) | | | | | | | 26,124 | | | | 1,323,870 | |
| | | | | | | | | | | | |
| | | | | | | | | | | | 47,835,373 | |
Total Non-Agency Mortgage-Backed Securities — 6.3% | | | | 618,338,993 | |
| | | | | | | | | | | | |
| Other Interests (o) | | | | | Beneficial
Interest
(000) | | | | |
Capital Markets — 0.0% | | | | | | | | | | | | |
Lehman Brothers Holdings Capital Trust VII (d)(g) | | | | 1,888 | | | | — | |
Lehman Brothers Holdings, Inc. (d)(g) | | | | | | | 7,360 | | | | 1 | |
Total Other Interests — 0.0% | | | | | | | | | | | 1 | |
| | | | | | | | | | | | |
| Preferred Securities | | | | | | | | | |
| Capital Trusts | | | | | Par (000) | | | | |
Banks — 0.3% | | | | | | | | | | | | |
Allied Irish Banks PLC, 7.38% (a)(m) | | | EUR | | | | 1,300 | | | | 1,468,321 | |
Banco Bilbao Vizcaya Argentaria SA,
8.88% (a)(m) | | | | | | | 400 | | | | 466,748 | |
Banco Popular Espanol SA: | | | | | | | | | | | | |
8.25% (a)(m) | | | | | | | 1,000 | | | | 977,725 | |
11.50% (a)(m) | | | | | | | 700 | | | | 761,697 | |
Banco Santander SA, 6.25% (a)(m) | | | | | | | 1,900 | | | | 2,001,650 | |
Bank of East Asia Ltd., 5.50% (a)(m) | | | USD | | | | 688 | | | | 687,941 | |
Bank of Ireland, 7.38% (a)(m) | | | EUR | | | | 2,575 | | | | 2,943,513 | |
Cooperatieve Rabobank UA, 6.63% (a)(m) | | | | | | | 1,600 | | | | 1,853,507 | |
HSH Nordbank AG, 7.25% (a)(m) | | | USD | | | | 5,535 | | | | 1,456,225 | |
Industrial & Commercial Bank of China Asia Ltd., 4.25% (a)(m) | | | | | | | 850 | | | | 829,964 | |
Intesa Sanpaolo SpA, 7.00% (a)(m) | | | EUR | | | | 1,149 | | | | 1,240,196 | |
Macquarie Bank Ltd., 6.13% (a)(b)(m) | | | USD | | | | 5,779 | | | | 5,807,895 | |
National Westminster Bank PLC,
1.31% (a)(m) | | | | | | | 1,600 | | | | 1,288,002 | |
Santander UK Group Holdings PLC,
6.75% (a)(m) | | | GBP | | | | 825 | | | | 1,033,237 | |
UniCredit SpA, 9.25% (a)(m) | | | EUR | | | | 350 | | | | 407,452 | |
Woori Bank, 4.50% (a)(m) | | | USD | | | | 1,250 | | | | 1,231,186 | |
| | | | | | | | | | | | |
| | | | | | | | | | | | 24,455,259 | |
Capital Markets — 0.1% | | | | | | | | | | | | |
Bank of New York Mellon Corp., 4.63% (a)(m) | | | | | | | 6,967 | | | | 6,688,320 | |
State Street Corp., 2.13%, 6/15/37 (a) | | | | | | | 1,048 | | | | 918,310 | |
See Notes to Consolidated Financial Statements.
| | | | | | |
| 66 | | BLACKROCK BALANCED CAPITAL FUND, INC. | | MARCH 31, 2017 | | |
| | | | |
| Consolidated Schedule of Investments (continued) | | | Master Total Return Portfolio | |
| | | | | | | | | | | | |
| Capital Trusts | | | | | Par
(000) | | | Value | |
Capital Markets (continued) | | | | | | | | | | | | |
UBS Group AG: | | | | | | | | | | | | |
5.75% (a)(m) | | | EUR | | | | 2,125 | | | $ | 2,450,807 | |
6.88% (a)(m) | | | USD | | | | 1,100 | | | | 1,142,625 | |
7.00% (a)(m) | | | | | | | 800 | | | | 860,000 | |
| | | | | | | | | | | | |
| | | | | | | | | | | | 12,060,062 | |
Construction & Engineering — 0.0% | | | | | | | | | | | | |
Chalieco Hong Kong Corp. Ltd., 5.70% (a)(m) | | | | | | | 200 | | | | 206,723 | |
Diversified Financial Services — 0.0% | | | | | | | | | | | | |
HBOS Capital Funding LP, 6.85% (m) | | | | | | | 446 | | | | 452,469 | |
Huarong Finance 2017 Co. Ltd., 4.50% (a)(m) | | | | | | | 1,184 | | | | 1,203,999 | |
| | | | | | | | | | | | |
| | | | | | | | | | | | 1,656,468 | |
Electric Utilities — 0.0% | | | | | | | | | | | | |
Gas Natural Fenosa Finance BV, 3.38% (a)(m) | | | EUR | | | | 900 | | | | 935,252 | |
Media — 0.1% | | | | | | | | | | | | |
NBCUniversal Enterprise, Inc., 5.25% (b)(m) | | | USD | | | | 3,770 | | | | 3,958,500 | |
Viacom, Inc., 6.25%, 2/28/57 (a) | | | | | | | 4,797 | | | | 4,835,376 | |
| | | | | | | | | | | | |
| | | | | | | | | | | | 8,793,876 | |
Transportation Infrastructure — 0.0% | | | | | | | | | | | | |
Royal Capital BV, 4.88% (a)(m) | | | | | | | 219 | | | | 213,179 | |
Wireless Telecommunication Services — 0.0% | | | | | | | | | | | | |
Telefonica Europe BV: | | | | | | | | | | | | |
3.75% (a)(m) | | | EUR | | | | 500 | | | | 534,735 | |
5.88% (a)(m) | | | | | | | 1,400 | | | | 1,632,796 | |
| | | | | | | | | | | | |
| | | | | | | | | | | | 2,167,531 | |
Total Capital Trusts — 0.5% | | | | | | | | | | | 50,488,350 | |
| | | | | | | | | | | | |
| Preferred Stocks | | | | | Shares | | | | |
Diversified Financial Services — 0.0% | | | | | | | | | | | | |
Concrete Investment II SCA, 0.00%, 8/27/44 (d) | | | | | | | 12,471 | | | | 1,390,279 | |
| | | | | | | | | | | | |
| Trust Preferreds | | | | | | | | | |
Banks — 0.1% | | | | | | | | | | | | |
Citigroup Capital XIII, 7.41%, 10/30/40 (a) | | | | | | | 349,440 | | | | 9,312,576 | |
Total Preferred Securities — 0.6% | | | | | | | | | | | 61,191,205 | |
| | | | | | | | | | | | |
| Taxable Municipal Bonds | | | | | Par
(000) | | | | |
American Municipal Power, Inc. RB, 6.45%, 2/15/44 | | | USD | | | | 895 | | | | 1,127,387 | |
Arizona Health Facilities Authority RB, 1.48%, 1/01/37 (a) | | | | | | | 1,355 | | | | 1,179,107 | |
Bay Area Toll Authority RB: | | | | | | | | | | | | |
6.92%, 4/01/40 | | | | | | | 3,145 | | | | 4,256,474 | |
7.04%, 4/01/50 | | | | | | | 7,275 | | | | 10,467,052 | |
Brooklyn Arena Local Development Corp. RB, 5.00%, 7/15/42 | | | | | | | 2,465 | | | | 2,675,388 | |
Buckeye Tobacco Settlement Financing Authority RB, 5.88%, 6/01/47 | | | | | | | 4,270 | | | | 4,085,707 | |
California Health Facilities Financing Authority RB, 5.00%, 8/15/33 | | | | | | | 1,190 | | | | 1,364,299 | |
California Infrastructure & Economic Development Bank RB: | | | | | | | | | | | | |
5.00%, 10/01/35 | | | | | | | 820 | | | | 966,214 | |
5.00%, 10/01/36 | | | | | | | 820 | | | | 963,885 | |
California Pollution Control Financing Authority RB, 5.00%, 11/21/45 (b) | | | | | | | 1,000 | | | | 1,035,610 | |
| | | | | | | | | | | | |
| Taxable Municipal Bonds | | | | | Par
(000) | | | Value | |
California Statewide Communities Development Authority RB: | | | | | | | | | | | | |
5.00%, 12/01/25 (b) | | | USD | | | | 1,000 | | | $ | 1,103,390 | |
5.00%, 12/01/26 (b) | | | | | | | 1,000 | | | | 1,099,420 | |
Chesapeake Bay Bridge & Tunnel District RB, 5.00%, 7/01/51 | | | | | | | 700 | | | | 766,668 | |
Chesapeake Bay Bridge & Tunnel District RB AGM, 5.00%, 7/01/41 | | | | | | | 880 | | | | 993,133 | |
City of Houston, TX Airport System Revenue RB, 5.00%, 7/01/24 | | | | | | | 700 | | | | 782,292 | |
City of Riverside, CA Electric Revenue RB, 7.61%, 10/01/40 | | | | | | | 2,550 | | | | 3,532,337 | |
City of San Jose, CA Airport Revenue RB, AMBAC, 5.00%, 3/01/37 | | | | | | | 390 | | | | 390,452 | |
City Public Service Board of San Antonio, TX RB, 5.81%, 2/01/41 | | | | | | | 3,260 | | | | 4,087,062 | |
Clark County School District GO: | | | | | | | | | | | | |
5.00%, 6/15/23 | | | | | | | 545 | | | | 635,334 | |
5.00%, 6/15/24 | | | | | | | 680 | | | | 802,012 | |
5.00%, 6/15/27 | | | | | | | 365 | | | | 428,437 | |
5.00%, 6/15/28 | | | | | | | 705 | | | | 821,854 | |
Colorado Health Facilities Authority RB, 5.25%, 2/01/31 | | | | | | | 785 | | | | 830,090 | |
Commonwealth Financing Authority RB, 4.14%, 6/01/38 | | | | | | | 3,030 | | | | 2,933,646 | |
Commonwealth of Massachusetts GO, 5.00%, 7/01/28 | | | | | | | 835 | | | | 1,033,955 | |
Commonwealth of Puerto Rico GO, 8.00%, 7/01/35 (d)(g) | | | | | | | 37,230 | | | | 23,129,137 | |
Contra Costa Community College District GO, 6.50%, 8/01/34 | | | | | | | 570 | | | | 738,726 | |
County of Clark, NV RB, 5.00%, 7/01/28 | | | | | | | 930 | | | | 1,140,357 | |
County of Miami-Dade, FL Aviation Revenue RB: | | | | | | | | | | | | |
2.50%, 10/01/24 | | | | | | | 2,490 | | | | 2,389,329 | |
5.00%, 10/01/38 | | | | | | | 1,600 | | | | 1,755,408 | |
County of Miami-Dade, FL GO: | | | | | | | | | | | | |
5.00%, 7/01/34 | | | | | | | 1,000 | | | | 1,143,950 | |
5.00%, 7/01/35 | | | | | | | 960 | | | | 1,093,238 | |
Dallas/Fort Worth International Airport RB: | | | | | | | | | | | | |
5.00%, 11/01/42 | | | | | | | 2,025 | | | | 2,159,602 | |
Series A, 5.00%, 11/01/43 | | | | | | | 60 | | | | 63,628 | |
5.00%, 11/01/45 | | | | | | | 3,670 | | | | 3,889,319 | |
5.00%, 11/01/45 | | | | | | | 2,650 | | | | 2,829,643 | |
District of Columbia RB: | | | | | | | | | | | | |
5.00%, 7/15/34 | | | | | | | 775 | | | | 870,991 | |
5.59%, 12/01/34 | | | | | | | 2,675 | | | | 3,264,731 | |
5.00%, 7/15/35 | | | | | | | 775 | | | | 867,861 | |
Golden State Tobacco Securitization Corp. RB: | | | | | | | | | | | | |
5.13%, 6/01/47 | | | | | | | 4,095 | | | | 4,016,417 | |
5.75%, 6/01/47 | | | | | | | 900 | | | | 899,874 | |
Grant County Public Utility District No. 2 RB, 4.58%, 1/01/40 | | | | | | | 600 | | | | 603,690 | |
Great Lakes Water Authority Water Supply System Revenue RB, 5.25%, 7/01/33 | | | | | | | 755 | | | | 868,899 | |
Health & Educational Facilities Authority of the State of Missouri RB, 5.00%, 11/15/29 | | | | | | | 840 | | | | 962,270 | |
Horry County School District, SC GO: | | | | | | | | | | | | |
5.00%, 3/01/24 | | | | | | | 750 | | | | 895,117 | |
5.00%, 3/01/25 | | | | | | | 870 | | | | 1,047,758 | |
Kentucky Economic Development Finance Authority RB, 5.25%, 6/01/50 | | | | | | | 850 | | | | 895,483 | |
Los Angeles Community College District GO, 6.60%, 8/01/42 | | | | | | | 1,860 | | | | 2,576,026 | |
Los Angeles Department of Water & Power RB, 6.60%, 7/01/50 | | | | | | | 1,065 | | | | 1,491,298 | |
Los Angeles Unified School District, 5.75%, 7/01/34 | | | | | | | 415 | | | | 509,388 | |
See Notes to Consolidated Financial Statements.
| | | | | | |
| | | BLACKROCK BALANCED CAPITAL FUND, INC. | | MARCH 31, 2017 | | 67 |
| | | | |
| Consolidated Schedule of Investments (continued) | | | Master Total Return Portfolio | |
| | | | | | | | | | | | |
| Taxable Municipal Bonds | | | | | Par
(000) | | | Value | |
Los Angeles Unified School District GO, 6.76%, 7/01/34 | | | USD | | | | 4,355 | | | $ | 5,835,265 | |
Maryland Health & Higher Educational Facilities Authority RB, 5.25%, 7/01/27 | | | | | | | 815 | | | | 936,810 | |
Massachusetts Clean Water Trust RB: | | | | | | | | | | | | |
5.00%, 2/01/27 | | | | | | | 670 | | | | 817,078 | |
5.00%, 2/01/28 | | | | | | | 1,140 | | | | 1,381,190 | |
Massachusetts Development Finance Agency RB, 5.00%, 7/01/47 | | | | | | | 1,260 | | | | 1,375,744 | |
Massachusetts Educational Financing Authority RB, 5.00%, 1/01/22 | | | | | | | 500 | | | | 551,865 | |
Metropolitan Transportation Authority RB: | | | | | | | | | | | | |
5.87%, 11/15/39 | | | | | | | 735 | | | | 887,961 | |
6.67%, 11/15/39 | | | | | | | 350 | | | | 464,727 | |
6.69%, 11/15/40 | | | | | | | 1,160 | | | | 1,541,454 | |
6.81%, 11/15/40 | | | | | | | 860 | | | | 1,157,027 | |
5.00%, 11/15/42 | | | | | | | 1,700 | | | | 1,948,489 | |
Metropolitan Washington Airports Authority Dulles Toll Road Revenue RB: | | | | | | | | | | | | |
7.46%, 10/01/46 | | | | | | | 1,060 | | | | 1,499,306 | |
5.00%, 10/01/53 | | | | | | | 1,000 | | | | 1,041,200 | |
Miami-Dade County Educational Facilities Authority RB, 5.07%, 4/01/50 | | | | | | | 1,300 | | | | 1,387,646 | |
Michigan Finance Authority RB, 5.00%, 6/01/39 | | | | | | | 840 | | | | 913,114 | |
Mississippi Hospital Equipment & Facilities Authority RB, 5.00%, 9/01/46 | | | | | | | 1,610 | | | | 1,715,713 | |
Municipal Electric Authority of Georgia RB: | | | | | | | | | | | | |
5.00%, 1/01/20 | | | | | | | 1,630 | | | | 1,765,176 | |
6.64%, 4/01/57 | | | | | | | 1,610 | | | | 1,830,731 | |
New Jersey State Turnpike Authority RB, 7.41%, 1/01/40 | | | | | | | 2,329 | | | | 3,351,710 | |
New Jersey Transportation Trust Fund Authority RB, 5.00%, 6/15/29 | | | | | | | 915 | | | | 966,972 | |
New York City Transitional Finance Authority Building Aid Revenue RB, 5.00%, 7/15/40 | | | | | | | 930 | | | | 1,049,542 | |
New York City Transitional Finance Authority Future Tax Secured Revenue RB: | | | | | | | | | | | | |
2.28%, 5/01/26 | | | | | | | 1,265 | | | | 1,176,754 | |
5.00%, 8/01/31 | | | | | | | 470 | | | | 549,345 | |
New York City Water & Sewer System RB: | | | | | | | | | | | | |
5.75%, 6/15/41 | | | | | | | 1,330 | | | | 1,725,502 | |
6.01%, 6/15/42 | | | | | | | 665 | | | | 868,610 | |
5.38%, 6/15/43 | | | | | | | 4,410 | | | | 4,972,231 | |
5.50%, 6/15/43 | | | | | | | 5,285 | | | | 5,992,503 | |
5.88%, 6/15/44 | | | | | | | 1,195 | | | | 1,541,849 | |
5.00%, 6/15/47 | | | | | | | 1,000 | | | | 1,134,820 | |
New York State Dormitory Authority RB: | | | | | | | | | | | | |
5.00%, 2/15/27 | | | | | | | 870 | | | | 1,050,812 | |
5.00%, 2/15/28 | | | | | | | 870 | | | | 1,046,880 | |
5.00%, 2/15/31 | | | | | | | 780 | | | | 918,458 | |
5.00%, 3/15/32 | | | | | | | 1,395 | | | | 1,625,775 | |
5.39%, 3/15/40 | | | | | | | 1,470 | | | | 1,754,607 | |
New York State Urban Development Corp. RB: | | | | | | | | | | | | |
5.00%, 3/15/25 | | | | | | | 470 | | | | 563,281 | |
5.00%, 3/15/27 | | | | | | | 810 | | | | 987,163 | |
New York Transportation Development Corp. RB, 5.25%, 1/01/50 | | | | | | | 2,235 | | | | 2,396,970 | |
Orange County Local Transportation Authority RB, 6.91%, 2/15/41 | | | | | | | 2,790 | | | | 3,772,080 | |
Pennsylvania Economic Development Financing Authority RB: | | | | | | | | | | | | |
5.00%, 12/31/22 | | | | | | | 1,000 | | | | 1,118,870 | |
5.00%, 12/31/38 | | | | | | | 320 | | | | 345,805 | |
Port Authority of New York & New Jersey RB: | | | | | | | | | | | | |
4.96%, 8/01/46 | | | | | | | 1,970 | | | | 2,239,260 | |
4.93%, 10/01/51 | | | | | | | 1,045 | | | | 1,178,844 | |
4.46%, 10/01/62 | | | | | | | 3,505 | | | | 3,659,956 | |
4.81%, 10/15/65 | | | | | | | 1,740 | | | | 1,911,268 | |
| | | | | | | | | | | | |
| Taxable Municipal Bonds | | | | | Par
(000) | | | Value | |
Port of Seattle, WA GO, 5.00%, 1/01/42 | | | USD | | | | 1,710 | | | $ | 1,976,828 | |
Regents of the University of California Medical Center Pooled Revenue RB, 6.58%, 5/15/49 | | | | | | | 2,860 | | | | 3,718,000 | |
San Diego County Regional Transportation Commission RB, 5.00%, 4/01/48 | | | | | | | 1,700 | | | | 1,949,101 | |
South Carolina Public Service Authority RB: | | | | | | | | | | | | |
2.39%, 12/01/23 | | | | | | | 2,957 | | | | 2,725,970 | |
5.00%, 12/01/49 | | | | | | | 1,730 | | | | 1,795,307 | |
5.00%, 12/01/50 | | | | | | | 1,730 | | | | 1,802,868 | |
5.50%, 12/01/54 | | | | | | | 880 | | | | 946,581 | |
State of California GO: | | | | | | | | | | | | |
5.00%, 9/01/27 | | | | | | | 250 | | | | 299,900 | |
7.50%, 4/01/34 | | | | | | | 2,210 | | | | 3,126,796 | |
7.55%, 4/01/39 | | | | | | | 3,715 | | | | 5,442,215 | |
7.30%, 10/01/39 | | | | | | | 820 | | | | 1,151,255 | |
7.35%, 11/01/39 | | | | | | | 1,320 | | | | 1,864,355 | |
7.60%, 11/01/40 | | | | | | | 6,115 | | | | 9,122,846 | |
State of Georgia GO, 5.00%, 7/01/26 | | | | | | | 855 | | | | 1,056,789 | |
State of Illinois GO, 5.10%, 6/01/33 | | | | | | | 8,190 | | | | 7,461,663 | |
State of Maryland GO: | | | | | | | | | | | | |
5.00%, 3/15/28 | | | | | | | 840 | | | | 1,037,224 | |
5.00%, 3/15/29 | | | | | | | 840 | | | | 1,029,538 | |
5.00%, 3/15/31 | | | | | | | 2,710 | | | | 3,266,688 | |
State of Washington GO: | | | | | | | | | | | | |
5.00%, 7/01/28 | | | | | | | 480 | | | | 562,210 | |
5.00%, 8/01/28 | | | | | | | 1,000 | | | | 1,194,520 | |
5.00%, 8/01/29 | | | | | | | 1,000 | | | | 1,186,340 | |
5.00%, 8/01/30 | | | | | | | 1,000 | | | | 1,180,460 | |
State of Wisconsin GO: | | | | | | | | | | | | |
5.00%, 5/01/24 | | | | | | | 1,460 | | | | 1,746,525 | |
5.00%, 5/01/25 | | | | | | | 1,665 | | | | 2,013,568 | |
Sumter Landing Community Development District RB, 4.17%, 10/01/47 | | | | | | | 920 | | | | 892,566 | |
Texas Private Activity Bond Surface Transportation Corp. RB, 5.00%, 12/31/55 | | | | | | | 370 | | | | 390,631 | |
Tobacco Settlement Finance Authority RB, 7.47%, 6/01/47 | | | | | | | 3,055 | | | | 2,911,293 | |
Tobacco Settlement Financing Corp. RB: | | | | | | | | | | | | |
5.00%, 6/01/41 | | | | | | | 1,700 | | | | 1,653,182 | |
6.71%, 6/01/46 | | | | | | | 3,325 | | | | 2,771,454 | |
University of California RB, 4.86%, 5/15/12 | | | | | | | 1,415 | | | | 1,397,270 | |
University of Houston RB: | | | | | | | | | | | | |
5.00%, 2/15/33 | | | | | | | 955 | | | | 1,095,566 | |
5.00%, 2/15/34 | | | | | | | 875 | | | | 999,416 | |
5.00%, 2/15/35 | | | | | | | 1,990 | | | | 2,264,700 | |
5.00%, 2/15/36 | | | | | | | 2,560 | | | | 2,907,034 | |
University of Massachusetts Building Authority RB, 5.00%, 11/01/31 | | | | | | | 1,190 | | | | 1,379,638 | |
West Virginia Hospital Finance Authority RB: | | | | | | | | | | | | |
5.00%, 6/01/19 | | | | | | | 895 | | | | 961,516 | |
5.00%, 6/01/20 | | | | | | | 965 | | | | 1,063,112 | |
5.00%, 6/01/21 | | | | | | | 960 | | | | 1,077,898 | |
5.00%, 6/01/22 | | | | | | | 1,050 | | | | 1,195,992 | |
5.00%, 6/01/23 | | | | | | | 870 | | | | 1,000,631 | |
5.00%, 6/01/24 | | | | | | | 935 | | | | 1,085,479 | |
Wisconsin Health & Educational Facilities Authority RB, 5.00%, 12/15/44 | | | | | | | 790 | | | | 854,962 | |
Total Taxable Municipal Bonds — 2.7% | | | | | | | | | | | 266,973,595 | |
| | | | | | | | | | | | |
| | | | | | | | | | |
See Notes to Consolidated Financial Statements.
| | | | | | |
| 68 | | BLACKROCK BALANCED CAPITAL FUND, INC. | | MARCH 31, 2017 | | |
| | | | |
| Consolidated Schedule of Investments (continued) | | | Master Total Return Portfolio | |
| | | | | | | | | | | | |
| U.S. Government Sponsored Agency Securities | | | Par (000) | | | Value | |
Agency Obligations — 0.1% | | | | | | | | | | | | |
Fannie Mae, 6.63%, 11/15/30 | | | USD | | | | 1,450 | | | $ | 2,045,032 | |
Freddie Mac: | | | | | | | | | | | | |
3.75%, 3/27/19 | | | | | | | 3,650 | | | | 3,821,805 | |
4.88%, 6/13/18 | | | | | | | 4,300 | | | | 4,484,560 | |
| | | | | | | | | | | | |
| | | | | | | | | | | | 10,351,397 | |
Collateralized Mortgage Obligations — 0.5% | | | | | | | | | | | | |
Fannie Mae: | | | | | | | | | | | | |
Series 2005-48, Class AR, 5.50%, 2/25/35 | | | | | | | 6 | | | | 6,149 | |
Series 2013-C01, Class M2, 6.23%, 10/25/23 (a) | | | | | | | 5,505 | | | | 6,282,863 | |
Series 2016-C02, Class 1M2, 6.78%, 9/25/28 (a) | | | | | | | 640 | | | | 730,378 | |
Series 2016-C04, Class 1M2, 5.23%, 1/25/29 (a) | | | | | | | 5,140 | | | | 5,456,524 | |
Series 2016-C05, Class 2M2, 5.43%, 1/25/29 (a) | | | | | | | 5,200 | | | | 5,556,496 | |
Series 2016-C06, Class 1M2, 5.23%, 4/25/29 (a) | | | | | | | 4,038 | | | | 4,275,812 | |
Series 2016-C07, Class 2M2, 5.13%, 4/25/29 (a) | | | | | | | 298 | | | | 314,591 | |
Series 2017-C01, Class 1B1, 6.73%, 7/25/29 (a) | | | | | | | 1,713 | | | | 1,789,311 | |
Series 2017-C01, Class 1M2, 4.53%, 7/25/29 (a) | | | | | | | 3,850 | | | | 3,896,572 | |
Series 2017-C02, Class 2M2, 4.63%, 9/25/29 (a) | | | | | | | 3,505 | | | | 3,510,608 | |
Freddie Mac: | | | | | | | | | | | | |
Series 2015-DN1, Class B, 12.28%, 1/25/25 (a) | | | | | | | 511 | | | | 663,071 | |
Series 2015-HQ2, Class B, 8.93%, 5/25/25 (a) | | | | | | | 534 | | | | 610,508 | |
Series 2016-DNA4, Class M3, 4.78%, 3/25/29 (a) | | | | | | | 3,200 | | | | 3,304,146 | |
Series 2016-HQA3, Class M3, 4.83%, 3/25/29 (a) | | | | | | | 3,420 | | | | 3,537,706 | |
Series 2017-DNA1, Class M2, 4.23%, 7/25/29 (a) | | | | | | | 3,290 | | | | 3,283,961 | |
Series 2017-HQA1, Class M2, 4.53%, 8/25/29 (a) | | | | | | | 2,120 | | | | 2,121,164 | |
| | | | | | | | | | | | |
| | | | | | | | | | | | 45,339,860 | |
Commercial Mortgage-Backed Securities — 0.1% | | | | | | | | | |
Fannie Mae: | | | | | | | | | | | | |
Series 2006-M2, Class A2A, 5.27%, 10/25/32 (a) | | | | | | | 2,844 | | | | 2,972,725 | |
Series 2015-M10, Class A2, 3.09%, 4/25/27 (a) | | | | | | | 1,000 | | | | 1,003,931 | |
Freddie Mac: | | | | | | | | | | | | |
Series K034, Class A2, 3.53%, 7/25/23 (a) | | | | | | | 1,220 | | | | 1,287,890 | |
Series KPLB, Class A, 2.77%, 5/25/25 | | | | | | | 2,700 | | | | 2,676,554 | |
| | | | | | | | | | | | |
| | | | | | | | | | | | 7,941,100 | |
Interest Only Collateralized Mortgage Obligations — 0.0% | | | | | |
Ginnie Mae: | | | | | | | | | | | | |
Series 2015-152, Class PI, 4.00%, 10/20/45 | | | | | | | 2,530 | | | | 346,863 | |
Series 2016-82, Class IM, 4.00%, 2/01/46 | | | | | | | 964 | | | | 123,651 | |
Series 2016-82, Class WI, 4.00%, 2/20/46 | | | | | | | 1,614 | | | | 218,471 | |
| | | | | | | | | | | | |
| | | | | | | | | | | | 688,985 | |
Interest Only Commercial Mortgage-Backed Securities — 0.1% | | | | | |
Fannie Mae: | | | | | | | | | | | | |
Series 2013-M5, Class X2, 2.29%, 1/25/22 (a) | | | | | | | 11,479 | | | | 768,703 | |
| | | | | | | | | | | | |
| U.S. Government Sponsored Agency Securities | | | Par (000) | | | Value | |
Interest Only Commercial Mortgage-Backed Securities (continued) | | | | | |
Series 2014-M13, Class X2, 0.13%, 8/25/24 (a) | | | USD | | | | 123,679 | | | $ | 1,141,534 | |
Series 2015-M4, Class X2, 0.56%, 7/25/22 (a) | | | | | | | 40,998 | | | | 931,881 | |
Freddie Mac: | | | | | | | | | | | | |
Series K038, Class X1, 1.19%, 3/25/24 (a) | | | | | | | 10,127 | | | | 669,090 | |
Series K056, Class X1, 1.39%, 5/25/26 (a) | | | | | | | 9,882 | | | | 901,930 | |
Series K718, Class X1, 0.65%, 1/25/22 (a) | | | | | | | 6,033 | | | | 156,569 | |
Series K721, Class X1, 0.34%, 8/25/22 (a) | | | | | | | 12,856 | | | | 200,683 | |
Ginnie Mae: | | | | | | | | | | | | |
Series 2012-120, Class IO, 0.80%, 2/16/53 (a) | | | | | | | 16,666 | | | | 844,348 | |
Series 2014-112, Class IO, 1.19%, 1/16/48 (a) | | | | | | | 18,887 | | | | 1,106,046 | |
Series 2014-172, Class IO, 0.95%, 1/16/49 (a) | | | | | | | 19,539 | | | | 988,023 | |
Series 2014-40, Class AI, 1.00%, 2/16/39 | | | | | | | 9,835 | | | | 238,798 | |
Series 2014-52, Class AI, 0.83%, 8/16/41 | | | | | | | 6,910 | | | | 171,221 | |
Series 2016-110, Class IO, 1.05%, 5/16/58 (a) | | | | | | | 6,650 | | | | 525,904 | |
Series 2016-113, Class IO, 1.19%, 2/16/58 (a) | | | | | | | 8,102 | | | | 729,735 | |
Series 2016-119, Class IO, 1.13%, 10/16/52 (a) | | | | | | | 10,260 | | | | 849,228 | |
Series 2016-125, Class IO, 1.09%, 12/16/57 (a) | | | | | | | 9,553 | | | | 771,843 | |
Series 2016-152, Class IO, 0.99%, 8/15/58 (a) | | | | | | | 18,599 | | | | 1,547,792 | |
Series 2016-158, Class IO, 0.93%, 6/16/58 (a) | | | | | | | 6,680 | | | | 509,323 | |
Series 2016-87, Class IO, 1.01%, 8/16/58 (a) | | | | | | | 9,440 | | | | 725,563 | |
| | | | | | | | | | | | |
| | | | | | | | | | | | 13,778,214 | |
Mortgage-Backed Securities — 70.3% | | | | | | | | | | | | |
Fannie Mae Mortgage-Backed Securities: | | | | | | | | | | | | |
2.23%, 10/01/42 (a) | | | | | | | 1,830 | | | | 1,921,912 | |
2.50%, 5/01/26-4/01/32 (p) | | | | | | | 109,090 | | | | 109,261,391 | |
2.69%, 4/01/25 | | | | | | | 1,170 | | | | 1,162,756 | |
3.00%, 1/01/29-4/01/47 (l)(p)(q) | | | | | | | 1,752,942 | | | | 1,745,415,713 | |
3.14%, 12/01/40 (a) | | | | | | | 1,723 | | | | 1,821,767 | |
3.50%, 9/01/23-4/01/47 (p) | | | | | | | 1,512,630 | | | | 1,550,407,184 | |
4.00%, 1/01/25-4/01/47 (p) | | | | | | | 810,866 | | | | 852,384,317 | |
4.50%, 2/01/25-4/01/47 (p) | | | | | | | 157,401 | | | | 168,720,885 | |
5.00%, 5/01/23-4/01/47 (p) | | | | | | | 67,430 | | | | 73,771,662 | |
5.50%, 12/01/32-4/01/47 (p) | | | | | | | 40,841 | | | | 45,674,155 | |
6.00%, 2/01/34-4/01/47 (p) | | | | | | | 23,572 | | | | 26,590,806 | |
6.50%, 5/01/40 | | | | | | | 4,839 | | | | 5,441,343 | |
Freddie Mac Mortgage-Backed Securities: | | | | | | | | | | | | |
2.50%, 2/01/24-4/01/32 (p) | | | | | | | 64,268 | | | | 64,363,750 | |
2.90%, 6/01/42 (a) | | | | | | | 1,816 | | | | 1,876,605 | |
3.00%, 1/01/30-4/01/47 (p) | | | | | | | 495,070 | | | | 492,908,546 | |
3.50%, 8/01/24-4/01/47 (p) | | | | | | | 295,557 | | | | 303,299,828 | |
4.00%, 8/01/40-4/01/47 (p) | | | | | | | 480,336 | | | | 504,107,902 | |
4.50%, 2/01/39-4/01/47 (p) | | | | | | | 42,242 | | | | 45,359,163 | |
5.00%, 7/01/35-11/01/41 | | | | | | | 17,686 | | | | 19,342,301 | |
5.50%, 2/01/35-6/01/41 | | | | | | | 5,435 | | | | 6,035,362 | |
6.00%, 4/01/47 (p) | | | | | | | 15,600 | | | | 17,609,719 | |
Ginnie Mae Mortgage-Backed Securities: | | | | | | | | | | | | |
2.13%, 5/20/34 (a) | | | | | | | 719 | | | | 747,175 | |
See Notes to Consolidated Financial Statements.
| | | | | | |
| | | BLACKROCK BALANCED CAPITAL FUND, INC. | | MARCH 31, 2017 | | 69 |
| | | | |
| Consolidated Schedule of Investments (continued) | | | Master Total Return Portfolio | |
| | | | | | | | | | | | |
| U.S. Government Sponsored Agency Securities | | | Par (000) | | | Value | |
Mortgage-Backed Securities (continued) | | | | | | | | | | | | |
3.00%, 4/15/47 (p) | | | USD | | | | 242,348 | | | $ | 244,463,509 | |
3.50%, 12/20/41-4/15/47 (p) | | | | | | | 376,307 | | | | 390,434,753 | |
4.00%, 7/20/39-4/15/47 (p) | | | | | | | 148,297 | | | | 156,988,271 | |
4.50%, 8/20/38-4/15/47 (p) | | | | | | | 81,991 | | | | 87,846,817 | |
5.00%, 4/15/33-7/20/44 | | | | | | | 12,538 | | | | 13,743,647 | |
5.50%, 4/15/47 (p) | | | | | | | 5,800 | | | | 6,331,364 | |
| | | | | | | | | | | | |
| | | | | | | | | | | | 6,938,032,603 | |
Total U.S. Government Sponsored Agency Securities — 71.1% | | | | 7,016,132,159 | |
| | | | | | | | | | | | |
| U.S. Treasury Obligations | | | | | | | | | |
U.S. Treasury Bonds: | | | | | | | | | | | | |
2.13%, 3/31/24 | | | | | | | 64,453 | | | | 64,072,856 | |
2.25%, 8/15/46 (l) | | | | | | | 175,999 | | | | 148,952,882 | |
2.88%, 11/15/46 (l) | | | | | | | 153,451 | | | | 148,888,974 | |
3.00%, 2/15/47 (l) | | | | | | | 109,071 | | | | 108,683,253 | |
U.S. Treasury Inflation Indexed Notes: | | | | | | | | | | | | |
0.13%, 4/15/21-7/15/26 (r) | | | | | | | 101,755 | | | | 102,236,616 | |
0.38%, 1/15/27 | | | | | | | 41,354 | | | | 41,186,566 | |
U.S. Treasury Notes: | | | | | | | | | | | | |
1.13%, 1/31/19-2/28/19 (l) | | | | | | | 192,123 | | | | 191,713,953 | |
1.25%, 3/31/19 | | | | | | | 22,145 | | | | 22,140,682 | |
1.38%, 1/15/20-2/15/20 (l)(r) | | | | | | | 633,214 | | | | 631,469,861 | |
1.63%, 3/15/20 (l)(r) | | | | | | | 208,175 | | | | 208,923,181 | |
2.00%, 12/31/21-11/15/26 (l) | | | | | | | 101,240 | | | | 98,328,828 | |
1.88%, 1/31/22-3/31/22 (l)(r) | | | | | | | 419,809 | | | | 418,896,674 | |
2.25%, 1/31/24-2/15/27 (l) | | | | | | | 96,339 | | | | 96,623,922 | |
2.13%, 2/29/24 | | | | | | | 96,313 | | | | 95,793,777 | |
1.50%, 8/15/26 (l) | | | | | | | 91,629 | | | | 84,785,413 | |
U.S. Treasury Strips, 0.00%, 5/15/36 (i)(l) | | | | | | | 14,105 | | | | 7,976,871 | |
Total U.S. Treasury Obligations — 25.0% | | | | | | | | | | | 2,470,674,309 | |
Total Long-Term Investments (Cost — $15,088,756,465) — 153.0% | | | | | | | | | | | 15,096,360,383 | |
| | | | | | | | | | | | |
| Short-Term Securities | | | | | | | | | |
Borrowed Bond Agreements — 5.9% (s) | | | | | | | | | | | | |
Barclays Bank PLC, (2.75)%, Open (t) | | | | | | | 522 | | | | 521,875 | |
(Purchased on 1/26/17 to be repurchased at $519,443, collateralized by Bank of Communications Co. Ltd., 5.00% (m), par and fair value of USD 500,000 and $512,650, respectively) | | | | | | | | | | | | |
Barclays Bank PLC, (0.70)%, Open (t) | | | EUR | | | | 2,793 | | | | 2,980,023 | |
(Purchased on 2/06/17 to be repurchased at EUR 2,790,589, collateralized by Kingdom of Spain, 5.40% due at 1/31/23, par and fair value of EUR 2,200,000 and $2,977,245, respectively) | | | | | | | | | | | | |
Barclays Bank PLC, 0.14%, Open (t) | | | GBP | | | | 42,421 | | | | 53,149,357 | |
(Purchased on 1/20/17 to be repurchased at GBP 42,432,883, collateralized by United Kingdom Gilt Inflation Linked Bonds, 0.13% due at 3/22/26, par and fair value of GBP 35,592,894 and $53,984,190, respectively) | | | | | | | | | | | | |
| | | | | | | | | | | | |
| Short-Term Securities | | | | | Par
(000) | | | Value | |
Borrowed Bond Agreements (continued) (s) | | | | | | | | | | | | |
Barclays Bank PLC, 0.17%, Open (t) | | | GBP | | | | 41,716 | | | $ | 52,266,445 | |
(Purchased on 10/18/16 to be repurchased at GBP 41,748,781, collateralized by United Kingdom Gilt Inflation Linked Bonds, 0.13% due at 3/22/26, par and fair value of GBP 34,438,102 and $52,232,702, respectively) | | | | | | | | | | | | |
BNP Paribas Securities Corp., 0.00%, Open (t) | | | | | | | 44,259 | | | | 55,451,655 | |
(Purchased on 3/31/17 to be repurchased at GBP 44,258,750, collateralized by United Kingdom Gilt Inflation Linked Bonds, 0.13% due at 3/22/26, par and fair value of GBP 36,409,372 and $55,222,552, respectively) | | | | | | | | | | | | |
BNP Paribas Securities Corp., 0.15%, Open (t) | | | | | | | 39,966 | | | | 50,073,657 | |
(Purchased on 12/01/16 to be repurchased at GBP 39,986,283, collateralized by United Kingdom Gilt Inflation Linked Bonds, 0.13% due at 3/22/26, par and fair value of GBP 33,965,079 and $51,515,263, respectively) | | | | | | | | | | | | |
BNP Paribas Securities Corp., 0.16%, Open (t) | | | | | | | 42,228 | | | | 52,907,159 | |
(Purchased on 1/20/17 to be repurchased at GBP 42,240,622, collateralized by United Kingdom Gilt Inflation Linked Bonds, 0.13% due at 3/22/26, par and fair value of GBP 35,592,894 and $53,984,190, respectively) | | | | | | | | | | | | |
Citigroup Global Markets Limited, (0.10)%, Open (t) | | | USD | | | | 455 | | | | 454,912 | |
(Purchased on 2/24/17 to be repurchased at $454,873, collateralized by Barclays Bank PLC, 7.63% due at 11/21/22, par and fair value of USD 394,000 and $430,918, respectively) | | | | | | | | | | | | |
Citigroup Global Markets, Inc., 0.00%, Open (t) | | | | | | | 3,809 | | | | 3,809,025 | |
(Purchased on 3/30/17 to be repurchased at $3,809,025, collateralized by Shell International Finance BV, 3.25% due at 5/11/25, par and fair value of USD 3,762,000 and $3,798,514, respectively) | | | | | | | | | | | | |
Citigroup Global Markets, Inc., 0.60%, Open (t) | | | | | | | 5,910 | | | | 5,909,963 | |
(Purchased on 3/23/17 to be repurchased at $5,910,455, collateralized by Shell International Finance BV, 3.25% due at 5/11/25, par and fair value of USD 5,837,000 and $5,893,654, respectively) | | | | | | | | | | | | |
Deutsche Bank AG, (0.60)%, Open (t) | | | EUR | | | | 2,855 | | | | 3,045,279 | |
(Purchased on 1/31/17 to be repurchased at EUR 2,851,824, collateralized by Kingdom of Spain, 5.40% due at 1/31/23, par and fair value of EUR 2,200,000 and $2,977,245, respectively) | | | | | | | | | | | | |
Deutsche Bank Securities, Inc., 0.75%, 4/17/17 | | | USD | | | | 7,991 | | | | 7,990,587 | |
(Purchased on 3/17/17 to be repurchased at $7,995,748, collateralized by U.S. Treasury Strips, 0.00% due at 2/15/36, par and fair value of USD 13,601,000 and $8,183,354, respectively) | | | | | | | | | | | | |
J.P. Morgan Securities PLC, (2.00)%, Open (t) | | | EUR | | | | 5,746 | | | | 6,129,489 | |
(Purchased on 3/01/17 to be repurchased at EUR 5,736,403, collateralized by Republic of France, 2.25% due at 10/25/22, par and fair value of EUR 5,100,000 and $6,059,848, respectively) | | | | | | | | | | | | |
See Notes to Consolidated Financial Statements.
| | | | | | |
| 70 | | BLACKROCK BALANCED CAPITAL FUND, INC. | | MARCH 31, 2017 | | |
| | | | |
| Consolidated Schedule of Investments (continued) | | | Master Total Return Portfolio | |
| | | | | | | | | | | | |
| Short-Term Securities | | | | | Par (000) | | | Value | |
Borrowed Bond Agreements (continued) (s) | | | | | | | | | | | | |
J.P. Morgan Securities PLC, (2.00)%, Open (t) | | | EUR | | | | 2,812 | | | $ | 3,000,117 | |
(Purchased on 3/29/17 to be repurchased at EUR 2,812,094, collateralized by Republic of France, 2.25% due at 10/25/22, par and fair value of EUR 2,500,000 and $2,970,513, respectively) | | | | | | | | | | | | |
J.P. Morgan Securities PLC, (1.60)%, Open (t) | | | | | | | 17,040 | | | | 18,177,964 | |
(Purchased on 3/21/17 to be repurchased at EUR 17,032,844, collateralized by Republic of France, 3.00% due at 4/25/22, par and fair value of EUR 14,600,000 and $17,862,408, respectively) | | | | | | | | | | | | |
J.P. Morgan Securities PLC, (1.30)%, Open (t) | | | | | | | 420 | | | | 448,533 | |
(Purchased on 2/23/17 to be repurchased at EUR 419,899, collateralized by Jaguar Land Rover Automotive PLC, 2.20% due at 1/15/24, par and fair value of EUR 400,000 and $422,241, respectively) | | | | | | | | | | | | |
J.P. Morgan Securities PLC, (1.10)%, Open (t) | | | | | | | 112 | | | | 119,423 | |
(Purchased on 1/31/17 to be repurchased at EUR 111,750, collateralized by Syngenta Finance NV, 1.88% due at 11/02/21, par and fair value of EUR 100,000 and $113,164, respectively) | | | | | | | | | | | | |
J.P. Morgan Securities PLC, (0.80)%, Open (t) | | | | | | | 11,477 | | | | 12,244,010 | |
(Purchased on 3/24/17 to be repurchased at EUR 11,476,270, collateralized by Deutsche Bundesrepublik Inflation Linked Bonds, 0.10% due at 4/15/26, par and fair value of EUR 10,403,515 and $12,265,808, respectively) | | | | | | | | | | | | |
J.P. Morgan Securities PLC, (0.25)%, Open (t) | | | USD | | | | 555 | | | | 554,943 | |
(Purchased on 2/01/17 to be repurchased at $554,723, collateralized by Industrial & Commercial Bank of China Ltd., 6.00% (m), par and fair value of USD 500,000 and $526,454, respectively) | | | | | | | | | | | | |
J.P. Morgan Securities PLC, (0.05)%, 4/3/17 | | | GBP | | | | 43,902 | | | | 55,004,418 | |
(Purchased on 3/24/17 to be repurchased at GBP 43,901,361, collateralized by United Kingdom Gilt Inflation Linked Bonds, 0.13% due at 3/22/26, par and fair value of GBP 36,409,372 and $55,222,551, respectively) | | | | | | | | | | | | |
J.P. Morgan Securities PLC, 0.02%, 4/24/17 | | | | | | | 150,993 | | | | 189,178,181 | |
(Purchased on 3/22/17 to be repurchased at GBP 150,995,288, collateralized by United Kingdom Gilt, 0.50% due at 7/22/22, par and fair value of GBP 151,599,000 and $189,463,276, respectively) | | | | | | | | | | | | |
Merrill Lynch, Pierce, Fenner & Smith, Inc., 0.75%, 4/3/17 | | | USD | | | | 5,017 | | | | 5,017,125 | |
(Purchased on 3/30/17 to be repurchased at $5,017,439, collateralized by U.S. Treasury Inflation Indexed Bonds, 0.88% due at 2/15/47, par and fair value of USD 5,129,580 and $5,052,388, respectively) | | | | | | | | | | | | |
| | | | | | | | | | | | |
| | | | | | | | | | | | 578,434,140 | |
| | | | | | | | | | | | |
| Certificates of Deposit | | | | | Par (000) | | | Value | |
Domestic — 0.2% | | | | | | | | | | | | |
Wells Fargo Bank N.A., 1.64%, 9/22/17 (a) | | | USD | | | | 24,620 | | | $ | 24,672,514 | |
Yankee — 1.8% (j) | | | | | | | | | | | | |
Bank of Tokyo-Mitsubishi UFJ Ltd., New York, 1.67%, 8/17/17 (a) | | | | | | | 25,030 | | | | 25,074,628 | |
Cooperatieve Rabobank UA, New York, 1.54%, 8/16/17 (a) | | | | | | | 25,030 | | | | 25,072,025 | |
Credit Industriel et Commercial, New York, 1.64%, 8/16/17 (a) | | | | | | | 25,030 | | | | 25,081,462 | |
Credit Suisse AG, New York, 1.82%, 8/16/17 (a) | | | | | | | 12,280 | | | | 12,302,129 | |
Credit Suisse AG, New York, 1.83%, 8/24/17 (a) | | | | | | | 12,080 | | | | 12,102,940 | |
Skandinaviska Enskilda Banken AB, New York, 1.52%, 8/17/17 (a) | | | | | | | 25,030 | | | | 25,071,675 | |
Sumitomo Mitsui Banking Corp., New York, 1.67%, 8/18/17 (a) | | | | | | | 13,070 | | | | 13,093,291 | |
Toronto-Dominion Bank, New York, 1.54%, 8/15/17 (a) | | | | | | | 24,630 | | | | 24,674,457 | |
UBS AG, Stamford, CT, 1.53%, 9/01/17 | | | | | | | 12,740 | | | | 12,758,298 | |
| | | | | | | | | | | | |
| | | | | | | | | | | | 175,230,905 | |
Total Certificates of Deposit — 2.0% | | | | | | | | | | | 199,903,419 | |
| | | | | | | | | | | | |
| Commercial Paper | | | | | | | | | |
BNP Paribas SA, (New York Branch), 1.53%, 8/17/17 (a)(u) | | | | | | | 12,820 | | | | 12,833,652 | |
BPCE SA, 1.49%, 8/14/17 (u) | | | | | | | 25,150 | | | | 25,033,327 | |
Mizuho Corporate Bank, (New York Branch), 1.37%, 8/16/17 (u) | | | | | | | 24,820 | | | | 24,706,779 | |
Sumitomo Mitsui Trust Bank Ltd., (New York Branch), 1.53%, 8/16/17 (a)(u) | | | | | | | 25,030 | | | | 25,056,567 | |
Swedbank AB, (New York Branch), 1.38%, 8/18/17 (a)(u) | | | | | | | 12,860 | | | | 12,874,636 | |
Total Commercial Paper — 1.0% | | | | | | | | | | | 100,504,961 | |
| | | | | | | | | | | | |
| Money Market Funds | | | | | Shares | | | | |
SL Liquidity Series, LLC, Money Market Series, 1.11% (n)(v)(w) | | | | | | | 19,434,774 | | | | 19,436,717 | |
Total Money Market Funds — 0.2% | | | | | | | | | | | 19,436,717 | |
Total Short-Term Securities (Cost — $894,820,786) — 9.1% | | | | | | | | | | | 898,279,237 | |
| | | | | | | | | | | | |
| Options Purchased | | | | | | | | | |
(Cost — $23,648,858) — 0.2% | | | | | | | | | | | 18,541,238 | |
Total Investments Before TBA Sale Commitments, Options Written and Borrowed Bonds (Cost — $16,007,226,109) — 162.3% | | | | 16,013,180,858 | |
| | | | | | | | | | | | |
| | | | | | | | | | |
See Notes to Consolidated Financial Statements.
| | | | | | |
| | | BLACKROCK BALANCED CAPITAL FUND, INC. | | MARCH 31, 2017 | | 71 |
| | | | |
| Consolidated Schedule of Investments (continued) | | | Master Total Return Portfolio | |
| | | | |
| | | | | | | | | | | | |
| TBA Sale Commitments (p) | | | | | Par (000) | | | Value | |
Fannie Mae Mortgage-Backed Securities: | | | | | | | | | | | | |
2.50%, 4/01/32 | | | USD | | | | 34,888 | | | $ | (34,904,356 | ) |
3.00%, 4/01/32-4/01/47 | | | | | | | 1,172,221 | | | | (1,162,591,098 | ) |
3.50%, 4/01/32-4/01/47 | | | | | | | 1,089,452 | | | | (1,115,388,771 | ) |
4.00%, 4/01/47 | | | | | | | 752,445 | | | | (789,244,226 | ) |
4.50%, 4/01/47 | | | | | | | 71,768 | | | | (76,929,453 | ) |
5.00%, 4/01/47 | | | | | | | 12,463 | | | | (13,617,890 | ) |
6.00%, 4/01/47 | | | | | | | 1,218 | | | | (1,376,626 | ) |
Freddie Mac Mortgage-Backed Securities: | | | | | | | | | | | | |
3.00%, 4/01/47 | | | | | | | 255,874 | | | | (253,514,710 | ) |
3.50%, 4/01/47 | | | | | | | 80,789 | | | | (82,619,706 | ) |
4.00%, 4/01/47 | | | | | | | 373,545 | | | | (391,813,666 | ) |
6.00%, 4/01/47 | | | | | | | 7,800 | | | | (8,809,125 | ) |
Ginnie Mae Mortgage-Backed Securities: | | | | | | | | | | | | |
3.50%, 4/15/47 | | | | | | | 98,230 | | | | (101,851,573 | ) |
4.00%, 4/01/47 | | | | | | | 25,286 | | | | (26,706,363 | ) |
4.50%, 4/01/47 | | | | | | | 17,785 | | | | (18,993,825 | ) |
Total TBA Sale Commitments (Proceeds — $4,059,295,035) — (41.3)% | | | | (4,078,361,388 | ) |
| | | | | | | | | | | | |
| Options Written | | | | | | | | | |
(Premiums Received — $9,335,012) — (0.1)% | | | | (7,870,887 | ) |
| | | | | | | | | | | | |
| Borrowed Bonds | | | | | | | | | |
Corporate Bonds — (0.1)% | | | | | | | | | | | | |
Bank of Communications Co. Ltd., | | | | | | | | | | | | |
5.00% (a)(m) | | | | | | | 500 | | | | (512,650 | ) |
Barclays Bank PLC, | | | | | | | | | | | | |
7.63%, 11/21/22 | | | | | | | 394 | | | | (430,918 | ) |
Jaguar Land Rover Automotive PLC, | | | | | | | | | | | | |
2.20%, 1/15/24 | | | EUR | | | | 400 | | | | (422,241 | ) |
Shell International Finance BV, | | | | | | | | | | | | |
3.25%, 5/11/25 | | | USD | | | | 5,837 | | | | (5,893,654 | ) |
Syngenta Finance NV, | | | | | | | | | | | | |
1.88%, 11/02/21 | | | EUR | | | | 100 | | | | (113,164 | ) |
| | | | | | | | | | | | |
| | | | | | | | | | | | (7,372,627 | ) |
| | | | | | | | | | | | |
| Borrowed Bonds | | | | | Par (000) | | | Value | |
Foreign Agency Obligations — (0.0)% | | | | | | | | | | | | |
Industrial & Commercial Bank of China Ltd., | | | | | | | | | | | | |
6.00% (a)(m) | | | USD | | | | 500 | | | $ | (526,454 | ) |
| | | | | | | | | | | | |
| | | | | | | | | | | | (526,454 | ) |
Foreign Government Obligations — (5.1)% | | | | | |
Deutsche Bundesrepublik Inflation Linked Bonds, | | | | | | | | | | | | |
0.10%, 4/15/26 | | | EUR | | | | 10,404 | | | | (12,265,808 | ) |
Kingdom of Spain, | | | | | | | | | | | | |
5.40%, 1/31/23 | | | | | | | 4,400 | | | | (5,954,490 | ) |
Republic of France, | | | | | | | | | | | | |
3.00%, 4/25/22 | | | | | | | 14,600 | | | | (17,862,408 | ) |
2.25%, 10/25/22 | | | | | | | 7,600 | | | | (9,030,361 | ) |
United Kingdom Gilt, | | | | | | | | | | | | |
0.50%, 7/22/22 | | | GBP | | | | 151,599 | | | | (189,463,276 | ) |
United Kingdom Gilt Inflation Linked Bonds, | | | | | | | | | | | | |
0.13%, 3/22/26 | | | | | | | 175,998 | | | | (266,938,896 | ) |
| | | | | | | | | | | | |
| | | | | | | | | | | | (501,515,239 | ) |
U.S. Treasury Obligations — (0.1)% | | | | | | | | | | | | |
U.S. Treasury Inflation Indexed Bonds, | | | | | | | | | | | | |
0.88%, 2/15/47 | | | USD | | | | 5,130 | | | | (5,052,388 | ) |
U.S. Treasury Strips, | | | | | | | | | | | | |
0.00%, 2/15/36 (i) | | | | | | | 13,601 | | | | (8,183,354 | ) |
| | | | | | | | | | | | |
| | | | | | | | | | | | (13,235,742 | ) |
Total Borrowed Bonds (Proceeds — $514,422,832) — (5.3)% | | | | | | | | | | | (522,650,062 | ) |
| | | | | | | | | | | | |
| | |
Total Investments Net of TBA Sale Commitments, Options Written and Borrowed Bonds — 115.6% | | | | 11,404,298,521 | |
Liabilities in Excess of Other Assets — (15.6)% | | | | (1,538,217,145 | ) |
| | | | | | | | | | | | |
Net Assets — 100.0% | | | | | | | | | | $ | 9,866,081,376 | |
| | | | | | | | | | | | |
|
Notes to Consolidated Schedule of Investments |
| (a) | Variable rate security. Rate as of period end. |
| (b) | Security exempt from registration pursuant to Rule 144A under the Securities Act of 1933, as amended. These securities may be resold in transactions exempt from registration to qualified institutional investors. |
| (c) | Step-up bond that pays an initial coupon rate for the first period and then a higher coupon rate for the following periods. Rate as of period end. |
| (d) | Non-income producing security. |
| (e) | A security contractually bound to one or more other securities to form a single saleable unit which cannot be sold separately. |
| (f) | Security, or a portion of the security, is on loan. |
| (g) | Issuer filed for bankruptcy and/or is in default. |
| (j) | Issuer is a U.S. branch of a foreign domiciled bank. |
| (k) | Payment-in-kind security which may pay interest/dividends in additional par/shares and/or in cash. Rates shown are the current rate and possible payment rates. |
| (l) | All or a portion of the security has been pledged as collateral in connection with outstanding reverse repurchase agreements. |
| (m) | Perpetual security with no stated maturity date. |
See Notes to Consolidated Financial Statements.
| | | | | | |
| 72 | | BLACKROCK BALANCED CAPITAL FUND, INC. | | MARCH 31, 2017 | | |
| | | | |
| Consolidated Schedule of Investments (continued) | | | Master Total Return Portfolio | |
| (n) | During the six months ended March 31, 2017, investments in issuers considered to be affiliates of the Master Portfolio for purposes of Section 2(a)(3) of the Investment Company Act of 1940, as amended, were as follows: |
| | | | | | | | | | | | | | | | | | | | | | | | | | | | | | | | |
| Affiliate | | Par/Shares
Held at
September 30,
2016 | | | Par/Shares
Purchased | | | Par/Shares Sold | | | Par/Shares
Held at
March 31,
2017 | | | Value at
March 31, 2017 | | | Income | | | Net
Realized
Gain (Loss) | | | Change in
Unrealized
Appreciation
(Depreciation) | |
BlackRock Capital Finance LP, Series 1997-R2, Class AP | | $ | 7,020 | | | | — | | | $ | (3,646 | ) | | $ | 3,374 | | | $ | 3,125 | | | $ | 8 | | | $ | 18 | | | | $ (157 | ) |
BlackRock Liquidity Funds, T-Fund, Institutional Class | | | 277,766,479 | | | | — | | | | (277,766,479 | )1 | | | — | | | | — | | | | 40,296 | | | | — | | | | — | |
iShares iBoxx $ High Yield Corporate Bond ETF | | | — | | | | 1,194,803 | | | | (75,459 | ) | | | 1,119,344 | | | | 98,256,016 | | | | 22,115 | | | | 15,409 | | | | 1,720,896 | |
iShares J.P. Morgan USD Emerging Markets Bond ETF | | | — | | | | 20,580 | | | | (20,580 | ) | | | — | | | | — | | | | — | | | | 2,976 | | | | — | |
iShares MSCI Emerging Markets ETF | | | 70,243 | | | | 290,857 | | | | (136,963 | ) | | | 224,137 | | | | 8,828,756 | | | | — | | | | (340,409 | ) | | | 44,724 | |
SL Liquidity Series, LLC, Money Market Series | | | 2,081,765 | | | | 17,353,009 | 2 | | | — | | | | 19,434,774 | | | | 19,436,717 | | | | 45,515 | 3 | | | (6,759 | ) | | | — | |
Total | | | | | | | | | | | | | | | | | | $ | 126,524,614 | | | $ | 107,934 | | | $ | (328,765 | ) | | | $1,765,463 | |
| | | | | | | | | | | | | | | | | | | | |
| 1 | | Represents net shares sold. |
| 2 | | Represents net shares purchased. |
| 3 | | Represents securities lending income earned from the reinvestment of cash collateral from loaned securities, net of fees and collateral investment expenses, and other payments to and from borrowers of securities. |
| (o) | Other interests represent beneficial interests in liquidation trusts and other reorganization or private entities. |
| (p) | Represents or includes a TBA transaction. As of period end, unsettled TBA transactions were as follows: |
| | | | | | | | |
| Counterparty | | Value | | | Unrealized
Appreciation
(Depreciation) | |
Amherst Pierpont Securities LLC | | $ | (11,426,729 | ) | | | $ (137,786 | ) |
Barclays Capital, Inc. | | $ | (394,206,518 | ) | | | $ (762,557 | ) |
BNP Paribas Securities Corp. | | $ | 11,160,174 | | | | $ (78,589 | ) |
BNY Mellon Capital Markets LLC | | $ | 419,562 | | | | $ 2,063 | |
Citigroup Global Markets, Inc. | | $ | 1,837,323 | | | | $ 213,124 | |
Credit Suisse Securities (USA) LLC | | $ | 92,676,482 | | | | $ 225,718 | |
Daiwa Capital Markets America, Inc. | | $ | 6,853,367 | | | | $ 36,117 | |
Deutsche Bank Securities, Inc. | | $ | 40,872,506 | | | | $ (16,650 | ) |
Goldman Sachs & Co. | | $ | 32,314,697 | | | | $(1,394,628 | ) |
J.P. Morgan Securities LLC | | $ | (189,812,769 | ) | | | $ (440,567 | ) |
Jefferies LLC | | $ | 93,169,226 | | | | $ 939,163 | |
Merrill Lynch, Pierce, Fenner & Smith, Inc. | | $ | 19,392,051 | | | | $ 1,304,131 | |
Mizuho Securities USA, Inc. | | $ | 71,687,591 | | | | $ 695,851 | |
Morgan Stanley & Co. LLC | | $ | 102,297,122 | | | | $ 911,189 | |
Nomura Securities International, Inc. | | $ | 22,301,267 | | | | $ 79,405 | |
RBC Capital Markets, LLC | | $ | (167,729,002 | ) | | | $(1,399,076 | ) |
Wells Fargo Securities, LLC | | $ | (35,035,459 | ) | | | $ (642,595 | ) |
| (q) | All or a portion of the security has been pledged as collateral in connection with outstanding TBA commitments. |
| (r) | All or a portion of the security has been pledged as collateral in connection with outstanding borrowed bonds. |
| (s) | Certain agreements have no stated maturity and can be terminated by either party at any time. |
| (t) | The amount to be repurchased assumes the maturity will be the day after the period end. |
| (u) | Rates are discount rates or a range of discount rates at the time of purchase. |
| (v) | Security was purchased with the cash collateral from loaned securities. |
| (w) | Current yield as of period end. |
| • | For Master Portfolio compliance purposes, the Master Portfolio’s industry classifications refer to one or more of the industry sub-classifications used by one or more widely recognized market indexes or ratings group indexes, and/or as defined by the investment adviser. These definitions may not apply for purposes of this report, which may combine such industry sub-classifications for reporting ease. |
See Notes to Consolidated Financial Statements.
| | | | | | |
| | | BLACKROCK BALANCED CAPITAL FUND, INC. | | MARCH 31, 2017 | | 73 |
| | | | |
| Consolidated Schedule of Investments (continued) | | | Master Total Return Portfolio | |
| | | | | | | | | | | | | | | | | | | | | | | | | | | | |
| Reverse Repurchase Agreements | | | | | | | | | | | | | | | | | | | | | |
| Counterparty | | Interest
Rate | | | Trade
Date | | | Maturity
Date1 | | | Face Value | | | Face Value
Including
Accrued Interest | | | Type of Non-Cash
Underlying Collateral | | | Remaining
Contractual
Maturity of the
Agreements | |
RBC Capital Markets, LLC | | | 0.64% | | | | 6/29/16 | | | | Open | | | $ | 433,550 | | | $ | 434,953 | | | | Corporate Bonds | | | | Open/Demand1 | |
RBC Capital Markets, LLC | | | 0.64% | | | | 9/13/16 | | | | Open | | | | 2,572,235 | | | | 2,580,558 | | | | Corporate Bonds | | | | Open/Demand1 | |
HSBC Securities (USA), Inc. | | | 0.63% | | | | 2/03/17 | | | | Open | | | | 80,100,000 | | | | 80,179,900 | | | | U.S. Treasury Obligations | | | | Open/Demand1 | |
MUFG Securities Americas, Inc. | | | 0.12% | | | | 3/09/17 | | | | Open | | | | 149,250,000 | | | | 149,261,443 | | | | U.S. Treasury Obligations | | | | Open/Demand1 | |
Nomura Securities International, Inc. | | | 0.45% | | | | 3/09/17 | | | | Open | | | | 97,000,000 | | | | 97,027,888 | | | | U.S. Treasury Obligations | | | | Open/Demand1 | |
Deutsche Bank Securities, Inc. | | | 0.90% | | | | 3/17/17 | | | | 4/17/17 | | | | 7,757,750 | | | | 7,760,659 | | | | U.S. Treasury Obligations | | | | Up to 30 Days | |
MUFG Securities Americas, Inc. | | | 0.68% | | | | 3/21/17 | | | | Open | | | | 82,912,500 | | | | 82,929,727 | | | | U.S. Treasury Obligations | | | | Open/Demand1 | |
Bank of Montreal | | | 0.52% | | | | 3/28/17 | | | | Open | | | | 149,812,500 | | | | 149,821,156 | | | | U.S. Treasury Obligations | | | | Open/Demand1 | |
Bank of Montreal | | | 0.37% | | | | 3/28/17 | | | | Open | | | | 22,971,250 | | | | 22,972,194 | | | | U.S. Treasury Obligations | | | | Open/Demand1 | |
Bank of Montreal | | | 0.82% | | | | 3/28/17 | | | | Open | | | | 90,675,000 | | | | 90,683,261 | | | | U.S. Treasury Obligations | | | | Open/Demand1 | |
Barclays Capital, Inc. | | | 0.65% | | | | 3/31/17 | | | | 4/03/17 | | | | 165,899,000 | | | | 165,901,995 | | | | U.S. Treasury Obligations | | | | Overnight | |
Credit Agricole Corporate & Investment Bank SA | | | 1.05% | | | | 3/31/17 | | | | Open | | | | 14,105,000 | | | | 14,105,411 | | | | U.S. Treasury Obligations | | | | Open/Demand1 | |
Credit Suisse Securities (USA) LLC | | | 0.80% | | | | 3/31/17 | | | | 4/03/17 | | | | 166,509,683 | | | | 166,513,383 | | | | U.S. Treasury Obligations | | | | Overnight | |
Deutsche Bank Securities, Inc. | | | 0.80% | | | | 3/31/17 | | | | 4/03/17 | | | | 150,381,588 | | | | 150,384,930 | | | | U.S. Treasury Obligations | | | | Overnight | |
J.P. Morgan Securities LLC | | | 0.87% | | | | 3/31/17 | | | | 4/03/17 | | | | 84,750,000 | | | | 84,752,048 | | | | U.S. Treasury Obligations | | | | Overnight | |
Merrill Lynch, Pierce, Fenner & Smith, Inc. | | | 0.45% | | | | 3/31/17 | | | | 4/03/17 | | | | 207,039,497 | | | | 207,042,085 | | | | U.S. Treasury Obligations | | | | Overnight | |
Merrill Lynch, Pierce, Fenner & Smith, Inc. | | | 0.70% | | | | 3/31/17 | | | | 4/03/17 | | | | 184,768,750 | | | | 184,772,343 | | | | U.S. Treasury Obligations | | | | Overnight | |
Total | | | | | | | | | | | | | | $ | 1,656,938,303 | | | $ | 1,657,123,934 | | | | | | | | | |
| | | | | | | | | | | | | | | | | | | | | | | | |
| | 1 | | Certain agreements have no stated maturity and can be terminated by either party at any time. |
|
Derivative Financial Instruments Outstanding as of Period End |
| | | | | | | | | | | | | | |
| Futures Contracts | |
Contracts
Long
(Short) | | | Issue | | Expiration | | Notional Value | | | Unrealized
Appreciation
(Depreciation) | |
| | (5 | ) | | Hang Seng China Enterprises Index | | April 2017 | | USD | 330,953 | | | | $ 1,588 | |
| | (4 | ) | | Hang Seng Index | | April 2017 | | USD | 621,012 | | | | 1,888 | |
| | (52 | ) | | CBOE Volatility Index | | May 2017 | | USD | 705,900 | | | | 49,176 | |
| | 478 | | | VSTOXX Mini | | May 2017 | | USD | 938,275 | | | | (69,118 | ) |
| | 1,154 | | | Euro Dollar | | June 2017 | | USD | 284,778,350 | | | | 137,157 | |
| | 87 | | | Euro STOXX 50 Index | | June 2017 | | USD | 3,179,735 | | | | 39,030 | |
| | (58 | ) | | Euro STOXX Banks Index | | June 2017 | | USD | 543,259 | | | | (4,382 | ) |
| | (778 | ) | | Euro-Bobl | | June 2017 | | USD | 109,390,429 | | | | 300,813 | |
| | 19 | | | Euro-BTP Italian Government Bond | | June 2017 | | USD | 2,648,990 | | | | 7,688 | |
| | (1,056 | ) | | Euro-Bund | | June 2017 | | USD | 181,846,764 | | | | 50,202 | |
| | (138 | ) | | Euro-OAT | | June 2017 | | USD | 21,647,059 | | | | (45,988 | ) |
| | (6 | ) | | Euro-Schatz | | June 2017 | | USD | 718,460 | | | | 1,500 | |
| | 1,633 | | | Long Gilt British | | June 2017 | | USD | 261,026,230 | | | | 3,499,779 | |
| | (5 | ) | | Nikkei 225 Index | | June 2017 | | USD | 849,277 | | | | (3,610 | ) |
| | 222 | | | Russell 2000 Mini Index | | June 2017 | | USD | 15,366,840 | | | | 55,068 | |
| | 205 | | | S&P 500 E-Mini Index | | June 2017 | | USD | 24,181,800 | | | | 51,884 | |
| | 968 | | | U.S. Treasury Bonds (30 Year) | | June 2017 | | USD | 146,016,750 | | | | (683,772 | ) |
| | (2,948 | ) | | U.S. Treasury Notes (10 Year) | | June 2017 | | USD | 367,210,250 | | | | (896,670 | ) |
| | (1,508 | ) | | U.S. Treasury Notes (2 Year) | | June 2017 | | USD | 326,411,314 | | | | 59,889 | |
| | 750 | | | U.S. Treasury Notes (5 Year) | | June 2017 | | USD | 88,294,922 | | | | 37,714 | |
| | (30 | ) | | U.S. Ultra Treasury Bonds | | June 2017 | | USD | 4,818,750 | | | | (54,452 | ) |
| | (169 | ) | | WTI Light Sweet Crude Oil1 | | June 2017 | | USD | 8,630,830 | | | | (378,881 | ) |
| | 178 | | | WTI Light Sweet Crude Oil1 | | September 2017 | | USD | 9,227,520 | | | | 380,094 | |
| | 328 | | | Euro Dollar | | December 2017 | | USD | 80,729,000 | | | | 61,054 | |
See Notes to Consolidated Financial Statements.
| | | | | | |
| 74 | | BLACKROCK BALANCED CAPITAL FUND, INC. | | MARCH 31, 2017 | | |
| | | | |
| Consolidated Schedule of Investments (continued) | | | Master Total Return Portfolio | |
| | | | | | | | | | | | | | | | |
Contracts
Long
(Short) | | | Issue | | Expiration | | | Notional Value | | | Unrealized
Appreciation
(Depreciation) | |
| | (771) | | | Euro Dollar | | | June 2018 | | | USD | 189,319,050 | | | | $ (198,397 | ) |
| | (492) | | | Euro Dollar | | | December 2018 | | | USD | 120,527,700 | | | | (37,569 | ) |
| | (716) | | | Euro Dollar | | | March 2019 | | | USD | 175,267,850 | | | | (200,574 | ) |
| | Total | | | | | | | | | | | | | | $2,161,111 | |
| | | | | | | | | | | | | | | | |
| | 1 | | All or a portion of the security is held by a wholly-owned subsidiary. See Note 1 of the Notes to Consolidated Financial Statements for details on the wholly-owned subsidiary. |
| | | | | | | | | | | | | | | | | | | | |
| Forward Foreign Currency Exchange Contracts | |
Currency Purchased | | | Currency
Sold | | | Counterparty | | Settlement
Date | | | Unrealized
Appreciation
(Depreciation) | |
| CAD | | | 2,409,016 | | | USD | | | 1,800,000 | | | Bank of America N.A. | | | 4/03/17 | | | | $ 11,574 | |
| CAD | | | 4,492,131 | | | USD | | | 3,353,000 | | | Barclays Bank PLC | | | 4/03/17 | | | | 25,072 | |
| CAD | | | 462,096 | | | USD | | | 347,000 | | | Deutsche Bank AG | | | 4/03/17 | | | | 495 | |
| CAD | | | 1,004,758 | | | USD | | | 751,000 | | | Nomura International PLC | | | 4/03/17 | | | | 4,576 | |
| MXN | | | 11,608,900 | | | USD | | | 615,000 | | | Barclays Bank PLC | | | 4/03/17 | | | | 4,771 | |
| MXN | | | 33,693,408 | | | USD | | | 1,786,000 | | | Barclays Bank PLC | | | 4/03/17 | | | | 12,809 | |
| MXN | | | 17,856,382 | | | USD | | | 947,000 | | | Citibank N.A. | | | 4/03/17 | | | | 6,309 | |
| MXN | | | 6,893,656 | | | USD | | | 361,000 | | | Citibank N.A. | | | 4/03/17 | | | | 7,036 | |
| MXN | | | 13,913,710 | | | USD | | | 732,000 | | | Deutsche Bank AG | | | 4/03/17 | | | | 10,819 | |
| MXN | | | 15,366,806 | | | USD | | | 813,000 | | | Goldman Sachs International | | | 4/03/17 | | | | 7,397 | |
| MXN | | | 15,282,049 | | | USD | | | 802,060 | | | Goldman Sachs International | | | 4/03/17 | | | | 13,811 | |
| MXN | | | 5,486,777 | | | USD | | | 287,940 | | | Société Générale | | | 4/03/17 | | | | 4,986 | |
| USD | | | 1,466,000 | | | CAD | | | 1,951,407 | | | BNP Paribas S.A. | | | 4/03/17 | | | | (1,454 | ) |
| USD | | | 448,000 | | | CAD | | | 597,228 | | | Goldman Sachs International | | | 4/03/17 | | | | (1,114 | ) |
| USD | | | 2,193,000 | | | CAD | | | 2,927,484 | | | Royal Bank of Canada | | | 4/03/17 | | | | (8,461 | ) |
| USD | | | 2,144,000 | | | CAD | | | 2,854,043 | | | Royal Bank of Canada | | | 4/03/17 | | | | (2,234 | ) |
| BRL | | | 7,602,095 | | | USD | | | 2,379,000 | | | BNP Paribas S.A. | | | 4/04/17 | | | | 47,102 | |
| BRL | | | 9,340,151 | | | USD | | | 2,997,000 | | | Goldman Sachs International | | | 4/04/17 | | | | (16,221 | ) |
| BRL | | | 5,743,750 | | | USD | | | 1,838,000 | | | Goldman Sachs International | | | 4/04/17 | | | | (4,962 | ) |
| BRL | | | 12,508 | | | USD | | | 4,000 | | | Goldman Sachs International | | | 4/04/17 | | | | (8 | ) |
| BRL | | | 6,658,301 | | | USD | | | 2,102,400 | | | Goldman Sachs International | | | 4/04/17 | | | | 22,504 | |
| BRL | | | 9,987,451 | | | USD | | | 3,153,600 | | | Goldman Sachs International | | | 4/04/17 | | | | 33,756 | |
| BRL | | | 7,521,818 | | | USD | | | 2,405,000 | | | Royal Bank of Scotland PLC | | | 4/04/17 | | | | (4,517 | ) |
| EUR | | | 2,333,707 | | | USD | | | 2,495,000 | | | Barclays Bank PLC | | | 4/04/17 | | | | (4,948 | ) |
| GBP | | | 2,026,584 | | | USD | | | 2,530,000 | | | Northern Trust Corp. | | | 4/04/17 | | | | 9,341 | |
| HUF | | | 719,895,574 | | | USD | | | 2,495,000 | | | Goldman Sachs International | | | 4/04/17 | | | | (6,174 | ) |
| JPY | | | 278,016,852 | | | USD | | | 2,495,000 | | | Royal Bank of Canada | | | 4/04/17 | | | | 2,637 | |
| RUB | | | 28,885,760 | | | USD | | | 500,000 | | | Citibank N.A. | | | 4/04/17 | | | | 12,785 | |
| RUB | | | 78,644,169 | | | USD | | | 1,350,000 | | | Citibank N.A. | | | 4/04/17 | | | | 46,104 | |
| RUB | | | 40,094,568 | | | USD | | | 680,000 | | | Deutsche Bank AG | | | 4/04/17 | | | | 31,765 | |
| SEK | | | 22,276,231 | | | USD | | | 2,495,000 | | | Standard Chartered Bank | | | 4/04/17 | | | | (8,532 | ) |
| TRY | | | 1,816,768 | | | USD | | | 500,000 | | | Citibank N.A. | | | 4/04/17 | | | | (699 | ) |
| TRY | | | 4,877,933 | | | USD | | | 1,330,000 | | | Citibank N.A. | | | 4/04/17 | | | | 10,599 | |
| TRY | | | 2,436,146 | | | USD | | | 665,000 | | | Goldman Sachs International | | | 4/04/17 | | | | 4,524 | |
| USD | | | 2,238,000 | | | BRL | | | 6,975,846 | | | Goldman Sachs International | | | 4/04/17 | | | | 11,756 | |
| USD | | | 2,409,000 | | | BRL | | | 7,669,052 | | | JPMorgan Chase Bank N.A. | | | 4/04/17 | | | | (38,471 | ) |
| USD | | | 2,379,000 | | | BRL | | | 7,630,643 | | | Morgan Stanley & Co. International PLC | | | 4/04/17 | | | | (56,213 | ) |
See Notes to Consolidated Financial Statements.
| | | | | | |
| | | BLACKROCK BALANCED CAPITAL FUND, INC. | | MARCH 31, 2017 | | 75 |
| | | | |
| Consolidated Schedule of Investments (continued) | | | Master Total Return Portfolio | |
| | | | | | | | | | | | | | | | | | | | |
Currency Purchased | | | Currency
Sold | | | Counterparty | | Settlement
Date | | | Unrealized
Appreciation
(Depreciation) | |
| USD | | | 2,597,000 | | | BRL | | | 8,105,756 | | | Morgan Stanley & Co. International PLC | | | 4/04/17 | | | | $ 10,161 | |
| USD | | | 5,256,000 | | | BRL | | | 16,438,534 | | | Royal Bank of Scotland PLC | | | 4/04/17 | | | | 9,871 | |
| USD | | | 1,330,000 | | | EUR | | | 1,259,951 | | | Goldman Sachs International | | | 4/04/17 | | | | (14,360 | ) |
| USD | | | 500,000 | | | EUR | | | 463,414 | | | Goldman Sachs International | | | 4/04/17 | | | | 5,540 | |
| USD | | | 665,000 | | | EUR | | | 625,357 | | | State Street Bank and Trust Co. | | | 4/04/17 | | | | (2,252 | ) |
| USD | | | 500,000 | | | GBP | | | 399,943 | | | Citibank N.A. | | | 4/04/17 | | | | (1,134 | ) |
| USD | | | 680,000 | | | GBP | | | 546,732 | | | Goldman Sachs International | | | 4/04/17 | | | | (5,064 | ) |
| USD | | | 1,350,000 | | | GBP | | | 1,081,543 | | | State Street Bank and Trust Co. | | | 4/04/17 | | | | (5,190 | ) |
| USD | | | 1,330,000 | | | HUF | | | 386,996,218 | | | Barclays Bank PLC | | | 4/04/17 | | | | (7,925 | ) |
| USD | | | 665,000 | | | HUF | | | 192,904,929 | | | Citibank N.A. | | | 4/04/17 | | | | (1,912 | ) |
| USD | | | 500,000 | | | HUF | | | 143,217,500 | | | Citibank N.A. | | | 4/04/17 | | | | 4,868 | |
| USD | | | 1,330,000 | | | JPY | | | 150,858,814 | | | JPMorgan Chase Bank N.A. | | | 4/04/17 | | | | (25,280 | ) |
| USD | | | 665,000 | | | JPY | | | 74,345,570 | | | Morgan Stanley & Co. International PLC | | | 4/04/17 | | | | (2,903 | ) |
| USD | | | 500,000 | | | JPY | | | 55,390,200 | | | Royal Bank of Canada | | | 4/04/17 | | | | 2,388 | |
| USD | | | 2,530,000 | | | RUB | | | 141,999,908 | | | BNP Paribas S.A. | | | 4/04/17 | | | | 9,195 | |
| USD | | | 1,330,000 | | | SEK | | | 11,926,407 | | | Barclays Bank PLC | | | 4/04/17 | | | | (1,223 | ) |
| USD | | | 500,000 | | | SEK | | | 4,405,172 | | | Barclays Bank PLC | | | 4/04/17 | | | | 8,296 | |
| USD | | | 665,000 | | | SEK | | | 5,980,846 | | | Royal Bank of Canada | | | 4/04/17 | | | | (2,581 | ) |
| USD | | | 2,495,000 | | | TRY | | | 9,076,201 | | | Citibank N.A. | | | 4/04/17 | | | | 595 | |
| USD | | | 2,495,000 | | | ZAR | | | 32,247,950 | | | Standard Chartered Bank | | | 4/04/17 | | | | 93,015 | |
| ZAR | | | 6,256,259 | | | USD | | | 500,000 | | | Barclays Bank PLC | | | 4/04/17 | | | | (34,003 | ) |
| ZAR | | | 8,755,973 | | | USD | | | 665,000 | | | Morgan Stanley & Co. International PLC | | | 4/04/17 | | | | (12,812 | ) |
| ZAR | | | 17,598,548 | | | USD | | | 1,330,000 | | | TD Securities, Inc. | | | 4/04/17 | | | | (19,174 | ) |
| BRL | | | 1,557,500 | | | USD | | | 500,000 | | | Royal Bank of Scotland PLC | | | 4/05/17 | | | | (3,059 | ) |
| BRL | | | 2,094,085 | | | USD | | | 665,000 | | | Royal Bank of Scotland PLC | | | 4/05/17 | | | | 3,146 | |
| BRL | | | 4,161,570 | | | USD | | | 1,330,000 | | | State Street Bank and Trust Co. | | | 4/05/17 | | | | (2,196 | ) |
| COP | | | 1,464,500,000 | | | USD | | | 500,000 | | | BNP Paribas S.A. | | | 4/05/17 | | | | 9,041 | |
| COP | | | 3,882,270,000 | | | USD | | | 1,330,000 | | | Citibank N.A. | | | 4/05/17 | | | | 19,425 | |
| COP | | | 1,953,770,000 | | | USD | | | 665,000 | | | Royal Bank of Scotland PLC | | | 4/05/17 | | | | 14,104 | |
| EUR | | | 4,586,000 | | | USD | | | 4,841,187 | | | Citibank N.A. | | | 4/05/17 | | | | 52,269 | |
| GBP | | | 90,500,000 | | | USD | | | 113,390,826 | | | JPMorgan Chase Bank N.A. | | | 4/05/17 | | | | 9,729 | |
| MXN | | | 66,295,615 | | | USD | | | 3,228,000 | | | Citibank N.A. | | | 4/05/17 | | | | 310,267 | |
| USD | | | 186,716,122 | | | EUR | | | 175,876,000 | | | Bank of America N.A. | | | 4/05/17 | | | | (951,004 | ) |
| USD | | | 4,848,643 | | | EUR | | | 4,586,000 | | | Citibank N.A. | | | 4/05/17 | | | | (44,813 | ) |
| USD | | | 4,095,981 | | | GBP | | | 3,332,000 | | | Credit Suisse International | | | 4/05/17 | | | | (79,165 | ) |
| USD | | | 17,265,293 | | | GBP | | | 13,823,000 | | | State Street Bank and Trust Co. | | | 4/05/17 | | | | (55,545 | ) |
| USD | | | 464,872 | | | GBP | | | 382,000 | | | State Street Bank and Trust Co. | | | 4/05/17 | | | | (13,791 | ) |
| USD | | | 4,236,886 | | | JPY | | | 484,346,000 | | | Morgan Stanley & Co. International PLC | | | 4/05/17 | | | | (114,540 | ) |
| USD | | | 922,286 | | | MXN | | | 18,423,856 | | | Deutsche Bank AG | | | 4/05/17 | | | | (61,015 | ) |
| USD | | | 1,383,429 | | | MXN | | | 27,626,341 | | | Royal Bank of Scotland PLC | | | 4/05/17 | | | | (91,018 | ) |
| USD | | | 922,286 | | | MXN | | | 18,421,182 | | | UBS AG | | | 4/05/17 | | | | (60,872 | ) |
| MXN | | | 55,164,454 | | | USD | | | 2,773,000 | | | Barclays Bank PLC | | | 4/06/17 | | | | 170,729 | |
| MXN | | | 43,182,667 | | | USD | | | 2,010,000 | | | Goldman Sachs International | | | 4/06/17 | | | | 294,348 | |
| MXN | | | 44,160,737 | | | USD | | | 2,010,000 | | | Goldman Sachs International | | | 4/06/17 | | | | 346,540 | |
| USD | | | 1,455,643 | | | MXN | | | 27,382,826 | | | Bank of America N.A. | | | 4/06/17 | | | | (5,581 | ) |
| USD | | | 2,391,500 | | | MXN | | | 47,402,878 | | | Barclays Bank PLC | | | 4/06/17 | | | | (138,050 | ) |
| USD | | | 970,429 | | | MXN | | | 18,280,186 | | | Barclays Bank PLC | | | 4/06/17 | | | | (5,053 | ) |
| USD | | | 970,429 | | | MXN | | | 18,280,545 | | | BNP Paribas S.A. | | | 4/06/17 | | | | (5,072 | ) |
See Notes to Consolidated Financial Statements.
| | | | | | |
| 76 | | BLACKROCK BALANCED CAPITAL FUND, INC. | | MARCH 31, 2017 | | |
| | | | |
| Consolidated Schedule of Investments (continued) | | | Master Total Return Portfolio | |
| | | | | | | | | | | | | | | | | | | | |
Currency
Purchased | | | Currency
Sold | | | Counterparty | | Settlement Date | | | Unrealized Appreciation (Depreciation) | |
| USD | | | 2,010,000 | | | MXN | | | 42,802,950 | | | Goldman Sachs International | | | 4/06/17 | | | | $(274,085 | ) |
| USD | | | 2,391,500 | | | MXN | | | 47,006,128 | | | Goldman Sachs International | | | 4/06/17 | | | | (116,878 | ) |
| USD | | | 970,429 | | | MXN | | | 18,287,338 | | | HSBC Bank PLC | | | 4/06/17 | | | | (5,435 | ) |
| USD | | | 970,429 | | | MXN | | | 18,272,976 | | | HSBC Bank PLC | | | 4/06/17 | | | | (4,668 | ) |
| USD | | | 970,429 | | | MXN | | | 18,260,263 | | | HSBC Bank PLC | | | 4/06/17 | | | | (3,990 | ) |
| USD | | | 485,214 | | | MXN | | | 9,128,084 | | | UBS AG | | | 4/06/17 | | | | (1,886 | ) |
| PLN | | | 9,363,403 | | | USD | | | 2,293,125 | | | Barclays Bank PLC | | | 4/07/17 | | | | 67,797 | |
| PLN | | | 1,476,642 | | | USD | | | 361,697 | | | Citibank N.A. | | | 4/07/17 | | | | 10,628 | |
| PLN | | | 3,743,898 | | | USD | | | 917,250 | | | Deutsche Bank AG | | | 4/07/17 | | | | 26,750 | |
| PLN | | | 395,899 | | | USD | | | 96,928 | | | Goldman Sachs International | | | 4/07/17 | | | | 2,896 | |
| USD | | | 3,669,000 | | | PLN | | | 14,968,247 | | | HSBC Bank PLC | | | 4/07/17 | | | | (105,147 | ) |
| AUD | | | 4,156,800 | | | JPY | | | 360,373,360 | | | Citibank N.A. | | | 4/10/17 | | | | (63,062 | ) |
| AUD | | | 4,156,800 | | | JPY | | | 354,068,450 | | | Goldman Sachs International | | | 4/10/17 | | | | (6,407 | ) |
| AUD | | | 4,156,800 | | | JPY | | | 353,752,949 | | | Goldman Sachs International | | | 4/10/17 | | | | (3,572 | ) |
| JPY | | | 358,231,776 | | | AUD | | | 4,156,800 | | | Citibank N.A. | | | 4/10/17 | | | | 43,817 | |
| JPY | | | 117,175,979 | | | AUD | | | 1,385,600 | | | HSBC Bank PLC | | | 4/10/17 | | | | (5,474 | ) |
| TRY | | | 14,553,429 | | | USD | | | 3,995,000 | | | HSBC Bank PLC | | | 4/10/17 | | | | (2,161 | ) |
| USD | | | 1,750,500 | | | TRY | | | 6,634,564 | | | Goldman Sachs International | | | 4/10/17 | | | | (69,741 | ) |
| PLN | | | 111,810,785 | | | USD | | | 27,475,819 | | | BNP Paribas S.A. | | | 4/11/17 | | | | 715,350 | |
| USD | | | 3,700,000 | | | KRW | | | 4,232,615,000 | | | Barclays Bank PLC | | | 4/11/17 | | | | (85,424 | ) |
| USD | | | 219,816 | | | PLN | | | 894,869 | | | Barclays Bank PLC | | | 4/11/17 | | | | (5,810 | ) |
| USD | | | 19,153,705 | | | PLN | | | 79,394,024 | | | BNP Paribas S.A. | | | 4/11/17 | | | | (864,134 | ) |
| USD | | | 7,537,400 | | | PLN | | | 31,521,891 | | | HSBC Bank PLC | | | 4/11/17 | | | | (410,303 | ) |
| USD | | | 2,312,500 | | | ZAR | | | 30,676,205 | | | Barclays Bank PLC | | | 4/11/17 | | | | 30,351 | |
| USD | | | 647,500 | | | ZAR | | | 8,591,294 | | | BNP Paribas S.A. | | | 4/11/17 | | | | 8,353 | |
| USD | | | 1,850,000 | | | ZAR | | | 24,587,654 | | | Citibank N.A. | | | 4/11/17 | | | | 20,807 | |
| ZAR | | | 63,556,565 | | | USD | | | 4,810,000 | | | Citibank N.A. | | | 4/11/17 | | | | (81,724 | ) |
| CLP | | | 1,009,665,835 | | | USD | | | 1,518,500 | | | BNP Paribas S.A. | | | 4/13/17 | | | | 10,577 | |
| CLP | | | 2,071,193,550 | | | USD | | | 3,108,500 | | | Credit Suisse International | | | 4/13/17 | | | | 28,196 | |
| CLP | | | 1,056,157,500 | | | USD | | | 1,590,000 | | | Royal Bank of Scotland PLC | | | 4/13/17 | | | | 9,486 | |
| JPY | | | 263,682,700 | | | USD | | | 2,391,500 | | | Morgan Stanley & Co. International PLC | | | 4/13/17 | | | | (21,772 | ) |
| USD | | | 6,217,000 | | | CLP | | | 4,106,515,010 | | | BNP Paribas S.A. | | | 4/13/17 | | | | (2,067 | ) |
| USD | | | 2,391,500 | | | JPY | | | 274,206,998 | | | Deutsche Bank AG | | | 4/13/17 | | | | (72,811 | ) |
| JPY | | | 288,878,304 | | | MXN | | | 49,738,000 | | | Bank of America N.A. | | | 4/17/17 | | | | (53,065 | ) |
| MXN | | | 45,136,802 | | | USD | | | 2,415,000 | | | Bank of America N.A. | | | 4/17/17 | | | | (10,468 | ) |
| MXN | | | 9,670,249 | | | USD | | | 512,000 | | | Goldman Sachs International | | | 4/17/17 | | | | 3,155 | |
| MXN | | | 59,331,875 | | | USD | | | 3,066,960 | | | JPMorgan Chase Bank N.A. | | | 4/17/17 | | | | 93,774 | |
| USD | | | 743,505 | | | MXN | | | 14,251,773 | | | Citibank N.A. | | | 4/17/17 | | | | (15,716 | ) |
| USD | | | 736,000 | | | MXN | | | 13,888,978 | | | Citibank N.A. | | | 4/17/17 | | | | (3,895 | ) |
| USD | | | 2,323,455 | | | MXN | | | 44,527,729 | | | Goldman Sachs International | | | 4/17/17 | | | | (48,631 | ) |
| EUR | | | 4,012,000 | | | USD | | | 4,375,716 | | | Morgan Stanley & Co. International PLC | | | 4/18/17 | | | | (92,247 | ) |
| JPY | | | 197,095,486 | | | USD | | | 1,732,000 | | | Citibank N.A. | | | 4/18/17 | | | | 39,666 | |
| USD | | | 268,302 | | | JPY | | | 30,750,000 | | | Citibank N.A. | | | 4/18/17 | | | | (8,105 | ) |
| USD | | | 808,819 | | | JPY | | | 92,700,000 | | | Royal Bank of Scotland PLC | | | 4/18/17 | | | | (24,449 | ) |
| USD | | | 2,774,000 | | | KRW | | | 3,193,983,600 | | | JPMorgan Chase Bank N.A. | | | 4/18/17 | | | | (82,796 | ) |
| USD | | | 1,562,491 | | | RUB | | | 95,296,313 | | | Barclays Bank PLC | | | 4/18/17 | | | | (123,603 | ) |
| USD | | | 828,362 | | | RUB | | | 50,314,684 | | | Barclays Bank PLC | | | 4/18/17 | | | | (61,864 | ) |
| USD | | | 263,993 | | | RUB | | | 15,958,397 | | | Barclays Bank PLC | | | 4/18/17 | | | | (18,361 | ) |
See Notes to Consolidated Financial Statements.
| | | | | | |
| | | BLACKROCK BALANCED CAPITAL FUND, INC. | | MARCH 31, 2017 | | 77 |
| | | | |
| Consolidated Schedule of Investments (continued) | | | Master Total Return Portfolio | |
| | | | | | | | | | | | | | | | | | | | |
Currency
Purchased | | | Currency
Sold | | | Counterparty | | Settlement
Date | | | Unrealized
Appreciation
(Depreciation) | |
| USD | | | 4,167,456 | | | RUB | | | 252,349,855 | | | Citibank N.A. | | | 4/18/17 | | | | $(297,412 | ) |
| USD | | | 2,833,492 | | | RUB | | | 173,466,397 | | | Citibank N.A. | | | 4/18/17 | | | | (235,677 | ) |
| USD | | | 263,906 | | | RUB | | | 15,958,397 | | | Citibank N.A. | | | 4/18/17 | | | | (18,449 | ) |
| USD | | | 131,822 | | | RUB | | | 7,983,128 | | | Citibank N.A. | | | 4/18/17 | | | | (9,425 | ) |
| USD | | | 6,605,783 | | | RUB | | | 399,517,755 | | | Credit Suisse International | | | 4/18/17 | | | | (462,951 | ) |
| USD | | | 3,212,707 | | | RUB | | | 196,649,785 | | | Credit Suisse International | | | 4/18/17 | | | | (266,650 | ) |
| USD | | | 3,216,648 | | | RUB | | | 196,649,785 | | | Credit Suisse International | | | 4/18/17 | | | | (262,709 | ) |
| USD | | | 3,256,116 | | | RUB | | | 197,600,669 | | | Credit Suisse International | | | 4/18/17 | | | | (240,065 | ) |
| USD | | | 2,340,580 | | | RUB | | | 142,447,685 | | | Credit Suisse International | | | 4/18/17 | | | | (179,771 | ) |
| USD | | | 1,573,224 | | | RUB | | | 95,439,630 | | | Credit Suisse International | | | 4/18/17 | | | | (115,405 | ) |
| USD | | | 1,214,650 | | | RUB | | | 73,217,881 | | | Credit Suisse International | | | 4/18/17 | | | | (80,806 | ) |
| USD | | | 2,859,035 | | | RUB | | | 174,401,133 | | | HSBC Bank PLC | | | 4/18/17 | | | | (226,673 | ) |
| USD | | | 2,986,053 | | | RUB | | | 180,559,159 | | | HSBC Bank PLC | | | 4/18/17 | | | | (208,610 | ) |
| USD | | | 1,564,286 | | | RUB | | | 95,296,313 | | | JPMorgan Chase Bank N.A. | | | 4/18/17 | | | | (121,807 | ) |
| USD | | | 2,401,135 | | | RUB | | | 144,704,424 | | | Morgan Stanley & Co. International PLC | | | 4/18/17 | | | | (159,144 | ) |
| USD | | | 6,583,244 | | | EUR | | | 6,132,634 | | | Goldman Sachs International | | | 4/19/17 | | | | 35,357 | |
| TRY | | | 54,002,056 | | | USD | | | 14,314,000 | | | Barclays Bank PLC | | | 4/20/17 | | | | 459,567 | |
| USD | | | 14,314,000 | | | TRY | | | 52,208,884 | | | Citibank N.A. | | | 4/20/17 | | | | 30,999 | |
| CLP | | | 1,540,395,750 | | | USD | | | 2,319,000 | | | Barclays Bank PLC | | | 4/24/17 | | | | 12,534 | |
| MXN | | | 74,558,280 | | | USD | | | 3,702,000 | | | Barclays Bank PLC | | | 4/24/17 | | | | 265,586 | |
| MXN | | | 35,513,107 | | | USD | | | 1,855,556 | | | Citibank N.A. | | | 4/24/17 | | | | 34,259 | |
| MXN | | | 44,396,231 | | | USD | | | 2,319,444 | | | Goldman Sachs International | | | 4/24/17 | | | | 43,081 | |
| MXN | | | 18,268,490 | | | USD | | | 931,600 | | | Nomura International PLC | | | 4/24/17 | | | | 40,550 | |
| MXN | | | 109,610,938 | | | USD | | | 5,589,600 | | | Nomura International PLC | | | 4/24/17 | | | | 243,298 | |
| USD | | | 1,020,000 | | | MXN | | | 20,217,856 | | | Goldman Sachs International | | | 4/24/17 | | | | (55,884 | ) |
| USD | | | 3,069,280 | | | MXN | | | 60,842,337 | | | JPMorgan Chase Bank N.A. | | | 4/24/17 | | | | (168,418 | ) |
| USD | | | 957,200 | | | ZAR | | | 12,799,228 | | | Deutsche Bank AG | | | 4/24/17 | | | | 7,139 | |
| ZAR | | | 1,170,415 | | | USD | | | 89,769 | | | Bank of America N.A. | | | 4/24/17 | | | | (2,891 | ) |
| ZAR | | | 13,003,367 | | | USD | | | 997,431 | | | Citibank N.A. | | | 4/24/17 | | | | (32,218 | ) |
| MXN | | | 47,510,700 | | | USD | | | 2,494,000 | | | Goldman Sachs International | | | 4/27/17 | | | | 33,091 | |
| USD | | | 2,494,000 | | | JPY | | | 276,678,873 | | | Goldman Sachs International | | | 4/27/17 | | | | 6,061 | |
| CLP | | | 1,544,790,000 | | | USD | | | 2,330,000 | | | Barclays Bank PLC | | | 4/28/17 | | | | 7,711 | |
| USD | | | 8,890,542 | | | BRL | | | 28,404,835 | | | Barclays Bank PLC | | | 5/03/17 | | | | (114,360 | ) |
| USD | | | 1,748,000 | | | BRL | | | 5,532,420 | | | UBS AG | | | 5/03/17 | | | | (5,888 | ) |
| USD | | | 4,805,701 | | | TRY | | | 17,662,699 | | | Deutsche Bank AG | | | 5/03/17 | | | | (8,069 | ) |
| USD | | | 162,586,449 | | | EUR | | | 151,896,000 | | | Morgan Stanley & Co. International PLC | | | 5/04/17 | | | | 293,090 | |
| USD | | | 4,359,173 | | | JPY | | | 484,346,000 | | | Citibank N.A. | | | 5/08/17 | | | | 2,116 | |
| USD | | | 403,577 | | | JPY | | | 44,909,000 | | | State Street Bank and Trust Co. | | | 5/08/17 | | | | (413 | ) |
| EUR | | | 2,256,481 | | | GBP | | | 1,901,462 | | | BNP Paribas S.A. | | | 5/17/17 | | | | 27,509 | |
| EUR | | | 4,162,020 | | | GBP | | | 3,564,000 | | | Goldman Sachs International | | | 5/17/17 | | | | (20,508 | ) |
| EUR | | | 591,466 | | | GBP | | | 498,538 | | | UBS AG | | | 5/17/17 | | | | 7,049 | |
| GBP | | | 473,557 | | | EUR | | | 554,784 | | | Barclays Bank PLC | | | 5/17/17 | | | | 836 | |
| GBP | | | 1,926,443 | | | EUR | | | 2,256,948 | | | BNP Paribas S.A. | | | 5/17/17 | | | | 3,325 | |
| USD | | | 1,480,000 | | | EUR | | | 1,383,819 | | | Citibank N.A. | | | 5/17/17 | | | | 507 | |
| USD | | | 3,077,348 | | | EUR | | | 2,877,360 | | | Citibank N.A. | | | 5/17/17 | | | | 1,053 | |
| USD | | | 12,606,485 | | | GBP | | | 10,092,131 | | | Citibank N.A. | | | 5/17/17 | | | | (51,954 | ) |
| CNH | | | 31,338,938 | | | USD | | | 4,485,000 | | | Bank of America N.A. | | | 5/19/17 | | | | 57,423 | |
| USD | | | 4,485,000 | | | CNH | | | 31,378,168 | | | HSBC Bank PLC | | | 5/19/17 | | | | (63,109 | ) |
See Notes to Consolidated Financial Statements.
| | | | | | |
| 78 | | BLACKROCK BALANCED CAPITAL FUND, INC. | | MARCH 31, 2017 | | |
| | | | |
| Consolidated Schedule of Investments (continued) | | | Master Total Return Portfolio | |
| | | | | | | | | | | | | | | | | | | | |
Currency
Purchased | | | Currency
Sold | | | Counterparty | | Settlement
Date | | | Unrealized
Appreciation
(Depreciation) | |
| USD | | | 7,479,259 | | | MXN | | | 155,056,255 | | | Royal Bank of Scotland PLC | | | 5/23/17 | | | | $ (733,210 | ) |
| USD | | | 1,496,000 | | | ZAR | | | 19,491,103 | | | HSBC Bank PLC | | | 5/23/17 | | | | 56,785 | |
| ZAR | | | 17,967,681 | | | USD | | | 1,366,000 | | | JPMorgan Chase Bank N.A. | | | 5/23/17 | | | | (39,274 | ) |
| AUD | | | 2,240,000 | | | USD | | | 1,696,300 | | | Citibank N.A. | | | 6/01/17 | | | | 13,088 | |
| BRL | | | 1,349,670 | | | USD | | | 420,000 | | | BNP Paribas S.A. | | | 6/01/17 | | | | 4,865 | |
| USD | | | 879,810 | | | CNH | | | 6,118,497 | | | HSBC Bank PLC | | | 6/14/17 | | | | (5,325 | ) |
| USD | | | 567,643 | | | CNH | | | 3,947,582 | | | HSBC Bank PLC | | | 6/14/17 | | | | (3,436 | ) |
| USD | | | 858,990 | | | EUR | | | 800,000 | | | Royal Bank of Scotland PLC | | | 6/14/17 | | | | 2,447 | |
| USD | | | 3,092,152 | | | EUR | | | 2,879,804 | | | Royal Bank of Scotland PLC | | | 6/14/17 | | | | 8,809 | |
| USD | | | 886,749 | | | HKD | | | 6,879,275 | | | Deutsche Bank AG | | | 6/14/17 | | | | 122 | |
| USD | | | 4,777,527 | | | JPY | | | 546,551,500 | | | Citibank N.A. | | | 6/14/17 | | | | (146,417 | ) |
| USD | | | 2,540,059 | | | JPY | | | 290,583,971 | | | Citibank N.A. | | | 6/14/17 | | | | (77,845 | ) |
| USD | | | 545,358 | | | JPY | | | 62,346,000 | | | JPMorgan Chase Bank N.A. | | | 6/14/17 | | | | (16,324 | ) |
| USD | | | 855,048 | | | KRW | | | 989,804,098 | | | JPMorgan Chase Bank N.A. | | | 6/14/17 | | | | (30,841 | ) |
| USD | | | 528,935 | | | SGD | | | 750,000 | | | HSBC Bank PLC | | | 6/14/17 | | | | (7,537 | ) |
| USD | | | 992,776 | | | TWD | | | 30,746,280 | | | BNP Paribas S.A. | | | 6/14/17 | | | | (24,033 | ) |
| JPY | | | 588,649,800 | | | USD | | | 5,300,000 | | | Credit Suisse International | | | 6/15/17 | | | | 3,466 | |
| JPY | | | 824,145,180 | | | USD | | | 7,300,000 | | | Goldman Sachs International | | | 6/15/17 | | | | 125,172 | |
| USD | | | 5,200,000 | | | JPY | | | 594,786,556 | | | HSBC Bank PLC | | | 6/15/17 | | | | (158,756 | ) |
| USD | | | 7,300,000 | | | JPY | | | 835,638,708 | | | Royal Bank of Scotland PLC | | | 6/15/17 | | | | (228,724 | ) |
| USD | | | 6,588,630 | | | RUB | | | 390,491,624 | | | Credit Suisse International | | | 6/16/17 | | | | (225,192 | ) |
| USD | | | 6,661,087 | | | RUB | | | 392,787,652 | | | Credit Suisse International | | | 6/16/17 | | | | (192,799 | ) |
| USD | | | 3,291,661 | | | RUB | | | 194,527,261 | | | Credit Suisse International | | | 6/16/17 | | | | (102,712 | ) |
| USD | | | 3,295,536 | | | RUB | | | 194,527,260 | | | Credit Suisse International | | | 6/16/17 | | | | (98,837 | ) |
| USD | | | 1,717,337 | | | RUB | | | 101,242,169 | | | Credit Suisse International | | | 6/16/17 | | | | (49,272 | ) |
| USD | | | 776,700 | | | RUB | | | 45,733,634 | | | Credit Suisse International | | | 6/16/17 | | | | (21,322 | ) |
| USD | | | 3,349,260 | | | RUB | | | 198,167,328 | | | Goldman Sachs International | | | 6/16/17 | | | | (108,630 | ) |
| USD | | | 3,554,421 | | | RUB | | | 209,284,335 | | | Goldman Sachs International | | | 6/16/17 | | | | (97,453 | ) |
| USD | | | 1,656,735 | | | RUB | | | 97,813,639 | | | Goldman Sachs International | | | 6/16/17 | | | | (50,049 | ) |
| USD | | | 641,723 | | | RUB | | | 38,131,200 | | | Goldman Sachs International | | | 6/16/17 | | | | (23,641 | ) |
| USD | | | 88,026 | | | RUB | | | 5,197,048 | | | Goldman Sachs International | | | 6/16/17 | | | | (2,659 | ) |
| TRY | | | 101,856,000 | | | USD | | | 25,308,354 | | | Royal Bank of Scotland PLC | | | 6/19/17 | | | | 2,073,689 | |
| TRY | | | 101,856,000 | | | USD | | | 25,260,652 | | | Royal Bank of Scotland PLC | | | 6/19/17 | | | | 2,121,392 | |
| USD | | | 25,862,936 | | | TRY | | | 101,856,000 | | | Citibank N.A. | | | 6/19/17 | | | | (1,519,108 | ) |
| USD | | | 25,824,248 | | | TRY | | | 101,856,000 | | | Royal Bank of Scotland PLC | | | 6/19/17 | | | | (1,557,795 | ) |
| AUD | | | 880,000 | | | NOK | | | 5,705,084 | | | BNP Paribas S.A. | | | 6/21/17 | | | | 6,262 | |
| AUD | | | 1,840,000 | | | USD | | | 1,394,897 | | | BNP Paribas S.A. | | | 6/21/17 | | | | 8,707 | |
| AUD | | | 5,800,000 | | | USD | | | 4,389,034 | | | BNP Paribas S.A. | | | 6/21/17 | | | | 35,367 | |
| AUD | | | 440,000 | | | USD | | | 335,685 | | | Royal Bank of Scotland PLC | | | 6/21/17 | | | | (41 | ) |
| AUD | | | 1,120,000 | | | USD | | | 841,784 | | | Royal Bank of Scotland PLC | | | 6/21/17 | | | | 12,583 | |
| BRL | | | 32,053 | | | USD | | | 10,000 | | | BNP Paribas S.A. | | | 6/21/17 | | | | 46 | |
| BRL | | | 2,189,025 | | | USD | | | 690,000 | | | Goldman Sachs International | | | 6/21/17 | | | | (3,951 | ) |
| CAD | | | 1,268,093 | | | EUR | | | 880,000 | | | BNP Paribas S.A. | | | 6/21/17 | | | | 12,124 | |
| CAD | | | 633,899 | | | EUR | | | 440,000 | | | UBS AG | | | 6/21/17 | | | | 5,951 | |
| CAD | | | 5,600,000 | | | MXN | | | 84,249,200 | | | Deutsche Bank AG | | | 6/21/17 | | | | (227,018 | ) |
| CAD | | | 2,150,000 | | | MXN | | | 31,998,450 | | | Deutsche Bank AG | | | 6/21/17 | | | | (68,848 | ) |
| CAD | | | 3,425,000 | | | MXN | | | 49,670,816 | | | JPMorgan Chase Bank N.A. | | | 6/21/17 | | | | (40,937 | ) |
| CAD | | | 1,700,000 | | | MXN | | | 24,721,400 | | | Morgan Stanley & Co. International PLC | | | 6/21/17 | | | | (23,867 | ) |
See Notes to Consolidated Financial Statements.
| | | | | | |
| | | BLACKROCK BALANCED CAPITAL FUND, INC. | | MARCH 31, 2017 | | 79 |
| | | | |
| Consolidated Schedule of Investments (continued) | | | Master Total Return Portfolio | |
| | | | | | | | | | | | | | | | | | | | |
Currency
Purchased | | | Currency
Sold | | | Counterparty | | Settlement
Date | | | Unrealized
Appreciation
(Depreciation) | |
| CAD | | | 1,173,346 | | | USD | | | 880,000 | | | Bank of America N.A. | | | 6/21/17 | | | | $ 3,341 | |
| CAD | | | 1,177,836 | | | USD | | | 880,000 | | | BNP Paribas S.A. | | | 6/21/17 | | | | 6,721 | |
| CAD | | | 1,196,823 | | | USD | | | 890,000 | | | HSBC Bank PLC | | | 6/21/17 | | | | 11,016 | |
| CHF | | | 868,878 | | | USD | | | 880,000 | | | Morgan Stanley & Co. International PLC | | | 6/21/17 | | | | (8,164 | ) |
| CHF | | | 686,792 | | | USD | | | 690,000 | | | UBS AG | | | 6/21/17 | | | | (870 | ) |
| EUR | | | 660,000 | | | CAD | | | 944,460 | | | UBS AG | | | 6/21/17 | | | | (4,117 | ) |
| EUR | | | 660,000 | | | CAD | | | 939,550 | | | UBS AG | | | 6/21/17 | | | | (420 | ) |
| EUR | | | 880,000 | | | JPY | | | 106,829,967 | | | Deutsche Bank AG | | | 6/21/17 | | | | (20,220 | ) |
| EUR | | | 690,000 | | | JPY | | | 83,772,003 | | | JPMorgan Chase Bank N.A. | | | 6/21/17 | | | | (15,922 | ) |
| EUR | | | 1,140,000 | | | RUB | | | 72,874,500 | | | JPMorgan Chase Bank N.A. | | | 6/21/17 | | | | (49,284 | ) |
| EUR | | | 740,000 | | | RUB | | | 46,373,950 | | | JPMorgan Chase Bank N.A. | | | 6/21/17 | | | | (15,770 | ) |
| EUR | | | 400,000 | | | RUB | | | 25,192,600 | | | JPMorgan Chase Bank N.A. | | | 6/21/17 | | | | (10,714 | ) |
| EUR | | | 1,780,000 | | | SEK | | | 16,905,707 | | | UBS AG | | | 6/21/17 | | | | 12,131 | |
| EUR | | | 880,000 | | | USD | | | 949,846 | | | Bank of America N.A. | | | 6/21/17 | | | | (7,300 | ) |
| EUR | | | 4,974,000 | | | USD | | | 5,366,444 | | | Deutsche Bank AG | | | 6/21/17 | | | | (38,914 | ) |
| EUR | | | 21,000,000 | | | USD | | | 22,786,913 | | | Morgan Stanley & Co. International PLC | | | 6/21/17 | | | | (294,328 | ) |
| GBP | | | 440,000 | | | USD | | | 544,806 | | | Royal Bank of Scotland PLC | | | 6/21/17 | | | | 7,591 | |
| GBP | | | 880,000 | | | USD | | | 1,072,338 | | | State Street Bank and Trust Co. | | | 6/21/17 | | | | 32,457 | |
| JPY | | | 113,856,008 | | | SEK | | | 8,890,000 | | | Citibank N.A. | | | 6/21/17 | | | | 29,909 | |
| JPY | | | 97,291,568 | | | USD | | | 880,000 | | | Deutsche Bank AG | | | 6/21/17 | | | | (3,195 | ) |
| JPY | | | 154,689,790 | | | USD | | | 1,350,000 | | | State Street Bank and Trust Co. | | | 6/21/17 | | | | 44,085 | |
| MXN | | | 17,630,452 | | | USD | | | 880,000 | | | Bank of America N.A. | | | 6/21/17 | | | | 49,750 | |
| MXN | | | 1,924,227,375 | | | USD | | | 97,375,000 | | | Nomura International PLC | | | 6/21/17 | | | | 4,099,977 | |
| NOK | | | 5,748,054 | | | AUD | | | 880,000 | | | JPMorgan Chase Bank N.A. | | | 6/21/17 | | | | (1,253 | ) |
| NOK | | | 1,404,941 | | | AUD | | | 215,000 | | | Morgan Stanley & Co. International PLC | | | 6/21/17 | | | | (238 | ) |
| NOK | | | 2,875,565 | | | AUD | | | 440,000 | | | UBS AG | | | 6/21/17 | | | | (447 | ) |
| NOK | | | 1,470,464 | | | AUD | | | 225,000 | | | UBS AG | | | 6/21/17 | | | | (229 | ) |
| NOK | | | 4,702,756 | | | USD | | | 551,555 | | | Goldman Sachs International | | | 6/21/17 | | | | (3,367 | ) |
| NOK | | | 4,050,155 | | | USD | | | 475,000 | | | Goldman Sachs International | | | 6/21/17 | | | | (2,884 | ) |
| NOK | | | 7,576,380 | | | USD | | | 880,000 | | | JPMorgan Chase Bank N.A. | | | 6/21/17 | | | | 3,159 | |
| NZD | | | 2,325,986 | | | AUD | | | 2,138,889 | | | Bank of America N.A. | | | 6/21/17 | | | | (4,539 | ) |
| NZD | | | 1,215,081 | | | AUD | | | 1,115,000 | | | Bank of America N.A. | | | 6/21/17 | | | | (584 | ) |
| NZD | | | 2,326,315 | | | AUD | | | 2,138,889 | | | Deutsche Bank AG | | | 6/21/17 | | | | (4,308 | ) |
| NZD | | | 2,326,322 | | | AUD | | | 2,138,889 | | | Royal Bank of Canada | | | 6/21/17 | | | | (4,303 | ) |
| NZD | | | 1,395,652 | | | AUD | | | 1,283,333 | | | Royal Bank of Canada | | | 6/21/17 | | | | (2,681 | ) |
| NZD | | | 2,700,000 | | | USD | | | 1,862,831 | | | HSBC Bank PLC | | | 6/21/17 | | | | 25,863 | |
| RUB | | | 73,929,000 | | | EUR | | | 1,140,000 | | | BNP Paribas S.A. | | | 6/21/17 | | | | 67,665 | |
| RUB | | | 220,521,420 | | | USD | | | 3,855,000 | | | Société Générale | | | 6/21/17 | | | | (10,987 | ) |
| RUB | | | 97,246,800 | | | USD | | | 1,700,000 | | | Société Générale | | | 6/21/17 | | | | (4,845 | ) |
| SEK | | | 12,826,746 | | | EUR | | | 1,350,000 | | | BNP Paribas S.A. | | | 6/21/17 | | | | (8,640 | ) |
| SEK | | | 17,027,747 | | | EUR | | | 1,780,000 | | | UBS AG | | | 6/21/17 | | | | 1,545 | |
| SEK | | | 8,890,000 | | | JPY | | | 113,083,467 | | | Citibank N.A. | | | 6/21/17 | | | | (22,947 | ) |
| USD | | | 1,619,402 | | | AUD | | | 2,140,000 | | | Goldman Sachs International | | | 6/21/17 | | | | (13,049 | ) |
| USD | | | 4,198,249 | | | AUD | | | 5,500,000 | | | Royal Bank of Scotland PLC | | | 6/21/17 | | | | 2,696 | |
| USD | | | 1,699,219 | | | AUD | | | 2,240,000 | | | Westpac Banking Corp. | | | 6/21/17 | | | | (9,515 | ) |
| USD | | | 1,120,000 | | | BRL | | | 3,561,600 | | | Citibank N.A. | | | 6/21/17 | | | | 3,781 | |
| USD | | | 1,350,000 | | | CHF | | | 1,355,566 | | | Royal Bank of Scotland PLC | | | 6/21/17 | | | | (10,182 | ) |
| USD | | | 1,120,000 | | | CHF | | | 1,116,287 | | | UBS AG | | | 6/21/17 | | | | (88 | ) |
See Notes to Consolidated Financial Statements.
| | | | | | |
| 80 | | BLACKROCK BALANCED CAPITAL FUND, INC. | | MARCH 31, 2017 | | |
| | | | |
| Consolidated Schedule of Investments (continued) | | | Master Total Return Portfolio | |
| | | | | | | | | | | | | | | | | | | | | | | | | | |
Currency
Purchased | | | Currency
Sold | | | Counterparty | | Settlement
Date | | | Unrealized
Appreciation
(Depreciation) | |
| USD | | | 37,954,000 | | | | CNH | | | | 264,197,794 | | | BNP Paribas S.A. | | | 6/21/17 | | | | | | | $ | (246,567 | ) |
| USD | | | 4,067,966 | | | | EUR | | | | 3,828,000 | | | Goldman Sachs International | | | 6/21/17 | | | | | | | | (32,111 | ) |
| USD | | | 946,502 | | | | EUR | | | | 880,000 | | | JPMorgan Chase Bank N.A. | | | 6/21/17 | | | | | | | | 3,955 | |
| USD | | | 540,806 | | | | GBP | | | | 440,000 | | | Bank of America N.A. | | | 6/21/17 | | | | | | | | (11,591 | ) |
| USD | | | 540,716 | | | | GBP | | | | 440,000 | | | BNP Paribas S.A. | | | 6/21/17 | | | | | | | | (11,681 | ) |
| USD | | | 1,077,716 | | | | GBP | | | | 880,000 | | | JPMorgan Chase Bank N.A. | | | 6/21/17 | | | | | | | | (27,078 | ) |
| USD | | | 1,350,000 | | | | JPY | | | | 151,937,100 | | | JPMorgan Chase Bank N.A. | | | 6/21/17 | | | | | | | | (19,278 | ) |
| USD | | | 1,350,000 | | | | KRW | | | | 1,532,520,000 | | | JPMorgan Chase Bank N.A. | | | 6/21/17 | | | | | | | | (21,743 | ) |
| USD | | | 440,000 | | | | KRW | | | | 492,448,000 | | | JPMorgan Chase Bank N.A. | | | 6/21/17 | | | | | | | | (785 | ) |
| USD | | | 49,165,000 | | | | MXN | | | | 959,087,221 | | | Goldman Sachs International | | | 6/21/17 | | | | | | | | (1,412,887 | ) |
| USD | | | 48,210,000 | | | | MXN | | | | 961,042,245 | | | Morgan Stanley & Co. International PLC | | | 6/21/17 | | | | | | | | (2,470,986 | ) |
| USD | | | 880,000 | | | | MXN | | | | 16,906,338 | | | Morgan Stanley & Co. International PLC | | | 6/21/17 | | | | | | | | (11,563 | ) |
| USD | | | 880,000 | | | | MXN | | | | 17,452,160 | | | Nomura International PLC | | | 6/21/17 | | | | | | | | (40,347 | ) |
| USD | | | 880,000 | | | | NOK | | | | 7,471,877 | | | Morgan Stanley & Co. International PLC | | | 6/21/17 | | | | | | | | 9,022 | |
| USD | | | 1,026,555 | | | | NOK | | | | 8,666,179 | | | Morgan Stanley & Co. International PLC | | | 6/21/17 | | | | | | | | 16,361 | |
| USD | | | 3,855,000 | | | | RUB | | | | 220,351,800 | | | Deutsche Bank AG | | | 6/21/17 | | | | | | | | 13,944 | |
| USD | | | 1,700,000 | | | | RUB | | | | 102,743,750 | | | JPMorgan Chase Bank N.A. | | | 6/21/17 | | | | | | | | (90,975 | ) |
| TRY | | | 20,990,105 | | | | USD | | | | 5,338,820 | | | Citibank N.A. | | | 6/28/17 | | | | | | | | 290,669 | |
| TRY | | | 67,094,739 | | | | USD | | | | 17,321,477 | | | HSBC Bank PLC | | | 6/28/17 | | | | | | | | 673,150 | |
| TRY | | | 14,439,769 | | | | USD | | | | 3,727,065 | | | Royal Bank of Scotland PLC | | | 6/28/17 | | | | | | | | 145,641 | |
| USD | | | 25,986,326 | | | | TRY | | | | 101,856,000 | | | Citibank N.A. | | | 6/28/17 | | | | | | | | (1,331,177 | ) |
| USD | | | 174,356 | | | | TRY | | | | 668,613 | | | Goldman Sachs International | | | 6/28/17 | | | | | | | | (4,964 | ) |
| MXN | | | 40,182,660 | | | | USD | | | | 2,100,000 | | | TD Securities, Inc. | | | 6/30/17 | | | | | | | | 16,281 | |
| RUB | | | 121,926,000 | | | | USD | | | | 2,100,000 | | | Société Générale | | | 6/30/17 | | | | | | | | 21,424 | |
| TRY | | | 7,803,581 | | | | USD | | | | 2,100,000 | | | Morgan Stanley & Co. International PLC | | | 6/30/17 | | | | | | | | (8,246 | ) |
| USD | | | 2,600,000 | | | | CAD | | | | 3,469,508 | | | JPMorgan Chase Bank N.A. | | | 6/30/17 | | | | | | | | (12,346 | ) |
| USD | | | 2,600,000 | | | | EUR | | | | 2,384,569 | | | JPMorgan Chase Bank N.A. | | | 6/30/17 | | | | | | | | 44,730 | |
| USD | | | 2,600,000 | | | | JPY | | | | 286,130,000 | | | Goldman Sachs International | | | 6/30/17 | | | | | | | | 20,245 | |
| ZAR | | | 27,478,640 | | | | USD | | | | 2,100,000 | | | BNP Paribas S.A. | | | 6/30/17 | | | | | | | | (84,344 | ) |
| BRL | | | 6,716,850 | | | | USD | | | | 2,100,000 | | | Royal Bank of Scotland PLC | | | 7/05/17 | | | | | | | | (1,270 | ) |
| RUB | | | 132,444,725 | | | | USD | | | | 2,135,000 | | | Société Générale | | | 8/07/17 | | | | | | | | 151,069 | |
| USD | | | 2,135,000 | | | | RUB | | | | 132,583,500 | | | Deutsche Bank AG | | | 8/07/17 | | | | | | | | (153,465 | ) |
| USD | | | 2,510,000 | | | | JPY | | | | 280,211,882 | | | Citibank N.A. | | | 11/14/17 | | | | | | | | (34,142 | ) |
| USD | | | 3,825,000 | | | | JPY | | | | 425,756,925 | | | Goldman Sachs International | | | 11/14/17 | | | | | | | | (40,596 | ) |
| USD | | | 3,765,000 | | | | JPY | | | | 420,492,556 | | | Morgan Stanley & Co. International PLC | | | 11/14/17 | | | | | | | | (52,799 | ) |
| HKD | | | 132,970,084 | | | | USD | | | | 16,790,000 | | | Goldman Sachs International | | | 1/19/18 | | | | | | | | 384,634 | |
| USD | | | 16,790,000 | | | | HKD | | | | 131,339,775 | | | Goldman Sachs International | | | 1/19/18 | | | | | | | | (174,060 | ) |
| USD | | | 5,500,000 | | | | INR | | | | 371,030,000 | | | JPMorgan Chase Bank N.A. | | | 2/20/18 | | | | | | | | 24,103 | |
| USD | | | 314,596 | | | | EUR | | | | 291,624 | | | Citibank N.A. | | | 2/21/18 | | | | | | | | (2,089 | ) |
| USD | | | 510,583 | | | | EUR | | | | 474,917 | | | Deutsche Bank AG | | | 2/21/18 | | | | | | | | (5,145 | ) |
| USD | | | 515,161 | | | | EUR | | | | 479,196 | | | Morgan Stanley & Co. International PLC | | | 2/21/18 | | | | | | | | (5,214 | ) |
| Total | | | | | | | | | | | | | | | | | | | | | | | | $ | (5,699,629 | ) |
| | | | | | | | | | | | | | | | | | | | | | | | | | |
| | | | | | | | | | | | |
Exchange-Traded Options Purchased | | | | | | | | | | | | |
| | | | | | | | | | | | | | | | | | | | |
| Description | | Put/
Call | | | Expiration
Date | | Strike Price | | | Contracts | | Value | |
Apple Inc. | | | Call | | | 4/21/17 | | | USD | | | | 145.00 | | | 419 | | $ | 56,356 | |
EURO STOXX 50 Index | | | Call | | | 4/21/17 | | | EUR | | | | 3,500.00 | | | 3,600 | | | 1,321,129 | |
Market Vector Russia ETF Trust | | | Call | | | 8/18/17 | | | USD | | | | 22.00 | | | 2,080 | | | 157,040 | |
See Notes to Consolidated Financial Statements.
| | | | | | |
| | | BLACKROCK BALANCED CAPITAL FUND, INC. | | MARCH 31, 2017 | | 81 |
| | | | |
| Consolidated Schedule of Investments (continued) | | | Master Total Return Portfolio | |
| | | | | | | | | | | | | | | | | | | | | | | | |
| Description | | Put/
Call | | | Expiration
Date | | | Strike Price | | | Contracts | | | Value | |
SPDR S&P 500 ETF Trust | | | Call | | | | 1/19/18 | | | | USD | | | | 280.00 | | | | 3,532 | | | $ | 52,980 | |
SPDR S&P 500 ETF Trust | | | Call | | | | 1/19/18 | | | | USD | | | | 270.00 | | | | 1,678 | | | | 70,476 | |
SPDR S&P 500 ETF Trust | | | Call | | | | 6/15/18 | | | | USD | | | | 300.00 | | | | 1,757 | | | | 17,570 | |
SPDR S&P 500 ETF Trust | | | Call | | | | 1/18/19 | | | | USD | | | | 310.00 | | | | 1,683 | | | | 50,490 | |
SPDR S&P 500 ETF Trust | | | Call | | | | 12/20/19 | | | | USD | | | | 350.00 | | | | 1,672 | | | | 41,800 | |
Euro Dollar Future | | | Put | | | | 4/13/17 | | | | USD | | | | 97.50 | | | | 7,541 | | | | 565,575 | |
EURO STOXX 50 Index | | | Put | | | | 4/21/17 | | | | EUR | | | | 3,375.00 | | | | 851 | | | | 70,812 | |
EURO STOXX 50 Index | | | Put | | | | 4/21/17 | | | | EUR | | | | 3,400.00 | | | | 296 | | | | 34,735 | |
EURO STOXX 50 Index | | | Put | | | | 4/21/17 | | | | EUR | | | | 3,450.00 | | | | 166 | | | | 38,605 | |
EURO STOXX Banks Index | | | Put | | | | 4/21/17 | | | | EUR | | | | 115.00 | | | | 427 | | | | 4,555 | |
U.S. Treasury Notes (10 Year) Future | | | Put | | | | 4/21/17 | | | | USD | | | | 124.00 | | | | 2,484 | | | | 659,813 | |
U.S. Treasury Notes (10 Year) Future | | | Put | | | | 4/21/17 | | | | USD | | | | 123.00 | | | | 2,219 | | | | 173,359 | |
S&P 500 Index | | | Put | | | | 6/16/17 | | | | USD | | | | 2,365.00 | | | | 130 | | | | 629,850 | |
SPDR S&P Oil & Gas Explore & Production ETF | | | Put | | | | 6/16/17 | | | | USD | | | | 34.00 | | | | 884 | | | | 68,510 | |
Total | | | | | | | | | | | | | | | | | | | | | | $ | 4,013,655 | |
| | | | | | | | | | | | | | | | | | | | | | | | |
| | 1 | | All or a portion of the security is held by a wholly-owned subsidiary. See Note 1 of the Notes to Consolidated Financial Statements for details on the wholly-owned subsidiary. |
| | | | | | | | | | | | | | | | | | | | | | | | | | | | | | | | | | | | | | | | | | |
| OTC Barrier Options Purchased | |
| Description | | Put/
Call | | | Type of Option | | | Counterparty | | Expiration Date | | | Strike Price | | | Barrier Price | | | Notional Amount (000) | | | Value | |
USD Currency | | | Call | | | | One-Touch | | | Citibank N.A. | | | 4/27/17 | | | | CAD | | | | 1.40 | | | | CAD | | | | 1.40 | | | | USD | | | | 2,540 | | | $ | 13,226 | |
USD Currency | | | Call | | | | One-Touch | | | Citibank N.A. | | | 11/10/17 | | | | JPY | | | | 125.00 | | | | JPY | | | | 125.00 | | | | USD | | | | 5,700 | | | | 218,896 | |
Total | | | | | | | | | | | | | | | | | | | | | | | | | | | | | | | | | | | | | | | | $ | 232,122 | |
| | | | | | | | | | | | | | | | | | | | | | | | | | | | | | | | | | | | | | | | | | |
| | | | | | | | | | | | | | | | | | | | | | | | | | | | |
| OTC Options Purchased | | | | | | | | | | | | | | | | | | | | | | | |
| Description | | Put/
Call | | | Counterparty | | Expiration
Date | | Strike Price | | | Notional Amount (000) | | | Contracts | | | Value | |
USD Currency | | | Call | | | Goldman Sachs International | | 4/04/17 | | MXN | | | 21.45 | | | USD | | | 7,030 | | | | — | | | $ | 1 | |
USD Currency | | | Call | | | Morgan Stanley & Co. International PLC | | 4/06/17 | | KRW | | | 1,150.00 | | | USD | | | 3,960 | | | | — | | | | 370 | |
USD Currency | | | Call | | | Morgan Stanley & Co. International PLC | | 4/06/17 | | KRW | | | 1,185.00 | | | USD | | | 3,960 | | | | — | | | | — | |
USD Currency | | | Call | | | Bank of America N.A. | | 4/07/17 | | JPY | | | 120.00 | | | USD | | | 26,602 | | | | — | | | | 3 | |
MXN Currency | | | Call | | | Bank of America N.A. | | 4/11/17 | | JPY | | | 5.85 | | | MXN | | | 119,366 | | | | — | | | | 112,990 | |
MXN Currency | | | Call | | | JPMorgan Chase Bank N.A. | | 4/11/17 | | JPY | | | 5.60 | | | MXN | | | 119,366 | | | | — | | | | 345,642 | |
MXN Currency | | | Call | | | Morgan Stanley & Co. International PLC | | 4/11/17 | | JPY | | | 5.85 | | | MXN | | | 59,684 | | | | — | | | | 56,932 | |
Nikkei 225 Index | | | Call | | | Bank of America N.A. | | 4/14/17 | | JPY | | | 19,882.09 | | | | | | — | | | | 25 | | | | 1,829 | |
Nikkei 225 Index | | | Call | | | Citibank N.A. | | 4/14/17 | | JPY | | | 19,930.50 | | | | | | — | | | | 20 | | | | 1,177 | |
USD Currency | | | Call | | | Morgan Stanley & Co. International PLC | | 4/19/17 | | BRL | | | 3.35 | | | USD | | | 3,496 | | | | — | | | | 1,808 | |
EUR Currency | | | Call | | | BNP Paribas S.A. | | 4/25/17 | | USD | | | 1.10 | | | EUR | | | 32,000 | | | | — | | | | 34,089 | |
USD Currency | | | Call | | | Goldman Sachs International | | 5/05/17 | | TRY | | | 3.80 | | | USD | | | 3,501 | | | | — | | | | 28,051 | |
EUR Currency | | | Call | | | Bank of America N.A. | | 5/12/17 | | USD | | | 1.07 | | | EUR | | | 5,440 | | | | — | | | | 72,944 | |
Nikkei 225 Index | | | Call | | | Citibank N.A. | | 5/12/17 | | JPY | | | 20,789.41 | | | | | | — | | | | 20 | | | | 1,990 | |
Taiwan Stock Exchange Weighted Index | | | Call | | | UBS AG | | 5/17/17 | | TWD | | | 10,269.51 | | | | | | — | | | | 50 | | | | 5,918 | |
USD Currency | | | Call | | | Bank of America N.A. | | 5/17/17 | | CNH | | | 7.00 | | | USD | | | 30,500 | | | | — | | | | 49,285 | |
USD Currency | | | Call | | | Deutsche Bank AG | | 5/17/17 | | CNH | | | 7.25 | | | USD | | | 40,800 | | | | — | | | | 2,073 | |
USD Currency | | | Call | | | JPMorgan Chase Bank N.A. | | 5/19/17 | | ZAR | | | 12.80 | | | USD | | | 2,393 | | | | — | | | | 144,794 | |
EUR Currency | | | Call | | | Citibank N.A. | | 6/01/17 | | PLN | | | 4.35 | | | EUR | | | 10,700 | | | | — | | | | 45,727 | |
EUR Currency | | | Call | | | JPMorgan Chase Bank N.A. | | 6/01/17 | | PLN | | | 4.35 | | | EUR | | | 21,600 | | | | — | | | | 92,662 | |
USD Currency | | | Call | | | HSBC Bank PLC | | 6/02/17 | | KRW | | | 1,160.00 | | | USD | | | 21,550 | | | | — | | | | 115,022 | |
See Notes to Consolidated Financial Statements.
| | | | | | |
| 82 | | BLACKROCK BALANCED CAPITAL FUND, INC. | | MARCH 31, 2017 | | |
| | | | |
| Consolidated Schedule of Investments (continued) | | | Master Total Return Portfolio | |
| | | | | | | | | | | | | | | | | | | | | | | | | | | | | | | | | | |
| Description | | Put/
Call | | | Counterparty | | Expiration
Date | | | Strike Price | | | Notional Amount (000) | | | Contracts | | | Value | |
EUR Currency | | | Call | | | Goldman Sachs International | | | 6/15/17 | | | | PLN | | | | 4.35 | | | | EUR | | | | 21,400 | | | | — | | | $ | 115,996 | |
EUR Currency | | | Call | | | HSBC Bank PLC | | | 6/19/17 | | | | GBP | | | | 0.89 | | | | EUR | | | | 20,947 | | | | — | | | | 103,204 | |
USD Currency | | | Call | | | Morgan Stanley & Co. International PLC | | | 7/03/17 | | | | MXN | | | | 21.50 | | | | USD | | | | 2,510 | | | | — | | | | 6,522 | |
EUR Currency | | | Call | | | HSBC Bank PLC | | | 7/21/17 | | | | JPY | | | | 125.00 | | | | EUR | | | | 21,400 | | | | — | | | | 134,943 | |
EUR Currency | | | Call | | | HSBC Bank PLC | | | 7/28/17 | | | | GBP | | | | 0.88 | | | | EUR | | | | 10,700 | | | | — | | | | 105,907 | |
GBP Currency | | | Call | | | HSBC Bank PLC | | | 7/28/17 | | | | JPY | | | | 150.00 | | | | GBP | | | | 26,700 | | | | — | | | | 88,581 | |
GBP Currency | | | Call | | | HSBC Bank PLC | | | 7/28/17 | | | | JPY | | | | 145.00 | | | | GBP | | | | 21,400 | | | | — | | | | 218,697 | |
USD Currency | | | Call | | | Deutsche Bank AG | | | 8/11/17 | | | | CNH | | | | 7.10 | | | | USD | | | | 10,700 | | | | — | | | | 49,282 | |
AUD Currency | | | Call | | | Bank of America N.A. | | | 8/14/17 | | | | NZD | | | | 1.08 | | | | AUD | | | | 10,775 | | | | — | | | | 176,240 | |
AUD Currency | | | Call | | | Citibank N.A. | | | 8/14/17 | | | | NZD | | | | 1.08 | | | | AUD | | | | 34,000 | | | | — | | | | 552,998 | |
EUR Currency | | | Call | | | BNP Paribas S.A. | | | 9/18/17 | | | | USD | | | | 1.11 | | | | EUR | | | | 104,085 | | | | — | | | | 1,299,400 | |
EUR Currency | | | Call | | | BNP Paribas S.A. | | | 9/18/17 | | | | USD | | | | 1.11 | | | | EUR | | | | 98,355 | | | | — | | | | 1,156,095 | |
USD Currency | | | Call | | | Bank of America N.A. | | | 11/10/17 | | | | HKD | | | | 7.74 | | | | USD | | | | 20,500 | | | | — | | | | 74,970 | |
USD Currency | | | Call | | | Citibank N.A. | | | 11/10/17 | | | | JPY | | | | 118.00 | | | | USD | | | | 70,500 | | | | — | | | | 522,172 | |
USD Currency | | | Call | | | HSBC Bank PLC | | | 11/10/17 | | | | HKD | | | | 7.74 | | | | USD | | | | 20,500 | | | | — | | | | 71,598 | |
USD Currency | | | Call | | | HSBC Bank PLC | | | 2/09/18 | | | | HKD | | | | 7.75 | | | | USD | | | | 20,500 | | | | — | | | | 86,016 | |
USD Currency | | | Call | | | JPMorgan Chase Bank N.A. | | | 2/09/18 | | | | HKD | | | | 7.75 | | | | USD | | | | 20,500 | | | | — | | | | 86,016 | |
USD Currency | | | Call | | | HSBC Bank PLC | | | 3/15/18 | | | | HKD | | | | 7.75 | | | | USD | | | | 42,550 | | | | — | | | | 195,927 | |
AUD Currency | | | Put | | | BNP Paribas S.A. | | | 4/06/17 | | | | USD | | | | 0.75 | | | | AUD | | | | 6,006 | | | | — | | | | 592 | |
AUD Currency | | | Put | | | Citibank N.A. | | | 4/06/17 | | | | JPY | | | | 86.00 | | | | AUD | | | | 6,928 | | | | — | | | | 62,010 | |
EUR Currency | | | Put | | | BNP Paribas S.A. | | | 4/07/17 | | | | USD | | | | 1.03 | | | | EUR | | | | 32,940 | | | | — | | | | 61 | |
EUR Currency | | | Put | | | Morgan Stanley & Co. International PLC | | | 4/12/17 | | | | MXN | | | | 21.60 | | | | EUR | | | | 4,012 | | | | — | | | | 320,958 | |
USD Currency | | | Put | | | Goldman Sachs International | | | 4/19/17 | | | | BRL | | | | 3.09 | | | | USD | | | | 3,496 | | | | — | | | | 14,221 | |
CAD Currency | | | Put | | | JPMorgan Chase Bank N.A. | | | 4/21/17 | | | | MXN | | | | 15.25 | | | | CAD | | | | 26,700 | | | | — | | | | 1,553,983 | |
CAD Currency | | | Put | | | JPMorgan Chase Bank N.A. | | | 4/21/17 | | | | MXN | | | | 15.75 | | | | CAD | | | | 21,375 | | | | — | | | | 1,804,695 | |
EUR Currency | | | Put | | | HSBC Bank PLC | | | 5/12/17 | | | | USD | | | | 1.06 | | | | EUR | | | | 2,700 | | | | — | | | | 23,742 | |
EUR Currency | | | Put | | | HSBC Bank PLC | | | 5/12/17 | | | | USD | | | | 1.06 | | | | EUR | | | | 2,700 | | | | — | | | | 23,742 | |
USD Currency | | | Put | | | Morgan Stanley & Co. International PLC | | | 5/18/17 | | | | BRL | | | | 3.15 | | | | USD | | | | 3,496 | | | | — | | | | 54,668 | |
EUR Currency | | | Put | | | Goldman Sachs International | | | 5/22/17 | | | | MXN | | | | 20.60 | | | | EUR | | | | 4,039 | | | | — | | | | 136,918 | |
USD Currency | | | Put | | | UBS AG | | | 5/30/17 | | | | CAD | | | | 1.31 | | | | USD | | | | 32,150 | | | | — | | | | 127,914 | |
EUR Currency | | | Put | | | BNP Paribas S.A. | | | 6/01/17 | | | | USD | | | | 1.02 | | | | EUR | | | | 133,933 | | | | — | | | | 519,521 | |
AUD Currency | | | Put | | | BNP Paribas S.A. | | | 6/16/17 | | | | USD | | | | 0.74 | | | | AUD | | | | 32,100 | | | | — | | | | 145,945 | |
AUD Currency | | | Put | | | BNP Paribas S.A. | | | 6/16/17 | | | | USD | | | | 0.70 | | | | AUD | | | | 21,280 | | | | — | | | | 13,774 | |
AUD Currency | | | Put | | | BNP Paribas S.A. | | | 6/16/17 | | | | USD | | | | 0.74 | | | | AUD | | | | 16,000 | | | | — | | | | 72,745 | |
GBP Currency | | | Put | | | HSBC Bank PLC | | | 7/28/17 | | | | USD | | | | 1.22 | | | | GBP | | | | 10,700 | | | | — | | | | 129,572 | |
USD Currency | | | Put | | | BNP Paribas S.A. | | | 8/04/17 | | | | RUB | | | | 58.00 | | | | USD | | | | 21,400 | | | | — | | | | 660,035 | |
USD Currency | | | Put | | | Deutsche Bank AG | | | 8/04/17 | | | | RUB | | | | 55.00 | | | | USD | | | | 21,400 | | | | — | | | | 176,584 | |
USD Currency | | | Put | | | Société Générale | | | 8/04/17 | | | | RUB | | | | 55.00 | | | | USD | | | | 32,000 | | | | — | | | | 295,788 | |
CAD Currency | | | Put | | | JPMorgan Chase Bank N.A. | | | 8/15/17 | | | | MXN | | | | 14.00 | | | | CAD | | | | 43,000 | | | | — | | | | 531,525 | |
USD Currency | | | Put | | | Credit Suisse International | | | 9/26/17 | | | | RUB | | | | 58.34 | | | | USD | | | | 3,500 | | | | — | | | | 120,720 | |
USD Currency | | | Put | | | Deutsche Bank AG | | | 9/26/17 | | | | TRY | | | | 3.82 | | | | USD | | | | 3,500 | | | | — | | | | 148,047 | |
USD Currency | | | Put | | | JPMorgan Chase Bank N.A. | | | 2/15/18 | | | | INR | | | | 67.00 | | | | USD | | | | 21,400 | | | | — | | | | 488,322 | |
USD Currency | | | Put | | | Deutsche Bank AG | | | 2/16/18 | | | | INR | | | | 67.00 | | | | USD | | | | 21,400 | | | | — | | | | 489,317 | |
Total | | | | | | | | | | | | | | | | | | | | | | | | | | | | | | | | $ | 14,073,270 | |
| | | | | | | | | | | | | | | | | | | | | | | | | | | | | | | | | | |
See Notes to Consolidated Financial Statements.
| | | | | | |
| | | BLACKROCK BALANCED CAPITAL FUND, INC. | | MARCH 31, 2017 | | 83 |
| | | | |
| Consolidated Schedule of Investments (continued) | | | Master Total Return Portfolio | |
| | | | | | | | | | | | | | | | | | | | | | | | | | | | | | | | | | |
| OTC Interest Rate Swaptions Purchased | |
| Description | | Counterparty | | Put/
Call | | | Exercise Rate | | | Pay/Receive
Exercise Rate | | | Floating Rate
Index | | | Expiration
Date | | | Notional Amount (000) | | | Value | |
10-Year Interest Rate Swap | | Citibank N.A. | | | Put | | | | 2.50% | | | | Pay | | | | 3-month LIBOR | | | | 4/18/17 | | | | USD | | | | 33,700 | | | $ | 57,882 | |
10-Year Interest Rate Swap | | Citibank N.A. | | | Put | | | | 2.67% | | | | Pay | | | | 3-month LIBOR | | | | 6/16/17 | | | | USD | | | | 41,900 | | | | 164,309 | |
Total | | | | | | | | | | | | | | | | | | | | | | | | | | | | | | | | $ | 222,191 | |
| | | | | | | | | | | | | | | | | | | | | | | | | | | | | | | | | | |
| | | | | | | | | | | | | | | | | | | | | | | | |
Exchange-Traded Options Written | | | | | | | | | | | | | | | | | | |
| Description | | Put/
Call | | | Expiration
Date | | | Strike Price | | | Contracts | | | Value | |
iShares Russell 2000 Index ETF | | | Call | | | | 4/13/17 | | | | USD | | | | 139.00 | | | | 1,264 | | | | $(89,112 | ) |
iShares Russell 2000 Index ETF | | | Call | | | | 4/13/17 | | | | USD | | | | 138.00 | | | | 2,527 | | | | (286,815 | ) |
Market Vector Russia ETF Trust | | | Call | | | | 8/18/17 | | | | USD | | | | 25.00 | | | | 2,600 | | | | (48,100 | ) |
iShares Russell 2000 Index ETF | | | Put | | | | 4/13/17 | | | | USD | | | | 133.00 | | | | 1,264 | | | | (38,552 | ) |
iShares Russell 2000 Index ETF | | | Put | | | | 4/13/17 | | | | USD | | | | 132.00 | | | | 2,527 | | | | (58,121 | ) |
CBOE Volatility Index | | | Put | | | | 5/17/17 | | | | USD | | | | 13.50 | | | | 3,788 | | | | (530,320 | ) |
iShares iBoxx $ High Yield Corporate Bond ETF | | | Put | | | | 6/16/17 | | | | USD | | | | 85.00 | | | | 641 | | | | (45,832 | ) |
SPDR S&P Oil & Gas Explore & Production ETF | | | Put | | | | 6/16/17 | | | | USD | | | | 30.00 | | | | 1,797 | | | | (41,331 | ) |
Total | | | | | | | | | | | | | | | | | | | | | | $ | (1,138,183 | ) |
| | | | | | | | | | | | | | | | | | | | | | | | |
| | | | | | | | | | | | | | | | | | | | | | | | | | | | | | | | | | |
| OTC Barrier Options Written | | | | | | | | | | | | | | | | | |
| Description | | Put/
Call | | | Type of Option | | Counterparty | | Expiration
Date | | | Strike Price | | | Barrier Price | | | Notional Amount (000) | | | Value | |
USD Currency | | | Call | | | One-Touch | | UBS AG | | | 4/27/17 | | | CAD | | | 1.40 | | | CAD | | | 1.40 | | | USD | | | 2,540 | | | | $(13,226 | ) |
| | | | | | | | | | | | | | | | | | | | | | | | | | | | |
| OTC Options Written | | | | | | | | | | | | | | | | | | | | | | | |
| Description | | Put/
Call | | | Counterparty | | Expiration
Date | | Strike Price | | | Notional Amount (000) | | | Contracts | | | Value | |
AUD Currency | | | Call | | | BNP Paribas S.A. | | 4/06/17 | | USD | | | 0.77 | | | AUD | | | 6,006 | | | | — | | | $ | (10,896 | ) |
USD Currency | | | Call | | | Morgan Stanley & Co. International PLC | | 4/06/17 | | KRW | | | 1,185.00 | | | USD | | | 7,920 | | | | — | | | | (1 | ) |
MXN Currency | | | Call | | | JPMorgan Chase Bank N.A. | | 4/11/17 | | JPY | | | 5.85 | | | MXN | | | 179,050 | | | | — | | | | (165,530 | ) |
USD Currency | | | Call | | | Citibank N.A. | | 4/11/17 | | MXN | | | 19.21 | | | USD | | | 15,532 | | | | — | | | | (27,107 | ) |
Nikkei 225 Index | | | Call | | | Citibank N.A. | | 4/14/17 | | JPY | | | 20,898.00 | | | | | | — | | | | 20 | | | | (33 | ) |
USD Currency | | | Call | | | Goldman Sachs International | | 4/19/17 | | BRL | | | 3.35 | | | USD | | | 3,496 | | | | — | | | | (1,785 | ) |
USD Currency | | | Call | | | JPMorgan Chase Bank N.A. | | 5/05/17 | | TRY | | | 3.80 | | | USD | | | 3,501 | | | | — | | | | (28,463 | ) |
EUR Currency | | | Call | | | Bank of America N.A. | | 5/12/17 | | USD | | | 1.12 | | | EUR | | | 5,440 | | | | — | | | | (3,876 | ) |
USD Currency | | | Call | | | Bank of America N.A. | | 5/17/17 | | CNH | | | 7.25 | | | USD | | | 40,800 | | | | — | | | | (2,076 | ) |
USD Currency | | | Call | | | Deutsche Bank AG | | 5/17/17 | | CNH | | | 7.00 | | | USD | | | 30,500 | | | | — | | | | (49,230 | ) |
USD Currency | | | Call | | | Morgan Stanley & Co. International PLC | | 5/18/17 | | BRL | | | 3.30 | | | USD | | | 3,496 | | | | — | | | | (23,314 | ) |
USD Currency | | | Call | | | UBS AG | | 5/19/17 | | ZAR | | | 12.80 | | | USD | | | 2,393 | | | | — | | | | (144,885 | ) |
EUR Currency | | | Call | | | Goldman Sachs International | | 5/22/17 | | MXN | | | 21.60 | | | EUR | | | 4,039 | | | | — | | | | (17,404 | ) |
EUR Currency | | | Call | | | JPMorgan Chase Bank N.A. | | 6/01/17 | | PLN | | | 4.45 | | | EUR | | | 21,600 | | | | — | | | | (36,304 | ) |
USD Currency | | | Call | | | HSBC Bank PLC | | 6/02/17 | | KRW | | | 1,200.00 | | | USD | | | 32,330 | | | | — | | | | (55,458 | ) |
EUR Currency | | | Call | | | Goldman Sachs International | | 6/15/17 | | PLN | | | 4.50 | | | EUR | | | 21,400 | | | | — | | | | (33,941 | ) |
EUR Currency | | | Call | | | HSBC Bank PLC | | 6/19/17 | | GBP | | | 0.92 | | | EUR | | | 20,947 | | | | — | | | | (20,560 | ) |
USD Currency | | | Call | | | Goldman Sachs International | | 7/03/17 | | MXN | | | 22.60 | | | USD | | | 5,020 | | | | — | | | | (4,138 | ) |
EUR Currency | | | Call | | | HSBC Bank PLC | | 7/21/17 | | JPY | | | 130.00 | | | EUR | | | 26,700 | | | | — | | | | (37,126 | ) |
EUR Currency | | | Call | | | HSBC Bank PLC | | 7/28/17 | | GBP | | | 0.92 | | | EUR | | | 10,700 | | | | — | | | | (27,344 | ) |
GBP Currency | | | Call | | | HSBC Bank PLC | | 7/28/17 | | JPY | | | 145.00 | | | GBP | | | 21,400 | | | | — | | | | (220,161 | ) |
GBP Currency | | | Call | | | HSBC Bank PLC | | 7/28/17 | | JPY | | | 150.00 | | | GBP | | | 26,700 | | | | — | | | | (87,752 | ) |
USD Currency | | | Call | | | Deutsche Bank AG | | 8/11/17 | | CNH | | | 6.80 | | | USD | | | 10,700 | | | | — | | | | (252,817 | ) |
See Notes to Consolidated Financial Statements.
| | | | | | |
| 84 | | BLACKROCK BALANCED CAPITAL FUND, INC. | | MARCH 31, 2017 | | |
| | | | |
| Consolidated Schedule of Investments (continued) | | | Master Total Return Portfolio | |
| | | | | | | | | | | | | | | | | | | | | | | | | | | | | | | | | | |
| Description | | Put/
Call | | | Counterparty | | Expiration
Date | | | Strike Price | | | Notional Amount (000) | | | Contracts | | | Value | |
AUD Currency | | | Call | | | Bank of America N.A. | | | 8/14/17 | | | | NZD | | | | 1.12 | | | | AUD | | | | 10,775 | | | | — | | | $ | (52,642 | ) |
AUD Currency | | | Call | | | Citibank N.A. | | | 8/14/17 | | | | NZD | | | | 1.12 | | | | AUD | | | | 45,000 | | | | — | | | | (218,250 | ) |
USD Currency | | | Call | | | Citibank N.A. | | | 11/10/17 | | | | JPY | | | | 123.00 | | | | USD | | | | 140,000 | | | | — | | | | (391,849 | ) |
USD Currency | | | Call | | | Goldman Sachs International | | | 12/18/17 | | | | HKD | | | | 7.78 | | | | USD | | | | 20,500 | | | | — | | | | (48,527 | ) |
USD Currency | | | Put | | | Deutsche Bank AG | | | 4/07/17 | | | | TRY | | | | 3.80 | | | | USD | | | | 2,984 | | | | — | | | | (131,811 | ) |
USD Currency | | | Put | | | Citibank N.A. | | | 4/11/17 | | | | MXN | | | | 18.66 | | | | USD | | | | 15,532 | | | | — | | | | (77,875 | ) |
CAD Currency | | | Put | | | JPMorgan Chase Bank N.A. | | | 4/21/17 | | | | MXN | | | | 15.75 | | | | CAD | | | | 21,375 | | | | — | | | | (1,809,783 | ) |
CAD Currency | | | Put | | | JPMorgan Chase Bank N.A. | | | 4/21/17 | | | | MXN | | | | 15.25 | | | | CAD | | | | 26,700 | | | | — | | | | (1,547,575 | ) |
AUD Currency | | | Put | | | BNP Paribas S.A. | | | 6/16/17 | | | | USD | | | | 0.70 | | | | AUD | | | | 21,500 | | | | — | | | | (13,917 | ) |
AUD Currency | | | Put | | | BNP Paribas S.A. | | | 6/16/17 | | | | USD | | | | 0.70 | | | | AUD | | | | 42,800 | | | | — | | | | (27,704 | ) |
GBP Currency | | | Put | | | HSBC Bank PLC | | | 7/28/17 | | | | USD | | | | 1.17 | | | | GBP | | | | 10,700 | | | | — | | | | (43,274 | ) |
USD Currency | | | Put | | | BNP Paribas S.A. | | | 8/04/17 | | | | RUB | | | | 55.00 | | | | USD | | | | 42,800 | | | | — | | | | (353,219 | ) |
USD Currency | | | Put | | | Société Générale | | | 8/04/17 | | | | RUB | | | | 58.00 | | | | USD | | | | 21,400 | | | | — | | | | (711,771 | ) |
Total | | | | | | | | | | | | | | | | | | | | | | | | | | | | | | | | $ | (6,678,398 | ) |
| | | | | | | | | | | | | | | | | | | | | | | | | | | | | | | | | | |
| | | | | | | | | | | | | | | | | | | | | | | | |
| OTC Interest Rate Swaptions Written | | | | | | | | | | | | | | | | | | | |
| Description | | Counterparty | | Put/
Call | | | Exercise Rate | | Pay/Receive
Exercise Rate | | Floating Rate
Index | | Expiration
Date | | Notional Amount (000) | | | Value | |
30-Year Interest Rate Swap | | Citibank N.A. | | | Put | | | 2.80% | | Receive | | 3-month LIBOR | | 4/20/17 | | USD | | | 16,900 | | | | $(41,080 | ) |
| | 1 | | Using S&P’s rating of the issuer or the underlying securities of the index, as applicable. |
| | 2 | | The maximum potential amount the Master Portfolio may pay should a negative credit event take place as defined under the terms of the agreement. |
| | | | | | | | | | | | | | | | | | | | |
Centrally Cleared Credit Default Swaps — Buy Protection | | | | | | | | | | | | |
| Index | | Pay
Fixed
Rate | | | Expiration
Date | | | Notional Amount (000) | | | Unrealized
Appreciation
(Depreciation) | |
ITRAXX.FINSR.25.V1 | | | 1.00% | | | | 6/20/21 | | | | EUR | | | | 2,000 | | | | $ 233 | |
ITRAXX.FINSR.27.V1 | | | 1.00% | | | | 6/20/22 | | | | EUR | | | | 13,640 | | | | (27,191 | ) |
ITRAXX.XO.27.V1 | | | 5.00% | | | | 6/20/22 | | | | EUR | | | | 62,110 | | | | (331,841 | ) |
CDX.NA.IG.28.V1 | | | 1.00% | | | | 6/20/22 | | | | USD | | | | 99,571 | | | | (102,867 | ) |
Total | | | | | | | | | | | | | | | | | | | $(461,666 | ) |
| | | | | | | | | | | | | | | | | | | | |
| | | | | | | | | | | | | | | | | | | | | | | | |
| Centrally Cleared Credit Default Swaps — Sell Protection | | | | | | | | | | | | | | | | | | |
| Index | | Receive
Fixed
Rate | | | Expiration
Date | | | Credit
Rating1 | | | Notional Amount (000)2 | | | Unrealized
Appreciation | |
ITRAXX.EUR.21.V1 | | | 1.00% | | | | 6/20/19 | | | | BBB+ | | | | EUR | | | | 1,445 | | | | $ 8,926 | |
ITRAXX.EUR.25.V1 | | | 1.00% | | | | 6/20/21 | | | | BBB+ | | | | EUR | | | | 5,170 | | | | 18,872 | |
ITRAXX.EUR.27.V1 | | | 1.00% | | | | 6/20/22 | | | | BBB+ | | | | EUR | | | | 44,340 | | | | 86,446 | |
Total | | | | | | | | | | | | | | | | | | | | | | | $114,244 | |
| | | | | | | | | | | | | | | | | | | | | | | | |
| | 1 | | Using S&P’s rating of the issuer or the underlying securities of the index, as applicable. |
| | 2 | | The maximum potential amount the Master Portfolio may pay should a negative credit event take place as defined under the terms of the agreement. |
| | | | | | | | | | | | | | | | |
| Centrally Cleared Interest Rate Swaps | |
| Fixed Rate | | Floating Rate | | Effective Date | | Expiration Date | | Notional Amount (000) | | | Unrealized
Appreciation
(Depreciation) | |
| 1.54%1 | | 3-month LIBOR | | 4/05/172 | | 12/31/18 | | USD | | | 607,600 | | | | $(274,328 | ) |
| 1.52%1 | | 3-month LIBOR | | 4/05/172 | | 12/31/18 | | USD | | | 308,475 | | | | (285,750 | ) |
| 1.53%1 | | 3-month LIBOR | | 4/05/172 | | 12/31/18 | | USD | | | 185,645 | | | | (126,725 | ) |
| 7.36%3 | | 28-day MXIBTIIE | | N/A | | 1/28/19 | | MXN | | | 728,739 | | | | (182,324 | ) |
| 7.32%1 | | 28-day MXIBTIIE | | N/A | | 2/20/20 | | MXN | | | 674,413 | | | | 107,654 | |
| 7.35%1 | | 28-day MXIBTIIE | | N/A | | 2/20/20 | | MXN | | | 66,011 | | | | 12,865 | |
See Notes to Consolidated Financial Statements.
| | | | | | |
| | | BLACKROCK BALANCED CAPITAL FUND, INC. | | MARCH 31, 2017 | | 85 |
| | | | |
| Consolidated Schedule of Investments (continued) | | | Master Total Return Portfolio | |
| | | | | | | | | | | | | | | | | | | | | | |
| Fixed Rate | | Floating Rate | | Effective Date | | | Expiration Date | | | Notional Amount (000) | | | Unrealized
Appreciation
(Depreciation) | |
| 7.31%1 | | 28-day MXIBTIIE | | | N/A | | | | 3/17/20 | | | | MXN | | | | 608,000 | | | $ | 78,899 | |
| 7.16%1 | | 28-day MXIBTIIE | | | N/A | | | | 3/20/20 | | | | MXN | | | | 458,458 | | | | 12,175 | |
| 7.17%1 | | 28-day MXIBTIIE | | | N/A | | | | 3/20/20 | | | | MXN | | | | 458,452 | | | | 18,859 | |
| 3.39%3 | | UK RPI All Items Monthly | | | N/A | | | | 10/15/21 | | | | GBP | | | | 36,162 | | | | 231,833 | |
| 3.39%3 | | UK RPI All Items Monthly | | | N/A | | | | 10/15/21 | | | | GBP | | | | 36,162 | | | | 219,206 | |
| 3.37%3 | | UK RPI All Items Monthly | | | N/A | | | | 10/15/21 | | | | GBP | | | | 35,622 | | | | 278,101 | |
| 7.45%1 | | 28-day MXIBTIIE | | | N/A | | | | 3/07/22 | | | | MXN | | | | 230,990 | | | | 141,957 | |
| 7.48%1 | | 28-day MXIBTIIE | | | N/A | | | | 3/07/22 | | | | MXN | | | | 115,492 | | | | 81,692 | |
| 7.47%1 | | 28-day MXIBTIIE | | | N/A | | | | 3/07/22 | | | | MXN | | | | 115,490 | | | | 79,065 | |
| 6.32%1 | | 28-day MXIBTIIE | | | N/A | | | | 7/17/25 | | | | MXN | | | | 73,475 | | | | (269,933 | ) |
| 2.13%1 | | 3-month LIBOR | | | N/A | | | | 8/25/25 | | | | USD | | | | 2,360 | | | | (29,227 | ) |
| 2.27%3 | | 3-month LIBOR | | | N/A | | | | 9/11/25 | | | | USD | | | | 1,800 | | | | 4,041 | |
| 3.46%1 | | UK RPI All Items Monthly | | | N/A | | | | 10/15/26 | | | | GBP | | | | 36,162 | | | | (18,351 | ) |
| 3.45%1 | | UK RPI All Items Monthly | | | N/A | | | | 10/15/26 | | | | GBP | | | | 36,162 | | | | (91,848 | ) |
| 3.43%1 | | UK RPI All Items Monthly | | | N/A | | | | 10/15/26 | | | | GBP | | | | 35,622 | | | | (185,039 | ) |
| 7.85%1 | | 28-day MXIBTIIE | | | N/A | | | | 3/02/37 | | | | MXN | | | | 92,276 | | | | 49,649 | |
| 7.82%1 | | 28-day MXIBTIIE | | | N/A | | | | 3/04/37 | | | | MXN | | | | 92,814 | | | | 31,322 | |
| 2.64%3 | | 3-month LIBOR | | | 6/30/172 | | | | 11/15/43 | | | | USD | | | | 102,725 | | | | 495,145 | |
| Total | | | | | | | | | | | | | | | | | | | | $ | 378,938 | |
| | | | | | | | | | | | | | | | | | | | | | |
| | 1 | | The Master Portfolio pays the floating rate and receives the fixed rate. |
| | 3 | | The Master Portfolio pays the fixed rate and receives the floating rate. |
| | | | | | | | | | | | | | | | | | | | | | | | | | | | |
OTC Credit Default Swaps — Buy Protection | |
| Issuer/Index | | Pay
Fixed
Rate | | | Counterparty | | Expiration
Date | | | Notional Amount (000) | | | Value | | | Premiums
Paid
(Received) | | | Unrealized
Appreciation
(Depreciation) | |
CDX.NA.IG.18.V1 | | | 1.00 | % | | Credit Suisse International | | | 6/20/17 | | | USD | | | 103,800 | | | $ | (250,587 | ) | | $ | (527 | ) | | | $(250,060 | ) |
Buoni Poliennali Del Tesoro | | | 1.00 | % | | Barclays Bank PLC | | | 3/20/18 | | | USD | | | 6,000 | | | | (36,112 | ) | | | 70,857 | | | | (106,969 | ) |
ITRAXX.FINSR.19.V1 | | | 1.00 | % | | Citibank N.A. | | | 6/20/18 | | | EUR | | | 8,200 | | | | (87,321 | ) | | | (63,173 | ) | | | (24,148 | ) |
ITRAXX.FINSR.20.V1 | | | 1.00 | % | | Barclays Bank PLC | | | 12/20/18 | | | EUR | | | 1,450 | | | | (19,830 | ) | | | (4,022 | ) | | | (15,808 | ) |
ITRAXX.FINSR.20.V1 | | | 1.00 | % | | Citibank N.A. | | | 12/20/18 | | | EUR | | | 5,900 | | | | (80,686 | ) | | | (55,869 | ) | | | (24,817 | ) |
ITRAXX.FINSR.20.V1 | | | 1.00 | % | | Citibank N.A. | | | 12/20/18 | | | EUR | | | 3,120 | | | | (42,668 | ) | | | (8,481 | ) | | | (34,187 | ) |
Republic of Portugal | | | 1.00 | % | | BNP Paribas S.A. | | | 9/20/19 | | | USD | | | 875 | | | | 4,351 | | | | 12,702 | | | | (8,351 | ) |
United Mexican States | | | 1.00 | % | | JPMorgan Chase Bank N.A. | | | 6/20/20 | | | USD | | | 7,452 | | | | (66,686 | ) | | | 42,190 | | | | (108,876 | ) |
United Mexican States | | | 1.00 | % | | Bank of America N.A. | | | 9/20/20 | | | USD | | | 7,452 | | | | (51,713 | ) | | | 64,999 | | | | (116,712 | ) |
Australia & New Zealand Banking Group Ltd. | | | 1.00 | % | | JPMorgan Chase Bank N.A. | | | 12/20/20 | | | USD | | | 1,000 | | | | (22,992 | ) | | | (268 | ) | | | (22,724 | ) |
Australia and New Zealand Banking Group Ltd. | | | 1.00 | % | | JPMorgan Chase Bank N.A. | | | 12/20/20 | | | USD | | | 1,205 | | | | (27,699 | ) | | | (4,177 | ) | | | (23,522 | ) |
Australia and New Zealand Banking Group Ltd. | | | 1.00 | % | | JPMorgan Chase Bank N.A. | | | 12/20/20 | | | USD | | | 795 | | | | (18,284 | ) | | | (3,038 | ) | | | (15,246 | ) |
Banco Comercial Portugues SA | | | 5.00 | % | | BNP Paribas S.A. | | | 12/20/20 | | | EUR | | | 216 | | | | (12,127 | ) | | | (2,818 | ) | | | (9,309 | ) |
Commonwealth Bank of Australia | | | 1.00 | % | | JPMorgan Chase Bank N.A. | | | 12/20/20 | | | USD | | | 1,150 | | | | (26,468 | ) | | | (3,135 | ) | | | (23,333 | ) |
Commonwealth Bank of Australia | | | 1.00 | % | | JPMorgan Chase Bank N.A. | | | 12/20/20 | | | USD | | | 1,000 | | | | (23,016 | ) | | | (2,011 | ) | | | (21,005 | ) |
Itochu Corp. | | | 1.00 | % | | Goldman Sachs International | | | 12/20/20 | | | JPY | | | 32,023 | | | | (7,994 | ) | | | (1,799 | ) | | | (6,195 | ) |
Itochu Corp. | | | 1.00 | % | | Goldman Sachs International | | | 12/20/20 | | | JPY | | | 29,326 | | | | (7,320 | ) | | | (1,570 | ) | | | (5,750 | ) |
Itochu Corp. | | | 1.00 | % | | Goldman Sachs International | | | 12/20/20 | | | JPY | | | 29,326 | | | | (7,320 | ) | | | (1,481 | ) | | | (5,839 | ) |
Itochu Corp. | | | 1.00 | % | | Goldman Sachs International | | | 12/20/20 | | | JPY | | | 29,326 | | | | (7,320 | ) | | | (1,142 | ) | | | (6,178 | ) |
See Notes to Consolidated Financial Statements.
| | | | | | |
| 86 | | BLACKROCK BALANCED CAPITAL FUND, INC. | | MARCH 31, 2017 | | |
| | | | |
| Consolidated Schedule of Investments (continued) | | | Master Total Return Portfolio | |
| | | | | | | | | | | | | | | | | | | | | | | | | | |
| Issuer/Index | | Pay
Fixed Rate | | | Counterparty | | Expiration
Date | | Notional
Amount (000) | | | Value | | | Premiums
Paid
(Received) | | | Unrealized
Appreciation
(Depreciation) | |
Loews Corp. | | | 1.00 | % | | Barclays Bank PLC | | 12/20/20 | | USD | | | 4,245 | | | | $(128,144 | ) | | | $(111,297 | ) | | | $ (16,847 | ) |
Mitsubishi Corp. | | | 1.00 | % | | Barclays Bank PLC | | 12/20/20 | | JPY | | | 47,573 | | | | (13,376 | ) | | | (5,677 | ) | | | (7,699 | ) |
Mitsubishi Corp. | | | 1.00 | % | | Goldman Sachs International | | 12/20/20 | | JPY | | | 29,326 | | | | (8,246 | ) | | | (3,091 | ) | | | (5,155 | ) |
Mitsui & Co. Ltd. | | | 1.00 | % | | Goldman Sachs International | | 12/20/20 | | JPY | | | 58,651 | | | | (15,745 | ) | | | (2,429 | ) | | | (13,316 | ) |
Mitsui & Co. Ltd. | | | 1.00 | % | | Goldman Sachs International | | 12/20/20 | | JPY | | | 29,326 | | | | (7,872 | ) | | | (873 | ) | | | (6,999 | ) |
National Australia Bank Ltd. | | | 1.00 | % | | JPMorgan Chase Bank N.A. | | 12/20/20 | | USD | | | 1,000 | | | | (22,068 | ) | | | (1,015 | ) | | | (21,053 | ) |
Standard Chartered PLC | | | 1.00 | % | | BNP Paribas S.A. | | 12/20/20 | | EUR | | | 810 | | | | (14,107 | ) | | | 15,574 | | | | (29,681 | ) |
Standard Chartered PLC | | | 1.00 | % | | BNP Paribas S.A. | | 12/20/20 | | EUR | | | 460 | | | | (8,011 | ) | | | 9,222 | | | | (17,233 | ) |
Standard Chartered PLC | | | 1.00 | % | | Goldman Sachs International | | 12/20/20 | | EUR | | | 610 | | | | (10,624 | ) | | | 5,225 | | | | (15,849 | ) |
Standard Chartered PLC | | | 1.00 | % | | Morgan Stanley & Co. International PLC | | 12/20/20 | | EUR | | | 240 | | | | (4,180 | ) | | | 4,906 | | | | (9,086 | ) |
Sumitomo Mitsui Banking Corp. | | | 1.00 | % | | Barclays Bank PLC | | 12/20/20 | | JPY | | | 24,938 | | | | (6,598 | ) | | | 909 | | | | (7,507 | ) |
Sumitomo Mitsui Banking Corp. | | | 1.00 | % | | JPMorgan Chase Bank N.A. | | 12/20/20 | | JPY | | | 25,316 | | | | (6,698 | ) | | | 1,543 | | | | (8,241 | ) |
Valero Energy Corp. | | | 1.00 | % | | Morgan Stanley & Co. International PLC | | 12/20/20 | | USD | | | 4,450 | | | | (74,017 | ) | | | 81,684 | | | | (155,701 | ) |
Westpac Banking Corp. | | | 1.00 | % | | Citibank N.A. | | 12/20/20 | | USD | | | 1,000 | | | | (24,625 | ) | | | (2,365 | ) | | | (22,260 | ) |
Cable & Wireless International Finance BV | | | 5.00 | % | | Goldman Sachs International | | 6/20/21 | | EUR | | | 450 | | | | (73,628 | ) | | | (49,166 | ) | | | (24,462 | ) |
Kingdom of Thailand | | | 1.00 | % | | Barclays Bank PLC | | 6/20/21 | | USD | | | 769 | | | | (17,781 | ) | | | (888 | ) | | | (16,893 | ) |
Kingdom of Thailand | | | 1.00 | % | | BNP Paribas S.A. | | 6/20/21 | | USD | | | 731 | | | | (16,899 | ) | | | (1,692 | ) | | | (15,207 | ) |
Kingdom of Thailand | | | 1.00 | % | | Citibank N.A. | | 6/20/21 | | USD | | | 420 | | | | (9,708 | ) | | | (634 | ) | | | (9,074 | ) |
Kingdom of Thailand | | | 1.00 | % | | JPMorgan Chase Bank N.A. | | 6/20/21 | | USD | | | 540 | | | | (12,486 | ) | | | (381 | ) | | | (12,105 | ) |
Kingdom of Thailand | | | 1.00 | % | | JPMorgan Chase Bank N.A. | | 6/20/21 | | USD | | | 540 | | | | (12,486 | ) | | | (165 | ) | | | (12,321 | ) |
BNP Paribas SA | | | 1.00 | % | | JPMorgan Chase Bank N.A. | | 12/20/21 | | EUR | | | 800 | | | | (7,851 | ) | | | (11,454 | ) | | | 3,603 | |
Clariant AG | | | 1.00 | % | | BNP Paribas S.A. | | 12/20/21 | | EUR | | | 500 | | | | (5,159 | ) | | | (1,259 | ) | | | (3,900 | ) |
Credit Suisse Group AG ADR | | | 1.00 | % | | Société Générale | | 12/20/21 | | EUR | | | 700 | | | | (1,698 | ) | | | 15,081 | | | | (16,779 | ) |
Iberdrola SA | | | 1.00 | % | | JPMorgan Chase Bank N.A. | | 12/20/21 | | EUR | | | 750 | | | | (11,583 | ) | | | (10,190 | ) | | | (1,393 | ) |
Louis Dreyfus Commodities BV | | | 5.00 | % | | Goldman Sachs International | | 12/20/21 | | EUR | | | 564 | | | | (56,120 | ) | | | (37,483 | ) | | | (18,637 | ) |
Monitchem HoldCo 3 SA | | | 5.00 | % | | JPMorgan Chase Bank N.A. | | 12/20/21 | | EUR | | | 750 | | | | (69,885 | ) | | | (14,690 | ) | | | (55,195 | ) |
Russian Federation | | | 1.00 | % | | Bank of America N.A. | | 12/20/21 | | USD | | | 425 | | | | 9,100 | | | | 23,609 | | | | (14,509 | ) |
Russian Federation | | | 1.00 | % | | Bank of America N.A. | | 12/20/21 | | USD | | | 425 | | | | 9,100 | | | | 23,609 | | | | (14,509 | ) |
Russian Federation | | | 1.00 | % | | Bank of America N.A. | | 12/20/21 | | USD | | | 425 | | | | 9,100 | | | | 23,722 | | | | (14,622 | ) |
Russian Federation | | | 1.00 | % | | Bank of America N.A. | | 12/20/21 | | USD | | | 425 | | | | 9,100 | | | | 23,722 | | | | (14,622 | ) |
Russian Federation | | | 1.00 | % | | Bank of America N.A. | | 12/20/21 | | USD | | | 425 | | | | 9,101 | | | | 23,783 | | | | (14,682 | ) |
Russian Federation | | | 1.00 | % | | Bank of America N.A. | | 12/20/21 | | USD | | | 255 | | | | 5,460 | | | | 14,233 | | | | (8,773 | ) |
Russian Federation | | | 1.00 | % | | JPMorgan Chase Bank N.A. | | 12/20/21 | | USD | | | 2,319 | | | | 49,655 | | | | 124,740 | | | | (75,085 | ) |
Statoil ASA | | | 1.00 | % | | BNP Paribas S.A. | | 12/20/21 | | EUR | | | 500 | | | | (17,136 | ) | | | (11,489 | ) | | | (5,647 | ) |
Techem GmbH | | | 5.00 | % | | Credit Suisse International | | 12/20/21 | | EUR | | | 650 | | | | (105,990 | ) | | | (114,117 | ) | | | 8,127 | |
AutoZone, Inc. | | | 1.00 | % | | Barclays Bank PLC | | 6/20/22 | | USD | | | 4,200 | | | | (102,161 | ) | | | (103,029 | ) | | | 868 | |
Fiat Chrysler Automobiles NV | | | 5.00 | % | | Bank of America N.A. | | 6/20/22 | | EUR | | | 1,400 | | | | (155,471 | ) | | | (164,555 | ) | | | 9,084 | |
Halliburton Co. | | | 1.00 | % | | Morgan Stanley & Co. International PLC | | 6/20/22 | | USD | | | 8,400 | | | | (161,662 | ) | | | (118,241 | ) | | | (43,421 | ) |
HSBC Holdings PLC ADR | | | 1.00 | % | | Bank of America N.A. | | 6/20/22 | | EUR | | | 3,540 | | | | (73,950 | ) | | | (64,471 | ) | | | (9,479 | ) |
HSBC Holdings PLC ADR | | | 1.00 | % | | BNP Paribas S.A. | | 6/20/22 | | EUR | | | 18,376 | | | | (383,870 | ) | | | (380,110 | ) | | | (3,760 | ) |
HSBC Holdings PLC ADR | | | 1.00 | % | | BNP Paribas S.A. | | 6/20/22 | | EUR | | | 18,170 | | | | (379,567 | ) | | | (375,849 | ) | | | (3,718 | ) |
HSBC Holdings PLC ADR | | | 1.00 | % | | Citibank N.A. | | 6/20/22 | | EUR | | | 17,746 | | | | (370,710 | ) | | | (323,191 | ) | | | (47,519 | ) |
HSBC Holdings PLC ADR | | | 1.00 | % | | Citibank N.A. | | 6/20/22 | | EUR | | | 8,754 | | | | (182,869 | ) | | | (159,428 | ) | | | (23,441 | ) |
HSBC Holdings PLC ADR | | | 1.00 | % | | Société Générale | | 6/20/22 | | EUR | | | 28,449 | | | | (594,292 | ) | | | (518,114 | ) | | | (76,178 | ) |
See Notes to Consolidated Financial Statements.
| | | | | | |
| | | BLACKROCK BALANCED CAPITAL FUND, INC. | | MARCH 31, 2017 | | 87 |
| | | | |
| Consolidated Schedule of Investments (continued) | | | Master Total Return Portfolio | |
| | | | | | | | | | | | | | | | | | | | | | | | | | |
| Issuer/Index | | Pay
Fixed Rate | | | Counterparty | | Expiration
Date | | Notional Amount (000) | | | Value | | | Premiums
Paid
(Received) | | | Unrealized
Appreciation
(Depreciation) | |
Iceland Bondco PLC | | | 5.00 | % | | Citibank N.A. | | 6/20/22 | | EUR | | | 400 | | | | $ (32,712 | ) | | | $ (30,221 | ) | | | $ (2,491 | ) |
Lanxess AG | | | 1.00 | % | | JPMorgan Chase Bank N.A. | | 6/20/22 | | EUR | | | 2,167 | | | | (34,485 | ) | | | (29,641 | ) | | | (4,844 | ) |
Macquarie Bank Ltd. | | | 1.00 | % | | Deutsche Bank AG | | 6/20/22 | | USD | | | 700 | | | | 5,164 | | | | 15,890 | | | | (10,726 | ) |
Macy’s, Inc. | | | 1.00 | % | | JPMorgan Chase Bank N.A. | | 6/20/22 | | USD | | | 4,200 | | | | 282,326 | | | | 275,898 | | | | 6,428 | |
Marks & Spencer PLC | | | 1.00 | % | | Bank of America N.A. | | 6/20/22 | | EUR | | | 1,630 | | | | 57,313 | | | | 57,757 | | | | (444 | ) |
Marks & Spencer PLC | | | 1.00 | % | | Barclays Bank PLC | | 6/20/22 | | EUR | | | 1,650 | | | | 58,016 | | | | 61,173 | | | | (3,157 | ) |
Melia Hotels International SA | | | 5.00 | % | | JPMorgan Chase Bank N.A. | | 6/20/22 | | EUR | | | 870 | | | | (195,532 | ) | | | (187,746 | ) | | | (7,786 | ) |
New Look Senior Issuer PLC | | | 5.00 | % | | JPMorgan Chase Bank N.A. | | 6/20/22 | | EUR | | | 1,100 | | | | 296,884 | | | | 308,184 | | | | (11,300 | ) |
People’s Republic of China | | | 1.00 | % | | Barclays Bank PLC | | 6/20/22 | | USD | | | 3,159 | | | | (28,515 | ) | | | (19,716 | ) | | | (8,799 | ) |
People’s Republic of China | | | 1.00 | % | | Goldman Sachs International | | 6/20/22 | | USD | | | 2,641 | | | | (23,838 | ) | | | (15,185 | ) | | | (8,653 | ) |
PizzaExpress Financing 1 PLC | | | 5.00 | % | | Citibank N.A. | | 6/20/22 | | EUR | | | 520 | | | | 38,596 | | | | 42,246 | | | | (3,650 | ) |
Republic of Argentina | | | 5.00 | % | | Barclays Bank PLC | | 6/20/22 | | USD | | | 5,924 | | | | (378,769 | ) | | | (284,560 | ) | | | (94,209 | ) |
Republic of France | | | 0.25 | % | | Bank of America N.A. | | 6/20/22 | | USD | | | 1,237 | | | | 15,307 | | | | 15,588 | | | | (281 | ) |
Republic of France | | | 0.25 | % | | Bank of America N.A. | | 6/20/22 | | USD | | | 1,200 | | | | 14,849 | | | | 15,122 | | | | (273 | ) |
Republic of France | | | 0.25 | % | | Bank of America N.A. | | 6/20/22 | | USD | | | 780 | | | | 9,696 | | | | 9,217 | | | | 479 | |
Republic of France | | | 0.25 | % | | Bank of America N.A. | | 6/20/22 | | USD | | | 618 | | | | 7,648 | | | | 7,788 | | | | (140 | ) |
Republic of France | | | 0.25 | % | | Goldman Sachs International | | 6/20/22 | | USD | | | 1,656 | | | | 20,492 | | | | 19,656 | | | | 836 | |
Republic of France | | | 0.25 | % | | Goldman Sachs International | | 6/20/22 | | USD | | | 780 | | | | 9,652 | | | | 9,258 | | | | 394 | |
Republic of France | | | 0.25 | % | | JPMorgan Chase Bank N.A. | | 6/20/22 | | USD | | | 770 | | | | 9,523 | | | | 10,251 | | | | (728 | ) |
Republic of Korea | | | 1.00 | % | | JPMorgan Chase Bank N.A. | | 6/20/22 | | USD | | | 5,000 | | | | (122,726 | ) | | | (126,518 | ) | | | 3,792 | |
Republic of South Africa | | | 1.00 | % | | Bank of America N.A. | | 6/20/22 | | USD | | | 4,065 | | | | 188,542 | | | | 208,285 | | | | (19,743 | ) |
Republic of South Africa | | | 1.00 | % | | Barclays Bank PLC | | 6/20/22 | | USD | | | 2,965 | | | | 137,577 | | | | 136,575 | | | | 1,002 | |
Republic of South Africa | | | 1.00 | % | | Barclays Bank PLC | | 6/20/22 | | USD | | | 133 | | | | 6,169 | | | | 6,740 | | | | (571 | ) |
Republic of South Africa | | | 1.00 | % | | Citibank N.A. | | 6/20/22 | | USD | | | 9,965 | | | | 462,195 | | | | 510,594 | | | | (48,399 | ) |
Republic of South Africa | | | 1.00 | % | | Goldman Sachs International | | 6/20/22 | | USD | | | 2,487 | | | | 115,351 | | | | 127,151 | | | | (11,800 | ) |
Republic of South Africa | | | 1.00 | % | | HSBC Bank PLC | | 6/20/22 | | USD | | | 4,445 | | | | 206,167 | | | | 223,262 | | | | (17,095 | ) |
Republic of the Philippines | | | 1.00 | % | | JPMorgan Chase Bank N.A. | | 6/20/22 | | USD | | | 18,547 | | | | (167,146 | ) | | | (48,062 | ) | | | (119,084 | ) |
Russian Federation | | | 1.00 | % | | Bank of America N.A. | | 6/20/22 | | USD | | | 7,890 | | | | 248,471 | | | | 343,695 | | | | (95,224 | ) |
Russian Federation | | | 1.00 | % | | Bank of America N.A. | | 6/20/22 | | USD | | | 3,945 | | | | 124,236 | | | | 169,689 | | | | (45,453 | ) |
Russian Federation | | | 1.00 | % | | Bank of America N.A. | | 6/20/22 | | USD | | | 2,365 | | | | 74,478 | | | | 106,080 | | | | (31,602 | ) |
Russian Federation | | | 1.00 | % | | JPMorgan Chase Bank N.A. | | 6/20/22 | | USD | | | 7,890 | | | | 248,471 | | | | 342,620 | | | | (94,149 | ) |
Simon Property Group, Inc. | | | 1.00 | % | | Barclays Bank PLC | | 6/20/22 | | USD | | | 4,200 | | | | (15,940 | ) | | | (5,840 | ) | | | (10,100 | ) |
Standard Chartered PLC | | | 1.00 | % | | BNP Paribas S.A. | | 6/20/22 | | EUR | | | 16,002 | | | | (196,557 | ) | | | (141,305 | ) | | | (55,252 | ) |
Standard Chartered PLC | | | 1.00 | % | | BNP Paribas S.A. | | 6/20/22 | | EUR | | | 10,500 | | | | (128,974 | ) | | | (123,204 | ) | | | (5,770 | ) |
Standard Chartered PLC | | | 1.00 | % | | BNP Paribas S.A. | | 6/20/22 | | EUR | | | 4,433 | | | | (54,452 | ) | | | (51,405 | ) | | | (3,047 | ) |
Standard Chartered PLC | | | 1.00 | % | | Citibank N.A. | | 6/20/22 | | EUR | | | 24,425 | | | | (300,020 | ) | | | (260,060 | ) | | | (39,960 | ) |
Standard Chartered PLC | | | 1.00 | % | | Citibank N.A. | | 6/20/22 | | EUR | | | 9,994 | | | | (122,759 | ) | | | (106,409 | ) | | | (16,350 | ) |
Standard Chartered PLC | | | 1.00 | % | | Citibank N.A. | | 6/20/22 | | EUR | | | 9,086 | | | | (111,606 | ) | | | (96,741 | ) | | | (14,865 | ) |
Standard Chartered PLC | | | 1.00 | % | | JPMorgan Chase Bank N.A. | | 6/20/22 | | EUR | | | 890 | | | | 24,459 | | | | 33,046 | | | | (8,587 | ) |
Standard Chartered PLC | | | 1.00 | % | | Société Générale | | 6/20/22 | | EUR | | | 13,547 | | | | (166,402 | ) | | | (138,701 | ) | | | (27,701 | ) |
Standard Chartered PLC | | | 1.00 | % | | Société Générale | | 6/20/22 | | EUR | | | 9,530 | | | | (117,060 | ) | | | (97,573 | ) | | | (19,487 | ) |
STMicroelectronics NV | | | 1.00 | % | | JPMorgan Chase Bank N.A. | | 6/20/22 | | EUR | | | 888 | | | | (7,243 | ) | | | (5,283 | ) | | | (1,960 | ) |
Tata Motors Ltd. | | | 5.00 | % | | Credit Suisse International | | 6/20/22 | | EUR | | | 1,300 | | | | (199,292 | ) | | | (201,810 | ) | | | 2,518 | |
Tata Motors Ltd. | | | 5.00 | % | | Credit Suisse International | | 6/20/22 | | EUR | | | 1,200 | | | | (183,963 | ) | | | (188,402 | ) | | | 4,439 | |
Tata Motors Ltd. | | | 5.00 | % | | JPMorgan Chase Bank N.A. | | 6/20/22 | | EUR | | | 3,100 | | | | (475,235 | ) | | | (475,317 | ) | | | 82 | |
Vodafone Group PLC | | | 1.00 | % | | Barclays Bank PLC | | 6/20/22 | | EUR | | | 5,530 | | | | (44,492 | ) | | | (38,969 | ) | | | (5,523 | ) |
CMBX.NA.8.AAA | | | 0.50 | % | | Credit Suisse International | | 10/17/57 | | USD | | | 2,319 | | | | 31,395 | | | | 102,915 | | | | (71,520 | ) |
CMBX.NA.8.AAA | | | 0.50 | % | | Morgan Stanley & Co. International PLC | | 10/17/57 | | USD | | | 1,980 | | | | 26,803 | | | | 45,666 | | | | (18,863 | ) |
See Notes to Consolidated Financial Statements.
| | | | | | |
| 88 | | BLACKROCK BALANCED CAPITAL FUND, INC. | | MARCH 31, 2017 | | |
| | | | |
| Consolidated Schedule of Investments (continued) | | | Master Total Return Portfolio | |
| | | | | | | | | | | | | | | | | | | | | | | | | | | | | | | | |
| Issuer/Index | | Pay
Fixed Rate | | | Counterparty | | | Expiration
Date | | | Notional
Amount
(000) | | | Value | | | Premiums
Paid
(Received) | | | Unrealized
Appreciation
(Depreciation) | |
CMBX.NA.8.AAA | | | 0.50 | % | | | Morgan Stanley & Co. International PLC | | | | 10/17/57 | | | | USD | | | | 70 | | | | $ 948 | | | | $ 1,558 | | | | $ (610 | ) |
CMBX.NA.9.A | | | 2.00 | % | | | J.P. Morgan Securities LLC | | | | 9/17/58 | | | | USD | | | | 1,021 | | | | 52,006 | | | | 141,650 | | | | (89,644 | ) |
CMBX.NA.9.A | | | 2.00 | % | | | Morgan Stanley & Co. International PLC | | | | 9/17/58 | | | | USD | | | | 1,780 | | | | 90,630 | | | | 227,292 | | | | (136,662 | ) |
CMBX.NA.6.AAA | | | 0.50 | % | | | Deutsche Bank AG | | | | 5/11/63 | | | | USD | | | | 6,505 | | | | 3,604 | | | | 2,148 | | | | 1,456 | |
CMBX.NA.6.AAA | | | 0.50 | % | | | Deutsche Bank AG | | | | 5/11/63 | | | | USD | | | | 5,788 | | | | 3,206 | | | | (1,934 | ) | | | 5,140 | |
CMBX.NA.6.AAA | | | 0.50 | % | | | Deutsche Bank AG | | | | 5/11/63 | | | | USD | | | | 4,064 | | | | 2,252 | | | | 810 | | | | 1,442 | |
CMBX.NA.6.BBB- | | | 3.00 | % | | | Deutsche Bank AG | | | | 5/11/63 | | | | USD | | | | 1,700 | | | | 216,653 | | | | 157,016 | | | | 59,637 | |
CMBX.NA.6.BBB- | | | 3.00 | % | | | J.P. Morgan Securities LLC | | | | 5/11/63 | | | | USD | | | | 850 | | | | 108,326 | | | | 85,894 | | | | 22,432 | |
CMBX.NA.6.BBB- | | | 3.00 | % | | | J.P. Morgan Securities LLC | | | | 5/11/63 | | | | USD | | | | 840 | | | | 107,052 | | | | 55,100 | | | | 51,952 | |
CMBX.NA.6.BBB- | | | 3.00 | % | | | J.P. Morgan Securities LLC | | | | 5/11/63 | | | | USD | | | | 840 | | | | 107,052 | | | | 55,100 | | | | 51,952 | |
CMBX.NA.6.BBB- | | | 3.00 | % | | | Morgan Stanley & Co. International PLC | | | | 5/11/63 | | | | USD | | | | 850 | | | | 108,327 | | | | 49,007 | | | | 59,320 | |
Total | | | | | | | | | | | | | | | | | | | | | | | $(3,446,331 | ) | | | $(853,225 | ) | | | $(2,593,106 | ) |
| | | | | | | | | | | | | | | | | | | | | | | | |
OTC Credit Default Swaps — Sell Protection
| | | | | | | | | | | | | | | | | | | | | | | | | | | | |
| Issuer/Index | | Receive
Fixed Rate | | | Counterparty | | Expiration
Date | | Credit
Rating1 | | Notional
Amount (000)2 | | | Value | | | Premiums
Paid
(Received) | | | Unrealized
Appreciation
(Depreciation) | |
CDX.NA.IG.18.V1 | | | 1.00 | % | | Citibank N.A. | | 6/20/17 | | BBB+ | | USD | | | 103,800 | | | $ | 250,587 | | | | $ 5,009 | | | | $245,578 | |
SAS AB | | | 5.00 | % | | Goldman Sachs International | | 12/20/17 | | Not Rated | | EUR | | | 270 | | | | 4,575 | | | | (4,365 | ) | | | 8,940 | |
Buoni Poliennali Del Tesoro | | | 1.00 | % | | Barclays Bank PLC | | 3/20/18 | | BBB- | | EUR | | | 4,500 | | | | 33,092 | | | | (75,830 | ) | | | 108,922 | |
Buoni Poliennali Del Tesoro | | | 1.00 | % | | Barclays Bank PLC | | 3/20/18 | | BBB- | | USD | | | 37 | | | | 222 | | | | (573 | ) | | | 795 | |
ITRAXX.FINSUB.19.V1 | | | 5.00 | % | | Citibank N.A. | | 6/20/18 | | BBB | | EUR | | | 5,900 | | | | 350,963 | | | | 342,650 | | | | 8,313 | |
ITRAXX.FINSUB.20.V1 | | | 5.00 | % | | Barclays Bank PLC | | 12/20/18 | | BBB | | EUR | | | 1,160 | | | | 94,798 | | | | 122,583 | | | | (27,785 | ) |
ITRAXX.FINSUB.20.V1 | | | 5.00 | % | | Citibank N.A. | | 12/20/18 | | BBB | | EUR | | | 4,600 | | | | 375,924 | | | | 360,855 | | | | 15,069 | |
ITRAXX.FINSUB.20.V1 | | | 5.00 | % | | Citibank N.A. | | 12/20/18 | | BBB | | EUR | | | 1,660 | | | | 135,660 | | | | 173,835 | | | | (38,175 | ) |
ITRAXX.FINSUB.20.V1 | | | 5.00 | % | | Deutsche Bank AG | | 12/20/18 | | BBB | | EUR | | | 830 | | | | 67,829 | | | | 87,315 | | | | (19,486 | ) |
SAS AB | | | 5.00 | % | | Goldman Sachs International | | 6/20/19 | | Not Rated | | EUR | | | 1,000 | | | | (3,044 | ) | | | (64,178 | ) | | | 61,134 | |
Transocean Ltd. | | | 1.00 | % | | Goldman Sachs International | | 6/20/19 | | B+ | | USD | | | 350 | | | | (6,297 | ) | | | (4,853 | ) | | | (1,444 | ) |
United Mexican States | | | 1.00 | % | | Bank of America N.A. | | 6/20/20 | | BBB+ | | USD | | | 7,452 | | | | 66,686 | | | | (48,904 | ) | | | 115,590 | |
People’s Republic of China | | | 1.00 | % | | Barclays Bank PLC | | 9/20/20 | | AA- | | USD | | | 1,000 | | | | 16,589 | | | | (5,623 | ) | | | 22,212 | |
People’s Republic of China | | | 1.00 | % | | Goldman Sachs International | | 9/20/20 | | AA- | | USD | | | 1,000 | | | | 16,589 | | | | (5,946 | ) | | | 22,535 | |
United Mexican States | | | 1.00 | % | | JPMorgan Chase Bank N.A. | | 9/20/20 | | BBB+ | | USD | | | 7,452 | | | | 51,713 | | | | (56,624 | ) | | | 108,337 | |
ITRAXX.ASIA.XJ.IG.24.V1 | | | 1.00 | % | | Goldman Sachs International | | 12/20/20 | | A- | | USD | | | 1,825 | | | | 31,402 | | | | (37,910 | ) | | | 69,312 | |
Deutsche Bank AG | | | 1.00 | % | | Barclays Bank PLC | | 6/20/21 | | BBB- | | EUR | | | 1,200 | | | | (4,689 | ) | | | (54,915 | ) | | | 50,226 | |
Deutsche Bank AG | | | 1.00 | % | | BNP Paribas S.A. | | 6/20/21 | | BBB- | | EUR | | | 1,100 | | | | (4,298 | ) | | | (56,116 | ) | | | 51,818 | |
Federative Republic of Brazil | | | 1.00 | % | | Citibank N.A. | | 6/20/21 | | BB | | USD | | | 700 | | | | (21,704 | ) | | | (42,280 | ) | | | 20,576 | |
Telecom Italia SpA | | | 1.00 | % | | BNP Paribas S.A. | | 6/20/21 | | BB+ | | EUR | | | 1,140 | | | | (42,536 | ) | | | (46,753 | ) | | | 4,217 | |
Telecom Italia SpA | | | 1.00 | % | | BNP Paribas S.A. | | 6/20/21 | | BB+ | | EUR | | | 1,000 | | | | (37,313 | ) | | | (36,019 | ) | | | (1,294 | ) |
Telecom Italia SpA | | | 1.00 | % | | Citibank N.A. | | 6/20/21 | | BB+ | | EUR | | | 550 | | | | (20,522 | ) | | | (28,524 | ) | | | 8,002 | |
UniCredit SpA | | | 1.00 | % | | Barclays Bank PLC | | 6/20/21 | | BBB- | | EUR | | | 1,200 | | | | (20,251 | ) | | | (35,051 | ) | | | 14,800 | |
UniCredit SpA | | | 1.00 | % | | Barclays Bank PLC | | 6/20/21 | | BBB- | | EUR | | | 500 | | | | (8,437 | ) | | | (14,823 | ) | | | 6,386 | |
UniCredit SpA | | | 1.00 | % | | Citibank N.A. | | 6/20/21 | | BBB- | | EUR | | | 1,510 | | | | (25,481 | ) | | | (76,540 | ) | | | 51,059 | |
UniCredit SpA | | | 1.00 | % | | Citibank N.A. | | 6/20/21 | | BBB- | | EUR | | | 1,200 | | | | (20,250 | ) | | | (65,836 | ) | | | 45,586 | |
UniCredit SpA | | | 1.00 | % | | Citibank N.A. | | 6/20/21 | | BBB- | | EUR | | | 800 | | | | (13,500 | ) | | | (24,826 | ) | | | 11,326 | |
UniCredit SpA | | | 1.00 | % | | Citibank N.A. | | 6/20/21 | | BBB- | | EUR | | | 280 | | | | (4,483 | ) | | | 39,859 | | | | (44,342 | ) |
Hellenic Telecommunications Organization SA | | | 5.00 | % | | Barclays Bank PLC | | 12/20/21 | | B+ | | EUR | | | 1,400 | | | | 116,364 | | | | 88,523 | | | | 27,841 | |
UniCredit SpA | | | 1.00 | % | | BNP Paribas S.A. | | 12/20/21 | | BBB- | | EUR | | | 829 | | | | (20,766 | ) | | | (36,404 | ) | | | 15,638 | |
See Notes to Consolidated Financial Statements.
| | | | | | |
| | | BLACKROCK BALANCED CAPITAL FUND, INC. | | MARCH 31, 2017 | | 89 |
| | | | |
| Consolidated Schedule of Investments (continued) | | | Master Total Return Portfolio | |
| | | | | | | | | | | | | | | | | | | | | | | | | | | | | | | | | | | | |
| Issuer/Index | | Receive
Fixed Rate | | | Counterparty | | | Expiration
Date | | | Credit
Rating1 | | | Notional
Amount
(000)2 | | | Value | | | Premiums
Paid
(Received) | | | Unrealized
Appreciation
(Depreciation) | |
Federative Republic of Brazil | | | 1.00 | % | | | HSBC Bank PLC | | | | 6/20/22 | | | | BB | | | | USD | | | | 1,800 | | | | $(105,730 | ) | | | $ (110,654 | ) | | | $ 4,924 | |
Republic of South Africa | | | 1.00 | % | | | JPMorgan Chase Bank N.A. | | | | 6/20/22 | | | | BBB- | | | | USD | | | | 1,800 | | | | (83,387 | ) | | | (95,471 | ) | | | 12,084 | |
Republic of Turkey | | | 1.00 | % | | | Barclays Bank PLC | | | | 6/20/22 | | | | BB | | | | USD | | | | 1,800 | | | | (114,619 | ) | | | (115,972 | ) | | | 1,353 | |
Russian Federation | | | 1.00 | % | | | Barclays Bank PLC | | | | 6/20/22 | | | | BB+ | | | | USD | | | | 1,800 | | | | (56,586 | ) | | | (63,834 | ) | | | 7,248 | |
United Mexican States | | | 1.00 | % | | | Deutsche Bank AG | | | | 6/20/22 | | | | BBB+ | | | | USD | | | | 1,800 | | | | (24,991 | ) | | | (27,824 | ) | | | 2,833 | |
CMBX.NA.7.AAA | | | 0.50 | % | | | Morgan Stanley & Co. International PLC | | | | 1/17/47 | | | | AAA | | | | USD | | | | 5,000 | | | | (29,760 | ) | | | (161,436 | ) | | | 131,676 | |
CMBX.NA.3.AM | | | 0.50 | % | | | Credit Suisse International | | | | 12/13/49 | | | | BB+ | | | | USD | | | | 140 | | | | (657 | ) | | | (12,452 | ) | | | 11,795 | |
CMBX.NA.3.AM | | | 0.50 | % | | | Goldman Sachs International | | | | 12/13/49 | | | | BB+ | | | | USD | | | | 353 | | | | (1,656 | ) | | | (31,797 | ) | | | 30,141 | |
CMBX.NA.3.AM | | | 0.50 | % | | | JPMorgan Chase Bank N.A. | | | | 12/13/49 | | | | BB+ | | | | USD | | | | 762 | | | | (3,568 | ) | | | (65,026 | ) | | | 61,458 | |
CMBX.NA.4.AM | | | 0.50 | % | | | Deutsche Bank AG | | | | 2/17/51 | | | | BBB- | | | | USD | | | | 1,840 | | | | (10,748 | ) | | | (247,281 | ) | | | 236,533 | |
CMBX.NA.8.A | | | 2.00 | % | | | Goldman Sachs International | | | | 10/17/57 | | | | Not Rated | | | | USD | | | | 1,710 | | | | (102,990 | ) | | | (98,004 | ) | | | (4,986 | ) |
CMBX.NA.8.A | | | 2.00 | % | | | Goldman Sachs International | | | | 10/17/57 | | | | Not Rated | | | | USD | | | | 440 | | | | (26,500 | ) | | | (45,140 | ) | | | 18,640 | |
CMBX.NA.8.A | | | 2.00 | % | | | Morgan Stanley & Co. International PLC | | | | 10/17/57 | | | | Not Rated | | | | USD | | | | 290 | | | | (17,466 | ) | | | (25,127 | ) | | | 7,661 | |
CMBX.NA.9.A | | | 2.00 | % | | | Credit Suisse International | | | | 9/17/58 | | | | Not Rated | | | | USD | | | | 1,360 | | | | (69,094 | ) | | | (71,086 | ) | | | 1,992 | |
CMBX.NA.9.A | | | 2.00 | % | | | Credit Suisse International | | | | 9/17/58 | | | | Not Rated | | | | USD | | | | 400 | | | | (20,366 | ) | | | (56,654 | ) | | | 36,288 | |
CMBX.NA.9.A | | | 2.00 | % | | | Deutsche Bank AG | | | | 9/17/58 | | | | Not Rated | | | | USD | | | | 1,850 | | | | (94,194 | ) | | | (194,136 | ) | | | 99,942 | |
CMBX.NA.9.A | | | 2.00 | % | | | Deutsche Bank AG | | | | 9/17/58 | | | | Not Rated | | | | USD | | | | 1,630 | | | | (82,993 | ) | | | (84,571 | ) | | | 1,578 | |
CMBX.NA.9.A | | | 2.00 | % | | | J.P. Morgan Securities LLC | | | | 9/17/58 | | | | Not Rated | | | | USD | | | | 551 | | | | (28,076 | ) | | | (68,790 | ) | | | 40,714 | |
CMBX.NA.9.A | | | 2.00 | % | | | Morgan Stanley & Co. International PLC | | | | 9/17/58 | | | | Not Rated | | | | USD | | | | 1,630 | | | | (82,992 | ) | | | (89,275 | ) | | | 6,283 | |
CMBX.NA.9.A | | | 2.00 | % | | | Morgan Stanley & Co. International PLC | | | | 9/17/58 | | | | Not Rated | | | | USD | | | | 890 | | | | (45,117 | ) | | | (43,983 | ) | | | (1,134 | ) |
CMBX.NA.9.BBB- | | | 3.00 | % | | | Credit Suisse International | | | | 9/17/58 | | | | Not Rated | | | | USD | | | | 3,420 | | | | (400,585 | ) | | | (363,812 | ) | | | (36,773 | ) |
CMBX.NA.10.BBB- | | | 3.00 | % | | | J.P. Morgan Securities LLC | | | | 11/17/59 | | | | BBB- | | | | USD | | | | 60 | | | | (6,087 | ) | | | (5,404 | ) | | | (683 | ) |
CMBX.NA.6.BBB- | | | 3.00 | % | | | Credit Suisse International | | | | 5/11/63 | | | | BBB- | | | | USD | | | | 850 | | | | (108,314 | ) | | | (69,557 | ) | | | (38,757 | ) |
Total | | | | | | | | | | | | | | | | | | | | | | | | | | | $(157,054 | ) | | | $(1,749,550 | ) | | | $1,592,496 | |
| | | | | | | | | | | | | | | | | | | | | | | | | | | | |
| | 1 | | Using S&P’s rating of the issuer or the underlying securities of the index, as applicable. |
| | 2 | | The maximum potential amount the Master Portfolio may pay should a negative credit event take place as defined under the terms of the agreement. |
OTC Interest Rate Swaps
| | | | | | | | | | | | | | | | | | | | | | | | |
Fixed
Rate | | Floating Rate | | Counterparty | | Expiration
Date | | Notional Amount (000) | | | Value | | | Premiums
Paid
(Received) | | | Unrealized
Appreciation
(Depreciation) | |
13.13%1 | | 1-day BZDIOVER | | Bank of America N.A. | | 7/03/17 | | BRL | | | 41,038 | | | | $ (50,745 | ) | | | — | | | | $ (50,745 | ) |
13.11%1 | | 1-day BZDIOVER | | Citibank N.A. | | 7/03/17 | | BRL | | | 49,252 | | | | (58,489 | ) | | | — | | | | (58,489 | ) |
12.85%1 | | 1-day BZDIOVER | | JPMorgan Chase Bank N.A. | | 7/03/17 | | BRL | | | 6,329 | | | | (4,906 | ) | | | — | | | | (4,906 | ) |
1.92%2 | | 3-month KRW Certificate of Deposit | | Deutsche Bank AG | | 11/10/17 | | KRW | | | 10,139,328 | | | | 30,322 | | | | $8,147 | | | | 22,175 | |
1.69%1 | | 3-month KRW Certificate of Deposit | | Deutsche Bank AG | | 11/10/17 | | KRW | | | 10,139,328 | | | | (14,784 | ) | | | — | | | | (14,784 | ) |
4.30%1 | | 28-day MXIBTIIE | | Bank of America N.A. | | 12/07/17 | | MXN | | | 23,670 | | | | 23,776 | | | | 15 | | | | 23,761 | |
12.10%1 | | 1-day BZDIOVER | | Bank of America N.A. | | 1/02/18 | | BRL | | | 45,282 | | | | (163,802 | ) | | | — | | | | (163,802 | ) |
9.99%1 | | 1-day BZDIOVER | | Citibank N.A. | | 1/02/18 | | BRL | | | 91,638 | | | | (32,998 | ) | | | — | | | | (32,998 | ) |
9.98%1 | | 1-day BZDIOVER | | JPMorgan Chase Bank N.A. | | 1/02/18 | | BRL | | | 91,641 | | | | (7,274 | ) | | | — | | | | (7,274 | ) |
9.98%1 | | 1-day BZDIOVER | | JPMorgan Chase Bank N.A. | | 1/02/18 | | BRL | | | 91,641 | | | | (7,274 | ) | | | — | | | | (7,274 | ) |
4.55%1 | | 28-day MXIBTIIE | | Barclays Bank PLC | | 3/21/18 | | MXN | | | 39,525 | | | | 52,537 | | | | 505 | | | | 52,032 | |
4.85%1 | | 28-day MXIBTIIE | | Bank of America N.A. | | 11/01/18 | | MXN | | | 23,232 | | | | 43,563 | | | | 41 | | | | 43,522 | |
7.07%2 | | 28-day MXIBTIIE | | Citibank N.A. | | 11/21/18 | | MXN | | | 231,800 | | | | (10,049 | ) | | | — | | | | (10,049 | ) |
See Notes to Consolidated Financial Statements.
| | | | | | |
| 90 | | BLACKROCK BALANCED CAPITAL FUND, INC. | | MARCH 31, 2017 | | |
| | | | |
| Consolidated Schedule of Investments (continued) | | | Master Total Return Portfolio | |
| | | | | | | | | | | | | | | | | | | | | | | | | | | | | | |
Fixed Rate | | Floating Rate | | | Counterparty | | Expiration
Date | | | Notional Amount (000) | | | Value | | | Premiums
Paid
(Received) | | | Unrealized
Appreciation
(Depreciation) | |
7.06%2 | | | 28-day MXIBTIIE | | | JPMorgan Chase Bank N.A. | | | 11/21/18 | | | | MXN | | | | 278,160 | | | | $ (14,408 | ) | | | — | | | | $ (14,408 | ) |
6.98%2 | | | 28-day MXIBTIIE | | | Citibank N.A. | | | 11/28/18 | | | | MXN | | | | 395,600 | | | | (49,289 | ) | | | $ (620 | ) | | | (48,669 | ) |
6.98%2 | | | 28-day MXIBTIIE | | | JPMorgan Chase Bank N.A. | | | 11/28/18 | | | | MXN | | | | 224,417 | | | | (27,961 | ) | | | (352 | ) | | | (27,609 | ) |
4.77%1 | | | 28-day MXIBTIIE | | | Citibank N.A. | | | 12/05/18 | | | | MXN | | | | 16,034 | | | | 32,534 | | | | 22 | | | | 32,512 | |
4.70%1 | | | 28-day MXIBTIIE | | | Bank of America N.A. | | | 12/06/18 | | | | MXN | | | | 16,034 | | | | 33,507 | | | | 21 | | | | 33,486 | |
4.76%1 | | | 28-day MXIBTIIE | | | Citibank N.A. | | | 12/06/18 | | | | MXN | | | | 16,034 | | | | 32,680 | | | | 22 | | | | 32,658 | |
11.00%2 | | | 1-day BZDIOVER | | | Bank of America N.A. | | | 1/02/20 | | | | BRL | | | | 19,004 | | | | 168,079 | | | | — | | | | 168,079 | |
9.73%2 | | | 1-day BZDIOVER | | | Citibank N.A. | | | 1/02/20 | | | | BRL | | | | 54,985 | | | | 41,542 | | | | — | | | | 41,542 | |
11.02%2 | | | 1-day BZDIOVER | | | Citibank N.A. | | | 1/02/20 | | | | BRL | | | | 10,125 | | | | 91,254 | | | | — | | | | 91,254 | |
11.10%2 | | | 1-day BZDIOVER | | | Goldman Sachs International | | | 1/02/20 | | | | BRL | | | | 9,502 | | | | 90,464 | | | | — | | | | 90,464 | |
9.73%2 | | | 1-day BZDIOVER | | | JPMorgan Chase Bank N.A. | | | 1/02/20 | | | | BRL | | | | 54,985 | | | | 41,542 | | | | — | | | | 41,542 | |
9.73%2 | | | 1-day BZDIOVER | | | JPMorgan Chase Bank N.A. | | | 1/02/20 | | | | BRL | | | | 54,985 | | | | 41,542 | | | | — | | | | 41,542 | |
10.98%2 | | | 1-day BZDIOVER | | | JPMorgan Chase Bank N.A. | | | 1/02/20 | | | | BRL | | | | 9,503 | | | | 81,875 | | | | — | | | | 81,875 | |
11.38%2 | | | 1-day BZDIOVER | | | JPMorgan Chase Bank N.A. | | | 1/02/20 | | | | BRL | | | | 3,648 | | | | 44,383 | | | | — | | | | 44,383 | |
3.27%1 | | | 3-month LIBOR | | | Deutsche Bank AG | | | 5/16/21 | | | | USD | | | | 9,510 | | | | (601,286 | ) | | | — | | | | (601,286 | ) |
5.73%1 | | | 28-day MXIBTIIE | | | Bank of America N.A. | | | 1/03/25 | | | | MXN | | | | 23,376 | | | | 120,868 | | | | 262 | | | | 120,606 | |
6.33%2 | | | 28-day MXIBTIIE | | | Citibank N.A. | | | 6/09/25 | | | | MXN | | | | 14,869 | | | | (50,043 | ) | | | (81 | ) | | | (49,962 | ) |
6.33%2 | | | 28-day MXIBTIIE | | | Citibank N.A. | | | 7/17/25 | | | | MXN | | | | 36,610 | | | | (125,854 | ) | | | (161 | ) | | | (125,693 | ) |
6.32%2 | | | 28-day MXIBTIIE | | | Goldman Sachs International | | | 8/06/25 | | | | MXN | | | | 109,616 | | | | (379,481 | ) | | | (479 | ) | | | (379,002 | ) |
6.31%1 | | | 28-day MXIBTIIE | | | Bank of America N.A. | | | 8/11/25 | | | | MXN | | | | 36,783 | | | | 129,465 | | | | 154 | | | | 129,311 | |
6.31%1 | | | 28-day MXIBTIIE | | | Bank of America N.A. | | | 8/11/25 | | | | MXN | | | | 36,783 | | | | 129,465 | | | | 154 | | | | 129,311 | |
6.31%1 | | | 28-day MXIBTIIE | | | Deutsche Bank AG | | | 8/11/25 | | | | MXN | | | | 136,536 | | | | 481,096 | | | | 571 | | | | 480,525 | |
6.27%2 | | | 28-day MXIBTIIE | | | Bank of America N.A. | | | 12/05/25 | | | | MXN | | | | 4,348 | | | | (16,473 | ) | | | (52 | ) | | | (16,421 | ) |
Total | | | | | | | | | | | | | | | | | | | | | $ 95,378 | | | | $8,169 | | | | $ 87,209 | |
| | | | | | | | | | | | | | | | | | | | | | |
| | 1 | | The Master Portfolio pays the fixed rate and receives the floating rate. |
| | 2 | | The Master Portfolio pays the floating rate and receives the fixed rate. |
OTC Total Return Swaps
| | | | | | | | | | | | | | | | | | | | | | | | | | | | |
| Reference Entity | | Floating Rate | | Counterparty | | Expiration
Date | | | Contract
Amount | | | Value | | | Premiums Paid
(Received) | | | Unrealized Appreciation
(Depreciation) | |
SPDR S&P Oil & Gas Explore & Production ETF | | 1-month LIBOR minus 0.65%1 | | Bank of America N.A. | | | 6/15/17 | | | | USD | | | | 15,232 | | | $ | (8,228 | ) | | | — | | | | $ (8,228 | ) |
SPDR S&P Oil & Gas Explore & Production ETF | | 1-month LIBOR minus 0.65%1 | | Bank of America N.A. | | | 6/16/17 | | | | USD | | | | 76,159 | | | | (71,632 | ) | | | — | | | | (71,632 | ) |
Aetna, Inc. | | 3-month LIBOR plus 0.20%2 | | Goldman Sachs International | | | 9/15/17 | | | | USD | | | | 10,599 | | | | 8,411 | | | | — | | | | 8,411 | |
SPDR S&P Retail ETF | | 1-month LIBOR minus 1.50%1 | | Bank of America N.A. | | | 9/15/17 | | | | USD | | | | 40,000 | | | | 9,660 | | | | — | | | | 9,660 | |
Aetna, Inc. | | 3-month LIBOR plus 0.20%2 | | Bank of America N.A. | | | 12/15/17 | | | | USD | | | | 26,987 | | | | (178,530 | ) | | | — | | | | (178,530 | ) |
Centene Corp. | | 3-month LIBOR plus 0.20%2 | | Bank of America N.A. | | | 12/15/17 | | | | USD | | | | 41,069 | | | | 109,723 | | | | — | | | | 109,723 | |
Ally Financial, Inc. | | 3-month LIBOR minus 0.30%1 | | Merrill Lynch International | | | 1/24/18 | | | | USD | | | | 1,100 | | | | (1,198 | ) | | | — | | | | (1,198 | ) |
Total | | | | | | | | | | | | | | | | | | $ | (131,794 | ) | | | — | | | | $(131,794 | ) |
| | | | | | | | | | | | | | | | | | | | |
| | 1 | | The Master Portfolio pays the total return of the reference entity and receives the floating rate. |
| | 2 | | The Master Portfolio pays the floating rate and receives the total return of the reference entity. |
See Notes to Consolidated Financial Statements.
| | | | | | |
| | | BLACKROCK BALANCED CAPITAL FUND, INC. | | MARCH 31, 2017 | | 91 |
| | | | |
| Consolidated Schedule of Investments (continued) | | | Master Total Return Portfolio | |
| | | | | | | | | | | | | | | | | | | | |
| Reference Entity | | Counterparty | | Expiration Dates | | Net Notional
Amount | | | Unrealized
Appreciation | | | Net Value of
Reference
Entities | |
Equity Securities Long/Short1 | | Bank of America N.A. | | 4/17/17-6/15/17 | | | USD | | | | 1,705,671 | | | | $41,815 | 2 | | | $1,748,636 | |
| | 1 | | The Master Portfolio receives or pays the total return on a portfolio of long and short positions underlying the total return swap. In addition, the Master Portfolio pays or receives a variable rate of interest, based on a specified benchmark, plus or minus a spread in a range of 20-120 basis points. The benchmark and spread are determined based upon the country and/or currency of the individual underlying positions. The following are the specified benchmarks used in determining the variable rate of interest: |
Intercontinental Exchange LIBOR:
EUR 1 Month
EUR 1 Week
GBP 1 Week
| | 2 | | Amount includes $(1,150) net of financing fees. |
The following tables represents the individual long and short positions and related values of equity securities underlying the total return swap with Bank of America N.A., as of March 31, 2017, expiration dates 4/17/17-6/15/17:
| | | | | | | | |
| | | Shares | | | Value | |
| Reference Entity — Long | | | | | | |
Eurobank Ergasias SA | | | 496,645 | | | $ | 303,459 | |
Hellenic Telecommunications Organization SA | | | 169,073 | | | | 1,588,469 | |
National Bank of Greece SA | | | 3,058,221 | | | | 782,581 | |
Total Reference Entity — Long | | | | | | | 2,674,509 | |
| | | | | | | | |
| | | Shares | | | Value | |
| Reference Entity — Short | | | | | | |
Deutsche Bank AG | | | (13,613 | ) | | $ | (234,022 | ) |
Deutsche Bank AG - Rights | | | (13,613 | ) | | | (32,530 | ) |
Tullow Oil PLC | | | (223,523 | ) | | | (659,321 | ) |
Total Reference Entity — Short | | | | | | | (925,873 | ) |
Net Value of Reference Entity — Bank of America N.A. | | | | | | $ | 1,748,636 | |
| | | | | | | | | | | | | | | | | | | | | | | | | | | | | | | | |
| OTC Total Return — Volatility Swaps | | | | | | | | | | | | | |
| Reference Entity | | Volatility
Strike Price | | | Counterparty | | | Expiration
Date | | | Notional
Amount (000) | | | Value | | | Premiums Paid
(Received) | | | Unrealized
Depreciation | |
EUR Currency | | | 8.95% | | | | BNP Paribas S.A. | | | | 6/05/17 | | | | EUR | | | | 117,520 | | | $ | (317,106 | ) | | | — | | | | $(317,106 | ) |
EUR Currency | | | 9.05% | | | | Deutsche Bank AG | | | | 6/05/17 | | | | EUR | | | | 58,766 | | | | (185,409 | ) | | | — | | | | (185,409 | ) |
EUR Currency | | | 8.95% | | | | Deutsche Bank AG | | | | 6/05/17 | | | | EUR | | | | 32,084 | | | | (86,573 | ) | | | — | | | | (86,573 | ) |
EUR Currency | | | 8.90% | | | | HSBC Bank PLC | | | | 6/05/17 | | | | EUR | | | | 85,460 | | | | (211,084 | ) | | | — | | | | (211,084 | ) |
Total | | | | | | | | | | | | | | | | | | | | | | $ | (800,172 | ) | | | — | | | | $(800,172 | ) |
| | | | | | | | | | | | | | | | | | | | | | | | |
See Notes to Consolidated Financial Statements.
| | | | | | |
| 92 | | BLACKROCK BALANCED CAPITAL FUND, INC. | | MARCH 31, 2017 | | |
| | | | |
| Consolidated Schedule of Investments (continued) | | | Master Total Return Portfolio | |
|
| Transactions in Options Written for the Six Months Ended March 31, 2017 |
| | | | | | | | | | | | | | | | | | | | | | | | | | | | | | | | | | | | | | | | | | | | | | | | | | | | |
| | | Calls | |
| | | | | | | | | Notional (000) | |
| | | Number of
Contracts | | | | | | AUD | | | | | | EUR | | | | | | GBP | | | | | | MXN | | | | | | USD | | | | | | Premiums
Received | |
| | | | |
Outstanding options, beginning of period | | | 32,985 | | | | | | | | — | | | | | | | | 196,495 | | | | | | | | — | | | | | | | | — | | | | | | | | 434,254 | | | | | | | $ | 6,644,464 | |
Options written | | | 70,547 | | | | | | | | 61,781 | | | | | | | | 1,362,978 | | | | | | | | 88,100 | | | | | | | | 179,050 | | | | | | | | 1,332,142 | | | | | | | | 30,622,581 | |
Options exercised | | | — | | | | | | | | — | | | | | | | | (95,300 | ) | | | | | | | — | | | | | | | | — | | | | | | | | (182,017 | ) | | | | | | | (3,012,658 | ) |
Options expired | | | (16,685) | | | | | | | | — | | | | | | | | (1,084,272 | ) | | | | | | | (24,100 | ) | | | | | | | — | | | | | | | | (627,740 | ) | | | | | | | (11,339,060 | ) |
Options closed | | | (80,436) | | | | | | | | — | | | | | | | | (269,075 | ) | | | | | | | (15,900 | ) | | | | | | | — | | | | | | | | (637,911 | ) | | | | | | | (16,572,140 | ) |
| | | | |
Outstanding options, end of period | | | 6,411 | | | | | | | | 61,781 | | | | | | | | 110,826 | | | | | | | | 48,100 | | | | | | | | 179,050 | | | | | | | | 318,728 | | | | | | | $ | 6,343,187 | |
| | | | |
| | | | | | | | | | | | | | | | | | | | | | | | | | | | | | | | | | | | | | | | | | | | | | | | | | | | | | | | | | | | |
| | | Puts | |
| | | | | | Notional (000) | |
| | | Number of Contracts | | | | | | AUD | | | | | | CAD | | | | | | EUR | | | | | | GBP | | | | | | MXN | | | | | | USD | | | | | | Premiums
Received | |
| | | | |
Outstanding options, beginning of period | | | 31,349 | | | | | | | | 289,100 | | | | | | | | — | | | | | | | | 36,400 | | | | | | | | 138,400 | | | | | | | | — | | | | | | | | 160,843 | | | | | | | $ | 6,885,870 | |
Options written | | | 149,710 | | | | | | | | 208,800 | | | | | | | | 117,775 | | | | | | | | 722,824 | | | | | | | | 191,563 | | | | | | | | 59,681 | | | | | | | | 2,593,475 | | | | | | | | 43,709,352 | |
Options exercised | | | — | | | | | | | | (144,633 | ) | | | | | | | — | | | | | | | | (181,677 | ) | | | | | | | (228,800 | ) | | | | | | | — | | | | | | | | (99,566 | ) | | | | | | | (7,578,351 | ) |
Options expired | | | (47,554) | | | | | | | | (241,200 | ) | | | | | | | — | | | | | | | | (356,306 | ) | | | | | | | (90,463 | ) | | | | | | | — | | | | | | | | (278,140 | ) | | | | | | | (9,344,766 | ) |
Options closed | | | (123,488) | | | | | | | | (47,767 | ) | | | | | | | (69,700 | ) | | | | | | | (221,241 | ) | | | | | | | — | | | | | | | | (59,681 | ) | | | | | | | (2,276,996 | ) | | | | | | | (30,680,280 | ) |
| | | | |
Outstanding options, end of period | | | 10,017 | | | | | | | | 64,300 | | | | | | | | 48,075 | | | | | | | | — | | | | | | | | 10,700 | | | | | | | | — | | | | | | | | 99,616 | | | | | | | $ | 2,991,825 | |
| | | | |
|
| Derivative Financial Instruments Categorized by Risk Exposure |
As of period end, the fair values of derivative financial instruments located in the Consolidated Statement of Assets and Liabilities were as follows:
| | | | | | | | | | | | | | | | | | | | | | | | | | | | | | |
| Assets - Derivative Financial Instruments | | Commodity Contracts | | | Credit Contracts | | | Equity Contracts | | | Foreign Currency Exchange
Contracts | | | Interest
Rate Contracts | | | Other Contracts | | | Total | |
Futures contracts | | Net unrealized appreciation1 | | | $380,094 | | | | — | | | $ | 198,634 | | | | — | | | $ | 4,155,796 | | | | — | | | $ | 4,734,524 | |
Forward foreign currency exchange contracts | | Unrealized appreciation on forward foreign currency exchange contracts | | | — | | | | — | | | | — | | | $ | 15,147,589 | | | | — | | | | — | | | | 15,147,589 | |
Options purchased | | Investments at value — unaffiliated2 | | | — | | | | — | | | | 2,625,822 | | | | 14,294,478 | | | | 1,620,938 | | | | — | | | | 18,541,238 | |
Swaps - centrally cleared | | Net unrealized appreciation1 | | | — | | | | $ 114,477 | | | | — | | | | — | | | | 1,113,323 | | | | $729,140 | | | | 1,956,940 | |
Swaps - OTC | | Unrealized appreciation on OTC swaps; Swap premiums paid | | | — | | | | 7,885,198 | | | | 169,609 | | | | — | | | | 1,710,494 | | | | — | | | | 9,765,301 | |
Total | | | | | $380,094 | | | | $7,999,675 | | | $ | 2,994,065 | | | $ | 29,442,067 | | | $ | 8,600,551 | | | | $729,140 | | | $ | 50,145,592 | |
| | | | | | |
| | | | | | | | | | | | | | | | | | | | | | | | | | | | | | |
| Liabilities - Derivative Financial Instruments | | | | | | | | | | | | | | | | | | | | | |
Futures contracts | | Net unrealized depreciation1 | | | $378,881 | | | | — | | | $ | 77,110 | | | | — | | | $ | 2,117,422 | | | | — | | | $ | 2,573,413 | |
Forward foreign currency exchange contracts | | Unrealized depreciation on forward foreign currency exchange contracts | | | — | | | | — | | | | — | | | $ | 20,847,218 | | | | — | | | | — | | | | 20,847,218 | |
Options written | | Options written at value | | | — | | | | — | | | | 1,138,216 | | | | 6,691,591 | | | | 41,080 | | | | — | | | | 7,870,887 | |
Swaps - centrally cleared | | Net unrealized depreciation1 | | | — | | | $ | 461,899 | | | | — | | | | — | | | | 1,168,287 | | | | $295,238 | | | | 1,925,424 | |
Swaps - OTC | | Unrealized depreciation on OTC swaps; Swap premiums received | | | — | | | | 11,488,583 | | | | 259,588 | | | | — | | | | 2,415,288 | | | | — | | | | 14,163,459 | |
Total | | | | | $378,881 | | | $ | 11,950,482 | | | $ | 1,474,914 | | | $ | 27,538,809 | | | $ | 5,742,077 | | | | $295,238 | | | $ | 47,380,401 | |
| | | | | | |
| | 1 | | Includes cumulative appreciation (depreciation) on futures contracts and centrally cleared swaps, if any, as reported in the Consolidated Schedule of Investments. Only current day’s variation margin is reported within the Consolidated Statement of Assets and Liabilities. |
| | 2 | | Includes options purchased at value as reported in the Consolidated Schedule of Investments. |
See Notes to Consolidated Financial Statements.
| | | | | | |
| | | BLACKROCK BALANCED CAPITAL FUND, INC. | | MARCH 31, 2017 | | 93 |
| | | | |
| Consolidated Schedule of Investments (continued) | | | Master Total Return Portfolio | |
| | | | | | | | | | | | | | | | | | | | | | | | | | | | |
For the six months ended March 31, 2017, the effect of derivative financial instruments in the Consolidated Statement of Operations was as follows: | |
| Net Realized Gain (Loss) from: | | Commodity Contracts | | | Credit Contracts | | | Equity Contracts | | | Foreign Currency
Exchange Contracts | | | Interest Rate Contracts | | | Other Contracts | | | Total | |
Futures contracts | | | $(238,260) | | | | — | | | $ | (137,260 | ) | | | — | | | $ | 23,746,458 | | | | — | | | $ | 23,370,938 | |
Forward foreign currency exchange contracts | | | — | | | | — | | | | — | | | | $ 41,640,354 | | | | — | | | | — | | | | 41,640,354 | |
Interest rate caps | | | — | | | | — | | | | — | | | | — | | | | (11,360 | ) | | | — | | | | (11,360 | ) |
Options purchased1 | | | — | | | | — | | | | (16,089,452 | ) | | | (21,114,793 | ) | | | 19,473,904 | | | | — | | | | (17,730,341 | ) |
Options written | | | — | | | $ | 302,906 | | | | 2,303,617 | | | | 17,718,973 | | | | (11,558,142 | ) | | | — | | | | 8,767,354 | |
Swaps | | | — | | | | (2,243,656 | ) | | | (1,311,789 | ) | | | — | | | | 15,832,439 | | | | — | | | | 12,276,994 | |
| | | | |
| | | $(238,260) | | | $ | (1,940,750 | ) | | $ | (15,234,884 | ) | | | $ 38,244,534 | | | $ | 47,483,299 | | | | — | | | $ | 68,313,939 | |
| | | | |
| | 1 | | Options purchased are included in net realized gain (loss) from investments. |
| | | | | | | | | | | | | | | | | | | | | | | | | | | | |
Net Change in Unrealized Appreciation
(Depreciation) on: | | Commodity Contracts | | | Credit Contracts | | | Equity Contracts | | | Foreign Currency
Exchange Contracts | | | Interest Rate Contracts | | | Other Contracts | | | Total | |
Futures contracts | | | $2,246 | | | | — | | | $ | 144,977 | | | | — | | | | $2,429,932 | | | | — | | | | $ 2,577,155 | |
Forward foreign currency exchange contracts | | | — | | | | — | | | | — | | | | $(2,223,052 | ) | | | — | | | | — | | | | (2,223,052 | ) |
Interest rate caps | | | — | | | | — | | | | — | | | | — | | | | 11,341 | | | | — | | | | 11,341 | |
Options purchased2 | | | — | | | | — | | | | 6,613,386 | | | | 1,371,653 | | | | 5,468 | | | | — | | | | 7,990,507 | |
Options written | | | — | | | | — | | | | (1,715,295 | ) | | | (2,564,826 | ) | | | (66,325 | ) | | | — | | | | (4,346,446 | ) |
Swaps | | | — | | | $ | (1,691,876 | ) | | | 640,208 | | | | — | | | | 2,708,368 | | | | $433,902 | | | | 2,090,602 | |
| | | | |
Total | | | $2,246 | | | $ | (1,691,876 | ) | | $ | 5,683,276 | | | | $(3,416,225 | ) | | | $5,088,784 | | | | $433,902 | | | | $ 6,100,107 | |
| | | | |
| | 2 | | Options purchased are included in net change in unrealized appreciation (depreciation) on investments. |
| | |
| Average Quarterly Balances of Outstanding Derivative Financial Instruments | | |
| | | | |
Futures contracts: | | | | |
Average notional value of contracts — long | | $ | 891,596,454 | |
Average notional value of contracts — short | | $ | 1,212,693,292 | |
Forward foreign currency exchange contracts: | | | | |
Average amounts purchased — in USD | | $ | 976,098,406 | |
Average amounts sold — in USD | | $ | 500,102,210 | |
Options: | | | | |
Average value of option contracts purchased | | $ | 16,903,006 | |
Average value of option contracts written | | $ | 7,248,226 | |
Average notional value of swaption contracts purchased | | $ | 37,800,000 | |
Average notional value of swaption contracts written | | $ | 28,345,156 | |
Credit default swaps: | | | | |
Average notional value — buy protection | | $ | 764,692,241 | |
Average notional value — sell protection | | $ | 332,448,310 | |
Interest rate swaps: | | | | |
Average notional value — pays fixed rate | | $ | 542,051,972 | |
Average notional value — receives fixed rate | | $ | 1,020,035,658 | |
Total return swaps: | | | | |
Average notional value | | $ | 168,715,136 | |
|
| For more information about the Master Portfolio’s investment risks regarding derivative financial instruments, refer to the Consolidated Notes to Financial Statements. |
See Notes to Consolidated Financial Statements.
| | | | | | |
| 94 | | BLACKROCK BALANCED CAPITAL FUND, INC. | | MARCH 31, 2017 | | |
| | | | |
| Consolidated Schedule of Investments (continued) | | | Master Total Return Portfolio | |
| | | | |
| Derivative Financial Instruments – Offsetting as of Period End | | | | |
The Master Portfolio’s derivative assets and liabilities (by type) were as follows:
| | | | | | | | | | | | | | | | | | | | |
| | | | | | Assets | | | | | | Liabilities | | | | |
Derivative Financial Instruments: | | | | | | | | | | | | | | | | | | | | |
Futures contracts | | | | | | | $ 1,175,422 | | | | | | | | $ 1,579,207 | | | | | |
Forward foreign currency exchange contracts | | | | | | | 15,147,589 | | | | | | | | 20,847,218 | | | | | |
Options | | | | | | | 18,541,238 | 1 | | | | | | | 7,870,887 | | | | | |
Swaps - Centrally cleared | | | | | | | — | | | | | | | | 851,000 | | | | | |
Swaps - OTC2 | | | | | | | 9,765,301 | | | | | | | | 14,163,459 | | | | | |
| | | | |
Total derivative assets and liabilities in the Consolidated Statements of Assets and Liabilities | | | | | | | $44,629,550 | | | | | | | | $45,311,771 | | | | | |
Derivatives not subject to a Master Netting Agreement or similar agreement (“MNA”) | | | | | | | (5,189,077 | ) | | | | | | | (3,568,390 | ) | | | | |
| | | | |
Total derivative assets and liabilities subject to an MNA | | | | | | | $39,440,473 | | | | | | | | $41,743,381 | | | | | |
| | | | |
| | 1 | | Includes options purchased at value which is included in Investments at value — unaffiliated in the Consolidated Statement of Assets and Liabilities and reported in the Consolidated Schedule of Investments. |
| | 2 | | Includes unrealized appreciation (depreciation) on OTC swaps and swap premiums paid/received in the Consolidated Statement of Assets and Liabilities. |
The following tables present the Master Portfolio’s derivative assets and liabilities by counterparty net of amounts for offset under an MNA and net of the related collateral received and pledged by the Master Portfolio:
| | | | | | | | | | | | | | | | | | | | | | | | | | | | | | | | | | | | | | | | |
| Counterparty | | | | | Derivative Assets Subject to an MNA by Counterparty | | | | | | Derivatives Available for Offset1 | | | | | | Non-cash Collateral Received | | | | | | Cash Collateral Received2 | | | | | | Net Amount of
Derivative Assets3,6 | |
Bank of America N.A. | | | | | | | $ 2,676,321 | | | | | | | | $ (2,274,025 | ) | | | | | | | $(402,296 | ) | | | | | | | — | | | | | | | | — | |
Barclays Bank PLC | | | | | | | 1,847,609 | | | | | | | | (1,847,609 | ) | | | | | | | — | | | | | | | | — | | | | | | | | — | |
BNP Paribas S.A. | | | | | | | 4,983,637 | | | | | | | | (3,397,426 | ) | | | | | | | — | | | | | | | | $(1,586,211 | ) | | | | | | | — | |
Citibank N.A. | | | | | | | 4,710,510 | | | | | | | | (4,710,510 | ) | | | | | | | — | | | | | | | | — | | | | | | | | — | |
Credit Suisse International | | | | | | | 320,456 | | | | | | | | (320,456 | ) | | | | | | | — | | | | | | | | — | | | | | | | | — | |
Deutsche Bank AG | | | | | | | 2,139,495 | | | | | | | | (2,139,495 | ) | | | | | | | — | | | | | | | | — | | | | | | | | — | |
Goldman Sachs International | | | | | | | 2,161,152 | | | | | | | | (2,161,152 | ) | | | | | | | — | | | | | | | | — | | | | | | | | — | |
HSBC Bank PLC | | | | | | | 2,291,951 | | | | | | | | (2,041,132 | ) | | | | | | | (250,819 | ) | | | | | | | — | | | | | | | | — | |
J.P. Morgan Securities LLC | | | | | | | 504,794 | | | | | | | | (164,521 | ) | | | | | | | — | | | | | | | | (340,000 | ) | | | | | | | $ 273 | |
JPMorgan Chase Bank N.A. | | | | | | | 6,770,687 | | | | | | | | (6,267,523 | ) | | | | | | | — | | | | | | | | (503,164 | ) | | | | | | | — | |
Morgan Stanley & Co. International PLC | | | | | | | 1,384,945 | | | | | | | | (1,384,945 | ) | | | | | | | — | | | | | | | | — | | | | | | | | — | |
Nomura International PLC | | | | | | | 4,388,401 | | | | | | | | (40,347 | ) | | | | | | | — | | | | | | | | — | | | | | | | | 4,348,054 | |
Northern Trust Corp. | | | | | | | 9,341 | | | | | | | | — | | | | | | | | — | | | | | | | | — | | | | | | | | 9,341 | |
Royal Bank of Canada | | | | | | | 5,025 | | | | | | | | (5,025 | ) | | | | | | | — | | | | | | | | — | | | | | | | | — | |
Royal Bank of Scotland PLC | | | | | | | 4,411,455 | | | | | | | | (2,654,265 | ) | | | | | | | — | | | | | | | | — | | | | | | | | 1,757,190 | |
Société Générale | | | | | | | 488,348 | | | | | | | | (488,348 | ) | | | | | | | — | | | | | | | | — | | | | | | | | — | |
Standard Chartered Bank | | | | | | | 93,015 | | | | | | | | (8,532 | ) | | | | | | | — | | | | | | | | — | | | | | | | | 84,483 | |
State Street Bank and Trust Co. | | | | | | | 76,542 | | | | | | | | (76,542 | ) | | | | | | | — | | | | | | | | — | | | | | | | | — | |
TD Securities, Inc. | | | | | | | 16,281 | | | | | | | | (16,281 | ) | | | | | | | — | | | | | | | | — | | | | | | | | — | |
UBS AG | | | | | | | 160,508 | | | | | | | | (160,508 | ) | | | | | | | — | | | | | | | | — | | | | | | | | — | |
| | | | |
Total | | | | | | | $39,440,473 | | | | | | �� | | $(30,158,642 | ) | | | | | | | $(653,115 | ) | | | | | | | $(2,429,375 | ) | | | | | | | $6,199,341 | |
| | | | |
| | | | | | | | | | | | | | | | | | | | | | | | | | | | | | | |
| Counterparty | | | | | Derivative Liabilities Subject to an MNA by Counterparty | | | | | | Derivatives Available for Offset1 | | | | | | Non-cash Collateral Pledged | | | | | | Cash Collateral Pledged4 | | | | | | Net Amount of Derivative Liabilities5,6 | |
Bank of America N.A. | | | | | | | $2,274,025 | | | | | | | | $(2,274,025 | ) | | | | | | | — | | | | | | | | — | | | | | | | | — | |
Barclays Bank PLC | | | | | | | 1,863,110 | | | | | | | | (1,847,609 | ) | | | | | | | — | | | | | | | | — | | | | | | | | $ 15,501 | |
BNP Paribas S.A. | | | | | | | 3,397,426 | | | | | | | | (3,397,426 | ) | | | | | | | — | | | | | | | | — | | | | | | | | — | |
Citibank N.A | | | | | | | 6,821,092 | | | | | | | | (4,710,510 | ) | | | | | | | — | | | | | | | | — | | | | | | | | 2,110,582 | |
Credit Suisse International | | | | | | | 3,853,183 | | | | | | | | (320,456 | ) | | | | | | | — | | | | | | | | $(3,532,727 | ) | | | | | | | — | |
Deutsche Bank AG | | | | | | | 2,570,876 | | | | | | | | (2,139,495 | ) | | | | | | | — | | | | | | | | (230,000 | ) | | | | | | | 201,381 | |
Goldman Sachs International | | | | | | | 3,640,861 | | | | | | | | (2,161,152 | ) | | | | | | | — | | | | | | | | (1,479,709 | ) | | | | | | | — | |
HSBC Bank PLC | | | | | | | 2,041,132 | | | | | | | | (2,041,132 | ) | | | | | | | — | | | | | | | | — | | | | | | | | — | |
J.P. Morgan Securities LLC | | | | | | | 164,521 | | | | | | | | (164,521 | ) | | | | | | | — | | | | | | | | — | | | | | | | | — | |
JPMorgan Chase Bank N.A. | | | | | | | 6,267,523 | | | | | | | | (6,267,523 | ) | | | | | | | — | | | | | | | | — | | | | | | | | — | |
Merrill Lynch International | | | | | | | 1,198 | | | | | | | | — | | | | | | | | — | | | | | | | | — | | | | | | | | 1,198 | |
See Notes to Consolidated Financial Statements.
| | | | | | |
| | | BLACKROCK BALANCED CAPITAL FUND, INC. | | MARCH 31, 2017 | | 95 |
| | | | |
| Consolidated Schedule of Investments (continued) | | | Master Total Return Portfolio | |
| | | | | | | | | | | | | | | | | | | | | | | | | | | | | | | | | | | | |
| Counterparty | | | | Derivative Liabilities Subject to an MNA by Counterparty | | | | | | Derivatives Available for Offset1 | | | | | | Non-cash Collateral Pledged | | | | | Cash Collateral Pledged4 | | | | | | Net Amount of
Derivative Liabilities5,6 | |
Morgan Stanley & Co. International PLC | | | | | $ 4,161,890 | | | | | | | | $ (1,384,945 | ) | | | | | | — | | | | | | | — | | | | | | | | $2,776,945 | |
Nomura International PLC | | | | | 40,347 | | | | | | | | (40,347 | ) | | | | | | — | | | | | | | — | | | | | | | | — | |
Royal Bank of Canada | | | | | 20,260 | | | | | | | | (5,025 | ) | | | | | | — | | | | | | | — | | | | | | | | 15,235 | |
Royal Bank of Scotland PLC | | | | | 2,654,265 | | | | | | | | (2,654,265 | ) | | | | | | — | | | | | | | — | | | | | | | | — | |
Société Générale | | | | | 1,622,136 | | | | | | | | (488,348 | ) | | | | | | — | | | | | | | $ (590,000 | ) | | | | | | | 543,788 | |
Standard Chartered Bank | | | | | 8,532 | | | | | | | | (8,532 | ) | | | | | | — | | | | | | | — | | | | | | | | — | |
State Street Bank and Trust Co. | | | | | 79,387 | | | | | | | | (76,542 | ) | | | | | | — | | | | | | | — | | | | | | | | 2,845 | |
TD Securities, Inc. | | | | | 19,174 | | | | | | | | (16,281 | ) | | | | | | — | | | | | | | — | | | | | | | | 2,893 | |
UBS AG | | | | | 232,928 | | | | | | | | (160,508 | ) | | | | | | — | | | | | | | — | | | | | | | | 72,420 | |
Westpac Banking Corp. | | | | | 9,515 | | | | | | | | — | | | | | | | — | | | | | | | — | | | | | | | | 9,515 | |
| | | |
Total | | | | | $41,743,381 | | | | | | | | $(30,158,642 | ) | | | | | | — | | | | | | | $(5,832,436 | ) | | | | | | | $5,752,303 | |
| | | |
| | 1 | | The amount of derivatives available for offset is limited to the amount of derivative assets and/or liabilities that are subject to an MNA. |
| | 2 | | Excess of collateral received from the individual counterparty is not shown for financial reporting purposes. |
| | 3 | | Net amount represents the net amount receivable from the counterparty in the event of default. |
| | 4 | | Excess of collateral pledged to the individual counterparty is not shown for financial reporting purposes. |
| | 5 | | Net amount represents the net amount payable due to the counterparty in the event of default. Net amount may be offset further by the options written receivable/payable on the Consolidated Statement of Assets and Liabilities. |
| | 6 | | Net amount may also include forward foreign currency exchange contracts that are not required to be collateralized. |
|
| Fair Value Hierarchy as of Period End |
Various inputs are used in determining the fair value of investments and derivative financial instruments. For information about the Master Portfolio’s policy regarding valuation of investments and derivative financial instruments, refer to the Consolidated Notes to Financial Statements.
The following tables summarize the Master Portfolio’s investments and derivative financial instruments categorized in the disclosure hierarchy:
| | | | | | | | | | | | | | | | |
| | | Level 1 | | | Level 2 | | | Level 3 | | | Total | |
Assets: | | | | | | | | | | | | | | | | |
Investments: | | | | | | | | | | | | | | | | |
Long-Term Investments: | | | | | | | | | | | | | | | | |
Asset-Backed Securities | | | — | | | $ | 1,023,309,371 | | | $ | 72,417,304 | | | $ | 1,095,726,675 | |
Common Stocks1 | | $ | 55,965,085 | | | | 707,649 | | | | 1,259,289 | | | | 57,932,023 | |
Corporate Bonds1 | | | — | | | | 2,750,137,019 | | | | 60,367 | | | | 2,750,197,386 | |
Floating Rate Loan Interests1 | | | — | | | | 26,273,133 | | | | 1,841,601 | | | | 28,114,734 | |
Foreign Agency Obligations | | | — | | | | 75,406,889 | | | | — | | | | 75,406,889 | |
Foreign Government Obligations | | | — | | | | 548,587,642 | | | | — | | | | 548,587,642 | |
Investment Companies | | | 107,084,772 | | | | — | | | | — | | | | 107,084,772 | |
Non-Agency Mortgage-Backed Securities | | | — | | | | 533,961,807 | | | | 84,377,186 | | | | 618,338,993 | |
Other Interests1 | | | — | | | | — | | | | 1 | | | | 1 | |
Preferred Securities1 | | | 9,312,576 | | | | 50,488,350 | | | | 1,390,279 | | | | 61,191,205 | |
Taxable Municipal Bonds | | | — | | | | 266,973,595 | | | | — | | | | 266,973,595 | |
U.S. Government Sponsored Agency Securities | | | — | | | | 7,012,621,551 | | | | 3,510,608 | | | | 7,016,132,159 | |
U.S. Treasury Obligations | | | — | | | | 2,470,674,309 | | | | — | | | | 2,470,674,309 | |
Short-Term Securities: | | | | | | | | | | | | | | | | |
Borrowed Bond Agreements | | | — | | | | 578,434,140 | | | | — | | | | 578,434,140 | |
Certificates of Deposit | | | — | | | | 199,903,419 | | | | — | | | | 199,903,419 | |
Commercial Paper | | | — | | | | 100,504,961 | | | | — | | | | 100,504,961 | |
Options Purchased: | | | | | | | | | | | | | | | | |
Equity contracts | | | 2,614,908 | | | | 10,914 | | | | — | | | | 2,625,822 | |
Foreign currency exchange contracts | | | — | | | | 14,294,478 | | | | — | | | | 14,294,478 | |
Interest rate contracts | | | 1,398,747 | | | | 222,191 | | | | — | | | | 1,620,938 | |
See Notes to Consolidated Financial Statements.
| | | | | | |
| 96 | | BLACKROCK BALANCED CAPITAL FUND, INC. | | MARCH 31, 2017 | | |
| | | | |
| Consolidated Schedule of Investments (continued) | | | Master Total Return Portfolio | |
| | | | | | | | | | | | | | | | |
| | | Level 1 | | | Level 2 | | | Level 3 | | | Total | |
Liabilities: | | | | | | | | | | | | | | | | |
Investments: | | | | | | | | | | | | | | | | |
TBA Sale Commitments | | | — | | | $ | (4,078,361,388 | ) | | | — | | | $ | (4,078,361,388 | ) |
Borrowed Bonds | | | — | | | | (522,650,062 | ) | | | — | | | | (522,650,062 | ) |
| | | | |
Subtotal | | $ | 176,376,088 | | | $ | 11,051,499,968 | | | $ | 164,856,635 | | | $ | 11,392,732,691 | |
| | | | |
Investments Valued at NAV2 | | | | | | | | | | | | | | | 19,436,717 | |
| | | | | | | | | | | | | | | | |
Total Investments | | | | | | | | | | | | | | $ | 11,412,169,408 | |
| | | | | | | | | | | | | | | | |
| | 1 | | See above Consolidated Schedule of Investments for values in each industry. |
| | 2 | | As of March 31, 2017, certain investments of the Master Portfolio were fair valued using NAV per share as no quoted market value is available and therefore have been excluded from the fair value hierarchy. |
| | | | | | | | | | | | | | |
Derivative Financial Instruments1 | | | | | | | | | | $ 164,856,635 | | | | |
Assets: | | | | | | | | | | | | | | |
Commodity contracts | | $ | 380,094 | | | | — | | | — | | $ | 380,094 | |
Credit contracts | | | — | | | $ | 2,216,815 | | | — | | | 2,216,815 | |
Equity contracts | | | 198,634 | | | | 169,609 | | | — | | | 368,243 | |
Foreign currency exchange contracts | | | — | | | | 15,147,589 | | | — | | | 15,147,589 | |
Interest rate contracts | | | 4,155,796 | | | | 2,813,903 | | | — | | | 6,969,699 | |
Other contracts | | | — | | | | 729,140 | | | — | | | 729,140 | |
Liabilities: | | | | | | | | | | | | | | |
Commodity contracts | | | (378,881 | ) | | | — | | | — | | | (378,881 | ) |
Credit contracts | | | — | | | | (3,564,847 | ) | | — | | | (3,564,847 | ) |
Equity contracts | | | (1,215,293 | ) | | | (259,621 | ) | | — | | | (1,474,914 | ) |
Foreign currency exchange contracts | | | — | | | | (27,538,809 | ) | | — | | | (27,538,809 | ) |
Interest rate contracts | | | (2,117,422 | ) | | | (3,622,910 | ) | | — | | | (5,740,332 | ) |
Other contracts | | | — | | | | (295,238 | ) | | — | | | (295,238 | ) |
Total | | $ | 1,022,928 | | | $ | (14,204,369 | ) | | — | | $ | (13,181,441 | ) |
| | | | |
| | 1 | | Derivative financial instruments are swaps, futures contracts, forward foreign currency exchange contracts and options written. Swaps, futures contracts and forward foreign currency exchange contracts are valued at the unrealized appreciation (depreciation) on the instrument and options written are shown at value. |
|
The Master Portfolio may hold assets and/or liabilities in which the fair value approximates the carrying amount or face value, including accrued interest, for financial statement purposes. As of period end, Reverse Repurchase Agreements of $1,657,123,934 are categorized as Level 2 within the disclosure hierarchy. During the six months ended March 31, 2017, there were no transfers between Level 1 and Level 2. |
See Notes to Consolidated Financial Statements.
| | | | | | |
| | | BLACKROCK BALANCED CAPITAL FUND, INC. | | MARCH 31, 2017 | | 97 |
| | | | |
| Consolidated Schedule of Investments (concluded) | | | Master Total Return Portfolio | |
|
| A reconciliation of Level 3 investments is presented when the Master Portfolio had a significant amount of Level 3 investments at the beginning and/or end of the period in relation to net assets. The following table is a reconciliation of Level 3 investments for which significant unobservable inputs were used in determining fair value: |
| | | | | | | | | | | | | | | | | | | | | | | | | | | | | | | | | | | | |
| | | Asset-Backed
Securities | | | Common Stocks | | | Corporate Bonds | | | Floating Rate Loan Interests | | | Non-Agency
Mortgage- Backed Securities | | | Other Interests | | | Preferred Securities | | | U.S. Government Sponsored Agency Securities | | | Total | |
Assets: | | | | | | | | | | | | | | | | | | | | | | | | | | | | | | | | | | | | |
Opening Balance, as of September 30, 2016 | | $ | 266,733,316 | | | | — | | | $ | 261,490 | | | $ | 386,154 | | | $ | 103,933,840 | | | $ | 1 | | | $ | 1,611,077 | | | $ | 7,671,767 | | | $ | 380,597,645 | |
Transfers into Level 3 | | | — | | | | — | | | | — | | | | 811,849 | | | | 5,668,621 | | | | — | | | | — | | | | — | | | | 6,480,470 | |
Transfers out of Level 31 | | | (199,694,251 | ) | | | — | | | | (168,475 | ) | | | (386,154 | ) | | | (30,058,125 | ) | | | — | | | | — | | | | (7,671,767 | ) | | | (237,978,772 | ) |
Other2 | | | 4,430,000 | | | | — | | | | — | | | | — | | | | (4,430,000 | ) | | | — | | | | — | | | | — | | | | — | |
Accrued discounts/premiums | | | 16,413 | | | | — | | | | (3,523 | ) | | | 970 | | | | 421,368 | | | | — | | | | — | | | | — | | | | 435,228 | |
Net realized gain (loss) | | | 8,615 | | | | — | | | | 1,682 | | | | — | | | | (352,591 | ) | | | — | | | | — | | | | — | | | | (342,294 | ) |
Net change in unrealized appreciation (depreciation)3,4 | | | (70,562 | ) | | $ | (44,998 | ) | | | (17,552 | ) | | | (44,721 | ) | | | 11,054 | | | | — | | | | (220,798 | ) | | | 5,608 | | | | (381,969 | ) |
Purchases | | | 46,717,912 | | | | 1,304,287 | | | | — | | | | 1,073,503 | | | | 50,706,729 | | | | — | | | | — | | | | 3,505,000 | | | | 103,307,431 | |
Sales | | | (45,724,139 | ) | | | — | | | | (13,255 | ) | | | — | | | | (41,523,710 | ) | | | — | | | | — | | | | — | | | | (87,261,104 | ) |
| | | | |
Closing Balance, as of March 31, 2017 | | $ | 72,417,304 | | | $ | 1,259,289 | | | $ | 60,367 | | | $ | 1,841,601 | | | $ | 84,377,186 | | | | $ 1 | | | $ | 1,390,279 | | | $ | 3,510,608 | | | $ | 164,856,635 | |
| | | | |
Net change in unrealized appreciation (depreciation) on investments still held at March 31, 20174 | | $ | (55,545 | ) | | $ | (44,998 | ) | | $ | (17,552 | ) | | $ | (44,721 | ) | | $ | 142,987 | | | | — | | | $ | (220,798 | ) | | $ | 5,608 | | | $ | (235,019 | ) |
| | | | |
| | 1 | | As of September 30, 2016, the Master Portfolio used significant unobservable inputs in determining the value of certain investments. As of March 31, 2017, the Master Portfolio used observable inputs in determining the value of the same investments. As a result, investments at beginning of period value were transferred from Level 3 to Level 2 in the disclosure hierarchy. |
| | 2 | | Certain Level 3 investments were re-classified between Asset-Backed Securities and Non-Agency Mortgage-Backed Securities. |
| | 3 | | Included in the related net change in unrealized appreciation (depreciation) in the Consolidated Statement of Operations. |
| | 4 | | Any difference between net change in unrealized appreciation (depreciation) and net change in unrealized appreciation (depreciation) on investments still held at March 31, 2017, is generally due to investments no longer held or categorized as Level 3 at period end. |
|
| The Master Portfolio’s investments that are categorized as Level 3 were valued utilizing third party pricing information without adjustment. Such valuations are based on unobservable inputs. A significant change in third party information could result in a significantly lower or higher value of such Level 3 investments. |
See Notes to Consolidated Financial Statements.
| | | | | | |
| 98 | | BLACKROCK BALANCED CAPITAL FUND, INC. | | MARCH 31, 2017 | | |
| | | | |
| Consolidated Statement of Assets and Liabilities | | | Master Total Return Portfolio | |
| | | | |
| March 31, 2017 (Unaudited) | | | |
| | | | |
| Assets | | | | |
Investments at value — unaffiliated (including securities loaned at value of $19,014,132) (cost — $15,882,524,430) | | $ | 15,886,656,244 | |
Investments at value — affiliated (cost — $124,701,679) | | | 126,524,614 | |
Cash | | | 25,196,810 | |
Cash pledged: | | | | |
Collateral — OTC derivatives | | | 6,323,000 | |
Futures contracts | | | 12,870,010 | |
Centrally cleared swaps | | | 16,903,630 | |
Foreign currency at value (cost — $64,059,642) | | | 64,256,025 | |
Receivables: | | | | |
Investments sold | | | 394,370,047 | |
Options written | | | 7,544 | |
Securities lending income — affiliated | | | 43,141 | |
Swaps | | | 842,276 | |
TBA sale commitments | | | 4,059,295,035 | |
Contributions from investors | | | 27,764,080 | |
Dividends — affiliated | | | 2,123 | |
Dividends — unaffiliated | | | 7,852 | |
Interest — unaffiliated | | | 52,911,033 | |
Principal paydowns | | | 108,706 | |
Variation margin on futures contracts | | | 1,175,422 | |
Swap premiums paid | | | 5,792,774 | |
Unrealized appreciation on: | | | | |
Forward foreign currency exchange contracts | | | 15,147,589 | |
OTC swaps | | | 3,972,527 | |
Prepaid expenses | | | 43,628 | |
Other assets | | | 49,838 | |
| | | | |
Total assets | | | 20,700,263,948 | |
| | | | |
| | | | |
| Liabilities | | | | |
Cash received: | | | | |
Collateral — reverse repurchase agreements | | | 4,016,000 | |
Collateral — OTC derivatives | | | 5,180,000 | |
Collateral — TBA commitments | | | 2,960,000 | |
Borrowed bonds at value (proceeds — $514,422,832) | | | 522,650,062 | |
Cash collateral on securities loaned at value | | | 19,443,860 | |
Options written at value (premiums received — $9,335,012) | | | 7,870,887 | |
TBA sale commitments at value (proceeds — $4,059,295,035) | | | 4,078,361,388 | |
Reverse repurchase agreements at value | | | 1,657,123,934 | |
Payables: | | | | |
Investments purchased | | | 4,473,281,984 | |
Swaps | | | 672,345 | |
Directors’ fees | | | 42,272 | |
Interest expense | | | 661,926 | |
Investment advisory fees | | | 455,134 | |
Options written | | | 113,231 | |
Other accrued expenses | | | 1,104,145 | |
Other affiliates | | | 44,486 | |
Variation margin on futures contracts | | | 1,579,207 | |
Variation margin on centrally cleared swaps | | | 851,000 | |
Withdrawals to investors | | | 22,760,034 | |
Swap premiums received | | | 8,387,380 | |
Unrealized depreciation on: | | | | |
Forward foreign currency exchange contracts | | | 20,847,218 | |
OTC swaps | | | 5,776,079 | |
| | | | |
Total liabilities | | | 10,834,182,572 | |
| | | | |
Net Assets | | $ | 9,866,081,376 | |
| | | | |
| | | | |
| Net Assets Consist of | | | | |
Investors’ capital | | $ | 9,893,250,870 | |
Net unrealized appreciation (depreciation) | | | (27,169,494 | ) |
| | | | |
Net Assets | | $ | 9,866,081,376 | |
| | | | |
See Notes to Consolidated Financial Statements.
| | | | | | |
| | | BLACKROCK BALANCED CAPITAL FUND, INC. | | MARCH 31, 2017 | | 99 |
| | | | |
| Consolidated Statement of Operations | | | Master Total Return Portfolio | |
| | | | |
| Six Months Ended March 31, 2017 (Unaudited) | | | |
| | | | |
| Investment Income | | | | |
Interest — unaffiliated | | $ | 156,024,683 | |
Interest — affiliated | | | 8 | |
Dividends — unaffiliated | | | 793,548 | |
Dividends — affiliated | | | 62,411 | |
Securities lending income — affiliated — net | | | 45,515 | |
Foreign taxes withheld | | | (26,705 | ) |
| | | | |
Total investment income | | | 156,899,460 | |
| | | | |
| | | | |
| Expenses | | | | |
Investment advisory | | | 2,625,277 | |
Custodian | | | 445,818 | |
Accounting services | | | 308,485 | |
Directors | | | 81,101 | |
Professional | | | 66,533 | |
Miscellaneous | | | 211,748 | |
| | | | |
Total expenses excluding interest expense | | | 3,738,962 | |
Interest expense | | | 6,213,832 | |
| | | | |
Total expenses | | | 9,952,794 | |
Less fees waived by the Manager | | | (7,702 | ) |
| | | | |
Total expenses after fees waived | | | 9,945,092 | |
| | | | |
Net investment income | | | 146,954,368 | |
| | | | |
| | | | |
| Realized and Unrealized Gain (Loss) | | | | |
Net realized gain (loss) from: | | | | |
Investments — unaffiliated (net of $945,244 foreign capital gain tax) | | | (149,249,955 | ) |
Investments — affiliated | | | (328,765 | ) |
Borrowed bonds | | | 6,906,210 | |
Foreign currency transactions | | | 2,085,538 | |
Forward foreign currency exchange contracts | | | 41,640,354 | |
Futures contracts | | | 23,370,938 | |
Interest rate caps | | | (11,360 | ) |
Options written | | | 8,767,354 | |
Swaps | | | 12,276,994 | |
| | | | |
| | | (54,542,692 | ) |
| | | | |
Net change in unrealized appreciation (depreciation) on: | | | | |
Investments — unaffiliated | | | (186,144,083 | ) |
Investments — affiliated | | | 1,765,463 | |
Borrowed bonds | | | (3,577,406 | ) |
Foreign currency translations | | | (1,291,665 | ) |
Forward foreign currency exchange contracts | | | (2,223,052 | ) |
Futures contracts | | | 2,577,155 | |
Interest rate caps | | | 11,341 | |
Options written | | | (4,346,446 | ) |
Swaps | | | 2,090,602 | |
| | | | |
| | | (191,138,091 | ) |
| | | | |
Total realized and unrealized loss | | | (245,680,783 | ) |
| | | | |
Net Decrease in Net Assets Resulting from Operations | | $ | (98,726,415 | ) |
| | | | |
See Notes to Consolidated Financial Statements.
| | | | | | |
| 100 | | BLACKROCK BALANCED CAPITAL FUND, INC. | | MARCH 31, 2017 | | |
| | | | |
| Consolidated Statements of Changes in Net Assets | | | Master Total Return Portfolio | |
| | | | | | | | |
| Increase (Decrease) in Net Assets: | | Six Months Ended
March 31, 2017
(Unaudited) | | | Year Ended
September 30, 2016 | |
| | | | | | | | |
| Operations | | | | | | | | |
Net investment income | | $ | 146,954,368 | | | $ | 263,185,465 | |
Net realized loss | | | (54,542,692 | ) | | | (1,115,455 | ) |
Net change in unrealized appreciation (depreciation) | | | (191,138,091 | ) | | | 250,972,880 | |
| | | | |
Net increase (decrease) in net assets resulting from operations | | | (98,726,415 | ) | | | 513,042,890 | |
| | | | |
| | | | | | | | |
| Capital Transactions | | | | | | | | |
Proceeds from contributions | | | 2,674,211,741 | | | | 4,667,665,533 | |
Value of withdrawals | | | (2,019,363,933 | ) | | | (3,288,784,196 | ) |
| | | | |
Net increase in net assets derived from capital transactions | | | 654,847,808 | | | | 1,378,881,337 | |
| | | | |
| | | | | | | | |
| Net Assets | | | | | | | | |
Total increase in net assets | | | 556,121,393 | | | | 1,891,924,227 | |
Beginning of period | | | 9,309,959,983 | | | | 7,418,035,756 | |
| | | | |
End of period | | $ | 9,866,081,376 | | | $ | 9,309,959,983 | |
| | | | |
See Notes to Consolidated Financial Statements.
| | | | | | |
| | | BLACKROCK BALANCED CAPITAL FUND, INC. | | MARCH 31, 2017 | | 101 |
| | | | |
| Consolidated Statement of Cash Flows | | | Master Total Return Portfolio | |
| | | | |
| Six Months Ended March 31, 2017 (Unaudited) | | | |
| | | | |
| Cash Provided by Operating Activities | | | | |
Net decrease in net assets resulting from operations | | $ | (98,726,415 | ) |
Adjustments to reconcile net decrease in net assets resulting from operations to net cash provided by operating activities: | | | | |
Proceeds from sales of long-term investments and principal paydowns | | | 52,652,866,520 | |
Purchases of long term investments | | | (51,970,380,539 | ) |
Net purchases of short-term securities | | | 310,575,894 | |
Amortization of premium and accretion of discount on investments | | | 2,464,803 | |
Payments for borrowed bonds | | | (1,600,721,306 | ) |
Proceeds from borrowed bonds | | | 1,597,429,230 | |
Premiums paid on closing options written | | | (59,116,394 | ) |
Premiums received from options written | | | 74,331,933 | |
Net realized gain from investments, futures contracts, options written, swaps, forward foreign currency exchange contracts, foreign currency transactions, interest rate caps and borrowed bonds | | | 133,905,156 | |
Net change in unrealized appreciation (depreciation) on investments, futures contracts, options written, swaps, forward foreign currency exchange contracts, foreign currency translations, interest rate caps and borrowed bonds | | | 195,697,874 | |
(Increase) Decrease in Assets: | | | | |
Cash pledged: | | | | |
Collateral — OTC derivatives | | | 1,120,000 | |
Futures contracts | | | (5,470,000 | ) |
Centrally cleared swaps | | | 15,935,000 | |
Receivables: | | | | |
Options written | | | 620,948 | |
Securities lending income — affiliated | | | (42,822 | ) |
Swaps | | | (339,999 | ) |
Dividends — affiliated | | | 2,855 | |
Dividends — unaffiliated | | | 386 | |
Interest | | | 4,436,195 | |
Principal paydowns | | | (5,708 | ) |
Variation margin on futures contracts | | | 863,121 | |
Variation margin on centrally cleared swaps | | | 492,451 | |
Interest rate caps premiums paid | | | 11,360 | |
Swap premiums paid | | | 6,478,613 | |
Prepaid expenses | | | (35,372 | ) |
Other assets | | | 20,673 | |
Increase (Decrease) in Liabilities: | | | | |
Cash received: | | | | |
Collateral — reverse repurchase agreements | | | 2,227,000 | |
Collateral — OTC derivatives | | | 3,900,000 | |
Collateral — TBA commitments | | | 1,337,000 | |
Collateral on securities loaned at value | | | 17,362,095 | |
Payables: | | | | |
Swaps | | | (70,032 | ) |
Directors’ fees | | | 6,358 | |
Interest expense | | | (1,959,504 | ) |
Investment advisory fees | | | 12,379 | |
Options written | | | (619,733 | ) |
Other accrued expenses | | | 492,980 | |
Other affiliates | | | (17,783 | ) |
Variation margin on futures contracts | | | (1,119,449 | ) |
Variation margin on centrally cleared swaps | | | 851,000 | |
Swap premiums received | | | (6,397,249 | ) |
| | | | |
Cash provided by operating activities | | | 1,278,419,519 | |
| | | | |
| | | | |
| Cash Used for Financing Activities | | | | |
Payments on redemption of capital shares | | | (2,014,120,912 | ) |
Proceeds from issuance of capital shares | | | 2,678,573,067 | |
Net borrowing of reverse repurchase agreements | | | (1,657,741,980 | ) |
Decrease in bank overdraft | | | (257,954,656 | ) |
| | | | |
Cash used for financing activities | | | (1,251,244,481 | ) |
| | | | |
| | | | |
| Cash Impact from Foreign Exchange Fluctuations | | | | |
Cash impact from foreign exchange fluctuations | | | (67,864 | ) |
| | | | |
| | | | |
| Cash and Foreign Currency | | | | |
Net increase in cash and foreign currency at value | | | 27,107,174 | |
Cash and foreign currency at beginning of period | | | 62,345,661 | |
| | | | |
Cash and foreign currency at end of period | | $ | 89,452,835 | |
| | | | |
| | | | |
| Supplemental Disclosure of Cash Flow Information | | | | |
Cash paid during the period for interest expense | | $ | 9,179,151 | |
| | | | |
See Notes to Consolidated Financial Statements.
| | | | | | |
| 102 | | BLACKROCK BALANCED CAPITAL FUND, INC. | | MARCH 31, 2017 | | |
| | | | |
| Consolidated Financial Highlights | | | Master Total Return Portfolio | |
| | | | | | | | | | | | | | | | | | | | | | | | |
| | | Six Months Ended
March 31, 2017 (Unaudited) | | | Year Ended September 30, | |
| | | | 2016 | | | 2015 | | | 2014 | | | 2013 | | | 2012 | |
| | | | | | | | | | | | | | | | | | | | | | | | |
| Total Return | | | | | | | | | | | | | | | | | | | | | | | | |
Total return | | | (1.14 | )%1 | | | 5.75 | % | | | 3.13 | % | | | 7.15 | % | | | 1.30 | % | | | 10.04 | % |
| | | | |
| | | | | | | | | | | | | | | | | | | | | | | | |
| Ratios to Average Net Assets2 | | | | | | | | | | | | | | | | | | | | | | | | |
Total expenses | | | 0.21 | %3 | | | 0.21 | % | | | 0.14 | % | | | 0.25 | % | | | 0.32 | % | | | 0.29 | % |
| | | | |
Total expenses after fees waived | | | 0.21 | %3 | | | 0.21 | % | | | 0.14 | % | | | 0.25 | % | | | 0.32 | % | | | 0.29 | % |
| | | | |
Total expenses after fees waived and excluding interest expense | | | 0.08 | %3 | | | 0.08 | % | | | 0.09 | % | | | 0.14 | % | | | 0.12 | % | | | 0.12 | % |
| | | | |
Net investment income | | | 3.11 | %3 | | | 3.03 | % | | | 3.07 | % | | | 4.03 | % | | | 3.59 | % | | | 4.20 | % |
| | | | |
| | | | | | | | | | | | | | | | | | | | | | | | |
| Supplemental Data | | | | | | | | | | | | | | | | | | | | | | | | |
Net assets, end of period (000) | | | $9,866,081 | | | $ | 9,309,960 | | | $ | 7,418,036 | | | $ | 3,431,769 | | | $ | 3,331,158 | | | $ | 3,470,151 | |
| | | | |
Portfolio turnover rate4 | | | 487 | % | | | 841 | % | | | 1,015 | % | | | 750 | % | | | 777 | % | | | 1,346 | % |
| | | | |
| | 1 | | Aggregate total return. |
| | 2 | | Excludes expenses incurred indirectly as a result of investments in underlying funds as follows: |
| | | | | | | | | | | | |
| | | Six Months Ended
March 31, 2017 | | Year Ended September 30, |
| | | (Unaudited) | | 2016 | | 2015 | | 2014 | | 2013 | | 2012 |
Investments in underlying funds | | — | | 0.01% | | — | | — | | — | | — |
| | 4 | | Includes mortgage dollar roll transactions. Additional information regarding portfolio turnover rate is as follows: |
| | | | | | | | | | | | |
| | | Six Months
Ended
March 31,
2017 | | Year Ended September 30, |
| | | (Unaudited) | | 2016 | | 2015 | | 2014 | | 2013 | | 2012 |
Portfolio turnover rate (excluding mortgage dollar roll transactions) | | 333% | | 598% | | 725% | | 529% | | 450% | | 752% |
See Notes to Consolidated Financial Statements.
| | | | | | |
| | | BLACKROCK BALANCED CAPITAL FUND, INC. | | MARCH 31, 2017 | | 103 |
| | | | |
| Notes to Consolidated Financial Statements (Unaudited) | | | Master Total Return Portfolio | |
1. Organization:
Master Total Return Portfolio (the “Master Portfolio”), a series of Master Bond LLC (the “Master LLC”), is registered under the Investment Company Act of 1940, as amended (the “1940 Act”), as a diversified, open-end management investment company. The Master LLC is organized as a Delaware limited liability company. The Limited Liability Company Agreement of the Master LLC permits the Board of Directors of the Master LLC (the “Board”) to issue nontransferable interests in the Master LLC, subject to certain limitations.
The Master Portfolio, together with certain other registered investment companies advised by BlackRock Advisors, LLC (the “Manager”) or its affiliates, is included in a complex of open-end funds referred to as the Equity-Bond Complex.
Basis of Consolidation: The accompanying consolidated financial statements include the accounts of BlackRock Cayman Master Total Return Portfolio I, Ltd. (the “Subsidiary”), which is a wholly-owned subsidiary of the Master Portfolio and primarily invests in commodity-related instruments. The Subsidiary enables the Master Portfolio to hold these commodity-related instruments and satisfy regulated investment company tax requirements. The Master Portfolio may invest up to 25% of its total assets in the Subsidiary. The net assets of the Subsidiary as of period end were $10,085,967 representing 0.1% of the Master Portfolio’s consolidated net assets. Intercompany accounts and transactions, if any, have been eliminated. The Subsidiary is subject to the same investment policies and restrictions that apply to the Master Portfolio, except that the Subsidiary may invest without limitation in commodity-related instruments.
The following table shows a summary of the selected financial information of the Subsidiary included in the consolidated financial statements:
| | | | |
| Statement of Assets and Liabilities | | | |
Total assets | | $ | 10,098,246 | |
Total liabilities | | | 12,279 | |
| | | | |
Net assets | | $ | 10,085,967 | |
| | | | |
| | | | |
| Statement of Operations | | | |
Net investment income | | | — | |
| | | | |
Net realized gain (loss) from: | | | | |
Investments — unaffiliated | | $ | (7,546,782 | ) |
Futures contracts | | | (257,420 | ) |
Options written | | | 1,624,439 | |
| | | | |
| | | (6,179,763 | ) |
| | | | |
Net change in unrealized appreciation (depreciation) on: | | | | |
Investments — unaffiliated | | | 4,559,725 | |
Futures contracts | | | 2,246 | |
Options written | | | (1,315,462 | ) |
| | | | |
| | | 3,246,509 | |
| | | | |
Net decrease in net assets resulting from operations | | $ | (2,933,254 | ) |
| | | | |
| | | | |
| Statement of Changes in Net Assets | | | |
Net investment income | | | — | |
Net realized loss | | $ | (6,179,763 | ) |
Net change in unrealized appreciation (depreciation) | | | 3,246,509 | |
| | | | |
Net decrease in net assets resulting from operations | | $ | (2,933,254 | ) |
Net decrease in net assets derived from capital share transactions | | | (4,717,449 | ) |
| | | | |
Net decrease in net assets | | $ | (7,650,703 | ) |
| | | | |
| | |
2. Significant Accounting Policies:
The consolidated financial statements are prepared in conformity with accounting principles generally accepted in the United States of America (“U.S. GAAP”), which may require management to make estimates and assumptions that affect the reported amounts of assets and liabilities in the consolidated financial statements, disclosure of contingent assets and liabilities at the date of the consolidated financial statements and the reported amounts of increases and decreases in net assets from operations during the reporting period. Actual results could differ from those estimates. The Master Portfolio is considered an investment company under U.S. GAAP and follows the accounting and reporting guidance applicable to investment companies. Below is a summary of significant accounting policies:
Foreign Currency: The Master Portfolio’s books and records are maintained in U.S. dollars. Purchases and sales of investments are recorded at the rates of exchange prevailing on the respective dates of such transactions. Generally, when the U.S. dollar rises in value against a foreign currency, the investments denominated in that currency will lose value; the opposite effect occurs if the U.S. dollar falls in relative value.
| | | | | | |
| 104 | | BLACKROCK BALANCED CAPITAL FUND, INC. | | MARCH 31, 2017 | | |
| | | | |
| Notes to Consolidated Financial Statements (continued) | | | Master Total Return Portfolio | |
The Master Portfolio does not isolate the portion of the results of operations arising as a result of changes in the exchange rates from the changes in the market prices of investments held or sold for financial reporting purposes. Accordingly, the effects of changes in exchange rates on investments are not segregated in the Consolidated Statement of Operations from the effects of changes in market prices of those investments, but are included as a component of net realized and unrealized gain (loss) from investments. The Master Portfolio reports realized currency gains (losses) on foreign currency related transactions as components of net realized gain (loss) for financial reporting purposes, whereas such components are generally treated as ordinary income for U. S. federal income tax purposes.
The Master Portfolio does not isolate the portion of the results of operations arising as a result of changes in the exchange rates from the changes in the market prices of investments held or sold for financial reporting purposes. Accordingly, the effects of changes in exchange rates on investments are not segregated in the Consolidated Statement of Operations from the effects of changes in market prices of those investments, but are included as a component of net realized and unrealized gain (loss) from investments. Realized currency gains (losses) on foreign currency related transactions are reported as components of net realized gain (loss) for financial reporting purposes, whereas such components are generally treated as ordinary income for U. S. federal income tax purposes. The Master Portfolio has elected to treat realized gains (losses) from certain forward foreign currency exchange contracts as capital gain (loss) for U. S. federal income tax purposes.
Segregation and Collateralization: In cases where the Master Portfolio enters into certain investments (e.g., dollar rolls, TBA sale commitments, futures contracts, forward foreign currency exchange contracts, options written, swaps, short sales and structured options) or certain borrowings (e.g., reverse repurchase transactions and treasury roll transactions) that would be treated as “senior securities” for 1940 Act purposes, the Master Portfolio may segregate or designate on its books and records cash or liquid assets having a market value at least equal to the amount of its future obligations under such investments or borrowings. Doing so allows the investment or borrowing to be excluded from treatment as a “senior security.” Furthermore, if required by an exchange or counterparty agreement, the Master Portfolio may be required to deliver/deposit cash and/or securities to/with an exchange, or broker-dealer or custodian as collateral for certain investments or obligations.
Investment Transactions and Investment Income: For financial reporting purposes, investment transactions are recorded on the dates the transactions are entered into (the trade dates). Realized gains and losses on investment transactions are determined on the identified cost basis. Dividend income is recorded on the ex-dividend date. Dividends from foreign securities where the ex-dividend date may have passed are subsequently recorded when the Master Portfolio is informed of the ex-dividend date. Under the applicable foreign tax laws, a withholding tax at various rates may be imposed on capital gains, dividends and interest. Upon notification from issuers, some of the dividend income received from a real estate investment trust may be redesignated as a reduction of cost of the related investment and/or realized gain. Interest income, including amortization and accretion of premiums and discounts on debt securities, is recognized on the accrual basis. Income, expenses and realized and unrealized gains and losses are allocated daily to each class based on its relative net assets.
Recent Accounting Standards: In April 2015, the Financial Accounting Standards Board issued “Disclosures for Investments in Certain Entities that Calculate Net Asset Value (“NAV”) per Share” which eliminates the requirement to categorize investments within the fair value hierarchy when fair value is based on the NAV per share and no quoted market value is available. As of March 31, 2017, certain investments of the Master Portfolio were valued using NAV per share as no quoted market value was available and therefore have been excluded from the fair value hierarchy.
In November 2016, the Financial Accounting Standards Board issued Accounting Standards Update “Restricted Cash” which will require entities to include the total of cash, cash equivalents, restricted cash, and restricted cash equivalents in the beginning and ending cash balances in the Consolidated Statement of Cash Flows. The guidance will be applied retrospectively and is effective for fiscal years beginning after December 15, 2017, and interim periods within those years. Management is evaluating the impact, if any, of this guidance on the Master Portfolio’s presentation in the Consolidated Statement of Cash Flows.
In March 2017, the Financial Accounting Standards Board issued Accounting Standards Update “Premium Amortization of Purchased Callable Debt Securities” which amends the amortization period for certain purchased callable debt securities. Under the new guidance, premium amortization of purchased callable debt securities that have explicit, non-contingent call features and are callable at fixed prices will be amortized to the earliest call date. The guidance will be on a modified applied retrospective basis and is effective for fiscal years, and their interim periods, beginning after December 15, 2018. Management is currently evaluating the impact of this guidance to the Master Portfolio.
Indemnifications: In the normal course of business, the Master Portfolio enters into contracts that contain a variety of representations that provide general indemnification. The Master Portfolio’s maximum exposure under these arrangements is unknown because it involves future potential claims against the Master Portfolio, which cannot be predicted with any certainty.
Other: Expenses directly related to the Master Portfolio are charged to the Master Portfolio. Other operating expenses shared by several funds, including other funds managed by the Manager, are prorated among those funds on the basis of relative net assets or other appropriate methods.
| | | | | | |
| | | BLACKROCK BALANCED CAPITAL FUND, INC. | | MARCH 31, 2017 | | 105 |
| | | | |
| Notes to Consolidated Financial Statements (continued) | | | Master Total Return Portfolio | |
The Master Portfolio has an arrangement with its custodian whereby credits are earned on uninvested cash balances, which could be used to reduce custody fees and/or overdraft charges. The Master Portfolio may incur charges on certain uninvested cash balances and overdrafts, subject to certain conditions.
3. Investment Valuation and Fair Value Measurements:
Investment Valuation Policies: The Master Portfolio’s investments are valued at fair value (also referred to as “market value” within the consolidated financial statements) as of the close of trading on the New York Stock Exchange (“NYSE”) (generally 4:00 p.m., Eastern time). U.S. GAAP defines fair value as the price the Master Portfolio would receive to sell an asset or pay to transfer a liability in an orderly transaction between market participants at the measurement date. The Master Portfolio determines the fair values of its financial instruments using independent dealers or pricing services under policies approved by the Board. The BlackRock Global Valuation Methodologies Committee (the “Global Valuation Committee”) is the committee formed by management to develop global pricing policies and procedures and to oversee the pricing function for the Master Portfolio for all financial instruments.
Fair Value Inputs and Methodologies: The following methods and inputs are used to establish the fair value of the Master Portfolio’s assets and liabilities:
| • | | Equity investments traded on a recognized securities exchange are valued at the official closing price each day, if available. For equity investments traded on more than one exchange, the official closing price on the exchange where the stock is primarily traded is used. Equity investments traded on a recognized exchange for which there were no sales on that day may be valued at the last available bid (long positions) or ask (short positions) price. |
| • | | Fixed-income securities for which market quotations are readily available are generally valued using the last available bid prices or current market quotations provided by independent dealers or third party pricing services. Floating rate loan interests are valued at the mean of the bid prices from one or more independent brokers or dealers as obtained from a third party pricing service. Pricing services generally value fixed-income securities assuming orderly transactions of an institutional round lot size, but the Master Portfolio may hold or transact in such securities in smaller, odd lot sizes. Odd lots often trade at lower prices than institutional round lots. The pricing services may use matrix pricing or valuation models that utilize certain inputs and assumptions to derive values, including transaction data (e.g., recent representative bids and offers), credit quality information, perceived market movements, news, and other relevant information. Certain fixed-income securities, including asset-backed and mortgage related securities may be valued based on valuation models that consider the estimated cash flows of each tranche of the entity, establish a benchmark yield and develop an estimated tranche specific spread to the benchmark yield based on the unique attributes of the tranche. The amortized cost method of valuation may be used with respect to debt obligations with sixty days or less remaining to maturity unless the Manager determines such method does not represent fair value. |
| • | | Generally, trading in foreign instruments is substantially completed each day at various times prior to the close of trading on the NYSE. Occasionally, events affecting the values of such instruments may occur between the foreign market close and the close of trading on the NYSE that may not be reflected in the computation of the Master Portfolio’s net assets. Each business day, the Master Portfolio uses a pricing service to assist with the valuation of certain foreign exchange-traded equity securities and foreign exchange-traded and over-the-counter (“OTC”) options (the “Systematic Fair Value Price”). Using current market factors, the Systematic Fair Value Price is designed to value such foreign securities and foreign options at fair value as of the close of trading on the NYSE, which follows the close of the local markets. |
| • | | Municipal investments (including commitments to purchase such investments on a “when-issued” basis) are valued on the basis of prices provided by dealers or pricing services. In determining the value of a particular investment, pricing services may use certain information with respect to transactions in such investments, quotations from dealers, pricing matrixes, market transactions in comparable investments and information with respect to various relationships between investments. |
| • | | Investments in open-end U.S. mutual funds are valued at NAV each business day. |
| • | | The Master Portfolio values its investment in SL Liquidity Series, LLC, Money Market Series (the “Money Market Series”) at fair value, which is ordinarily based upon its pro rata ownership in the underlying fund’s net assets. The Money Market Series seeks current income consistent with maintaining liquidity and preserving capital. Although the Money Market Series is not registered under the 1940 Act, its investments may follow the parameters of investments by a money market fund that is subject to Rule 2a-7 under the 1940 Act. |
| • | | Futures contracts traded on exchanges are valued at their last sale price. |
| • | | Securities and other assets and liabilities denominated in foreign currencies are translated into U.S. dollars using exchange rates determined as of the close of trading on the NYSE. Forward foreign currency exchange contracts are valued at the mean between the bid and ask prices and are determined as of the close of trading on the NYSE. Interpolated values are derived when the settlement date of the contract is an interim date for which quotations are not available. |
| • | | Exchange-traded options are valued at the mean between the last bid and ask prices at the close of the options market in which the options trade. An exchange-traded option for which there is no mean price is valued at the last bid (long positions) or ask (short positions) price. If no bid or ask price is available, the prior day’s price will be used, unless it is determined that the prior day’s price no longer reflects the fair value of the option. |
| | | | | | |
| 106 | | BLACKROCK BALANCED CAPITAL FUND, INC. | | MARCH 31, 2017 | | |
| | | | |
| Notes to Consolidated Financial Statements (continued) | | | Master Total Return Portfolio | |
| | Over-the-counter (“OTC”) options and options on swaps (“swaptions”) are valued by an independent pricing service using a mathematical model, which incorporates a number of market data factors, such as the trades and prices of the underlying instruments. |
| • | | Swap agreements are valued utilizing quotes received daily by the Master Portfolio’s pricing service or through brokers, which are derived using daily swap curves and models that incorporate a number of market data factors, such as discounted cash flows, trades and values of the underlying reference instruments. |
| • | | To-be-announced (“TBA”) commitments are valued on the basis of last available bid prices or current market quotations provided by pricing services. |
| • | | The market value of the Master Portfolio’s investments in the underlying funds is based on the published NAV of each underlying fund computed as of the close of regular trading on the NYSE on days when the NYSE is open. |
If events (e.g., a company announcement, market volatility or a natural disaster) occur that are expected to materially affect the value of such investments, or in the event that the application of these methods of valuation results in a price for an investment that is deemed not to be representative of the market value of such investment, or if a price is not available, the investment will be valued by the Global Valuation Committee, or its delegate, in accordance with a policy approved by the Board as reflecting fair value (“Fair Valued Investments”). The fair valuation approaches that may be used by the Global Valuation Committee will include Market approach, Income approach and Cost approach. Valuation techniques such as discounted cash flow, use of market comparables and matrix pricing are types of valuation approaches and typically used in determining fair value. When determining the price for Fair Valued Investments, the Global Valuation Committee, or its delegate, seeks to determine the price that the Master Portfolio might reasonably expect to receive or pay from the current sale or purchase of that asset or liability in an arm’s-length transaction. Fair value determinations shall be based upon all available factors that the Global Valuation Committee, or its delegate, deems relevant and consistent with the principles of fair value measurement.
The Global Valuation Committee, or its delegate, employs various methods for calibrating valuation approaches for investments where an active market does not exist, including regular due diligence of the Master Portfolio’s pricing vendors, regular reviews of key inputs and assumptions, transactional back-testing or disposition analysis to compare unrealized gains and losses to realized gains and losses, reviews of missing or stale prices and large movements in market values and reviews of any market related activity. The pricing of all Fair Valued Investments is subsequently reported to the Board or a committee thereof on a quarterly basis. As a result of the inherent uncertainty in valuation of these investments, the fair values may differ from the values that would have been used had an active market existed.
For investments in equity or debt issued by privately-held companies or funds (“Private Company” or collectively, the “Private Companies”) and other Fair Valued Investments, the fair valuation approaches that are used by third party pricing services utilize one or a combination of, but not limited to, the following inputs.
| | | | |
| | | | | Standard Inputs Generally Considered By Third Party Pricing Services |
Market approach | | (i) | | recent market transactions, including subsequent rounds of financing, in the underlying investment or comparable issuers; |
| | (ii) | | recapitalizations and other transactions across the capital structure; and |
| | | (iii) | | market multiples of comparable issuers. |
| | |
| Income approach | | (i) | | future cash flows discounted to present and adjusted as appropriate for liquidity, credit, and/or market risks; |
| | (ii) | | quoted prices for similar investments or assets in active markets; and |
| | | (iii) | | other risk factors, such as interest rates, yield curves, volatilities, prepayment speeds, loss severities, credit risks, recovery rates, liquidation amounts and/or default rates. |
| | |
| Cost approach | | (i) | | audited or unaudited financial statements, investor communications and financial or operational metrics issued by the Private Company; |
| | (ii) | | changes in the valuation of relevant indices or publicly traded companies comparable to the Private Company; |
| | (iii) | | relevant news and other public sources; and |
| | | (iv) | | known secondary market transactions in the Private Company’s interests and merger or acquisition activity in companies comparable to the Private Company. |
| | | | | | |
| | | BLACKROCK BALANCED CAPITAL FUND, INC. | | MARCH 31, 2017 | | 107 |
| | | | |
| Notes to Consolidated Financial Statements (continued) | | | Master Total Return Portfolio | |
Investments in series of preferred stock issued by Private Companies are typically valued utilizing Market approach in determining the enterprise value of the company. Such investments often contain rights and preferences that differ from other series of preferred and common stock of the same issuer. Valuation techniques such as an option pricing model (“OPM”), a probability weighted expected return model (“PWERM”) or a hybrid of those techniques are used in allocating enterprise value of the company, as deemed appropriate under the circumstances. The use of OPM and PWERM techniques involve a determination of the exit scenarios of the investment in order to appropriately allocate the enterprise value of the company among the various parts of its capital structure.
The Private Companies are not subject to the public company disclosure, timing, and reporting standards as other investments held by the Master Portfolio. Typically, the most recently available information by a Private Company is as of a date that is earlier than the date the Master Portfolio is calculating its NAV. This factor may result in a difference between the value of the investment and the price the Master Portfolio could receive upon the sale of the investment.
Fair Value Hierarchy: Various inputs are used in determining the fair value of investments and derivative financial instruments. These inputs to valuation techniques are categorized into a fair value hierarchy consisting of three broad levels for financial statement purposes as follows:
| | • | | Level 1 — unadjusted price quotations in active markets/exchanges for identical assets or liabilities that the Master Portfolio has the ability to access |
| | • | | Level 2 — other observable inputs (including, but not limited to, quoted prices for similar assets or liabilities in markets that are active, quoted prices for identical or similar assets or liabilities in markets that are not active, inputs other than quoted prices that are observable for the assets or liabilities (such as interest rates, yield curves, volatilities, prepayment speeds, loss severities, credit risks and default rates) or other market-corroborated inputs) |
| | • | | Level 3 — unobservable inputs based on the best information available in the circumstances, to the extent observable inputs are not available (including the Master Portfolio’s own assumptions used in determining the fair value of investments and derivative financial instruments) |
The hierarchy gives the highest priority to unadjusted quoted prices in active markets for identical assets or liabilities (Level 1 measurements) and the lowest priority to unobservable inputs (Level 3 measurements). Accordingly, the degree of judgment exercised in determining fair value is greatest for instruments categorized in Level 3. The inputs used to measure fair value may fall into different levels of the fair value hierarchy. In such cases, for disclosure purposes, the fair value hierarchy classification is determined based on the lowest level input that is significant to the fair value measurement in its entirety. Investments classified within Level 3 have significant unobservable inputs used by the Global Valuation Committee in determining the price for Fair Valued Investments. Level 3 investments include equity or debt issued by Private Companies. There may not be a secondary market, and/or there are a limited number of investors. Level 3 investments may also be adjusted to reflect illiquidity and/or non-transferability, with the amount of such discount estimated by the Global Valuation Committee in the absence of market information.
Changes in valuation techniques may result in transfers into or out of an assigned level within the hierarchy. In accordance with the Master Portfolio’s policy, transfers between different levels of the fair value hierarchy are deemed to have occurred as of the beginning of the reporting period. The categorization of a value determined for investments and derivative financial instruments is based on the pricing transparency of the investments and derivative financial instruments and is not necessarily an indication of the risks associated with investing in those securities.
4. Securities and Other Investments:
Asset-Backed and Mortgage-Backed Securities: Asset-backed securities are generally issued as pass-through certificates or as debt instruments. Asset-backed securities issued as pass-through certificates represent undivided fractional ownership interests in an underlying pool of assets. Asset-backed securities issued as debt instruments, which are also known as collateralized obligations, are typically issued as the debt of a special purpose entity organized solely for the purpose of owning such assets and issuing such debt. Asset-backed securities are often backed by a pool of assets representing the obligations of a number of different parties. The yield characteristics of certain asset-backed securities may differ from traditional debt securities. One such major difference is that all or a principal part of the obligations may be prepaid at any time because the underlying assets (i.e., loans) may be prepaid at any time. As a result, a decrease in interest rates in the market may result in increases in the level of prepayments as borrowers, particularly mortgagors, refinance and repay their loans. An increased prepayment rate with respect to an asset-backed security will have the effect of shortening the maturity of the security. In addition, the Master Portfolio may subsequently have to reinvest the proceeds at lower interest rates. If the Master Portfolio has purchased such an asset-backed security at a premium, a faster than anticipated prepayment rate could result in a loss of principal to the extent of the premium paid.
| | | | | | |
| 108 | | BLACKROCK BALANCED CAPITAL FUND, INC. | | MARCH 31, 2017 | | |
| | | | |
| Notes to Consolidated Financial Statements (continued) | | | Master Total Return Portfolio | |
For mortgage pass-through securities (the “Mortgage Assets”) there are a number of important differences among the agencies and instrumentalities of the U.S. Government that issue mortgage-related securities and among the securities that they issue. For example, mortgage-related securities guaranteed by Ginnie Mae are guaranteed as to the timely payment of principal and interest by Ginnie Mae and such guarantee is backed by the full faith and credit of the United States. However, mortgage-related securities issued by Freddie Mac and Fannie Mae, including Freddie Mac and Fannie Mae guaranteed mortgage pass-through certificates, which are solely the obligations of Freddie Mac and Fannie Mae, are not backed by or entitled to the full faith and credit of the United States, but are supported by the right of the issuer to borrow from the U.S. Treasury.
Non-agency mortgage-backed securities are securities issued by non-governmental issuers and have no direct or indirect government guarantees of payment and are subject to various risks. Non-agency mortgage loans are obligations of the borrowers thereunder only and are not typically insured or guaranteed by any other person or entity. The ability of a borrower to repay a loan is dependent upon the income or assets of the borrower. A number of factors, including a general economic downturn, acts of God, terrorism, social unrest and civil disturbances, may impair a borrower’s ability to repay its loans.
Collateralized Debt Obligations: Collateralized debt obligations (“CDOs”), including collateralized bond obligations (“CBOs”) and collateralized loan obligations (“CLOs”), are types of asset-backed securities. A CDO is an entity that is backed by a diversified pool of debt securities (CBOs) or syndicated bank loans (CLOs). The cash flows of the CDO can be split into multiple segments, called “tranches,” which will vary in risk profile and yield. The riskiest segment is the subordinated or “equity” tranche. This tranche bears the greatest risk of defaults from the underlying assets in the CDO and serves to protect the other, more senior, tranches from default in all but the most severe circumstances. Since it is shielded from defaults by the more junior tranches, a “senior” tranche will typically have higher credit ratings and lower yields than their underlying securities, and often receive investment grade ratings from one or more of the nationally recognized rating agencies. Despite the protection from the more junior tranches, senior tranches can experience substantial losses due to actual defaults, increased sensitivity to future defaults and the disappearance of one or more protecting tranches as a result of changes in the credit profile of the underlying pool of assets.
Inflation-Indexed Bonds: Inflation-indexed bonds (other than municipal inflation-indexed and certain corporate inflation-indexed bonds) are fixed income securities whose principal value is periodically adjusted according to the rate of inflation. If the index measuring inflation rises or falls, the principal value of inflation-indexed bonds (other than municipal inflation-indexed and certain corporate inflation-indexed bonds) will be adjusted upward or downward, and consequently the interest payable on these securities (calculated with respect to a larger or smaller principal amount) will be increased or reduced, respectively. Any upward or downward adjustment in the principal amount of an inflation-indexed bond will be included as interest income in the Consolidated Statement of Operations, even though investors do not receive their principal until maturity. Repayment of the original bond principal upon maturity (as adjusted for inflation) is guaranteed in the case of U.S. Treasury inflation-indexed bonds. For bonds that do not provide a similar guarantee, the adjusted principal value of the bond repaid at maturity may be less than the original principal. With regard to municipal inflation-indexed bonds and certain corporate inflation-indexed bonds, the inflation adjustment is typically reflected in the semi-annual coupon payment. As a result, the principal value of municipal inflation-indexed bonds and such corporate inflation-indexed bonds does not adjust according to the rate of inflation.
Multiple Class Pass-Through Securities: Multiple class pass-through securities, including collateralized mortgage obligations (“CMOs”) and commercial mortgage-backed securities, may be issued by Ginnie Mae, U.S. Government agencies or instrumentalities or by trusts formed by private originators of, or investors in, mortgage loans. In general, CMOs are debt obligations of a legal entity that are collateralized by a pool of residential or commercial mortgage loans or Mortgage Assets. The payments on these are used to make payments on the CMOs or multiple pass-through securities. Multiple class pass-through securities represent direct ownership interests in the Mortgage Assets. Classes of CMOs include interest only (“IOs”), principal only (“POs”), planned amortization classes and targeted amortization classes. IOs and POs are stripped mortgage-backed securities representing interests in a pool of mortgages, the cash flow from which has been separated into interest and principal components. IOs receive the interest portion of the cash flow while POs receive the principal portion. IOs and POs can be extremely volatile in response to changes in interest rates. As interest rates rise and fall, the value of IOs tends to move in the same direction as interest rates. POs perform best when prepayments on the underlying mortgages rise since this increases the rate at which the principal is returned and the yield to maturity on the PO. When payments on mortgages underlying a PO are slower than anticipated, the life of the PO is lengthened and the yield to maturity is reduced. If the underlying Mortgage Assets experience greater than anticipated prepayments of principal, the Master Portfolio’s initial investment in the IOs may not fully recoup.
| | | | | | |
| | | BLACKROCK BALANCED CAPITAL FUND, INC. | | MARCH 31, 2017 | | 109 |
| | | | |
| Notes to Consolidated Financial Statements (continued) | | | Master Total Return Portfolio | |
Stripped Mortgage-Backed Securities: Stripped mortgage-backed securities are typically issued by the U.S. Government, its agencies and instrumentalities. Stripped mortgage-backed securities are usually structured with two classes that receive different proportions of the interest (IOs) and principal (POs) distributions on a pool of Mortgage Assets. Stripped mortgage-backed securities may be privately issued.
Zero-Coupon Bonds: Zero-coupon bonds, are normally issued at a significant discount from face value and do not provide for periodic interest payments. These bonds may experience greater volatility in market value than other debt obligations of similar maturity which provide for regular interest payments.
Capital Securities and Trust Preferred Securities: Capital securities, including trust preferred securities, are typically issued by corporations, generally in the form of interest-bearing notes with preferred securities characteristics. In the case of trust preferred securities, an affiliated business trust of a corporation issues these securities, generally in the form of beneficial interests in subordinated debentures or similarly structured securities. The securities can be structured with either a fixed or adjustable coupon that can have either a perpetual or stated maturity date. For trust preferred securities, the issuing bank or corporation pays interest to the trust, which is then distributed to holders of these securities as a dividend. Dividends can be deferred without creating an event of default or acceleration, although maturity cannot take place unless all cumulative payment obligations have been met. The deferral of payments does not affect the purchase or sale of these securities in the open market. Payments on these securities are treated as interest rather than dividends for U. S. federal income tax purposes. These securities generally are rated below that of the issuing company’s senior debt securities and are freely callable at the issuer’s option.
Preferred Stock: Preferred stock has a preference over common stock in liquidation (and generally in receiving dividends as well), but is subordinated to the liabilities of the issuer in all respects. As a general rule, the market value of preferred stock with a fixed dividend rate and no conversion element varies inversely with interest rates and perceived credit risk, while the market price of convertible preferred stock generally also reflects some element of conversion value. Because preferred stock is junior to debt securities and other obligations of the issuer, deterioration in the credit quality of the issuer will cause greater changes in the value of a preferred stock than in a more senior debt security with similar stated yield characteristics. Unlike interest payments on debt securities, preferred stock dividends are payable only if declared by the issuer’s board of directors. Preferred stock also may be subject to optional or mandatory redemption provisions.
Floating Rate Loan Interests: Floating rate loan interests are typically issued to companies (the “borrower”) by banks, other financial institutions, or privately and publicly offered corporations (the “lender”). Floating rate loan interests are generally non-investment grade, often involve borrowers whose financial condition is troubled or uncertain and companies that are highly leveraged or in bankruptcy proceedings. In addition, transactions in floating rate loan interests may settle on a delayed basis, which may result to proceeds from the sale to not be readily available for the Master Portfolio to make additional investments or meet its redemption obligations. Floating rate loan interests may include fully funded term loans or revolving lines of credit. Floating rate loan interests are typically senior in the corporate capital structure of the borrower. Floating rate loan interests generally pay interest at rates that are periodically determined by reference to a base lending rate plus a premium. Since the rates reset only periodically, changes in prevailing interest rates (and particularly sudden and significant changes) can be expected to cause some fluctuations in the NAV of the Master Portfolio to the extent that it invests in floating rate loan interest. The base lending rates are generally the lending rate offered by one or more European banks, such as the London Interbank Offered Rate (“LIBOR”), the prime rate offered by one or more U.S. banks or the certificate of deposit rate. Floating rate loan interests may involve foreign borrowers, and investments may be denominated in foreign currencies. These investments are treated as investments in debt securities for purposes of the Master Portfolio’s investment policies.
When the Master Portfolio purchases a floating rate loan interest, it may receive a facility fee and when it sells a floating rate loan interest, it may pay a facility fee. On an ongoing basis, the Master Portfolio may receive a commitment fee based on the undrawn portion of the underlying line of credit amount of a floating rate loan interest. Facility and commitment fees are typically amortized to income over the term of the loan or term of the commitment, respectively. Consent and amendment fees are recorded to income as earned. Prepayment penalty fees, which may be received by the Master Portfolio upon the prepayment of a floating rate loan interest by a borrower, are recorded as realized gains. The Master Portfolio may invest in multiple series or tranches of a loan. A different series or tranche may have varying terms and carry different associated risks.
Floating rate loan interests are usually freely callable at the borrower’s option. The Master Portfolio may invest in such loans in the form of participations in loans (“Participations”) or assignments (“Assignments”) of all or a portion of loans from third parties. Participations typically will result in the Master Portfolio having a contractual relationship only with the lender, not with the borrower. The Master Portfolio has the right to receive payments of principal, interest and any fees to which it is entitled only from the lender selling the Participation and only upon receipt by the lender of the payments from the borrower. In connection with purchasing Participations, the Master Portfolio generally will have no right to enforce compliance by the borrower
| | | | | | |
| 110 | | BLACKROCK BALANCED CAPITAL FUND, INC. | | MARCH 31, 2017 | | |
| | | | |
| Notes to Consolidated Financial Statements (continued) | | | Master Total Return Portfolio | |
with the terms of the loan agreement, nor any rights of offset against the borrower. The Master Portfolio may not benefit directly from any collateral supporting the loan in which it has purchased the Participation. As a result, the Master Portfolio assumes the credit risk of both the borrower and the lender that is selling the Participation. The Master Portfolio’s investment in loan participation interests involves the risk of insolvency of the financial intermediaries who are parties to the transactions. In the event of the insolvency of the lender selling the Participation, the Master Portfolio may be treated as a general creditor of the lender and may not benefit from any offset between the lender and the borrower. Assignments typically result in the Master Portfolio having a direct contractual relationship with the borrower, and the Master Portfolio may enforce compliance by the borrower with the terms of the loan agreement.
In connection with floating rate loan interests, the Master Portfolio may also enter into unfunded floating rate loan interests (“commitments”). In connection with these commitments, the Master Portfolio earns a commitment fee, typically set as a percentage of the commitment amount. Such fee income, which is included in interest income in the Consolidated Statement of Operations, is recognized ratably over the commitment period. Unfunded floating rate loan interests are marked-to-market daily, and any unrealized appreciation (depreciation) is included in the Consolidated Statement of Assets and Liabilities and Consolidated Statement of Operations. As of period end, the Master Portfolio had no unfunded floating rate loan interests.
Forward Commitments and When-Issued Delayed Delivery Securities: The Master Portfolio may purchase securities on a when-issued basis and may purchase or sell securities on a forward commitment basis. Settlement of such transactions normally occurs within a month or more after the purchase or sale commitment is made. The Master Portfolio may purchase securities under such conditions with the intention of actually acquiring them, but may enter into a separate agreement to sell the securities before the settlement date. Since the value of securities purchased may fluctuate prior to settlement, the Master Portfolio may be required to pay more at settlement than the security is worth. In addition, the Master Portfolio is not entitled to any of the interest earned prior to settlement. When purchasing a security on a delayed delivery basis, the Master Portfolio assumes the rights and risks of ownership of the security, including the risk of price and yield fluctuations. In the event of default by the counterparty, the Master Portfolio’s maximum amount of loss is the unrealized appreciation of unsettled when-issued transactions.
TBA Commitments: TBA commitments are forward agreements for the purchase or sale of mortgage-backed securities for a fixed price, with payment and delivery on an agreed upon future settlement date. The specific securities to be delivered are not identified at the trade date. However, delivered securities must meet specified terms, including issuer, rate and mortgage terms. When entering into TBA commitments, the Master Portfolio may take possession of or deliver the underlying mortgage-backed securities but can extend the settlement or roll the transaction. TBA commitments involve a risk of loss if the value of the security to be purchased or sold declines or increases, respectively, prior to settlement date.
In order to better define contractual rights and to secure rights that will help the Master Portfolio mitigate its counterparty risk, TBA commitments may be entered into by the Master Portfolio under Master Securities Forward Transaction Agreements (each, an “MSFTA”). An MSFTA typically contains, among other things, collateral posting terms and netting provisions in the event of default and/or termination event. The collateral requirements are typically calculated by netting the mark-to-market amount for each transaction under such agreement and comparing that amount to the value of the collateral currently pledged by the Master Portfolio and the counterparty. Cash collateral that has been pledged to cover the obligations of the Master Portfolio and cash collateral received from the counterparty, if any, is reported separately on the Consolidated Statement of Assets and Liabilities as cash pledged as collateral for TBA commitments or cash received as collateral for TBA commitments, respectively. Non-cash collateral pledged by the Master Portfolio, if any, is noted in the Consolidated Schedule of Investments. Typically, the Master Portfolio is permitted to sell, repledge or use the collateral it receives; however, the counterparty is not permitted to do so. To the extent amounts due to the Master Portfolio are not fully collateralized, contractually or otherwise, the Master Portfolio bears the risk of loss from counterparty non-performance.
Mortgage Dollar Roll Transactions: The Master Portfolio may sell TBA mortgage-backed securities and simultaneously contract to repurchase substantially similar (i.e., same type, coupon and maturity) securities on a specific future date at an agreed upon price. During the period between the sale and repurchase, the Master Portfolio is not entitled to receive interest and principal payments on the securities sold. Mortgage dollar roll transactions are treated as purchases and sales and realize gains and losses on these transactions. Mortgage dollar rolls involve the risk that the market value of the securities that the Master Portfolio is required to purchase may decline below the agreed upon repurchase price of those securities.
Borrowed Bond Agreements: Repurchase agreements may be referred to as borrowed bond agreements when entered into in connection with short sales of bonds. In a borrowed bond agreement, the Master Portfolio borrows a bond from a counterparty in exchange for cash collateral. The agreement contains a commitment that the security and the cash will be returned to the counterparty and the Master Portfolio at a mutually agreed upon date. Certain agreements have no stated maturity and can be terminated by either party at any time. Earnings on cash collateral and compensation to the lender of the bond are based on agreed upon rates between the Master Portfolio and the counterparty. The value of the underlying cash collateral
| | | | | | |
| | | BLACKROCK BALANCED CAPITAL FUND, INC. | | MARCH 31, 2017 | | 111 |
| | | | |
| Notes to Consolidated Financial Statements (continued) | | | Master Total Return Portfolio | |
approximates the market value and accrued interest of the borrowed bond. To the extent that a borrowed bond transaction exceeds one business day, the value of the cash collateral in the possession of the counterparty is monitored on a daily basis to ensure the adequacy of the collateral. As the market value of the borrowed bond changes, the cash collateral is periodically increased or decreased with a frequency and in amounts prescribed in the borrowed bond agreement. The Master Portfolio may also experience delays in gaining access to the collateral.
Reverse Repurchase Agreements: Reverse repurchase agreements are agreements with qualified third party broker dealers in which the Master Portfolio sells securities to a bank or broker-dealer and agrees to repurchase the same securities at a mutually agreed upon date and price. The Master Portfolio receives cash from the sale to use for other investment purposes. During the term of the reverse repurchase agreement, the Master Portfolio continues to receive the principal and interest payments on the securities sold. Certain agreements have no stated maturity and can be terminated by either party at any time. Interest on the value of the reverse repurchase agreements issued and outstanding is based upon competitive market rates determined at the time of issuance. The Master Portfolio may utilize reverse repurchase agreements when it is anticipated that the interest income to be earned from the investment of the proceeds of the transaction is greater than the interest expense of the transaction. Reverse repurchase agreements involve leverage risk. If the Master Portfolio suffers a loss on its investment of the transaction proceeds from a reverse repurchase agreement, the Master Portfolio would still be required to pay the full repurchase price. Further, the Master Portfolio remains subject to the risk that the market value of the securities repurchased declines below the repurchase price. In such cases, the Master Portfolio would be required to return a portion of the cash received from the transaction or provide additional securities to the counterparty.
Cash received in exchange for securities delivered plus accrued interest due to the counterparty is recorded as a liability in the Consolidated Statement of Assets and Liabilities at face value including accrued interest. Due to the short-term nature of the reverse repurchase agreements, face value approximates fair value. Interest payments made by the Master Portfolio to the counterparties are recorded as a component of interest expense in the Consolidated Statement of Operations. In periods of increased demand for the security, the Master Portfolio may receive a fee for use of the security by the counterparty, which may result in interest income to the Master Portfolio.
For the six months ended March 31, 2017, the average amount of reverse repurchase agreements outstanding and the daily weighted average interest rate for the Master Portfolio were $1,933,811,879 and 0.4%, respectively.
Treasury Roll Transactions: In a treasury roll transaction, the Master Portfolio sells a Treasury security to a counterparty with a simultaneous agreement to repurchase the same security at an agreed upon price and future settlement date. The Master Portfolio receives cash from the sale of the Treasury security to use for other investment purposes. The difference between the sale price and repurchase price represents net interest income or net interest expense reflective of an agreed upon rate between the Master Portfolio and the counterparty over the term of the borrowing. For U.S. GAAP purposes, a treasury roll transaction is accounted for as a secured borrowing and not as a purchase or sale. During the term of the borrowing, interest income from the Treasury security and the related interest expense on the secured borrowing is recorded by the Master Portfolio on an accrual basis. The Master Portfolio will benefit from the transaction if the income earned on the investment purchased with the cash received in the treasury roll transaction exceeds the interest expense incurred by the Master Portfolio. If the interest expense exceeds the income earned, the Master Portfolio’s net investment income and dividends to shareholders may be adversely impacted. Treasury roll transactions involve leverage risk. If the Master Portfolio suffers a loss on its investment of the transaction proceeds from a Treasury roll transaction, the Master Portfolio would be required to pay the full repurchase price. Further, the Master Portfolio remains subject to the risk that the market value of the Treasury securities that the Master Portfolio is required to repurchase may decline below the agreed upon repurchase price of those securities. In such cases, the Master Portfolio would need to return a portion of the cash received from the transaction or provide additional Treasury securities to the counterparty.
Borrowed bond agreements, reverse repurchase transactions and treasury roll transactions are entered into by the Master Portfolio under Master Repurchase Agreements (each, an “MRA”), which permit the Master Portfolio, under certain circumstances, including an event of default (such as bankruptcy or insolvency), to offset payables and/or receivables under the MRA with collateral held and/or posted to the counterparty and create one single net payment due to or from the Master Portfolio. With borrowed bond agreements reverse repurchase transactions and treasury roll transactions, typically the Master Portfolio and counterparty under an MRA are permitted to sell, re-pledge, or use the collateral associated with the transaction. Bankruptcy or insolvency laws of a particular jurisdiction may impose restrictions on or prohibitions against such a right of offset in the event of the MRA counterparty’s bankruptcy or insolvency. Pursuant to the terms of the MRA, the Master Portfolio receives or posts securities as collateral with a market value in excess of the repurchase price to be paid or received by the Master Portfolio upon the maturity of the transaction. Upon a bankruptcy or insolvency of the MRA counterparty, the Master Portfolio is considered an unsecured creditor with respect to excess collateral and, as such, the return of excess collateral may be delayed.
| | | | | | |
| 112 | | BLACKROCK BALANCED CAPITAL FUND, INC. | | MARCH 31, 2017 | | |
| | | | |
| Notes to Consolidated Financial Statements (continued) | | | Master Total Return Portfolio | |
As of period end, the following table is a summary of the Master Portfolio’s open borrowed bond agreements and reverse repurchase agreements by counterparty which are subject to offset under an MRA on a net basis:
| | | | | | | | | | | | | | | | | | | | | | | | | | | | | | | | | | | | |
| Counterparty | | Borrowed
Bond
Agreements1 | | | Reverse
Repurchase
Agreements | | | Borrowed
Bonds
at Value
Including
Accrued
Interest2 | | | Net Amount Before
Collateral | | | Non-cash
Collateral
Received | | | Cash
Collateral
Received | | | Non-cash
Collateral
Pledged | | | Net Collateral
(Received)/
Pledged3 | | | Net Exposure
Due (to)/ from
Counterparty4 | |
Bank of Montreal | | | — | | | $ | (263,476,611 | ) | | | — | | | $ | (263,476,611 | ) | | | — | | | | — | | | $ | 263,476,611 | | | $ | 263,476,611 | | | | $ — | |
Barclays Bank PLC | | $ | 108,917,700 | | | | — | | | $ | (109,747,452 | ) | | | (829,752 | ) | | | — | | | | — | | | | 731,748 | | | | 731,748 | | | | (98,004 | ) |
Barclays Capital, Inc. | | | — | | | | (165,901,995 | ) | | | — | | | | (165,901,995 | ) | | | — | | | | — | | | | 165,901,995 | | | | 165,901,995 | | | | — | |
BNP Paribas Securities Corp. | | | 158,432,471 | | | | — | | | | (105,502,407 | ) | | | 52,930,064 | | | | — | | | | — | | | | — | | | | — | | | | 52,930,064 | 5 |
Citigroup Global Markets Limited | | | 454,912 | | | | — | | | | (441,818 | ) | | | 13,094 | | | | — | | | | — | | | | — | | | | — | | | | 13,094 | |
Citigroup Global Markets, Inc. | | | 9,718,988 | | | | — | | | | (5,967,544 | ) | | | 3,751,444 | | | | — | | | | — | | | | — | | | | — | | | | 3,751,444 | 6 |
Credit Agricole Corporate & Investment Bank SA | | | — | | | | (14,105,411 | ) | | | — | | | | (14,105,411 | ) | | | — | | | | — | | | | 14,105,411 | | | | 14,105,411 | | | | — | |
Credit Suisse Securities (USA) LLC | | | — | | | | (166,513,383 | ) | | | — | | | | (166,513,383 | ) | | | — | | | | — | | | | 166,513,383 | | | | 166,513,383 | | | | — | |
Deutsche Bank AG | | | 3,045,279 | | | | — | | | | (2,998,086 | ) | | | 47,193 | | | $ | (47,193 | ) | | | — | | | | — | | | | (47,193 | ) | | | — | |
Deutsche Bank Securities, Inc. | | | 7,990,587 | | | | (158,145,589 | ) | | | (8,183,354 | ) | | | (158,338,356 | ) | | | (10,052 | ) | | | — | | | | 158,348,408 | | | | 158,338,356 | | | | — | |
HSBC Securities (USA), Inc. | | | — | | | | (80,179,900 | ) | | | — | | | | (80,179,900 | ) | | | (560,086 | ) | | | — | | | | 80,739,986 | | | | 80,179,900 | | | | — | |
J.P. Morgan Securities LLC | | | — | | | | (84,752,048 | ) | | | — | | | | (84,752,048 | ) | | | — | | | | — | | | | 84,752,048 | | | | 84,752,048 | | | | — | |
J.P. Morgan Securities PLC | | | 284,857,078 | | | | — | | | | (285,451,626 | ) | | | (594,548 | ) | | | — | | | | — | | | | 594,548 | | | | 594,548 | | | | — | |
Merrill Lynch, Pierce, Fenner & Smith, Inc. | | | 5,017,125 | | | | (391,814,428 | ) | | | (5,057,993 | ) | | | (391,855,296 | ) | | | — | | | | — | | | | 391,855,296 | | | | 391,855,296 | | | | — | |
MUFG Securities Americas, Inc. | | | — | | | | (232,191,170 | ) | | | — | | | | (232,191,170 | ) | | | — | | | $ | (1,196,000 | ) | | | 233,387,170 | | | | 232,191,170 | | | | — | |
Nomura Securities International, Inc. | | | — | | | | (97,027,888 | ) | | | — | | | | (97,027,888 | ) | | | — | | | | (2,820,000 | ) | | | 99,847,888 | | | | 97,027,888 | | | | — | |
RBC Capital Markets, LLC | | | — | | | | (3,015,511 | ) | | | — | | | | (3,015,511 | ) | | | — | | | | — | | | | 3,015,511 | | | | 3,015,511 | | | | — | |
| | | | |
Total | | $ | 578,434,140 | | | $ | (1,657,123,934 | ) | | $ | (523,350,280 | ) | | $ | (1,602,040,074 | ) | | $ | (617,331 | ) | | $ | (4,016,000 | ) | | $ | 1,663,270,003 | | | $ | 1,658,636,672 | | | | $56,596,598 | |
| | | | |
| | 1 | | Included in Investments at value-unaffiliated in the Consolidated Statement of Assets and Liabilities. |
| | 2 | | Includes accrued interest on borrowed bonds in the amount of $700,218 which is included in interest expense payable in the Consolidated Statement of Assets and Liabilities. |
| | 3 | | Net collateral with a value of $1,660,078,486 has been pledged/received in connection with open reverse repurchase agreements. Excess of net collateral pledged to the individual counterparty is not shown for financial reporting purposes. |
| | 4 | | Net exposure represents the net receivable (payable) that would be due from/to the counterparty in the event of default. |
| | 5 | | Borrowed bond agreements with a value of $55,451,655, have been purchased and are pending settlement as of April 3, 2017. |
| | 6 | | Borrowed bond agreements with a value of $3,809,025, have been purchased and are pending settlement as of April 3, 2017. |
When the Master Portfolio enters into an MRA and International Swaps and Derivatives Association, Inc. (an “ISDA”) and/or Master Securities Lending Agreements (“MSLA”) with the same counterparty, the agreements may contain a set-off provision allowing the Master Portfolio to offset a net amount payable with a net amount receivable upon default of the counterparty. Bankruptcy or insolvency laws of a particular jurisdiction may restrict or prohibit the right of offset in bankruptcy, insolvency or other events. For example, regardless of the contractual rights included in an MRA, such laws may prohibit the Master Portfolio from setting off amounts owed to a defaulting counterparty under an MRA against amounts owed to the Master Portfolio by affiliates of the defaulting counterparty. However, the insolvency regimes of many jurisdictions generally permit set-off of simultaneous payables and receivables with the same legal entity under certain types of financial contracts. These rules would apply upon a default of the legal entity, regardless of the existence of a contractual set-off right in those contracts.
In the event the counterparty of securities under an MRA files for bankruptcy or becomes insolvent, the Master Portfolio’s use of the proceeds from the agreement may be restricted while the counterparty, or its trustee or receiver, determines whether or not to enforce the Master Portfolio’s obligation to repurchase the securities.
| | | | | | |
| | | BLACKROCK BALANCED CAPITAL FUND, INC. | | MARCH 31, 2017 | | 113 |
| | | | |
| Notes to Consolidated Financial Statements (continued) | | | Master Total Return Portfolio | |
Short Sales Transactions (Borrowed Bonds): In short sale transactions, the Master Portfolio sells a security it does not hold in anticipation of a decline in the market price of that security. When the Master Portfolio makes a short sale, it will borrow the security sold short (borrowed bond) and deliver the fixed-income security to the counterparty to which it sold the security short. An amount equal to the proceeds received by the Master Portfolio is reflected as an asset and an equivalent liability. The amount of the liability is subsequently marked-to-market to reflect the market value of the short sale. The Master Portfolio is required to repay the counterparty interest on the security sold short, which, if applicable, is shown as interest expense in the Consolidated Statement of Operations. The Master Portfolio is exposed to market risk based on the amount, if any, that the market value of the security increases beyond the market value at which the position was sold. Thus, a short sale of a security involves the risk that instead of declining, the price of the security sold short will rise. The short sale of securities involves the possibility of an unlimited loss since there is an unlimited potential for the market price of the security sold short to increase. A gain is limited to the price at which the Master Portfolio sold the security short. A realized gain or loss is recognized upon the termination of a short sale if the market price is either less than or greater than the proceeds originally received. There is no assurance that the Master Portfolio will be able to close out a short position at a particular time or at an acceptable price.
Short Sales Transactions (Investments Sold Short): In short sale transaction, the Master Portfolio sells a security it does not hold in anticipation of a decline in the market price of that security. When the Master Portfolio makes a short sale, it will borrow the security sold short from a broker/ counterparty and deliver the security to the purchaser. To close out a short position, the Master Portfolio delivers the same security to the broker and records a liability to reflect the obligation to return the security to the broker. The amount of the liability is subsequently marked-to-market to reflect the market value of the short sale. The Master Portfolio maintains a segregated account of securities or deposits cash with the broker-dealer as collateral for the short sales. Cash deposited with the broker is recorded as an asset in the Consolidated Statement of Assets and Liabilities. Securities segregated as collateral are denoted in the Consolidated Schedule of Investments. The Master Portfolio may pay a financing fee for the difference between the market value of the short position and the cash collateral deposited with the broker which would be recorded as interest expense. The Master Portfolio is required to repay the counterparty any dividends received on the security sold short, which, if applicable, is shown as dividend expense in the Consolidated Statement of Operations. The Master Portfolio may pay a fee on the assets borrowed from the counterparty, which, if applicable, is shown as broker fees and expenses on short sales in the Consolidated Statement of Operations. The Master Portfolio is exposed to market risk based on the amount, if any, that the market value of the security increases beyond the market value at which the position was sold. Thus, a short sale of a security involves the risk that instead of declining, the price of the security sold short will rise. The short sale of securities involves the possibility of an unlimited loss since there is an unlimited potential for the market price of the security sold short to increase. A gain, limited to the price at which the Master Portfolio sold the security short. A realized gain or loss is recognized upon the termination of a short sale if the market price is either less than or greater than the proceeds originally received. There is no assurance that the Master Portfolio will be able to close out a short position at a particular time or at an acceptable price.
Securities Lending: The Master Portfolio may lend its securities to approved borrowers, such as brokers, dealers and other financial institutions. The borrower pledges and maintains with the Master Portfolio collateral consisting of cash, an irrevocable letter of credit issued by a bank, or securities issued or guaranteed by the U.S. Government. The initial collateral received by the Master Portfolio is required to have a value of at least 102% of the current value of the loaned securities for securities traded on U.S. exchanges and a value of at least 105% for all other securities. The collateral is maintained thereafter at a value equal to at least 100% of the current market value of the securities on loan. The market value of the loaned securities is determined at the close of each business day of the Master Portfolio and any additional required collateral is delivered to the Master Portfolio, or excess collateral returned by the Master Portfolio, on the next business day. During the term of the loan, the Master Portfolio is entitled to all distributions made on or in respect of the loaned securities but does not receive interest income on securities received as collateral. Loans of securities are terminable at any time and the borrower, after notice, is required to return borrowed securities within the standard time period for settlement of securities transactions.
The market value of any securities on loan, all of which were classified as investment companies in the Master Portfolio’s Consolidated Schedule of Investments, and the value of any related collateral are shown separately in the Consolidated Statement of Assets and Liabilities as a component of investments at value — unaffiliated, and collateral on securities loaned at value, respectively. As of period end, any securities on loan were collateralized by cash and/or U.S. Government obligations. Cash collateral invested by the securities lending agent, BlackRock Investment Management, LLC (“BIM”), if any, is disclosed in the Consolidated Schedule of Investments.
Securities lending transactions are entered into by the Master Portfolio under an MSLA, which provide the right, in the event of default (including bankruptcy or insolvency), for the non-defaulting party to liquidate the collateral and calculate a net exposure to the defaulting party or request additional collateral. In the event that a borrower defaults, the Master Portfolio, as lender, would offset the market value of the collateral received against the market value of the securities loaned. When the value of the collateral is greater than that of the market value of the securities loaned, the lender is left with a net amount payable to the defaulting party. However, bankruptcy or insolvency laws of a particular jurisdiction may impose restrictions on or prohibitions against such a right of offset in the event of an MSLA counterparty’s bankruptcy or insolvency. Under the MSLA, absent an event of default, the borrower can resell or re-pledge the loaned securities, and the Master Portfolio can reinvest cash collateral received in connection with loaned securities. Upon an event of default, the parties’ obligations to return the securities or collateral to the other party are extinguished, and the parties can
| | | | | | |
| 114 | | BLACKROCK BALANCED CAPITAL FUND, INC. | | MARCH 31, 2017 | | |
| | | | |
| Notes to Consolidated Financial Statements (continued) | | | Master Total Return Portfolio | |
resell or re-pledge the loaned securities or the collateral received in connection with the loaned securities in order to satisfy the defaulting party’s net payment obligation for all transactions under the MSLA. The defaulting party remains liable for any deficiency.
As of period end, the following table is a summary of the Master Portfolio’s securities lending agreements by counterparty which are subject to offset under an MSLA:
| | | | | | | | | | |
| Counterparty | | Securities Loaned
at Value | | | Cash Collateral
Received1 | | | Net Amount |
Citigroup Global Markets, Inc. | | | $ 568,581 | | | | $ (568,581) | | | — |
Deutsche Bank Securities, Inc. | | | 6,841,520 | | | | (6,841,520) | | | — |
J.P. Morgan Securities LLC | | | 7,208,448 | | | | (7,208,448) | | | — |
Merrill Lynch, Pierce, Fenner & Smith, Inc. | | | 4,395,583 | | | | (4,395,583) | | | — |
| | | |
Total | | | $19,014,132 | | | | $(19,014,132) | | | — |
| | | |
| | 1 | | Collateral with a value of $19,443,860 has been received in connection with securities lending agreements. Collateral received in excess of the value of securities loaned from the individual counterparty is not shown for financial reporting purposes in the table above. |
The risks of securities lending include the risk that the borrower may not provide additional collateral when required or may not return the securities when due. To mitigate these risks, the Master Portfolio benefits from a borrower default indemnity provided by BIM. BIM’s indemnity allows for full replacement of the securities loaned if the collateral received does not cover the value on the securities loaned in the event of borrower default. The Master Portfolio could incur a loss if the value of an investment purchased with cash collateral falls below the market value of loaned securities or if the value of an investment purchased with cash collateral falls below the value of the original cash collateral received.
5. Derivative Financial Instruments:
The Master Portfolio engages in various portfolio investment strategies using derivative contracts both to increase the returns of the Master Portfolio and/or to manage its exposure to certain risks such as credit risk, equity risk, interest rate risk, foreign currency exchange rate risk, commodity price risk or other risks (e.g., inflation risk). Derivative financial instruments categorized by risk exposure are included in the Consolidated Schedule of Investments. These contracts may be transacted on an exchange or OTC.
Futures Contracts: The Master Portfolio invests in long and/or short positions in futures and options on futures contracts to gain exposure to, or manage exposure to, changes in interest rates (interest rate risk), changes in the value of equity securities (equity risk) or foreign currencies (foreign currency exchange rate risk).
Futures contracts are agreements between the Master Portfolio and a counterparty to buy or sell a specific quantity of an underlying instrument at a specified price and on a specified date. Depending on the terms of a contract, it is settled either through physical delivery of the underlying instrument on the settlement date or by payment of a cash amount on the settlement date. Upon entering into a futures contract, the Master Portfolio is required to deposit initial margin with the broker in the form of cash or securities in an amount that varies depending on a contract’s size and risk profile. The initial margin deposit must then be maintained at an established level over the life of the contract.
Securities deposited as initial margin are designated in the Consolidated Schedule of Investments and cash deposited, if any, is shown as cash pledged for futures contracts in the Consolidated Statement of Assets and Liabilities. Pursuant to the contract, the Master Portfolio agrees to receive from or pay to the broker an amount of cash equal to the daily fluctuation in market value of the contract (“variation margin”). Variation margin is recorded as unrealized appreciation (depreciation) and, if any, shown as variation margin receivable (or payable) on futures contracts in the Consolidated Statement of Assets and Liabilities. When the contract is closed, a realized gain or loss is recorded in the Consolidated Statement of Operations equal to the difference between the value of the contract at the time it was opened and the value at the time it was closed. The use of futures contracts involves the risk of an imperfect correlation in the movements in the price of futures contracts and interest, foreign currency exchange rates or underlying assets.
Forward Foreign Currency Exchange Contracts: The Master Portfolio enters into forward foreign currency exchange contracts to gain or reduce exposure to foreign currencies (foreign currency exchange rate risk).
A forward foreign currency exchange contract is an agreement between two parties to buy and sell a currency at a set exchange rate on a specified date. These contracts help to manage the overall exposure to the currencies in which some of the investments held by the Master Portfolio are denominated and in some cases, may be used to obtain exposure to a particular market.
The contract is marked to market daily and the change in market value is recorded as unrealized appreciation (depreciation) in the Consolidated Statement of Assets and Liabilities. When a contract is closed, a realized gain or loss is recorded in the Consolidated Statement of Operations equal to the difference between the value at the time it was opened and the value at the time it was closed. Non-deliverable forward foreign currency exchange
| | | | | | |
| | | BLACKROCK BALANCED CAPITAL FUND, INC. | | MARCH 31, 2017 | | 115 |
| | | | |
| Notes to Consolidated Financial Statements (continued) | | | Master Total Return Portfolio | |
contracts are settled with the counterparty in cash without the delivery of foreign currency. The use of forward foreign currency exchange contracts involves the risk that the value of a forward foreign currency exchange contract changes unfavorably due to movements in the value of the referenced foreign currencies.
Options: The Master Portfolio purchases and writes call and put options to increase or decrease its exposure to the risks of underlying instruments, including equity risk, interest rate risk and/or commodity price risk and/or, in the case of options written, to generate gains from options premiums.
A call option gives the purchaser (holder) of the option the right (but not the obligation) to buy, and obligates the seller (writer) to sell (when the option is exercised) the underlying instrument at the exercise or strike price at any time or at a specified time during the option period. A put option gives the holder the right to sell and obligates the writer to buy the underlying instrument at the exercise or strike price at any time or at a specified time during the option period.
Premiums paid on options purchased and premiums received on options written, as well as the daily fluctuation in market value, are included in investments at value — unaffiliated and options written at value, respectively, in the Consolidated Statement of Assets and Liabilities. When an instrument is purchased or sold through the exercise of an option, the premium is offset against the cost or proceeds of the underlying instrument. When an option expires, a realized gain or loss is recorded in the Consolidated Statement of Operations to the extent of the premiums received or paid. When an option is closed or sold, a gain or loss is recorded in the Consolidated Statement of Operations to the extent the cost of the closing transaction exceeds the premiums received or paid). When the Master Portfolio writes a call option, such option is typically “covered,” meaning that it holds the underlying instrument subject to being called by the option counterparty. When the Master Portfolio writes a put option, such option is covered by cash in an amount sufficient to cover the obligation.
| • | | Swaptions — The Master Portfolio purchases and writes options on swaps (“swaptions”) primarily to preserve a return or spread on a particular investment or portion of the Master Portfolio’s holdings, as a duration management technique or to protect against an increase in the price of securities it anticipates purchasing at a later date. The purchaser and writer of a swaption is buying or granting the right to enter into a previously agreed upon interest rate or credit default swap agreement (interest rate risk and/or credit risk) at any time before the expiration of the option. |
| • | | Foreign Currency options — The Master Portfolio purchases and writes foreign currency options, foreign currency futures and options on foreign currency futures to gain or reduce exposure to foreign currencies (foreign currency exchange rate risk). Foreign currency options give the purchaser the right to buy from or sell to the writer a foreign currency at any time before the expiration of the option. |
| • | | Barrier options — The Master Portfolio may purchase and write a variety of options with non-standard payout structures or other features (“barrier options”) that are generally traded OTC. |
The Master Portfolio may invest in various types of barrier options, including down-and-out options, down-and-in options, double no-touch options, one-touch options, up-and-out options and up-and-in options. Down-and-out options expire worthless to the purchaser if the price of the underlying instrument falls below a specific barrier price level prior to the expiration date. Down-and-in options expire worthless to the purchaser unless the price of the underlying instrument falls below a specific barrier price level prior to the expiration date. Double no-touch options provide the purchaser an agreed-upon payout if the price of the underlying instrument does not reach or surpass predetermined barrier price levels prior to the option’s expiration date. One-touch options provide the purchaser an agreed-upon payout if the price of the underlying instrument reaches or surpasses predetermined barrier price levels prior to the expiration date. Up-and-out options expire worthless if the price of the underlying instrument increases beyond a predetermined barrier price level prior to the expiration date. Up-and-in options can only be exercised when the price of the underlying instrument increases beyond a predetermined barrier price level.
| • | | Structured options — The Master Portfolio invests in structured options to increase or decrease its exposure to an underlying index or group of securities (equity risk). |
These options may consist of single or multiple OTC options which are priced as a single instrument. They may only be exercised at the expiration date, but may be transferred/sold prior to the expiration date. The value of a structured option may either increase or decrease with the underlying index or group of securities, depending on the combination of options used. Structured options are issued in units whereby each unit represents a structure based on the specific index with an initial reference strike price. One type of structure involves the combination of selling a put while buying a call on a specific index. This option would rise in value as the underlying index increases and fall in value as the underlying index decreases. Alternatively, another structure involves the sale of a call and the purchase of a put. This option structure would rise in value as the underlying index decreases and fall in value as the underlying index increases. Upon the exercise of the structured option, the Master Portfolio will receive a payment from, or be required to remit a payment to, the counterparty depending on the value of the underlying index at exercise.
| | | | | | |
| 116 | | BLACKROCK BALANCED CAPITAL FUND, INC. | | MARCH 31, 2017 | | |
| | | | |
| Notes to Consolidated Financial Statements (continued) | | | Master Total Return Portfolio | |
In purchasing and writing options, the Master Portfolio bears the risk of an unfavorable change in the value of the underlying instrument or the risk that it may not be able to enter into a closing transaction due to an illiquid market. Exercise of a written option could result in the Master Portfolio purchasing or selling a security when it otherwise would not, or at a price different from the current market value.
Swaps: The Master Portfolio enters into swap contracts to manage exposure to issuers, markets and securities. Such contracts are agreements between the Master Portfolio and a counterparty to make periodic net payments on a specified notional amount or a net payment upon termination. Swap agreements are privately negotiated in the OTC market and may be entered into as a bilateral contract (“OTC swaps”) or centrally cleared (“centrally cleared swaps”).
For OTC swaps, any upfront premiums paid and any upfront fees received are shown as swap premiums paid and swap premiums received, respectively, in the Consolidated Statement of Assets and Liabilities and amortized over the term of the contract. The daily fluctuation in market value is recorded as unrealized appreciation (depreciation) on OTC Swaps in the Consolidated Statement of Assets and Liabilities. Payments received or paid are recorded in the Consolidated Statement of Operations as realized gains or losses, respectively. When an OTC swap is terminated, a realized gain or loss is recorded in the Consolidated Statement of Operations equal to the difference between the proceeds from (or cost of) the closing transaction and the Master Portfolio’s basis in the contract, if any. Generally, the basis of the contract is the premium received or paid.
In a centrally cleared swap, immediately following execution of the swap contract, the swap contract is novated to a central counterparty (the “CCP”) and the Master Portfolio’s counterparty on the swap agreement becomes the CCP. The Master Portfolio is required to interface with the CCP through the broker. Upon entering into a centrally cleared swap, the Master Portfolio is required to deposit initial margin with the broker in the form of cash or securities in an amount that varies depending on the size and risk profile of the particular swap. Securities deposited as initial margin are designated in the Consolidated Schedule of Investments and cash deposited is shown as cash pledged for centrally cleared swaps in the Consolidated Statement of Assets and Liabilities. Pursuant to the contract, the Master Portfolio agrees to receive from or pay to the broker an amount of cash equal to the daily fluctuation in market value of the contract (“variation margin”). Variation margin is recorded as unrealized appreciation (depreciation) and shown as variation margin receivable (or payable) on centrally cleared swaps in the Consolidated Statement of Assets and Liabilities. Payments received from (paid to) the counterparty, including at termination, are recorded as realized gains (losses) in the Consolidated Statement of Operations.
| • | | Credit default swaps — The Master Portfolio enters into credit default swaps to manage its exposure to the market or certain sectors of the market, to reduce its risk exposure to defaults of corporate and/or sovereign issuers or to create exposure to corporate and/or sovereign issuers to which it is not otherwise exposed (credit risk). |
The Master Portfolio may either buy or sell (write) credit default swaps on single-name issuers (corporate or sovereign), a combination or basket of single-name issuers or traded indexes. Credit default swaps are agreements in which the protection buyer pays fixed periodic payments to the seller in consideration for a promise from the protection seller to make a specific payment should a negative credit event take place with respect to the referenced entity (e.g., bankruptcy, failure to pay, obligation acceleration, repudiation, moratorium or restructuring). As a buyer, if an underlying credit event occurs, the Master Portfolio will either (i) receive from the seller an amount equal to the notional amount of the swap and deliver the referenced security or underlying securities comprising the index, or (ii) receive a net settlement of cash equal to the notional amount of the swap less the recovery value of the security or underlying securities comprising the index. As a seller (writer), if an underlying credit event occurs, the Master Portfolio will either pay the buyer an amount equal to the notional amount of the swap and take delivery of the referenced security or underlying securities comprising the index or pay a net settlement of cash equal to the notional amount of the swap less the recovery value of the security or underlying securities comprising the index.
| • | | Total return swaps — The Master Portfolio enters into total return swaps to obtain exposure to a security or market without owning such security or investing directly in such market or to exchange the risk/return of one market (e.g., fixed income) with another market (e.g., equity or commodity prices) (equity risk, commodity price risk and/or interest rate risk). |
Total return swaps are agreements in which there is an exchange of cash flows whereby one party commits to make payments based on the total return (distributions plus capital gains/losses) of an underlying instrument in exchange for fixed or floating rate interest payments. If the total return of the instrument or index underlying the transaction exceeds or falls short of the offsetting fixed or floating interest rate obligation, the Master Portfolio receives payment from or makes a payment to the counterparty.
| • | | Total return swaps — The Master Portfolio enters into total return swaps to obtain exposure to a portfolio of long and short securities without owning such securities. |
Under the terms of a contract, the swap is designed to function as a portfolio of direct investments in long and short equity positions. This means that the Master Portfolio has the ability to trade in and out of these long and short positions within the swap and will receive the economic benefits and risks equivalent to direct investment in these positions, subject to certain adjustments due to events related to the counterparty. Benefits and risks include capital appreciation (depreciation), corporate actions and dividends received and paid, all of which are reflected in the swap’s market
| | | | | | |
| | | BLACKROCK BALANCED CAPITAL FUND, INC. | | MARCH 31, 2017 | | 117 |
| | | | |
| Notes to Consolidated Financial Statements (continued) | | | Master Total Return Portfolio | |
value. The market value also includes interest charges and credits (“financing fees”) related to the notional values of the long and short positions and cash balances within the swap. These interest charges and credits are based on a specified benchmark rate plus or minus a specified spread determined based upon the country and/or currency of the positions in the portfolio.
Positions within the swap and financing fees are reset periodically. During a reset, any unrealized appreciation (depreciation) on positions and accrued financing fees become available for cash settlement between the Master Portfolio and the counterparty. The amounts that are available for cash settlement are recorded as realized gains or losses in the Consolidated Statement of Operations. Cash settlement in and out of the swap may occur at a reset date or any other date, at the discretion of the Master Portfolio and the counterparty, over the life of the agreement. Certain swaps have no stated expiration and can be terminated by either party at any time.
| • | | Interest rate swaps — The Master Portfolio enters into interest rate swaps to gain or reduce exposure to interest rates or to manage duration, the yield curve or interest rate (interest rate risk). |
Interest rate swaps are agreements in which one party pays a stream of interest payments, either fixed or floating, in exchange for another party’s stream of interest payments, either fixed or floating, on the same notional amount for a specified period of time. In more complex interest rate swaps, the notional principal amount may decline (or amortize) over time.
| • | | Currency swaps — The Master Portfolio enters into currency swaps to gain or reduce exposure to foreign currencies (foreign currency exchange rate risk). |
Currency swaps are interest rate swaps in which one party pays a stream of interest payments, either fixed or floating, in exchange for another party’s stream of interest payments, either fixed or floating, based on the notional amounts of two different currencies. The notional amounts are typically determined based on the spot exchange rates at the inception of the trade. Currency swaps may also involve an exchange of notional amounts at the start, during and/or at expiration of the contract, either at the current spot rate or another specified rate.
| • | | Forward swaps — The Master Portfolio enters into forward interest rate swaps and forward total return swaps. In a forward swap, the Master Portfolio and the counterparty agree to make periodic net payments beginning on a specified date or a net payment at termination. |
Swap transactions involve, to varying degrees, elements of interest rate, credit and market risk in excess of the amounts recognized in the Consolidated Statement of Assets and Liabilities. Such risks involve the possibility that there will be no liquid market for these agreements, that the counterparty to the agreements may default on its obligation to perform or disagree as to the meaning of the contractual terms in the agreements, and that there may be unfavorable changes in interest rates and/or market values associated with these transactions.
Master Netting Arrangements: In order to define its contractual rights and to secure rights that will help it mitigate its counterparty risk, the Master Portfolio may enter into an International Swaps and Derivatives Association, Inc. Master Agreement (“ISDA Master Agreement”) or similar agreement with its counterparties. An ISDA Master Agreement is a bilateral agreement between the Master Portfolio and a counterparty that governs certain OTC derivatives and typically contains, among other things, collateral posting terms and netting provisions in the event of a default and/or termination event. Under an ISDA Master Agreement, the Master Portfolio may, under certain circumstances, offset with the counterparty certain derivative financial instruments’ payables and/or receivables with collateral held and/or posted and create one single net payment. The provisions of the ISDA Master Agreement typically permit a single net payment in the event of default including the bankruptcy or insolvency of the counterparty. Bankruptcy or insolvency laws of a particular jurisdiction may restrict or prohibit the right of offset in bankruptcy, insolvency or other events. In addition, certain ISDA Master Agreements allow counterparties to terminate derivative contracts prior to maturity in the event the Master Portfolio’s net assets decline by a stated percentage or the Master Portfolio fails to meet the terms of its ISDA Master Agreements. The result would cause the Master Portfolio to accelerate payment of any net liability owed to the counterparty.
Collateral Requirements: For derivatives traded under an ISDA Master Agreement, the collateral requirements are typically calculated by netting the mark-to-market amount for each transaction under such agreement and comparing that amount to the value of any collateral currently pledged by the Master Portfolio and the counterparty.
Cash collateral that has been pledged to cover obligations of the Master Portfolio and cash collateral received from the counterparty, if any, is reported separately on the Consolidated Statement of Assets and Liabilities as cash pledged as collateral and cash received as collateral, respectively. Non-cash collateral pledged by the Master Portfolio, if any, is noted in the Consolidated Schedule of Investments. Generally, the amount of collateral due from or to a counterparty is subject to a certain minimum transfer amount threshold before a transfer is required, which is determined at the close of business of the Master Portfolio. Any additional required collateral is delivered to/pledged by the Master Portfolio on the next business day. Typically, the counterparty is not permitted to sell, re-pledge or use cash and non-cash collateral it receives. The Master Portfolio generally agrees not to use non-cash collateral that it receives but may, absent default or certain other circumstances defined in the underlying ISDA Master Agreement, be permitted to use cash collateral received. In such cases, interest may be paid pursuant to the collateral arrangement with the counterparty. To the extent
| | | | | | |
| 118 | | BLACKROCK BALANCED CAPITAL FUND, INC. | | MARCH 31, 2017 | | |
| | | | |
| Notes to Consolidated Financial Statements (continued) | | | Master Total Return Portfolio | |
amounts due to the Master Portfolio from its counterparties are not fully collateralized, it bears the risk of loss from counterparty non-performance. Likewise, to the extent the Master Portfolio has delivered collateral to a counterparty and stands ready to perform under the terms of its agreement with such counterparty, it bears the risk of loss from a counterparty in the amount of the value of the collateral in the event the counterparty fails to return such collateral. Based on the terms of agreements, collateral may not be required for all derivative contracts.
For financial reporting purposes, the Master Portfolio does not offset derivative assets and derivative liabilities that are subject to netting arrangements, if any, in the Consolidated Statement of Assets and Liabilities.
6. Investment Advisory Agreement and Other Transactions with Affiliates:
The PNC Financial Services Group, Inc. is the largest stockholder and an affiliate of BlackRock, Inc. (“BlackRock”) for 1940 Act purposes.
Investment Advisory: The Master LLC, on behalf of the Master Portfolio, entered into an Investment Advisory Agreement with BlackRock Advisors, LLC (the “Manager”), the Master Portfolio’s investment adviser, an indirect, wholly-owned subsidiary of BlackRock, to provide investment advisory and administration services. The Manager is responsible for the management of the Master Portfolio’s portfolio and provides the personnel, facilities, equipment and certain other services necessary to the operations of the Master Portfolio.
For such services, the Master Portfolio pays the Manager a monthly fee at an annual rate equal to the following percentages of the average daily value of the Master Portfolio’s net assets:
| | | | | |
| Average Daily Net Assets | | Investment Advisory Fee |
First $250 Million | | | | 0.16 | % |
$250 Million - $ 500 Million | | | | 0.12 | % |
$500 Million - $ 750 Million | | | | 0.08 | % |
Greater than $750 Million | | | | 0.05 | % |
The Manager provides investment management and other services to the Subsidiary. The Manager does not receive separate compensation from the Subsidiary for providing investment management or administrative services. However, the Master Portfolio pays the Manager based on the Master Portfolio’s net assets, which includes the assets of the Subsidiary.
With respect to the Master Portfolio, the Manager entered into sub-advisory agreements with BlackRock International Limited (“BIL”) and BlackRock (Singapore) Limited (“BRS”), each an affiliate of the Manager. The Manager pays BIL and BRS for services they provide, a monthly fee that is a percentage of the investment advisory fees paid by the Master Portfolio to the Manager.
Expense Waivers: With respect to the Master Portfolio, the Manager voluntarily agreed to waive its investment advisory fees by the amount of investment advisory fees the Master Portfolio pays to the Manager indirectly through its investment in affiliated money market funds (the “affiliated money market fund waiver”). This amount is included in fees waived by the Manager in the Consolidated Statement of Operations. For the six months ended March 31, 2017, the amount waived was $4,830.
The Manager voluntarily agreed to waive its investment advisory fee with respect to any portion of the Master Portfolio’s assets invested in affiliated equity and fixed-income mutual funds and exchange-traded funds that have a contractual management fee. Effective January 27, 2017, the waiver became contractual through January 31, 2018. The contractual agreement may be terminated upon 90 days’ notice by a majority of the non-interested directors of the Master Portfolio or by a vote of a majority of the outstanding voting securities of the Master Portfolio. This amount is included in fees waived by the Manager in the Consolidated Statement of Operations. For the six months ended March 31, 2017, the Master Portfolio waived $2,872 in investment advisory fees pursuant to these arrangements.
For the six months ended March 31, 2017, the Master LLC reimbursed the Manager $58,398 for certain accounting services, which is included in accounting services in the Consolidated Statement of Operations.
Securities Lending: The U.S. Securities and Exchange Commission has issued an exemptive order which permits BIM, an affiliate of the Manager, to serve as securities lending agent for the Master Portfolio, subject to applicable conditions. As securities lending agent, BIM bears all operational costs directly related to securities lending. The Master Portfolio is responsible for expenses in connection with the investment of cash collateral received for securities on loan (the “collateral investment expenses”). The cash collateral is invested in a private investment company managed by the Manager or its affiliates. However, BIM has agreed to cap the collateral investment expenses of the private investment company to an annual rate of 0.04%. The investment adviser to the private investment company will not charge any advisory fees with respect to shares purchased by the Master Portfolio. If the private investment company’s weekly liquid assets fall below 30% of its total assets, BIM, as managing member of the private investment company, is permitted at any time, if it determines it to be in the best interests of the private investment company, to impose a liquidity fee of up to 2% of the value of units withdrawn or impose a redemption gate that temporarily suspends the right of withdrawal out of the private investment company. In addition, if
| | | | | | |
| | | BLACKROCK BALANCED CAPITAL FUND, INC. | | MARCH 31, 2017 | | 119 |
| | | | |
| Notes to Consolidated Financial Statements (continued) | | | Master Total Return Portfolio | |
the private investment company’s weekly liquid assets fall below 10% of its total assets at the end of any business day, the private investment company will impose a liquidity fee in the default amount of 1% of the amount withdrawn, generally effective as of the next business day, unless BIM determines that a higher (not to exceed 2%) or lower fee level or not imposing a liquidity fee is in the best interests of the private investment company. The shares of the private investment company purchased by the Master Portfolio would be subject to any such liquidity fee or redemption gate imposed.
Securities lending income is equal to the total of income earned from the reinvestment of cash collateral, net of fees and other payments to and from borrowers of securities, and less the collateral investment expenses. The Master Portfolio retains a portion of securities lending income and remits a remaining portion to BIM as compensation for its services as securities lending agent.
Pursuant to a securities lending agreement, the Master Portfolio retains 71.5% of securities lending income, and this amount retained can never be less than 65% of the total of securities lending income plus the collateral investment expenses.
In addition, commencing the business day following the date that the aggregate securities lending income earned across the Equity-Bond Complex in a calendar year exceeds a specified threshold, the Master Portfolio, pursuant to the securities lending agreement, will retain for the remainder of that calendar year securities lending income as follows: 75% of securities lending income, and this amount retained can never be less than 65% of the total of securities lending income plus the collateral investment expenses.
The share of securities lending income earned by the Master Portfolio is shown as securities lending — affiliated — net in the Consolidated Statement of Operations. For the six months ended March 31, 2017, the Master Portfolio paid BIM $17,931 for securities lending agent services.
Interfund Lending: In accordance with an exemptive order (the “Order”) from the U.S. Securities and Exchange Commission, the Master Portfolio may participate in a joint lending and borrowing facility for temporary purposes (the “Interfund Lending Program”), subject to compliance with the terms and conditions of the Order, and to the extent permitted by the Master Portfolio’s investment policies and restrictions. The Master Portfolio is currently permitted to borrow under the Interfund Lending Program.
A lending BlackRock fund may lend in aggregate up to 15% of its net assets, but may not lend more than 5% of its net assets to any one borrowing fund through the Interfund Lending Program. A borrowing BlackRock fund may not borrow through the Interfund Lending Program or from any other source more than 33 1/3% of its total assets (or any lower threshold provided for by the fund’s investment restrictions). If a borrowing BlackRock fund’s total outstanding borrowings exceed 10% of its total assets, each of its outstanding interfund loans will be subject to collateralization of at least 102% of the outstanding principal value of the loan. All interfund loans are for temporary or emergency purposes and the interest rate to be charged will be the average of the highest current overnight repurchase agreement rate available to a lending fund and the bank loan rate, as calculated according to a formula established by the Board.
During the six months ended March, 31.2017, the Master Portfolio did not participate in the Interfund Lending Program.
Officers and Directors: Certain officers and/or directors of the Master LLC are officers and/or directors of BlackRock or its affiliates.
Other Transactions: The Master Portfolio may purchase securities from, or sell securities to, an affiliated fund provided the affiliation is due solely to having a common investment adviser, common officers, or common trustees. For the six months ended March 31, 2017, the purchase and sale transactions with an affiliated fund in compliance with Rule 17a-7 under the 1940 Act were as follows:
| | | | | | | | |
| Purchases | | Sales | | | Net Realized Loss | |
| $28,291,957 | | | $11,488,993 | | | | $(155,894) | |
7. Purchases and Sales:
For the six months ended March 31, 2017, purchases and sales of investments, including paydown and mortgage dollar rolls and excluding short-term securities, were as follows:
| | | | | | | | |
| | | Purchases | | | Sales | |
Non-U.S. Government Securities | | | $42,865,812,072 | | | | $45,641,774,878 | |
U.S. Government Securities | | | $10,118,324,348 | | | | $10,676,032,730 | |
| | |
| | | | | | | | | |
For the six months ended March 31, 2017, purchases and sales related to mortgage dollar rolls were as follows:
| | | | |
Purchases | | | $16,756,785,730 | |
Sales | | | $16,755,049,825 | |
| | | | | | |
| 120 | | BLACKROCK BALANCED CAPITAL FUND, INC. | | MARCH 31, 2017 | | |
| | | | |
| Notes to Consolidated Financial Statements (continued) | | | Master Total Return Portfolio | |
8. Income Tax Information:
The Master Portfolio is classified as a partnership for U. S. federal income tax purposes. As such, each investor in the Master Portfolio is treated as the owner of its proportionate share of net assets, income, expenses and realized and unrealized gains and losses of the Master Portfolio. Therefore, no U.S. federal income tax provision is required. It is intended that the Master Portfolio’s assets will be managed so an investor in the Master Portfolio can satisfy the requirements of Subchapter M of the Internal Revenue Code of 1986, as amended.
The Master Portfolio files U.S. federal and various state and local tax returns. No income tax returns are currently under examination. The statute of limitations on the Master Portfolio’s U.S. federal tax returns generally remains open for each of the four years ended September 30, 2016. The statutes of limitations on Master Portfolio’s state and local tax returns may remain open for an additional year depending upon the jurisdiction.
Management has analyzed tax laws and regulations and their application to the Master Portfolio as of March 31, 2017, inclusive of the open tax return years, and does not believe that there are any uncertain tax positions that require recognition of a tax liability in the Master Portfolio’s consolidated financial statements.
As of March 31, 2017, gross unrealized appreciation and depreciation based on cost for U. S. federal income tax purposes were as follows:
| | | | |
Tax cost | | $ | 16,014,698,522 | |
| | | | |
Gross unrealized appreciation | | $ | 104,677,457 | |
Gross unrealized depreciation | | | (106,195,121 | ) |
| | | | |
Net unrealized depreciation | | $ | (1,517,664 | ) |
| | | | |
| | | | | |
9. Bank Borrowings:
The Master LLC, on behalf of the Master Portfolio, along with certain other funds managed by the Manager and its affiliates (“Participating Funds”), is a party to a 364-day, $2.1 billion credit agreement with a group of lenders. Under this agreement, the Master Portfolio may borrow to fund shareholder redemptions. Excluding commitments designated for certain individual funds, the Participating Funds, including the Master Portfolio, can borrow up to an aggregate commitment amount of $1.6 billion at any time outstanding, subject to asset coverage and other limitations as specified in the agreement. The credit agreement has the following terms: a fee of 0.12% per annum on unused commitment amounts and interest at a rate equal to the higher of (a) one-month LIBOR (but, in any event, not less than 0.00%) on the date the loan is made plus 0.80% per annum or (b) the Fed Funds rate (but, in any event, not less than 0.00%) in effect from time to time plus 0.80% per annum on amounts borrowed. The agreement expires in April 2017 unless extended or renewed. Participating Funds paid administration, legal and arrangement fees, which, if applicable, are included in miscellaneous expenses in the Consolidated Statement of Operations. These fees were allocated among such funds based upon portions of the aggregate commitment available to them and relative net assets of Participating Funds. During the six months ended March 31, 2017, the Master Portfolio did not borrow under the credit agreement.
10. Principal Risks:
Many municipalities insure repayment of their bonds, which may reduce the potential for loss due to credit risk. The market value of these bonds may fluctuate for other reasons, including market perception of the value of such insurance, and there is no guarantee that the insurer will meet its obligation.
Inventories of municipal bonds held by brokers and dealers may decrease, which would lessen their ability to make a market in these securities. Such a reduction in market making capacity could potentially decrease the Master Portfolio’s ability to buy or sell bonds. As a result, the Master Portfolio may sell a security at a lower price, sell other securities to raise cash, or give up an investment opportunity, any of which could have a negative impact on performance. If the Master Portfolio needed to sell large blocks of bonds, those sales could further reduce the bonds’ prices and impact performance.
In the normal course of business, the Master Portfolio invests in securities and enters into transactions where risks exist due to fluctuations in the market (market risk) or failure of the issuer to meet all its obligations, including the ability to pay principal and interest when due (issuer credit risk). The value of securities held by the Master Portfolio may decline in response to certain events, including those directly involving the issuers of securities owned by the Master Portfolio. Changes arising from the general economy, the overall market and local, regional or global political and/or social instability, as well as currency, interest rate and price fluctuations, may also affect the securities’ value.
The Master Portfolio may be exposed to prepayment risk, which is the risk that borrowers may exercise their option to prepay principal earlier than scheduled during periods of declining interest rates, which would force the Master Portfolio to reinvest in lower yielding securities. The Master Portfolio may also be exposed to reinvestment risk, which is the risk that income from the Master Portfolio’s portfolio will decline if the Master Portfolio invests the proceeds from matured, traded or called fixed income securities at market interest rates that are below the Master Portfolio portfolio’s current earnings rate.
| | | | | | |
| | | BLACKROCK BALANCED CAPITAL FUND, INC. | | MARCH 31, 2017 | | 121 |
| | | | |
| Notes to Consolidated Financial Statements (continued) | | | Master Total Return Portfolio | |
On October 11, 2016, BlackRock implemented certain changes required by amendments to Rule 2a-7 under the 1940 Act, which governs the operations of U.S. money market funds. The Master Portfolio may be exposed to additional risks when reinvesting cash collateral in money market funds that do not seek to maintain a stable NAV per share of $1.00 and which may be subject to redemption gates or liquidity fees under certain circumstances.
Valuation Risk: The market values of equities, such as common stocks and preferred securities or equity related investments, such as futures and options, may decline due to general market conditions which are not specifically related to a particular company. They may also decline due to factors which affect a particular industry or industries. The Master Portfolio may invest in illiquid investments and may experience difficulty in selling those investments in a timely manner at the price that it believes the investments are worth. Prices may fluctuate widely over short or extended periods in response to company, market or economic news. Markets also tend to move in cycles, with periods of rising and falling prices. This volatility may cause the Master Portfolio’s NAV to experience significant increases or decreases over short periods of time. If there is a general decline in the securities and other markets, the NAV of the Master Portfolio may lose value, regardless of the individual results of the securities and other instruments in which the Master Portfolio invests.
The price the Master Portfolio could receive upon the sale of any particular portfolio investment may differ from the Master Portfolio’s valuation of the investment, particularly for securities that trade in thin or volatile markets or that are valued using a fair valuation technique or a price provided by an independent pricing service. Changes to significant unobservable inputs and assumptions (i.e., publicly traded company multiples, growth rate, time to exit) due to the lack of observable inputs may significantly impact the resulting fair value and therefore the Master Portfolio’s results of operations. As a result, the price received upon the sale of an investment may be less than the value ascribed by the Master Portfolio, and the Master Portfolio could realize a greater than expected loss or lesser than expected gain upon the sale of the investment. The Master Portfolio’s ability to value its investments may also be impacted by technological issues and/or errors by pricing services or other third party service providers.
Counterparty Credit Risk: Similar to issuer credit risk, the Master Portfolio may be exposed to counterparty credit risk, or the risk that an entity may fail to or be unable to perform on its commitments related to unsettled or open transactions. The Master Portfolio manages counterparty credit risk by entering into transactions only with counterparties that the Manager believes have the financial resources to honor their obligations and by monitoring the financial stability of those counterparties. Financial assets, which potentially expose the Master Portfolio to market, issuer and counterparty credit risks, consist principally of financial instruments and receivables due from counterparties. The extent of the Master Portfolio’s exposure to market, issuer and counterparty credit risks with respect to these financial assets is approximately their value recorded in the Consolidated Statement of Assets and Liabilities, less any collateral held by the Master Portfolio.
A derivative contract may suffer a mark-to-market loss if the value of the contract decreases due to an unfavorable change in the market rates or values of the underlying instrument. Losses can also occur if the counterparty does not perform under the contract.
The Master Portfolio’s risk of loss from counterparty credit risk on OTC derivatives is generally limited to the aggregate unrealized gain less the value of any collateral held by the Master Portfolio.
For OTC options purchased, the Master Portfolio bears the risk of loss in the amount of the premiums paid plus the positive change in market values net of any collateral held by the Master Portfolio should the counterparty fail to perform under the contracts. Options written by the Master Portfolio do not typically give rise to counterparty credit risk, as options written generally obligate the Master Portfolio, and not the counterparty, to perform. The Master Portfolio may be exposed to counterparty credit risk with respect to options written to the extent the Master Portfolio deposits collateral with its counterparty to a written option.
With exchange-traded options purchased and futures and centrally cleared swaps, there is less counterparty credit risk to the Master Portfolio since the exchange or clearinghouse, as counterparty to such instruments, guarantees against a possible default. The clearinghouse stands between the buyer and the seller of the contract; therefore, credit risk is limited to failure of the clearinghouse. While offset rights may exist under applicable law, the Master Portfolio does not have a contractual right of offset against a clearing broker or clearinghouse in the event of a default (including the bankruptcy or insolvency). Additionally, credit risk exists in exchange-traded futures and centrally cleared swaps with respect to initial and variation margin that is held in a clearing broker’s customer accounts. While clearing brokers are required to segregate customer margin from their own assets, in the event that a clearing broker becomes insolvent or goes into bankruptcy and at that time there is a shortfall in the aggregate amount of margin held by the clearing broker for all its clients, typically the shortfall would be allocated on a pro rata basis across all the clearing broker’s customers, potentially resulting in losses to the Master Portfolio.
Concentration Risk: The Master Portfolio invests a significant portion of its assets in fixed income securities and/or uses derivatives tied to the fixed income markets. Changes in market interest rates or economic conditions may affect the value and/or liquidity of such investments. Interest rate risk is the risk that prices of bonds and other fixed income securities will increase as interest rates fall and decrease as interest rates rise. The Master Portfolio may be subject to a greater risk of rising interest rates due to the current period of historically low rates.
| | | | | | |
| 122 | | BLACKROCK BALANCED CAPITAL FUND, INC. | | MARCH 31, 2017 | | |
| | | | |
| Notes to Consolidated Financial Statements (concluded) | | | Master Total Return Portfolio | |
The Master Portfolio invests a significant portion of its assets in securities backed by commercial or residential mortgage loans or in issuers that hold mortgage and other asset-backed securities. Investment percentages in these securities are presented in the Consolidated Schedule of Investments. Changes in economic conditions, including delinquencies and/or defaults on assets underlying these securities, can affect the value, income and/or liquidity of such positions.
11. Subsequent Events:
Management’s evaluation of the impact of all subsequent events on the Master Portfolio’s financial statements was completed through the date the financial statements were issued and the following item was noted:
Effective April 20, 2017, the credit agreement was extended until April 2018 under the same terms.
| | | | | | |
| | | BLACKROCK BALANCED CAPITAL FUND, INC. | | MARCH 31, 2017 | | 123 |
Robert M. Hernandez, Chair of the Board and Director
James H. Bodurtha, Director
Bruce R. Bond, Director
Donald W. Burton, Director
Honorable Stuart E. Eizenstat, Director
Robert Fairbairn, Director
Henry Gabbay, Director
Lena G. Goldberg, Director
Henry R. Keizer, Director
John F. O’Brien, Director
Donald C. Opatrny, Director
Roberta Cooper Ramo, Director
John M. Perlowski, Director, President and Chief Executive Officer
Jennifer McGovern, Vice President
Neal J. Andrews, Chief Financial Officer
Jay M. Fife, Treasurer
Charles Park, Chief Compliance Officer
Fernanda Piedra, Anti-Money Laundering Compliance Officer
Benjamin Archibald, Secretary
Effective January 31, 2017, David H. Walsh and Fred G. Weiss retired as Directors of the Fund/Master LLC.
| | | | | | |
| | | | |
| Investment Advisor | | Independent Registered | | Custodian | | Legal Counsel |
| BlackRock Advisors, LLC | | Public Accounting Firm | | Bank of New York Mellon | | Willkie Farr & Gallagher LLP |
| Wilmington, DE 19809 | | Deloitte & Touche LLP | | New York, NY 10286 | | New York, NY 10019 |
| | Philadelphia, PA 19103 | | | | |
| | | | | | |
| Sub-Advisors1 | | Accounting Agent and | | Distributor | | Address of the Fund/ |
| BlackRock International Limited | | Transfer Agent | | BlackRock Investments, LLC | | Master LLC |
Edinburgh, EH3 8BL United Kingdom | | BNY Mellon Investment Servicing (US) Inc. | | New York, NY 10022 | | 100 Bellevue Parkway Wilmington, DE 19809 |
| | Wilmington, DE 19809 | | | | |
| BlackRock (Singapore) Limited | | | | | | |
| 079912 Singapore | | | | | | |
| 1 | For Master Total Return. |
| | | | | | |
| 124 | | BLACKROCK BALANCED CAPITAL FUND, INC. | | MARCH 31, 2017 | | |
Householding
The Fund will mail only one copy of shareholder documents, including prospectuses, annual and semi-annual reports and proxy statements, to shareholders with multiple accounts at the same address. This practice is commonly called “householding” and is intended to reduce expenses and eliminate duplicate mailings of shareholder documents. Mailings of your shareholder documents may be householded indefinitely unless you instruct us otherwise. If you do not want the mailing of these documents to be combined with those for other members of your household, please call the Fund at (800) 441-7762.
Availability of Quarterly Schedule of Investments
The Fund/Master LLCs file their complete schedule of portfolio holdings with the SEC for the first and third quarters of each fiscal year on Form N-Q. The Fund’s/Master LLC’s Forms N-Q are available on the SEC’s website at http://www.sec.gov and may also be reviewed and copied at the SEC’s Public Reference Room in Washington, D.C. Information on the operation of the Public Reference Room or how to access documents on the SEC’s website without charge may be obtained by calling (800) SEC-0330. The Fund’s/Master LLC’s Forms N-Q may also be obtained upon request and without charge by calling (800) 441-7762.
Availability of Proxy Voting Policies and Procedures
A description of the policies and procedures that the Fund/Master LLCs use to determine how to vote proxies relating to portfolio securities is available upon request and without charge (1) by calling (800) 441-7762; (2) at http://www.blackrock.com; and (3) on the SEC’s website at http:// www.sec.gov.
Availability of Proxy Voting Record
Information about how the Fund/Master LLCs voted proxies relating to securities held in the Fund/Master LLCs’ portfolios during the most recent 12-month period ended June 30 is available upon request and without charge (1) at http://www.blackrock.com or by calling (800) 441-7762 and (2) on the SEC’s website at http://www.sec.gov.
BlackRock’s Mutual Fund Family
BlackRock offers a diverse lineup of open-end mutual funds crossing all investment styles and managed by experts in equity, fixed income and tax-exempt investing. Visit http://www.blackrock.com for more information.
Account Information
Call us at (800) 441-7762 from 8:00 AM to 6:00 PM ET on any business day to get information about your account balances, recent transactions and share prices. You can also reach us on the Web at http://www.blackrock.com/funds.
Automatic Investment Plans
Investor Class shareholders who want to invest regularly can arrange to have $50 or more automatically deducted from their checking or savings account and invested in any of the BlackRock funds.
Systematic Withdrawal Plans
Investor Class shareholders can establish a systematic withdrawal plan and receive periodic payments of $50 or more from their BlackRock funds, as long as their account balance is at least $10,000.
Retirement Plans
Shareholders may make investments in conjunction with Traditional, Rollover, Roth, Coverdell, Simple IRAs, SEP IRAs and 403(b) Plans.
| | | | | | |
| | | BLACKROCK BALANCED CAPITAL FUND, INC. | | MARCH 31, 2017 | | 125 |
| | | | |
| Additional Information (concluded) | | | | |
|
| BlackRock Privacy Principles |
BlackRock is committed to maintaining the privacy of its current and former fund investors and individual clients (collectively, “Clients”) and to safeguarding their non-public personal information. The following information is provided to help you understand what personal information BlackRock collects, how we protect that information and why in certain cases we share such information with select parties.
If you are located in a jurisdiction where specific laws, rules or regulations require BlackRock to provide you with additional or different privacy-related rights beyond what is set forth below, then BlackRock will comply with those specific laws, rules or regulations.
BlackRock obtains or verifies personal non-public information from and about you from different sources, including the following: (i) information we receive from you or, if applicable, your financial intermediary, on applications, forms or other documents; (ii) information about your transactions with us, our affiliates, or others; (iii) information we receive from a consumer reporting agency; and (iv) from visits to our websites.
BlackRock does not sell or disclose to non-affiliated third parties any non-public personal information about its Clients, except as permitted by law or as is necessary to respond to regulatory requests or to service Client accounts. These non-affiliated third parties are required to protect the confidentiality and security of this information and to use it only for its intended purpose.
We may share information with our affiliates to service your account or to provide you with information about other BlackRock products or services that may be of interest to you. In addition, BlackRock restricts access to non-public personal information about its Clients to those BlackRock employees with a legitimate business need for the information. BlackRock maintains physical, electronic and procedural safeguards that are designed to protect the non-public personal information of its Clients, including procedures relating to the proper storage and disposal of such information.
| | |

| | Shareholders can sign up for e-mail notifications of quarterly statements, annual and semi-annual shareholder reports and prospectuses by enrolling in the electronic delivery program. Electronic copies of shareholder reports and prospectuses are also available on BlackRock’s website. |
| | TO ENROLL IN ELECTRONIC DELIVERY: |
| | Shareholders Who Hold Accounts with Investment Advisors, Banks or Brokerages: |
| | Please contact your financial advisor. Please note that not all investment advisors, banks or brokerages may offer this service. |
| | Shareholders Who Hold Accounts Directly with BlackRock: |
| | 1. Access the BlackRock website at blackrock.com |
| | 2. Select “Access Your Account” |
| | 3. Next, select “eDelivery” in the “Related Resources” box and follow the sign-up instructions |
| | | | | | |
| 126 | | BLACKROCK BALANCED CAPITAL FUND, INC. | | MARCH 31, 2017 | | |
This report is intended for existing shareholders. It is not authorized for use as an offer of sale or a solicitation of an offer to buy shares of a Fund unless preceded or accompanied by the Fund’s current prospectus. Past performance results shown in this report should not be considered a representation of future performance. Investment returns and principal value of shares will fluctuate so that shares, when redeemed, may be worth more or less than their original cost. Statements and other information herein are as dated and are subject to change.

| | |
BC-3/17-SAR | |  |
| | |
| Item 2 – | | Code of Ethics – Not Applicable to this semi-annual report |
| |
| Item 3 – | | Audit Committee Financial Expert – Not Applicable to this semi-annual report |
| |
| Item 4 – | | Principal Accountant Fees and Services – Not Applicable to this semi-annual report |
| |
| Item 5 – | | Audit Committee of Listed Registrants – Not Applicable |
| |
| Item 6 – | | Investments |
| | (a) The registrants’ Schedules of Investments are included as part of the Report to Stockholders filed under Item 1 of this Form. |
| | (b) Not Applicable due to no such divestments during the semi-annual period covered since the previous Form N-CSR filing. |
| |
| Item 7 – | | Disclosure of Proxy Voting Policies and Procedures for Closed-End Management Investment Companies – Not Applicable |
| |
| Item 8 – | | Portfolio Managers of Closed-End Management Investment Companies – Not Applicable |
| |
| Item 9 – | | Purchases of Equity Securities by Closed-End Management Investment Company and Affiliated Purchasers – Not Applicable |
| |
| Item 10 – | | Submission of Matters to a Vote of Security Holders – There have been no material changes to these procedures. |
| |
| Item 11 – | | Controls and Procedures |
| |
| | (a) – The registrants’ principal executive and principal financial officers, or persons performing similar functions, have concluded that the registrants’ disclosure controls and procedures (as defined in Rule 30a-3(c) under the Investment Company Act of 1940, as amended (the “1940 Act”)) are effective as of a date within 90 days of the filing of this report based on the evaluation of these controls and procedures required by Rule 30a-3(b) under the 1940 Act and Rule 15d-15(b) under the Securities Exchange Act of 1934, as amended. |
| |
| | (b) – There were no changes in the registrants’ internal control over financial reporting (as defined in Rule 30a-3(d) under the 1940 Act) that occurred during the second fiscal quarter of the period covered by this report that have materially affected, or are reasonably likely to materially affect, the registrants’ internal control over financial reporting. |
| |
| Item 12 – | | Exhibits attached hereto |
| |
| | (a)(1) – Code of Ethics – Not Applicable to this semi-annual report |
| |
| | (a)(2) – Certifications – Attached hereto |
| |
| | (a)(3) – Not Applicable |
| |
| | (b) – Certifications – Attached hereto |
2
Pursuant to the requirements of the Securities Exchange Act of 1934 and the Investment Company Act of 1940, each registrant has duly caused this report to be signed on its behalf by the undersigned, thereunto duly authorized.
BlackRock Balanced Capital Fund, Inc., Master Large Cap Core Portfolio of Master Large Cap Series LLC and Master Total Return Portfolio of Master Bond LLC
| | | | |
| By: | | /s/ John M. Perlowski | | |
| | John M. Perlowski | | |
| | Chief Executive Officer (principal executive officer) of |
| | BlackRock Balanced Capital Fund, Inc., Master Large Cap Core Portfolio of Master Large Cap Series LLC and Master Total Return Portfolio of Master Bond LLC |
| | |
| Date: | | June 2, 2017 | | |
Pursuant to the requirements of the Securities Exchange Act of 1934 and the Investment Company Act of 1940, this report has been signed below by the following persons on behalf of each registrant and in the capacities and on the dates indicated.
| | | | |
| By: | | /s/ John M. Perlowski | | |
| | John M. Perlowski | | |
| | Chief Executive Officer (principal executive officer) of |
| | BlackRock Balanced Capital Fund, Inc., Master Large Cap Core Portfolio of Master Large Cap Series LLC and Master Total Return Portfolio of Master Bond LLC |
| | |
| Date: | | June 2, 2017 | | |
| | |
| By: | | /s/ Neal J. Andrews | | |
| | Neal J. Andrews | | |
| | Chief Financial Officer (principal financial officer) of |
| | BlackRock Balanced Capital Fund, Inc., Master Large Cap Core Portfolio of Master Large Cap Series LLC and Master Total Return Portfolio of Master Bond LLC |
| | |
| Date: | | June 2, 2017 | | |
3