UNITED STATES
SECURITIES AND EXCHANGE COMMISSION
Washington, D.C. 20549
FORM N-CSR
CERTIFIED SHAREHOLDER REPORT OF REGISTERED MANAGEMENT
INVESTMENT COMPANIES
Investment Company Act file number: 811-02405, 811-09739 and 811-21434
Name of Fund: BlackRock Balanced Capital Fund, Inc., Master Advantage Large Cap Core Portfolio of Master Large Cap Series LLC and Master Total Return Portfolio of Master Bond LLC
| Fund Address: | | 100 Bellevue Parkway, Wilmington, DE 19809 |
Name and address of agent for service: John M. Perlowski, Chief Executive Officer, BlackRock Balanced Capital Fund, Inc., Master Advantage Large Cap Core Portfolio of Master Large Cap Series LLC and Master Total Return Portfolio of Master Bond LLC, 55 East 52nd Street, New York, NY 10055
Registrants’ telephone number, including area code: (800) 441-7762
Date of fiscal year end: 09/30/2020
Date of reporting period: 09/30/2020
Item 1 – Report to Stockholders
| | |

| | SEPTEMBER 30, 2020 |
BlackRock Balanced Capital Fund, Inc.
Beginning on January 1, 2021, as permitted by regulations adopted by the Securities and Exchange Commission, paper copies of the Fund’s shareholder reports will no longer be sent by mail, unless you specifically request paper copies of the reports from BlackRock or from your financial intermediary, such as a broker-dealer or bank. Instead, the reports will be made available on a website, and you will be notified by mail each time a report is posted and provided with a website link to access the report.
You may elect to receive all future reports in paper free of charge. If you hold accounts directly with BlackRock, you can call (800) 441-7762 to inform BlackRock that you wish to continue receiving paper copies of your shareholder reports. If you hold accounts through a financial intermediary, you can follow the instructions included with this disclosure, if applicable, or contact your financial intermediary to request that you continue to receive paper copies of your shareholder reports. Please note that not all financial intermediaries may offer this service. Your election to receive reports in paper will apply to all funds advised by BlackRock Advisors, LLC, BlackRock Fund Advisors or their affiliates, or all funds held with your financial intermediary, as applicable.
If you already elected to receive shareholder reports electronically, you will not be affected by this change and you need not take any action. You may elect to receive electronic delivery of shareholder reports and other communications by: (i) accessing the BlackRock website at blackrock.com/edelivery and logging into your accounts, if you hold accounts directly with BlackRock, or (ii) contacting your financial intermediary, if you hold accounts through a financial intermediary. Please note that not all financial intermediaries may offer this service.
|
| Not FDIC Insured • May Lose Value • No Bank Guarantee |
The Markets in Review
Dear Shareholder,
The last 12 months have been a time of sudden change in global financial markets, as a long period of growth and positive returns was interrupted in early 2020 by the emergence and spread of the coronavirus. For the first part of the reporting period, U.S. equities and bonds both delivered impressive returns, despite fears and doubts about the economy that were ultimately laid to rest with unprecedented monetary stimulus and a sluggish yet resolute performance from the U.S. economy. But as the threat from the coronavirus became more apparent throughout February and March 2020, leading countries around the world took economically disruptive countermeasures, causing equity prices to fall sharply. While markets have since recovered some of these losses as countries around the world begin reopening, there is still significant uncertainty surrounding the long-term impact of the pandemic on the global economy.
Returns for most securities were robust for the first part of the reporting period, as investors began to realize that the U.S. economy was maintaining the modest yet steady growth that had characterized this economic cycle. However, once stay-at-home orders and closures of non-essential businesses became widespread, many workers were laid off and unemployment claims spiked. With large portions of the global economy on hold, all types of international equities ended the 12-month reporting period with negative performance, while in the United States large-capitalization stocks, which investors saw as more resilient than smaller companies, delivered solid returns.
The performance of different types of fixed-income securities diverged substantially due to a reduced investor appetite for risk. Treasuries benefited from the risk-off environment, and posted healthy returns, as the 10-year U.S. Treasury yield (which is inversely related to bond prices) fell to an all-time low. Investment-grade corporate bonds also delivered a solid return, while high-yield corporate returns were muted due to credit concerns.
The U.S. Federal Reserve (the “Fed”) reduced interest rates three times in 2019, to support slowing economic growth. After the coronavirus outbreak, the Fed instituted two emergency rate cuts, pushing short-term interest rates close to zero. To stabilize credit markets, the Fed also announced a new bond-buying program, as did several other central banks around the world, including the European Central Bank and the Bank of Japan.
Looking ahead, while coronavirus-related disruption is certain to hurt worldwide economic growth, the global expansion is likely to continue once the impact of the outbreak subsides. We are encouraged by the strong coordinated monetary and fiscal response that is underway, both in the United States and abroad. However, there remains a risk that policy fatigue and recent improvements in economic indicators could lead lawmakers to retreat from needed stimulus measures too soon.
Overall, we favor a neutral stance toward risk, given the uncertainty surrounding the path to recovery. Among equities, we see an advantage in U.S. stocks compared to other developed markets, given the diversity of the U.S. economy and the impressive scope of monetary and fiscal stimulus. In bonds, the swift action taken by the world’s central banks means there are attractive opportunities in credit, and we expect credit spreads to narrow as markets stabilize. Both U.S. Treasuries and sustainable investments can help provide portfolio resilience, and the disruption created by the coronavirus appears to be accelerating the shift toward sustainable investments.
In this environment, our view is that investors need to think globally, extend their scope across a broad array of asset classes, and be nimble as market conditions change. We encourage you to talk with your financial advisor and visit blackrock.com for further insight about investing in today’s markets.
Sincerely,

Rob Kapito
President, BlackRock Advisors, LLC

Rob Kapito
President, BlackRock Advisors, LLC
| | | | | | | | |
| Total Returns as of September 30, 2020 | |
| | | |
| | | 6-Month | | | 12-Month | |
| | |
U.S. large cap equities
(S&P 500® Index) | | | 31.31% | | | | 15.15% | |
| | |
U.S. small cap equities
(Russell 2000® Index) | | | 31.60 | | | | 0.39 | |
| | |
International equities
(MSCI Europe, Australasia, Far East Index) | | | 20.39 | | | | 0.49 | |
| | |
Emerging market equities (MSCI Emerging Markets Index) | | | 29.37 | | | | 10.54 | |
| | |
3-month Treasury bills
(ICE BofA 3-Month U.S. Treasury Bill Index) | | | 0.06 | | | | 1.10 | |
| | |
U.S. Treasury securities
(ICE BofA 10-Year U.S. Treasury Index) | | | 0.71 | | | | 10.74 | |
| | |
U.S. investment grade bonds (Bloomberg Barclays U.S. Aggregate Bond Index) | | | 3.53 | | | | 6.98 | |
| | |
Tax-exempt municipal bonds (S&P Municipal Bond Index) | | | 3.78 | | | | 3.85 | |
| | |
U.S. high yield bonds
(Bloomberg Barclays U.S. Corporate High Yield 2% Issuer Capped Index) | | | 15.18 | | | | 3.20 | |
|
Past performance is not an indication of future results. Index performance is shown for illustrative purposes only. You cannot invest directly in an index. | |
| | |
| 2 | | T H I S P A G E I S N O T P A R T O F Y O U R F U N D R E P O R T |
Table of Contents

| | |
| Fund Summary as of September 30, 2020 | | BlackRock Balanced Capital Fund, Inc. |
Investment Objective
BlackRock Balanced Capital Fund, Inc.’s (the “Fund”) investment objective is to seek the highest total investment return through a fully managed investment policy utilizing equity, debt (including money market) and convertible securities.
Portfolio Management Commentary
How did the Fund perform?
For the 12-month period ended September 30, 2020, through its investments in Master Advantage Large Cap Core Portfolio of Master Large Cap Series LLC (the “equity allocation” or the “Master Advantage Large Cap Core Portfolio”) and Master Total Return Portfolio of Master Bond LLC (the “fixed income allocation” or the “Master Total Return Portfolio”) (collectively, the “Master Portfolios”), the Fund underperformed the blended reference benchmark (60% Russell 1000® Index/40% Bloomberg Barclays U.S. Aggregate Bond Index). The Fund outperformed the fixed income portion of the benchmark, the Bloomberg Barclays U.S. Aggregate Bond Index, but it underperformed the equity portion of the benchmark, the Russell 1000® Index.
What factors influenced performance?
The Fund combines top-down macroeconomic views and bottom-up security selection from Master Advantage Large Cap Core Portfolio and Master Total Return Portfolio.
An overweight in equities and an underweight in fixed-income detracted from returns in the first quarter of 2020, which hurt the Fund’s relative performance over the full 12 months. Higher-risk assets sold off in February and March due to concerns about the impact COVID-19 would have on the global economy, while bonds rallied.
Master Advantage Large Cap Core Portfolio underperformed the equity benchmark, largely due to relative weakness in the third calendar quarter of 2020. During this time, previously winning positions that had been boosted by post-coronavirus themes began to lag. For example, an overweight in the communications equipment industry—which was driven by an insight that evaluates remote work trends—hurt results as several notable employers made forward-looking comments regarding their desire for employees to return to office. Additionally, certain macro-thematic insights struggled amid the evolving market backdrop. Specifically, a style-timing insight focused on momentum detracted. On the positive side, various insights that capture trends for stocks using higher-frequency alternative data contributed. An insight that uses brand sentiment measures and mobile app usage to determine how companies are navigating fast-changing consumer habits and the emergence from lockdown was also additive.
In Master Total Return Portfolio, an overweight in U.S. municipal bonds—which lagged due to the effects of COVID-19 on the finances of state and local governments—detracted from performance. Conversely, Master Total Return Portfolio’s duration positioning and its overweights in investment-grade corporates, agency mortgage-backed securities (MBS) and emerging market debt contributed positively. (Duration is a measure of interest-rate sensitivity.)
The investment adviser used derivatives as a means to manage risk and/or take outright views on equities, interest rates, credit risk and/or the foreign exchange markets. The use of derivatives, which was limited overall, was a slight detractor from Fund performance. The Fund held an elevated exposure to cash as collateral for its derivatives positions. The cash position did not have any material impact on Fund performance.
Describe recent portfolio activity.
The Fund entered the year with a modest overweight in equities and an underweight in fixed-income. In early February, as the investment adviser’s conviction on the macroeconomic outlook improved, the Fund’s pro-cyclical positioning was increased by raising the extent of the overweight in equities and underweight in bonds. As the COVID-19 outbreak spread beyond China and equity markets sold off, the investment adviser took the opportunity to increase the overweight in U.S. equities and move the underweight in bonds to neutral. Later in the period, the investment adviser reduced the magnitude of the overweight in U.S. equities and added a tactical overweight in bonds. The Fund subsequently moved to a neutral allocation in bonds, where it finished the period.
Master Advantage Large Cap Core Portfolio maintained a balanced allocation of risk across all major return drivers, while adding several new stock-selection insights to the portfolio. Given the dynamism of the current environment, the investment adviser instituted enhanced signal constructs to identify trends emerging from COVID-19, such as “work from home” and vaccine development. Additionally, the investment adviser added the insight designed to capture consumer brand sentiment.
Within Master Total Return Portfolio, the investment adviser reduced the allocation to investment-grade corporates in late 2019 due to valuation concerns, and it rotated the proceeds into agency mortgage-backed securities. As investors moved into cash in the first quarter of 2020, liquidity became a major issue across the fixed-income market. Given the magnitude of the economic shock, Master Total Return Portfolio moved to an overweight on the front end of the yield curve. Master Total Return Portfolio also added to its positions in the three- to five-year range, as well as 15 years and above. In the second half of the period, the Master Total Return Portfolio shifted to a small underweight in duration versus the benchmark, as U.S. yields fell to historically low levels. (Prices and yields move in opposite directions.) The investment adviser also added to Master Total Return Portfolio’s overweight positions in emerging market debt, European sovereign bonds and non-agency residential mortgages, while reducing the weighting in agency mortgage-backed securities.
Describe portfolio positioning at period end.
The investment adviser believes central banks will continue to take actions that are likely to be supportive for risk assets. Therefore, it is expected that interest rates will remain at historically low levels for a sustained period, which should provide an ongoing tailwind for equities.
The views expressed reflect the opinions of BlackRock as of the date of this report and are subject to change based on changes in market, economic or other conditions. These views are not intended to be a forecast of future events and are no guarantee of future results.
| | |
| 4 | | 2 0 2 0 B L A C K R O C K A N N U A L R E P O R T T O S H A R E H O L D E R S |
| | |
| Fund Summary as of September 30, 2020 (continued) | | BlackRock Balanced Capital Fund, Inc. |
TOTAL RETURN BASED ON $10,000 INVESTMENT
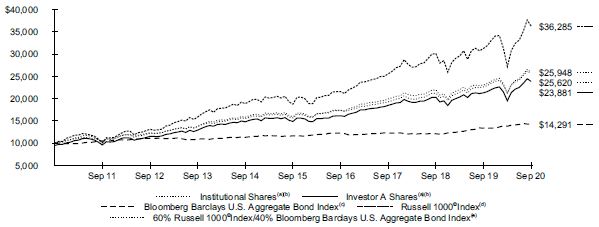
| | (a) | Assuming maximum sales charges, if any, transaction costs and other operating expenses, including investment advisory and administration fees. Institutional Shares do not have a sales charge. | |
| | (b) | The Fund invests in equity securities (including common stock, preferred stock, securities convertible into common stock, or securities or other instruments whose price is linked to the value of common stock) and fixed-income securities (including debt securities, convertible securities and short term securities). | |
| | (c) | A widely recognized unmanaged market-weighted index, comprised of investment-grade corporate bonds rated BBB or better, mortgages and U.S. Treasury and U.S. Government agency issues with at least one year to maturity. | |
| | (d) | An index that measures the performance of the large cap segment of the U.S. equity universe. It is a subset of the Russell 3000® Index and includes approximately 1,000 of the largest securities based on a combination of their market capitalization and current index membership. The index represents approximately 92% of the total market capitalization of the Russell 3000® Index. | |
| | (e) | A customized weighted index comprised of the returns of the Russell 1000® Index (60%) and Bloomberg Barclays U.S. Aggregate Bond Index (40%). | |
Performance Summary for the Period Ended September 30, 2020
| | | | | | | | | | | | | | | | | | | | | | | | | | | | |
| | | | | | Average Annual Total Returns(a) | |
| | | | |
| | | | | | 1 Year | | | 5 Years | | | 10 Years | |
| | | | | | | |
| | | 6-Month Total Returns | | | Without Sales Charge | | | With Sales Charge | | | Without Sales Charge | | | With Sales Charge | | | Without Sales Charge | | | With Sales Charge | |
| | | | | | | |
Institutional | | | 22.54 | % | | | 12.35 | % | | | N/A | | | | 10.23 | % | | | N/A | | | | 10.00 | % | | | N/A | |
Investor A | | | 22.39 | | | | 12.08 | | | | 6.20 | % | | | 9.92 | | | | 8.74 | % | | | 9.68 | | | | 9.10 | % |
Investor C | | | 21.94 | | | | 11.20 | | | | 10.20 | | | | 9.09 | | | | 9.09 | | | | 8.84 | | | | 8.84 | |
Class K | | | 22.57 | | | | 12.42 | | | | N/A | | | | 10.27 | | | | N/A | | | | 10.02 | | | | N/A | |
Class R | | | 22.12 | | | | 11.67 | | | | N/A | | | | 9.53 | | | | N/A | | | | 9.29 | | | | N/A | |
60% Russell 1000® Index/40% Bloomberg
Barclays U.S. Aggregate Bond Index | | | 20.85 | | | | 13.06 | | | | N/A | | | | 10.35 | | | | N/A | | | | 9.86 | | | | N/A | |
Bloomberg Barclays U.S. Aggregate Bond Index | | | 3.53 | | | | 6.98 | | | | N/A | | | | 4.18 | | | | N/A | | | | 3.64 | | | | N/A | |
Russell 1000® Index | | | 33.36 | | | | 16.01 | | | | N/A | | | | 14.09 | | | | N/A | | | | 13.76 | | | | N/A | |
| | (a) | Assuming maximum sales charges, if any. Average annual total returns with and without sales charges reflect reductions for distribution and service fees. See “About Fund Performance” on page 7 for a detailed description of share classes, including any related sales charges and fees, and how performance was calculated for certain share classes. | |
N/A - Not applicable as share class and index do not have a sales charge.
Past performance is not an indication of future results.
Performance results may include adjustments made for financial reporting purposes in accordance with U.S. generally accepted accounting principles.
| | |
| Fund Summary as of September 30, 2020 (continued) | | BlackRock Balanced Capital Fund, Inc. |
Expense Example
| | | | | | | | | | | | | | | | | | | | | | | | | | | | |
| | | Actual | | | Hypothetical(a) | | | | |
| | | | | | | |
| | |
| Beginning
Account Value (04/01/20) |
| |
| Ending
Account Value (09/30/20) |
| |
| Expenses
Paid During the Period |
(b) | |
| Beginning
Account Value (04/01/20) |
| |
| Ending
Account Value (09/30/20) |
| |
| Expenses
Paid During the Period |
(b) | |
| Annualized
Expense Ratio |
|
Institutional | | | $ 1,000.00 | | | | $ 1,225.40 | | | | $ 2.92 | | | | $ 1,000.00 | | | | $ 1,022.38 | | | | $ 2.65 | | | | 0.52 | % |
Investor A | | | 1,000.00 | | | | 1,223.90 | | | | 4.37 | | | | 1,000.00 | | | | 1,021.07 | | | | 3.97 | | | | 0.79 | |
Investor C | | | 1,000.00 | | | | 1,219.40 | | | | 8.58 | | | | 1,000.00 | | | | 1,017.27 | | | | 7.80 | | | | 1.55 | |
Class K | | | 1,000.00 | | | | 1,225.70 | | | | 2.67 | | | | 1,000.00 | | | | 1,022.60 | | | | 2.43 | | | | 0.48 | |
Class R | | | 1,000.00 | | | | 1,221.20 | | | | 6.39 | | | | 1,000.00 | | | | 1,019.25 | | | | 5.81 | | | | 1.15 | |
| | (a) | Hypothetical 5% annual return before expenses is calculated by prorating the number of days in the most recent fiscal half year divided by 366. | |
| | (b) | For each class of the Fund, expenses are equal to the annualized expense ratio for the class, multiplied by the average account value over the period, multiplied by 183/366 (to reflect the one-half year period shown). Because the Fund invests all of its assets in the Master Portfolios the expense example reflects the net expenses of both the Fund and the Master Portfolios in which it invests. | |
See “Disclosure of Expenses” on page 7 for further information on how expenses were calculated.
Portfolio Information
| | | | |
PORTFOLIO COMPOSITION | |
| | |
| Asset Type | | Percent of Total Investments | |
| |
Equity Funds | | | 52 | % |
Fixed-Income Funds | | | 32 | |
Short-Term Securities | | | 16 | |
| | |
| 6 | | 2 0 2 0 B L A C K R O C K A N N U A L R E P O R T T O S H A R E H O L D E R S |
About Fund Performance
Institutional and Class K Shares are not subject to any sales charge. These shares bear no ongoing distribution or service fees and are available only to certain eligible investors. Class K Shares performance shown prior to the Class K Shares inception date of January 25, 2018 is that of Institutional Shares. The performance of the Fund’s Class K Shares would be substantially similar to Institutional Shares because Class K Shares and Institutional Shares invest in the same portfolio of securities and performance would only differ to the extent that Class K Shares and Institutional Shares have different expenses. The actual returns of Class K Shares would have been higher than those of the Institutional Shares because Class K Shares have lower expenses than the Institutional Shares.
Investor A Shares are subject to a maximum initial sales charge (front-end load) of 5.25% and a service fee of 0.25% per year (but no distribution fee). Certain redemptions of these shares may be subject to a contingent deferred sales charge (“CDSC”) where no initial sales charge was paid at the time of purchase. These shares are generally available through financial intermediaries.
Investor C Shares are subject to a 1.00% CDSC if redeemed within one year of purchase. In addition, these shares are subject to a distribution fee of 0.75% per year and a service fee of 0.25% per year. These shares are generally available through financial intermediaries. These shares automatically convert to Investor A Shares after approximately ten years. Effective November 23, 2020, the automatic conversion feature will be modified to reduce the conversion period from ten years to eight years.
Class R Shares are not subject to any sales charge. These shares are subject to a distribution fee of 0.25% per year and a service fee of 0.25% per year. These shares are available only to certain employer-sponsored retirement plans.
Past performance is not an indication of future results. Financial markets have experienced extreme volatility and trading in many instruments has been disrupted. These circumstances may continue for an extended period of time, and may continue to affect adversely the value and liquidity of the fund’s investments. As a result, current performance may be lower or higher than the performance data quoted. Refer to blackrock.com to obtain performance data current to the most recent month-end. Performance results do not reflect the deduction of taxes that a shareholder would pay on Fund distributions or the redemption of Fund shares. Figures shown in the performance tables on the previous page assume reinvestment of all distributions, if any, at net asset value (“NAV”) on the ex-dividend date or payable date, as applicable. Investment return and principal value of shares will fluctuate so that shares, when redeemed, may be worth more or less than their original cost. Distributions paid to each class of shares will vary because of the different levels of service, distribution and transfer agency fees applicable to each class, which are deducted from the income available to be paid to shareholders.
BlackRock Advisors, LLC (the “Manager”), the Fund’s investment adviser, has contractually and/or voluntarily agreed to waive and/or reimburse a portion of the Fund’s expenses. Without such waiver and/or reimbursement, the Fund’s performance would have been lower. With respect to the Fund’s voluntary waivers, if any, the Manager is under no obligation to waive and/or reimburse or to continue waiving and/or reimbursing its fees and such voluntary waivers may be reduced or discontinued at any time. With respect to the Fund’s contractual waivers, if any, the Manager is under no obligation to continue waiving and/or reimbursing its fees after the applicable termination date of such agreement. See the Notes to Financial Statements for additional information on waivers and/or reimbursements.
Disclosure of Expenses
Shareholders of the Fund may incur the following charges: (a) transactional expenses, such as sales charges; and (b) operating expenses, including administration fees, service and distribution fees, including 12b-1 fees, acquired fund fees and expenses, and other fund expenses. The expense example shown on the previous page (which is based on a hypothetical investment of $1,000 invested on April 1, 2020 and held through September 30, 2020) is intended to assist shareholders both in calculating expenses based on an investment in the Fund and in comparing these expenses with similar costs of investing in other mutual funds.
The expense example provides information about actual account values and actual expenses. In order to estimate the expenses a shareholder paid during the period covered by this report, shareholders can divide their account value by $1,000 and then multiply the result by the number corresponding to their share class under the heading entitled “Expenses Paid During the Period.”
The expense example also provides information about hypothetical account values and hypothetical expenses based on the Fund’s actual expense ratio and an assumed rate of return of 5% per year before expenses. In order to assist shareholders in comparing the ongoing expenses of investing in the Fund and other funds, compare the 5% hypothetical example with the 5% hypothetical examples that appear in shareholder reports of other funds.
The expenses shown in the expense example are intended to highlight shareholders’ ongoing costs only and do not reflect transactional expenses, such as sales charges, if any. Therefore, the hypothetical example is useful in comparing ongoing expenses only, and will not help shareholders determine the relative total expenses of owning different funds. If these transactional expenses were included, shareholder expenses would have been higher.
Derivative Financial Instruments
The Fund and/or the Master Portfolios may invest in various derivative financial instruments. These instruments are used to obtain exposure to a security, commodity, index, market, and/or other assets without owning or taking physical custody of securities, commodities and/or other referenced assets or to manage market, equity, credit, interest rate, foreign currency exchange rate, commodity and/or other risks. Derivative financial instruments may give rise to a form of economic leverage and involve risks, including the imperfect correlation between the value of a derivative financial instrument and the underlying asset, possible default of the counterparty to the transaction or illiquidity of the instrument. The Fund’s and/or Master Portfolios’ successful use of a derivative financial instrument depends on the investment adviser’s ability to predict pertinent market movements accurately, which cannot be assured. The use of these instruments may result in losses greater than if they had not been used, may limit the amount of appreciation the Fund and/or the Master Portfolios can realize on an investment and/or may result in lower distributions paid to shareholders. The Fund’s and/or the Master Portfolios’ investments in these instruments, if any, are discussed in detail in the Fund’s and the Master Portfolios’ Notes to Financial Statements.
| | |
A B O U T F U N D P E R F O R M A N C E | | 7 |
| | |
Schedule of Investments September 30, 2020 | | BlackRock Balanced Capital Fund, Inc. (Percentages shown are based on Net Assets) |
| | | | | | | | |
| Security | | Shares/
Investment
Value | | | Value | |
| | |
Investment Companies(a) | | | | | | | | |
| | |
| Equity Funds — 51.0% | | | | | | |
Master Advantage Large Cap Core Portfolio of Master Large Cap Series LLC | | $ | 755,769,919 | | | $ | 755,769,919 | |
| | | | | | | | |
| | |
| Fixed-Income Funds — 32.0% | | | | | | |
iShares Core U.S. Aggregate Bond ETF | | | 473,739 | | | | 55,929,627 | |
Master Total Return Portfolio of Master Bond LLC | | $ | 417,698,909 | | | | 417,698,909 | |
| | | | | | | | |
| | |
| | | | | | | 473,628,536 | |
| | | | | | | | |
| |
Total Long-Term Investments — 83.0%
(Cost: $1,087,840,281) | | | | 1,229,398,455 | |
| | | | | | | | |
| | |
| | | Shares | | | | |
| | |
Short-Term Securities(a)(b) | | | | | | | | |
| | |
| Money Market Funds — 16.3% | | | | | | |
BlackRock Liquidity Funds, T-Fund, Institutional Class, 0.02% | | | 242,046,920 | | | | 242,046,920 | |
| | | | | | | | |
| | |
Total Short-Term Securities — 16.3%
(Cost: $242,046,920) | | | | | | | 242,046,920 | |
| | | | | | | | |
| | |
Total Investments — 99.3%
(Cost: $1,329,887,201) | | | | | | | 1,471,445,375 | |
| | |
Other Assets Less Liabilities — 0.7% | | | | | | | 10,207,635 | |
| | | | | | | | |
| | |
Net Assets — 100.0% | | | | | | $ | 1,481,653,010 | |
| | | | | | | | |
| (a) | Affiliate of the Fund. |
| (b) | Annualized 7-day yield as of period end. |
Affiliates
Investments in issuers considered to be affiliate(s) of the Fund during the year ended September 30, 2020 for purposes of Section 2(a)(3) of the Investment Company Act of 1940, as amended, were as follows:
| | | | | | | | | | | | | | | | | | | | | | | | | | | | | | | | | | | | | | | | | | | | | | |
| | | | | | | |
| | | | | | | | | | | |
| | | Affiliated Issuer | | Value at 09/30/19 | | | Purchases at Cost | | | Proceeds from Sale | | | Net Realized Gain (Loss) | | | Change in Unrealized Appreciation (Depreciation) | | | Value at 09/30/20 | | | Shares/ Investment Value Held at 09/30/20 | | | Income
(Expense) | | | Capital Gain Distributions from Underlying Funds | | | | |
| | | | | | | |
| | | | | | | | | | | | |
| | BlackRock Liquidity Funds, T-Fund, Institutional Class | | $ | 159,700,160 | | | $ | 82,346,760 | (a) | | | $ — | | | $ | — | | | $ | — | | | $ | 242,046,920 | | | | 242,046,920 | | | $ | 1,358,331 | | | | | | | $ | 367 | | | | | |
| | iShares Core U.S. Aggregate Bond ETF | | | 37,092,486 | | | | 16,971,213 | | | | — | | | | — | | | | 1,865,928 | | | | 55,929,627 | | | | 473,739 | | | | 1,058,081 | | | | | | | | — | | | | | |
| | Master Advantage Large Cap Core Portfolio of Master Large Cap Series LLC | | | 651,543,880 | | | | 9,151,949 | (a)(b) | | | — | | | | 24,470,032 | | | | 70,604,058 | | | | 755,769,919 | | | $ | 755,769,919 | | | | 9,151,948 | | | | | | | | — | | | | | |
| | Master Total Return Portfolio of Master Bond LLC | | | 387,033,377 | | | | 10,861,524 | (a)(b) | | | — | | | | 20,234,215 | | | | (430,207 | ) | | | 417,698,909 | | | $ | 417,698,909 | | | | 10,861,521 | | | | | | | | — | | | | | |
| | | | | | | | | | | | | | | | | | | | | | | | | | | | | | | | | | | | | | | | | | | | | | |
| | | | | | | | | | | | | | | | $ | 44,704,247 | | | $ | 72,039,779 | | | $ | 1,471,445,375 | | | | | | | $ | 22,429,881 | | | | | | | $ | 367 | | | | | |
| | | | | | | | | | | | | | | | | | | | | | | | | | | | | | | | | | | | | | | | | | | | | | |
| | (a) | Represents net shares/investment value purchased (sold). | |
| | (b) | Inclusive of income, expense, realized and unrealized gains and losses allocated from the Master Portfolio. | |
| | |
| 8 | | 2 0 2 0 B L A C K R O C K A N N U A L R E P O R T T O S H A R E H O L D E R S |
| | |
Schedule of Investments (continued) September 30, 2020 | | BlackRock Balanced Capital Fund, Inc. |
Derivative Financial Instruments Outstanding as of Period End
Futures Contracts
| | | | | | | | | | | | | | | | | | | | |
| |
| | | | |
| Description | | Number of Contracts | | | Expiration Date | | | Notional Amount (000) | | | Value/ Unrealized Appreciation (Depreciation) | |
| |
Long Contracts | | | | | | | | | | | | | | | | | | | | |
E-Mini S&P 500 Index | | | 922 | | | | 12/18/20 | | | $ | 154,527 | | | | | | | $ | 843,516 | |
U.S. Treasury Notes (10 Year) | | | 704 | | | | 12/21/20 | | | | 98,230 | | | | | | | | 59,123 | |
| | | | | | | | | | | | | | | | | | | | |
| | | | | | | | | | | | | | | | | | | 902,639 | |
| | | | | | | | | | | | | | | | | | | | |
Derivative Financial Instruments Categorized by Risk Exposure
As of period end, the fair values of derivative financial instruments located in the Statement of Assets and Liabilities were as follows:
| | | | | | | | | | | | | | | | | | | | | | | | | | | | | | | | | | | | | | | | | | | | | | | | | | | | | | | | |
| |
| | | | | | | | |
| | | Commodity
Contracts | | | Credit
Contracts | | | Equity Contracts | | | Foreign
Currency
Exchange
Contracts | | | Interest Rate Contracts | | | Other
Contracts | | | | | | Total | |
| |
| | | | | | | | | | | | | | |
Assets — Derivative Financial Instruments | | | | | | | | | | | | | | | | | | | | | | | | | | | | | | | | | | | | | | | | | | | | | | | | | | | | | | | | |
Futures contracts | | | | | | | | | | | | | | | | | | | | | | | | | | | | | | | | | | | | | | | | | | | | | | | | | | | | | | | | |
Unrealized appreciation(a) | | | | | | $ | — | | | | | | | $ | — | | | | | | | $ | 843,516 | | | | | | | $ | — | | | | | | | $ | 59,123 | | | | | | | $ | — | | | | | | | $ | 902,639 | |
| | | | | | | | | | | | | | | | | | | | | | | | | | | | | | | | | | | | | | | | | | | | | | | | | | | | | | | | |
| | (a) | Net cumulative unrealized appreciation (depreciation) on futures contracts, if any, are reported in the Schedule of Investments. In the Statement of Assets and Liabilities, only current day’s variation margin is reported in receivables or payables and the net cumulative unrealized appreciation (depreciation) is included in accumulated earnings (loss). | |
For the year ended September 30, 2020, the effect of derivative financial instruments in the Statement of Operations was as follows:
| | | | | | | | | | | | | | | | | | | | | | | | | | | | | | | | | | | | | | | | | | | | | | | | | | | | | | | | |
| |
| | | | | | | |
| | | Commodity Contracts | | | Credit Contracts | | | Equity Contracts | | | Foreign Currency Exchange Contracts | | | Interest Rate Contracts | | | Other Contracts | | | Total | |
| |
| | | | | | | | | | | | | | |
Net Realized Gain (Loss) from | | | | | | | | | | | | | | | | | | | | | | | | | | | | | | | | | | | | | | | | | | | | | | | | | | | | | | | | |
Futures contracts | | | | | | $ | — | | | | | �� | | $ | — | | | | | | | $ | 18,908,100 | | | | | | | $ | — | | | | | | | $ | (2,802,052 | ) | | | | | | $ | — | | | | | | | $ | 16,106,048 | |
| | | | | | | | | | | | | | | | | | | | | | | | | | | | | | | | | | | | | | | | | | | | | | | | | | | | | | | | |
| | | | | | | | | | | | | | |
Net Change in Unrealized Appreciation (Depreciation) on | | | | | | | | | | | | | | | | | | | | | | | | | | | | | | | | | | | | | | | | | | | | | | | | | | | | | | | | |
Futures contracts | | | | | | $ | — | | | | | | | $ | — | | | | | | | $ | 1,974,684 | | | | | | | $ | — | | | | | | | $ | 239,637 | | | | | | | $ | — | | | | | | | $ | 2,214,321 | |
| | | | | | | | | | | | | | | | | | | | | | | | | | | | | | | | | | | | | | | | | | | | | | | | | | | | | | | | |
Average Quarterly Balances of Outstanding Derivative Financial Instruments
| | | | |
| |
| |
Futures contracts | | | | |
Average notional value of contracts — long | | $ | 194,033,633 | |
Average notional value of contracts — short | | $ | 3,451,469 | |
| |
For more information about the Fund’s investment risks regarding derivative financial instruments, refer to the Notes to Financial Statements.
Fair Value Hierarchy as of Period End
Various inputs are used in determining the fair value of financial instruments. For description of the input levels and information about the Fund’s policy regarding valuation of financial instruments, refer to the Notes to Financial Statements.
| | |
S C H E D U L E O F I N V E S T M E N T S | | 9 |
| | |
Schedule of Investments (continued) September 30, 2020 | | BlackRock Balanced Capital Fund, Inc. |
The following tables summarize the Fund’s investments and derivative financial instruments categorized in the disclosure hierarchy. The breakdown of the Fund’s investments into major categories is disclosed in the Schedule of Investments above.
| | | | | | | | | | | | | | | | | | | | | | | | | | | | |
| |
| | | | | |
| | | Level 1 | | | Level 2 | | | Level 3 | | | | | | Total | |
| |
| | | | | | | |
Assets | | | | | | | | | | | | | | | | | | | | | | | | | | | | |
Investments | | | | | | | | | | | | | | | | | | | | | | | | | | | | |
Long-Term Investments | | | | | | | | | | | | | | | | | | | | | | | | | | | | |
Investment Companies(a) | | $ | 55,929,627 | | | | | | | $ | — | | | | | | | $ | — | | | | | | | $ | 55,929,627 | |
Short-Term Securities | | | | | | | | | | | | | | | | | | | | | | | | | | | | |
Money Market Funds | | | 242,046,920 | | | | | | | | — | | | | | | | | — | | | | | | | | 242,046,920 | |
| | | | | | | | | | | | | | | | | | | | | | | | | | | | |
| | $ | 297,976,547 | | | | | | | $ | — | | | | | | | $ | — | | | | | | | | 297,976,547 | |
| | | | | | | | | | | | | | | | | | | | | | | | | | | | |
Investments Valued at NAV(b) | | | | | | | | | | | | | | | | | | | | | | | | | | | 1,173,468,828 | |
| | | | | | | | | | | | | | | | | | | | | | | | | | | | |
| | | | | | | | | | | | | | | | | | | | | | | | | | $ | 1,471,445,375 | |
| | | | | | | | | | | | | | | | | | | | | | | | | | | | |
Derivative Financial Instruments(c) | | | | | | | | | | | | | | | | | | | | | | | | | | | | |
Assets | | | | | | | | | | | | | | | | | | | | | | | | | | | | |
Equity Contracts | | $ | 843,516 | | | | | | | $ | — | | | | | | | $ | — | | | | | | | $ | 843,516 | |
Interest Rate Contracts | | | 59,123 | | | | | | | | — | | | | | | | | — | | | | | | | | 59,123 | |
| | | | | | | | | | | | | | | | | | | | | | | | | | | | |
| | $ | 902,639 | | | | | | | $ | — | | | | | | | $ | — | | | | | | | $ | 902,639 | |
| | | | | | | | | | | | | | | | | | | | | | | | | | | | |
| | (a) | See above Schedule of Investments for values in each industry. | |
| | (b) | Certain investments of the Fund were fair valued using NAV per share as no quoted market value is available and therefore have been excluded from the fair value hierarchy. | |
| | (c) | Derivative financial instruments are futures contracts. Futures contracts are valued at the unrealized appreciation (depreciation) on the instrument. | |
| | |
| 10 | | 2 0 2 0 B L A C K R O C K A N N U A L R E P O R T T O S H A R E H O L D E R S |
Statement of Assets and Liabilities
September 30, 2020
| | | | |
| | BlackRock Balanced Capital Fund, Inc. | |
| |
ASSETS | | | | |
Investments at value — affiliated(a) | | $ | 1,471,445,375 | |
Cash pledged for futures contracts | | | 9,422,991 | |
Receivables: | | | | |
Capital shares sold | | | 2,447,967 | |
Dividends — affiliated | | | 9,498 | |
Variation margin on futures contracts | | | 710,499 | |
Prepaid expenses | | | 56,324 | |
| | | | |
| |
Total assets | | | 1,484,092,654 | |
| | | | |
| |
LIABILITIES | | | | |
Payables: | | | | |
Capital shares redeemed | | | 1,321,952 | |
Investment advisory fees | | | 197,387 | |
Officer’s fees | | | 3,137 | |
Other accrued expenses | | | 174,044 | |
Other affiliate fees | | | 38,234 | |
Service and distribution fees | | | 258,788 | |
Transfer agent fees | | | 237,424 | |
Variation margin on futures contracts | | | 208,678 | |
| | | | |
| |
Total liabilities | | | 2,439,644 | |
| | | | |
| |
NET ASSETS | | $ | 1,481,653,010 | |
| | | | |
| |
NET ASSETS CONSIST OF | | | | |
Paid-in capital | | $ | 1,267,557,912 | |
Accumulated earnings | | | 214,095,098 | |
| | | | |
| |
NET ASSETS | | $ | 1,481,653,010 | |
| | | | |
(a) Investments at cost — affiliated | | $ | 1,329,887,201 | |
| | |
F I N A N C I A L S T A T E M E N T S | | 11 |
Statement of Assets and Liabilities (continued)
September 30, 2020
| | | | |
| | | BlackRock Balanced Capital Fund, Inc. | |
NET ASSET VALUE | | | | |
| |
| Institutional | | | |
Net assets | | $ | 568,976,645 | |
| | | | |
Shares outstanding | | | 22,858,039 | |
| | | | |
Net asset value | | $ | 24.89 | |
| | | | |
Shares authorized | | | 400 million | |
| | | | |
Par value | | $ | 0.10 | |
| | | | |
| |
| Investor A | | | |
Net assets | | $ | 737,707,910 | |
| | | | |
Shares outstanding | | | 29,774,484 | |
| | | | |
Net asset value | | $ | 24.78 | |
| | | | |
Shares authorized | | | 200 million | |
| | | | |
Par value | | $ | 0.10 | |
| | | | |
| |
| Investor C | | | |
Net assets | | $ | 126,159,165 | |
| | | | |
Shares outstanding | | | 5,965,275 | |
| | | | |
Net asset value | | $ | 21.15 | |
| | | | |
Shares authorized | | | 200 million | |
| | | | |
Par value | | $ | 0.10 | |
| | | | |
| |
| Class K | | | |
Net assets | | $ | 36,969,786 | |
| | | | |
Shares outstanding | | | 1,485,229 | |
| | | | |
Net asset value | | $ | 24.89 | |
| | | | |
Shares authorized | | | 2 billion | |
| | | | |
Par value | | $ | 0.10 | |
| | | | |
| |
| Class R | | | |
Net assets | | $ | 11,839,504 | |
| | | | |
Shares outstanding | | | 524,085 | |
| | | | |
Net asset value | | $ | 22.59 | |
| | | | |
Shares authorized | | | 500 million | |
| | | | |
Par value | | $ | 0.10 | |
| | | | |
See notes to financial statements.
| | |
| 12 | | 2 0 2 0 B L A C K R O C K A N N U A L R E P O R T T O S H A R E H O L D E R S |
Statement of Operations
Year Ended September 30, 2020
| | | | | | | | |
| | | BlackRock Balanced Capital Fund, Inc. | |
| | |
INVESTMENT INCOME | | | | | | | | |
Dividends — affiliated | | | | | | $ | 2,416,412 | |
Other income | | | | | | | 36,029 | |
Net investment income allocated from the affiliated Master Portfolios: | | | | | | | | |
Dividends — unaffiliated | | | | | | | 12,044,867 | |
Dividends — affiliated | | | | | | | 275,412 | |
Interest — unaffiliated | | | | | | | 10,881,633 | |
Securities lending income — affiliated — net | | | | | | | 49,850 | |
Foreign taxes withheld | | | | | | | (43,127 | ) |
Expenses | | | | | | | (3,294,416 | ) |
Fees waived | | | | | | | 99,250 | |
| | | | | | | | |
| | |
Total investment income | | | | | | | 22,465,910 | |
| | | | | | | | |
| | |
FUND EXPENSES | | | | | | | | |
Investment advisory | | | | | | | 5,583,850 | |
Service and distribution — class specific | | | | | | | 2,964,388 | |
Transfer agent — class specific | | | | | | | 1,162,903 | |
Registration | | | | | | | 140,016 | |
Professional | | | | | | | 129,213 | |
Printing and postage | | | | | | | 126,894 | |
Officer | | | | | | | 21,123 | |
Accounting services | | | | | | | 7,020 | |
Miscellaneous | | | | | | | 25,206 | |
| | | | | | | | |
| | |
Total expenses | | | | | | | 10,160,613 | |
Less: | | | | | | | | |
Fees waived and/or reimbursed by the Manager | | | | | | | (3,389,075 | ) |
| | | | | | | | |
| | |
Total expenses after fees waived and/or reimbursed | | | | | | | 6,771,538 | |
| | | | | | | | |
| | |
Net investment income | | | | | | | 15,694,372 | |
| | | | | | | | |
| | |
REALIZED AND UNREALIZED GAIN (LOSS) | | | | | | | | |
Net realized gain (loss) from: | | | | | | | | |
Capital gain distributions from investment companies — affiliated | | | | | | | 367 | |
Futures contracts | | | | | | | 16,106,048 | |
Net realized gain from investments, capital gain distributions received from affiliated investment companies, foreign currency transactions, forward foreign currency exchange contracts, futures contracts, options written and swaps allocated from the affiliated Master Portfolios | | | | | | | 44,704,247 | |
| | | | | | | | |
| | |
| | | | | | | 60,810,662 | |
| | | | | | | | |
Net change in unrealized appreciation (depreciation) on: | | | | | | | | |
Investments — affiliated | | | | | | | 1,865,928 | |
Futures contracts | | | | | | | 2,214,321 | |
Net change in unrealized appreciation (depreciation) on investments, foreign currency translations, forward foreign currency exchange contracts, futures contracts, options written, swaps and unfunded floating rate loan interests allocated from the affiliated Master Portfolios | | | | | | | 70,173,851 | |
| | | | | | | | |
| | |
| | | | | | | 74,254,100 | |
| | | | | | | | |
| | |
Total net realized and unrealized gain | | | | | | | 135,064,762 | |
| | | | | | | | |
| | |
NET INCREASE IN NET ASSETS RESULTING FROM OPERATIONS | | | | | | $ | 150,759,134 | |
| | | | | | | | |
See notes to financial statements.
| | |
F I N A N C I A L S T A T E M E N T S | | 13 |
Statements of Changes in Net Assets
| | | | | | | | | | | | | | |
| | | BlackRock Balanced Capital Fund, Inc. | |
| |
| | | Year Ended September 30, | |
| | | | | | 2020 | | | | | 2019 | |
| | | | |
INCREASE (DECREASE) IN NET ASSETS | | | | | | | | | | | | | | |
| | | | |
OPERATIONS | | | | | | | | | | | | | | |
Net investment income | | | | | | $ | 15,694,372 | | | | | $ | 21,044,212 | |
Net realized gain | | | | | | | 60,810,662 | | | | | | 46,959,493 | |
Net change in unrealized appreciation (depreciation) | | | | | | | 74,254,100 | | | | | | (8,594,187 | ) |
| | | | | | | | | | | | | | |
| | | | |
Net increase in net assets resulting from operations | | | | | | | 150,759,134 | | | | | | 59,409,518 | |
| | | | | | | | | | | | | | |
| | | | |
DISTRIBUTIONS TO SHAREHOLDERS(a) | | | | | | | | | | | | | | |
Institutional | | | | | | | (25,614,887 | ) | | | | | (30,083,390 | ) |
Investor A | | | | | | | (30,893,014 | ) | | | | | (35,699,715 | ) |
Investor C | | | | | | | (6,569,740 | ) | | | | | (7,198,305 | ) |
Class K | | | | | | | (1,604,803 | ) | | | | | (754,289 | ) |
Class R | | | | | | | (602,475 | ) | | | | | (973,829 | ) |
| | | | | | | | | | | | | | |
| | | | |
Decrease in net assets resulting from distributions to shareholders | | | | | | | (65,284,919 | ) | | | | | (74,709,528 | ) |
| | | | | | | | | | | | | | |
| | | | |
CAPITAL SHARE TRANSACTIONS | | | | | | | | | | | | | | |
Net increase in net assets derived from capital share transactions | | | | | | | 153,847,508 | | | | | | 175,017,391 | |
| | | | | | | | | | | | | | |
| | | | |
NET ASSETS | | | | | | | | | | | | | | |
Total increase in net assets | | | | | | | 239,321,723 | | | | | | 159,717,381 | |
Beginning of year | | | | | | | 1,242,331,287 | | | | | | 1,082,613,906 | |
| | | | | | | | | | | | | | |
| | | | |
End of year | | | | | | $ | 1,481,653,010 | | | | | $ | 1,242,331,287 | |
| | | | | | | | | | | | | | |
| (a) | Distributions for annual periods determined in accordance with U.S. federal income tax regulations. |
See notes to financial statements.
| | |
| 14 | | 2 0 2 0 B L A C K R O C K A N N U A L R E P O R T T O S H A R E H O L D E R S |
Financial Highlights
(For a share outstanding throughout each period)
| | | | | | | | | | | | | | | | | | | | |
| | | BlackRock Balanced Capital Fund, Inc. | |
| |
| | | Institutional | |
| |
| | | Year Ended September 30, | |
| | | 2020 | | | 2019 | | | 2018 | | | 2017 | | | 2016 | |
| | | | | |
Net asset value, beginning of year | | $ | 23.32 | | | $ | 23.95 | | | $ | 26.09 | | | $ | 23.86 | | | $ | 23.09 | |
| | | | | | | | | | | | | | | | | | | | |
Net investment income(a) | | | 0.33 | | | | 0.48 | | | | 0.47 | | | | 0.41 | | | | 0.38 | |
Net realized and unrealized gain | | | 2.47 | | | | 0.52 | | | | 1.89 | | | | 3.01 | | | | 1.64 | |
| | | | | | | | | | | | | | | | | | | | |
| | | | | |
Net increase from investment operations | | | 2.80 | | | | 1.00 | | | | 2.36 | | | | 3.42 | | | | 2.02 | |
| | | | | | | | | | | | | | | | | | | | |
| | | | | |
Distributions(b) | | | | | | | | | | | | | | | | | | | | |
From net investment income | | | (0.37 | ) | | | (0.41 | ) | | | (0.47 | ) | | | (0.40 | ) | | | (0.41 | ) |
From net realized gain | | | (0.86 | ) | | | (1.22 | ) | | | (4.03 | ) | | | (0.79 | ) | | | (0.84 | ) |
| | | | | | | | | | | | | | | | | | | | |
| | | | | |
Total distributions | | | (1.23 | ) | | | (1.63 | ) | | | (4.50 | ) | | | (1.19 | ) | | | (1.25 | ) |
| | | | | | | | | | | | | | | | | | | | |
| | | | | |
Net asset value, end of year | | $ | 24.89 | | | $ | 23.32 | | | $ | 23.95 | | | $ | 26.09 | | | $ | 23.86 | |
| | | | | | | | | | | | | | | | | | | | |
| | | | | |
Total Return(c) | | | | | | | | | | | | | | | | | | | | |
Based on net asset value | | | 12.35 | % | | | 5.16 | % | | | 10.14 | % | | | 14.83 | %(d) | | | 8.93 | %(d) |
| | | | | | | | | | | | | | | | | | | | |
| | | | | |
Ratios to Average Net Assets(e) | | | | | | | | | | | | | | | | | | | | |
Total expenses(f) | | | 0.78 | %(g) | | | 0.80 | % | | | 0.91 | % | | | 0.93 | % | | | 0.94 | % |
| | | | | | | | | | | | | | | | | | | | |
| | | | | |
Total expenses after fees waived and/or reimbursed(f) | | | 0.52 | %(g) | | | 0.53 | % | | | 0.62 | % | | | 0.62 | % | | | 0.63 | % |
| | | | | | | | | | | | | | | | | | | | |
| | | | | |
Net investment income(f) | | | 1.42 | %(g) | | | 2.11 | % | | | 1.97 | % | | | 1.67 | % | | | 1.64 | % |
| | | | | | | | | | | | | | | | | | | | |
| | | | | |
Supplemental Data | | | | | | | | | | | | | | | | | | | | |
Net assets, end of year (000) | | $ | 568,977 | | | $ | 488,105 | | | $ | 427,511 | | | $ | 395,850 | | | $ | 348,430 | |
| | | | | | | | | | | | | | | | | | | | |
| | | | | |
Portfolio turnover rate of the Fund(h) | | | — | % | | | 4 | % | | | 140 | % | | | 109 | % | | | — | % |
| | | | | | | | | | | | | | | | | | | | |
| | | | | |
Portfolio turnover rate of the Master Total Return Portfolio(i) | | | 556 | % | | | 574 | % | | | 734 | % | | | 806 | % | | | 841 | % |
| | | | | | | | | | | | | | | | | | | | |
| | | | | |
Portfolio turnover rate of the Master Advantage Large Cap Core Portfolio | | | 99 | % | | | 151 | % | | | 148 | % | | | 130 | % | | | 39 | % |
| | | | | | | | | | | | | | | | | | | | |
| (a) | Based on average shares outstanding. |
| (b) | Distributions for annual periods determined in accordance with U.S. federal income tax regulations. |
| (c) | Where applicable, assumes the reinvestment of distributions. |
| (d) | Includes proceeds received from a settlement of litigation, which had no impact on the Fund’s total return. |
| (e) | Includes the Fund’s share of the Master Portfolios’ allocated expenses and/or net investment income. |
| (f) | Excludes expenses incurred indirectly as a result of investments in underlying funds as follows: |
| | | | | | | | | | | | | | | | | | | | |
| | | Year Ended September 30, | |
| | | 2020 | | | 2019 | | | 2018 | | | 2017 | | | 2016 | |
Investments in underlying funds | | | 0.03 | % | | | 0.02 | % | | | 0.01 | % | | | 0.01 | % | | | — | % |
| | | | | | | | | | | | | | | | | | | | |
| (g) | Includes the Fund’s share of the Master Portfolios’ allocated fees waived of 0.01%. |
| (h) | Excludes transactions in the Master Portfolios. |
| (i) | Includes mortgage dollar roll transactions (“MDRs”). Additional information regarding portfolio turnover rate is as follows: |
| | | | | | | | | | | | | | | | | | | | |
| | | Year Ended September 30, | |
| | | 2020 | | | 2019 | | | 2018 | | | 2017 | | | 2016 | |
Portfolio turnover rate (excluding MDRs) | | | 274 | % | | | 241 | % | | | 350 | % | | | 540 | % | | | 598 | % |
| | | | | | | | | | | | | | | | | | | | |
See notes to financial statements.
| | |
F I N A N C I A L H I G H L I G H T S | | 15 |
Financial Highlights (continued)
(For a share outstanding throughout each period)
| | | | | | | | | | | | | | | | | | | | |
| | | BlackRock Balanced Capital Fund, Inc. (continued) | |
| |
| | | Investor A | |
| |
| | | Year Ended September 30, | |
| | | | | |
| | | 2020 | | | 2019 | | | 2018 | | | 2017 | | | 2016 | |
| | | | | |
Net asset value, beginning of year | | $ | 23.22 | | | $ | 23.86 | | | $ | 26.00 | | | $ | 23.78 | | | $ | 23.03 | |
| | | | | | | | | | | | | | | | | | | | |
| | | | | |
Net investment income(a) | | | 0.27 | | | | 0.41 | | | | 0.40 | | | | 0.34 | | | | 0.31 | |
Net realized and unrealized gain | | | 2.46 | | | | 0.52 | | | | 1.89 | | | | 3.01 | | | | 1.62 | |
| | | | | | | | | | | | | | | | | | | | |
| | | | | |
Net increase from investment operations | | | 2.73 | | | | 0.93 | | | | 2.29 | | | | 3.35 | | | | 1.93 | |
| | | | | | | | | | | | | | | | | | | | |
| | | | | |
Distributions(b) | | | | | | | | | | | | | | | | | | | | |
From net investment income | | | (0.31 | ) | | | (0.35 | ) | | | (0.40 | ) | | | (0.34 | ) | | | (0.34 | ) |
From net realized gain | | | (0.86 | ) | | | (1.22 | ) | | | (4.03 | ) | | | (0.79 | ) | | | (0.84 | ) |
| | | | | | | | | | | | | | | | | | | | |
| | | | | |
Total distributions | | | (1.17 | ) | | | (1.57 | ) | | | (4.43 | ) | | | (1.13 | ) | | | (1.18 | ) |
| | | | | | | | | | | | | | | | | | | | |
| | | | | |
Net asset value, end of year | | $ | 24.78 | | | $ | 23.22 | | | $ | 23.86 | | | $ | 26.00 | | | $ | 23.78 | |
| | | | | | | | | | | | | | | | | | | | |
| | | | | |
Total Return(c) | | | | | | | | | | | | | | | | | | | | |
Based on net asset value | | | 12.08 | % | | | 4.84 | % | | | 9.86 | % | | | 14.52 | %(d) | | | 8.57 | %(d) |
| | | | | | | | | | | | | | | | | | | | |
| | | | | |
Ratios to Average Net Assets(e) | | | | | | | | | | | | | | | | | | | | |
Total expenses(f) | | | 1.04 | %(g) | | | 1.07 | %(g) | | | 1.20 | %(h) | | | 1.21 | %(h) | | | 1.22 | %(h) |
| | | | | | | | | | | | | | | | | | | | |
| | | | | |
Total expenses after fees waived and/or reimbursed(f) | | | 0.79 | %(g) | | | 0.80 | %(g) | | | 0.91 | %(h) | | | 0.90 | %(h) | | | 0.91 | %(h) |
| | | | | | | | | | | | | | | | | | | | |
| | | | | |
Net investment income(f) | | | 1.15 | %(g) | | | 1.83 | %(g) | | | 1.68 | %(h) | | | 1.38 | %(h) | | | 1.35 | %(h) |
| | | | | | | | | | | | | | | | | | | | |
| | | | | |
Supplemental Data | | | | | | | | | | | | | | | | | | | | |
Net assets, end of year (000) | | $ | 737,708 | | | $ | 594,909 | | | $ | 528,701 | | | $ | 535,542 | | | $ | 491,889 | |
| | | | | | | | | | | | | | | | | | | | |
| | | | | |
Portfolio turnover rate of the Fund(i) | | | — | % | | | 4 | % | | | 140 | % | | | 109 | % | | | — | % |
| | | | | | | | | | | | | | | | | | | | |
| | | | | |
Portfolio turnover rate of the Master Total Return Portfolio(j) | | | 556 | % | | | 574 | % | | | 734 | % | | | 806 | % | | | 841 | % |
| | | | | | | | | | | | | | | | | | | | |
| | | | | |
Portfolio turnover rate of the Master Advantage Large Cap Core Portfolio | | | 99 | % | | | 151 | % | | | 148 | % | | | 130 | % | | | 39 | % |
| | | | | | | | | | | | | | | | | | | | |
| (a) | Based on average shares outstanding. |
| (b) | Distributions for annual periods determined in accordance with U.S. federal income tax regulations. |
| (c) | Where applicable, assumes the reinvestment of distributions. |
| (d) | Includes proceeds received from a settlement of litigation, which had no impact on the Fund’s total return. |
| (e) | Includes the Fund’s share of the Master Portfolios’ allocated expenses and/or net investment income. |
| (f) | Excludes expenses incurred indirectly as a result of investments in underlying funds as follows: |
| | | | | | | | | | | | | | | | | | | | |
| | | Year Ended September 30, | |
| | | 2020 | | | 2019 | | | 2018 | | | 2017 | | | 2016 | |
| | | | | |
Investments in underlying funds | | | 0.03 | % | | | 0.02 | % | | | 0.01 | % | | | 0.01 | % | | | — | % |
| | | | | | | | | | | | | | | | | | | | |
| (g) | Includes the Fund’s share of the Master Portfolios’ allocated fees waived of 0.01%. |
| (h) | Includes the Fund’s share of the Master Portfolios’ allocated fees waived of less than 0.01%. |
| (i) | Excludes transactions in the Master Portfolios. |
| (j) | Includes MDRs. Additional information regarding portfolio turnover rate is as follows: |
| | | | | | | | | | | | | | | | | | | | |
| | | Year Ended September 30, | |
| | | 2020 | | | 2019 | | | 2018 | | | 2017 | | | 2016 | |
| | | | | |
Portfolio turnover rate (excluding MDRs) | | | 274 | % | | | 241 | % | | | 350 | % | | | 540 | % | | | 598 | % |
| | | | | | | | | | | | | | | | | | | | |
See notes to financial statements.
| | |
| 16 | | 2 0 2 0 B L A C K R O C K A N N U A L R E P O R T T O S H A R E H O L D E R S |
Financial Highlights (continued)
(For a share outstanding throughout each period)
| | | | | | | | | | | | | | | | | | | | |
| | | BlackRock Balanced Capital Fund, Inc. (continued) | |
| |
| | | Investor C | |
| |
| | | Year Ended September 30, | |
| | | 2020 | | | 2019 | | | 2018 | | | 2017 | | | 2016 | |
| | | | | |
Net asset value, beginning of year | | $ | 20.00 | | | $ | 20.79 | | | $ | 23.21 | | | $ | 21.34 | | | $ | 20.80 | |
| | | | | | | | | | | | | | | | | | | | |
| | | | | |
Net investment income(a) | | | 0.08 | | | | 0.21 | | | | 0.19 | | | | 0.14 | | | | 0.12 | |
Net realized and unrealized gain | | | 2.10 | | | | 0.43 | | | | 1.67 | | | | 2.68 | | | | 1.47 | |
| | | | | | | | | | | | | | | | | | | | |
| | | | | |
Net increase from investment operations | | | 2.18 | | | | 0.64 | | | | 1.86 | | | | 2.82 | | | | 1.59 | |
| | | | | | | | | | | | | | | | | | | | |
| | | | | |
Distributions(b) | | | | | | | | | | | | | | | | | | | | |
From net investment income | | | (0.17 | ) | | | (0.21 | ) | | | (0.25 | ) | | | (0.16 | ) | | | (0.21 | ) |
From net realized gain | | | (0.86 | ) | | | (1.22 | ) | | | (4.03 | ) | | | (0.79 | ) | | | (0.84 | ) |
| | | | | | | | | | | | | | | | | | | | |
| | | | | |
Total distributions | | | (1.03 | ) | | | (1.43 | ) | | | (4.28 | ) | | | (0.95 | ) | | | (1.05 | ) |
| | | | | | | | | | | | | | | | | | | | |
| | | | | |
Net asset value, end of year | | $ | 21.15 | | | $ | 20.00 | | | $ | 20.79 | | | $ | 23.21 | | | $ | 21.34 | |
| | | | | | | | | | | | | | | | | | | | |
| | | | | |
Total Return(c) | | | | | | | | | | | | | | | | | | | | |
Based on net asset value | | | 11.20 | % | | | 4.09 | % | | | 9.03 | % | | | 13.62 | %(d) | | | 7.78 | %(d) |
| | | | | | | | | | | | | | | | | | | | |
| | | | | |
Ratios to Average Net Assets(e) | | | | | | | | | | | | | | | | | | | | |
Total expenses(f) | | | 1.80 | %(g) | | | 1.83 | % | | | 1.95 | % | | | 1.97 | % | | | 1.98 | % |
| | | | | | | | | | | | | | | | | | | | |
| | | | | |
Total expenses after fees waived and/or reimbursed(f) | | | 1.55 | %(g) | | | 1.56 | % | | | 1.66 | % | | | 1.66 | % | | | 1.67 | % |
| | | | | | | | | | | | | | | | | | | | |
| | | | | |
Net investment income(f) | | | 0.41 | %(g) | | | 1.07 | % | | | 0.93 | % | | | 0.63 | % | | | 0.60 | % |
| | | | | | | | | | | | | | | | | | | | |
| | | | | |
Supplemental Data | | | | | | | | | | | | | | | | | | | | |
Net assets, end of year (000) | | $ | 126,159 | | | $ | 125,584 | | | $ | 103,756 | | | $ | 104,113 | | | $ | 117,651 | |
| | | | | | | | | | | | | | | | | | | | |
| | | | | |
Portfolio turnover rate of the Fund(h) | | | — | % | | | 4 | % | | | 140 | % | | | 109 | % | | | — | % |
| | | | | | | | | | | | | | | | | | | | |
| | | | | |
Portfolio turnover rate of the Master Total Return Portfolio(i) | | | 556 | % | | | 574 | % | | | 734 | % | | | 806 | % | | | 841 | % |
| | | | | | | | | | | | | | | | | | | | |
| | | | | |
Portfolio turnover rate of the Master Advantage Large Cap Core Portfolio | | | 99 | % | | | 151 | % | | | 148 | % | | | 130 | % | | | 39 | % |
| | | | | | | | | | | | | | | | | | | | |
| (a) | Based on average shares outstanding. |
| (b) | Distributions for annual periods determined in accordance with U.S. federal income tax regulations. |
| (c) | Where applicable, assumes the reinvestment of distributions. |
| (d) | Includes proceeds received from a settlement of litigation, which had no impact on the Fund’s total return. |
| (e) | Includes the Fund’s share of the Master Portfolios’ allocated expenses and/or net investment income. |
| (f) | Excludes expenses incurred indirectly as a result of investments in underlying funds as follows: |
| | | | | | | | | | | | | | | | | | | | |
| | |
| | | Year Ended September 30, | |
| | | | | |
| | | 2020 | | | 2019 | | | 2018 | | | 2017 | | | 2016 | |
| | | | | |
Investments in underlying funds | | | 0.03 | % | | | 0.02 | % | | | 0.01 | % | | | 0.01 | % | | | — | % |
| | | | | | | | | | | | | | | | | | | | |
| (g) | Includes the Fund’s share of the Master Portfolios’ allocated fees waived of 0.01%. |
| (h) | Excludes transactions in the Master Portfolios. |
| (i) | Includes MDRs. Additional information regarding portfolio turnover rate is as follows: |
| | | | | | | | | | | | | | | | | | | | |
| | |
| | | Year Ended September 30, | |
| | | | | |
| | | 2020 | | | 2019 | | | 2018 | | | 2017 | | | 2016 | |
| | | | | |
Portfolio turnover rate (excluding MDRs) | | | 274 | % | | | 241 | % | | | 350 | % | | | 540 | % | | | 598 | % |
| | | | | | | | | | | | | | | | | | | | |
See notes to financial statements.
| | |
F I N A N C I A L H I G H L I G H T S | | 17 |
Financial Highlights (continued)
(For a share outstanding throughout each period)
| | | | | | | | | | | | | | | | |
| | | BlackRock Balanced Capital Fund, Inc. (continued) | |
| |
| | | Class K | |
| | | Year Ended September 30, | | | | Period from 01/25/18 to 09/30/18 | (a) |
| | | 2020 | | | 2019 | | | | |
| | | | | |
Net asset value, beginning of period | | $ | 23.32 | | | $ | 23.95 | | | | | | | $ | 23.61 | |
| | | | | | | | | | | | | | | | |
| | | | |
Net investment income(b) | | | 0.34 | | | | 0.49 | | | | | | | | 0.33 | |
Net realized and unrealized gain | | | 2.47 | | | | 0.52 | | | | | | | | 0.25 | |
| | | | | | | | | | | | | | | | |
| | | | |
Net increase from investment operations | | | 2.81 | | | | 1.01 | | | | | | | | 0.58 | |
| | | | | | | | | | | | | | | | |
| | | | |
Distributions(c) | | | | | | | | | | | | | | | | |
From net investment income | | | (0.38 | ) | | | (0.42 | ) | | | | | | | (0.24 | ) |
From net realized gain | | | (0.86 | ) | | | (1.22 | ) | | | | | | | — | |
| | | | | | | | | | | | | | | | |
| | | | |
Total distributions | | | (1.24 | ) | | | (1.64 | ) | | | | | | | (0.24 | ) |
| | | | | | | | | | | | | | | | |
| | | | |
Net asset value, end of period | | $ | 24.89 | | | $ | 23.32 | | | | | | | $ | 23.95 | |
| | | | | | | | | | | | | | | | |
| | | | |
Total Return(d) | | | | | | | | | | | | | | | | |
Based on net asset value | | | 12.42 | % | | | 5.23 | % | | | | | | | 2.46 | %(e) |
| | | | | | | | | | | | | | | | |
| | | | |
Ratios to Average Net Assets(f) | | | | | | | | | | | | | | | | |
Total expenses(g) | | | 0.72 | %(h) | | | 0.73 | % | | | | | | | 0.81 | %(i) |
| | | | | | | | | | | | | | | | |
| | | | |
Total expenses after fees waived and/or reimbursed(g) | | | 0.46 | %(h) | | | 0.46 | % | | | | | | | 0.51 | %(i) |
| | | | | | | | | | | | | | | | |
| | | | |
Net investment income(g) | | | 1.47 | %(h) | | | 2.15 | % | | | | | | | 2.07 | %(i) |
| | | | | | | | | | | | | | | | |
| | | | |
Supplemental Data | | | | | | | | | | | | | | | | |
Net assets, end of period (000) | | $ | 36,970 | | | $ | 21,901 | | | | | | | $ | 8,283 | |
| | | | | | | | | | | | | | | | |
| | | | |
Portfolio turnover rate of the Fund(j) | | | — | % | | | 4 | % | | | | | | | 140 | %(k) |
| | | | | | | | | | | | | | | | |
| | | | |
Portfolio turnover rate of the Master Total Return Portfolio(l) | | | 556 | % | | | 574 | % | | | | | | | 734 | %(k) |
| | | | | | | | | | | | | | | | |
| | | | |
Portfolio turnover rate of the Master Advantage Large Cap Core Portfolio | | | 99 | % | | | 151 | % | | | | | | | 148 | %(k) |
| | | | | | | | | | | | | | | | |
| (a) | Commencement of operations. |
| (b) | Based on average shares outstanding. |
| (c) | Distributions for annual periods determined in accordance with U.S. federal income tax regulations. |
| (d) | Where applicable, assumes the reinvestment of distributions. |
| (e) | Aggregate total return. |
| (f) | Includes the Fund’s share of the Master Portfolios’ allocated expenses and/or net investment income. |
| (g) | Excludes expenses incurred indirectly as a result of investments in underlying funds as follows: |
| | | | | | | | | | | | | | | | |
| | | | Year Ended September 30, | | | | | | |
| Period from
01/25/18 to 09/30/18 |
(a) |
| | | 2020 | | | 2019 | | | | |
| | | | | |
Investments in underlying funds | | | 0.03 | % | | | 0.02 | % | | | | | | | 0.01 | % |
| | | | | | | | | | | | | | | | |
| (h) | Includes the Fund’s share of the Master Portfolios’ allocated fees waived of 0.01%. |
| (j) | Excludes transactions in the Master Portfolios. |
| (k) | Portfolio turnover is representative of the Fund for the entire year. |
| (l) | Includes MDRs. Additional information regarding portfolio turnover rate is as follows: |
| | | | | | | | | | | | | | | | |
| | | | Year Ended September 30, | | |
| Period from
01/25/18 to 09/30/18 |
(a) |
| | | 2020 | | | 2019 | | | | |
| | | | | |
Portfolio turnover rate (excluding mortgage dollar roll transactions) | | | 274 | % | | | 241 | % | | | | | | | 350 | % |
| | | | | | | | | | | | | | | | |
See notes to financial statements.
| | |
| 18 | | 2 0 2 0 B L A C K R O C K A N N U A L R E P O R T T O S H A R E H O L D E R S |
Financial Highlights (continued)
(For a share outstanding throughout each period)
| | | | | | | | | | | | | | | | | | | | |
| | | BlackRock Balanced Capital Fund, Inc. (continued) | |
| |
| | | Class R | |
| |
| | | Year Ended September 30, | |
| | | | | |
| | | 2020 | | | 2019 | | | 2018 | | | 2017 | | | 2016 | |
| | | | | |
Net asset value, beginning of year | | $ | 21.27 | | | $ | 22.00 | | | $ | 24.30 | | | $ | 22.31 | | | $ | 21.70 | |
| | | | | | | | | | | | | | | | | | | | |
| | | | | |
Net investment income(a) | | | 0.17 | | | | 0.31 | | | | 0.29 | | | | 0.24 | | | | 0.22 | |
Net realized and unrealized gain | | | 2.24 | | | | 0.46 | | | | 1.77 | | | | 2.81 | | | | 1.52 | |
| | | | | | | | | | | | | | | | | | | | |
| | | | | |
Net increase from investment operations | | | 2.41 | | | | 0.77 | | | | 2.06 | | | | 3.05 | | | | 1.74 | |
| | | | | | | | | | | | | | | | | | | | |
| | | | | |
Distributions(b) | | | | | | | | | | | | | | | | | | | | |
From net investment income | | | (0.23 | ) | | | (0.28 | ) | | | (0.33 | ) | | | (0.27 | ) | | | (0.29 | ) |
From net realized gain | | | (0.86 | ) | | | (1.22 | ) | | | (4.03 | ) | | | (0.79 | ) | | | (0.84 | ) |
| | | | | | | | | | | | | | | | | | | | |
| | | | | |
Total distributions | | | (1.09 | ) | | | (1.50 | ) | | | (4.36 | ) | | | (1.06 | ) | | | (1.13 | ) |
| | | | | | | | | | | | | | | | | | | | |
| | | | | |
Net asset value, end of year | | $ | 22.59 | | | $ | 21.27 | | | $ | 22.00 | | | $ | 24.30 | | | $ | 22.31 | |
| | | | | | | | | | | | | | | | | | | | |
| | | | | |
Total Return(c) | | | | | | | | | | | | | | | | | | | | |
Based on net asset value | | | 11.67 | % | | | 4.47 | % | | | 9.51 | % | | | 14.11 | %(d) | | | 8.15 | %(d) |
| | | | | | | | | | | | | | | | | | | | |
| | | | | |
Ratios to Average Net Assets | | | | | | | | | | | | | | | | | | | | |
Total expenses(e) | | | 1.40 | %(f) | | | 1.41 | %(f) | | | 1.55 | %(g) | | | 1.56 | %(g) | | | 1.58 | %(g) |
| | | | | | | | | | | | | | | | | | | | |
| | | | | |
Total expenses after fees waived and/or reimbursed(e) | | | 1.15 | %(f) | | | 1.14 | %(f) | | | 1.26 | %(g) | | | 1.25 | %(g) | | | 1.27 | %(g) |
| | | | | | | | | | | | | | | | | | | | |
| | | | | |
Net investment income(e) | | | 0.82 | %(f) | | | 1.50 | %(f) | | | 1.33 | %(g) | | | 1.04 | %(g) | | | 0.99 | %(g) |
| | | | | | | | | | | | | | | | | | | | |
| | | | | |
Supplemental Data | | | | | | | | | | | | | | | | | | | | |
Net assets, end of year (000) | | $ | 11,840 | | | $ | 11,833 | | | $ | 14,363 | | | $ | 16,257 | | | $ | 12,731 | |
| | | | | | | | | | | | | | | | | | | | |
| | | | | |
Portfolio turnover rate of the Fund(h) | | | — | % | | | 4 | % | | | 140 | % | | | 109 | % | | | — | % |
| | | | | | | | | | | | | | | | | | | | |
| | | | | |
Portfolio turnover rate of the Master Total Return Portfolio(i) | | | 556 | % | | | 574 | % | | | 734 | % | | | 806 | % | | | 841 | % |
| | | | | | | | | | | | | | | | | | | | |
| | | | | |
Portfolio turnover rate of the Master Advantage Large Cap Core Portfolio | | | 99 | % | | | 151 | % | | | 148 | % | | | 130 | % | | | 39 | % |
| | | | | | | | | | | | | | | | | | | | |
| (a) | Based on average shares outstanding. |
| (b) | Distributions for annual periods determined in accordance with U.S. federal income tax regulations. |
| (c) | Where applicable, assumes the reinvestment of distributions. |
| (d) | Includes proceeds received from a settlement of litigation, which had no impact on the Fund’s total return. |
| (e) | Excludes expenses incurred indirectly as a result of investments in underlying funds as follows: |
| | | | | | | | | | | | | | | | | | | | |
| | |
| | | Year Ended September 30, | |
| | | | | |
| | | 2020 | | | 2019 | | | 2018 | | | 2017 | | | 2016 | |
| | | | | |
Investments in underlying funds | | | 0.03 | % | | | 0.02 | % | | | 0.01 | % | | | 0.01 | % | | | — | % |
| | | | | | | | | | | | | | | | | | | | |
| (f) | Includes the Fund’s share of the Master Portfolios’ allocated fees waived of 0.01%. |
| (g) | Includes the Fund’s share of the Master Portfolios’ allocated fees waived of less than 0.01%. |
| (h) | Excludes transactions in the Master Portfolios. |
| (i) | Includes MDRs. Additional information regarding portfolio turnover rate is as follows: |
| | | | | | | | | | | | | | | | | | | | |
| | |
| | | Year Ended September 30, | |
| | | | | |
| | | 2020 | | | 2019 | | | 2018 | | | 2017 | | | 2016 | |
| | | | | |
Portfolio turnover rate (excluding MDRs) | | | 274 | % | | | 241 | % | | | 350 | % | | | 540 | % | | | 598 | % |
| | | | | | | | | | | | | | | | | | | | |
See notes to financial statements.
| | |
F I N A N C I A L H I G H L I G H T S | | 19 |
Notes to Financial Statements
BlackRock Balanced Capital Fund, Inc. (the “Fund”) is registered under the Investment Company Act of 1940, as amended (the “1940 Act”), as an open-end management investment company. The Fund is organized as a Maryland corporation. The Fund is classified as diversified. The Fund seeks to achieve its investment objective by investing directly in equity and fixed-income securities, indirectly through one or more funds that invest in such securities, or in a combination of securities and funds. The Fund intends to invest a significant portion of its fixed-income assets in Master Total Return Portfolio (the “Master Total Return Portfolio”) of Master Bond LLC, a mutual fund that has an investment objective and strategy consistent with that of the fixed-income portion of the Fund. The Fund intends to invest a significant portion of its equity assets in Master Advantage Large Cap Core Portfolio (the “Master Advantage Large Cap Core Portfolio”) of Master Large Cap Series LLC, a mutual fund that has an investment objective and strategy consistent with that of the equity portion of the Fund. Master Total Return Portfolio and Master Advantage Large Cap Core Portfolio, both affiliates of the Fund, are collectively referred to as the “Master Portfolios.” The value of the Fund’s investment in the Master Portfolios reflects the Fund’s proportionate interest in the net assets of the Master Portfolios. The performance of the Fund is directly affected by the performance of the Master Portfolios as well as the Fund’s direct investments. At September 30, 2020, the percentages of Master Advantage Large Cap Core Portfolio and Master Total Return Portfolio owned by the Fund were 20.5% and 2.1%, respectively. The financial statements of the Master Portfolios, including the Schedules of Investments, are included elsewhere in this report and should be read in conjunction with the Fund’s financial statements.
The Fund offers multiple classes of shares. All classes of shares have identical voting, dividend, liquidation and other rights and are subject to the same terms and conditions, except that certain classes bear expenses related to the shareholder servicing and distribution of such shares. Institutional and Class K Shares are sold only to certain eligible investors. Investor A, Investor C and Class R Shares bear certain expenses related to shareholder servicing of such shares, and Investor C and Class R Shares also bear certain expenses related to the distribution of such shares. Investor A and Investor C Shares are generally available through financial intermediaries. Class R Shares are sold only to certain employer-sponsored retirement plans. Each class has exclusive voting rights with respect to matters relating to its shareholder servicing and distribution expenditures (except that Investor C shareholders may vote on material changes to the Investor A Shares distribution and service plan).
The Board of Directors of the Fund and Boards of Directors of the Master Portfolios are referred to throughout this report as the “Board” and the members are referred to as “Directors.”
| | | | | | | | |
| | | | |
| Share Class | | Initial Sales Charge | | CDSC | | | Conversion Privilege |
| | | |
Institutional, Class K and Class R Shares | | No | | | No | | | None |
Investor A Shares | | Yes | | | No | (a) | | None |
Investor C Shares | | No | | | Yes | (b) | | To Investor A Shares after approximately 10 years(c) |
| | (a) | Investor A Shares may be subject to a contingent deferred sales charge (“CDSC”) for certain redemptions where no initial sales charge was paid at the time of purchase. | |
| | (b) | A CDSC of 1.00% is assessed on certain redemptions of Investor C Shares made within one year after purchase. | |
| | (c) | Effective November 23, 2020, the automatic conversion feature will be modified to reduce the conversion period from ten years to eight years. | |
The Fund, together with certain other registered investment companies advised by BlackRock Advisors, LLC (the “Manager”) or its affiliates, is included in a complex of equity, multi-asset, index and money market funds referred to as the BlackRock Multi-Asset Complex.
| 2. | SIGNIFICANT ACCOUNTING POLICIES |
The financial statements are prepared in conformity with accounting principles generally accepted in the United States of America (“U.S. GAAP”), which may require management to make estimates and assumptions that affect the reported amounts of assets and liabilities in the financial statements, disclosure of contingent assets and liabilities at the date of the financial statements and the reported amounts of increases and decreases in net assets from operations during the reporting period. Actual results could differ from those estimates. The Fund is considered an investment company under U.S. GAAP and follows the accounting and reporting guidance applicable to investment companies. Below is a summary of significant accounting policies:
Investment Transactions and Income Recognition: For financial reporting purposes, investment transactions are recorded on the dates the transactions are executed. Realized gains and losses on investment transactions are determined on the identified cost basis. Dividend income and capital gain distributions, if any, are recorded on the ex-dividend date. Non-cash dividends, if any, are recorded on the ex-dividend date at fair value. Interest income, including amortization and accretion of premiums and discounts on debt securities, is recognized on an accrual basis. Contributions to and withdrawals from the Master Portfolios are accounted for on a trade date basis. The Fund records its proportionate share of the Master Portfolios’ income, expenses and realized and unrealized gains and losses on a daily basis. Realized and unrealized gains and losses are adjusted utilizing partnership tax allocation rules. Income, expenses and realized and unrealized gains and losses are allocated daily to each class based on its relative net assets.
Foreign CurrencyTranslation: The Fund’s books and records are maintained in U.S. dollars. Securities and other assets and liabilities denominated in foreign currencies are translated into U.S. dollars using exchange rates determined as of the close of trading on the New York Stock Exchange (“NYSE”). Purchases and sales of investments are recorded at the rates of exchange prevailing on the respective dates of such transactions. Generally, when the U.S. dollar rises in value against a foreign currency, the investments denominated in that currency will lose value; the opposite effect occurs if the U.S. dollar falls in relative value.
The Fund does not isolate the effect of fluctuations in foreign exchange rates from the effect of fluctuations in the market prices of investments for financial reporting purposes. Accordingly, the effects of changes in exchange rates on investments are not segregated in the Statement of Operations from the effects of changes in market prices of those investments, but are included as a component of net realized and unrealized gain (loss) from investments. The Fund reports realized currency gains (losses) on foreign currency related transactions as components of net realized gain (loss) for financial reporting purposes, whereas such components are generally treated as ordinary income for U.S. federal income tax purposes.
| | |
| 20 | | 2 0 2 0 B L A C K R O C K A N N U A L R E P O R T T O S H A R E H O L D E R S |
Notes to Financial Statements (continued)
Segregation and Collateralization: In cases where the Fund enters into certain investments (e.g., futures contracts) that would be treated as “senior securities” for 1940 Act purposes, the Fund may segregate or designate on its books and records cash or liquid assets having a market value at least equal to the amount of its future obligations under such investments. Doing so allows the investment to be excluded from treatment as a “senior security.” Furthermore, if required by an exchange or counterparty agreement, the Fund may be required to deliver/deposit cash and/or securities to/with an exchange, or broker-dealer or custodian as collateral for certain investments or obligations.
Distributions: Distributions paid by the Fund are recorded on the ex-dividend dates. The character and timing of distributions are determined in accordance with U.S. federal income tax regulations, which may differ from U.S. GAAP.
Net income and realized gains from investments held by the Master Total Return Portfolio’s investment in BlackRock Cayman Master Total Return Portfolio I, Ltd. (the “Subsidiary”) are treated as ordinary income for tax purposes. If a net loss is realized by the Subsidiary in any taxable year, the loss will generally not be available to offset the Fund’s ordinary income and/or capital gains for that year. Effective November 30, 2018, the Fund, through the Master Portfolio, no longer invests in the Subsidiary.
Offering Costs: Offering costs are amortized over a 12-month period beginning with the commencement of operations of a class of shares.
Indemnifications: In the normal course of business, the Fund enters into contracts that contain a variety of representations that provide general indemnification. The Fund’s maximum exposure under these arrangements is unknown because it involves future potential claims against the Fund, which cannot be predicted with any certainty.
Other: Expenses directly related to the Fund or its classes are charged to the Fund or the applicable class. Expenses directly related to the Fund and other shared expenses prorated to the Fund are allocated daily to each class based on its relative net assets or other appropriate methods. Other operating expenses shared by several funds, including other funds managed by the Manager, are prorated among those funds on the basis of relative net assets or other appropriate methods.
The Fund has an arrangement with its custodian whereby credits are earned on uninvested cash balances, which could be used to reduce custody fees and/or overdraft charges. The Fund may incur charges on overdrafts, subject to certain conditions.
3. INVESTMENT VALUATION AND FAIR VALUE MEASUREMENTS
Investment Valuation Policies: The Fund’s investments are valued at fair value (also referred to as “market value” within the financial statements) each day that the Fund’s listing exchange is open and, for financial reporting purposes, as of the report date should the reporting period end on a day that the Fund’s listing exchange is not open. U.S. GAAP defines fair value as the price the Fund would receive to sell an asset or pay to transfer a liability in an orderly transaction between market participants at the measurement date. The Fund determines the fair values of its financial instruments using various independent dealers or pricing services under policies approved by the Board. If a security’s market price is not readily available or does not otherwise accurately represent the fair value of the security, the security will be valued in accordance with a policy approved by the Board as reflecting fair value. The BlackRock Global Valuation Methodologies Committee (the “Global Valuation Committee”) is the committee formed by management to develop global pricing policies and procedures and to oversee the pricing function for all financial instruments.
Fair Value Inputs and Methodologies: The following methods and inputs are used to establish the fair value of the Fund’s assets and liabilities:
| | • | | Exchange-traded funds (“ETFs”) and closed-end funds traded on a recognized securities exchange are valued at that day’s official closing price, as applicable, on the exchange where the stock is primarily traded. ETFs and closed-end funds traded on a recognized exchange for which there were no sales on that day may be valued at the last available bid (long positions) or ask (short positions) price. |
| | • | | Investments in open-end U.S. mutual funds (including money market funds) are valued at that day’s published net asset value (“NAV”). |
| | • | | Futures contracts are valued based on that day’s last reported settlement price on the exchange where the contract is traded. |
| | • | | The Fund records its proportionate investment in Master Total Return Portfolio and Master Advantage Large Cap Core Portfolio at fair value, which is based upon its pro rata ownership in the net assets of the Master Total Return Portfolio and Master Advantage Large Cap Core Portfolio. |
If events (e.g., a company announcement, market volatility or a natural disaster) occur that are expected to materially affect the value of such investment, or in the event that the application of these methods of valuation results in a price for an investment that is deemed not to be representative of the market value of such investment, or if a price is not available, the investment will be valued by the Global Valuation Committee, or its delegate, in accordance with a policy approved by the Board as reflecting fair value (“Fair Valued Investments”). The fair valuation approaches that may be used by the Global Valuation Committee will include market approach, income approach and cost approach. Valuation techniques such as discounted cash flow, use of market comparables and matrix pricing are types of valuation approaches and are typically used in determining fair value. When determining the price for Fair Valued Investments, the Global Valuation Committee, or its delegate, seeks to determine the price that the Fund might reasonably expect to receive or pay from the current sale or purchase of that asset or liability in an arm’s-length transaction. Fair value determinations shall be based upon all available factors that the Global Valuation Committee, or its delegate, deems relevant and consistent with the principles of fair value measurement. The pricing of all Fair Valued Investments is subsequently reported to the Board or a committee thereof on a quarterly basis.
Fair Value Hierarchy: Various inputs are used in determining the fair value of financial instruments. These inputs to valuation techniques are categorized into a fair value hierarchy consisting of three broad levels for financial reporting purposes as follows:
| | • | | Level 1 – Unadjusted price quotations in active markets/exchanges for identical assets or liabilities that the Fund has the ability to access |
| | • | | Level 2 – Other observable inputs (including, but not limited to, quoted prices for similar assets or liabilities in markets that are active, quoted prices for identical or similar assets or liabilities in markets that are not active, inputs other than quoted prices that are observable for the assets or liabilities (such as interest rates, yield curves, volatilities, prepayment speeds, loss severities, credit risks and default rates) or other market–corroborated inputs) |
| | • | | Level 3 – Unobservable inputs based on the best information available in the circumstances, to the extent observable inputs are not available (including the Global Valuation Committee’s assumptions used in determining the fair value of financial instruments) |
| | |
N O T E S T O F I N A N C I A L S T A T E M E N T S | | 21 |
Notes to Financial Statements (continued)
The hierarchy gives the highest priority to unadjusted quoted prices in active markets for identical assets or liabilities (Level 1 measurements) and the lowest priority to unobservable inputs (Level 3 measurements). Accordingly, the degree of judgment exercised in determining fair value is greatest for instruments categorized in Level 3. The inputs used to measure fair value may fall into different levels of the fair value hierarchy. In such cases, for disclosure purposes, the fair value hierarchy classification is determined based on the lowest level input that is significant to the fair value measurement in its entirety. Investments classified within Level 3 have significant unobservable inputs used by the Global Valuation Committee in determining the price for Fair Valued Investments. Level 3 investments include equity or debt issued by privately held companies or funds that may not have a secondary market and/or may have a limited number of investors. The categorization of a value determined for financial instruments is based on the pricing transparency of the financial instruments and is not necessarily an indication of the risks associated with investing in those securities.
As of September 30, 2020, certain investments of the Fund were fair valued using NAV per share as no quoted market value is available and therefore have been excluded from the fair value hierarchy.
| 4. | DERIVATIVE FINANCIAL INSTRUMENTS |
The Fund engages in various portfolio investment strategies using derivative contracts both to increase the returns of the Fund and/or to manage its exposure to certain risks such as credit risk, equity risk, interest rate risk, foreign currency exchange rate risk, commodity price risk or other risks (e.g., inflation risk). Derivative financial instruments categorized by risk exposure are included in the Schedule of Investments. These contracts may be transacted on an exchange or over-the-counter (“OTC”).
Futures Contracts: Futures contracts are purchased or sold to gain exposure to, or manage exposure to, changes in interest rates (interest rate risk) and changes in the value of equity securities (equity risk) or foreign currencies (foreign currency exchange rate risk).
Futures contracts are agreements between the Fund and a counterparty to buy or sell a specific quantity of an underlying instrument at a specified price and on a specified date. Depending on the terms of a contract, it is settled either through physical delivery of the underlying instrument on the settlement date or by payment of a cash amount on the settlement date. Upon entering into a futures contract, the Fund is required to deposit initial margin with the broker in the form of cash or securities in an amount that varies depending on a contract’s size and risk profile. The initial margin deposit must then be maintained at an established level over the life of the contract. Amounts pledged, which are considered restricted, are included in cash pledged for futures contracts in the Statement of Assets and Liabilities.
Securities deposited as initial margin are designated in the Schedule of Investments and cash deposited, if any, are shown as cash pledged for futures contracts in the Statement of Assets and Liabilities. Pursuant to the contract, the Fund agrees to receive from or pay to the broker an amount of cash equal to the daily fluctuation in market value of the contract (“variation margin”). Variation margin is recorded as unrealized appreciation (depreciation) and, if any, shown as variation margin receivable (or payable) on futures contracts in the Statement of Assets and Liabilities. When the contract is closed, a realized gain or loss is recorded in the Statement of Operations equal to the difference between the notional amount of the contract at the time it was opened and the notional amount at the time it was closed. The use of futures contracts involves the risk of an imperfect correlation in the movements in the price of futures contracts and interest, foreign currency exchange rates or underlying assets.
| 5. | INVESTMENT ADVISORY AGREEMENT AND OTHER TRANSACTIONS WITH AFFILIATES |
Investment Advisory: The Fund entered into an Investment Advisory Agreement with the Manager, the Fund’s investment adviser and an indirect, wholly-owned subsidiary of BlackRock, Inc. (“BlackRock”), to provide investment advisory and administrative services. The Manager is responsible for the management of the Fund’s portfolio and provides the personnel, facilities, equipment and certain other services necessary to the operations of the Fund.
For such services, the Fund pays the Manager a monthly fee at an annual rate equal to the following percentages of the average daily value of the Fund’s net assets:
| | | | |
| | |
| Average Daily Net Assets | | Investment Advisory Fees | |
| |
First $250 million | | | 0.500 | % |
$250 million — $300 million | | | 0.450 | |
$300 million — $400 million | | | 0.425 | |
Greater than $400 million | | | 0.400 | |
The Fund also pays an investment advisory fee to the Manager, which is the investment adviser of Master Total Return Portfolio and Master Advantage Large Cap Core Portfolio, to the extent it invests in the Master Total Return Portfolio and Master Advantage Large Cap Core Portfolio.
Service and Distribution Fees: The Fund entered into a Distribution Agreement and Distribution Plans with BlackRock Investments, LLC (“BRIL”), an affiliate of the Manager. Pursuant to the Distribution Plans and in accordance with Rule 12b-1 under the 1940 Act, the Fund pays BRIL ongoing service and distribution fees. The fees are accrued daily and paid monthly at annual rates based upon the average daily net assets of the relevant share class of the Fund as follows:
| | | | | | | | |
| | | |
| Share Class | | Service Fees | | | Distribution Fees | |
| | |
Investor A | | | 0.25 | % | | | N/A | |
Investor C | | | 0.25 | | | | 0.75 | % |
Class R | | | 0.25 | | | | 0.25 | |
BRIL and broker-dealers, pursuant to sub-agreements with BRIL, provide shareholder servicing and distribution services to the Fund. The ongoing service and/or distribution fee compensates BRIL and each broker-dealer for providing shareholder servicing and/or distribution related services to shareholders.
| | |
| 22 | | 2 0 2 0 B L A C K R O C K A N N U A L R E P O R T T O S H A R E H O L D E R S |
Notes to Financial Statements (continued)
For the year ended September 30, 2020, the following table shows the class specific service and distribution fees borne directly by each share class of the Fund:
| | | | | | | | | | | | | | | | |
| | | | | |
| | | Investor A | | | Investor C | | | Class R | | | Total | |
| | | | |
Service and distribution fees — class specific | | | $ 1,619,155 | | | | $ 1,287,547 | | | | $ 57,686 | | | | $ 2,964,388 | |
Transfer Agent: Pursuant to written agreements, certain financial intermediaries, some of which may be affiliates, provide the Fund with sub-accounting, recordkeeping, sub-transfer agency and other administrative services with respect to servicing of underlying investor accounts. For these services, these entities receive an asset-based fee or an annual fee per shareholder account, which will vary depending on share class and/or net assets. For the year ended September 30, 2020, the Fund did not pay any amounts to affiliates in return for these services.
The Manager maintains a call center that is responsible for providing certain shareholder services to the Fund. Shareholder services include responding to inquiries and processing purchases and sales based upon instructions from shareholders. For the year ended September 30, 2020, the Fund reimbursed the Manager the following amounts for costs incurred in running the call center, which are included in transfer agent — class specific in the Statement of Operations:
| | | | | | | | | | | | | | | | | | | | | | | | |
| | | | | | | |
| | | Institutional | | | Investor A | | | Investor C | | | Class K | | | Class R | | | Total | |
| | | | | | |
Amounts reimbursed | | | $ 15,458 | | | | $ 25,555 | | | | $ 9,463 | | | | $ 100 | | | | $ 109 | | | | $ 50,685 | |
For the year ended September 30, 2020, the following table shows the class specific transfer agent fees borne directly by each share class of the Fund:
| | | | | | | | | | | | | | | | | | | | | | | | |
| | | | | | | |
| | | Institutional | | | Investor A | | | Investor C | | | Class K | | | Class R | | | Total | |
| | | | | | |
Transfer agent fees — class specific | | | $ 401,497 | | | | $ 599,641 | | | | $ 130,963 | | | | $ 7,255 | | | | $ 23,547 | | | | $ 1,162,903 | |
Other Fees: For the year ended September 30, 2020, affiliates earned underwriting discounts, direct commissions and dealer concessions on sales of the Fund’s Investor A Shares of $44,673.
For the year ended September 30, 2020, affiliates received CDSCs as follows:
| | | | |
| | |
| Share Class | | Amounts | |
| |
Investor A | | $ | 15,021 | |
Investor C | | | 13,641 | |
| | | | |
| | $ | 28,662 | |
| | | | |
Expense Limitations, Waivers and Reimbursements: The Manager contractually agreed to waive its investment advisory fee by the amount of any management fees the Fund pays indirectly through its investments in the Master Portfolios. For the year ended September 30, 2020, the Manager waived $3,073,534, which is included in fees waived and/or reimbursed by the Manager in the Statement of Operations.
With respect to the Fund, the Manager contractually agreed to waive its investment advisory fees by the amount of investment advisory fees the Fund pays to the Manager indirectly through its investment in affiliated money market funds (the “affiliated money market fund waiver”) through January 31, 2021. The contractual agreement may be terminated upon 90 days’ notice by a majority of the directors who are not “interested persons” of the Fund, as defined in the 1940 Act (“Independent Directors”), or by a vote of a majority of the outstanding voting securities of the Fund. This amount is included in fees waived and/or reimbursed by the Manager in the Statement of Operations. For the year ended September 30, 2020, the amount waived and/or reimbursed was $132,637.
With the exception of the Fund’s investment in the Master Portfolios, the Manager has contractually agreed to waive its investment advisory fee with respect to any portion of the Fund’s assets invested in affiliated equity and fixed-income mutual funds, and affiliated exchange-traded funds that have a contractual management fee through January 31, 2021. The contractual agreement may be terminated upon 90 days’ notice by a majority of the Independent Directors, or by a vote of a majority of the outstanding voting securities of the Fund. This amount is included in fees waived and/or reimbursed by the Manager in the Statement of Operations. For the year ended September 30, 2020, the Manager waived $182,904 in investment advisory fees pursuant to this arrangement.
Interfund Lending: In accordance with an exemptive order (the “Order”) from the U.S. Securities and Exchange Commission (“SEC”), the Fund may participate in a joint lending and borrowing facility for temporary purposes (the “Interfund Lending Program”), subject to compliance with the terms and conditions of the Order, and to the extent permitted by the Fund’s investment policies and restrictions. The Fund is currently permitted to borrow and lend under the Interfund Lending Program.
A lending BlackRock fund may lend in aggregate up to 15% of its net assets, but may not lend more than 5% of its net assets to any one borrowing fund through the Interfund Lending Program. A borrowing BlackRock fund may not borrow through the Interfund Lending Program or from any other source more than 33 1/3% of its total assets (or any lower threshold provided for by the fund’s investment restrictions). If a borrowing BlackRock fund’s total outstanding borrowings exceed 10% of its total assets, each of its outstanding interfund loans will be subject to collateralization of at least 102% of the outstanding principal value of the loan. All interfund loans are for temporary or emergency purposes and the interest rate to be charged will be the average of the highest current overnight repurchase agreement rate available to a lending fund and the bank loan rate, as calculated according to a formula established by the Board.
During the year ended September 30, 2020, the Fund did not participate in the Interfund Lending Program.
Directors and Officers: Certain directors and/or officers of the Fund are directors and/or officers of BlackRock or its affiliates. The Fund reimburses the Manager for a portion of the compensation paid to the Fund’s Chief Compliance Officer, which is included in Officer in the Statement of Operations.
| | |
N O T E S T O F I N A N C I A L S T A T E M E N T S | | 23 |
Notes to Financial Statements (continued)
For the year ended September 30, 2020, purchases of investments, excluding short-term investments, were $16,971,212. For the year ended September 30, 2020, there were no sales.
It is the Fund’s policy to comply with the requirements of the Internal Revenue Code of 1986, as amended, applicable to regulated investment companies, and to distribute substantially all of its taxable income to its shareholders. Therefore, no U.S. federal income tax provision is required.
The Fund files U.S. federal and various state and local tax returns. No income tax returns are currently under examination. The statute of limitations on the Fund’s U.S. federal tax returns generally remains open for a period of three fiscal years after they are filed. The statutes of limitations on the Fund’s state and local tax returns may remain open for an additional year depending upon the jurisdiction.
Management has analyzed tax laws and regulations and their application to the Fund as of September 30, 2020, inclusive of the open tax return years, and does not believe that there are any uncertain tax positions that require recognition of a tax liability in the Fund’s financial statements.
U.S. GAAP requires that certain components of net assets be adjusted to reflect permanent differences between financial and tax reporting. These reclassifications have no effect on net assets or net asset values per share. As of period end, the following permanent differences attributable to certain deemed distributions were reclassified to the following accounts:
| | | | |
| |
| |
| | | Amounts | |
| |
| |
Paid-in capital | | $ | 4,792,559 | |
Accumulated earnings (loss) | | | (4,792,559 | ) |
| |
The tax character of distributions paid was as follows:
| | | | | | | | | | | | |
| |
| | |
| | | 09/30/20 | (a) | | | 09/30/19(a) | |
| |
| | | |
Ordinary income | | $ | 37,320,495 | | | $ | 47,757,929 | | | | | |
Long-term capital gains | | | 32,756,983 | | | | 30,526,391 | | | | | |
| | | | | | | | | | | | |
| | $ | 70,077,478 | | | $ | 78,284,320 | | | | | |
| | | | | | | | | | | | |
| | | | | | | | | | | | |
| |
| | (a) | Distribution amounts may include a portion of the proceeds from redeemed shares. | |
As of period end, the tax components of accumulated net earnings were as follows:
| | | | |
| |
| |
| | | Amounts | |
| |
| |
Undistributed ordinary income | | $ | 26,888,045 | |
Undistributed long-term capital gains | | | 28,206,840 | |
Net unrealized gains(a) | | | 159,000,213 | |
| | | | |
| | $ | 214,095,098 | |
| | | | |
| | | | |
| |
| | (a) | The difference between book-basis and tax-basis net unrealized gains/losses was attributable primarily to the timing and recognition of partnership income and the realization for tax purposes of unrealized gains/losses on certain futures contracts. | |
As of September 30, 2020, gross unrealized appreciation and depreciation for investments and derivatives based on cost for U.S. federal income tax purposes were as follows:
| | | | |
| |
| |
| | | Amounts | |
| |
| |
Tax cost | | $ | 1,312,445,162 | |
| | | | |
Gross unrealized appreciation | | $ | 159,000,213 | |
Gross unrealized depreciation | | | — | |
| | | | |
Net unrealized appreciation (depreciation) | | $ | 159,000,213 | |
| | | | |
The Fund, along with certain other funds managed by the Manager and its affiliates (“Participating Funds”), is a party to a 364-day, $2.25 billion credit agreement with a group of lenders. Under this agreement, the Fund may borrow to fund shareholder redemptions. Excluding commitments designated for certain individual funds, the Participating Funds, including the Fund, can borrow up to an aggregate commitment amount of $1.75 billion at any time outstanding, subject to asset coverage and other limitations as specified in the agreement. The credit agreement has the following terms: a fee of 0.10% per annum on unused commitment amounts and interest at a rate equal to the higher of (a) one-month LIBOR (but, in any event, not less than 0.00%) on the date the loan is made plus 0.80% per annum or (b) the Fed Funds rate (but, in any event, not less than 0.00%) in effect from time to time plus 0.80% per annum on amounts borrowed. The agreement expires in April 2021 unless extended or renewed. These fees were allocated among such funds based upon portions of the aggregate commitment available to them and relative net assets of Participating Funds. During the year ended September 30, 2020, the Fund did not borrow under the credit agreement.
| | |
| 24 | | 2 0 2 0 B L A C K R O C K A N N U A L R E P O R T T O S H A R E H O L D E R S |
Notes to Financial Statements (continued)
In the normal course of business, the Fund invests in securities or other instruments and may enter into certain transactions, and such activities subject the Fund to various risks, including among others, fluctuations in the market (market risk) or failure of an issuer to meet all of its obligations. The value of securities or other instruments may also be affected by various factors, including, without limitation: (i) the general economy; (ii) the overall market as well as local, regional or global political and/or social instability; (iii) regulation, taxation or international tax treaties between various countries; or (iv) currency, interest rate and price fluctuations. Local, regional or global events such as war, acts of terrorism, the spread of infectious illness or other public health issues, recessions, or other events could have a significant impact on the Fund and its investments. The Fund’s prospectus provides details of the risks to which the Fund is subject.
Market Risk: An outbreak of respiratory disease caused by a novel coronavirus has developed into a global pandemic and has resulted in closing borders, quarantines, disruptions to supply chains and customer activity, as well as general concern and uncertainty. The impact of this pandemic, and other global health crises that may arise in the future, could affect the economies of many nations, individual companies and the market in general in ways that cannot necessarily be foreseen at the present time. This pandemic may result in substantial market volatility and may adversely impact the prices and liquidity of a fund’s investments. The duration of this pandemic and its effects cannot be determined with certainty.
Valuation Risk: The market values of equities, such as common stocks and preferred securities or equity related investments, such as futures and options, may decline due to general market conditions which are not specifically related to a particular company. They may also decline due to factors which affect a particular industry or industries. The Fund may invest in illiquid investments. An illiquid investment is any investment that the Fund reasonably expects cannot be sold or disposed of in current market conditions in seven calendar days or less without the sale or disposition significantly changing the market value of the investment. The Fund may experience difficulty in selling illiquid investments in a timely manner at the price that it believes the investments are worth. Prices may fluctuate widely over short or extended periods in response to company, market or economic news. Markets also tend to move in cycles, with periods of rising and falling prices. This volatility may cause the Fund’s NAV to experience significant increases or decreases over short periods of time. If there is a general decline in the securities and other markets, the NAV of the Fund may lose value, regardless of the individual results of the securities and other instruments in which the Fund invests.
The price a Fund could receive upon the sale of any particular portfolio investment may differ from a Fund’s valuation of the investment, particularly for securities that trade in thin or volatile markets or that are valued using a fair valuation technique or a price provided by an independent pricing service. Changes to significant unobservable inputs and assumptions (i.e., publicly traded company multiples, growth rate, time to exit) due to the lack of observable inputs may significantly impact the resulting fair value and therefore a Fund’s results of operations. As a result, the price received upon the sale of an investment may be less than the value ascribed by a Fund, and a Fund could realize a greater than expected loss or lesser than expected gain upon the sale of the investment. A Fund’s ability to value its investments may also be impacted by technological issues and/or errors by pricing services or other third party service providers.
Counterparty Credit Risk: The Fund may be exposed to counterparty credit risk, or the risk that an entity may fail to or be unable to perform on its commitments related to unsettled or open transactions, including making timely interest and/or principal payments or otherwise honoring its obligations. The Fund manages counterparty credit risk by entering into transactions only with counterparties that the Manager believes have the financial resources to honor their obligations and by monitoring the financial stability of those counterparties. Financial assets, which potentially expose the Fund to market, issuer and counterparty credit risks, consist principally of financial instruments and receivables due from counterparties. The extent of the Fund’s exposure to market, issuer and counterparty credit risks with respect to these financial assets is approximately their value recorded in the Statement of Assets and Liabilities, less any collateral held by the Fund.
A derivative contract may suffer a mark-to-market loss if the value of the contract decreases due to an unfavorable change in the market rates or values of the underlying instrument. Losses can also occur if the counterparty does not perform under the contract.
With exchange-traded futures, there is less counterparty credit risk to the Fund since the exchange or clearinghouse, as counterparty to such instruments, guarantees against a possible default. The clearinghouse stands between the buyer and the seller of the contract; therefore, credit risk is limited to failure of the clearinghouse. While offset rights may exist under applicable law, the Fund does not have a contractual right of offset against a clearing broker or clearinghouse in the event of a default (including the bankruptcy or insolvency). Additionally, credit risk exists in exchange-traded futures with respect to initial and variation margin that is held in a clearing broker’s customer accounts. While clearing brokers are required to segregate customer margin from their own assets, in the event that a clearing broker becomes insolvent or goes into bankruptcy and at that time there is a shortfall in the aggregate amount of margin held by the clearing broker for all its clients, typically the shortfall would be allocated on a pro rata basis across all the clearing broker’s customers, potentially resulting in losses to the Fund.
Concentration Risk: A diversified portfolio, where this is appropriate and consistent with a fund’s objectives, minimizes the risk that a price change of a particular investment will have a material impact on the NAV of a fund. The investment concentrations within the Fund’s portfolio are disclosed in its Schedule of Investments.
LIBOR Transition Risk: The United Kingdom’s Financial Conduct Authority announced a phase out of the London Interbank Offered Rate (“LIBOR”) by the end of 2021, and it is expected that LIBOR will cease to be published after that time. The Fund may be exposed to financial instruments tied to LIBOR to determine payment obligations, financing terms, hedging strategies or investment value. The transition process away from LIBOR might lead to increased volatility and illiquidity in markets for, and reduce the effectiveness of new hedges placed against, instruments whose terms currently include LIBOR. The ultimate effect of the LIBOR transition process on the Fund is uncertain.
| | |
N O T E S T O F I N A N C I A L S T A T E M E N T S | | 25 |
Notes to Financial Statements (continued)
| 10. | CAPITAL SHARE TRANSACTIONS |
Transactions in capital shares for each class were as follows:
| | | | | | | | | | | | | | | | | | | | |
| | | | |
| | | Year Ended 09/30/20 | | | Year Ended 09/30/19 | | | | |
| | | | | |
| Share Class | | Shares | | | Amounts | | | Shares | | | Amounts | | | | |
| | | | | |
Institutional | | | | | | | | | | | | | | | | | | | | |
Shares sold | | | 5,973,087 | | | $ | 140,408,300 | | | | 5,820,817 | | | $ | 130,370,585 | | | | | |
Shares issued in reinvestment of distributions | | | 913,200 | | | | 21,474,108 | | | | 1,219,382 | | | | 25,012,438 | | | | | |
Shares redeemed | | | (4,958,302 | ) | | | (112,828,295 | ) | | | (3,961,435 | ) | | | (88,163,064 | ) | | | | |
| | | | | | | | | | | | | | | | | | | | |
| | | | | |
| | | 1,927,985 | | | $ | 49,054,113 | | | | 3,078,764 | | | $ | 67,219,959 | | | | | |
| | | | | | | | | | | | | | | | | | | | |
Investor A | | | | | | | | | | | | | | | | | | | | |
Shares sold | | | 8,711,700 | | | $ | 203,218,124 | | | | — | | | $ | — | | | | | |
Shares sold and automatic conversion of shares | | | — | | | | — | | | | 6,774,720 | | | | 150,706,896 | | | | | |
Shares issued in reinvestment of distributions | | | 1,211,101 | | | | 28,355,955 | | | | 1,597,323 | | | | 32,556,063 | | | | | |
Shares redeemed | | | (5,766,837 | ) | | | (132,560,158 | ) | | | (4,916,166 | ) | | | (109,427,242 | ) | | | | |
| | | | | | | | | | | | | | | | | | | | |
| | | | | |
| | | 4,155,964 | | | $ | 99,013,921 | | | | 3,455,877 | | | $ | 73,835,717 | | | | | |
| | | | | | | | | | | | | | | | | | | | |
Investor C | | | | | | | | | | | | | | | | | | | | |
Shares sold | | | 2,162,261 | | | $ | 42,903,371 | | | | 3,299,069 | | | $ | 62,360,336 | | | | | |
Shares issued in reinvestment of distributions | | | 316,937 | | | | 6,345,196 | | | | 395,079 | | | | 6,937,273 | | | | | |
Shares redeemed | | | (2,793,603 | ) | | | (55,535,399 | ) | | | — | | | | — | | | | | |
Shares redeemed and automatic conversion of shares | | | — | | | | — | | | | (2,405,162 | ) | | | (46,470,773 | ) | | | | |
| | | | | | | | | | | | | | | | | | | | |
| | | | | |
| | | (314,405 | ) | | $ | (6,286,832 | ) | | | 1,288,986 | | | $ | 22,826,836 | | | | | |
| | | | | | | | | | | | | | | | | | | | |
Class K | | | | | | | | | | | | | | | | | | | | |
Shares sold | | | 975,343 | | | $ | 22,747,205 | | | | 714,094 | | | $ | 15,979,217 | | | | | |
Shares issued in reinvestment of distributions | | | 67,778 | | | | 1,594,255 | | | | 35,661 | | | | 740,292 | | | | | |
Shares redeemed | | | (496,990 | ) | | | (11,661,445 | ) | | | (156,556 | ) | | | (3,482,997 | ) | | | | |
| | | | | | | | | | | | | | | | | | | | |
| | | | | |
| | | 546,131 | | | $ | 12,680,015 | | | | 593,199 | | | $ | 13,236,512 | | | | | |
| | | | | | | | | | | | | | | | | | | | |
Class R | | | | | | | | | | | | | | | | | | | | |
Shares sold | | | 136,539 | | | $ | 2,908,943 | | | | 112,460 | | | $ | 2,319,013 | | | | | |
Shares issued in reinvestment of distributions | | | 28,212 | | | | 602,475 | | | | 52,310 | | | | 973,829 | | | | | |
Shares redeemed | | | (196,871 | ) | | | (4,125,127 | ) | | | (261,538 | ) | | | (5,394,475 | ) | | | | |
| | | | | | | | | | | | | | | | | | | | |
| | | | | |
| | | (32,120 | ) | | $ | (613,709 | ) | | | (96,768 | ) | | $ | (2,101,633 | ) | | | | |
| | | | | | | | | | | | | | | | | | | | |
| | | | | |
| | | 6,283,555 | | | $ | 153,847,508 | | | | 8,320,058 | | | $ | 175,017,391 | | | | | |
| | | | | | | | | | | | | | | | | | | | |
As of September 30, 2020, BlackRock Financial Management, Inc., an affiliate of the Fund, owned 8,471 Class K Shares of the Fund.
Management has evaluated the impact of all subsequent events on the Fund through the date the financial statements were issued and has determined that there were no subsequent events requiring adjustment or additional disclosure in the financial statements.
| | |
| 26 | | 2 0 2 0 B L A C K R O C K A N N U A L R E P O R T T O S H A R E H O L D E R S |
Report of Independent Registered Public Accounting Firm
To the Shareholders and Board of Directors of BlackRock Balanced Capital Fund, Inc.:
Opinion on the Financial Statements and Financial Highlights
We have audited the accompanying statement of assets and liabilities of BlackRock Balanced Capital Fund, Inc. (the “Fund”), including the schedule of investments, as of September 30, 2020, the related statement of operations for the year then ended, the statements of changes in net assets for each of the two years in the period then ended, the financial highlights for each of the five years in the period then ended, and the related notes. In our opinion, the financial statements and financial highlights present fairly, in all material respects, the financial position of the Fund as of September 30, 2020, and the results of its operations for the year then ended, the changes in its net assets for each of the two years in the period then ended, and the financial highlights for each of the five years in the period then ended, in conformity with accounting principles generally accepted in the United States of America.
Basis for Opinion
These financial statements and financial highlights are the responsibility of the Fund’s management. Our responsibility is to express an opinion on the Fund’s financial statements and financial highlights based on our audits. We are a public accounting firm registered with the Public Company Accounting Oversight Board (United States) (PCAOB) and are required to be independent with respect to the Fund in accordance with the U.S. federal securities laws and the applicable rules and regulations of the Securities and Exchange Commission and the PCAOB.
We conducted our audits in accordance with the standards of the PCAOB. Those standards require that we plan and perform the audit to obtain reasonable assurance about whether the financial statements and financial highlights are free of material misstatement, whether due to error or fraud. The Fund is not required to have, nor were we engaged to perform, an audit of its internal control over financial reporting. As part of our audits we are required to obtain an understanding of internal control over financial reporting but not for the purpose of expressing an opinion on the effectiveness of the Fund’s internal control over financial reporting. Accordingly, we express no such opinion.
Our audits included performing procedures to assess the risks of material misstatement of the financial statements and financial highlights, whether due to error or fraud, and performing procedures that respond to those risks. Such procedures included examining, on a test basis, evidence regarding the amounts and disclosures in the financial statements and financial highlights. Our audits also included evaluating the accounting principles used and significant estimates made by management, as well as evaluating the overall presentation of the financial statements and financial highlights. Our procedures included confirmation of securities owned as of September 30, 2020, by correspondence with the custodian and brokers; when replies were not received from brokers, we performed other auditing procedures. We believe that our audits provide a reasonable basis for our opinion.
Deloitte & Touche LLP
Boston, Massachusetts
November 20, 2020
We have served as the auditor of one or more BlackRock investment companies since 1992.
| | |
R E P O R T O F I N D E P E N D E N T R E G I S T E R E D P U B L I C A C C O U N T I N G F I R M | | 27 |
Important Tax Information (unaudited)
For corporate shareholders, the percentage of ordinary income distributions paid during the fiscal year ended September 30, 2020 that qualified for the dividends-received deduction were as follows:
| | | | |
| |
| |
| Fund Name | | Dividends-Received Deduction | |
| |
| |
BlackRock Balanced Capital Fund, Inc. | | | 25.28 | % |
| |
The following maximum amounts are hereby designated as qualified dividend income for individuals for the fiscal year ended September 30, 2020:
| | | | |
| |
| |
| Fund Name | | Qualified Dividend Income | |
| |
| |
BlackRock Balanced Capital Fund, Inc. | | | $20,113,270 | |
| |
The following maximum amounts are hereby designated as qualified business income for individuals for the fiscal year ended September 30, 2020:
| | | | |
| |
| |
| Fund Name | | Qualified Business Income | |
| |
| |
BlackRock Balanced Capital Fund, Inc. | | | $1,030,131 | |
| |
For the fiscal year ended September 30, 2020, the Fund hereby designates the following maximum amounts allowable as interest-related dividends eligible for exemption from U.S. withholding tax for nonresident aliens and foreign corporations:
| | | | |
| |
| |
| Fund Name | | Interest-Related Dividends | |
| |
| |
BlackRock Balanced Capital Fund, Inc. | | | $23,965,260 | |
| |
The Fund hereby designates the following amount of distributions from direct federal obligation interest for the fiscal year ended September 30, 2020:
| | | | |
| |
| |
| Fund Name | | Federal Obligation Interest | |
| |
| |
BlackRock Balanced Capital Fund, Inc. | | | $2,364,952 | |
| |
The law varies in each state as to whether and what percent of ordinary income dividends attribute to federal obligations is exempt from state income tax. Shareholders are advised to check with their tax advisers to determine if any portion of the dividends received is exempt from state income tax.
The following distribution amounts are hereby designated for the fiscal year ended September 30, 2020:
| | | | | | | | |
| |
| | |
| Fund Name | | Short-Term Capital Gain Dividends | | | 20% Rate Long-Term Capital Gain Dividends | |
| |
| | |
BlackRock Balanced Capital Fund, Inc. | | $ | 19,595,456 | | | $ | 32,756,983 | |
| |
| | |
| 28 | | 2 0 2 0 B L A C K R O C K A N N U A L R E P O R T T O S H A R E H O L D E R S |
Director and Officer Information of the Fund
| | | | | | | | | | |
| Independent Directors(a) |
| | | | | | |
Name Year of Birth(b) | | Position(s) Held (Length of Service)(c) | | Principal Occupation(s) During Past Five Years | | | | Number of BlackRock-Advised Registered Investment Companies (“RICs”) Consisting of Investment Portfolios (“Portfolios”) Overseen | | Public Company and Other Investment Company Directorships Held During Past Five Years |
| | | | | |
Mark Stalnecker 1951 | | Chair of the Board and Director
(Since 2019) | | Chief Investment Officer, University of Delaware from 1999 to 2013; Trustee and Chair of the Finance and Investment Committees, Winterthur Museum and Country Estate from 2005 to 2016; Member of the Investment Committee, Delaware Public Employees’ Retirement System since 2002; Member of the Investment Committee, Christiana Care Health System from 2009 to 2017; Member of the Investment Committee, Delaware Community Foundation from 2013 to 2014; Director and Chair of the Audit Committee, SEI Private Trust Co. from 2001 to 2014. | | | | 35 RICs consisting of 158 Portfolios | | None |
| | | | | |
Bruce R. Bond 1946 | | Director
(Since 2007) | | Board Member, Amsphere Limited (software) since 2018; Trustee and Member of the Governance Committee, State Street Research Mutual Funds from 1997 to 2005; Board Member of Governance, Audit and Finance Committee, Avaya Inc. (computer equipment) from 2003 to 2007. | | | | 35 RICs consisting of 158 Portfolios | | None |
| | | | | |
Susan J. Carter 1956 | | Director
(Since 2019) | | Director, Pacific Pension Institute from 2014 to 2018; Advisory Board Member, Center for Private Equity and Entrepreneurship at Tuck School of Business since 1997; Senior Advisor, Commonfund Capital, Inc. (“CCI”) (investment adviser) in 2015; Chief Executive Officer, CCI from 2013 to 2014; President & Chief Executive Officer, CCI from 1997 to 2013; Advisory Board Member, Girls Who Invest from 2015 to 2018 and Board Member thereof since 2018; Advisory Board Member, Bridges Fund Management since 2016; Trustee, Financial Accounting Foundation since 2017; Practitioner Advisory Board Member, Private Capital Research Institute (“PCRI”) since 2017; Lecturer in the Practice of Management, Yale School of Management since 2019. | | | | 35 RICs consisting of 158 Portfolios | | None |
| | | | | |
Collette Chilton 1958 | | Director
(Since 2019) | | Chief Investment Officer, Williams College since 2006; Chief Investment Officer, Lucent Asset Management Corporation from 1998 to 2006. | | | | 35 RICs consisting of 158 Portfolios | | None |
| | | | | |
Neil A. Cotty 1954 | | Director
(Since 2019) | | Bank of America Corporation from 1996 to 2015, serving in various senior finance leadership roles, including Chief Accounting Officer from 2009 to 2015, Chief Financial Officer of Global Banking, Markets and Wealth Management from 2008 to 2009, Chief Accounting Officer from 2004 to 2008, Chief Financial Officer of Consumer Bank from 2003 to 2004, Chief Financial Officer of Global Corporate Investment Bank from 1999 to 2002. | | | | 35 RICs consisting of 158 Portfolios | | None |
| | | | | |
Lena G. Goldberg 1954 | | Director
(Since 2016) | | Senior Lecturer, Harvard Business School, since 2008; Director, Charles Stark Draper Laboratory, Inc. since 2013; FMR LLC/Fidelity Investments (financial services) from 1996 to 2008, serving in various senior roles including Executive Vice President - Strategic Corporate Initiatives and Executive Vice President and General Counsel; Partner, Sullivan & Worcester LLP from 1985 to 1996 and Associate thereof from 1979 to 1985. | | | | 35 RICs consisting of 158 Portfolios | | None |
| | | | | |
Henry R. Keizer 1956 | | Director
(Since 2016) | | Director, Park Indemnity Ltd. (captive insurer) since 2010; Director, MUFG Americas Holdings Corporation and MUFG Union Bank, N.A. (financial and bank holding company) from 2014 to 2016; Director, American Institute of Certified Public Accountants from 2009 to 2011; Director, KPMG LLP (audit, tax and advisory services) from 2004 to 2005 and 2010 to 2012; Director, KPMG International in 2012, Deputy Chairman and Chief Operating Officer thereof from 2010 to 2012 and U.S. Vice Chairman of Audit thereof from 2005 to 2010; Global Head of Audit, KPMGI (consortium of KPMG firms) from 2006 to 2010; Director, YMCA of Greater New York from 2006 to 2010. | | | | 35 RICs consisting of 158 Portfolios | | Hertz Global Holdings (car rental); Montpelier Re Holdings, Ltd. (publicly held property and casualty reinsurance) from 2013 until 2015; WABCO (commercial vehicle safety systems); Sealed Air Corp. (packaging) |
| | |
D I R E C T O R A N D O F F I C E R I N F O R M A T I O N O F T H E F U N D | | 29 |
Director and Officer Information of the Fund (continued)
| | | | | | | | | | |
| Independent Directors(a) |
| | | | | | |
Name Year of Birth(b) | | Position(s) Held (Length of Service)(c) | | Principal Occupation(s) During Past Five Years | | | | Number of BlackRock-Advised Registered Investment Companies (“RICs”) Consisting of Investment Portfolios (“Portfolios”) Overseen | | Public Company and Other
Investment
Company
Directorships
Held During Past Five Years |
| | | | | |
Cynthia A. Montgomery 1952 | | Director
(Since 2019) | | Professor, Harvard Business School since 1989. | | | | 35 RICs consisting of 158 Portfolios | | Newell Rubbermaid, Inc. (manufacturing) |
| | | | | |
Donald C. Opatrny 1952 | | Director
(Since 2015) | | Trustee, Vice Chair, Member of the Executive Committee and Chair of the Investment Committee, Cornell University since 2004; President, Trustee and Member of the Investment Committee, The Aldrich Contemporary Art Museum from 2007 to 2014; Member of the Board and Investment Committee, University School from 2007 to 2018; Member of the Investment Committee, Mellon Foundation from 2009 to 2015; Trustee, Artstor (a Mellon Foundation affiliate) from 2010 to 2015; President and Trustee, the Center for the Arts, Jackson Hole from 2011 to 2018; Director, Athena Capital Advisors LLC (investment management firm) since 2013; Trustee and Chair of the Investment Committee, Community Foundation of Jackson Hole since 2014; Member of Affordable Housing Supply Board of Jackson, Wyoming since 2018; Member, Investment Funds Committee, State of Wyoming since 2017; Trustee, Phoenix Art Museum since 2018; Trustee, Arizona Community Foundation and Member of Investment Committee since 2020. | | | | 35 RICs consisting of 158 Portfolios | | None |
| | | | | |
Joseph P. Platt 1947 | | Director
(Since 2019) | | General Partner, Thorn Partners, LP (private investments) since 1998; Director, WQED Multi-Media (public broadcasting not-for-profit) since 2001; Chair, Basic Health International (non-profit) since 2015. | | | | 35 RICs consisting of 158 Portfolios | | Greenlight Capital Re, Ltd. (reinsurance company); Consol Energy Inc. |
| | | | | |
Kenneth L. Urish 1951 | | Director
(Since 2019) | | Managing Partner, Urish Popeck & Co., LLC (certified public accountants and consultants) since 1976; Past-Chairman of the Professional Ethics Committee of the Pennsylvania Institute of Certified Public Accountants and Committee Member thereof since 2007; Member of External Advisory Board, The Pennsylvania State University Accounting Department since founding in 2001; Principal, UP Strategic Wealth Investment Advisors, LLC since 2013; Trustee, The Holy Family Institute from 2001 to 2010; President and Trustee, Pittsburgh Catholic Publishing Associates from 2003 to 2008; Director, Inter-Tel from 2006 to 2007. | | | | 35 RICs consisting of 158 Portfolios | | None |
| | | | | |
Claire A. Walton 1957 | | Director
(Since 2019) | | Chief Operating Officer and Chief Financial Officer of Liberty Square Asset Management, LP from 1998 to 2015; General Partner of Neon Liberty Capital Management, LLC since 2003; Director, Boston Hedge Fund Group from 2009 to 2018; Director, Woodstock Ski Runners since 2013; Director, Massachusetts Council on Economic Education from 2013 to 2015. | | | | 35 RICs consisting of 158 Portfolios | | None |
| | |
| 30 | | 2 0 2 0 B L A C K R O C K A N N U A L R E P O R T T O S H A R E H O L D E R S |
Director and Officer Information of the Fund (continued)
| | | | | | | | | | |
| Interested Directors(a)(d) |
| | | | | | |
Name Year of Birth(b) | | Position(s) Held (Length of Service)(c) | | Principal Occupation(s) During Past Five Years | | | | Number of BlackRock-Advised Registered Investment Companies (“RICs”) Consisting of Investment Portfolios (“Portfolios”) Overseen | | Public Company and Other
Investment
Company
Directorships Held During Past Five Years |
| | | | | |
Robert Fairbairn 1965 | | Director
(Since 2015) | | Vice Chairman of BlackRock, Inc. since 2019; Member of BlackRock’s Global Executive and Global Operating Committees; Co-Chair of BlackRock’s Human Capital Committee; Senior Managing Director of BlackRock, Inc. from 2010 to 2019; oversaw BlackRock’s Strategic Partner Program and Strategic Product Management Group from 2012 to 2019; Member of the Board of Managers of BlackRock Investments, LLC from 2011 to 2018; Global Head of BlackRock’s Retail and iShares® businesses from 2012 to 2016. | | | | 122 RICs consisting of 269 Portfolios | | None |
| | | | | |
John M. Perlowski(e) 1964 | | Director
(Since 2015), President and Chief Executive Officer (Since 2010) | | Managing Director of BlackRock, Inc. since 2009; Head of BlackRock Global Accounting and Product Services since 2009; Advisory Director of Family Resource Network (charitable foundation) since 2009. | | | | 123 RICs consisting of 270 Portfolios | | None |
(a) The address of each Director is c/o BlackRock, Inc., 55 East 52nd Street, New York, New York 10055. (b) Each Independent Director holds office until his or her successor is duly elected and qualifies or until his or her earlier death, resignation, retirement or removal as provided by the Fund’s by-laws or charter or statute, or until December 31 of the year in which he or she turns 75. Directors who are “interested persons,” as defined in the 1940 Act, serve until their successor is duly elected and qualifies or until their earlier death, resignation, retirement or removal as provided by the Fund’s by-laws or statute, or until December 31 of the year in which they turn 72. The Board may determine to extend the terms of Independent Directors on a case-by-case basis, as appropriate. (c) Following the combination of Merrill Lynch Investment Managers, L.P. (“MLIM”) and BlackRock, Inc. in September 2006, the various legacy MLIM and legacy BlackRock fund boards were realigned and consolidated into three new fund boards in 2007. In addition, effective January 1, 2019, three BlackRock Fund Complexes were realigned and consolidated into two BlackRock Fund Complexes. As a result, although the chart shows the year that each Independent Director joined the Board, certain Independent Directors first became members of the boards of other BlackRock-advised Funds, legacy MLIM funds or legacy BlackRock funds as follows: Bruce R. Bond, 2005; Susan J. Carter, 2016; Collette Chilton, 2015; Neil A. Cotty, 2016; Cynthia A. Montgomery, 1994; Joseph P. Platt, 1999; Mark Stalnecker, 2015; Kenneth L. Urish, 1999; Claire A. Walton, 2016. (d) Mr. Fairbairn and Mr. Perlowski are both “interested persons,” as defined in the 1940 Act, of the Fund based on their positions with BlackRock, Inc. and its affiliates. Mr. Fairbairn and Mr. Perlowski are also board members of the BlackRock Fixed-Income Complex. (e) Mr. Perlowski is also a trustee of the BlackRock Credit Strategies Fund. |
| | |
D I R E C T O R A N D O F F I C E R I N F O R M A T I O N O F T H E F U N D | | 31 |
Director and Officer Information of the Fund (continued)
| | | | | | |
| Officers Who Are Not Directors(a) |
| | | | |
Name Year of Birth(b) | | Position(s) Held (Length of Service) | | Principal Occupation(s) During Past Five Years | | |
| | |
Jennifer McGovern 1977 | | Vice President
(Since 2014) | | Managing Director of BlackRock, Inc. since 2016; Director of BlackRock, Inc. from 2011 to 2015; Head of Americas Product Development and Governance for BlackRock’s Global Product Group since 2019; Head of Product Structure and Oversight for BlackRock’s U.S. Wealth Advisory Group from 2013 to 2019. |
| | |
Neal J. Andrews 1966 | | Chief Financial Officer
(Since 2007) | | Chief Financial Officer of the iShares® exchange traded funds from 2019 to 2020; Managing Director of BlackRock, Inc. since 2006. |
| | |
Jay M. Fife 1970 | | Treasurer
(Since 2007) | | Managing Director of BlackRock, Inc. since 2007. |
| | |
Charles Park 1967 | | Chief Compliance Officer
(Since 2014) | | Anti-Money Laundering Compliance Officer for certain BlackRock-advised Funds from 2014 to 2015; Chief Compliance Officer of BlackRock Advisors, LLC and the BlackRock-advised Funds in the BlackRock Multi-Asset Complex and the BlackRock Fixed-Income Complex since 2014; Principal of and Chief Compliance Officer for iShares® Delaware Trust Sponsor LLC since 2012 and BlackRock Fund Advisors (“BFA”) since 2006; Chief Compliance Officer for the BFA-advised iShares® exchange traded funds since 2006; Chief Compliance Officer for BlackRock Asset Management International Inc. since 2012. |
| | |
Lisa Belle 1968 | | Anti-Money Laundering Compliance Officer
(Since 2019) | | Managing Director of BlackRock, Inc. since 2019; Global Financial Crime Head for Asset and Wealth Management of JP Morgan from 2013 to 2019; Managing Director of RBS Securities from 2012 to 2013; Head of Financial Crimes for Barclays Wealth Americas from 2010 to 2012. |
| | |
Janey Ahn 1975 | | Secretary
(Since 2019) | | Managing Director of BlackRock, Inc. since 2018; Director of BlackRock, Inc. from 2009 to 2017. |
(a) The address of each Officer is c/o BlackRock, Inc., 55 East 52nd Street, New York, New York 10055. (b) Officers of the Fund serve at the pleasure of the Board. |
Further information about the Fund’s Directors and Officers is available in the Fund’s Statement of Additional Information, which can be obtained without charge by calling (800) 441-7762.
| | |
| 32 | | 2 0 2 0 B L A C K R O C K A N N U A L R E P O R T T O S H A R E H O L D E R S |
| | |
| Portfolio Information as of September 30, 2020 | | Master Advantage Large Cap Core Portfolio |
| | | | |
| TEN LARGEST HOLDINGS | |
| | |
| Security(a) | | Percent of
Net Assets | |
| |
Microsoft Corp. | | | 6 | % |
Apple Inc. | | | 5 | |
Amazon.com, Inc. | | | 4 | |
NVIDIA Corp. | | | 2 | |
Alphabet, Inc., Class A | | | 2 | |
PayPal Holdings, Inc. | | | 2 | |
salesforce.com, Inc. | | | 2 | |
PepsiCo, Inc. | | | 2 | |
Home Depot, Inc. | | | 2 | |
Intel Corp. | | | 1 | |
| | | | |
| SECTOR ALLOCATION | |
| | |
| Sector(b) | | Percent of Net Assets | |
| |
Information Technology | | | 27 | % |
Health Care | | | 14 | |
Consumer Discretionary | | | 12 | |
Communication Services | | | 10 | |
Financials | | | 9 | |
Industrials | | | 8 | |
Consumer Staples | | | 7 | |
Utilities | | | 3 | |
Real Estate | | | 3 | |
Materials | | | 2 | |
Energy | | | 2 | |
Short-Term Securities | | | 3 | |
| (a) | Excludes short-term securities. |
| (b) | For Master Portfolio compliance purposes, the Master Portfolio’s sector classifications refer to one or more of the sector sub-classifications used by one or more widely recognized market indexes or ratings group indexes, and/or as defined by the investment adviser. These definitions may not apply for purposes of this report, which may combine such sector sub-classifications for reporting ease. |
| | |
Schedule of Investments September 30, 2020 | | Master Advantage Large Cap Core Portfolio (Percentages shown are based on Net Assets) |
| | | | | | | | |
| Security | | Shares | | | Value | |
| | |
Common Stocks | | | | | | | | |
| | |
| Aerospace & Defense — 1.0% | | | | | | |
HEICO Corp. | | | 39,087 | | | $ | 4,090,845 | |
L3Harris Technologies, Inc. | | | 17,170 | | | | 2,916,153 | |
Lockheed Martin Corp. | | | 33,468 | | | | 12,827,615 | |
Northrop Grumman Corp. | | | 21,599 | | | | 6,814,269 | |
Teledyne Technologies, Inc.(a) | | | 29,472 | | | | 9,142,509 | |
| | | | | | | | |
| | |
| | | | | | 35,791,391 | |
| | |
| Airlines — 0.2% | | | | | | |
Alaska Air Group, Inc. | | | 71,778 | | | | 2,629,228 | |
Delta Air Lines, Inc. | | | 65,767 | | | | 2,011,155 | |
United Airlines Holdings, Inc.(a) | | | 83,366 | | | | 2,896,968 | |
| | | | | | | | |
| | |
| | | | | | 7,537,351 | |
| | |
| Auto Components — 0.1% | | | | | | |
Aptiv PLC | | | 27,859 | | | | 2,554,113 | |
| | | | | | | | |
| | |
| Automobiles — 1.2% | | | | | | |
Harley-Davidson, Inc. | | | 19,991 | | | | 490,579 | |
Tesla, Inc.(a) | | | 104,949 | | | | 45,024,171 | |
| | | | | | | | |
| | |
| | | | | | 45,514,750 | |
| | |
| Banks — 2.2% | | | | | | |
Bank of America Corp. | | | 876,718 | | | | 21,120,137 | |
CIT Group, Inc. | | | 66,192 | | | | 1,172,260 | |
Cullen/Frost Bankers, Inc. | | | 80,318 | | | | 5,136,336 | |
First Hawaiian, Inc. | | | 29,822 | | | | 431,525 | |
First Horizon National Corp. | | | 72,035 | | | | 679,290 | |
First Republic Bank | | | 18,571 | | | | 2,025,353 | |
JPMorgan Chase & Co. | | | 286,674 | | | | 27,598,106 | |
Wells Fargo & Co. | | | 976,883 | | | | 22,966,519 | |
Zions Bancorp NA | | | 29,672 | | | | 867,016 | |
| | | | | | | | |
| | |
| | | | | | 81,996,542 | |
| | |
| Beverages — 1.7% | | | | | | |
Molson Coors Beverage Co., Class B | | | 107,954 | | | | 3,622,936 | |
PepsiCo, Inc. | | | 420,284 | | | | 58,251,363 | |
| | | | | | | | |
| | |
| | | | | | 61,874,299 | |
| | |
| Biotechnology — 3.4% | | | | | | |
AbbVie, Inc. | | | 450,302 | | | | 39,441,952 | |
Amgen, Inc. | | | 102,974 | | | | 26,171,872 | |
Biogen, Inc.(a) | | | 41,114 | | | | 11,663,220 | |
Gilead Sciences, Inc. | | | 559,320 | | | | 35,343,431 | |
Immunomedics, Inc.(a) | | | 23,321 | | | | 1,982,985 | |
Moderna, Inc.(a) | | | 30,935 | | | | 2,188,651 | |
Regeneron Pharmaceuticals, Inc.(a) | | | 11,171 | | | | 6,253,302 | |
Vertex Pharmaceuticals, Inc.(a) | | | 9,404 | | | | 2,559,016 | |
| | | | | | | | |
| | |
| | | | | | 125,604,429 | |
| | |
| Building Products — 0.6% | | | | | | |
Allegion PLC | | | 229,158 | | | | 22,666,018 | |
Lennox International, Inc. | | | 1,632 | | | | 444,900 | |
Masco Corp. | | | 8,257 | | | | 455,208 | |
| | | | | | | | |
| | |
| | | | | | 23,566,126 | |
| | |
| Capital Markets — 3.6% | | | | | | |
Affiliated Managers Group, Inc. | | | 22,768 | | | | 1,556,876 | |
Ameriprise Financial, Inc. | | | 7,210 | | | | 1,111,133 | |
Bank of New York Mellon Corp. | | | 32,799 | | | | 1,126,318 | |
Cboe Global Markets, Inc. | | | 60,284 | | | | 5,289,318 | |
Charles Schwab Corp. | | | 626,538 | | | | 22,699,472 | |
CME Group, Inc. | | | 52,802 | | | | 8,834,303 | |
Evercore, Inc., Class A | | | 11,637 | | | | 761,758 | |
FactSet Research Systems, Inc. | | | 34,199 | | | | 11,452,561 | |
Intercontinental Exchange, Inc. | | | 123,781 | | | | 12,384,289 | |
| | | | | | | | |
| Security | | Shares | | | Value | |
| | |
| Capital Markets (continued) | | | | | | |
Invesco Ltd. | | | 95,548 | | | $ | 1,090,203 | |
MarketAxess Holdings, Inc. | | | 1,123 | | | | 540,826 | |
Moody’s Corp. | | | 96,792 | | | | 28,055,161 | |
Morgan Stanley | | | 75,909 | | | | 3,670,200 | |
S&P Global, Inc. | | | 88,934 | | | | 32,069,600 | |
State Street Corp. | | | 12,210 | | | | 724,419 | |
T Rowe Price Group, Inc. | | | 8,042 | | | | 1,031,145 | |
TD Ameritrade Holding Corp. | | | 31,063 | | | | 1,216,116 | |
| | | | | | | | |
| | |
| | | | | | 133,613,698 | |
| | |
| Chemicals — 2.0% | | | | | | |
Air Products & Chemicals, Inc. | | | 43,298 | | | | 12,896,742 | |
Ecolab, Inc. | | | 175,244 | | | | 35,020,761 | |
FMC Corp. | | | 11,748 | | | | 1,244,230 | |
Mosaic Co. | | | 141,047 | | | | 2,576,929 | |
PPG Industries, Inc. | | | 96,988 | | | | 11,840,295 | |
Sherwin-Williams Co. | | | 15,474 | | | | 10,781,355 | |
| | | | | | | | |
| | |
| | | | | | 74,360,312 | |
| | |
| Commercial Services & Supplies — 0.3% | | | | | | |
Cintas Corp. | | | 28,537 | | | | 9,497,970 | |
Copart, Inc.(a) | | | 28,453 | | | | 2,992,117 | |
| | | | | | | | |
| | |
| | | | | | 12,490,087 | |
| | |
| Communications Equipment — 1.3% | | | | | | |
Cisco Systems, Inc. | | | 1,199,682 | | | | 47,255,474 | |
InterDigital, Inc. | | | 9 | | | | 514 | |
| | | | | | | | |
| | |
| | | | | | 47,255,988 | |
| | |
| Construction & Engineering — 0.1% | | | | | | |
EMCOR Group, Inc. | | | 27,717 | | | | 1,876,718 | |
MasTec, Inc.(a) | | | 88,204 | | | | 3,722,209 | |
| | | | | | | | |
| | |
| | | | | | 5,598,927 | |
| | |
| Consumer Finance — 0.6% | | | | | | |
Ally Financial, Inc. | | | 355,412 | | | | 8,910,179 | |
American Express Co. | | | 113,923 | | | | 11,420,781 | |
Capital One Financial Corp. | | | 13,774 | | | | 989,799 | |
| | | | | | | | |
| | |
| | | | | | 21,320,759 | |
| | |
| Distributors — 0.2% | | | | | | |
Genuine Parts Co. | | | 60,666 | | | | 5,773,583 | |
| | | | | | | | |
| | |
| Diversified Consumer Services — 0.2% | | | | | | |
Bright Horizons Family Solutions, Inc.(a) | | | 26,594 | | | | 4,043,352 | |
H&R Block, Inc. | | | 264,275 | | | | 4,305,040 | |
| | | | | | | | |
| | |
| | | | | | 8,348,392 | |
| | |
| Diversified Financial Services — 1.2% | | | | | | |
Berkshire Hathaway, Inc., Class B(a) | | | 207,253 | | | | 44,132,454 | |
| | | | | | | | |
|
| Diversified Telecommunication Services — 0.9% | |
AT&T Inc. | | | 436,384 | | | | 12,441,308 | |
CenturyLink, Inc. | | | 474,332 | | | | 4,786,010 | |
Verizon Communications, Inc. | | | 284,754 | | | | 16,940,015 | |
| | | | | | | | |
| | |
| | | | | | 34,167,333 | |
| | |
| Electric Utilities — 1.6% | | | | | | |
Alliant Energy Corp. | | | 43,721 | | | | 2,258,190 | |
Eversource Energy | | | 178,475 | | | | 14,911,586 | |
IDACORP, Inc. | | | 71,247 | | | | 5,692,635 | |
NextEra Energy, Inc. | | | 71,298 | | | | 19,789,473 | |
Pinnacle West Capital Corp. | | | 60,228 | | | | 4,489,997 | |
Xcel Energy, Inc. | | | 177,956 | | | | 12,280,744 | |
| | | | | | | | |
| | |
| | | | | | 59,422,625 | |
| | |
| 34 | | 2 0 2 0 B L A C K R O C K A N N U A L R E P O R T T O S H A R E H O L D E R S |
| | |
Schedule of Investments (continued) September 30, 2020 | | Master Advantage Large Cap Core Portfolio (Percentages shown are based on Net Assets) |
| | | | | | | | |
| Security | | Shares | | | Value | |
| | |
| Electrical Equipment — 0.7% | | | | | | |
AMETEK, Inc. | | | 179,584 | | | $ | 17,850,650 | |
Hubbell, Inc. | | | 70,680 | | | | 9,671,851 | |
| | | | | | | | |
| | |
| | | | | | 27,522,501 | |
|
| Electronic Equipment, Instruments & Components — 0.4% | |
Avnet, Inc. | | | 32,158 | | | | 830,963 | |
National Instruments Corp. | | | 338,689 | | | | 12,091,197 | |
Zebra Technologies Corp., Class A(a) | | | 3,065 | | | | 773,790 | |
| | | | | | | | |
| | |
| | | | | | 13,695,950 | |
| | |
| Energy Equipment & Services — 0.2% | | | | | | |
Baker Hughes Co. | | | 89,590 | | | | 1,190,651 | |
ChampionX Corp.(a) | | | 195,679 | | | | 1,563,475 | |
Schlumberger NV | | | 165,352 | | | | 2,572,877 | |
TechnipFMC PLC | | | 252,800 | | | | 1,595,168 | |
| | | | | | | | |
| | |
| | | | | | 6,922,171 | |
| | |
| Entertainment — 1.5% | | | | | | |
Activision Blizzard, Inc. | | | 160,044 | | | | 12,955,562 | |
Electronic Arts, Inc.(a) | | | 9,349 | | | | 1,219,203 | |
Netflix, Inc.(a) | | | 57,280 | | | | 28,641,718 | |
Roku, Inc.(a) | | | 24,237 | | | | 4,575,946 | |
Walt Disney Co. | | | 49,808 | | | | 6,180,177 | |
| | | | | | | | |
| | |
| | | | | | 53,572,606 | |
|
| Equity Real Estate Investment Trusts (REITs) — 2.6% | |
Alexandria Real Estate Equities, Inc. | | | 28,519 | | | | 4,563,040 | |
American Tower Corp. | | | 75,772 | | | | 18,316,366 | |
AvalonBay Communities, Inc. | | | 20,171 | | | | 3,012,337 | |
Boston Properties, Inc. | | | 78,480 | | | | 6,301,944 | |
Camden Property Trust | | | 4,596 | | | | 408,952 | |
Equity Residential | | | 154,325 | | | | 7,921,502 | |
Lamar Advertising Co., Class A | | | 16,079 | | | | 1,063,947 | |
Macerich Co.(b) | | | 181,107 | | | | 1,229,717 | |
Outfront Media, Inc. | | | 172,282 | | | | 2,506,703 | |
Park Hotels & Resorts, Inc. | | | 258,162 | | | | 2,579,038 | |
Prologis, Inc. | | | 473,848 | | | | 47,678,586 | |
RLJ Lodging Trust | | | 73 | | | | 632 | |
UDR, Inc. | | | 21,167 | | | | 690,256 | |
| | | | | | | | |
| | |
| | | | | | 96,273,020 | |
| | |
| Food & Staples Retailing — 1.3% | | | | | | |
Costco Wholesale Corp. | | | 136,574 | | | | 48,483,770 | |
| | | | | | | | |
| | |
| Food Products — 1.9% | | | | | | |
General Mills, Inc. | | | 413,028 | | | | 25,475,567 | |
Hershey Co. | | | 180,205 | | | | 25,830,585 | |
Hormel Foods Corp. | | | 66,717 | | | | 3,261,794 | |
McCormick & Co., Inc. | | | 80,053 | | | | 15,538,287 | |
| | | | | | | | |
| | |
| | | | | | 70,106,233 | |
| | |
| Gas Utilities — 0.2% | | | | | | |
Southwest Gas Holdings, Inc. | | | 74,263 | | | | 4,685,995 | |
UGI Corp. | | | 38,406 | | | | 1,266,630 | |
| | | | | | | | |
| | |
| | | | | | 5,952,625 | |
| | |
| Health Care Equipment & Supplies — 3.0% | | | | | | |
Abbott Laboratories | | | 210,092 | | | | 22,864,312 | |
DENTSPLY SIRONA, Inc. | | | 42,171 | | | | 1,844,138 | |
DexCom, Inc.(a) | | | 27,569 | | | | 11,364,769 | |
Edwards Lifesciences Corp.(a) | | | 292,375 | | | | 23,337,372 | |
Hologic, Inc.(a) | | | 144,017 | | | | 9,572,810 | |
IDEXX Laboratories, Inc.(a) | | | 29,273 | | | | 11,507,509 | |
Medtronic PLC | | | 94,102 | | | | 9,779,080 | |
Quidel Corp.(a) | | | 4,347 | | | | 953,645 | |
| | | | | | | | |
| Security | | Shares | | | Value | |
|
| Health Care Equipment & Supplies (continued) | |
Stryker Corp. | | | 93,196 | | | $ | 19,419,251 | |
West Pharmaceutical Services, Inc. | | | 1,827 | | | | 502,242 | |
| | | | | | | | |
| | |
| | | | | | 111,145,128 | |
| | |
| Health Care Providers & Services — 2.1% | | | | | | |
1Life Healthcare, Inc.(a) | | | 22,866 | | | | 648,480 | |
AmerisourceBergen Corp. | | | 30,547 | | | | 2,960,615 | |
Anthem, Inc. | | | 60,105 | | | | 16,143,602 | |
Cardinal Health, Inc. | | | 16,823 | | | | 789,840 | |
Cigna Corp. | | | 34,323 | | | | 5,814,659 | |
CVS Health Corp. | | | 130,324 | | | | 7,610,922 | |
HCA Healthcare, Inc. | | | 24,774 | | | | 3,088,822 | |
McKesson Corp. | | | 90,693 | | | | 13,506,908 | |
Quest Diagnostics, Inc. | | | 14,140 | | | | 1,618,889 | |
UnitedHealth Group, Inc. | | | 81,383 | | | | 25,372,778 | |
| | | | | | | | |
| | |
| | | | | | 77,555,515 | |
| | |
| Health Care Technology — 0.9% | | | | | | |
Teladoc Health, Inc.(a)(b) | | | 84,347 | | | | 18,492,236 | |
Veeva Systems, Inc., Class A(a) | | | 46,372 | | | | 13,039,343 | |
| | | | | | | | |
| | |
| | | | | | 31,531,579 | |
| | |
| Hotels, Restaurants & Leisure — 1.1% | | | | | | |
Caesars Entertainment, Inc.(a) | | | 88,400 | | | | 4,955,704 | |
Chipotle Mexican Grill, Inc.(a) | | | 1,862 | | | | 2,315,788 | |
Choice Hotels International, Inc. | | | 26,464 | | | | 2,274,845 | |
Darden Restaurants, Inc. | | | 27,242 | | | | 2,744,359 | |
Domino’s Pizza, Inc. | | | 3,378 | | | | 1,436,596 | |
Dunkin’ Brands Group, Inc. | | | 20,973 | | | | 1,717,898 | |
Extended Stay America, Inc. | | | 441,807 | | | | 5,279,594 | |
MGM Resorts International | | | 66,325 | | | | 1,442,569 | |
Penn National Gaming, Inc.(a) | | | 52,451 | | | | 3,813,188 | |
Six Flags Entertainment Corp. | | | 116,473 | | | | 2,364,402 | |
Texas Roadhouse, Inc. | | | 53,996 | | | | 3,282,417 | |
Vail Resorts, Inc. | | | 28,567 | | | | 6,112,481 | |
Wyndham Destinations, Inc. | | | 132,533 | | | | 4,076,715 | |
| | | | | | | | |
| | |
| | | | | | 41,816,556 | |
| | |
| Household Products — 2.3% | | | | | | |
Church & Dwight Co., Inc. | | | 108,284 | | | | 10,147,294 | |
Clorox Co. | | | 171,336 | | | | 36,009,687 | |
Colgate-Palmolive Co. | | | 174,808 | | | | 13,486,437 | |
Procter & Gamble Co. | | | 184,309 | | | | 25,617,108 | |
| | | | | | | | |
| | |
| | | | | | 85,260,526 | |
| | |
| Industrial Conglomerates — 1.0% | | | | | | |
3M Co. | | | 23,598 | | | | 3,779,928 | |
Honeywell International, Inc. | | | 136,908 | | | | 22,536,426 | |
Roper Technologies, Inc. | | | 26,728 | | | | 10,560,500 | |
| | | | | | | | |
| | |
| | | | | | 36,876,854 | |
| | |
| Insurance — 1.8% | | | | | | |
Aflac, Inc. | | | 74,768 | | | | 2,717,817 | |
Allstate Corp. | | | 23,990 | | | | 2,258,419 | |
Arthur J. Gallagher & Co. | | | 56,763 | | | | 5,993,038 | |
Athene Holding Ltd., Class A(a) | | | 51,993 | | | | 1,771,921 | |
Brighthouse Financial, Inc.(a) | | | 1,324 | | | | 35,629 | |
Brown & Brown, Inc. | | | 25,271 | | | | 1,144,018 | |
Cincinnati Financial Corp. | | | 187,675 | | | | 14,633,020 | |
First American Financial Corp. | | | 101,255 | | | | 5,154,892 | |
Globe Life, Inc. | | | 58,954 | | | | 4,710,425 | |
Lincoln National Corp. | | | 112,344 | | | | 3,519,737 | |
Marsh & McLennan Cos., Inc. | | | 60,533 | | | | 6,943,135 | |
MetLife, Inc. | | | 62,972 | | | | 2,340,669 | |
Progressive Corp. | | | 8,252 | | | | 781,217 | |
Prudential Financial, Inc. | | | 77,405 | | | | 4,916,766 | |
| | |
S C H E D U L E O F I N V E S T M E N T S | | 35 |
| | |
Schedule of Investments (continued) September 30, 2020 | | Master Advantage Large Cap Core Portfolio (Percentages shown are based on Net Assets) |
| | | | | | | | |
| Security | | Shares | | | Value | |
| | |
| Insurance (continued) | | | | | | |
Travelers Cos., Inc. | | | 19,379 | | | $ | 2,096,614 | |
Unum Group | | | 156,134 | | | | 2,627,735 | |
Willis Towers Watson PLC | | | 14,303 | | | | 2,986,752 | |
| | | | | | | | |
| | |
| | | | | | 64,631,804 | |
| | |
| Interactive Media & Services — 5.0% | | | | | | |
Alphabet, Inc., Class A(a) | | | 48,613 | | | | 71,247,213 | |
Alphabet, Inc., Class C(a) | | | 33,629 | | | | 49,421,178 | |
Facebook, Inc., Class A(a) | | | 118,559 | | | | 31,050,602 | |
Twitter, Inc.(a) | | | 689,507 | | | | 30,683,062 | |
| | | | | | | | |
| | |
| | | | | | 182,402,055 | |
|
| Internet & Direct Marketing Retail — 4.6% | |
Amazon.com, Inc.(a) | | | 50,215 | | | | 158,113,477 | |
Etsy, Inc.(a) | | | 22,945 | | | | 2,790,800 | |
Grubhub, Inc.(a) | | | 10,411 | | | | 753,028 | |
Wayfair, Inc., Class A(a)(b) | | | 28,179 | | | | 8,200,371 | |
| | | | | | | | |
| | |
| | | | | | 169,857,676 | |
| | |
| IT Services — 5.2% | | | | | | |
Accenture PLC, Class A | | | 15,810 | | | | 3,572,902 | |
Amdocs Ltd. | | | 39,396 | | | | 2,261,724 | |
Automatic Data Processing, Inc. | | | 162,940 | | | | 22,728,501 | |
Fiserv, Inc.(a) | | | 115,635 | | | | 11,916,187 | |
GoDaddy, Inc., Class A(a) | | | 10,911 | | | | 828,909 | |
Mastercard, Inc., Class A | | | 104,323 | | | | 35,278,909 | |
Paychex, Inc. | | | 81,460 | | | | 6,498,064 | |
PayPal Holdings, Inc.(a) | | | 336,415 | | | | 66,283,847 | |
Visa, Inc., Class A | | | 215,439 | | | | 43,081,337 | |
| | | | | | | | |
| | |
| | | | | | 192,450,380 | |
|
| Life Sciences Tools & Services — 0.1% | |
Adaptive Biotechnologies Corp.(a) | | | 8,106 | | | | 394,195 | |
Agilent Technologies, Inc. | | | 19,217 | | | | 1,939,764 | |
Thermo Fisher Scientific, Inc. | | | 6,370 | | | | 2,812,482 | |
| | | | | | | | |
| | |
| | | | | | 5,146,441 | |
| | |
| Machinery — 2.6% | | | | | | |
AGCO Corp. | | | 24,513 | | | | 1,820,581 | |
Deere & .Co. | | | 136,611 | | | | 30,277,096 | |
Fortive .Corp | | | 36,970 | | | | 2,817,484 | |
Illinois Tool Works, Inc. | | | 36,049 | | | | 6,965,027 | |
Oshkosh Corp. | | | 192,489 | | | | 14,147,941 | |
PACCAR, Inc. | | | 189,068 | | | | 16,123,719 | |
Snap-on, Inc. | | | 39,268 | | | | 5,777,501 | |
Xylem, Inc. | | | 196,776 | | | | 16,552,797 | |
| | | | | | | | |
| | |
| | | | | | 94,482,146 | |
| | |
| Media — 2.0% | | | | | | |
AMC Networks, Inc., Class A(a) | | | 89,272 | | | | 2,205,911 | |
Comcast Corp., Class A | | | 290,545 | | | | 13,440,612 | |
Discovery, Inc., Class A(a)(b) | | | 1,047,816 | | | | 22,810,954 | |
Discovery, Inc., Class C(a) | | | 37,115 | | | | 727,454 | |
Interpublic Group of Cos., Inc. | | | 942,393 | | | | 15,709,691 | |
Sirius XM Holdings, Inc. | | | 2,840,592 | | | | 15,225,573 | |
ViacomCBS, Inc., Class B | | | 101,357 | | | | 2,839,010 | |
| | | | | | | | |
| | |
| | | | | | 72,959,205 | |
| | |
| Metals & Mining — 0.1% | | | | | | |
Reliance Steel & Aluminum Co. | | | 36,451 | | | | 3,719,460 | |
| | | | | | | | |
| | |
| Multiline Retail — 0.3% | | | | | | |
Kohl’s Corp. | | | 247,214 | | | | 4,580,875 | |
Nordstrom, Inc.(b) | | | 419,381 | | | | 4,999,022 | |
| | | | | | | | |
| | |
| | | | | | | 9,579,897 | |
| | | | | | | | |
| Security | | Shares | | | Value | |
| | |
| Multi-Utilities — 1.0% | | | | | | |
Ameren Corp. | | | 90,727 | | | $ | 7,174,691 | |
Avista Corp. | | | 10,700 | | | | 365,084 | |
CMS Energy Corp. | | | 275,770 | | | | 16,935,036 | |
Consolidated Edison, Inc. | | | 152,291 | | | | 11,848,240 | |
| | | | | | | | |
| | |
| | | | | | 36,323,051 | |
| | |
| Oil, Gas & Consumable Fuels — 1.7% | | | | | | |
Chevron Corp. | | | 139,005 | | | | 10,008,360 | |
Concho Resources, Inc. | | | 19,378 | | | | 854,957 | |
ConocoPhillips | | | 307,341 | | | | 10,093,078 | |
Continental Resources, Inc. | | | 234,958 | | | | 2,885,284 | |
EOG Resources, Inc. | | | 314,258 | | | | 11,294,433 | |
Hess Corp. | | | 46,443 | | | | 1,900,912 | |
Marathon Oil Corp. | | | 837,899 | | | | 3,427,007 | |
ONEOK, Inc. | | | 12,734 | | | | 330,829 | |
Phillips 66 | | | 41,071 | | | | 2,129,121 | |
Pioneer Natural Resources Co. | | | 13,265 | | | | 1,140,657 | |
Suncor Energy, Inc. | | | 193,322 | | | | 2,364,328 | |
Valero Energy Corp. | | | 139,252 | | | | 6,032,397 | |
Williams Cos., Inc. | | | 439,004 | | | | 8,626,429 | |
| | | | | | | | |
| | |
| | | | | | 61,087,792 | |
| | |
| Paper & Forest Products — 0.0% | | | | | | |
Domtar Corp. | | | 59,005 | | | | 1,550,061 | |
| | | | | | | | |
| | |
| Personal Products — 0.0% | | | | | | |
Coty, Inc., Class A | | | 240,676 | | | | 649,825 | |
| | | | | | | | |
| | |
| Pharmaceuticals — 3.9% | | | | | | |
Bristol-Myers Squibb Co. | | | 197,444 | | | | 11,903,899 | |
Catalent, Inc.(a) | | | 17,609 | | | | 1,508,387 | |
Johnson & Johnson | | | 301,053 | | | | 44,820,770 | |
Merck & Co., Inc. | | | 480,601 | | | | 39,865,853 | |
Mylan NV(a) | | | 62,424 | | | | 925,748 | |
Pfizer, Inc. | | | 639,109 | | | | 23,455,300 | |
Zoetis, Inc. | | | 130,927 | | | | 21,651,398 | |
| | | | | | | | |
| | |
| | | | | | 144,131,355 | |
| | |
| Professional Services — 0.4% | | | | | | |
IHS Markit Ltd. | | | 62,610 | | | | 4,915,511 | |
Robert Half International, Inc. | | | 148,154 | | | | 7,843,273 | |
Verisk Analytics, Inc. | | | 16,203 | | | | 3,002,578 | |
| | | | | | | | |
| | |
| | | | | | 15,761,362 | |
| | |
| Road & Rail — 0.5% | | | | | | |
CSX Corp. | | | 79,951 | | | | 6,209,794 | |
Landstar System, Inc. | | | 68,775 | | | | 8,630,575 | |
Lyft, Inc., Class A(a) | | | 26,372 | | | | 726,548 | |
Old Dominion Freight Line, Inc. | | | 15,927 | | | | 2,881,513 | |
| | | | | | | | |
| | |
| | | | | | 18,448,430 | |
|
| Semiconductors & Semiconductor Equipment — 4.9% | |
Analog Devices, Inc. | | | 73,935 | | | | 8,631,172 | |
Applied Materials, Inc. | | | 436,676 | | | | 25,960,388 | |
Cirrus Logic, Inc.(a) | | | 127,387 | | | | 8,592,253 | |
Intel Corp. | | | 1,020,234 | | | | 52,827,716 | |
NVIDIA Corp. | | | 140,880 | | | | 76,247,074 | |
Texas Instruments, Inc. | | | 54,672 | | | | 7,806,615 | |
| | | | | | | | |
| | |
| | | | | | 180,065,218 | |
| | |
| Software — 10.2% | | | | | | |
Adobe, Inc.(a) | | | 74,171 | | | | 36,375,684 | |
Cadence Design Systems, Inc.(a) | | | 14,508 | | | | 1,546,988 | |
HubSpot, Inc.(a)(b) | | | 15,432 | | | | 4,509,693 | |
Intuit, Inc. | | | 54,994 | | | | 17,939,593 | |
Microsoft Corp. | | | 1,038,685 | | | | 218,466,616 | |
RingCentral, Inc., Class A(a) | | | 8,426 | | | | 2,313,864 | |
| | |
| 36 | | 2 0 2 0 B L A C K R O C K A N N U A L R E P O R T T O S H A R E H O L D E R S |
| | |
Schedule of Investments (continued) September 30, 2020 | | Master Advantage Large Cap Core Portfolio (Percentages shown are based on Net Assets) |
| | | | | | | | |
| Security | | Shares | | | Value | |
| | |
| Software (continued) | | | | | | |
salesforce.com, Inc.(a) | | | 256,586 | | | $ | 64,485,193 | |
ServiceNow, Inc.(a) | | | 25,519 | | | | 12,376,715 | |
VMware, Inc., Class A(a) | | | 97,123 | | | | 13,953,661 | |
Zendesk, Inc.(a) | | | 24,315 | | | | 2,502,500 | |
| | | | | | | | |
| | |
| | | | | | 374,470,507 | |
| | |
| Specialty Retail — 3.1% | | | | | | |
Best Buy Co., Inc. | | | 43,212 | | | | 4,809,063 | |
Five Below, Inc.(a) | | | 49,866 | | | | 6,332,982 | |
Foot Locker, Inc. | | | 157,903 | | | | 5,215,536 | |
Gap, Inc. | | | 34,298 | | | | 584,095 | |
Home Depot, Inc. | | | 209,012 | | | | 58,044,723 | |
Lowe’s Cos., Inc. | | | 163,921 | | | | 27,187,937 | |
TJX Cos., Inc. | | | 222,927 | | | | 12,405,888 | |
| | | | | | | | |
| | |
| | | | | | 114,580,224 | |
|
| Technology Hardware, Storage & Peripherals — 5.3% | |
Apple Inc. | | | 1,547,055 | | | | 179,164,440 | |
Hewlett Packard Enterprise Co. | | | 794,050 | | | | 7,440,248 | |
HP, Inc. | | | 162,161 | | | | 3,079,437 | |
NetApp, Inc. | | | 100,209 | | | | 4,393,163 | |
| | | | | | | | |
| | |
| | | | | | 194,077,288 | |
| | |
| Textiles, Apparel & Luxury Goods — 1.4% | | | | | | |
Lululemon Athletica, Inc.(a) | | | 70,103 | | | | 23,089,825 | |
NIKE, Inc., Class B | | | 168,068 | | | | 21,099,257 | |
Ralph Lauren Corp. | | | 114,844 | | | | 7,805,947 | |
| | | | | | | | |
| | |
| | | | | | 51,995,029 | |
| | |
| Thrifts & Mortgage Finance — 0.0% | | | | | | |
MGIC Investment Corp. | | | 118,973 | | | | 1,054,101 | |
New York Community Bancorp, Inc. | | | 43,102 | | | | 356,453 | |
| | | | | | | | |
| | |
| | | | | | 1,410,554 | |
|
| Trading Companies & Distributors — 0.5% | |
Fastenal Co. | | | 20,880 | | | | 941,479 | |
GATX Corp. | | | 123,704 | | | | 7,886,130 | |
WW Grainger, Inc. | | | 28,777 | | | | 10,266,770 | |
| | | | | | | | |
| | |
| | | | | | 19,094,379 | |
| | |
| Water Utilities — 0.3% | | | | | | |
American Water Works Co., Inc. | | | 66,461 | | | | 9,628,870 | |
| | | | | | | | |
| | | | | | | | |
| Security | | Shares | | | Value | |
|
| Wireless Telecommunication Services — 0.3% | |
Telephone & Data Systems, Inc. | | | 339,724 | | | $ | 6,264,510 | |
United States Cellular Corp.(a) | | | 127,790 | | | | 3,773,639 | |
| | | | | | | | |
| | |
| | | | | | 10,038,149 | |
| | | | | | | | |
| | |
Total Common Stocks — 96.8%
(Cost: $2,808,174,735) | | | | | | | 3,566,179,351 | |
| | | | | | | | |
| | |
Rights | | | | | | | | |
| | |
| Pharmaceuticals — 0.0% | | | | | | |
Bristol-Myers Squibb Co., CVR(a) | | | 87,067 | | | | 195,901 | |
| | | | | | | | |
| | |
Total Rights — 0.0%
(Cost: $200,254) | | | | | | | 195,901 | |
| | | | | | | | |
| | |
Total Long-Term Investments — 96.8%
(Cost: $2,808,374,989) | | | | | | | 3,566,375,252 | |
| | | | | | | | |
| | |
Short-Term Securities(c)(d) | | | | | | | | |
| | |
| Money Market Funds — 3.6% | | | | | | |
BlackRock Liquidity Funds, T-Fund, Institutional Class, 0.02% | | | 109,976,399 | | | | 109,976,399 | |
SL Liquidity Series, LLC, Money Market Series, 0.25%(e) | | | 22,232,426 | | | | 22,241,319 | |
| | | | | | | | |
| |
Total Short-Term Securities — 3.6%
(Cost: $132,209,739) | | | | 132,217,718 | |
| | | | | | | | |
| | |
Total Investments — 100.4%
(Cost: $2,940,584,728) | | | | | | | 3,698,592,970 | |
| |
Liabilities in Excess of Other Assets — (0.4)% | | | | (16,098,665 | ) |
| | | | | | | | |
| | |
Net Assets — 100.0% | | | | | | $ | 3,682,494,305 | |
| | | | | | | | |
| (a) | Non-income producing security. |
| (b) | All or a portion of this security is on loan. |
| (c) | Affiliate of the Master Portfolio. |
| (d) | Annualized 7-day yield as of period end. |
| (e) | All or a portion of this security was purchased with the cash collateral from loaned securities. |
Affiliates
Investments in issuers considered to be affiliate(s) of the Master Portfolio during the year ended September 30, 2020 for purposes of Section 2(a)(3) of the Investment Company Act of 1940, as amended, were as follows:
| | | | | | | | | | | | | | | | | | | | | | | | | | | | | | | | | | | | | | | | | | | | | | | | | | | | | | | | |
| | | |
| | | Affiliated Issuer | | Value at 09/30/19 | | | Purchases at Cost | | | Proceeds
from Sale | | | Net Realized Gain (Loss) | | | Change in
Unrealized
Appreciation
(Depreciation) | | | | | | Value at
09/30/20 | | | Shares Held at 09/30/20 | | | | | Income | | | Capital Gain
Distributions from Underlying Funds | |
| | | |
| | BlackRock Liquidity Funds, T-Fund, Institutional Class | | $ | 38,261,121 | | | $ | 71,715,278 | (a) | | | $— | | | | | | | | $ — | | | | | | | | $ — | | | | | | | $ | 109,976,399 | | | | 109,976,399 | | | | | $ | 300,569 | | | | | | | | $ 69 | |
| | SL Liquidity Series, LLC, Money Market Series | | | 9,761,844 | | | | 12,497,366 | (a) | | | — | | | | | | | | (25,678 | ) | | | | | | | 7,787 | | | | | | | | 22,241,319 | | | | 22,232,426 | | | | | | 251,417 | (b) | | | | | | | — | |
| | | | | | | | | | | | | | | | | | | | | | | | | | | | | | | | | | | | | | | | | | | | | | | | | | | | | | | | |
| | | | | | | | | | | | | | | | | | | | $ | (25,678 | ) | | | | | | $ | 7,787 | | | | | | | $ | 132,217,718 | | | | | | | | | $ | 551,986 | | | | | | | | $ 69 | |
| | | | | | | | | | | | | | | | | | | | | | | | | | | | | | | | | | | | | | | | | | | | | | | | | | | | | | | | |
| | (a) | Represents net amount purchased (sold). | |
| | (b) | All or a portion represents securities lending income earned from the reinvestment of cash collateral from loaned securities, net of fees and collateral investment expenses, and other payments to and from borrowers of securities. | |
For Master Portfolio compliance purposes, the Master Portfolio’s industry classifications refer to one or more of the industry sub-classifications used by one or more widely recognized market indexes or rating group indexes, and/or as defined by the investment adviser. These definitions may not apply for purposes of this report, which may combine such industry sub-classifications for reporting ease.
| | |
S C H E D U L E O F I N V E S T M E N T S | | 37 |
| | |
Schedule of Investments (continued) September 30, 2020 | | Master Advantage Large Cap Core Portfolio |
Derivative Financial Instruments Outstanding as of Period End
Futures Contracts
| | | | | | | | | | | | | | | | | | | | |
| |
| | | | |
| Description | | Number of
Contracts | | | Expiration
Date | | | Notional
Amount
(000) | | | Value/
Unrealized
Appreciation
(Depreciation) | |
| |
| | | | | |
Long Contracts | | | | | | | | | | | | | | | | | | | | |
S&P 500 E-Mini Index | | | 713 | | | | 12/18/20 | | | | $ 119,499 | | | | | | | | $ (610,259 | ) |
| | | | | | | | | | | | | | | | | | | | |
| | | | | | | | | | | | | | | | | | | | |
Derivative Financial Instruments Categorized by Risk Exposure
As of period end, the fair values of derivative financial instruments located in the Statement of Assets and Liabilities were as follows:
| | | | | | | | | | | | | | | | | | | | | | | | | | | | | | | | | | | | | | | | | | | | |
|
| | | | | | | | | | | | |
| | | Commodity
Contracts | | | | Credit Contracts | | | | Equity
Contracts | | | | Foreign
Currency
Exchange
Contracts | | | | Interest
Rate
Contracts | | Other
Contracts | | | | | Total |
|
| | | | | | | | | | | | | | | | | |
Liabilities — Derivative Financial Instruments | | | | | | | | | | | | | | | | | | | | | | | | | | | | | | | | | | | | | | | | | | | | |
Futures contracts | | | | | | | | | | | | | | | | | | | | | | | | | | | | | | | | | | | | | | | | | | | | |
Unrealized depreciation(a) | | | | | | $— | | | | | | | | $— | | | | $610,259 | | | | | | $— | | | | | | | | $— | | | | | | $— | | | | | | $610,259 |
| | | | | | | | | | | | | | | | | | | | | | | | | | | | | | | | | | | | | | | | | | | | |
| | (a) | Net cumulative unrealized appreciation (depreciation) on futures contracts, if any, are reported in the Schedule of Investments. In the Statement of Assets and Liabilities, only current day’s variation margin is reported in receivables or payables and the net cumulative unrealized appreciation (depreciation) is included in accumulated earnings (loss). | |
For the year ended September 30, 2020, the effect of derivative financial instruments in the Statement of Operations was as follows:
| | | | | | | | | | | | | | | | | | | | | | | | | | | | | | | | | | | | | | | | | | | | |
| |
| | | | | | | | | |
| | | Commodity
Contracts | | Credit
Contracts | | | | Equity
Contracts | | | Foreign
Currency
Exchange
Contracts | | Interest
Rate
Contracts | | Other
Contracts | | | | | Total | |
| |
| | | | | | | | | | | | | | |
Net Realized Gain (Loss) from | | | | | | | | | | | | | | | | | | | | | | | | | | | | | | | | | | | | | | | | | | | | |
Futures contracts | | | �� | | | $ — | | | | | | $ — | | | | | $22,410,677 | | | | | | | $ — | | | | | | $ — | | | | | | $ — | | | | | | | $22,410,677 | |
| | | | | | | | | | | | | | | | | | | | | | | | | | | | | | | | | | | | | | | | | | | | |
| | | | | | | | | | | | | | |
Net Change in Unrealized Appreciation (Depreciation) on | | | | | | | | | | | | | | | | | | | | | | | | | | | | | | | | | | | | | | | | | | | | |
Futures contracts | | | | | | $ — | | | | | | $ — | | | | | $ (253,441 | ) | | | | | | $ — | | | | | | $ — | | | | | | $ — | | | | | | | $ (253,441 | ) |
| | | | | | | | | | | | | | | | | | | | | | | | | | | | | | | | | | | | | | | | | | | | |
Average Quarterly Balances of Outstanding Derivative Financial Instruments
| | | | |
Futures contracts | | | | |
Average notional value of contracts — long | | | $92,103,945 | |
For more information about the Master Portfolio’s investment risks regarding derivative financial instruments, refer to the Notes to Financial Statements.
| | |
| 38 | | 2 0 2 0 B L A C K R O C K A N N U A L R E P O R T T O S H A R E H O L D E R S |
| | |
Schedule of Investments (continued) September 30, 2020 | | Master Advantage Large Cap Core Portfolio |
Fair Value Hierarchy as of Period End
Various inputs are used in determining the fair value of financial instruments. For description of the input levels and information about the Master Portfolio’s policy regarding valuation of financial instruments, refer to the Notes to Financial Statements.
The following tables summarize the Master Portfolio’s investments and derivative financial instruments categorized in the disclosure hierarchy. The breakdown of the Master Portfolio’s investments into major categories is disclosed in the Schedule of Investments above.
| | | | | | | | | | | | | | | | |
|
| | | | | |
| | | Level 1 | | Level 2 | | Level 3 | | | | | Total |
|
| | | | | | | |
Assets | | | | | | | | | | | | | | | | |
Investments | | | | | | | | | | | | | | | | |
Long-Term Investments | | | | | | | | | | | | | | | | |
Common Stocks | | $3,566,179,351 | | | | $ — | | | | $ — | | | | | | $3,566,179,351 |
Rights | | 195,901 | | | | — | | | | — | | | | | | 195,901 |
Short-Term Securities | | | | | | | | | | | | | | | | |
Money Market Funds | | 109,976,399 | | | | — | | | | — | | | | | | 109,976,399 |
| | | | | | | | | | | | | | | | |
| | $3,676,351,651 | | | | $ — | | | | $ — | | | | | | 3,676,351,651 |
| | | | | | | | | | | | | | | | |
| | | | | | | |
Investments Valued at NAV(a) | | | | | | | | | | | | | | | | 22,241,319 |
| | | | | | | | | | | | | | | | |
| | | | | | | |
| | | | | | | | | | | | | | | | $3,698,592,970 |
| | | | | | | | | | | | | | | | |
| | | | | | | |
Derivative Financial Instruments(b) | | | | | | | | | | | | | | | | |
Liabilities | | | | | | | | | | | | | | | | |
Equity Contracts | | $ (610,259) | | | | $ — | | | | $ — | | | | | | $ (610,259) |
| | | | | | | | | | | | | | | | |
| | (a) | Certain investments of the Master Portfolio were fair valued using NAV per share as no quoted market value is available and therefore have been excluded from the fair value hierarchy. | |
| | (b) | Derivative financial instruments are futures contracts. Futures contracts are valued at the unrealized appreciation (depreciation) on the instrument. | |
See notes to financial statements.
| | |
S C H E D U L E O F I N V E S T M E N T S | | 39 |
Statement of Assets and Liabilities
September 30, 2020
| | | | |
| | | Master Advantage Large Cap Core
Portfolio | |
| |
ASSETS | | | | |
Investments at value — unaffiliated(a)(b) | | $ | 3,566,375,252 | |
Investments at value — affiliated(c) | | | 132,217,718 | |
Cash pledged for futures contracts | | | 8,678,000 | |
Receivables: | | | | |
Investments sold | | | 27,060,386 | |
Securities lending income — affiliated | | | 9,544 | |
Dividends — affiliated | | | 4,263 | |
Dividends — unaffiliated | | | 1,736,290 | |
Variation margin on futures contracts | | | 652,420 | |
Prepaid expenses | | | 11,337 | |
| | | | |
| |
Total assets | | | 3,736,745,210 | |
| | | | |
| |
LIABILITIES | | | | |
Bank overdraft | | | 3,654 | |
Cash collateral on securities loaned at value | | | 22,257,040 | |
Payables: | | | | |
Investments purchased | | | 28,290,946 | |
Investment advisory fees | | | 1,266,635 | |
Directors’ fees | | | 3,944 | |
Other accrued expenses | | | 165,313 | |
Other affiliate fees | | | 19,837 | |
Withdrawals to investors | | | 2,243,536 | |
| | | | |
| |
Total liabilities | | | 54,250,905 | |
| | | | |
| |
NET ASSETS | | $ | 3,682,494,305 | |
| | | | |
| |
NET ASSETS CONSIST OF | | | | |
Investors’ capital | | $ | 2,925,096,322 | |
Net unrealized appreciation (depreciation) | | | 757,397,983 | |
| | | | |
| |
NET ASSETS | | $ | 3,682,494,305 | |
| | | | |
| |
(a) Investments at cost — unaffiliated | | $ | 2,808,374,989 | |
(b) Securities loaned at value | | $ | 21,662,852 | |
(c) Investments at cost — affiliated | | $ | 132,209,739 | |
See notes to financial statements.
| | |
| 40 | | 2 0 2 0 B L A C K R O C K A N N U A L R E P O R T T O S H A R E H O L D E R S |
Statement of Operations
Year Ended September 30, 2020
| | | | |
| | | Master
Advantage
Large Cap Core
Portfolio | |
| |
INVESTMENT INCOME | | | | |
Dividends — unaffiliated | | $ | 61,184,321 | |
Dividends — affiliated | | | 300,569 | |
Interest — unaffiliated | | | 12,952 | |
Securities lending income — affiliated — net | | | 251,417 | |
Foreign taxes withheld | | | (145,029 | ) |
| | | | |
| |
Total investment income | | | 61,604,230 | |
| | | | |
| |
EXPENSES | | | | |
Investment advisory | | | 14,876,085 | |
Accounting services | | | 272,036 | |
Custodian | | | 103,423 | |
Professional | | | 58,630 | |
Directors | | | 27,842 | |
Miscellaneous | | | 30,856 | |
| | | | |
| |
Total expenses | | | 15,368,872 | |
Less: | | | | |
Fees waived and/or reimbursed by the Manager | | | (398,487 | ) |
| | | | |
| |
Total expenses after fees waived and/or reimbursed | | | 14,970,385 | |
| | | | |
| |
Net investment income | | | 46,633,845 | |
| | | | |
| |
REALIZED AND UNREALIZED GAIN (LOSS) | | | | |
Net realized gain (loss) from: | | | | |
Investments — unaffiliated | | | 119,889,909 | |
Investments — affiliated | | | (25,678 | ) |
Capital gain distributions from investment companies — affiliated | | | 69 | |
Futures contracts | | | 22,410,677 | |
| | | | |
| |
| | | 142,274,977 | |
| | | | |
Net change in unrealized appreciation (depreciation) on: | | | | |
Investments — unaffiliated | | | 351,019,514 | |
Investments — affiliated | | | 7,787 | |
Futures contracts | | | (253,441 | ) |
| | | | |
| |
| | | 350,773,860 | |
| | | | |
| |
Net realized and unrealized gain | | | 493,048,837 | |
| | | | |
| |
NET INCREASE IN NET ASSETS RESULTING FROM OPERATIONS | | $ | 539,682,682 | |
| | | | |
See notes to financial statements.
| | |
F I N A N C I A L S T A T E M E N T S | | 41 |
Statements of Changes in Net Assets
| | | | | | | | | | | | |
| | | Master Advantage Large Cap Core Portfolio | |
| | | Year Ended September 30, | |
| | | 2020 | | | | | | 2019 | |
| | | |
INCREASE (DECREASE) IN NET ASSETS | | | | | | | | | | | | |
| | | |
OPERATIONS | | | | | | | | | | | | |
Net investment income | | $ | 46,633,845 | | | | | | | $ | 52,940,092 | |
Net realized gain | | | 142,274,977 | | | | | | | | 71,848,471 | |
Net change in unrealized appreciation (depreciation) | | | 350,773,860 | | | | | | | | (38,717,372 | ) |
| | | | | | | | | | | | |
| | | |
Net increase in net assets resulting from operations | | | 539,682,682 | | | | | | | | 86,071,191 | |
| | | | | | | | | | | | |
| | | |
CAPITAL TRANSACTIONS | | | | | | | | | | | | |
Proceeds from contributions | | | 428,282,888 | | | | | | | | 828,461,445 | |
Value of withdrawals | | | (754,708,045 | ) | | | | | | | (548,484,470 | ) |
| | | | | | | | | | | | |
| | | |
Net increase (decrease) in net assets derived from capital transactions | | | (326,425,157 | ) | | | | | | | 279,976,975 | |
| | | | | | | | | | | | |
| | | |
NET ASSETS | | | | | | | | | | | | |
Total increase in net assets | | | 213,257,525 | | | | | | | | 366,048,166 | |
Beginning of year | | | 3,469,236,780 | | | | | | | | 3,103,188,614 | |
| | | | | | | | | | | | |
| | | |
End of year | | $ | 3,682,494,305 | | | | | | | $ | 3,469,236,780 | |
| | | | | | | | | | | | |
See notes to financial statements.
| | |
| 42 | | 2 0 2 0 B L A C K R O C K A N N U A L R E P O R T T O S H A R E H O L D E R S |
Financial Highlights
(For a share outstanding throughout each period)
| | | | | | | | | | | | | | | | | | | | |
| | | Master Advantage Large Cap Core Portfolio | |
| |
| | | Year Ended September 30, | |
| | | | | |
| | | 2020 | | | 2019 | | | 2018 | | | 2017 | | | 2016 | |
| | | | | |
Total Return | | | | | | | | | | | | | | | | | | | | |
Total return | | | 15.98 | % | | | 1.43 | % | | | 17.40 | % | | | 24.06 | %(a) | | | 10.34 | %(a) |
| | | | | | | | | | | | | | | | | | | | |
| | | | | |
Ratios to Average Net Assets | | | | | | | | | | | | | | | | | | | | |
Total expenses | | | 0.44 | % | | | 0.44 | % | | | 0.45 | % | | | 0.49 | % | | | 0.50 | % |
| | | | | | | | | | | | | | | | | | | | |
| | | | | |
Total expenses after fees waived and/or reimbursed | | | 0.43 | % | | | 0.43 | % | | | 0.45 | % | | | 0.49 | % | | | 0.50 | % |
| | | | | | | | | | | | | | | | | | | | |
| | | | | |
Net investment income | | | 1.34 | % | | | 1.59 | % | | | 1.47 | % | | | 1.33 | % | | | 1.25 | % |
| | | | | | | | | | | | | | | | | | | | |
| | | | | |
Supplemental Data | | | | | | | | | | | | | | | | | | | | |
Net assets, end of year (000) | | $ | 3,682,494 | | | $ | 3,469,237 | | | $ | 3,103,189 | | | $ | 2,262,543 | | | $ | 2,132,705 | |
| | | | | | | | | | | | | | | | | | | | |
| | | | | |
Portfolio turnover rate | | | 99 | % | | | 151 | % | | | 148 | % | | | 130 | % | | | 39 | % |
| | | | | | | | | | | | | | | | | | | | |
| (a) | Includes proceeds received from a settlement of litigation, which had no impact on the Master Portfolio’s total return. |
See notes to financial statements.
| | |
F I N A N C I A L H I G H L I G H T S | | 43 |
Notes to Financial Statements
Master Advantage Large Cap Core Portfolio (the “Master Portfolio”) is a series of Master Large Cap Series LLC (the “Master LLC”). The Master LLC is registered under the Investment Company Act of 1940, as amended (the “1940 Act”), as an open-end management investment company and is organized as a Delaware limited liability company. The Master Portfolio is classified as diversified. The Limited Liability Company Agreement of the Master LLC permits the Board of Directors of the Master LLC (the “Board”) to issue non-transferable interests in the Master LLC, subject to certain limitations.
The Master Portfolio, together with certain other registered investment companies advised by BlackRock Advisors, LLC (the “Manager”) or its affiliates, is included in a complex of equity, multi-asset, index and money market funds referred to as the BlackRock Multi-Asset Complex.
Prior Year Reorganization: The Board of Directors of BlackRock Large Cap Series Funds, Inc. and the Board of Trustees of State Farm Mutual Fund Trust and shareholders of State Farm Equity Fund (the “Target Fund”), a series of State Farm Mutual Fund Trust, approved the reorganization of the Target Fund into BlackRock Advantage Large Cap Core Fund. As a result, BlackRock Advantage Large Cap Core Fund acquired all of the assets and assumed certain of the liabilities of the Target Fund in exchange for an equal aggregate value of newly-issued shares of BlackRock Advantage Large Cap Core Fund.
On November 19, 2018, all of the portfolio securities previously held by the Target Fund were subsequently contributed by BlackRock Advantage Large Cap Core Fund to the Master Portfolio in exchange for an investment in the Master Portfolio.
For financial reporting purposes, assets received and shares issued by BlackRock Advantage Large Cap Core Fund were recorded at fair value. However, the cost basis of the investments received from the Target Fund was carried forward by Master Portfolio to align ongoing reporting of BlackRock Advantage Large Cap Core Fund’s realized and unrealized gains and losses with amounts distributable to shareholders for tax purposes.
The Target Fund’s fair value and cost of investments prior to the reorganization were as follows:
| | | | | | |
| Target Fund | | Fair Value of
Investments | | | | Cost of
Investments |
| | | |
State Farm Equity Fund | | $369,010,639 | | | | $345,412,676 |
| 2. | SIGNIFICANT ACCOUNTING POLICIES |
The financial statements are prepared in conformity with accounting principles generally accepted in the United States of America (“U.S. GAAP”), which may require management to make estimates and assumptions that affect the reported amounts of assets and liabilities in the financial statements, disclosure of contingent assets and liabilities at the date of the financial statements and the reported amounts of increases and decreases in net assets from operations during the reporting period. Actual results could differ from those estimates. The Master Portfolio is considered an investment company under U.S. GAAP and follows the accounting and reporting guidance applicable to investment companies. Below is a summary of significant accounting policies:
Investment Transactions and Income Recognition: For financial reporting purposes, investment transactions are recorded on the dates the transactions are executed. Realized gains and losses on investment transactions are determined on the identified cost basis. Dividend income and capital gain distributions, if any, are recorded on the ex-dividend date. Non-cash dividends, if any, are recorded on the ex-dividend date at fair value. Dividends from foreign securities where the ex-dividend date may have passed are subsequently recorded when the Master Portfolio is informed of the ex-dividend date. Under the applicable foreign tax laws, a withholding tax at various rates may be imposed on capital gains, dividends and interest. Upon notification from issuers, a portion of the dividend income received from a real estate investment trust may be redesignated as a reduction of cost of the related investment and/or realized gain. Interest income, including amortization and accretion of premiums and discounts on debt securities is recognized daily on an accrual basis.
Foreign Taxes: The Portfolio may be subject to foreign taxes (a portion of which may be reclaimable) on income, stock dividends, capital gains on investments, or certain foreign currency transactions. All foreign taxes are recorded in accordance with the applicable foreign tax regulations and rates that exist in the foreign jurisdictions in which the Master Portfolio invests. These foreign taxes, if any, are paid by the Master Portfolio and are reflected in its Statement of Operations as follows: foreign taxes withheld at source are presented as a reduction of income, foreign taxes on securities lending income are presented as a reduction of securities lending income, foreign taxes on stock dividends are presented as “Foreign taxes withheld”, and foreign taxes on capital gains from sales of investments and foreign taxes on foreign currency transactions are included in their respective net realized gain (loss) categories. Foreign taxes payable or deferred as of September 30, 2020, if any, are disclosed in the Statement of Assets and Liabilities.
Segregation and Collateralization: In cases where the Master Portfolio enters into certain investments (e.g., futures contracts) that would be treated as “senior securities” for 1940 Act purposes, the Master Portfolio may segregate or designate on its books and records cash or liquid assets having a market value at least equal to the amount of its future obligations under such investments. Doing so allows the investment to be excluded from treatment as a “senior security.” Furthermore, if required by an exchange or counterparty agreement, the Master Portfolio may be required to deliver/deposit cash and/or securities to/with an exchange, or broker-dealer or custodian as collateral for certain investments or obligations.
Indemnifications: In the normal course of business, the Master Portfolio enters into contracts that contain a variety of representations that provide general indemnification. The Master Portfolio’s maximum exposure under these arrangements is unknown because it involves future potential claims against the Master Portfolio, which cannot be predicted with any certainty.
Other: Expenses directly related to the Master Portfolio are charged to the Master Portfolio. Other operating expenses shared by several funds, including other funds managed by the Manager, are prorated among those funds on the basis of relative net assets or other appropriate methods.
| | |
| 44 | | 2 0 2 0 B L A C K R O C K A N N U A L R E P O R T T O S H A R E H O L D E R S |
Notes to Financial Statements (continued)
The Master Portfolio has an arrangement with its custodian whereby credits are earned on uninvested cash balances, which could be used to reduce custody fees and/or overdraft charges. The Master Portfolio may incur charges on overdrafts, subject to certain conditions.
| 3. | INVESTMENT VALUATION AND FAIR VALUE MEASUREMENTS |
Investment Valuation Policies: The Master Portfolio’s investments are valued at fair value (also referred to as “market value” within the financial statements) each day that the Master Portfolio’s listing exchange is open and, for financial reporting purposes, as of the report date should the reporting period end on a day that the Master Portfolio’s listing exchange is not open. U.S. GAAP defines fair value as the price the Master Portfolio would receive to sell an asset or pay to transfer a liability in an orderly transaction between market participants at the measurement date. The Master Portfolio determines the fair values of its financial instruments using various independent dealers or pricing services under policies approved by the Board. If a security’s market price is not readily available or does not otherwise accurately represent the fair value of the security, the security will be valued in accordance with a policy approved by the Board as reflecting fair value. The BlackRock Global Valuation Methodologies Committee (the “Global Valuation Committee”) is the committee formed by management to develop global pricing policies and procedures and to oversee the pricing function for all financial instruments.
Fair Value Inputs and Methodologies: The following methods and inputs are used to establish the fair value of the Master Portfolio’s assets and liabilities:
| | • | | Equity investments traded on a recognized securities exchange are valued at that day’s official closing price, as applicable, on the exchange where the stock is primarily traded. Equity investments traded on a recognized exchange for which there were no sales on that day may be valued at the last available bid (long positions) or ask (short positions) price. |
Generally, trading in foreign instruments is substantially completed each day at various times prior to the close of trading on the Master Portfolio’s listing exchange. Occasionally, events affecting the values of such instruments may occur between the foreign market close and the close of trading on the Master Portfolio’s listing exchange that may not be reflected in the computation of the Master Portfolio’s net assets. Each business day, the Master Portfolio uses a pricing service to assist with the valuation of certain foreign exchange-traded equity securities and foreign exchange-traded and over-the-counter (“OTC”) options (the “Systematic Fair Value Price”). Using current market factors, the Systematic Fair Value Price is designed to value such foreign securities and foreign options at fair value as of the close of trading on the NYSE, which follows the close of the local markets.
| | • | | Investments in open-end U.S. mutual funds (including money market funds) are valued at that day’s published net asset value (“NAV”). |
| | • | | The Master Portfolio values its investment in SL Liquidity Series, LLC, Money Market Series (the “Money Market Series”) at fair value, which is ordinarily based upon its pro rata ownership in the underlying fund’s net assets. |
| | • | | Futures contracts are valued based on that day’s last reported settlement price on the exchange where the contract is traded. |
If events (e.g., a company announcement, market volatility or a natural disaster) occur that are expected to materially affect the value of such investment, or in the event that the application of these methods of valuation results in a price for an investment that is deemed not to be representative of the market value of such investment, or if a price is not available, the investment will be valued by the Global Valuation Committee, or its delegate, in accordance with a policy approved by the Board as reflecting fair value (“Fair Valued Investments”). The fair valuation approaches that may be used by the Global Valuation Committee will include market approach, income approach and cost approach. Valuation techniques such as discounted cash flow, use of market comparables and matrix pricing are types of valuation approaches and are typically used in determining fair value. When determining the price for Fair Valued Investments, the Global Valuation Committee, or its delegate, seeks to determine the price that the Master Portfolio might reasonably expect to receive or pay from the current sale or purchase of that asset or liability in an arm’s-length transaction. Fair value determinations shall be based upon all available factors that the Global Valuation Committee, or its delegate, deems relevant and consistent with the principles of fair value measurement. The pricing of all Fair Valued Investments is subsequently reported to the Board or a committee thereof on a quarterly basis.
Fair Value Hierarchy: Various inputs are used in determining the fair value of financial instruments. These inputs to valuation techniques are categorized into a fair value hierarchy consisting of three broad levels for financial reporting purposes as follows:
| | • | | Level 1 – Unadjusted price quotations in active markets/exchanges for identical assets or liabilities that the Master Portfolio has the ability to access |
| | • | | Level 2 – Other observable inputs (including, but not limited to, quoted prices for similar assets or liabilities in markets that are active, quoted prices for identical or similar assets or liabilities in markets that are not active, inputs other than quoted prices that are observable for the assets or liabilities (such as interest rates, yield curves, volatilities, prepayment speeds, loss severities, credit risks and default rates) or other market–corroborated inputs) |
| | • | | Level 3 – Unobservable inputs based on the best information available in the circumstances, to the extent observable inputs are not available (including the Global Valuation Committee’s assumptions used in determining the fair value of financial instruments) |
The hierarchy gives the highest priority to unadjusted quoted prices in active markets for identical assets or liabilities (Level 1 measurements) and the lowest priority to unobservable inputs (Level 3 measurements). Accordingly, the degree of judgment exercised in determining fair value is greatest for instruments categorized in Level 3. The inputs used to measure fair value may fall into different levels of the fair value hierarchy. In such cases, for disclosure purposes, the fair value hierarchy classification is determined based on the lowest level input that is significant to the fair value measurement in its entirety. Investments classified within Level 3 have significant unobservable inputs used by the Global Valuation Committee in determining the price for Fair Valued Investments. Level 3 investments include equity or debt issued by privately held companies or funds that may not have a secondary market and/or may have a limited number of investors. The categorization of a value determined for financial instruments is based on the pricing transparency of the financial instruments and is not necessarily an indication of the risks associated with investing in those securities.
As of September 30, 2020, certain investments of the Master Portfolio were fair valued using NAV per share as no quoted market value is available and therefore have been excluded from the fair value hierarchy.
| | |
N O T E S T O F I N A N C I A L S T A T E M E N T S | | 45 |
Notes to Financial Statements (continued)
| 4. | SECURITIES AND OTHER INVESTMENTS |
Securities Lending: The Master Portfolio may lend its securities to approved borrowers, such as brokers, dealers and other financial institutions. The borrower pledges and maintains with the Master Portfolio collateral consisting of cash, an irrevocable letter of credit issued by a bank, or securities issued or guaranteed by the U.S. Government. The initial collateral received by the Master Portfolio is required to have a value of at least 102% of the current value of the loaned securities for securities traded on U.S. exchanges and a value of at least 105% for all other securities. The collateral is maintained thereafter at a value equal to at least 100% of the current market value of the securities on loan. The market value of the loaned securities is determined at the close of each business day of the Master Portfolio and any additional required collateral is delivered to the Master Portfolio, or excess collateral returned by the Master Portfolio, on the next business day. During the term of the loan, the Master Portfolio is entitled to all distributions made on or in respect of the loaned securities, but does not receive interest income on securities received as collateral. Loans of securities are terminable at any time and the borrower, after notice, is required to return borrowed securities within the standard time period for settlement of securities transactions.
The market value of any securities on loan, all of which were classified as common stocks in the Master Portfolio’s Schedule of Investments, and the value of any related collateral are shown separately in the Statement of Assets and Liabilities as a component of investments at value – unaffiliated, and collateral on securities loaned at value, respectively. As of period end, any securities on loan were collateralized by cash and/or U.S. Government obligations. Cash collateral invested by the securities lending agent, BlackRock Investment Management, LLC (“BIM”), if any, is disclosed in the Schedule of Investments.
Securities lending transactions are entered into by the Master Portfolio under Master Securities Lending Agreements (each, an “MSLA”), which provide the right, in the event of default (including bankruptcy or insolvency), for the non-defaulting party to liquidate the collateral and calculate a net exposure to the defaulting party or request additional collateral. In the event that a borrower defaults, the Master Portfolio, as lender, would offset the market value of the collateral received against the market value of the securities loaned. When the value of the collateral is greater than that of the market value of the securities loaned, the lender is left with a net amount payable to the defaulting party. However, bankruptcy or insolvency laws of a particular jurisdiction may impose restrictions on or prohibitions against such a right of offset in the event of an MSLA counterparty’s bankruptcy or insolvency. Under the MSLA, absent an event of default, the borrower can resell or re-pledge the loaned securities, and the Master Portfolio can reinvest cash collateral received in connection with loaned securities. Upon an event of default, the parties’ obligations to return the securities or collateral to the other party are extinguished, and the parties can resell or re-pledge the loaned securities or the collateral received in connection with the loaned securities in order to satisfy the defaulting party’s net payment obligation for all transactions under the MSLA. The defaulting party remains liable for any deficiency.
As of period end, the following table is a summary of the Master Portfolio’s securities on loan by counterparty which are subject to offset under an MSLA:
| | | | | | | | | | | | | | | | | | | | | | | | | | | | |
Counterparty | |
| Securities
Loaned at Value |
| |
| Cash
Collateral Received(a) | | | |
| Net
Amount |
|
| | | | | | | | |
Citigroup Global Markets, Inc. | | | | | | | $ 925,626 | | | | | | | | $ (925,626 | ) | | | | | | | | | | | $— | |
Deutsche Bank Securities, Inc. | | | | | | | 349,232 | | | | | | | | (349,232 | ) | | | | | | | | | | | — | |
Goldman Sachs & Co. | | | | | | | 4,062,238 | | | | | | | | (4,062,238 | ) | | | | | | | | | | | — | |
J.P. Morgan Securities LLC | | | | | | | 10,749,947 | | | | | | | | (10,749,947 | ) | | | | | | | | | | | — | |
Jefferies LLC | | | | | | | 2,050,771 | | | | | | | | (2,050,771 | ) | | | | | | | | | | | — | |
National Financial Services LLC | | | | | | | 310,508 | | | | | | | | (310,508 | ) | | | | | | | | | | | — | |
TD Prime Services LLC | | | | | | | 3,214,530 | | | | | | | | (3,214,530 | ) | | | | | | | | | | | — | |
| | | | | | | | | | | | | | | | | | | | | | | | | | | | |
| | | | | | $ | 21,662,852 | | | | | | | $ | (21,662,852 | ) | | | | | | | | | | $ | — | |
| | | | | | | | | | | | | | | | | | | | | | | | | | | | |
| | (a) | Collateral received in excess of the market value of securities on loan is not presented in this table. The total cash collateral received by the Master Portfolio is disclosed in the Master Portfolio’s Statement of Assets and Liabilities. | |
The risks of securities lending include the risk that the borrower may not provide additional collateral when required or may not return the securities when due. To mitigate these risks, the Master Portfolio benefits from a borrower default indemnity provided by BIM. BIM’s indemnity allows for full replacement of the securities loaned to the extent the collateral received does not cover the value on the securities loaned in the event of borrower default. The Master Portfolio could incur a loss if the value of an investment purchased with cash collateral falls below the market value of loaned securities or if the value of an investment purchased with cash collateral falls below the value of the original cash collateral received. Such losses are borne entirely by the Master Portfolio.
| 5. | DERIVATIVE FINANCIAL INSTRUMENTS |
The Master Portfolio engages in various portfolio investment strategies using derivative contracts both to increase the returns of the Master Portfolio and/or to manage its exposure to certain risks such as credit risk, equity risk, interest rate risk, foreign currency exchange rate risk, commodity price risk or other risks (e.g., inflation risk). Derivative financial instruments categorized by risk exposure are included in the Schedule of Investments. These contracts may be transacted on an exchange or OTC.
Futures Contracts: Futures contracts are purchased or sold to gain exposure to, or manage exposure to, changes in interest rates (interest rate risk) and changes in the value of equity securities (equity risk) or foreign currencies (foreign currency exchange rate risk).
Futures contracts are agreements between the Master Portfolio and a counterparty to buy or sell a specific quantity of an underlying instrument at a specified price and on a specified date. Depending on the terms of a contract, it is settled either through physical delivery of the underlying instrument on the settlement date or by payment of a cash amount on the settlement date. Upon entering into a futures contract, the Master Portfolio is required to deposit initial margin with the broker in the form of cash or securities in an amount that varies depending on a contract’s size and risk profile. The initial margin deposit must then be maintained at an established level over the life of the contract. Amounts pledged, which are considered restricted, are included in cash pledged for futures contracts in the Statement of Assets and Liabilities.
| | |
| 46 | | 2 0 2 0 B L A C K R O C K A N N U A L R E P O R T T O S H A R E H O L D E R S |
Notes to Financial Statements (continued)
Securities deposited as initial margin are designated in the Schedule of Investments and cash deposited, if any, are shown as cash pledged for futures contracts in the Statement of Assets and Liabilities. Pursuant to the contract, the Master Portfolio agrees to receive from or pay to the broker an amount of cash equal to the daily fluctuation in market value of the contract (“variation margin”). Variation margin is recorded as unrealized appreciation (depreciation) and, if any, shown as variation margin receivable (or payable) on futures contracts in the Statement of Assets and Liabilities. When the contract is closed, a realized gain or loss is recorded in the Statement of Operations equal to the difference between the notional amount of the contract at the time it was opened and the notional amount at the time it was closed. The use of futures contracts involves the risk of an imperfect correlation in the movements in the price of futures contracts and interest, foreign currency exchange rates or underlying assets.
| 6. | INVESTMENT ADVISORY AGREEMENT AND OTHER TRANSACTIONS WITH AFFILIATES |
Investment Advisory: The Master LLC, on behalf of the Master Portfolio, entered into an Investment Advisory Agreement with the Manager, the Master Portfolio’s investment adviser and an indirect, wholly-owned subsidiary of BlackRock, Inc. (“BlackRock”), to provide investment advisory and administrative services. The Manager is responsible for the management of the Master Portfolio’s portfolio and provides the personnel, facilities, equipment and certain other services necessary to the operations of the Master Portfolio.
For such services, the Master Portfolio pays the Manager a monthly fee at an annual rate equal to the following percentages of the average daily value of the Master Portfolio’s net assets:
| | |
| | |
| Average Daily Net Assets | | Investment Advisory Fees |
| |
First $1 billion | | 0.45% |
$1 billion — $3 billion | | 0.42 |
$3 billion — $5 billion | | 0.41 |
$5 billion — $10 billion | | 0.39 |
Greater than $10 billion | | 0.38 |
Expense Limitations, Waivers and Reimbursements: With respect to the Master Portfolio, the Manager contractually agreed to waive its investment advisory fees by the amount of investment advisory fees the Master Portfolio pays to the Manager indirectly through its investment in affiliated money market funds (the “affiliated money market fund waiver”) through January 31, 2021. The contractual agreement may be terminated upon 90 days’ notice by a majority of the directors who are not “interested persons” of the Master LLC, as defined in the 1940 Act (“Independent Directors”), or by a vote of a majority of the outstanding voting securities of the Master Portfolio. The amount of waivers and/or reimbursements of fees and expenses made pursuant to the expense limitation described below will be reduced by the amount of the affiliated money market fund waiver. Prior to January 28, 2020, this waiver was voluntary. This amount is included in fees waived and/or reimbursed by the Manager in the Statement of Operations. For the year ended September 30, 2020 the amount waived was $51,012.
The Manager has contractually agreed to waive its investment advisory fee with respect to any portion of the Master Portfolio’s assets invested in affiliated equity and fixed-income mutual funds and affiliated exchange-traded funds that have a contractual management fee through January 31, 2021. The contractual agreement may be terminated upon 90 days’ notice by a majority of the Independent Directors, or by a vote of a majority of the outstanding voting securities of the Master Portfolio. This amount is included in fees waived and/or reimbursed by the Manager in the Statement of Operations. For the year ended September 30, 2020, the Manager waived $347,475 in investment advisory fees pursuant to this arrangement.
For the year ended September 30, 2020, the Master Portfolio reimbursed the Manager $40,461 for certain accounting services, which is included in accounting services in the Statement of Operations.
Securities Lending: The U.S. Securities and Exchange Commission (“SEC”) has issued an exemptive order which permits BIM, an affiliate of the Manager, to serve as securities lending agent for the Master Portfolio, subject to applicable conditions. As securities lending agent, BIM bears all operational costs directly related to securities lending. The Master Portfolio is responsible for expenses in connection with the investment of cash collateral received for securities on loan (the “collateral investment expenses”). The cash collateral is invested in a private investment company, SL Liquidity Series, LLC (“Money Market Series”), managed by the Manager or its affiliates. However, BIM has agreed to cap the collateral investment expenses of the Money Market Series to an annual rate of 0.04%. The investment adviser to the Money Market Series will not charge any advisory fees with respect to shares purchased by the Master Portfolio. The Money Market Series may, under certain circumstances, impose a liquidity fee of up to 2% of the value withdrawn or temporarily restrict withdrawals for up to 10 business days during a 90 day period, in the event that the private investment company’s weekly liquid assets fall below certain thresholds. The Money Market Series seeks current income consistent with maintaining liquidity and preserving capital. Although the Money Market Series is not registered under the 1940 Act, its investments may follow the parameters of investments by a money market fund that is subject to Rule 2a-7 under the 1940 Act.
Securities lending income is equal to the total of income earned from the reinvestment of cash collateral, net of fees and other payments to and from borrowers of securities, and less the collateral investment expenses. The Master Portfolio retains a portion of securities lending income and remits a remaining portion to BIM as compensation for its services as securities lending agent.
Pursuant to the current securities lending agreement, the Master Portfolio retains 75% of securities lending income (which excludes collateral investment expenses), and this amount retained can never be less than 70% of the total of securities lending income plus the collateral investment expenses.
In addition, commencing the business day following the date that the aggregate securities lending income earned across the BlackRock Multi-Asset Complex in a calendar year exceeds a specified threshold, the Master Portfolio, pursuant to the securities lending agreement, will retain for the remainder of that calendar year securities lending income in an amount equal to 80% of securities lending income (which excludes collateral investment expenses), and this amount retained can never be less than 70% of the total of securities lending income plus the collateral investment expenses.
| | |
N O T E S T O F I N A N C I A L S T A T E M E N T S | | 47 |
Notes to Financial Statements (continued)
Prior to January 1, 2020, the Master Portfolio retained 73.5% of securities lending income (which excluded collateral investment expenses) and the amount retained could never be less than 70% of the total of securities lending income plus the collateral investment expenses. In addition, commencing the business day following the date that the aggregate securities lending income earned across the BlackRock Multi-Asset Complex in a calendar year exceeded a specified threshold, the Master Portfolio would retain for the remainder of that calendar year 80% of securities lending income (which excluded collateral investment expenses), and the amount retained could never be less than 70% of the total of securities lending income plus the collateral investment expenses.
The share of securities lending income earned by the Master Portfolio is shown as securities lending income — affiliated — net in the Statement of Operations. For the year ended September 30, 2020, the Master Portfolio paid BIM $72,315 for securities lending agent services.
Interfund Lending: In accordance with an exemptive order (the “Order”) from the SEC, the Master Portfolio may participate in a joint lending and borrowing facility for temporary purposes (the “Interfund Lending Program”), subject to compliance with the terms and conditions of the Order, and to the extent permitted by the Master Portfolio’s investment policies and restrictions. The Master Portfolio is currently permitted to borrow under the Interfund Lending Program.
A lending BlackRock fund may lend in aggregate up to 15% of its net assets, but may not lend more than 5% of its net assets to any one borrowing fund through the Interfund Lending Program. A borrowing BlackRock fund may not borrow through the Interfund Lending Program or from any other source more than 33 1/3% of its total assets (or any lower threshold provided for by the fund’s investment restrictions). If a borrowing BlackRock fund’s total outstanding borrowings exceed 10% of its total assets, each of its outstanding interfund loans will be subject to collateralization of at least 102% of the outstanding principal value of the loan. All interfund loans are for temporary or emergency purposes and the interest rate to be charged will be the average of the highest current overnight repurchase agreement rate available to a lending fund and the bank loan rate, as calculated according to a formula established by the Board.
During the year ended September 30, 2020, the Master Portfolio did not participate in the Interfund Lending Program.
Directors and Officers: Certain directors and/or officers of the Master LLC are directors and/or officers of BlackRock or its affiliates.
For the year ended September 30, 2020, purchases and sales of investments, excluding short-term investments, were $3,385,751,570 and $3,730,881,464, respectively.
It is the Master Portfolio’s policy to comply with the requirements of the Internal Revenue Code of 1986, as amended, applicable to regulated investment companies, and to distribute substantially all of its taxable income to its shareholders. Therefore, no U.S. federal income tax provision is required.
The Master Portfolio is classified as a partnership for U.S. federal income tax purposes. As such, each investor in the Master Portfolio is treated as the owner of its proportionate share of net assets, income, expenses and realized and unrealized gains and losses of the Master Portfolio. Therefore, no U.S. federal income tax provision is required. It is intended that the Master Portfolio’s assets will be managed so an investor in the Master Portfolio can satisfy the requirements of Subchapter M of the Internal Revenue Code of 1986, as amended.
The Master Portfolio files U.S. federal and various state and local tax returns. No income tax returns are currently under examination. The statute of limitations on the Master Portfolio’s U.S. federal tax returns generally remains open for a period of three fiscal years after they are filed. The statutes of limitations on the Master Portfolio’s state and local tax returns may remain open for an additional year depending upon the jurisdiction.
Management has analyzed tax laws and regulations and their application to the Master Portfolio as of September 30, 2020, inclusive of the open tax return years, and does not believe that there are any uncertain tax positions that require recognition of a tax liability in the Master Portfolio’s financial statements.
As of September 30, 2020, gross unrealized appreciation and depreciation for investments based on cost for U.S. federal income tax purposes were as follows:
| | | | |
| |
| | | Amounts | |
| |
Tax cost | | $ | 2,970,712,800 | |
| | | | |
| |
Gross unrealized appreciation | | $ | 826,850,527 | |
Gross unrealized depreciation | | | (98,970,357 | ) |
| | | | |
| |
Net unrealized appreciation (depreciation) | | $ | 727,880,170 | |
| | | | |
The Master LLC, on behalf of the Master Portfolio, along with certain other funds managed by the Manager and its affiliates (“Participating Funds”), is a party to a 364-day, $2.25 billion credit agreement with a group of lenders. Under this agreement, the Master Portfolio may borrow to fund shareholder redemptions. Excluding commitments designated for certain individual funds, the Participating Funds, including the Master Portfolio, can borrow up to an aggregate commitment amount of $1.75 billion at any time outstanding, subject to asset coverage and other limitations as specified in the agreement. The credit agreement has the following terms: a fee of 0.10% per annum on unused commitment amounts and interest at a rate equal to the higher of (a) one-month LIBOR (but, in any event, not less than 0.00%) on the date the loan is made plus 0.80% per annum or (b) the Fed Funds rate (but, in any event, not less than 0.00%) in effect from time to time plus 0.80% per annum on amounts borrowed. The agreement expires in April 2021 unless extended or renewed. These fees were allocated among such funds based upon portions of the aggregate commitment available to them and relative net assets of Participating Funds. During the year ended September 30, 2020, the Master Portfolio did not borrow under the credit agreement.
| | |
| 48 | | 2 0 2 0 B L A C K R O C K A N N U A L R E P O R T T O S H A R E H O L D E R S |
Notes to Financial Statements (continued)
In the normal course of business, the Master Portfolio invests in securities or other instruments and may enter into certain transactions, and such activities subject the Master Portfolio to various risks, including among others, fluctuations in the market (market risk) or failure of an issuer to meet all of its obligations. The value of securities or other instruments may also be affected by various factors, including, without limitation: (i) the general economy; (ii) the overall market as well as local, regional or global political and/or social instability; (iii) regulation, taxation or international tax treaties between various countries; or (iv) currency, interest rate and price fluctuations. Local, regional or global events such as war, acts of terrorism, the spread of infectious illness or other public health issues, recessions, or other events could have a significant impact on the Master Portfolio and its investments. The Master Portfolio’s prospectus provides details of the risks to which the Master Portfolio is subject.
The Master Portfolio may be exposed to additional risks when reinvesting cash collateral in money market funds that do not seek to maintain a stable NAV per share of $1.00, which may be subject to redemption gates or liquidity fees under certain circumstances.
Market Risk: An outbreak of respiratory disease caused by a novel coronavirus has developed into a global pandemic and has resulted in closing borders, quarantines, disruptions to supply chains and customer activity, as well as general concern and uncertainty. The impact of this pandemic, and other global health crises that may arise in the future, could affect the economies of many nations, individual companies and the market in general in ways that cannot necessarily be foreseen at the present time. This pandemic may result in substantial market volatility and may adversely impact the prices and liquidity of a fund’s investments. The duration of this pandemic and its effects cannot be determined with certainty.
Valuation Risk: The market values of equities, such as common stocks and preferred securities or equity related investments, such as futures and options, may decline due to general market conditions which are not specifically related to a particular company. They may also decline due to factors which affect a particular industry or industries. The Master Portfolio may invest in illiquid investments. An illiquid investment is any investment that the Master Portfolio reasonably expects cannot be sold or disposed of in current market conditions in seven calendar days or less without the sale or disposition significantly changing the market value of the investment. The Master Portfolio may experience difficulty in selling illiquid investments in a timely manner at the price that it believes the investments are worth. Prices may fluctuate widely over short or extended periods in response to company, market or economic news. Markets also tend to move in cycles, with periods of rising and falling prices. This volatility may cause the Master Portfolio’s NAV to experience significant increases or decreases over short periods of time. If there is a general decline in the securities and other markets, the NAV of the Master Portfolio may lose value, regardless of the individual results of the securities and other instruments in which the Master Portfolio invests.
Counterparty Credit Risk: The Master Portfolio may be exposed to counterparty credit risk, or the risk that an entity may fail to or be unable to perform on its commitments related to unsettled or open transactions, including making timely interest and/or principal payments or otherwise honoring its obligations. The Master Portfolio manages counterparty credit risk by entering into transactions only with counterparties that the Manager believes have the financial resources to honor their obligations and by monitoring the financial stability of those counterparties. Financial assets, which potentially expose the Master Portfolio to market, issuer and counterparty credit risks, consist principally of financial instruments and receivables due from counterparties. The extent of the Master Portfolio’s exposure to market, issuer and counterparty credit risks with respect to these financial assets is approximately their value recorded in the Statement of Assets and Liabilities, less any collateral held by the Master Portfolio.
A derivative contract may suffer a mark-to-market loss if the value of the contract decreases due to an unfavorable change in the market rates or values of the underlying instrument. Losses can also occur if the counterparty does not perform under the contract.
With exchange-traded futures there is less counterparty credit risk to the Master Portfolio since the exchange or clearinghouse, as counterparty to such instruments, guarantees against a possible default. The clearinghouse stands between the buyer and the seller of the contract; therefore, credit risk is limited to failure of the clearinghouse. While offset rights may exist under applicable law, the Master Portfolio does not have a contractual right of offset against a clearing broker or clearinghouse in the event of a default (including the bankruptcy or insolvency). Additionally, credit risk exists in exchange-traded futures with respect to initial and variation margin that is held in a clearing broker’s customer accounts. While clearing brokers are required to segregate customer margin from their own assets, in the event that a clearing broker becomes insolvent or goes into bankruptcy and at that time there is a shortfall in the aggregate amount of margin held by the clearing broker for all its clients, typically the shortfall would be allocated on a pro rata basis across all the clearing broker’s customers, potentially resulting in losses to the Master Portfolio.
Concentration Risk: A diversified portfolio, where this is appropriate and consistent with a fund’s objectives, minimizes the risk that a price change of a particular investment will have a material impact on the NAV of a fund. The investment concentrations within the Master Portfolio’s portfolio are disclosed in its Schedule of Investments.
The Master Portfolio invests a significant portion of its assets in securities within a single or limited number of market sectors. When a Master Portfolio concentrates its investments in this manner, it assumes the risk that economic, regulatory, political and social conditions affecting such sectors may have a significant impact on the Master Portfolio and could affect the income from, or the value or liquidity of, the Master Portfolio’s portfolio. Investment percentages in specific sectors are presented in the Schedule of Investments.
LIBOR Transition Risk: The United Kingdom’s Financial Conduct Authority announced a phase out of the London Interbank Offered Rate (“LIBOR”) by the end of 2021, and it is expected that LIBOR will cease to be published after that time. The Master Portfolio may be exposed to financial instruments tied to LIBOR to determine payment obligations, financing terms, hedging strategies or investment value. The transition process away from LIBOR might lead to increased volatility and illiquidity in markets for, and reduce the effectiveness of new hedges placed against, instruments whose terms currently include LIBOR. The ultimate effect of the LIBOR transition process on the Master Portfolio is uncertain.
Management has evaluated the impact of all subsequent events on the Master Portfolio through the date the financial statements were issued and has determined that there were no subsequent events requiring adjustment or additional disclosure in the financial statements.
| | |
N O T E S T O F I N A N C I A L S T A T E M E N T S | | 49 |
Report of Independent Registered Public Accounting Firm
To the Investors of Master Advantage Large Cap Core Portfolio and the Board of Directors of Master Large Cap Series LLC:
Opinion on the Financial Statements and Financial Highlights
We have audited the accompanying statement of assets and liabilities of Master Advantage Large Cap Core Portfolio of Master Large Cap Series LLC (the “Fund”), including the schedule of investments, as of September 30, 2020, the related statement of operations for the year then ended, the statements of changes in net assets for each of the two years in the period then ended, the financial highlights for each of the five years in the period then ended, and the related notes. In our opinion, the financial statements and financial highlights present fairly, in all material respects, the financial position of the Fund as of September 30, 2020, and the results of its operations for the year then ended, the changes in its net assets for each of the two years in the period then ended, and the financial highlights for each of the five years in the period then ended, in conformity with accounting principles generally accepted in the United States of America.
Basis for Opinion
These financial statements and financial highlights are the responsibility of the Fund’s management. Our responsibility is to express an opinion on the Fund’s financial statements and financial highlights based on our audits. We are a public accounting firm registered with the Public Company Accounting Oversight Board (United States) (PCAOB) and are required to be independent with respect to the Fund in accordance with the U.S. federal securities laws and the applicable rules and regulations of the Securities and Exchange Commission and the PCAOB.
We conducted our audits in accordance with the standards of the PCAOB. Those standards require that we plan and perform the audit to obtain reasonable assurance about whether the financial statements and financial highlights are free of material misstatement, whether due to error or fraud. The Fund is not required to have, nor were we engaged to perform, an audit of its internal control over financial reporting. As part of our audits we are required to obtain an understanding of internal control over financial reporting but not for the purpose of expressing an opinion on the effectiveness of the Fund’s internal control over financial reporting. Accordingly, we express no such opinion.
Our audits included performing procedures to assess the risks of material misstatement of the financial statements and financial highlights, whether due to error or fraud, and performing procedures that respond to those risks. Such procedures included examining, on a test basis, evidence regarding the amounts and disclosures in the financial statements and financial highlights. Our audits also included evaluating the accounting principles used and significant estimates made by management, as well as evaluating the overall presentation of the financial statements and financial highlights. Our procedures included confirmation of securities owned as of September 30, 2020, by correspondence with the custodian and brokers; when replies were not received from brokers, we performed other auditing procedures. We believe that our audits provide a reasonable basis for our opinion.
Deloitte & Touche LLP
Boston, Massachusetts
November 20, 2020
We have served as the auditor of one or more BlackRock investment companies since 1992.
| | |
| 50 | | 2 0 2 0 B L A C K R O C K A N N U A L R E P O R T T O S H A R E H O L D E R S |
Director and Officer Information of Master Large Cap Series LLC
| | | | | | | | |
| Independent Directors(a) |
| | | | | |
Name Year of Birth(b) | | Position(s) Held (Length of Service)(c) | | Principal Occupation(s) During Past Five Years | | Number of BlackRock-Advised Registered Investment Companies (“RICs”) Consisting of Investment Portfolios (“Portfolios”) Overseen | | Public Company and Other Investment Company Directorships Held During Past Five Years |
| | | | |
Mark Stalnecker 1951 | | Chair of the Board (Since 2019) and Director
(Since 2015) | | Chief Investment Officer, University of Delaware from 1999 to 2013; Trustee and Chair of the Finance and Investment Committees, Winterthur Museum and Country Estate from 2005 to 2016; Member of the Investment Committee, Delaware Public Employees’ Retirement System since 2002; Member of the Investment Committee, Christiana Care Health System from 2009 to 2017; Member of the Investment Committee, Delaware Community Foundation from 2013 to 2014; Director and Chair of the Audit Committee, SEI Private Trust Co. from 2001 to 2014. | | 35 RICs consisting of 158 Portfolios | | None |
| | | | |
Bruce R. Bond 1946 | | Director
(Since 2019) | | Board Member, Amsphere Limited (software) since 2018; Trustee and Member of the Governance Committee, State Street Research Mutual Funds from 1997 to 2005; Board Member of Governance, Audit and Finance Committee, Avaya Inc. (computer equipment) from 2003 to 2007. | | 35 RICs consisting of 158 Portfolios | | None |
| | | | |
Susan J. Carter 1956 | | Director
(Since 2016) | | Director, Pacific Pension Institute from 2014 to 2018; Advisory Board Member, Center for Private Equity and Entrepreneurship at Tuck School of Business since 1997; Senior Advisor, Commonfund Capital, Inc. (“CCI”) (investment adviser) in 2015; Chief Executive Officer, CCI from 2013 to 2014; President & Chief Executive Officer, CCI from 1997 to 2013; Advisory Board Member, Girls Who Invest from 2015 to 2018 and Board Member thereof since 2018; Advisory Board Member, Bridges Fund Management since 2016; Trustee, Financial Accounting Foundation since 2017; Practitioner Advisory Board Member, Private Capital Research Institute (“PCRI”) since 2017; Lecturer in the Practice of Management, Yale School of Management since 2019. | | 35 RICs consisting of 158 Portfolios | | None |
| | | | |
Collette Chilton 1958 | | Director (Since 2015) | | Chief Investment Officer, Williams College since 2006; Chief Investment Officer, Lucent Asset Management Corporation from 1998 to 2006. | | 35 RICs consisting of 158 Portfolios | | None |
| | | | |
Neil A. Cotty 1954 | | Director (Since 2016) | | Bank of America Corporation from 1996 to 2015, serving in various senior finance leadership roles, including Chief Accounting Officer from 2009 to 2015, Chief Financial Officer of Global Banking, Markets and Wealth Management from 2008 to 2009, Chief Accounting Officer from 2004 to 2008, Chief Financial Officer of Consumer Bank from 2003 to 2004, Chief Financial Officer of Global Corporate Investment Bank from 1999 to 2002. | | 35 RICs consisting of 158 Portfolios | | None |
| | | | |
Lena G. Goldberg 1949 | | Director (Since 2019) | | Senior Lecturer, Harvard Business School, since 2008; Director, Charles Stark Draper Laboratory, Inc. since 2013; FMR LLC/Fidelity Investments (financial services) from 1996 to 2008, serving in various senior roles including Executive Vice President - Strategic Corporate Initiatives and Executive Vice President and General Counsel; Partner, Sullivan & Worcester LLP from 1985 to 1996 and Associate thereof from 1979 to 1985. | | 35 RICs consisting of 158 Portfolios | | None |
| | | | |
Henry R. Keizer 1956 | | Director (Since 2019) | | Director, Park Indemnity Ltd. (captive insurer) since 2010; Director, MUFG Americas Holdings Corporation and MUFG Union Bank, N.A. (financial and bank holding company) from 2014 to 2016; Director, American Institute of Certified Public Accountants from 2009 to 2011; Director, KPMG LLP (audit, tax and advisory services) from 2004 to 2005 and 2010 to 2012; Director, KPMG International in 2012, Deputy Chairman and Chief Operating Officer thereof from 2010 to 2012 and U.S. Vice Chairman of Audit thereof from 2005 to 2010; Global Head of Audit, KPMGI (consortium of KPMG firms) from 2006 to 2010; Director, YMCA of Greater New York from 2006 to 2010. | | 35 RICs consisting of 158 Portfolios | | Hertz Global Holdings (car rental); Montpelier Re Holdings, Ltd. (publicly held property and casualty reinsurance) from 2013 until 2015; WABCO (commercial vehicle safety systems); Sealed Air Corp. (packaging) |
| | |
D I R E C T O R A N D O F F I C E R I N F O R M A T I O N O F M A S T E R L A R G E C A P S E R I E S L L C | | 51 |
Director and Officer Information of Master Large Cap Series LLC (continued)
| | | | | | | | |
| Independent Directors(a) |
| | | | | |
Name Year of Birth(b) | | Position(s) Held (Length of Service)(c) | | Principal Occupation(s) During Past Five Years | | Number of BlackRock-Advised Registered Investment Companies (“RICs”) Consisting of Investment Portfolios (“Portfolios”) Overseen | | Public Company and Other Investment Company Directorships Held During Past Five Years |
| | | | |
Cynthia A. Montgomery 1952 | | Director
(Since 2007) | | Professor, Harvard Business School since 1989. | | 35 RICs consisting of 158 Portfolios | | Newell Rubbermaid, Inc. (manufacturing) |
| | | | |
Donald C. Opatrny 1952 | | Director
(Since 2019) | | Trustee, Vice Chair, Member of the Executive Committee and Chair of the Investment Committee, Cornell University since 2004; President, Trustee and Member of the Investment Committee, The Aldrich Contemporary Art Museum from 2007 to 2014; Member of the Board and Investment Committee, University School from 2007 to 2018; Member of the Investment Committee, Mellon Foundation from 2009 to 2015; Trustee, Artstor (a Mellon Foundation affiliate) from 2010 to 2015; President and Trustee, the Center for the Arts, Jackson Hole from 2011 to 2018; Director, Athena Capital Advisors LLC (investment management firm) since 2013; Trustee and Chair of the Investment Committee, Community Foundation of Jackson Hole since 2014; Member of Affordable Housing Supply Board of Jackson, Wyoming since 2018; Member, Investment Funds Committee, State of Wyoming since 2017; Trustee, Phoenix Art Museum since 2018;Trustee, Arizona Community Foundation and Member of Investment Committee since 2020. | | 35 RICs consisting of 158 Portfolios | | None |
| | | | |
Joseph P. Platt 1947 | | Director
(Since 2007) | | General Partner, Thorn Partners, LP (private investments) since 1998; Director, WQED Multi-Media (public broadcasting not-for-profit) since 2001; Chair, Basic Health International (non-profit) since 2015. | | 35 RICs consisting of 158 Portfolios | | Greenlight Capital Re, Ltd. (reinsurance company); Consol Energy Inc. |
| | | | |
Kenneth L. Urish 1951 | | Director (Since 2007) | | Managing Partner, Urish Popeck & Co., LLC (certified public accountants and consultants) since 1976; Past-Chairman of the Professional Ethics Committee of the Pennsylvania Institute of Certified Public Accountants and Committee Member thereof since 2007; Member of External Advisory Board, The Pennsylvania State University Accounting Department since founding in 2001; Principal, UP Strategic Wealth Investment Advisors, LLC since 2013; Trustee, The Holy Family Institute from 2001 to 2010; President and Trustee, Pittsburgh Catholic Publishing Associates from 2003 to 2008; Director, Inter-Tel from 2006 to 2007. | | 35 RICs consisting of 158 Portfolios | | None |
| | | | |
Claire A. Walton 1957 | | Director (Since 2016) | | Chief Operating Officer and Chief Financial Officer of Liberty Square Asset Management, LP from 1998 to 2015; General Partner of Neon Liberty Capital Management, LLC since 2003; Director, Boston Hedge Fund Group from 2009 to 2018; Director, Woodstock Ski Runners since 2013; Director, Massachusetts Council on Economic Education from 2013 to 2015. | | 35 RICs consisting of 158 Portfolios | | None |
| | |
| 52 | | 2 0 2 0 B L A C K R O C K A N N U A L R E P O R T T O S H A R E H O L D E R S |
Director and Officer Information of Master Large Cap Series LLC (continued)
| | | | | | | | |
| Interested Directors(a)(d) |
| | | | | |
Name Year of Birth(b) | | Position(s) Held (Length of Service)(c) | | Principal Occupation(s) During Past Five Years | | Number of BlackRock-Advised Registered Investment Companies (“RICs”) Consisting of Investment Portfolios (“Portfolios”) Overseen | | Public Company and Other Investment Company Directorships Held During Past Five Years |
| | | | |
Robert Fairbairn 1965 | | Director
(Since 2018) | | Vice Chairman of BlackRock, Inc. since 2019; Member of BlackRock’s Global Executive and Global Operating Committees; Co-Chair of BlackRock’s Human Capital Committee; Senior Managing Director of BlackRock, Inc. from 2010 to 2019; oversaw BlackRock’s Strategic Partner Program and Strategic Product Management Group from 2012 to 2019; Member of the Board of Managers of BlackRock Investments, LLC from 2011 to 2018; Global Head of BlackRock’s Retail and iShares® businesses from 2012 to 2016. | | 122 RICs consisting of 269 Portfolios | | None |
| | | | |
John M. Perlowski(e) 1964 | | Director (since 2015), President and Chief Executive Officer
(Since 2010) | | Managing Director of BlackRock, Inc. since 2009; Head of BlackRock Global Accounting and Product Services since 2009; Advisory Director of Family Resource Network (charitable foundation) since 2009. | | 123 RICs consisting of 270 Portfolios | | None |
(a) The address of each Director is c/o BlackRock, Inc., 55 East 52nd Street, New York, New York 10055. (b) Independent Directors serve until their resignation, retirement, removal or death, or until December 31 of the year in which they turn 75. The Board may determine to extend the terms of Independent Directors on a case-by-case basis, as appropriate. (c) Following the combination of MLIM and BlackRock, Inc. in September 2006, the various legacy MLIM and legacy BlackRock fund boards were realigned and consolidated into three new fund boards in 2007. Furthermore, effective January 1, 2019, three BlackRock Fund Complexes were realigned and consolidated into two BlackRock Fund Complexes. As a result, although the chart shows the year that each Independent Director joined the Board, certain Independent Directors first became members of the boards of other BlackRock-advised Funds, legacy MLIM funds or legacy BlackRock funds as follows: Bruce R. Bond, 2005; Cynthia A. Montgomery, 1994; Joseph P. Platt, 1999; Kenneth L. Urish, 1999; Lena G. Goldberg, 2016; Henry R. Keizer, 2016; Donald C. Opatrny, 2015. (d) Mr. Fairbairn and Mr. Perlowski are both “interested persons,” as defined in the 1940 Act, of the Corporation/Master LLC based on their positions with BlackRock, Inc. and its affiliates. Mr. Fairbairn and Mr. Perlowski are also board members of the BlackRock Fixed-Income Complex. (e) Mr. Perlowski is also a trustee of the BlackRock Credit Strategies Fund. |
| | |
D I R E C T O R A N D O F F I C E R I N F O R M A T I O N O F M A S T E R L A R G E C A P S E R I E S L L C | | 53 |
Director and Officer Information of Master Large Cap Series LLC (continued)
| | | | |
| Officers Who Are Not Directors(a) |
| | | |
Name Year of Birth(b) | | Position(s) Held (Length of Service) | | Principal Occupation(s) During Past Five Years |
| | |
Jennifer McGovern 1977 | | Vice President
(Since 2014) | | Managing Director of BlackRock, Inc. since 2016; Director of BlackRock, Inc. from 2011 to 2015; Head of Americas Product Development and Governance for BlackRock’s Global Product Group since 2019; Head of Product Structure and Oversight for BlackRock’s U.S. Wealth Advisory Group from 2013 to 2019. |
| | |
Neal J. Andrews 1966 | | Chief Financial Officer
(Since 2007) | | Chief Financial Officer of the iShares® exchange traded funds from 2019 to 2020; Managing Director of BlackRock, Inc. since 2006. |
| | |
Jay M. Fife 1970 | | Treasurer
(Since 2007) | | Managing Director of BlackRock, Inc. since 2007. |
| | |
Charles Park 1967 | | Chief Compliance Officer
(Since 2014) | | Anti-Money Laundering Compliance Officer for certain BlackRock-advised Funds from 2014 to 2015; Chief Compliance Officer of BlackRock Advisors, LLC and the BlackRock-advised Funds in the BlackRock Multi-Asset Complex and the BlackRock Fixed-Income Complex since 2014; Principal of and Chief Compliance Officer for iShares® Delaware Trust Sponsor LLC since 2012 and BlackRock Fund Advisors (“BFA”) since 2006; Chief Compliance Officer for the BFA-advised iShares® exchange traded funds since 2006; Chief Compliance Officer for BlackRock Asset Management International Inc. since 2012. |
| | |
Lisa Belle 1968 | | Anti-Money Laundering Compliance Officer
(Since 2019) | | Managing Director of BlackRock, Inc. since 2019; Global Financial Crime Head for Asset and Wealth Management of JP Morgan from 2013 to 2019; Managing Director of RBS Securities from 2012 to 2013; Head of Financial Crimes for Barclays Wealth Americas from 2010 to 2012. |
| | |
Janey Ahn 1975 | | Secretary
(Since 2019) | | Managing Director of BlackRock, Inc. since 2018; Director of BlackRock, Inc. from 2009 to 2017. |
(a) The address of each Officer is c/o BlackRock, Inc., 55 East 52nd Street, New York, New York 10055. (b) Officers of the Corporation/Master LLC serve at the pleasure of the Board. |
Further information about the Corporation’s/Master LLC’s Directors and Officers is available in the Corporation’s Statement of Additional Information, which can be obtained without charge by calling (800) 441-7762.
| | |
| 54 | | 2 0 2 0 B L A C K R O C K A N N U A L R E P O R T T O S H A R E H O L D E R S |
| | |
Portfolio Information as of September 30, 2020 | | Master Total Return Portfolio |
| | | | |
| PORTFOLIO COMPOSITION | |
| | |
Asset Type | |
| Percent of
Total Investments |
(a) |
| |
U.S. Government Sponsored Agency Securities | | | 40 | % |
Corporate Bonds | | | 28 | |
U.S. Treasury Obligations | | | 10 | |
Asset-Backed Securities | | | 8 | |
Foreign Government Obligations | | | 5 | |
Non-Agency Mortgage-Backed Securities | | | 4 | |
Municipal Bonds | | | 2 | |
Floating Rate Loan Interests | | | 1 | |
Investment Companies | | | 1 | |
Foreign Agency Obligations | | | 1 | |
Preferred Securities | | | — | (b) |
Common Stocks | | | — | (b) |
Warrants | | | — | (b) |
| | | | |
| CREDIT QUALITY ALLOCATION | |
| | |
Credit Rating(c) | |
| Percent of
Total Investments |
(a) |
| |
AAA/Aaa(d) | | | 55 | % |
AA/Aa | | | 4 | |
A | | | 14 | |
BBB/Baa | | | 14 | |
BB/Ba | | | 4 | |
B | | | 2 | |
CCC/Caa | | | 1 | |
N/R | | | 6 | |
| (a) | Total investments exclude short-term securities, options purchased, options written and TBA sale commitments. |
| (b) | Amount is less than 1%. |
| (c) | For financial reporting purposes, credit quality ratings shown above reflect the highest rating assigned by either S&P Global Ratings or Moody’s if ratings differ. These rating agencies are independent, nationally recognized statistical rating organizations and are widely used. Investment grade ratings are credit ratings of BBB/Baa or higher. Below investment grade ratings are credit ratings of BB/Ba or lower. Investments designated N/R are not rated by either rating agency. Unrated investments do not necessarily indicate low credit quality. Credit quality ratings are subject to change. |
| (d) | The investment adviser evaluates the credit quality of unrated investments based upon certain factors including, but not limited to, credit ratings for similar investments and financial analysis of sectors, individual investments and/or issuers. Using this approach, the investment adviser has deemed unrated U.S. Government Sponsored Agency Securities and U.S. Treasury Obligations to be of similar credit quality as investments rated AAA/Aaa. |
| | |
P O R T F O L I O I N F O R M A T I O N | | 55 |
| | |
Schedule of Investments September 30, 2020 | | Master Total Return Portfolio (Percentages shown are based on Net Assets) |
| | | | | | | | | | | | |
| Security | | | | | Par
(000) | | | Value | |
| | | |
| Asset-Backed Securities | | | | | | | | | |
ACE Securities Corp. Home Equity Loan Trust | | | | | | | | | | | | |
Series 2003-OP1, Class A2, (1 mo. LIBOR US + 0.72%), 0.87%, 12/25/33(a) | | | USD | | | | 581 | | | $ | 517,304 | |
Series 2006-CW1, Class A2C, (1 mo. LIBOR US + 0.14%), 0.29%, 07/25/36(a) | | | | | | | 352 | | | | 302,596 | |
Series 2007-HE4, Class A2A, (1 mo. LIBOR US + 0.13%), 0.28%, 05/25/37(a) | | | | | | | 2,657 | | | | 686,030 | |
Series 2007-HE4, Class A2C, (1 mo. LIBOR US + 0.30%), 0.45%, 05/25/37(a) | | | | | | | 234 | | | | 65,466 | |
ACIS CLO Ltd., Series 2014-4A, Class A, (3 mo. LIBOR US + 1.42%), 1.67%, 05/01/26(a)(b) | | | | | | | 511 | | | | 510,409 | |
Adams Mill CLO Ltd. | | | | | | | | | | | | |
Series 2014-1A, Class A2R, (3 mo. LIBOR US + 1.10%),
1.38%, 07/15/26(a)(b) | | | | | | | 2,544 | | | | 2,533,287 | |
Series 2014-1A, Class C1R, (3 mo. LIBOR US + 2.35%),
2.63%, 07/15/26(a)(b) | | | | | | | 1,610 | | | | 1,592,450 | |
AGL CLO 7 Ltd. | | | | | | | | | | | | |
Series 2020-7A, Class A1, (3 mo. LIBOR US + 1.80%), 2.05%, 07/15/31(a)(b) | | | | | | | 2,400 | | | | 2,400,003 | |
Series 2020-7A, Class D, (3 mo. LIBOR US + 4.40%), 4.65%, 07/15/31(a)(b) | | | | | | | 500 | | | | 500,013 | |
AGL Core CLO 2 Ltd., Series 2019-2A, Class A1, (3 mo. LIBOR US + 1.39%), 1.66%, 04/20/32(a)(b) | | | | | | | 8,405 | | | | 8,396,956 | |
AGL Core CLO 5 Ltd., Series 2020-5A, Class D, (3 mo. LIBOR US + 4.95%), 5.25%, 07/20/30(a)(b)(c) | | | | | | | 1,750 | | | | 1,737,400 | |
AIMCO CLO | | | | | | | | | | | | |
Series 2015-AA, Class BR, (3 mo. LIBOR US + 1.30%), 1.58%, 01/15/28(a)(b) | | | | | | | 950 | | | | 924,073 | |
Series 2017-AA, Class A, (3 mo. LIBOR US + 1.26%), 1.53%, 07/20/29(a)(b) | | | | | | | 500 | | | | 497,204 | |
Series 2017-AA, Class C, (3 mo. LIBOR US + 2.45%), 2.72%, 07/20/29(a)(b) | | | | | | | 500 | | | | 489,707 | |
Ajax Mortgage Loan Trust | | | | | | | | | | | | |
Series 2017-D, Class A,
3.75%, 12/25/57(b) | | | | | | | 8,436 | | | | 8,468,338 | |
Series 2017-D, Class B,
0.00%, 12/25/57(b)(c)(d). | | | | | | | 1,691 | | | | 993,123 | |
Series 2018-A, Class A,
3.85%, 04/25/58(b)(c) | | | | | | | 8,881 | | | | 8,837,932 | |
Series 2018-A, Class B,
0.00%, 04/25/58(b) | | | | | | | 2,641 | | | | 1,354,051 | |
Series 2018-B, Class A,
3.75%, 02/26/57(b)(c) | | | | | | | 3,835 | | | | 3,830,735 | |
Series 2018-B, Class B,
0.00%, 02/26/57(b) | | | | | | | 2,646 | | | | 728,691 | |
Series 2018-D, Class A,
3.75%, 08/25/58(b)(c)(d) | | | | | | | 10,203 | | | | 10,202,793 | |
Series 2018-D, Class B,
0.00%, 08/25/58(b)(c)(d) | | | | | | | 2,846 | | | | 1,437,193 | |
Series 2018-E, Class A,
4.38%, 06/25/58(b)(d) | | | | | | | 4,472 | | | | 4,588,967 | |
Series 2018-E, Class B,
5.25%, 06/25/58(b)(c)(d) | | | | | | | 840 | | | | 844,956 | |
Series 2018-E, Class C,
0.00%, 06/25/58(b)(d) | | | | | | | 2,116 | | | | 1,611,265 | |
Series 2018-F, Class A,
4.38%, 11/25/58(b)(c)(d) | | | | | | | 14,503 | | | | 14,620,807 | |
Series 2018-F, Class B,
5.25%, 11/25/58(b)(c)(d) | | | | | | | 2,415 | | | | 2,393,657 | |
Series 2018-F, Class C,
0.00%, 11/25/58(b) | | | | | | | 5,661 | | | | 3,545,878 | |
Series 2018-G, Class A,
4.38%, 06/25/57(b)(c)(d) | | | | | | | 11,942 | | | | 11,643,824 | |
Series 2018-G, Class B,
5.25%, 06/25/57(b)(c)(d) | | | | | | | 2,042 | | | | 1,541,710 | |
Series 2018-G, Class C,
0.00%, 06/25/57(b)(c) | | | | | | | 5,261 | | | | 5,173,482 | |
Series 2019-A, Class A,
3.75%, 08/25/57(b)(d) | | | | | | | 12,182 | | | | 12,392,604 | |
Series 2019-A, Class B,
5.25%, 08/25/57(b)(d) | | | | | | | 1,720 | | | | 1,542,193 | |
Series 2019-A, Class C,
0.00%, 08/25/57(b)(c) | | | | | | | 4,309 | | | | 3,569,411 | |
Series 2019-B, Class A,
3.75%, 01/25/59(b)(d) | | | | | | | 19,873 | | | | 20,214,846 | |
Series 2019-B, Class B,
5.25%, 01/25/59(b)(c)(d) | | | | | | | 2,845 | | | | 2,147,975 | |
Series 2019-B, Class C,
0.00%, 01/25/59(b)(c) | | | | | | | 7,281 | | | | 6,249,106 | |
Series 2019-C, Class A,
3.95%, 10/25/58(b)(d) | | | | | | | 6,414 | | | | 6,440,581 | |
Series 2019-E, Class A,
3.00%, 09/25/59(b) | | | | | | | 22,336 | | | | 22,189,098 | |
Series 2019-E, Class B,
4.88%, 09/25/59(b) | | | | | | | 2,600 | | | | 2,245,827 | |
Series 2019-E, Class C,
0.00%, 09/25/59(b) | | | | | | | 5,988 | | | | 3,207,124 | |
| | | | | | | | | | | | |
| Security | | | | | Par
(000) | | | Value | |
|
| Asset-Backed Securities (continued) | |
Ajax Mortgage Loan Trust | | | | | | | | | | | | |
Series 2019-G, Class A,
3.00%, 09/25/59(b)(e) | | | USD | | | | 15,656 | | | $ | 15,528,496 | |
Series 2019-G, Class B,
4.25%, 09/25/59(b)(e) | | | | | | | 2,120 | | | | 1,786,009 | |
Series 2019-G, Class C,
0.00%, 09/25/59(b) | | | | | | | 5,425 | | | | 4,195,698 | |
Series 2019-H, Class A,
3.00%, 11/25/59(b)(e) | | | | | | | 13,839 | | | | 13,725,534 | |
Series 2019-H, Class B,
4.25%, 11/25/59(b)(e) | | | | | | | 1,970 | | | | 1,659,640 | |
Series 2019-H, Class C, 0.00%, 11/25/59(b) | | | | | | | 5,033 | | | | 4,083,577 | |
Series 2020-A, Class A, 2.38%, 12/25/59(b) | | | | | | | 27,491 | | | | 27,415,027 | |
Series 2020-A, Class B, 3.50%, 12/25/59(b) | | | | | | | 3,853 | | | | 3,836,097 | |
Series 2020-A, Class C,
0.00%, 12/25/59(b)(c) | | | | | | | 9,310 | | | | 5,834,255 | |
Series 2020-C, Class A,
2.25%, 09/27/60(b)(c)(e) | | | | | | | 30,440 | | | | 29,921,360 | |
Series 2020-C, Class B,
5.00%, 09/27/60(b)(e) | | | | | | | 2,981 | | | | 2,939,389 | |
Series 2020-C, Class C, 0.00%, 09/27/60(b) | | | | | | | 10,135 | | | | 8,273,031 | |
Series 2020-D, Class A,
2.25%, 06/25/60(b)(c)(e) | | | | | | | 29,270 | | | | 28,791,699 | |
Series 2020-D, Class B,
5.00%, 06/25/60(b)(e) | | | | | | | 4,238 | | | | 4,179,318 | |
Series 2020-D, Class C, 0.00%, 06/25/60(b) | | | | | | | 10,899 | | | | 8,688,731 | |
Allegro CLO II-S Ltd., Series 2014-1RA, Class A1, (3 mo. LIBOR US + 1.08%),
1.35%, 10/21/28(a)(b) | | | | | | | 3,790 | | | | 3,779,830 | |
Allegro CLO IV Ltd. | | | | | | | | | | | | |
Series 2016-1A, Class AR, (3 mo. LIBOR US + 1.15%), 1.43%, 01/15/30(a)(b) | | | | | | | 6,568 | | | | 6,542,057 | |
Series 2016-1A, Class BR, (3 mo. LIBOR US + 1.70%), 1.98%, 01/15/30(a)(b) | | | | | | | 2,530 | | | | 2,485,527 | |
Allegro CLO V Ltd., Series 2017-1A, Class A, (3 mo. LIBOR US + 1.24%), 1.51%, 10/16/30(a)(b) | | | | | | | 1,100 | | | | 1,093,812 | |
ALM 2020 Ltd., Series 2020-1A, Class A2, (3 mo. LIBOR US + 1.85%),
2.13%, 10/15/29(a)(b) | | | | | | | 7,780 | | | | 7,773,920 | |
ALM VII Ltd. | | | | | | | | | | | | |
Series 2012-7A, Class A1A2, (3 mo. LIBOR US + 1.17%),
1.45%, 07/15/29(a)(b) | | | | | | | 750 | | | | 745,986 | |
Series 2012-7A, Class A2R2, (3 mo. LIBOR US + 1.85%),
2.13%, 07/15/29(a)(b) | | | | | | | 591 | | | | 586,221 | |
ALM VII R Ltd., Series 2013-7RA, Class A1R, (3 mo. LIBOR US + 1.41%), 1.69%, 10/15/28(a)(b) | | | | | | | 2,970 | | | | 2,957,604 | |
ALM XIX Ltd. | | | | | | | | | | | | |
Series 2016-19A, Class A1RA, (3 mo. LIBOR US + 1.00%),
1.28%, 04/16/29(a)(b)(c) | | | | | | | 750 | | | | 747,375 | |
Series 2016-19A, Class A1RB, (3 mo. LIBOR US + 1.35%),
1.63%, 04/16/29(a)(b)(c) | | | | | | | 500 | | | | 482,850 | |
Series 2016-19A, Class A2RA, (3 mo. LIBOR US + 1.45%),
1.73%, 04/16/29(a)(b)(c) | | | | | | | 3,370 | | | | 3,338,996 | |
ALM XVI Ltd./ALM XVI LLC | | | | | | | | | | | | |
Series 2015-16A, Class A2R2, (3 mo. LIBOR US + 1.50%),
1.78%, 07/15/27(a)(b) | | | | | | | 6,284 | | | | 6,223,344 | |
Series 2015-16A, Class BR2, (3 mo. LIBOR US + 1.90%),
2.18%, 07/15/27(a)(b) | | | | | | | 2,060 | | | | 2,006,035 | |
ALM XVIII Ltd., Series 2016-18A, Class A2R, (3 mo. LIBOR US + 1.65%), 1.93%, 01/15/28(a)(b) | | | | | | | 1,250 | | | | 1,225,797 | |
AMMC CLO 16 Ltd., Series 2015-16A, Class BR, (3 mo. LIBOR US + 1.60%), 1.87%, 04/14/29(a)(b) | | | | | | | 500 | | | | 487,979 | |
AMMC CLO 21 Ltd., Series 2017-21A, Class A, (3 mo. LIBOR US + 1.25%), 1.50%, 11/02/30(a)(b) | | | | | | | 750 | | | | 743,920 | |
AMMC CLO XII Ltd., Series 2013-12A, Class AR, (3 mo. LIBOR US + 1.20%), 1.44%, 11/10/30(a)(b) | | | | | | | 540 | | | | 536,437 | |
| | |
| 56 | | 2 0 2 0 B L A C K R O C K A N N U A L R E P O R T T O S H A R E H O L D E R S |
| | |
Schedule of Investments (continued) September 30, 2020 | | Master Total Return Portfolio (Percentages shown are based on Net Assets) |
| | | | | | | | | | | | |
| Security | | | | | Par
(000) | | | Value | |
| | | |
| Asset-Backed Securities (continued) | | | | | | | | | |
AMMC CLO XIII Ltd., Series 2013-13A, Class A1LR, (3 mo. LIBOR US + 1.26%), 1.52%, 07/24/29(a)(b) | | | USD | | | | 2,592 | | | $ | 2,585,474 | |
AMMC CLO XIV Ltd., Series 2014-14A, Class A1LR, (3 mo. LIBOR US + 1.25%), 1.49%, 07/25/29(a)(b) | | | | | | | 6,220 | | | | 6,197,343 | |
AMSR Trust | | | | | | | | | | | | |
Series 2020-SFR1, Class E, 3.22%, 04/17/37(b) | | | | | | | 1,280 | | | | 1,299,885 | |
Series 2020-SFR2, Class D, 3.28%, 07/17/37(b) | | | | | | | 2,437 | | | | 2,534,057 | |
Series 2020-SFR3, Class E1, 2.56%, 09/17/37(b) | | | | | | | 2,490 | | | | 2,490,239 | |
Series 2020-SFR4, Class E2, 2.46%, 11/17/37(b) | | | | | | | 2,500 | | | | 2,502,674 | |
Series 2020-SFR4, Class F, 2.86%, 11/17/37(b) | | | | | | | 2,760 | | | | 2,761,701 | |
Anchorage Capital CLO 3-R Ltd. | | | | | | | | | | | | |
Series 2014-3RA, Class A, (3 mo. LIBOR US + 1.05%), 1.30%, 01/28/31(a)(b) | | | | | | | 2,120 | | | | 2,101,599 | |
Series 2014-3RA, Class B, (3 mo. LIBOR US + 1.50%), 1.75%, 01/28/31(a)(b) | | | | | | | 3,600 | | | | 3,534,065 | |
Series 2014-3RA, Class C, (3 mo. LIBOR US + 1.85%), 2.10%, 01/28/31(a)(b) | | | | | | | 500 | | | | 484,160 | |
Anchorage Capital CLO 4-R Ltd. | | | | | | | | | | | | |
Series 2014-4RA, Class A, (3 mo. LIBOR US + 1.05%), 1.30%, 01/28/31(a)(b) | | | | | | | 5,330 | | | | 5,277,371 | |
Series 2014-4RA, Class C, (3 mo. LIBOR US + 1.85%), 2.10%, 01/28/31(a)(b) | | | | | | | 5,550 | | | | 5,319,544 | |
Anchorage Capital CLO 5-R Ltd. | | | | | | | | | | | | |
Series 2014-5RA, Class B, (3 mo. LIBOR US + 1.45%), 1.73%, 01/15/30(a)(b) | | | | | | | 9,200 | | | | 8,985,844 | |
Series 2014-5RA, Class C, (3 mo. LIBOR US + 1.85%), 2.13%, 01/15/30(a)(b) | | | | | | | 3,540 | | | | 3,383,750 | |
Anchorage Capital CLO 6 Ltd., Series 2015-6A, Class AR, (3 mo. LIBOR US + 1.27%), 1.55%, 07/15/30(a)(b) | | | | | | | 4,010 | | | | 3,982,788 | |
Anchorage Capital CLO 7 Ltd. | | | | | | | | | | | | |
Series 2015-7A, Class AR2, (3 mo. LIBOR US + 1.09%), 1.34%, 01/28/31(a)(b) | | | | | | | 4,936 | | | | 4,871,673 | |
Series 2015-7A, Class BR2, (3 mo. LIBOR US + 1.75%), 2.00%, 01/28/31(a)(b) | | | | | | | 7,620 | | | | 7,457,055 | |
Series 2015-7A, Class CR2, (3 mo. LIBOR US + 2.20%), 2.45%, 01/28/31(a)(b) | | | | | | | 4,250 | | | | 4,122,752 | |
Series 2015-7A, Class D1R2, (3 mo. LIBOR US + 3.50%), 3.75%, 01/28/31(a)(b) | | | | | | | 1,140 | | | | 1,085,441 | |
Anchorage Capital CLO 8 Ltd. | | | | | | | | | | | | |
Series 2016-8A, Class AR, (3 mo. LIBOR US + 1.00%), 1.25%, 07/28/28(a)(b) | | | | | | | 2,430 | | | | 2,423,458 | |
Series 2016-8A, Class BR, (3 mo. LIBOR US + 1.60%), 1.85%, 07/28/28(a)(b) | | | | | | | 3,050 | | | | 3,001,945 | |
Anchorage Capital CLO Ltd. | | | | | | | | | | | | |
Series 2013-1A, Class A1R, (3 mo. LIBOR US + 1.25%), 1.52%, 10/13/30(a)(b) | | | | | | | 2,755 | | | | 2,745,246 | |
Series 2013-1A, Class A2R, (3 mo. LIBOR US + 1.65%), 1.92%, 10/13/30(a)(b) | | | | | | | 750 | | | | 734,256 | |
Series 2013-1A, Class BR, (3 mo. LIBOR US + 2.15%), 2.42%, 10/13/30(a)(b) | | | | | | | 1,410 | | | | 1,367,922 | |
Anchorage Capital Europe CLO 2 DAC, Series 2A, Class B, (3 mo. EURIBOR + 1.80%), 1.80%, 05/15/31(a)(b) | | | EUR | | | | 250 | | | | 292,540 | |
Apidos CLO XII, Series 2013-12A, Class AR, (3 mo. LIBOR US + 1.08%), 1.36%, 04/15/31(a)(b) | | | USD | | | | 3,152 | | | | 3,103,141 | |
| | | | | | | | | | | | |
| Security | | | | | Par
(000) | | | Value | |
| | | |
| Asset-Backed Securities (continued) | | | | | | | | | |
Apidos CLO XV, Series 2013-15A, Class A1RR, (3 mo. LIBOR US + 1.01%),
1.28%, 04/20/31(a)(b) | | | USD | | | | 1,080 | | | $ | 1,073,068 | |
Apidos CLO XVIII, Series 2018-18A, Class A1, (3 mo. LIBOR US + 1.14%),
1.40%, 10/22/30(a)(b) | | | | | | | 880 | | | | 868,840 | |
Apidos CLO XXXI, Series 2019-31A, Class B, (3 mo. LIBOR US + 1.90%),
2.18%, 04/15/31(a)(b) | | | | | | | 2,950 | | | | 2,949,988 | |
Apres Static CLO Ltd., Series 2019-1A, Class A2, (3 mo. LIBOR US + 1.75%), 2.03%, 01/15/27(a)(b) | | | | | | | 350 | | | | 348,203 | |
Aqueduct European CLO DAC | | | | | | | | | | | | |
Series 2019-4A, Class B1, (3 mo. EURIBOR + 1.80%), 1.80%, 07/15/32(a)(b) | | | EUR | | | | 750 | | | | 878,537 | |
Series 2019-4X, Class B1, (3 mo. EURIBOR + 1.80%), 1.80%, 07/15/32(a) | | | | | | | 1,560 | | | | 1,827,356 | |
Arbor Realty Collateralized Loan Obligation Ltd., Series 2017-FL3, Class A, (1 mo. LIBOR US + 0.99%), 1.14%, 12/15/27(a)(b) | | | USD | | | | 3,740 | | | | 3,696,446 | |
Arbour CLO II DAC, Series 2014-2X, Class B2R, (3 mo. EURIBOR + 1.50%),
1.50%, 05/15/30(a) | | | EUR | | | | 995 | | | | 1,159,669 | |
ARBOUR CLO VIII DAC, Series 8A, Class C,
(3 mo. EURIBOR + 2.90%),
2.90%, 07/15/33(a)(b)(c) | | | | | | | 550 | | | | 644,851 | |
Ares European CLO X BV, Series 10X,
Class B1, (3 mo. EURIBOR + 1.70%), 1.70%, 10/15/31(a) | | | | | | | 820 | | | | 954,191 | |
Ares European CLO XI BV, Series 11X,
Class B1, (3 mo. EURIBOR + 1.85%), 1.85%, 04/15/32(a) | | | | | | | 730 | | | | 853,411 | |
Ares European CLO XII BV, Series 12X,
Class B1, (3 mo. EURIBOR + 1.75%), 1.75%, 04/20/32(a) | | | | | | | 1,370 | | | | 1,600,495 | |
Ares XXXVII CLO Ltd., Series 2015-4A, Class A1R, (3 mo. LIBOR US + 1.17%), 1.45%, 10/15/30(a)(b) | | | USD | | | | 1,150 | | | | 1,138,426 | |
Argent Mortgage Loan Trust, Series 2005-W1, Class A2, (1 mo. LIBOR US + 0.48%), 0.63%, 05/25/35(a) | | | | | | | 3,796 | | | | 3,435,506 | |
ASSURANT CLO I Ltd., Series 2017-1A,
Class B, (3 mo. LIBOR US + 1.70%),
1.97%, 10/20/29(a)(b) | | | | | | | 1,400 | | | | 1,371,556 | |
Atrium IX, Series 9A, Class AR, (3 mo. LIBOR US + 1.24%), 1.50%, 05/28/30(a)(b) | | | | | | | 4,010 | | | | 3,913,133 | |
Atrium XII | | | | | | | | | | | | |
Series 12A, Class AR, (3 mo. LIBOR US + 0.83%), 1.09%, 04/22/27(a)(b) | | | | | | | 1,602 | | | | 1,586,783 | |
Series 12A, Class CR, (3 mo. LIBOR US + 1.65%), 1.91%, 04/22/27(a)(b) | | | | | | | 2,381 | | | | 2,259,779 | |
Atrium XIII, Series 13A, Class B, (3 mo. LIBOR US + 1.50%), 1.76%, 11/21/30(a)(b) | | | | | | | 1,000 | | | | 972,758 | |
Avery Point IV CLO Ltd., Series 2014-1A,
Class AR, (3 mo. LIBOR US + 1.10%), 1.35%, 04/25/26(a)(b) | | | | | | | 7,040 | | | | 7,037,769 | |
Avery Point V CLO Ltd. | | | | | | | | | | | | |
Series 2014-5A, Class AR, (3 mo. LIBOR US + 0.98%), 1.25%, 07/17/26(a)(b) | | | | | | | 1,344 | | | | 1,341,937 | |
Series 2014-5A, Class BR, (3 mo. LIBOR US + 1.50%), 1.77%, 07/17/26(a)(b) | | | | | | | 2,250 | | | | 2,230,822 | |
Avery Point VI CLO Ltd. | | | | | | | | | | | | |
Series 2015-6A, Class AR, (3 mo. LIBOR US + 1.05%), 1.30%, 08/05/27(a)(b) | | | | | | | 3,959 | | | | 3,955,238 | |
Series 2015-6A, Class BR, (3 mo. LIBOR US + 1.50%), 1.75%, 08/05/27(a)(b) | | | | | | | 3,240 | | | | 3,172,795 | |
| | |
S C H E D U L E O F I N V E S T M E N T S | | 57 |
| | |
Schedule of Investments (continued) September 30, 2020 | | Master Total Return Portfolio (Percentages shown are based on Net Assets) |
| | | | | | | | | | | | |
| Security | | | | | Par
(000) | | | Value | |
| | | |
| Asset-Backed Securities (continued) | | | | | | | | | |
Avery Point VII CLO Ltd., Series 2015-7A, Class AR, (3 mo. LIBOR US + 1.14%), 1.42%, 01/15/28(a)(b) | | | USD | | | | 7,480 | | | $ | 7,440,052 | |
Avoca CLO XII Ltd., Series 12X, Class CR, (3 mo. EURIBOR + 2.05%), 2.05%, 04/15/30(a) | | | EUR | | | | 475 | | | | 548,864 | |
Avoca CLO XV DAC, Series 15X, Class B2R, (3 mo. EURIBOR + 1.05%), 1.05%, 04/15/31(a) | | | | | | | 400 | | | | 456,258 | |
Avoca CLO XVII DAC, Series 17A, Class B1R, (3 mo. EURIBOR + 1.70%), 1.70%, 10/15/32(a)(b) | | | | | | | 1,390 | | | | 1,639,088 | |
Avoca CLO XVIII DAC, Series 18X, Class C, (3 mo. EURIBOR + 1.75%), 1.75%, 04/15/31(a) | | | | | | | 400 | | | | 455,458 | |
B2R Mortgage Trust, Series 2015-2, Class A, 3.34%, 11/15/48(b) | | | USD | | | | 26 | | | | 25,879 | |
Babson CLO Ltd. | | | | | | | | | | | | |
Series 2015-2A, Class AR, (3 mo. LIBOR US + 1.19%), 1.46%, 10/20/30(a)(b) | | | | | | | 2,590 | | | | 2,571,497 | |
Series 2015-IA, Class BR, (3 mo. LIBOR US + 1.40%), 1.67%, 01/20/31(a)(b) | | | | | | | 610 | | | | 595,697 | |
Bain Capital Credit CLO Ltd. | | | | | | | | | | | | |
Series 2016-2A, Class AR, (3 mo. LIBOR US + 1.14%), 1.42%, 01/15/29(a)(b) | | | | | | | 1,346 | | | | 1,332,618 | |
Series 2016-2A, Class BR, (3 mo. LIBOR US + 1.80%), 2.08%, 01/15/29(a)(b) | | | | | | | 1,000 | | | | 991,332 | |
Series 2018-2A, Class A1, (3 mo. LIBOR US + 1.08%), 1.35%, 07/19/31(a)(b) | | | | | | | 1,420 | | | | 1,402,553 | |
BankAmerica Manufactured Housing Contract Trust | | | | | | | | | | | | |
Series 1997-2, Class B1,
7.07%, 02/10/22(d) | | | | | | | 1,680 | | | | 995,198 | |
Series 1998-2, Class B1,
7.46%, 12/10/25(d) | | | | | | | 2,790 | | | | 1,314,909 | |
Barings CLO Ltd., Series 2018-3A, Class A1, (3 mo. LIBOR US + 0.95%), 1.22%, 07/20/29(a)(b) | | | | | | | 1,085 | | | | 1,073,637 | |
Battalion CLO 18 Ltd. | | | | | | | | | | | | |
Series 2020-18A, Class B, (3 mo. LIBOR US + 2.30%), 0.00%, 10/15/32(a)(b) | | | | | | | 1,827 | | | | 1,827,000 | |
Series 2020-18A, Class D1, (3 mo. LIBOR US + 4.00%), 0.00%, 10/15/32(a)(b) | | | | | | | 1,617 | | | | 1,617,000 | |
Battalion CLO VII Ltd., Series 2014-7A, Class A1RR, (3 mo. LIBOR US + 1.04%), 1.31%, 07/17/28(a)(b) | | | | | | | 3,450 | | | | 3,429,869 | |
Battalion CLO VIII Ltd. | | | | | | | | | | | | |
Series 2015-8A, Class A1R2, (3 mo. LIBOR US + 1.07%),
1.34%, 07/18/30(a)(b) | | | | | | | 6,500 | | | | 6,421,809 | |
Series 2015-8A, Class A2R2, (3 mo. LIBOR US + 1.55%),
1.82%, 07/18/30(a)(b) | | | | | | | 3,250 | | | | 3,155,678 | |
Series 2015-8A, Class BR2, (3 mo. LIBOR US + 2.00%),
2.27%, 07/18/30(a)(b) | | | | | | | 2,901 | | | | 2,714,249 | |
Battalion CLO X Ltd., Series 2016-10A, Class A1R, (3 mo. LIBOR US + 1.25%), 1.51%, 01/24/29(a)(b) | | | | | | | 23,120 | | | | 23,027,437 | |
Bayview Financial Revolving Asset Trust | | | | | | | | | | | | |
Series 2004-B, Class A1, (1 mo. LIBOR US + 1.00%), 1.15%, 05/28/39(a)(b) | | | | | | | 10,520 | | | | 8,597,070 | |
Series 2004-B, Class A2, (1 mo. LIBOR US + 1.30%), 1.45%, 05/28/39(a)(b) | | | | | | | 216 | | | | 179,548 | |
Series 2005-A, Class A1, (1 mo. LIBOR US + 1.00%), 1.15%, 02/28/40(a)(b) | | | | | | | 2,270 | | | | 2,127,589 | |
Series 2005-E, Class A1, (1 mo. LIBOR US + 1.00%), 1.15%, 12/28/40(a)(b) | | | | | | | 827 | | | | 729,795 | |
BCMSC Trust | | | | | | | | | | | | |
Series 2000-A, Class A2,
7.58%, 06/15/30(d) | | | | | | | 1,674 | | | | 493,954 | |
| | | | | | | | | | | | |
| Security | | | | | Par
(000) | | | Value | |
| | | |
| Asset-Backed Securities (continued) | | | | | | | | | |
BCMSC Trust | | | | | | | | | | | | |
Series 2000-A, Class A3,
7.83%, 06/15/30(d) | | | USD | | | | 1,554 | | | $ | 473,885 | |
Series 2000-A, Class A4,
8.29%, 06/15/30(d) | | | | | | | 1,121 | | | | 361,925 | |
BDS Ltd., Series 2019-FL3, Class A, (1 mo. LIBOR US + 1.40%), 1.55%, 12/15/35(a)(b) | | | | | | | 4,680 | | | | 4,598,307 | |
Bear Stearns Asset-Backed Securities I Trust | | | | | | | | | | | | |
Series 2004-HE7, Class M2, (1 mo. LIBOR US + 1.73%), 1.87%, 08/25/34(a) | | | | | | | 186 | | | | 185,419 | |
Series 2006-HE1, Class 1M4, (1 mo. LIBOR US + 0.68%), 0.83%, 12/25/35(a) | | | | | | | 1,688 | | | | 2,180,845 | |
Series 2006-HE7, Class 1A2, (1 mo. LIBOR US + 0.17%), 0.32%, 09/25/36(a) | | | | | | | 2,680 | | | | 3,294,611 | |
Series 2007-FS1, Class 1A3, (1 mo. LIBOR US + 0.17%), 0.32%, 05/25/35(a) | | | | | | | 894 | | | | 984,087 | |
Series 2007-HE1, Class 21A2, (1 mo. LIBOR US + 0.16%), 0.31%, 01/25/37(a) | | | | | | | 560 | | | | 552,106 | |
Series 2007-HE2, Class 1A4, (1 mo. LIBOR US + 0.32%), 0.47%, 03/25/37(a) | | | | | | | 1,004 | | | | 803,399 | |
Series 2007-HE2, Class 22A, (1 mo. LIBOR US + 0.14%), 0.29%, 03/25/37(a) | | | | | | | 883 | | | | 872,804 | |
Series 2007-HE2, Class 23A, (1 mo. LIBOR US + 0.14%), 0.29%, 03/25/37(a) | | | | | | | 1,615 | | | | 1,687,672 | |
Series 2007-HE3, Class 1A3, (1 mo. LIBOR US + 0.25%), 0.40%, 04/25/37(a) | | | | | | | 1,031 | | | | 1,128,138 | |
Series 2007-HE3, Class 1A4, (1 mo. LIBOR US + 0.35%), 0.50%, 04/25/37(a) | | | | | | | 6,111 | | | | 5,484,475 | |
Bear Stearns Asset-Backed Securities Trust, Series 2005-4, Class M2, (1 mo. LIBOR US + 1.20%), 1.35%, 01/25/36(a) | | | | | | | 33 | | | | 32,684 | |
Benefit Street Partners CLO II Ltd., Series 2013- IIA, Class A2R, (3 mo. LIBOR US + 1.75%), 2.03%, 07/15/29(a)(b) | | | | | | | 900 | | | | 894,477 | |
Benefit Street Partners CLO III Ltd., Series 2013- IIIA, Class A1R, (3 mo. LIBOR US + 1.25%), 1.52%, 07/20/29(a)(b) | | | | | | | 749 | | | | 748,071 | |
Benefit Street Partners CLO IV Ltd., Series 2014- IVA, Class A1RR, (3 mo. LIBOR US + 1.25%), 1.52%, 01/20/29(a)(b) | | | | | | | 7,830 | | | | 7,798,839 | |
Benefit Street Partners CLO V-B Ltd., Series 2018-5BA, Class A1A, (3 mo. LIBOR US + 1.09%), 1.36%, 04/20/31(a)(b) | | | | | | | 4,360 | | | | 4,324,970 | |
Benefit Street Partners CLO VI Ltd. | | | | | | | | | | | | |
Series 2015-VIA, Class A1R, (3 mo. LIBOR US + 1.24%), 1.51%, 10/18/29(a)(b) | | | | | | | 12,030 | | | | 11,980,546 | |
Series 2015-VIA, Class A2R, (3 mo. LIBOR US + 1.72%), 1.99%, 10/18/29(a)(b) | | | | | | | 3,320 | | | | 3,260,881 | |
Benefit Street Partners CLO VII Ltd. | | | | | | | | | | | | |
Series 2015-VIIA, Class A1AR, (3 mo. LIBOR US + 0.78%),
1.05%, 07/18/27(a)(b) | | | | | | | 1,634 | | | | 1,625,559 | |
Series 2015-VIIA, Class CR, (3 mo. LIBOR US + 2.40%), 2.67%, 07/18/27(a)(b) | | | | | | | 600 | | | | 573,764 | |
Benefit Street Partners CLO VIII Ltd., Series 2015- 8A, Class A1AR, (3 mo. LIBOR US + 1.10%), 1.37%, 01/20/31(a)(b) | | | | | | | 1,250 | | | | 1,232,802 | |
Benefit Street Partners CLO X Ltd. | | | | | | | | | | | | |
Series 2016-10A, Class A1R, (3 mo. LIBOR US + 1.14%), 1.42%, 01/15/29(a)(b) | | | | | | | 1,000 | | | | 993,087 | |
Series 2016-10A, Class A2R, (3 mo. LIBOR US + 1.75%), 2.03%, 01/15/29(a)(b) | | | | | | | 600 | | | | 591,541 | |
Benefit Street Partners CLO XX Ltd., Series 2020- 20A, Class D, (3 mo. LIBOR US + 4.25%), 4.40%, 07/15/31(a)(b) | | | | | | | 3,010 | | | | 3,007,886 | |
| | |
| 58 | | 2 0 2 0 B L A C K R O C K A N N U A L R E P O R T T O S H A R E H O L D E R S |
| | |
Schedule of Investments (continued) September 30, 2020 | | Master Total Return Portfolio (Percentages shown are based on Net Assets) |
| | | | | | | | | | | | |
| Security | | | | | Par
(000) | | | Value | |
| | | |
| Asset-Backed Securities (continued) | | | | | | | | | |
Birch Grove CLO Ltd., Series 19A, Class D,
(3 mo. LIBOR US + 3.90%),
4.15%, 06/15/31(a)(b) | | | USD | | | | 1,195 | | | $ | 1,183,789 | |
Black Diamond CLO Ltd., Series 2013-1A, Class A2R, (3 mo. LIBOR US + 1.45%), 1.72%, 02/06/26(a)(b) | | | | | | | 345 | | | | 344,368 | |
BlueMountain CLO Ltd. | | | | | | | | | | | | |
Series 2012-2A, Class AR2, (3 mo. LIBOR US + 1.05%), 1.30%, 11/20/28(a)(b) | | | | | | | 1,500 | | | | 1,492,789 | |
Series 2013-1A, Class A1R2, (3 mo. LIBOR US + 1.23%), 1.50%, 01/20/29(a)(b) | | | | | | | 3,952 | | | | 3,944,176 | |
Series 2013-2A, Class A1R, (3 mo. LIBOR US + 1.18%), 1.44%, 10/22/30(a)(b) | | | | | | | 6,321 | | | | 6,252,706 | |
Series 2015-3A, Class A1R, (3 mo. LIBOR US + 1.00%), 1.27%, 04/20/31(a)(b) | | | | | | | 2,550 | | | | 2,512,233 | |
BlueMountain CLO XXIX Ltd., Series 2020-29A, Class B, (3 mo. LIBOR US + 2.25%), 2.56%, 07/25/31(a)(b) | | | | | | | 750 | | | | 749,958 | |
BlueMountain CLO XXV Ltd., Series 2019-25A, Class E, (3 mo. LIBOR US + 6.70%), 6.98%, 07/15/32(a)(b) | | | | | | | 1,000 | | | | 938,099 | |
BlueMountain Fuji Eur CLO IV DAC, Series 4X, Class A2, (3 mo. EURIBOR + 1.35%), 1.35%, 03/30/32(a) | | | EUR | | | | 670 | | | | 785,335 | |
BlueMountain Fuji Eur CLO V DAC, Series 5X, Class C, (3 mo. EURIBOR + 2.45%), 2.45%, 01/15/33(a) | | | | | | | 1,560 | | | | 1,799,285 | |
Bowman Park CLO Ltd., Series 2014-1A, Class AR, (3 mo. LIBOR US + 1.18%), 1.44%, 11/23/25(a)(b) | | | USD | | | | 1,265 | | | | 1,263,315 | |
Brookside Mill CLO Ltd. | | | | | | | | | | | | |
Series 2013-1A, Class BR, (3 mo. LIBOR US + 1.35%),
1.62%, 01/17/28(a)(b) | | | | | | | 500 | | | | 491,486 | |
Series 2013-1A, Class DR, (3 mo. LIBOR US + 2.65%), 2.92%, 01/17/28(a)(b) | | | | | | | 1,073 | | | | 1,001,075 | |
Cairn CLO XII DAC | | | | | | | | | | | | |
Series 2020-12A, Class B, (3 mo. EURIBOR + 2.30%),
2.30%, 04/15/33(a)(b)(c) | | | EUR | | | | 500 | �� | | | 587,694 | |
Series 2020-12A, Class C, (3 mo. EURIBOR + 3.00%),
3.00%, 04/15/33(a)(b)(c) | | | | | | | 1,175 | | | | 1,379,014 | |
California Street CLO XII Ltd., Series 2013-12A, Class AR, (3 mo. LIBOR US + 1.03%), 1.31%, 10/15/25(a)(b) | | | USD | | | | 1,270 | | | | 1,265,711 | |
Carlyle C17 CLO Ltd., Series C17A, Class A1AR, (3 mo. LIBOR US + 1.03%), 1.30%, 04/30/31(a)(b) | | | | | | | 7,620 | | | | 7,526,961 | |
Carlyle Global Market Strategies CLO Ltd. | | | | | | | | | | | | |
Series 2013-2A, Class AR, (3 mo. LIBOR US + 0.89%), 1.16%, 01/18/29(a)(b) | | | | | | | 1,488 | | | | 1,472,612 | |
Series 2013-3A, Class A1AR, (3 mo. LIBOR US + 1.10%), 1.38%, 10/15/30(a)(b) | | | | | | | 248 | | | | 244,451 | |
Series 2013-4A, Class A1RR, (3 mo. LIBOR US + 1.00%), 1.28%, 01/15/31(a)(b) | | | | | | | 1,853 | | | | 1,822,599 | |
Series 2014-1A, Class A1R2, (3 mo. LIBOR US + 0.97%), 1.24%, 04/17/31(a)(b) | | | | | | | 3,160 | | | | 3,122,309 | |
Series 2015-3A, Class A2R, (3 mo. LIBOR US + 1.60%), 1.85%, 07/28/28(a)(b) | | | | | | | 2,470 | | | | 2,423,960 | |
Carlyle U.S. CLO Ltd. | | | | | | | | | | | | |
Series 2016-4A, Class A2R, (3 mo. LIBOR US + 1.45%), 1.72%, 10/20/27(a)(b) | | | | | | | 750 | | | | 730,561 | |
Series 2017-4A, Class A1, (3 mo. LIBOR US + 1.18%), 1.46%, 01/15/30(a)(b) | | | | | | | 4,620 | | | | 4,585,012 | |
| | | | | | | | | | | | |
| Security | | | | | Par
(000) | | | Value | |
| | | |
| Asset-Backed Securities (continued) | | | | | | | | | |
Carlyle U.S. CLO Ltd. | | | | | | | | | | | | |
Series 2019-2A, Class A1, (3 mo. LIBOR US + 1.28%), 1.56%, 07/15/32(a)(b) | | | USD | | | | 4,000 | | | $ | 3,979,228 | |
Series 2020-1A, Class C1, (3 mo. LIBOR US + 4.00%), 4.19%, 07/20/31(a)(b) | | | | | | | 750 | | | | 750,007 | |
Carrington Mortgage Loan Trust | | | | | | | | | | | | |
Series 2006-NC1, Class M2, (1 mo. LIBOR US + 0.42%), 0.57%, 01/25/36(a) | | | | | | | 610 | | | | 506,130 | |
Series 2006-NC3, Class A3, (1 mo. LIBOR US + 0.15%), 0.30%, 08/25/36(a) | | | | | | | 3,561 | | | | 3,347,284 | |
Series 2006-NC4, Class A3, (1 mo. LIBOR US + 0.16%), 0.31%, 10/25/36(a) | | | | | | | 772 | | | | 735,352 | |
Series 2006-NC5, Class A3, (1 mo. LIBOR US + 0.15%), 0.30%, 01/25/37(a) | | | | | | | 3,978 | | | | 3,304,425 | |
CarVal CLO II Ltd. | | | | | | | | | | | | |
Series 2019-1A, Class C, (3 mo. LIBOR US + 3.25%), 3.52%, 04/20/32(a)(b) | | | | | | | 713 | | | | 705,901 | |
Series 2019-1A, Class D, (3 mo. LIBOR US + 4.15%), 4.42%, 04/20/32(a)(b) | | | | | | | 6,252 | | | | 6,251,864 | |
CarVal CLO III Ltd., Series 2019-2A, Class D, (3 mo. LIBOR US + 3.70%), 3.97%, 07/20/32(a)(b) | | | | | | | 2,000 | | | | 1,982,566 | |
CarVal CLO Ltd., Series 2018-1A, Class D,
(3 mo. LIBOR US + 2.89%), 3.16%, 07/16/31(a)(b) | | | | | | | 500 | | | | 479,344 | |
Cascade MH Asset Trust, Series 2019-MH1, Class A, 4.00%, 11/25/44(b)(d) | | | | | | | 11,382 | | | | 11,733,854 | |
CBAM Ltd. | | | | | | | | | | | | |
Series 2017-1A, Class A1, (3 mo. LIBOR US + 1.25%), 1.52%, 07/20/30(a)(b) | | | | | | | 6,050 | | | | 6,044,692 | |
Series 2017-2A, Class B1, (3 mo. LIBOR US + 1.75%), 2.02%, 10/17/29(a)(b) | | | | | | | 2,955 | | | | 2,901,596 | |
Series 2017-3A, Class A, (3 mo. LIBOR US + 1.23%), 1.50%, 10/17/29(a)(b) | | | | | | | 3,780 | | | | 3,764,614 | |
Series 2017-3A, Class B1, (3 mo. LIBOR US + 1.70%), 1.97%, 10/17/29(a)(b) | | | | | | | 1,000 | | | | 979,384 | |
C-BASS Trust, Series 2006-CB7, Class A4,
(1 mo. LIBOR US + 0.16%), 0.31%, 10/25/36(a) | | | | | | | 579 | | | | 481,803 | |
CDO Repack SPC Ltd., Series 2006-CLF1, Class D1, 0.00%, 05/20/30(b) | | | | | | | 420 | | | | 439,360 | |
Cedar Funding II CLO Ltd. | | | | | | | | | | | | |
Series 2013-1A, Class A1R, (3 mo. LIBOR US + 1.23%), 1.47%, 06/09/30(a)(b) | | | | | | | 1,511 | | | | 1,502,711 | |
Series 2013-1A, Class BR, (3 mo. LIBOR US + 1.75%), 1.99%, 06/09/30(a)(b) | | | | | | | 2,450 | | | | 2,424,489 | |
Cedar Funding IV CLO Ltd., Series 2014-4A, Class AR, (3 mo. LIBOR US + 1.23%), 1.49%, 07/23/30(a)(b) | | | | | | | 3,790 | | | | 3,769,781 | |
Cedar Funding IX CLO Ltd., Series 2018-9A, Class A1, (3 mo. LIBOR US + 0.98%), 1.25%, 04/20/31(a)(b) | | | | | | | 940 | | | | 927,434 | |
Cedar Funding V CLO Ltd., Series 2016-5A, Class A1R, (3 mo. LIBOR US + 1.10%), 1.37%, 07/17/31(a)(b) | | | | | | | 1,880 | | | | 1,860,495 | |
Cedar Funding VI CLO Ltd., Series 2016-6A, Class AR, (3 mo. LIBOR US + 1.09%), 1.36%, 10/20/28(a)(b) | | | | | | | 15,035 | | | | 14,922,439 | |
Cedar Funding VIII CLO Ltd. | | | | | | | | | | | | |
Series 2017-8A, Class A1, (3 mo. LIBOR US + 1.25%), 1.52%, 10/17/30(a)(b) | | | | | | | 16,520 | | | | 16,395,966 | |
Series 2017-8A, Class B, (3 mo. LIBOR US + 1.70%), 1.97%, 10/17/30(a)(b) | | | | | | | 2,628 | | | | 2,565,837 | |
| | |
S C H E D U L E O F I N V E S T M E N T S | | 59 |
| | |
Schedule of Investments (continued) September 30, 2020 | | Master Total Return Portfolio (Percentages shown are based on Net Assets) |
| | | | | | | | | | | | |
| Security | | | | | Par
(000) | | | Value | |
| | | |
| Asset-Backed Securities (continued) | | | | | | | | | |
Cedar Funding VIII CLO Ltd. | | | | | | | | | | | | |
Series 2017-8A, Class C, (3 mo. LIBOR US + 2.25%), 2.52%, 10/17/30(a)(b) | | | USD | | | | 750 | | | $ | 721,460 | |
Cent CLO Ltd., Series 2015-24A, Class A1R, (3 mo. LIBOR US + 1.07%), 1.35%, 10/15/26(a)(b) | | | | | | | 3,868 | | | | 3,859,780 | |
CIFC European Funding CLO II DAC, Series 2X, Class B1, (3 mo. EURIBOR + 1.60%), 1.60%, 04/15/33(a) | | | EUR | | | | 900 | | | | 1,032,145 | |
CIFC Funding Ltd. | | | | | | | | | | | | |
Series 2012-2RA, Class A2, (3 mo. LIBOR US + 1.25%),
1.52%, 01/20/28(a)(b) | | | USD | | | | 750 | | | | 726,959 | |
Series 2013-1A, Class A2R, (3 mo. LIBOR US + 1.75%),
2.02%, 07/16/30(a)(b) | | | | | | | 500 | | | | 489,725 | |
Series 2014-4RA, Class A1A, (3 mo. LIBOR US + 1.13%),
1.40%, 10/17/30(a)(b) | | | | | | | 26,820 | | | | 26,699,766 | |
Series 2014-4RA, Class A2, (3 mo. LIBOR US + 1.65%),
1.92%, 10/17/30(a)(b) | | | | | | | 250 | | | | 248,882 | |
Series 2015-2A, Class AR2, (3 mo. LIBOR US + 1.01%),
1.29%, 04/15/30(a)(b)(c) | | | | | | | 1,270 | | | | 1,257,427 | |
Series 2015-2A, Class CR2, (3 mo. LIBOR US + 2.00%),
2.28%, 04/15/30(a)(b) | | | | | | | 2,904 | | | | 2,778,297 | |
Series 2015-4A, Class A1R, (3 mo. LIBOR US + 1.15%),
1.42%, 10/20/27(a)(b) | | | | | | | 690 | | | | 686,135 | |
Series 2017-1A, Class AR, (3 mo. LIBOR US + 1.01%), 1.28%, 04/23/29(a)(b) | | | | | | | 5,840 | | | | 5,820,520 | |
Series 2017-1A, Class B, (3 mo. LIBOR US + 1.70%), 1.97%, 04/23/29(a)(b) | | | | | | | 2,910 | | | | 2,869,317 | |
Series 2017-5A, Class C, (3 mo. LIBOR US + 2.85%), 3.12%, 11/16/30(a)(b) | | | | | | | 300 | | | | 283,243 | |
Series 2018-1A, Class A, (3 mo. LIBOR US + 1.00%), 1.27%, 04/18/31(a)(b) | | | | | | | 1,834 | | | | 1,797,595 | |
Series 2019-4A, Class A2, (3 mo. LIBOR US + 1.80%), 2.08%, 07/15/32(a)(b) | | | | | | | 400 | | | | 393,842 | |
Series 2020-1A, Class B, (3 mo. LIBOR US + 2.30%), 2.54%, 07/15/32(a)(b) | | | | | | | 3,260 | | | | 3,259,985 | |
Series 2020-1A, Class D, (3 mo. LIBOR US + 4.00%), 4.24%, 07/15/32(a)(b) | | | | | | | 1,120 | | | | 1,110,656 | |
Citigroup Mortgage Loan Trust | | | | | | | | | | | | |
Series 2007-AHL2, Class A3B, (1 mo. LIBOR US + 0.20%), 0.35%, 05/25/37(a) | | | | | | | 6,399 | | | | 5,133,168 | |
Series 2007-AHL2, Class A3C, (1 mo. LIBOR US + 0.27%), 0.42%, 05/25/37(a) | | | | | | | 2,907 | | | | 2,350,462 | |
Clear Creek CLO, Series 2015-1A, Class DR, (3 mo. LIBOR US + 2.95%), 3.22%, 10/20/30(a)(b) | | | | | | | 620 | | | | 581,394 | |
Cloud Pass-Through Trust, Series 2019-1A, Class CLOU, 3.55%, 12/05/22(b)(d) | | | | | | | 11,295 | | | | 11,474,689 | |
Conseco Finance Corp. | | | | | | | | | | | | |
Series 1997-3, Class M1,
7.53%, 03/15/28(d) | | | | | | | 1,353 | | | | 1,366,946 | |
Series 1997-6, Class M1,
7.21%, 01/15/29(d) | | | | | | | 252 | | | | 256,541 | |
Series 1998-4, Class M1,
6.83%, 04/01/30(d) | | | | | | | 342 | | | | 330,130 | |
Series 1998-8, Class A1,
6.28%, 09/01/30 | | | | | | | 594 | | | | 625,304 | |
Series 1998-8, Class M1,
6.98%, 09/01/30(d) | | | | | | | 2,477 | | | | 2,294,432 | |
Series 1999-5, Class A5,
7.86%, 03/01/30(d) | | | | | | | 947 | | | | 576,300 | |
Series 1999-5, Class A6,
7.50%, 03/01/30(d) | | | | | | | 1,015 | | | | 595,033 | |
Series 2001-D, Class B1, (1 mo. LIBOR US + 2.50%), 2.65%, 11/15/32(a) | | | | | | | 1,825 | | | | 1,691,806 | |
Conseco Finance Securitizations Corp. | | | | | | | | | | | | |
Series 2000-1, Class A5, 8.06%, 09/01/29(d) | | | | 1,602 | | | | 573,319 | |
Series 2000-4, Class A6, 8.31%, 05/01/32(d) | | | | 1,373 | | | | 487,182 | |
Series 2000-5, Class A6, 7.96%, 05/01/31 | | | | | | | 2,221 | | | | 1,119,564 | |
| | | | | | | | | | | | |
| Security | | | | | Par
(000) | | | Value | |
| | | |
| Asset-Backed Securities (continued) | | | | | | | | | |
Conseco Finance Securitizations Corp. | | | | | | | | | | | | |
Series 2000-5, Class A7, 8.20%, 05/01/31 | | | USD | | | | 4,051 | | | $ | 2,103,010 | |
Contego CLO VIII DAC | | | | | | | | | | | | |
Series 8A, Class B1, (3 mo. EURIBOR + 2.10%), 2.10%, 01/25/32(a)(b) | | | EUR | | | | 2,400 | | | | 2,810,468 | |
Series 8A, Class C, (3 mo. EURIBOR + 2.80%), 2.80%, 01/25/32(a)(b)(c) | | | | | | | 500 | | | | 586,228 | |
Corevest American Finance Trust, Series 2020-2, Class A, 3.38%, 05/15/52(b) | | | USD | | | | 1,942 | | | | 2,111,729 | |
Countrywide Asset-Backed Certificates | | | | | | | | | | | | |
Series 2004-5, Class A, (1 mo. LIBOR US + 0.90%), 1.05%, 10/25/34(a) | | | | | | | 488 | | | | 478,582 | |
Series 2005-16, Class 1AF,
4.62%, 04/25/36(d) | | | | | | | 3,335 | | | | 3,332,362 | |
Series 2005-17, Class 1AF4,
6.05%, 05/25/36(e) | | | | | | | 1,685 | | | | 1,738,919 | |
Series 2006-1, Class AF4, 4.61%, 07/25/36(d) | | | | | | | 2,051 | | | | 2,083,340 | |
Series 2006-11, Class 3AV2, (1 mo. LIBOR US + 0.16%), 0.31%, 09/25/46(a) | | | | | | | 201 | | | | 196,700 | |
Series 2006-17, Class 2A2, (1 mo. LIBOR US + 0.15%), 0.30%, 03/25/47(a) | | | | | | | 210 | | | | 206,017 | |
Series 2006-18, Class M1, (1 mo. LIBOR US + 0.30%), 0.45%, 03/25/37(a) | | | | | | | 6,168 | | | | 4,744,444 | |
Series 2006-8, Class 2A3, (1 mo. LIBOR US + 0.16%), 0.31%, 12/25/35(a) | | | | | | | 475 | | | | 470,653 | |
Series 2006-8, Class 2A4, (1 mo. LIBOR US + 0.25%), 0.40%, 01/25/46(a) | | | | | | | 8,384 | | | | 7,736,536 | |
Series 2006-S10, Class A3, (1 mo. LIBOR US + 0.32%), 0.47%, 10/25/36(a) | | | | | | | 4,005 | | | | 3,747,234 | |
Series 2006-S3, Class A4, 6.53%, 01/25/29(e) | | | | | | | 299 | | | | 342,444 | |
Series 2006-SPS1, Class A, (1 mo. LIBOR US + 0.22%), 0.37%, 12/25/25(a) | | | | | | | 107 | | | | 136,781 | |
Series 2007-12, Class 1A2, (1 mo. LIBOR US + 0.84%), 0.99%, 08/25/47(a) | | | | | | | 5,823 | | | | 5,681,213 | |
Countrywide Asset-Backed Certificates Revolving Home Equity Loan Trust, Series 2004-U, Class 2A, (1 mo. LIBOR US + 0.27%), 0.42%, 03/15/34(a) | | | | | | | 666 | | | | 629,054 | |
Credit Suisse First Boston Mortgage Securities Corp., Series 2001-MH29, Class B1, 8.10%, 09/25/31(d) | | | | | | | 1,750 | | | | 1,825,809 | |
Credit-Based Asset Servicing & Securitization LLC | | | | | | | | | | | | |
Series 2006-CB2, Class AF4,
3.20%, 12/25/36(e) | | | | | | | 421 | | | | 418,447 | |
Series 2006-MH1, Class B1,
6.25%, 10/25/36(b)(e) | | | | | | | 852 | | | | 889,284 | |
Series 2006-SL1, Class A2,
6.06%, 09/25/36(b)(e) | | | | | | | 3,037 | | | | 414,262 | |
Series 2007-CB6, Class A4, (1 mo. LIBOR US + 0.34%), 0.49%, 07/25/37(a)(b) | | | | | | | 611 | | | | 490,054 | |
Cumberland Park CLO Ltd. | | | | | | | | | | | | |
Series 2015-2A, Class CR, (3 mo. LIBOR US + 1.80%), 2.07%, 07/20/28(a)(b) | | | | | | | 1,190 | | | | 1,153,066 | |
Series 2015-2A, Class DR, (3 mo. LIBOR US + 2.70%), 2.97%, 07/20/28(a)(b) | | | | | | | 500 | | | | 476,057 | |
CVC Cordatus Loan Fund VI DAC, Series 6X, Class CR, (3 mo. EURIBOR + 1.60%), 1.60%, 04/15/32(a) | | | EUR | | | | 1,160 | | | | 1,302,891 | |
CWHEQ Home Equity Loan Trust, Series 2006- S5, Class A5, 6.16%, 06/25/35 | | | USD | | | | 343 | | | | 379,204 | |
| | |
| 60 | | 2 0 2 0 B L A C K R O C K A N N U A L R E P O R T T O S H A R E H O L D E R S |
| | |
Schedule of Investments (continued) September 30, 2020 | | Master Total Return Portfolio (Percentages shown are based on Net Assets) |
| | | | | | | | | | | | |
| Security | | | | | Par
(000) | | | Value | |
|
| Asset-Backed Securities (continued) | |
CWHEQ Revolving Home Equity Loan | |
Resuritization Trust | | | | | | | | | | | | |
Series 2006-RES, Class 4Q1B, (1 mo. LIBOR US + 0.30%),
0.45%, 12/15/33(a)(b) | | | USD | | | | 656 | | | $ | 622,250 | |
Series 2006-RES, Class 5B1A, (1 mo. LIBOR US + 0.19%),
0.34%, 05/15/35(a)(b) | | | | | | | 258 | | | | 246,786 | |
Series 2006-RES, Class 5B1B, (1 mo. LIBOR US + 0.19%),
0.34%, 05/15/35(a)(b)(c) | | | | | | | 151 | | | | 140,920 | |
CWHEQ Revolving Home Equity Loan Trust | | | | | |
Series 2005-B, Class 2A, (1 mo. LIBOR US + 0.18%), 0.33%, 05/15/35(a) | | | | | | | 407 | | | | 396,653 | |
Series 2006-C, Class 2A, (1 mo. LIBOR US + 0.18%), 0.33%, 05/15/36(a) | | | | | | | 2,321 | | | | 2,236,369 | |
Series 2006-H, Class 1A, (1 mo. LIBOR US + 0.15%), 0.30%, 11/15/36(a) | | | | | | | 1,476 | | | | 1,234,547 | |
Deer Creek CLO Ltd., Series 2017-1A, Class A, (3 mo. LIBOR US + 1.18%), 1.45%, 10/20/30(a)(b) | | | | | | | 5,561 | | | | 5,488,472 | |
Dorchester Park CLO DAC, Series 2015-1A, Class BR, (3 mo. LIBOR US + 1.45%), 1.72%, 04/20/28(a)(b) | | | | | | | 3,064 | | | | 3,000,924 | |
Dryden 33 Senior Loan Fund, Series 2014-33A, Class BR2, (3 mo. LIBOR US + 1.75%), 2.03%, 04/15/29(a)(b) | | | | | | | 250 | | | | 247,049 | |
Dryden 36 Senior Loan Fund, Series 2014-36A, Class DR2, (3 mo. LIBOR US + 3.70%), 3.98%, 04/15/29(a)(b) | | | | | | | 750 | | | | 729,603 | |
Dryden 43 Senior Loan Fund, Series 2016-43A, Class AR, (3 mo. LIBOR US + 1.14%), 1.41%, 07/20/29(a)(b) | | | | | | | 7,230 | | | | 7,215,806 | |
Dryden 53 CLO Ltd., Series 2017-53A, Class A, (3 mo. LIBOR US + 1.12%), 1.40%, 01/15/31(a)(b) | | | | | | | 18,720 | | | | 18,565,479 | |
Dryden 76 CLO Ltd., Series 2019-76A, Class A1, (3 mo. LIBOR US + 1.33%), 1.60%, 10/20/32(a)(b) | | | | | | | 750 | | | | 740,628 | |
Dryden 77 CLO Ltd., Series 2020-77A, Class D1, (3 mo. LIBOR US + 5.14%), 5.51%, 05/20/31(a)(b) | | | | | | | 750 | | | | 749,667 | |
Dryden XXV Senior Loan Fund | | | | | | | | | | | | |
Series 2012-25A, Class ARR, (3 mo. LIBOR US + 0.90%),
1.18%, 10/15/27(a)(b) | | | | | | | 9,911 | | | | 9,835,945 | |
Series 2012-25A, Class CRR, (3 mo. LIBOR US + 1.85%),
2.13%, 10/15/27(a)(b) | | | | | | | 1,340 | | | | 1,279,580 | |
Dryden XXVI Senior Loan Fund, Series 2013-26A, Class AR, (3 mo. LIBOR US + 0.90%), 1.18%, 04/15/29(a)(b) | | | | | | | 1,170 | | | | 1,157,488 | |
Dryden XXVIII Senior Loan Fund, Series 2013- 28A, Class A1LR, (3 mo. LIBOR US + 1.20%), 1.48%, 08/15/30(a)(b) | | | | | | | 9,085 | | | | 8,986,067 | |
Eaton Vance CLO Ltd. | | | | | | | | | | | | |
Series 2013-1A, Class A1RR, (3 mo. LIBOR US + 1.16%),
1.44%, 01/15/28(a)(b) | | | | | | | 1,280 | | | | 1,273,914 | |
Series 2013-1A, Class A2RR, (3 mo. LIBOR US + 1.85%),
2.13%, 01/15/28(a)(b) | | | | | | | 1,150 | | | | 1,147,137 | |
Series 2018-1A, Class C, (3 mo. LIBOR US + 2.20%),
2.48%, 10/15/30(a)(b) | | | | | | | 3,550 | | | | 3,382,200 | |
Elm CLO Ltd. | | | | | | | | | | | | |
Series 2014-1A, Class ARR, (3 mo. LIBOR US + 1.17%),
1.44%, 01/17/29(a)(b) | | | | | | | 18,150 | | | | 18,061,325 | |
Series 2014-1A, Class BRR, (3 mo. LIBOR US + 1.75%),
2.02%, 01/17/29(a)(b) | | | | | | | 1,950 | | | | 1,934,391 | |
| | | | | | | | | | | | |
| Security | | | | | Par (000) | | | Value | |
|
| Asset-Backed Securities (continued) | |
Elmwood CLO I Ltd., Series 2019-1A, Class B, (3 mo. LIBOR US + 1.90%), 2.17%, 04/20/30(a)(b) | | | USD | | | | 1,500 | | | $ | 1,481,583 | |
Elmwood CLO II Ltd. | | | | | | | | | | | | |
Series 2019-2A, Class A, (3 mo. LIBOR US + 1.45%), 1.72%, 04/20/31(a)(b) | | | | | | | 4,020 | | | | 4,019,987 | |
Series 2019-2A, Class D, (3 mo. LIBOR US + 3.95%), 4.22%, 04/20/31(a)(b) | | | | | | | 1,450 | | | | 1,436,969 | |
Elmwood CLO III Ltd., Series 2019-3A, Class D, (3 mo. LIBOR US + 3.85%), 4.13%, 10/15/32(a)(b) | | | | | | | 250 | | | | 247,091 | |
Elmwood CLO V Ltd. | | | | | | | | | | | | |
Series 2020-2A, Class B, (3 mo. LIBOR US + 2.20%), 2.48%, 07/24/31(a)(b) | | | | | | | 2,880 | | | | 2,879,748 | |
Series 2020-2A, Class C, (3 mo. LIBOR US + 2.75%), 3.03%, 07/24/31(a)(b) | | | | | | | 2,880 | | | | 2,860,284 | |
FBR Securitization Trust, Series 2005-5, Class M2, (1 mo. LIBOR US + 0.71%), 0.85%, 11/25/35(a) | | | | | | | 6,465 | | | | 6,210,180 | |
Finance of America HECM Buyout, Series 2020- HB1, Class M5, 6.00%, 02/25/30(b)(c)(d) | | | | | | | 1,758 | | | | 1,378,272 | |
First Franklin Mortgage Loan Trust | | | | | | | | | | | | |
Series 2004-FFH3, Class M3, (1 mo. LIBOR US + 1.05%), 1.20%, 10/25/34(a) | | | | | | | 1,000 | | | | 933,580 | |
Series 2006-FF13, Class A1, (1 mo. LIBOR US + 0.12%), 0.27%, 10/25/36(a) | | | | | | | 2,340 | | | | 1,857,976 | |
Series 2006-FF16, Class 2A3, (1 mo. LIBOR US + 0.14%), 0.29%, 12/25/36(a) | | | | | | | 12,064 | | | | 7,447,656 | |
Series 2006-FF17, Class A5, (1 mo. LIBOR US + 0.15%), 0.30%, 12/25/36(a) | | | | | | | 16,552 | | | | 15,079,653 | |
Series 2006-FFH1, Class M2, (1 mo. LIBOR US + 0.40%), 0.55%, 01/25/36(a) | | | | | | | 2,652 | | | | 1,849,617 | |
FirstKey Homes Trust | | | | | | | | | | | | |
Series 2020-SFR1, Class E, 2.79%,��08/17/37(b). | | | | | | | 4,480 | | | | 4,581,346 | |
Series 2020-SFR1, Class F1, 3.64%, 09/17/25(b) | | | | | | | 2,690 | | | | 2,775,402 | |
Flatiron CLO Ltd., Series 2015-1A, Class AR, (3 mo. LIBOR US + 0.89%), 1.17%, 04/15/27(a)(b) | | | | | | | 1,698 | | | | 1,695,791 | |
Fremont Home Loan Trust, Series 2006-3, Class 1A1, (1 mo. LIBOR US + 0.14%), 0.29%, 02/25/37(a) | | | | | | | 2,890 | | | | 2,260,319 | |
Galaxy XV CLO Ltd., Series 2013-15A, Class AR, (3 mo. LIBOR US + 1.20%), 1.48%, 10/15/30(a)(b) | | | | | | | 1,350 | | | | 1,344,099 | |
Galaxy XXIII CLO Ltd., Series 2017-23A, Class A, (3 mo. LIBOR US + 1.28%), 1.54%, 04/24/29(a)(b) | | | | | | | 2,603 | | | | 2,586,763 | |
Galaxy XXIX CLO Ltd. | | | | | | | | | | | | |
Series 2018-29A, Class B, (3 mo. LIBOR US + 1.40%), 1.68%, 11/15/26(a)(b) | | | | | | | 250 | | | | 245,131 | |
Series 2018-29A, Class C, (3 mo. LIBOR US + 1.68%), 1.96%, 11/15/26(a)(b) | | | | | | | 1,470 | | | | 1,397,394 | |
GE-WMC Asset-Backed Pass-Through | | | | | |
Certificates, Series 2005-2, Class A2C, (1 mo. LIBOR US + 0.50%), 0.65%, 12/25/35(a) | | | | | | | 266 | | | | 262,706 | |
Gilbert Park CLO Ltd. | | | | | | | | | | | | |
Series 2017-1A, Class C, (3 mo. LIBOR US + 1.95%), 2.23%, 10/15/30(a)(b) | | | | | | | 3,110 | | | | 2,981,592 | |
Series 2017-1A, Class D, (3 mo. LIBOR US + 2.95%), 3.23%, 10/15/30(a)(b) | | | | | | | 4,292 | | | | 4,093,708 | |
| | |
S C H E D U L E O F I N V E S T M E N T S | | 61 |
| | |
Schedule of Investments (continued) September 30, 2020 | | Master Total Return Portfolio (Percentages shown are based on Net Assets) |
| | | | | | | | | | | | |
| Security | | | | | Par (000) | | | Value | |
|
| Asset-Backed Securities (continued) | |
GoldenTree Loan Management U.S. CLO 1 Ltd. | |
Series 2017-1A, Class CR, (3 mo. LIBOR US + 1.85%), 2.12%, 04/20/29(a)(b) | | | USD | | | | 3,120 | | | $ | 3,018,399 | |
Series 2017-1A, Class DR, (3 mo. LIBOR US + 2.65%), 2.92%, 04/20/29(a)(b) | | | | | | | 1,800 | | | | 1,670,794 | |
GoldenTree Loan Management U.S. CLO 5 Ltd., Series 2019-5A, Class A, (3 mo. LIBOR US + 1.30%), 1.57%, 10/20/32(a)(b) | | | | | | | 1,750 | | | | 1,739,186 | |
GoldenTree Loan Management U.S. CLO 7 Ltd., Series 2020-7A, Class D, (3 mo. LIBOR US + 2.98%), 3.39%, 04/20/31(a)(b) | | | | | | | 2,240 | | | | 2,212,725 | |
GoldenTree Loan Opportunities IX Ltd., Series 2014-9A, Class AR2, (3 mo. LIBOR US + 1.11%), 1.38%, 10/29/29(a)(b) | | | | | | | 1,830 | | | | 1,826,459 | |
GoldenTree Loan Opportunities X Ltd., Series 2015-10A, Class AR, (3 mo. LIBOR US + 1.12%), 1.39%, 07/20/31(a)(b) | | | | | | | 4,688 | | | | 4,640,063 | |
GoldenTree Loan Opportunities XI Ltd., Series 2015-11A, Class AR2, (3 mo. LIBOR US + 1.07%), 1.34%, 01/18/31(a)(b) | | | | | | | 3,749 | | | | 3,720,135 | |
Greenpoint Manufactured Housing | | | | | | | | | | | | |
Series 1999-5, Class M1B, 8.29%, 12/15/29(d) | | | | | | | 870 | | | | 910,069 | |
Series 1999-5, Class M2,
9.23%, 12/15/29(d) | | | | | | | 965 | | | | 821,662 | |
Grippen Park CLO Ltd., Series 2017-1A, Class A, (3 mo. LIBOR US + 1.26%), 1.53%, 01/20/30(a)(b) | | | | | | | 1,123 | | | | 1,120,582 | |
GSAA Home Equity Trust | | | | | | | | | | | | |
Series 2005-14, Class 1A2, (1 mo. LIBOR US + 0.35%), 0.50%, 12/25/35(a) | | | | | | | 836 | | | | 338,205 | |
Series 2006-4, Class 1A1, 3.53%, 03/25/36(d) | | | | | | | 2,398 | | | | 1,900,790 | |
Series 2006-5, Class 2A1, (1 mo. LIBOR US + 0.07%), 0.22%, 03/25/36(a) | | | | | | | 14 | | | | 6,361 | |
Series 2007-2, Class AF3, 5.92%, 03/25/37(d) | | | | | | | 501 | | | | 143,829 | |
GSAMP Trust | | | | | | | | | | | | |
Series 2007-H1, Class A1B, (1 mo. LIBOR US + 0.20%), 0.35%, 01/25/47(a) | | | | | | | 950 | | | | 633,444 | |
Series 2007-HS1, Class M6, (1 mo. LIBOR US + 2.25%), 2.40%, 02/25/47(a) | | | | | | | 1,300 | | | | 1,315,838 | |
Gulf Stream Meridian 1 Ltd., Series 2020-IA, Class A1, (3 mo. LIBOR US + 1.37%), 1.65%, 04/15/33(a)(b) | | | | | | | 5,820 | | | | 5,808,567 | |
Gulf Stream Meridian 2 Ltd., Series 2020-IIA, Class C, (3 mo. LIBOR US + 4.85%), 5.13%, 10/15/29(a)(b) | | | | | | | 1,500 | | | | 1,492,025 | |
Halcyon Loan Advisors Funding Ltd., Series 2015- 2A, Class AR, (3 mo. LIBOR US + 1.08%), 1.33%, 07/25/27(a)(b) | | | | | | | 7,627 | | | | 7,598,730 | |
Highbridge Loan Management Ltd. | | | | | | | | | | | | |
Series 12A-18, Class A1B, (3 mo. LIBOR US + 1.25%), 1.52%, 07/18/31(a)(b) | | | | | | | 750 | | | | 737,322 | |
Series 6A-2015, Class A1R, (3 mo. LIBOR US + 1.00%),
1.25%, 02/05/31(a)(b) | | | | | | | 11,313 | | | | 11,132,653 | |
Series 7A-2015, Class BR, (3 mo. LIBOR US + 1.18%), 1.46%, 03/15/27(a)(b) | | | | | | | 500 | | | | 483,312 | |
Home Equity Asset Trust | | | | | | | | | | | | |
Series 2006-3, Class M2, (1 mo. LIBOR US + 0.40%), 0.55%, 07/25/36(a) | | | | | | | 2,440 | | | | 2,187,025 | |
Series 2007-1, Class 2A3, (1 mo. LIBOR US + 0.15%), 0.30%, 05/25/37(a) | | | | | | | 2,490 | | | | 2,117,779 | |
Home Equity Mortgage Loan Asset-Backed Trust | | | | | | | | | |
Series 2004-A, Class M2, (1 mo. LIBOR US + 2.03%), 2.17%, 07/25/34(a) | | | | | | | 530 | | | | 527,626 | |
| | | | | | | | | | | | |
| Security | | | | | Par (000) | | | Value | |
|
| Asset-Backed Securities (continued) | |
Home Equity Mortgage Loan Asset-Backed Trust | |
Series 2007-A, Class 2A2, (1 mo. LIBOR US + 0.19%), 0.34%, 04/25/37(a) | | | USD | | | | 1,900 | | | $ | 1,390,003 | |
Home Equity Mortgage Trust, Series 2006-2, Class 1A1, 5.87%, 07/25/36(e) | | | | | | | 2,273 | | | | 590,095 | |
Home Loan Mortgage Loan Trust, Series 2005-1, Class A3, (1 mo. LIBOR US + 0.72%), 0.87%, 04/15/36(a) | | | | | | | 974 | | | | 913,116 | |
HPS Loan Management Ltd. | | | | | | | | | | | | |
Series 10A-16, Class A1R, (3 mo. LIBOR US + 1.14%), 1.41%, 01/20/28(a)(b) | | | | | | | 4,550 | | | | 4,525,774 | |
Series 14A-19, Class A1, (3 mo. LIBOR US + 1.27%), 1.51%, 07/25/30(a)(b) | | | | | | | 1,300 | | | | 1,293,503 | |
ICG U.S. CLO Ltd., Series 2015-1A, Class A1R, (3 mo. LIBOR US + 1.14%),
1.41%, 10/19/28(a)(b) | | | | | | | 5,420 | | | | 5,384,077 | |
Invesco Euro CLO II DAC, Series 2X, Class B1, (3 mo. EURIBOR + 1.80%),
1.80%, 08/15/32(a) . | | | EUR | | | | 1,440 | | | | 1,687,815 | |
Invitation Homes Trust | | | | | | | | | | | | |
Series 2018-SFR3, Class A, (1 mo. LIBOR US + 1.00%), 1.15%, 07/17/37(a)(b) | | | USD | | | | 2,711 | | | | 2,710,915 | |
Series 2018-SFR3, Class E, (1 mo. LIBOR US + 2.00%), 2.15%, 07/17/37(a)(b) | | | | | | | 2,468 | | | | 2,469,852 | |
Irwin Home Equity Loan Trust, Series 2006-3, Class 2A3, 6.53%, 09/25/37(b)(e) | | | | | | | 391 | | | | 390,340 | |
JPMorgan Mortgage Acquisition Trust, Series 2006-CW1, Class M1, (1 mo. LIBOR US + 0.27%), 0.42%, 05/25/36(a) | | | | | | | 1,170 | | | | 1,118,924 | |
Kayne CLO 5 Ltd., Series 2019-5A, Class A, (3 mo. LIBOR US + 1.35%), 1.61%, 07/24/32(a)(b) | | | | | | | 3,770 | | | | 3,760,983 | |
Kayne CLO II Ltd., Series 2018-2A, Class A, (3 mo. LIBOR US + 1.24%), 1.52%, 10/15/31(a)(b) | | | | | | | 500 | | | | 499,039 | |
KKR CLO 16 Ltd., Series 16, Class A1R, (3 mo. LIBOR US + 1.25%), 1.52%, 01/20/29(a)(b) | | | | | | | 7,421 | | | | 7,387,925 | |
LCM 26 Ltd., Series 26A, Class A1, (3 mo. LIBOR US + 1.07%), 1.34%, 01/20/31(a)(b) | | | | | | | 8,120 | | | | 8,031,808 | |
LCM XIV LP, Series 14A, Class AR, (3 mo. LIBOR US + 1.04%), 1.31%, 07/20/31(a)(b) | | | | | | | 500 | | | | 489,691 | |
LCM XX LP | | | | | | | | | | | | |
Series 20A, Class AR, (3 mo. LIBOR US + 1.04%), 1.31%, 10/20/27(a)(b) | | | | | | | 3,740 | | | | 3,706,621 | |
Series 20A, Class BR, (3 mo. LIBOR US + 1.55%), 1.82%, 10/20/27(a)(b) | | | | | | | 250 | | | | 245,333 | |
LCM XXI LP, Series 21A, Class AR, (3 mo. LIBOR US + 0.88%), 1.15%, 04/20/28(a)(b) | | | | | | | 3,430 | | | | 3,400,084 | |
LCM XXIV Ltd., Series 24A, Class A, (3 mo. LIBOR US + 1.31%), 1.58%, 03/20/30(a)(b) | | | | | | | 500 | | | | 499,549 | |
Legacy Mortgage Asset Trust | | | | | | | | | | | | |
Series 2019-SL2, Class A, 3.38%, 02/25/59(b)(c)(d) | | | | 8,371 | | | | 8,396,015 | |
Series 2019-SL2, Class B, 0.00%, 02/25/59(b)(c) | | | | 2,348 | | | | 398,228 | |
Series 2019-SL2, Class M, 4.25%, 02/25/59(b)(c)(d) | | | | 2,083 | | | | 1,989,265 | |
Lehman ABS Manufactured Housing Contract Trust | | | | | | | | | | | | |
Series 2001-B, Class M1, 6.63%, 04/15/40(d) | | | | 4,228 | | | | 4,497,664 | |
Series 2002-A, Class C, 0.00%, 06/15/33 | | | | | | | 357 | | | | 316,058 | |
| | |
| 62 | | 2 0 2 0 B L A C K R O C K A N N U A L R E P O R T T O S H A R E H O L D E R S |
| | |
Schedule of Investments (continued) September 30, 2020 | | Master Total Return Portfolio (Percentages shown are based on Net Assets) |
| | | | | | | | | | | | |
| Security | | | | | Par (000) | | | Value | |
|
| Asset-Backed Securities (continued) | |
Lehman ABS Mortgage Loan Trust, Series 2007-1, Class 2A1, (1 mo. LIBOR US + 0.09%), 0.24%, 06/25/37(a)(b) | | | USD | | | | 432 | | | $ | 336,435 | |
Lendmark Funding Trust, Series 2019-2A, Class A, 2.78%, 04/20/28(b) | | | | | | | 12,230 | | | | 12,365,853 | |
Litigation Fee Residual Funding LLC, Series 2015-1, Class A,
4.00%, 10/01/27(c) | | | | | | | 1,919 | | | | 1,917,909 | |
LoanCore Issuer Ltd., Series 2018-CRE1, Class A, (1 mo. LIBOR US + 1.13%), 1.28%, 05/15/28(a)(b) | | | | | | | 2,245 | | | | 2,233,958 | |
Loanpal Solar Loan Ltd., Series 2020-2GF, Class A, 2.75%, 07/20/47(b) | | | | | | | 7,620 | | | | 7,786,711 | |
Long Beach Mortgage Loan Trust | | | | | | | | | | | | |
Series 2006-5, Class 2A3, (1 mo. LIBOR US + 0.15%), 0.30%, 06/25/36(a) | | | | | | | 3,741 | | | | 2,313,357 | |
Series 2006-7, Class 2A3, (1 mo. LIBOR US + 0.16%), 0.31%, 08/25/36(a) | | | | | | | 6,337 | | | | 3,320,578 | |
Series 2006-9, Class 2A2, (1 mo. LIBOR US + 0.11%), 0.26%, 10/25/36(a) | | | | | | | 1,518 | | | | 688,936 | |
Series 2006-9, Class 2A4, (1 mo. LIBOR US + 0.23%), 0.38%, 10/25/36(a) | | | | | | | 1,528 | | | | 720,318 | |
Madison Avenue Manufactured Housing Contract Trust, Series 2002-A, Class B2, (1 mo. LIBOR US + 3.25%), 3.40%, 03/25/32(a) | | | | | | | 1,020 | | | | 1,020,652 | |
Madison Park Funding X Ltd. | | | | | | | | | | | | |
Series 2012-10A, Class AR2, (3 mo. LIBOR US + 1.22%),
1.49%, 01/20/29(a)(b) | | | | | | | 10,710 | | | | 10,670,923 | |
Series 2012-10A, Class BR2, (3 mo. LIBOR US + 1.80%),
2.07%, 01/20/29(a)(b) | | | | | | | 250 | | | | 246,497 | |
Madison Park Funding XI Ltd., Series 2013-11A, Class AR, (3 mo. LIBOR US + 1.16%), 1.42%, 07/23/29(a)(b) | | | | | | | 4,830 | | | | 4,801,917 | |
Madison Park Funding XIII Ltd. | | | | | | | | | | | | |
Series 2014-13A, Class AR2, (3 mo. LIBOR US + 0.95%),
1.22%, 04/19/30(a)(b) | | | | | | | 7,780 | | | | 7,702,652 | |
Series 2014-13A, Class BR2, (3 mo. LIBOR US + 1.50%),
1.77%, 04/19/30(a)(b) | | | | | | | 4,540 | | | | 4,461,052 | |
Madison Park Funding XIX Ltd. | | | | | | | | | | | | |
Series 2015-19A, Class A1R2, (3 mo. LIBOR US + 0.92%),
1.18%, 01/22/28(a)(b) | | | | | | | 7,698 | | | | 7,637,917 | |
Series 2015-19A, Class A2R2, (3 mo. LIBOR US + 1.50%),
1.76%, 01/22/28(a)(b) | | | | | | | 1,000 | | | | 988,174 | |
Madison Park Funding XVI Ltd., Series 2015-16A, Class A2R, (3 mo. LIBOR US + 1.90%), 2.17%, 04/20/26(a)(b) | | | | | | | 500 | | | | 496,424 | |
Madison Park Funding XVII Ltd., Series 2015-17A, Class B1R, (3 mo. LIBOR US + 1.75%), 2.02%, 07/21/30(a)(b) | | | | | | | 1,770 | | | | 1,745,311 | |
Madison Park Funding XVIII Ltd., Series 2015- 18A, Class A1R, (3 mo. LIBOR US + 1.19%), 1.46%, 10/21/30(a)(b) | | | | | | | 14,970 | | | | 14,811,032 | |
Madison Park Funding XXII Ltd., Series 2016-22A, Class A1R, (3 mo. LIBOR US + 1.26%), 1.54%, 01/15/33(a)(b) | | | | | | | 3,000 | | | | 2,914,467 | |
Madison Park Funding XXIII Ltd. | | | | | | | | | | | | |
Series 2017-23A, Class A, (3 mo. LIBOR US + 1.21%), 1.45%, 07/27/30(a)(b) | | | | | | | 250 | | | | 248,693 | |
Series 2017-23A, Class B, (3 mo. LIBOR US + 1.70%), 1.94%, 07/27/30(a)(b) | | | | | | | 500 | | | | 497,319 | |
Madison Park Funding XXVI Ltd., Series 2017- 26A, Class AR, (3 mo. LIBOR US + 1.20%), 1.47%, 07/29/30(a)(b) | | | | | | | 11,115 | | | | 11,007,400 | |
| | | | | | | | | | | | |
| Security | | | | | Par
(000) | | | Value | |
|
| Asset-Backed Securities (continued) | |
Madison Park Funding XXXVI Ltd., Series 2019- 36A, Class B1, (3 mo. LIBOR US + 1.85%), 2.13%, 01/15/33(a)(b) | | | USD | | | | 2,470 | | | $ | 2,458,661 | |
Marble Point CLO XI Ltd., Series 2017-2A, Class A, (3 mo. LIBOR US + 1.18%), 1.45%, 12/18/30(a)(b) | | | | | | | 2,000 | | | | 1,974,419 | |
Mariner CLO 5 Ltd., Series 2018-5A, Class A, (3 mo. LIBOR US + 1.11%), 1.36%, 04/25/31(a)(b) | | | | | | | 3,550 | | | | 3,533,889 | |
Mariner CLO 8 Ltd., Series 2020-8A, Class A, (3 mo. LIBOR US + 1.27%), 2.44%, 04/20/33(a)(b) | | | | | | | 3,010 | | | | 2,985,887 | |
Mariner CLO LLC | | | | | | | | | | | | |
Series 2015-1A, Class BR2, (3 mo. LIBOR US + 1.50%), 1.77%, 04/20/29(a)(b) | | | | | | | 7,152 | | | | 6,985,516 | |
Series 2015-1A, Class CR2, (3 mo. LIBOR US + 1.90%), 2.17%, 04/20/29(a)(b) | | | | | | | 2,000 | | | | 1,940,060 | |
Series 2016-3A, Class BR2, (3 mo. LIBOR US + 1.50%), 1.76%, 07/23/29(a)(b)(c) | | | | | | | 1,478 | | | | 1,456,865 | |
Series 2016-3A, Class CR2, (3 mo. LIBOR US + 2.05%), 2.31%, 07/23/29(a)(b)(c) | | | | | | | 5,162 | | | | 5,103,669 | |
Series 2016-3A, Class DR2, (3 mo. LIBOR US + 2.90%), 3.16%, 07/23/29(a)(b)(c) | | | | | | | 500 | | | | 474,600 | |
Series 2017-4A, Class A, (3 mo. LIBOR US + 1.21%), 1.45%, 10/26/29(a)(b) | | | | | | | 1,800 | | | | 1,792,599 | |
Mariner Finance Issuance Trust | | | | | | | | | | | | |
Series 2019-AA, Class A, 2.96%, 07/20/32(b) | | | | 14,870 | | | | 15,131,371 | |
Series 2019-AA, Class B, 3.51%, 07/20/32(b) | | | | 2,420 | | | | 2,435,676 | |
Series 2019-AA, Class C, 4.01%, 07/20/32(b) | | | | 2,150 | | | | 2,122,289 | |
Series 2020-AA, Class A, 2.19%, 08/21/34(b) | | | | 7,050 | | | | 7,073,425 | |
Series 2020-AA, Class B, 3.21%, 08/21/34(b) | | | | 1,630 | | | | 1,643,799 | |
Series 2020-AA, Class C, 4.10%, 08/21/34(b) | | | | 1,536 | | | | 1,562,140 | |
Series 2020-AA, Class D, 5.75%, 08/21/34(b) | | | | 2,030 | | | | 1,967,162 | |
MASTR Asset-Backed Securities Trust | | | | | | | | | | | | |
Series 2006-AM2, Class A4, (1 mo. LIBOR US + 0.26%), 0.41%, 06/25/36(a)(b) | | | | | | | 1,516 | | | | 1,394,003 | |
Series 2007-HE1, Class A4, (1 mo. LIBOR US + 0.28%), 0.43%, 05/25/37(a) | | | | | | | 1,318 | | | | 1,001,816 | |
MASTR Specialized Loan Trust, Series 2006-3, Class A, (1 mo. LIBOR US + 0.26%), 0.41%, 06/25/46(a)(b) | | | | | | | 491 | | | | 466,732 | |
Merrill Lynch First Franklin Mortgage Loan Trust, Series 2007-2, Class A2C, (1 mo. LIBOR US + 0.24%), 0.39%, 05/25/37(a) | | | | | | | 1,882 | | | | 1,415,068 | |
Merrill Lynch Mortgage Investors Trust | | | | | | | | | | | | |
Series 2006-OPT1, Class M1, (1 mo. LIBOR US + 0.26%), 0.41%, 08/25/37(a) | | | | | | | 385 | | | | 207,389 | |
Series 2006-RM3, Class A2B, (1 mo. LIBOR US + 0.09%), 0.24%, 06/25/37(a) | | | | | | | 928 | | | | 288,650 | |
MidOcean Credit CLO III, Series 2014-3A, Class A3A2, (3 mo. LIBOR US + 0.97%), 1.24%, 04/21/31(a)(b) | | | | | | | 2,006 | | | | 1,967,413 | |
Mill City Solar Loan Ltd., Series 2019-2GS, Class A, 3.69%, 07/20/43(b) | | | | | | | 7,282 | | | | 7,642,095 | |
Morgan Stanley ABS Capital I, Inc. Trust | | | | | | | | | | | | |
Series 2005-HE1, Class A2MZ, (1 mo. LIBOR US + 0.60%), 0.75%, 12/25/34(a) | | | | | | | 820 | | | | 756,154 | |
Series 2005-HE5, Class M4, (1 mo. LIBOR US + 0.87%), 1.02%, 09/25/35(a) | | | | | | | 3,764 | | | | 2,252,645 | |
Morgan Stanley Home Equity Loan Trust, Series 2006-3, Class A3, (1 mo. LIBOR US + 0.16%), 0.31%, 04/25/36(a) | | | | | | | 2,004 | | | | 1,589,877 | |
| | |
S C H E D U L E O F I N V E S T M E N T S | | 63 |
| | |
Schedule of Investments (continued) September 30, 2020 | | Master Total Return Portfolio (Percentages shown are based on Net Assets) |
| | | | | | | | | | | | |
Security | | | | | Par (000) | | | Value | |
|
| Asset-Backed Securities (continued) | |
Morgan Stanley Mortgage Loan Trust | | | | | | | | | | | | |
Series 2006-16AX, Class 1A, (1 mo. LIBOR US + 0.17%), 0.32%, 11/25/36(a) | | | USD | | | | 4,221 | | | $ | 1,303,171 | |
Series 2007-9SL, Class A, (1 mo. LIBOR US + 0.32%), 0.47%, 07/25/37(a) | | | | | | | 1,021 | | | | 987,100 | |
Mosaic Solar Loan Trust | | | | | | | | | | | | |
Series 2018-2GS, Class A, 4.20%, 02/22/44(b) | | | | 2,919 | | | | 3,105,687 | |
Series 2019-2A, Class A, 2.88%, 09/20/40(b) | | | | | | | 921 | | | | 973,783 | |
Series 2020-1A, Class A, 2.10%, 04/20/46(b) | | | | | | | 1,615 | | | | 1,650,633 | |
Series 2020-1A, Class B, 3.10%, 04/20/46(b) | | | | | | | 2,442 | | | | 2,501,581 | |
Mountain Hawk II CLO Ltd., Series 2013-2A, Class BR, (3 mo. LIBOR US + 1.60%), 1.87%, 07/20/24(a)(b) | | | | | | | 1,444 | | | | 1,439,849 | |
MP CLO III Ltd., Series 2013-1A, Class AR, (3 mo. LIBOR US + 1.25%),
1.52%, 10/20/30(a)(b) | | | | | | | 2,820 | | | | 2,795,416 | |
MP CLO VII Ltd. | | | | | | | | | | | | |
Series 2015-1A, Class ARR, (3 mo. LIBOR US + 1.08%), 1.35%, 10/18/28(a)(b) | | | | | | | 490 | | | | 487,619 | |
Series 2015-1A, Class BRR, (3 mo. LIBOR US + 1.60%), 1.87%, 10/18/28(a)(b) | | | | | | | 750 | | | | 732,566 | |
MP CLO VIII Ltd. | | | | | | | | | | | | |
Series 2015-2A, Class AR, (3 mo. LIBOR US + 0.91%), 1.16%, 10/28/27(a)(b) | | | | | | | 5,511 | | | | 5,484,230 | |
Series 2015-2A, Class BR, (3 mo. LIBOR US + 1.42%), 1.67%, 10/28/27(a)(b) | | | | | | | 3,250 | | | | 3,170,485 | |
Nationstar HECM Loan Trust, Series 2020-1A, Class M3, 2.82%, 09/25/30(b)(c)(d) | | | | | | | 2,151 | | | | 2,150,607 | |
Nationstar Home Equity Loan Trust | | | | | | | | | | | | |
Series 2007-B, Class M1, (1 mo. LIBOR US + 0.41%), 0.56%, 04/25/37(a) | | | | | | | 3,320 | | | | 2,879,008 | |
Series 2007-C, Class 2AV3, (1 mo. LIBOR US + 0.18%), 0.33%, 06/25/37(a) | | | | | | | 42 | | | | 42,254 | |
Navient Private Education Loan Trust, Series 2014-AA, Class B, 3.50%, 08/15/44(b) | | | | | | | 6,000 | | | | 6,129,850 | |
Navient Private Education Refi Loan Trust | | | | | | | | | | | | |
Series 2020-A, Class A2B, (1 mo. LIBOR US + 0.90%), 1.05%, 11/15/68(a)(b) | | | | | | | 2,410 | | | | 2,398,713 | |
Series 2020-FA, Class B, 2.69%, 07/15/69(b) | | | | | | | 2,590 | | | | 2,592,040 | |
Neuberger Berman CLO XVII Ltd. | | | | | | | | | | | | |
Series 2014-17A, Class BR2, (3 mo. LIBOR US + 1.50%), 1.76%, 04/22/29(a)(b) | | | | | | | 1,500 | | | | 1,459,641 | |
Series 2014-17A, Class CR2, (3 mo. LIBOR US + 2.00%), 2.26%, 04/22/29(a)(b) | | | | | | | 1,900 | | | | 1,813,946 | |
Neuberger Berman CLO XVI-S Ltd., Series 2017- 16SA, Class A, (3 mo. LIBOR US + 0.85%), 1.13%, 01/15/28(a)(b) | | | | | | | 2,490 | | | | 2,481,126 | |
Neuberger Berman CLO XX Ltd. | | | | | | | | | | | | |
Series 2015-20A, Class AR, (3 mo. LIBOR US + 0.80%), 1.08%, 01/15/28(a)(b) | | | | | | | 947 | | | | 940,309 | |
Series 2015-20A, Class BR, (3 mo. LIBOR US + 1.25%), 1.53%, 01/15/28(a)(b) | | | | | | | 750 | | | | 735,285 | |
Neuberger Berman CLO XXIII Ltd., Series 2016- 23A, Class BR, (3 mo. LIBOR US + 1.55%), 1.82%, 10/17/27(a)(b) | | | | | | | 400 | | | | 389,714 | |
Neuberger Berman Loan Advisers CLO 26 Ltd. | | | | | | | | | | | | |
Series 2017-26A, Class A, (3 mo. LIBOR US + 1.17%), 1.44%, 10/18/30(a)(b) | | | | | | | 5,520 | | | | 5,475,032 | |
Series 2017-26A, Class B, (3 mo. LIBOR US + 1.50%), 1.77%, 10/18/30(a)(b) | | | | | | | 250 | | | | 246,999 | |
Neuberger Berman Loan Advisers CLO 37 Ltd., Series 2020-37A, Class B, (3 mo. LIBOR US + 2.20%), 2.37%, 07/20/31(a)(b)(c) | | | | | | | 1,000 | | | | 1,004,000 | |
| | | | | | | | | | | | |
| Security | | | | | Par (000) | | | Value | |
|
| Asset-Backed Securities (continued) | |
Nomura Asset Acceptance Corp. Alternative Loan Trust, Series 2006-S5, Class A1, (1 mo. LIBOR US + 0.40%),
0.55%, 10/25/36(a)(b) | | | USD | | | | 242 | | | $ | 233,529 | |
Oaktree CLO Ltd. | | | | | | | | | | | | |
Series 2014-1A, Class A2R, (3 mo. LIBOR US + 1.85%), 2.10%, 05/13/29(a)(b) | | | | | | | 1,840 | | | | 1,787,106 | |
Series 2015-1A, Class A1R, (3 mo. LIBOR US + 0.87%), 1.14%, 10/20/27(a)(b) | | | | | | | 422 | | | | 420,946 | |
Oaktree EIF III Series I Ltd., Series 2016-IIIA, Class B, (3 mo. LIBOR US + 2.00%), 2.27%, 10/20/27(a)(b) | | | | | | | 425 | | | | 422,854 | |
Oakwood Mortgage Investors, Inc. | | | | | | | | | | | | |
Series 2001-D, Class A2, 5.26%, 01/15/19(d) | | | | 680 | | | | 482,045 | |
Series 2001-D, Class A4, 6.93%, 09/15/31(d) | | | | 433 | | | | 352,572 | |
Series 2002-B, Class M1, 7.62%, 06/15/32(d) | | | | 4,448 | | | | 3,727,958 | |
OCP CLO Ltd. | | | | | | | | | | | | |
Series 2013-4A, Class A2RR, (3 mo. LIBOR US + 1.45%), 1.71%,
04/24/29(a)(b) | | | | | | | 2,500 | | | | 2,432,496 | |
Series 2013-4A, Class BRR, (3 mo. LIBOR US + 1.90%), 2.16%, 04/24/29(a)(b) | | | | | | | 4,618 | | | | 4,395,957 | |
Series 2013-4A, Class CRR, (3 mo. LIBOR US + 3.00%), 3.26%, 04/24/29(a)(b) | | | | | | | 3,000 | | | | 2,848,017 | |
Series 2014-5A, Class A1R, (3 mo. LIBOR US + 1.08%), 1.33%, 04/26/31(a)(b) | | | | | | | 660 | | | | 655,475 | |
Series 2014-7A, Class A2RR, (3 mo. LIBOR US + 1.65%),
1.92%, 07/20/29(a)(b) | | | | | | | 750 | | | | 735,920 | |
Series 2015-10A, Class A1R, (3 mo. LIBOR US + 0.82%), 1.07%, 10/26/27(a)(b) | | | | | | | 556 | | | | 553,281 | |
Series 2015-10A, Class BR, (3 mo. LIBOR US + 1.85%), 2.10%, 10/26/27(a)(b) | | | | | | | 1,120 | | | | 1,094,374 | |
Series 2015-9A, Class BR, (3 mo. LIBOR US + 1.75%), 2.03%, 07/15/27(a)(b) | | | | | | | 250 | | | | 245,609 | |
Series 2016-12A, Class A1R, (3 mo. LIBOR US + 1.12%), 1.39%, 10/18/28(a)(b) | | | | | | | 10,736 | | | | 10,699,469 | |
Series 2016-12A, Class A2R, (3 mo. LIBOR US + 1.60%), 1.87%, 10/18/28(a)(b) | | | | | | | 500 | | | | 493,596 | |
Series 2017-13A, Class A1A, (3 mo. LIBOR US + 1.26%), 1.54%, 07/15/30(a)(b) | | | | | | | 9,170 | | | | 9,138,130 | |
Series 2017-14A, Class B, (3 mo. LIBOR US + 1.95%), 2.20%, 11/20/30(a)(b) | | | | | | | 500 | | | | 468,165 | |
Series 2020-19A, Class B, (3 mo. LIBOR US + 2.50%), 2.82%, 07/20/31(a)(b) | | | | | | | 500 | | | | 499,903 | |
Series 2020-19A, Class C, (3 mo. LIBOR US + 2.95%), 3.27%, 07/20/31(a)(b) | | | | | | | 650 | | | | 644,133 | |
Series 2020-19A, Class D, (3 mo. LIBOR US + 4.47%), 4.79%, 07/20/31(a)(b) | | | | | | | 525 | | | | 522,467 | |
OCP Euro CLO DAC, Series 2017-2X, Class B, (3 mo. EURIBOR + 1.35%), 1.35%, 01/15/32(a) . | | | EUR | | | | 1,130 | | | | 1,312,429 | |
Octagon Investment Partners 18-R Ltd., Series 2018-18A, Class A1A, (3 mo. LIBOR US + 0.96%), 1.23%, 04/16/31(a)(b) | | | USD | | | | 7,300 | | | | 7,183,779 | |
Octagon Investment Partners 32 Ltd., Series 2017-1A, Class B1, (3 mo. LIBOR US + 1.70%), 1.98%, 07/15/29(a)(b) | | | | | | | 1,650 | | | | 1,622,173 | |
Octagon Investment Partners 33 Ltd., Series 2017-1A, Class A1, (3 mo. LIBOR US + 1.19%), 1.46%, 01/20/31(a)(b) | | | | | | | 1,310 | | | | 1,305,742 | |
Octagon Investment Partners 46 Ltd. | | | | | | | | | | | | |
Series 2020-2A, Class B, (3 mo. LIBOR US + 2.20%), 2.45%, 07/15/33(a)(b) | | | | | | | 3,290 | | | | 3,289,912 | |
Series 2020-2A, Class D, (3 mo. LIBOR US + 4.60%), 4.85%, 07/15/33(a)(b) | | | | | | | 2,470 | | | | 2,469,590 | |
| | |
| 64 | | 2 0 2 0 B L A C K R O C K A N N U A L R E P O R T T O S H A R E H O L D E R S |
| | |
Schedule of Investments (continued) September 30, 2020 | | Master Total Return Portfolio (Percentages shown are based on Net Assets) |
| | | | | | | | | | | | |
| Security | | | | | Par
(000) | | | Value | |
|
| Asset-Backed Securities (continued) | |
Octagon Investment Partners XVI Ltd., Series 2013-1A, Class A1R, (3 mo. LIBOR US + 1.02%), 1.29%, 07/17/30(a)(b) | | | USD | | | | 3,580 | | | $ | 3,528,857 | |
Octagon Investment Partners XVII Ltd., Series 2013-1A, Class A1R2, (3 mo. LIBOR US + 1.00%), 1.24%, 01/25/31(a)(b) | | | | | | | 7,240 | | | | 7,239,986 | |
Octagon Investment Partners XXIII Ltd., Series 2015-1A, Class CR, (3 mo. LIBOR US + 1.85%), 2.13%, 07/15/27(a)(b) | | | | | | | 2,840 | | | | 2,735,292 | |
OFSI Fund VII Ltd., Series 2014-7A, Class AR, (3 mo. LIBOR US + 0.90%), 1.17%, 10/18/26(a)(b) | | | | | | | 146 | | | | 145,824 | |
OHA Credit Funding 3 Ltd., Series 2019-3A, Class B1, (3 mo. LIBOR US + 1.80%), 2.07%, 07/20/32(a)(b) | | | | | | | 2,989 | | | | 2,948,480 | |
OHA Loan Funding Ltd. | | | | | | | | | | | | |
Series 2013-2A, Class AR, (3 mo. LIBOR US + 1.04%), 1.30%, 05/23/31(a)(b) | | | | | | | 6,219 | | | | 6,136,451 | |
Series 2015-1A, Class A1R2, (3 mo. LIBOR US + 1.34%),
1.62%, 11/15/32(a)(b) | | | | | | | 5,400 | | | | 5,386,796 | |
OneMain Financial Issuance Trust | | | | | | | | | | | | |
Series 2019-1A, Class E, 5.69%, 02/14/31(b) | | | | 5,010 | | | | 5,161,929 | |
Series 2019-2A, Class A, 3.14%, 10/14/36(b) | | | | 14,760 | | | | 15,809,200 | |
Series 2020-1A, Class A, 3.84%, 05/14/32(b) | | | | 12,330 | | | | 12,968,751 | |
Series 2020-2A, Class C, 2.76%, 09/14/35(b) | | | | 2,620 | | | | 2,645,844 | |
Series 2020-2A, Class D, 3.45%, 09/14/35(b) | | | | 6,620 | | | | 6,733,658 | |
Option One Mortgage Acceptance Corp. Asset- Backed Certificates, Series 2003-4, Class A2, (1 mo. LIBOR US + 0.64%), 0.79%, 07/25/33(a) | | | | | | | 821 | | | | 765,036 | |
Option One Mortgage Loan Trust | | | | | | | | | | | | |
Series 2006-3, Class 1A1, (1 mo. LIBOR US + 0.14%), 0.29%, 02/25/37(a) | | | | | | | 1,244 | | | | 938,704 | |
Series 2007-CP1, Class 2A3, (1 mo. LIBOR US + 0.21%), 0.36%, 03/25/37(a) | | | | | | | 2,360 | | | | 1,642,113 | |
Series 2007-FXD1, Class 1A1, 5.87%, 01/25/37(e) | | | | | | | 2,614 | | | | 2,580,484 | |
Series 2007-FXD1, Class 2A1, 5.87%, 01/25/37(e) | | | | | | | 6,561 | | | | 6,484,810 | |
Series 2007-FXD2, Class 1A1, 5.82%, 03/25/37(e) | | | | | | | 3,532 | | | | 3,647,993 | |
Option One Mortgage Loan Trust Asset-Backed Certificates, Series 2005-4, Class M3, (1 mo. LIBOR US + 0.74%), 0.88%, 11/25/35(a) | | | | | | | 4,030 | | | | 3,450,715 | |
Origen Manufactured Housing Contract Trust | | | | | | | | | | | | |
Series 2001-A, Class M1, 7.82%, 03/15/32(d) | | | | | | | 1,345 | | | | 1,318,774 | |
Series 2007-B, Class A1, (1 mo. LIBOR US + 1.20%), 1.35%, 10/15/37(a)(b)(c) | | | | | | | 1,726 | | | | 1,674,137 | |
Ownit Mortgage Loan Trust Series, Series 2006-2, Class A2C, 6.00%, 01/25/37(e) | | | | | | | 1,990 | | | | 1,926,276 | |
OZLM Funding III Ltd., Series 2013-3A, Class BRR, (3 mo. LIBOR US + 2.70%), 2.96%, 01/22/29(a)(b) | | | | | | | 4,720 | | | | 4,691,185 | |
OZLM Funding IV Ltd. | | | | | | | | | | | | |
Series 2013-4A, Class A1R, (3 mo. LIBOR US + 1.25%),
1.51%, 10/22/30(a)(b) | | | | | | | 13,115 | | | | 13,050,543 | |
Series 2013-4A, Class A2R, (3 mo. LIBOR US + 1.70%),
1.96%, 10/22/30(a)(b) | | | | | | | 2,120 | | | | 2,076,051 | |
OZLM Funding Ltd., Series 2012-1A, Class A2R2, (3 mo. LIBOR US + 1.85%), 2.11%, 07/22/29(a)(b) | | | | | | | 495 | | | | 490,651 | |
| | | | | | | | | | | | |
| Security | | | | | Par (000) | | | Value | |
|
| Asset-Backed Securities (continued) | |
OZLM VI Ltd., Series 2014-6A, Class A2AS, (3 mo. LIBOR US + 1.75%), 2.02%, 04/17/31(a)(b) | | | USD | | | | 900 | | | $ | 889,151 | |
OZLM VIII Ltd., Series 2014-8A, Class BRR, (3 mo. LIBOR US + 2.20%), 2.47%, 10/17/29(a)(b) | | | | | | | 1,160 | | | | 1,131,039 | |
OZLM XII Ltd., Series 2015-12A, Class A2R, (3 mo. LIBOR US + 1.60%), 1.87%, 04/30/27(a)(b) | | | | | | | 500 | | | | 493,778 | |
OZLM XIV Ltd., Series 2015-14A, Class A2AR, (3 mo. LIBOR US + 1.70%), 1.98%, 01/15/29(a)(b) | | | | | | | 5,770 | | | | 5,680,199 | |
OZLM XIX Ltd., Series 2017-19A, Class A1, (3 mo. LIBOR US + 1.22%), 1.50%, 11/22/30(a)(b) | | | | | | | 2,160 | | | | 2,140,012 | |
OZLM XVIII Ltd., Series 2018-18A, Class A, (3 mo. LIBOR US + 1.02%), 1.30%, 04/15/31(a)(b) | | | | | | | 2,620 | | | | 2,570,239 | |
OZLM XX Ltd., Series 2018-20A, Class A2, (3 mo. LIBOR US + 1.65%),
1.92%, 04/20/31(a)(b) | | | | | | | 600 | | | | 585,573 | |
OZLM XXI Ltd., Series 2017-21A, Class B, (3 mo. LIBOR US + 1.90%),
2.17%, 01/20/31(a)(b) | | | | | | | 930 | | | | 866,736 | |
OZLM XXIV Ltd., Series 2019-24A, Class A2A, (3 mo. LIBOR US + 2.25%), 2.52%, 07/20/32(a)(b) | | | | | | | 750 | | | | 749,995 | |
Palmer Square CLO Ltd. | | | | | | | | | | | | |
Series 2014-1A, Class A1R2, (3 mo. LIBOR US + 1.13%), 1.40%, 01/17/31(a)(b) | | | | | | | 4,548 | | | | 4,493,661 | |
Series 2015-1A, Class A1R2, (3 mo. LIBOR US + 1.22%), 1.47%, 05/21/29(a)(b) | | | | | | | 10,965 | | | | 10,932,149 | |
Series 2015-1A, Class A2R2, (3 mo. LIBOR US + 1.65%), 1.90%, 05/21/29(a)(b) | | | | | | | 2,460 | | | | 2,416,032 | |
Series 2015-2A, Class A2R2, (3 mo. LIBOR US + 1.55%), 1.82%, 07/20/30(a)(b) | | | | | | | 2,500 | | | | 2,472,220 | |
Series 2015-2A, Class CR2, (3 mo. LIBOR US + 2.75%), 3.02%, 07/20/30(a)(b) | | | | | | | 1,000 | | | | 935,804 | |
Series 2018-1A, Class A1, (3 mo. LIBOR US + 1.03%), 1.30%, 04/18/31(a)(b) | | | | | | | 3,360 | | | | 3,299,505 | |
Series 2018-2A, Class A1A, (3 mo. LIBOR US + 1.10%), 1.37%, 07/16/31(a)(b) | | | | | | | 4,820 | | | | 4,765,977 | |
Series 2018-2A, Class A2, (3 mo. LIBOR US + 1.65%), 1.92%, 07/16/31(a)(b) | | | | | | | 1,500 | | | | 1,492,674 | |
Series 2018-3A, Class A2, (3 mo. LIBOR US + 1.35%), 1.63%, 08/15/26(a)(b) | | | | | | �� | 3,323 | | | | 3,266,552 | |
Palmer Square Loan Funding Ltd. | | | | | | | | | | | | |
Series 2018-2A, Class A2, (3 mo. LIBOR US + 1.05%), 1.33%, 07/15/26(a)(b) | | | | | | | 3,050 | | | | 3,010,822 | |
Series 2019-1A, Class D, (3 mo. LIBOR US + 5.80%), 6.07%, 04/20/27(a)(b) | | | | | | | 1,700 | | | | 1,580,907 | |
Series 2019-2A, Class B, (3 mo. LIBOR US + 2.25%), 2.52%, 04/20/27(a)(b) | | | | | | | 1,500 | | | | 1,461,638 | |
Series 2019-2A, Class C, (3 mo. LIBOR US + 3.25%), 3.52%, 04/20/27(a)(b) | | | | | | | 250 | | | | 229,921 | |
Series 2019-3A, Class A2, (3 mo. LIBOR US + 1.60%), 1.85%, 08/20/27(a)(b) | | | | | | | 2,610 | | | | 2,576,304 | |
Series 2019-3A, Class B, (3 mo. LIBOR US + 2.10%), 2.35%, 08/20/27(a)(b) | | | | | | | 1,940 | | | | 1,875,577 | |
Series 2019-4A, Class D, (3 mo. LIBOR US + 5.90%), 6.16%, 10/24/27(a)(b) | | | | | | | 1,488 | | | | 1,358,007 | |
Series 2020-1A, Class A2, (3 mo. LIBOR US + 1.35%), 1.60%, 02/20/28(a)(b) | | | | | | | 4,860 | | | | 4,713,520 | |
| | |
S C H E D U L E O F I N V E S T M E N T S | | 65 |
| | |
Schedule of Investments (continued) September 30, 2020 | | Master Total Return Portfolio (Percentages shown are based on Net Assets) |
| | | | | | | | | | | | |
| Security | | | | | Par (000) | | | Value | |
|
| Asset-Backed Securities (continued) | |
Palmer Square Loan Funding Ltd. | |
Series 2020-2A, Class A2, (3 mo. LIBOR US + 1.55%), 1.82%, 04/20/28(a)(b) | | | USD | | | | 5,850 | | | $ | 5,718,039 | |
Series 2020-2A, Class B, (3 mo. LIBOR US + 2.25%), 2.52%, 04/20/28(a)(b) | | | | | | | 1,000 | | | | 978,417 | |
Series 2020-2A, Class C, (3 mo. LIBOR US + 3.00%), 3.27%, 04/20/28(a)(b) | | | | | | | 1,000 | | | | 939,842 | |
Series 2020-4A, Class A2, (3 mo. LIBOR US + 1.60%), 0.00%, 11/25/28(a)(b) | | | | | | | 2,640 | | | | 2,640,000 | |
Series 2020-4A, Class C, (3 mo. LIBOR US + 3.60%), 0.00%, 11/25/28(a)(b) | | | | | | | 500 | | | | 500,000 | |
Parallel Ltd. | | | | | | | | | | | | |
Series 2015-1A, Class AR, (3 mo. LIBOR US + 0.85%), 1.12%, 07/20/27(a)(b) | | | | | | | 2,540 | | | | 2,517,738 | |
Series 2015-1A, Class C1R, (3 mo. LIBOR US + 1.75%),
2.02%, 07/20/27(a)(b) | | | | | | | 1,150 | | | | 1,097,763 | |
Park Avenue Institutional Advisers CLO Ltd. | | | | | | | | | | | | |
Series 2017-1A, Class A1, (3 mo. LIBOR US + 1.22%), 1.49%, 11/14/29(a)(b) | | | | | | | 6,970 | | | | 6,930,948 | |
Series 2017-1A, Class A2, (3 mo. LIBOR US + 1.70%), 1.97%, 11/14/29(a)(b) | | | | | | | 2,940 | | | | 2,885,414 | |
Series 2019-1A, Class A1, (3 mo. LIBOR US + 1.48%), 1.76%, 05/15/32(a)(b) | | | | | | | 500 | | | | 499,998 | |
Series 2019-1A, Class A2A, (3 mo. LIBOR US + 2.00%), 2.28%, 05/15/32(a)(b) | | | | | | | 500 | | | | 494,403 | |
Pretium Mortgage Credit Partners I LLC, Series 2020-NPL2, Class A1, 3.72%, 02/27/60(b)(e) | | | | | | | 15,060 | | | | 15,084,442 | |
Progress Residential Trust | | | | | | | | | | | | |
Series 2017-SFR1, Class A, 2.77%, 08/17/34(b) | | | | | | | 2,634 | | | | 2,682,956 | |
Series 2018-SFR1, Class F, 4.78%, 03/17/35(b) | | | | | | | 1,620 | | | | 1,653,737 | |
Series 2018-SFR2, Class F, 4.95%, 08/17/35(b) | | | | | | | 1,030 | | | | 1,041,764 | |
Series 2019-SFR1, Class E, 4.47%, 08/17/35(b) | | | | | | | 2,000 | | | | 2,063,213 | |
Series 2020-SFR2, Class B, 2.58%, 06/17/37(b) | | | | | | | 550 | | | | 564,435 | |
Series 2020-SFR2, Class D, 3.87%, 06/17/37(b) | | | | | | | 1,886 | | | | 1,975,414 | |
Series 2020-SFR3, Class E, 2.30%, 10/17/27(b) | | | | | | | 2,870 | | | | 2,870,986 | |
Series 2020-SFR3, Class F, 2.80%, 10/17/27(b) | | | | | | | 5,410 | | | | 5,411,891 | |
Race Point IX CLO Ltd., Series 2015-9A, Class A1AR, (3 mo. LIBOR US + 1.21%), 1.49%, 10/15/30(a)(b) | | | | | | | 3,710 | | | | 3,704,789 | |
Race Point X CLO Ltd., Series 2016-10A, Class A1R, (3 mo. LIBOR US + 1.10%), 1.35%, 07/25/31(a)(b) | | | | | | | 5,472 | | | | 5,410,597 | |
RAMP Series Trust, Series 2004-RS7, Class A2A, (1 mo. LIBOR US + 0.62%), 0.77%, 07/25/34(a) | | | | | | | 1,825 | | | | 1,543,775 | |
Regatta Funding LP, Series 2013-2A, Class A1R2, (3 mo. LIBOR US + 1.25%), 1.53%, 01/15/29(a)(b) | | | | | | | 1,300 | | | | 1,294,170 | |
Regatta VI Funding Ltd., Series 2016-1A, Class AR, (3 mo. LIBOR US + 1.08%), 1.35%, 07/20/28(a)(b) | | | | | | | 10,290 | | | | 10,273,546 | |
Regatta VII Funding Ltd., Series 2016-1A, Class BR, (3 mo. LIBOR US + 1.50%), 1.73%, 12/20/28(a)(b) | | | | | | | 250 | | | | 243,587 | |
Regional Management Issuance Trust, Series 2019-1, Class A,
3.05%, 11/15/28(b) | | | | | | | 12,820 | | | | 12,830,825 | |
Republic FInance Issuance Trust, Series 2019-A, Class A,
3.43%, 11/22/27(b) | | | | | | | 14,870 | | | | 15,117,200 | |
Riserva CLO Ltd., Series 2016-3A, Class AR, (3 mo. LIBOR US + 1.14%), 1.41%, 10/18/28(a)(b) | | | | | | | 4,670 | | | | 4,631,538 | |
| | | | | | | | | | | | |
| Security | | | | | Par (000) | | | Value | |
|
| Asset-Backed Securities (continued) | |
Rockford Tower CLO Ltd. | |
Series 2017-1A, Class AR, (3 mo. LIBOR US + 1.03%), 1.31%, 04/15/29(a)(b) | | | USD | | | | 10,140 | | | $ | 10,065,390 | |
Series 2017-1A, Class BR, (3 mo. LIBOR US + 1.45%), 1.73%, 04/15/29(a)(b) | | | | | | | 7,210 | | | | 7,068,667 | |
Series 2017-1A, Class CR, (3 mo. LIBOR US + 1.85%), 2.13%, 04/15/29(a)(b) | | | | | | | 2,490 | | | | 2,377,372 | |
Series 2017-1A, Class DR, (3 mo. LIBOR US + 2.65%), 2.93%, 04/15/29(a)(b) | | | | | | | 750 | | | | 701,730 | |
Series 2017-2A, Class BR, (3 mo. LIBOR US + 1.50%), 1.78%, 10/15/29(a)(b) | | | | | | | 7,771 | | | | 7,535,959 | |
Series 2017-2A, Class CR, (3 mo. LIBOR US + 1.90%), 2.18%, 10/15/29(a)(b) | | | | | | | 2,750 | | | | 2,640,824 | |
Series 2017-2A, Class DR, (3 mo. LIBOR US + 2.85%), 3.13%, 10/15/29(a)(b) | | | | | | | 4,766 | | | | 4,702,087 | |
Series 2017-2A, Class ER, (3 mo. LIBOR US + 6.25%), 6.53%, 10/15/29(a)(b) | | | | | | | 1,750 | | | | 1,522,004 | |
Series 2017-3A, Class A, (3 mo. LIBOR US + 1.19%), 1.46%, 10/20/30(a)(b) | | | | | | | 14,614 | | | | 14,554,818 | |
Series 2018-1A, Class A, (3 mo. LIBOR US + 1.10%), 1.35%, 05/20/31(a)(b) | | | | | | | 1,953 | | | | 1,937,510 | |
Series 2018-1A, Class B, (3 mo. LIBOR US + 1.72%), 1.97%, 05/20/31(a)(b) | | | | | | | 1,500 | | | | 1,470,394 | |
Series 2018-1A, Class D, (3 mo. LIBOR US + 3.00%), 3.25%, 05/20/31(a)(b) | | | | | | | 750 | | | | 717,910 | |
Series 2018-2A, Class A, (3 mo. LIBOR US + 1.16%), 1.43%, 10/20/31(a)(b) | | | | | | | 1,000 | | | | 993,963 | |
Series 2018-2A, Class B, (3 mo. LIBOR US + 1.80%), 2.07%, 10/20/31(a)(b) | | | | | | | 500 | | | | 492,103 | |
Series 2019-2A, Class B, (3 mo. LIBOR US + 1.93%), 2.18%, 08/20/32(a)(b) | | | | | | | 1,250 | | | | 1,229,575 | |
Rockford Tower Europe CLO DAC | | | | | | | | | | | | |
Series 2018-1X, Class B, (3 mo. EURIBOR + 1.85%), 1.85%, 12/20/31(a) | | | EUR | | | | 3,898 | | | | 4,573,813 | |
Series 2018-1X, Class C, (3 mo. EURIBOR + 2.47%), 2.47%, 12/20/31(a) | | | | | | | 435 | | | | 506,114 | |
Romark WM-R Ltd., Series 2018-1A, Class A1, (3 mo. LIBOR US + 1.03%), 1.30%, 04/20/31(a)(b) | | | USD | | | | 4,272 | | | | 4,264,289 | |
RR 11 Ltd., Series 2020-11A, Class A2, (3 mo. LIBOR US + 2.10%),
2.28%, 10/15/31(a)(b) | | | | | | | 4,176 | | | | 4,175,985 | |
RR 2 Ltd. | | | | | | | | | | | | |
Series 2017-2A, Class A2, (3 mo. LIBOR US + 1.60%), 1.88%, 10/15/29(a)(b) | | | | | | | 750 | | | | 733,334 | |
Series 2017-2A, Class B, (3 mo. LIBOR US + 2.00%), 2.28%, 10/15/29(a)(b) | | | | | | | 750 | | | | 719,223 | |
RR 3 Ltd., Series 2018-3A, Class A1R2, (3 mo. LIBOR US + 1.09%),
1.37%, 01/15/30(a)(b) | | | | | | | 2,020 | | | | 1,999,681 | |
RR 4 Ltd., Series 2018-4A, Class A2, (3 mo. LIBOR US + 1.55%), 1.83%, 04/15/30(a)(b) | | | | | | | 1,400 | | | | 1,361,090 | |
RR 6 Ltd., Series 2019-6A, Class A1A, (3 mo. LIBOR US + 1.25%), 1.53%, 04/15/30(a)(b) | | | | | | | 9,840 | | | | 9,798,126 | |
RRE 2 Loan Management DAC, Series 2A, Class B, (3 mo. EURIBOR + 1.80%), 1.80%, 01/15/32(a)(b) | | | EUR | | | | 750 | | | | 879,964 | |
SACO I Trust, Series 2006-9, Class A1, (1 mo. LIBOR US + 0.30%),
0.45%, 08/25/36(a) | | | USD | | | | 242 | | | | 239,411 | |
Security National Mortgage Loan Trust, Series 2007-1A, Class 2A, (1 mo. LIBOR US + 0.35%), 0.50%, 04/25/37(a)(b) | | | | | | | 391 | | | | 390,206 | |
| | |
| 66 | | 2 0 2 0 B L A C K R O C K A N N U A L R E P O R T T O S H A R E H O L D E R S |
| | |
Schedule of Investments (continued) September 30, 2020 | | Master Total Return Portfolio (Percentages shown are based on Net Assets) |
| | | | | | | | | | | | |
| Security | | | | | Par
(000) | | | Value | |
|
| Asset-Backed Securities (continued) | |
Seneca Park CLO Ltd., Series 2014-1A, Class AR, (3 mo. LIBOR US + 1.12%), 1.39%, 07/17/26(a)(b) | | | USD | | | | 35 | | | $ | 34,946 | |
SG Mortgage Securities Trust, Series 2006-FRE2, Class A2C, (1 mo. LIBOR US + 0.16%), 0.31%, 07/25/36(a) | | | | | | | 953 | | | | 306,672 | |
Silver Creek CLO Ltd. | | | | | | | | | | | | |
Series 2014-1A, Class AR, (3 mo. LIBOR US + 1.24%), 1.51%, 07/20/30(a)(b) | | | | | | | 3,920 | | | | 3,908,375 | |
Series 2014-1A, Class CR, (3 mo. LIBOR US + 2.30%), 2.57%, 07/20/30(a)(b) | | | | | | | 500 | | | | 480,909 | |
SLM Private Credit Student Loan Trust | | | | | | | | | | | | |
Series 2004-A, Class A3, (3 mo. LIBOR US + 0.40%), 0.65%, 06/15/33(a) | | | | | | | 1,675 | | | | 1,645,185 | |
Series 2004-B, Class A3, (3 mo. LIBOR US + 0.33%), 0.58%, 03/15/24(a) | | | | | | | 5,813 | | | | 5,756,281 | |
Series 2006-A, Class A5, (3 mo. LIBOR US + 0.29%), 0.54%, 06/15/39(a) | | | | | | | 14,392 | | | | 13,689,232 | |
Series 2006-B, Class A5, (3 mo. LIBOR US + 0.27%), 0.52%, 12/15/39(a) | | | | | | | 456 | | | | 424,993 | |
SLM Private Education Loan Trust, Series 2010-C, Class A5, (1 mo. LIBOR US + 4.75%), 4.90%, 10/15/41(a)(b) | | | | | | | 17,610 | | | | 19,191,977 | |
SMB Private Education Loan Trust | | | | | | | | | | | | |
Series 2015-B, Class B, 3.50%, 12/17/40(b) | | | | 2,480 | | | | 2,548,490 | |
Series 2020-BA, Class B, 2.76%, 07/15/53(b) | | | | | | | 2,440 | | | | 2,427,673 | |
Series 2020-PTA, Class A2A, 1.60%, 09/15/54(b) | | | | | | | 20,680 | | | | 20,808,845 | |
Series 2020-PTA, Class B, 2.50%, 09/15/54(b) | | | | | | | 6,740 | | | | 6,624,010 | |
Sound Point CLO II Ltd., Series 2013-1A, Class A1R, (3 mo. LIBOR US + 1.07%), 1.32%, 01/26/31(a)(b) | | | | | | | 500 | | | | 495,139 | |
Sound Point CLO XI Ltd., Series 2016-1A, Class CR, (3 mo. LIBOR US + 2.25%), 2.52%, 07/20/28(a)(b) | | | | | | | 440 | | | | 429,099 | |
Sound Point CLO XIV Ltd. | | | | | | | | | | | | |
Series 2016-3A, Class AR, (3 mo. LIBOR US + 1.15%), 1.41%, 01/23/29(a)(b) | | | | | | | 9,440 | | | | 9,411,519 | |
Series 2016-3A, Class C, (3 mo. LIBOR US + 2.65%), 2.91%, 01/23/29(a)(b) | | | | | | | 1,000 | | | | 974,187 | |
Sound Point CLO XV Ltd., Series 2017-1A, Class AR, (3 mo. LIBOR US + 1.15%), 1.41%, 01/23/29(a)(b) | | | | | | | 1,720 | | | | 1,707,283 | |
Sound Point CLO XVIII Ltd., Series 2017-4A, Class B, (3 mo. LIBOR US + 1.80%), 2.07%, 01/21/31(a)(b) | | | | | | | 500 | | | | 464,759 | |
Sound Point CLO XXIII, Series 2019-2A, Class A1, (3 mo. LIBOR US + 1.40%), 1.68%, 04/15/32(a)(b) | | | | | | | 19,610 | | | | 19,448,267 | |
Sound Point Euro CLO I Funding DAC, Series 1X, Class B1, (3 mo. EURIBOR + 2.00%), 2.00%, 04/25/32(a) | | | EUR | | | | 660 | | | | 770,895 | |
Sound Point Euro CLO II Funding DAC, Series 2A, Class B1, (3 mo. EURIBOR + 1.85%), 1.85%, 10/26/32(a)(b) | | | | | | | 3,020 | | | | 3,546,089 | |
Soundview Home Loan Trust, Series 2004-WMC1, Class M2, (1 mo. LIBOR US + 0.80%), 0.94%, 01/25/35(a) | | | USD | | | | 45 | | | | 42,404 | |
St. Paul’s CLO XII DAC, Series 12X, Class B1, (3 mo. EURIBOR + 1.60%), 1.60%, 04/15/33(a) | | | EUR | | | | 1,420 | | | | 1,638,073 | |
| | | | | | | | | | | | |
| Security | | | | | Par (000) | | | Value | |
|
| Asset-Backed Securities (continued) | |
Starwood Waypoint Homes Trust, Series 2017-1, Class E, (1 mo. LIBOR US + 2.60%), 2.75%, 01/17/35(a)(b) | | | USD | | | | 4,500 | | | $ | 4,505,068 | |
Steele Creek CLO Ltd., Series 2017-1A, Class A, (3 mo. LIBOR US + 1.25%), 1.53%, 10/15/30(a)(b) | | | | | | | 4,140 | | | | 4,079,349 | |
Stewart Park CLO Ltd., Series 2015-1A, Class CR, (3 mo. LIBOR US + 1.80%), 2.08%, 01/15/30(a)(b) | | | | | | | 1,630 | | | | 1,520,901 | |
Stratus CLO Ltd., Series 2020-2A, Class D, (3 mo. LIBOR US + 3.65%), 3.92%, 10/15/28(a)(b) | | | | | | | 500 | | | | 500,212 | |
Structured Asset Securities Corp. Assistance Loan Trust, Series 2003-AL2, Class A, 3.36%, 01/25/31(b) | | | | | | | 236 | | | | 233,351 | |
Structured Asset Securities Corp. Mortgage Pass- Through Certificates, Series 2004-23XS, Class 2A1, (1 mo. LIBOR US + 0.30%), 0.45%, 01/25/35(a) | | | | | | | 235 | | | | 232,774 | |
Sutton Park CLO DAC, Series 1X, Class BE, (3 mo. EURIBOR + 2.35%), 2.35%, 11/15/31(a) | | | EUR | | | | 940 | | | | 1,079,577 | |
Symphony CLO XVII Ltd., Series 2016-17A, Class AR, (3 mo. LIBOR US + 0.88%), 1.16%, 04/15/28(a)(b) | | | USD | | | | 3,598 | | | | 3,569,848 | |
Symphony CLO XVIII Ltd. | | | | | | | | | | | | |
Series 2016-18A, Class AR, (3 mo. LIBOR US + 1.15%), 1.41%, 01/23/28(a)(b) | | | | | | | 4,140 | | | | 4,116,195 | |
Series 2016-18A, Class B, (3 mo. LIBOR US + 1.80%), 2.06%, 01/23/28(a)(b) | | | | | | | 300 | | | | 295,769 | |
Symphony CLO XXI Ltd., Series 2019-21A, Class A, (3 mo. LIBOR US + 1.38%), 1.66%, 07/15/32(a)(b) | | | | | | | 4,230 | | | | 4,227,769 | |
TCI-Flatiron CLO Ltd., Series 2017-1A, Class A, (3 mo. LIBOR US + 1.20%),
1.48%, 11/18/30(a)(b) | | | | | | | 3,290 | | | | 3,268,088 | |
TCW CLO Ltd., Series 2020-1A, Class D, (3 mo. LIBOR US + 4.50%), 5.26%, 04/20/28(a)(b) | | | | | | | 2,150 | | | | 2,151,982 | |
Thacher Park CLO Ltd., Series 2014-1A, Class AR, (3 mo. LIBOR US + 1.16%), 1.43%, 10/20/26(a)(b) | | | | | | | 125 | | | | 125,022 | |
THL Credit Wind River CLO Ltd. | | | | | | | | | | | | |
Series 2012-1A, Class BR2, (3 mo. LIBOR US + 1.45%), 1.73%, 01/15/26(a)(b) | | | | | | | 920 | | | | 909,726 | |
Series 2016-1A, Class AR, (3 mo. LIBOR US + 1.05%), 1.33%, 07/15/28(a)(b) | | | | | | | 4,880 | | | | 4,868,874 | |
Series 2017-1A, Class C, (3 mo. LIBOR US + 2.30%), 2.57%, 04/18/29(a)(b) | | | | | | | 1,400 | | | | 1,362,897 | |
TIAA CLO II Ltd., Series 2017-1A, Class A, (3 mo. LIBOR US + 1.28%), 1.55%, 04/20/29(a)(b) | | | | | | | 2,340 | | | | 2,334,669 | |
TIAA CLO III Ltd., Series 2017-2A, Class A, (3 mo. LIBOR US + 1.15%), 1.42%, 01/16/31(a)(b) | | | | | | | 1,467 | | | | 1,447,579 | |
TICP CLO I Ltd., Series 2015-1A, Class AR, (3 mo. LIBOR US + 0.80%), 1.07%, 07/20/27(a)(b) | | | | | | | 852 | | | | 846,772 | |
TICP CLO IX Ltd., Series 2017-9A, Class A, (3 mo. LIBOR US + 1.14%), 1.41%, 01/20/31(a)(b) | | | | | | | 3,080 | | | | 3,049,211 | |
TICP CLO V Ltd., Series 2016-5A, Class ER, (3 mo. LIBOR US + 5.75%), 6.02%, 07/17/31(a)(b) | | | | | | | 1,000 | | | | 881,713 | |
TICP CLO VI Ltd. | | | | | | | | | | | | |
Series 2016-6A, Class AR, (3 mo. LIBOR US + 1.20%), 1.48%, 01/15/29(a)(b) | | | | | | | 3,820 | | | | 3,799,200 | |
| | |
S C H E D U L E O F I N V E S T M E N T S | | 67 |
| | |
Schedule of Investments (continued) September 30, 2020 | | Master Total Return Portfolio (Percentages shown are based on Net Assets) |
| | | | | | | | | | | | |
| Security | | | | | Par (000) | | | Value | |
|
| Asset-Backed Securities (continued) | |
TICP CLO VI Ltd. | | | | | | | | | | | | |
Series 2016-6A, Class BR, (3 mo. LIBOR US + 1.70%), 1.98%, 01/15/29(a)(b) | | | USD | | | | 5,360 | | | $ | 5,270,271 | |
TICP CLO VII Ltd., Series 2017-7A, Class ER, (3 mo. LIBOR US + 7.05%), 7.33%, 04/15/33(a)(b) | | | | | | | 750 | | | | 654,811 | |
TICP CLO XI Ltd., Series 2018-11A, Class A, (3 mo. LIBOR US + 1.18%), 1.45%, 10/20/31(a)(b) | | | | | | | 750 | | | | 742,499 | |
TICP CLO XII Ltd., Series 2018-12A, Class A, (3 mo. LIBOR US + 1.11%), 1.39%, 01/15/31(a)(b) | | | | | | | 250 | | | | 247,951 | |
Towd Point Mortgage Trust, Series 2019-SJ2, Class M1, 4.50%, 11/25/58(b)(d) | | | | | | | 8,260 | | | | 8,598,812 | |
TRESTLES CLO III Ltd. | | | | | | | | | | | | |
Series 2020-3A, Class A1, (3 mo. LIBOR US + 1.33%), 1.60%, 01/20/33(a)(b) | | | | | | | 8,860 | | | | 8,842,625 | |
Series 2020-3A, Class B1, (3 mo. LIBOR US + 1.85%), 2.12%, 01/20/33(a)(b) | | | | | | | 2,590 | | | | 2,589,987 | |
TRESTLES CLO Ltd., Series 2017-1A, Class A1A, (3 mo. LIBOR US + 1.29%), 1.53%, 07/25/29(a)(b) | | | | | | | 250 | | | | 249,320 | |
Tricon American Homes, Series 2020-SFR1, Class D, 2.55%, 07/17/38(b) | | | | | | | 6,675 | | | | 6,814,310 | |
Tricon American Homes Trust | | | | | | | | | | | | |
Series 2017-SFR1, Class D, 3.41%, 09/17/34(b) | | | | | | | 2,784 | | | | 2,824,884 | |
Series 2017-SFR1, Class F, 5.15%, 09/17/34(b) | | | | | | | 14,485 | | | | 14,873,407 | |
Series 2017-SFR2, Class F, 5.10%, 01/17/36(b) | | | | | | | 8,715 | | | | 9,051,280 | |
Series 2018-SFR1, Class E, 4.56%, 05/17/37(b) | | | | | | | 890 | | | | 940,357 | |
Series 2018-SFR1, Class F, 4.96%, 05/17/37(b) | | | | | | | 610 | | | | 648,900 | |
VCAT LLC, Series 2020-NPL1, Class A1, 3.67%, 08/25/50(b)(e) | | | | | | | 11,737 | | | | 11,734,215 | |
Venture CLO Ltd. | | | | | | | | | | | | |
Series 2018-32A, Class A2A, (3 mo. LIBOR US + 1.07%), 1.34%, 07/18/31(a)(b) | | | | | | | 1,480 | | | | 1,458,163 | |
Series 2018-35A, Class AS, (3 mo. LIBOR US + 1.15%), 1.41%, 10/22/31(a)(b) | | | | | | | 2,810 | | | | 2,815,636 | |
Venture XVIII CLO Ltd., Series 2014-18A, Class AR, (3 mo. LIBOR US + 1.22%), 1.50%, 10/15/29(a)(b) | | | | | | | 9,820 | | | | 9,679,428 | |
Vericrest Opportunity Loan Trust, Series 2019- NPL2, Class A1, 3.97%, 02/25/49(b)(e) | | | | | | | 922 | | | | 922,279 | |
Vibrant CLO VII Ltd., Series 2017-7A, Class A1, (3 mo. LIBOR US + 1.27%), 1.54%, 09/15/30(a)(b) | | | | | | | 1,750 | | | | 1,738,096 | |
Voya CLO Ltd. | | | | | | | | | | | | |
Series 2014-3A, Class CR, (3 mo. LIBOR US + 2.65%), 2.89%, 07/25/26(a)(b) | | | | | | | 1,680 | | | | 1,574,327 | |
Series 2014-4A, Class A1RA, (3 mo. LIBOR US + 1.10%), 1.37%, 07/14/31(a)(b) | | | | | | | 249 | | | | 244,726 | |
Series 2015-2A, Class BR, (3 mo. LIBOR US + 1.50%), 1.76%, 07/23/27(a)(b) | | | | | | | 780 | | | | 763,375 | |
Series 2017-3A, Class A1A, (3 mo. LIBOR US + 1.23%), 1.50%, 07/20/30(a)(b) | | | | | | | 2,201 | | | | 2,195,209 | |
Series 2017-4A, Class A1, (3 mo. LIBOR US + 1.13%), 1.41%, 10/15/30(a)(b) | | | | | | | 6,640 | | | | 6,604,310 | |
Series 2019-1A, Class AR, (3 mo. LIBOR US + 1.06%), 1.34%, 04/15/31(a)(b) | | | | | | | 10,079 | | | | 9,984,644 | |
Voya Euro CLO II DAC, Series 2X, Class C, (3 mo. EURIBOR + 2.75%), 2.75%, 07/15/32(a) | | | EUR | | | | 730 | | | | 856,062 | |
| | | | | | | | | | | | |
| Security | | | | | Par (000) | | | Value | |
|
| Asset-Backed Securities (continued) | |
Wachovia Asset Securitization Issuance II LLC Trust, Series 2007-HE2A, Class A, (1 mo. LIBOR US + 0.13%), 0.30%, 07/25/37(a)(b) | | | USD | | | | 1,467 | | | $ | 1,316,337 | |
Washington Mutual Asset-Backed Certificates Trust | | | | | | | | | | | | |
Series 2006-HE4, Class 2A2, (1 mo. LIBOR US + 0.18%), 0.33%, 09/25/36(a) | | | | | | | 4,973 | | | | 2,231,767 | |
Series 2006-HE5, Class 1A, (1 mo. LIBOR US + 0.16%), 0.30%, 10/25/36(a) | | | | | | | 1,877 | | | | 1,536,416 | |
Series 2007-HE3, Class 2A3, (1 mo. LIBOR US + 0.24%), 0.39%, 05/25/37(a) | | | | | | | 1,282 | | | | 1,103,479 | |
Wellfleet CLO Ltd. | | | | | | | | | | | | |
Series 2017-1A, Class A1R, (3 mo. LIBOR US + 1.15%), 1.42%, 04/20/29(a)(b) | | | | | | | 3,730 | | | | 3,718,745 | |
Series 2017-3A, Class B, (3 mo. LIBOR US + 1.95%), 2.22%, 01/17/31(a)(b) | | | | | | | 750 | | | | 720,741 | |
Westcott Park CLO Ltd., Series 2016-1A, Class AR, (3 mo. LIBOR US + 1.21%), 1.48%, 07/20/28(a)(b) | | | | | | | 5,610 | | | | 5,587,589 | |
Whitebox CLO I Ltd., Series 2019-1A, Class C, (3 mo. LIBOR US + 4.35%), 4.61%, 07/24/32(a)(b) | | | | | | | 2,570 | | | | 2,552,162 | |
Whitebox CLO II Ltd. | | | | | | | | | | | | |
Series 2020-2A, Class A1, (3 mo. LIBOR US + 1.75%), 1.99%, 10/24/31(a)(b) | | | | | | | 1,470 | | | | 1,467,030 | |
Series 2020-2A, Class B, (3 mo. LIBOR US + 2.25%), 2.49%, 10/24/31(a)(b) | | | | | | | 1,470 | | | | 1,450,011 | |
Series 2020-2A, Class D, (3 mo. LIBOR US + 4.15%), 4.39%, 10/24/31(a)(b) | | | | | | | 1,470 | | | | 1,460,941 | |
Yale Mortgage Loan Trust, Series 2007-1, Class A, (1 mo. LIBOR US + 0.40%), 0.55%, 06/25/37(a)(b) | | | | | | | 2,418 | | | | 996,243 | |
York CLO 1 Ltd., Series 2014-1A, Class DRR, (3 mo. LIBOR US + 3.01%), 3.27%, 10/22/29(a)(b) | | | | | | | 250 | | | | 235,311 | |
York CLO-2 Ltd., Series 2015-1A, Class AR, (3 mo. LIBOR US + 1.15%), 1.41%, 01/22/31(a)(b) | | | | | | | 250 | | | | 248,036 | |
York CLO-3 Ltd., Series 2016-1A, Class BR, (3 mo. LIBOR US + 1.75%), 2.02%, 10/20/29(a)(b) | | | | | | | 3,380 | | | | 3,321,885 | |
York CLO-4 Ltd. | | | | | | | | | | | | |
Series 2016-2A, Class A1R, (3 mo. LIBOR US + 1.09%), 1.36%, 04/20/32(a)(b)(c) | | | | | | | 8,250 | | | | 8,126,250 | |
Series 2016-2A, Class BR, (3 mo. LIBOR US + 1.55%), 1.82%, 04/20/32(a)(b)(c) | | | | | | | 3,000 | | | | 2,880,000 | |
Series 2016-2A, Class CR, (3 mo. LIBOR US + 2.15%), 2.42%, 04/20/32(a)(b) | | | | | | | 3,000 | | | | 2,859,000 | |
York CLO-7 Ltd., Series 2019-2A, Class C, (3 mo. LIBOR US + 2.75%), 3.01%, 01/22/33(a)(b) | | | | | | | 500 | | | | 494,391 | |
| | | | | | | | | | | | |
| |
Total Asset-Backed Securities — 11.0%
(Cost: $2,225,960,384) | | | | 2,210,762,256 | |
| | | | | | | | | | | | |
| | | |
| | | | | | Shares | | | | |
| | | |
Common Stocks | | | | | | | | | | | | |
| |
| Diversified Financial Services — 0.1% | | | | |
Dragoneer Growth Opportunities Corp.(f) | | | | | | | 323,687 | | | | 3,965,166 | |
Falcon Capital Acquisition Corp.(f) | | | | | | | 359,337 | | | | 3,697,577 | |
| | | | | | | | | | | | |
| | | |
| | | | | | | | | | | 7,662,743 | |
| | |
| 68 | | 2 0 2 0 B L A C K R O C K A N N U A L R E P O R T T O S H A R E H O L D E R S |
| | |
Schedule of Investments (continued) September 30, 2020 | | Master Total Return Portfolio (Percentages shown are based on Net Assets) |
| | | | | | | | | | | | |
| Security | | | | | Shares | | | Value | |
|
| Energy Equipment & Services — 0.0% | |
Pioneer Energy Services Corp.(c)(f) | | | | | | | 7,278 | | | $ | 282,627 | |
Vantage Drilling Co.(f) | | | | | | | 311,000 | | | | 1,088 | |
| | | | | | | | | | | | |
| | | |
| | | | | | | | | | | 283,715 | |
|
| Entertainment — 0.0% | |
Cinemark Holdings, Inc. | | | | | | | 104,612 | | | | 1,046,120 | |
| | | | | | | | | | | | |
|
| Equity Real Estate Investment Trusts (REITs) — 0.0% | |
Service Properties Trust | | | | | | | 389,045 | | | | 3,092,908 | |
| | | | | | | | | | | | |
|
| Health Care Providers & Services — 0.0% | |
HCA Healthcare, Inc. | | | | | | | 14,402 | | | | 1,795,641 | |
| | | | | | | | | | | | |
|
| Hotels, Restaurants & Leisure — 0.0% | |
Caesars Entertainment, Inc.(f) | | | | | | | 105,840 | | | | 5,933,390 | |
Target Hospitality Corp.(f) | | | | | | | 112,843 | | | | 137,669 | |
| | | | | | | | | | | | |
| | | |
| | | | | | | | | | | 6,071,059 | |
| | | |
| Household Durables — 0.1% | | | | | | | | | |
Beazer Homes U.S.A., Inc.(f) | | | | | | | 52,287 | | | | 690,189 | |
Century Communities, Inc.(f)(g) | | | | | | | 56,406 | | | | 2,387,666 | |
Taylor Morrison Home Corp.(f) | | | | | | | 328,641 | | | | 8,081,282 | |
| | | | | | | | | | | | |
| | | |
| | | | | | | | | | | 11,159,137 | |
|
| Independent Power and Renewable Electricity Producers — 0.0% | |
Vistra Energy Corp.(g) | | | | | | | 139,988 | | | | 2,640,174 | |
| | | | | | | | | | | | |
|
| Media — 0.0% | |
Altice U.S.A., Inc.(f) | | | | | | | 77,054 | | | | 2,003,404 | |
| | | | | | | | | | | | |
|
| Metals & Mining — 0.0% | |
Northern Graphite Corp.(f) | | | | | | | 99,612 | | | | 20,198 | |
| | | | | | | | | | | | |
|
| Oil, Gas & Consumable Fuels — 0.0% | |
CA Resources Corp.(f) | | | | | | | 136,266 | | | | 1,771,458 | |
| | | | | | | | | | | | |
|
| Real Estate Management & Development — 0.0% | |
Forestar Group, Inc.(f) | | | | | | | 128,970 | | | | 2,282,769 | |
KE Holdings, Inc., ADR(f)(h) | | | | | | | 9,967 | | | | 610,977 | |
| | | | | | | | | | | | |
| | | |
| | | | | | | | | | | 2,893,746 | |
| | | | | | | | | | | | |
| | | |
Total Common Stocks — 0.2%
(Cost: $37,492,413) | | | | | | | | | | | 40,440,303 | |
| | | | | | | | | | | | |
| | | |
| | | | | | Par (000) | | | | |
| | | |
Corporate Bonds | | | | | | | | | | | | |
| | | |
| Aerospace & Defense — 1.7% | | | | | | | | | |
BAE Systems Holdings, Inc. | | | | | | | | | | | | |
3.80%, 10/07/24(b) | | | USD | | | | 2,488 | | | | 2,761,576 | |
3.85%, 12/15/25(b) | | | | | | | 12,498 | | | | 14,107,786 | |
4.75%, 10/07/44(b) | | | | | | | 259 | | | | 330,604 | |
BAE Systems PLC, 3.40%, 04/15/30(b) | | | | | | | 13,988 | | | | 15,633,150 | |
Boeing Co. | | | | | | | | | | | | |
2.80%, 03/01/23 | | | | | | | 2,463 | | | | 2,510,802 | |
4.51%, 05/01/23 | | | | | | | 6,687 | | | | 7,050,372 | |
4.88%, 05/01/25 | | | | | | | 10,598 | | | | 11,531,951 | |
3.83%, 03/01/59 | | | | | | | 605 | | | | 533,257 | |
5.93%, 05/01/60 | | | | | | | 5,008 | | | | 6,198,098 | |
Embraer Netherlands Finance BV,
5.40%, 02/01/27 | | | | | | | 947 | | | | 894,323 | |
Embraer Overseas Ltd.,
5.70%, 09/16/23 | | | | | | | 1,337 | | | | 1,354,339 | |
General Dynamics Corp. | | | | | | | | | | | | |
3.75%, 05/15/28 | | | | | | | 4,050 | | | | 4,754,175 | |
3.63%, 04/01/30 | | | | | | | 8,065 | | | | 9,591,187 | |
4.25%, 04/01/50 | | | | | | | 1,506 | | | | 1,966,916 | |
Huntington Ingalls Industries, Inc.
3.84%, 05/01/25(b) | | | | | | | 5,245 | | | | 5,763,178 | |
| | | | | | | | | | | | |
| Security | | | | | Par (000) | | | Value | |
|
| Aerospace & Defense (continued) | |
Huntington Ingalls Industries, Inc.
4.20%, 05/01/30(b) | | | USD | | | | 9,516 | | | $ | 10,922,410 | |
L3 Technologies, Inc., 4.95%, 02/15/21 | | | | | | | 250 | | | | 251,006 | |
L3Harris Technologies, Inc. | | | | | | | | | | | | |
3.85%, 06/15/23 | | | | | | | 2,291 | | | | 2,480,358 | |
3.85%, 12/15/26 | | | | | | | 10,802 | | | | 12,411,457 | |
4.40%, 06/15/28 | | | | | | | 13,382 | | | | 15,951,546 | |
4.40%, 06/15/28 | | | | | | | 3,547 | | | | 4,228,077 | |
2.90%, 12/15/29 | | | | | | | 864 | | | | 947,895 | |
Lockheed Martin Corp. | | | | | | | | | | | | |
3.60%, 03/01/35 | | | | | | | 14,240 | | | | 17,129,715 | |
6.15%, 09/01/36 | | | | | | | 1,247 | | | | 1,848,709 | |
4.07%, 12/15/42 | | | | | | | 2,369 | | | | 2,959,448 | |
3.80%, 03/01/45 | | | | | | | 2,429 | | | | 2,887,605 | |
4.70%, 05/15/46 | | | | | | | 1,489 | | | | 2,029,032 | |
2.80%, 06/15/50 | | | | | | | 9,104 | | | | 9,568,720 | |
Northrop Grumman Corp. | |
2.93%, 01/15/25 | | | | | | | 10,547 | | | | 11,475,706 | |
3.25%, 01/15/28 | | | | | | | 18,403 | | | | 20,677,149 | |
4.03%, 10/15/47 | | | | | | | 3,320 | | | | 4,064,820 | |
5.25%, 05/01/50 | | | | | | | 3,342 | | | | 4,794,088 | |
Raytheon Technologies Corp. | | | | | | | | | | | | |
3.65%, 08/16/23 | | | | | | | 694 | | | | 749,899 | |
3.15%, 12/15/24(b) | | | | | | | 4,040 | | | | 4,364,307 | |
3.95%, 08/16/25 | | | | | | | 7,411 | | | | 8,422,123 | |
7.20%, 08/15/27(b) | | | | | | | 2,353 | | | | 3,178,976 | |
7.00%, 11/01/28(b) | | | | | | | 7,205 | | | | 9,876,120 | |
4.13%, 11/16/28 | | | | | | | 10,595 | | | | 12,545,804 | |
7.50%, 09/15/29 | | | | | | | 475 | | | | 690,395 | |
2.15%, 05/18/30 | | | EUR | | | | 8,500 | | | | 11,083,863 | |
2.25%, 07/01/30 | | | USD | | | | 15,973 | | | | 16,893,635 | |
4.20%, 12/15/44(b) | | | | | | | 1,922 | | | | 2,178,377 | |
4.15%, 05/15/45 | | | | | | | 1,513 | | | | 1,814,891 | |
Textron, Inc. | | | | | | | | | | | | |
3.88%, 03/01/25 | | | | | | | 3,610 | | | | 3,955,869 | |
3.65%, 03/15/27 | | | | | | | 2,985 | | | | 3,247,848 | |
3.90%, 09/17/29 | | | | | | | 8,086 | | | | 9,059,369 | |
2.45%, 03/15/31 | | | | | | | 2,100 | | | | 2,086,736 | |
TransDigm, Inc. | | | | | | | | | | | | |
8.00%, 12/15/25(b) | | | | | | | 9,810 | | | | 10,668,375 | |
6.25%, 03/15/26(b) | | | | | | | 23,463 | | | | 24,502,294 | |
United Technologies Corp.,
5.40%, 05/01/35 | | | | | | | 2,386 | | | | 3,242,756 | |
| | | | | | | | | | | | |
| | | |
| | | | | | | | | | | 338,171,092 | |
| | | |
| Air Freight & Logistics — 0.3% | | | | | | | | | |
FedEx Corp. | | | | | | | | | | | | |
1.30%, 08/05/31 | | | EUR | | | | 6,865 | | | | 8,259,314 | |
3.88%, 08/01/42 | | | USD | | | | 2,943 | | | | 3,245,330 | |
4.55%, 04/01/46 | | | | | | | 1,320 | | | | 1,591,790 | |
United Parcel Service, Inc. | | | | | | | | | | | | |
3.40%, 03/15/29 | | | | | | | 7,874 | | | | 9,095,553 | |
2.50%, 09/01/29 | | | | | | | 4,016 | | | | 4,390,933 | |
4.45%, 04/01/30 | | | | | | | 9,021 | | | | 11,292,547 | |
5.20%, 04/01/40 | | | | | | | 8,859 | | | | 12,271,414 | |
XPO Logistics, Inc. | | | | | | | | | | | | |
6.13%, 09/01/23(b) | | | | | | | 1,462 | | | | 1,492,227 | |
6.75%, 08/15/24(b) | | | | | | | 3,480 | | | | 3,686,016 | |
| | | | | | | | | | | | |
| | | |
| | | | | | | | | | | 55,325,124 | |
| | | |
| Airlines — 0.6% | | | | | | | | | |
Air Canada Pass-Through Trust | | | | | | | | | | | | |
Series 2015-2, Class B,
5.00%, 12/15/23(b) | | | | | | | 1,241 | | | | 1,029,580 | |
Series 2017-1, Class AA,
3.30%, 01/15/30(b) | | | | | | | 1,974 | | | | 1,876,540 | |
Series 2017-1, Class B,
3.70%, 01/15/26(b) | | | | | | | 20 | | | | 16,402 | |
| | |
S C H E D U L E O F I N V E S T M E N T S | | 69 |
| | |
Schedule of Investments (continued) September 30, 2020 | | Master Total Return Portfolio (Percentages shown are based on Net Assets) |
| | | | | | | | | | | | |
| Security | | | | | Par
(000) | | | Value | |
|
| Airlines (continued) | |
Alaska Airlines Pass-Through Trust, | |
Series 2020-1, Class A,
4.80%, 08/15/27(b) | | | USD | | | | 8,910 | | | $ | 9,331,040 | |
Allegiant Travel Co., 8.50%, 02/05/24(b) | | | | | | | 5,339 | | | | 5,339,000 | |
American Airlines Pass-Through Trust | | | | | | | | | | | | |
4.00%, 12/15/25(c) | | | | | | | 1,705 | | | | 1,489,916 | |
3.50%, 12/15/27(c) | | | | | | | 4,717 | | | | 4,221,335 | |
Series 2015-2, Class AA, 3.60%, 09/22/27 | | | | | | | 1,034 | | | | 991,409 | |
Series 2015-2, Class B, 4.40%, 09/22/23 | | | | | | | 5,551 | | | | 3,995,759 | |
Series 2016-1, Class AA, 3.58%, 01/15/28 | | | | | | | 4,124 | | | | 3,957,270 | |
Series 2016-1, Class B, 5.25%, 01/15/24 | | | | | | | 4,405 | | | | 3,043,032 | |
Series 2016-2, Class AA, 3.20%, 06/15/28 | | | | | | | 1,892 | | | | 1,778,305 | |
Series 2016-3, Class AA, 3.00%, 10/15/28 | | | | | | | 4,252 | | | | 3,972,602 | |
Series 2016-3, Class B, 3.75%, 10/15/25 | | | | | | | 74 | | | | 51,714 | |
Series 2017-1, Class AA, 3.65%, 02/15/29 | | | | | | | 1,449 | | | | 1,393,365 | |
Series 2017-1, Class B, 4.95%, 02/15/25 | | | | | | | 1,300 | | | | 916,503 | |
Series 2017-2, Class B, 3.70%, 10/15/25 | | | | | | | 1,508 | | | | 959,234 | |
Series 2019-1, Class AA, 3.15%, 02/15/32 | | | | | | | 5,096 | | | | 4,806,439 | |
Series 2019-1, Class B, 3.85%, 02/15/28 | | | | | | | 5,353 | | | | 3,537,137 | |
American Airlines, Inc. | | | | | | | | | | | | |
4.13%, 06/15/22(c) | | | | | | | 15,927 | | | | 13,678,107 | |
4.87%, 10/22/23(c) | | | | | | | 1,080 | | | | 910,090 | |
Avianca Holdings SA,
9.00%, 05/10/23(b)(f)(i) | | | | | | | 983 | | | | 154,208 | |
Delta Air Lines Pass-Through Trust, | | | | | | | | | | | | |
Series 2019-1, Class AA, 3.20%, 04/25/24 | | | | | | | 12,694 | | | | 12,651,017 | |
GOL Equity Finance SA,
3.75%, 07/15/24(b)(j) | | | | | | | 790 | | | | 493,106 | |
Gol Finance, Inc., 7.00%, 01/31/25(b) | | | | | | | 3,654 | | | | 2,546,907 | |
JetBlue 2020-1 Class A Pass-Through Trust, 4.00%, 11/15/32 | | | | | | | 9,725 | | | | 10,062,654 | |
Sun Country Airlines | | | | | | | | | | | | |
Series 2019-1B, 4.70%, 12/15/25(c) | | | | | | | 2,342 | | | | 1,929,470 | |
Series 2019-1C, 7.00%, 12/15/25(c) | | | | | | | 2,344 | | | | 1,922,008 | |
Transportes Aereos Portugueses SA,
5.63%, 12/02/24(b) | | | EUR | | | | 400 | | | | 286,085 | |
Turkish Airlines Pass-Through Trust, | | | | | | | | | | | | |
Series 2015-1, Class A,
4.20%, 03/15/27(b) | | | USD | | | | 1,341 | | | | 1,067,182 | |
United Airlines Pass-Through Trust | | | | | | | | | | | | |
Series 2014-1, Class B, 4.75%, 04/11/22 | | | | | | | 364 | | | | 334,474 | |
Series 2014-2, Class B, 4.63%, 09/03/22 | | | | | | | 416 | | | | 387,656 | |
Series 2015-1, Class AA, 3.45%, 12/01/27 | | | | | | | 1,472 | | | | 1,442,426 | |
Series 2016-1, Class AA, 3.10%, 07/07/28 | | | | | | | 577 | | | | 564,564 | |
Series 2016-1, Class B, 3.65%, 01/07/26 | | | | | | | 432 | | | | 329,159 | |
Series 2016-2, Class AA, 2.88%, 10/07/28 | | | | | | | 1,811 | | | | 1,720,278 | |
Series 2016-2, Class B, 3.65%, 10/07/25 | | | | | | | 240 | | | | 180,970 | |
Series 2018-1, Class AA, 3.50%, 03/01/30 | | | | | | | 1,217 | | | | 1,153,006 | |
Series 2018-1, Class B, 4.60%, 03/01/26 | | | | | | | 1,894 | | | | 1,468,649 | |
Series 2019-2, Class AA, 2.70%, 05/01/32 | | | | | | | 3,365 | | | | 3,183,072 | |
Series 2019-2, Class B, 3.50%, 05/01/28 | | | | | | | 4,946 | | | | 3,618,584 | |
| | | | | | | | | | | | |
| | | |
| | | | | | | | | | | 112,790,254 | |
|
| Auto Components — 0.0% | |
American Axle & Manufacturing, Inc.,
6.25%, 04/01/25 | | | | | | | 1,860 | | | | 1,836,750 | |
Magna International, Inc., 2.45%, 06/15/30 | | | | | | | 2,085 | | | | 2,196,248 | |
| | | | | | | | | | | | |
| | | |
| | | | | | | | | | | 4,032,998 | |
| | | |
| Automobiles — 0.3% | | | | | | | | | |
BMW U.S. Capital LLC,
3.90%, 04/09/25(b) | | | | | | | 4,460 | | | | 4,983,247 | |
Daimler Finance North America LLC | | | | | | | | | | | | |
2.30%, 02/12/21(b) | | | | | | | 8,755 | | | | 8,808,731 | |
3.35%, 05/04/21(b) | | | | | | | 13,164 | | | | 13,374,031 | |
| | | | | | | | | | | | |
| Security | | | | | Par (000) | | | Value | |
| | | |
| Automobiles (continued) | | | | | | | | | |
Nissan Motor Co. Ltd. | | | | | | | | | | | | |
3.52%, 09/17/25(b) | | | USD | | | | 10,201 | | | $ | 10,292,197 | |
4.81%, 09/17/30(b) | | | | | | | 14,616 | | | | 14,703,766 | |
| | | | | | | | | | | | |
| | | |
| | | | | | | | | | | 52,161,972 | |
| | | |
| Banks — 5.7% | | | | | | | | | |
Banco de Credito del Peru, (5 yr. U.S. Treasury Yield Curve Rate T Note Constant Maturity + 3.00%), 3.13%, 07/01/30(b)(k) | | | | | | | 3,279 | | | | 3,279,000 | |
Banco Espirito Santo SA | | | | | | | | | | | | |
2.63%, 05/08/17(f)(i) | | | EUR | | | | 400 | | | | 60,968 | |
4.75%, 01/15/18(f)(i) | | | | | | | 2,200 | | | | 335,323 | |
4.00%, 01/21/19(f)(i) | | | | | | | 6,300 | | | | 960,242 | |
Banco Internacional del Peru SAA Interbank, 3.25%, 10/04/26(b) | | | USD | | | | 2,224 | | | | 2,322,690 | |
Banco Latinoamericano de Comercio Exterior SA, 2.38%, 09/14/25(b) | | | | | | | 2,301 | | | | 2,324,010 | |
Banco Santander Mexico SA Institucion de Banca Multiple Grupo Financiero Santand, 5.38%, 04/17/25(b) | | | | | | | 3,285 | | | | 3,637,645 | |
Banco Santander SA | | | | | | | | | | | | |
2.71%, 06/27/24 | | | | | | | 13,400 | | | | 14,177,468 | |
3.31%, 06/27/29 | | | | | | | 3,600 | | | | 3,915,804 | |
Banco Votorantim SA, 4.00%, 09/24/22(b) | | | | | | | 2,516 | | | | 2,574,969 | |
Bancolombia SA, 3.00%, 01/29/25 | | | | | | | 1,852 | | | | 1,851,537 | |
Bangkok Bank PCL, (5 yr. U.S. Treasury Yield Curve Rate T Note Constant Maturity + 1.90%), 3.73%, 09/25/34(k) | | | | | | | 2,275 | | | | 2,215,992 | |
Bank of America Corp. | | | | | | | | | | | | |
(3 mo. LIBOR US + 0.63%), 2.33%, 10/01/21(k) | | | | | | | 37,283 | | | | 37,283,000 | |
(3 mo. LIBOR US + 0.37%), 2.74%, 01/23/22(k) | | | | | | | 83 | | | | 83,584 | |
(3 mo. LIBOR US + 0.63%), 3.50%, 05/17/22(k) | | | | | | | 10,605 | | | | 10,803,824 | |
(3 mo. LIBOR US + 1.16%), 3.12%, 01/20/23(k) | | | | | | | 5,470 | | | | 5,647,520 | |
(3 mo. LIBOR US + 1.02%), 2.88%, 04/24/23(k) | | | | | | | 428 | | | | 442,718 | |
(3 mo. LIBOR US + 0.93%), 2.82%, 07/21/23(k) | | | | | | | 2,979 | | | | 3,094,061 | |
(3 mo. LIBOR US + 0.79%), 3.00%, 12/20/23(k) | | | | | | | 3,584 | | | | 3,762,466 | |
4.20%, 08/26/24 | | | | | | | 6,037 | | | | 6,723,036 | |
4.00%, 01/22/25 | | | | | | | 4,977 | | | | 5,544,378 | |
3.95%, 04/21/25 | | | | | | | 4,095 | | | | 4,548,875 | |
(3 mo. LIBOR US + 0.87%), 2.46%, 10/22/25(k) | | | | | | | 13,300 | | | | 14,022,559 | |
4.45%, 03/03/26 | | | | | | | 11,549 | | | | 13,319,968 | |
(3 mo. LIBOR US + 1.06%), 3.56%, 04/23/27(k) | | | | | | | 8,198 | | | | 9,156,592 | |
(3 mo. LIBOR US + 1.58%), 3.82%, 01/20/28(k) | | | | | | | 26,270 | | | | 29,692,192 | |
(3 mo. LIBOR US + 1.51%), 3.71%, 04/24/28(k) | | | | | | | 13,449 | | | | 15,207,923 | |
(3 mo. LIBOR US + 1.37%), 3.59%, 07/21/28(k) | | | | | | | 1,191 | | | | 1,337,563 | |
(3 mo. LIBOR US + 1.04%), 3.42%, 12/20/28(g)(k) | | | | | | | 36,756 | | | | 40,901,181 | |
(3 mo. LIBOR US + 1.07%), 3.97%, 03/05/29(k) | | | | | | | 16,847 | | | | 19,329,695 | |
(3 mo. LIBOR US + 1.31%), 4.27%, 07/23/29(k) | | | | | | | 9,955 | | | | 11,677,834 | |
| | |
| 70 | | 2 0 2 0 B L A C K R O C K A N N U A L R E P O R T T O S H A R E H O L D E R S |
| | |
Schedule of Investments (continued) September 30, 2020 | | Master Total Return Portfolio (Percentages shown are based on Net Assets) |
| | | | | | | | |
| Security | | Par (000) | | | Value | |
|
| Banks (continued) | |
Bank of America Corp. | | | | | | | | |
(3 mo. LIBOR US + 1.18%), 3.19%, 07/23/30(k) | | | USD 2,902 | | | $ | 3,192,681 | |
(3 mo. LIBOR US + 1.19%), 2.88%, 10/22/30(k) | | | 2,515 | | | | 2,716,432 | |
(Secured Overnight Financing Rate + 2.15%), 2.59%, 04/29/31(k) | | | 8,616 | | | | 9,166,743 | |
(Secured Overnight Financing Rate + 1.93%), 2.68%, 06/19/41(k) | | | 20,897 | | | | 21,337,537 | |
Bank of East Asia Ltd., (5 yr. U.S. Treasury Yield Curve Rate T Note Constant Maturity + 3.75%), 4.00%, 05/29/30(k) | | | 2,160 | | | | 2,226,825 | |
Bank Tabungan Negara Persero Tbk PT, 4.20%, 01/23/25 | | | 200 | | | | 198,812 | |
Barclays PLC | | | | | | | | |
4.38%, 01/12/26 | | | 4,159 | | | | 4,659,396 | |
(3 mo. LIBOR US + 1.90%), 4.97%, 05/16/29(k) | | | 9,427 | | | | 11,031,161 | |
(1 yr. U.S. Treasury Yield Curve Rate T Note Constant Maturity + 1.90%), 2.65%, 06/24/31(k) | | | 4,288 | | | | 4,277,983 | |
BBVA Bancomer SA, 6.75%, 09/30/22(b) | | | 2,888 | | | | 3,113,625 | |
BNP Paribas SA | | | | | | | | |
3.50%, 03/01/23(b) | | | 8,616 | | | | 9,132,735 | |
3.38%, 01/09/25(b) | | | 2,338 | | | | 2,535,964 | |
4.38%, 09/28/25(b) | | | 2,732 | | | | 3,046,265 | |
(3 mo. LIBOR US + 1.11%), 2.82%, 11/19/25(b)(k) | | | 15,073 | | | | 15,884,219 | |
4.40%, 08/14/28(b) | | | 1,756 | | | | 2,059,428 | |
(Secured Overnight Financing Rate + 1.51%), 3.05%, 01/13/31(b)(k) | | | 10,668 | | | | 11,441,040 | |
BPCE SA | | | | | | | | |
3.00%, 05/22/22(b) | | | 2,017 | | | | 2,086,650 | |
2.70%, 10/01/29(b) | | | 9,456 | | | | 10,166,540 | |
Citigroup, Inc. | | | | | | | | |
(3 mo. LIBOR US + 0.95%), 2.88%, 07/24/23(k) | | | 4,900 | | | | 5,084,601 | |
4.40%, 06/10/25 | | | 7,783 | | | | 8,781,620 | |
(3 mo. LIBOR US + 1.56%), 3.89%, 01/10/28(k) | | | 4,408 | | | | 4,989,384 | |
(3 mo. LIBOR US + 1.39%), 3.67%, 07/24/28(k) | | | 34,845 | | | | 39,169,695 | |
(3 mo. LIBOR US + 1.15%), 3.52%, 10/27/28(k) | | | 2,309 | | | | 2,573,328 | |
(3 mo. LIBOR US + 1.19%), 4.08%, 04/23/29(k) | | | 5,249 | | | | 6,071,113 | |
(Secured Overnight Financing Rate + 1.42%), 2.98%, 11/05/30(k) | | | 40,007 | | | | 43,252,838 | |
(Secured Overnight Financing Rate + 3.91%), 4.41%, 03/31/31(k) | | | 1,814 | | | | 2,174,489 | |
Citizens Financial Group, Inc., 3.25%, 04/30/30 | | | 2,910 | | | | 3,212,196 | |
Credicorp Ltd., 2.75%, 06/17/25(b) | | | 590 | | | | 597,522 | |
Danske Bank A/S | | | | | | | | |
5.00%, 01/12/22(b) | | | 13,526 | | | | 14,209,720 | |
(3 mo. LIBOR US + 1.25%), 3.00%, 09/20/22(b)(k) | | | 927 | | | | 944,594 | |
(1 yr. U.S. Treasury Yield Curve Rate T Note Constant Maturity + 1.03%), 1.17%, 12/08/23(b)(k) | | | 3,435 | | | | 3,438,332 | |
5.38%, 01/12/24(b) | | | 14,017 | | | | 15,766,377 | |
| | | | | | | | | | | | |
| Security | | | | | Par (000) | | | Value | |
| | | |
| Banks (continued) | | | | | | | | | |
Danske Bank A/S | | | | | | | | | | | | |
(1 yr. US Treasury Yield Curve Rate T Note Constant Maturity + 1.35%), 1.62%, 09/11/26(b)(k) | | | USD | | | | 3,505 | | | $ | 3,479,841 | |
Fifth Third Bancorp, 3.65%, 01/25/24 | | | | | | | 2,460 | | | | 2,683,607 | |
Grupo Aval Ltd., 4.75%, 09/26/22 | | | | | | | 1,073 | | | | 1,099,825 | |
HSBC Holdings PLC | | | | | | | | | | | | |
(3 mo. LIBOR US + 1.35%), 4.29%, 09/12/26(k) | | | | | | | 4,934 | | | | 5,508,762 | |
(3 mo. LIBOR US + 1.55%), 4.04%, 03/13/28(k) | | | | | | | 2,280 | | | | 2,519,817 | |
(Secured Overnight Financing Rate + 1.73%), 2.01%, 09/22/28(k) | | | | | | | 2,881 | | | | 2,855,809 | |
(3 mo. LIBOR US + 1.53%), 4.58%, 06/19/29(k) | | | | | | | 3,175 | | | | 3,663,097 | |
(3 mo. LIBOR US + 1.61%), 3.97%, 05/22/30(k) | | | | | | | 12,500 | | | | 13,955,857 | |
Huntington National Bank, 3.25%, 05/14/21 | | | | | | | 3,780 | | | | 3,839,629 | |
ING Groep NV | | | | | | | | | | | | |
4.10%, 10/02/23 | | | | | | | 23,473 | | | | 25,719,722 | |
4.63%, 01/06/26(b) | | | | | | | 5,226 | | | | 6,129,421 | |
Intesa Sanpaolo SpA, 6.50%, 02/24/21(b) | | | | | | | 1,790 | | | | 1,827,100 | |
Itau Unibanco Holding SA | | | | | | | | | | | | |
2.90%, 01/24/23(b) | | | | | | | 4,491 | | | | 4,538,739 | |
3.25%, 01/24/25(b) | | | | | | | 2,456 | | | | 2,502,050 | |
JPMorgan Chase & Co. | | | | | | | | | | | | |
2.97%, 01/15/23 | | | | | | | 1,360 | | | | 1,404,362 | |
(3 mo. LIBOR US + 0.70%), 3.21%, 04/01/23(k) | | | | | | | 23,172 | | | | 24,077,792 | |
(3 mo. LIBOR US + 0.73%), 3.56%, 04/23/24(k) | | | | | | | 2,451 | | | | 2,628,207 | |
(3 mo. LIBOR US + 0.89%), 3.80%, 07/23/24(k) | | | | | | | 13,298 | | | | 14,405,473 | |
3.88%, 09/10/24 | | | | | | | 7,758 | | | | 8,605,067 | |
(3 mo. LIBOR US + 1.00%), 4.02%, 12/05/24(k) | | | | | | | 39,194 | | | | 43,008,669 | |
(3 mo. LIBOR US + 1.16%), 3.22%, 03/01/25(k) | | | | | | | 30,542 | | | | 32,807,009 | |
3.90%, 07/15/25 | | | | | | | 8,990 | | | | 10,168,812 | |
(Secured Overnight Financing Rate + 1.16%), 2.30%, 10/15/25(k) | | | | | | | 8,819 | | | | 9,278,699 | |
(Secured Overnight Financing Rate + 1.59%), 2.01%, 03/13/26(k) | | | | | | | 4,655 | | | | 4,819,571 | |
(Secured Overnight Financing Rate + 1.85%), 2.08%, 04/22/26(k) | | | | | | | 5,000 | | | | 5,228,899 | |
3.20%, 06/15/26 | | | | | | | 200 | | | | 221,999 | |
(3 mo. LIBOR US + 1.25%), 3.96%, 01/29/27(k) | | | | | | | 3,380 | | | | 3,849,443 | |
(3 mo. LIBOR US + 1.34%), 3.78%, 02/01/28(k) | | | | | | | 27,927 | | | | 31,586,510 | |
(3 mo. LIBOR US + 1.38%), 3.54%, 05/01/28(k) | | | | | | | 28,330 | | | | 31,910,860 | |
(Secured Overnight Financing Rate + 1.89%), 2.18%, 06/01/28(k) | | | | | | | 5,825 | | | | 6,077,610 | |
(3 mo. LIBOR US + 0.95%), 3.51%, 01/23/29(k) | | | | | | | 32 | | | | 35,994 | |
(3 mo. LIBOR US + 1.12%), 4.01%, 04/23/29(k) | | | | | | | 6,576 | | | | 7,629,403 | |
(3 mo. LIBOR US + 1.33%), 4.45%, 12/05/29(k) | | | | | | | 14,177 | | | | 17,044,929 | |
(Secured Overnight Financing Rate + 1.51%), 2.74%, 10/15/30(k) | | | | | | | 1,799 | | | | 1,927,326 | |
| | |
S C H E D U L E O F I N V E S T M E N T S | | 71 |
| | |
Schedule of Investments (continued) September 30, 2020 | | Master Total Return Portfolio (Percentages shown are based on Net Assets) |
| | | | | | | | |
| Security | | Par (000) | | | Value | |
| | |
| Banks (continued) | | | | | | |
JPMorgan Chase & Co. | | | | | | | | |
(Secured Overnight Financing Rate + 3.79%), 4.49%, 03/24/31(k) | | | USD 1,831 | | | $ | 2,234,447 | |
(Secured Overnight Financing Rate + 2.44%), 3.11%, 04/22/51(k) | | | 15,738 | | | | 16,888,792 | |
Kasikornbank PCL, (5 yr. U.S. Treasury Yield Curve Rate T Note Constant Maturity + 1.70%), 3.34%, 10/02/31(k) | | | 1,940 | | | | 1,905,080 | |
KeyCorp | | | | | | | | |
4.10%, 04/30/28 | | | 718 | | | | 842,262 | |
2.55%, 10/01/29 | | | 3,481 | | | | 3,703,548 | |
Lloyds Banking Group PLC | | | | | | | | |
4.05%, 08/16/23 | | | 201 | | | | 217,518 | |
3.75%, 01/11/27 | | | 6,060 | | | | 6,707,662 | |
Mitsubishi UFJ Financial Group, Inc. | | | | | | | | |
3.00%, 02/22/22 | | | 3,776 | | | | 3,902,198 | |
2.62%, 07/18/22 | | | 6,043 | | | | 6,262,291 | |
2.67%, 07/25/22 | | | 540 | | | | 559,818 | |
3.46%, 03/02/23 | | | 19,706 | | | | 20,995,486 | |
2.19%, 02/25/25 | | | 14,000 | | | | 14,663,021 | |
1.41%, 07/17/25 | | | 2,959 | | | | 3,000,403 | |
3.20%, 07/18/29 | | | 1,119 | | | | 1,236,237 | |
Mizuho Financial Group, Inc. | | | | | | | | |
2.63%, 04/12/21(b) | | | 7,490 | | | | 7,581,755 | |
2.27%, 09/13/21 | | | 5,639 | | | | 5,740,641 | |
(3 mo. LIBOR US + 0.98%), 2.84%, 07/16/25(k) | | | 797 | | | | 845,864 | |
(3 mo. LIBOR US + 1.10%), 2.56%, 09/13/25(k) | | | 18,319 | | | | 19,253,469 | |
3.66%, 02/28/27 | | | 352 | | | | 392,943 | |
(3 mo. LIBOR US + 1.51%), 2.20%, 07/10/31(k) | | | 3,166 | | | | 3,207,606 | |
(3 mo. LIBOR US + 1.27%), 1.98%, 09/08/31(k) | | | 5,413 | | | | 5,376,559 | |
Royal Bank of Scotland Group PLC, (3 mo. LIBOR US + 1.48%), 3.50%, 05/15/23(k) | | | 696 | | | | 720,849 | |
Santander UK Group Holdings PLC, 2.88%, 08/05/21 | | | 12,877 | | | | 13,135,981 | |
Shinhan Financial Group Co. Ltd., (5 yr. U.S. Treasury Yield Curve Rate T Note Constant Maturity + 1.50%), 3.34%, 02/05/30(k) | | | 1,025 | | | | 1,074,969 | |
Shizuoka Bank Ltd., (3 mo. LIBOR US - 0.50%), 0.00%, 01/25/23(a)(j) | | | 200 | | | | 189,790 | |
Standard Chartered PLC, (3 mo. LIBOR US + 1.08%), 3.89%, 03/15/24(b)(k) | | | 2,885 | | | | 3,040,788 | |
Sumitomo Mitsui Financial Group, Inc. | | | | | | | | |
2.70%, 07/16/24 | | | 16,297 | | | | 17,339,751 | |
2.35%, 01/15/25 | | | 11,070 | | | | 11,660,545 | |
1.47%, 07/08/25 | | | 2,094 | | | | 2,132,509 | |
U.S. Bancorp, 3.00%, 07/30/29 | | | 3,250 | | | | 3,614,467 | |
Washington Mutual Escrow Bonds | | | | | | | | |
0.00%, (c)(f)(i)(l) | | | 13,308 | | | | 1 | |
0.00%, (c)(f)(i)(l) | | | 11,911 | | | | 1 | |
0.00%, (c)(f)(i)(l) | | | 2,570 | | | | — | |
0.00%, (c)(f)(i)(l) | | | 3,115 | | | | — | |
Wells Fargo & Co. | | | | | | | | |
3.75%, 01/24/24 | | | 6,345 | | | | 6,893,976 | |
3.55%, 09/29/25 | | | 7,860 | | | | 8,750,452 | |
(3 mo. LIBOR US + 0.83%), 2.41%, 10/30/25(k) | | | 4,567 | | | | 4,782,223 | |
3.00%, 04/22/26 | | | 7,336 | | | | 7,986,177 | |
| | | | | | | | |
| Security | | Par (000) | | | Value | |
| | |
| Banks (continued) | | | | | | |
Wells Fargo & Co. | | | | | | | | |
3.00%, 10/23/26 | | | USD 4,873 | | | $ | 5,326,635 | |
(3 mo. LIBOR US + 1.31%), 3.58%, 05/22/28(k) | | | 6,434 | | | | 7,202,483 | |
(Secured Overnight Financing Rate + 2.10%), 2.39%, 06/02/28(k) | | | 2,099 | | | | 2,189,843 | |
(3 mo. LIBOR US + 1.17%), 2.88%, 10/30/30(k) | | | 14,317 | | | | 15,374,993 | |
(Secured Overnight Financing Rate + 2.53%), 3.07%, 04/30/41(k) | | | 18,795 | | | | 19,661,461 | |
| | | | | | | | |
| | | | | | | 1,132,409,866 | |
|
| Beverages — 0.8% | |
Anheuser-Busch Cos. LLC/Anheuser-Busch InBev Worldwide, Inc., 4.70%, 02/01/36 | | | 28,831 | | | | 34,828,425 | |
Anheuser-Busch InBev Worldwide, Inc. | | | | | | | | |
4.75%, 01/23/29 | | | 38,680 | | | | 47,205,802 | |
3.50%, 06/01/30 | | | 21,681 | | | | 24,667,150 | |
4.90%, 01/23/31 | | | 4,325 | | | | 5,441,043 | |
5.45%, 01/23/39 | | | 1,023 | | | | 1,324,416 | |
8.00%, 11/15/39 | | | 3,000 | | | | 4,837,508 | |
4.95%, 01/15/42 | | | 500 | | | | 613,482 | |
Central American Bottling Corp., 5.75%, 01/31/27(b) | | | 1,707 | | | | 1,768,968 | |
Coca-Cola Co. | | | | | | | | |
2.50%, 06/01/40 | | | 4,340 | | | | 4,550,641 | |
2.75%, 06/01/60 | | | 6,450 | | | | 6,550,767 | |
Coca-Cola Femsa SAB de CV, 1.85%, 09/01/32 | | | 2,555 | | | | 2,576,207 | |
Embotelladora Andina SA,
3.95%, 01/21/50(b) | | | 2,139 | | | | 2,262,661 | |
Fomento Economico Mexicano SAB de CV, 3.50%, 01/16/50 | | | 2,880 | | | | 3,040,920 | |
Keurig Dr Pepper, Inc., 3.20%, 05/01/30 | | | 6,658 | | | | 7,469,881 | |
Molson Coors Brewing Co. | | | | | | | | |
5.00%, 05/01/42 | | | 1,379 | | | | 1,561,793 | |
4.20%, 07/15/46 | | | 1,500 | | | | 1,582,261 | |
PepsiCo, Inc. | | | | | | | | |
4.60%, 07/17/45 | | | 1,586 | | | | 2,172,939 | |
3.45%, 10/06/46 | | | 1,562 | | | | 1,810,648 | |
4.00%, 05/02/47 | | | 181 | | | | 228,546 | |
| | | | | | | | |
| | | | | | | 154,494,058 | |
|
| Biotechnology — 0.7% | |
AbbVie, Inc. | | | | | | | | |
2.30%, 11/21/22(b) | | | 6,787 | | | | 7,022,693 | |
3.85%, 06/15/24(b) | | | 167 | | | | 183,018 | |
2.60%, 11/21/24(b) | | | 30,942 | | | | 32,783,169 | |
3.80%, 03/15/25(b) | | | 13,744 | | | | 15,239,932 | |
3.20%, 05/14/26 | | | 1,986 | | | | 2,186,436 | |
2.95%, 11/21/26(b) | | | 2,317 | | | | 2,523,739 | |
4.55%, 03/15/35(b) | | | 5,398 | | | | 6,636,483 | |
4.50%, 05/14/35 | | | 9,666 | | | | 11,764,633 | |
4.70%, 05/14/45 | | | 1,604 | | | | 1,975,007 | |
4.88%, 11/14/48 | | | 7,823 | | | | 9,934,093 | |
Amgen, Inc. | | | | | | | | |
2.45%, 02/21/30 | | | 4,757 | | | | 5,042,114 | |
4.40%, 05/01/45 | | | 12,437 | | | | 15,408,114 | |
Biogen, Inc., 2.25%, 05/01/30 | | | 9,862 | | | | 10,099,457 | |
Elanco Animal Health, Inc. | | | | | | | | |
4.91%, 08/27/21 | | | 212 | | | | 217,565 | |
5.27%, 08/28/23 | | | 3,230 | | | | 3,464,175 | |
5.90%, 08/28/28 | | | 437 | | | | 504,735 | |
Gilead Sciences, Inc. | | | | | | | | |
1.20%, 10/01/27 | | | 1,882 | | | | 1,887,669 | |
4.60%, 09/01/35 | | | 1,584 | | | | 2,037,808 | |
| | |
| 72 | | 2 0 2 0 B L A C K R O C K A N N U A L R E P O R T T O S H A R E H O L D E R S |
| | |
Schedule of Investments (continued) September 30, 2020 | | Master Total Return Portfolio (Percentages shown are based on Net Assets) |
| | | | | | | | |
| Security | | Par (000) | | | Value | |
|
| Biotechnology (continued) | |
Gilead Sciences, Inc. | | | | | | | | |
4.80%, 04/01/44 | | | USD 5,022 | | | $ | 6,473,013 | |
4.50%, 02/01/45 | | | 2,386 | | | | 2,985,600 | |
| | | | | | | | |
| | | | | | | 138,369,453 | |
| | |
| Building Products — 0.0% | | | | | | |
Johnson Controls International plc | | | | | | | | |
4.63%, 07/02/44 | | | 1,483 | | | | 1,854,035 | |
5.13%, 09/14/45 | | | 7 | | | | 9,241 | |
Masonite International Corp. | | | | | | | | |
5.75%, 09/15/26(b) | | | 120 | | | | 125,100 | |
5.38%, 02/01/28(b) | | | 1,697 | | | | 1,809,740 | |
Owens Corning | | | | | | | | |
3.95%, 08/15/29 | | | 1,900 | | | | 2,152,300 | |
4.30%, 07/15/47 | | | 1,312 | | | | 1,442,181 | |
Standard Industries, Inc. | | | | | | | | |
5.00%, 02/15/27(b) | | | 1,674 | | | | 1,740,960 | |
4.75%, 01/15/28(b) | | | 597 | | | | 619,388 | |
| | | | | | | | |
| | | | | | | 9,752,945 | |
| | |
| Capital Markets — 2.0% | | | | | | |
Bank of New York Mellon Corp., (3 mo. LIBOR US + 1.07%), 3.44%, 02/07/28(k) | | | 6,475 | | | | 7,428,328 | |
CCTI 2017 Ltd., 3.63%, 08/08/22 | | | 1,675 | | | | 1,698,031 | |
Charles Schwab Corp., 3.20%, 03/02/27 | | | 3,391 | | | | 3,801,590 | |
Cindai Capital Ltd., 0.00%, 02/08/23(j)(m) | | | 2,461 | | | | 2,488,533 | |
Credit Suisse AG, 3.63%, 09/09/24 | | | 4,401 | | | | 4,868,970 | |
Credit Suisse Group AG | | | | | | | | |
(3 mo. LIBOR US + 1.20%), 3.00%, 12/14/23(b)(k) | | | 8,280 | | | | 8,618,930 | |
(Secured Overnight Financing Rate + 3.73%), 4.19%, 04/01/31(b)(k) | | | 5,454 | | | | 6,296,588 | |
Credit Suisse Group Funding Guernsey Ltd. | | | | | | | | |
3.80%, 09/15/22 | | | 9,654 | | | | 10,215,343 | |
3.80%, 06/09/23 | | | 3,341 | | | | 3,594,328 | |
Deutsche Bank AG | | | | | | | | |
4.25%, 02/04/21 | | | 2,930 | | | | 2,961,121 | |
(Secured Overnight Financing Rate + 3.04%), 3.55%, 09/18/31(k) | | | 1,573 | | | | 1,589,420 | |
E*TRADE Financial Corp., 3.80%, 08/24/27 | | | 785 | | | | 882,537 | |
Goldman Sachs Group, Inc. | | | | | | | | |
2.35%, 11/15/21 | | | 4,591 | | | | 4,601,523 | |
5.75%, 01/24/22 | | | 432 | | | | 461,510 | |
3.50%, 01/23/25 | | | 8,671 | | | | 9,513,843 | |
3.50%, 04/01/25 | | | 34,054 | | | | 37,584,373 | |
(3 mo. LIBOR US + 1.20%), 3.27%, 09/29/25(k) | | | 3,652 | | | | 3,952,881 | |
3.75%, 02/25/26 | | | 3,474 | | | | 3,910,024 | |
(3 mo. LIBOR US + 1.17%), 1.45%, 05/15/26(a) | | | 10,315 | | | | 10,415,264 | |
3.85%, 01/26/27 | | | 3,159 | | | | 3,556,430 | |
(3 mo. LIBOR US + 1.51%), 3.69%, 06/05/28(k) | | | 22,323 | | | | 25,022,492 | |
Intercontinental Exchange, Inc. | | | | | | | | |
3.75%, 09/21/28 | | | 5,126 | | | | 5,931,971 | |
1.85%, 09/15/32 | | | 8,838 | | | | 8,781,154 | |
Lehman Brothers Holdings, Inc., 6.75%, 12/28/17(c)(f)(i) | | | 7,360 | | | | 1 | |
Moody’s Corp. | | | | | | | | |
4.88%, 02/15/24 | | | 1,978 | | | | 2,235,547 | |
3.25%, 01/15/28 | | | 4,450 | | | | 5,006,968 | |
Morgan Stanley | | | | | | | | |
3.70%, 10/23/24 | | | 9,381 | | | | 10,407,811 | |
| | | | | | | | |
| Security | | Par (000) | | | Value | |
| | |
| Capital Markets (continued) | | | | | | |
Morgan Stanley | | | | | | | | |
(Secured Overnight Financing Rate + 1.15%), 2.72%, 07/22/25(k) | | | USD 6,457 | | | $ | 6,859,092 | |
4.00%, 07/23/25 | | | 18,642 | | | | 21,070,125 | |
(Secured Overnight Financing Rate + 1.99%), 2.19%, 04/28/26(k) | | | 31,086 | | | | 32,555,893 | |
3.13%, 07/27/26 | | | 2,858 | | | | 3,163,980 | |
3.63%, 01/20/27 | | | 30,604 | | | | 34,682,289 | |
(3 mo. LIBOR US + 1.34%), 3.59%, 07/22/28(k) | | | 1,846 | | | | 2,076,179 | |
(3 mo. LIBOR US + 1.14%), 3.77%, 01/24/29(k) | | | 5,943 | | | | 6,783,408 | |
(3 mo. LIBOR US + 1.63%), 4.43%, 01/23/30(k) | | | 11,021 | | | | 13,168,133 | |
(Secured Overnight Financing Rate + 1.14%), 2.70%, 01/22/31(k) | | | 5,366 | | | | 5,715,838 | |
(Secured Overnight Financing Rate + 3.12%), 3.62%, 04/01/31(k) | | | 13,253 | | | | 15,227,430 | |
Series F, 3.88%, 04/29/24 | | | 70 | | | | 77,248 | |
Nomura Holdings, Inc. | | | | | | | | |
3.10%, 01/16/30 | | | 3,704 | | | | 3,929,414 | |
2.68%, 07/16/30 | | | 1,707 | | | | 1,762,112 | |
Northern Trust Corp., 3.15%, 05/03/29 | | | 3,064 | | | | 3,494,278 | |
Poseidon Finance 1 Ltd., 0.00%, 02/01/25(j)(m) | | | 2,640 | | | | 2,516,970 | |
State Street Corp. | | | | | | | | |
2.65%, 05/19/26 | | | 2,996 | | | | 3,280,716 | |
2.40%, 01/24/30 | | | 3,934 | | | | 4,308,568 | |
(Secured Overnight Financing Rate + 2.65%), 3.15%, 03/30/31(b)(k) | | | 224 | | | | 255,529 | |
UBS Group AG | | | | | | | | |
(3 mo. LIBOR US + 0.95%), 2.86%, 08/15/23(b)(k) | | | 18,674 | | | | 19,366,769 | |
4.13%, 09/24/25(b) | | | 11,625 | | | | 13,241,834 | |
4.13%, 04/15/26(b) | | | 4,551 | | | | 5,254,312 | |
(1 yr. U.S. Treasury Yield Curve Rate T Note Constant Maturity + 1.08%), 1.36%, 01/30/27(b)(k) | | | 13,635 | | | | 13,627,820 | |
| | | | | | | | |
| | | | | | | 398,243,448 | |
| | |
| Chemicals — 0.3% | | | | | | |
Braskem Netherlands Finance BV | | | | | | | | |
4.50%, 01/10/28 | | | 877 | | | | 844,112 | |
(5 yr. U.S. Treasury Yield Curve Rate T Note Constant Maturity + 8.22%), 8.50%, 01/23/81(b)(k) | | | 6,046 | | | | 6,085,677 | |
(5 yr. U.S. Treasury Yield Curve Rate T Note Constant Maturity + 8.22%), 8.50%, 01/23/81(k) | | | 993 | | | | 999,517 | |
Cydsa SAB de CV, 6.25%, 10/04/27(b) | | | 2,170 | | | | 2,186,953 | |
Dow Chemical Co. | | | | | | | | |
9.00%, 04/01/21 | | | 3,960 | | | | 4,119,453 | |
4.55%, 11/30/25 | | | 1,962 | | | | 2,282,328 | |
DuPont de Nemours, Inc., 4.49%, 11/15/25 | | | 17,273 | | | | 19,909,896 | |
Eastman Chemical Co., 4.50%, 12/01/28 | | | 1,368 | | | | 1,608,697 | |
Ecolab, Inc., 1.30%, 01/30/31 | | | 2,087 | | | | 2,043,472 | |
LYB International Finance BV, 4.88%, 03/15/44 | | | 3,606 | | | | 4,310,248 | |
Mitsubishi Chemical Holdings Corp. | | | | | | | | |
0.00%, 03/30/22(j)(m) | | | JPY 150,000 | | | | 1,401,787 | |
0.00%, 03/29/24(j)(m) | | | 40,000 | | | | 370,855 | |
Rock International Investment, Inc., 6.63%, 03/27/20(f)(i) | | | USD 500 | | | | 150,000 | |
RPM International, Inc., 4.25%, 01/15/48 | | | 155 | | | | 163,805 | |
Sasol Financing USA LLC, 5.88%, 03/27/24 | | | 1,461 | | | | 1,400,734 | |
| | |
S C H E D U L E O F I N V E S T M E N T S | | 73 |
| | |
Schedule of Investments (continued) September 30, 2020 | | Master Total Return Portfolio (Percentages shown are based on Net Assets) |
| | | | | | | | |
| Security | | Par (000) | | | Value | |
|
| Chemicals (continued) | |
Sherwin-Williams Co. | | | | | | | | |
4.20%, 01/15/22 | | | USD 2,800 | | | $ | 2,905,233 | |
2.95%, 08/15/29 | | | 5,806 | | | | 6,390,075 | |
2.30%, 05/15/30 | | | 1,729 | | | | 1,805,572 | |
4.00%, 12/15/42 | | | 971 | | | | 1,075,130 | |
| | | | | | | | |
| | | | | | | 60,053,544 | |
|
| Commercial Services & Supplies — 0.2% | |
Beijing Environment Bvi Co. Ltd., 5.30%, 10/18/21 | | | 680 | | | | 697,000 | |
Clean Harbors, Inc., 4.88%, 07/15/27(b) | | | 2,288 | | | | 2,373,800 | |
Conservation Fund, 3.47%, 12/15/29 | | | 1,008 | | | | 1,089,770 | |
KAR Auction Services, Inc., 5.13%, 06/01/25(b) | | | 2,696 | | | | 2,695,946 | |
Republic Services, Inc. | | | | | | | | |
2.90%, 07/01/26 | | | 2,994 | | | | 3,310,725 | |
3.38%, 11/15/27 | | | 410 | | | | 466,099 | |
3.95%, 05/15/28 | | | 11,362 | | | | 13,385,484 | |
2.30%, 03/01/30 | | | 5,451 | | | | 5,795,341 | |
Waste Management, Inc., 3.90%, 03/01/35 | | | 492 | | | | 595,888 | |
Waste Pro USA, Inc., 5.50%, 02/15/26(b) | | | 1,398 | | | | 1,414,762 | |
| | | | | | | | |
| | | | | | | 31,824,815 | |
| | |
| Communications Equipment — 0.1% | | | | | | |
Motorola Solutions, Inc. | | | | | | | | |
4.60%, 02/23/28 | | | 237 | | | | 276,715 | |
4.60%, 05/23/29 | | | 10,242 | | | | 12,095,532 | |
2.30%, 11/15/30 | | | 3,669 | | | | 3,642,288 | |
5.50%, 09/01/44 | | | 6,050 | | | | 7,031,934 | |
| | | | | | | | |
| | | | | | | 23,046,469 | |
|
| Construction & Engineering — 0.0% | |
China City Construction International Co. Ltd., 5.35%, 07/03/17(f)(i) | | | CNH 340 | | | | 2,754 | |
GMR Hyderabad International Airport Ltd., 5.38%, 04/10/24 | | | USD 400 | | | | 394,933 | |
Zhengzhou Real Estate Group Co. Ltd., 3.95%, 10/09/22 | | | 965 | | | | 977,062 | |
| | | | | | | | |
| | | | | | | 1,374,749 | |
|
| Construction Materials — 0.0% | |
Cemex SAB de CV, 5.20%, 09/17/30(b) | | | 3,426 | | | | 3,438,505 | |
U.S. Concrete, Inc., 6.38%, 06/01/24 | | | 1,627 | | | | 1,677,844 | |
| | | | | | | | |
| | | | | | | 5,116,349 | |
|
| Consumer Finance — 0.9% | |
Alpha Holding SA de CV,
9.00%, 02/10/25(b) | | | 3,084 | | | | 2,322,638 | |
American Express Co., 3.70%, 08/03/23 | | | 6,764 | | | | 7,342,774 | |
Capital One Financial Corp. | | | | | | | | |
4.75%, 07/15/21 | | | 546 | | | | 564,933 | |
3.90%, 01/29/24 | | | 8,058 | | | | 8,770,978 | |
3.20%, 02/05/25 | | | 1,160 | | | | 1,253,185 | |
Discover Bank, 4.65%, 09/13/28 | | | 14,850 | | | | 17,477,453 | |
Discover Financial Services | | | | | | | | |
4.50%, 01/30/26 | | | 4,031 | | | | 4,599,097 | |
4.10%, 02/09/27 | | | 952 | | | | 1,055,738 | |
Ford Motor Credit Co. LLC | | | | | | | | |
3.20%, 01/15/21 | | | 2,007 | | | | 2,002,760 | |
5.75%, 02/01/21 | | | 7,810 | | | | 7,858,812 | |
3.34%, 03/18/21 | | | 1,500 | | | | 1,500,375 | |
General Motors Financial Co., Inc. | | | | | | | | |
5.20%, 03/20/23 | | | 23,557 | | | | 25,555,644 | |
3.70%, 05/09/23 | | | 8,790 | | | | 9,185,500 | |
5.10%, 01/17/24 | | | 2,093 | | | | 2,285,561 | |
4.00%, 01/15/25 | | | 20,533 | | | | 21,939,305 | |
4.35%, 04/09/25 | | | 3,899 | | | | 4,229,728 | |
| | | | | | | | |
| Security | | Par (000) | | | Value | |
|
| Consumer Finance (continued) | |
General Motors Financial Co., Inc. | | | | | | | | |
2.75%, 06/20/25 | | | USD 15,914 | | | $ | 16,281,901 | |
0.85%, 02/26/26 | | | EUR 17,000 | | | | 18,851,302 | |
Hyundai Capital Services, Inc.,
3.00%, 08/29/22(b) | | | USD 7,790 | | | | 8,055,347 | |
Navient Corp. | | | | | | | | |
5.88%, 03/25/21 | | | 1,549 | | | | 1,558,681 | |
6.63%, 07/26/21 | | | 1,857 | | | | 1,884,855 | |
6.50%, 06/15/22 | | | 2,529 | | | | 2,579,580 | |
7.25%, 09/25/23 | | | 1,473 | | | | 1,520,873 | |
5.88%, 10/25/24 | | | 1,377 | | | | 1,369,261 | |
6.75%, 06/25/25 | | | 1,446 | | | | 1,464,075 | |
6.75%, 06/15/26 | | | 1,424 | | | | 1,420,440 | |
Synchrony Financial | | | | | | | | |
4.38%, 03/19/24 | | | 1,140 | | | | 1,233,533 | |
4.25%, 08/15/24 | | | 570 | | | | 619,390 | |
Toyota Motor Credit Corp. | | | | | | | | |
2.15%, 02/13/30 | | | 6,889 | | | | 7,260,486 | |
3.38%, 04/01/30 | | | 3,548 | | | | 4,089,867 | |
| | | | | | | | |
| | | | | | | 186,134,072 | |
| | |
| Containers & Packaging — 0.1% | | | | | | |
Ardagh Packaging Finance PLC/Ardagh Holdings USA, Inc. | | | | | | | | |
4.13%, 08/15/26(b) | | | 299 | | | | 303,111 | |
5.25%, 08/15/27(b) | | | 2,217 | | | | 2,259,123 | |
Ball Corp. | | | | | | | | |
5.25%, 07/01/25 | | | 597 | | | | 675,759 | |
4.88%, 03/15/26 | | | 448 | | | | 499,520 | |
International Paper Co. | | | | | | | | |
6.00%, 11/15/41 | | | 2,411 | | | | 3,314,169 | |
4.40%, 08/15/47 | | | 2,477 | | | | 3,025,824 | |
Owens-Brockway Glass Container, Inc., 5.88%, 08/15/23(b) | | | 2,010 | | | | 2,110,500 | |
Reynolds Group Issuer, Inc./Reynolds Group Issuer LLC/Reynolds Group Issuer Luxembourg, 7.00%, 07/15/24(b) | | | 125 | | | | 127,250 | |
| | | | | | | | |
| | | | | | | 12,315,256 | |
|
| Diversified Consumer Services — 0.1% | |
American University, 3.67%, 04/01/49 | | | 4,301 | | | | 4,918,549 | |
Bright Scholar Education Holdings Ltd., 7.45%, 07/31/22 | | | 200 | | | | 204,500 | |
China Education Group Holdings Ltd., 2.00%, 03/28/24(j) | | | HKD 8,000 | | | | 1,197,576 | |
Claremont Mckenna College, 3.38%, 01/01/50 | | | USD 996 | | | | 1,126,945 | |
Ford Foundation, 2.42%, 06/01/50 | | | 265 | | | | 272,240 | |
George Washington University, 4.13%, 09/15/48 | | | 1,968 | | | | 2,418,392 | |
Massachusetts Institute of Technology, 3.96%, 07/01/38 | | | 1,385 | | | | 1,721,260 | |
University of Southern California, 3.03%, 10/01/39 | | | 246 | | | | 266,204 | |
Wesleyan University, 4.78%, 07/01/2116 | | | 1,285 | | | | 1,645,230 | |
| | | | | | | | |
| | | | | | | 13,770,896 | |
|
| Diversified Financial Services — 0.9% | |
ANLLIAN Capital Ltd.,
0.00%, 02/05/25(j)(m) | | | EUR 800 | | | | 900,664 | |
ASG Finance Designated Activity Co., 7.88%, 12/03/24(b) | | | USD 4,445 | | | | 3,178,175 | |
AXA Equitable Holdings, Inc., 3.90%, 04/20/23 | | | 184 | | | | 197,823 | |
Azul Investments LLP, 5.88%, 10/26/24(b) | | | 1,759 | | | | 1,320,899 | |
Baoxin Auto Finance I Ltd., (3 yr. U.S. Treasury Yield Curve Rate T Note Constant Maturity + 8.91%), 5.63%(k)(l) | | | 300 | | | | 217,875 | |
| | |
| 74 | | 2 0 2 0 B L A C K R O C K A N N U A L R E P O R T T O S H A R E H O L D E R S |
| | |
Schedule of Investments (continued) September 30, 2020 | | Master Total Return Portfolio (Percentages shown are based on Net Assets) |
| | | | | | | | |
| Security | | Par (000) | | | Value | |
|
| Diversified Financial Services (continued) | |
Capitol Investment Merger Sub 2 LLC, 10.00%, 08/01/24(b) | | | USD 4,232 | | | $ | 4,433,020 | |
China Huadian Overseas Development 2018 Ltd.,
(5 yr. U.S. Treasury Yield Curve Rate T Note Constant Maturity + 6.07%),
3.38%(k)(l) | | | 2,165 | | | | 2,202,887 | |
CK Hutchison International 17 II Ltd., 3.25%, 09/29/27 | | | 600 | | | | 658,500 | |
CNH Industrial Capital LLC, 4.38%, 11/06/20 | | | 13,090 | | | | 13,131,169 | |
Coastal Emerald Ltd. | | | | | | | | |
(5 yr. U.S. Treasury Yield Curve Rate T Note Constant Maturity + 7.45%), 4.30%, (k)(l) | | | 1,190 | | | | 1,201,156 | |
3.95%, 08/01/22 | | | 695 | | | | 701,908 | |
Deutsche Telekom International Finance BV, 3.60%, 01/19/27(b) | | | 4,339 | | | | 4,861,972 | |
Easy Tactic Ltd. | | | | | | | | |
9.13%, 07/28/22 | | | 200 | | | | 185,750 | |
8.63%, 02/27/24 | | | 830 | | | | 712,503 | |
Fortune Star BVI Ltd. | | | | | | | | |
5.95%, 01/29/23 | | | 200 | | | | 202,687 | |
6.85%, 07/02/24 | | | 540 | | | | 556,200 | |
GE Capital International Funding Co., 4.42%, 11/15/35 | | | 12,123 | | | | 12,796,538 | |
GlaxoSmithKline Capital, Inc., 3.88%, 05/15/28 | | | 8,087 | | | | 9,611,923 | |
Grupo Aval Ltd., 4.38%, 02/04/30(b) | | | 5,009 | | | | 4,828,175 | |
Guojing Capital BVI Ltd., 3.95%, 12/11/22 | | | 498 | | | | 511,384 | |
Holcim U.S. Finance S.a.r.l & Cie SCS, 5.15%, 09/12/23(b) | | | 2,325 | | | | 2,577,510 | |
Hyundai Capital America | | | | | | | | |
3.95%, 02/01/22(b) | | | 3,655 | | | | 3,785,209 | |
2.38%, 02/10/23(b) | | | 15,891 | | | | 16,293,201 | |
Intercorp Peru Ltd., 3.88%, 08/15/29(b) | | | 789 | | | | 780,124 | |
Latam Finance Ltd., 6.88%, 04/11/24(f)(i) | | | 873 | | | | 323,283 | |
Manappuram Finance Ltd., 5.90%, 01/13/23 | | | 400 | | | | 391,250 | |
Mirae Asset Daewoo Co. Ltd., 2.63%, 07/30/25 | | | 1,175 | | | | 1,191,744 | |
Muthoot Finance Ltd., 4.40%, 09/02/23 | | | 200 | | | | 195,062 | |
New Lion Bridge Co. Ltd., 9.75%, 10/10/20 | | | 430 | | | | 426,775 | |
ORIX Corp., 2.90%, 07/18/22 | | | 4,137 | | | | 4,282,374 | |
Pacific National Finance Pty Ltd., 4.75%, 03/22/28 | | | 1,100 | | | | 1,155,199 | |
Pearl Holding III Ltd., 9.50%, 12/11/22 | | | 600 | | | | 145,125 | |
Prime Bloom Holdings Ltd., 6.95%, 07/05/22 | | | 890 | | | | 167,431 | |
Quicken Loans LLC/Quicken Loans Co-Issuer, Inc., 3.63%, 03/01/29(b) | | | 3,343 | | | | 3,313,749 | |
Quicken Loans, Inc. | | | | | | | | |
5.75%, 05/01/25(b) | | | 3,385 | | | | 3,484,857 | |
5.25%, 01/15/28(b) | | | 3,322 | | | | 3,500,259 | |
RELX Capital, Inc. | | | | | | | | |
3.50%, 03/16/23 | | | 6,730 | | | | 7,157,624 | |
4.00%, 03/18/29 | | | 8,959 | | | | 10,514,032 | |
3.00%, 05/22/30 | | | 11,344 | | | | 12,403,910 | |
Santos Finance Ltd., 5.25%, 03/13/29 | | | 1,500 | | | | 1,651,585 | |
Shell International Finance BV | | | | | | | | |
3.88%, 11/13/28 | | | 10,509 | | | | 12,271,723 | |
2.38%, 11/07/29 | | | 10,494 | | | | 11,076,211 | |
3.63%, 08/21/42 | | | 1,539 | | | | 1,682,158 | |
4.38%, 05/11/45 | | | 6,362 | | | | 7,802,240 | |
Shriram Transport Finance Co. Ltd. | | | | | | | | |
5.95%, 10/24/22 | | | 436 | | | | 409,976 | |
5.10%, 07/16/23 | | | 243 | | | | 222,877 | |
Total Capital International SA | | | | | | | | |
3.70%, 01/15/24 | | | 3,644 | | | | 3,997,857 | |
2.43%, 01/10/25 | | | 4,468 | | | | 4,753,467 | |
| | | | | | | | |
| Security | | Par (000) | | | Value | |
|
| Diversified Financial Services (continued) | |
Trust Fibra Uno, 6.95%, 01/30/44(b) | | | USD 2,194 | | | $ | 2,335,239 | |
USAA Capital Corp., 2.13%, 05/01/30(b) | | | 3,190 | | | | 3,360,980 | |
| | | | | | | | |
| | | | | | | 184,064,239 | |
|
| Diversified Telecommunication Services — 1.5% | |
AT&T Inc. | | | | | | | | |
0.00%, 11/27/22(b)(m) | | | 36,000 | | | | 35,500,851 | |
4.45%, 04/01/24 | | | 2,436 | | | | 2,720,961 | |
3.80%, 02/15/27 | | | 7 | | | | 7,898 | |
4.25%, 03/01/27 | | | 1,170 | | | | 1,358,417 | |
4.30%, 02/15/30 | | | 2,536 | | | | 3,005,997 | |
2.25%, 02/01/32 | | | 4,504 | | | | 4,504,895 | |
4.50%, 05/15/35 | | | 14,502 | | | | 17,121,722 | |
3.15%, 09/04/36 | | | EUR 1,800 | | | | 2,496,260 | |
2.60%, 05/19/38 | | | 11,000 | | | | 14,387,171 | |
4.90%, 06/15/42 | | | USD 2,043 | | | | 2,414,565 | |
4.65%, 06/01/44 | | | 2,343 | | | | 2,663,768 | |
4.80%, 06/15/44 | | | 878 | | | | 1,046,417 | |
4.35%, 06/15/45 | | | 453 | | | | 507,549 | |
4.50%, 03/09/48 | | | 2,656 | | | | 3,048,065 | |
3.30%, 02/01/52 | | | 3,226 | | | | 3,057,661 | |
3.50%, 09/15/53(b) | | | 11,262 | | | | 10,888,373 | |
3.55%, 09/15/55(b) | | | 16,953 | | | | 16,430,385 | |
3.65%, 09/15/59(b) | | | 3,446 | | | | 3,385,176 | |
Axtel SAB de CV, 6.38%, 11/14/24(b) | | | 2,921 | | | | 3,034,189 | |
Bharti Airtel International Netherlands BV | | | | | | | | |
5.13%, 03/11/23 | | | 278 | | | | 294,941 | |
5.35%, 05/20/24 | | | 922 | | | | 994,896 | |
Comunicaciones Celulares SA Via Comcel Trust, 6.88%, 02/06/24 | | | 1,530 | | | | 1,547,243 | |
Connect Finco S.a.r.l/Connect U.S. Finco LLC, 6.75%, 10/01/26(b) | | | 5,764 | | | | 5,782,157 | |
Digicel International Finance Ltd./Digicel Holdings Bermuda Ltd. | | | | | | | | |
8.75%, 05/25/24(b) | | | 1,109 | | | | 1,116,954 | |
(6.00% Cash and 7.00% PIK), 13.00%, 12/31/25(b)(n) | | | 562 | | | | 506,607 | |
8.00%, 12/31/26(b) | | | 443 | | | | 345,209 | |
Empresa Nacional de Telecomunicaciones SA, 4.75%, 08/01/26(b) | | | 6,698 | | | | 7,372,020 | |
Globe Telecom, Inc. | | | | | | | | |
2.50%, 07/23/30 | | | 1,535 | | | | 1,483,194 | |
3.00%, 07/23/35 | | | 910 | | | | 865,637 | |
Level 3 Financing, Inc. | | | | | | | | |
5.38%, 01/15/24 | | | 3,830 | | | | 3,850,127 | |
5.25%, 03/15/26 | | | 2,579 | | | | 2,671,715 | |
4.63%, 09/15/27(b) | | | 597 | | | | 613,417 | |
4.25%, 07/01/28(b) | | | 8,811 | | | | 8,945,984 | |
3.63%, 01/15/29(b) | | | 6,525 | | | | 6,443,437 | |
Network i2i Ltd., (5 yr. U.S. Treasury Yield Curve Rate T Note Constant Maturity + 4.27%), 5.65%(k)(l) | | | 700 | | | | 695,844 | |
UPC Holding BV, 5.50%, 01/15/28(b) | | | 1,479 | | | | 1,525,219 | |
Verizon Communications, Inc. | | | | | | | | |
4.13%, 03/16/27(g) | | | 22,613 | | | | 26,735,397 | |
4.33%, 09/21/28 | | | 7,332 | | | | 8,890,041 | |
3.88%, 02/08/29 | | | 16,847 | | | | 19,930,057 | |
4.02%, 12/03/29 | | | 2,321 | | | | 2,779,301 | |
1.50%, 09/18/30 | | | 11,450 | | | | 11,411,654 | |
4.50%, 08/10/33 | | | 1,523 | | | | 1,931,675 | |
4.40%, 11/01/34 | | | 2,986 | | | | 3,722,571 | |
4.27%, 01/15/36 | | | 26,368 | | | | 32,524,757 | |
1.85%, 05/18/40 | | | EUR 4,290 | | | | 5,389,754 | |
| | |
S C H E D U L E O F I N V E S T M E N T S | | 75 |
| | |
Schedule of Investments (continued) September 30, 2020 | | Master Total Return Portfolio (Percentages shown are based on Net Assets) |
| | | | | | | | |
| Security | | Par (000) | | | Value | |
|
| Diversified Telecommunication Services (continued) | |
Verizon Communications, Inc. | | | | | | | | |
4.86%, 08/21/46 | | | USD 3,587 | | | $ | 4,898,039 | |
5.50%, 03/16/47 | | | 534 | | | | 804,334 | |
Series 20Y, 2.88%, 01/15/38 | | | EUR 4,400 | | | | 6,376,773 | |
Ziggo BV | | | | | | | | |
5.50%, 01/15/27(b) | | | USD 5,252 | | | | 5,501,470 | |
4.88%, 01/15/30(b) | | | 1,372 | | | | 1,420,020 | |
| | | | | | | | |
| | | | | | | 304,950,764 | |
|
| Electric Utilities — 2.4% | |
Adani Electricity Mumbai Ltd. | | | | | | | | |
3.95%, 02/12/30(b) | | | 2,519 | | | | 2,457,599 | |
3.95%, 02/12/30 | | | 1,919 | | | | 1,872,224 | |
Adani Transmission Ltd. | | | | | | | | |
4.00%, 08/03/26 | | | 662 | | | | 683,929 | |
4.25%, 05/21/36 | | | 1,646 | | | | 1,639,147 | |
AEP Texas, Inc. | | | | | | | | |
3.95%, 06/01/28 | | | 10,571 | | | | 12,217,535 | |
4.15%, 05/01/49 | | | 950 | | | | 1,140,854 | |
3.45%, 01/15/50 | | | 1,440 | | | | 1,575,277 | |
AEP Transmission Co. LLC | | | | | | | | |
4.00%, 12/01/46 | | | 1,806 | | | | 2,191,166 | |
4.25%, 09/15/48 | | | 2,195 | | | | 2,789,354 | |
3.80%, 06/15/49(g) | | | 4,475 | | | | 5,289,436 | |
3.15%, 09/15/49 | | | 3,515 | | | | 3,767,070 | |
3.65%, 04/01/50 | | | 1,807 | | | | 2,107,214 | |
Alabama Power Co. | | | | | | | | |
3.55%, 12/01/23 | | | 885 | | | | 967,942 | |
6.00%, 03/01/39 | | | 215 | | | | 313,299 | |
4.15%, 08/15/44 | | | 290 | | | | 354,220 | |
3.75%, 03/01/45 | | | 4,887 | | | | 5,649,072 | |
4.30%, 07/15/48 | | | 2,138 | | | | 2,739,897 | |
3.45%, 10/01/49 | | | 4,816 | | | | 5,493,354 | |
Baltimore Gas & Electric Co. | | | | | | | | |
3.50%, 08/15/46 | | | 4,197 | | | | 4,760,321 | |
3.75%, 08/15/47 | | | 2,530 | | | | 2,969,711 | |
4.25%, 09/15/48 | | | 1,490 | | | | 1,889,408 | |
3.20%, 09/15/49 | | | 2,000 | | | | 2,153,809 | |
2.90%, 06/15/50 | | | 163 | | | | 166,249 | |
Bi Hai Co. Ltd., 6.25%, 03/05/22 | | | 400 | | | | 402,500 | |
CenterPoint Energy Houston Electric LLC | | | | | | | | |
3.55%, 08/01/42 | | | 2,240 | | | | 2,564,744 | |
3.95%, 03/01/48 | | | 549 | | | | 680,172 | |
Commonwealth Edison Co., 2.95%, 08/15/27 | | | 1,200 | | | | 1,335,073 | |
Dayton Power & Light Co., 3.95%, 06/15/49 | | | 4,998 | | | | 5,422,588 | |
DTE Electric Co. | | | | | | | | |
2.95%, 03/01/50 | | | 1,742 | | | | 1,837,722 | |
Series A, 4.05%, 05/15/48 | | | 6,639 | | | | 8,365,613 | |
Duke Energy Carolinas LLC | | | | | | | | |
3.95%, 11/15/28 | | | 1,701 | | | | 2,039,626 | |
2.45%, 08/15/29 | | | 8,544 | | | | 9,250,224 | |
2.45%, 02/01/30 | | | 7,726 | | | | 8,355,384 | |
3.75%, 06/01/45 | | | 1,177 | | | | 1,391,264 | |
3.88%, 03/15/46 | | | 3,172 | | | | 3,840,778 | |
3.70%, 12/01/47 | | | 3,085 | | | | 3,654,052 | |
3.20%, 08/15/49 | | | 5,348 | | | | 5,939,757 | |
Duke Energy Florida LLC | | | | | | | | |
3.80%, 07/15/28 | | | 2,807 | | | | 3,287,498 | |
2.50%, 12/01/29 | | | 18,416 | | | | 19,976,159 | |
1.75%, 06/15/30 | | | 12,459 | | | | 12,652,812 | |
3.40%, 10/01/46 | | | 2,103 | | | | 2,362,170 | |
4.20%, 07/15/48 | | | 53 | | | | 67,609 | |
| | | | | | | | |
| Security | | Par (000) | | | Value | |
| |
| Electric Utilities (continued) | | | | |
Duke Energy Ohio, Inc. | | | | | | | | |
3.65%, 02/01/29 | | | USD 12,683 | | | $ | 14,726,002 | |
2.13%, 06/01/30 | | | 2,925 | | | | 3,070,384 | |
Duke Energy Progress LLC | | | | | | | | |
3.70%, 09/01/28 | | | 10,090 | | | | 11,717,457 | |
3.45%, 03/15/29 | | | 4,103 | | | | 4,736,545 | |
4.10%, 05/15/42 | | | 2,372 | | | | 2,892,652 | |
4.10%, 03/15/43 | | | 5,261 | | | | 6,427,184 | |
4.20%, 08/15/45 | | | 260 | | | | 323,855 | |
3.70%, 10/15/46 | | | 49 | | | | 57,708 | |
2.50%, 08/15/50 | | | 2,300 | | | | 2,229,928 | |
Edison International | | | | | | | | |
2.40%, 09/15/22 | | | 139 | | | | 141,696 | |
3.13%, 11/15/22 | | | 10 | | | | 10,318 | |
3.55%, 11/15/24 | | | 3,527 | | | | 3,718,560 | |
Entergy Arkansas LLC, 4.20%, 04/01/49 | | | 1,197 | | | | 1,527,310 | |
Entergy Louisiana LLC | | | | | | | | |
5.40%, 11/01/24 | | | 1,470 | | | | 1,731,985 | |
4.20%, 09/01/48 | | | 7,609 | | | | 9,642,591 | |
Eversource Energy, 2.90%, 10/01/24 | | | 5,710 | | | | 6,180,151 | |
Exelon Corp. | | | | | | | | |
4.95%, 06/15/35 | | | 530 | | | | 654,775 | |
5.10%, 06/15/45 | | | 70 | | | | 90,804 | |
FirstEnergy Corp. | | | | | | | | |
2.05%, 03/01/25 | | | 1,392 | | | | 1,412,614 | |
3.90%, 07/15/27 | | | 1,670 | | | | 1,836,097 | |
2.65%, 03/01/30 | | | 7,667 | | | | 7,774,730 | |
2.25%, 09/01/30 | | | 2,734 | | | | 2,673,945 | |
3.40%, 03/01/50 | | | 4,237 | | | | 4,110,218 | |
FirstEnergy Transmission LLC | | | | | | | | |
4.35%, 01/15/25(b) | | | 13,860 | | | | 15,448,765 | |
5.45%, 07/15/44(b) | | | 1,121 | | | | 1,448,468 | |
4.55%, 04/01/49(b) | | | 7,583 | | | | 8,914,323 | |
Florida Power & Light Co. | | | | | | | | |
3.25%, 06/01/24 | | | 60 | | | | 65,060 | |
3.95%, 03/01/48 | | | 7,001 | | | | 8,856,090 | |
3.15%, 10/01/49 | | | 11,814 | | | | 13,411,364 | |
Generacion Mediterranea SA/Generacion Frias SA/Central Termica Roca SA, 9.63%, 07/27/23(b) | | | 4,333 | | | | 2,365,547 | |
Huachen Energy Co. Ltd.,
6.63%, 05/18/20(f)(i) | | | 200 | | | | 72,063 | |
ITC Holdings Corp., 2.70%, 11/15/22 | | | 3,406 | | | | 3,552,494 | |
LLPL Capital Pte Ltd., 6.88%, 02/04/39 | | | 610 | | | | 704,954 | |
MidAmerican Energy Co. | | | | | | | | |
3.10%, 05/01/27 | | | 390 | | | | 434,793 | |
3.65%, 04/15/29 | | | 13,756 | | | | 16,389,571 | |
3.65%, 08/01/48 | | | 1,020 | | | | 1,203,998 | |
4.25%, 07/15/49 | | | 2,933 | | | | 3,801,568 | |
3.15%, 04/15/50 | | | 3,370 | | | | 3,734,489 | |
Mid-Atlantic Interstate Transmission LLC, 4.10%, 05/15/28(b) | | | 992 | | | | 1,121,017 | |
Mong Duong Finance Holdings BV,
5.13%, 05/07/29 | | | 796 | | | | 808,189 | |
Northern States Power Co. | | | | | | | | |
3.40%, 08/15/42 | | | 3,707 | | | | 4,232,952 | |
4.00%, 08/15/45 | | | 1,610 | | | | 2,017,616 | |
3.60%, 09/15/47 | | | 1,658 | | | | 1,968,292 | |
2.90%, 03/01/50 | | | 2,475 | | | | 2,650,338 | |
NSTAR Electric Co. | | | | | | | | |
3.20%, 05/15/27 | | | 161 | | | | 180,204 | |
3.25%, 05/15/29 | | | 825 | | | | 941,769 | |
3.95%, 04/01/30 | | | 642 | | | | 776,586 | |
| | |
| 76 | | 2 0 2 0 B L A C K R O C K A N N U A L R E P O R T T O S H A R E H O L D E R S |
| | |
Schedule of Investments (continued) September 30, 2020 | | Master Total Return Portfolio (Percentages shown are based on Net Assets) |
| | | | | | | | |
| Security | | Par (000) | | | Value | |
| | |
| Electric Utilities (continued) | | | | | | |
Ohio Power Co. | | | | | | | | |
6.60%, 02/15/33 | | | USD 3,415 | | | $ | 4,816,540 | |
4.00%, 06/01/49 | | | 3,666 | | | | 4,489,636 | |
Oncor Electric Delivery Co. LLC | | | | | | | | |
3.70%, 11/15/28 | | | 5,350 | | | | 6,291,886 | |
5.75%, 03/15/29 | | | 480 | | | | 631,145 | |
2.75%, 05/15/30 | | | 3,074 | | | | 3,431,256 | |
5.30%, 06/01/42 | | | 597 | | | | 845,074 | |
3.80%, 09/30/47 | | | 2,314 | | | | 2,810,425 | |
3.80%, 06/01/49 | | | 187 | | | | 227,552 | |
3.10%, 09/15/49 | | | 3,583 | | | | 3,937,850 | |
5.35%, 10/01/52(b) | | | 1,028 | | | | 1,557,317 | |
Public Service Electric & Gas Co. | | | | | | | | |
3.65%, 09/01/28 | | | 6,843 | | | | 8,012,232 | |
3.20%, 05/15/29 | | | 1,531 | | | | 1,748,470 | |
Public Service Electric and Gas Co., 2.05%, 08/01/50 | | | 1,150 | | | | 1,058,619 | |
Southern California Edison Co. | | | | | | | | |
2.90%, 03/01/21 | | | 2,215 | | | | 2,238,500 | |
1.85%, 02/01/22 | | | 1,804 | | | | 1,806,428 | |
3.70%, 08/01/25 | | | 11,997 | | | | 13,298,301 | |
4.20%, 03/01/29 | | | 1,808 | | | | 2,069,436 | |
2.25%, 06/01/30 | | | 9,815 | | | | 9,848,240 | |
3.60%, 02/01/45 | | | 1,389 | | | | 1,426,123 | |
Tampa Electric Co. | | | | | | | | |
4.35%, 05/15/44 | | | 1,190 | | | | 1,480,771 | |
4.30%, 06/15/48 | | | 1,207 | | | | 1,519,964 | |
4.45%, 06/15/49 | | | 2,671 | | | | 3,450,119 | |
Tohoku Electric Power Co., Inc., 0.00%, 12/03/20(j)(m) | | | JPY 110,000 | | | | 1,035,889 | |
Trans-Allegheny Interstate Line Co., 3.85%, 06/01/25(b) | | | USD 18,145 | | | | 20,108,017 | |
Vistra Operations Co. LLC | | | | | | | | |
3.55%, 07/15/24(b) | | | 9,301 | | | | 9,908,284 | |
5.50%, 09/01/26(b) | | | 4,297 | | | | 4,484,994 | |
5.63%, 02/15/27(b) | | | 4,376 | | | | 4,617,555 | |
5.00%, 07/31/27(b) | | | 3,804 | | | | 3,986,592 | |
4.30%, 07/15/29(b) | | | 11,528 | | | | 12,583,066 | |
| | | | | | | | |
| | | | | | | 475,122,132 | |
|
| Electrical Equipment — 0.3% | |
Carrier Global Corp. | | | | | | | | |
1.92%, 02/15/23(b) | | | 14,677 | | | | 15,101,199 | |
2.24%, 02/15/25(b) | | | 28,975 | | | | 30,225,889 | |
Otis Worldwide Corp. | | | | | | | | |
2.29%, 04/05/27 | | | 935 | | | | 994,520 | |
2.57%, 02/15/30 | | | 6,030 | | | | 6,480,626 | |
Suzlon Energy Ltd., (1.25% Cash or 2.75% PIK), Series SUEL, 1.25%, 08/17/32(c)(f)(i)(j)(n) | | | 160 | | | | 112,000 | |
| | | | | | | | |
| | | | | | | 52,914,234 | |
|
| Electronic Equipment, Instruments & Components — 0.0% | |
Corning, Inc. | | | | | | | | |
3.70%, 11/15/23 | | | 775 | | | | 838,849 | |
4.38%, 11/15/57 | | | 4,068 | | | | 4,925,601 | |
| | | | | | | | |
| | | | | | | 5,764,450 | |
|
| Energy Equipment & Services — 0.1% | |
Hilong Holding Ltd.,
8.25%, 09/26/22(f)(i) | | | 250 | | | | 124,687 | |
Odebrecht Drilling Norbe VIII/IX Ltd., 6.35%, 12/01/21(b) | | | 360 | | | | 320,114 | |
Pioneer Energy Services Corp. | | | | | | | | |
(11.00% Cash or 11.00% PIK), 11.00%, 05/15/25(b)(c)(n) | | | 3,017 | | | | 2,413,913 | |
| | | | | | | | |
| Security | | Par (000) | | | Value | |
|
| Energy Equipment & Services (continued) | |
Pioneer Energy Services Corp. | | | | | | | | |
(5.00% Cash or 5.00% PIK), 5.00%, 11/15/25(b)(c)(j)(n) | | | USD 2,034 | | | $ | 1,099,267 | |
Transocean Guardian Ltd., 5.88%, 01/15/24(b) | | | 927 | | | | 598,186 | |
Transocean Phoenix 2 Ltd., 7.75%, 10/15/24(b) | | | 7,556 | | | | 6,952,663 | |
Transocean Proteus Ltd., 6.25%, 12/01/24(b) | | | 759 | | | | 677,006 | |
| | | | | | | | |
| | | | | | | 12,185,836 | |
|
| Equity Real Estate Investment Trusts (REITs) — 1.2% | |
American Tower Corp. | | | | | | | | |
5.00%, 02/15/24 | | | 4,536 | | | | 5,129,160 | |
3.38%, 05/15/24 | | | 3,600 | | | | 3,897,741 | |
2.40%, 03/15/25 | | | 12,994 | | | | 13,732,386 | |
2.75%, 01/15/27 | | | 1,252 | | | | 1,350,577 | |
3.95%, 03/15/29 | | | 1,825 | | | | 2,101,104 | |
3.80%, 08/15/29 | | | 8,966 | | | | 10,264,021 | |
1.88%, 10/15/30 | | | 1,251 | | | | 1,236,069 | |
Boston Properties LP, 3.13%, 09/01/23 | | | 2,102 | | | | 2,223,413 | |
CC Holdings GS V LLC/Crown Castle GS III Corp., 3.85%, 04/15/23 | | | 2,211 | | | | 2,381,164 | |
Crown Castle International Corp. | | | | | | | | |
3.15%, 07/15/23 | | | 2,323 | | | | 2,470,344 | |
1.35%, 07/15/25 | | | 5,279 | | | | 5,336,281 | |
4.45%, 02/15/26 | | | 2,370 | | | | 2,716,162 | |
3.70%, 06/15/26 | | | 5,925 | | | | 6,607,975 | |
3.80%, 02/15/28 | | | 474 | | | | 537,757 | |
4.30%, 02/15/29 | | | 1,324 | | | | 1,545,440 | |
3.10%, 11/15/29 | | | 14,492 | | | | 15,703,906 | |
3.30%, 07/01/30 | | | 1,360 | | | | 1,487,259 | |
2.25%, 01/15/31 | | | 3,983 | | | | 4,025,780 | |
5.20%, 02/15/49 | | | 581 | | | | 764,572 | |
4.15%, 07/01/50 | | | 1,362 | | | | 1,556,794 | |
Digital Dutch Finco BV | | | | | | | | |
1.50%, 03/15/30 | | | EUR 9,150 | | | | 11,200,009 | |
1.00%, 01/15/32 | | | 5,050 | | | | 5,847,226 | |
Equinix, Inc. | | | | | | | | |
2.63%, 11/18/24 | | | USD 1,762 | | | | 1,873,457 | |
1.25%, 07/15/25 | | | 5,023 | | | | 5,057,415 | |
1.00%, 09/15/25 | | | 13,088 | | | | 12,994,353 | |
1.55%, 03/15/28 | | | 3,099 | | | | 3,104,198 | |
GLP Capital LP/GLP Financing II, Inc., 4.00%, 01/15/31 | | | 2,938 | | | | 3,058,546 | |
LMIRT Capital Pte Ltd., 7.25%, 06/19/24 | | | 200 | | | | 182,375 | |
MGM Growth Properties Operating Partnership LP/MGP Finance Co-Issuer, Inc. | | | | | | | | |
5.63%, 05/01/24 | | | 6,235 | | | | 6,610,846 | |
4.63%, 06/15/25(b) | | | 802 | | | | 818,040 | |
4.50%, 09/01/26 | | | 1,730 | | | | 1,755,111 | |
5.75%, 02/01/27 | | | 4,235 | | | | 4,563,213 | |
MPT Operating Partnership LP/MPT Finance Corp. | | | | | | | | |
5.25%, 08/01/26 | | | 299 | | | | 307,970 | |
5.00%, 10/15/27 | | | 4,705 | | | | 4,905,903 | |
4.63%, 08/01/29 | | | 537 | | | | 558,732 | |
National Retail Properties, Inc., 2.50%, 04/15/30(g) | | | 4,195 | | | | 4,160,322 | |
Park Intermediate Holdings LLC/PK Domestic Property LLC/PK Finance Co-Issuer, 5.88%, 10/01/28(b) | | | 567 | | | | 565,583 | |
Prologis Euro Finance LLC, 1.50%, 09/10/49 | | | EUR 7,300 | | | | 8,681,155 | |
Realty Income Corp. | | | | | | | | |
4.65%, 08/01/23 | | | USD 5 | | | | 5,525 | |
4.13%, 10/15/26 | | | 2,631 | | | | 3,044,393 | |
| | |
S C H E D U L E O F I N V E S T M E N T S | | 77 |
| | |
Schedule of Investments (continued) September 30, 2020 | | Master Total Return Portfolio (Percentages shown are based on Net Assets) |
| | | | | | | | |
| Security | | Par (000) | | | Value | |
|
| Equity Real Estate Investment Trusts (REITs) (continued) | |
Realty Income Corp. | | | | | | | | |
3.00%, 01/15/27 | | | USD 865 | | | $ | 941,117 | |
3.25%, 01/15/31 | | | 3,140 | | | | 3,474,871 | |
RHP Hotel Properties LP/RHP Finance Corp., 4.75%, 10/15/27 | | | 2,358 | | | | 2,173,887 | |
Service Properties Trust | | | | | | | | |
5.00%, 08/15/22 | | | 4,481 | | | | 4,455,996 | |
4.50%, 06/15/23 | | | 7,725 | | | | 7,575,753 | |
4.35%, 10/01/24 | | | 1,505 | | | | 1,362,025 | |
7.50%, 09/15/25 | | | 1,479 | | | | 1,571,733 | |
VICI Properties LP/VICI Note Co., Inc. | | | | | | | | |
3.50%, 02/15/25(b) | | | 26,650 | | | | 26,383,633 | |
4.25%, 12/01/26(b) | | | 13,700 | | | | 13,763,705 | |
3.75%, 02/15/27(b) | | | 4,326 | | | | 4,253,669 | |
4.63%, 12/01/29(b) | | | 597 | | | | 607,448 | |
4.13%, 08/15/30(b) | | | 5,173 | | | | 5,088,939 | |
| | | | | | | | |
| | | | | | | 236,015,053 | |
|
| Food & Staples Retailing — 0.5% | |
Albertsons Cos., Inc./Safeway, Inc./New | | | | | | | | |
Albertsons LP/Albertsons LLC | | | | | | | | |
3.50%, 02/15/23(b) | | | 3,289 | | | | 3,344,091 | |
5.75%, 03/15/25 | | | 6,117 | | | | 6,309,991 | |
7.50%, 03/15/26(b) | | | 3,937 | | | | 4,319,046 | |
4.63%, 01/15/27(b) | | | 806 | | | | 824,691 | |
5.88%, 02/15/28(b) | | | 3,317 | | | | 3,540,898 | |
4.88%, 02/15/30(b) | | | 597 | | | | 622,373 | |
Alimentation Couche-Tard, Inc., 3.55%, 07/26/27(b) | | | 12,317 | | | | 13,785,858 | |
CVS Health Corp. | | | | | | | | |
4.10%, 03/25/25 | | | 3,698 | | | | 4,177,372 | |
3.25%, 08/15/29 | | | 7,073 | | | | 7,780,359 | |
3.75%, 04/01/30 | | | 22,364 | | | | 25,520,316 | |
5.30%, 12/05/43 | | | 1,240 | | | | 1,585,824 | |
5.13%, 07/20/45 | | | 13,841 | | | | 17,487,952 | |
Performance Food Group, Inc., 5.50%, 10/15/27(b) | | | 3,012 | | | | 3,102,360 | |
| | | | | | | | |
| | | | | | | 92,401,131 | |
|
| Food Products — 0.3% | |
BRF GmbH, 4.35%, 09/29/26(b) | | | 2,245 | | | | 2,321,470 | |
BRF SA, 5.75%, 09/21/50(b) | | | 2,675 | | | | 2,646,270 | |
Campbell Soup Co., 8.88%, 05/01/21 | | | 2,350 | | | | 2,465,443 | |
CP Foods Capital Ltd., 0.50%, 06/18/25(j) | | | 400 | | | | 394,000 | |
Darling Ingredients, Inc.,
5.25%, 04/15/27(b) | | | 1,690 | | | | 1,774,500 | |
JBS Investments II GmbH | | | | | | | | |
7.00%, 01/15/26(b) | | | 3,405 | | | | 3,634,837 | |
5.75%, 01/15/28(b) | | | 2,508 | | | | 2,608,320 | |
JBS USA LUX SA/JBS USA Finance, Inc. | | | | | | | | |
5.75%, 06/15/25(b) | | | 2,836 | | | | 2,916,968 | |
6.75%, 02/15/28(b) | | | 4,011 | | | | 4,351,935 | |
JBS USA LUX SA/JBS USA Food Co./JBS USA Finance, Inc. | | | | | | | | |
6.50%, 04/15/29(b) | | | 4,974 | | | | 5,520,991 | |
5.50%, 01/15/30(b) | | | 746 | | | | 811,999 | |
Knight Castle Investments Ltd.,
7.99%, 01/23/21 | | | 700 | | | | 491,969 | |
Lamb Weston Holdings, Inc. | | | | | | | | |
4.63%, 11/01/24(b) | | | 2,776 | | | | 2,893,980 | |
4.88%, 11/01/26(b) | | | 2,790 | | | | 2,908,575 | |
Mondelez International, Inc., 2.75%, 04/13/30 | | | 4,984 | | | | 5,419,730 | |
Pilgrim’s Pride Corp., 5.88%, 09/30/27(b) | | | 5,344 | | | | 5,517,680 | |
Post Holdings, Inc. | | | | | | | | |
5.75%, 03/01/27(b) | | | 3,722 | | | | 3,912,752 | |
5.63%, 01/15/28(b) | | | 2,728 | | | | 2,894,654 | |
| | | | | | | | |
| Security | | Par (000) | | | Value | |
| | |
| Food Products (continued) | | | | | | |
Post Holdings, Inc. | | | | | | | | |
5.50%, 12/15/29(b) | | | USD 2,156 | | | $ | 2,306,920 | |
Simmons Foods, Inc., 5.75%, 11/01/24(b) | | | 1,440 | | | | 1,441,498 | |
| | | | | | | | |
| | | | | | | 57,234,491 | |
| | |
| Gas Utilities — 0.0% | | | | | | |
Atmos Energy Corp., 3.38%, 09/15/49 | | | 2,607 | | | | 2,956,099 | |
Piedmont Natural Gas Co., Inc. | | | | | | | | |
3.64%, 11/01/46 | | | 427 | | | | 485,063 | |
3.35%, 06/01/50 | | | 1,635 | | | | 1,789,196 | |
Promigas SA ESP/Gases del Pacifico SAC, 3.75%, 10/16/29 | | | 1,460 | | | | 1,430,800 | |
| | | | | | | | |
| | | | | | | 6,661,158 | |
|
| Health Care Equipment & Supplies — 0.1% | |
Becton Dickinson and Co., 3.30%, 03/01/23 | | | 4,494 | | | | 4,721,511 | |
Boston Scientific Corp. | | | | | | | | |
4.00%, 03/01/29 | | | 4,150 | | | | 4,827,864 | |
2.65%, 06/01/30 | | | 1,706 | | | | 1,810,508 | |
Medtronic Global Holdings SCA | | | | | | | | |
1.50%, 07/02/39 | | | EUR 3,660 | | | | 4,486,526 | |
1.38%, 10/15/40 | | | 570 | | | | 681,856 | |
1.75%, 07/02/49 | | | 3,500 | | | | 4,303,610 | |
Teleflex, Inc., 4.63%, 11/15/27 | | | USD 1,667 | | | | 1,754,518 | |
| | | | | | | | |
| | | | | | | 22,586,393 | |
|
| Health Care Providers & Services — 1.5% | |
Aetna, Inc. | | | | | | | | |
4.50%, 05/15/42 | | | 2,558 | | | | 3,045,596 | |
4.13%, 11/15/42 | | | 10 | | | | 11,409 | |
4.75%, 03/15/44 | | | 1,023 | | | | 1,263,320 | |
AHS Hospital Corp., 5.02%, 07/01/45 | | | 2,140 | | | | 2,881,018 | |
AMN Healthcare, Inc. | | | | | | | | |
5.13%, 10/01/24(b) | | | 4,520 | | | | 4,627,350 | |
4.63%, 10/01/27(b) | | | 2,029 | | | | 2,079,725 | |
Anthem, Inc. | | | | | | | | |
3.65%, 12/01/27 | | | 6,450 | | | | 7,349,429 | |
4.10%, 03/01/28 | | | 2,442 | | | | 2,839,817 | |
Centene Corp. | | | | | | | | |
5.25%, 04/01/25(b) | | | 2,566 | | | | 2,666,716 | |
5.38%, 06/01/26(b) | | | 12,003 | | | | 12,648,161 | |
5.38%, 08/15/26(b) | | | 2,500 | | | | 2,647,938 | |
4.25%, 12/15/27 | | | 8,294 | | | | 8,679,090 | |
4.63%, 12/15/29 | | | 2,090 | | | | 2,254,399 | |
CHRISTUS Health, 4.34%, 07/01/28 | | | 4,070 | | | | 4,736,643 | |
Cigna Corp. | | | | | | | | |
3.00%, 07/15/23 | | | 1,605 | | | | 1,702,683 | |
3.75%, 07/15/23 | | | 65 | | | | 70,439 | |
3.25%, 04/15/25 | | | 4,621 | | | | 5,082,063 | |
3.40%, 03/01/27 | | | 4,183 | | | | 4,690,687 | |
4.38%, 10/15/28 | | | 18,752 | | | | 22,306,585 | |
Cottage Health Obligated Group, 3.30%, 11/01/49 | | | 10,759 | | | | 11,943,766 | |
DaVita, Inc., 4.63%, 06/01/30(b) | | | 6,689 | | | | 6,851,543 | |
DH Europe Finance II S.a.r.l | | | | | | | | |
1.35%, 09/18/39 | | | EUR 4,795 | | | | 5,555,422 | |
1.80%, 09/18/49 | | | 3,600 | | | | 4,244,700 | |
Encompass Health Corp. | | | | | | | | |
4.50%, 02/01/28 | | | USD 1,372 | | | | 1,378,860 | |
4.75%, 02/01/30 | | | 1,382 | | | | 1,402,094 | |
HCA, Inc. | | | | | | | | |
4.75%, 05/01/23 | | | 8,538 | | | | 9,314,011 | |
5.00%, 03/15/24 | | | 7,975 | | | | 8,934,541 | |
5.38%, 02/01/25 | | | 1,552 | | | | 1,699,440 | |
| | |
| 78 | | 2 0 2 0 B L A C K R O C K A N N U A L R E P O R T T O S H A R E H O L D E R S |
| | |
Schedule of Investments (continued) September 30, 2020 | | Master Total Return Portfolio (Percentages shown are based on Net Assets) |
| | | | | | | | |
| Security | | Par (000) | | | Value | |
|
| Health Care Providers & Services (continued) | |
HCA, Inc. | | | | | | | | |
5.25%, 04/15/25 | | | USD 25,546 | | | $ | 29,496,667 | |
5.88%, 02/15/26 | | | 896 | | | | 1,003,520 | |
5.25%, 06/15/26 | | | 2,781 | | | | 3,244,561 | |
5.38%, 09/01/26 | | | 597 | | | | 659,685 | |
5.63%, 09/01/28 | | | 896 | | | | 1,024,979 | |
5.88%, 02/01/29 | | | 597 | | | | 695,505 | |
4.13%, 06/15/29 | | | 3,078 | | | | 3,481,372 | |
Humana, Inc. | | | | | | | | |
4.50%, 04/01/25 | | | 4,430 | | | | 5,088,166 | |
3.13%, 08/15/29 | | | 2,294 | | | | 2,538,109 | |
4.88%, 04/01/30 | | | 2,923 | | | | 3,653,251 | |
McLaren Health Care Corp., 4.39%, 05/15/48 | | | 2,199 | | | | 2,734,478 | |
Molina Healthcare, Inc., 5.38%, 11/15/22 | | | 2,368 | | | | 2,474,560 | |
Ochsner Clinic Foundation, 5.90%, 05/15/45 | | | 734 | | | | 954,129 | |
PeaceHealth Obligated Group, 4.79%, 11/15/48 | | | 462 | | | | 600,368 | |
RWJ Barnabas Health, Inc., 3.48%, 07/01/49 | | | 1,409 | | | | 1,466,239 | |
Select Medical Corp.,
6.25%, 08/15/26(b) | | | 14,365 | | | | 14,939,600 | |
Sutter Health, 3.70%, 08/15/28 | | | 1,823 | | | | 2,050,330 | |
Tenet Healthcare Corp. | | | | | | | | |
4.63%, 07/15/24 | | | 4,979 | | | | 5,003,895 | |
4.63%, 09/01/24(b) | | | 9,353 | | | | 9,428,946 | |
5.13%, 05/01/25 | | | 8,459 | | | | 8,537,669 | |
4.88%, 01/01/26(b) | | | 15,230 | | | | 15,506,577 | |
6.25%, 02/01/27(b) | | | 9,396 | | | | 9,698,645 | |
5.13%, 11/01/27(b) | | | 896 | | | | 920,371 | |
4.63%, 06/15/28(b) | | | 511 | | | | 518,358 | |
UnitedHealth Group, Inc. | | | | | | | | |
2.95%, 10/15/27 | | | 11,106 | | | | 12,394,245 | |
3.85%, 06/15/28 | | | 863 | | | | 1,018,529 | |
5.80%, 03/15/36 | | | 5 | | | | 7,241 | |
6.50%, 06/15/37 | | | 231 | | | | 359,362 | |
2.75%, 05/15/40 | | | 14,634 | | | | 15,462,852 | |
4.63%, 11/15/41 | | | 2,362 | | | | 3,099,134 | |
4.75%, 07/15/45 | | | 4,326 | | | | 5,904,978 | |
4.20%, 01/15/47 | | | 1,634 | | | | 2,069,550 | |
4.25%, 04/15/47 | | | 50 | | | | 63,678 | |
3.75%, 10/15/47 | | | 1,148 | | | | 1,365,063 | |
| | | | | | | | |
| | | | | | | 310,372,057 | |
|
| Hotels, Restaurants & Leisure — 0.9% | |
1011778 BC ULC/New Red Finance, Inc. | | | | | | | | |
5.00%, 10/15/25(b) | | | 8,681 | | | | 8,901,150 | |
3.88%, 01/15/28(b) | | | 448 | | | | 456,422 | |
Aramark Services, Inc. | | | | | | | | |
4.75%, 06/01/26 | | | 1,657 | | | | 1,676,553 | |
5.00%, 02/01/28(b) | | | 3,857 | | | | 3,885,927 | |
Boyd Gaming Corp. | | | | | | | | |
8.63%, 06/01/25(b) | | | 1,656 | | | | 1,815,440 | |
6.38%, 04/01/26 | | | 1,848 | | | | 1,924,119 | |
6.00%, 08/15/26 | | | 1,726 | | | | 1,779,938 | |
Caesars Resort Collection LLC/CRC Finco, Inc., 5.25%, 10/15/25(b) | | | 4,652 | | | | 4,500,810 | |
Cedar Fair LP, 5.25%, 07/15/29 | | | 3,581 | | | | 3,437,760 | |
Cedar Fair LP/Canada’s Wonderland Co./Magnum Management Corp./Millennium Op | | | | | | | | |
5.50%, 05/01/25(b) | | | 6,059 | | | | 6,240,770 | |
5.38%, 04/15/27 | | | 3,117 | | | | 3,101,415 | |
Churchill Downs, Inc. | | | | | | | | |
5.50%, 04/01/27(b) | | | 3,722 | | | | 3,885,024 | |
4.75%, 01/15/28(b) | | | 1,701 | | | | 1,709,505 | |
| | | | | | | | |
| Security | | Par (000) | | | Value | |
|
| Hotels, Restaurants & Leisure (continued) | |
Colt Merger Sub, Inc. | | | | | | | | |
5.75%, 07/01/25(b) | | | USD 2,601 | | | $ | 2,682,281 | |
6.25%, 07/01/25(b) | | | 13,890 | | | | 14,518,453 | |
8.13%, 07/01/27(b) | | | 4,331 | | | | 4,590,860 | |
Golden Nugget, Inc., 6.75%, 10/15/24(b) | | | 3,550 | | | | 2,964,250 | |
Hilton Domestic Operating Co., Inc. | | | | | | | | |
5.13%, 05/01/26 | | | 4,106 | | | | 4,226,183 | |
4.88%, 01/15/30 | | | 597 | | | | 614,910 | |
Hilton Worldwide Finance LLC/Hilton Worldwide Finance Corp. | | | | | | | | |
4.63%, 04/01/25 | | | 2,955 | | | | 2,984,550 | |
4.88%, 04/01/27 | | | 2,561 | | | | 2,601,784 | |
HIS Co. Ltd., 0.00%, 11/15/24(j)(m) | | | JPY 40,000 | | | | 305,065 | |
Hyatt Hotels Corp., 5.38%, 04/23/25 | | | USD 4,131 | | | | 4,447,245 | |
International Game Technology PLC | | | | | | | | |
6.25%, 02/15/22(b) | | | 2,025 | | | | 2,068,031 | |
6.50%, 02/15/25(b) | | | 3,422 | | | | 3,640,152 | |
6.25%, 01/15/27(b) | | | 448 | | | | 480,480 | |
IRB Holding Corp., 7.00%, 06/15/25(b) | | | 1,742 | | | | 1,857,408 | |
Marriott International, Inc., 4.63%, 06/15/30 | | | 2,084 | | | | 2,231,854 | |
Marriott Ownership Resorts, Inc., 6.13%, 09/15/25(b) | | | 3,879 | | | | 3,995,370 | |
Marriott Ownership Resorts, Inc./ILG LLC, 6.50%, 09/15/26 | | | 3,289 | | | | 3,376,882 | |
McDonald’s Corp. | | | | | | | | |
2.13%, 03/01/30 | | | 3,710 | | | | 3,860,413 | |
4.60%, 05/26/45 | | | 2,222 | | | | 2,756,144 | |
4.88%, 12/09/45 | | | 5,602 | | | | 7,264,260 | |
4.45%, 09/01/48 | | | 2,753 | | | | 3,428,094 | |
3.63%, 09/01/49 | | | 2,366 | | | | 2,656,672 | |
Melco Resorts Finance Ltd. | | | | | | | | |
5.63%, 07/17/27 | | | 200 | | | | 206,875 | |
5.38%, 12/04/29(b) | | | 537 | | | | 534,063 | |
MGM China Holdings Ltd. | | | | | | | | |
5.38%, 05/15/24(b) | | | 2,481 | | | | 2,552,329 | |
5.88%, 05/15/26(b) | | | 2,506 | | | | 2,593,710 | |
5.88%, 05/15/26 | | | 200 | | | | 207,000 | |
MGM Resorts International | | | | | | | | |
5.75%, 06/15/25 | | | 392 | | | | 411,130 | |
4.63%, 09/01/26 | | | 229 | | | | 227,855 | |
5.50%, 04/15/27 | | | 390 | | | | 407,550 | |
REXLot Holdings Ltd.,
4.50%, 04/17/19(f)(i)(j) | | | HKD 1,161 | | | | 14,979 | |
Sands China Ltd., 4.38%, 06/18/30 | | | USD 1,962 | | | | 2,060,464 | |
Scientific Games International, Inc., 5.00%, 10/15/25(b) | | | 3,693 | | | | 3,711,465 | |
SeaWorld Parks & Entertainment, Inc. | | | | | | | | |
8.75%, 05/01/25(b) | | | 4,134 | | | | 4,371,705 | |
9.50%, 08/01/25(b) | | | 1,587 | | | | 1,648,830 | |
Starbucks Corp. | | | | | | | | |
2.25%, 03/12/30 | | | 2,711 | | | | 2,815,490 | |
2.55%, 11/15/30 | | | 11,184 | | | | 11,874,660 | |
Station Casinos LLC, 5.00%, 10/01/25(b) | | | 1,495 | | | | 1,470,407 | |
Studio City Finance Ltd., 7.25%, 02/11/24 | | | 200 | | | | 206,210 | |
Wyndham Destinations, Inc., 6.63%, 07/31/26(b) | | | 1,141 | | | | 1,195,323 | |
Wyndham Hotels & Resorts, Inc., 5.38%, 04/15/26(b) | | | 1,681 | | | | 1,710,418 | |
Wynn Las Vegas LLC/Wynn Las Vegas Capital Corp. | | | | | | | | |
5.50%, 03/01/25(b) | | | 6,222 | | | | 5,872,012 | |
5.25%, 05/15/27(b) | | | 3,101 | | | | 2,883,930 | |
Wynn Macau Ltd. | | | | | | | | |
4.88%, 10/01/24(b) | | | 3,585 | | | | 3,526,744 | |
| | |
S C H E D U L E O F I N V E S T M E N T S | | 79 |
| | |
Schedule of Investments (continued) September 30, 2020 | | Master Total Return Portfolio (Percentages shown are based on Net Assets) |
| | | | | | | | |
| Security | | Par (000) | | | Value | |
|
| Hotels, Restaurants & Leisure (continued) | |
Wynn Macau Ltd. | | | | | | | | |
5.50%, 10/01/27(b) | | | USD 2,511 | | | $ | 2,454,502 | |
5.50%, 10/01/27 | | | 400 | | | | 391,000 | |
5.13%, 12/15/29(b) | | | 597 | | | | 571,628 | |
Series AUG, 5.50%, 01/15/26 | | | 200 | | | | 196,000 | |
Wynn Resorts Finance LLC/Wynn Resorts Capital Corp. | | | | | | | | |
7.75%, 04/15/25(b) | | | 5,371 | | | | 5,688,346 | |
5.13%, 10/01/29(b) | | | 5,182 | | | | 4,935,855 | |
| | | | | | | | |
| | | | | | | 185,606,654 | |
|
| Household Durables — 0.4% | |
Ashton Woods USA LLC/Ashton Woods Finance Co. | | | | | | | | |
6.75%, 08/01/25(b) | | | 1,069 | | | | 1,085,035 | |
9.88%, 04/01/27(b) | | | 3,448 | | | | 3,792,800 | |
6.63%, 01/15/28(b) | | | 6,260 | | | | 6,291,300 | |
Beazer Homes U.S.A., Inc., 7.25%, 10/15/29 | | | 4,961 | | | | 5,320,672 | |
Brookfield Residential Properties, Inc./Brookfield Residential U.S. Corp., 6.25%, 09/15/27(b) | | | 6,893 | | | | 6,951,074 | |
Century Communities, Inc., 6.75%, 06/01/27 | | | 7,145 | | | | 7,537,975 | |
Harvest International Co.,
0.00%, 11/21/22(j)(m) | | | HKD 8,000 | | | | 1,116,153 | |
KB Home, 7.63%, 05/15/23 | | | USD 1,769 | | | | 1,941,477 | |
Lennar Corp. | | | | | | | | |
2.95%, 11/29/20 | | | 20 | | | | 20,000 | |
8.38%, 01/15/21 | | | 755 | | | | 768,213 | |
4.75%, 04/01/21 | | | 1,788 | | | | 1,803,645 | |
4.13%, 01/15/22 | | | 1,350 | | | | 1,382,062 | |
4.50%, 04/30/24 | | | 1,533 | | | | 1,640,310 | |
5.88%, 11/15/24 | | | 4,092 | | | | 4,552,350 | |
4.75%, 05/30/25 | | | 299 | | | | 326,323 | |
5.25%, 06/01/26 | | | 60 | | | | 67,350 | |
4.75%, 11/29/27 | | | 537 | | | | 613,120 | |
LGI Homes, Inc., 6.88%, 07/15/26(b) | | | 1,069 | | | | 1,117,105 | |
M/I Homes, Inc., 4.95%, 02/01/28 | | | 5,263 | | | | 5,420,890 | |
Mattamy Group Corp. | | | | | | | | |
5.25%, 12/15/27(b) | | | 3,110 | | | | 3,195,525 | |
4.63%, 03/01/30(b) | | | 3,535 | | | | 3,579,541 | |
PulteGroup, Inc. | | | | | | | | |
4.25%, 03/01/21 | | | 152 | | | | 152,950 | |
5.50%, 03/01/26 | | | 418 | | | | 476,520 | |
5.00%, 01/15/27 | | | 562 | | | | 635,763 | |
6.00%, 02/15/35 | | | 53 | | | | 65,455 | |
Taylor Morrison Communities, Inc., 5.88%, 06/15/27(b) | | | 299 | | | | 328,900 | |
Tempur Sealy International, Inc., 5.50%, 06/15/26. | | | 3,695 | | | | 3,835,225 | |
Toll Brothers Finance Corp. | | | | | �� | | | |
4.38%, 04/15/23 | | | 5,264 | | | | 5,502,117 | |
3.80%, 11/01/29 | | | 5,508 | | | | 5,831,595 | |
TRI Pointe Group, Inc. | | | | | | | | |
5.25%, 06/01/27 | | | 2,378 | | | | 2,538,515 | |
5.70%, 06/15/28 | | | 333 | | | | 364,635 | |
Weekley Homes LLC/Weekley Finance Corp., 4.88%, 09/15/28(b) | | | 1,891 | | | | 1,909,910 | |
| | | | | | | | |
| | | | | | | 80,164,505 | |
|
| Household Products — 0.0% | |
Clorox Co., 3.10%, 10/01/27 | | | 900 | | | | 1,013,872 | |
Kimberly-Clark de Mexico SAB de CV, 2.43%, 07/01/31(b) | | | 1,908 | | | | 1,950,930 | |
Spectrum Brands, Inc., 5.75%, 07/15/25 | | | 2,442 | | | | 2,517,702 | |
| | | | | | | | |
| | | | | | | 5,482,504 | |
| | | | | | | | |
| Security | | Par (000) | | | Value | |
|
| Independent Power and Renewable Electricity Producers — 0.3% | |
Calpine Corp. | | | | | | | | |
5.25%, 06/01/26(b) | | | USD 8,264 | | | $ | 8,585,304 | |
4.50%, 02/15/28(b) | | | 15,793 | | | | 16,174,243 | |
China Shuifa Singyes Energy Holdings Ltd., (6.00% Cash or 6.00% PIK), 6.00%, 12/19/22(n) | | | 340 | | | | 309,183 | |
Colbun SA, 3.15%, 03/06/30(b) | | | 675 | | | | 726,891 | |
NRG Energy, Inc. | | | | | | | | |
7.25%, 05/15/26 | | | 8,865 | | | | 9,434,754 | |
6.63%, 01/15/27 | | | 5,276 | | | | 5,579,370 | |
5.75%, 01/15/28 | | | 2,783 | | | | 3,002,161 | |
5.25%, 06/15/29(b) | | | 3,165 | | | | 3,441,937 | |
2.75%, 06/01/48(j) | | | 2,906 | | | | 3,009,849 | |
Orazul Energy Egenor S en C por A, 5.63%, 04/28/27(b) | | | 607 | | | | 627,335 | |
ReNew Power Pvt Ltd., 5.88%, 03/05/27 | | | 200 | | | | 198,860 | |
ReNew Power Synthetic, 6.67%, 03/12/24 | | | 1,000 | | | | 1,031,250 | |
Star Energy Geothermal Wayang Windu Ltd., 6.75%, 04/24/33(b) | | | 181 | | | | 199,313 | |
Stoneway Capital Corp. | | | | | | | | |
10.00%, 03/01/27(f)(i) | | | 4,059 | | | | 1,632,329 | |
10.00%, 03/01/27(b)(f)(i) | | | 4,327 | | | | 1,740,249 | |
Talen Energy Supply LLC | | | | | | | | |
6.50%, 06/01/25 | | | 1,999 | | | | 1,306,856 | |
10.50%, 01/15/26(b) | | | 1,956 | | | | 1,486,560 | |
7.25%, 05/15/27(b) | | | 3,184 | | | | 3,173,238 | |
| | | | | | | | |
| | | | | | | 61,659,682 | |
|
| Industrial Conglomerates — 0.2% | |
3M Co., 2.38%, 08/26/29 | | | 3,687 | | | | 3,987,694 | |
General Electric Co., 5.88%, 01/14/38 | | | 13,269 | | | | 15,516,181 | |
Grupo KUO SAB De CV, 5.75%, 07/07/27(b) | | | 2,142 | | | | 2,068,369 | |
Honeywell International, Inc. | | | | | | | | |
2.70%, 08/15/29 | | | 1,451 | | | | 1,605,334 | |
0.75%, 03/10/32 | | | EUR 7,580 | | | | 8,939,606 | |
Roper Technologies, Inc., 2.95%, 09/15/29 | | | USD 6,577 | | | | 7,239,497 | |
Tyco Electronics Group SA | | | | | | | | |
3.45%, 08/01/24 | | | 865 | | | | 940,548 | |
3.13%, 08/15/27 | | | 1,669 | | | | 1,825,020 | |
| | | | | | | | |
| | | | | | | 42,122,249 | |
|
| Insurance — 0.4% | |
Ambac Assurance Corp., 5.10%(b)(l) | | | 462 | | | | 633,218 | |
Ambac LSNI LLC, (3 mo. LIBOR US + 5.00%), 6.00%, 02/12/23(a)(b) | | | 2,510 | | | | 2,510,263 | |
Aon Corp. | | | | | | | | |
4.50%, 12/15/28 | | | 8,643 | | | | 10,456,383 | |
3.75%, 05/02/29 | | | 15,704 | | | | 18,114,165 | |
2.80%, 05/15/30 | | | 1,500 | | | | 1,625,190 | |
Aon PLC, 4.75%, 05/15/45 | | | 1,475 | | | | 1,921,403 | |
Marsh & McLennan Cos., Inc. | | | | | | | | |
1.35%, 09/21/26 | | | EUR 4,390 | | | | 5,423,720 | |
4.38%, 03/15/29 | | | USD 4,809 | | | | 5,822,645 | |
1.98%, 03/21/30 | | | EUR 3,035 | | | | 4,021,490 | |
2.25%, 11/15/30 | | | USD 5,332 | | | | 5,579,520 | |
MetLife, Inc., 4.72%, 12/15/44 | | | 1,873 | | | | 2,473,699 | |
Principal Financial Group, Inc. | | | | | | | | |
3.70%, 05/15/29 | | | 2,435 | | | | 2,853,433 | |
2.13%, 06/15/30 | | | 3,114 | | | | 3,207,753 | |
QBE Insurance Group Ltd., (USD Swap Rate 11:00 am NY 10Y + 4.40%), 5.88%, 06/17/46(k) | | | 450 | | | | 491,649 | |
Trinity Acquisition PLC, 4.40%, 03/15/26 | | | 1,765 | | | | 2,038,162 | |
Union Life Insurance Co. Ltd., 3.00%, 09/19/21 | | | 229 | | | | 213,471 | |
| | |
| 80 | | 2 0 2 0 B L A C K R O C K A N N U A L R E P O R T T O S H A R E H O L D E R S |
| | |
Schedule of Investments (continued) September 30, 2020 | | Master Total Return Portfolio (Percentages shown are based on Net Assets) |
| | | | | | | | |
| Security | | Par (000) | | | Value | |
|
| Insurance (continued) | |
Willis North America, Inc. | | | | | | | | |
3.60%, 05/15/24 | | USD | 2,050 | | | $ | 2,238,956 | |
3.88%, 09/15/49 | | | 777 | | | | 893,006 | |
ZhongAn Online P&C Insurance Co. Ltd., 3.50%, 03/08/26 | | | 1,200 | | | | 1,201,666 | |
| | | | | | | | |
| | |
| | | | | | | 71,719,792 | |
|
| Interactive Media & Services — 0.0% | |
Baidu, Inc., 4.38%, 05/14/24 | | | 3,320 | | | | 3,644,610 | |
Tencent Holdings Ltd., 3.24%, 06/03/50 | | | 2,350 | | | | 2,380,397 | |
| | | | | | | | |
| | |
| | | | | | | 6,025,007 | |
|
| Internet & Direct Marketing Retail — 0.3% | |
Alibaba Group Holding Ltd., 3.60%, 11/28/24 | | | 5,095 | | | | 5,582,795 | |
Amazon.com, Inc., 3.88%, 08/22/37 | | | 9,842 | | | | 12,253,561 | |
Baozun, Inc., 1.63%, 05/01/24(j) | | | 258 | | | | 237,455 | |
Booking Holdings, Inc. | | | | | | | | |
4.10%, 04/13/25 | | | 13,198 | | | | 14,850,665 | |
1.80%, 03/03/27 | | EUR | 6,125 | | | | 7,564,907 | |
Expedia Group, Inc. | | | | | | | | |
6.25%, 05/01/25(b) | | USD | 5,251 | | | | 5,791,375 | |
3.80%, 02/15/28 | | | 2,973 | | | | 3,002,260 | |
3.25%, 02/15/30 | | | 5,730 | | | | 5,520,915 | |
Netflix, Inc. | | | | | | | | |
4.88%, 04/15/28 | | | 955 | | | | 1,067,213 | |
6.38%, 05/15/29 | | | 478 | | | | 587,940 | |
5.38%, 11/15/29(b) | | | 537 | | | | 632,935 | |
4.88%, 06/15/30(b) | | | 597 | | | | 680,580 | |
| | | | | | | | |
| | |
| | | | | | | 57,772,601 | |
| | |
| IT Services — 1.1% | | | | | | |
21Vianet Group, Inc., 7.88%, 10/15/21 | | | 685 | | | | 699,556 | |
DXC Technology Co. | | | | | | | | |
4.00%, 04/15/23 | | | 6,655 | | | | 7,007,997 | |
4.13%, 04/15/25 | | | 1,330 | | | | 1,437,043 | |
Fidelity National Information Services, Inc. | | | | | | | | |
3.00%, 08/15/26 | | | 5,100 | | | | 5,657,427 | |
1.00%, 12/03/28 | | EUR | 10,500 | | | | 12,606,254 | |
2.95%, 05/21/39 | | | 4,400 | | | | 6,237,362 | |
Fiserv, Inc. | | | | | | | | |
3.20%, 07/01/26 | | USD | 3,974 | | | | 4,415,287 | |
3.50%, 07/01/29 | | | 13,009 | | | | 14,829,159 | |
2.65%, 06/01/30 | | | 6,790 | | | | 7,306,620 | |
1.63%, 07/01/30 | | EUR | 8,660 | | | | 10,826,842 | |
Global Payments, Inc. | | | | | | | | |
3.80%, 04/01/21 | | USD | 1,910 | | | | 1,935,452 | |
4.80%, 04/01/26 | | | 4,157 | | | | 4,853,299 | |
4.45%, 06/01/28 | | | 2,703 | | | | 3,175,473 | |
3.20%, 08/15/29 | | | 5,410 | | | | 5,900,922 | |
International Business Machines Corp. | | | | | | | | |
3.30%, 05/15/26 | | | 18,911 | | | | 21,295,931 | |
1.70%, 05/15/27 | | | 1,442 | | | | 1,490,782 | |
1.95%, 05/15/30 | | | 31,140 | | | | 32,126,361 | |
4.15%, 05/15/39 | | | 2,600 | | | | 3,184,534 | |
2.85%, 05/15/40 | | | 9,573 | | | | 10,156,115 | |
Leidos, Inc., 4.38%, 05/15/30(b) | | | 13,524 | | | | 15,849,452 | |
LINE Corp., 0.00%, 09/19/25(j)(m) | | JPY | 20,000 | | | | 188,738 | |
Mastercard, Inc. | | | | | | | | |
2.95%, 06/01/29 | | USD | 17,164 | | | | 19,384,947 | |
3.35%, 03/26/30 | | | 6,428 | | | | 7,537,209 | |
PayPal Holdings, Inc. | | | | | | | | |
1.65%, 06/01/25 | | | 4,546 | | | | 4,708,374 | |
2.65%, 10/01/26 | | | 1,096 | | | | 1,195,936 | |
Sabre GLBL, Inc., 5.25%, 11/15/23(b) | | | 300 | | | | 293,250 | |
| | | | | | | | |
| Security | | Par (000) | | | Value | |
|
| IT Services (continued) | |
Transcosmos, Inc., 0.00%, 12/22/20(j)(m) | | JPY | 40,000 | | | $ | 398,753 | |
Visa, Inc. | | | | | | | | |
2.75%, 09/15/27 | | USD | 3,727 | | | | 4,124,840 | |
4.15%, 12/14/35 | | | 3,063 | | | | 3,966,391 | |
2.70%, 04/15/40 | | | 5,603 | | | | 6,060,676 | |
| | | | | | | | |
| | |
| | | | | | | 218,850,982 | |
|
| Leisure Products — 0.1% | |
Hasbro, Inc. | | | | | | | | |
2.60%, 11/19/22 | | | 12,338 | | | | 12,781,954 | |
3.90%, 11/19/29 | | | 1,450 | | | | 1,526,066 | |
| | | | | | | | |
| | |
| | | | | | | 14,308,020 | |
|
| Life Sciences Tools & Services — 0.2% | |
Agilent Technologies, Inc. | | | | | | | | |
3.05%, 09/22/26 | | | 9,644 | | | | 10,600,109 | |
2.75%, 09/15/29 | | | 2,205 | | | | 2,390,243 | |
Avantor, Inc., 6.00%, 10/01/24(b) | | | 1,212 | | | | 1,266,540 | |
Charles River Laboratories International, Inc. | | | | | | | | |
5.50%, 04/01/26(b) | | | 1,408 | | | | 1,481,920 | |
4.25%, 05/01/28(b) | | | 758 | | | | 795,513 | |
IQVIA, Inc. | | | | | | | | |
5.00%, 10/15/26(b) | | | 3,518 | | | | 3,676,310 | |
5.00%, 05/15/27(b) | | | 3,707 | | | | 3,887,049 | |
Jaguar Holding Co. II/PPD Development LP, 5.00%, 06/15/28(b) | | | 904 | | | | 943,550 | |
Thermo Fisher Scientific, Inc. | | | | | | | | |
4.13%, 03/25/25 | | | 342 | | | | 389,582 | |
2.60%, 10/01/29 | | | 4,103 | | | | 4,472,701 | |
4.50%, 03/25/30 | | | 3,037 | | | | 3,757,129 | |
1.88%, 10/01/49 | | EUR | 7,400 | | | | 8,729,538 | |
| | | | | | | | |
| | |
| | | | | | | 42,390,184 | |
| | |
| Machinery — 0.2% | | | | | | |
China Conch Venture Holdings International Ltd., 0.00%, 09/05/23(j)(m) | | HKD | 6,000 | | | | 859,010 | |
Colfax Corp., 6.00%, 02/15/24(b) | | USD | 2,044 | | | | 2,118,095 | |
HTA Group Ltd., 7.00%, 12/18/25(b) | | | 2,290 | | | | 2,387,325 | |
John Deere Cash Management SA | | | | | | | | |
1.85%, 04/02/28 | | EUR | 730 | | | | 955,179 | |
2.20%, 04/02/32 | | | 2,385 | | | | 3,301,625 | |
Parker-Hannifin Corp. | | | | | | | | |
2.70%, 06/14/24 | | USD | 9,940 | | | | 10,642,217 | |
3.25%, 06/14/29 | | | 1,783 | | | | 1,996,866 | |
Terex Corp., 5.63%, 02/01/25(b) | | | 4,180 | | | | 4,190,450 | |
Vertical U.S. Newco, Inc., 5.25%, 07/15/27(b) | | | 5,290 | | | | 5,497,712 | |
| | | | | | | | |
| | |
| | | | | | | 31,948,479 | |
| | |
| Media — 1.9% | | | | | | |
Altice France SA | | | | | | | | |
7.38%, 05/01/26(b) | | | 15,115 | | | | 15,839,008 | |
8.13%, 02/01/27(b) | | | 5,275 | | | | 5,749,750 | |
5.50%, 01/15/28(b) | | | 3,005 | | | | 3,042,563 | |
AMC Networks, Inc. | | | | | | | | |
5.00%, 04/01/24 | | | 3,289 | | | | 3,363,002 | |
4.75%, 08/01/25 | | | 3,348 | | | | 3,460,811 | |
CCO Holdings LLC/CCO Holdings Capital Corp. | | | | | | | | |
5.75%, 02/15/26(b) | | | 5,720 | | | | 5,948,800 | |
5.50%, 05/01/26(b) | | | 3,389 | | | | 3,520,324 | |
5.13%, 05/01/27(b) | | | 8,329 | | | | 8,763,940 | |
5.88%, 05/01/27(b) | | | 1,819 | | | | 1,909,768 | |
5.00%, 02/01/28(b) | | | 10,487 | | | | 11,011,350 | |
5.38%, 06/01/29(b) | | | 3,505 | | | | 3,798,544 | |
4.75%, 03/01/30(b) | | | 4,054 | | | | 4,292,172 | |
| | |
S C H E D U L E O F I N V E S T M E N T S | | 81 |
| | |
Schedule of Investments (continued) September 30, 2020 | | Master Total Return Portfolio (Percentages shown are based on Net Assets) |
| | | | | | | | |
| Security | | Par (000) | | | Value | |
|
| Media (continued) | |
Charter Communications Operating LLC/Charter Communications Operating Capital | | | | | | | | |
(3 mo. LIBOR US + 1.65%), 1.90%, 02/01/24(a) | | USD | 208 | | | $ | 212,795 | |
6.38%, 10/23/35 | | | 6,501 | | | | 8,915,462 | |
6.48%, 10/23/45 | | | 20,357 | | | | 27,303,889 | |
5.38%, 05/01/47 | | | 9,250 | | | | 10,983,090 | |
5.13%, 07/01/49 | | | 1,609 | | | | 1,865,560 | |
4.80%, 03/01/50 | | | 1,621 | | | | 1,843,294 | |
6.83%, 10/23/55 | | | 1,405 | | | | 1,945,877 | |
Cinemark Holdings, Inc.,
4.50%, 08/15/25(b)(j) | | | 2,609 | | | | 2,594,283 | |
Clear Channel Worldwide Holdings, Inc., 5.13%, 08/15/27(b) | | | 3,843 | | | | 3,690,241 | |
Comcast Corp. | | | | | | | | |
4.15%, 10/15/28 | | | 14,620 | | | | 17,617,378 | |
2.65%, 02/01/30 | | | 5,553 | | | | 6,050,633 | |
3.40%, 04/01/30 | | | 27,632 | | | | 31,883,540 | |
1.95%, 01/15/31 | | | 19,508 | | | | 20,051,099 | |
4.40%, 08/15/35 | | | 322 | | | | 408,604 | |
3.90%, 03/01/38 | | | 6,050 | | | | 7,179,140 | |
3.75%, 04/01/40 | | | 7,481 | | | | 8,748,877 | |
4.75%, 03/01/44 | | | 8 | | | | 10,540 | |
4.60%, 08/15/45 | | | 2,191 | | | | 2,826,386 | |
3.40%, 07/15/46 | | | 8,690 | | | | 9,669,281 | |
4.00%, 08/15/47 | | | 445 | | | | 539,618 | |
3.97%, 11/01/47 | | | 5,977 | | | | 7,144,834 | |
4.70%, 10/15/48 | | | 1,868 | | | | 2,491,166 | |
4.00%, 11/01/49 | | | 945 | | | | 1,146,681 | |
2.65%, 08/15/62 | | | 1,525 | | | | 1,457,823 | |
Cox Communications, Inc. | | | | | | | | |
3.25%, 12/15/22(b) | | | 2,960 | | | | 3,120,089 | |
3.15%, 08/15/24(b) | | | 19,141 | | | | 20,595,615 | |
CSC Holdings LLC | | | | | | | | |
7.50%, 04/01/28(b) | | | 3,177 | | | | 3,505,978 | |
5.75%, 01/15/30(b) | | | 6,441 | | | | 6,843,562 | |
Diamond Sports Group LLC/Diamond Sports Finance Co., 5.38%, 08/15/26(b) | | | 1,821 | | | | 1,288,358 | |
Discovery Communications LLC | | | | | | | | |
1.90%, 03/19/27 | | EUR | 3,980 | | | | 4,871,782 | |
5.20%, 09/20/47 | | USD | 2,919 | | | | 3,535,950 | |
5.30%, 05/15/49 | | | 905 | | | | 1,105,945 | |
4.00%, 09/15/55(b) | | | 7,431 | | | | 7,544,732 | |
Gray Television, Inc. | | | | | | | | |
5.88%, 07/15/26(b) | | | 1,994 | | | | 2,068,775 | |
7.00%, 05/15/27(b) | | | 2,255 | | | | 2,444,730 | |
iHeartCommunications, Inc. | | | | | | | | |
6.38%, 05/01/26 | | | 3,559 | | | | 3,707,433 | |
5.25%, 08/15/27(b) | | | 3,210 | | | | 3,129,750 | |
4.75%, 01/15/28(b) | | | 299 | | | | 281,792 | |
JOYY, Inc., 0.75%, 06/15/25(j) | | | 166 | | | | 180,217 | |
Lamar Media Corp. | | | | | | | | |
5.75%, 02/01/26 | | | 2,213 | | | | 2,284,923 | |
3.75%, 02/15/28(b) | | | 358 | | | | 356,210 | |
Meredith Corp., 6.88%, 02/01/26 | | | 3,573 | | | | 2,983,455 | |
NBCUniversal Media LLC, 6.40%, 04/30/40 | | | 89 | | | | 137,269 | |
Nexstar Broadcasting, Inc. | | | | | | | | |
5.63%, 07/15/27(b) | | | 3,217 | | | | 3,379,072 | |
4.75%, 11/01/28(b) | | | 2,573 | | | | 2,620,729 | |
Nielsen Co. Luxembourg S.a.r.l, 5.00%, 02/01/25(b) | | | 1,349 | | | | 1,374,294 | |
| | | | | | | | |
| Security | | Par (000) | | | Value | |
|
| Media (continued) | |
Outfront Media Capital LLC/Outfront Media Capital Corp. | | | | | | | | |
5.00%, 08/15/27(b) | | USD | 4,648 | | | $ | 4,531,800 | |
4.63%, 03/15/30(b) | | | 299 | | | | 287,040 | |
Sirius XM Radio, Inc. | | | | | | | | |
4.63%, 07/15/24(b) | | | 8,075 | | | | 8,352,578 | |
5.38%, 07/15/26(b) | | | 2,752 | | | | 2,864,006 | |
5.00%, 08/01/27(b) | | | 6,435 | | | | 6,708,487 | |
5.50%, 07/01/29(b) | | | 4,240 | | | | 4,547,400 | |
TEGNA, Inc. | | | | | | | | |
4.63%, 03/15/28(b) | | | 4,459 | | | | 4,360,010 | |
5.00%, 09/15/29(b) | | | 657 | | | | 648,788 | |
Time Warner Cable LLC | | | | | | | | |
4.00%, 09/01/21 | | | 911 | | | | 930,733 | |
6.55%, 05/01/37 | | | 990 | | | | 1,316,168 | |
TWDC Enterprises 18 Corp. | | | | | | | | |
3.70%, 12/01/42 | | | 2,383 | | | | 2,695,444 | |
4.13%, 06/01/44 | | | 1,476 | | | | 1,782,346 | |
3.00%, 07/30/46 | | | 2,724 | | | | 2,810,267 | |
Viacom, Inc., 6.88%, 04/30/36 | | | 3,442 | | | | 4,736,224 | |
ViacomCBS, Inc. | | | | | | | | |
4.38%, 03/15/43 | | | 3,795 | | | | 4,034,170 | |
5.85%, 09/01/43 | | | 3,148 | | | | 3,993,226 | |
Walt Disney Co. | | | | | | | | |
3.70%, 10/15/25 | | | 1,846 | | | | 2,093,643 | |
6.15%, 02/15/41 | | | 64 | | | | 94,428 | |
4.75%, 09/15/44 | | | 1,915 | | | | 2,433,138 | |
2.75%, 09/01/49 | | | 1,965 | | | | 1,916,093 | |
Weibo Corp., 1.25%, 11/15/22(j) | | | 89 | | | | 84,607 | |
Ziggo Bond Co. BV, 6.00%, 01/15/27(b) | | | 1,779 | | | | 1,839,041 | |
| | | | | | | | |
| | |
| | | | | | | 387,700,420 | |
|
| Metals & Mining — 0.3% | |
ABJA Investment Co. Pte Ltd., 5.95%, 07/31/24 | | | 200 | | | | 204,999 | |
Anglo American Capital PLC | | | | | | | | |
5.63%, 04/01/30(b) | | | 3,625 | | | | 4,449,397 | |
2.63%, 09/10/30(b) | | | 7,395 | | | | 7,374,886 | |
AngloGold Ashanti Holdings PLC, 3.75%, 10/01/30 | | | 1,102 | | | | 1,125,418 | |
FMG Resources August 2006 Pty Ltd. | | | | | | | | |
4.75%, 05/15/22(b) | | | 2,474 | | | | 2,532,757 | |
5.13%, 03/15/23(b) | | | 1,681 | | | | 1,754,124 | |
5.13%, 05/15/24(b) | | | 327 | | | | 349,073 | |
4.50%, 09/15/27(b) | | | 358 | | | | 382,169 | |
Freeport-McMoRan, Inc. | | | | | | | | |
5.00%, 09/01/27 | | | 358 | | | | 373,949 | |
5.25%, 09/01/29 | | | 358 | | | | 384,850 | |
Fresnillo PLC, 4.25%, 10/02/50(b) | | | 3,648 | | | | 3,604,490 | |
Industrias Penoles SAB de CV | | | | | | | | |
4.15%, 09/12/29(b) | | | 3,906 | | | | 4,242,892 | |
4.75%, 08/06/50(b) | | | 1,074 | | | | 1,105,394 | |
Minera Mexico SA de CV,
4.50%, 01/26/50(b) | | | 1,833 | | | | 1,988,805 | |
Newmont Corp. | | | | | | | | |
2.80%, 10/01/29 | | | 4,682 | | | | 5,042,331 | |
2.25%, 10/01/30 | | | 3,364 | | | | 3,471,729 | |
Nucor Corp., 3.95%, 05/01/28 | | | 2,488 | | | | 2,899,807 | |
Steel Dynamics, Inc., 2.80%, 12/15/24 | | | 3,750 | | | | 3,955,981 | |
Teck Resources Ltd., 6.13%, 10/01/35 | | | 1,384 | | | | 1,654,406 | |
Vale Overseas Ltd., 3.75%, 07/08/30 | | | 2,475 | | | | 2,542,444 | |
Vedanta Resources Finance II PLC, 8.00%, 04/23/23 | | | 700 | | | | 549,719 | |
| | |
| 82 | | 2 0 2 0 B L A C K R O C K A N N U A L R E P O R T T O S H A R E H O L D E R S |
| | |
Schedule of Investments (continued) September 30, 2020 | | Master Total Return Portfolio (Percentages shown are based on Net Assets) |
| | | | | | | | |
| Security | | Par (000) | | | Value | |
|
| Metals & Mining (continued) | |
Vedanta Resources Ltd., 6.13%, 08/09/24 | | USD | 586 | | | $ | 410,200 | |
Votorantim SA, 6.75%, 04/05/21(b) | | | 1,349 | | | | 1,382,725 | |
| | | | | | | | |
| | |
| | | | | | | 51,782,545 | |
|
| Multiline Retail — 0.0% | |
Dollar General Corp., 4.13%, 04/03/50 | | | 2,356 | | | | 2,794,114 | |
Macy’s, Inc., 8.38%, 06/15/25(b) | | | 1,286 | | | | 1,329,634 | |
| | | | | | | | |
| | |
| | | | | | | 4,123,748 | |
|
| Multi-Utilities — 0.3% | |
Ameren Illinois Co. | | | | | | | | |
3.80%, 05/15/28 | | | 3,671 | | | | 4,291,268 | |
3.70%, 12/01/47 | | | 100 | | | | 117,669 | |
3.25%, 03/15/50 | | | 3,650 | | | | 4,106,360 | |
CenterPoint Energy Resources Corp., 1.75%, 10/01/30 | | | 9,695 | | | | 9,732,107 | |
Consumers Energy Co. | | | | | | | | |
3.95%, 05/15/43 | | | 5 | | | | 6,030 | |
3.25%, 08/15/46 | | | 628 | | | | 699,686 | |
4.05%, 05/15/48 | | | 1,325 | | | | 1,664,761 | |
3.75%, 02/15/50 | | | 5,099 | | | | 6,255,352 | |
3.10%, 08/15/50 | | | 6,026 | | | | 6,577,020 | |
3.50%, 08/01/51 | | | 3,600 | | | | 4,213,968 | |
Dominion Energy Gas Holdings LLC | | | | | | | | |
4.80%, 11/01/43 | | | 1,110 | | | | 1,384,855 | |
4.60%, 12/15/44 | | | 1,268 | | | | 1,576,321 | |
PG&E Corp., 5.00%, 07/01/28 | | | 6,372 | | | | 6,180,840 | |
Virginia Electric & Power Co. | | | | | | | | |
2.75%, 03/15/23 | | | 6,506 | | | | 6,816,101 | |
3.50%, 03/15/27 | | | 3,975 | | | | 4,531,549 | |
4.00%, 01/15/43 | | | 8,631 | | | | 10,564,961 | |
4.00%, 11/15/46 | | | 1,554 | | | | 1,922,669 | |
| | | | | | | | |
| | |
| | | | | | | 70,641,517 | |
|
| Oil, Gas & Consumable Fuels — 2.9% | |
Boardwalk Pipelines LP | | | | | | | | |
4.80%, 05/03/29 | | | 640 | | | | 697,423 | |
3.40%, 02/15/31 | | | 3,031 | | | | 2,970,852 | |
BP Capital Markets America, Inc. | | | | | | | | |
3.79%, 02/06/24 | | | 7,003 | | | | 7,679,700 | |
3.80%, 09/21/25 | | | 7,158 | | | | 8,068,307 | |
3.41%, 02/11/26 | | | 3,329 | | | | 3,715,550 | |
3.12%, 05/04/26 | | | 2,440 | | | | 2,693,767 | |
BP Capital Markets PLC | | | | | | | | |
3.81%, 02/10/24 | | | 4,525 | | | | 4,974,201 | |
3.54%, 11/04/24 | | | 342 | | | | 377,455 | |
Bruin E&P Partners LLC,
8.88%, 08/01/23(f)(i) | | | 2,601 | | | | 3,251 | |
Buckeye Partners LP | | | | | | | | |
4.15%, 07/01/23 | | | 1,988 | | | | 1,961,659 | |
4.35%, 10/15/24 | | | 2,500 | | | | 2,453,125 | |
4.13%, 03/01/25(b) | | | 1,160 | | | | 1,102,000 | |
3.95%, 12/01/26 | | | 358 | | | | 333,584 | |
Cameron LNG LLC | | | | | | | | |
3.30%, 01/15/35(b) | | | 7,430 | | | | 8,382,935 | |
3.40%, 01/15/38(b) | | | 11,339 | | | | 12,271,461 | |
Cheniere Corpus Christi Holdings LLC | | | | | | | | |
5.88%, 03/31/25 | | | 14,310 | | | | 16,311,037 | |
5.13%, 06/30/27 | | | 13,464 | | | | 14,987,337 | |
Cheniere Energy Partners LP | | | | | | | | |
5.25%, 10/01/25 | | | 4,139 | | | | 4,234,197 | |
5.63%, 10/01/26 | | | 2,955 | | | | 3,073,200 | |
4.50%, 10/01/29 | | | 896 | | | | 919,090 | |
| | | | | | | | |
| Security | | Par (000) | | | Value | |
|
| Oil, Gas & Consumable Fuels (continued) | |
Cheniere Energy, Inc. | | | | | | | | |
(4.88% Cash or 4.88% PIK), 4.88%, 05/28/21(b)(j)(n) | | USD | 16,055 | | | $ | 16,044,815 | |
4.63%, 10/15/28(b) | | | 2,529 | | | | 2,595,386 | |
Chesapeake Energy Corp. | | | | | | | | |
6.63%, 08/15/20(f)(i) | | | 623 | | | | 21,805 | |
6.13%, 02/15/21(f)(i) | | | 9,090 | | | | 318,150 | |
5.38%, 06/15/21(f)(i) | | | 425 | | | | 15,938 | |
Chevron U.S.A., Inc., 2.34%, 08/12/50 | | | 3,650 | | | | 3,456,676 | |
Concho Resources, Inc. | | | | | | | | |
3.75%, 10/01/27 | | | 7,139 | | | | 7,711,444 | |
4.30%, 08/15/28 | | | 7,020 | | | | 7,764,499 | |
2.40%, 02/15/31 | | | 1,245 | | | | 1,179,315 | |
CrownRock LP/CrownRock Finance, Inc., 5.63%, 10/15/25(b) | | | 3,125 | | | | 2,945,312 | |
DCP Midstream Operating LP | | | | | | | | |
5.38%, 07/15/25 | | | 493 | | | | 508,322 | |
5.13%, 05/15/29 | | | 358 | | | | 352,630 | |
Diamondback Energy, Inc., 3.50%, 12/01/29 | | | 17,404 | | | | 16,871,865 | |
Enbridge Energy Partners LP, 7.38%, 10/15/45 | | | 658 | | | | 963,405 | |
Enbridge, Inc., 2.90%, 07/15/22 | | | 2,018 | | | | 2,094,593 | |
Endeavor Energy Resources LP/EER Finance, Inc. | | | | | | | | |
5.50%, 01/30/26(b) | | | 1,718 | | | | 1,705,115 | |
5.75%, 01/30/28(b) | | | 1,351 | | | | 1,357,755 | |
Energy Transfer Operating LP | | | | | | | | |
3.60%, 02/01/23 | | | 3,265 | | | | 3,359,834 | |
4.25%, 03/15/23 | | | 3,843 | | | | 3,995,726 | |
4.20%, 09/15/23 | | | 3,200 | | | | 3,377,445 | |
4.90%, 02/01/24 | | | 113 | | | | 120,586 | |
4.05%, 03/15/25 | | | 2,850 | | | | 2,995,582 | |
2.90%, 05/15/25 | | | 24,294 | | | | 24,425,266 | |
6.50%, 02/01/42 | | | 6,482 | | | | 6,789,679 | |
Energy Transfer Partners LP/Regency Energy Finance Corp. | | | | | | | | |
5.88%, 03/01/22 | | | 11,403 | | | | 11,911,417 | |
5.00%, 10/01/22 | | | 12,080 | | | | 12,713,360 | |
4.50%, 11/01/23 | | | 5,290 | | | | 5,628,420 | |
Enterprise Products Operating LLC | | | | | | | | |
6.88%, 03/01/33 | | | 2,153 | | | | 2,886,943 | |
6.65%, 10/15/34 | | | 145 | | | | 192,820 | |
4.45%, 02/15/43 | | | 6,682 | | | | 7,213,214 | |
4.85%, 03/15/44 | | | 3,040 | | | | 3,457,606 | |
5.10%, 02/15/45 | | | 3,534 | | | | 4,113,892 | |
EOG Resources, Inc., 4.15%, 01/15/26 | | | 9,444 | | | | 10,815,451 | |
Exxon Mobil Corp., 1.41%, 06/26/39 | | | EUR 9,940 | | | | 11,486,655 | |
Gray Oak Pipeline LLC | | | | | | | | |
2.00%, 09/15/23(b) | | | USD 4,753 | | | | 4,779,215 | |
2.60%, 10/15/25(b) | | | 6,056 | | | | 6,076,851 | |
Great Western Petroleum LLC/Great Western Finance Corp.,
9.00%, 09/30/21(b) | | | 7,127 | | | | 4,151,477 | |
Hammerhead Resources, Inc., 9.00%, 07/10/22(c) | | | 3,381 | | | | 2,541,425 | |
Hess Corp., 5.60%, 02/15/41 | | | 2,000 | | | | 2,158,575 | |
HPCL-Mittal Energy Ltd., 5.45%, 10/22/26 | | | 200 | | | | 201,500 | |
Kinder Morgan Energy Partners LP | | | | | | | | |
6.50%, 02/01/37 | | | 6,083 | | | | 7,568,787 | |
6.95%, 01/15/38 | | | 1,402 | | | | 1,834,740 | |
6.38%, 03/01/41 | | | 2,148 | | | | 2,631,084 | |
Leviathan Bond Ltd., 5.75%, 06/30/23(b) | | | 2,914 | | | | 3,001,417 | |
Marathon Petroleum Corp. 4.75%, 12/15/23 | | | 2,680 | | | | 2,937,309 | |
| | |
S C H E D U L E O F I N V E S T M E N T S | | 83 |
| | |
Schedule of Investments (continued) September 30, 2020 | | Master Total Return Portfolio (Percentages shown are based on Net Assets) |
| | | | | | | | |
| Security | | Par (000) | | | Value | |
|
| Oil, Gas & Consumable Fuels (continued) | |
Marathon Petroleum Corp. | | | | | | | | |
4.75%, 09/15/44 | | USD | 1,372 | | | $ | 1,430,336 | |
5.85%, 12/15/45 | | | 1,915 | | | | 2,174,568 | |
Matador Resources Co., 5.88%, 09/15/26 | | | 627 | | | | 524,141 | |
Medco Platinum Road Pte Ltd., 6.75%, 01/30/25 | | | 200 | | | | 191,000 | |
MPLX LP | | | | | | | | |
3.38%, 03/15/23 | | | 2,055 | | | | 2,165,042 | |
4.88%, 12/01/24 | | | 11,620 | | | | 12,981,711 | |
4.25%, 12/01/27 | | | 2,445 | | | | 2,740,339 | |
2.65%, 08/15/30 | | | 7,015 | | | | 6,847,087 | |
5.20%, 03/01/47 | | | 2,810 | | | | 3,063,870 | |
NGPL PipeCo LLC | | | | | | | | |
4.38%, 08/15/22(b) | | | 5,395 | | | | 5,600,228 | |
4.88%, 08/15/27(b) | | | 7,707 | | | | 8,363,191 | |
7.77%, 12/15/37(b) | | | 1,336 | | | | 1,700,599 | |
Northwest Pipeline LLC, 4.00%, 04/01/27 | | | 10,855 | | | | 11,969,406 | |
Oasis Petroleum, Inc., 6.50%, 11/01/21(f)(i) | | | 1,547 | | | | 340,340 | |
Odebrecht Offshore Drilling Finance Ltd. | | | | | | | | |
6.72%, 12/01/22(b) | | | 746 | | | | 670,765 | |
(7.72% Cash or 7.72% PIK), 7.72%, 12/01/26(b)(n) | | | 42 | | | | 4,077 | |
Odebrecht Oil & Gas Finance Ltd.,
0.00%(b)(l)(m) | | | 193 | | | | 193 | |
Parsley Energy LLC/Parsley Finance Corp., 5.63%, 10/15/27(b) | | | 643 | | | | 639,785 | |
PBF Holding Co. LLC/PBF Finance Corp., 9.25%, 05/15/25(b) | | | 5,440 | | | | 5,576,109 | |
Pioneer Natural Resources Co., 1.90%, 08/15/30 . | | | 4,712 | | | | 4,419,483 | |
PTTEP Treasury Center Co. Ltd., 2.59%, 06/10/27(b) | | | 490 | | | | 506,685 | |
Puma International Financing SA | | | | | | | | |
5.13%, 10/06/24(b) | | | 2,888 | | | | 2,555,878 | |
5.00%, 01/24/26(b) | | | 1,709 | | | | 1,427,549 | |
QEP Resources, Inc., 5.25%, 05/01/23 | | | 925 | | | | 672,938 | |
Sabine Pass Liquefaction LLC | | | | | | | | |
5.63%, 04/15/23 | | | 6,227 | | | | 6,820,869 | |
5.75%, 05/15/24 | | | 16,871 | | | | 19,106,033 | |
5.63%, 03/01/25 | | | 34,953 | | | | 39,980,650 | |
5.88%, 06/30/26 | | | 11,384 | | | | 13,461,514 | |
4.20%, 03/15/28 | | | 5,555 | | | | 6,032,205 | |
Shelf Drilling Holdings Ltd., 8.50%, 11/15/24(c) | | | 10,789 | | | | 8,631,200 | |
SM Energy Co. | | | | | | | | |
1.50%, 07/01/21(j) | | | 5,224 | | | | 4,796,004 | |
10.00%, 01/15/25(b) | | | 6,246 | | | | 5,933,700 | |
Suncor Energy, Inc. | | | | | | | | |
6.80%, 05/15/38(o) | | | 1,859 | | | | 2,431,813 | |
6.50%, 06/15/38 | | | 1,163 | | | | 1,488,975 | |
6.85%, 06/01/39 | | | 1,848 | | | | 2,422,205 | |
Sunoco Logistics Partners Operations LP | | | | | | | | |
4.25%, 04/01/24 | | | 11,234 | | | | 11,796,104 | |
5.95%, 12/01/25 | | | 2,980 | | | | 3,401,774 | |
Sunoco LP/Sunoco Finance Corp. | | | | | | | | |
4.88%, 01/15/23 | | | 1,721 | | | | 1,729,605 | |
5.50%, 02/15/26 | | | 1,394 | | | | 1,392,258 | |
6.00%, 04/15/27 | | | 1,057 | | | | 1,086,068 | |
Talos Production LLC/Talos Production Finance, Inc., 11.00%, 04/03/22 | | | 5,130 | | | | 4,873,500 | |
Targa Resources Partners LP/Targa Resources Partners Finance Corp. | | | | | | | | |
5.13%, 02/01/25 | | | 1,818 | | | | 1,813,455 | |
5.88%, 04/15/26 | | | 2,941 | | | | 3,019,525 | |
5.38%, 02/01/27 | | | 1,690 | | | | 1,699,498 | |
6.50%, 07/15/27 | | | 3,372 | | | | 3,515,310 | |
| | | | | | | | |
| Security | | Par (000) | | | Value | |
|
| Oil, Gas & Consumable Fuels (continued) | |
Targa Resources Partners LP/Targa Resources Partners Finance Corp. | | | | | | | | |
5.00%, 01/15/28 | | USD | 448 | | | $ | 436,800 | |
6.88%, 01/15/29 | | | 2,717 | | | | 2,906,375 | |
5.50%, 03/01/30(b) | | | 597 | | | | 597,627 | |
Texas Eastern Transmission LP | | | | | | | | |
3.50%, 01/15/28(b) | | | 4,737 | | | | 5,119,932 | |
4.15%, 01/15/48(b) | | | 3,170 | | | | 3,385,344 | |
Thaioil Treasury Center Co. Ltd., 3.75%, 06/18/50 | | | 2,470 | | | | 2,344,184 | |
TransCanada PipeLines Ltd. | | | | | | | | |
4.63%, 03/01/34 | | | 2,905 | | | | 3,430,621 | |
5.85%, 03/15/36 | | | 1,026 | | | | 1,342,000 | |
Transcontinental Gas Pipe Line Co. LLC | | | | | | | | |
7.85%, 02/01/26 | | | 6,627 | | | | 8,580,013 | |
4.00%, 03/15/28 | | | 6,240 | | | | 6,967,600 | |
4.60%, 03/15/48 | | | 3,414 | | | | 3,903,724 | |
3.95%, 05/15/50(b) | | | 5,137 | | | | 5,392,237 | |
Western Midstream Operating LP, (3 mo. LIBOR US + 0.85%), 2.12%, 01/13/23(a) | | | 4,291 | | | | 3,990,630 | |
Williams Cos., Inc., 7.50%, 01/15/31 | | | 2,180 | | | | 2,871,631 | |
WPX Energy, Inc. | | | | | | | | |
8.25%, 08/01/23 | | | 375 | | | | 423,750 | |
5.88%, 06/15/28 | | | 558 | | | | 583,110 | |
Yankuang Group Cayman Ltd., 4.75%, 11/30/20 | | | 770 | | | | 771,902 | |
| | | | | | | | |
| | |
| | | | | | | 591,528,497 | |
|
| Paper & Forest Products — 0.1% | |
Celulosa Arauco y Constitucion SA, 4.25%, 04/30/29(b) | | | 1,802 | | | | 1,919,130 | |
Georgia-Pacific LLC | | | | | | | | |
3.73%, 07/15/23(b) | | | 3,907 | | | | 4,206,387 | |
1.75%, 09/30/25(b) | | | 3,780 | | | | 3,940,121 | |
7.38%, 12/01/25 | | | 3,288 | | | | 4,249,234 | |
2.10%, 04/30/27(b) | | | 2,870 | | | | 3,013,694 | |
7.75%, 11/15/29 | | | 1,275 | | | | 1,906,164 | |
2.30%, 04/30/30(b) | | | 4,364 | | | | 4,630,568 | |
8.88%, 05/15/31 | | | 528 | | | | 853,592 | |
Inversiones CMPC SA, 4.38%, 05/15/23(b) | | | 827 | | | | 876,878 | |
Suzano Austria GmbH, 3.75%, 01/15/31 | | | 800 | | | | 799,200 | |
| | | | | | | | |
| | |
| | | | | | | 26,394,968 | |
|
| Pharmaceuticals — 0.8% | |
Allergan Funding SCS, 3.45%, 03/15/22 | | | 14,735 | | | | 15,008,843 | |
AstraZeneca PLC, 1.38%, 08/06/30 | | | 14,424 | | | | 14,030,157 | |
Bausch Health Americas, Inc. | | | | | | | | |
9.25%, 04/01/26(b) | | | 3,933 | | | | 4,326,300 | |
8.50%, 01/31/27(b) | | | 4,589 | | | | 5,042,164 | |
Bausch Health Cos., Inc. | | | | | | | | |
5.50%, 11/01/25(b) | | | 4,757 | | | | 4,881,871 | |
9.00%, 12/15/25(b) | | | 3,992 | | | | 4,342,498 | |
5.75%, 08/15/27(b) | | | 1,865 | | | | 1,979,231 | |
7.00%, 01/15/28(b) | | | 1,897 | | | | 2,010,820 | |
7.25%, 05/30/29(b) | | | 1,961 | | | | 2,112,978 | |
Bayer U.S. Finance II LLC | | | | | | | | |
2.85%, 04/15/25(b) | | | 2,800 | | | | 2,874,375 | |
4.38%, 12/15/28(b) | | | 6,176 | | | | 7,251,809 | |
3.60%, 07/15/42(b) | | | 2,845 | | | | 2,738,113 | |
Bristol-Myers Squibb Co., 4.55%, 02/20/48 | | | 3,279 | | | | 4,434,493 | |
Eli Lilly & Co., 1.70%, 11/01/49 | | EUR | 3,400 | | | | 4,329,665 | |
Horizon Therapeutics USA, Inc., 5.50%, 08/01/27(b) | | USD | 358 | | | | 379,928 | |
Johnson & Johnson, 3.70%, 03/01/46 | | | 2,341 | | | | 2,930,268 | |
Luye Pharma Group Ltd.,
1.50%, 07/09/24(j) | | | 900 | | | | 882,110 | |
| | |
| 84 | | 2 0 2 0 B L A C K R O C K A N N U A L R E P O R T T O S H A R E H O L D E R S |
| | |
Schedule of Investments (continued) September 30, 2020 | | Master Total Return Portfolio (Percentages shown are based on Net Assets) |
| | | | | | | | |
| Security | | Par (000) | | | Value | |
|
| Pharmaceuticals (continued) | |
Merck & Co., Inc. | | | | | | | | |
3.40%, 03/07/29 | | USD | 4,691 | | | $ | 5,465,357 | |
1.45%, 06/24/30 | | | 6,258 | | | | 6,345,518 | |
Pfizer, Inc. | | | | | | | | |
3.45%, 03/15/29 | | | 8,145 | | | | 9,535,313 | |
1.70%, 05/28/30 | | | 2,919 | | | | 3,008,272 | |
Pharmacia LLC, 6.60%, 12/01/28 | | | 2,164 | | | | 3,001,543 | |
Shire Acquisitions Investments Ireland DAC | | | | | | | | |
2.88%, 09/23/23 | | | 4,400 | | | | 4,663,780 | |
3.20%, 09/23/26 | | | 4,497 | | | | 5,000,319 | |
Sino Biopharmaceutical Ltd., 0.00%, 02/17/25(j)(m) | | EUR | 924 | | | | 1,051,166 | |
Takeda Pharmaceutical Co. Ltd. | | | | | | | | |
5.00%, 11/26/28 | | USD | 8,445 | | | | 10,496,214 | |
2.05%, 03/31/30 | | | 2,809 | | | | 2,836,654 | |
2.00%, 07/09/40 | | EUR | 10,410 | | | | 12,927,435 | |
Wyeth LLC, 5.95%, 04/01/37 | | USD | 6,252 | | | | 9,270,446 | |
| | | | | | | | |
| | |
| | | | | | | 153,157,640 | |
| | |
| Professional Services — 0.0% | | | | | | |
Equifax, Inc., 3.10%, 05/15/30 | | | 3,905 | | | | 4,254,344 | |
| | | | | | | | |
|
| Real Estate Management & Development — 0.4% | |
Agile Group Holdings Ltd. | | | | | | | | |
(5 yr. U.S. Treasury Yield Curve Rate T Note Constant Maturity + 11.29%), 7.88%, (k)(l) | | | 200 | | | | 202,500 | |
6.70%, 03/07/22 | | | 236 | | | | 241,605 | |
5.75%, 01/02/25 | | | 650 | | | | 637,000 | |
Arrow Bidco LLC, 9.50%, 03/15/24(b) | | | 2,177 | | | | 1,806,910 | |
Central China Real Estate Ltd. | | | | | | | | |
6.88%, 10/23/20 | | | 500 | | | | 500,000 | |
6.50%, 03/05/21 | | | 260 | | | | 260,003 | |
6.75%, 11/08/21 | | | 435 | | | | 436,823 | |
7.25%, 04/24/23 | | | 200 | | | | 200,500 | |
7.65%, 08/27/23 | | | 200 | | | | 200,761 | |
7.25%, 07/16/24 | | | 320 | | | | 311,200 | |
7.25%, 08/13/24 | | | 350 | | | | 338,625 | |
CFLD Cayman Investment Ltd. | | | | | | | | |
8.63%, 02/28/21 | | | 581 | | | | 581,000 | |
6.90%, 01/13/23 | | | 650 | | | | 614,250 | |
8.60%, 04/08/24 | | | 719 | | | | 665,749 | |
China Aoyuan Group Ltd. | | | | | | | | |
4.80%, 02/18/21 | | | 800 | | | | 798,000 | |
7.95%, 02/19/23 | | | 1,765 | | | | 1,826,775 | |
6.35%, 02/08/24 | | | 1,100 | | | | 1,091,750 | |
China Evergrande Group | | | | | | | | |
9.50%, 04/11/22 | | | 200 | | | | 180,000 | |
11.50%, 01/22/23 | | | 400 | | | | 354,625 | |
4.25%, 02/14/23(j) | | HKD | 28,000 | | | | 3,357,980 | |
10.00%, 04/11/23 | | USD | 400 | | | | 338,000 | |
7.50%, 06/28/23 | | | 400 | | | | 318,250 | |
12.00%, 01/22/24 | | | 900 | | | | 789,187 | |
10.50%, 04/11/24 | | | 200 | | | | 160,500 | |
China SCE Group Holdings Ltd. | | | | | | | | |
7.25%, 04/19/23 | | | 1,000 | | | | 1,015,312 | |
7.38%, 04/09/24 | | | 636 | | | | 641,366 | |
CIFI Holdings Group Co. Ltd. | | | | | | | | |
6.45%, 11/07/24 | | | 200 | | | | 204,500 | |
6.00%, 07/16/25 | | | 200 | | | | 201,625 | |
5.95%, 10/20/25 | | | 800 | | | | 802,750 | |
Country Garden Holdings Co. Ltd. | | | | | | | | |
6.50%, 04/08/24 | | | 200 | | | | 215,563 | |
5.40%, 05/27/25 | | | 965 | | | | 1,037,073 | |
6.15%, 09/17/25 | | | 200 | | | | 221,750 | |
| | | | | | | | |
| Security | | Par (000) | | | Value | |
|
| Real Estate Management & Development (continued) | |
Esic Sukuk Ltd., 3.94%, 07/30/24 | | USD | 1,500 | | | $ | 1,506,562 | |
Fantasia Holdings Group Co. Ltd. | | | | | | | | |
8.38%, 03/08/21 | | | 510 | | | | 506,972 | |
11.75%, 04/17/22 | | | 230 | | | | 235,606 | |
7.95%, 07/05/22 | | | 530 | | | | 509,959 | |
12.25%, 10/18/22 | | | 200 | | | | 205,500 | |
10.88%, 01/09/23 | | | 200 | | | | 199,813 | |
Five Point Operating Co. LP/Five Point Capital Corp., 7.88%, 11/15/25(b) | | | 4,330 | | | | 4,327,835 | |
Forestar Group, Inc. | | | | | | | | |
8.00%, 04/15/24(b) | | | 9,456 | | | | 9,999,720 | |
5.00%, 03/01/28(b) | | | 3,502 | | | | 3,537,020 | |
Future Land Development Holdings Ltd., 7.50%, 01/22/21 | | | 700 | | | | 703,281 | |
Gemdale Ever Prosperity Investment Ltd., 5.60%, 06/14/22 | | | 200 | | | | 205,491 | |
Global Prime Capital Pte Ltd., 5.95%, 01/23/25 | | | 451 | | | | 436,202 | |
Greenland Global Investment Ltd., 5.60%, 11/13/22 | | | 200 | | | | 193,737 | |
Hopson Capital International Group Co. Ltd., 6.00%, 02/17/21 | | | 800 | | | | 797,000 | |
Hopson Development Holdings Ltd., 7.50%, 06/27/22 | | | 400 | | | | 399,000 | |
Howard Hughes Corp. | | | | | | | | |
5.38%, 03/15/25(b) | | | 4,211 | | | | 4,278,797 | |
5.38%, 08/01/28(b) | | | 4,396 | | | | 4,393,758 | |
Jingrui Holdings Ltd., 9.45%, 04/23/21 | | | 700 | | | | 686,219 | |
Kaisa Group Holdings Ltd. | | | | | | | | |
6.75%, 02/18/21 | | | 555 | | | | 550,837 | |
8.50%, 06/30/22 | | | 254 | | | | 248,523 | |
11.95%, 10/22/22 | | | 900 | | | | 929,250 | |
11.50%, 01/30/23 | | | 200 | | | | 203,813 | |
10.88%, 07/23/23 | | | 200 | | | | 198,500 | |
11.95%, 11/12/23 | | | 215 | | | | 220,375 | |
9.38%, 06/30/24 | | | 500 | | | | 469,375 | |
KWG Group Holdings Ltd. | | | | | | | | |
7.88%, 09/01/23 | | | 486 | | | | 499,365 | |
7.40%, 03/05/24 | | | 200 | | | | 205,563 | |
5.95%, 08/10/25 | | | 614 | | | | 598,650 | |
Logan Group Co. Ltd., 5.75%, 01/14/25 | | | 436 | | | | 437,362 | |
Logan Property Holdings Co. Ltd., 6.50%, 07/16/23 | | | 200 | | | | 203,688 | |
Longfor Group Holdings Ltd., 3.95%, 09/16/29 | | | 620 | | | | 660,300 | |
MAF Global Securities Ltd., 4.75%, 05/07/24 | | | 1,073 | | | | 1,141,404 | |
New Metro Global Ltd., 6.80%, 08/05/23 | | | 400 | | | | 406,000 | |
No Va Land Investment Group Corp., 5.50%, 04/27/23(j) | | | 1,285 | | | | 1,304,001 | |
NWD MTN Ltd., 4.13%, 07/18/29 | | | 1,200 | | | | 1,214,625 | |
Powerlong Real Estate Holdings Ltd. | | | | | | | | |
7.13%, 11/08/22 | | | 620 | | | | 638,600 | |
6.95%, 07/23/23 | | | 200 | | | | 204,000 | |
Realogy Group LLC/Realogy Co-Issuer Corp., 9.38%, 04/01/27(b) | | | 410 | | | | 424,432 | |
Redsun Properties Group Ltd. | | | | | | | | |
11.50%, 03/04/21 | | | 800 | | | | 814,000 | |
10.50%, 10/03/22 | | | 600 | | | | 617,062 | |
RKPF Overseas 2019 A Ltd., 6.00%, 09/04/25 | | | 595 | | | | 590,537 | |
Ronshine China Holdings Ltd. | | | | | | | | |
11.25%, 08/22/21 | | | 265 | | | | 275,600 | |
8.75%, 10/25/22 | | | 730 | | | | 742,775 | |
7.35%, 12/15/23 | | | 466 | | | | 454,615 | |
| | |
S C H E D U L E O F I N V E S T M E N T S | | 85 |
| | |
Schedule of Investments (continued) September 30, 2020 | | Master Total Return Portfolio (Percentages shown are based on Net Assets) |
| | | | | | | | |
| Security | | Par (000) | | | Value | |
|
| Real Estate Management & Development (continued) | |
Scenery Journey Ltd. | | | | | | | | |
11.50%, 10/24/22 | | USD | 665 | | | $ | 601,825 | |
12.00%, 10/24/23 | | | 800 | | | | 695,791 | |
Seazen Group Ltd. | | | | | | | | |
6.45%, 06/11/22 | | | 200 | | | | 202,491 | |
6.00%, 08/12/24 | | | 400 | | | | 398,000 | |
Shimao Group Holdings Ltd. | | | | | | | | |
5.60%, 07/15/26 | | | 200 | | | | 218,563 | |
4.60%, 07/13/30 | | | 1,263 | | | | 1,326,150 | |
Shui On Development Holding Ltd. | | | | | | | | |
5.75%, 11/12/23 | | | 300 | | | | 299,250 | |
6.15%, 08/24/24 | | | 580 | | | | 580,000 | |
Sunac China Holdings Ltd. | | | | | | | | |
8.35%, 04/19/23 | | | 200 | | | | 203,688 | |
7.95%, 10/11/23 | | | 200 | | | | 201,688 | |
7.50%, 02/01/24 | | | 200 | | | | 200,700 | |
6.65%, 08/03/24 | | | 700 | | | | 673,703 | |
7.00%, 07/09/25 | | | 302 | | | | 291,415 | |
Theta Capital Pte Ltd., 8.13%, 01/22/25 | | | 300 | | | | 262,313 | |
Times China Holdings Ltd. | | | | | | | | |
5.75%, 04/26/22 | | | 500 | | | | 499,170 | |
6.75%, 07/16/23 | | | 295 | | | | 301,361 | |
Vanke Real Estate Hong Kong Co. Ltd., 3.15%, 05/12/25 | | | 1,650 | | | | 1,720,641 | |
Wanda Group Overseas Ltd., 7.50%, 07/24/22 | | | 840 | | | | 809,550 | |
Yango Justice International Ltd. | | | | | | | | |
6.80%, 03/11/21 | | | 795 | | | | 793,012 | |
9.25%, 04/15/23 | | | 600 | | | | 615,937 | |
8.25%, 11/25/23 | | | 400 | | | | 400,375 | |
Yanlord Land HK Co. Ltd. | | | | | | | | |
6.75%, 04/23/23 | | | 200 | | | | 206,813 | |
6.80%, 02/27/24 | | | 680 | | | | 712,300 | |
Yuzhou Properties Co. Ltd. | | | | | | | | |
8.50%, 02/04/23 | | | 200 | | | | 208,688 | |
6.00%, 10/25/23 | | | 620 | | | | 614,575 | |
8.50%, 02/26/24 | | | 900 | | | | 933,187 | |
8.38%, 10/30/24 | | | 200 | | | | 206,813 | |
Zhenro Properties Group Ltd. | | | | | | | | |
5.60%, 02/28/21 | | | 325 | | | | 324,187 | |
9.15%, 05/06/23 | | | 910 | | | | 943,272 | |
8.30%, 09/15/23 | | | 200 | | | | 202,749 | |
| | | | | | | | |
| | |
| | | | | | | 83,575,863 | |
| | |
| Road & Rail — 0.7% | | | | | | |
Burlington Northern Santa Fe LLC | | | | | | | | |
5.75%, 05/01/40 | | | 4,135 | | | | 5,975,116 | |
5.05%, 03/01/41 | | | 399 | | | | 538,179 | |
4.40%, 03/15/42 | | | 4,271 | | | | 5,360,320 | |
CMB International Leasing Management Ltd., 2.75%, 08/12/30 | | | 1,150 | | | | 1,126,560 | |
CSX Corp. | | | | | | | | |
4.25%, 03/15/29 | | | 3,216 | | | | 3,867,872 | |
6.15%, 05/01/37 | | | 75 | | | | 108,953 | |
5.50%, 04/15/41 | | | 285 | | | | 388,904 | |
4.10%, 03/15/44 | | | 1,488 | | | | 1,785,629 | |
4.30%, 03/01/48 | | | 7,631 | | | | 9,504,803 | |
4.75%, 11/15/48 | | | 3,141 | | | | 4,169,948 | |
4.50%, 03/15/49 | | | 1,303 | | | | 1,698,916 | |
4.25%, 11/01/66 | | | 1,775 | | | | 2,201,725 | |
Norfolk Southern Corp. | | | | | | | | |
3.65%, 08/01/25 | | | 3,515 | | | | 3,953,292 | |
2.90%, 06/15/26 | | | 6,045 | | | | 6,672,663 | |
2.55%, 11/01/29 | | | 365 | | | | 396,988 | |
| | | | | | | | |
| Security | | Par (000) | | | Value | |
|
| Road & Rail (continued) | |
Norfolk Southern Corp. | | | | | | | | |
4.84%, 10/01/41 | | USD | 455 | | | $ | 597,548 | |
4.45%, 06/15/45 | | | 35 | | | | 44,402 | |
3.40%, 11/01/49 | | | 1,244 | | | | 1,378,002 | |
4.05%, 08/15/52 | | | 6,058 | | | | 7,423,774 | |
Penske Truck Leasing Co. LP/PTL Finance Corp. | | | | | | | | |
4.25%, 01/17/23(b) | | | 2,565 | | | | 2,760,428 | |
2.70%, 03/14/23(b) | | | 3,425 | | | | 3,565,425 | |
2.70%, 11/01/24(b) | | | 1,580 | | | | 1,676,331 | |
3.95%, 03/10/25(b) | | | 2,210 | | | | 2,458,344 | |
4.00%, 07/15/25(b) | | | 6,435 | | | | 7,249,212 | |
4.45%, 01/29/26(b) | | | 950 | | | | 1,087,414 | |
3.40%, 11/15/26(b) | | | 839 | | | | 918,184 | |
3.35%, 11/01/29(b) | | | 930 | | | | 988,696 | |
Ryder System, Inc. | | | | | | | | |
2.50%, 09/01/22 | | | 345 | | | | 356,150 | |
2.50%, 09/01/24 | | | 3,710 | | | | 3,899,170 | |
4.63%, 06/01/25 | | | 17,920 | | | | 20,592,463 | |
Union Pacific Corp. | | | | | | | | |
3.25%, 08/15/25 | | | 4,144 | | | | 4,601,664 | |
2.75%, 03/01/26 | | | 4,737 | | | | 5,194,740 | |
3.38%, 02/01/35 | | | 2,074 | | | | 2,399,248 | |
3.60%, 09/15/37 | | | 4,179 | | | | 4,830,153 | |
3.95%, 08/15/59 | | | 2,134 | | | | 2,490,404 | |
3.84%, 03/20/60 | | | 6,449 | | | | 7,481,025 | |
3.75%, 02/05/70 | | | 700 | | | | 790,293 | |
Union Pacific Railroad Co. Pass-Through Trust, Series 2014-1, 3.23%, 05/14/26 | | | 2,583 | | | | 2,865,834 | |
| | | | | | | | |
| | |
| | | | | | | 133,398,772 | |
|
| Semiconductors & Semiconductor Equipment — 1.2% | |
Analog Devices, Inc., 3.50%, 12/05/26 | | | 1,332 | | | | 1,507,089 | |
Applied Materials, Inc., 2.75%, 06/01/50 | | | 6,670 | | | | 7,009,792 | |
Broadcom Corp./Broadcom Cayman Finance Ltd. | | | | | | | | |
3.13%, 01/15/25 | | | 2,971 | | | | 3,164,869 | |
3.88%, 01/15/27 | | | 24,486 | | | | 27,128,165 | |
Broadcom, Inc. | | | | | | | | |
2.25%, 11/15/23 | | | 10,401 | | | | 10,813,366 | |
3.63%, 10/15/24 | | | 3,113 | | | | 3,394,336 | |
4.70%, 04/15/25 | | | 21,345 | | | | 24,254,591 | |
4.25%, 04/15/26 | | | 21,377 | | | | 24,083,778 | |
4.11%, 09/15/28 | | | 5,190 | | | | 5,853,018 | |
4.15%, 11/15/30 | | | 3,866 | | | | 4,342,847 | |
Intel Corp. | | | | | | | | |
4.10%, 05/19/46 | | | 273 | | | | 340,739 | |
3.73%, 12/08/47 | | | 83 | | | | 99,121 | |
4.75%, 03/25/50 | | | 7,044 | | | | 9,700,434 | |
KLA Corp. | | | | | | | | |
4.10%, 03/15/29 | | | 7,170 | | | | 8,604,951 | |
5.00%, 03/15/49 | | | 980 | | | | 1,308,747 | |
3.30%, 03/01/50 | | | 11,466 | | | | 12,114,077 | |
Lam Research Corp. | | | | | | | | |
3.75%, 03/15/26 | | | 7,638 | | | | 8,762,557 | |
1.90%, 06/15/30 | | | 2,535 | | | | 2,630,323 | |
4.88%, 03/15/49 | | | 2,870 | | | | 4,062,384 | |
2.88%, 06/15/50 | | | 3,261 | | | | 3,371,186 | |
3.13%, 06/15/60 | | | 1,024 | | | | 1,096,661 | |
NVIDIA Corp. | | | | | | | | |
3.20%, 09/16/26 | | | 6,970 | | | | 7,861,983 | |
2.85%, 04/01/30 | | | 12,173 | | | | 13,676,442 | |
3.50%, 04/01/50 | | | 6,241 | | | | 7,303,712 | |
NXP BV/NXP Funding LLC 4.63%, 06/01/23(b) | | | 8,885 | | | | 9,717,063 | |
| | |
| 86 | | 2 0 2 0 B L A C K R O C K A N N U A L R E P O R T T O S H A R E H O L D E R S |
| | |
Schedule of Investments (continued) September 30, 2020 | | Master Total Return Portfolio (Percentages shown are based on Net Assets) |
| | | | | | | | |
| Security | | Par (000) | | | Value | |
|
| Semiconductors & Semiconductor Equipment (continued) | |
NXP BV/NXP Funding LLC 5.55%, 12/01/28(b) | | USD | 2,008 | | | $ | 2,483,344 | |
NXP BV/NXP Funding LLC/NXP USA, Inc. | | | | | | | | |
3.15%, 05/01/27(b) | | | 65 | | | | 70,252 | |
4.30%, 06/18/29(b)(g) | | | 6,513 | | | | 7,507,735 | |
3.40%, 05/01/30(b) | | | 13,258 | | | | 14,513,648 | |
QUALCOMM, Inc. | | | | | | | | |
4.80%, 05/20/45 | | | 4,845 | | | | 6,538,682 | |
4.30%, 05/20/47 | | | 3,969 | | | | 5,098,197 | |
Rohm Co. Ltd., 0.00%, 12/05/24(j)(m) | | JPY | 30,000 | | | | 294,410 | |
Texas Instruments, Inc., 1.75%, 05/04/30 | | USD | 1,423 | | | | 1,467,793 | |
| | | | | | | | |
| | |
| | | | | | | 240,176,292 | |
| | |
| Software — 0.5% | | | | | | |
Activision Blizzard, Inc. | | | | | | | | |
1.35%, 09/15/30 | | | 4,271 | | | | 4,175,091 | |
2.50%, 09/15/50 | | | 4,950 | | | | 4,612,640 | |
Autodesk, Inc. | | | | | | | | |
4.38%, 06/15/25 | | | 405 | | | | 464,640 | |
3.50%, 06/15/27 | | | 13,495 | | | | 15,309,520 | |
Microsoft Corp. | | | | | | | | |
4.20%, 11/03/35 | | | 169 | | | | 221,922 | |
3.45%, 08/08/36 | | | 817 | | | | 991,394 | |
4.10%, 02/06/37 | | | 3,621 | | | | 4,694,309 | |
3.75%, 02/12/45 | | | 2,586 | | | | 3,246,588 | |
3.70%, 08/08/46 | | | 8,202 | | | | 10,299,240 | |
2.53%, 06/01/50 | | | 4,735 | | | | 4,951,953 | |
Oracle Corp. | | | | | | | | |
3.90%, 05/15/35 | | | 9,232 | | | | 11,230,638 | |
3.85%, 07/15/36 | | | 1,295 | | | | 1,530,086 | |
3.80%, 11/15/37 | | | 6,303 | | | | 7,394,738 | |
3.60%, 04/01/40 | | | 5,518 | | | | 6,320,717 | |
5.38%, 07/15/40 | | | 2,370 | | | | 3,305,517 | |
4.13%, 05/15/45 | | | 4,119 | | | | 4,913,279 | |
4.00%, 07/15/46 | | | 705 | | | | 835,658 | |
3.60%, 04/01/50 | | | 20,529 | | | | 23,139,657 | |
| | | | | | | | |
| | |
| | | | | | | 107,637,587 | |
|
| Specialty Retail — 0.2% | |
Home Depot, Inc., 2.95%, 06/15/29 | | | 18,514 | | | | 20,903,811 | |
L Brands, Inc., 6.63%, 10/01/30(b) | | | 731 | | | | 743,793 | |
Lowe’s Cos., Inc. | | | | | | | | |
4.00%, 04/15/25 | | | 13,350 | | | | 15,149,249 | |
4.38%, 09/15/45 | | | 1,553 | | | | 1,914,745 | |
4.05%, 05/03/47 | | | 2,419 | | | | 2,892,683 | |
4.55%, 04/05/49 | | | 1,762 | | | | 2,260,942 | |
| | | | | | | | |
| | |
| | | | | | | 43,865,223 | |
|
| Technology Hardware, Storage & Peripherals — 0.5% | |
Apple Inc. | | | | | | | | |
3.85%, 05/04/43 | | | 11,059 | | | | 13,786,855 | |
3.45%, 02/09/45 | | | 5,020 | | | | 5,860,636 | |
2.55%, 08/20/60 | | | 6,900 | | | | 6,854,480 | |
Dell International LLC/EMC Corp. | | | | | | | | |
6.02%, 06/15/26(b) | | | 335 | | | | 393,350 | |
4.90%, 10/01/26(b) | | | 4,377 | | | | 4,947,860 | |
8.10%, 07/15/36(b) | | | 7,500 | | | | 9,862,787 | |
Hewlett Packard Enterprise Co. | | | | | | | | |
4.40%, 10/15/22 | | | 20,602 | | | | 22,015,772 | |
4.65%, 10/01/24 | | | 22,290 | | | | 25,205,532 | |
HP, Inc., 6.00%, 09/15/41 | | | 285 | | | | 349,361 | |
Innolux Corp., Series
1, 0.00%, 01/22/25(j)(m) | | | 800 | | | | 868,390 | |
Seagate HDD Cayman,
4.09%, 06/01/29(b) | | | 3,217 | | | | 3,499,336 | |
| | | | | | | | |
| | |
| | | | | | | 93,644,359 | |
| | | | | | | | |
| Security | | Par (000) | | | Value | |
|
| Textiles, Apparel & Luxury Goods — 0.1% | |
Hanesbrands, Inc. | | | | | | | | |
4.63%, 05/15/24(b) | | USD | 3,828 | | | $ | 3,980,316 | |
4.88%, 05/15/26(b) | | | 537 | | | | 573,247 | |
NIKE, Inc., 2.75%, 03/27/27 | | | 10,798 | | | | 12,009,649 | |
Under Armour, Inc., 3.25%, 06/15/26 | | | 358 | | | | 337,415 | |
William Carter Co., 5.63%, 03/15/27(b) | | | 1,700 | | | | 1,774,375 | |
| | | | | | | | |
| | |
| | | | | | | 18,675,002 | |
|
| Thrifts & Mortgage Finance — 0.0% | |
Mongolian Mortgage Corp. Hfc LLC, 9.75%, 01/29/22 | | | 800 | | | | 773,750 | |
Nationstar Mortgage Holdings, Inc., 9.13%, 07/15/26(b) | | | 5,946 | | | | 6,377,085 | |
| | | | | | | | |
| | |
| | | | | | | 7,150,835 | |
| | |
| Tobacco — 0.5% | | | | | | |
Altria Group, Inc. | | | | | | | | |
4.00%, 01/31/24 | | | 5,847 | | | | 6,429,938 | |
4.40%, 02/14/26 | | | 8,822 | | | | 10,190,848 | |
4.80%, 02/14/29 | | | 5,450 | | | | 6,466,941 | |
3.13%, 06/15/31 | | EUR | 8,450 | | | | 11,312,108 | |
5.80%, 02/14/39 | | USD | 12,869 | | | | 16,468,612 | |
BAT Capital Corp. | | | | | | | | |
4.91%, 04/02/30 | | | 3,175 | | | | 3,744,714 | |
4.54%, 08/15/47 | | | 4,377 | | | | 4,687,216 | |
5.28%, 04/02/50 | | | 1,965 | | | | 2,309,399 | |
Philip Morris International, Inc., 1.45%, 08/01/39 | | EUR | 11,250 | | | | 13,033,834 | |
Reynolds American, Inc. | | | | | | | | |
4.45%, 06/12/25 | | USD | 9,839 | | | | 11,072,204 | |
5.85%, 08/15/45 | | | 11,857 | | | | 14,407,970 | |
| | | | | | | | |
| | |
| | | | | | | 100,123,784 | |
|
| Trading Companies & Distributors — 0.2% | |
American Builders & Contractors Supply Co., Inc. | | | | | | | | |
5.88%, 05/15/26(b) | | | 1,723 | | | | 1,787,613 | |
4.00%, 01/15/28(b) | | | 2,286 | | | | 2,323,147 | |
Beacon Roofing Supply, Inc., 4.88%, 11/01/25(b) | | | 3,424 | | | | 3,355,520 | |
H&E Equipment Services, Inc., 5.63%, 09/01/25 | | | 5,888 | | | | 6,138,240 | |
HD Supply, Inc., 5.38%, 10/15/26(b) | | | 2,094 | | | | 2,190,408 | |
Herc Holdings, Inc., 5.50%, 07/15/27(b) | | | 3,403 | | | | 3,520,914 | |
United Rentals North America, Inc. | | | | | | | | |
4.63%, 10/15/25 | | | 2,451 | | | | 2,506,147 | |
5.88%, 09/15/26 | | | 3,421 | | | | 3,604,879 | |
5.50%, 05/15/27 | | | 3,428 | | | | 3,637,965 | |
3.88%, 11/15/27 | | | 4,513 | | | | 4,648,390 | |
4.88%, 01/15/28 | | | 7,036 | | | | 7,387,800 | |
5.25%, 01/15/30 | | | 448 | | | | 488,880 | |
| | | | | | | | |
| | |
| | | | | | | 41,589,903 | |
|
| Transportation Infrastructure — 0.0% | |
Adani Ports & Special Economic Zone Ltd., 4.00%, 07/30/27 | | | 203 | | | | 202,493 | |
Delhi International Airport Ltd., 6.13%, 10/31/26 | | | 300 | | | | 302,194 | |
Rumo Luxembourg S.a.r.l, 5.88%, 01/18/25(b) | | | 728 | | | | 762,352 | |
| | | | | | | | |
| | |
| | | | | | | 1,267,039 | |
|
| Wireless Telecommunication Services — 0.6% | |
America Movil SAB de CV, 2.88%, 05/07/30 | | | 5,957 | | | | 6,444,700 | |
Bharti Airtel Ltd., 1.50%, 02/17/25(j) | | | 1,900 | | | | 2,027,809 | |
Digicel Group 0.5 Ltd. | | | | | | | | |
(7.00% Cash or 7.00% PIK),
7.00%, (b)(j)(l)(n) | | | 164 | | | | 19,690 | |
(5.00% Cash and 3.00% PIK or 8.00% PIK), 8.00%, 04/01/25(b)(n) | | | 991 | | | | 346,735 | |
Digicel Ltd., 6.75%, 03/01/23(b)(f)(i) | | | 233 | | | | 145,625 | |
Kenbourne Invest SA,
6.88%, 11/26/24(b) | | | 3,075 | | | | 3,189,351 | |
| | |
S C H E D U L E O F I N V E S T M E N T S | | 87 |
| | |
Schedule of Investments (continued) September 30, 2020 | | Master Total Return Portfolio (Percentages shown are based on Net Assets) |
| | | | | | | | |
| Security | | Par (000) | | | Value | |
|
| Wireless Telecommunication Services (continued) | |
Millicom International Cellular SA, 6.63%, 10/15/26(b) | | USD | 1,100 | | | $ | 1,179,062 | |
Sprint Corp. | | | | | | | | |
7.88%, 09/15/23 | | | 312 | | | | 358,410 | |
7.13%, 06/15/24 | | | 156 | | | | 179,495 | |
7.63%, 02/15/25 | | | 4,480 | | | | 5,241,600 | |
7.63%, 03/01/26 | | | 4,516 | | | | 5,457,067 | |
Sprint Spectrum Co. LLC/Sprint Spectrum Co. II LLC/Sprint Spectrum Co. III LLC, 3.36%, 09/20/21(b) | | | 4,129 | | | | 4,174,992 | |
T-Mobile USA, Inc. | | | | | | | | |
3.50%, 04/15/25(b) | | | 23,210 | | | | 25,468,333 | |
3.75%, 04/15/27(b) | | | 20,008 | | | | 22,451,777 | |
3.88%, 04/15/30(b) | | | 9,814 | | | | 11,135,161 | |
2.55%, 02/15/31(b) | | | 7,806 | | | | 8,076,166 | |
Vodafone Group PLC | | | | | | | | |
4.13%, 05/30/25 | | | 1,336 | | | | 1,523,426 | |
4.38%, 02/19/43 | | | 4,046 | | | | 4,703,967 | |
5.25%, 05/30/48 | | | 10,959 | | | | 14,168,041 | |
| | | | | | | | |
| | |
| | | | | | | 116,291,407 | |
| | | | | | | | |
| |
Total Corporate Bonds — 37.9%
(Cost: $7,273,695,120) | | | | 7,584,689,702 | |
| | | | | | | | |
|
Floating Rate Loan Interests(a) | |
|
| Air Freight & Logistics — 0.0% | |
XPO Logistics, Inc., Refinancing Term Loan (2018), (1 mo. LIBOR US + 2.00%, 0.00% Floor), 2.15%, 02/24/25 | | | 6,661 | | | | 6,521,405 | |
| | | | | | | | |
| | |
| Airlines — 0.1% | | | | | | |
Allegiant Travel Co., Replacement Term Loan, (3 mo. LIBOR US + 3.00%, 0.00% Floor), 3.25%, 02/05/24 | | | 14,104 | | | | 12,975,887 | |
Kestrel Bidco, Inc. (AKAWestJet Airlines), Term Loan, (3 mo. LIBOR US + 3.00%, 1.00% Floor), 4.00%, 12/11/26 | | | 14,656 | | | | 12,667,248 | |
| | | | | | | | |
| | |
| | | | | | | 25,643,135 | |
| | |
| Biotechnology — 0.0% | | | | | | |
Grifols Worldwide Operations Ltd., Dollar Tranche B Term Loan, (1 wk. LIBOR US + 2.00%, 0.00% Floor), 2.10%, 11/15/27 | | | 7,203 | | | | 7,045,692 | |
| | | | | | | | |
| | |
| Building Products — 0.0% | | | | | | |
JELD-WEN, Inc., Term B-4 Loan, (1 mo. LIBOR US + 2.00%, 0.00% Floor), 2.15%, 12/14/24 | | | 2,890 | | | | 2,804,605 | |
TAMKO Building Products LLC, Initial Term Loan, (1 mo. LIBOR US + 3.25%, 0.00% Floor), 3.40%, 05/31/26(c) | | | 3,765 | | | | 3,699,083 | |
| | | | | | | | |
| | |
| | | | | | | 6,503,688 | |
|
| Commercial Services & Supplies — 0.1% | |
621 17th Street Operating Co. LLC (633 17th Street Operating Co. LLC), Loan, (1 mo. LIBOR US + 2.90%, 0.00% Floor), 3.05%, 05/15/21(c) | | | 8,600 | | | | 7,740,000 | |
KAR Auction Services, Inc., Tranche B-6 Term Loan, (1 mo. LIBOR US + 2.25%, 0.00% Floor), 2.44%, 09/19/26(c) | | | 1,069 | | | | 1,029,233 | |
| | | | | | | | |
| | |
| | | | | | | 8,769,233 | |
| | | | | | | | |
| Security | | Par (000) | | | Value | |
|
| Construction & Engineering — 0.0% | |
Pike Corp., Initial Term Loan (2020), (1 mo. LIBOR US + 3.00%, 0.00% Floor), 3.15%, 07/24/26 | | USD | 1,414 | | | $ | 1,399,860 | |
PLH Infrastructure Services, Inc., Term Loan, (3 mo. LIBOR US + 6.00%, 0.00% Floor), 6.24%, 08/07/23(c) | | | 2,537 | | | | 2,156,486 | |
Ply Gem Midco, Inc., Initial Term Loan, (1 mo. LIBOR US + 3.75%, 0.00% Floor), 3.90%, 04/12/25 | | | 2,335 | | | | 2,287,781 | |
| | | | | | | | |
| | |
| | | | | | | 5,844,127 | |
|
| Construction Materials — 0.0% | |
Advanced Drainage Systems, Inc., Initial Term Loan, (1 mo. LIBOR US + 2.25%, 0.00% Floor), 2.44%, 09/24/26 | | | 928 | | | | 924,542 | |
| | | | | | | | |
|
| Consumer Finance — 0.0% | |
Crédito Real SAB de CV, SOFOM, ENR (Marevalley Corp.), Tranche A Loan, (3 mo. LIBOR US + 3.75%, 0.00% Floor), 4.00%, 02/21/23(c) | | | 815 | | | | 727,795 | |
| | | | | | | | |
|
| Diversified Financial Services — 0.2% | |
18 Fremont Street Acquisition LLC, Term Loan, (3 mo. LIBOR US + 8.00%, 1.50% Floor), 9.50%, 08/09/25 | | | 12,000 | | | | 10,800,246 | |
BSREP II Houston Office 1HC Owner LLC, Mezzanine Loan, (1 mo. LIBOR US + 2.10%, 0.00% Floor), 2.26%, 01/09/21(c) | | | 10,813 | | | | 10,766,218 | |
Connect Finco S.a.r.l (AKA Inmarsat), Initial Term Loan, (1 mo. LIBOR US + 4.50%, 1.00% Floor), 5.50%, 12/12/26 | | | 2,522 | | | | 2,441,938 | |
Flutter Entertainment PLC, USD Term Loan, (3 mo. LIBOR US + 3.50%, 0.00% Floor), 3.72%, 07/10/25 | | | 3,251 | | | | 3,239,582 | |
Intelsat Jackson Holdings SA | | | | | | | | |
DIP Facility, (3 mo. LIBOR US + 5.50%, 1.00% Floor), 6.50%, 07/13/21 | | | 1,289 | | | | 1,309,903 | |
Tranche B-3 Term Loan, (1 mo. PRIME US + 4.75%, 1.00% Floor), 8.00%, 11/27/23 | | | 1,275 | | | | 1,279,424 | |
Tranche B-4 Term Loan, (1 mo. PRIME US + 5.50%, 1.00% Floor), 8.75%, 01/02/24 | | | 1,458 | | | | 1,467,444 | |
Pretium Mortgage Credit Partners I LP, Term Loan B1, (1 mo. LIBOR US + 2.25%, 0.00% Floor), 2.50%, 10/21/20(c) | | | 4,837 | | | | 4,812,519 | |
RNTR-1 LLC (AKA Seer Sylvan), Initial Term Loan, (1 mo. LIBOR US + 2.38%, 0.25% Floor), 2.63%, 12/20/21(c) | | | 7,528 | | | | 7,414,952 | |
| | | | | | | | |
| | |
| | | | | | | 43,532,226 | |
|
| Diversified Telecommunication Services — 0.0% | |
Cablevision Lightpath LLC, Term Loan B, 4.00%, 09/29/27 | | | 1,223 | | | | 1,215,356 | |
| | | | | | | | |
|
| Electronic Equipment, Instruments & Components — 0.0% | |
Robertshaw U.S. Holding Corp. (FKA Fox U.S. Bidco Corp.), Initial Term Loan (Second Lien), (3 mo. LIBOR US + 8.00%, 1.00% Floor), 9.00%, 02/28/26 | | | 1,795 | | | | 1,063,537 | |
| | | | | | | | |
|
| Equity Real Estate Investment Trusts (REITs) — 0.1% | |
VICI Properties 1 LLC, Term B Loan, (1 mo. LIBOR US + 1.75%, 0.00% Floor), 1.91%, 12/22/24 | | | 8,361 | | | | 8,067,884 | |
| | | | | | | | |
| | |
| 88 | | 2 0 2 0 B L A C K R O C K A N N U A L R E P O R T T O S H A R E H O L D E R S |
| | |
Schedule of Investments (continued) September 30, 2020 | | Master Total Return Portfolio (Percentages shown are based on Net Assets) |
| | | | | | | | |
| Security | | Par (000) | | | Value | |
|
| Food Products — 0.0% | |
JBS USA Lux SA (FKA JBS USA LLC), New Term Loan, (1 mo. LIBOR US + 2.00%, 0.00% Floor), 2.15%, 05/01/26 | | USD | 3,342 | | | $ | 3,246,605 | |
Shearer’s Foods LLC, Term Loan B, 4.75%, 09/23/27 | | | 992 | | | | 983,945 | |
| | | | | | | | |
| | |
| | | | | | | 4,230,550 | |
|
| Health Care Providers & Services — 0.1% | |
Acadia Healthcare Co., Inc., Tranche B-4 Term Loan, (1 mo. LIBOR US + 2.50%, 0.00% Floor), 2.65%, 02/16/23 | | | 15,068 | | | | 14,917,809 | |
Select Medical Corp., Tranche B Term Loan, (1 mo. LIBOR US + 2.50%, 0.00% Floor), 2.78%, 03/06/25 | | | 1,124 | | | | 1,091,601 | |
| | | | | | | | |
| | |
| | | | | | | 16,009,410 | |
|
| Hotels, Restaurants & Leisure — 0.3% | |
Aimbridge Acquisition Co., Inc. | | | | | | | | |
Initial Term Loan (2019) (First Lien), (1 mo. LIBOR US + 3.75%, 0.00% Floor), 3.89%, 02/01/26(c) | | | 3,914 | | | | 3,483,117 | |
Term Loan B, 6.75%, 02/02/26(c) | | | 2,052 | | | | 2,010,960 | |
Caesars Resort Collection LLC | | | | | | | | |
Term B-1 Loan, (1 mo. LIBOR US + 4.50%, 0.00% Floor), 4.65%, 07/20/25(p) | | | 1,469 | | | | 1,419,305 | |
Term B-1 Loan, (3 mo. LIBOR US + 4.50%, 0.00% Floor), 4.77%, 07/20/25 | | | 734 | | | | 709,652 | |
DuPont Hotel Project Owner LLC, Loan, (1 mo. LIBOR US + 2.50%, 1.00% Floor), 3.50%, 04/01/24(c) | | | 12,000 | | | | 10,800,000 | |
Golden Nugget, Inc. (AKA Landry’s, Inc.), Initial B Term Loan, (2 mo. LIBOR US + 2.50%, 0.75% Floor), 3.25%, 10/04/23 | | | 6,512 | | | | 5,789,031 | |
Herschend Entertainment Company LLC, Initial Term Loan, (3 mo. LIBOR US + 5.75%, 1.00% Floor),
6.75%, 08/25/25(c) | | | 5,463 | | | | 5,217,165 | |
PCI Gaming Authority, Term B Facility Loan, (1 mo. LIBOR US + 2.50%, 0.00% Floor), 2.65%, 05/31/26 | | | 6,597 | | | | 6,396,009 | |
Spectacle Gary Holdings LLC, Closing Date Term Loan, (3 mo. LIBOR US + 9.00%, 2.00% Floor), 11.00%, 12/23/25 | | | 13,889 | | | | 13,133,459 | |
| | | | | | | | |
| | |
| | | | | | | 48,958,698 | |
|
| Machinery — 0.0% | |
Douglas Dynamics LLC, 2020 Term B Loan, (1 mo. LIBOR US + 3.75%, 1.00% Floor), 4.75%, 06/08/26(c) | | | 1,284 | | | | 1,271,415 | |
Gates Global LLC, Initial B-2 Dollar Term Loan, (1 mo. LIBOR US + 2.75%, 1.00% Floor), 3.75%, 03/31/24 | | | 979 | | | | 962,788 | |
| | | | | | | | |
| | |
| | | | | | | 2,234,203 | |
| | |
| Media — 0.1% | | | | | | |
Airbnb, Inc., Initial Term Loan (First Lien), (3 mo. LIBOR US + 7.50%, 1.00% Floor), 8.50%, 04/17/25(c) | | | 3,814 | | | | 4,100,523 | |
Burlingame Point LLC, Construction Loan, (3 mo. LIBOR US + 3.10%, 1.75% Floor), 3.10%, 05/09/23(c) | | | 9,919 | | | | 9,919,147 | |
Charter Communications Operating LLC (AKA CCO Safari LLC), Term A-4 Loan, (1 mo. LIBOR US + 1.25%, 0.00% Floor), 1.40%, 02/01/25(c) | | | 4,237 | | | | 4,130,616 | |
| | | | | | | | |
| Security | | Par (000) | | | Value | |
|
| Media (continued) | |
CSC Holdings LLC (FKA CSC Holdings, Inc. (Cablevision)), September 2019 Initial Term Loan, (1 mo. LIBOR US + 2.50%, 0.00% Floor), 2.65%, 04/15/27 | | USD | 4,526 | | | $ | 4,380,018 | |
Lamar Media Corp., Term B Loan, (1 mo. LIBOR US + 1.50%, 0.00% Floor), 1.66%, 02/06/27 | | | 477 | | | | 466,235 | |
| | | | | | | | |
| | |
| | | | | | | 22,996,539 | |
|
| Metals & Mining — 0.0% | |
Samarco Mineracao SA, Term Loan, 3.89%, 12/02/19(f)(i) | | | 1,122 | | | | 594,762 | |
Zekelman Industries, Inc. (FKA JMC Steel Group, Inc.), 2020 Term Loan, (1 mo. LIBOR US + 2.00%, 0.00% Floor), 2.14%, 01/24/27 | | | 1,368 | | | | 1,322,375 | |
| | | | | | | | |
| | |
| | | | | | | 1,917,137 | |
| | |
| Multi-Utilities — 0.1% | | | | | | |
PG&E Corp., Loan, (1 mo. LIBOR US + 4.50%, 1.00% Floor), 5.50%, 01/01/22 | | | 7,780 | | | | 7,610,921 | |
| | | | | | | | |
|
| Oil, Gas & Consumable Fuels — 0.2% | |
BCP Raptor II LLC, Initial Term Loan, (1 mo. LIBOR US + 4.75%, 0.00% Floor), 4.90%, 11/03/25 | | | 9,428 | | | | 6,567,970 | |
Buckeye Partners LP, Initial Term Loan, (1 mo. LIBOR US + 2.75%, 0.00% Floor), 2.90%, 11/01/26 | | | 11,578 | | | | 11,346,263 | |
California Resources Corp. | | | | | | | | |
Initial Loan, (1 mo. LIBOR US + 4.75%, 1.00% Floor), 5.75%, 12/31/22(f)(i) | | | 8,708 | | | | 3,132,442 | |
Junior DIP Facility, (1 mo. LIBOR US + 9.00%, 1.00% Floor), 10.00%, 01/15/21(c) | | | 5,211 | | | | 5,159,299 | |
Loan, (1 mo. LIBOR US + 10.38%, 1.00% Floor), 11.38%, 12/31/21(f)(i) | | | 7,760 | | | | 148,759 | |
Chesapeake Energy Corp., Term A Loan , (1 mo. LIBOR US + 8.00%, 1.00% Floor), 9.00%, 06/23/24(c)(f)(i) | | | 15,648 | | | | 10,640,640 | |
| | | | | | | | |
| | |
| | | | | | | 36,995,373 | |
|
| Real Estate Management & Development — 0.1% | |
BRE Park Avenue Tower Owner LLC, Mezzanine A Loan, (1 mo. LIBOR US + 2.05%, 0.00% Floor), 2.21%, 03/09/24(c) | | | 16,472 | | | | 16,404,401 | |
| | | | | | | | |
| | |
| Road & Rail — 0.0% | | | | | | |
Genesee & Wyoming, Inc., Initial Term Loan, (3 mo. LIBOR US + 2.00%, 0.00% Floor), 2.22%, 12/30/26 | | | 4,237 | | | | 4,163,245 | |
| | | | | | | | |
| | |
| Software — 0.1% | | | | | | |
Interface Security Systems LLC, Initial Term Loan, (3 mo. LIBOR US + 7.00%, 1.75% Floor), 8.75%, 08/07/23(c) | | | 5,621 | | | | 5,431,776 | |
Playtika Holding Corp., Term B Loan, (3 mo. LIBOR US + 6.00%, 1.00% Floor), 7.00%, 12/10/24 | | | 10,974 | | | | 10,969,728 | |
| | | | | | | | |
| | |
| | | | | | | 16,401,504 | |
|
| Technology Hardware, Storage & Peripherals — 0.0% | |
Everi Payments, Inc. | | | | | | | | |
Term B Loan, (1 mo. LIBOR US + 2.75%, 1.00% Floor), 3.75%, 05/09/24 | | | 806 | | | | 777,223 | |
Term Loan, (1 mo. LIBOR US + 10.50%, 1.00% Floor), 11.50%, 05/09/24(c) | | | 736 | | | | 747,197 | |
| | | | | | | | |
| | |
| | | | | | | 1,524,420 | |
| | |
S C H E D U L E O F I N V E S T M E N T S | | 89 |
| | |
Schedule of Investments (continued) September 30, 2020 | | Master Total Return Portfolio (Percentages shown are based on Net Assets) |
| | | | | | | | |
| Security | | Par (000) | | | Value | |
|
| Thrifts & Mortgage Finance — 0.1% | |
Caliber Home Loans, Inc. | | | | | | | | |
Term Loan, (1 mo. LIBOR US + 3.25%, 0.00% Floor), 3.41%, 04/24/21(c) | | USD | 5,290 | | | $ | 5,263,369 | |
Term Loan, (1 mo. LIBOR US + 3.25%, 0.00% Floor), 3.16%, 04/24/21(c) | | | 5,154 | | | | 5,128,411 | |
Roundpoint Mortgage Servicing Corp., Closing Date Term Loan, (1 mo. LIBOR US + 3.38%, 0.00% Floor), 3.53%, 08/27/21(c) | | | 5,395 | | | | 5,398,955 | |
| | | | | | | | |
| | |
| | | | | | | 15,790,735 | |
|
| Trading Companies & Distributors — 0.0% | |
Foundation Building Materials Holding Company LLC, Term Loan, (1 mo. LIBOR US + 3.00%, 0.00% Floor), 3.42%, 08/13/25 | | | 3,940 | | | | 3,875,803 | |
| | | | | | | | |
| |
Total Floating Rate Loan Interests — 1.6%
(Cost: $346,436,631) | | | | 314,971,559 | |
| | | | | | | | |
|
Foreign Agency Obligations | |
|
| Argentina — 0.0% | |
YPF SA, 7.00%, 12/15/47(b) | | | 1,525 | | | | 958,129 | |
| | | | | | | | |
| | |
| Brazil — 0.1% | | | | | | |
Banco do Brasil SA | | | | | | | | |
5.38%, 01/15/21(b) | | | 1,204 | | | | 1,213,782 | |
5.88%, 01/26/22(b) | | | 1,244 | | | | 1,298,036 | |
Centrais Eletricas Brasileiras SA | | | | | | | | |
5.75%, 10/27/21(b) | | | 365 | | | | 376,589 | |
3.63%, 02/04/25(b) | | | 1,830 | | | | 1,823,137 | |
Petrobras Global Finance BV | | | | | | | | |
5.09%, 01/15/30 | | | 2,902 | | | | 3,049,567 | |
6.75%, 06/03/50 | | | 1,066 | | | | 1,139,621 | |
| | | | | | | | |
| | |
| | | | | | | 8,900,732 | |
| | |
| Chile — 0.0% | | | | | | |
Corp Nacional del Cobre de Chile, 3.75%, 01/15/31(b) | | | 730 | | | | 812,125 | |
Empresa de los Ferrocarriles del Estado, 3.07%, 08/18/50(b) | | | 1,105 | | | | 1,077,375 | |
Empresa de Transporte de Pasajeros Metro SA, 3.65%, 05/07/30(b) | | | 1,110 | | | | 1,225,163 | |
| | | | | | | | |
| | |
| | | | | | | 3,114,663 | |
| | |
| China — 0.2% | | | | | | |
Chengdu Xingcheng Investment Group Co. Ltd., 2.50%, 03/20/21 | | EUR | 800 | | | | 929,172 | |
China Construction Bank Corp. | | | | | | | | |
(5 yr. U.S. Treasury Yield Curve Rate T Note Constant Maturity + 1.88%), 4.25%, 02/27/29(k) | | USD | 805 | | | | 860,092 | |
(5 yr. U.S. Treasury Yield Curve Rate T Note Constant Maturity + 2.15%), 2.45%, 06/24/30(k) | | | 2,950 | | | | 2,951,150 | |
China Development Bank Financial Leasing Co. Ltd., (5 yr. U.S. Treasury Yield Curve Rate T Note Constant Maturity + 2.75%), 2.88%, 09/28/30(k) | | | 1,200 | | | | 1,195,677 | |
China Minmetals Corp., (5 yr. U.S. Treasury Yield Curve Rate T Note Constant Maturity + 4.72%), 3.75%(k)(l) | | | 339 | | | | 345,702 | |
China Resources Land Ltd., (5 yr. U.S. Treasury Yield Curve Rate T Note Constant Maturity + 5.14%), 3.75%(k)(l) | | | 1,450 | | | | 1,475,828 | |
| | | | | | | | |
| Security | | Par (000) | | | Value | |
|
| China (continued) | |
Chinalco Capital Holdings Ltd. | | | | | | | | |
4.25%, 04/21/22 | | USD | 1,025 | | | $ | 1,040,695 | |
(5 yr. U.S. Treasury Yield Curve Rate T Note Constant Maturity + 5.79%), 4.10%, (k)(l) | | | 735 | | | | 743,728 | |
CITIC Ltd., 2.85%, 02/25/30 | | | 1,140 | | | | 1,177,050 | |
Franshion Brilliant Ltd., 4.25%, 07/23/29 | | | 1,000 | | | | 1,015,938 | |
Guangxi Financial Investment Group Co. Ltd., 5.75%, 01/23/21 | | | 500 | | | | 495,156 | |
Huarong Finance 2019 Co. Ltd. | | | | | | | | |
3.25%, 11/13/24 | | | 2,300 | | | | 2,370,127 | |
4.50%, 05/29/29 | | | 1,300 | | | | 1,397,094 | |
3.88%, 11/13/29 | | | 1,600 | | | | 1,646,000 | |
3.63%, 09/30/30 | | | 1,240 | | | | 1,260,134 | |
(5 yr. U.S. Treasury Yield Curve Rate T Note Constant Maturity + 6.98%), 4.25%, (k)(l) | | | 855 | | | | 851,794 | |
Huarong Finance II Co. Ltd., 5.00%, 11/19/25 | | | 1,550 | | | | 1,719,531 | |
Inner Mongolia High-Grade High Way Construction And Development Co. Ltd., 4.38%, 12/04/20 | | | 300 | | | | 299,844 | |
Leader Goal International Ltd., (5 yr. U.S. Treasury Yield Curve Rate T Note Constant Maturity + 6.92%), 4.25%(k)(l) | | | 700 | | | | 714,875 | |
Rongshi International Finance Ltd., 3.75%, 05/21/29 | | | 1,945 | | | | 2,171,106 | |
Sino-Ocean Land Treasure IV Ltd. | | | | | | | | |
5.25%, 04/30/22 | | | 480 | | | | 494,793 | |
4.75%, 08/05/29 | | | 1,615 | | | | 1,633,169 | |
Sinopec Group Overseas Development 2018 Ltd., 2.15%, 05/13/25(b) | | | 2,345 | | | | 2,424,613 | |
Sunny Express Enterprises Corp., 3.13%, 04/23/30 | | | 1,385 | | | | 1,459,390 | |
| | | | | | | | |
| | |
| | | | | | | 30,672,658 | |
| | |
| Colombia — 0.1% | | | | | | |
Ecopetrol SA | | | | | | | | |
5.38%, 06/26/26 | | | 11,184 | | | | 12,311,137 | |
6.88%, 04/29/30 | | | 2,198 | | | | 2,628,807 | |
Empresas Publicas de Medellin ESP | | | | | | | | |
4.25%, 07/18/29(b) | | | 1,883 | | | | 1,880,364 | |
4.38%, 02/15/31(b) | | | 1,447 | | | | 1,447,000 | |
Oleoducto Central SA, 4.00%, 07/14/27(b) | | | 2,213 | | | | 2,298,200 | |
| | | | | | | | |
| | |
| | | | | | | 20,565,508 | |
| | |
| Hong Kong — 0.0% | | | | | | |
Nanyang Commercial Bank Ltd., (5 yr. U.S. Treasury Yield Curve Rate T Note Constant Maturity + 2.18%), 3.80%, 11/20/29(k) | | | 1,750 | | | | 1,770,781 | |
| | | | | | | | |
| | |
| India — 0.0% | | | | | | |
Bharat Petroleum Corp. Ltd., 4.00%, 05/08/25 | | | 473 | | | | 495,467 | |
Greenko Dutch BV, 5.25%, 07/24/24 | | | 200 | | | | 203,437 | |
Greenko Investment Co., 4.88%, 08/16/23 | | | 200 | | | | 198,688 | |
Greenko Solar Mauritius Ltd., 5.55%, 01/29/25 | | | 200 | | | | 204,000 | |
Oil India Ltd., 5.13%, 02/04/29 | | | 880 | | | | 940,500 | |
Power Finance Corp. Ltd. | | | | | | | | |
3.75%, 06/18/24 | | | 1,060 | | | | 1,090,475 | |
3.75%, 12/06/27 | | | 1,130 | | | | 1,111,991 | |
4.50%, 06/18/29 | | | 893 | | | | 901,930 | |
REC Ltd., 4.75%, 05/19/23 | | | 725 | | | | 761,022 | |
| | | | | | | | |
| | |
| | | | | | | 5,907,510 | |
| | |
| 90 | | 2 0 2 0 B L A C K R O C K A N N U A L R E P O R T T O S H A R E H O L D E R S |
| | |
Schedule of Investments (continued) September 30, 2020 | | Master Total Return Portfolio (Percentages shown are based on Net Assets) |
| | | | | | | | |
| Security | | Par (000) | | | Value | |
| | |
| Indonesia — 0.0% | | | | | | |
Pertamina Persero PT | | | | | | | | |
3.10%, 01/21/30 | | USD | 500 | | | $ | 514,844 | |
4.18%, 01/21/50 | | | 2,800 | | | | 2,823,100 | |
| | | | | | | | |
| | |
| | | | | | | 3,337,944 | |
| | |
| Kuwait — 0.1% | | | | | | |
Equate Petrochemical BV, 4.25%, 11/03/26 | | | 879 | | | | 921,130 | |
MEGlobal Canada ULC | | | | | | | | |
5.00%, 05/18/25(b) | | | 3,035 | | | | 3,267,367 | |
5.00%, 05/18/25 | | | 3,400 | | | | 3,664,228 | |
5.88%, 05/18/30(b) | | | 1,770 | | | | 2,059,838 | |
5.88%, 05/18/30 | | | 1,350 | | | | 1,574,443 | |
| | | | | | | | |
| | |
| | | | | | | 11,487,006 | |
| | |
| Malaysia — 0.0% | | | | | | |
1MDB Energy Ltd., 5.99%, 05/11/22 | | | 1,500 | | | | 1,573,125 | |
Petronas Capital Ltd., 3.50%, 04/21/30(b) | | | 2,628 | | | | 2,938,393 | |
| | | | | | | | |
| | |
| | | | | | | 4,511,518 | |
| | |
| Mexico — 0.1% | | | | | | |
Mexico City Airport Trust, 5.50%, 07/31/47(b) | | | 561 | | | | 455,964 | |
Petroleos Mexicanos | | | | | | | | |
5.50%, 01/21/21 | | | 600 | | | | 605,250 | |
4.25%, 01/15/25 | | | 3,372 | | | | 3,124,685 | |
4.50%, 01/23/26 | | | 6,952 | | | | 6,153,909 | |
6.95%, 01/28/60 | | | 10,944 | | | | 8,465,184 | |
(3 mo. LIBOR US + 3.65%), 3.90%, 03/11/22(a) | | | 2,287 | | | | 2,234,239 | |
| | | | | | | | |
| | |
| | | | | | | 21,039,231 | |
| | |
| Morocco — 0.0% | | | | | | |
OCP SA, 4.50%, 10/22/25 | | | 1,171 | | | | 1,235,039 | |
| | | | | | | | |
| | |
| Panama — 0.0% | | | | | | |
Banco Nacional de Panama,
2.50%, 08/11/30(b) | | | 1,627 | | | | 1,601,228 | |
| | | | | | | | |
| | |
| Peru — 0.0% | | | | | | |
Consorcio Transmantaro SA, 4.70%, 04/16/34(b) | | | 1,155 | | | | 1,361,853 | |
| | | | | | | | |
| | |
| Qatar — 0.0% | | | | | | |
Ooredoo International Finance Ltd., 5.00%, 10/19/25 | | | 878 | | | | 1,026,163 | |
| | | | | | | | |
| | |
| Saudi Arabia — 0.0% | | | | | | |
SABIC Capital II BV | | | | | | | | |
4.00%, 10/10/23 | | | 1,273 | | | | 1,368,475 | |
4.00%, 10/10/23(b) | | | 1,864 | | | | 2,003,800 | |
| | | | | | | | |
| | |
| | | | | | | 3,372,275 | |
| | |
| Singapore — 0.0% | | | | | | |
BOC Aviation Ltd., 3.00%, 09/11/29 | | | 2,000 | | | | 2,038,750 | |
| | | | | | | | |
| | |
| United Arab Emirates — 0.1% | | | | | | |
Abu Dhabi Crude Oil Pipeline LLC, 4.60%, 11/02/47 | | | 1,100 | | | | 1,347,156 | |
DP World Crescent Ltd., 3.91%, 05/31/23 | | | 2,019 | | | | 2,127,443 | |
MDGH - GMTN BV | | | | | | | | |
2.50%, 11/07/24(b) | | | 2,650 | | | | 2,762,625 | |
2.88%, 11/07/29(b) | | | 1,779 | | | | 1,903,530 | |
| | | | | | | | |
| | |
| | | | | | | 8,140,754 | |
| | |
| United States — 0.0% | | | | | | |
Citgo Holding, Inc., 9.25%, 08/01/24(b) | | | 1,775 | | | | 1,690,688 | |
| | | | | | | | |
| | |
Total Foreign Agency Obligations — 0.7%
(Cost: $126,210,436) | | | | | | | 132,732,430 | |
| | | | | | | | |
| | | | | | | | |
| Security | | Par (000) | | | Value | |
|
Foreign Government Obligations | |
| | |
| Bahrain — 0.0% | | | | | | |
Kingdom of Bahrain | | | | | | | | |
7.38%, 05/14/30 | | USD | 3,267 | | | $ | 3,584,511 | |
5.63%, 09/30/31 | | | 1,615 | | | | 1,574,625 | |
| | | | | | | | |
| | |
| | | | | | | 5,159,136 | |
| | |
| Brazil — 0.1% | | | | | | |
Federative Republic of Brazil, 3.88%, 06/12/30 | | | 8,693 | | | | 8,693,000 | |
| | | | | | | | |
| | |
| Chile — 0.0% | | | | | | |
Republic of Chile, 2.45%, 01/31/31 | | | 2,116 | | | | 2,227,090 | |
| | | | | | | | |
| | |
| China — 3.5% | | | | | | |
People’s Republic of China | | | | | | | | |
3.30%, 07/04/23 | | CNH | 3,500 | | | | 525,409 | |
1.99%, 04/09/25 | | CNY | 2,864,850 | | | | 402,631,898 | |
2.41%, 06/19/25 | | | 447,300 | | | | 64,176,543 | |
2.85%, 06/04/27 | | | 318,800 | | | | 45,816,282 | |
3.29%, 05/23/29 | | | 159,300 | | | | 23,574,255 | |
2.68%, 05/21/30 | | | 1,199,730 | | | | 169,326,865 | |
| | | | | | | | |
| | |
| | | | | | | 706,051,252 | |
| | |
| Colombia — 0.3% | | | | | | |
Colombian TES | | | | | | | | |
6.25%, 11/26/25 | | COP | 12,296,000 | | | | 3,509,645 | |
7.25%, 10/18/34 | | | 34,310,100 | | | | 9,761,569 | |
Republic of Colombia | | | | | | | | |
3.88%, 04/25/27 | | USD | 16,282 | | | | 17,584,560 | |
4.50%, 03/15/29 | | | 13,000 | | | | 14,564,062 | |
3.13%, 04/15/31 | | | 8,599 | | | | 8,783,879 | |
5.20%, 05/15/49 | | | 8,440 | | | | 10,196,575 | |
| | | | | | | | |
| | |
| | | | | | | 64,400,290 | |
| | |
| Dominican Republic — 0.1% | | | | | | |
Dominican Republic | | | | | | | | |
4.50%, 01/30/30 | | | 11,416 | | | | 11,184,112 | |
6.40%, 06/05/49 | | | 3,458 | | | | 3,467,726 | |
5.88%, 01/30/60(b) | | | 2,128 | | | | 2,008,300 | |
5.88%, 01/30/60 | | | 2,934 | | | | 2,768,963 | |
| | | | | | | | |
| | |
| | | | | | | 19,429,101 | |
| | |
| Egypt — 0.1% | | | | | | |
Arab Republic of Egypt | | | | | | | | |
5.25%, 10/06/25(b) | | | 2,831 | | | | 2,823,923 | |
5.63%, 04/16/30 | | EUR | 2,767 | | | | 2,938,017 | |
6.38%, 04/11/31(b) | | | 2,459 | | | | 2,682,157 | |
7.90%, 02/21/48 | | USD | 3,230 | | | | 2,973,619 | |
8.88%, 05/29/50(b) | | | 4,205 | | | | 4,168,206 | |
| | | | | | | | |
| | |
| | | | | | | 15,585,922 | |
| | |
| Hungary — 0.1% | | | | | | |
Republic of Hungary, 5.38%, 03/25/24 | | | 8,710 | | | | 9,981,116 | |
| | | | | | | | |
| | |
| Indonesia — 0.3% | | | | | | |
Perusahaan Penerbit SBSN Indonesia III, 3.80%, 06/23/50 | | | 1,504 | | | | 1,600,820 | |
Republic of Indonesia | | | | | | | | |
7.00%, 05/15/27 | | IDR | 88,851,000 | | | | 6,078,651 | |
4.10%, 04/24/28 | | USD | 10,993 | | | | 12,490,796 | |
2.85%, 02/14/30 | | | 15,357 | | | | 16,148,845 | |
7.00%, 09/15/30 | | IDR | 39,330,000 | | | | 2,643,145 | |
6.63%, 05/15/33 | | | 25,942,000 | | | | 1,643,168 | |
7.50%, 06/15/35 | | | 76,657,000 | | | | 5,180,658 | |
8.38%, 04/15/39 | | | 111,094,000 | | | | 7,940,085 | |
7.38%, 05/15/48 | | | 72,527,000 | | | | 4,784,260 | |
| | | | | | | | |
| | |
| | | | | | | 58,510,428 | |
| | |
S C H E D U L E O F I N V E S T M E N T S | | 91 |
| | |
Schedule of Investments (continued) September 30, 2020 | | Master Total Return Portfolio (Percentages shown are based on Net Assets) |
| | | | | | | | |
| Security | | Par (000) | | | Value | |
| | |
| Italy — 0.3% | | | | | | |
Buoni Poliennali Del Tesoro, 1.80%, 03/01/41(b) | | EUR | 47,825 | | | $ | 58,732,718 | |
| | | | | | | | |
| | |
| Maldives — 0.0% | | | | | | |
Republic of Maldives, 7.00%, 06/07/22 | | USD | 775 | | | | 575,437 | |
| | | | | | | | |
| | |
| Mexico — 0.3% | | | | | | |
United Mexican States | | | | | | | | |
4.15%, 03/28/27 | | | 30,448 | | | | 33,842,952 | |
3.25%, 04/16/30 | | | 8,149 | | | | 8,360,874 | |
4.50%, 01/31/50 | | | 17,010 | | | | 17,903,025 | |
| | | | | | | | |
| | |
| | | | | | | 60,106,851 | |
| | |
| Mongolia — 0.0% | | | | | | |
Mongolian People’s Republic, 8.75%, 03/09/24 | | �� | 236 | | | | 263,804 | |
| | | | | | | | |
| | |
| Panama — 0.2% | | | | | | |
Republic of Panama | | | | | | | | |
3.88%, 03/17/28 | | | 25,538 | | | | 28,961,688 | |
3.16%, 01/23/30 | | | 6,025 | | | | 6,544,656 | |
| | | | | | | | |
| | |
| | | | | | | 35,506,344 | |
| | |
| Peru — 0.1% | | | | | | |
Republic of Peru | | | | | | | | |
4.13%, 08/25/27 | | | 17,494 | | | | 20,385,977 | |
2.78%, 01/23/31 | | | 3,272 | | | | 3,540,304 | |
| | | | | | | | |
| | |
| | | | | | | 23,926,281 | |
| | |
| Philippines — 0.2% | | | | | | |
Republic of the Philippines | | | | | | | | |
3.00%, 02/01/28 | | | 30,655 | | | | 33,733,988 | |
3.75%, 01/14/29 | | | 4,174 | | | | 4,871,841 | |
| | | | | | | | |
| | |
| | | | | | | 38,605,829 | |
| | |
| Qatar — 0.0% | | | | | | |
State of Qatar, 3.75%, 04/16/30 | | | 6,383 | | | | 7,392,312 | |
| | | | | | | | |
| | |
| Romania — 0.0% | | �� | | | | |
Republic of Romania, 3.00%, 02/14/31(b) | | | 4,056 | | | | 4,162,470 | |
| | | | | | | | |
| | |
| Russian Federation — 0.2% | | | | | | |
Russian Federation | | | | | | | | |
8.15%, 02/03/27 | | RUB | 564,263 | | | | 8,182,812 | |
6.00%, 10/06/27 | | | 316,725 | | | | 4,098,410 | |
4.38%, 03/21/29 | | USD | 6,200 | | | | 7,123,800 | |
6.90%, 05/23/29 | | RUB | 651,725 | | | | 8,837,644 | |
8.50%, 09/17/31 | | | 632,552 | | | | 9,567,853 | |
| | | | | | | | |
| | |
| | | | | | | 37,810,519 | |
| | |
| Saudi Arabia — 0.1% | | | | | | |
Kingdom of Saudi Arabia, 3.25%, 10/22/30 | | USD | 8,493 | | | | 9,214,905 | |
| | | | | | | | |
| | |
| Sri Lanka — 0.0% | | | | | | |
Republic of Sri Lanka | | | | | | | | |
6.85%, 03/14/24 | | | 625 | | | | 458,203 | |
6.35%, 06/28/24 | | | 200 | | | | 144,312 | |
7.85%, 03/14/29 | | | 200 | | | | 137,813 | |
7.55%, 03/28/30 | | | 1,200 | | | | 810,000 | |
| | | | | | | | |
| | |
| | | | | | | 1,550,328 | |
| | |
| Ukraine — 0.1% | | | | | | |
Ukraine Government | | | | | | | | |
6.75%, 06/20/26 | | EUR | 2,600 | | | | 2,961,699 | |
9.75%, 11/01/28 | | USD | 11,527 | | | | 12,441,955 | |
7.38%, 09/25/32 | | | 11,392 | | | | 10,701,360 | |
| | | | | | | | |
| | |
| | | | | | | 26,105,014 | |
| | | | | | | | |
| Security | | Par (000) | | | Value | |
| | |
| Uruguay — 0.1% | | | | | | |
Republic of Uruguay | | | | | | | | |
4.38%, 10/27/27 | | USD | 15,409 | | | $ | 17,797,803 | |
5.10%, 06/18/50 | | | 3,180 | | | | 4,264,181 | |
| | | | | | | | |
| | |
| | | | | | | 22,061,984 | |
| | | | | | | | |
| |
Total Foreign Government Obligations — 6.1%
(Cost: $1,197,658,415) | | | | 1,216,052,131 | |
| | | | | | | | |
| | |
| | | Shares | | | | |
| | |
Investment Companies | | | | | | | | |
| | |
| Equity Funds — 0.0% | | | | | | |
Communication Services Select Sector SPDR Fund | | | 900 | | | | 53,460 | |
| | | | | | | | |
| | |
| Fixed-Income Funds — 1.4% | | | | | | |
iShares iBoxx High Yield Corporate Bond ETF(g)(h)(q) | | | 1,523,730 | | | | 127,840,947 | |
SPDR Bloomberg Barclays High Yield Bond ETF(h) | | | 1,379,494 | | | | 143,839,839 | |
| | | | | | | | |
| | |
| | | | | | | 271,680,786 | |
| | | | | | | | |
| | |
Total Investment Companies — 1.4%
(Cost: $272,702,865) | | | | | | | 271,734,246 | |
| | | | | | | | |
| | |
| | | Par (000) | | | | |
| | |
Municipal Bonds | | | | | | | | |
| | |
| Arizona — 0.0% | | | | | | |
Arizona Health Facilities Authority, RB, 1.01%, 01/01/37(d) | | USD | 1,355 | | | | 1,241,318 | |
| | | | | | | | |
| | |
| California — 0.6% | | | | | | |
Bay Area Toll Authority | | | | | | | | |
RB, 2.43%, 04/01/26 | | | 2,845 | | | | 3,064,634 | |
RB, Series S1, 6.92%, 04/01/40 | | | 3,145 | | | | 4,839,055 | |
RB, Series S1, 7.04%, 04/01/50 | | | 10,645 | | | | 19,144,926 | |
California Pollution Control Financing Authority, RB, AMT, 5.00%, 11/21/45(b) | | | 1,000 | | | | 1,024,630 | |
California State University, RB, Series B, 2.98%, 11/01/51 | | | 8,170 | | | | 8,536,180 | |
City of Riverside, CA Electric Revenue, RB, 7.61%, 10/01/40 | | | 1,325 | | | | 2,176,710 | |
Contra Costa Community College District, GO, 6.50%, 08/01/34 | | | 570 | | | | 840,476 | |
Los Angeles Community College District, GO, 6.60%, 08/01/42 | | | 3,990 | | | | 6,792,257 | |
Los Angeles Unified School District | | | | | | | | |
GO, 5.75%, 07/01/34 | | | 415 | | | | 579,228 | |
GO, 6.76%, 07/01/34 | | | 7,405 | | | | 10,958,585 | |
Sacramento County Sanitation Districts Financing Authority, Refunding RB, (NPFGC), Series B, 0.70%, 12/01/35(d) | | | 3,500 | | | | 3,022,321 | |
San Jose Redevelopment Agency Successor Agency | | | | | | | | |
TA, Series A, 3.18%, 08/01/26 | | | 2,025 | | | | 2,259,353 | |
TA, Series A, 3.13%, 08/01/28 | | | 4,275 | | | | 4,741,103 | |
TA, Series A, 3.25%, 08/01/29 | | | 3,585 | | | | 3,979,565 | |
State of California | | | | | | | | |
GO, 7.50%, 04/01/34 | | | 855 | | | | 1,417,120 | |
GO, 7.55%, 04/01/39 | | | 4,565 | | | | 7,948,715 | |
GO, 7.30%, 10/01/39 | | | 2,575 | | | | 4,228,201 | |
GO, 7.35%, 11/01/39 | | | 720 | | | | 1,203,394 | |
| | |
| 92 | | 2 0 2 0 B L A C K R O C K A N N U A L R E P O R T T O S H A R E H O L D E R S |
| | |
Schedule of Investments (continued) September 30, 2020 | | Master Total Return Portfolio (Percentages shown are based on Net Assets) |
| | | | | | | | |
| Security | | Par (000) | | | Value | |
| | |
| California (continued) | | | | | | |
State of California Refunding GO, 4.60%, 04/01/38 | | USD | 22,215 | | | $ | 26,373,870 | |
University of California | | | | | | | | |
RB, 5.77%, 05/15/43 | | | 8,110 | | | | 11,812,052 | |
RB, 4.86%, 05/15/2112 | | | 1,940 | | | | 2,756,119 | |
| | | | | | | | |
| | |
| | | | | | | 127,698,494 | |
| | |
| Connecticut — 0.0% | | | | | | |
State of Connecticut | | | | | | | | |
GO, Series A, 3.31%, 01/15/26 | | | 860 | | | | 960,844 | |
GO, Series D, 5.09%, 10/01/30 | | | 5,755 | | | | 7,140,631 | |
| | | | | | | | |
| | |
| | | | | | | 8,101,475 | |
| | |
| District of Columbia — 0.0% | | | | | | |
District of Columbia | | | | | | | | |
RB, 5.00%, 07/15/34 | | | 775 | | | | 909,207 | |
RB, 5.00%, 07/15/35 | | | 775 | | | | 905,634 | |
| | | | | | | | |
| | |
| | | | | | | 1,814,841 | |
| | |
| Florida — 0.1% | | | | | | |
County of Broward, FL Airport System Revenue | | | | | | | | |
RB, 2.91%, 10/01/32 | | | 1,435 | | | | 1,454,588 | |
RB, Series C, 2.50%, 10/01/28 | | | 5,360 | | | | 5,441,204 | |
County of Miami-Dade, FL Aviation Revenue | | | | | | | | |
RB, 2.53%, 10/01/30 | | | 5,705 | | | | 5,692,221 | |
RB, 4.06%, 10/01/31 | | | 1,765 | | | | 1,951,631 | |
RB, Series A, 5.00%, 10/01/38 | | | 1,600 | | | | 1,809,488 | |
Refunding RB, Series D, 3.35%, 10/01/29 | | | 560 | | | | 592,088 | |
Refunding RB, Series D, 3.45%, 10/01/30 | | | 1,030 | | | | 1,089,853 | |
Sumter Landing Community Development District, RB, 4.17%, 10/01/47 | | | 920 | | | | 1,023,040 | |
| | | | | | | | |
| | |
| | | | | | | 19,054,113 | |
| | |
| Georgia — 0.0% | | | | | | |
Municipal Electric Authority of Georgia | | | | | | | | |
RB, 6.64%, 04/01/57 | | | 2,487 | | | | 3,710,753 | |
RB, 6.66%, 04/01/57 | | | 1,115 | | | | 1,690,753 | |
| | | | | | | | |
| | |
| | | | | | | 5,401,506 | |
| | |
| Hawaii — 0.0% | | | | | | |
State of Hawaii, GO, 1.70%, 08/01/32 | | | 415 | | | | 412,879 | |
| | | | | | | | |
| | |
| Idaho — 0.0% | | | | | | |
Idaho Health Facilities Authority, RB, Series A, 5.00%, 12/01/47 | | | 1,155 | | | | 1,377,234 | |
| | | | | | | | |
| | |
| Illinois — 0.1% | | | | | | |
State of Illinois, GO, 5.10%, 06/01/33 | | | 13,140 | | | | 13,192,166 | |
| | | | | | | | |
| | |
| Indiana — 0.0% | | | | | | |
Indiana Housing & Community Development Authority, RB, (GNMA), Series A, 3.80%, 07/01/38 | | | 495 | | | | 538,852 | |
| | | | | | | | |
| | |
| Massachusetts — 0.1% | | | | | | |
Commonwealth of Massachusetts | | | | | | | | |
GO, 5.46%, 12/01/39 | | | 430 | | | | 610,209 | |
GO, 2.90%, 09/01/49 | | | 225 | | | | 247,639 | |
Massachusetts Development Finance Agency | | | | | | | | |
RB, 5.00%, 07/01/47 | | | 1,260 | | | | 1,465,909 | |
RB, Series J2, 5.00%, 07/01/48 | | | 1,035 | | | | 1,230,843 | |
Massachusetts HFA | | | | | | | | |
RB, Series A, 4.50%, 12/01/48 | | | 1,160 | | | | 1,242,488 | |
Refunding RB, AMT, Series B, 4.50%, 12/01/39 | | | 910 | | | | 962,953 | |
Refunding RB, AMT, Series B, 4.60%, 12/01/44 | | | 960 | | | | 1,038,643 | |
| | | | | | | | |
| Security | | Par (000) | | | Value | |
| | |
| Massachusetts (continued) | | | | | | |
Massachusetts School Building Authority | | | | | | | | |
RB, 2.87%, 10/15/31 | | USD | 5,350 | | | $ | 5,779,284 | |
RB, 2.97%, 10/15/32 | | | 4,300 | | | | 4,653,890 | |
| | | | | | | | |
| | |
| | | | | | | 17,231,858 | |
| | |
| Michigan — 0.0% | | | | | | |
Michigan Finance Authority | | | | | | | | |
RB, 5.00%, 11/15/28 | | | 1,380 | | | | 1,697,055 | |
RB, 5.00%, 06/01/39 | | | 840 | | | | 947,235 | |
RB, 5.00%, 11/15/41 | | | 850 | | | | 999,277 | |
Michigan State HDA | | | | | | | | |
RB, Series A, 3.55%, 10/01/33 | | | 1,055 | | | | 1,157,145 | |
RB, Series A, 4.00%, 10/01/43 | | | 1,010 | | | | 1,110,869 | |
RB, Series A, 4.05%, 10/01/48 | | | 465 | | | | 510,551 | |
Royal Oak Hospital Finance Authority, RB, Series D, 5.00%, 09/01/39 | | | 1,160 | | | | 1,298,504 | |
| | | | | | | | |
| | |
| | | | | | | 7,720,636 | |
| | |
| Mississippi — 0.0% | | | | | | |
State of Mississippi | | | | | | | | |
GO, 1.63%, 11/01/31 | | | 155 | | | | 158,582 | |
GO, 1.73%, 11/01/32 | | | 470 | | | | 481,590 | |
| | | | | | | | |
| | |
| | | | | | | 640,172 | |
| | |
| New Jersey — 0.1% | | | | | | |
New Jersey Transportation Trust Fund Authority, RB, Series C, 5.75%, 12/15/28 | | | 1,630 | | | | 1,855,869 | |
New Jersey Turnpike Authority, RB, Series F, 7.41%, 01/01/40 | | | 2,329 | | | | 3,924,505 | |
Rutgers The State University of New Jersey, RB, 3.27%, 05/01/43 | | | 4,555 | | | | 4,914,617 | |
| | | | | | | | |
| | |
| | | | | | | 10,694,991 | |
| | |
| NewYork — 0.5% | | | | | | |
City of New York, NY, GO, 2.90%, 08/01/32 | | | 2,875 | | | | 3,101,032 | |
Metropolitan Transportation Authority | | | | | | | | |
RB, 5.87%, 11/15/39 | | | 735 | | | | 867,947 | |
RB, 6.67%, 11/15/39 | | | 350 | | | | 444,682 | |
RB, Series E, 6.81%, 11/15/40 | | | 860 | | | | 1,105,934 | |
New York City Housing Development Corp. | | | | | | | | |
RB, 3.70%, 11/01/38 | | | 1,090 | | | | 1,156,763 | |
RB, Series C-1B, 3.85%, 11/01/43 | | | 3,300 | | | | 3,537,039 | |
New York City Transitional Finance Authority Future Tax Secured Revenue | | | | | | | | |
RB, Series B3, 3.90%, 08/01/31 | | | 4,860 | | | | 5,557,361 | |
RB, Series C3, 3.35%, 11/01/30 | | | 6,190 | | | | 6,886,375 | |
RB, Series C4, 3.55%, 05/01/25 | | | 4,155 | | | | 4,643,919 | |
RB, Series F2, 3.05%, 05/01/27 | | | 4,675 | | | | 5,177,749 | |
New York City Water & Sewer System | | | | | | | | |
RB, 5.75%, 06/15/41 | | | 385 | | | | 593,963 | |
RB, 6.01%, 06/15/42 | | | 665 | | | | 1,054,890 | |
RB, 5.38%, 06/15/43 | | | 2,920 | | | | 2,950,602 | |
RB, 5.44%, 06/15/43 | | | 3,400 | | | | 5,255,414 | |
RB, 5.50%, 06/15/43 | | | 5,285 | | | | 5,342,342 | |
RB, 5.88%, 06/15/44 | | | 1,240 | | | | 1,989,245 | |
Refunding RB, 5.38%, 06/15/43 | | | 1,490 | | | | 1,505,273 | |
New York State Dormitory Authority | | | | | | | | |
RB, 2.99%, 07/01/40 | | | 630 | | | | 656,429 | |
RB, Series H, 5.39%, 03/15/40 | | | 1,470 | | | | 2,059,911 | |
Refunding RB, Series F, 3.19%, 02/15/43 | | | 1,985 | | | | 2,152,613 | |
New York State Urban Development Corp. | | | | | | | | |
RB, 3.32%, 03/15/29 | | | 4,035 | | | | 4,513,511 | |
RB, 2.23%, 03/15/33 | | | 5,940 | | | | 6,035,693 | |
Refunding RB, Series B, 2.35%, 03/15/27 | | | 3,650 | | | | 3,872,029 | |
| | |
S C H E D U L E O F I N V E S T M E N T S | | 93 |
| | |
Schedule of Investments (continued) September 30, 2020 | | Master Total Return Portfolio (Percentages shown are based on Net Assets) |
| | | | | | | | |
| Security | | Par (000) | | | Value | |
| | |
| NewYork (continued) | | | | | | |
New York Transportation Development Corp. | | | | | | | | |
RB, Series A, 5.00%, 07/01/46 | | USD | 730 | | | $ | 780,297 | |
RB, Series A, 5.25%, 01/01/50 | | | 9,190 | | | | 9,902,041 | |
Port Authority of New York & New Jersey | | | | | | | | |
RB, 5.65%, 11/01/40 | | | 2,165 | | | | 3,090,451 | |
RB, 4.96%, 08/01/46 | | | 5,020 | | | | 6,760,434 | |
RB, 4.93%, 10/01/51 | | | 1,045 | | | | 1,421,284 | |
RB, 4.46%, 10/01/62 | | | 2,890 | | | | 3,702,581 | |
State of New York, Refunding GO, Series B, 2.80%, 02/15/32 | | | 5,195 | | | | 5,656,628 | |
| | | | | | | | |
| | |
| | | | | | | 101,774,432 | |
| | |
| Ohio — 0.1% | | | | | | |
American Municipal Power, Inc. | | | | | | | | |
RB, Series B, 7.83%, 02/15/41 | | | 1,500 | | | | 2,500,065 | |
RB, Series B, 8.08%, 02/15/50 | | | 2,650 | | | | 4,845,711 | |
JobsOhio Beverage System, RB, Series B, 3.99%, 01/01/29 | | | 8,385 | | | | 9,619,691 | |
| | | | | | | | |
| | |
| | | | | | | 16,965,467 | |
| | |
| Oregon — 0.1% | | | | | | |
Oregon School Boards Association | | | | | | | | |
GO, (AMBAC), 4.76%, 06/30/28 | | | 3,750 | | | | 4,319,962 | |
GO, (NPFGC), Series B, 5.55%, 06/30/28 | | | 2,875 | | | | 3,524,980 | |
GO, (NPFGC), Series B, 5.68%, 06/30/28 | | | 10,105 | | | | 12,646,307 | |
State of Oregon, GO, 5.89%, 06/01/27 | | | 3,860 | | | | 4,885,216 | |
| | | | | | | | |
| | |
| | | | | | | 25,376,465 | |
| | |
| Pennsylvania — 0.0% | | | | | | |
City of Philadelphia, PA Airport Revenue, RB, Series B, 5.00%, 07/01/42 | | | 1,000 | | | | 1,157,580 | |
Commonwealth Financing Authority | | | | | | | | |
RB, 4.14%, 06/01/38 | | | 530 | | | | 630,255 | |
RB, Series A, 3.86%, 06/01/38 | | | 1,180 | | | | 1,367,585 | |
Pennsylvania Turnpike Commission, RB, Series B, 5.00%, 12/01/48 | | | 2,805 | | | | 3,350,123 | |
| | | | | | | | |
| | |
| | | | | | | 6,505,543 | |
| | |
| Puerto Rico — 0.1% | | | | | | |
Commonwealth of Puerto Rico, GO, Refunding, Series A, 8.00%, 07/01/35(f)(i) | | | 5,625 | | | | 3,547,601 | |
Puerto Rico Sales Tax Financing Corp. Sales Tax Revenue | | | | | | | | |
RB, Series A-1, 0.00%, 07/01/46(m) | | | 41,207 | | | | 11,633,560 | |
RB, Series A-1, 0.00%, 07/01/51(m) | | | 25,029 | | | | 5,105,666 | |
| | | | | | | | |
| | |
| | | | | | | 20,286,827 | |
| | |
| South Carolina — 0.1% | | | | | | |
Lexington County Health Services District, Inc., RB, 5.00%, 11/01/41 | | | 960 | | | | 1,108,263 | |
South Carolina Public Service Authority | | | | | | | | |
RB, Series C, 6.45%, 01/01/50 | | | 1,955 | | | | 3,134,158 | |
RB, Series D, 2.39%, 12/01/23 | | | 3,392 | | | | 3,564,042 | |
Spartanburg County School District No. 7, GO, (SCSDE), Series B, 5.00%, 03/01/48 | | | 645 | | | | 804,334 | |
| | | | | | | | |
| | |
| | | | | | | 8,610,797 | |
| | |
| Tennessee — 0.0% | | | | | | |
Tennessee Housing Development Agency | | | | | | | | |
RB, Series 3, 3.75%, 07/01/38 | | | 15 | | | | 16,309 | |
RB, Series 3, 3.85%, 07/01/43 | | | 455 | | | | 491,159 | |
RB, Series 3, 3.95%, 01/01/49 | | | 360 | | | | 388,242 | |
| | | | | | | | |
| | |
| | | | | | | 895,710 | |
| | | | | | | | |
| Security | | Par (000) | | | Value | |
| | |
| Texas — 0.2% | | | | | | |
City of San Antonio, TX Electric & Gas Systems Revenue | | | | | | | | |
RB, 5.72%, 02/01/41 | | USD | 3,180 | | | $ | 4,633,006 | |
RB, 5.81%, 02/01/41 | | | 3,260 | | | | 4,921,752 | |
Dallas/Fort Worth International Airport | | | | | | | | |
RB, Series A, 3.14%, 11/01/45 | | | 1,080 | | | | 1,129,658 | |
RB, Series A, 5.00%, 11/01/45 | | | 3,670 | | | | 3,683,763 | |
RB, Series H, 5.00%, 11/01/45 | | | 2,650 | | | | 2,784,381 | |
State of Texas, GO, 5.52%, 04/01/39 | | | 10,740 | | | | 15,989,175 | |
Texas A&M University, RB, 2.84%, 05/15/27 | | | 2,240 | | | | 2,504,858 | |
Texas Municipal Gas Acquisition and Supply Corp. I, RB, Series D, 6.25%, 12/15/26 | | | 720 | | | | 857,851 | |
| | | | | | | | |
| | |
| | | | | | | 36,504,444 | |
| | |
| Virginia — 0.1% | | | | | | |
Tobacco Settlement Financing Corp., RB, Series A-1, 6.71%, 06/01/46 | | | 4,090 | | | | 4,212,700 | |
Virginia College Building Authority, RB, 1.97%, 02/01/32 | | | 3,930 | | | | 3,987,456 | |
| | | | | | | | |
| | |
| | | | | | | 8,200,156 | |
| | |
| Washington — 0.0% | | | | | | |
Central Puget Sound Regional Transit Authority, RB, Series S1, 5.00%, 11/01/50 | | | 1,730 | | | | 2,060,153 | |
Grant County Public Utility District No. 2 Priest Rapids Hydroelectric Project, RB, 4.58%, 01/01/40 | | | 600 | | | | 775,674 | |
| | | | | | | | |
| | |
| | | | | | | 2,835,827 | |
| | |
| West Virginia — 0.0% | | | | | | |
Tobacco Settlement Finance Authority, RB, Series A, 7.47%, 06/01/47 | | | 4,100 | | | | 4,360,268 | |
| | | | | | | | |
| | |
Total Municipal Bonds — 2.2%
(Cost: $404,631,349) | | | | | | | 447,436,471 | |
| | | | | | | | |
|
Non-Agency Mortgage-Backed Securities | |
| | |
| Collateralized Mortgage Obligations — 1.7% | | | | | | |
Alternative Loan Trust, Series 2007-14T2, Class A1, 6.00%, 07/25/37 | | | 2,630 | | | | 1,895,731 | |
American Home Mortgage Assets Trust | | | | | | | | |
Series 2006-3, Class 2A11, (12 mo. Federal Reserve Cumulative Average US + 0.94%), 1.96%, 10/25/46(a) | | | 851 | | | | 683,902 | |
Series 2006-4, Class 1A12, (1 mo. LIBOR US + 0.21%), 0.36%, 10/25/46(a) | | | 2,339 | | | | 1,544,008 | |
Series 2006-5, Class A1, (12 mo. Federal Reserve Cumulative Average US + 0.92%), 1.94%, 11/25/46(a) | | | 3,467 | | | | 1,487,277 | |
Series 2007-1, Class A1, (12 mo. Federal Reserve Cumulative Average US + 0.70%), 1.72%, 02/25/47(a) | | | 774 | | | | 420,003 | |
Angel Oak Mortgage Trust, Series 2020-4, Class A3, 2.81%, 06/25/65(b)(d) | | | 4,681 | | | | 4,698,306 | |
Angel Oak Mortgage Trust I LLC, Series 2019-4, Class A3, 3.30%, 07/26/49(b)(d) | | | 4,152 | | | | 4,195,369 | |
Angel Oak Mortgage Trust LLC | | | | | | | | |
Series 2020-3, Class A3,
2.87%, 04/25/65(b)(d) | | | 7,010 | | | | 7,045,036 | |
Series 2020-3, Class M1,
3.81%, 04/25/65(b)(d) | | | 4,120 | | | | 4,176,719 | |
APS Resecuritization Trust | | | | | | | | |
Series 2016-1, Class 1MZ,
4.14%, 07/31/57(b)(d) | | | 7,321 | | | | 2,569,633 | |
Series 2016-3, Class 3A, (1 mo. LIBOR US + 2.85%), 3.00%, 09/27/46(a)(b) | | | 4,686 | | | | 4,663,876 | |
| | |
| 94 | | 2 0 2 0 B L A C K R O C K A N N U A L R E P O R T T O S H A R E H O L D E R S |
| | |
Schedule of Investments (continued) September 30, 2020 | | Master Total Return Portfolio (Percentages shown are based on Net Assets) |
| | | | | | | | |
| Security | | Par (000) | | | Value | |
|
| Collateralized Mortgage Obligations (continued) | |
APS Resecuritization Trust | | | | | | | | |
Series 2016-3, Class 4A, (1 mo. LIBOR US + 2.60%), 2.75%, 04/27/47(a)(b) | | USD | 811 | | | $ | 805,512 | |
ARI Investments LLC | | | | | | | | |
Series 2017-1, Class A,
4.61%, 01/06/25(c)(d) | | | 2,722 | | | | 2,639,864 | |
Series 2019-1, 4.55%, 01/30/25(c)(d) | | | 3,146 | | | | 3,083,290 | |
Banc of America Funding Trust | | | | | | | | |
Series 2014-R2, Class 1C, 0.00%, 11/26/36(b)(d) | | | 3,961 | | | | 940,459 | |
Series 2016-R2, Class 1A1, 4.70%, 05/01/33(b)(d) | | | 1,374 | | | | 1,313,961 | |
BCAP LLC Trust, Series 2011-RR5, Class 11A5, (1 mo. LIBOR US + 0.15%), 0.48%, 05/28/36(a)(b) | | | 4,498 | | | | 4,266,115 | |
Bear Stearns ALT-A Trust, Series 2007-1, Class 1A1, (1 mo. LIBOR US + 0.32%), 0.47%, 01/25/47(a) | | | 1,363 | | | | 1,174,839 | |
Bear Stearns Asset-Backed Securities I Trust, Series 2005-AC9, Class A5, 6.25%, 12/25/35(e) | | | 230 | | | | 211,307 | |
Bear Stearns Mortgage Funding Trust | | | | | | | | |
Series 2006-SL1, Class A1, (1 mo. LIBOR US + 0.28%),
0.43%, 08/25/36(a) | | | 1,199 | | | | 1,177,078 | |
Series 2007-AR2, Class A1, (1 mo. LIBOR US + 0.17%),
0.32%, 03/25/37(a) | | | 328 | | | | 292,938 | |
Series 2007-AR3, Class 1A1, (1 mo. LIBOR US + 0.14%),
0.29%, 03/25/37(a) | | | 545 | | | | 487,981 | |
Series 2007-AR4, Class 2A1, (1 mo. LIBOR US + 0.21%),
0.36%, 06/25/37(a) | | | 553 | | | | 514,677 | |
BlackRock Capital Finance LP, Series 1997-R2, Class AP, 1.68%, 12/25/35(b)(d)(q) | | | 3 | | | | 3,188 | |
Chase Mortgage Finance Trust, Series 2007-S6, Class 1A1, 6.00%, 12/25/37 | | | 23,552 | | | | 15,890,253 | |
Citicorp Mortgage Securities Trust | | | | | | | | |
Series 2007-9, Class 1A1, 6.25%, 12/25/37 | | | 1,704 | | | | 1,525,554 | |
Series 2008-2, Class 1A1, 6.50%, 06/25/38 | | | 5,590 | | | | 4,912,205 | |
Citigroup Mortgage Loan Trust, Series 2007-2, Class 2A, 6.00%, 11/25/36 | | | 12 | | | | 12,303 | |
CitiMortgage Alternative Loan Trust, Series 2007- A6, Class 1A11, 6.00%, 06/25/37 | | | 864 | | | | 869,872 | |
COLT Mortgage Loan Trust, Series 2020-3, Class A3, 2.38%, 04/27/65(b)(d) | | | 2,438 | | | | 2,441,431 | |
Countrywide Alternative Loan Trust | | | | | | | | |
Series 2005-22T1, Class A1, (1 mo. LIBOR US + 0.35%),
0.50%, 06/25/35(a) | | | 3,687 | | | | 2,880,729 | |
Series 2005-72, Class A3, (1 mo. LIBOR US + 0.60%), 0.75%, 01/25/36(a) | | | 621 | | | | 569,722 | |
Series 2005-76, Class 2A1, (12 mo. Federal Reserve Cumulative Average US + 1.00%), 2.02%, 02/25/36(a) | | | 779 | | | | 711,093 | |
Series 2006-11CB, Class 3A1, 6.50%, 05/25/36 | | | 1,631 | | | | 1,202,424 | |
Series 2006-15CB, Class A1, 6.50%, 06/25/36 | | | 393 | | | | 301,280 | |
Series 2006-23CB, Class 2A5, (1 mo. LIBOR US + 0.40%),
0.55%, 08/25/36(a) | | | 5,570 | | | | 1,080,877 | |
Series 2006-OA14, Class 1A1, (12 mo. Federal Reserve Cumulative Average US + 1.73%), 2.75%, 11/25/46(a) | | | 3,233 | | | | 2,668,888 | |
Series 2006-OA16, Class A2, (1 mo. LIBOR US + 0.19%),
0.34%, 10/25/46(a) | | | 3,672 | | | | 3,435,618 | |
Series 2006-OA16, Class A4C, (1 mo. LIBOR US + 0.34%),
0.49%, 10/25/46(a) | | | 4,083 | | | | 2,934,622 | |
| | | | | | | | |
| Security | | Par (000) | | | Value | |
|
| Collateralized Mortgage Obligations (continued) | |
Countrywide Alternative Loan Trust | | | | | | | | |
Series 2006-OA21, Class A1, (1 mo. LIBOR US + 0.19%), 0.35%, 03/20/47(a) | | USD | 8,564 | | | $ | 6,995,505 | |
Series 2006-OA8, Class 1A1, (1 mo. LIBOR US + 0.19%), 0.34%, 07/25/46(a) | | | 443 | | | | 386,063 | |
Series 2006-OC10, Class 2A3, (1 mo. LIBOR US + 0.23%), 0.38%, 11/25/36(a) | | | 1,606 | | | | 1,441,418 | |
Series 2006-OC7, Class 2A3, (1 mo. LIBOR US + 0.25%), 0.40%, 07/25/46(a) | | | 2,317 | | | | 2,036,205 | |
Series 2007-3T1, Class 1A1, 6.00%, 04/25/37 . | | | 343 | | | | 223,919 | |
Series 2007-OA3, Class 1A1, (1 mo. LIBOR US + 0.14%), 0.29%, 04/25/47(a) | | | 1,026 | | | | 918,916 | |
Series 2007-OA3, Class 2A2, (1 mo. LIBOR US + 0.18%), 0.33%, 04/25/47(a) | | | 7 | | | | 352 | |
Series 2007-OA8, Class 2A1, (1 mo. LIBOR US + 0.18%), 0.33%, 06/25/47(a) | | | 353 | | | | 267,523 | |
Series 2007-OH2, Class A2A, (1 mo. LIBOR US + 0.24%), 0.39%, 08/25/47(a) | | | 434 | | | | 387,803 | |
Countrywide Home Loan Mortgage Pass-Through Trust | | | | | | | | |
Series 2004-29, Class 1A1, (1 mo. LIBOR US + 0.54%), 0.69%, 02/25/35(a) | | | 240 | | | | 225,205 | |
Series 2006-OA4, Class A1, (12 mo. Federal Reserve Cumulative Average US + 0.96%), 1.98%, 04/25/46(a) | | | 1,431 | | | | 609,792 | |
Series 2006-OA5, Class 3A1, (1 mo. LIBOR US + 0.20%), 0.35%, 04/25/46(a) | | | 642 | | | | 582,032 | |
Series 2007-15, Class 2A2, 6.50%, 09/25/37 | | | 8,888 | | | | 5,460,184 | |
Credit Suisse Commercial Mortgage Trust | | | | | | | | |
Series 2009-12R, Class 3A1, 6.50%, 10/27/37(b) | | | 8,103 | | | | 4,394,154 | |
Series 2009-5R, Class 4A4, 3.03%, 06/25/36(b)(d) | | | 1,654 | | | | 1,410,579 | |
Series 2014-11R, Class 16A1, 3.23%, 09/27/47(b)(d) | | | 888 | | | | 908,594 | |
Series 2014-4R, Class 16A3, (1 mo. LIBOR US + 0.20%),
0.38%, 02/27/36(a)(b)(c) | | | 717 | | | | 663,012 | |
Series 2014-9R, Class 9A1, (1 mo. LIBOR US + 0.12%), 0.30%, 08/27/36(a)(b) | | | 1,249 | | | | 1,155,600 | |
Series 2019-JR1, Class A1, 4.10%, 09/27/66(b)(d) | | | 28,894 | | | | 29,002,873 | |
Series 2020-SPT1, Class M1, 3.85%, 04/25/65(b)(d) | | | 4,796 | | | | 4,840,780 | |
CSFB Mortgage-Backed Pass-Through Certificates, Series 2005-10, Class 10A1, (1 mo. LIBOR US + 1.35%), 1.50%, 11/25/35(a) | | | 1,284 | | | | 252,712 | |
Deephaven Residential Mortgage Trust, Series 2020-2, Class A3,
2.86%, 05/25/65(b) | | | 3,800 | | | | 3,814,630 | |
Deutsche Alt-A Securities Mortgage Loan Trust, Series 2007-OA4, Class A2A, (1 mo. LIBOR US + 0.17%),
0.32%, 08/25/47(a) | | | 1,219 | | | | 841,133 | |
Deutsche Alt-A Securities, Inc., Series 2007-RS1, Class A2, (1 mo. LIBOR US + 0.50%), 0.67%, 01/27/37(a)(b) | | | 36 | | | | 34,791 | |
Deutsche Alt-B Securities Mortgage Loan Trust | | | | | | | | |
Series 2006-AB3, Class A3, 6.51%, 07/25/36(d) | | | 435 | | | | 424,543 | |
Series 2006-AB3, Class A8, 6.36%, 07/25/36(d) | | | 277 | | | | 270,728 | |
| | |
S C H E D U L E O F I N V E S T M E N T S | | 95 |
| | |
Schedule of Investments (continued) September 30, 2020 | | Master Total Return Portfolio (Percentages shown are based on Net Assets) |
| | | | | | | | |
| Security | | Par (000) | | | Value | |
|
| Collateralized Mortgage Obligations (continued) | |
GreenPoint Mortgage Funding Trust, Series 2006- AR2, Class 4A1, (12 mo. Federal Reserve Cumulative Average US + 2.00%), 3.02%, 03/25/36(a) | | USD | 839 | | | $ | 799,701 | |
GSR Mortgage Loan Trust, Series 2007-1F, Class 2A4, 5.50%, 01/25/37 | | | 213 | | | | 238,782 | |
HarborView Mortgage Loan Trust | | | | | | | | |
Series 2006-12, Class 1A1A, (1 mo. LIBOR US + 0.21%), 0.36%, 12/19/36(a) | | | 13,859 | | | | 12,100,681 | |
Series 2007-4, Class 2A2, (1 mo. LIBOR US + 0.25%), 0.41%, 07/19/47(a) | | | 721 | | | | 619,424 | |
Homeward Opportunities Fund I Trust | | | | | | | | |
Series 2020-2, Class A2,
2.64%, 05/25/65(b)(d) | | | 4,767 | | | | 4,891,068 | |
Series 2020-2, Class A3,
3.20%, 05/25/65(b)(d) | | | 5,763 | | | | 5,962,848 | |
Impac CMB Trust | | | | | | | | |
Series 2004-11, Class 1A2, (1 mo. LIBOR US + 0.52%), 0.67%, 03/25/35(a) | | | 1,229 | | | | 1,204,538 | |
Series 2005-6, Class 1A1, (1 mo. LIBOR US + 0.50%), 0.65%, 10/25/35(a) | | | 961 | | | | 911,136 | |
IndyMac Index Mortgage Loan Trust | | | | | | | | |
Series 2006-AR15, Class A1, (1 mo. LIBOR US + 0.12%), 0.27%, 07/25/36(a) | | | 517 | | | | 464,366 | |
Series 2007-AR19, Class 3A1, 3.18%, 09/25/37(d) | | | 3,059 | | | | 2,096,467 | |
Series 2007-FLX5, Class 2A2, (1 mo. LIBOR US + 0.24%), 0.39%, 08/25/37(a) | | | 1,000 | | | | 841,322 | |
JPMorgan Alternative Loan Trust | | | | | | | | |
Series 2007-A1, Class 1A4, (1 mo. LIBOR US + 0.42%), 0.57%, 03/25/37(a) | | | 1,547 | | | | 1,460,220 | |
Series 2007-A2, Class 2A1, 3.68%, 05/25/37(d) | | | 328 | | | | 291,776 | |
Legacy Mortgage Asset Trust | | | | | | | | |
Series 2019-SL1, Class A, 4.00%, 12/28/54(d) | | | 3,798 | | | | 3,833,459 | |
Series 2020-GS5, Class A1, 3.25%, 06/25/60(b) | | | 4,293 | | | | 4,320,592 | |
Series 2020-SL1, Class A, 2.73%, (b)(e)(l) | | | 6,120 | | | | 6,119,970 | |
Lehman XS Trust | | | | | | | | |
Series 2007-16N, Class AF2, (1 mo. LIBOR US + 0.95%), 1.10%, 09/25/47(a) | | | 3,736 | | | | 3,658,132 | |
Series 2007-20N, Class A1, (1 mo. LIBOR US + 1.15%), 1.30%, 12/25/37(a) | | | 930 | | | | 862,189 | |
LSTAR Securities Investment Trust, Series 2019-1, Class A1, (1 mo. LIBOR US + 1.70%), 1.86%, 03/01/24(a)(b) | | | 2,773 | | | | 2,745,234 | |
MASTR Resecuritization Trust, Series 2008-3, Class A1,
0.61%, 08/25/37(b)(d) | | | 1,072 | | | | 587,338 | |
MCM Trust | | | | | | | | |
Series 2018-NPL1, Class A, 4.00%, 05/28/58(b) | | | 932 | | | | 936,812 | |
Series 2018-NPL1, Class B, 0.00%, 05/28/58(b) | | | 6,154 | | | | 4,339,037 | |
Series 2018-NPL2, Class A, 4.00%, 10/25/28(b)(c)(e) | | | 3,441 | | | | 3,441,422 | |
Series 2018-NPL2, Class B, 0.00%, 10/25/28(b) | | | 10,087 | | | | 3,169,381 | |
Merrill Lynch Alternative Note Asset Trust, Series 2007-OAR2, Class A2, (1 mo. LIBOR US + 0.21%), 0.36%, 04/25/37(a) | | | 2,189 | | | | 1,962,402 | |
Merrill Lynch Mortgage Investors Trust, Series 2006-A3, Class 6A1, 3.40%, 05/25/36(d) | | | 1,238 | | | | 1,128,037 | |
| | | | | | | | |
| Security | | Par (000) | | | Value | |
|
| Collateralized Mortgage Obligations (continued) | |
MFA Trust, Series 2020-NQM1, Class A3, 2.30%, 08/25/49(b)(d) | | USD | 684 | | | $ | 687,847 | |
Mortgage Loan Resecuritization Trust, Series 2009-RS1, Class A85, (1 mo. LIBOR US + 0.34%), 0.50%, 04/16/36(a)(b) | | | 7,621 | | | | 6,722,653 | |
New Residential Mortgage Loan Trust | | | | | | | | |
Series 2019-2A, Class A1, 4.25%, 12/25/57(b)(d) | | | 1,831 | | | | 1,969,490 | |
Series 2020-NPL2, Class A1, 3.23%, 08/25/60(b)(e) | | | 1,779 | | | | 1,779,567 | |
Series 2020-RPL1, Class B3, 3.94%, 11/25/59(b)(d) | | | 6,210 | | | | 4,991,395 | |
Series 2020-RPL2, Class A1, 3.58%, 08/25/25(b)(d) | | | 13,371 | | | | 13,367,547 | |
Nomura Asset Acceptance Corp. Alternative Loan Trust | | | | | | | | |
Series 2001-R1A, Class A,
7.00%, 02/19/30(b)(d) | | | 440 | | | | 449,520 | |
Series 2006-AF1, Class 1A4, 6.63%, 05/25/36(e) | | | 576 | | | | 192,357 | |
Series 2007-2, Class A4, (1 mo. LIBOR US + 0.42%), 0.57%, 06/25/37(a) | | | 395 | | | | 320,713 | |
PRPM LLC, Series 2019-1A, Class A1, 4.50%, 01/25/24(b)(e) | | | 2,733 | | | | 2,754,087 | |
RALI Trust, Series 2007-QH9, Class A1, 2.11%, 11/25/37(d) | | | 734 | | | | 657,466 | |
Reperforming Loan REMIC Trust | | | | | | | | |
Series 2005-R2, Class 1AF1, (1 mo. LIBOR US + 0.34%), 0.49%, 06/25/35(a)(b) | | | 467 | | | | 434,072 | |
Series 2005-R3, Class AF, (1 mo. LIBOR US + 0.40%), 0.55%, 09/25/35(a)(b) | | | 146 | | | | 127,041 | |
Residential Mortgage Loan Trust | | | | | | | | |
Series 2020-2, Class A2,
2.51%, 05/25/60(b)(d) | | | 3,500 | | | | 3,521,454 | |
Series 2020-2, Class M1,
3.57%, 05/25/60(b)(d) | | | 7,854 | | | | 8,059,124 | |
Seasoned Credit Risk Transfer Trust, Series 2018-1, Class BX,
1.53%, 05/25/57(d) | | | 543 | | | | 251,342 | |
Seasoned Loans Structured Transaction Trust, Series 2020-2, Class M1, 4.75%, 09/25/60(b)(d) | | | 15,220 | | | | 15,258,050 | |
Sequoia Mortgage Trust, Series 2007-3, Class 2AA1, 3.26%, 07/20/37(d) | | | 1,464 | | | | 1,321,619 | |
Structured Adjustable Rate Mortgage Loan Trust, Series 2006-3, Class 4A, 3.57%, 04/25/36(d) | | | 906 | | | | 716,058 | |
Structured Asset Mortgage Investments II Trust | | | | | | | | |
Series 2006-AR4, Class 3A1, (1 mo. LIBOR US + 0.19%), 0.34%, 06/25/36(a) | | | 2,350 | | | | 2,102,842 | |
Series 2006-AR5, Class 2A1, (1 mo. LIBOR US + 0.21%), 0.36%, 05/25/46(a) | | | 538 | | | | 463,470 | |
Thornburg Mortgage Securities Trust, Series 2007-3, Class 4A1, (12 mo. LIBOR US + 1.25%), 1.62%, 06/25/47(a) | | | 357 | | | | 331,974 | |
TVC Mortgage Trust, Series 2020-RTL1, Class A1, 3.47%, 09/25/24(b) | | | 1,960 | | | | 1,995,274 | |
Verus Securitization Trust | | | | | | | | |
Series 2019-INV2, Class M1, 3.50%, 07/25/59(b)(d) | | | 660 | | | | 672,635 | |
Series 2020-4, Class A3,
2.32%, 05/25/65(b)(e) | | | 3,239 | | | | 3,251,116 | |
Series 2020-4, Class M1,
3.29%, 05/25/65(b)(d) | | | 3,120 | | | | 3,187,448 | |
Series 2020-INV1, Class A2, 3.04%, 03/25/60(b)(d) | | | 1,895 | | | | 1,944,926 | |
Series 2020-INV1, Class A3, 3.89%, 03/25/60(b)(d) | | | 1,800 | | | | 1,873,329 | |
| | |
| 96 | | 2 0 2 0 B L A C K R O C K A N N U A L R E P O R T T O S H A R E H O L D E R S |
| | |
Schedule of Investments (continued) September 30, 2020 | | Master Total Return Portfolio (Percentages shown are based on Net Assets) |
| | | | | | | | |
| Security | | Par (000) | | | Value | |
|
| Collateralized Mortgage Obligations (continued) | |
Visio Trust, Series 2020-1, Class M1, 4.45%, 08/25/55(b)(d) | | USD | 1,100 | | | $ | 1,125,190 | |
Vista Point Securitization Trust | | | | | | | | |
Series 2020-1, Class A1, 1.76%, 03/25/65(b)(d) | | | 15,343 | | | | 15,424,421 | |
Series 2020-2, Class A3, 2.50%, 04/25/65(b)(d) | | | 3,917 | | | | 3,919,684 | |
Series 2020-2, Class M1, 3.40%, 04/25/65(b)(d) | | | 1,480 | | | | 1,487,065 | |
Washington Mutual Mortgage Pass-Through Certificates Trust | | | | | | | | |
Series 2006-1, Class 4CB, 6.50%, 02/25/36 | | | 1,352 | | | | 1,172,253 | |
Series 2006-4, Class 1A1, 6.00%, 04/25/36 | | | 3,838 | | | | 3,859,210 | |
Series 2006-4, Class 3A1, 6.50%, 05/25/36(e) | | | 1,300 | | | | 1,214,394 | |
Series 2006-4, Class 3A5, 6.35%, 05/25/36(e) | | | 504 | | | | 470,865 | |
Series 2007-OA5, Class 2A, (Cost of Funds for the 11th District of San Francisco + 1.25%),
1.93%, 06/25/47(a) | | | 1,893 | | | | 1,613,507 | |
| | | | | | | | |
| | |
| | | | | | | 337,954,325 | |
|
| Commercial Mortgage-Backed Securities — 3.4% | |
1211 Avenue of the Americas Trust | | | | | | | | |
Series 2015-1211, Class D, 4.28%, 08/10/35(b)(d) | | | 6,157 | | | | 6,326,588 | |
Series 2015-1211, Class E, 4.28%, 08/10/35(b)(d) | | | 1,110 | | | | 1,063,595 | |
245 Park Avenue Trust | | | | | | | | |
Series 2017-245P, Class D, 3.78%, 06/05/37(b)(d) | | | 480 | | | | 483,087 | |
Series 2017-245P, Class E, 3.78%, 06/05/37(b)(d) | | | 1,699 | | | | 1,616,372 | |
280 Park Avenue Mortgage Trust | | | | | | | | |
Series 2017-280P, Class D, (1 mo. LIBOR US + 1.54%), 1.69%, 09/15/34(a)(b) | | | 2,920 | | | | 2,854,054 | |
Series 2017-280P, Class E, (1 mo. LIBOR US + 2.12%), 2.27%, 09/15/34(a)(b) | | | 5,835 | | | | 5,615,435 | |
Series 2017-280P, Class F, (1 mo. LIBOR US + 2.83%), 2.98%, 09/15/34(a)(b) | | | 630 | | | | 593,782 | |
AOA Mortgage Trust, Series 2015-1177, Class C, 3.11%, 12/13/29(b)(d) | | | 5,210 | | | | 5,174,850 | |
Ashford Hospitality Trust, Series 2018-ASHF, Class D, (1 mo. LIBOR US + 2.10%), 2.25%, 04/15/35(a)(b) | | | 740 | | | | 673,614 | |
Atrium Hotel Portfolio Trust | | | | | | | | |
Series 2017-ATRM, Class D, (1 mo. LIBOR US + 1.95%), 2.10%, 12/15/36(a)(b) | | | 4,840 | | | | 4,072,668 | |
Series 2017-ATRM, Class E, (1 mo. LIBOR US + 3.05%), 3.20%, 12/15/36(a)(b) | | | 568 | | | | 463,090 | |
Banc of America Merrill Lynch Commercial Mortgage Securities Trust | | | | | | | | |
Series 2015-200P, Class F, 3.72%, 04/14/33(b)(d) | | | 1,241 | | | | 1,244,784 | |
Series 2016-ISQ, Class C, 3.73%, 08/14/34(b)(d) | | | 445 | | | | 460,385 | |
Series 2016-ISQ, Class E, 3.73%, 08/14/34(b)(d) | | | 5,287 | | | | 5,085,486 | |
Series 2017-SCH, Class AF, (1 mo. LIBOR US + 1.00%), 1.15%, 11/15/33(a)(b) | | | 150 | | | | 141,853 | |
Series 2017-SCH, Class BF, (1 mo. LIBOR US + 1.40%), 1.55%, 11/15/33(a)(b) | | | 2,870 | | | | 2,699,762 | |
Series 2017-SCH, Class CL, (1 mo. LIBOR US + 1.50%), 1.65%, 11/15/32(a)(b) | | | 970 | | | | 829,263 | |
Series 2017-SCH, Class DL, (1 mo. LIBOR US + 2.00%), 2.15%, 11/15/32(a)(b) | | | 1,930 | | | | 1,578,296 | |
Series 2018-DSNY, Class C, (1 mo. LIBOR US + 1.35%), 1.50%, 09/15/34(a)(b) | | | 350 | | | | 329,404 | |
| | | | | | | | |
| Security | | Par (000) | | | Value | |
|
| Commercial Mortgage-Backed Securities (continued) | |
Banc of America Merrill Lynch Commercial Mortgage Securities Trust Series 2018-DSNY, Class D, (1 mo. LIBOR US + 1.70%), 1.85%, 09/15/34(a)(b) | | USD | 3,275 | | | $ | 3,026,263 | |
BANK | | | | | | | | |
Series 2017-BNK9, Class A4, 3.54%, 11/15/54 | | | 4,030 | | | | 4,593,786 | |
Series 2019-BN19, Class C, 4.17%, 08/15/61(d) | | | 686 | | | | 748,334 | |
Series 2019-BN21, Class A5, 2.85%, 10/17/52 | | | 1,088 | | | | 1,203,698 | |
Series 2020-BN28, Class D, 2.50%, 03/15/63(b) | | | 1,830 | | | | 1,599,540 | |
Barclays Commercial Mortgage Trust | | | | | | | | |
Series 2018-TALL, Class A, (1 mo. LIBOR US + 0.72%), 0.87%, 03/15/37(a)(b) | | | 918 | | | | 881,487 | |
Series 2018-TALL, Class D, (1 mo. LIBOR US + 1.45%), 1.60%, 03/15/37(a)(b) | | | 1,120 | | | | 1,050,091 | |
Bayview Commercial Asset Trust | | | | | | | | |
Series 2005-3A, Class A1, (1 mo. LIBOR US + 0.32%), 0.47%, 11/25/35(a)(b) | | | 2,359 | | | | 2,216,360 | |
Series 2005-4A, Class A1, (1 mo. LIBOR US + 0.30%), 0.45%, 01/25/36(a)(b) | | | 5,139 | | | | 4,802,573 | |
Series 2005-4A, Class A2, (1 mo. LIBOR US + 0.39%), 0.54%, 01/25/36(a)(b) | | | 80 | | | | 75,073 | |
Series 2005-4A, Class M1, (1 mo. LIBOR US + 0.45%), 0.60%, 01/25/36(a)(b) | | | 213 | | | | 200,377 | |
Series 2006-1A, Class A2, (1 mo. LIBOR US + 0.36%), 0.51%, 04/25/36(a)(b) | | | 271 | | | | 251,633 | |
Series 2006-2A, Class A2, (1 mo. LIBOR US + 0.28%), 0.43%, 07/25/36(a)(b) | | | 932 | | | | 868,453 | |
Series 2006-3A, Class A1, (1 mo. LIBOR US + 0.25%), 0.40%, 10/25/36(a)(b) | | | 464 | | | | 430,682 | |
Series 2006-3A, Class A2, (1 mo. LIBOR US + 0.30%), 0.45%, 10/25/36(a)(b) | | | 323 | | | | 300,872 | |
Series 2006-4A, Class A1, (1 mo. LIBOR US + 0.23%), 0.38%, 12/25/36(a)(b) | | | 701 | | | | 651,180 | |
Series 2007-2A, Class A1, (1 mo. LIBOR US + 0.27%), 0.42%, 07/25/37(a)(b) | | | 10,291 | | | | 9,642,869 | |
Series 2007-6A, Class A4A, (1 mo. LIBOR US + 1.50%), 1.65%, 12/25/37(a)(b) | | | 1,980 | | | | 1,873,344 | |
Series 2008-2, Class A4A, (1 mo. LIBOR US + 2.50%), 2.65%, 04/25/38(a)(b) | | | 2,533 | | | | 2,537,617 | |
BBCMS Mortgage Trust | | | | | | | | |
Series 2018-CHRS, Class E, 4.41%, 08/05/38(b)(d) | | | 980 | | | | 671,230 | |
Series 2019-BWAY, Class D, (1 mo. LIBOR US + 2.16%), 2.31%, 11/25/34(a)(b) | | | 2,450 | | | | 2,267,003 | |
Series 2020-C6, Class A4, 2.64%, 02/15/53 | | | 4,593 | | | | 5,018,221 | |
BBCMS Trust, Series 2015-SRCH, Class A1, 3.31%, 08/10/35(b) | | | 2,705 | | | | 2,850,412 | |
BB-UBS Trust, Series 2012-SHOW, Class E, 4.16%, 11/05/36(b)(d) | | | 790 | | | | 634,720 | |
Bear Stearns Commercial Mortgage Securities Trust | | | | | | | | |
Series 2005-PWR7, Class B, 5.21%, 02/11/41(d) | | | 393 | | | | 390,249 | |
Series 2007-T26, Class AM, 5.51%, 01/12/45(d) | | | 754 | | | | 752,748 | |
Benchmark Mortgage Trust | | | | | | | | |
Series 2018-B3, Class D,
3.21%, 04/10/51(b)(d) | | | 210 | | | | 164,357 | |
Series 2018-B5, Class A3, 3.94%, 07/15/51 | | | 4,840 | | | | 5,677,743 | |
Series 2019-B10, Class 3CCA, 4.03%, 03/15/62(b)(d) | | | 3,610 | | | | 3,730,518 | |
| | |
S C H E D U L E O F I N V E S T M E N T S | | 97 |
| | |
Schedule of Investments (continued) September 30, 2020 | | Master Total Return Portfolio (Percentages shown are based on Net Assets) |
| | | | | | | | |
| Security | | Par (000) | | | Value | |
|
| Commercial Mortgage-Backed Securities (continued) | |
Benchmark Mortgage Trust | | | | | | | | |
Series 2019-B14, Class 225C, 3.40%, 12/15/62(b)(d) | | USD | 1,411 | | | $ | 1,363,086 | |
Series 2020-B16, Class C, 3.66%, 02/15/53(d) | | | 623 | | | | 617,057 | |
Series 2020-B16, Class D, 2.50%, 02/15/53(b) | | | 957 | | | | 806,578 | |
BFLD Trust, Series 2020-EYP, Class E, 3.90%, 10/15/35(a)(b) | | | 5,885 | | | | 5,885,000 | |
BHMS, Series 2018-ATLS, Class A, (1 mo. LIBOR US + 1.25%),
1.40%, 07/15/35(a)(b) | | | 2,770 | | | | 2,656,171 | |
BWAY Mortgage Trust | | | | | | | | |
Series 2013-1515, Class A2, 3.45%, 03/10/33(b) | | | 5,084 | | | | 5,471,445 | |
Series 2013-1515, Class D, 3.63%, 03/10/33(b). | | | 1,400 | | | | 1,414,696 | |
Series 2013-1515, Class E, 3.72%, 03/10/33(b). | | | 250 | | | | 248,622 | |
Series 2013-1515, Class F, 4.06%, 03/10/33(b)(d) | | | 250 | | | | 246,814 | |
Series 2015-1740, Class E, 4.81%, 01/10/35(b)(d) | | | 688 | | | | 640,006 | |
BX Commercial Mortgage Trust | | | | | | | | |
Series 2018-BIOA, Class F, (1 mo. LIBOR US + 2.47%),
2.62%, 03/15/37(a)(b) | | | 3,350 | | | | 3,228,610 | |
Series 2018-IND, Class H, (1 mo. LIBOR US + 3.00%), 3.15%, 11/15/35(a)(b) | | | 10,976 | | | | 10,703,041 | |
Series 2019-XL, Class G, (1 mo. LIBOR US + 2.30%), 2.45%, 10/15/36(a)(b) | | | 18,607 | | | | 18,304,773 | |
Series 2019-XL, Class J, (1 mo. LIBOR US + 2.65%), 2.80%, 10/15/36(a)(b) | | | 21,704 | | | | 21,166,091 | |
Series 2020-BXLP, Class F, (1 mo. LIBOR US + 2.00%),
2.15%, 12/15/36(a)(b) | | | 21,806 | | | | 21,451,707 | |
Series 2020-BXLP, Class G, (1 mo. LIBOR US + 2.50%),
2.65%, 12/15/36(a)(b) | | | 3,627 | | | | 3,576,645 | |
Series 2020-VIV3, Class B, 3.54%, 03/09/44(b) | | | 2,700 | | | | 2,713,181 | |
Series 2020-VKNG, Class F, (1 mo. LIBOR US + 2.75%),
2.95%, 10/15/37(a)(b) | | | 4,670 | | | | 4,670,000 | |
BX Trust | | | | | | | | |
Series 2019-OC11, Class A, 3.20%, 12/09/41(b) | | | 1,830 | | | | 1,937,109 | |
Series 2019-OC11, Class D, 4.08%, 12/09/41(b)(d) | | | 9,585 | | | | 9,299,794 | |
Series 2019-OC11, Class E, 4.08%, 12/09/41(b)(d) | | | 11,936 | | | | 10,965,341 | |
BXP Trust | | | | | | | | |
Series 2017-CC, Class D, 3.67%, 08/13/37(b)(d) | | | 750 | | | | 746,580 | |
Series 2017-CC, Class E, 3.67%, 08/13/37(b)(d) | | | 1,450 | | | | 1,347,806 | |
Series 2017-GM, Class D, 3.54%, 06/13/39(b)(d) | | | 590 | | | | 616,995 | |
Series 2017-GM, Class E, 3.54%, 06/13/39(b)(d) | | | 1,240 | | | | 1,240,463 | |
CAMB Commercial Mortgage Trust, Series 2019- LIFE, Class D, (1 mo. LIBOR US + 1.75%),
1.90%, 12/15/37(a)(b) | | | 3,619 | | | | 3,609,576 | |
CD Mortgage Trust | | | | | | | | |
Series 2017-CD5, Class B, 3.96%, 08/15/50(d) | | | 2,091 | | | | 2,289,145 | |
Series 2017-CD6, Class C, 4.41%, 11/13/50(d) | | | 1,290 | | | | 1,258,246 | |
CFCRE Commercial Mortgage Trust | | | | | | | | |
Series 2016-C3, Class A3, 3.87%, 01/10/48 | | | 410 | | | | 459,596 | |
Series 2018-TAN, Class B, 4.69%, 02/15/33(b) | | | 944 | | | | 954,987 | |
Series 2018-TAN, Class C, 5.30%, 02/15/33(b) | | | 1,160 | | | | 1,132,050 | |
CFK Trust, Series 2019-FAX, Class D, 4.64%, 01/15/39(b)(d) | | | 2,643 | | | | 2,725,317 | |
| | | | | | | | |
| Security | | Par (000) | | | Value | |
|
| Commercial Mortgage-Backed Securities (continued) | |
CGDBB Commercial Mortgage Trust | | | | | | | | |
Series 2017-BIOC, Class A, (1 mo. LIBOR US + 0.79%), 0.94%, 07/15/32(a)(b) | | USD | 2,960 | | | $ | 2,959,407 | |
Series 2017-BIOC, Class D, (1 mo. LIBOR US + 1.60%), 1.75%, 07/15/32(a)(b) | | | 4,348 | | | | 4,343,209 | |
Series 2017-BIOC, Class E, (1 mo. LIBOR US + 2.15%), 2.30%, 07/15/32(a)(b) | | | 6,833 | | | | 6,765,872 | |
CHC Commercial Mortgage Trust, Series 2019- CHC, Class B, (1 mo. LIBOR US + 1.50%), 1.65%, 06/15/34(a)(b) | | | 7,262 | | | | 6,849,661 | |
Citigroup Commercial Mortgage Trust | | | | | | | | |
Series 2014-GC19, Class C, 5.26%, 03/10/47(d) | | | 440 | | | | 462,147 | |
Series 2015-GC27, Class B, 3.77%, 02/10/48 | | | 990 | | | | 1,034,062 | |
Series 2016-C1, Class D,
5.12%, 05/10/49(b)(d). | | | 450 | | | | 382,471 | |
Series 2016-GC37, Class C, 5.08%, 04/10/49(d) | | | 640 | | | | 620,760 | |
Series 2016-P3, Class C, 5.05%, 04/15/49(d) | | | 120 | | | | 117,023 | |
Series 2016-P3, Class D,
2.80%, 04/15/49(b)(d) | | | 137 | | | | 83,864 | |
Series 2017-C4, Class A4, 3.47%, 10/12/50 | | | 1,220 | | | | 1,384,103 | |
Series 2018-C6, Class A4, 4.41%, 11/10/51 | | | 1,960 | | | | 2,355,363 | |
Series 2019-C7, Class A4, 3.10%, 12/15/72 | | | 1,130 | | | | 1,275,681 | |
Series 2019-PRM, Class E,
4.89%, 05/10/36(b)(d) | | | 4,801 | | | | 4,934,415 | |
Series 2019-PRM, Class F,
4.89%, 05/10/36(b)(d) | | | 5,180 | | | | 5,212,311 | |
Series 2019-SMRT, Class D, 4.90%, 01/10/36(b)(d) | | | 7,200 | | | | 7,366,636 | |
Series 2019-SMRT, Class E, 4.90%, 01/10/36(b)(d) | | | 419 | | | | 419,850 | |
Citigroup/Deutsche Bank Commercial Mortgage Trust | | | | | | | | |
Series 2006-CD3, Class AM, 5.65%, 10/15/48 . | | | 3,173 | | | | 3,244,205 | |
Series 2017-CD3, Class A4, 3.63%, 02/10/50 | | | 850 | | | | 963,361 | |
Series 2017-CD4, Class A4, 3.51%, 05/10/50(d) | | | 3,400 | | | | 3,839,800 | |
Commercial Mortgage Pass-Through Certificates | | | | | | | | |
Series 2014-CR14, Class A4, 4.24%, 02/10/47(d) | | | 855 | | | | 928,151 | |
Series 2014-CR15, Class C, 4.89%, 02/10/47(d) | | | 3,920 | | | | 4,164,073 | |
Series 2014-CR18, Class A4, 3.55%, 07/15/47 | | | 372 | | | | 400,885 | |
Series 2014-CR19, Class A5, 3.80%, 08/10/47 | | | 1,391 | | | | 1,527,020 | |
Series 2015-CR24, Class A5, 3.70%, 08/10/48 | | | 1,370 | | | | 1,532,938 | |
Series 2015-CR25, Class A4, 3.76%, 08/10/48 | | | 3,505 | | | | 3,921,114 | |
Series 2015-LC21, Class C,
4.48%, 07/10/48(d) | | | 1,600 | | | | 1,556,577 | |
Series 2017-COR2, Class A3, 3.51%, 09/10/50 | | | 1,180 | | | | 1,320,040 | |
Series 2017-COR2, Class D, 3.00%, 09/10/50(b) | | | 379 | | | | 302,818 | |
Series 2018-HCLV, Class B, (1 mo. LIBOR US + 1.40%), 1.55%, 09/15/33(a)(b) | | | 1,420 | | | | 1,348,008 | |
Commercial Mortgage Trust | | | | | | | | |
Series 2013-GAM, Class A2, 3.37%, 02/10/28(b) | | | 1,656 | | | | 1,586,934 | |
Series 2013-GAM, Class E,
3.53%, 02/10/28(b)(d) | | | 2,270 | | | | 1,617,844 | |
Series 2014-CR21, Class A3, 3.53%, 12/10/47 | | | 1,352 | | | | 1,462,867 | |
Series 2014-LC15, Class A4, 4.01%, 04/10/47 | | | 2,350 | | | | 2,558,514 | |
Series 2014-UBS4, Class C, 4.80%, 08/10/47(d) | | | 641 | | | | 636,050 | |
| | |
| 98 | | 2 0 2 0 B L A C K R O C K A N N U A L R E P O R T T O S H A R E H O L D E R S |
| | |
Schedule of Investments (continued) September 30, 2020 | | Master Total Return Portfolio (Percentages shown are based on Net Assets) |
| | | | | | | | |
| Security | | Par (000) | | | Value | |
|
| Commercial Mortgage-Backed Securities (continued) | |
Commercial Mortgage Trust | | | | | | | | |
Series 2015-CR23, Class A4, 3.50%, 05/10/48(c) | | USD | 810 | | | $ | 889,001 | |
Series 2015-LC19, Class D, 2.87%, 02/10/48(b) | | | 126 | | | | 112,030 | |
Series 2015-LC23, Class A4, 3.77%, 10/10/48 | | | 1,040 | | | | 1,167,869 | |
Series 2016-667M, Class D, 3.29%, 10/10/36(b)(d) | | | 630 | | | | 613,579 | |
CORE Mortgage Trust, Series 2019-CORE, Class F, (1 mo. LIBOR US + 2.35%), 2.50%, 12/15/31(a)(b) | | | 3,200 | | | | 3,073,030 | |
Credit Suisse Commercial Mortgage Trust | | | | | | | | |
Series 2017-CALI, Class C, 3.90%, 11/10/32(b)(d) | | | 1,729 | | | | 1,819,038 | |
Series 2017-PFHP, Class A, (1 mo. LIBOR US + 0.95%),
1.10%, 12/15/30(a)(b) | | | 900 | | | | 875,431 | |
Series 2017-TIME, Class A, 3.65%, 11/13/39(b). | | | 850 | | | | 846,341 | |
Series 2020-NET, Class D, 3.83%, 08/15/37(b)(d) | | | 710 | | | | 710,813 | |
Series 2020-NET, Class E, 3.83%, 08/15/37(b)(d) | | | 3,580 | | | | 3,528,084 | |
CSAIL Commercial Mortgage Trust | | | | | | | | |
Series 2015-C2, Class A4, 3.50%, 06/15/57 | | | 1,160 | | | | 1,278,216 | |
Series 2015-C2, Class B,
4.21%, 06/15/57(d) | | | 2,020 | | | | 1,932,950 | |
Series 2016-C5, Class B,
4.46%, 11/15/48(d) | | | 2,410 | | | | 2,598,375 | |
Series 2018-C14, Class C, 5.05%, 11/15/51(d) | | | 300 | | | | 322,302 | |
Series 2018-CX12, Class A4, 4.22%, 08/15/51(d) | | | 460 | | | | 547,091 | |
Series 2019-C15, Class A4, 4.05%, 03/15/52 | | | 4,080 | | | | 4,760,394 | |
Series 2019-C15, Class D, 3.00%, 03/15/52(b) | | | 1,285 | | | | 945,739 | |
Series 2019-C16, Class C, 4.24%, 06/15/52(d) | | | 2,919 | | | | 2,871,609 | |
Series 2019-C17, Class C, 3.93%, 09/15/52 | | | 3,158 | | | | 3,397,415 | |
Series 2019-C17, Class D, 2.50%, 09/15/52(b) | | | 2,481 | | | | 1,826,769 | |
Series 2020-C19, Class A3, 2.56%, 03/15/53 | | | 10,090 | | | | 10,859,335 | |
DBGS Mortgage Trust | | | | | | | | |
Series 2018-5BP, Class B, (1 mo. LIBOR US + 0.83%), 0.98%, 06/15/33(a)(b) | | | 2,890 | | | | 2,840,552 | |
Series 2019-1735, Class F, 4.33%, 04/10/37(b)(d) | | | 1,144 | | | | 871,356 | |
Del Amo Fashion Center Trust, Series 2017-AMO, Class D, 3.76%, 06/05/35(b)(d) | | | 962 | | | | 711,567 | |
Deutsche Bank JPMorgan Mortgage Trust, Series 2016-C1, Class A4, 3.28%, 05/10/49 | | | 1,430 | | | | 1,578,500 | |
Deutsche Bank UBS Mortgage Trust | | | | | | | | |
Series 2017-BRBK, Class A, 3.45%, 10/10/34(b) | | | 2,540 | | | | 2,723,377 | |
Series 2017-BRBK, Class D, 3.65%, 10/10/34(b)(c)(d) | | | 1,800 | | | | 1,789,186 | |
Series 2017-BRBK, Class E, 3.65%, 10/10/34(b)(d) | | | 3,560 | | | | 3,606,375 | |
Series 2017-BRBK, Class F, 3.65%, 10/10/34(b)(d) | | | 1,270 | | | | 1,260,654 | |
Eleven Madison Trust Mortgage Trust, Series 2015-11MD, Class A, 3.67%, 09/10/35(b)(d) | | | 1,190 | | | | 1,297,307 | |
Exantas Capital Corp. Ltd., Series 2019-RSO7, Class AS, (1 mo. LIBOR US + 1.50%), 1.65%, 04/15/36(a)(b) | | | 3,495 | | | | 3,429,894 | |
FREMF Mortgage Trust | | | | | | | | |
Series 2017-KGX1, Class BFX, 3.71%, 10/25/27(b)(d) | | | 1,190 | | | | 1,251,095 | |
| | | | | | | | |
| Security | | Par (000) | | | Value | |
|
| Commercial Mortgage-Backed Securities (continued) | |
FREMF Mortgage Trust | | | | | | | | |
Series 2018-K74, Class B,
4.23%, 02/25/51(b)(d) | | USD | 120 | | | $ | 135,507 | |
Series 2018-K80, Class B,
4.37%, 08/25/50(b)(d) | | | 1,510 | | | | 1,738,366 | |
FRESB Mortgage Trust | | | | | | | | |
Series 2018-SB52, Class A10F, 3.48%, 06/25/28(d) | | | 2,299 | | | | 2,461,480 | |
Series 2018-SB53, Class A10F, 3.66%, 06/25/28(d) | | | 1,388 | | | | 1,531,901 | |
GPMT Ltd., Series 2018-FL1, Class A, (1 mo. LIBOR US + 0.90%), 1.06%, 11/21/35(a)(b) | | | 405 | | | | 403,132 | |
GRACE Mortgage Trust, Series 2014-GRCE, Class F, 3.71%, 06/10/28(b)(d) | | | 1,662 | | | | 1,650,945 | |
GS Mortgage Securities Corp. II | | | | | | | | |
Series 2005-ROCK, Class A, 5.37%, 05/03/32(b) | | | 2,750 | | | | 3,192,428 | |
Series 2012-TMSQ, Class D, 3.57%, 12/10/30(b)(d) | | | 1,210 | | | | 1,057,775 | |
GS Mortgage Securities Corp. Trust | | | | | | | | |
Series 2017-500K, Class D, (1 mo. LIBOR US + 1.30%), 1.55%, 07/15/32(a)(b) | | | 230 | | | | 228,298 | |
Series 2017-500K, Class E, (1 mo. LIBOR US + 1.50%), 1.75%, 07/15/32(a)(b) | | | 480 | | | | 475,164 | |
Series 2017-500K, Class F, (1 mo. LIBOR US + 1.80%), 2.15%, 07/15/32(a)(b) | | | 549 | | | | 542,117 | |
Series 2017-500K, Class G, (1 mo. LIBOR US + 2.50%), 2.85%, 07/15/32(a)(b) | | | 170 | | | | 167,583 | |
Series 2017-GPTX, Class A, 2.86%, 05/10/34(b) | | | 2,290 | | | | 2,249,502 | |
Series 2019-BOCA, Class A, (1 mo. LIBOR US + 1.20%), 1.35%, 06/15/38(a)(b) | | | 1,431 | | | | 1,395,399 | |
Series 2019-SOHO, Class A, (1 mo. LIBOR US + 0.90%), 1.05%, 06/15/36(a)(b) | | | 3,715 | | | | 3,687,417 | |
Series 2019-SOHO, Class E, (1 mo. LIBOR US + 1.87%), 2.03%, 06/15/36(a)(b) | | | 1,723 | | | | 1,616,008 | |
GS Mortgage Securities Trust | | | | | | | | |
Series 2012-GCJ9, Class C, 4.45%, 11/10/45(b)(d) | | | 1,207 | | | | 1,223,841 | |
Series 2014-GC20, Class B, 4.53%, 04/10/47(d) | | | 140 | | | | 146,648 | |
Series 2014-GC24, Class A5, 3.93%, 09/10/47. | | | 882 | | | | 968,716 | |
Series 2015-590M, Class E,
3.93%, 10/10/35(b)(d) | | | 1,790 | | | | 1,795,853 | |
Series 2015-GC32, Class C, 4.57%, 07/10/48(d) | | | 290 | | | | 284,717 | |
Series 2015-GS1, Class A3, 3.73%, 11/10/48 | | | 670 | | | | 747,202 | |
Series 2016-RENT, Class C,
4.20%, 02/10/29(b)(d) | | | 1,070 | | | | 1,064,985 | |
Series 2017-GS7, Class D,
3.00%, 08/10/50(b) | | | 530 | | | | 427,140 | |
Series 2017-GS7, Class E,
3.00%, 08/10/50(b) | | | 180 | | | | 131,977 | |
Series 2019-GSA1, Class C, 3.93%, 11/10/52(d) | | | 520 | | | | 482,774 | |
GSCG Trust, Series 2019-600C, Class F, 4.12%, 09/06/34(b)(d) | | | 1,950 | | | | 1,866,247 | |
HMH Trust, Series 2017-NSS, Class A, 3.06%, 07/05/31(b) | | | 3,390 | | | | 3,269,078 | |
Hudson Yards Mortgage Trust | | | | | | | | |
Series 2016-10HY, Class A,
2.84%, 08/10/38(b) | | | 2,640 | | | | 2,835,205 | |
Series 2019-30HY, Class E,
3.56%, 07/10/39(b)(d) | | | 2,178 | | | | 2,126,869 | |
| | |
S C H E D U L E O F I N V E S T M E N T S | | 99 |
| | |
Schedule of Investments (continued) September 30, 2020 | | Master Total Return Portfolio (Percentages shown are based on Net Assets) |
| | | | | | | | |
| Security | | Par (000) | | | Value | |
|
| Commercial Mortgage-Backed Securities (continued) | |
Hudson Yards Mortgage Trust Series 2019-55HY, Class F, 3.04%, 12/10/41(b)(d) | | USD | 4,179 | | | $ | 3,668,117 | |
IMT Trust | | | | | | | | |
Series 2017-APTS, Class AFX, 3.48%, 06/15/34(b) | | | 1,540 | | | | 1,637,139 | |
Series 2017-APTS, Class DFX, 3.61%, 06/15/34(b)(d) | | | 1,600 | | | | 1,533,843 | |
Series 2017-APTS, Class EFX, 3.61%, 06/15/34(b)(d) | | | 810 | | | | 757,012 | |
JPMBB Commercial Mortgage Securities Trust | | | | | | | | |
Series 2014-C21, Class A5, 3.78%, 08/15/47 | | | 1,420 | | | | 1,555,593 | |
Series 2014-C22, Class A4, 3.80%, 09/15/47 | | | 563 | | | | 617,499 | |
Series 2014-C22, Class B, 4.71%, 09/15/47(d) | | | 670 | | | | 669,628 | |
Series 2014-C26, Class A4, 3.49%, 01/15/48 | | | 1,247 | | | | 1,366,608 | |
Series 2015-C33, Class D1, 4.27%, 12/15/48(b)(d) | | | 1,873 | | | | 1,469,671 | |
JPMDB Commercial Mortgage Securities Trust, Series 2018-C8, Class A4, 4.21%, 06/15/51 | | | 965 | | | | 1,147,808 | |
JPMorgan Chase Commercial Mortgage Securities Trust | | | | | | | | |
Series 2012-CBX, Class A4FL, (1 mo. LIBOR US + 1.30%),
1.45%, 06/15/45(a)(b) | | | 401 | | | | 400,557 | |
Series 2014-C20, Class A5, 3.81%, 07/15/47 | | | 1,990 | | | | 2,171,714 | |
Series 2015-JP1, Class A5, 3.91%, 01/15/49 | | | 339 | | | | 384,282 | |
Series 2015-JP1, Class C, 4.87%, 01/15/49(d) | | | 710 | | | | 714,523 | |
Series 2016-NINE, Class A, 2.95%, 09/06/38(b)(d) | | | 647 | | | | 695,734 | |
Series 2017-FL10, Class E, (1 mo. LIBOR US + 3.90%),
4.05%, 06/15/32(a)(b) | | | 560 | | | | 522,516 | |
Series 2017-JP5, Class D, 4.78%, 03/15/50(b)(d) | | | 1,650 | | | | 1,218,528 | |
Series 2017-JP6, Class A5, 3.49%, 07/15/50 | | | 1,180 | | | | 1,336,406 | |
Series 2017-JP7, Class B, 4.05%, 09/15/50 | | | 320 | | | | 344,965 | |
Series 2018-AON, Class A, 4.13%, 07/05/31(b) | | | 2,825 | | | | 3,006,352 | |
Series 2018-AON, Class D, 4.77%, 07/05/31(b)(d) | | | 1,518 | | | | 1,565,621 | |
Series 2018-WPT, Class DFX, 5.35%, 07/05/33(b) | | | 1,996 | | | | 1,985,980 | |
Series 2019-BKWD, Class E, (1 mo. LIBOR US + 2.60%),
2.75%, 09/15/29(a)(b) | | | 3,080 | | | | 2,727,973 | |
Series 2019-COR5, Class A3, 3.12%, 06/13/52 | | | 1,700 | | | | 1,895,950 | |
Series 2019-COR5, Class C, 3.75%, 06/13/52 . | | | 988 | | | | 945,938 | |
Series 2019-MFP, Class E, (1 mo. LIBOR US + 2.16%),
2.31%, 07/15/36(a)(b) | | | 2,460 | | | | 2,308,943 | |
Series 2019-MFP, Class F, (1 mo. LIBOR US + 3.00%),
3.15%, 07/15/36(a)(b) | | | 891 | | | | 829,060 | |
Series 2019-OSB, Class E, 3.91%, 06/05/39(b)(d) | | | 1,384 | | | | 1,177,662 | |
Series 2020-MKST, Class E, (1 mo. LIBOR US + 2.25%),
2.40%, 12/15/36(a)(b) | | | 1,973 | | | | 1,758,493 | |
KNDL Mortgage Trust | | | | | | | | |
Series 2019-KNSQ, Class E, (1 mo. LIBOR US + 1.80%),
1.95%, 05/15/36(a)(b) | | | 11,283 | | | | 11,160,081 | |
Series 2019-KNSQ, Class F, (1 mo. LIBOR US + 2.00%),
2.15%, 05/15/36(a)(b) | | | 2,550 | | | | 2,401,074 | |
Ladder Capital Commercial Mortgage Trust | | | | | | | | |
Series 2014-909, Class A, 3.39%, 05/15/31(b) | | | 2,030 | | | | 2,037,661 | |
Series 2014-909, Class C, 4.03%, 05/15/31(b)(d) | | | 2,560 | | | | 2,555,889 | |
| | | | | | | | |
| Security | | Par (000) | | | Value | |
|
| Commercial Mortgage-Backed Securities (continued) | |
Ladder Capital Commercial Mortgage Trust Series 2014-909, Class D,
4.03%, 05/15/31(b)(d) | | USD | 4,633 | | | $ | 4,600,125 | |
Lehman Brothers Small Balance Commercial Mortgage Trust | | | | | | | | |
Series 2006-2A, Class M2, (1 mo. LIBOR US + 0.39%), 0.54%, 09/25/36(a)(b) | | | 315 | | | | 305,531 | |
Series 2007-1A, Class 1A, (1 mo. LIBOR US + 0.25%), 0.40%, 03/25/37(a)(b) | | | 757 | | | | 718,075 | |
LSTAR Commercial Mortgage Trust, Series 2015-3, Class AS,
3.35%, 04/20/48(b)(d) | | | 1,095 | | | | 1,108,765 | |
MAD Mortgage Trust | | | | | | | | |
Series 2017-330M, Class D, 4.11%, 08/15/34(b)(d) | | | 1,085 | | | | 1,102,212 | |
Series 2017-330M, Class E, 4.17%, 08/15/34(b)(d) | | | 1,846 | | | | 1,835,176 | |
Manhattan West, Series 2020-1MW, Class D, 2.41%, 09/10/39(b)(d) | | | 1,259 | | | | 1,224,429 | |
MFT Trust | | | | | | | | |
Series 2020-ABC, Class C, 3.48%, 02/10/42(b)(d) | | | 6,719 | | | | 6,450,352 | |
Series 2020-ABC, Class D, 3.48%, 02/10/42(b)(d) | | | 4,800 | | | | 4,415,264 | |
Morgan Stanley Bank of America Merrill Lynch Trust | | | | | | | | |
Series 2014-C16, Class A5, 3.89%, 06/15/47 | | | 3,880 | | | | 4,221,272 | |
Series 2015-C23, Class A4, 3.72%, 07/15/50 | | | 1,016 | | | | 1,125,741 | |
Series 2015-C23, Class D,
4.29%, 07/15/50(b)(d) | | | 110 | | | | 97,052 | |
Series 2015-C24, Class A4, 3.73%, 05/15/48 | | | 840 | | | | 937,396 | |
Series 2015-C25, Class B,
4.68%, 10/15/48(d) | | | 2,910 | | | | 3,255,610 | |
Series 2015-C25, Class C,
4.68%, 10/15/48(d) | | | 430 | | | | 459,236 | |
Series 2015-C26, Class A5, 3.53%, 10/15/48 | | | 1,144 | | | | 1,271,155 | |
Series 2015-C26, Class D,
3.06%, 10/15/48(b) | | | 372 | | | | 264,802 | |
Series 2016-C31, Class A5, 3.10%, 11/15/49 | | | 2,903 | | | | 3,188,237 | |
Series 2017-C33, Class C,
4.56%, 05/15/50(d) | | | 840 | | | | 826,149 | |
Morgan Stanley Capital Barclays Bank Trust, Series 2016-MART, Class A, 2.20%, 09/13/31(b) | | | 820 | | | | 817,665 | |
Morgan Stanley Capital I Trust | | | | | | | | |
Series 2006-IQ11, Class C, 6.05%, 10/15/42(d) | | | 1,601 | | | | 1,586,728 | |
Series 2007-T27, Class AJ, 6.22%, 06/11/42(d) | | | 1,763 | | | | 1,765,817 | |
Series 2014-150E, Class D, 4.44%, 09/09/32(b)(d) | | | 3,015 | | | | 3,040,990 | |
Series 2014-150E, Class F, 4.44%, 09/09/32(b)(d) | | | 508 | | | | 474,713 | |
Series 2014-CPT, Class E, 3.56%, 07/13/29(b)(d) | | | 250 | | | | 253,402 | |
Series 2015-MS1, Class A4, 3.78%, 05/15/48(d) | | | 420 | | | | 466,175 | |
Series 2015-MS1, Class C, 4.17%, 05/15/48(d) | | | 1,000 | | | | 927,315 | |
Series 2015-MS1, Class D, 4.17%, 05/15/48(b)(d) | | | 310 | | | | 255,887 | |
Series 2017-CLS, Class E, (1 mo. LIBOR US + 1.95%), 2.10%, 11/15/34(a)(b) | | | 471 | | | | 460,710 | |
Series 2017-CLS, Class F, (1 mo. LIBOR US + 2.60%), 2.75%, 11/15/34(a)(b) | | | 6,092 | | | | 5,928,846 | |
Series 2017-H1, Class C,
4.28%, 06/15/50(d) | | | 560 | | | | 568,760 | |
Series 2017-H1, Class D,
2.55%, 06/15/50(b) | | | 4,190 | | | | 3,052,885 | |
Series 2017-HR2, Class D,
2.73%, 12/15/50(c) | | | 430 | | | | 348,300 | |
Series 2018-H3, Class A5, 4.18%, 07/15/51 | | | 175 | | | | 207,734 | |
Series 2018-H3, Class C,
5.01%, 07/15/51(d) | | | 420 | | | | 433,998 | |
| | |
| 100 | | 2 0 2 0 B L A C K R O C K A N N U A L R E P O R T T O S H A R E H O L D E R S |
| | |
Schedule of Investments (continued) September 30, 2020 | | Master Total Return Portfolio (Percentages shown are based on Net Assets) |
| | | | | | | | |
| Security | | Par (000) | | | Value | |
|
| Commercial Mortgage-Backed Securities (continued) | |
Morgan Stanley Capital I Trust | | | | | | | | |
Series 2018-L1, Class A3, 4.14%, 10/15/51 | | USD | 940 | | | $ | 1,080,296 | |
Series 2018-MP, Class E,
4.42%, 07/11/40(b)(d). | | | 3,789 | | | | 2,993,667 | |
Series 2018-SUN, Class A, (1 mo. LIBOR US + 1.15%),
1.30%, 07/15/35(a)(b) | | | 1,410 | | | | 1,364,426 | |
Series 2018-SUN, Class F, (1 mo. LIBOR US + 2.80%),
2.95%, 07/15/35(a)(b) | | | 417 | | | | 386,851 | |
Series 2019-H6, Class A4, 3.42%, 06/15/52 | | | 1,939 | | | | 2,205,906 | |
Series 2019-H7, Class A4, 3.26%, 07/15/52 | | | 2,450 | | | | 2,760,230 | |
Series 2019-L2, Class A4, 4.07%, 03/15/52 | | | 1,485 | | | | 1,751,518 | |
Series 2019-NUGS, Class E, (1 mo. LIBOR US + 2.24%),
3.74%, 12/15/36(a)(b) | | | 1,400 | | | | 1,277,949 | |
Series 2020-L4, Class D, 2.50%, 02/15/53(b) | | | 4,269 | | | | 3,408,750 | |
Morgan Stanley Capital I, Inc., Series 2018-H3, Class D, 3.00%, 07/15/51(b) | | | 960 | | | | 689,405 | |
MSCG Trust, Series 2018-SELF, Class F, (1 mo. LIBOR US + 3.05%),
3.20%, 10/15/37(a)(b) | | | 2,550 | | | | 2,403,298 | |
MSDB Trust, Series 2017-712F, Class B, 3.57%, 07/11/39(b)(d) | | | 1,650 | | | | 1,728,843 | |
Natixis Commercial Mortgage Securities Trust | | | | | | | | |
Series 2018-FL1, Class A, (1 mo. LIBOR US + 0.95%), 1.11%, 06/15/35(a)(b) | | | 756 | | | | 729,047 | |
Series��2018-FL1, Class MCR1, (1 mo. LIBOR US + 2.35%),
2.51%, 06/15/35(a)(b) | | | 646 | | | | 608,196 | |
Series 2018-SOX, Class A, 4.40%, 06/17/38(b) | | | 4,162 | | | | 4,558,666 | |
Series 2019-LVL, Class D,
4.44%, 08/15/38(b)(d) | | | 1,550 | | | | 1,519,259 | |
Olympic Tower Mortgage Trust, Series 2017-OT, Class E,
4.08%, 05/10/39(b)(d) | | | 2,910 | | | | 2,504,883 | |
One Market Plaza Trust, Series 2017-1MKT, Class D, 4.15%, 02/10/32(b) | | | 4,327 | | | | 4,417,661 | |
PFP Ltd. | | | | | | | | |
Series 2019-5, Class A, (1 mo. LIBOR US + 0.97%), 1.12%, 04/14/36(a)(b) | | | 1,195 | | | | 1,179,714 | |
Series 2019-5, Class AS, (1 mo. LIBOR US + 1.42%), 1.57%, 04/14/36(a)(b) | | | 900 | | | | 885,046 | |
Prima Capital CRE Securitization Ltd. | | | | | | | | |
Series 2015-4A, Class C,
4.00%, 08/24/49(b)(c) | | | 1,590 | | | | 1,536,417 | |
Series 2016-6A, Class C,
4.00%, 08/24/40(b)(c) | | | 7,170 | | | | 7,131,282 | |
Scorpio European Loan Conduit No. 34 DAC, Series 34A, Class C, (3 mo. LIBOR GBP + 2.10%),
2.17%, 05/17/29(a)(b) | | GBP | 1,185 | | | | 1,434,482 | |
SG Commercial Mortgage Securities Trust, Series 2019-PREZ, Class D, 3.59%, 09/15/39(b)(d) | | USD | 2,200 | | | | 2,174,727 | |
U.S. | | | | | | | | |
Series 2018-USDC, Class E, 4.64%, 05/13/38(b)(d) | | | 1,890 | | | | 1,567,486 | |
Series 2018-USDC, Class F, 4.64%, 05/13/38(b)(d) | | | 1,420 | | | | 1,041,189 | |
UBS Commercial Mortgage Trust, Series 2017-C7, Class A4, 3.68%, 12/15/50 | | | 880 | | | | 1,012,787 | |
VCC Trust, Series 2020-MC1, Class A, 4.50%, 06/25/45(b)(d) | | | 18,082 | | | | 17,784,817 | |
Velocity Commercial Capital Loan Trust | | | | | | | | |
Series 2014-1, Class M7,
8.02%, 09/25/44(b)(d) | | | 2,399 | | | | 2,015,086 | |
Series 2016-1, Class M4,
8.65%, 04/25/46(b)(d) | | | 370 | | | | 383,499 | |
Series 2016-2, Class M2, 4.46%, 10/25/46(d) | | | 200 | | | | 200,641 | |
Series 2016-2, Class M3, 5.50%, 10/25/46(d) | | | 800 | | | | 802,438 | |
Series 2016-2, Class M4, 7.23%, 10/25/46(d) | | | 370 | | | | 373,294 | |
Series 2017-1, Class M2,
4.45%, 05/25/47(b)(d) | | | 410 | | | | 413,759 | |
Series 2017-1, Class M3,
5.35%, 05/25/47(b)(d) | | | 410 | | | | 413,929 | |
| | | | | | | | |
| Security | | Par (000) | | | Value | |
|
| Commercial Mortgage-Backed Securities (continued) | |
Velocity Commercial Capital Loan Trust | | | | | | | | |
Series 2017-2, Class M3,
4.24%, 11/25/47(b)(d) | | USD | 541 | | | $ | 501,079 | |
Series 2017-2, Class M4,
5.00%, 11/25/47(b)(d) | | | 326 | | | | 278,243 | |
Series 2018-1, Class M2,
4.26%, 04/25/48(b) | | | 324 | | | | 326,194 | |
Series 2020-1, Class M1,
2.80%, 02/25/50(b)(d) | | | 1,412 | | | | 1,411,764 | |
Series 2020-1, Class M2,
2.98%, 02/25/50(b)(d) | | | 1,163 | | | | 1,160,375 | |
VNDO Mortgage Trust, Series 2013-PENN, Class D, 4.08%, 12/13/29(b)(d) | | | 550 | | | | 545,512 | |
VNDO Trust, Series 2016-350P, Class D, 4.03%, 01/10/35(b)(d) | | | 3,390 | | | | 3,465,916 | |
Wells Fargo Commercial Mortgage Trust | | | | | | | | |
Series 2014-LC18, Class A5, 3.41%, 12/15/47 | | | 550 | | | | 599,905 | |
Series 2015-C27, Class C, 3.89%, 02/15/48 | | | 902 | | | | 860,541 | |
Series 2015-C28, Class A4, 3.54%, 05/15/48 | | | 930 | | | | 1,025,153 | |
Series 2015-C31, Class A4, 3.70%, 11/15/48 | | | 590 | | | | 659,893 | |
Series 2015-NXS1, Class A5, 3.15%, 05/15/48 | | | 399 | | | | 431,988 | |
Series 2015-NXS2, Class A5, 3.77%, 07/15/58(d) | | | 3,050 | | | | 3,391,006 | |
Series 2015-NXS4, Class A4, 3.72%, 12/15/48 | | | 608 | | | | 681,172 | |
Series 2015-P2, Class A4, 3.81%, 12/15/48 | | | 2,150 | | | | 2,415,451 | |
Series 2015-P2, Class D,
3.24%, 12/15/48(b) | | | 1,784 | | | | 1,381,838 | |
Series 2016-C32, Class A3FL, (1 mo. LIBOR US + 1.42%), 1.57%, 01/15/59(a) | | | 3,390 | | | | 3,390,000 | |
Series 2016-C34, Class A3FL, (1 mo. LIBOR US + 1.04%),
1.19%, 06/15/49(a)(b) | | | 1,830 | | | | 1,828,105 | |
Series 2016-NXS5, Class B, 5.10%, 01/15/59(d) | | | 860 | | | | 982,840 | |
Series 2017-C39, Class D,
4.50%, 09/15/50(b)(d) | | | 594 | | | | 473,856 | |
Series 2017-C41, Class B,
4.19%, 11/15/50(d) | | | 1,710 | | | | 1,816,582 | |
Series 2017-C41, Class C,
4.66%, 11/15/50(d) | | | 900 | | | | 795,311 | |
Series 2017-C41, Class D,
2.60%, 11/15/50(b)(d) | | | 1,772 | | | | 1,247,976 | |
Series 2017-HSDB, Class A, (1 mo. LIBOR US + 0.85%), 1.00%, 12/13/31(a)(b) | | | 1,508 | | | | 1,448,051 | |
Series 2018-1745, Class A,
3.87%, 06/15/36(b)(d) | | | 1,987 | | | | 2,189,325 | |
Series 2018-BXI, Class E, (1 mo. LIBOR US + 2.16%), 2.31%, 12/15/36(a)(b) | | | 766 | | | | 751,225 | |
Series 2018-C44, Class D,
3.00%, 05/15/51(b) | | | 348 | | | | 257,771 | |
Series 2018-C45, Class C,
4.73%, 06/15/51 | | | 530 | | | | 538,691 | |
Series 2018-C48, Class B,
4.90%, 01/15/52(d) | | | 3,612 | | | | 4,268,653 | |
Series 2019-C52, Class C,
3.56%, 08/15/52 | | | 1,880 | | | | 1,921,156 | |
Series 2020-SDAL, Class D, (1 mo. LIBOR US + 2.09%),
2.24%, 02/15/37(a)(b) | | | 1,530 | | | | 1,290,377 | |
Series 2020-SDAL, Class E, (1 mo. LIBOR US + 2.74%), 2.89%, 02/15/37(a)(b) | | | 1,300 | | | | 1,079,880 | |
WFRBS Commercial Mortgage Trust | | | | | | | | |
Series 2014-C21, Class A5, 3.68%, 08/15/47 | | | 1,515 | | | | 1,656,843 | |
Series 2014-C24, Class B,
4.20%, 11/15/47(d) | | | 770 | | | | 737,157 | |
| | | | | | | | |
| | |
| | | | | | | 668,996,508 | |
|
| Interest Only Collateralized Mortgage Obligations — 0.0% | |
Seasoned Credit Risk Transfer Trust, Series 2017-3, Class BIO,
0.00%, 07/25/56(b)(d) | | | 3,224 | | | | 450,368 | |
Voyager OPTONE Delaware Trust, Series 2009-1, Class SAA7,
4.72%, 02/25/38(b)(d) | | | 14,056 | | | | 4,857,796 | |
| | | | | | | | |
| | |
| | | | | | | 5,308,164 | |
|
| Interest Only Commercial Mortgage-Backed Securities — 0.2% | |
245 Park Avenue Trust, Series 2017-245P, Class XA,
0.27%, 06/05/37(b)(d) | | | 13,000 | | | | 148,756 | |
| | |
S C H E D U L E O F I N V E S T M E N T S | | 101 |
| | |
Schedule of Investments (continued) September 30, 2020 | | Master Total Return Portfolio (Percentages shown are based on Net Assets) |
| | | | | | | | |
| Security | | Par (000) | | | Value | |
|
Interest Only Commercial Mortgage-Backed Securities (continued) | |
Banc of America Commercial Mortgage Trust | | | | | | | | |
Series 2017-BNK3, Class XB, 0.78%, 02/15/50(d) | | USD | 11,850 | | | $ | 440,297 | |
Series 2017-BNK3, Class XD, 1.44%, 02/15/50(b)(d) | | | 5,000 | | | | 338,600 | |
BANK | | | | | | | | |
Series 2019-BN20, Class XA, 0.96%, 09/15/62(d) | | | 11,517 | | | | 720,876 | |
Series 2019-BN20, Class XB, 0.46%, 09/15/62(d) | | | 39,279 | | | | 1,176,426 | |
Barclays Commercial Mortgage Trust | | | | | | | | |
Series 2015-SRCH, Class XA, 1.12%, 08/10/35(b)(d) | | | 17,673 | | | | 892,154 | |
Series 2019-C3, Class XA,
1.51%, 05/15/52(d) | | | 9,951 | | | | 927,525 | |
BBCMS Mortgage Trust | | | | | | | | |
Series 2020-C7, Class XA,
1.63%, 04/15/53(d) | | | 8,128 | | | | 892,310 | |
Series 2020-C7, Class XB,
0.99%, 04/15/53(d) | | | 1,596 | | | | 132,636 | |
Benchmark Mortgage Trust | | | | | | | | |
Series 2019-B13, Class XA, 1.27%, 08/15/57(d) | | | 58,192 | | | | 4,510,528 | |
Series 2019-B9, Class XA,
1.21%, 03/15/52(d) | | | 20,939 | | | | 1,501,947 | |
Series 2020-B17, Class XB, 0.65%, 03/15/53(c)(d) | | | 7,100 | | | | 298,200 | |
CFCRE Commercial Mortgage Trust | | | | | | | | |
Series 2016-C3, Class XD,
1.86%, 01/10/48(b)(d) | | | 5,497 | | | | 435,519 | |
Series 2016-C4, Class XB,
0.89%, 05/10/58(d) | | | 5,810 | | | | 218,747 | |
Commercial Mortgage Pass-Through Certificates | | | | | | | | |
Series 2013-CR6, Class XA, 1.16%, 03/10/46(d) | | | 16,397 | | | | 278,494 | |
Series 2015-3BP, Class XA, 0.17%, 02/10/35(b)(d) | | | 150,000 | | | | 609,000 | |
Series 2015-CR25, Class XA, 0.99%, 08/10/48(d) | | | 4,696 | | | | 159,622 | |
Series 2018-COR3, Class XD, 1.75%, 05/10/51(b)(d) | | | 3,200 | | | | 343,618 | |
CSAIL Commercial Mortgage Trust | | | | | | | | |
Series 2017-CX10, Class XB, 0.22%, 11/15/50(d) | | | 12,490 | | | | 186,343 | |
Series 2019-C16, Class XA, 1.73%, 06/15/52(d) | | | 41,437 | | | | 4,393,429 | |
Series 2019-C17, Class XA, 1.51%, 09/15/52(d) | | | 39,603 | | | | 3,688,775 | |
Series 2019-C17, Class XB, 0.70%, 09/15/52(d) | | | 19,090 | | | | 807,169 | |
DBGS Mortgage Trust, Series 2019-1735, Class X, 0.43%, 04/10/37(b)(d) | | | 21,535 | | | | 527,392 | |
Deutsche Bank JPMorgan Mortgage Trust, Series 2017-C6, Class XD,
1.00%, 06/10/50(d) | | | 5,780 | | | | 309,057 | |
GS Mortgage Securities Corp. II, Series 2005- ROCK, Class X1, 0.40%, 05/03/32(b)(d) | | | 21,000 | | | | 252,725 | |
GS Mortgage Securities Trust, Series 2019- GSA1, Class XA, 0.96%, 11/10/52(d) | | | 14,695 | | | | 914,212 | |
JPMBB Commercial Mortgage Securities Trust | | | | | | | | |
Series 2014-C22, Class XA, 0.98%, 09/15/47(d) | | | 1,940 | | | | 52,778 | |
Series 2014-C23, Class XA, 0.78%, 09/15/47(d) | | | 28,703 | | | | 589,607 | |
Series 2015-C29, Class XA, 0.83%, 05/15/48(d) | | | 1,943 | | | | 50,067 | |
| | | | | | | | |
| Security | | Par (000) | | | Value | |
|
Interest Only Commercial Mortgage-Backed Securities (continued) | |
JPMDB Commercial Mortgage Securities Trust, Series 2016-C4, Class XC, 0.75%, 12/15/49(b)(d) | | USD | 4,940 | | | $ | 187,574 | |
JPMorgan Chase Commercial Mortgage Securities Trust | | | | | | | | |
Series 2013-LC11, Class XB,
0.65%, 04/15/46(d) | | | 4,570 | | | | 59,135 | |
Series 2016-JP3, Class XC,
0.75%, 08/15/49(b)(d) | | | 13,040 | | | | 485,092 | |
Ladder Capital Commercial Mortgage Mortgage Trust, Series 2013-GCP, Class XA, 1.35%, 02/15/36(b)(d) | | | 3,875 | | | | 278,248 | |
LSTAR Commercial Mortgage Trust, Series 2017-5, Class X,
1.15%, 03/10/50(b)(d) | | | 3,243 | | | | 107,040 | |
Morgan Stanley Bank of America Merrill Lynch Trust | | | | | | | | |
Series 2014-C19, Class XF, 1.36%, 12/15/47(b)(d) | | | 4,370 | | | | 192,193 | |
Series 2015-C26, Class XD, 1.49%, 10/15/48(b)(d) | | | 4,490 | | | | 276,943 | |
Morgan Stanley Capital I Trust | | | | | | | | |
Series 2016-UBS9, Class XD, 1.76%, 03/15/49(b)(d) | | | 13,984 | | | | 1,091,451 | |
Series 2017-H1, Class XD, 2.36%, 06/15/50(b)(d) | | | 3,293 | | | | 389,397 | |
Series 2019-H6, Class XB, 0.87%, 06/15/52(d) | | | 23,510 | | | | 1,255,547 | |
Series 2019-L2, Class XA, 1.19%, 03/15/52(d) | | | 8,833 | | | | 638,344 | |
Olympic Tower Mortgage Trust, Series 2017-OT, Class XA, 0.51%, 05/10/39(b)(d) | | | 36,697 | | | | 887,334 | |
One Market Plaza Trust | | | | | | | | |
Series 2017-1MKT, Class XCP, 0.22%, 02/10/32(b)(d) | | | 53,230 | | | | 105,928 | |
Series 2017-1MKT, Class XNCP, 0.00%, 02/10/32(b)(c)(d) | | | 10,646 | | | | 106 | |
UBS Commercial Mortgage Trust | | | | | | | | |
Series 2019-C17, Class XA, 1.64%, 10/15/52(d) | | | 32,608 | | | | 3,401,510 | |
Series 2019-C18, Class XA, 1.18%, 12/15/52(d) | | | 35,737 | | | | 2,542,860 | |
Wells Fargo Commercial Mortgage Trust | | | | | | | | |
Series 2015-NXS4, Class XA, 1.02%, 12/15/48(d) | | | 2,391 | | | | 105,327 | |
Series 2016-BNK1, Class XD, 1.40%, 08/15/49(b)(d) | | | 4,420 | | | | 272,228 | |
Series 2019-C50, Class XA, 1.59%, 05/15/52(d) | | | 20,709 | | | | 1,916,096 | |
| | | | | | | | |
| | |
| | | | | | | 39,989,162 | |
|
| Mortgage-Backed Securities — 0.1% | |
Preston Ridge Partners Mortgage LLC, Series 2020-3, Class A1,
2.86%, 09/25/25(b)(e) | | | 26,210 | | | | 26,209,560 | |
|
| Principal Only Collateralized Mortgage Obligations — 0.0% | |
Seasoned Credit Risk Transfer Trust, Series 2017-3, Class B,
0.00%, 07/25/56(b)(m) | | | 1,567 | | | | 171,527 | |
| | | | | | | | |
| |
Total Non-Agency Mortgage-Backed
Securities — 5.4%
(Cost: $1,093,384,551) | | | | 1,078,629,246 | |
| | | | | | | | |
| | |
| 102 | | 2 0 2 0 B L A C K R O C K A N N U A L R E P O R T T O S H A R E H O L D E R S |
| | |
Schedule of Investments (continued) September 30, 2020 | | Master Total Return Portfolio (Percentages shown are based on Net Assets) |
| | | | | | | | |
| Security | | Par (000) | | | Value | |
|
Preferred Securities | |
|
| Capital Trusts — 0.4% | |
| | |
| Banks — 0.1% | | | | | | |
Bangkok Bank PCL, (5 yr. U.S. Treasury Yield Curve Rate T Note Constant Maturity + 4.73%), 5.00%(k)(l) | | USD | 300 | | | $ | 300,000 | |
Bank of America Corp., (3 mo. LIBOR US + 2.93%), 5.88%(k)(l) | | | 8,450 | | | | 9,111,241 | |
Chong Hing Bank Ltd., (5 yr. U.S. Treasury Yield Curve Rate T Note Constant Maturity + 3.86%), 5.70%(k)(l) | | | 250 | | | | 248,748 | |
Emirates NBD Bank PJSC | | | | | | | | |
(6 yr. Swap Semi 30/360 US + 3.66%), 6.13%(k)(l) | | | 1,025 | | | | 1,056,070 | |
(6 yr. Swap Semi 30/360 US + 5.70%), 6.13%(k)(l) | | | 750 | | | | 781,875 | |
Kookmin Bank, (5 yr. U.S. Treasury Yield Curve Rate T Note Constant Maturity + 2.64%), 4.35%(k)(l) | | | 1,700 | | | | 1,773,844 | |
Lehman Brothers Holdings Capital Trust VII, 5.86%(c)(i)(l) | | | 1,888 | | | | — | |
Nanyang Commercial Bank Ltd., (5 yr. U.S. Treasury Yield Curve Rate T Note Constant Maturity + 3.21%), 5.00%(k)(l) | | | 200 | | | | 197,812 | |
Rizal Commercial Banking Corp., (5 yr. U.S. Treasury Yield Curve Rate T Note Constant Maturity + 6.24%), 6.50%(k)(l) | | | 200 | | | | 199,000 | |
Shinhan Financial Group Co. Ltd., (5 yr. U.S. Treasury Yield Curve Rate T Note Constant Maturity + 3.05%), 5.88%(k)(l) | | | 900 | | | | 967,781 | |
Woori Bank, (5 yr. U.S. Treasury Yield Curve Rate T Note Constant Maturity + 2.66%), 4.25%(k)(l) | | | 200 | | | | 203,750 | |
| | | | | | | | |
| | |
| | | | | | | 14,840,121 | |
|
| Capital Markets — 0.3% | |
Bank of New York Mellon Corp. | | | | | | | | |
(3 mo. LIBOR US + 3.13%), 4.63%(k)(l) | | | 9,722 | | | | 10,074,422 | |
(3 mo. LIBOR US + 3.42%), 3.65%(k)(l) | | | 4,380 | | | | 4,292,400 | |
State Street Corp. | | | | | | | | |
(3 mo. LIBOR US + 2.54%), 5.63%(k)(l) | | | 19,655 | | | | 20,228,926 | |
(3 mo. LIBOR US + 3.60%), 3.85%(k)(l) | | | 4,015 | | | | 3,992,115 | |
UBS Group AG, (5 yr. Swap Semi 30/360 US + 4.34%), 7.00%(b)(k)(l) | | | 15,350 | | | | 16,386,125 | |
| | | | | | | | |
| | |
| | | | | | | 54,973,988 | |
|
| Commercial Services & Supplies — 0.0% | |
King Talent Management Ltd., (5 yr. U.S. Treasury Yield Curve Rate T Note Constant Maturity + 3.52%), 5.60%(k)(l) | | | 600 | | | | 522,937 | |
| | | | | | | | |
|
| Insurance — 0.0% | |
Heungkuk Life Insurance Co. Ltd., (5 yr. U.S. Treasury Yield Curve Rate T Note Constant Maturity + 2.47%), 4.48%(k)(l) | | | 1,000 | | | | 1,000,000 | |
KDB Life Insurance Co. Ltd., (5 yr. U.S. Treasury Yield Curve Rate T Note Constant Maturity + 4.66%), 7.50%(k)(l) | | | 900 | | | | 861,750 | |
Tongyang Life Insurance Co. Ltd., (5 yr. U.S. Treasury Yield Curve Rate T Note Constant Maturity + 4.98%), 5.25%(k)(l) | | | 950 | | | | 942,875 | |
| | | | | | | | |
| | | | | | | 2,804,625 | |
| | | | | | | | |
| Security | | Par (000) | | | Value | |
|
Machinery — 0.0% | |
Weichai International Hong Kong Energy Group Co. Ltd., (5 yr. U.S. Treasury Yield Curve Rate T Note Constant Maturity + 6.08%), 3.75%, 03/14/69(k)(l) | | USD | 278 | | | $ | 280,346 | |
| | | | | | | | |
| | |
| Media — 0.0% | | | | | | |
NBCUniversal Enterprise, Inc., 5.25%(b)(g)(l) | | | 13,680 | | | | 13,816,800 | |
| | | | | | | | |
|
| Real Estate Management & Development — 0.0% | |
Agile Group Holdings Ltd., (5 yr. U.S. Treasury Yield Curve Rate T Note Constant Maturity + 9.22%), 6.88%(k)(l) | | | 200 | | | | 198,000 | |
MAF Global Securities Ltd., (5 yr. Swap Semi 30/360 US + 3.48%), 5.50%(k)(l) | | | 1,341 | | | | 1,318,790 | |
| | | | | | | | |
| | |
| | | | | | | 1,516,790 | |
| | | | | | | | |
| | |
Total Preferred Securities — 0.4%
(Cost: $87,162,055) | | | | | | | 88,755,607 | |
| | | | | | | | |
|
U.S. Government Sponsored Agency Securities | |
| | |
| Agency Obligations — 0.0% | | | | | | |
Fannie Mae, 6.63%, 11/15/30 | | | 1,450 | | | | 2,227,865 | |
| | | | | | | | |
|
| Collateralized Mortgage Obligations — 0.0% | |
Fannie Mae, Series 2003-W5, Class A, (1 mo. LIBOR US + 0.11%),
0.40%, 04/25/33(a) | | | 1 | | | | 1,559 | |
Freddie Mac | | | | | | | | |
Series 2015-DN1, Class B, (1 mo. LIBOR US + 11.50%), 11.65%, 01/25/25(a) | | | 488 | | | | 543,851 | |
Series 2015-HQ2, Class B, (1 mo. LIBOR US + 7.95%),
8.10%, 05/25/25(a) | | | 521 | | | | 517,589 | |
Series 2017-DNA2, Class B1, (1 mo. LIBOR US + 5.15%),
5.30%, 10/25/29(a) | | | 590 | | | | 599,595 | |
Series 2017-DNA3, Class B1, (1 mo. LIBOR US + 4.45%),
4.60%, 03/25/30(a) | | | 1,860 | | | | 1,808,818 | |
Series 2017-HRP1, Class M2, (1 mo. LIBOR US + 2.45%),
2.60%, 12/25/42(a) | | | 500 | | | | 473,400 | |
Series 2020-DNA4, Class M2, (1 mo. LIBOR US + 3.75%),
3.90%, 08/25/50(a)(b) | | | 3,520 | | | | 3,562,453 | |
| | | | | | | | |
| | |
| | | | | | | 7,507,265 | |
|
| Commercial Mortgage-Backed Securities — 0.1% | |
Fannie Mae | | | | | | | | |
Series 2006-M2, Class A2A, 5.27%, 10/25/32(d) | | | 691 | | | | 779,492 | |
Series 2017-M5, Class A2, 3.29%, 04/25/29(d) . | | | 1,200 | | | | 1,378,347 | |
Series 2018-M14, Class A2, 3.70%, 08/25/28(d) | | | 3,510 | | | | 4,143,502 | |
Freddie Mac, Series KL4F, Class A2AS, 3.68%, 10/25/25(d) | | | 1,664 | | | | 1,824,779 | |
Ginnie Mae | | | | | | | | |
Series 2015-97, Class VA, 2.25%, 12/16/38 | | | 1,005 | | | | 1,044,258 | |
Series 2016-158, Class VA, 2.00%, 03/16/35 | | | 658 | | | | 670,320 | |
| | | | | | | | |
| | |
| | | | | | | 9,840,698 | |
|
| Interest Only Collateralized Mortgage Obligations — 0.0% | |
Fannie Mae, Series 2020-73, Class AI, 2.00%, 10/25/50 | | | 7,100 | | | | 590,187 | |
Freddie Mac | | | | | | | | |
Series 4995, Class BI, 4.50%, 06/25/50 | | | 6,818 | | | | 916,412 | |
Series 4999, Class QI, 4.00%, 05/25/50 | | | 6,765 | | | | 870,442 | |
Series 5014, Class DI, 4.00%, 09/25/50 | | | 4,789 | | | | 609,591 | |
Series 5029, Class GI, 2.00%, 10/25/50 | | | 5,300 | | | | 497,703 | |
| | | | | | | | |
| | |
| | | | | | | 3,484,335 | |
| | |
S C H E D U L E O F I N V E S T M E N T S | | 103 |
| | |
Schedule of Investments (continued) September 30, 2020 | | Master Total Return Portfolio (Percentages shown are based on Net Assets) |
| | | | | | | | |
| Security | | Par (000) | | | Value | |
|
| Interest Only Commercial Mortgage-Backed Securities — 0.1% | |
Freddie Mac, Series K111, Class X1, 1.68%, 05/25/30(d) | | USD | 20,342 | | | $ | 2,620,319 | |
Ginnie Mae | | | | | | | | |
Series 2012-23, Class IO, 0.28%, 06/16/53(d) | | | 2,376 | | | | 23,971 | |
Series 2013-191, Class IO, 0.71%, 11/16/53(d) | | | 2,721 | | | | 70,842 | |
Series 2013-30, Class IO, 0.75%, 09/16/53(d) | | | 11,190 | | | | 352,675 | |
Series 2013-63, Class IO, 0.83%, 09/16/51(d) | | | 11,619 | | | | 276,959 | |
Series 2013-78, Class IO, 0.72%, 10/16/54(d) | | | 11,968 | | | | 403,588 | |
Series 2014-52, Class AI, 0.83%, 08/16/41 | | | 437 | | | | 1,739 | |
Series 2015-173, Class IO, 0.79%, 09/16/55(d) | | | 5,154 | | | | 249,852 | |
Series 2015-22, Class IO, 0.62%, 03/16/55(d) | | | 7,094 | | | | 231,872 | |
Series 2015-37, Class IO, 0.69%, 10/16/56(d) | | | 1,867 | | | | 82,815 | |
Series 2015-48, Class IO, 0.66%, 02/16/50(d) | | | 4,716 | | | | 159,062 | |
Series 2016-110, Class IO, 0.98%, 05/16/58(d) | | | 5,484 | | | | 332,162 | |
Series 2016-113, Class IO, 1.16%, 02/16/58(d) | | | 6,525 | | | | 485,122 | |
Series 2016-125, Class IO, 0.95%, 12/16/57(d) | | | 6,990 | | | | 414,842 | |
Series 2016-128, Class IO, 0.90%, 09/16/56(d) | | | 11,141 | | | | 688,339 | |
Series 2016-152, Class IO, 0.84%, 08/15/58(d) | | | 7,199 | | | | 424,545 | |
Series 2016-162, Class IO, 0.90%, 09/16/58(d) | | | 20,840 | | | | 1,329,501 | |
Series 2016-165, Class IO, 0.96%, 12/16/57(d) | | | 6,324 | | | | 394,536 | |
Series 2016-26, Class IO, 0.89%, 02/16/58(d) | | | 29,050 | | | | 1,497,762 | |
Series 2016-36, Class IO, 0.81%, 08/16/57(d) | | | 2,718 | | | | 143,659 | |
Series 2016-67, Class IO, 1.00%, 07/16/57(d) | | | 2,762 | | | | 155,239 | |
Series 2016-92, Class IO, 0.90%, 04/16/58(d) | | | 6,059 | | | | 337,625 | |
Series 2016-96, Class IO, 0.93%, 12/16/57(d) | | | 14,951 | | | | 818,537 | |
| | | | | | | | |
| | |
| | | | | | | 11,495,563 | |
|
| Mortgage-Backed Securities — 53.4% | |
Fannie Mae Mortgage-Backed Securities | | | | | | | | |
2.00%, 10/01/31 - 03/01/32 | | | 14,224 | | | | 14,852,510 | |
2.50%, 09/01/27 - 10/01/50 | | | 131,386 | | | | 139,945,309 | |
3.00%, 04/01/28 - 09/01/50 | | | 617,026 | | | | 663,486,503 | |
3.50%, 08/01/28 - 08/01/50 | | | 369,268 | | | | 404,032,260 | |
4.00%, 08/01/31 - 09/01/50 | | | 192,268 | | | | 213,279,827 | |
4.50%, 02/01/25 - 02/01/50 | | | 626,855 | | | | 692,195,331 | |
5.00%, 11/01/32 - 06/01/45 | | | 22,265 | | | | 25,483,863 | |
5.50%, 12/01/32 - 04/01/41 | | | 18,894 | | | | 22,136,072 | |
6.00%, 02/01/34 - 06/01/41 | | | 11,230 | | | | 13,081,489 | |
6.50%, 05/01/40 | | | 2,283 | | | | 2,745,352 | |
Freddie Mac Mortgage-Backed Securities | | | | | | | | |
2.50%, 04/01/27 - 04/01/31 | | | 17,836 | | | | 18,955,288 | |
3.00%, 09/01/27 - 08/01/50 | | | 161,708 | | | | 172,478,354 | |
3.50%, 09/01/30 - 05/01/50 | | | 160,433 | | | | 175,689,102 | |
4.00%, 08/01/40 - 02/01/47 | | | 37,080 | | | | 40,705,327 | |
4.50%, 02/01/39 - 11/01/49 | | | 301,347 | | | | 329,303,832 | |
5.00%, 07/01/35 - 11/01/41 | | | 8,383 | | | | 9,608,162 | |
5.50%, 02/01/35 - 06/01/41 | | | 2,604 | | | | 3,023,021 | |
Ginnie Mae Mortgage-Backed Securities | | | | | | | | |
2.00%, 10/15/50(r) | | | 9,866 | | | | 10,249,849 | |
2.50%, 10/15/50(r) | | | 257,853 | | | | 270,607,643 | |
3.00%, 12/20/44 - 10/15/50(r) | | | 778,536 | | | | 818,587,543 | |
3.50%, 01/15/42 - 10/15/50(r) | | | 532,723 | | | | 564,091,911 | |
4.00%, 04/20/39 - 10/15/50(r) | | | 188,732 | | | | 201,238,712 | |
4.50%, 12/20/39 - 10/15/50(r) | | | 86,430 | | | | 93,072,714 | |
5.00%, 04/15/33 - 10/15/50(r) | | | 36,640 | | | | 40,174,187 | |
5.50%, 10/15/50(r) | | | 5,800 | | | | 6,364,367 | |
Uniform Mortgage-Backed Securities | | | | | | | | |
2.00%, 10/01/35 - 10/01/50(r) | | | 1,201,857 | | | | 1,243,156,006 | |
2.50%, 10/01/35 - 10/01/50(r) | | | 1,468,881 | | | | 1,540,126,048 | |
3.00%, 10/01/35 - 10/01/50(r) | | | 1,040,008 | | | | 1,089,655,592 | |
3.50%, 10/01/35 - 10/01/50(r) | | | 107,352 | | | | 113,294,594 | |
4.00%, 10/01/35 - 10/01/50(r) | | | 1,375,277 | | | | 1,467,319,250 | |
| | | | | | | | |
| Security | | Par (000) | | | Value | |
|
Mortgage-Backed Securities (continued) | |
Uniform Mortgage-Backed Securities | |
4.50%, 10/01/50(r) | | USD | 225,661 | | | $ | 244,101,735 | |
5.00%, 10/01/50(r) | | | 42,159 | | | | 46,195,395 | |
| | | | | | | | |
| | |
| | | | | | | 10,689,237,148 | |
| | | | | | | | |
| |
Total U.S. Government Sponsored Agency Securities — 53.6%
(Cost: $10,622,739,463) | | | | 10,723,792,874 | |
| | | | | | | | |
|
U.S. Treasury Obligations | |
U.S. Treasury Bonds | | | | | | | | |
4.63%, 02/15/40 | | | 10,812 | | | | 17,434,350 | |
3.88%, 08/15/40 | | | 10,812 | | | | 16,027,945 | |
4.25%, 11/15/40 | | | 10,812 | | | | 16,811,815 | |
2.50%, 02/15/45 | | | 88,094 | | | | 108,658,443 | |
2.75%, 11/15/47 | | | 88,610 | | | | 115,438,755 | |
3.00%, 02/15/48(s)(t) | | | 88,094 | | | | 120,000,546 | |
U.S. Treasury Inflation Indexed Bonds, 0.25%, 02/15/50 | | | 74,367 | | | | 87,900,094 | |
U.S. Treasury Inflation Indexed Notes | | | | | | | | |
0.63%, 04/15/23 | | | 636,448 | | | | 665,933,751 | |
0.13%, 07/15/30 | | | 45,325 | | | | 50,419,424 | |
U.S. Treasury Notes | | | | | | | | |
1.75%, 07/15/22 - 11/15/29 | | | 253,010 | | | | 264,557,326 | |
0.50%, 03/15/23 - 05/31/27 | | | 436,195 | | | | 439,764,304 | |
0.25%, 04/15/23 | | | 167,495 | | | | 167,946,451 | |
1.50%, 10/31/24 - 02/15/30 | | | 85,515 | | | | 90,831,610 | |
2.25%, 11/15/24 - 08/15/27 | | | 147,346 | | | | 160,364,613 | |
0.38%, 04/30/25 | | | 181,142 | | | | 182,210,455 | |
0.63%, 03/31/27 | | | 60,677 | | | | 61,473,386 | |
2.38%, 05/15/27 | | | 20,160 | | | | 22,729,613 | |
1.63%, 08/15/29 | | | 31,559 | | | | 34,369,723 | |
| | | | | | | | |
| |
Total U.S. Treasury Obligations — 13.1%
(Cost: $2,616,152,357) | | | | 2,622,872,604 | |
| | | | | | | | |
| | |
| | | Shares | | | | |
| | |
Warrants(f) | | | | | | | | |
|
Diversified Financial Services — 0.0% | |
Social Capital Hedosophia Holdings (Issued/Exercisable 09/18/17, 1 Share for 1 Warrant, Expires 12/31/20, Strike Price USD 10.00)(c) | | | 833,000 | | | | — | |
| | | | | | | | |
|
| Oil, Gas & Consumable Fuels — 0.0% | |
SM Energy Co. (Issued/Exercisable 07/14/20, 1 Share for 1 Warrant, Expires 06/30/23, Strike Price USD 0.01) | | | 51,102 | | | | 80,741 | |
| | | | | | | | |
|
| Real Estate Management & Development — 0.0% | |
Target Hospitality Corp. (Issued/Exercisable 03/05/18, 1 Share for 1 Warrant, Expires 03/05/25, Strike Price USD 11.50) | | | 8,280 | | | | 638 | |
| | | | | | | | |
| | |
Total Warrants — 0.0%
(Cost: $11,817) | | | | | | | 81,379 | |
| | | | | | | | |
| |
Total Long-Term Investments — 133.6%
(Cost: $26,304,237,856) | | | | 26,732,950,808 | |
| | | | | | | | |
| | |
| 104 | | 2 0 2 0 B L A C K R O C K A N N U A L R E P O R T T O S H A R E H O L D E R S |
| | |
Schedule of Investments (continued) September 30, 2020 | | Master Total Return Portfolio (Percentages shown are based on Net Assets) |
| | | | | | | | |
| Security | | Shares | | | Value | |
|
Short-Term Securities | |
|
| Money Market Funds — 1.2% | |
BlackRock Liquidity Funds, T-Fund, Institutional Class, 0.02%(q)(u) | | | 178,500,804 | | | $ | 178,500,805 | |
SL Liquidity Series, LLC, Money Market Series, 0.25%(q)(u)(v) | | | 56,761,232 | | | | 56,783,936 | |
| | | | | | | | |
| |
Total Short-Term Securities — 1.2%
(Cost: $235,284,795) | | | | 235,284,741 | |
| | | | | | | | |
Options Purchased — 0.1% | | | | | |
| | |
| (Cost: $36,201,886) | | | | | 26,767,883 | |
| | | | | | | | |
| |
Total Investments Before Options Written and TBA Sale Commitments — 134.9%
(Cost: $26,575,724,537) | | | | 26,995,003,432 | |
| | | | | | | | |
| | |
| | | Par (000) | | | | |
|
TBA Sale Commitments(r) | |
|
| Mortgage-Backed Securities — (24.3)% | |
Ginnie Mae Mortgage-Backed Securities | | | | | | | | |
2.50%, 10/15/50 | | USD | 102,600 | | | | (107,750,039 | ) |
3.00%, 10/15/50 | | | 288,962 | | | | (302,557,888 | ) |
3.50%, 10/15/50 | | | 158,760 | | | | (167,162,897 | ) |
4.00%, 10/15/50 | | | 5,043 | | | | (5,358,089 | ) |
4.50%, 10/15/50 | | | 2,018 | | | | (2,161,877 | ) |
5.50%, 10/15/50 | | | 5,800 | | | | (6,364,367 | ) |
Uniform Mortgage-Backed Securities | | | | | | | | |
2.00%, 10/01/50 | | | 349,221 | | | | (361,061,258 | ) |
2.50%, 10/01/35 - 10/01/50 | | | 1,621,935 | | | | (1,700,599,613 | ) |
3.00%, 10/01/35 - 10/01/50 | | | 1,319,800 | | | | (1,382,677,665 | ) |
3.50%, 10/01/35 - 10/01/50 | | | 210,926 | | | | (222,396,008 | ) |
4.00%, 10/01/50 | | | 570,793 | | | | (608,775,261 | ) |
| | | | | | | | |
| |
Total TBA Sale Commitments — (24.3)%
(Proceeds: $(4,871,004,784)) | | | | (4,866,864,962 | ) |
| | | | | | | | |
|
Options Written — (0.0)% | |
| |
| (Premiums Received: $(16,215,223)) | | | (12,962,851) | |
| | | | | | | | |
| |
Total Investments Net of Options Written and TBA Sale Commitments — 110.6%
(Cost: $21,688,504,530) | | | | 22,115,175,619 | |
| |
Liabilities in Excess of Other
Assets — (10.6)% | | | | (2,110,725,994 | ) |
| | | | | | | | |
| |
Net Assets — 100.0% | | | $ | 20,004,449,625 | |
| | | | | | | | |
| (a) | Variable rate security. Rate shown is the rate in effect as of period end. |
| (b) | Security exempt from registration pursuant to Rule 144A under the Securities Act of 1933, as amended. These securities may be resold in transactions exempt from registration to qualified institutional investors. |
| (c) | Security is valued using significant unobservable inputs and is classified as Level 3 in the fair value hierarchy. |
| (d) | Variable or floating rate security, which interest rate adjusts periodically based on changes in current interest rates and prepayments on the underlying pool of assets. Rate shown is the rate in effect as of period end. |
| (e) | Step-up bond that pays an initial coupon rate for the first period and then a higher coupon rate for the following periods. Rate as of period end. |
| (f) | Non-income producing security. |
| (g) | All or a portion of the security has been pledged and/or segregated as collateral in connection with outstanding exchange-traded options written. |
| (h) | All or a portion of this security is on loan. |
| (i) | Issuer filed for bankruptcy and/or is in default. |
| (j) | Convertible security. |
| (k) | Variable rate security. Security may be issued at a fixed coupon rate, which converts to a variable rate at a specified date. Rate shown is the rate in effect as of period end. |
| (l) | Perpetual security with no stated maturity date. |
| (n) | Payment-in-kind security which may pay interest/dividends in additional par/shares and/or in cash. Rates shown are the current rate and possible payment rates. |
| (o) | Issuer is a U.S. branch of a foreign domiciled bank. |
| (p) | Represents an unsettled loan commitment at period end. Certain details associated with this purchase are not known prior to the settlement date, including coupon rate. |
| (q) | Affiliate of the Portfolio. |
| (r) | Represents or includes a TBA transaction. |
| (s) | All or a portion of the security has been pledged as collateral in connection with outstanding OTC derivatives. |
| (t) | All or a portion of the security has been pledged as collateral in connection with outstanding TBA commitments. |
| (u) | Annualized 7-day yield as of period end. |
| (v) | All or a portion of this security was purchased with the cash collateral from loaned securities. |
| | |
S C H E D U L E O F I N V E S T M E N T S | | 105 |
| | |
Schedule of Investments (continued) September 30, 2020 | | Master Total Return Portfolio |
Affiliates
Investments in issuers considered to be affiliate(s) of the Master Portfolio during the year ended September 30, 2020 for purposes of Section 2(a)(3) of the Investment Company Act of 1940, as amended, were as follows:
| | | | | | | | | | | | | | | | | | | | | | | | | | | | | | | | | | | | | | | | | | |
| | | | | | | | | | | |
| | | Affiliated Issuer | | Value at
09/30/19 | | | Purchases at Cost | | | Proceeds from Sale | | | Net Realized
Gain (Loss) | | | Change in
Unrealized
Appreciation
(Depreciation) | | | Value at
09/30/20 | | | Par/Shares
Held at
09/30/20 | | | Income | | | Capital Gain
Distributions
from Underlying
Funds | | | |
| | | | | | | | | | | | |
| | BlackRock Capital Finance LP, Series 1997- R2, Class AP | | $ | 3,056 | | | $ | — | | | $ | — | | | $ | — | | | $ | 132 | | | $ | 3,188 | | | $ | 3,374 | | | $ | — | | | | | | $ — | | | |
| | BlackRock Liquidity Funds, T-Fund, Institutional Class | | | 205,577,418 | | | | — | | | | (27,076,613 | )(a) | | | — | | | | — | | | | 178,500,805 | | | | 178,500,804 | | | | 8,545,192 | | | | | | 2,436 | | | |
| | iShares China Large-Cap ETF(b) | | | — | | | | 10,896,680 | | | | (10,759,175 | ) | | | (137,505 | ) | | | — | | | | — | | | | — | | | | — | | | | | | — | | | |
| | iShares iBoxx $ Investment Grade Corporate Bond ETF(b) | | | — | | | | 186,595,925 | | | | (193,714,139 | ) | | | 7,118,214 | | | | — | | | | — | | | | — | | | | 641,544 | | | | | | — | | | |
| | iShares iBoxx High Yield Corporate Bond ETF | | | — | | | | 787,026,009 | | | | (665,076,532 | ) | | | 6,517,135 | | | | (625,665 | ) | | | 127,840,947 | | | | 1,523,730 | | | | 1,210,732 | | | | | | — | | | |
| | iShares MSCI Emerging Markets ETF(b) | | | 5,640,060 | | | | — | | | | (6,013,756 | ) | | | 245,218 | | | | 128,478 | | | | — | | | | — | | | | — | | | | | | — | | | |
| | iShares PHLX Semiconductor ETF(b) | | | — | | | | 7,168,900 | | | | (7,816,564 | ) | | | 647,664 | | | | — | | | | — | | | | — | | | | — | | | | �� | | — | | | |
| | SL Liquidity Series, LLC, Money Market Series | | | 1,616,850 | | | | 55,167,187 | (a) | | | — | | | | (46 | ) | | | (55 | ) | | | 56,783,936 | | | | 56,761,232 | | | | 8,557 | (c) | | | | | — | | | |
| | | | | | | | | | | | | | | | | | | | | | | | | | | | | | | | | | | | | | | | | | |
| | | | | | | | | | | | |
| | | | | | | | | | | | | | | | $ | 14,390,680 | | | $ | (497,110 | ) | | $ | 363,128,876 | | | | | | | $ | 10,406,025 | | | | | | $ 2,436 | | | |
| | | | | | | | | | | | | | | | | | | | | | | | | | | | | | | | | | | | | | | | | | |
| | (a) | Represents net shares purchased (sold). | |
| | (b) | As of period end, the entity is no longer held by the Master Portfolio. | |
| | (c) | All or a portion represents securities lending income earned from the reinvestment of cash collateral from loaned securities, net of fees and collateral investment expenses, and other payments to and from borrowers of securities. | |
For Master Portfolio compliance purposes, the Master Portfolio’s industry classifications refer to one or more of the industry sub-classifications used by one or more widely recognized market indexes or rating group indexes, and/or as defined by the investment adviser. These definitions may not apply for purposes of this report, which may combine such industry sub-classifications for reporting ease.
Derivative Financial Instruments Outstanding as of Period End
Futures Contracts
| | | | | | | | | | | | | | | | |
| | | | | |
| Description | | Number of
Contracts | | | Expiration
Date | | | Notional
Amount
(000) | | | Value/
Unrealized
Appreciation
(Depreciation) | |
| | | | |
Long Contracts | | | | | | | | | | | | | | | | |
Euro-Schatz | | | 1,922 | | | | 12/08/20 | | | $ | 253,041 | | | $ | (39,545 | ) |
| | |
| 106 | | 2 0 2 0 B L A C K R O C K A N N U A L R E P O R T T O S H A R E H O L D E R S |
| | |
Schedule of Investments (continued) September 30, 2020 | | Master Total Return Portfolio |
Futures Contracts (continued)
| | | | | | | | | | | | | | | | | | | | |
| | | | | |
| Description | | Number of
Contracts | | | Expiration
Date | | | Notional
Amount (000) | | | Value/ Unrealized
Appreciation
(Depreciation) | |
| | | | | |
Long Contracts (continued) | | | | | | | | | | | | | | | | | | | | |
U.S. Treasury Bonds (30 Year) | | | 1,040 | | | | 12/21/20 | | | $ | 183,333 | | | | | | | $ | (330,811 | ) |
U.S. Ultra Treasury Bonds | | | 3,806 | | | | 12/21/20 | | | | 844,218 | | | | | | | | (2,293,083 | ) |
10 Year U.K. Gilt | | | 496 | | | | 12/29/20 | | | | 87,113 | | | | | | | | (234,588 | ) |
U.S. Treasury Notes (2 Year) | | | 5,536 | | | | 12/31/20 | | | | 1,223,240 | | | | | | | | 523,227 | |
U.S. Treasury Notes (5 Year) | | | 8,589 | | | | 12/31/20 | | | | 1,082,482 | | | | | | | | 526,654 | |
Euro Dollar | | | 539 | | | | 09/13/21 | | | | 134,494 | | | | | | | | 93,990 | |
Euro Dollar | | | 539 | | | | 12/13/21 | | | | 134,467 | | | | | | | | 105,959 | |
Euro Dollar | | | 539 | | | | 03/14/22 | | | | 134,454 | | | | | | | | (27,436 | ) |
Euro Dollar | | | 539 | | | | 06/13/22 | | | | 134,440 | | | | | | | | (34,566 | ) |
| | | | | | | | | | | | | | | | | | | | |
| | | | | |
| | | | | | | | | | | | | | | | | | | (1,710,199 | ) |
| | | | | | | | | | | | | | | | | | | | |
Short Contracts | | | | | | | | | | | | | | | | | | | | |
Euro-Bund | | | 1,264 | | | | 12/08/20 | | | | 258,636 | | | | | | | | 88,054 | |
Euro-Buxl | | | 539 | | | | 12/08/20 | | | | 140,723 | | | | | | | | (2,723,250 | ) |
Canadian Government Bonds (10 Year) | | | 1,056 | | | | 12/18/20 | | | | 120,395 | | | | | | | | 93,438 | |
E-Mini S&P 500 Index | | | 56 | | | | 12/18/20 | | | | 9,386 | | | | | | | | 46,169 | |
U.S. Treasury Notes (10 Year) | | | 3,813 | | | | 12/21/20 | | | | 532,033 | | | | | | | | (86,277 | ) |
U.S. Ultra Treasury Notes (10 Year) | | | 564 | | | | 12/21/20 | | | | 90,196 | | | | | | | | (65,001 | ) |
Euro Dollar | | | 539 | | | | 09/18/23 | | | | 134,292 | | | | | | | | (240,541 | ) |
Euro Dollar | | | 539 | | | | 12/18/23 | | | | 134,224 | | | | | | | | (246,462 | ) |
Euro Dollar | | | 539 | | | | 03/18/24 | | | | 134,177 | | | | | | | | 47,166 | |
Euro Dollar | | | 539 | | | | 06/17/24 | | | | 134,110 | | | | | | | | 12,621 | |
| | | | | | | | | | | | | | | | | | | | |
| | | | | |
| | | | | | | | | | | | | | | | | | | (3,074,083 | ) |
| | | | | | | | | | | | | | | | | | | | |
| | | | | |
| | | | | | | | | | | | | | | | | | $ | (4,784,282 | ) |
| | | | | | | | | | | | | | | | | | | | |
Forward Foreign Currency Exchange Contracts
| | | | | | | | | | | | | | | | | | | | | | | | | | | | | | |
| | | | | | | |
| Currency Purchased | | | Currency Sold | | | | | | Counterparty | | Settlement
Date | | | | | | Unrealized
Appreciation
(Depreciation) | |
| | | | | | | | |
BRL | | | 82,303,458 | | | | USD | | | | 14,654,000 | | | | | | | Citibank N.A. | | | 10/02/20 | | | | | | | $ | 686 | |
BRL | | | 44,375,571 | | | | USD | | | | 7,901,000 | | | | | | | Citibank N.A. | | | 10/02/20 | | | | | | | | 370 | |
BRL | | | 11,451,942 | | | | USD | | | | 2,039,000 | | | | | | | Citibank N.A. | | | 10/02/20 | | | | | | | | 95 | |
USD | | | 3,958,000 | | | | BRL | | | | 21,274,250 | | | | | | | Barclays Bank PLC | | | 10/02/20 | | | | | | | | 169,976 | |
USD | | | 4,654,000 | | | | BRL | | | | 25,215,372 | | | | | | | Barclays Bank PLC | | | 10/02/20 | | | | | | | | 164,233 | |
USD | | | 5,001,000 | | | | BRL | | | | 26,820,363 | | | | | | | BNP Paribas S.A. | | | 10/02/20 | | | | | | | | 225,453 | |
USD | | | 1,985,000 | | | | BRL | | | | 10,713,045 | | | | | | | Citibank N.A. | | | 10/02/20 | | | | | | | | 77,470 | |
USD | | | 4,961,000 | | | | BRL | | | | 26,774,517 | | | | | | | Citibank N.A. | | | 10/02/20 | | | | | | | | 193,617 | |
USD | | | 4,001,000 | | | | BRL | | | | 21,427,356 | | | | | | | Citibank N.A. | | | 10/02/20 | | | | | | | | 185,715 | |
USD | | | 4,001,000 | | | | BRL | | | | 21,427,356 | | | | | | | Citibank N.A. | | | 10/02/20 | | | | | | | | 185,715 | |
USD | | | 4,999,000 | | | | BRL | | | | 27,354,528 | | | | | | | Citibank N.A. | | | 10/02/20 | | | | | | | | 128,342 | |
USD | | | 2,999,000 | | | | BRL | | | | 16,410,528 | | | | | | | Citibank N.A. | | | 10/02/20 | | | | | | | | 76,995 | |
USD | | | 2,999,000 | | | | BRL | | | | 16,410,528 | | | | | | | Citibank N.A. | | | 10/02/20 | | | | | | | | 76,995 | |
EUR | | | 107,391,500 | | | | USD | | | | 125,755,446 | | | | | | | UBS AG | | | 10/05/20 | | | | | | | | 169,291 | |
JPY | | | 209,449,000 | | | | USD | | | | 1,982,762 | | | | | | | Barclays Bank PLC | | | 10/05/20 | | | | | | | | 3,305 | |
USD | | | 3,308,920 | | | | EUR | | | | 2,786,000 | | | | | | | BNP Paribas S.A. | | | 10/05/20 | | | | | | | | 42,123 | |
USD | | | 2,261,278 | | | | EUR | | | | 1,921,000 | | | | | | | Deutsche Bank AG | | | 10/05/20 | | | | | | | | 8,759 | |
USD | | | 4,036,606 | | | | EUR | | | | 3,415,000 | | | | | | | State Street Bank and Trust Co. | | | 10/05/20 | | | | | | | | 32,257 | |
USD | | | 236,109,405 | | | | EUR | | | | 197,457,000 | | | | | | | UBS AG | | | 10/05/20 | | | | | | | | 4,575,989 | |
AUD | | | 3,769,000 | | | | USD | | | | 2,684,564 | | | | | | | Bank of America N.A. | | | 10/06/20 | | | | | | | | 15,021 | |
USD | | | 3,219,051 | | | | AUD | | | | 4,384,000 | | | | | | | BNP Paribas S.A. | | | 10/06/20 | | | | | | | | 78,966 | |
CAD | | | 31,644,140 | | | | USD | | | | 23,691,000 | | | | | | | JPMorgan Chase Bank N.A. | | | 10/09/20 | | | | | | | | 74,564 | |
AUD | | | 5,684,000 | | | | USD | | | | 4,002,539 | | | | | | | Barclays Bank PLC | | | 10/14/20 | | | | | | | | 68,760 | |
AUD | | | 5,684,000 | | | | USD | | | | 4,002,539 | | | | | | | Barclays Bank PLC | | | 10/14/20 | | | | | | | | 68,760 | |
CLP | | | 3,913,419,750 | | | | USD | | | | 4,971,000 | | | | | | | Citibank N.A. | | | 10/14/20 | | | | | | | | 14,423 | |
EUR | | | 4,254,000 | | | | USD | | | | 4,972,628 | | | | | | | Bank of America N.A. | | | 10/14/20 | | | | | | | | 16,429 | |
EUR | | | 4,254,000 | | | | USD | | | | 4,975,219 | | | | | | | Deutsche Bank AG | | | 10/14/20 | | | | | | | | 13,838 | |
JPY | | | 419,894,262 | | | | AUD | | | | 5,415,000 | | | | | | | Bank of America N.A. | | | 10/14/20 | | | | | | | | 103,353 | |
JPY | | | 896,239,682 | | | | AUD | | | | 11,558,000 | | | | | | | Bank of America N.A. | | | 10/14/20 | | | | | | | | 220,600 | |
| | |
S C H E D U L E O F I N V E S T M E N T S | | 107 |
| | |
Schedule of Investments (continued) September 30, 2020 | | Master Total Return Portfolio |
Forward Foreign Currency Exchange Contracts (continued)
| | | | | | | | | | | | | | | | | | | | | | | | | | | | | | |
| | | | | | | |
| Currency Purchased | | | Currency Sold | | | | | | Counterparty | | Settlement
Date | | | | | | Unrealized
Appreciation
(Depreciation) | |
| | | | | | | | |
JPY | | | 493,710,521 | | | | USD | | | | 4,641,700 | | | | | | | HSBC Bank PLC | | | 10/14/20 | | | | | | | $ | 40,293 | |
JPY | | | 493,710,521 | | | | USD | | | | 4,641,700 | | | | | | | HSBC Bank PLC | | | 10/14/20 | | | | | | | | 40,293 | |
MXN | | | 88,759,871 | | | | USD | | | | 4,004,000 | | | | | | | Barclays Bank PLC | | | 10/14/20 | | | | | | | | 3,524 | |
RUB | | | 236,580,000 | | | | USD | | | | 3,000,000 | | | | | | | BNP Paribas S.A. | | | 10/14/20 | | | | | | | | 40,042 | |
RUB | | | 236,580,000 | | | | USD | | | | 3,000,000 | | | | | | | BNP Paribas S.A. | | | 10/14/20 | | | | | | | | 40,042 | |
USD | | | 5,701,078 | | | | AUD | | | | 7,754,000 | | | | | | | BNP Paribas S.A. | | | 10/14/20 | | | | | | | | 147,094 | |
USD | | | 4,971,000 | | | | CLP | | | | 3,818,970,750 | | | | | | | Citibank N.A. | | | 10/14/20 | | | | | | | | 105,898 | |
USD | | | 3,969,000 | | | | COP | | | | 14,546,385,000 | | | | | | | Citibank N.A. | | | 10/14/20 | | | | | | | | 170,685 | |
USD | | | 4,971,000 | | | | COP | | | | 18,512,004,000 | | | | | | | JPMorgan Chase Bank N.A. | | | 10/14/20 | | | | | | | | 137,192 | |
USD | | | 4,966,527 | | | | EUR | | | | 4,208,000 | | | | | | | HSBC Bank PLC | | | 10/14/20 | | | | | | | | 31,419 | |
USD | | | 6,954,082 | | | | EUR | | | | 5,892,000 | | | | | | | HSBC Bank PLC | | | 10/14/20 | | | | | | | | 43,992 | |
USD | | | 2,376,331 | | | | EUR | | | | 2,006,000 | | | | | | | JPMorgan Chase Bank N.A. | | | 10/14/20 | | | | | | | | 23,711 | |
USD | | | 5,504,316 | | | | EUR | | | | 4,635,000 | | | | | | | Morgan Stanley & Co. International PLC | | | 10/14/20 | | | | | | | | 68,426 | |
USD | | | 1,831,363 | | | | EUR | | | | 1,545,000 | | | | | | | UBS AG | | | 10/14/20 | | | | | | | | 19,399 | |
USD | | | 1,832,670 | | | | EUR | | | | 1,545,000 | | | | | | | UBS AG | | | 10/14/20 | | | | | | | | 20,706 | |
USD | | | 4,961,000 | | | | HUF | | | | 1,517,669,120 | | | | | | | Bank of America N.A. | | | 10/14/20 | | | | | | | | 66,590 | |
USD | | | 4,961,000 | | | | HUF | | | | 1,517,669,120 | | | | | | | Bank of America N.A. | | | 10/14/20 | | | | | | | | 66,591 | |
USD | | | 4,999,000 | | | | JPY | | | | 522,637,451 | | | | | | | UBS AG | | | 10/14/20 | | | | | | | | 42,685 | |
USD | | | 2,999,000 | | | | KRW | | | | 3,498,933,300 | | | | | | | Bank of America N.A. | | | 10/14/20 | | | | | | | | 7,180 | |
USD | | | 2,999,000 | | | | KRW | | | | 3,498,933,300 | | | | | | | Bank of America N.A. | | | 10/14/20 | | | | | | | | 7,180 | |
USD | | | 4,998,000 | | | | KRW | | | | 5,819,171,400 | | | | | | | Barclays Bank PLC | | | 10/14/20 | | | | | | | | 22,223 | |
USD | | | 4,998,000 | | | | KRW | | | | 5,819,171,400 | | | | | | | Barclays Bank PLC | | | 10/14/20 | | | | | | | | 22,223 | |
USD | | | 4,995,000 | | | | MXN | | | | 105,507,387 | | | | | | | Citibank N.A. | | | 10/14/20 | | | | | | | | 231,323 | |
USD | | | 4,995,000 | | | | MXN | | | | 105,507,387 | | | | | | | Citibank N.A. | | | 10/14/20 | | | | | | | | 231,323 | |
USD | | | 390,000 | | | | MXN | | | | 8,392,059 | | | | | | | Citibank N.A. | | | 10/14/20 | | | | | | | | 11,097 | |
USD | | | 390,000 | | | | MXN | | | | 8,392,059 | | | | | | | Citibank N.A. | | | 10/14/20 | | | | | | | | 11,097 | |
USD | | | 2,407,647 | | | | MXN | | | | 53,277,125 | | | | | | | Citibank N.A. | | | 10/14/20 | | | | | | | | 2,175 | |
USD | | | 4,655,000 | | | | MXN | | | | 100,040,605 | | | | | | | Deutsche Bank AG | | | 10/14/20 | | | | | | | | 138,149 | |
USD | | | 4,655,000 | | | | MXN | | | | 100,040,605 | | | | | | | Deutsche Bank AG | | | 10/14/20 | | | | | | | | 138,149 | |
USD | | | 10,001,000 | | | | MXN | | | | 211,763,174 | | | | | | | HSBC Bank PLC | | | 10/14/20 | | | | | | | | 439,855 | |
USD | | | 2,325,000 | | | | MXN | | | | 50,005,774 | | | | | | | HSBC Bank PLC | | | 10/14/20 | | | | | | | | 67,230 | |
USD | | | 2,325,000 | | | | MXN | | | | 50,005,775 | | | | | | | HSBC Bank PLC | | | 10/14/20 | | | | | | | | 67,230 | |
USD | | | 2,628,000 | | | | MXN | | | | 56,561,130 | | | | | | | HSBC Bank PLC | | | 10/14/20 | | | | | | | | 74,255 | |
USD | | | 2,628,000 | | | | MXN | | | | 56,561,130 | | | | | | | HSBC Bank PLC | | | 10/14/20 | | | | | | | | 74,255 | |
USD | | | 4,357,353 | | | | MXN | | | | 96,482,388 | | | | | | | UBS AG | | | 10/14/20 | | | | | | | | 1,156 | |
USD | | | 3,969,000 | | | | PLN | | | | 15,001,629 | | | | | | | Bank of America N.A. | | | 10/14/20 | | | | | | | | 87,874 | |
USD | | | 3,969,000 | | | | PLN | | | | 15,001,629 | | | | | | | Bank of America N.A. | | | 10/14/20 | | | | | | | | 87,874 | |
USD | | | 2,999,000 | | | | RUB | | | | 229,033,630 | | | | | | | Bank of America N.A. | | | 10/14/20 | | | | | | | | 55,928 | |
USD | | | 2,999,000 | | | | RUB | | | | 229,033,630 | | | | | | | Bank of America N.A. | | | 10/14/20 | | | | | | | | 55,928 | |
USD | | | 1,171,000 | | | | RUB | | | | 88,709,105 | | | | | | | Citibank N.A. | | | 10/14/20 | | | | | | | | 31,092 | |
USD | | | 9,372,000 | | | | RUB | | | | 709,975,860 | | | | | | | Citibank N.A. | | | 10/14/20 | | | | | | | | 248,843 | |
USD | | | 9,452,000 | | | | RUB | | | | 717,213,034 | | | | | | | Citibank N.A. | | | 10/14/20 | | | | | | | | 235,845 | |
USD | | | 1,708,000 | | | | RUB | | | | 129,602,186 | | | | | | | Citibank N.A. | | | 10/14/20 | | | | | | | | 42,618 | |
USD | | | 4,995,000 | | | | ZAR | | | | 81,991,426 | | | | | | | BNP Paribas S.A. | | | 10/14/20 | | | | | | | | 108,139 | |
USD | | | 2,997,000 | | | | ZAR | | | | 49,194,856 | | | | | | | BNP Paribas S.A. | | | 10/14/20 | | | | | | | | 64,883 | |
ZAR | | | 83,434,755 | | | | USD | | | | 4,971,000 | | | | | | | BNP Paribas S.A. | | | 10/14/20 | | | | | | | | 1,887 | |
ZAR | | | 51,151,244 | | | | USD | | | | 2,999,000 | | | | | | | BNP Paribas S.A. | | | 10/14/20 | | | | | | | | 49,722 | |
ZAR | | | 51,151,244 | | | | USD | | | | 2,999,000 | | | | | | | BNP Paribas S.A. | | | 10/14/20 | | | | | | | | 49,722 | |
ZAR | | | 50,961,600 | | | | USD | | | | 3,000,000 | | | | | | | Citibank N.A. | | | 10/14/20 | | | | | | | | 37,418 | |
ZAR | | | 50,961,600 | | | | USD | | | | 3,000,000 | | | | | | | Citibank N.A. | | | 10/14/20 | | | | | | | | 37,418 | |
USD | | | 4,038,000 | | | | BRL | | | | 22,337,005 | | | | | | | BNP Paribas S.A. | | | 11/04/20 | | | | | | | | 64,205 | |
USD | | | 2,966,000 | | | | BRL | | | | 16,407,022 | | | | | | | BNP Paribas S.A. | | | 11/04/20 | | | | | | | | 47,160 | |
USD | | | 126,112,523 | | | | EUR | | | | 107,391,500 | | | | | | | Goldman Sachs Bank USA | | | 11/04/20 | | | | | | | | 110,430 | |
USD | | | 14,347,407 | | | | COP | | | | 53,206,642,219 | | | | | | | Barclays Bank PLC | | | 12/04/20 | | | | | | | | 491,923 | |
USD | | | 3,739,582 | | | | EUR | | | | 3,139,000 | | | | | | | Bank of America N.A. | | | 12/04/20 | | | | | | | | 54,143 | |
USD | | | 5,958,645 | | | | EUR | | | | 5,001,678 | | | | | | | Bank of America N.A. | | | 12/04/20 | | | | | | | | 86,271 | |
USD | | | 4,897,222 | | | | MXN | | | | 105,018,972 | | | | | | | Deutsche Bank AG | | | 12/04/20 | | | | | | | | 183,095 | |
USD | | | 54,235,662 | | | | RUB | | | | 4,105,449,793 | | | | | | | Citibank N.A. | | | 12/04/20 | | | | | | | | 1,764,719 | |
EUR | | | 21,340,000 | | | | USD | | | | 24,887,882 | | | | | | | Bank of America N.A. | | | 12/16/20 | | | | | | | | 176,680 | |
EUR | | | 21,300,000 | | | | USD | | | | 24,967,306 | | | | | | | Deutsche Bank AG | | | 12/16/20 | | | | | | | | 50,274 | |
EUR | | | 22,780,000 | | | | USD | | | | 26,660,186 | | | | | | | JPMorgan Chase Bank N.A. | | | 12/16/20 | | | | | | | | 95,705 | |
EUR | | | 22,410,000 | | | | USD | | | | 26,117,309 | | | | | | | JPMorgan Chase Bank N.A. | | | 12/16/20 | | | | | | | | 204,004 | |
| | |
| 108 | | 2 0 2 0 B L A C K R O C K A N N U A L R E P O R T T O S H A R E H O L D E R S |
| | |
Schedule of Investments (continued) September 30, 2020 | | Master Total Return Portfolio |
Forward Foreign Currency Exchange Contracts (continued)
| | | | | | | | | | | | | | | | | | | | | | | | | | | | | | |
| | | | | | | |
| Currency Purchased | | | Currency Sold | | | | | | Counterparty | | Settlement
Date | | | | | | Unrealized
Appreciation
(Depreciation) | |
| | | | | | | | |
EUR | | | 42,610,000 | | | | USD | | | | 49,917,189 | | | | | | | JPMorgan Chase Bank N.A. | | | 12/16/20 | | | | | | | $ | 129,717 | |
GBP | | | 28,929,141 | | | | EUR | | | | 31,550,000 | | | | | | | BNP Paribas S.A. | | | 12/16/20 | | | | | | | | 291,142 | |
GBP | | | 29,259,407 | | | | EUR | | | | 31,550,000 | | | | | | | BNP Paribas S.A. | | | 12/16/20 | | | | | | | | 717,516 | |
GBP | | | 29,102,794 | | | | EUR | | | | 31,510,000 | | | | | | | BNP Paribas S.A. | | | 12/16/20 | | | | | | | | 562,309 | |
USD | | | 41,266,169 | | | | CNH | | | | 280,721,365 | | | | | | | Morgan Stanley & Co. International PLC | | | 12/16/20 | | | | | | | | 106,907 | |
USD | | | 1,363,301 | | | | EUR | | | | 1,145,538 | | | | | | | Bank of America N.A. | | | 12/16/20 | | | | | | | | 17,828 | |
USD | | | 100,096,399 | | | | EUR | | | | 84,080,000 | | | | | | | BNP Paribas S.A. | | | 12/16/20 | | | | | | | | 1,341,557 | |
USD | | | 25,444,370 | | | | EUR | | | | 21,440,000 | | | | | | | BNP Paribas S.A. | | | 12/16/20 | | | | | | | | 262,355 | |
USD | | | 13,543,157 | | | | EUR | | | | 11,388,484 | | | | | | | Citibank N.A. | | | 12/16/20 | | | | | | | | 166,992 | |
USD | | | 19,948,131 | | | | EUR | | | | 16,870,000 | | | | | | | Citibank N.A. | | | 12/16/20 | | | | | | | | 133,737 | |
USD | | | 29,766,812 | | | | EUR | | | | 25,060,000 | | | | | | | Citibank N.A. | | | 12/16/20 | | | | | | | | 332,983 | |
USD | | | 20,081,481 | | | | EUR | | | | 16,910,000 | | | | | | | Citibank N.A. | | | 12/16/20 | | | | | | | | 220,106 | |
USD | | | 102,514,686 | | | | EUR | | | | 86,436,000 | | | | | | | JPMorgan Chase Bank N.A. | | | 12/16/20 | | | | | | | | 992,642 | |
USD | | | 1,321,842 | | | | EUR | | | | 1,111,516 | | | | | | | JPMorgan Chase Bank N.A. | | | 12/16/20 | | | | | | | | 16,328 | |
USD | | | 13,523,767 | | | | EUR | | | | 11,364,462 | | | | | | | Morgan Stanley & Co. International PLC | | | 12/16/20 | | | | | | | | 175,816 | |
USD | | | 4,393,331 | | | | EUR | | | | 3,707,621 | | | | | | | UBS AG | | | 12/16/20 | | | | | | | | 38,603 | |
| | | | | | | | | | | | | | | | | | | | | | | | | | | | | | |
| | | | | | | | |
| | | | | | | | | | | | | | | | | | | | | | | | | | | | | 19,677,120 | |
| | | | | | | | | | | | | | | | | | | | | | | | | | | | | | |
BRL | | | 22,319,641 | | | | USD | | | | 4,038,000 | | | | | | | BNP Paribas S.A. | | | 10/02/20 | | | | | | | | (63,837 | ) |
BRL | | | 16,394,268 | | | | USD | | | | 2,966,000 | | | | | | | BNP Paribas S.A. | | | 10/02/20 | | | | | | | | (46,890 | ) |
BRL | | | 21,006,440 | | | | USD | | | | 3,980,000 | | | | | | | Citibank N.A. | | | 10/02/20 | | | | | | | | (239,662 | ) |
BRL | | | 21,006,440 | | | | USD | | | | 3,980,000 | | | | | | | Citibank N.A. | | | 10/02/20 | | | | | | | | (239,662 | ) |
EUR | | | 107,391,500 | | | | USD | | | | 126,034,664 | | | | | | | Goldman Sachs Bank USA | | | 10/05/20 | | | | | | | | (109,927 | ) |
USD | | | 1,533,920 | | | | EUR | | | | 1,316,000 | | | | | | | Goldman Sachs Bank USA | | | 10/05/20 | | | | | | | | (9,191 | ) |
USD | | | 1,732,319 | | | | EUR | | | | 1,479,000 | | | | | | | HSBC Bank PLC | | | 10/05/20 | | | | | | | | (1,921 | ) |
USD | | | 7,509,721 | | | | EUR | | | | 6,409,000 | | | | | | | State Street Bank and Trust Co. | | | 10/05/20 | | | | | | | | (5,321 | ) |
USD | | | 1,977,014 | | | | JPY | | | | 209,449,000 | | | | | | | JPMorgan Chase Bank N.A. | | | 10/05/20 | | | | | | | | (9,053 | ) |
AUD | | | 33,052,720 | | | | USD | | | | 23,691,000 | | | | | | | JPMorgan Chase Bank N.A. | | | 10/09/20 | | | | | | | | (16,487 | ) |
EUR | | | 20,199,910 | | | | USD | | | | 23,691,000 | | | | | | | JPMorgan Chase Bank N.A. | | | 10/09/20 | | | | | | | | (3,127 | ) |
GBP | | | 18,324,575 | | | | USD | | | | 23,691,000 | | | | | | | JPMorgan Chase Bank N.A. | | | 10/09/20 | | | | | | | | (44,714 | ) |
USD | | | 23,691,000 | | | | AUD | | | | 33,606,496 | | | | | | | JPMorgan Chase Bank N.A. | | | 10/09/20 | | | | | | | | (380,163 | ) |
USD | | | 23,691,000 | | | | CAD | | | | 31,725,258 | | | | | | | JPMorgan Chase Bank N.A. | | | 10/09/20 | | | | | | | | (135,486 | ) |
USD | | | 23,691,000 | | | | EUR | | | | 20,340,459 | | | | | | | JPMorgan Chase Bank N.A. | | | 10/09/20 | | | | | | | | (161,690 | ) |
USD | | | 23,691,000 | | | | GBP | | | | 18,447,917 | | | | | | | JPMorgan Chase Bank N.A. | | | 10/09/20 | | | | | | | | (114,449 | ) |
AUD | | | 5,457,000 | | | | USD | | | | 3,988,794 | | | | | | | UBS AG | | | 10/14/20 | | | | | | | | (80,090 | ) |
AUD | | | 7,513,000 | | | | USD | | | | 5,491,627 | | | | | | | UBS AG | | | 10/14/20 | | | | | | | | (110,265 | ) |
COP | | | 14,899,626,000 | | | | USD | | | | 3,969,000 | | | | | | | Citibank N.A. | | | 10/14/20 | | | | | | | | (78,447 | ) |
COP | | | 18,427,497,000 | | | | USD | | | | 4,971,000 | | | | | | | Citibank N.A. | | | 10/14/20 | | | | | | | | (159,258 | ) |
EUR | | | 1,390,000 | | | | USD | | | | 1,640,638 | | | | | | | Citibank N.A. | | | 10/14/20 | | | | | | | | (10,457 | ) |
EUR | | | 4,330,000 | | | | USD | | | | 5,110,764 | | | | | | | Citibank N.A. | | | 10/14/20 | | | | | | | | (32,574 | ) |
EUR | | | 13,195,000 | | | | USD | | | | 15,630,771 | | | | | | | UBS AG | | | 10/14/20 | | | | | | | | (155,780 | ) |
EUR | | | 13,195,000 | | | | USD | | | | 15,630,771 | | | | | | | UBS AG | | | 10/14/20 | | | | | | | | (155,780 | ) |
HUF | | | 1,206,486,235 | | | | USD | | | | 3,968,676 | | | | | | | Bank of America N.A. | | | 10/14/20 | | | | | | | | (77,816 | ) |
HUF | | | 1,206,486,235 | | | | USD | | | | 3,968,676 | | | | | | | Bank of America N.A. | | | 10/14/20 | | | | | | | | (77,816 | ) |
HUF | | | 301,901,081 | | | | USD | | | | 992,324 | | | | | | | Citibank N.A. | | | 10/14/20 | | | | | | | | (18,708 | ) |
HUF | | | 301,901,081 | | | | USD | | | | 992,324 | | | | | | | Citibank N.A. | | | 10/14/20 | | | | | | | | (18,708 | ) |
JPY | | | 412,638,331 | | | | AUD | | | | 5,474,000 | | | | | | | Deutsche Bank AG | | | 10/14/20 | | | | | | | | (7,718 | ) |
JPY | | | 412,638,331 | | | | AUD | | | | 5,474,000 | | | | | | | Deutsche Bank AG | | | 10/14/20 | | | | | | | | (7,718 | ) |
KRW | | | 9,328,900,350 | | | | USD | | | | 7,997,000 | | | | | | | JPMorgan Chase Bank N.A. | | | 10/14/20 | | | | | | | | (20,172 | ) |
KRW | | | 9,328,900,350 | | | | USD | | | | 7,997,000 | | | | | | | JPMorgan Chase Bank N.A. | | | 10/14/20 | | | | | | | | (20,172 | ) |
MXN | | | 211,641,319 | | | | USD | | | | 9,942,000 | | | | | | | Citibank N.A. | | | 10/14/20 | | | | | | | | (386,357 | ) |
MXN | | | 128,097,273 | | | | USD | | | | 5,838,000 | | | | | | | Deutsche Bank AG | | | 10/14/20 | | | | | | | | (54,385 | ) |
MXN | | | 168,913,298 | | | | USD | | | | 7,908,000 | | | | | | | UBS AG | | | 10/14/20 | | | | | | | | (281,534 | ) |
MXN | | | 39,583,768 | | | | USD | | | | 1,853,190 | | | | | | | UBS AG | | | 10/14/20 | | | | | | | | (65,976 | ) |
MXN | | | 359,314,556 | | | | USD | | | | 16,822,000 | | | | | | | UBS AG | | | 10/14/20 | | | | | | | | (598,883 | ) |
PLN | | | 22,271,661 | | | | USD | | | | 5,953,000 | | | | | | | Bank of America N.A. | | | 10/14/20 | | | | | | | | (191,018 | ) |
PLN | | | 22,271,661 | | | | USD | | | | 5,953,000 | | | | | | | Bank of America N.A. | | | 10/14/20 | | | | | | | | (191,018 | ) |
RUB | | | 128,615,304 | | | | USD | | | | 1,708,000 | | | | | | | Citibank N.A. | | | 10/14/20 | | | | | | | | (55,299 | ) |
RUB | | | 711,751,668 | | | | USD | | | | 9,452,000 | | | | | | | Citibank N.A. | | | 10/14/20 | | | | | | | | (306,024 | ) |
RUB | | | 88,178,291 | | | | USD | | | | 1,171,000 | | | | | | | Citibank N.A. | | | 10/14/20 | | | | | | | | (37,913 | ) |
RUB | | | 705,727,532 | | | | USD | | | | 9,372,000 | | | | | | | Citibank N.A. | | | 10/14/20 | | | | | | | | (303,434 | ) |
USD | | | 9,697,266 | | | | EUR | | | | 8,307,000 | | | | | | | JPMorgan Chase Bank N.A. | | | 10/14/20 | | | | | | | | (45,117 | ) |
| | |
S C H E D U L E O F I N V E S T M E N T S | | 109 |
| | |
Schedule of Investments (continued) September 30, 2020 | | Master Total Return Portfolio |
Forward Foreign Currency Exchange Contracts (continued)
| | | | | | | | | | | | | | | | | | | | | | | | | | | | | | |
| | | | | | |
| Currency Purchased | | | Currency Sold | | | Counterparty | | Settlement
Date | | | | | | Unrealized
Appreciation
(Depreciation) | |
| | | | | | | | |
USD | | | 9,697,266 | | | | EUR | | | | 8,307,000 | | | | | | | JPMorgan Chase Bank N.A. | | | 10/14/20 | | | | | | | $ | (45,117 | ) |
USD | | | 4,943,000 | | | | JPY | | | | 526,472,207 | | | | | | | BNP Paribas S.A. | | | 10/14/20 | | | | | | | | (49,681 | ) |
USD | | | 4,943,000 | | | | JPY | | | | 526,472,207 | | | | | | | BNP Paribas S.A. | | | 10/14/20 | | | | | | | | (49,681 | ) |
USD | | | 3,902,430 | | | | MXN | | | | 87,908,089 | | | | | | | Morgan Stanley & Co. International PLC | | | 10/14/20 | | | | | | | | (66,636 | ) |
USD | | | 3,095,570 | | | | MXN | | | | 69,801,602 | | | | | | | UBS AG | | | 10/14/20 | | | | | | | | (55,985 | ) |
USD | | | 2,165,000 | | | | RUB | | | | 172,095,850 | | | | | | | Bank of America N.A. | | | 10/14/20 | | | | | | | | (46,424 | ) |
USD | | | 2,165,000 | | | | RUB | | | | 172,095,850 | | | | | | | Bank of America N.A. | | | 10/14/20 | | | | | | | | (46,424 | ) |
USD | | | 835,000 | | | | RUB | | | | 66,288,145 | | | | | | | BNP Paribas S.A. | | | 10/14/20 | | | | | | | | (16,800 | ) |
USD | | | 835,000 | | | | RUB | | | | 66,288,145 | | | | | | | BNP Paribas S.A. | | | 10/14/20 | | | | | | | | (16,800 | ) |
USD | | | 3,001,000 | | | | RUB | | | | 235,908,610 | | | | | | | Citibank N.A. | | | 10/14/20 | | | | | | | | (30,415 | ) |
USD | | | 3,001,000 | | | | RUB | | | | 235,908,610 | | | | | | | Citibank N.A. | | | 10/14/20 | | | | | | | | (30,415 | ) |
USD | | | 3,000,000 | | | | ZAR | | | | 51,042,000 | | | | | | | Bank of America N.A. | | | 10/14/20 | | | | | | | | (42,210 | ) |
USD | | | 3,000,000 | | | | ZAR | | | | 51,042,000 | | | | | | | Bank of America N.A. | | | 10/14/20 | | | | | | | | (42,210 | ) |
USD | | | 6,001,916 | | | | ZAR | | | | 101,587,230 | | | | | | | BNP Paribas S.A. | | | 10/14/20 | | | | | | | | (52,896 | ) |
USD | | | 14,407,000 | | | | ZAR | | | | 243,850,001 | | | | | | | BNP Paribas S.A. | | | 10/14/20 | | | | | | | | (126,972 | ) |
USD | | | 6,404,356 | | | | ZAR | | | | 108,165,922 | | | | | | | UBS AG | | | 10/14/20 | | | | | | | | (42,560 | ) |
ZAR | | | 98,700,161 | | | | USD | | | | 5,986,000 | | | | | | | Bank of America N.A. | | | 10/14/20 | | | | | | | | (103,263 | ) |
KZT | | | 539,247,006 | | | | USD | | | | 1,270,760 | | | | | | | Citibank N.A. | | | 10/23/20 | | | | | | | | (32,461 | ) |
USD | | | 2,684,749 | | | | AUD | | | | 3,769,000 | | | | | | | Bank of America N.A. | | | 11/04/20 | | | | | | | | (15,020 | ) |
USD | | | 125,833,305 | | | | EUR | | | | 107,391,500 | | | | | | | UBS AG | | | 11/04/20 | | | | | | | | (168,788 | ) |
USD | | | 1,983,425 | | | | JPY | | | | 209,449,000 | | | | | | | Barclays Bank PLC | | | 11/04/20 | | | | | | | | (3,297 | ) |
USD | | | 1,790,749 | | | | EUR | | | | 1,591,408 | | | | | | | UBS AG | | | 11/27/20 | | | | | | | | (77,335 | ) |
IDR | | | 194,009,060,238 | | | | USD | | | | 13,055,791 | | | | | | | HSBC Bank PLC | | | 12/04/20 | | | | | | | | (95,767 | ) |
RUB | | | 125,450,291 | | | | USD | | | | 1,630,792 | | | | | | | Bank of America N.A. | | | 12/04/20 | | | | | | | | (27,436 | ) |
RUB | | | 212,661,430 | | | | USD | | | | 2,758,541 | | | | | | | Credit Suisse International | | | 12/04/20 | | | | | | | | (40,557 | ) |
RUB | | | 141,745,141 | | | | USD | | | | 1,840,523 | | | | | | | Credit Suisse International | | | 12/04/20 | | | | | | | | (28,907 | ) |
RUB | | | 62,678,618 | | | | USD | | | | 813,438 | | | | | | | Credit Suisse International | | | 12/04/20 | | | | | | | | (12,355 | ) |
RUB | | | 70,696,936 | | | | USD | | | | 920,341 | | | | | | | Credit Suisse International | | | 12/04/20 | | | | | | | | (16,778 | ) |
RUB | | | 212,090,656 | | | | USD | | | | 2,768,302 | | | | | | | Credit Suisse International | | | 12/04/20 | | | | | | | | (57,613 | ) |
RUB | | | 173,518,557 | | | | USD | | | | 2,265,152 | | | | | | | Credit Suisse International | | | 12/04/20 | | | | | | | | (47,445 | ) |
RUB | | | 226,253,011 | | | | USD | | | | 2,937,226 | | | | | | | Credit Suisse International | | | 12/04/20 | | | | | | | | (45,530 | ) |
RUB | | | 125,261,799 | | | | USD | | | | 1,636,703 | | | | | | | HSBC Bank PLC | | | 12/04/20 | | | | | | | | (35,757 | ) |
RUB | | | 125,261,799 | | | | USD | | | | 1,631,310 | | | | | | | HSBC Bank PLC | | | 12/04/20 | | | | | | | | (30,364 | ) |
USD | | | 18,335,820 | | | | CNH | | | | 126,083,000 | | | | | | | Barclays Bank PLC | | | 12/04/20 | | | | | | | | (164,703 | ) |
USD | | | 118,972,110 | | | | CNH | | | | 817,731,000 | | | | | | | Citibank N.A. | | | 12/04/20 | | | | | | | | (1,015,920 | ) |
USD | | | 3,997,820 | | | | CNH | | | | 27,465,000 | | | | | | | HSBC Bank PLC | | | 12/04/20 | | | | | | | | (32,199 | ) |
USD | | | 40,666,987 | | | | IDR | | | | 615,616,849,730 | | | | | | | Standard Chartered Bank | | | 12/04/20 | | | | | | | | (456,915 | ) |
EUR | | | 31,670,000 | | | | GBP | | | | 29,421,747 | | | | | | | BNP Paribas S.A. | | | 12/16/20 | | | | | | | | (786,154 | ) |
EUR | | | 6,240,000 | | | | GBP | | | | 5,759,607 | | | | | | | BNP Paribas S.A. | | | 12/16/20 | | | | | | | | (106,594 | ) |
EUR | | | 31,430,000 | | | | GBP | | | | 29,168,297 | | | | | | | Citibank N.A. | | | 12/16/20 | | | | | | | | (740,837 | ) |
EUR | | | 25,270,000 | | | | GBP | | | | 23,313,344 | | | | | | | Citibank N.A. | | | 12/16/20 | | | | | | | | (417,188 | ) |
EUR | | | 22,776,573 | | | | USD | | | | 27,030,439 | | | | | | | Bank of America N.A. | | | 12/16/20 | | | | | | | | (278,574 | ) |
EUR | | | 2,483,521 | | | | USD | | | | 2,944,363 | | | | | | | Bank of America N.A. | | | 12/16/20 | | | | | | | | (27,383 | ) |
EUR | | | 21,050,000 | | | | USD | | | | 24,754,989 | | | | | | | Bank of America N.A. | | | 12/16/20 | | | | | | | | (31,043 | ) |
EUR | | | 50,500,000 | | | | USD | | | | 60,085,304 | | | | | | | BNP Paribas S.A. | | | 12/16/20 | | | | | | | | (771,323 | ) |
EUR | | | 25,310,000 | | | | USD | | | | 30,132,694 | | | | | | | BNP Paribas S.A. | | | 12/16/20 | | | | | | | | (405,231 | ) |
EUR | | | 84,080,000 | | | | USD | | | | 99,950,125 | | | | | | | Citibank N.A. | | | 12/16/20 | | | | | | | | (1,195,283 | ) |
EUR | | | 24,970,000 | | | | USD | | | | 29,735,842 | | | | | | | Citibank N.A. | | | 12/16/20 | | | | | | | | (407,721 | ) |
EUR | | | 17,110,000 | | | | USD | | | | 20,162,989 | | | | | | | Citibank N.A. | | | 12/16/20 | | | | | | | | (66,707 | ) |
EUR | | | 2,423,427 | | | | USD | | | | 2,876,960 | | | | | | | Deutsche Bank AG | | | 12/16/20 | | | | | | | | (30,561 | ) |
EUR | | | 21,100,000 | | | | USD | | | | 24,870,188 | | | | | | | HSBC Bank PLC | | | 12/16/20 | | | | | | | | (87,515 | ) |
EUR | | | 22,826,479 | | | | USD | | | | 27,053,865 | | | | | | | Morgan Stanley & Co. International PLC | | | 12/16/20 | | | | | | | | (243,383 | ) |
TWD | | | 38,600,260 | | | | USD | | | | 1,334,725 | | | | | | | Goldman Sachs Bank USA | | | 12/16/20 | | | | | | | | (1,620 | ) |
USD | | | 528,242 | | | | CNH | | | | 3,634,112 | | | | | | | HSBC Bank PLC | | | 12/16/20 | | | | | | | | (4,590 | ) |
USD | | | 255,893,973 | | | | CNH | | | | 1,759,347,830 | | | | | | | Standard Chartered Bank | | | 12/16/20 | | | | | | | | (2,060,947 | ) |
USD | | | 40,830,417 | | | | CNH | | | | 280,721,365 | | | | | | | Standard Chartered Bank | | | 12/16/20 | | | | | | | | (328,845 | ) |
USD | | | 25,162,369 | | | | EUR | | | | 21,530,000 | | | | | | | Bank of America N.A. | | | 12/16/20 | | | | | | | | (125,354 | ) |
USD | | | 30,204,190 | | | | EUR | | | | 25,730,000 | | | | | | | BNP Paribas S.A. | | | 12/16/20 | | | | | | | | (16,577 | ) |
USD | | | 24,697,106 | | | | EUR | | | | 21,030,000 | | | | | | | Citibank N.A. | | | 12/16/20 | | | | | | | | (3,350 | ) |
USD | | | 25,299,400 | | | | EUR | | | | 21,630,000 | | | | | | | Deutsche Bank AG | | | 12/16/20 | | | | | | | | (105,777 | ) |
USD | | | 30,169,274 | | | | EUR | | | | 25,730,000 | | | | | | | Deutsche Bank AG | | | 12/16/20 | | | | | | | | (51,493 | ) |
USD | | | 25,106,181 | | | | EUR | | | | 21,470,000 | | | | | | | JPMorgan Chase Bank N.A. | | | 12/16/20 | | | | | | | | (111,070 | ) |
| | |
| 110 | | 2 0 2 0 B L A C K R O C K A N N U A L R E P O R T T O S H A R E H O L D E R S |
| | |
Schedule of Investments (continued) September 30, 2020 | | Master Total Return Portfolio |
Forward Foreign Currency Exchange Contracts (continued)
| | | | | | | | | | | | | | | | | | | | | | | | |
| | | | | | |
| | | Currency Purchased | | | Currency Sold | | | Counterparty | | Settlement
Date | | | Unrealized
Appreciation
(Depreciation) | | | |
| | | | | | | | |
| | | USD | | | 25,043,270 | | | EUR | | | 21,430,000 | | | JPMorgan Chase Bank N.A. | | | 12/16/20 | | | $ | (127,000 | ) | | |
| | USD | | | 40,170,060 | | | EUR | | | 34,270,000 | | | JPMorgan Chase Bank N.A. | | | 12/16/20 | | | | (81,229 | ) | | |
| | USD | | | 50,317,579 | | | EUR | | | 42,880,000 | | | JPMorgan Chase Bank N.A. | | | 12/16/20 | | | | (46,451 | ) | | |
| | USD | | | 7,106,139 | | | HKD | | | 55,103,485 | | | Bank of America N.A. | | | 12/16/20 | | | | (1,838 | ) | | |
| | USD | | | 4,133,845 | | | JPY | | | 438,419,026 | | | Goldman Sachs Bank USA | | | 12/16/20 | | | | (27,671 | ) | | |
| | USD | | | 1,328,432 | | | TWD | | | 38,600,260 | | | Goldman Sachs Bank USA | | | 12/16/20 | | | | (4,673 | ) | | |
| | USD | | | 9,692,000 | | | TRY | | | 77,796,715 | | | JPMorgan Chase Bank N.A. | | | 12/29/20 | | | | (96,484 | ) | | |
| | | | | | | | | | | | | | | | | | | | | | | | |
| | | | | | | | |
| | | | | | | | | | | | | | | | | | | | | (17,190,119 | ) | | |
| | | | | | | | |
| | | | | | | | | | | | | | | | | | | | | | | | |
| | | | | | | | |
| | | | | | | | | | | | | | | | | | | | $ | 2,487,001 | | | |
| | | | | | | | | | | | | | | | | | | | | | | | |
Interest Rate Caps Purchased
| | | | | | | | | | | | | | | | | | | | | | | | | | | | | | |
| | | | | | | | | |
| | | Reference Entity | | Exercise Rate | | | Counterparty | | Expiration
Date | | | Notional Amount (000) | | | Value | | | Premiums Paid (Received) | | | Unrealized
Appreciation
(Depreciation) | | | |
| | | | | | | | | |
| | 30Y-5Y CMS Index Cap | | | 0.87 | % | | Goldman Sachs Bank USA | | | 03/18/21 | | | | USD 948,500 | | | $ | 966,569 | | | $ | 820,452 | | | $ | 146,116 | | | |
| | | | | | | | | | | | | | | | | | | | | | | | | | | | | | |
Exchange-Traded Options Purchased
| | | | | | | | | | | | | | | | | | | | | | | | |
| | | | | | |
| Description | | Number of
Contracts | | | Expiration
Date | | | Exercise Price | | | Notional Amount (000) | | | Value | |
| | | | | | | |
Call | | | | | | | | | | | | | | | | | | | | | | | | |
SPDR S&P 500 ETF Trust | | | 2,481 | | | | 10/05/20 | | | USD | | | 335.00 | | | USD | | | 83,086 | | | $ | 710,806 | |
SPDR S&P 500 ETF Trust | | | 9,161 | | | | 10/09/20 | | | USD | | | 350.00 | | | USD | | | 306,793 | | | | 384,762 | |
Facebook, Inc. | | | 1,221 | | | | 10/16/20 | | | USD | | | 300.00 | | | USD | | | 31,978 | | | | 39,683 | |
PowerShares QQQ Trust, Series 1 ETF | | | 5,929 | | | | 10/16/20 | | | USD | | | 280.00 | | | USD | | | 164,731 | | | | 3,050,470 | |
PowerShares QQQ Trust, Series 1 ETF | | | 49 | | | | 11/20/20 | | | USD | | | 295.00 | | | USD | | | 1,361 | | | | 28,812 | |
Caesars Entertainment, Inc. | | | 1,451 | | | | 01/15/21 | | | USD | | | 45.00 | | | USD | | | 8,134 | | | | 2,245,422 | |
Caesars Entertainment, Inc. | | | 869 | | | | 03/19/21 | | | USD | �� | | 35.00 | | | USD | | | 4,872 | | | | 2,074,737 | |
Caesars Entertainment, Inc. | | | 1,160 | | | | 03/19/21 | | | USD | | | 40.00 | | | USD | | | 6,503 | | | | 2,389,600 | |
SPDR S&P 500 ETF Trust | | | 120 | | | | 03/19/21 | | | USD | | | 380.00 | | | USD | | | 4,019 | | | | 51,960 | |
SPDR S&P 500 ETF Trust | | | 3,652 | | | | 06/18/21 | | | USD | | | 400.00 | | | USD | | | 122,302 | | | | 1,256,288 | |
| | | | | | | | | | | | | | | | | | | | | | | | |
| | | | | | | |
| | | | | | | | | | | | | | | | | | | | | | | 12,232,540 | |
| | | | | | | | | | | | | | | | | | | | | | | | |
Put | | | | | | | | | | | | | | | | | | | | | | | | |
SPDR S&P 500 ETF Trust | | | 3,054 | | | | 10/05/20 | | | USD | | | 328.00 | | | USD | | | 102,275 | | | | 479,478 | |
Euro Dollar (2 Year) Mid-Curve | | | 56,681 | | | | 12/11/20 | | | USD | | | 99.63 | | | USD | | | 14,132,699 | | | | 2,834,050 | |
Euro Dollar (3 Year) Mid-Curve | | | 22,196 | | | | 06/11/21 | | | USD | | | 99.25 | | | USD | | | 5,522,642 | | | | 4,161,750 | |
| | | | | | | | | | | | | | | | | | | | | | | | |
| | | | | | | |
| | | | | | | | | | | | | | | | | | | | | | | 7,475,278 | |
| | | | | | | | | | | | | | | | | | | | | | | | |
| | | | | | | |
| | | | | | | | | | | | | | | | | | | | | | $ | 19,707,818 | |
| | | | | | | | | | | | | | | | | | | | | | | | |
OTC Barrier Options Purchased
| | | | | | | | | | | | | | | | | | | | | | | | | | | | | | | | | | | | | | | | |
| | | | | | | | | |
| Description | | Type of
Option | | Counterparty | | Number of
Contracts | | | Expiration
Date | | | Exercise Price | | | Barrier Price/Range | | | Notional Amount (000) | | | Value | |
| | | | | | | | | | | |
Call | | | | | | | | | | | | | | | | | | | | | | | | | | | | | | | | | | | | | | | | |
EUR | | | | | | | | | | | | | | | | | | | | | | | | | | | | | | | | | | | | | | | | |
Currency | | One-Touch | | Deutsche Bank AG | | | — | | | | 10/29/20 | | | | USD | | | | 1.22 | | | | USD | | | | 1.25 | | | | EUR | | | | 1,160 | | | $ | 33,842 | |
USD | | | | | | | | | | | | | | | | | | | | | | | | | | | | | | | | | | | | | | | | |
Currency | | Down-and-In | | BNP Paribas S.A. | | | — | | | | 10/30/20 | | | | ZAR | | | | 16.50 | | | | ZAR | | | | 15.65 | | | | USD | | | | 19,990 | | | | 4,852 | |
USD | | | | | | | | | | | | | | | | | | | | | | | | | | | | | | | | | | | | | | | | |
Currency | | Down-and-In | | Bank of America N.A. | | | — | | | | 11/02/20 | | | | ZAR | | | | 16.70 | | | | ZAR | | | | 15.80 | | | | USD | | | | 31,400 | | | | 13,827 | |
USD | | | | | | | | | | | | | | | | | | | | | | | | | | | | | | | | | | | | | | | | |
Currency | | Down-and-In | | Bank of America N.A. | | | — | | | | 11/02/20 | | | | ZAR | | | | 17.03 | | | | ZAR | | | | 16.13 | | | | USD | | | | 50,006 | | | | 58,982 | |
USD | | | | | | | | | | | | | | | | | | | | | | | | | | | | | | | | | | | | | | | | |
Currency | | Down-and-In | | BNP Paribas S.A. | | | — | | | | 11/02/20 | | | | ZAR | | | | 16.58 | | | | ZAR | | | | 15.68 | | | | USD | | | | 44,035 | | | | 14,002 | |
| | |
S C H E D U L E O F I N V E S T M E N T S | | 111 |
| | |
Schedule of Investments (continued) September 30, 2020 | | Master Total Return Portfolio |
OTC Barrier Options Purchased (continued)
| | | | | | | | | | | | | | | | | | | | | | | | | | | | | | | | | | | | | | | | | | | | |
| | | | | | | | | | |
| | | Description | | Type of Option | | Counterparty | | Number of
Contracts | | | Expiration
Date | | | Exercise Price | | | Barrier Price/Range | | | Notional Amount (000) | | | Value | | | |
| | |
| | Call (continued) | | | |
| | USD Currency | | Down-and-In | | Morgan Stanley & Co. International PLC | | | — | | | | 11/02/20 | | | | MXN | | | | 21.50 | | | | MXN | | | | 20.50 | | | | USD | | | | 31,400 | | | $ | 7,092 | | | |
| | USD Currency | | Down-and-In | | Morgan Stanley & Co. International PLC | | | — | | | | 11/02/20 | | | | MXN | | | | 21.40 | | | | MXN | | | | 20.40 | | | | USD | | | | 94,040 | | | | 16,981 | | | |
| | USD Currency. | | One-Touch | | Credit Suisse International | | | — | | | | 12/21/20 | | | | CAD | | | | 1.41 | | | | CAD | | | | 1.41 | | | | USD | | | | 736 | | | | 94,126 | | | |
| | USD Currency | | One-Touch | | Citibank N.A. | | | — | | | | 02/18/21 | | | | JPY | | | | 100.00 | | | | JPY | | | | 100.00 | | | | USD | | | | 943 | | | | 240,868 | | | |
| | | | | | | | | | | | | | | | | | | | | | | | | | | | | | | | | | | | | | | | | | | | |
| | | | | | | | | | | | | |
| | | | | | | | | | | | | | | | | | | | | | | | | | | | | | | | | | | | | | | | | 484,572 | | | |
| | | | | | | | | | | | | | | | | | | | | | | | | | | | | | | | | | | | | | | | | | | | |
| | Put | | | | | | | | | | | | | | | | | | | | | | | | | | | | | | | | | | | | | | | | | | |
| | USD Currency | | Down-and-Out | | Morgan Stanley & Co. International PLC | | | — | | | | 11/20/20 | | | | MXN | | | | 21.90 | | | | MXN | | | | 21.25 | | | | USD | | | | 9,999 | | | | 49,117 | | | |
| | S&P | | | | | | | | | | | | | | | | | | | | | | | | | | | | | | | | | | | | | | | | | | |
| | 500 Index | | Down-and-Out | | Goldman Sachs International | | | 9,262 | | | | 03/19/21 | | | | USD | | | | 3,242.36 | | | | USD | | | | 2,559.76 | | | | USD | | | | 31,148 | | | | 343,154 | | | |
| | | | | | | | | | | | | | | | | | | | | | | | | | | | | | | | | | | | | | | | | | | | |
| | | | | | | | | | | | | |
| | | | | | | | | | | | | | | | | | | | | | | | | | | | | | | | | | | | | | | | | 392,271 | | | |
| | | | | | | | | | | | | | | | | | | | | | | | | | | | | | | | | | | | | | | | | | | | |
| | | | | | | | | | | | | |
| | | | | | | | | | | | | | | | | | | | | | | | | | | | | | | | | | | | | | | | $ | 876,843 | | | |
| | | | | | | | | | | | | | | | | | | | | | | | | | | | | | | | | | | | | | | | | | | | |
OTC Options Purchased
| | | | | | | | | | | | | | | | | | | | | | | | | | |
| | | | | | | |
| Description | | Counterparty | | Number of
Contracts | | | Expiration
Date | | | Exercise Price | | | Notional Amount (000) | | | Value | |
| | | | | | | | |
| Call | | | | | | | | | | | | | | | | | | | | | |
USD Currency | | Bank of America N.A. | | | — | | | | 10/15/20 | | | ZAR | | | 17.00 | | | USD | | | 15,188 | | | $ | 141,163 | |
USD Currency | | JPMorgan Chase Bank N.A. | | | — | | | | 10/23/20 | | | IDR | | | 15,000.00 | | | USD | | | 15,696 | | | | 128,915 | |
USD Currency | | Citibank N.A. | | | — | | | | 10/30/20 | | | MXN | | | 22.50 | | | USD | | | 7,993 | | | | 128,018 | |
USD Currency | | Deutsche Bank AG | | | — | | | | 11/03/20 | | | CLP | | | 775.00 | | | USD | | | 19,460 | | | | 439,721 | |
USD Currency | | JPMorgan Chase Bank N.A. | | | — | | | | 11/03/20 | | | TWD | | | 30.00 | | | USD | | | 13,122 | | | | 7,009 | |
USD Currency | | Citibank N.A. | | | — | | | | 11/06/20 | | | TRY | | | 7.70 | | | USD | | | 6,255 | | | | 189,854 | |
| | | | | | | | | | | | | | | | | | | | | | | | | | |
| | | | | | | | |
| | | | | | | | | | | | | | | | | | | | | | | | | 1,034,680 | |
| | | | | | | | | | | | | | | | | | | | | | | | | | |
| Put | | | | | | | | | | | | | | | | | | | | | |
USD Currency | | Citibank N.A. | | | — | | | | 10/01/20 | | | MXN | | | 21.50 | | | USD | | | 15,812 | | | | 553 | |
USD Currency | | Citibank N.A. | | | — | | | | 10/02/20 | | | RUB | | | 73.50 | | | USD | | | 29,114 | | | | 8 | |
USD Currency | | Bank of America N.A. | | | — | | | | 10/07/20 | | | BRL | | | 5.30 | | | USD | | | 13,690 | | | | 3,301 | |
USD Currency | | Bank of America N.A. | | | — | | | | 10/09/20 | | | MXN | | | 23.80 | | | USD | | | 8,759 | | | | 659,240 | |
USD Currency | | Morgan Stanley & Co. International PLC | | | — | | | | 10/09/20 | | | MXN | | | 21.30 | | | USD | | | 13,920 | | | | 21,357 | |
AUD Currency | | Morgan Stanley & Co. International PLC | | | — | | | | 10/14/20 | | | JPY | | | 72.40 | | | AUD | | | 356,057 | | | | 169,062 | |
USD Currency | | Bank of America N.A. | | | — | | | | 10/30/20 | | | ZAR | | | 17.00 | | | USD | | | 12,000 | | | | 333,226 | |
USD Currency | | BNP Paribas S.A. | | | — | | | | 10/30/20 | | | RUB | | | 79.00 | | | USD | | | 12,000 | | | | 339,789 | |
USD Currency | | Citibank N.A. | | | — | | | | 10/30/20 | | | MXN | | | 21.50 | | | USD | | | 9,998 | | | | 80,546 | |
USD Currency | | Goldman Sachs International | | | — | | | | 10/30/20 | | | JPY | | | 104.50 | | | USD | | | 11,998 | | | | 39,260 | |
USD Currency | | Morgan Stanley & Co. International PLC | | | — | | | | 10/30/20 | | | MXN | | | 21.80 | | | USD | | | 14,995 | | | | 190,295 | |
USD Currency | | Morgan Stanley & Co. International PLC | | | — | | | | 10/30/20 | | | MXN | | | 20.90 | | | USD | | | 15,986 | | | | 44,526 | |
USD Currency | | Citibank N.A. | | | — | | | | 11/09/20 | | | RUB | | | 75.00 | | | USD | | | 15,876 | | | | 121,782 | |
USD Currency | | Deutsche Bank AG | | | — | | | | 12/22/20 | | | CNH | | | 6.80 | | | USD | | | 56,779 | | | | 603,055 | |
| | | | | | | | | | | | | | | | | | | | | | | | | | |
| | | | | | | | |
| | | | | | | | | | | | | | | | | | | | | | | | | 2,606,000 | |
| | | | | | | | | | | | | | | | | | | | | | | | | | |
| | | | | | | | |
| | | | | | | | | | | | | | | | | | | | | | | | $ | 3,640,680 | |
| | | | | | | | | | | | | | | | | | | | | | | | | | |
OTC Interest Rate Swaptions Purchased
| | | | | | | | | | | | | | | | | | | | | | | | | | | | | | | | | | |
| | | | | | | | | | | | | | | Notional | | | | |
| | | Paid by the Fund | | Received by the Fund | | | | Expiration | | | Exercise | | | Amount | | | | |
| Description | | Rate | | | Frequency | | Rate | | | Frequency | | Counterparty | | Date | | | Rate | | | (000) | | | Value | |
| | | | | | | | | | | |
Put | | | | | | | | | | | | | | | | | | | | | | | | | | | | | | | | | | |
30-Year Interest Rate Swap, 06/20/51 | | | 1.41 | % | | Semi-Annual | | | 3-month LIBOR, 0.23 | % | | Quarterly | | Goldman Sachs International | | | 06/18/21 | | | | 1.41 | % | | | USD | | | | 40,320 | | | $ | 1,575,973 | |
| | | | | | | | | | | | | | | | | | | | | | | | | | | | | | | | | | |
| | |
| 112 | | 2 0 2 0 B L A C K R O C K A N N U A L R E P O R T T O S H A R E H O L D E R S |
| | |
Schedule of Investments (continued) September 30, 2020 | | Master Total Return Portfolio |
Interest Rate Caps Sold
| | | | | | | | | | | | | | | | | | | | | | | | | | | | | | |
| | | | | | | | |
| Reference Entity | | Exercise Rate | | | Counterparty | | Expiration Date | | | Notional Amount (000) | | | Value | | | Premiums Paid (Received) | | | Unrealized
Appreciation
(Depreciation) | |
| | | | | | | | |
30Y-5Y CMS Index Cap | | | 1.17 | % | | Goldman Sachs Bank USA | | | 03/18/21 | | | | USD | | | | 948,500 | | | $ | (320,327 | ) | | $ | (204,876 | ) | | $ | (115,451 | ) |
| | | | | | | | | | | | | | | | | | | | | | | | | | | | | | |
Exchange-Traded Options Written
| | | | | | | | | | | | | | | | | | | | | | | | |
| | | | | | | |
| Description | | Number of
Contracts | | | Expiration
Date | | | | | Exercise
Price | | | Notional Amount (000) | | | Value | |
| | | | | | | |
| Call | | | | | | | | | | | | | | | | | | | |
PowerShares QQQ Trust, Series 1 ETF | | | 79 | | | | 10/02/20 | | | USD | | | 295.00 | | | USD | | | 2,195 | | | $ | (158 | ) |
SPDR S&P 500 ETF Trust | | | 3,092 | | | | 10/05/20 | | | USD | | | 340.00 | | | USD | | | 103,548 | | | | (316,930 | ) |
PowerShares QQQ Trust, Series 1 ETF | | | 123 | | | | 10/16/20 | | | USD | | | 280.00 | | | USD | | | 3,418 | | | | (63,283 | ) |
PowerShares QQQ Trust, Series 1 ETF | | | 123 | | | | 10/16/20 | | | USD | | | 290.00 | | | USD | | | 3,417 | | | | (20,172 | ) |
PowerShares QQQ Trust, Series 1 ETF | | | 5,972 | | | | 10/16/20 | | | USD | | | 285.00 | | | USD | | | 165,926 | | | | (1,824,446 | ) |
PowerShares QQQ Trust, Series 1 ETF | | | 123 | | | | 10/23/20 | | | USD | | | 290.00 | | | USD | | | 3,417 | | | | (33,702 | ) |
PowerShares QQQ Trust, Series 1 ETF | | | 246 | | | | 10/23/20 | | | USD | | | 285.00 | | | USD | | | 6,835 | | | | (109,347 | ) |
U.S. Treasury 2-Year Notes Futures | | | 244 | | | | 10/23/20 | | | USD | | | 110.50 | | | USD | | | 53,915 | | | | (11,438 | ) |
U.S. Treasury 5-Year Notes Futures | | | 243 | | | | 10/23/20 | | | USD | | | 126.25 | | | USD | | | 30,626 | | | | (11,391 | ) |
SPDR S&P 500 ETF Trust | | | 2,158 | | | | 10/30/20 | | | USD | | | 340.00 | | | USD | | | 72,269 | | | | (1,206,322 | ) |
iShares iBoxx $ Investment Grade Corporate Bond ETF | | | 330 | | | | 11/20/20 | | | USD | | | 140.00 | | | USD | | | 4,445 | | | | (4,290 | ) |
PowerShares QQQ Trust, Series 1 ETF | | | 85 | | | | 11/20/20 | | | USD | | | 305.00 | | | USD | | | 2,362 | | | | (26,138 | ) |
U.S. Treasury Long-Term Bonds Futures | | | 83 | | | | 11/20/20 | | | USD | | | 182.00 | | | USD | | | 14,631 | | | | (55,766 | ) |
SPDR S&P 500 ETF Trust | | | 119 | | | | 12/18/20 | | | USD | | | 365.00 | | | USD | | | 3,985 | | | | (44,685 | ) |
| | | | | | | | | | | | | | | | | | | | | | | | |
| | | | | | | |
| | | | | | | | | | | | | | | | | | | | | | | (3,728,068 | ) |
| | | | | | | | | | | | | | | | | | | | | | | | |
| Put | | | | | | | | | | | | | | | | | | | |
SPDR S&P 500 ETF Trust | | | 3,054 | | | | 10/05/20 | | | USD | | | 322.00 | | | USD | | | 102,275 | | | | (186,294 | ) |
PowerShares QQQ Trust, Series 1 ETF | | | 240 | | | | 10/16/20 | | | USD | | | 250.00 | | | USD | | | 6,668 | | | | (22,200 | ) |
U.S. Treasury 2-Year Notes Futures | | | 244 | | | | 10/23/20 | | | USD | | | 110.38 | | | USD | | | 53,915 | | | | (7,625 | ) |
U.S. Treasury 5-Year Notes Futures | | | 243 | | | | 10/23/20 | | | USD | | | 125.50 | | | USD | | | 30,626 | | | | (7,594 | ) |
PowerShares QQQ Trust, Series 1 ETF | | | 123 | | | | 10/30/20 | | | USD | | | 250.00 | | | USD | | | 3,417 | | | | (32,534 | ) |
PowerShares QQQ Trust, Series 1 ETF | | | 246 | | | | 10/30/20 | | | USD | | | 255.00 | | | USD | | | 6,835 | | | | (84,870 | ) |
SPDR S&P 500 ETF Trust | | | 58 | | | | 11/20/20 | | | USD | | | 280.00 | | | USD | | | 1,942 | | | | (11,397 | ) |
PowerShares QQQ Trust, Series 1 ETF | | | 243 | | | | 12/18/20 | | | USD | | | 220.00 | | | USD | | | 6,752 | | | | (80,068 | ) |
SPDR S&P 500 ETF Trust | | | 396 | | | | 12/18/20 | | | USD | | | 250.00 | | | USD | | | 13,262 | | | | (63,954 | ) |
SPDR S&P 500 ETF Trust | | | 240 | | | | 03/19/21 | | | USD | | | 250.00 | | | USD | | | 8,037 | | | | (120,120 | ) |
Euro Dollar (3 Year) Mid-Curve | | | 22,196 | | | | 06/11/21 | | | USD | | | 98.75 | | | USD | | | 5,522,642 | | | | (832,350 | ) |
SPDR S&P 500 ETF Trust | | | 3,652 | | | | 06/18/21 | | | USD | | | 275.00 | | | USD | | | 122,302 | | | | (4,382,400 | ) |
| | | | | | | | | | | | | | | | | | | | | | | | |
| | | | | | | |
| | | | | | | | | | | | | | | | | | | | | | | (5,831,406 | ) |
| | | | | | | | | | | | | | | | | | | | | | | | |
| | | | | | | |
| | | | | | | | | | | | | | | | | | | | | | $ | (9,559,474 | ) |
| | | | | | | | | | | | | | | | | | | | | | | | |
OTC Barrier Options Written
| | | | | | | | | | | | | | | | | | | | | | | | | | | | | | | | | | | | | | | | | | | | |
| | | | | | | | | | |
| | | Description | | Type of
Security | | Counterparty | | Number of Contracts | | | Expiration
Date | | | Exercise Price | | | Barrier Price/Range | | | Notional Amount (000) | | | Value | | | |
| | | | | | | | | | | | | |
| | | Call | | | | | �� | | | | | | | | | | | | | | | | | | | | | | | | | | | | |
| | USD | | | | | | | | | | | | | | | | | | | | | | | | | | | | | | | | | | | | | | | | | | |
| | Currency | | One-Touch | | Credit Suisse International | | | — | | | | 10/21/20 | | | | CAD | | | | 1.41 | | | | CAD | | | | 1.41 | | | | USD | | | | 613 | | | $ | (6,322 | ) | | |
| | USD Currency | | One-Touch | | Morgan Stanley & Co. International PLC | | | — | | | | 10/30/20 | | | | MXN | | | | 22.75 | | | | MXN | | | | 22.75 | | | | USD | | | | 200 | | | | (64,160 | ) | | |
| | USD | | | | | | | | | | | | | | | | | | | | | | | | | | | | | | | | | | | | | | | | | | |
| | Currency | | One-Touch | | Citibank N.A. | | | — | | | | 11/18/20 | | | | JPY | | | | 100.00 | | | | JPY | | | | 100.00 | | | | USD | | | | 943 | | | | (84,967 | ) | | |
| | | | | | | | | | | | | | | | | | | | | | | | | | | | | | | | | | | | | | | | | | | | |
| | | | | | | | | | | | | |
| | | | | | | | | | | | | | | | | | | | | | | | | | | | | | | | | | | | | | | | $ | (155,449 | ) | | |
| | | | | | | | | | | | | | | | | | | | | | | | | | | | | | | | | | | | | | | | | | | | |
| | | Put | | | | | | | | | | | | | | | | | | | | | | | | | | | | | | | | | |
| | USD Currency | | Down-and-Out | | Morgan Stanley & Co. International PLC | | | — | | | | 11/20/20 | | | | MXN | | | | 21.40 | | | | MXN | | | | 21.25 | | | | USD | | | | 9,999 | | | | (21,365 | ) | | |
| | | | | | | | | | | | | | | | | | | | | | | | | | | | | | | | | | | | | | | | | | | | |
| | | | | | | | | | | | | |
| | | | | | | | | | | | | | | | | | | | | | | | | | | | | | | | | | | | | | | | $ | (176,814 | ) | | |
| | | | | | | | | | | | | | | | | | | | | | | | | | | | | | | | | | | | | | | | | | | | |
| | |
S C H E D U L E O F I N V E S T M E N T S | | 113 |
| | |
Schedule of Investments (continued) September 30, 2020 | | Master Total Return Portfolio |
OTC Options Written
| | | | | | | | | | | | | | | | | | | | | | | | | | | | |
| | | | | | | |
| Description | | Counterparty | | Number of Contracts | | Expiration
Date | | | Exercise Price | | | Notional Amount (000) | | | Value | |
| Call | | | | | | | | | | | | | | | | | | | | | | |
| | | | | | | | |
USD Currency | | Bank of America N.A. | | — | | | 10/07/20 | | | | BRL | | | | 5.45 | | | | USD | | | | 13,690 | | | $ | (454,249 | ) |
USD Currency | | JPMorgan Chase Bank N.A. | | — | | | 10/23/20 | | | | IDR | | | | 15,500.00 | | | | USD | | | | 23,544 | | | | (53,500 | ) |
USD Currency | | Bank of America N.A. | | — | | | 10/30/20 | | | | ZAR | | | | 18.00 | | | | USD | | | | 12,000 | | | | (51,411 | ) |
USD Currency | | Morgan Stanley & Co. International PLC | | — | | | 10/30/20 | | | | MXN | | | | 22.50 | | | | USD | | | | 15,986 | | | | (256,035 | ) |
USD Currency | | Deutsche Bank AG | | — | | | 11/03/20 | | | | CLP | | | | 810.00 | | | | USD | | | | 23,352 | | | | (155,327 | ) |
USD Currency | | Citibank N.A. | | — | | | 11/09/20 | | | | RUB | | | | 78.00 | | | | USD | | | | 11,908 | | | | (274,893 | ) |
iShares iBoxx $ Investment Grade Corporate Bond ETF | | UBS AG | | 2,000,600 | | | 11/20/20 | | | | USD | | | | 140.00 | | | | USD | | | | 269,501 | | | | (260,078 | ) |
| | | | | | | | | | | | | | | | | | | | | | | | | | | | |
| | | | | | | | |
| | | | | | | | | | | | | | | | | | | | | | | | | | | (1,505,493 | ) |
| | | | | | | | | | | | | | | | | | | | | | | | | | | | |
| Put | | | | | | | | | | | | | | | | | | | | | | |
USD Currency(a) | | Citibank N.A. | | — | | | 10/02/20 | | | | RUB | | | | 70.50 | | | | USD | | | | 21,351 | | | | (2 | ) |
USD Currency | | Bank of America N.A. | | — | | | 10/09/20 | | | | MXN | | | | 22.80 | | | | USD | | | | 14,015 | | | | (470,956 | ) |
AUD Currency | | Morgan Stanley & Co. International PLC | | — | | | 10/14/20 | | | | JPY | | | | 70.15 | | | | AUD | | | | 445,071 | | | | (39,022 | ) |
USD Currency | | Bank of America N.A. | | — | | | 10/30/20 | | | | ZAR | | | | 16.25 | | | | USD | | | | 17,998 | | | | (132,694 | ) |
USD Currency | | BNP Paribas S.A. | | — | | | 10/30/20 | | | | RUB | | | | 76.80 | | | | USD | | | | 17,998 | | | | (228,110 | ) |
USD Currency | | Goldman Sachs International | | — | | | 10/30/20 | | | | JPY | | | | 102.50 | | | | USD | | | | 11,998 | | | | (9,794 | ) |
USD Currency | | Morgan Stanley & Co. International PLC | | — | | | 10/30/20 | | | | MXN | | | | 21.20 | | | | USD | | | | 14,995 | | | | (72,656 | ) |
USD Currency | | Morgan Stanley & Co. International PLC | | — | | | 10/30/20 | | | | MXN | | | | 20.20 | | | | USD | | | | 15,986 | | | | (11,023 | ) |
USD Currency | | Deutsche Bank AG | | — | | | 11/03/20 | | | | CLP | | | | 740.00 | | | | USD | | | | 9,730 | | | | (11,404 | ) |
USD Currency | | Citibank N.A. | | — | | | 11/06/20 | | | | TRY | | | | 7.25 | | | | USD | | | | 6,255 | | | | (15,015 | ) |
USD Currency | | Deutsche Bank AG | | — | | | 12/22/20 | | | | CNH | | | | 6.75 | | | | USD | | | | 56,779 | | | | (410,067 | ) |
| | | | | | | | | | | | | | | | | | | | | | | | | | | | |
| | | | | | | | |
| | | | | | | | | | | | | | | | | | | | | | | | | | | (1,400,743 | ) |
| | | | | | | | | | | | | | | | | | | | | | | | | | | | |
| | | | | | | | |
| | | | | | | | | | | | | | | | | | | | | | | | | | $ | (2,906,236 | ) |
| | | | | | | | | | | | | | | | | | | | | | | | | | | | |
| | (a) | Security is valued using significant unobservable inputs and is classified as Level 3 in the fair value hierarchy. | |
Centrally Cleared Credit Default Swaps — Buy Protection
| | | | | | | | | | | | | | | | | | | | | | | | | | | | | | | | | | |
| | | | | | | | |
| Reference Obligation/Index | | Financing Rate Paid by the Fund | | | Payment Frequency | | Termination Date | | | Notional Amount (000) | | | Value | | | Upfront Premium Paid (Received) | | | Unrealized
Appreciation
(Depreciation) | |
| | | | | | | | | |
CDX.NA.HY.33.V1 | | | 5.00 | % | | Quarterly | | | 12/20/24 | | | | USD | | | | 35,458 | | | $ | (1,870,432 | ) | | $ | (2,790,442 | ) | | | | | | $ | 920,010 | |
| | | | | | | | | | | | | | | | | | | | | | | | | | | | | | | | | | |
Centrally Cleared Inflation Swaps
| | | | | | | | | | | | | | | | | | | | | | | | | | | | | | | | | | |
| | | | | | | | | | | | | | | | | | | | Upfront | | | | |
| | | | | | | | | | | | Notional | | | | | Premium | | | Unrealized | |
Paid by the Fund | | Received by the Fund | | Termination | | | Amount | | | | | Paid | | | Appreciation | |
| Reference | | Frequency | | Rate | | Frequency | | Date | | | 000) | | Value | | | (Received) | | | (Depreciation) | |
| | | | | | | | | | | | |
0.73% | | At Termination | | Eurostat Eurozone HICP Ex Tobacco NSA (CPTFEMU) | | At Termination | | | 09/15/25 | | | | EUR | | | 69,035 | | $ | (549,437 | ) | | | | $ | — | | | | | | | $ | (549,437 | ) |
0.72% | | At Termination | | Eurostat Eurozone HICP Ex Tobacco NSA (CPTFEMU) | | At Termination | | | 09/15/25 | | | | EUR | | | 69,035 | | | (503,242 | ) | | | | | — | | | | | | | | (503,242 | ) |
Eurostat Eurozone HICP Ex Tobacco NSA (CPTFEMU) | | At Termination | | 0.98% | | At Termination | | | 09/15/30 | | | | EUR | | | 69,035 | | | 967,458 | | | | | | — | | | | | | | | 967,458 | |
Eurostat Eurozone HICP Ex Tobacco NSA (CPTFEMU) | | At Termination | | 0.96% | | At Termination | | | 09/15/30 | | | | EUR | | | 69,035 | | | 822,182 | | | | | | — | | | | | | | | 822,182 | |
| | | | | | | | | | | | | | | | | | | | | | | | | | | | | | | | | | |
| | | | | | | | | | | |
| | | | | | | | | | | | | | | | | | $ | 736,961 | | | | | $ | — | | | | | | | $ | 736,961 | |
| | | | | | | | | | | | | | | | | | | | | | | | | | | | | | | | | | |
| | |
| 114 | | 2 0 2 0 B L A C K R O C K A N N U A L R E P O R T T O S H A R E H O L D E R S |
| | |
Schedule of Investments (continued) September 30, 2020 | | Master Total Return Portfolio |
Centrally Cleared Interest Rate Swaps
| | | | | | | | | | | | | | | | | | | | | | | | | | | | | | | | | | | | |
| | | | | | | | | | | | | | | | | | | | | | | | | | | | Upfront | | | | | |
| | | | | | | | | | | | | | | | Notional | | | | | | | | Premium | | | | Unrealized | |
Paid by the Fund | | Received by the Fund | | Effective | | | Termination | | | Amount | | | | | | Paid | | | Appreciation | |
| Rate | | Frequency | | Rate | | Frequency | | Date | | | Date | | | (000) | | | Value | | | (Received) | | | (Depreciation) | |
| | | | | | | | | | | | |
28-day MXIBTIIE, 4.55% | | Monthly | | 4.51% | | Monthly | | | N/A | | | | 09/29/22 | | | MXN | | | 1,380,188 | | | $ | 29,793 | | | $ | 67 | | | | | | | $ | 29,726 | |
1-day SONIA, 0.05% | | At Termination | | 0.02% | | At Termination | | | 05/26/22(a) | | | | 05/26/23 | | | GBP | | | 25,520 | | | | 39,185 | | | | — | | | | | | | | 39,185 | |
3-month Canadian Bankers Acceptances, 0.51% | | Semi-Annual | | 0.78% | | Semi-Annual | | | 08/12/22(a) | | | | 08/12/23 | | | CAD | | | 50,765 | | | | 25,820 | | | | — | | | | | | | | 25,820 | |
1-day CORRA, 0.21% | | Semi-Annual | | 0.49% | | Semi-Annual | | | 08/16/22(a) | | | | 08/16/23 | | | CAD | | | 50,765 | | | | 31,519 | | | | — | | | | | | | | 31,519 | |
1-day CORRA, 0.21% | | At Termination | | 0.49% | | At Termination | | | 08/25/22(a) | | | | 08/25/23 | | | CAD | | | 300,000 | | | | 173,320 | | | | — | | | | | | | | 173,320 | |
1-day SONIA, 0.05% | | At Termination | | (0.02)% | | At Termination | | | 08/26/22(a) | | | | 08/26/23 | | | GBP | | | 13,180 | | | | 11,950 | | | | — | | | | | | | | 11,950 | |
1-day SONIA, 0.05% | | At Termination | | (0.04)% | | At Termination | | | 08/26/22(a) | | | | 08/26/23 | | | GBP | | | 13,180 | | | | 8,943 | | | | — | | | | | | | | 8,943 | |
3-month Canadian Bankers Acceptances, 0.51% | | Semi-Annual | | 0.76% | | Semi-Annual | | | 08/29/22(a) | | | | 08/29/23 | | | CAD | | | 312,120 | | | | 83,443 | | | | — | | | | | | | | 83,443 | |
0.30% | | Semi-Annual | | 3-month LIBOR, 0.23% | | Quarterly | | | 09/01/22(a) | | | | 09/01/23 | | | USD | | | 236,455 | | | | 38,497 | | | | — | | | | | | | | 38,497 | |
1-day Overnight Fed Funds Effective Rate, 0.09% | | At Termination | | 0.04% | | At Termination | | | 09/19/22(a) | | | | 09/19/23 | | | USD | | | 982,433 | | | | (200,367 | ) | | | — | | | | | | | | (200,367 | ) |
1-day Overnight Fed Funds Effective Rate, 0.09% | | At Termination | | 0.05% | | At Termination | | | 09/19/22(a) | | | | 09/19/23 | | | USD | | | 1,964,868 | | | | (148,072 | ) | | | — | | | | | | | | (148,072 | ) |
1-day SONIA, 0.05% | | At Termination | | (0.15)% | | At Termination | | | 09/19/22(a) | | | | 09/19/23 | | | GBP | | | 102,205 | | | | (79,708 | ) | | | 43,767 | | | | | | | | (123,475 | ) |
1-day SONIA, 0.05% | | At Termination | | (0.17)% | | At Termination | | | 09/21/22(a) | | | | 09/21/23 | | | GBP | | | 192,000 | | | | (222,510 | ) | | | — | | | | | | | | (222,510 | ) |
1-day SONIA, 0.05% | | At Termination | | (0.12)% | | At Termination | | | 09/22/22(a) | | | | 09/22/23 | | | GBP | | | 175,000 | | | | (81,003 | ) | | | — | | | | | | | | (81,003 | ) |
1-day SONIA, 0.05% | | At Termination | | (0.13)% | | At Termination | | | 09/22/22(a) | | | | 09/22/23 | | | GBP | | | 175,000 | | | | (108,153 | ) | | | — | | | | | | | | (108,153 | ) |
1-day Overnight Fed Funds Effective Rate, 0.09% | | At Termination | | 0.04% | | At Termination | | | 09/23/22(a) | | | | 09/23/23 | | | USD | | | 982,464 | | | | (186,177 | ) | | | — | | | | | | | | (186,177 | ) |
1-day SONIA, 0.05% | | At Termination | | (0.09)% | | At Termination | | | 09/26/22(a) | | | | 09/26/23 | | | GBP | | | 220,000 | | | | 12,750 | | | | 5,591 | | | | | | | | 7,159 | |
1-day SONIA, 0.05% | | At Termination | | (0.10)% | | At Termination | | | 09/28/22(a) | | | | 09/28/23 | | | GBP | | | 118,000 | | | | (27,113 | ) | | | — | | | | | | | | (27,113 | ) |
1-day SONIA, 0.05% | | At Termination | | (0.11)% | | At Termination | | | 09/29/22(a) | | | | 09/29/23 | | | GBP | | | 197,298 | | | | (68,705 | ) | | | — | | | | | | | | (68,705 | ) |
1-day SONIA, 0.05% | | At Termination | | (0.12)% | | At Termination | | | 09/29/22(a) | | | | 09/29/23 | | | GBP | | | 194,354 | | | | (87,780 | ) | | | — | | | | | | | | (87,780 | ) |
1-day SONIA, 0.05% | | At Termination | | (0.12)% | | At Termination | | | 09/29/22(a) | | | | 09/29/23 | | | GBP | | | 197,298 | | | | (81,457 | ) | | | — | | | | | | | | (81,457 | ) |
28-day MXIBTIIE, 4.55% | | Monthly | | 6.67% | | Monthly | | | N/A | | | | 08/12/24 | | | MXN | | | 258,548 | | | | 773,066 | | | | 556 | | | | | | | | 772,510 | |
28-day MXIBTIIE, 4.55% | | Monthly | | 6.72% | | Monthly | | | N/A | | | | 08/13/24 | | | MXN | | | 222,465 | | | | 681,331 | | | | 462 | | | | | | | | 680,869 | |
28-day MXIBTIIE, 4.55% | | Monthly | | 6.59% | | Monthly | | | N/A | | | | 11/08/24 | | | MXN | | | 169,474 | | | | 495,587 | | | | 1,132 | | | | | | | | 494,455 | |
| | |
S C H E D U L E O F I N V E S T M E N T S | | 115 |
| | |
Schedule of Investments (continued) September 30, 2020 | | Master Total Return Portfolio |
Centrally Cleared Interest Rate Swaps (continued)
| | | | | | | | | | | | | | | | | | | | | | | | | | | | | | | | | | | | | | | | | | | | | | | | |
| | | | | | | | | | | | | | | | | | | | | | | Upfront | | | | | | | | | | | | | |
| | | | | | | | | | | | | | Notional | | | | | | | | | Premium | | | | | | Unrealized | | | | | | | |
| | | Paid by the Fund | | Received by the Fund | | Effective | | Termination | | | | | Amount | | | | | | | | | Paid | | | Appreciation | | | | | | | |
| | | Rate | | Frequency | | Rate | | Frequency | | Date | | Date | | | | | (000) | | | Value | | | (Received) | | | (Depreciation) | | | | | | | |
| | | | | | | | | | | | | | | |
| | | 3-month Canadian Bankers Acceptances, 0.51% | | Semi-Annual | | 0.75% | | Semi-Annual | | N/A | | | 05/26/25 | | | CAD | | | 143,415 | | | $ | 163,508 | | | | | | | $ | (442 | ) | | | | | | $ | 163,950 | | | | | | | | | |
| | 3-month Canadian Bankers Acceptances, 0.51% | | Semi-Annual | | 0.82% | | Semi-Annual | | N/A | | | 06/03/25 | | | CAD | | | 5,855 | | | | 21,450 | | | | | | | | (28 | ) | | | | | | | 21,478 | | | | | | | | | |
| | 3-month Canadian Bankers Acceptances, 0.51% | | Semi-Annual | | 0.82% | | Semi-Annual | | N/A | | | 06/03/25 | | | CAD | | | 5,855 | | | | 20,355 | | | | | | | | (55 | ) | | | | | | | 20,410 | | | | | | | | | |
| | 3-month Canadian Bankers Acceptances, 0.51% | | Semi-Annual | | 0.85% | | Semi-Annual | | N/A | | | 06/04/25 | | | CAD | | | 63,000 | | | | 301,034 | | | | | | | | (767 | ) | | | | | | | 301,801 | | | | | | | | | |
| | 3-month Canadian Bankers Acceptances, 0.51% | | Semi-Annual | | 0.85% | | Semi-Annual | | N/A | | | 06/04/25 | | | CAD | | | 63,000 | | | | 296,320 | | | | | | | | (335 | ) | | | | | | | 296,655 | | | | | | | | | |
| | 3-month Canadian Bankers Acceptances, 0.51% | | Semi-Annual | | 0.70% | | Semi-Annual | | N/A | | | 08/06/25 | | | CAD | | | 260,160 | | | | (355,351 | ) | | | | | | | (891 | ) | | | | | | | (354,460 | ) | | | | | | | | |
| | 0.38% | | At Termination | | 1-day Overnight Fed Funds Effective Rate, 0.09% | | At Termination | | 09/18/24(a) | | | 09/18/25 | | | USD | | | 982,433 | | | | 90,050 | | | | | | | | — | | | | | | | | 90,050 | | | | | | | | | |
| | 0.39% | | At Termination | | 1-day Overnight Fed Funds Effective Rate, 0.09% | | At Termination | | 09/18/24(a) | | | 09/18/25 | | | USD | | | 1,964,868 | | | | (110,701 | ) | | | | | | | — | | | | | | | | (110,701 | ) | | | | | | | | |
| | 3-month Canadian Bankers Acceptances, 0.51% | | Semi-Annual | | 0.74% | | Semi-Annual | | N/A | | | 09/18/25 | | | CAD | | | 13,320 | | | | (6,689 | ) | | | | | | | (193 | ) | | | | | | | (6,496 | ) | | | | | | | | |
| | 3-month Canadian Bankers Acceptances, 0.51% | | Semi-Annual | | 0.75% | | Semi-Annual | | N/A | | | 09/18/25 | | | CAD | | | 40,315 | | | | (10,591 | ) | | | | | | | (602 | ) | | | | | | | (9,989 | ) | | | | | | | | |
| | 3-month Canadian Bankers Acceptances, 0.51% | | Semi-Annual | | 0.74% | | Semi-Annual | | N/A | | | 09/21/25 | | | CAD | | | 22,500 | | | | (11,941 | ) | | | | | | | (108 | ) | | | | | | | (11,833 | ) | | | | | | | | |
| | 3-month Canadian Bankers Acceptances, 0.51% | | Semi-Annual | | 0.74% | | Semi-Annual | | N/A | | | 09/21/25 | | | CAD | | | 22,500 | | | | (9,417 | ) | | | | | | | (220 | ) | | | | | | | (9,197 | ) | | | | | | | | |
| | 0.39% | | At Termination | | 1-day Overnight Fed Funds Effective Rate, 0.09% | | At Termination | | 09/23/24(a) | | | 09/23/25 | | | USD | | | 982,464 | | | | (20,887 | ) | | | | | | | — | | | | | | | | (20,887 | ) | | | | | | | | |
| | 2.91% | | Semi-Annual | | 3-month LIBOR, 0.23% | | Quarterly | | N/A | | | 08/23/26 | | | USD | | | 3,692 | | | | (551,153 | ) | | | | | | | (46 | ) | | | | | | | (551,107 | ) | | | | | | | | |
| | 2.93% | | Semi-Annual | | 3-month LIBOR, 0.23% | | Quarterly | | N/A | | | 08/24/28 | | | USD | | | 8,170 | | | | (1,529,115 | ) | | | | | | | 128 | | | | | | | | (1,529,243 | ) | | | | | | | | |
| | 3.16% | | Semi-Annual | | 3-month LIBOR, 0.23% | | Quarterly | | N/A | | | 10/03/28 | | | USD | | | 4,519 | | | | (990,511 | ) | | | | | | | 71 | | | | | | | | (990,582 | ) | | | | | | | | |
| | |
| 116 | | 2 0 2 0 B L A C K R O C K A N N U A L R E P O R T T O S H A R E H O L D E R S |
| | |
Schedule of Investments (continued) September 30, 2020 | | Master Total Return Portfolio |
Centrally Cleared Interest Rate Swaps (continued)
| | | | | | | | | | | | | | | | | | | | | | | | | | | | | | | | | | | | | | | | | | |
| | | | | | | | | |
| Paid by the Fund | | Received by the Fund | | Effective | | Termination | | | Notional Amount | | | | | | Upfront Premium Paid | | | Unrealized
Appreciation | | | | |
| Rate | | Frequency | | Rate | | Frequency | | Date | | Date | | | | | (000) | | | Value | | | (Received) | | | (Depreciation) | |
| | | | | | | | | | | | | |
| 0.68% | | Semi-Annual | | 3-month LIBOR,
0.23% | | Quarterly | | N/A | | | 09/23/30 | | | USD | | | 19,409 | | | $ | 66,696 | | | | | | | $ | — | | | | | | | $ | 66,696 | | | | | |
3-month LIBOR,
0.23% | | Quarterly | | 0.67% | | Semi-Annual | | N/A | | | 09/23/30 | | | USD | | | 19,409 | | | | (89,642 | ) | | | | | | | — | | | | | | | | (89,642 | ) | | | | |
| | | | | | | | | | | | | | | | | | | | | | | | | | | | | | | | | | | | | | | | | | |
| | | | | | | | | | | | | |
| | | | | | | | | | | | | | | | | | | | $ | (1,612,426 | ) | | | | | | $ | 48,087 | | | | | | | $ | (1,660,513 | ) | | | | |
| | | | | | | | | | | | | | | | | | | | | | | | | | | | | | | | | | | | | | | | | | |
OTC Credit Default Swaps — Buy Protection
| | | | | | | | | | | | | | | | | | | | | | | | | | | | | | | | | | | | | | | | | | |
| | | | | | | | | | | |
| | | Reference Obligation/Index | | Financing Rate Paid by the Fund | | | Payment Frequency | | Counterparty | | Termination Date | | | Notional Amount (000) | | | Value | | | Upfront Premiun Paid (Received) | | | Unrealized Appreciation (Depreciation) | | | | | | | |
| | | | | | | | | | | | |
| | Australia & New Zealand Banking Group Ltd. | | | 1.00 | % | | Quarterly | | JPMorgan Chase Bank N.A. | | | 12/20/20 | | | | USD | | | | 795 | | | $ | (1,908 | ) | | $ | (179 | ) | | $ | (1,729 | ) | | | | | | | | |
| | Australia & New Zealand Banking Group Ltd. | | | 1.00 | | | Quarterly | | JPMorgan Chase Bank N.A. | | | 12/20/20 | | | | USD | | | | 1,205 | | | | (2,890 | ) | | | (246 | ) | | | (2,644 | ) | | | | | | | | |
| | Australia & New Zealand Banking Group Ltd. | | | 1.00 | | | Quarterly | | JPMorgan Chase Bank N.A. | | | 12/20/20 | | | | USD | | | | 1,000 | | | | (2,400 | ) | | | (16 | ) | | | (2,384 | ) | | | | | | | | |
| | Avis Budget Group, Inc. | | | 5.00 | | | Quarterly | | Barclays Bank PLC | | | 12/20/20 | | | | USD | | | | 2,550 | | | | (12,039 | ) | | | 106,900 | | | | (118,939 | ) | | | | | | | | |
| | Avis Budget Group, Inc. | | | 5.00 | | | Quarterly | | Barclays Bank PLC | | | 12/20/20 | | | | USD | | | | 2,545 | | | | (9,260 | ) | | | 133,584 | | | | (142,844 | ) | | | | | | | | |
| | Avis Budget Group, Inc. | | | 5.00 | | | Quarterly | | Barclays Bank PLC | | | 12/20/20 | | | | USD | | | | 2,545 | | | | (12,016 | ) | | | 171,991 | | | | (184,007 | ) | | | | | | | | |
| | Avis Budget Group, Inc. | | | 5.00 | | | Quarterly | | Goldman Sachs International | | | 12/20/20 | | | | USD | | | | 2,555 | | | | (12,063 | ) | | | 93,902 | | | | (105,965 | ) | | | | | | | | |
| | Commonwealth Bank of Australia | | | 1.00 | | | Quarterly | | JPMorgan Chase Bank N.A. | | | 12/20/20 | | | | USD | | | | 1,150 | | | | (2,776 | ) | | | (185 | ) | | | (2,591 | ) | | | | | | | | |
| | Commonwealth Bank of Australia | | | 1.00 | | | Quarterly | | JPMorgan Chase Bank N.A. | | | 12/20/20 | | | | USD | | | | 1,000 | | | | (2,414 | ) | | | (119 | ) | | | (2,295 | ) | | | | | | | | |
| | Itochu Corp. | | | 1.00 | | | Quarterly | | Goldman Sachs International | | | 12/20/20 | | | | JPY | | | | 29,326 | | | | (672 | ) | | | 60 | | | | (732 | ) | | | | | | | | |
| | Itochu Corp. | | | 1.00 | | | Quarterly | | Goldman Sachs International | | | 12/20/20 | | | | JPY | | | | 29,326 | | | | (672 | ) | | | 64 | | | | (736 | ) | | | | | | | | |
| | Itochu Corp. | | | 1.00 | | | Quarterly | | Goldman Sachs International | | | 12/20/20 | | | | JPY | | | | 29,326 | | | | (672 | ) | | | 29 | | | | (701 | ) | | | | | | | | |
| | Itochu Corp. | | | 1.00 | | | Quarterly | | Goldman Sachs International | | | 12/20/20 | | | | JPY | | | | 32,023 | | | | (734 | ) | | | 87 | | | | (821 | ) | | | | | | | | |
| | Mitsubishi Corp. | | | 1.00 | | | Quarterly | | Barclays Bank PLC | | | 12/20/20 | | | | JPY | | | | 47,573 | | | | (1,100 | ) | | | 151 | | | | (1,251 | ) | | | | | | | | |
| | Mitsubishi Corp. | | | 1.00 | | | Quarterly | | Goldman Sachs International | | | 12/20/20 | | | | JPY | | | | 29,326 | | | | (678 | ) | | | 127 | | | | (805 | ) | | | | | | | | |
| | Mitsui & Co. Ltd. | | | 1.00 | | | Quarterly | | Goldman Sachs International | | | 12/20/20 | | | | JPY | | | | 58,651 | | | | (1,355 | ) | | | 99 | | | | (1,454 | ) | | | | | | | | |
| | Mitsui & Co. Ltd. | | | 1.00 | | | Quarterly | | Goldman Sachs International | | | 12/20/20 | | | | JPY | | | | 29,326 | | | | (678 | ) | | | 22 | | | | (700 | ) | | | | | | | | |
| | National Australia Bank Ltd. | | | 1.00 | | | Quarterly | | JPMorgan Chase Bank N.A. | | | 12/20/20 | | | | USD | | | | 1,000 | | | | (2,398 | ) | | | (60 | ) | | | (2,338 | ) | | | | | | | | |
| | Standard Chartered Bank | | | 1.00 | | | Quarterly | | BNP Paribas S.A. | | | 12/20/20 | | | | EUR | | | | 460 | | | | (1,230 | ) | | | 461 | | | | (1,691 | ) | | | | | | | | |
| | Standard Chartered Bank | | | 1.00 | | | Quarterly | | BNP Paribas S.A. | | | 12/20/20 | | | | EUR | | | | 810 | | | | (2,167 | ) | | | 777 | | | | (2,944 | ) | | | | | | | | |
| | Standard Chartered Bank | | | 1.00 | | | Quarterly | | Goldman Sachs International | | | 12/20/20 | | | | EUR | | | | 610 | | | | (1,632 | ) | | | 262 | | | | (1,894 | ) | | | | | | | | |
| | | | | | | | | | Morgan Stanley & Co. | | | | | | | | | | | | | | | | | | | | | | | | | | | | | | | | |
| | Standard Chartered Bank | | | 1.00 | | | Quarterly | | International PLC | | | 12/20/20 | | | | EUR | | | | 240 | | | | (642 | ) | | | 246 | | | | (888 | ) | | | | | | | | |
| | Sumitomo Corp. | | | 1.00 | | | Quarterly | | Barclays Bank PLC | | | 12/20/20 | | | | JPY | | | | 24,938 | | | | (575 | ) | | | (36 | ) | | | (539 | ) | | | | | | | | |
| | Sumitomo Corp. | | | 1.00 | | | Quarterly | | JPMorgan Chase Bank N.A. | | | 12/20/20 | | | | JPY | | | | 25,316 | | | | (585 | ) | | | (40 | ) | | | (545 | ) | | | | | | | | |
| | Westpac Banking Corp. | | | 1.00 | | | Quarterly | | Citibank N.A. | | | 12/20/20 | | | | USD | | | | 1,000 | | | | (2,408 | ) | | | (139 | ) | | | (2,269 | ) | | | | | | | | |
| | DISH DBS Corp. | | | 5.00 | | | Quarterly | | Goldman Sachs International | | | 12/20/23 | | | | USD | | | | 2,168 | | | | (134,094 | ) | | | 71,974 | | | | (206,068 | ) | | | | | | | | |
| | KB Home | | | 5.00 | | | Quarterly | | JPMorgan Chase Bank N.A. | | | 12/20/23 | | | | USD | | | | 2,138 | | | | (266,275 | ) | | | (115,698 | ) | | | (150,577 | ) | | | | | | | | |
| | Realogy Group LLC | | | 5.00 | | | Quarterly | | JPMorgan Chase Bank N.A. | | | 12/20/23 | | | | USD | | | | 1,069 | | | | (39,957 | ) | | | (6,762 | ) | | | (33,195 | ) | | | | | | | | |
| | RR Donnelley & Sons Co. | | | 5.00 | | | Quarterly | | JPMorgan Chase Bank N.A. | | | 12/20/23 | | | | USD | | | | 1,070 | | | | 66,792 | | | | 34,982 | | | | 31,810 | | | | | | | | | |
| | Beazer Homes USA, Inc. | | | 5.00 | | | Quarterly | | Barclays Bank PLC | | | 06/20/24 | | | | USD | | | | 1,199 | | | | (111,069 | ) | | | (59,603 | ) | | | (51,466 | ) | | | | | | | | |
| | Beazer Homes USA, Inc. | | | 5.00 | | | Quarterly | | BNP Paribas S.A. | | | 06/20/24 | | | | USD | | | | 1,000 | | | | (92,635 | ) | | | (43,893 | ) | | | (48,742 | ) | | | | | | | | |
| | Beazer Homes USA, Inc. | | | 5.00 | | | Quarterly | | BNP Paribas S.A. | | | 06/20/24 | | | | USD | | | | 1,103 | | | | (102,176 | ) | | | (52,244 | ) | | | (49,932 | ) | | | | | | | | |
| | Tenet Healthcare Corp. | | | 5.00 | | | Quarterly | | Barclays Bank PLC | | | 06/20/24 | | | | USD | | | | 1,000 | | | | (37,697 | ) | | | (8,760 | ) | | | (28,937 | ) | | | | | | | | |
| | Tenet Healthcare Corp. | | | 5.00 | | | Quarterly | | Goldman Sachs International | | | 06/20/24 | | | | USD | | | | 1,175 | | | | (49,526 | ) | | | (31,574 | ) | | | (17,952 | ) | | | | | | | | |
| | Tenet Healthcare Corp. | | | 5.00 | | | Quarterly | | Goldman Sachs International | | | 06/20/24 | | | | USD | | | | 1,150 | | | | (48,473 | ) | | | (30,903 | ) | | | (17,570 | ) | | | | | | | | |
| | Tenet Healthcare Corp. | | | 5.00 | | | Quarterly | | Goldman Sachs International | | | 06/20/24 | | | | USD | | | | 1,175 | | | | (49,526 | ) | | | (31,602 | ) | | | (17,924 | ) | | | | | | | | |
| | Tenet Healthcare Corp. | | | 5.00 | | | Quarterly | | Goldman Sachs International | | | 06/20/24 | | | | USD | | | | 1,223 | | | | (46,104 | ) | | | (12,959 | ) | | | (33,145 | ) | | | | | | | | |
| | Tenet Healthcare Corp. | | | 5.00 | | | Quarterly | | JPMorgan Chase Bank N.A. | | | 06/20/24 | | | | USD | | | | 500 | | | | (21,075 | ) | | | (5,129 | ) | | | (15,946 | ) | | | | | | | | |
| | Avis Budget Group, Inc. | | | 5.00 | | | Quarterly | | JPMorgan Chase Bank N.A. | | | 12/20/24 | | | | USD | | | | 750 | | | | 35,807 | | | | 53,568 | | | | (17,761 | ) | | | | | | | | |
| | Avis Budget Group, Inc. | | | 5.00 | | | Quarterly | | JPMorgan Chase Bank N.A. | | | 12/20/24 | | | | USD | | | | 1,680 | | | | 80,208 | | | | 118,892 | | | | (38,684 | ) | | | | | | | | |
| | Boeing Co. | | | 1.00 | | | Quarterly | | BNP Paribas S.A. | | | 12/20/24 | | | | USD | | | | 2,250 | | | | 173,316 | | | | (37,900 | ) | | | 211,216 | | | | | | | | | |
| | |
S C H E D U L E O F I N V E S T M E N T S | | 117 |
| | |
Schedule of Investments (continued) September 30, 2020 | | Master Total Return Portfolio |
OTC Credit Default Swaps — Buy Protection (continued)
| | | | | | | | | | | | | | | | | | | | | | | | | | | | | | | | | | | | | | | | |
| | | | | | | | | | |
| | | Reference Obligation/Index | | Financing Rate Paid by the Fund | | | Payment Frequency | | | Counterparty | | Termination Date | | | Notional Amount (000) | | | Value | | | Upfront Premiun Paid (Received) | | | Unrealized Appreciation (Depreciation) | | | | |
| | | | | | | | | | | |
| | Boeing Co. | | | 1.00 | % | | | Quarterly | | | Morgan Stanley & Co. International PLC | | | 12/20/24 | | | | USD | | | | 5,950 | | | $ | 458,324 | | | $ | (59,327 | ) | | $ | 517,651 | | | | | |
| | Broadcom, Inc. | | | 1.00 | | | | Quarterly | | | JPMorgan Chase Bank N.A. | | | 12/20/24 | | | | USD | | | | 1,325 | | | | 2,906 | | | | 34,306 | | | | (31,400 | ) | | | | |
| | Occidental Petroleum Corp. | | | 1.00 | | | | Quarterly | | | Barclays Bank PLC | | | 12/20/24 | | | | USD | | | | 5,080 | | | | 1,094,168 | | | | 2,248,983 | | | | (1,154,815 | ) | | | | |
| | Avis Budget Group, Inc. | | | 5.00 | | | | Quarterly | | | JPMorgan Chase Bank N.A. | | | 06/20/25 | | | | USD | | | | 2,540 | | | | 148,462 | | | | 297,716 | | | | (149,254 | ) | | | | |
| | Federative Republic of Brazil | | | 1.00 | | | | Quarterly | | | Barclays Bank PLC | | | 12/20/25 | | | | USD | | | | 20,679 | | | | 1,464,710 | | | | 1,320,630 | | | | 144,080 | | | | | |
| | Federative Republic of Brazil | | | 1.00 | | | | Quarterly | | | Barclays Bank PLC | | | 12/20/25 | | | | USD | | | | 15,020 | | | | 1,063,857 | | | | 898,598 | | | | 165,259 | | | | | |
| | Federative Republic of Brazil | | | 1.00 | | | | Quarterly | | | Barclays Bank PLC | | | 12/20/25 | | | | USD | | | | 3,770 | | | | 267,027 | | | | 207,859 | | | | 59,168 | | | | | |
| | Federative Republic of Brazil | | | 1.00 | | | | Quarterly | | | Barclays Bank PLC | | | 12/20/25 | | | | USD | | | | 3,770 | | | | 267,027 | | | | 213,157 | | | | 53,870 | | | | | |
| | Federative Republic of Brazil | | | 1.00 | | | | Quarterly | | | Barclays Bank PLC | | | 12/20/25 | | | | USD | | | | 3,320 | | | | 235,153 | | | | 187,713 | | | | 47,440 | | | | | |
| | Republic of Chile | | | 1.00 | | | | Quarterly | | | Citibank N.A. | | | 12/20/25 | | | | USD | | | | 5,147 | | | | (86,123 | ) | | | (70,726 | ) | | | (15,397 | ) | | | | |
| | Republic of Colombia | | | 1.00 | | | | Quarterly | | | Barclays Bank PLC | | | 12/20/25 | | | | USD | | | | 2,190 | | | | 53,675 | | | | 37,611 | | | | 16,064 | | | | | |
| | Republic of Colombia | | | 1.00 | | | | Quarterly | | | Barclays Bank PLC | | | 12/20/25 | | | | USD | | | | 2,190 | | | | 53,676 | | | | 39,780 | | | | 13,896 | | | | | |
| | Republic of Colombia | | | 1.00 | | | | Quarterly | | | Citibank N.A. | | | 12/20/25 | | | | USD | | | | 44,575 | | | | 1,092,509 | | | | 864,303 | | | | 228,206 | | | | | |
| | Republic of Colombia | | | 1.00 | | | | Quarterly | | | Goldman Sachs International | | | 12/20/25 | | | | USD | | | | 7,980 | | | | 195,585 | | | | 148,637 | | | | 46,948 | | | | | |
| | Republic of Colombia | | | 1.00 | | | | Quarterly | | | Goldman Sachs International | | | 12/20/25 | | | | USD | | | | 3,230 | | | | 79,166 | | | | 74,196 | | | | 4,970 | | | | | |
| | Republic of Colombia | | | 1.00 | | | | Quarterly | | | Morgan Stanley & Co. International PLC | | | 12/20/25 | | | | USD | | | | 1,300 | | | | 31,862 | | | | 22,964 | | | | 8,898 | | | | | |
| | Republic of Colombia | | | 1.00 | | | | Quarterly | | | Morgan Stanley & Co. International PLC | | | 12/20/25 | | | | USD | | | | 1,950 | | | | 47,793 | | | | 36,148 | | | | 11,645 | | | | | |
| | Republic of Indonesia | | | 1.00 | | | | Quarterly | | | Citibank N.A. | | | 12/20/25 | | | | USD | | | | 21,112 | | | | 161,308 | | | | 21,212 | | | | 140,096 | | | | | |
| | Republic of Indonesia | | | 1.00 | | | | Quarterly | | | Citibank N.A. | | | 12/20/25 | | | | USD | | | | 3,240 | | | | 24,755 | | | | 6,021 | | | | 18,734 | | | | | |
| | Republic of Indonesia | | | 1.00 | | | | Quarterly | | | Citibank N.A. | | | 12/20/25 | | | | USD | | | | 3,340 | | | | 25,520 | | | | 7,881 | | | | 17,639 | | | | | |
| | Republic of Indonesia | | | 1.00 | | | | Quarterly | | | JPMorgan Chase Bank N.A. | | | 12/20/25 | | | | USD | | | | 4,280 | | | | 32,701 | | | | 8,598 | | | | 24,103 | | | | | |
| | Republic of South Africa | | | 1.00 | | | | Quarterly | | | Goldman Sachs International | | | 12/20/25 | | | | USD | | | | 8,596 | | | | 881,963 | | | | 814,375 | | | | 67,588 | | | | | |
| | Republic of South Africa | | | 1.00 | | | | Quarterly | | | Morgan Stanley & Co. International PLC | | | 12/20/25 | | | | USD | | | | 3,602 | | | | 369,536 | | | | 346,133 | | | | 23,403 | | | | | |
| | Republic of South Africa | | | 1.00 | | | | Quarterly | | | Morgan Stanley & Co. International PLC | | | 12/20/25 | | | | USD | | | | 29,969 | | | | 3,074,956 | | | | 2,880,215 | | | | 194,741 | | | | | |
| | Republic of South Africa | | | 1.00 | | | | Quarterly | | | Morgan Stanley & Co. International PLC | | | 12/20/25 | | | | USD | | | | 23,518 | | | | 2,413,015 | | | | 2,260,196 | | | | 152,819 | | | | | |
| | Republic of South Africa | | | 1.00 | | | | Quarterly | | | Morgan Stanley & Co. International PLC | | | 12/20/25 | | | | USD | | | | 10,860 | | | | 1,114,267 | | | | 1,018,374 | | | | 95,893 | | | | | |
| | Republic of the Philippines | | | 1.00 | | | | Quarterly | | | Goldman Sachs International | | | 12/20/25 | | | | USD | | | | 11,217 | | | | (257,289 | ) | | | (264,601 | ) | | | 7,312 | | | | | |
| | Russian Federation | | | 1.00 | | | | Quarterly | | | Bank of America N.A. | | | 12/20/25 | | | | USD | | | | 8,257 | | | | 103,882 | | | | 79,419 | | | | 24,463 | | | | | |
| | Russian Federation | | | 1.00 | | | | Quarterly | | | Bank of America N.A. | | | 12/20/25 | | | | USD | | | | 9,137 | | | | 114,959 | | | | 66,408 | | | | 48,551 | | | | | |
| | Russian Federation | | | 1.00 | | | | Quarterly | | | Bank of America N.A. | | | 12/20/25 | | | | USD | | | | 10,860 | | | | 136,636 | | | | 83,598 | | | | 53,038 | | | | | |
| | Russian Federation | | | 1.00 | | | | Quarterly | | | Citibank N.A. | | | 12/20/25 | | | | USD | | | | 3,718 | | | | 46,783 | | | | 24,877 | | | | 21,906 | | | | | |
| | United Mexican States | | | 1.00 | | | | Quarterly | | | Barclays Bank PLC | | | 12/20/25 | | | | USD | | | | 31,727 | | | | 784,234 | | | | 585,942 | | | | 198,292 | | | | | |
| | United Mexican States | | | 1.00 | | | | Quarterly | | | Barclays Bank PLC | | | 12/20/25 | | | | USD | | | | 3,610 | | | | 89,231 | | | | 56,179 | | | | 33,052 | | | | | |
| | United Mexican States | | | 1.00 | | | | Quarterly | | | Barclays Bank PLC | | | 12/20/25 | | | | USD | | | | 3,610 | | | | 89,232 | | | | 61,552 | | | | 27,680 | | | | | |
| | United Mexican States | | | 1.00 | | | | Quarterly | | | Morgan Stanley & Co. International PLC | | | 12/20/25 | | | | USD | | | | 3,640 | | | | 89,973 | | | | 62,965 | | | | 27,008 | | | | | |
| | CMBX.NA.9.AAA | | | 0.50 | | | | Monthly | | | Credit Suisse International | | | 09/17/58 | | | | USD | | | | 4,540 | | | | (36,341 | ) | | | 51,362 | | | | (87,703 | ) | | | | |
| | CMBX.NA.9.AAA | | | 0.50 | | | | Monthly | | | Deutsche Bank AG | | | 09/17/58 | | | | USD | | | | 3,620 | | | | (28,976 | ) | | | 41,547 | | | | (70,523 | ) | | | | |
| | CMBX.NA.9.AAA | | | 0.50 | | | | Monthly | | | Morgan Stanley & Co. International PLC | | | 09/17/58 | | | | USD | | | | 2,530 | | | | (20,251 | ) | | | 28,623 | | | | (48,874 | ) | | | | |
| | CMBX.NA.9.AAA | | | 0.50 | | | | Monthly | | | Morgan Stanley & Co. International PLC | | | 09/17/58 | | | | USD | | | | 3,050 | | | | (24,414 | ) | | | 34,506 | | | | (58,920 | ) | | | | |
| | CMBX.NA.9.AAA | | | 0.50 | | | | Monthly | | | Morgan Stanley & Co. International PLC | | | 09/17/58 | | | | USD | | | | 5,570 | | | | (44,586 | ) | | | 69,142 | | | | (113,728 | ) | | | | |
| | CMBX.NA.9.BBB- | | | 3.00 | | | | Monthly | | | Citibank N.A. | | | 09/17/58 | | | | USD | | | | 2,080 | | | | 546,478 | | | | 70,712 | | | | 475,766 | | | | | |
| | CMBX.NA.9.BBB- | | | 3.00 | | | | Monthly | | | Morgan Stanley & Co. International PLC | | | 09/17/58 | | | | USD | | | | 204 | | | | 53,597 | | | | 11,355 | | | | 42,242 | | | | | |
| | CMBX.NA.6.AAA | | | 0.50 | | | | Monthly | | | Deutsche Bank AG | | | 05/11/63 | | | | USD | | | | 2,203 | | | | (10,119 | ) | | | 406 | | | | (10,525 | ) | | | | |
| | CMBX.NA.6.AAA | | | 0.50 | | | | Monthly | | | Deutsche Bank AG | | | 05/11/63 | | | | USD | | | | 5,352 | | | | (24,590 | ) | | | (1,653 | ) | | | (22,937 | ) | | | | |
| | CMBX.NA.6.BBB- | | | 3.00 | | | | Monthly | | | J.P. Morgan Securities LLC | | | 05/11/63 | | | | USD | | | | 850 | | | | 283,433 | | | | 79,380 | | | | 204,053 | | | | | |
| | | | | | | | | | | | | | | | | | | | | | | | | | | | | | | | | | | | | | | | |
| | | | | | | | | | | |
| | | | | | | | | | | | | | | | | | | | | | | | | | $ | 15,741,222 | | | $ | 15,357,403 | | | $ | 383,819 | | | | | |
| | | | | | | | | | | | | | | | | | | | | | | | | | | | | | | | | | | | | | | | |
| | |
| 118 | | 2 0 2 0 B L A C K R O C K A N N U A L R E P O R T T O S H A R E H O L D E R S |
| | |
Schedule of Investments (continued) September 30, 2020 | | Master Total Return Portfolio |
OTC Credit Default Swaps — Sell Protection
| | | | | | | | | | | | | | | | | | | | | | | | | | | | | | | | | | | | | | | | | | | | | | |
| | | | | | | | | | | |
| | | Reference Obligation/Index | | Financing Rate Received by the Fund | | | Payment Frequency | | Counterparty | | Termination
Date | | | Credit Rating(a) | | | Notional Amount (000) | | | Value | | | Upfront Premium Paid (Received) | | | Unrealized
Appreciation
(Depreciation) | | | | |
| | | | | | | | | | | | | |
| | ITRAXX.ASIA.XJ.IG.24.V1 | | | 1.00 | % | | Quarterly | | Goldman Sachs International | | | 12/20/20 | | | | A- | | | | USD | | | | 1,825 | | | $ | 4,846 | | | $ | (2,235 | ) | | | | | | $ | 7,081 | | | | | |
| | Broadcom, Inc.(b) | | | 1.00 | | | Quarterly | | Citibank N.A. | | | 06/20/24 | | | | BBB- | | | | USD | | | | 14,931 | | | | 110,255 | | | | (850,719 | ) | | | | | | | 960,974 | | | | | |
| | CMBX.NA.7.AAA | | | 0.50 | | | Monthly | | Morgan Stanley & Co. International PLC | | | 01/17/47 | | | | AAA | | | | USD | | | | 4,964 | | | | 37,074 | | | | (141,470 | ) | | | | | | | 178,544 | | | | | |
| �� | CMBX.NA.3.AM | | | 0.50 | | | Monthly | | Credit Suisse International | | | 12/13/49 | | | | N/R | | | | USD | | | | — | (c) | | | — | | | | (10 | ) | | | | | | | 10 | | | | | |
| | CMBX.NA.3.AM | | | 0.50 | | | Monthly | | Goldman Sachs International | | | 12/13/49 | | | | N/R | | | | USD | | | | — | (c) | | | — | | | | (25 | ) | | | | | | | 25 | | | | | |
| | CMBX.NA.3.AM | | | 0.50 | | | Monthly | | JPMorgan Chase Bank N.A. | | | 12/13/49 | | | | N/R | | | | USD | | | | 1 | | | | — | | | | (51 | ) | | | | | | | 51 | | | | | |
| | CMBX.NA.9.BBB- | | | 3.00 | | | Monthly | | Deutsche Bank AG | | | 09/17/58 | | | | N/R | | | | USD | | | | 906 | | | | (238,034 | ) | | | (104,277 | ) | | | | | | | (133,757 | ) | | | | |
| | CMBX.NA.9.BBB- | | | 3.00 | | | Monthly | | JPMorgan Chase Bank N.A. | | | 09/17/58 | | | | N/R | | | | USD | | | | 438 | | | | (115,075 | ) | | | (37,187 | ) | | | | | | | (77,888 | ) | | | | |
| | CMBX.NA.9.BBB- | | | 3.00 | | | Monthly | | Morgan Stanley & Co. International PLC | | | 09/17/58 | | | | N/R | | | | USD | | | | 1,060 | | | | (278,494 | ) | | | (51,526 | ) | | | | | | | (226,968 | ) | | | | |
| | CMBX.NA.9.BBB- | | | 3.00 | | | Monthly | | Morgan Stanley & Co. International PLC | | | 09/17/58 | | | | N/R | | | | USD | | | | 231 | | | | (60,690 | ) | | | (13,499 | ) | | | | | | | (47,191 | ) | | | | |
| | CMBX.NA.9.BBB- | | | 3.00 | | | Monthly | | Morgan Stanley & Co. International PLC | | | 09/17/58 | | | | N/R | | | | USD | | | | 1,200 | | | | (315,276 | ) | | | (1,497 | ) | | | | | | | (313,779 | ) | | | | |
| | CMBX.NA.10.A | | | 2.00 | | | Monthly | | Deutsche Bank AG | | | 11/17/59 | | | | A- | | | | USD | | | | 3,340 | | | | (272,577 | ) | | | (139,551 | ) | | | | | | | (133,026 | ) | | | | |
| | CMBX.NA.10.A | | | 2.00 | | | Monthly | | Deutsche Bank AG | | | 11/17/59 | | | | A- | | | | USD | | | | 1,670 | | | | (136,289 | ) | | | (70,948 | ) | | | | | | | (65,341 | ) | | | | |
| | CMBX.NA.10.BBB- | | | 3.00 | | | Monthly | | J.P. Morgan Securities LLC | | | 11/17/59 | | | | BBB- | | | | USD | | | | 60 | | | | (14,687 | ) | | | (4,960 | ) | | | | | | | (9,727 | ) | | | | |
| | CMBX.NA.6.BBB- | | | 3.00 | | | Monthly | | Credit Suisse International | | | 05/11/63 | | | | BB+ | | | | USD | | | | 850 | | | | (283,434 | ) | | | (64,282 | ) | | | | | | | (219,152 | ) | | | | |
| | | | | | | | | | | | | | | | | | | | | | | | | | | | | | | | | | | | | | | | | | | | | | |
| | | | | | | | | | | | | |
| | | | | | | | | | | | | | | | | | | | | | | | | | | | $ | (1,562,381 | ) | | $ | (1,482,237 | ) | | | | | | $ | (80,144 | ) | | | | |
| | | | | | | | | | | | | | | | | | | | | | | | | | | | | | | | | | | | | | | | | | | | | | |
| | (a) | Using the rating of the issuer or the underlying securities of the index, as applicable, provided by S&P Global Ratings. | |
| | (b) | Security is valued using significant unobservable inputs and is classified as Level 3 in the fair value hierarchy. | |
| | (c) | Notional amount is less than USD 500. | |
OTC Interest Rate Swaps
| | | | | | | | | | | | | | | | | | | | | | | | | | | | | | | | | | | | | | | | | | | | |
| | | | | | | | |
Paid by the Fund | | Received by the Fund | | | Counterparty | | Termination | | | Notional Amount (000) | | | Value | | | Upfront Premium Paid | | | Unrealized
Appreciation | |
| Rate | | Frequency | | Rate | | | Frequency | | | Date | | | (Received) | | | (Depreciation) | |
| | | | | | | | | | | | |
3.27% | | Semi-Annual | |
| 3-month LIBOR,
0.23% |
| | | Quarterly | | | Deutsche Bank AG | | | 05/16/21 | | | | USD | | | | 9,510 | | | $ | (294,467 | ) | | | | | | $ | — | | | | | | | $ | (294,467 | ) |
1-day BZDIOVER, 0.01% | | At Termination | | | 3.10% | | | | At Termination | | | Citibank N.A. | | | 01/03/22 | | | | BRL | | | | 209,788 | | | | 43,673 | | | | | | | | — | | | | | | | | 43,673 | |
1-day BZDIOVER, 0.01% | | At Termination | | | 5.13% | | | | At Termination | | | JPMorgan Chase Bank N.A. | | | 01/02/23 | | | | BRL | | | | 58,940 | | | | 162,368 | | | | | | | | — | | | | | | | | 162,368 | |
1-day BZDIOVER, 0.01% | | At Termination | | | 4.52% | | | | At Termination | | | BNP Paribas S.A. | | | 01/02/23 | | | | BRL | | | | 230,186 | | | | 66,266 | | | | | | | | — | | | | | | | | 66,266 | |
28-day MXIBTIIE, 4.55% | | Monthly | | | 6.33% | | | | Monthly | | | Citibank N.A. | | | 06/09/25 | | | | MXN | | | | 14,869 | | | | 38,656 | | | | | | | | (56 | ) | | | | | | | 38,712 | |
28-day MXIBTIIE, 4.55% | | Monthly | | | 6.32% | | | | Monthly | | | Goldman Sachs International | | | 08/06/25 | | | | MXN | | | | 109,616 | | | | 283,607 | | | | | | | | (313 | ) | | | | | | | 283,920 | |
| | | | | | | | | | | | | | | | | | | | | | | | | | | | | | | | | | | | | | | | | | | | |
| | | | | | | | | | | | |
| | | | | | | | | | | | | | | | | | | | | | | | | | $ | 300,103 | | | | | | | $ | (369 | ) | | | | | | $ | 300,472 | |
| | | | | | | | | | | | | | | | | | | | | | | | | | | | | | | | | | | | | | | | | | | | |
OTC Inflation Rate Swaps
| | | | | | | | | | | | | | | | | | | | | | | | | | | | | | | | | | | | | | |
| | | | | | | | | |
| | | Paid by the Fund | | Received by the Fund | | Counterparty | | | Termination Date | | | Notional Amount (000) | | | | | | Upfront Premium Paid | | | Unrealized
Appreciation | | | | |
| | | Reference | | Frequency | | Rate | | Frequency | | Value | | | (Received) | | | (Depreciation) | | | | |
| | | | | | | | | | | | |
| | U.S. CPI Urban Consumers NAS (CPURNSA) | | At Termination | | (0.96)% | | At Termination | | | Citibank N.A. | | | | 04/15/21 | | | USD | | | 130,790 | | | $ | (2,205,425 | ) | | | $ — | | | | $ (2,205,425 | ) | | | | |
| | |
S C H E D U L E O F I N V E S T M E N T S | | 119 |
| | |
Schedule of Investments (continued) September 30, 2020 | | Master Total Return Portfolio |
OTC Inflation Rate Swaps (continued)
| | | | | | | | | | | | | | | | | | | | | | | | | | | | | | | | | | | | | | | | | | | | | | |
| | | | | | | | | | |
| | | Paid by the Fund | | Received by the Fund | | | | | Termination Date | | | Notional Amount (000) | | | Value | | | Upfront Premium Paid | | | Unrealized Appreciation | | | | |
| | | Reference | | Frequency | | Rate | | Frequency | | Counterparty | | | (Received) | | | (Depreciation) | | | | |
| | | | | | | | | | | | | | |
| | U.S. CPI Urban Consumers NAS (CPURNSA) | | At Termination | | (1.00)% | | At Termination | | | Citibank N.A. | | | | 04/15/21 | | | USD | | | 130,789 | | | $ | (2,251,864 | ) | | | | | | $ | — | | | | | | | $ | (2,251,864 | ) | | | | |
| | U.S. CPI Urban Consumers NAS (CPURNSA) | | At Termination | | (1.00)% | | At Termination | | | Citibank N.A. | | | | 04/15/21 | | | USD | | | 130,789 | | | | (2,251,864 | ) | | | | | | | — | | | | | | | | (2,251,864 | ) | | | | |
| | U.S. CPI Urban Consumers NAS (CPURNSA) | | At Termination | | (1.02)% | | At Termination | | | Citibank N.A. | | | | 04/15/21 | | | USD | | | 130,789 | | | | (2,275,832 | ) | | | | | | | — | | | | | | | | (2,275,832 | ) | | | | |
| | U.S. CPI Urban Consumers NAS (CPURNSA) | | At Termination | | (0.60)% | | At Termination | | | Citibank N.A. | | | | 04/15/21 | | | USD | | | 76,394 | | | | (1,085,001 | ) | | | | | | | — | | | | | | | | (1,085,001 | ) | | | | |
| | 0.00% | | At Termination | | U.S. CPI Urban Consumers NAS (CPURNSA) | | At Termination | | | Citibank N.A. | | | | 04/15/22 | | | USD | | | 130,789 | | | | 2,797,906 | | | | | | | | — | | | | | | | | 2,797,906 | | | | | |
| | 0.01% | | At Termination | | U.S. CPI Urban Consumers NAS (CPURNSA) | | At Termination | | | Citibank N.A. | | | | 04/15/22 | | | USD | | | 130,789 | | | | 2,767,843 | | | | | | | | — | | | | | | | | 2,767,843 | | | | | |
| | 0.02% | | At Termination | | U.S. CPI Urban Consumers NAS (CPURNSA) | | At Termination | | | Citibank N.A. | | | | 04/15/22 | | | USD | | | 130,789 | | | | 2,747,800 | | | | | | | | — | | | | | | | | 2,747,800 | | | | | |
| | 0.04% | | At Termination | | U.S. CPI Urban Consumers NAS (CPURNSA) | | At Termination | | | Citibank N.A. | | | | 04/15/22 | | | USD | | | 130,789 | | | | 2,692,672 | | | | | | | | — | | | | | | | | 2,692,672 | | | | | |
| | 0.27% | | At Termination | | U.S. CPI Urban Consumers NAS (CPURNSA) | | At Termination | | | Citibank N.A. | | | | 04/15/22 | | | USD | | | 76,394 | | | | 1,307,781 | | | | | | | | — | | | | | | | | 1,307,781 | | | | | |
| | U.S. CPI Urban Consumers NAS (CPURNSA) | | At Termination | | (0.05)% | | At Termination | | | Citibank N.A. | | | | 04/15/22 | | | USD | | | 196,184 | | | | (4,384,694 | ) | | | | | | | — | | | | | | | | (4,384,694 | ) | | | | |
| | 0.62% | | At Termination | | U.S. CPI Urban Consumers NAS (CPURNSA) | | At Termination | | | Citibank N.A. | | | | 04/15/24 | | | USD | | | 196,184 | | | | 6,496,771 | | | | | | | | — | | | | | | | | 6,496,771 | | | | | |
| | | | | | | | | | | | | | | | | | | | | | | | | | | | | | | | | | | | | | | | | | | | | | |
| | | | | | | | | | | | | | |
| | | | | | | | | | | | | | | | | | | | | | | | $ | 4,356,093 | | | | | | | $ | — | | | | | | | $ | 4,356,093 | | | | | |
| | | | | | | | | | | | | | | | | | | | | | | | | | | | | | | | | | | | | | | | | | | | | | |
| | |
| 120 | | 2 0 2 0 B L A C K R O C K A N N U A L R E P O R T T O S H A R E H O L D E R S |
| | |
Schedule of Investments (continued) September 30, 2020 | | Master Total Return Portfolio |
OTC Total Return Swaps
| | | | | | | | | | | | | | | | | | | | | | | | | | | | | | |
Paid by the Fund | | Received by the Fund | | | | Termination | | | Notional Amount | | | | | Upfront Premium Paid | | | Unrealized Appreciation | |
| | | | | | | | | |
| Reference | | Frequency | | Rate | | Frequency | | Counterparty | | Date | | | (000) | | Value | | | (Received) | | | (Depreciation) | |
Berry Petroleum Corp. | | At Termination | | 3-month LIBOR minus 0.45%, 0.23% | | At Termination | | Credit Suisse International | | | 11/05/20 | | | | USD | | | 205 | | $ | 89,149 | | | $ | — | | | $ | 89,149 | |
Antero Resources Corp. | | At Termination | | 3-month LIBOR minus 0.50%, 0.23% | | At Termination | | Citibank N.A. | | | 02/12/21 | | | | USD | | | 1,311 | | | 652,264 | | | | — | | | | 652,264 | |
EQT Corp. | | At Termination | | 3-month LIBOR minus 0.15%, 0.23% | | At Termination | | Citibank N.A. | | | 02/12/21 | | | | USD | | | 2,363 | | | 629,115 | | | | — | | | | 629,115 | |
| | | | Goldman Sachs Systematic Skew U.S. Series 10 | | | | | | | | | | | | | | | | | | | | | | | | | | |
3-month LIBOR, 0.23% | | At Termination | | Excess Return Strategy | | At Termination | | Goldman Sachs International | | | 09/09/21 | | | | USD | | | 3,052 | | | 579 | | | | — | | | | 579 | |
| | | | | | | | | | | | | | | | | | | | | | | | | | | | | | |
| | | | | | | | | | | | | | | | | | | | $ | 1,371,107 | | | $ | — | | | $ | 1,371,107 | |
| | | | | | | | | | | | | | | | | | | | | | | | | | | | | | |
Balances Reported in the Statement of Assets and Liabilities for Centrally Cleared Swaps, OTC Swaps and Options Written
| | | | | | | | | | | | | | | | | | | | |
| | | Swaps Premiums Paid | | | Swap Premiums Received | | | Unrealized Appreciation | | | Unrealized Depreciation | | | Value | |
Centrally Cleared Swaps(a) | | $ | 51,774 | | | $ | (2,794,129 | ) | | $ | 6,068,086 | | | $ | (6,071,628 | ) | | $ | — | |
OTC Swaps | | | 16,191,757 | | | | (2,316,960 | ) | | | 25,383,004 | | | | (19,051,657 | ) | | | — | |
Options Written | | | N/A | | | | N/A | | | | 5,257,303 | | | | (2,004,931 | ) | | | (12,962,851 | ) |
| | (a) | Includes cumulative appreciation (depreciation) on centrally cleared swaps, as reported in the Schedule of Investments. Only current day’s variation margin is reported within the Statement of Assets and Liabilities and is net of any previously paid (received) swap premium amounts. | |
Derivative Financial Instruments Categorized by Risk Exposure
As of period end, the fair values of derivative financial instruments located in the Statement of Assets and Liabilities were as follows:
| | | | | | | | | | | | | | | | | | | | | | | | | | | | | | | | |
| | | Commodity Contracts | | | Credit Contracts | | | Equity Contracts | | | Foreign Currency Exchange Contracts | | | Interest Rate Contracts | | | Other Contracts | | | Total | |
Assets — Derivative Financial Instruments | | | | | | | | | | | | | | | | | | | | | | | | | | | | | | | | |
Futures contracts | | | | | | | | | | | | | | | | | | | | | | | | | | | | | | | | |
Unrealized appreciation(a) | | | | | | $ | — | | | $ | — | | | $ | 46,169 | | | $ | — | | | $ | 1,491,109 | | | $ | — | | | $ | 1,537,278 | |
Forward foreign currency exchange contracts | | | | | | | | | | | | | | | | | | | | | | | | | | | | | | | | |
Unrealized appreciation on forward foreign currency exchange contracts | | | | | | | — | | | | — | | | | — | | | | 19,677,120 | | | | — | | | | — | | | | 19,677,120 | |
Options purchased | | | | | | | | | | | | | | | | | | | | | | | | | | | | | | | | |
Investments at value — unaffiliated(b) | | | | | | | — | | | | — | | | | 13,055,172 | | | | 4,174,369 | | | | 9,538,342 | | | | — | | | | 26,767,883 | |
Swaps — centrally cleared Unrealized appreciation(a) | | | | | | | — | | | | 920,010 | | | | — | | | | — | | | | 3,358,436 | | | | 1,789,640 | | | | 6,068,086 | |
Swaps — OTC | | | | | | | | | | | | | | | | | | | | | | | | | | | | | | | | |
Unrealized appreciation on OTC swaps; Swap premiums paid | | | | | | | — | | | | 20,797,942 | | | | 1,371,107 | | | | — | | | | 594,939 | | | | 18,810,773 | | | | 41,574,761 | |
| | | | | | | | | | | | | | | | | | | | | | | | | | | | | | | | |
| | | | | | $ | — | | | $ | 21,717,952 | | | $ | 14,472,448 | | | $ | 23,851,489 | | | $ | 14,982,826 | | | $ | 20,600,413 | | | $ | 95,625,128 | |
| | | | | | | | | | | | | | | | | | | | | | | | | | | | | | | | |
Liabilities — Derivative Financial Instruments | | | | | | | | | | | | | | | | | | | | | | | | | | | | | | | | |
Futures contracts | | | | | | | | | | | | | | | | | | | | | | | | | | | | | | | | |
Unrealized depreciation(a) | | | | | | $ | — | | | $ | — | | | $ | — | | | $ | — | | | $ | 6,321,560 | | | $ | — | | | $ | 6,321,560 | |
Forward foreign currency exchange contracts | | | | | | | | | | | | | | | | | | | | | | | | | | | | | | | | |
Unrealized depreciation on forward foreign currency exchange contracts | | | | | | | — | | | | — | | | | — | | | | 17,190,119 | | | | — | | | | — | | | | 17,190,119 | |
Options written | | | | | | | | | | | | | | | | | | | | | | | | | | | | | | | | |
Options written at value | | | | | | | — | | | | — | | | | 8,893,388 | | | | 2,822,972 | | | | 1,246,491 | | | | — | | | | 12,962,851 | |
| | |
S C H E D U L E O F I N V E S T M E N T S | | 121 |
| | |
Schedule of Investments (continued) September 30, 2020 | | Master Total Return Portfolio |
| | | | | | | | | | | | | | | | | | | | | | | | | | | | |
| | | Commodity
Contracts | | | Credit
Contracts | | | Equity
Contracts | | | Foreign
Currency
Exchange
Contracts | | | Interest
Rate
Contracts | | | Other
Contracts | | | Total | |
Swaps — centrally cleared | | | | | | | | | | | | | | | | | | | | | | | | | | | | |
Unrealized depreciation(a) | | $ | — | | | $ | — | | | $ | — | | | $ | — | | | $ | 5,018,949 | | | $ | 1,052,679 | | | $ | 6,071,628 | |
Swaps — OTC | | | | | | | | | | | | | | | | | | | | | | | | | | | | |
Unrealized depreciation on OTC swaps; | | | | | | | | | | | | | | | | | | | | | | | | | | | | |
Swap premiums received | | | — | | | | 6,619,101 | | | | — | | | | — | | | | 294,836 | | | | 14,454,680 | | | | 21,368,617 | |
| | | | | | | | | | | | | | | | | | | | | | | | | | | | |
| | $ | — | | | $ | 6,619,101 | | | $ | 8,893,388 | | | $ | 20,013,091 | | | $ | 12,881,836 | | | $ | 15,507,359 | | | $ | 63,914,775 | |
| | | | | | | | | | | | | | | | | | | | | | | | | | | | |
| | (a) | Net cumulative unrealized appreciation (depreciation) on futures and centrally cleared swaps, if any, are reported in the Schedule of Investments. In the Statement of Assets and Liabilities, only current day’s variation margin is reported in receivables or payables and the net cumulative unrealized appreciation (depreciation) is included in accumulated earnings (loss). | |
| | (b) | Includes options purchased at value as reported in the Schedule of Investments. | |
For the year ended September 30, 2020, the effect of derivative financial instruments in the Statement of Operations was as follows:
| | | | | | | | | | | | | | | | | | | | | | | | | | | | |
| | | Commodity Contracts | | | Credit Contracts | | | Equity Contracts | | | Foreign Currency Exchange Contracts | | | Interest Rate Contracts | | | Other Contracts | | | Total | |
Net Realized Gain (Loss) from | | | | | | | | | | | | | | | | | | | | | | | | | | | | |
Futures contracts | | $ | — | | | $ | — | | | $ | (15,482,787 | ) | | $ | — | | | $ | 352,588,980 | | | $ | — | | | $ | 337,106,193 | |
Forward foreign currency exchange contracts | | | — | | | | — | | | | — | | | | (13,457,019 | ) | | | — | | | | — | | | | (13,457,019 | ) |
Options purchased(a) | | | — | | | | — | | | | (4,107,491 | ) | | | (28,241,218 | ) | | | (20,323,619 | ) | | | — | | | | (52,672,328 | ) |
Options written | | | — | | | | — | | | | 12,630,731 | | | | 17,695,011 | | | | 14,412,727 | | | | — | | | | 44,738,469 | |
Swaps | | | — | | | | 12,205,587 | | | | 5,626,357 | | | | — | | | | 17,438,009 | | | | 7,099,776 | | | | 42,369,729 | |
| | | | | | | | | | | | | | | | | | | | | | | | | | | | |
| | $ | — | | | $ | 12,205,587 | | | $ | (1,333,190 | ) | | $ | (24,003,226 | ) | | $ | 364,116,097 | | | $ | 7,099,776 | | | $ | 358,085,044 | |
| | | | | | | | | | | | | | | | | | | | | | | | | | | | |
Net Change in Unrealized Appreciation (Depreciation) on | | | | | | | | | | | | | | | | | | | | | | | | | | | | |
Futures contracts | | $ | — | | | $ | — | | | $ | (314,289 | ) | | $ | — | | | $ | (752,308 | ) | | $ | — | | | $ | (1,066,597 | ) |
Forward foreign currency exchange contracts | | | — | | | | — | | | | — | | | | (10,783,041 | ) | | | — | | | | — | | | | (10,783,041 | ) |
Options purchased | | | — | | | | — | | | | 4,795,437 | | | | (6,303,865 | ) | | | (5,008,870 | ) | | | — | | | | (6,517,298 | ) |
Options written | | | — | | | | — | | | | (1,025,742 | ) | | | 2,668,248 | | | | 404,082 | | | | — | | | | 2,046,588 | |
Swaps | | | — | | | | 559,557 | | | | 1,066,274 | | | | — | | | | (2,404,220 | ) | | | 4,925,049 | | | | 4,146,660 | |
| | | | | | | | | | | | | | | | | | | | | | | | | | | | |
| | $ | — | | | $ | 559,557 | | | $ | 4,521,680 | | | $ | (14,418,658 | ) | | $ | (7,761,316 | ) | | $ | 4,925,049 | | | $ | (12,173,688 | ) |
| | | | | | | | | | | | | | | | | | | | | | | | | | | | |
| | (a) | Options purchased are included in net realized gain (loss) from investments — unaffiliated. | |
Average Quarterly Balances of Outstanding Derivative Financial Instruments
| | | | |
Futures contracts | | | | |
Average notional value of contracts — long | | $ | 4,756,116,393 | |
Average notional value of contracts — short | | $ | 1,292,212,179 | |
Forward foreign currency exchange contracts | | | | |
Average amounts purchased — in USD | | $ | 1,273,662,682 | |
Average amounts sold — in USD | | $ | 801,042,281 | |
Options | | | | |
Average value of option contracts purchased | | $ | 19,351,235 | |
Average value of option contracts written | | $ | 11,624,128 | |
Average notional value of swaption contracts purchased | | $ | 223,865,000 | |
Average notional value of swaption contracts written | | $ | 244,727,250 | |
Credit default swaps | | | | |
Average notional value — buy protection | | $ | 451,523,821 | |
Average notional value — sell protection | | $ | 76,329,822 | |
Total return swaps | | | | |
Average notional amount | | $ | 39,986,473 | |
Interest rate swaps | | | | |
Average notional value — pays fixed rate | | $ | 5,320,739,721 | |
Average notional value — received fixed rate | | $ | 4,596,465,473 | |
| | |
| 122 | | 2 0 2 0 B L A C K R O C K A N N U A L R E P O R T T O S H A R E H O L D E R S |
| | |
Schedule of Investments (continued) September 30, 2020 | | Master Total Return Portfolio |
Average Quarterly Balances of Outstanding Derivative Financial Instruments (continued)
| | | | |
Inflation swaps | | | | |
Average notional amount — pays | | $ | 438,337,388 | |
Average notional amount — receives | | $ | 438,337,723 | |
For more information about the Master Portfolio’s investment risks regarding derivative financial instruments, refer to the Notes to Financial Statements.
Derivative Financial Instruments – Offsetting as of Period End
The Portfolio’s derivative assets and liabilities (by type) were as follows:
| | | | | | | | |
| | | Assets | | | Liabilities | |
Derivative Financial Instruments | | | | | | | | |
Futures contracts | | $ | 3,741,666 | | | $ | 9,564,980 | |
Forward foreign currency exchange contracts | | | 19,677,120 | | | | 17,190,119 | |
Options | | | 26,767,883(a | ) | | | 12,962,851 | |
Swaps — centrally cleared | | | — | | | | 2,620,865 | |
Swaps — OTC(b) | | | 41,574,761 | | | | 21,368,617 | |
| | | | | | | | |
Total derivative assets and liabilities in the Statement of Assets and Liabilities | | $ | 91,761,430 | | | $ | 63,707,432 | |
| | | | | | | | |
Derivatives not subject to a Master Netting Agreement or similar agreement (“MNA”) | | | (23,449,484 | ) | | | (21,745,319 | ) |
| | | | | | | | |
Total derivative assets and liabilities subject to an MNA | | $ | 68,311,946 | | | $ | 41,962,113 | |
| | | | | | | | |
| | (a) | Includes interest rate caps purchased at value and options purchased at value which are included in Investments at value — unaffiliated in the Statement of Assets and Liabilities and reported in the Schedule of Investments. | |
| | (b) | Includes unrealized appreciation (depreciation) on OTC swaps and swap premiums paid/received in the Statement of Assets and Liabilities. | |
The following tables present the Master Portfolio’s derivative assets and liabilities by counterparty net of amounts available for offset under an MNA and net of the related collateral received and pledged by the Master Portfolio:
| | | | | | | | | | | | | | | | | | | | |
| Counterparty | | Derivative Assets Subject to an MNA by Counterparty | | | Derivatives Available for Offset(a) | | | Non- Cash Collateral Received(b) | | | Cash Collateral Received(b) | | | Net Amount of Derivative Assets(c)(d) | |
Bank of America N.A | | $ | 2,690,686 | | | $ | (2,434,157 | ) | | $ | (256,529 | ) | | $ | — | | | $ | — | |
Barclays Bank PLC | | | 8,044,358 | | | | (1,919,197 | ) | | | — | | | | (6,125,161 | ) | | | — | |
BNP Paribas S.A | | | 4,771,680 | | | | (2,974,892 | ) | | | — | | | | — | | | | 1,796,788 | |
Citibank N.A | | | 28,750,285 | | | | (21,595,663 | ) | | | — | | | | (7,154,622 | ) | | | — | |
Credit Suisse International | | | 234,647 | | | | (234,647 | ) | | | — | | | | — | | | | — | |
Deutsche Bank AG | | | 1,650,835 | | | | (1,650,835 | ) | | | — | | | | — | | | | — | |
Goldman Sachs Bank USA | | | 1,076,999 | | | | (473,409 | ) | | | — | | | | (600,000 | ) | | | 3,590 | |
Goldman Sachs International | | | 3,580,644 | | | | (790,473 | ) | | | — | | | | (2,790,171 | ) | | | — | |
HSBC Bank PLC | | | 878,822 | | | | (288,113 | ) | | | — | | | | — | | | | 590,709 | |
J.P. Morgan Securities LLC | | | 283,433 | | | | (14,687 | ) | | | — | | | | — | | | | 268,746 | |
JPMorgan Chase Bank N.A | | | 2,576,181 | | | | (2,206,384 | ) | | | — | | | | (369,797 | ) | | | — | |
Morgan Stanley & Co. International PLC | | | 8,873,290 | | | | (1,851,947 | ) | | | — | | | | (7,021,343 | ) | | | — | |
State Street Bank and Trust Co. | | | 32,257 | | | | (5,321 | ) | | | — | | | | — | | | | 26,936 | |
UBS AG | | | 4,867,829 | | | | (2,053,054 | ) | | | — | | | | — | | | | 2,814,775 | |
| | | | | | | | | | | | | | | | | | | | |
| | $ | 68,311,946 | | | $ | (38,492,779 | ) | | $ | (256,529 | ) | | $ | (24,061,094 | ) | | $ | 5,501,544 | |
| | | | | | | | | | | | | | | | | | | | |
| | | | | | | | | | | | | | | | | | | | |
| Counterparty | | Derivative Liabilities Subject to an MNA by Counterparty | | | Derivatives Available for Offset(a) | | | Non- Cash Collateral Pledged | | | Cash Collateral Pledged(e) | | | Net Amount of Derivative Liabilities(d)(f) | |
Bank of America N.A | | $ | 2,434,157 | | | $ | (2,434,157 | ) | | $ | — | | | $ | — | | | $ | — | |
Barclays Bank PLC | | | 1,919,197 | | | | (1,919,197 | ) | | | — | | | | — | | | | — | |
BNP Paribas S.A | | | 2,974,892 | | | | (2,974,892 | ) | | | — | | | | — | | | | — | |
Citibank N.A | | | 21,595,663 | | | | (21,595,663 | ) | | | — | | | | — | | | | — | |
Credit Suisse International | | | 626,654 | | | | (234,647 | ) | | | — | | | | (392,007 | ) | | | — | |
Deutsche Bank AG | | | 1,881,455 | | | | (1,650,835 | ) | | | — | | | | (230,620 | ) | | | — | |
Goldman Sachs Bank USA | | | 473,409 | | | | (473,409 | ) | | | — | | | | — | | | | — | |
Goldman Sachs International | | | 790,473 | | | | (790,473 | ) | | | — | | | | — | | | | — | |
| | |
S C H E D U L E O F I N V E S T M E N T S | | 123 |
| | |
Schedule of Investments (continued) September 30, 2020 | | Master Total Return Portfolio |
| | | | | | | | | | | | | | | | | | | | | | | | |
| Counterparty | | Derivative Liabilities Subject to an MNA by Counterparty | | | Derivatives Available for Offset(a) | | | Non- Cash Collateral Pledged | | | Cash Collateral Pledged(e) | | | Net Amount of Derivative Liabilities(d)(f) | |
HSBC Bank PLC | | $ | 288,113 | | | $ | (288,113 | ) | | | | | | $ | — | | | $ | — | | | $ | — | |
J.P. Morgan Securities LLC | | | 14,687 | | | | (14,687 | ) | | | | | | | — | | | | — | | | | — | |
JPMorgan Chase Bank N.A | | | 2,206,384 | | | | (2,206,384 | ) | | | | | | | — | | | | — | | | | — | |
Morgan Stanley & Co. International PLC | | | 1,851,947 | | | | (1,851,947 | ) | | | | | | | — | | | | — | | | | — | |
Standard Chartered Bank | | | 2,846,707 | | | | — | | | | | | | | — | | | | (20,000 | ) | | | 2,826,707 | |
State Street Bank and Trust Co. | | | 5,321 | | | | (5,321 | ) | | | | | | | — | | | | — | | | | — | |
UBS AG | | | 2,053,054 | | | | (2,053,054 | ) | | | | | | | — | | | | — | | | | — | |
| | | | | | | | | | | | | | | | | | | | | | | | |
| | $ | 41,962,113 | | | $ | (38,492,779 | ) | | | | | | $ | — | | | $ | (642,627 | ) | | $ | 2,826,707 | |
| | | | | | | | | | | | | | | | | | | | | | | | |
| | (a) | The amount of derivatives available for offset is limited to the amount of derivative assets and/or liabilities that are subject to an MNA. | |
| | (b) | Excess of collateral received from the individual counterparty is not shown for financial reporting purposes. | |
| | (c) | Net amount represents the net amount receivable from the counterparty in the event of default. | |
| | (d) | Net amount may also include forward foreign currency exchange contracts that are not required to be collateralized. | |
| | (e) | Excess of collateral pledged to the individual counterparty is not shown for financial reporting purposes. | |
| | (f) | Net amount represents the net amount payable due to the counterparty in the event of default. Net amount may be offset further by the options written receivable/payable on the Statement of Assets and Liabilities. | |
Fair Value Hierarchy as of Period End
Various inputs are used in determining the fair value of financial instruments. For description of the input levels and information about the Master Portfolio’s policy regarding valuation of financial instruments, refer to the Notes to Financial Statements.
The following tables summarize the Master Portfolio’s investments and derivative financial instruments categorized in the disclosure hierarchy. The breakdown of the Master Portfolio’s investments into major categories is disclosed in the Schedule of Investments above.
| | | | | | | | | | | | | | | | |
| |
| | | | |
| | | Level 1 | | | Level 2 | | | Level 3 | | | Total | |
| |
Assets | | | | | | | | | | | | | | | | |
Investments | | | | | | | | | | | | | | | | |
Long-Term Investments | | | | | | | | | | | | | | | | |
Asset-Backed Securities | | $ | — | | | $ | 2,024,875,666 | | | $ | 185,886,590 | | | $ | 2,210,762,256 | |
Common Stocks | | | | | | | | | | | | | | | | |
Diversified Financial Services | | | 7,662,743 | | | | — | | | | — | | | | 7,662,743 | |
Energy Equipment & Services | | | 1,088 | | | | — | | | | 282,627 | | | | 283,715 | |
Entertainment | | | 1,046,120 | | | | — | | | | — | | | | 1,046,120 | |
Equity Real Estate Investment Trusts (REITs) | | | 3,092,908 | | | | — | | | | — | | | | 3,092,908 | |
Health Care Providers & Services | | | 1,795,641 | | | | — | | | | — | | | | 1,795,641 | |
Hotels, Restaurants & Leisure | | | 6,071,059 | | | | — | | | | — | | | | 6,071,059 | |
Household Durables | | | 11,159,137 | | | | — | | | | — | | | | 11,159,137 | |
Independent Power and Renewable Electricity Producers | | | 2,640,174 | | | | — | | | | — | | | | 2,640,174 | |
Media | | | 2,003,404 | | | | — | | | | — | | | | 2,003,404 | |
Metals & Mining | | | 20,198 | | | | — | | | | — | | | | 20,198 | |
Oil, Gas & Consumable Fuels | | | — | | | | 1,771,458 | | | | — | | | | 1,771,458 | |
Real Estate Management & Development | | | 2,893,746 | | | | — | | | | — | | | | 2,893,746 | |
Corporate Bonds(a) | | | — | | | | 7,545,740,968 | | | | 38,948,734 | | | | 7,584,689,702 | |
Floating Rate Loan Interests(a) | | | — | | | | 181,518,282 | | | | 133,453,277 | | | | 314,971,559 | |
Foreign Agency Obligations | | | — | | | | 132,732,430 | | | | — | | | | 132,732,430 | |
Foreign Government Obligations | | | — | | | | 1,216,052,131 | | | | — | | | | 1,216,052,131 | |
Investment Companies | | | 271,734,246 | | | | — | | | | — | | | | 271,734,246 | |
Municipal Bonds | | | — | | | | 447,436,471 | | | | — | | | | 447,436,471 | |
Non-Agency Mortgage-Backed Securities | | | — | | | | 1,056,809,166 | | | | 21,820,080 | | | | 1,078,629,246 | |
Preferred Securities(a) | | | — | | | | 88,755,607 | | | | — | | | | 88,755,607 | |
U.S. Government Sponsored Agency Securities | | | — | | | | 10,723,792,874 | | | | — | | | | 10,723,792,874 | |
U.S. Treasury Obligations | | | — | | | | 2,622,872,604 | | | | — | | | | 2,622,872,604 | |
Warrants | | | | | | | | | | | | | | | | |
Diversified Financial Services | | | — | | | | — | | | | — | | | | — | |
Oil, Gas & Consumable Fuels | | | — | | | | 80,741 | | | | — | | | | 80,741 | |
Real Estate Management & Development | | | 638 | | | | — | | | | — | | | | 638 | |
Short-Term Securities | | | | | | | | | | | | | | | | |
Money Market Funds | | | 178,500,805 | | | | — | | | | — | | | | 178,500,805 | |
| | |
| 124 | | 2 0 2 0 B L A C K R O C K A N N U A L R E P O R T T O S H A R E H O L D E R S |
| | |
Schedule of Investments (continued) September 30, 2020 | | Master Total Return Portfolio |
| | | | | | | | | | | | | | | | |
| | | | | |
| | | Level 1 | | | Level 2 | | | Level 3 | | | Total | |
| | | | |
Short-Term Securities | | | | | | | | | | | | | | | | |
Options Purchased | | | | | | | | | | | | | | | | |
Equity Contracts | | $ | 12,712,018 | | | $ | 343,154 | | | $ | — | | | $ | 13,055,172 | |
Foreign Currency Exchange Contracts | | | — | | | | 4,174,369 | | | | — | | | | 4,174,369 | |
Interest Rate Contracts | | | 6,995,800 | | | | 2,542,542 | | | | — | | | | 9,538,342 | |
Unfunded Floating Rate Loan Interests(b) | | | — | | | | 38,565 | | | | — | | | | 38,565 | |
Liabilities | | | | | | | | | | | | | | | | |
TBA Sale Commitments | | | — | | | | (4,866,864,962 | ) | | | — | | | | (4,866,864,962 | ) |
Unfunded Floating Rate Loan Interests (b) | | | — | | | | (54,719 | ) | | | (14,194 | ) | | | (68,913 | ) |
| | | | | | | | | | | | | | | | |
| | $ | 508,329,725 | | | $ | 21,182,617,347 | | | $ | 380,377,114 | | | | 22,071,324,186 | |
| | | | | | | | | | | | | | | | |
Investments Valued at NAV(c) | | | | | | | | | | | | | | | 56,783,936 | |
| | | | | | | | | | | | | | | | |
| | | | | | | | | | | | | | $ | 22,128,108,122 | |
| | | | | | | | | | | | | | | | |
Derivative Financial Instruments(d) | | | | | | | | | | | | | | | | |
Assets | | | | | | | | | | | | | | | | |
Credit Contracts | | $ | — | | | $ | 4,565,221 | | | $ | 960,974 | | | $ | 5,526,195 | |
Equity Contracts | | | 46,169 | | | | 1,371,107 | | | | — | | | | 1,417,276 | |
Foreign Currency Exchange Contracts | | | — | | | | 19,677,120 | | | | — | | | | 19,677,120 | |
Interest Rate Contracts | | | 1,491,109 | | | | 3,953,375 | | | | — | | | | 5,444,484 | |
Other Contracts | | | — | | | | 20,600,413 | | | | — | | | | 20,600,413 | |
Liabilities | | | | | | | | | | | | | | | | |
Credit Contracts | | | — | | | | (4,302,510 | ) | | | — | | | | (4,302,510 | ) |
Equity Contracts | | | (8,633,310 | ) | | | (260,078 | ) | | | — | | | | (8,893,388 | ) |
Foreign Currency Exchange Contracts | | | — | | | | (20,013,089 | ) | | | (2 | ) | | | (20,013,091 | ) |
Interest Rate Contracts | | | (7,247,724 | ) | | | (5,633,743 | ) | | | — | | | | (12,881,467 | ) |
Other Contracts | | | — | | | | (15,507,359 | ) | | | — | | | | (15,507,359 | ) |
| | | | | | | | | | | | | | | | |
| | $ | (14,343,756 | ) | | $ | 4,450,457 | | | $ | 960,972 | | | $ | (8,932,327 | ) |
| | | | | | | | | | | | | | | | |
| | (a) | See above Schedule of Investments for values in each industry. | |
| | (b) | Unfunded floating rate loan interests are valued at the unrealized appreciation (depreciation) on the commitment. | |
| | (c) | Certain investments of the Master Portfolio were fair valued using NAV per share as no quoted market value is available and therefore have been excluded from the fair value hierarchy. | |
| | (d) | Derivative financial instruments are swaps, futures contracts, forward foreign currency exchange contracts and options written. Swaps, futures contracts and forward foreign currency exchange contracts are valued at the unrealized appreciation (depreciation) on the instrument and options written are shown at value. | |
A reconciliation of Level 3 investments is presented when the Master Portfolio had a significant amount of Level 3 investments at the beginning and/or end of the period in relation to net assets. The following table is a reconciliation of Level 3 investments for which significant unobservable inputs were used in determining fair value:
| | | | | | | | | | | | | | | | | | | | |
| |
| | | | | |
| | | Asset-Backed Securities | | | Common Stocks | | | Corporate Bonds | | | Floating Rate Loan Interests | | | Non-Agency Mortgage- Backed Securities | |
| |
| | | | | |
Assets | | | | | | | | | | | | | | | | | | | | |
Opening Balance, as of September 30, 2019 | | $ | 119,808,152 | | | $ | — | | | $ | 24,565,099 | | | $ | 143,255,372 | | | $ | 36,178,812 | |
Transfers into Level 3 | | | 7,344,485 | | | | — | | | | 4,262,210 | | | | 41,006,741 | | | | 3,105,944 | |
Transfers out of Level 3 | | | (16,689,482 | ) | | | — | | | | — | | | | (12,785,807 | ) | | | (12,631,615 | ) |
Accrued discounts/premiums | | | 188,138 | | | | — | | | | 97,917 | | | | 149,585 | | | | 15,662 | |
Net realized gain (loss) | | | 480,124 | | | | — | | | | (1,410,242 | ) | | | (182,650 | ) | | | 89,348 | |
Net change in unrealized appreciation (depreciation)(a)(b) | | | (1,081,233 | ) | | | 185,611 | | | | (6,685,283 | ) | | | (7,806,206 | ) | | | (507,677 | ) |
Purchases | | | 98,923,147 | | | | 97,016 | | | | 19,258,160 | | | | 68,549,365 | | | | 3,502,500 | |
Sales | | | (23,086,741 | ) | | | — | | | | (1,139,127 | ) | | | (98,733,123 | ) | | | (7,932,894 | ) |
| | | | | | | | | | | | | | | | | | | | |
Closing Balance, as of September 30, 2020 | | $ | 185,886,590 | | | $ | 282,627 | | | $ | 38,948,734 | | | $ | 133,453,277 | | | $ | 21,820,080 | |
| | | | | | | | | | | | | | | | | | | | |
Net change in unrealized appreciation (depreciation) on investments still held at September 30, 2020(b) | | $ | (1,018,209 | ) | | $ | 185,611 | | | $ | (6,685,283 | ) | | $ | (7,897,672 | ) | | $ | (507,677 | ) |
| | | | | | | | | | | | | | | | | | | | |
| | |
S C H E D U L E O F I N V E S T M E N T S | | 125 |
| | |
Schedule of Investments (continued) September 30, 2020 | | Master Total Return Portfolio |
| | | | | | | | | | | | | | | | | | | | |
| |
| | | |
| | | Options Purchased | | | Unfunded Floating Rate Loan Interests | | | Total | |
| |
| | | | | |
Assets | | | | | | | | | | | | | | | | | | | | |
Opening Balance, as of September 30, 2019 | | | | | | $ | 1 | | | | | | | $ | — | | | $ | 323,807,436 | |
Transfers into Level 3 | | | | | | | — | | | | | | | | (4,404 | ) | | | 55,714,976 | |
Transfers out of Level 3 | | | | | | | — | | | | | | | | — | | | | (42,106,904 | ) |
Accrued discounts/premiums | | | | | | | — | | | | | | | | — | | | | 451,302 | |
Net realized gain (loss) | | | | | | | (8,551 | ) | | | | | | | — | | | | (1,031,971 | ) |
Net change in unrealized appreciation (depreciation)(a)(b) | | | | | | | 8,550 | | | | | | | | (9,790 | ) | | | (15,896,028 | ) |
Purchases | | | | | | | — | | | | | | | | — | | | | 190,330,188 | |
Sales | | | | | | | — | | | | | | | | — | | | | (130,891,885 | ) |
| | | | | | | | | | | | | | | | | | | | |
| | | | | |
Closing Balance, as of September 30, 2020 | | | | | | $ | — | | | | | | | $ | (14,194 | ) | | $ | 380,377,114 | |
| | | | | | | | | | | | | | | | | | | | |
| | | | | |
Net change in unrealized appreciation (depreciation) on investments still held at September 30, 2020(b) | | | | | | $ | — | | | | | | | $ | (9,790 | ) | | $ | (15,933,020 | ) |
| | | | | | | | | | | | | | | | | | | | |
| | (a) | Included in the related net change in unrealized appreciation (depreciation) in the Statement of Operations. | |
| | (b) | Any difference between net change in unrealized appreciation (depreciation) and net change in unrealized appreciation (depreciation) on investments still held at September 30, 2020 is generally due to investments no longer held or categorized as Level 3 at period end. | |
The following table is a reconciliation of Level 3 derivative financial instruments for which significant unobservable inputs were used in determining fair value:
| | | | | | | | | | | | | | | | | | | | | | |
| |
| | |
| | | | | | Foreign Currency | |
| | | Credit Contracts | | | Exchange Contracts | |
| | | | | | | |
| | | | |
| | | Assets | | | Liabilities | | | Assets | | | Liabilities | |
| |
| | | | | | |
Opening Balance, as of September 30, 2019 | | $ | — | | | | | | | $ | — | | | | | $ | — | | | $ | (1 | ) |
Transfers into Level 3 | | | 246,546 | | | | | | | | — | | | | | | — | | | | — | |
Transfers out of Level 3 | | | — | | | | | | | | — | | | | | | — | | | | — | |
Accrued discounts/premiums | | | 229,281 | | | | | | | | — | | | | | | — | | | | 1 | |
Net realized gain (loss) | | | — | | | | | | | | — | | | | | | — | | | | (14,132 | ) |
Net change in unrealized appreciation (depreciation)(a)(b) | | | 332,934 | | | | | | | | — | | | | | | — | | | | 97,958 | |
Purchases | | | — | | | | | | | | — | | | | | | — | | | | (195,921 | ) |
Issues | | | — | | | | | | | | — | | | | | | — | | | | — | |
Sales | | | — | | | | | | | | — | | | | | | — | | | | 112,093 | |
Settlements | | | 152,213 | | | | | | | | — | | | | | | — | | | | — | |
| | | | | | | | | | | | | | | | | | | | | | |
| | | | | | |
Closing Balance, as of September 30, 2020 | | $ | 960,974 | | | | | | | $ | — | | | | | $ | — | | | $ | (2 | ) |
| | | | | | | | | | | | | | | | | | | | | | |
| | | | | | |
Net change in unrealized appreciation (depreciation) on investments still held at September 30, 2020(b) | | $ | 332,934 | | | | | | | $ | — | | | | | $ | — | | | $ | 97,958 | |
| | | | | | | | | | | | | | | | | | | | | | |
| | (a) | Included in the related net change in unrealized appreciation (depreciation) in the Statement of Operations. | |
| | (b) | Any difference between net change in unrealized appreciation (depreciation) and net change in unrealized appreciation (depreciation) on investments still held at September 30, 2020 is generally due to investments no longer held or categorized as Level 3 at period end. | |
See notes to financial statements.
| | |
| 126 | | 2 0 2 0 B L A C K R O C K A N N U A L R E P O R T T O S H A R E H O L D E R S |
Statement of Assets and Liabilities
September 30, 2020
| | | | | | |
| | | Master Total Return Portfolio | | | |
| | |
ASSETS | | | | | | |
Investments at value — unaffiliated(a)(b) | | $ | 26,631,874,556 | | | |
Investments at value — affiliated(c) | | | 363,128,876 | | | |
Cash | | | 27,129,498 | | | |
Cash pledged: | | | | | | |
Collateral — OTC derivatives | | | 2,000,000 | | | |
Collateral — TBA commitments | | | 910,000 | | | |
Futures contracts | | | 60,591,010 | | | |
Centrally cleared swaps | | | 32,442,630 | | | |
Foreign currency at value(d) | | | 63,664,091 | | | |
Receivables: | | | | | | |
Investments sold | | | 182,686,152 | | | |
Options written | | | 1,559,928 | | | |
Securities lending income — affiliated | | | 3,567 | | | |
Swaps | | | 3,089,540 | | | |
TBA sale commitments | | | 4,871,004,784 | | | |
Contributions from investors | | | 658,662 | | | |
Dividends — affiliated | | | 13,991 | | | |
Interest — unaffiliated | | | 128,817,858 | | | |
Principal paydowns | | | 1,093,771 | | | |
Variation margin on futures contracts | | | 3,741,666 | | | |
Swap premiums paid | | | 16,191,757 | | | |
Unrealized appreciation on: | | | | | | |
Forward foreign currency exchange contracts | | | 19,677,120 | | | |
OTC swaps | | | 25,383,004 | | | |
Unfunded floating rate loan interests | | | 38,565 | | | |
Prepaid expenses | | | 94,912 | | | |
| | | | | | |
| | |
Total assets | | | 32,435,795,938 | | | |
| | | | | | |
| | |
LIABILITIES | | | | | | |
Cash received as collateral for OTC derivatives | | | 28,850,520 | | | |
Cash received as collateral for TBA commitments | | | 5,845,571 | | | |
Cash collateral on securities loaned at value | | | 56,784,289 | | | |
Options written at value(e) | | | 12,962,851 | | | |
TBA sale commitments at value(f) | | | 4,866,864,962 | | | |
Payables: | | | | | | |
Investments purchased | | | 7,383,488,176 | | | |
Swaps | | | 13,478 | | | |
Investment advisory fees | | | 836,763 | | | |
Directors’ fees | | | 1,478 | | | |
Options written | | | 1,281,462 | | | |
Other accrued expenses | | | 1,014,785 | | | |
Other affiliate fees | | | 107,996 | | | |
Variation margin on futures contracts | | | 9,564,980 | | | |
Variation margin on centrally cleared swaps | | | 2,620,865 | | | |
Withdrawals to investors | | | 22,480,488 | | | |
Swap premiums received | | | 2,316,960 | | | |
Unrealized depreciation on: | | | | | | |
Forward foreign currency exchange contracts | | | 17,190,119 | | | |
OTC swaps | | | 19,051,657 | | | |
Unfunded floating rate loan interests | | | 68,913 | | | |
| | | | | | |
| | |
Total liabilities | | | 12,431,346,313 | | | |
| | | | | | |
| | |
NET ASSETS | | $ | 20,004,449,625 | | | |
| | | | | | |
| | |
NET ASSETS CONSIST OF | | | | | | |
Investors’ capital | | $ | 19,573,873,094 | | | |
Net unrealized appreciation (depreciation) | | | 430,576,531 | | | |
| | | | | | |
| | |
NET ASSETS | | $ | 20,004,449,625 | | | |
| | | | | | |
| | |
F I N A N C I A L S T A T E M E N T S | | 127 |
Statement of Assets and Liabilities (continued)
September 30, 2020
| | | | | | |
| | | Master Total Return Portfolio | | | |
| | |
(a) Investments at cost — unaffiliated | | $ | 26,211,969,769 | | | |
(b) Securities loaned at value | | $ | 55,735,013 | | | |
(c) Investments at cost — affiliated | | $ | 363,754,768 | | | |
(d) Foreign currency at cost | | $ | 64,018,683 | | | |
(e) Premiums received | | $ | 16,215,223 | | | |
(f) Proceeds from TBA sale commitments | | $ | 4,871,004,784 | | | |
See notes to financial statements.
| | |
| 128 | | 2 0 2 0 B L A C K R O C K A N N U A L R E P O R T T O S H A R E H O L D E R S |
Statement of Operations
Year Ended September 30, 2020
| | | | | | |
| | | Master Total Return Portfolio | | | |
| | |
INVESTMENT INCOME | | | | | | |
Dividends — unaffiliated | | $ | 1,050,285 | | | |
Dividends — affiliated | | | 10,397,468 | | | |
Interest — unaffiliated | | | 480,402,552 | | | |
Securities lending income — affiliated — net | | | 8,557 | | | |
Foreign taxes withheld | | | (616,864 | ) | | |
| | | | | | |
| | |
Total investment income | | | 491,241,998 | | | |
| | | | | | |
| | |
EXPENSES | | | | | | |
Investment advisory | | | 9,403,300 | | | |
Accounting services | | | 729,413 | | | |
Custodian | | | 636,014 | | | |
Professional | | | 287,870 | | | |
Directors | | | 178,638 | | | |
Printing and postage | | | 9,738 | | | |
Miscellaneous | | | 644,405 | | | |
| | | | | | |
| | |
Total expenses | | | 11,889,378 | | | |
Less: | | | | | | |
Fees waived and/or reimbursed by the Manager | | | (933,305 | ) | | |
| | | | | | |
| | |
Total expenses after fees waived and/or reimbursed | | | 10,956,073 | | | |
| | | | | | |
| | |
Net investment income | | | 480,285,925 | | | |
| | | | | | |
| | |
REALIZED AND UNREALIZED GAIN (LOSS) | | | | | | |
Net realized gain (loss) from: | | | | | | |
Investments — unaffiliated (net of $741,485 foreign capital gain tax) | | | 386,726,593 | | | |
Investments — affiliated | | | 14,390,680 | | | |
Capital gain distributions from investment companies — affiliated | | | 2,436 | | | |
Options written | | | 44,738,469 | | | |
Futures contracts | | | 337,106,193 | | | |
Forward foreign currency exchange contracts | | | (13,457,019 | ) | | |
Foreign currency transactions | | | 12,548,895 | | | |
Swaps | | | 42,369,729 | | | |
| | | | | | |
| | |
| | | 824,425,976 | | | |
| | | | | | |
Net change in unrealized appreciation (depreciation) on: | | | | | | |
Investments — unaffiliated | | | 41,163,394 | | | |
Investments — affiliated | | | (497,110 | ) | | |
Options written | | | 2,046,588 | | | |
Futures contracts | | | (1,066,597 | ) | | |
Forward foreign currency exchange contracts | | | (10,783,041 | ) | | |
Foreign currency translations | | | 799,673 | | | |
Swaps | | | 4,146,660 | | | |
Unfunded floating rate loan interests | | | (16,106 | ) | | |
| | | | | | |
| | |
| | | 35,793,461 | | | |
| | | | | | |
| | |
Net realized and unrealized gain | | | 860,219,437 | | | |
| | | | | | |
| | |
NET INCREASE IN NET ASSETS RESULTING FROM OPERATIONS | | $ | 1,340,505,362 | | | |
| | | | | | |
See notes to financial statements.
| | |
F I N A N C I A L S T A T E M E N T S | | 129 |
Statements of Changes in Net Assets
| | | | | | | | |
| | | Master Total Return Portfolio | |
| |
| | | Year Ended September 30, | |
| | |
| | | 2020 | | | 2019(a) | |
| | |
INCREASE (DECREASE) IN NET ASSETS | | | | | | | | |
| | |
OPERATIONS | | | | | | | | |
Net investment income | | $ | 480,285,925 | | | $ | 509,537,884 | |
Net realized gain | | | 824,425,976 | | | | 232,728,084 | |
Net change in unrealized appreciation (depreciation) | | | 35,793,461 | | | | 657,550,089 | |
| | | | | | | | |
| | |
Net increase in net assets resulting from operations | | | 1,340,505,362 | | | | 1,399,816,057 | |
| | | | | | | | |
| | |
CAPITAL TRANSACTIONS | | | | | | | | |
Proceeds from contributions | | | 8,975,170,481 | | | | 5,976,173,038 | |
Value of withdrawals | | | (6,024,057,622 | ) | | | (4,727,004,752 | ) |
| | | | | | | | |
| | |
Net increase in net assets derived from capital transactions | | | 2,951,112,859 | | | | 1,249,168,286 | |
| | | | | | | | |
| | |
NET ASSETS | | | | | | | | |
Total increase in net assets | | | 4,291,618,221 | | | | 2,648,984,343 | |
Beginning of year | | | 15,712,831,404 | | | | 13,063,847,061 | |
| | | | | | | | |
| | |
End of year | | $ | 20,004,449,625 | | | $ | 15,712,831,404 | |
| | | | | | | | |
| (a) | Consolidated Statement of Changes in Net Assets. |
See notes to financial statements.
| | |
| 130 | | 2 0 2 0 B L A C K R O C K A N N U A L R E P O R T T O S H A R E H O L D E R S |
Financial Highlights
(For a share outstanding throughout each period)
| | | | | | | | | | | | | | | | | | | | |
| | | Master Total Return Portfolio | |
| |
| | | Year Ended September 30, | |
| | | | | |
| | | 2020 | | | 2019(a) | | | 2018(a) | | | 2017(a) | | | 2016(a) | |
| | | | | |
Total Return | | | | | | | | | | | | | | | | | | | | |
Total return | | | 7.90 | % | | | 10.60 | % | | | (1.19 | )%(b) | | | 1.90 | % | | | 5.75 | % |
| | | | | | | | | | | | | | | | | | | | |
| | | | | |
Ratios to Average Net Assets(c) | | | | | | | | | | | | | | | | | | | | |
Total expenses | | | 0.07 | % | | | 0.07 | % | | | 0.34 | % | | | 0.32 | % | | | 0.21 | % |
| | | | | | | | | | | | | | | | | | | | |
| | | | | |
Total expenses after fees waived and/or reimbursed | | | 0.06 | % | | | 0.07 | % | | | 0.34 | % | | | 0.32 | % | | | 0.21 | % |
| | | | | | | | | | | | | | | | | | | | |
| | | | | |
Total expenses after fees waived and/or reimbursed and excluding interest expense | | | 0.06 | % | | | 0.07 | % | | | 0.07 | % | | | 0.08 | % | | | 0.08 | % |
| | | | | | | | | | | | | | | | | | | | |
| | | | | |
Net investment income | | | 2.70 | % | | | 3.70 | % | | | 3.67 | % | | | 3.30 | % | | | 3.03 | % |
| | | | | | | | | | | | | | | | | | | | |
| | | | | |
Supplemental Data | | | | | | | | | | | | | | | | | | | | |
Net assets, end of year (000) | | $ | 20,004,450 | | | $ | 15,712,831 | | | $ | 13,063,847 | | | $ | 11,601,109 | | | $ | 9,309,960 | |
| | | | | | | | | | | | | | | | | | | | |
| | | | | |
Portfolio turnover rate(d) | | | 556 | % | | | 574 | % | | | 734 | % | | | 806 | % | | | 841 | % |
| | | | | | | | | | | | | | | | | | | | |
| (a) | Consolidated Financial Highlights. |
| (b) | Includes a payment received from an affiliate, which had no impact on the Master Portfolio’s total return. |
| (c) | Excludes expenses incurred indirectly as a result of investments in underlying funds as follows: |
| | | | | | | | | | | | | | | | | | | | |
| | |
| | | Year Ended September 30, | |
| | | | | |
| | | 2020 | | | 2019 | | | 2018 | | | 2017 | | | 2016 | |
| | | | | |
Investments in underlying funds | | | 0.01 | % | | | 0.01 | % | | | 0.01 | % | | | 0.01 | % | | | 0.01 | % |
| | | | | | | | | | | | | | | | | | | | |
| (d) | Includes mortgage dollar roll transactions (“MDRs”).Additional information regarding portfolio turnover rate is as follows: |
| | | | | | | | | | | | | | | | | | | | |
| | |
| | | Year Ended September 30, | |
| | | | | |
| | | 2020 | | | 2019 | | | 2018 | | | 2017 | | | 2016 | |
| | | | | |
Portfolio turnover rate (excluding MDRs) | | | 274 | % | | | 241 | % | | | 350 | % | | | 540 | % | | | 598 | % |
| | | | | | | | | | | | | | | | | | | | |
See notes to financial statements.
| | |
F I N A N C I A L H I G H L I G H T S | | 131 |
| | |
| Notes to Financial Statements | | |
Master Total Return Portfolio (the “Master Portfolio”), a series of Master Bond LLC, is registered under the Investment Company Act of 1940, as amended (the “1940 Act”), as an open-end management investment company. The Master Bond LLC is organized as a Delaware limited liability company. The Master Portfolio is classified as diversified. The Limited Liability Company Agreement of the Master Bond LLC permits the Board of Directors of the Master Bond LLC (the “Board”) to issue nontransferable interests in the Master Bond LLC, subject to certain limitations.
The Master Portfolio, together with certain other registered investment companies advised by BlackRock Advisors, LLC (the “Manager”) or its affiliates, is included in a complex of non-index fixed-income mutual funds and all BlackRock-advised closed-end funds referred to as the BlackRock Fixed-Income Complex.
Basis of Consolidation: The accompanying consolidated financial statements of the Master Portfolio include the accounts of BlackRock Cayman Master Total Return Portfolio I, Ltd. (the “Subsidiary”) which was wholly-owned by the Master Portfolio. Effective November 30, 2018, the Master Portfolio no longer invested in the Subsidiary and on December 26, 2019 the Subsidiary was dissolved. The Subsidiary enabled Master Portfolio to hold commodity-related instruments and other derivatives and satisfy Regulated Investment Company (“RIC”) tax requirements.
| 2. | SIGNIFICANT ACCOUNTING POLICIES |
The financial statements are prepared in conformity with accounting principles generally accepted in the United States of America (“U.S. GAAP”), which may require management to make estimates and assumptions that affect the reported amounts of assets and liabilities in the financial statements, disclosure of contingent assets and liabilities at the date of the financial statements and the reported amounts of increases and decreases in net assets from operations during the reporting period. Actual results could differ from those estimates. The Master Portfolio is considered an investment company under U.S. GAAP and follows the accounting and reporting guidance applicable to investment companies. Below is a summary of significant accounting policies:
Investment Transactions and Income Recognition: For financial reporting purposes, investment transactions are recorded on the dates the transactions are executed. Realized gains and losses on investment transactions are determined on the identified cost basis. Dividend income and capital gain distributions, if any, are recorded on the ex-dividend date. Non-cash dividends, if any, are recorded on the ex-dividend date at fair value. Dividends from foreign securities where the ex-dividend date may have passed are subsequently recorded when the Master Portfolio is informed of the ex-dividend date. Under the applicable foreign tax laws, a withholding tax at various rates may be imposed on capital gains, dividends and interest. Upon notification from issuers, a portion of the dividend income received from a real estate investment trust may be redesignated as a reduction of cost of the related investment and/or realized gain. Interest income, including amortization and accretion of premiums and discounts on debt securities, is recognized on an accrual basis. For convertible securities, premiums attributable to the debt instrument are amortized, but premiums attributable to the conversion feature are not amortized.
Foreign Currency Translation: The Master Portfolio’s books and records are maintained in U.S. dollars. Securities and other assets and liabilities denominated in foreign currencies are translated into U.S. dollars using exchange rates determined as of the close of trading on the New York Stock Exchange (“NYSE”). Purchases and sales of investments are recorded at the rates of exchange prevailing on the respective dates of such transactions. Generally, when the U.S. dollar rises in value against a foreign currency, the investments denominated in that currency will lose value; the opposite effect occurs if the U.S. dollar falls in relative value.
The Master Portfolio does not isolate the effect of fluctuations in foreign exchange rates from the effect of fluctuations in the market prices of investments for financial reporting purposes. Accordingly, the effects of changes in exchange rates on investments are not segregated in the Statement of Operations from the effects of changes in market prices of those investments, but are included as a component of net realized and unrealized gain (loss) from investments. The Master Portfolio reports realized currency gains (losses) on foreign currency related transactions as components of net realized gain (loss) for financial reporting purposes, whereas such components are generally treated as ordinary income for U.S. federal income tax purposes.
Foreign Taxes: The Master Portfolio may be subject to foreign taxes (a portion of which may be reclaimable) on income, stock dividends, capital gains on investments, or certain foreign currency transactions. All foreign taxes are recorded in accordance with the applicable foreign tax regulations and rates that exist in the foreign jurisdictions in which the Master Portfolio invests. These foreign taxes, if any, are paid by the Master Portfolio and are reflected in its Statement of Operations as follows: foreign taxes withheld at source are presented as a reduction of income, foreign taxes on securities lending income are presented as a reduction of securities lending income, foreign taxes on stock dividends are presented as “Foreign taxes withheld”, and foreign taxes on capital gains from sales of investments and foreign taxes on foreign currency transactions are included in their respective net realized gain (loss) categories. Foreign taxes payable or deferred as of September 30, 2020, if any, are disclosed in the Statement of Assets and Liabilities.
Segregation and Collateralization: In cases where the Master Portfolio enters into certain investments (e.g., to-be-announced (“TBA”) sale commitments, futures contracts, forward foreign currency exchange contracts, options written, swaps and structured options) that would be treated as “senior securities” for 1940 Act purposes, the Master Portfolio may segregate or designate on its books and records cash or liquid assets having a market value at least equal to the amount of its future obligations under such investments. Doing so allows the investment or borrowings to be excluded from treatment as a “senior security.” Furthermore, if required by an exchange or counterparty agreement, the Master Portfolio may be required to deliver/deposit cash and/or securities to/with an exchange, or broker-dealer or custodian as collateral for certain investments or obligations.
Deferred Compensation Plan: Under the Deferred Compensation Plan (the “Plan”) approved by the Master Portfolio’s Board, the directors who are not “interested persons” of the Master Bond LLC, as defined in the 1940 Act (“Independent Directors”), may defer a portion of their annual complex-wide compensation. Deferred amounts earn an approximate return as though equivalent dollar amounts had been invested in common shares of certain funds in the BlackRock Fixed-Income Complex selected by the Independent Directors. This has the same economic effect for the Independent Directors as if the Independent Directors had invested the deferred amounts directly in certain funds in the BlackRock Fixed-Income Complex.
| | |
| 132 | | 2 0 2 0 B L A C K R O C K A N N U A L R E P O R T T O S H A R E H O L D E R S |
| | |
| Notes to Financial Statements (continued) | | |
The Plan is not funded and obligations thereunder represent general unsecured claims against the general assets of the Master Portfolio, as applicable. Deferred compensation liabilities, if any, are included in the Directors’ and Officer’s fees payable in the Statement of Assets and Liabilities and will remain as a liability of the Master Portfolio until such amounts are distributed in accordance with the Plan.
Recent Accounting Standards: The Master Portfolio has adopted Financial Accounting Standards Board Accounting Standards Update 2017-08 to amend the amortization period for certain purchased callable debt securities held at a premium. Under the new standard, the Master Portfolio has changed the amortization period for the premium on certain purchased callable debt securities with non-contingent call features to the earliest call date. In accordance with the transition provisions of the standard, the Master Portfolio applied the amendments on a modified retrospective basis beginning with the fiscal period ended September 30, 2020. The adjusted cost basis of securities at September 30, 2019 is $18,319,844,109.
Indemnifications: In the normal course of business, the Master Portfolio enters into contracts that contain a variety of representations that provide general indemnification. The Master Portfolio’s maximum exposure under these arrangements is unknown because it involves future potential claims against the Master Portfolio, which cannot be predicted with any certainty.
Other: Expenses directly related to the Master Portfolio are charged to the Master Portfolio. Other operating expenses shared by several funds, including other funds managed by the Manager, are prorated among those funds on the basis of relative net assets or other appropriate methods.
The Master Portfolio has an arrangement with its custodian whereby credits are earned on uninvested cash balances, which could be used to reduce custody fees and/or overdraft charges. The Master Portfolio may incur charges on overdrafts, subject to certain conditions.
| 3. | INVESTMENT VALUATION AND FAIR VALUE MEASUREMENTS |
Investment Valuation Policies: The Master Portfolio’s investments are valued at fair value (also referred to as “market value” within the financial statements) each day that the Master Portfolio is open for business and, for financial reporting purposes, as of the report date. U.S. GAAP defines fair value as the price the Master Portfolio would receive to sell an asset or pay to transfer a liability in an orderly transaction between market participants at the measurement date. The Master Portfolio determines the fair values of its financial instruments using various independent dealers or pricing services under policies approved by the Board. If a security’s market price is not readily available or does not otherwise accurately represent the fair value of the security, the security will be valued in accordance with a policy approved by the Board as reflecting fair value. The BlackRock Global Valuation Methodologies Committee (the “Global Valuation Committee”) is the committee formed by management to develop global pricing policies and procedures and to oversee the pricing function for all financial instruments.
Fair Value Inputs and Methodologies: The following methods and inputs are used to establish the fair value of the Master Portfolio’s assets and liabilities:
| | • | | Equity investments traded on a recognized securities exchange are valued at that day’s official closing price, as applicable, on the exchange where the stock is primarily traded. Equity investments traded on a recognized exchange for which there were no sales on that day may be valued at the last available bid (long positions) or ask (short positions) price. |
Generally, trading in foreign instruments is substantially completed each day at various times prior to the close of trading on the Master Portfolio’s listing exchange. Occasionally, events affecting the values of such instruments may occur between the foreign market close and the close of trading on the Master Portfolio’s listing exchange that may not be reflected in the computation of the Master Portfolio’s net assets. Each business day, the Master Portfolio uses a pricing service to assist with the valuation of certain foreign exchange-traded equity securities and foreign exchange-traded and over-the-counter (“OTC”) options (the “Systematic Fair Value Price”). Using current market factors, the Systematic Fair Value Price is designed to value such foreign securities and foreign options at fair value as of the close of trading on the NYSE, which follows the close of the local markets.
| | • | | Fixed-income investments for which market quotations are readily available are generally valued using the last available bid prices or current market quotations provided by independent dealers or third party pricing services. Floating rate loan interests are valued at the mean of the bid prices from one or more independent brokers or dealers as obtained from a third party pricing service. Pricing services generally value fixed-income securities assuming orderly transactions of an institutional round lot size, but a fund may hold or transact in such securities in smaller, odd lot sizes. Odd lots may trade at lower prices than institutional round lots. The pricing services may use matrix pricing or valuation models that utilize certain inputs and assumptions to derive values, including transaction data (e.g., recent representative bids and offers), market data, credit quality information, perceived market movements, news, and other relevant information. Certain fixed-income securities, including asset-backed and mortgage related securities may be valued based on valuation models that consider the estimated cash flows of each tranche of the entity, establish a benchmark yield and develop an estimated tranche specific spread to the benchmark yield based on the unique attributes of the tranche. The amortized cost method of valuation may be used with respect to debt obligations with sixty days or less remaining to maturity. |
| | • | | Investments in open-end U.S. mutual funds (including money market funds) are valued at that day’s published net asset value (“NAV”). |
| | • | | The Master Portfolio values its investment in SL Liquidity Series, LLC, Money Market Series (the “Money Market Series”) at fair value, which is ordinarily based upon its pro rata ownership in the underlying fund’s net assets. |
| | • | | Futures contracts are valued based on that day’s last reported settlement price on the exchange where the contract is traded. |
| | • | | Forward foreign currency exchange contracts are valued at the mean between the bid and ask prices and are determined as of the close of trading on the NYSE based on that day’s prevailing forward exchange rate for the underlying currencies. |
| | • | | Exchange-traded equity options for which market quotations are readily available will be valued at the National Best Bid and Offer quotes (“NBBO”). NBBO represents the mean of the bid and ask prices as quoted on the exchange on which such options are traded. In the event that there is no mean price available, the last bid (long |
| | |
N O T E S T O F I N A N C I A L S T A T E M E N T S | | 133 |
| | |
| Notes to Financial Statements (continued) | | |
| | positions) or ask (short positions) price will be used. If no bid or ask price is available, the prior day’s price may be used. OTC options and options on swaps (“swaptions”) are valued by an independent pricing service using a mathematical model, which incorporates a number of market data factors, such as the trades and prices of the underlying instruments. |
| | • | | Swap agreements are valued utilizing quotes received daily by independent pricing services or through brokers, which are derived using daily swap curves and models that incorporate a number of market data factors, such as discounted cash flows, trades and values of the underlying reference instruments. |
If events (e.g., a company announcement, market volatility or a natural disaster) occur that are expected to materially affect the value of such investment, or in the event that the application of these methods of valuation results in a price for an investment that is deemed not to be representative of the market value of such investment, or if a price is not available, the investment will be valued by the Global Valuation Committee, or its delegate, in accordance with a policy approved by the Board as reflecting fair value (“Fair Valued Investments”). The fair valuation approaches that may be used by the Global Valuation Committee will include market approach, income approach and cost approach. Valuation techniques such as discounted cash flow, use of market comparables and matrix pricing are types of valuation approaches and are typically used in determining fair value. When determining the price for Fair Valued Investments, the Global Valuation Committee, or its delegate, seeks to determine the price that the Master Portfolio might reasonably expect to receive or pay from the current sale or purchase of that asset or liability in an arm’s-length transaction. Fair value determinations shall be based upon all available factors that the Global Valuation Committee, or its delegate, deems relevant and consistent with the principles of fair value measurement. The pricing of all Fair Valued Investments is subsequently reported to the Board or a committee thereof on a quarterly basis.
For investments in equity or debt issued by privately held companies or funds (“Private Company” or collectively, the “Private Companies”) and other Fair Valued Investments, the fair valuation approaches that are used by the Global Valuation Committee and third party pricing services utilize one or a combination of, but not limited to, the following inputs.
| | |
| Standard Inputs Generally Considered By Third Party Pricing Services |
| |
Market approach | | (i) recent market transactions, including subsequent rounds of financing, in the underlying investment or comparable issuers; (ii) recapitalizations and other transactions across the capital structure; and (iii) market multiples of comparable issuers. |
| |
Income approach | | (i) future cash flows discounted to present and adjusted as appropriate for liquidity, credit and/or market risks; (ii) quoted prices for similar investments or assets in active markets; and (iii) other risk factors, such as interest rates, yield curves, volatilities, prepayment speeds, loss severities, credit risks, recovery rates, liquidation amounts and/or default rates. |
| |
Cost approach | | (i) audited or unaudited financial statements, investor communications and financial or operational metrics issued by the Private Company; (ii) changes in the valuation of relevant indices or publicly traded companies comparable to the Private Company; (iii) relevant news and other public sources; and (iv) known secondary market transactions in the Private Company’s interests and merger or acquisition activity in companies comparable to the Private Company. |
Investments in series of preferred stock issued by Private Companies are typically valued utilizing market approach in determining the enterprise value of the company. Such investments often contain rights and preferences that differ from other series of preferred and common stock of the same issuer. Valuation techniques such as an option pricing model (“OPM”), a probability weighted expected return model (“PWERM”) or a hybrid of those techniques are used in allocating enterprise value of the company, as deemed appropriate under the circumstances. The use of OPM and PWERM techniques involve a determination of the exit scenarios of the investment in order to appropriately allocate the enterprise value of the company among the various parts of its capital structure.
The Private Companies are not subject to the public company disclosure, timing, and reporting standards applicable to other investments held by the Master Portfolio. Typically, the most recently available information by a Private Company is as of a date that is earlier than the date the Master Portfolio is calculating its NAV. This factor may result in a difference between the value of the investment and the price the Master Portfolio could receive upon the sale of the investment.
Fair Value Hierarchy: Various inputs are used in determining the fair value of financial instruments. These inputs to valuation techniques are categorized into a fair value hierarchy consisting of three broad levels for financial reporting purposes as follows:
| • | | Level 1 – Unadjusted price quotations in active markets/exchanges for identical assets or liabilities that the Master Portfolio has the ability to access |
| • | | Level 2 – Other observable inputs (including, but not limited to, quoted prices for similar assets or liabilities in markets that are active, quoted prices for identical or similar assets or liabilities in markets that are not active, inputs other than quoted prices that are observable for the assets or liabilities (such as interest rates, yield curves, volatilities, prepayment speeds, loss severities, credit risks and default rates) or other market–corroborated inputs) |
| • | | Level 3 – Unobservable inputs based on the best information available in the circumstances, to the extent observable inputs are not available (including the Global Valuation Committee’s assumptions used in determining the fair value of financial instruments) |
The hierarchy gives the highest priority to unadjusted quoted prices in active markets for identical assets or liabilities (Level 1 measurements) and the lowest priority to unobservable inputs (Level 3 measurements). Accordingly, the degree of judgment exercised in determining fair value is greatest for instruments categorized in Level 3. The inputs used to measure fair value may fall into different levels of the fair value hierarchy. In such cases, for disclosure purposes, the fair value hierarchy classification is determined based on the lowest level input that is significant to the fair value measurement in its entirety. Investments classified within Level 3 have significant unobservable inputs used by the Global Valuation Committee in determining the price for Fair Valued Investments. Level 3 investments include equity or debt issued by Private Companies that may not have a secondary market, and/or may have a limited number of investors. The categorization of a value determined for financial instruments is based on the pricing transparency of the financial instruments and is not necessarily an indication of the risks associated with investing in those securities.
| | |
| 134 | | 2 0 2 0 B L A C K R O C K A N N U A L R E P O R T T O S H A R E H O L D E R S |
| | |
| Notes to Financial Statements (continued) | | |
As of September 30, 2020, certain investments of the Master Portfolio were fair valued using NAV per share as no quoted market value is available and therefore have been excluded from the fair value hierarchy.
| 4. | SECURITIES AND OTHER INVESTMENTS |
Asset-Backed and Mortgage-Backed Securities: Asset-backed securities are generally issued as pass-through certificates or as debt instruments. Asset-backed securities issued as pass-through certificates represent undivided fractional ownership interests in an underlying pool of assets. Asset-backed securities issued as debt instruments, which are also known as collateralized obligations, are typically issued as the debt of a special purpose entity organized solely for the purpose of owning such assets and issuing such debt. Asset-backed securities are often backed by a pool of assets representing the obligations of a number of different parties. The yield characteristics of certain asset-backed securities may differ from traditional debt securities. One such major difference is that all or a principal part of the obligations may be prepaid at any time because the underlying assets (i.e., loans) may be prepaid at any time. As a result, a decrease in interest rates in the market may result in increases in the level of prepayments as borrowers, particularly mortgagors, refinance and repay their loans. An increased prepayment rate with respect to an asset-backed security will have the effect of shortening the maturity of the security. In addition, the Master Portfolio may subsequently have to reinvest the proceeds at lower interest rates. If the Master Portfolio has purchased such an asset-backed security at a premium, a faster than anticipated prepayment rate could result in a loss of principal to the extent of the premium paid.
For mortgage pass-through securities (the “Mortgage Assets”) there are a number of important differences among the agencies and instrumentalities of the U.S. Government that issue mortgage-related securities and among the securities that they issue. For example, mortgage-related securities guaranteed by Ginnie Mae are guaranteed as to the timely payment of principal and interest by Ginnie Mae and such guarantee is backed by the full faith and credit of the United States. However, mortgage-related securities issued by Freddie Mac and Fannie Mae, including Freddie Mac and Fannie Mae guaranteed mortgage pass-through certificates, which are solely the obligations of Freddie Mac and Fannie Mae, are not backed by or entitled to the full faith and credit of the United States, but are supported by the right of the issuer to borrow from the U.S. Treasury.
Non-agency mortgage-backed securities are securities issued by non-governmental issuers and have no direct or indirect government guarantees of payment and are subject to various risks. Non-agency mortgage loans are obligations of the borrowers thereunder only and are not typically insured or guaranteed by any other person or entity. The ability of a borrower to repay a loan is dependent upon the income or assets of the borrower. A number of factors, including a general economic downturn, acts of God, terrorism, social unrest and civil disturbances, may impair a borrower’s ability to repay its loans.
Collateralized Debt Obligations: Collateralized debt obligations (“CDOs”), including collateralized bond obligations (“CBOs”) and collateralized loan obligations (“CLOs”), are types of asset-backed securities. ACDO is an entity that is backed by a diversified pool of debt securities (CBOs) or syndicated bank loans (CLOs). The cash flows of the CDO can be split into multiple segments, called “tranches,” which will vary in risk profile and yield. The riskiest segment is the subordinated or “equity” tranche. This tranche bears the greatest risk of defaults from the underlying assets in the CDO and serves to protect the other, more senior, tranches from default in all but the most severe circumstances. Since it is shielded from defaults by the more junior tranches, a “senior” tranche will typically have higher credit ratings and lower yields than their underlying securities, and often receive investment grade ratings from one or more of the nationally recognized rating agencies. Despite the protection from the more junior tranches, senior tranches can experience substantial losses due to actual defaults, increased sensitivity to future defaults and the disappearance of one or more protecting tranches as a result of changes in the credit profile of the underlying pool of assets.
Inflation-Indexed Bonds: Inflation-indexed bonds (other than municipal inflation-indexed and certain corporate inflation-indexed bonds) are fixed-income securities whose principal value is periodically adjusted according to the rate of inflation. If the index measuring inflation rises or falls, the principal value of inflation-indexed bonds (other than municipal inflation-indexed and certain corporate inflation-indexed bonds) will be adjusted upward or downward, and consequently the interest payable on these securities (calculated with respect to a larger or smaller principal amount) will be increased or reduced, respectively. Any upward or downward adjustment in the principal amount of an inflation-indexed bond will be included as interest income in the Statement of Operations, even though investors do not receive their principal until maturity. Repayment of the original bond principal upon maturity (as adjusted for inflation) is guaranteed in the case of U.S. Treasury inflation-indexed bonds. For bonds that do not provide a similar guarantee, the adjusted principal value of the bond repaid at maturity may be less than the original principal. With regard to municipal inflation-indexed bonds and certain corporate inflation-indexed bonds, the inflation adjustment is typically reflected in the semi-annual coupon payment. As a result, the principal value of municipal inflation-indexed bonds and such corporate inflation-indexed bonds does not adjust according to the rate of inflation.
Multiple Class Pass-Through Securities: Multiple class pass-through securities, including collateralized mortgage obligations (“CMOs”) and commercial mortgage-backed securities, may be issued by Ginnie Mae, U.S. Government agencies or instrumentalities or by trusts formed by private originators of, or investors in, mortgage loans. In general, CMOs are debt obligations of a legal entity that are collateralized by a pool of residential or commercial mortgage loans or mortgage assets. The payments on these are used to make payments on the CMOs or multiple pass-through securities. Multiple class pass-through securities represent direct ownership interests in the Mortgage Assets. Classes of CMOs include interest only (“IOs”), principal only (“POs”), planned amortization classes and targeted amortization classes. IOs and POs are stripped mortgage-backed securities representing interests in a pool of mortgages, the cash flow from which has been separated into interest and principal components. IOs receive the interest portion of the cash flow while POs receive the principal portion. IOs and POs can be extremely volatile in response to changes in interest rates. As interest rates rise and fall, the value of IOs tends to move in the same direction as interest rates. POs perform best when prepayments on the underlying mortgages rise since this increases the rate at which the principal is returned and the yield to maturity on the PO. When payments on mortgages underlying a PO are slower than anticipated, the life of the PO is lengthened and the yield to maturity is reduced. If the underlying Mortgage Assets experience greater than anticipated prepayments of principal, the Master Portfolio’s initial investment in the IOs may not fully recoup.
Stripped Mortgage-Backed Securities: Stripped mortgage-backed securities are typically issued by the U.S. Government, its agencies and instrumentalities. Stripped mortgage-backed securities are usually structured with two classes that receive different proportions of the interest (IOs) and principal (POs) distributions on a pool of Mortgage Assets. Stripped mortgage-backed securities may be privately issued.
Zero-Coupon Bonds: Zero-coupon bonds are normally issued at a significant discount from face value and do not provide for periodic interest payments. These bonds may experience greater volatility in market value than other debt obligations of similar maturity which provide for regular interest payments.
| | |
N O T E S T O F I N A N C I A L S T A T E M E N T S | | 135 |
| | |
| Notes to Financial Statements (continued) | | |
Capital Securities and Trust Preferred Securities: Capital securities, including trust preferred securities, are typically issued by corporations, generally in the form of interest-bearing notes with preferred securities characteristics. In the case of trust preferred securities, an affiliated business trust of a corporation issues these securities, generally in the form of beneficial interests in subordinated debentures or similarly structured securities. The securities can be structured with either a fixed or adjustable coupon that can have either a perpetual or stated maturity date. For trust preferred securities, the issuing bank or corporation pays interest to the trust, which is then distributed to holders of these securities as a dividend. Dividends can be deferred without creating an event of default or acceleration, although maturity cannot take place unless all cumulative payment obligations have been met. The deferral of payments does not affect the purchase or sale of these securities in the open market. These securities generally are rated below that of the issuing company’s senior debt securities and are freely callable at the issuer’s option.
Preferred Stocks: Preferred stock has a preference over common stock in liquidation (and generally in receiving dividends as well), but is subordinated to the liabilities of the issuer in all respects. As a general rule, the market value of preferred stock with a fixed dividend rate and no conversion element varies inversely with interest rates and perceived credit risk, while the market price of convertible preferred stock generally also reflects some element of conversion value. Because preferred stock is junior to debt securities and other obligations of the issuer, deterioration in the credit quality of the issuer will cause greater changes in the value of a preferred stock than in a more senior debt security with similar stated yield characteristics. Unlike interest payments on debt securities, preferred stock dividends are payable only if declared by the issuer’s board of directors. Preferred stock also may be subject to optional or mandatory redemption provisions.
Floating Rate Loan Interests: Floating rate loan interests are typically issued to companies (the “borrower”) by banks, other financial institutions, or privately and publicly offered corporations (the “lender”). Floating rate loan interests are generally non-investment grade, often involve borrowers whose financial condition is troubled or uncertain and companies that are highly leveraged or in bankruptcy proceedings. In addition, transactions in floating rate loan interests may settle on a delayed basis, which may result in proceeds from the sale not being readily available for a fund to make additional investments or meet its redemption obligations. Floating rate loan interests may include fully funded term loans or revolving lines of credit. Floating rate loan interests are typically senior in the corporate capital structure of the borrower. Floating rate loan interests generally pay interest at rates that are periodically determined by reference to a base lending rate plus a premium. Since the rates reset only periodically, changes in prevailing interest rates (and particularly sudden and significant changes) can be expected to cause some fluctuations in the NAV of a fund to the extent that it invests in floating rate loan interests. The base lending rates are generally the lending rate offered by one or more European banks, such as the London Interbank Offered Rate (“LIBOR”), the prime rate offered by one or more U.S. banks or the certificate of deposit rate. Floating rate loan interests may involve foreign borrowers, and investments may be denominated in foreign currencies. These investments are treated as investments in debt securities for purposes of a fund’s investment policies.
When a fund purchases a floating rate loan interest, it may receive a facility fee and when it sells a floating rate loan interest, it may pay a facility fee. On an ongoing basis, a fund may receive a commitment fee based on the undrawn portion of the underlying line of credit amount of a floating rate loan interest. Facility and commitment fees are typically amortized to income over the term of the loan or term of the commitment, respectively. Consent and amendment fees are recorded to income as earned. Prepayment penalty fees, which may be received by a fund upon the prepayment of a floating rate loan interest by a borrower, are recorded as realized gains. A fund may invest in multiple series or tranches of a loan. A different series or tranche may have varying terms and carry different associated risks.
Floating rate loan interests are usually freely callable at the borrower’s option. A fund may invest in such loans in the form of participations in loans (“Participations”) or assignments (“Assignments”) of all or a portion of loans from third parties. Participations typically will result in a fund having a contractual relationship only with the lender, not with the borrower. A fund has the right to receive payments of principal, interest and any fees to which it is entitled only from the lender selling the Participation and only upon receipt by the lender of the payments from the borrower. In connection with purchasing Participations, a fund generally will have no right to enforce compliance by the borrower with the terms of the loan agreement, nor any rights of offset against the borrower. A fund may not benefit directly from any collateral supporting the loan in which it has purchased the Participation. As a result, a fund assumes the credit risk of both the borrower and the lender that is selling the Participation. A fund’s investment in loan participation interests involves the risk of insolvency of the financial intermediaries who are parties to the transactions. In the event of the insolvency of the lender selling the Participation, a fund may be treated as a general creditor of the lender and may not benefit from any offset between the lender and the borrower. Assignments typically result in a fund having a direct contractual relationship with the borrower, and a fund may enforce compliance by the borrower with the terms of the loan agreement.
In connection with floating rate loan interests, the Master Portfolio may also enter into unfunded floating rate loan interests (“commitments”). In connection with these commitments, the Master Portfolio earns a commitment fee, typically set as a percentage of the commitment amount. Such fee income, which is included in interest income in the Statement of Operations, is recognized ratably over the commitment period. Unfunded floating rate loan interests are marked-to-market daily, and any unrealized appreciation (depreciation) is included in the Statement of Assets and Liabilities and Statement of Operations. As of period end, the Master Portfolio had the following unfunded floating rate loan interests:
| | | | | | | | | | | | | | | | |
| Borrower | | Par | | | Commitment Amount | | | Value | | | Unrealized Appreciation (Depreciation) | |
BRE Park Avenue Tower Owner LLC, Mezzanine A Loan | | | $ 528,064 | | | | $ 528,064 | | | | $ 525,899 | | | | $ (2,165 | ) |
BSREP II Houston Office 1HC Owner LLC, Mezzanine Loan | | | 2,427,176 | | | | 2,427,176 | | | | 2,416,739 | | | | (10,437 | ) |
Burlingame Point LLC, Construction Loan | | | 3,643,982 | | | | 3,645,574 | | | | 3,643,982 | | | | (1,592 | ) |
Intelsat Jackson Holdings SA, DIP Facility | | | 1,289,490 | | | | 1,271,338 | | | | 1,309,903 | | | | 38,565 | |
Spectacle Gary Holdings LLC, Delayed Draw Term Loan. | | | 1,006,419 | | | | 1,006,419 | | | | 951,700 | | | | (54,719 | ) |
Forward Commitments, When-Issued and Delayed Delivery Securities: The Master Portfolio may purchase securities on a when-issued basis and may purchase or sell securities on a forward commitment basis. Settlement of such transactions normally occurs within a month or more after the purchase or sale commitment is made. The Master Portfolio may purchase securities under such conditions with the intention of actually acquiring them, but may enter into a separate agreement to sell the securities before the settlement date. Since the value of securities purchased may fluctuate prior to settlement, the Master Portfolio may be required to pay more at settlement than the security is worth. In addition, the Master Portfolio is not entitled to any of the interest earned prior to settlement. When purchasing a security on a delayed delivery basis, the Master Portfolio assumes the rights and risks of ownership of the security, including the risk of price and yield fluctuations. In the event of default by the counterparty, the Master Portfolio’s maximum amount of loss is the unrealized appreciation of unsettled when-issued transactions.
| | |
| 136 | | 2 0 2 0 B L A C K R O C K A N N U A L R E P O R T T O S H A R E H O L D E R S |
| | |
| Notes to Financial Statements (continued) | | |
TBA Commitments: TBA commitments are forward agreements for the purchase or sale of mortgage-backed securities for a fixed price, with payment and delivery on an agreed upon future settlement date. The specific securities to be delivered are not identified at the trade date. However, delivered securities must meet specified terms, including issuer, rate and mortgage terms. When entering into TBA commitments, the Master Portfolio may take possession of or deliver the underlying mortgage-backed securities but can extend the settlement or roll the transaction. TBA commitments involve a risk of loss if the value of the security to be purchased or sold declines or increases, respectively, prior to settlement date.
In order to better define contractual rights and to secure rights that will help the Master Portfolio mitigate its counterparty risk, TBA commitments may be entered into by the Master Portfolio under Master Securities Forward Transaction Agreements (each, an “MSFTA”). An MSFTA typically contains, among other things, collateral posting terms and netting provisions in the event of default and/or termination event. The collateral requirements are typically calculated by netting the mark-to-market amount for each transaction under such agreement and comparing that amount to the value of the collateral currently pledged by the Master Portfolio and the counterparty. Cash collateral that has been pledged to cover the obligations of the Master Portfolio and cash collateral received from the counterparty, if any, is reported separately in the Statement of Assets and Liabilities as cash pledged as collateral for TBA commitments or cash received as collateral for TBA commitments, respectively. Non-cash collateral pledged by the Master Portfolio, if any, is noted in the Schedule of Investments. Typically, the Master Portfolio is permitted to sell, re-pledge or use the collateral it receives; however, the counterparty is not permitted to do so. To the extent amounts due to the Master Portfolio are not fully collateralized, contractually or otherwise, the Master Portfolio bears the risk of loss from counterparty non-performance.
Mortgage Dollar Roll Transactions: The Master Portfolio may sell TBA mortgage-backed securities and simultaneously contract to repurchase substantially similar (i.e., same type, coupon and maturity) securities on a specific future date at an agreed upon price. During the period between the sale and repurchase, a fund is not entitled to receive interest and principal payments on the securities sold. Mortgage dollar roll transactions are treated as purchases and sales and realizes gains and losses on these transactions. Mortgage dollar rolls involve the risk that the market value of the securities that a fund is required to purchase may decline below the agreed upon repurchase price of those securities.
Securities Lending: The Master Portfolio may lend its securities to approved borrowers, such as brokers, dealers and other financial institutions. The borrower pledges and maintains with the Master Portfolio collateral consisting of cash, an irrevocable letter of credit issued by a bank, or securities issued or guaranteed by the U.S. Government. The initial collateral received by the Master Portfolio is required to have a value of at least 102% of the current value of the loaned securities for securities traded on U.S. exchanges and a value of at least 105% for all other securities. The collateral is maintained thereafter at a value equal to at least 100% of the current market value of the securities on loan. The market value of the loaned securities is determined at the close of each business day of the Master Portfolio and any additional required collateral is delivered to the Master Portfolio, or excess collateral returned by the Master Portfolio, on the next business day. During the term of the loan, the Master Portfolio is entitled to all distributions made on or in respect of the loaned securities, but does not receive interest income on securities received as collateral. Loans of securities are terminable at any time and the borrower, after notice, is required to return borrowed securities within the standard time period for settlement of securities transactions.
The market value of any securities on loan, all of which were classified as investment companies in the Master Portfolio’s Schedule of Investments, and the value of any related collateral are shown separately in the Statement of Assets and Liabilities as a component of investments at value – unaffiliated, and collateral on securities loaned at value, respectively. As of period end, any securities on loan were collateralized by cash and/or U.S. Government obligations. Cash collateral invested by the securities lending agent, BlackRock Investment Management, LLC (“BIM”), if any, is disclosed in the Schedule of Investments.
Securities lending transactions are entered into by the Master Portfolio under Master Securities Lending Agreements (each, an “MSLA”), which provide the right, in the event of default (including bankruptcy or insolvency), for the non-defaulting party to liquidate the collateral and calculate a net exposure to the defaulting party or request additional collateral. In the event that a borrower defaults, the Master Portfolio, as lender, would offset the market value of the collateral received against the market value of the securities loaned. When the value of the collateral is greater than that of the market value of the securities loaned, the lender is left with a net amount payable to the defaulting party. However, bankruptcy or insolvency laws of a particular jurisdiction may impose restrictions on or prohibitions against such a right of offset in the event of an MSLA counterparty’s bankruptcy or insolvency. Under the MSLA, absent an event of default, the borrower can resell or re-pledge the loaned securities, and the Master Portfolio can reinvest cash collateral received in connection with loaned securities. Upon an event of default, the parties’ obligations to return the securities or collateral to the other party are extinguished, and the parties can resell or re-pledge the loaned securities or the collateral received in connection with the loaned securities in order to satisfy the defaulting party’s net payment obligation for all transactions under the MSLA. The defaulting party remains liable for any deficiency.
As of period end, the following table is a summary of the Master Portfolio’s securities on loan by counterparty which are subject to offset under an MSLA:
| | | | | | | | | | | | | | | | | | | | | | | | | | |
| |
Counterparty | |
| Securities
Loaned at Value |
| |
| Cash
Collateral Received(a) | |
| Net
Amount |
|
| |
Citigroup Global Markets, Inc. | | | | | | | $41,950,000 | | | | | | | | $(41,950,000) | | | | | | | | | | $— | |
Credit Suisse Securities (USA) LLC | | | | | | | 813,306 | | | | | | | | (813,306) | | | | | | | | | | — | |
J.P. Morgan Securities LLC | | | | | | | 604,847 | | | | | | | | (604,847) | | | | | | | | | | — | |
Jefferies LLC. | | | | | | | 12,366,860 | | | | | | | | (12,366,860) | | | | | | | | | | — | |
| | | | | | | | | | | | | | | | | | | | | | | | | | |
| | | | | | | $55,735,013 | | | | | | | | $(55,735,013) | | | | | | | | | | $— | |
| | | | | | | | | | | | | | | | | | | | | | | | | | |
| (a) | Collateral received in excess of the market value of securities on loan is not presented in this table. The total cash collateral received by the Master Portfolio is disclosed in the Master Portfolio’s Statement of Assets and Liabilities. |
| | |
N O T E S T O F I N A N C I A L S T A T E M E N T S | | 137 |
| | |
| Notes to Financial Statements (continued) | | |
The risks of securities lending include the risk that the borrower may not provide additional collateral when required or may not return the securities when due. To mitigate these risks, the Master Portfolio benefits from a borrower default indemnity provided by BIM. BIM’s indemnity allows for full replacement of the securities loaned to the extent the collateral received does not cover the value on the securities loaned in the event of borrower default. The Master Portfolio could incur a loss if the value of an investment purchased with cash collateral falls below the market value of loaned securities or if the value of an investment purchased with cash collateral falls below the value of the original cash collateral received. Such losses are borne entirely by the Master Portfolio.
| 5. | DERIVATIVE FINANCIAL INSTRUMENTS |
The Master Portfolio engages in various portfolio investment strategies using derivative contracts both to increase the returns of the Master Portfolio and/or to manage its exposure to certain risks such as credit risk, equity risk, interest rate risk, foreign currency exchange rate risk, commodity price risk or other risks (e.g., inflation risk). Derivative financial instruments categorized by risk exposure are included in the Schedule of Investments. These contracts may be transacted on an exchange or OTC.
Futures Contracts: Futures contracts are purchased or sold to gain exposure to, or manage exposure to, changes in interest rates (interest rate risk) and changes in the value of equity securities (equity risk) or foreign currencies (foreign currency exchange rate risk).
Futures contracts are agreements between the Master Portfolio and a counterparty to buy or sell a specific quantity of an underlying instrument at a specified price and on a specified date. Depending on the terms of a contract, it is settled either through physical delivery of the underlying instrument on the settlement date or by payment of a cash amount on the settlement date. Upon entering into a futures contract, the Master Portfolio is required to deposit initial margin with the broker in the form of cash or securities in an amount that varies depending on a contract’s size and risk profile. The initial margin deposit must then be maintained at an established level over the life of the contract. Amounts pledged, which are considered restricted, are included in cash pledged for futures contracts in the Statement of Assets and Liabilities.
Securities deposited as initial margin are designated in the Schedule of Investments and cash deposited, if any, are shown as cash pledged for futures contracts in the Statement of Assets and Liabilities. Pursuant to the contract, the Master Portfolio agrees to receive from or pay to the broker an amount of cash equal to the daily fluctuation in market value of the contract (“variation margin”). Variation margin is recorded as unrealized appreciation (depreciation) and, if any, shown as variation margin receivable (or payable) on futures contracts in the Statement of Assets and Liabilities. When the contract is closed, a realized gain or loss is recorded in the Statement of Operations equal to the difference between the notional amount of the contract at the time it was opened and the notional amount at the time it was closed. The use of futures contracts involves the risk of an imperfect correlation in the movements in the price of futures contracts and interest, foreign currency exchange rates or underlying assets.
Forward Foreign Currency Exchange Contracts: Forward foreign currency exchange contracts are entered into to gain or reduce exposure to foreign currencies (foreign currency exchange rate risk).
A forward foreign currency exchange contract is an agreement between two parties to buy and sell a currency at a set exchange rate on a specified date. These contracts help to manage the overall exposure to the currencies in which some of the investments held by the Master Portfolio are denominated and in some cases, may be used to obtain exposure to a particular market.
The contract is marked-to-market daily and the change in market value is recorded as unrealized appreciation (depreciation) in the Statement of Assets and Liabilities. When a contract is closed, a realized gain or loss is recorded in the Statement of Operations equal to the difference between the value at the time it was opened and the value at the time it was closed. Non-deliverable forward foreign currency exchange contracts are settled with the counterparty in cash without the delivery of foreign currency. The use of forward foreign currency exchange contracts involves the risk that the value of a forward foreign currency exchange contract changes unfavorably due to movements in the value of the referenced foreign currencies, and such value may exceed the amounts reflected in the Statement of Assets and Liabilities. Cash amounts pledged for forward foreign currency exchange contracts are considered restricted and are included in cash pledged as collateral for OTC derivatives in the Statement of Assets and Liabilities.
Options: The Master Portfolio purchases and writes call and put options to increase or decrease its exposure to the risks of underlying instruments, including equity risk, interest rate risk and/or commodity price risk and/or, in the case of options written, to generate gains from options premiums.
A call option gives the purchaser (holder) of the option the right (but not the obligation) to buy, and obligates the seller (writer) to sell (when the option is exercised) the underlying instrument at the exercise or strike price at any time or at a specified time during the option period. A put option gives the holder the right to sell and obligates the writer to buy the underlying instrument at the exercise or strike price at any time or at a specified time during the option period.
Premiums paid on options purchased and premiums received on options written, as well as the daily fluctuation in market value, are included in investments at value –unaffiliated and options written at value, respectively, in the Statement of Assets and Liabilities. When an instrument is purchased or sold through the exercise of an option, the premium is offset against the cost or proceeds of the underlying instrument. When an option expires, a realized gain or loss is recorded in the Statement of Operations to the extent of the premiums received or paid. When an option is closed or sold, a gain or loss is recorded in the Statement of Operations to the extent the cost of the closing transaction exceeds the premiums received or paid. When the Master Portfolio writes a call option, such option is typically “covered,” meaning that it holds the underlying instrument subject to being called by the option counterparty. When the Master Portfolio writes a put option, cash is segregated in an amount sufficient to cover the obligation. These amounts, which are considered restricted, are included in cash pledged as collateral for options written in the Statement of Assets and Liabilities.
| | • | | Swaptions – The Master Portfolio purchases and writes swaptions primarily to preserve a return or spread on a particular investment or portion of the Master Portfolio’s holdings, as a duration management technique or to protect against an increase in the price of securities it anticipates purchasing at a later date. The purchaser and writer of a swaption is buying or granting the right to enter into a previously agreed upon interest rate or credit default swap agreement (interest rate risk and/or credit risk) at any time before the expiration of the option. |
| | • | | Interest rate caps and floors – Interest rate caps and floors are entered into to gain or reduce exposure to interest rates (interest rate risk and/or other risk). Caps are agreements whereby one party agrees to make payments to the other, in return for a premium, to the extent that interest rate indexes exceed a specified rate, or “cap.” Floors are agreements whereby one party agrees to make payments to the other, in return for a premium, to the extent that interest rate indexes fall below a specified rate, or “floor.” The maximum potential amount of future payments that the Master Portfolio would be required to make under an interest rate cap would be the notional amount times the percentage increase in interest rates determined by the difference between the interest rate index current value and the value at the time the cap was entered into. |
| | |
| 138 | | 2 0 2 0 B L A C K R O C K A N N U A L R E P O R T T O S H A R E H O L D E R S |
| | |
| Notes to Financial Statements (continued) | | |
| | • | | Foreign currency options – The Master Portfolio purchases and writes foreign currency options, foreign currency futures and options on foreign currency futures to gain or reduce exposure to foreign currencies (foreign currency exchange rate risk). Foreign currency options give the purchaser the right to buy from or sell to the writer a foreign currency at any time before the expiration of the option. |
| | • | | Barrier options – The Master Portfolio may purchases and writes a variety of options with non-standard payout structures or other features (“barrier options”) that are generally traded OTC. |
The Master Portfolio may invest in various types of barrier options, including down-and-out options, down-and-in options, double no-touch options, one-touch options, up-and-out options and up-and-in options. Down-and-out options expire worthless to the purchaser if the price of the underlying instrument falls below a specific barrier price level prior to the expiration date. Down-and-in options expire worthless to the purchaser unless the price of the underlying instrument falls below a specific barrier price level prior to the expiration date. Double no-touch options provide the purchaser an agreed-upon payout if the price of the underlying instrument does not reach or surpass predetermined barrier price levels prior to the option’s expiration date. One-touch options provide the purchaser an agreed-upon payout if the price of the underlying instrument reaches or surpasses predetermined barrier price levels prior to the expiration date. Up-and-out options expire worthless to the purchaser if the price of the underlying instrument increases beyond a predetermined barrier price level prior to the expiration date. Up-and-in options can only be exercised when the price of the underlying instrument increases beyond a predetermined barrier price level.
| | • | | Structured options – The Master Portfolio invests in structured options to increase or decrease its exposure to an underlying index or group of securities (equity risk). |
These options may consist of single or multiple OTC options which are priced as a single instrument. They may only be exercised at the expiration date, but may be transferred/sold prior to the expiration date. The value of a structured option may either increase or decrease with the underlying index or group of securities, depending on the combination of options used. Structured options are issued in units whereby each unit represents a structure based on the specific index with an initial reference strike price. One type of structure involves the combination of selling a put while buying a call on a specific index. This option would rise in value as the underlying index increases and fall in value as the underlying index decreases. Alternatively, another structure involves the sale of a call and the purchase of a put. This option structure would rise in value as the underlying index decreases and fall in value as the underlying index increases. Upon the exercise of the structured option, the Master Portfolio will receive a payment from, or be required to remit a payment to, the counterparty depending on the value of the underlying index at exercise.
In purchasing and writing options, the Master Portfolio bears the risk of an unfavorable change in the value of the underlying instrument or the risk that it may not be able to enter into a closing transaction due to an illiquid market. Exercise of a written option could result in the Master Portfolio purchasing or selling a security when it otherwise would not, or at a price different from the current market value.
Swaps: Swap contracts are entered into to manage exposure to issuers, markets and securities. Such contracts are agreements between the Master Portfolio and a counterparty to make periodic net payments on a specified notional amount or a net payment upon termination. Swap agreements are privately negotiated in the OTC market and may be entered into as a bilateral contract (“OTC swaps”) or centrally cleared (“centrally cleared swaps”).
For OTC swaps, any upfront premiums paid and any upfront fees received are shown as swap premiums paid and swap premiums received, respectively, in the Statement of Assets and Liabilities and amortized over the term of the contract. The daily fluctuation in market value is recorded as unrealized appreciation (depreciation) on OTC Swaps in the Statement of Assets and Liabilities. Payments received or paid are recorded in the Statement of Operations as realized gains or losses, respectively. When an OTC swap is terminated, a realized gain or loss is recorded in the Statement of Operations equal to the difference between the proceeds from (or cost of) the closing transaction and the Master Portfolio’s basis in the contract, if any. Generally, the basis of the contract is the premium received or paid.
In a centrally cleared swap, immediately following execution of the swap contract, the swap contract is novated to a central counterparty (the “CCP”) and the Master Portfolio’s counterparty on the swap agreement becomes the CCP. The Master Portfolio is required to interface with the CCP through the broker. Upon entering into a centrally cleared swap, the Master Portfolio is required to deposit initial margin with the broker in the form of cash or securities in an amount that varies depending on the size and risk profile of the particular swap. Securities deposited as initial margin are designated in the Schedule of Investments and cash deposited is shown as cash pledged for centrally cleared swaps in the Statement of Assets and Liabilities. Amounts pledged, which are considered restricted cash, are included in cash pledged for centrally cleared swaps in the Statement of Assets and Liabilities. Pursuant to the contract, the Master Portfolio agrees to receive from or pay to the broker variation margin. Variation margin is recorded as unrealized appreciation (depreciation) and shown as variation margin receivable (or payable) on centrally cleared swaps in the Statement of Assets and Liabilities. Payments received from (paid to) the counterparty, including at termination, are recorded as realized gains (losses) in the Statement of Operations.
| | • | | Credit default swaps — Credit default swaps are entered into to manage exposure to the market or certain sectors of the market, to reduce risk exposure to defaults of corporate and/or sovereign issuers or to create exposure to corporate and/or sovereign issuers to which a fund is not otherwise exposed (credit risk). |
The Master Portfolio may either buy or sell (write) credit default swaps on single-name issuers (corporate or sovereign), a combination or basket of single-name issuers or traded indexes. Credit default swaps are agreements in which the protection buyer pays fixed periodic payments to the seller in consideration for a promise from the protection seller to make a specific payment should a negative credit event take place with respect to the referenced entity (e.g., bankruptcy, failure to pay, obligation acceleration, repudiation, moratorium or restructuring). As a buyer, if an underlying credit event occurs, the Master Portfolio will either (i) receive from the seller an amount equal to the notional amount of the swap and deliver the referenced security or underlying securities comprising the index, or (ii) receive a net settlement of cash equal to the notional amount of the swap less the recovery value of the security or underlying securities comprising the index. As a seller (writer), if an underlying credit event
| | |
N O T E S T O F I N A N C I A L S T A T E M E N T S | | 139 |
| | |
| Notes to Financial Statements (continued) | | |
occurs, the Master Portfolio will either pay the buyer an amount equal to the notional amount of the swap and take delivery of the referenced security or underlying securities comprising the index or pay a net settlement of cash equal to the notional amount of the swap less the recovery value of the security or underlying securities comprising the index.
| | • | | Total return swaps — Total return swaps are entered into to obtain exposure to a security or market without owning such security or investing directly in such market or to exchange the risk/return of one security or market (e.g., fixed-income) with another security or market (e.g., equity or commodity prices) (equity risk, commodity price risk and/or interest rate risk). |
Total return swaps are agreements in which there is an exchange of cash flows whereby one party commits to make payments based on the total return (distributions plus capital gains/losses) of an underlying instrument, or basket of underlying instruments, in exchange for fixed or floating rate interest payments. If the total return of the instrument(s) or index underlying the transaction exceeds or falls short of the offsetting fixed or floating interest rate obligation, the Master Portfolio receives payment from or makes a payment to the counterparty.
Certain total return swaps are designed to function as a portfolio of direct investments in long and short equity positions. This means that the Master Portfolio has the ability to trade in and out of these long and short positions within the swap and will receive the economic benefits and risks equivalent to direct investment in these positions, subject to certain adjustments due to events related to the counterparty. Benefits and risks include capital appreciation (depreciation), corporate actions and dividends received and paid, all of which are reflected in the swap’s market value. The market value also includes interest charges and credits (“financing fees”) related to the notional values of the long and short positions and cash balances within the swap. These interest charges and credits are based on a specified benchmark rate plus or minus a specified spread determined based upon the country and/or currency of the positions in the Master Portfolio.
Positions within the swap and financing fees are reset periodically. During a reset, any unrealized appreciation (depreciation) on positions and accrued financing fees become available for cash settlement between the Master Portfolio and the counterparty. The amounts that are available for cash settlement are recorded as realized gains or losses in the Statement of Operations. Cash settlement in and out of the swap may occur at a reset date or any other date, at the discretion of the Master Portfolio and the counterparty, over the life of the agreement. Certain swaps have no stated expiration and can be terminated by either party at any time.
| | • | | Interest rate swaps — Interest rate swaps are entered into to gain or reduce exposure to interest rates or to manage duration, the yield curve or interest rate (interest rate risk). |
Interest rate swaps are agreements in which one party pays a stream of interest payments, either fixed or floating, in exchange for another party’s stream of interest payments, either fixed or floating, on the same notional amount for a specified period of time. In more complex interest rate swaps, the notional principal amount may decline (or amortize) over time.
| | • | | Currency swaps — Currency swaps are entered into to gain or reduce exposure to foreign currencies (foreign currency exchange rate risk). |
Currency swaps are interest rate swaps in which one party pays a stream of interest payments, either fixed or floating, in exchange for another party’s stream of interest payments, either fixed or floating, based on the notional amounts of two different currencies. The notional amounts are typically determined based on the spot exchange rates at the inception of the trade. Currency swaps may also involve an exchange of notional amounts at the start, during and/or at expiration of the contract, either at the current spot rate or another specified rate.
| | • | | Forward swaps — The Master Portfolio enters into forward interest rate swaps and forward total return swaps. In a forward swap, the Master Portfolio and the counterparty agree to make periodic net payments beginning on a specified date or a net payment at termination. |
| | • | | Inflation swaps — Inflation swaps are entered into to gain or reduce exposure to inflation (inflation risk). In an inflation swap, one party makes fixed interest payments on a notional principal amount in exchange for another party’s variable payments based on an inflation index, such as the Consumer Price Index. |
Swap transactions involve, to varying degrees, elements of interest rate, credit and market risk in excess of the amounts recognized in the Statement of Assets and Liabilities. Such risks involve the possibility that there will be no liquid market for these agreements, that the counterparty to the agreements may default on its obligation to perform or disagree as to the meaning of the contractual terms in the agreements, and that there may be unfavorable changes in interest rates and/or market values associated with these transactions.
Master Netting Arrangements: In order to define its contractual rights and to secure rights that will help it mitigate its counterparty risk, the Master Portfolio may enter into an International Swaps and Derivatives Association, Inc. Master Agreement (“ISDA Master Agreement”) or similar agreement with its counterparties. An ISDA Master Agreement is a bilateral agreement between the Master Portfolio and a counterparty that governs certain OTC derivatives and typically contains, among other things, collateral posting terms and netting provisions in the event of a default and/or termination event. Under an ISDA Master Agreement, the Master Portfolio may, under certain circumstances, offset with the counterparty certain derivative financial instruments’ payables and/or receivables with collateral held and/or posted and create one single net payment. The provisions of the ISDA Master Agreement typically permit a single net payment in the event of default including the bankruptcy or insolvency of the counterparty. When the Master Portfolio enters into an ISDA Master Agreement and an MRA and/or MSLA with the same counterparty, the agreements may contain a set-off provision allowing the Master Portfolio to offset a net amount payable with amounts due to the Master Portfolio upon default of the counterparty. Bankruptcy or insolvency laws of a particular jurisdiction may restrict or prohibit the right of offset in bankruptcy, insolvency or other events. For example, notwithstanding what contractual rights may be included in an ISDA Master Agreement, such laws may prohibit the Master Portfolio from setting off amounts owed to a defaulting counterparty under an ISDA Master Agreement against amounts owed to the Master Portfolio by affiliates of the defaulting counterparty. The insolvency regimes of many jurisdictions do, however, generally permit set-off of simultaneous payables and receivables under certain types of financial contracts between the same legal entity upon a default of the entity, regardless of the existence of a contractual set-off right in those contracts.
Collateral Requirements: For derivatives traded under an ISDA Master Agreement, the collateral requirements are typically calculated by netting the mark-to-market amount for each transaction under such agreement and comparing that amount to the value of any collateral currently pledged by the Master Portfolio and the counterparty.
| | |
| 140 | | 2 0 2 0 B L A C K R O C K A N N U A L R E P O R T T O S H A R E H O L D E R S |
| | |
| Notes to Financial Statements (continued) | | |
Cash collateral that has been pledged to cover obligations of the Master Portfolio and cash collateral received from the counterparty, if any, is reported separately in the Statement of Assets and Liabilities as cash pledged as collateral and cash received as collateral, respectively. Non-cash collateral pledged by the Master Portfolio, if any, is noted in the Schedule of Investments. Generally, the amount of collateral due from or to a counterparty is subject to a certain minimum transfer amount threshold before a transfer is required, which is determined at the close of business of the Master Portfolio. Any additional required collateral is delivered to/pledged by the Master Portfolio on the next business day. Typically, the counterparty is not permitted to sell, re-pledge or use cash and non-cash collateral it receives. The Master Portfolio generally agrees not to use non-cash collateral that it receives but may, absent default or certain other circumstances defined in the underlying ISDA Master Agreement, be permitted to use cash collateral received. In such cases, interest may be paid pursuant to the collateral arrangement with the counterparty. To the extent amounts due to the Master Portfolio from its counterparties are not fully collateralized, it bears the risk of loss from counterparty non-performance. Likewise, to the extent the Master Portfolio has delivered collateral to a counterparty and stands ready to perform under the terms of its agreement with such counterparty, it bears the risk of loss from a counterparty in the amount of the value of the collateral in the event the counterparty fails to return such collateral. Based on the terms of agreements, collateral may not be required for all derivative contracts.
For financial reporting purposes, the Master Portfolio does not offset derivative assets and derivative liabilities that are subject to netting arrangements, if any, in the Statement of Assets and Liabilities.
| 6. | INVESTMENT ADVISORY AGREEMENT AND OTHER TRANSACTIONS WITH AFFILIATES |
Investment Advisory: The Master Bond LLC, on behalf of the Master Portfolio, entered into an Investment Advisory Agreement with the Manager, the Master Portfolio’s investment adviser and an indirect, wholly-owned subsidiary of BlackRock, Inc. (“BlackRock”), to provide investment advisory and administrative services. The Manager is responsible for the management of the Master Portfolio’s portfolio and provides the personnel, facilities, equipment and certain other services necessary to the operations of the Master Portfolio.
For such services, the Master Portfolio pays the Manager a monthly fee at an annual rate equal to the following percentages of the average daily value of the Master Portfolio’s net assets:
| | | | |
| | |
| Average Daily Net Assets | | Investment Advisory Fees | |
| |
First $250 million | | | 0.16 | % |
$250 million — $500 million | | | 0.12 | |
$500 million — $750 million | | | 0.08 | |
Greater than $750 million | | | 0.05 | |
With respect to the Master Portfolio, the Manager entered into separate sub-advisory agreements with BlackRock International Limited (“BIL”) and BlackRock (Singapore) Limited (“BRS”), each an affiliate of the Manager. The Manager pays BIL and BRS for services they provide, for that portion of the Master Portfolio for which BIL and BRS, as applicable, act as sub-adviser, a monthly fee that is equal to a percentage of the investment advisory fees paid by the Master Portfolio to the Manager.
Expense Waivers and Reimbursements: With respect to the Master Portfolio, the Manager contractually agreed to waive its investment advisory fees by the amount of investment advisory fees the Master Portfolio pays to the Manager indirectly through its investment in affiliated money market funds (the “affiliated money market fund waiver”) through January 31, 2021. The contractual agreement may be terminated upon 90 days’ notice by a majority of the directors who are not “interested persons” of the Corporation, as defined in the 1940 Act (“Independent Directors”), or by a vote of a majority of the outstanding voting securities of the Master Portfolio. The amount of waivers and/or reimbursements of fees and expenses made pursuant to the expense limitation described below will be reduced by the amount of the affiliated money market fund waiver. Prior to January 28, 2020, this waiver was voluntary. This amount is included in fees waived and/or reimbursed by the Manager in the Statement of Operations. For the year ended September 30, 2020 the amount waived was $907,693.
The Manager has contractually agreed to waive its investment advisory fee with respect to any portion of the Master Portfolio’s assets invested in affiliated equity and fixed-income mutual funds and affiliated exchange-traded funds that have a contractual management fee through January 31, 2021. The contractual agreement may be terminated upon 90 days notice by a majority of the Independent Directors, or by a vote of a majority of the outstanding voting securities of the Master Portfolio. This amount is included in fees waived and/or reimbursed by the Manager in the Statement of Operations. For the year ended September 30, 2020, the Manager waived $25,612 in investment advisory fees pursuant to this arrangement.
For the year ended September 30, 2020, the Master Bond LLC reimbursed the Manager $219,313 for certain accounting services, which is included in accounting services in the Statement of Operations.
Securities Lending: The U.S. Securities and Exchange Commission (“SEC”) has issued an exemptive order which permits BIM, an affiliate of the Manager, to serve as securities lending agent for the Master Portfolio, subject to applicable conditions. As securities lending agent, BIM bears all operational costs directly related to securities lending. The Master Portfolio is responsible for expenses in connection with the investment of cash collateral received for securities on loan (the “collateral investment expenses”). The cash collateral is invested in a private investment company, SL Liquidity Series, LLC (“Money Market Series”), managed by the Manager or its affiliates. However, BIM has agreed to cap the collateral investment expenses of the Money Market Series to an annual rate of 0.04%. The investment adviser to the Money Market Series will not charge any advisory fees with respect to shares purchased by the Master Portfolio. The Money Market Series may, under certain circumstances, impose a liquidity fee of up to 2% of the value withdrawn or temporarily restrict withdrawals for up to 10 business days during a 90 day period, in the event that the private investment company’s weekly liquid assets fall below certain thresholds. The Money Market Series seeks current income consistent with maintaining liquidity and preserving capital. Although the Money Market Series is not registered under the 1940 Act, its investments may follow the parameters of investments by a money market fund that is subject to Rule 2a-7 under the 1940 Act.
| | |
N O T E S T O F I N A N C I A L S T A T E M E N T S | | 141 |
| | |
| Notes to Financial Statements (continued) | | |
Securities lending income is equal to the total of income earned from the reinvestment of cash collateral, net of fees and other payments to and from borrowers of securities, and less the collateral investment expenses. The Master Portfolio retains a portion of securities lending income and remits a remaining portion to BIM as compensation for its services as securities lending agent.
Pursuant to the current securities lending agreement, the Master Portfolio retains 75% of securities lending income (which excludes collateral investment expenses), and this amount retained can never be less than 70% of the total of securities lending income plus the collateral investment expenses.
In addition, commencing the business day following the date that the aggregate securities lending income earned across the BlackRock Multi-Asset Complex in a calendar year exceeds a specified threshold, the Master Portfolio, pursuant to the securities lending agreement, will retain for the remainder of that calendar year securities lending income in an amount equal to 80% of securities lending income (which excludes collateral investment expenses), and this amount retained can never be less than 70% of the total of securities lending income plus the collateral investment expenses.
Prior to January 1, 2020, the Master Portfolio retained 82% of securities lending income (which excluded collateral investment expenses) and the amount retained could never be less than 70% of the total of securities lending income plus the collateral investment expenses. In addition, commencing the business day following the date that the aggregate securities lending income earned across the BlackRock Fixed-Income Complex in a calendar year exceeded a specified threshold, the Master Portfolio would retain for the remainder of that calendar year 85% of securities lending income (which excluded collateral investment expenses), and the amount retained could never be less than 70% of the total of securities lending income plus the collateral investment expenses.
The share of securities lending income earned by the Master Portfolio is shown as securities lending income — affiliated — net in the Statement of Operations. For the year ended September 30, 2020, the Master Portfolio paid BIM $1,991 for securities lending agent services.
Interfund Lending: In accordance with an exemptive order (the “Order”) from the SEC, the Master Portfolio may participate in a joint lending and borrowing facility for temporary purposes (the “Interfund Lending Program”), subject to compliance with the terms and conditions of the Order, and to the extent permitted by the Master Portfolio’s investment policies and restrictions. The Master Portfolio is currently permitted to borrow under the Interfund Lending Program.
A lending BlackRock fund may lend in aggregate up to 15% of its net assets, but may not lend more than 5% of its net assets to any one borrowing fund through the Interfund Lending Program. A borrowing BlackRock fund may not borrow through the Interfund Lending Program or from any other source more than 33 1/3% of its total assets (or any lower threshold provided for by the fund’s investment restrictions). If a borrowing BlackRock fund’s total outstanding borrowings exceed 10% of its total assets, each of its outstanding interfund loans will be subject to collateralization of at least 102% of the outstanding principal value of the loan. All interfund loans are for temporary or emergency purposes and the interest rate to be charged will be the average of the highest current overnight repurchase agreement rate available to a lending fund and the bank loan rate, as calculated according to a formula established by the Board.
During the year ended September 30, 2020, the Master Portfolio did not participate in the Interfund Lending Program.
Directors and Officers: Certain directors and/or officers of the Master Bond LLC are directors and/or officers of BlackRock or its affiliates.
Other Transactions: The Master Portfolio may purchase securities from, or sell securities to, an affiliated fund provided the affiliation is due solely to having a common investment adviser, common officers, or common directors. For the year ended September 30, 2020, the purchase and sale transactions and any net realized gains (losses) with an affiliated fund in compliance with Rule 17a-7 under the 1940 Act were as follows:
| | | | | | | | | | |
| | | | |
| Purchases | | | Sales | | | | Net Realized Gain | |
| | | |
| $ | 47,942,088 | | | $ 35,458,096 | | | | | $219,493 | |
For the year ended September 30, 2020, purchases and sales of investments, including paydowns and mortgage dollar rolls and excluding short-term investments, were as follows:
| | | | | | | | |
| | | |
| | | Purchases | | | Sales | |
| | |
Non-U.S. Government Securities | | $ | 105,695,574,360 | | | $ | 103,849,745,368 | |
U.S. Government Securities | | | 6,396,339,029 | | | | 5,151,924,194 | |
For the year ended September 30, 2020, purchases and sales related to mortgage dollar rolls were as follows:
| | | | | | | | |
| | | |
| | | Purchases | | | Sales | |
| | |
Mortgage Dollar Rolls. | | $ | 55,266,526,855 | | | $ | 55,268,062,914 | |
The Master Portfolio is classified as a partnership for U.S. federal income tax purposes. As such, each investor in the Master Portfolio is treated as the owner of its proportionate share of net assets, income, expenses and realized and unrealized gains and losses of the Master Portfolio. Therefore, no U.S. federal income tax provision is required. It is intended that the Master Portfolio’s assets will be managed so an investor in the Master Portfolio can satisfy the requirements of Subchapter M of the Internal Revenue Code of 1986, as amended.
| | |
| 142 | | 2 0 2 0 B L A C K R O C K A N N U A L R E P O R T T O S H A R E H O L D E R S |
| | |
| Notes to Financial Statements (continued) | | |
The Master Portfolio files U.S. federal and various state and local tax returns. No income tax returns are currently under examination. The statute of limitations on the Master Portfolio’s U.S. federal tax returns generally remains open for a period of three fiscal years after they are filed. The statutes of limitations on the Master Portfolio’s state and local tax returns may remain open for an additional year depending upon the jurisdiction.
Management has analyzed tax laws and regulations and their application to the Master Portfolio as of September 30, 2020, inclusive of the open tax return years, and does not believe that there are any uncertain tax positions that require recognition of a tax liability in the Master Portfolio’s financial statements.
As of September 30, 2020, gross unrealized appreciation and depreciation for investments and derivatives based on cost for U.S. federal income tax purposes were as follows:
| | | | |
| |
| | | Amounts | |
| |
Tax cost | | $ | 26,589,504,152 | |
| | | | |
Gross unrealized appreciation | | $ | 701,016,073 | |
Gross unrealized depreciation | | | (280,834,721 | ) |
| | | | |
Net unrealized appreciation (depreciation) | | $ | 420,181,352 | |
| | | | |
The Master Bond LLC, on behalf of the Master Portfolio, along with certain other funds managed by the Manager and its affiliates (“Participating Funds”), is a party to a 364-day, $2.25 billion credit agreement with a group of lenders. Under this agreement, the Master Portfolio may borrow to fund shareholder redemptions. Excluding commitments designated for certain individual funds, the Participating Funds, including the Master Portfolio, can borrow up to an aggregate commitment amount of $1.75 billion at any time outstanding, subject to asset coverage and other limitations as specified in the agreement. The credit agreement has the following terms: a fee of 0.10% per annum on unused commitment amounts and interest at a rate equal to the higher of (a) one-month LIBOR (but, in any event, not less than 0.00%) on the date the loan is made plus 0.80% per annum or (b) the Fed Funds rate (but, in any event, not less than 0.00%) in effect from time to time plus 0.80% per annum on amounts borrowed. The agreement expires in April 2021 unless extended or renewed. These fees were allocated among such funds based upon portions of the aggregate commitment available to them and relative net assets of Participating Funds. During the year ended September 30, 2020, the Master Portfolio did not borrow under the credit agreement.
In the normal course of business, the Master Portfolio invests in securities or other instruments and may enter into certain transactions, and such activities subject the Master Portfolio to various risks, including among others, fluctuations in the market (market risk) or failure of an issuer to meet all of its obligations. The value of securities or other instruments may also be affected by various factors, including, without limitation: (i) the general economy; (ii) the overall market as well as local, regional or global political and/or social instability; (iii) regulation, taxation or international tax treaties between various countries; or (iv) currency, interest rate and price fluctuations. Local, regional or global events such as war, acts of terrorism, the spread of infectious illness or other public health issues, recessions, or other events could have a significant impact on the Master Portfolio and its investments. The Master Portfolio’s prospectus provides details of the risks to which the Master Portfolio is subject.
The Master Portfolio may be exposed to additional risks when reinvesting cash collateral in money market funds that do not seek to maintain a stable NAV per share of $1.00, which may be subject to redemption gates or liquidity fees under certain circumstances.
Market Risk: The Master Portfolio may be exposed to prepayment risk, which is the risk that borrowers may exercise their option to prepay principal earlier than scheduled during periods of declining interest rates, which would force the Master Portfolio to reinvest in lower yielding securities. The Master Portfolio may also be exposed to reinvestment risk, which is the risk that income from the Master Portfolio’s portfolio will decline if the Master Portfolio invests the proceeds from matured, traded or called fixed-income securities at market interest rates that are below the Master Portfolio’s current earnings rate.
Municipal securities are subject to the risk that litigation, legislation or other political events, local business or economic the present time. This pandemic may result in substantial market volatility and may adversely impact the prices and liquidity conditions, credit rating downgrades, or the bankruptcy of the issuer could have a significant effect on an issuer’s ability to make payments of principal and/or interest or otherwise affect the value of such securities. Municipal securities can be significantly affected by political or economic changes, including changes made in the law after issuance of the securities, as well as uncertainties in the municipal market related to, taxation, legislative changes or the rights of municipal security holders, including in connection with an issuer insolvency. Municipal securities backed by current or anticipated revenues from a specific project or specific assets can be negatively affected by the discontinuance of the tax benefits supporting the project or assets or the inability to collect revenues for the project or from the assets. Municipal securities may be less liquid than taxable bonds, and there may be less publicly available information on the financial condition of municipal security issuers than for issuers of other securities.
An outbreak of respiratory disease caused by a novel coronavirus has developed into a global pandemic and has resulted in closing borders, quarantines, disruptions to supply chains and customer activity, as well as general concern and uncertainty. The impact of this pandemic, and other global health crises that may arise in the future, could affect the economies of many nations, individual companies and the market in general in ways that cannot necessarily be foreseen at of a fund’s investments. The duration of this pandemic and its effects cannot be determined with certainty.
Valuation Risk: The market values of equities, such as common stocks and preferred securities or equity related investments, such as futures and options, may decline due to general market conditions which are not specifically related to a particular company. They may also decline due to factors which affect a particular industry or industries. The Master Portfolio may invest in illiquid investments. An illiquid investment is any investment that the Master Portfolio reasonably expects cannot be sold or disposed of in current market conditions in seven calendar days or less without the sale or disposition significantly changing the market value of the investment. The Master Portfolio may experience difficulty in selling illiquid investments in a timely manner at the price that it believes the investments are worth. Prices may fluctuate widely over short or extended periods in
| | |
N O T E S T O F I N A N C I A L S T A T E M E N T S | | 143 |
| | |
| Notes to Financial Statements (continued) | | |
response to company, market or economic news. Markets also tend to move in cycles, with periods of rising and falling prices. This volatility may cause the Master Portfolio’s NAV to experience significant increases or decreases over short periods of time. If there is a general decline in the securities and other markets, the NAV of the Master Portfolio may lose value, regardless of the individual results of the securities and other instruments in which the Master Portfolio invests.
The price the Master Portfolio could receive upon the sale of any particular portfolio investment may differ from the Master Portfolio’s valuation of the investment, particularly for securities that trade in thin or volatile markets or that are valued using a fair valuation technique or a price provided by an independent pricing service. Changes to significant unobservable inputs and assumptions (i.e., publicly traded company multiples, growth rate, time to exit) due to the lack of observable inputs may significantly impact the resulting fair value and therefore the Master Portfolio’s results of operations. As a result, the price received upon the sale of an investment may be less than the value ascribed by the Master Portfolio, and the Master Portfolio could realize a greater than expected loss or lesser than expected gain upon the sale of the investment. The Master Portfolio’s ability to value its investments may also be impacted by technological issues and/or errors by pricing services or other third party service providers.
Counterparty Credit Risk: The Master Portfolio may be exposed to counterparty credit risk, or the risk that an entity may fail to or be unable to perform on its commitments related to unsettled or open transactions, including making timely interest and/or principal payments or otherwise honoring its obligations. The Master Portfolio manages counterparty credit risk by entering into transactions only with counterparties that the Manager believes have the financial resources to honor their obligations and by monitoring the financial stability of those counterparties. Financial assets, which potentially expose the Master Portfolio to market, issuer and counterparty credit risks, consist principally of financial instruments and receivables due from counterparties. The extent of the Master Portfolio’s exposure to market, issuer and counterparty credit risks with respect to these financial assets is approximately their value recorded in the Statement of Assets and Liabilities, less any collateral held by the Master Portfolio.
A derivative contract may suffer a mark-to-market loss if the value of the contract decreases due to an unfavorable change in the market rates or values of the underlying instrument. Losses can also occur if the counterparty does not perform under the contract.
For OTC options purchased, the Master Portfolio bears the risk of loss in the amount of the premiums paid plus the positive change in market values net of any collateral held by the Master Portfolio should the counterparty fail to perform under the contracts. Options written by the Master Portfolio do not typically give rise to counterparty credit risk, as options written generally obligate the Master Portfolio, and not the counterparty, to perform. The Master Portfolio may be exposed to counterparty credit risk with respect to options written to the extent the Master Portfolio deposits collateral with its counterparty to a written option.
With exchange-traded options purchased and futures and centrally cleared swaps, there is less counterparty credit risk to the Master Portfolio since the exchange or clearinghouse, as counterparty to such instruments, guarantees against a possible default. The clearinghouse stands between the buyer and the seller of the contract; therefore, credit risk is limited to failure of the clearinghouse. While offset rights may exist under applicable law, the Master Portfolio does not have a contractual right of offset against a clearing broker or clearinghouse in the event of a default (including the bankruptcy or insolvency). Additionally, credit risk exists in exchange-traded futures and centrally cleared swaps with respect to initial and variation margin that is held in a clearing broker’s customer accounts. While clearing brokers are required to segregate customer margin from their own assets, in the event that a clearing broker becomes insolvent or goes into bankruptcy and at that time there is a shortfall in the aggregate amount of margin held by the clearing broker for all its clients, typically the shortfall would be allocated on a pro rata basis across all the clearing broker’s customers, potentially resulting in losses to the Master Portfolio.
Concentration Risk: A diversified portfolio, where this is appropriate and consistent with the Master Portfolio’s objectives, minimizes the risk that a price change of a particular investment will have a material impact on the NAV of the Master Portfolio. The investment concentrations within the Master Portfolio’s portfolio are disclosed in its Schedule of Investments.
The Master Portfolio invests a significant portion of its assets in fixed-income securities and/or uses derivatives tied to the fixed-income markets. Changes in market interest rates or economic conditions may affect the value and/or liquidity of such investments. Interest rate risk is the risk that prices of bonds and other fixed-income securities will increase as interest rates fall and decrease as interest rates rise. The Master Portfolio may be subject to a greater risk of rising interest rates due to the current period of historically low rates.
The Master Portfolio invests a significant portion of its assets in securities backed by commercial or residential mortgage loans or in issuers that hold mortgage and other asset-backed securities. When the Master Portfolio concentrates its investments in this manner, it assumes a greater risk of prepayment or payment extension by securities issuer. Changes in economic conditions, including delinquencies and/or defaults on assets underlying these securities, can affect the value, income and/or liquidity of such positions. Investment percentages in these securities are presented in the Schedule of Investments.
LIBOR Transition Risk: The United Kingdom’s Financial Conduct Authority announced a phase out of the London Interbank Offered Rate (“LIBOR”) by the end of 2021, and it is expected that LIBOR will cease to be published after that time. The Master Portfolio may be exposed to financial instruments tied to LIBOR to determine payment obligations, financing terms, hedging strategies or investment value. The transition process away from LIBOR might lead to increased volatility and illiquidity in markets for, and reduce the effectiveness of new hedges placed against, instruments whose terms currently include LIBOR. The ultimate effect of the LIBOR transition process on the Master Portfolio is uncertain.
Management has evaluated the impact of all subsequent events on the Master Portfolio through the date the financial statements were issued and has determined that there were no subsequent events requiring adjustment or additional disclosure in the financial statements.
| | |
| 144 | | 2 0 2 0 B L A C K R O C K A N N U A L R E P O R T T O S H A R E H O L D E R S |
Report of Independent Registered Public Accounting Firm
To the Investors of Master Total Return Portfolio and the Board of Directors of Master Bond LLC:
Opinion on the Financial Statements and Financial Highlights
We have audited the accompanying statement of assets and liabilities of Master Total Return Portfolio of Master Bond LLC (the “Fund”), including the schedule of investments, as of September 30, 2020, the related statement of operations for the year then ended, the statement of changes in net assets for the year then ended, the consolidated statement of changes in net assets for the year ended September 30, 2019, the financial highlights for the year then ended, the consolidated financial highlights for each of the four years in the period ended September 30, 2019, and the related notes. In our opinion, the financial statements and financial highlights present fairly, in all material respects, the financial position of the Fund as of September 30, 2020, and the results of its operations for the year then ended, the changes in its net assets for each of the two years in the period then ended, and the financial highlights for each of the five years in the period then ended, in conformity with accounting principles generally accepted in the United States of America.
Basis for Opinion
These financial statements and financial highlights are the responsibility of the Fund’s management. Our responsibility is to express an opinion on the Fund’s financial statements and financial highlights based on our audits. We are a public accounting firm registered with the Public Company Accounting Oversight Board (United States) (PCAOB) and are required to be independent with respect to the Fund in accordance with the U.S. federal securities laws and the applicable rules and regulations of the Securities and Exchange Commission and the PCAOB.
We conducted our audits in accordance with the standards of the PCAOB. Those standards require that we plan and perform the audit to obtain reasonable assurance about whether the financial statements and financial highlights are free of material misstatement, whether due to error or fraud. The Fund is not required to have, nor were we engaged to perform, an audit of its internal control over financial reporting. As part of our audits we are required to obtain an understanding of internal control over financial reporting but not for the purpose of expressing an opinion on the effectiveness of the Fund’s internal control over financial reporting. Accordingly, we express no such opinion.
Our audits included performing procedures to assess the risks of material misstatement of the financial statements and financial highlights, whether due to error or fraud, and performing procedures that respond to those risks. Such procedures included examining, on a test basis, evidence regarding the amounts and disclosures in the financial statements and financial highlights. Our audits also included evaluating the accounting principles used and significant estimates made by management, as well as evaluating the overall presentation of the financial statements and financial highlights. Our procedures included confirmation of securities owned as of September 30, 2020, by correspondence with the custodian, brokers and agent banks; when replies were not received from brokers or agent banks, we performed other auditing procedures. We believe that our audits provide a reasonable basis for our opinion.
Deloitte & Touche LLP
Boston, Massachusetts
November 20, 2020
We have served as the auditor of one or more BlackRock investment companies since 1992.
| | |
R E P O R T O F I N D E P E N D E N T R E G I S T E R E D P U B L I C A C C O U N T I N G F I R M | | 145 |
Disclosure of Investment Advisory Agreement
The Board of Directors (the “Board,” the members of which are referred to as “Board Members”) of BlackRock Balanced Capital Fund, Inc. (the “Fund”) met on April 7, 2020 (the “April Meeting”) and May 11-13, 2020 (the “May Meeting”) to consider the approval of the investment advisory agreement (the “Agreement”) between the Fund and BlackRock Advisors, LLC (the “Manager” or “BlackRock”), the Fund’s investment advisor.
Activities and Composition of the Board
On the date of the May Meeting, the Board consisted of fourteen individuals, twelve of whom were not “interested persons” of the Fund as defined in the Investment Company Act of 1940, as amended (the “1940 Act”) (the “Independent Board Members”). The Board Members are responsible for the oversight of the operations of the Fund and perform the various duties imposed on the directors of investment companies by the 1940 Act. The Independent Board Members have retained independent legal counsel to assist them in connection with their duties. The Chair of the Board is an Independent Board Member. The Board has established five standing committees: an Audit Committee, a Governance and Nominating Committee, a Compliance Committee, a Performance Oversight Committee and an Ad Hoc Topics Committee, each of which is chaired by an Independent Board Member and composed of Independent Board Members (except for the Ad Hoc Topics Committee, which also has one interested Board Member).
The Agreement
Consistent with the requirements of the 1940 Act, the Board considers the continuation of the Agreement on an annual basis. The Board has four quarterly meetings per year, each typically extending for two days, and additional in-person and telephonic meetings throughout the year, as needed. While the Board also has a fifth one-day meeting to consider specific information surrounding the renewal of the Agreement, the Board’s consideration entails a year-long deliberative process whereby the Board and its committees assess BlackRock’s services to the Fund. In particular, the Board assessed, among other things, the nature, extent and quality of the services provided to the Fund by BlackRock, BlackRock’s personnel and affiliates, including (as applicable): investment management services; accounting oversight; administrative and shareholder services; oversight of the Fund’s service providers; risk management and oversight; and legal, regulatory and compliance services. Throughout the year, including during the contract renewal process, the Independent Board Members were advised by independent legal counsel, and met with independent legal counsel in various executive sessions outside of the presence of BlackRock’s management.
During the year, the Board, acting directly and through its committees, considers information that is relevant to its annual consideration of the renewal of the Agreement, including the services and support provided by BlackRock to the Fund and its shareholders. BlackRock also furnished additional information to the Board in response to specific questions from the Board. This additional information is discussed further in the section titled “Board Considerations in Approving the Agreement.” Among the matters the Board considered were: (a) investment performance for one-year, three-year, five-year, and/or since inception periods, as applicable, against peer funds, an applicable benchmark, and other performance metrics, as applicable, as well as BlackRock senior management’s and portfolio managers’ analyses of the reasons for any outperformance or underperformance relative to its peers, benchmarks, and other performance metrics, as applicable; (b) fees, including advisory, administration, if applicable, and other amounts paid to BlackRock and its affiliates by the Fund for services; (c) Fund operating expenses and how BlackRock allocates expenses to the Fund; (d) the resources devoted to risk oversight of, and compliance reports relating to, implementation of the Fund’s investment objective, policies and restrictions, and meeting regulatory requirements; (e) BlackRock’s and the Fund’s adherence to applicable compliance policies and procedures; (f) the nature, character and scope of non-investment management services provided by BlackRock and its affiliates and the estimated cost of such services; (g) BlackRock’s and other service providers’ internal controls and risk and compliance oversight mechanisms; (h) BlackRock’s implementation of the proxy voting policies approved by the Board; (i) the use of brokerage commissions and execution quality of portfolio transactions; (j) BlackRock’s implementation of the Fund’s valuation and liquidity procedures; (k) an analysis of management fees for products with similar investment mandates across the open-end fund, exchange-traded fund (“ETF”), closed-end fund, sub-advised mutual fund, separately managed account, collective investment trust, and institutional separate account product channels, as applicable, and the similarities and differences between these products and the services provided as compared to the Fund; (l) BlackRock’s compensation methodology for its investment professionals and the incentives and accountability it creates, along with investment professionals’ investments in the fund(s) they manage; and (m) periodic updates on BlackRock’s business.
Board Considerations in Approving the Agreement
The Approval Process: Prior to the April Meeting, the Board requested and received materials specifically relating to the Agreement. The Independent Board Members are continuously engaged in a process with their independent legal counsel and BlackRock to review the nature and scope of the information provided to the Board to better assist its deliberations. The materials provided in connection with the April Meeting included, among other things: (a) information independently compiled and prepared by Broadridge Financial Solutions, Inc. (“Broadridge”), based on either a Lipper classification or Morningstar category, regarding the Fund’s fees and expenses as compared with a peer group of funds as determined by Broadridge (“Expense Peers”) and the investment performance of the Fund as compared with a peer group of funds (“Performance Peers”); (b) information on the composition of the Expense Peers and Performance Peers and a description of Broadridge’s methodology; (c) information on the estimated profits realized by BlackRock and its affiliates pursuant to the Agreement and a discussion of fall-out benefits to BlackRock and its affiliates; (d) a general analysis provided by BlackRock concerning investment management fees received in connection with other types of investment products, such as institutional accounts, sub-advised mutual funds, ETFs, closed-end funds, open-end funds, and separately managed accounts under similar investment mandates, as well as the performance of such other products, as applicable; (e) a review of non-management fees; (f) the existence, impact and sharing of potential economies of scale, if any, with the Fund; (g) a summary of aggregate amounts paid by the Fund to BlackRock; (h) sales and redemption data regarding the Fund’s shares; and (i) various additional information requested by the Board as appropriate regarding BlackRock’s and the Fund’s operations.
At the April Meeting, the Board reviewed materials relating to its consideration of the Agreement. As a result of the discussions that occurred during the April Meeting, and as a culmination of the Board’s year-long deliberative process, the Board presented BlackRock with questions and requests for additional information. BlackRock responded to these questions and requests with additional written information in advance of the May Meeting.
At the May Meeting, the Board concluded its assessment of, among other things: (a) the nature, extent and quality of the services provided by BlackRock; (b) the investment performance of the Fund as compared to its Performance Peers and to other metrics, as applicable; (c) the advisory fee and the estimated cost of the services and estimated
| | |
| 146 | | 2 0 2 0 B L A C K R O C K A N N U A L R E P O R T T O S H A R E H O L D E R S |
Disclosure of Investment Advisory Agreement (continued)
profits realized by BlackRock and its affiliates from their relationship with the Fund; (d) the Fund’s fees and expenses compared to its Expense Peers; (e) the existence and sharing of potential economies of scale; (f) any fall-out benefits to BlackRock and its affiliates as a result of BlackRock’s relationship with the Fund; and (g) other factors deemed relevant by the Board Members.
The Board also considered other matters it deemed important to the approval process, such as other payments made to BlackRock or its affiliates relating to securities lending and cash management, and BlackRock’s services related to the valuation and pricing of Fund portfolio holdings. The Board noted the willingness of BlackRock’s personnel to engage in open, candid discussions with the Board. The Board did not identify any particular information as determinative, and each Board Member may have attributed different weights to the various items considered.
A. Nature, Extent and Quality of the Services Provided by BlackRock: The Board, including the Independent Board Members, reviewed the nature, extent and quality of services provided by BlackRock, including the investment advisory services, and the resulting performance of the Fund. Throughout the year, the Board compared Fund performance to the performance of a comparable group of mutual funds, relevant benchmark, and performance metrics, as applicable. The Board met with BlackRock’s senior management personnel responsible for investment activities, including the senior investment officers. The Board also reviewed the materials provided by the Fund’s portfolio management team discussing the Fund’s performance, investment strategies and outlook.
The Board considered, among other factors, with respect to BlackRock: the number, education and experience of investment personnel generally and the Fund’s portfolio management team; research capabilities; investments by portfolio managers in the funds they manage; portfolio trading capabilities; use of technology; commitment to compliance; credit analysis capabilities; risk analysis and oversight capabilities; and the approach to training and retaining portfolio managers and other research, advisory and management personnel. The Board also considered BlackRock’s overall risk management program, including the continued efforts of BlackRock and its affiliates to address cybersecurity risks and the role of BlackRock’s Risk & Quantitative Analysis Group. The Board engaged in a review of BlackRock’s compensation structure with respect to the Fund’s portfolio management team and BlackRock’s ability to attract and retain high-quality talent and create performance incentives.
In addition to investment advisory services, the Board considered the nature and quality of the administrative and other non-investment advisory services provided to the Fund. BlackRock and its affiliates provide the Fund with certain administrative, shareholder and other services (in addition to any such services provided to the Fund by third parties) and officers and other personnel as are necessary for the operations of the Fund. In particular, BlackRock and its affiliates provide the Fund with administrative services including, among others: (i) responsibility for disclosure documents, such as the prospectus, the summary prospectus (as applicable), the statement of additional information and periodic shareholder reports; (ii) oversight of daily accounting and pricing; (iii) responsibility for periodic filings with regulators; (iv) overseeing and coordinating the activities of third-party service providers including, among others, the Fund’s custodian, fund accountant, transfer agent, and auditor; (v) organizing Board meetings and preparing the materials for such Board meetings; (vi) providing legal and compliance support; (vii) furnishing analytical and other support to assist the Board in its consideration of strategic issues such as the merger, consolidation or repurposing of certain open-end funds; and (viii) performing or managing administrative functions necessary for the operation of the Fund, such as tax reporting, expense management, fulfilling regulatory filing requirements, overseeing the Fund’s distribution partners, and shareholder call center and other services. The Board reviewed the structure and duties of BlackRock’s fund administration, shareholder services, and legal & compliance departments and considered BlackRock’s policies and procedures for assuring compliance with applicable laws and regulations.
B. The Investment Performance of the Fund and BlackRock: The Board, including the Independent Board Members, also reviewed and considered the performance history of the Fund. In preparation for the April Meeting, the Board was provided with reports independently prepared by Broadridge, which included an analysis of the Fund’s performance as of December 31, 2019, as compared to its Performance Peers. Broadridge ranks funds in quartiles, ranging from first to fourth, where first is the most desirable quartile position and fourth is the least desirable. In connection with its review, the Board received and reviewed information regarding the investment performance of the Fund as compared to its Performance Peers. The Board and its Performance Oversight Committee regularly review and meet with Fund management to discuss the performance of the Fund throughout the year.
In evaluating performance, the Board focused particular attention on funds with less favorable performance records. The Board also noted that while it found the data provided by Broadridge generally useful, it recognized the limitations of such data, including in particular, that notable differences may exist between a fund and its Performance Peers (for example, the investment objectives and strategies). Further, the Board recognized that the performance data reflects a snapshot of a period as of a particular date and that selecting a different performance period could produce significantly different results. The Board also acknowledged that long-term performance could be impacted by even one period of significant outperformance or underperformance, and that a single investment theme could have the ability to disproportionately affect long-term performance.
The Board noted that for each of the one-, three- and five-year periods reported, the Fund ranked in the first quartile, against its Performance Peers.
C. Consideration of the Advisory/Management Fees and the Estimated Cost of the Services and Estimated Profits Realized by BlackRock and its Affiliates from their Relationship with the Fund: The Board, including the Independent Board Members, reviewed the Fund’s contractual management fee rate compared with those of its Expense Peers. The contractual management fee rate represents a combination of the advisory fee and any administrative fees, before taking into account any reimbursements or fee waivers. The Board also compared the Fund’s total expense ratio, as well as its actual management fee rate, to those of its Expense Peers. The total expense ratio represents a fund’s total net operating expenses, including any 12b-1 or non-12b-1 service fees. The total expense ratio gives effect to any expense reimbursements or fee waivers, and the actual management fee rate gives effect to any management fee reimbursements or waivers. The Board considered the services provided and the fees charged by BlackRock and its affiliates to other types of clients with similar investment mandates, as applicable, including institutional accounts and sub-advised mutual funds (including mutual funds sponsored by third parties).
The Board received and reviewed statements relating to BlackRock’s financial condition. The Board reviewed BlackRock’s profitability methodology and was also provided with an estimated profitability analysis that detailed the revenues earned and the expenses incurred by BlackRock for services provided to the Fund. The Board reviewed BlackRock’s estimated profitability with respect to the Fund and other funds the Board currently oversees for the year ended December 31, 2019 compared to available aggregate estimated profitability data provided for the prior two years. The Board reviewed BlackRock’s estimated profitability with respect to certain other U.S. fund complexes managed by BlackRock and/or its affiliates. The Board reviewed BlackRock’s assumptions and methodology of allocating expenses in the estimated profitability analysis, noting the inherent limitations in allocating costs among various advisory products. The Board recognized that profitability may be affected by numerous factors including, among other things, fee waivers and expense reimbursements by BlackRock, the types of funds managed, precision of expense allocations and business mix. The Board thus recognized that calculating and comparing profitability at the individual fund level is difficult.
| | |
D I S C L O S U R E O F I N V E S T M E N T A D V I S O R Y A G R E E M E N T | | 147 |
Disclosure of Investment Advisory Agreement (continued)
The Board noted that, in general, individual fund or product line profitability of other advisors is not publicly available. The Board reviewed BlackRock’s overall operating margin, in general, compared to that of certain other publicly traded asset management firms. The Board considered the differences between BlackRock and these other firms, including the contribution of technology at BlackRock, BlackRock’s expense management, and the relative product mix.
The Board considered whether BlackRock has the financial resources necessary to attract and retain high quality investment management personnel to perform its obligations under the Agreement and to continue to provide the high quality of services that is expected by the Board. The Board further considered factors including but not limited to BlackRock’s commitment of time, assumption of risk, and liability profile in servicing the Fund, including in contrast to what is required of BlackRock with respect to other products with similar investment mandates across the open-end fund, ETF, closed-end fund, sub-advised mutual fund, separately managed account, collective investment trust, and institutional separate account product channels, as applicable.
The Board noted that the Fund’s contractual management fee rate ranked in the first quartile, and that the actual management fee rate and total expense ratio each ranked in the first quartile relative to the Fund’s Expense Peers. The Board also noted that the Fund has an advisory fee arrangement that includes breakpoints that adjust the fee rate downward as the size of the Fund increases above certain contractually specified levels. The Board noted that if the size of the Fund were to decrease, the Fund could lose the benefit of one or more breakpoints. Additionally, the Board noted that BlackRock and the Board have contractually agreed to waive a portion of the advisory fee for the Fund by the amount of any management fees paid by the Fund to the manager of each Master Portfolio in which it invests.
D. Economies of Scale: The Board, including the Independent Board Members, considered the extent to which economies of scale might be realized as the assets of the Fund increase, including the existence of fee waivers and/or expense caps, as applicable, noting that any contractual fee waivers and contractual expense caps had been approved by the Board. In its consideration, the Board further considered the continuation and/or implementation of fee waivers and/or expense caps, as applicable. The Board also considered the extent to which the Fund benefits from such economies of scale in a variety of ways and whether there should be changes in the advisory fee rate or breakpoint structure in order to enable the Fund to more fully participate in these economies of scale. The Board considered the Fund’s asset levels and whether the current fee schedule was appropriate.
E. Other Factors Deemed Relevant by the Board Members: The Board, including the Independent Board Members, also took into account other ancillary or “fall-out” benefits that BlackRock or its affiliates may derive from BlackRock’s respective relationships with the Fund, both tangible and intangible, such as BlackRock’s ability to leverage its investment professionals who manage other portfolios and its risk management personnel, an increase in BlackRock’s profile in the investment advisory community, and the engagement of BlackRock’s affiliates as service providers to the Fund, including for administrative, distribution, securities lending and cash management services. The Board also considered BlackRock’s overall operations and its efforts to expand the scale of, and improve the quality of, its operations. The Board also noted that, subject to applicable law, BlackRock may use and benefit from third-party research obtained by soft dollars generated by certain registered fund transactions to assist in managing all or a number of its other client accounts.
In connection with its consideration of the Agreement, the Board also received information regarding BlackRock’s brokerage and soft dollar practices. The Board received reports from BlackRock which included information on brokerage commissions and trade execution practices throughout the year.
The Board noted the competitive nature of the open-end fund marketplace, and that shareholders are able to redeem their Fund shares if they believe that the Fund’s fees and expenses are too high or if they are dissatisfied with the performance of the Fund.
Conclusion
The Board, including the Independent Board Members, unanimously approved the continuation of the Agreement between the Manager and the Fund for a one-year term ending June 30, 2021. Based upon its evaluation of all of the aforementioned factors in their totality, as well as other information, the Board, including the Independent Board Members, was satisfied that the terms of the Agreement were fair and reasonable and in the best interest of the Fund and its shareholders. In arriving at its decision to approve the Agreement, the Board did not identify any single factor or group of factors as all-important or controlling, but considered all factors together, and different Board Members may have attributed different weights to the various factors considered. The Independent Board Members were also assisted by the advice of independent legal counsel in making this determination.
| | |
| 148 | | 2 0 2 0 B L A C K R O C K A N N U A L R E P O R T T O S H A R E H O L D E R S |
Director and Officer Information of Master Bond LLC
| | | | | | | | |
| Independent Directors(a) |
| | | | | |
Name Year of Birth(b) | | Position(s) Held (Length of Service)(c) | | Principal Occupation(s) During Past Five Years | | Number of BlackRock-Advised Registered Investment Companies (“RICs”) Consisting of Investment Portfolios (“Portfolios”) Overseen | | Public Company and Other Investment Company Directorships Held During Past Five Years |
| | | | |
Richard E. Cavanagh 1946 | | Co-Chair of the Board and Director
(Since 2019) | | Director, The Guardian Life Insurance Company of America since 1998; Board Chair, Volunteers of America (a not-for-profit organization) from 2015 to 2018 (board member since 2009); Director, Arch Chemicals (chemical and allied products) from 1999 to 2011; Trustee, Educational Testing Service from 1997 to 2009 and Chairman thereof from 2005 to 2009; Senior Advisor, The Fremont Group since 2008 and Director thereof since 1996; Faculty Member/Adjunct Lecturer, Harvard University since 2007 and Executive Dean from 1987 to 1995; President and Chief Executive Officer, The Conference Board, Inc. (global business research organization) from 1995 to 2007. | | 87 RICs consisting of 111 Portfolios | | None |
| | | | |
Karen P. Robards 1950 | | Co-Chair of the Board and Director
(Since 2019) | | Principal of Robards & Company, LLC (consulting and private investing) since 1987; Co-founder and Director of the Cooke Center for Learning and Development (a not-for-profit organization) since 1987; Director of Enable Injections, LLC (medical devices) since 2019; Investment Banker at Morgan Stanley from 1976 to 1987. | | 87 RICs consisting of 111 Portfolios | | Greenhill & Co., Inc.; AtriCure, Inc. (medical devices) from 2000 until 2017 |
| | | | |
Michael J. Castellano 1946 | | Director
(Since 2019) | | Chief Financial Officer of Lazard Group LLC from 2001 to 2011; Chief Financial Officer of Lazard Ltd from 2004 to 2011; Director, Support Our Aging Religious (non-profit) from 2009 to June 2015 and 2017 to September 2020; Director, National Advisory Board of Church Management at Villanova University since 2010; Trustee, Domestic Church Media Foundation since 2012; Director, CircleBlack Inc. (financial technology company) from 2015 to June 2020. | | 87 RICs consisting of 111 Portfolios | | None |
| | | | |
Cynthia L. Egan 1955 | | Director
(Since 2019) | | Advisor, U.S. Department of the Treasury from 2014 to 2015; President, Retirement Plan Services, for T. Rowe Price Group, Inc. from 2007 to 2012; executive positions within Fidelity Investments from 1989 to 2007. | | 87 RICs consisting of 111 Portfolios | | Unum (insurance); The Hanover Insurance Group (insurance); Envestnet (investment platform) from 2013 until 2016 |
| | | | |
Frank J. Fabozzi(d) 1948 | | Director
(Since 2019) | | Editor of The Journal of Portfolio Management since 1986; Professor of Finance, EDHEC Business School (France) since 2011; Visiting Professor, Princeton University for the 2013 to 2014 academic year and Spring 2017 semester; Professor in the Practice of Finance, Yale University School of Management from 1994 to 2011 and currently a Teaching Fellow in Yale’s Executive Programs; Board Member, BlackRock Equity-Liquidity Funds from 2014 to 2016; affiliated professor Karlsruhe Institute of Technology from 2008 to 2011; Visiting Professor, Rutgers University for the Spring 2019 semester; Visiting Professor, New York University for the 2019 academic year. | | 88 RICs consisting of 112 Portfolios | | None |
| | | | |
R. Glenn Hubbard 1958 | | Director
(Since 2019) | | Dean, Columbia Business School from 2004 to 2019; Faculty member, Columbia Business School since 1988. | | 87 RICs consisting of 111 Portfolios | | ADP (data and information services); Metropolitan Life Insurance Company (insurance); KKR Financial Corporation (finance) from 2004 until 2014 |
| | | | |
W. Carl Kester(d) 1951 | | Director
(Since 2019) | | George Fisher Baker Jr. Professor of Business Administration, Harvard Business School since 2008; Deputy Dean for Academic Affairs from 2006 to 2010; Chairman of the Finance Unit, from 2005 to 2006; Senior Associate Dean and Chairman of the MBA Program from 1999 to 2005; Member of the faculty of Harvard Business School since 1981. | | 88 RICs consisting of 112 Portfolios | | None |
| | |
D I R E C T O R A N D O F F I C E R I N F O R M A T I O N O F M A S T E R B O N D L L C | | 149 |
Director and Officer Information of Master Bond LLC (continued)
| | | | | | | | |
| Independent Directors(a) |
| | | | | |
Name Year of Birth(b) | | Position(s) Held (Length of Service)(c) | | Principal Occupation(s) During Past Five Years | | Number of BlackRock-Advised Registered Investment Companies (“RICs”) Consisting of Investment Portfolios (“Portfolios”) Overseen | | Public Company and Other Investment Company Directorships Held During Past Five Years |
| | | | |
Catherine A. Lynch(d) 1961 | | Director
(Since 2019) | | Chief Executive Officer, Chief Investment Officer and various other positions, National Railroad Retirement Investment Trust from 2003 to 2016; Associate Vice President for Treasury Management, The George Washington University from 1999 to 2003; Assistant Treasurer, Episcopal Church of America from 1995 to 1999. | | 88 RICs consisting of 112 Portfolios | | None |
| | |
| 150 | | 2 0 2 0 B L A C K R O C K A N N U A L R E P O R T T O S H A R E H O L D E R S |
Director and Officer Information of Master Bond LLC (continued)
| | | | | | | | |
| Interested Directors(a)(e) |
| | | | | |
Name Year of Birth(b) | | Position(s) Held (Length of Service)(c) | | Principal Occupation(s) During Past Five Years | | Number of BlackRock-Advised Registered Investment Companies (“RICs”) Consisting of Investment Portfolios (“Portfolios”) Overseen | | Public Company and Other Investment Company Directorships Held During Past Five Years |
| | | | |
Robert Fairbairn 1965 | | Director (Since 2015) | | Vice Chairman of BlackRock, Inc. since 2019; Member of BlackRock’s Global Executive and Global Operating Committees; Co-Chair of BlackRock’s Human Capital Committee; Senior Managing Director of BlackRock, Inc. from 2010 to 2019; oversaw BlackRock’s Strategic Partner Program and Strategic Product Management Group from 2012 to 2019; Member of the Board of Managers of BlackRock Investments, LLC from 2011 to 2018; Global Head of BlackRock’s Retail and iShares® businesses from 2012 to 2016. | | 122 RICs consisting of 269 Portfolios | | None |
| | | | |
John M. Perlowski(d) 1964 | | Director (Since 2015), President and Chief Executive Officer (Since 2010) | | Managing Director of BlackRock, Inc. since 2009; Head of BlackRock Global Accounting and Product Services since 2009; Advisory Director of Family Resource Network (charitable foundation) since 2009. | | 123 RICs consisting of 270 Portfolios | | None |
| (a) | The address of each Director is c/o BlackRock, Inc., 55 East 52nd Street, New York, New York 10055. |
| (b) | Each Independent Director holds office until his or her successor is duly elected and qualifies or until his or her earlier death, resignation, retirement or removal as provided by the Master Bond LLC’s by-laws or charter or statute, or until December 31 of the year in which he or she turns 75. Directors who are “interested persons,” as defined in the Investment Company Act serve until their successor is duly elected and qualifies or until their earlier death, resignation, retirement or removal as provided by the Master Bond LLC’s by-laws or statute, or until December 31 of the year in which they turn 72. The Board may determine to extend the terms of Independent Directors on a case-by-case basis, as appropriate. |
| (c) | Following the combination of Merrill Lynch Investment Managers, L.P. (“MLIM”) and BlackRock, Inc. in September 2006, the various legacy MLIM and legacy BlackRock fund boards were realigned and consolidated into three new fund boards in 2007. Certain Independent Directors first became members of the boards of other legacy MLIM or legacy BlackRock funds as follows: Richard E. Cavanagh, 1994; Frank J. Fabozzi, 1988; R. Glenn Hubbard, 2004; W. Carl Kester, 1995; and Karen P. Robards, 1998. Certain other Independent Directors became members of the boards of the closed-end funds in the Fixed-Income Complex as follows: Michael J. Castellano, 2011; Cynthia L. Egan, 2016; and Catherine A. Lynch, 2016. |
| (d) | Dr. Fabozzi, Dr. Kester, Ms. Lynch and Mr. Perlowski are also trustees of the BlackRock Credit Strategies Fund. |
| (e) | Mr. Fairbairn and Mr. Perlowski are both “interested persons,” as defined in the 1940 Act, of the Master Bond LLC based on their positions with BlackRock, Inc. and its affiliates. Mr. Fairbairn and Mr. Perlowski are also board members of the BlackRock Multi-Asset Complex. |
| | |
D I R E C T O R A N D O F F I C E R I N F O R M A T I O N O F M A S T E R B O N D L L C | | 151 |
Director and Officer Information of Master Bond LLC (continued)
| | | | |
| Officers Who Are Not Directors(a) |
| | | |
Name Year of Birth(b) | | Position(s) Held
(Length of
Service) | | Principal Occupation(s) During Past Five Years |
| | |
Jennifer McGovern 1977 | | Vice President (Since 2014) | | Managing Director of BlackRock, Inc. since 2016; Director of BlackRock, Inc. from 2011 to 2015; Head of Americas Product Development and Governance for BlackRock’s Global Product Group since 2019; Head of Product Structure and Oversight for BlackRock’s U.S. Wealth Advisory Group from 2013 to 2019. |
| | |
Neal J. Andrews 1966 | | Chief Financial Officer (Since 2007) | | Chief Financial Officer of the iShares® exchange traded funds from 2019 to 2020; Managing Director of BlackRock, Inc. since 2006. |
| | |
Jay M. Fife 1970 | | Treasurer (Since 2007) | | Managing Director of BlackRock, Inc. since 2007. |
| | |
Charles Park 1967 | | Chief Compliance Officer (Since 2014) | | Anti-Money Laundering Compliance Officer for certain BlackRock-advised Funds from 2014 to 2015; Chief Compliance Officer of BlackRock Advisors, LLC and the BlackRock-advised Funds in the BlackRock Multi AssetComplex and the BlackRock Fixed-Income Complex since 2014; Principal of and Chief Compliance Officer for iShares® Delaware Trust Sponsor LLC since 2012 and BlackRock Fund Advisors (“BFA”) since 2006;Chief Compliance Officer for the BFA-advised iShares® exchange traded funds since 2006; Chief Compliance Officer for BlackRock Asset Management International Inc. since 2012. |
| | |
Lisa Belle 1968 | | Anti-Money Laundering Compliance Officer (Since 2019) | | Managing Director of BlackRock, Inc. since 2019; Global Financial Crime Head for Asset and Wealth Management of JP Morgan from 2013 to 2019; Managing Director of RBS Securities from 2012 to 2013; Head of Financial Crimes for Barclays Wealth Americas from 2010 to 2012. |
| | |
Janey Ahn 1975 | | Secretary (Since 2019) | | Managing Director of BlackRock, Inc. since 2018; Director of BlackRock, Inc. from 2009 to 2017. |
| (a) | The address of each Officer is c/o BlackRock, Inc., 55 East 52nd Street, New York, New York 10055. |
| (b) | Officers of the Master LLC serve at the pleasure of the Board. |
Further information about the Corporation/Master Bond LLC’s Directors and Officers is available in the Corporation/Master Bond LLC’s Statement of Additional Information, which can be obtained without charge by calling (800) 441-7762.
| | |
| 152 | | 2 0 2 0 B L A C K R O C K A N N U A L R E P O R T T O S H A R E H O L D E R S |
Additional Information
General Information
Householding
The Fund will mail only one copy of shareholder documents, including prospectuses, annual and semi-annual reports and proxy statements, to shareholders with multiple accounts at the same address. This practice is commonly called “householding” and is intended to reduce expenses and eliminate duplicate mailings of shareholder documents. Mailings of your shareholder documents may be householded indefinitely unless you instruct us otherwise. If you do not want the mailing of these documents to be combined with those for other members of your household, please call the Fund at (800) 441-7762.
Availability of Quarterly Schedule of Investments
The Fund/Master LLC/Master Bond LLC files their complete schedule of portfolio holdings with the SEC for the first and third quarters of each fiscal year as an exhibit to their reports on Form N-PORT. The Fund’s/Master LLC/Master Bond LLC’s Forms N-PORT are available on the SEC’s website at sec.gov.
Availability of Proxy Voting Policies and Procedures
A description of the policies and procedures that the Fund/Master LLC/Master Bond LLC use to determine how to vote proxies relating to portfolio securities is available upon request and without charge (1) by calling (800) 441-7762; (2) at blackrock.com; and (3) on the SEC’s website at sec.gov.
Availability of Proxy Voting Record
Information about how the Fund/Master LLC/Master Bond LLC voted proxies relating to securities held in the Fund’s/Master LLC/Master Bond LLC’s portfolio during the most recent 12-month period ended June 30 is available upon request and without charge (1) at blackrock.com; or by calling (800) 441-7762 and (2) on the SEC’s website at sec.gov.
BlackRock’s Mutual Fund Family
BlackRock offers a diverse lineup of open-end mutual funds crossing all investment styles and managed by experts in equity, fixed-income and tax-exempt investing. Visit blackrock.com for more information.
Shareholder Privileges
Account Information
Call us at (800) 441-7762 from 8:00 AM to 6:00 PM ET on any business day to get information about your account balances, recent transactions and share prices. You can also visit blackrock.com for more information.
Automatic Investment Plans
Investor class shareholders who want to invest regularly can arrange to have $50 or more automatically deducted from their checking or savings account and invested in any of the BlackRock funds.
Systematic Withdrawal Plans
Investor class shareholders can establish a systematic withdrawal plan and receive periodic payments of $50 or more from their BlackRock funds, as long as their account balance is at least $10,000.
Retirement Plans
Shareholders may make investments in conjunction with Traditional, Rollover, Roth, Coverdell, Simple IRAs, SEP IRAs and 403(b) Plans.
| | |
A D D I T I O N A L I N F O R M A T I O N | | 153 |
Additional Information (continued)
BlackRock Privacy Principles
BlackRock is committed to maintaining the privacy of its current and former fund investors and individual clients (collectively, “Clients”) and to safeguarding their non-public personal information. The following information is provided to help you understand what personal information BlackRock collects, how we protect that information and why in certain cases we share such information with select parties.
If you are located in a jurisdiction where specific laws, rules or regulations require BlackRock to provide you with additional or different privacy-related rights beyond what is set forth below, then BlackRock will comply with those specific laws, rules or regulations.
BlackRock obtains or verifies personal non-public information from and about you from different sources, including the following: (i) information we receive from you or, if applicable, your financial intermediary, on applications, forms or other documents; (ii) information about your transactions with us, our affiliates, or others; (iii) information we receive from a consumer reporting agency; and (iv) from visits to our websites.
BlackRock does not sell or disclose to non-affiliated third parties any non-public personal information about its Clients, except as permitted by law or as is necessary to respond to regulatory requests or to service Client accounts. These non-affiliated third parties are required to protect the confidentiality and security of this information and to use it only for its intended purpose.
We may share information with our affiliates to service your account or to provide you with information about other BlackRock products or services that may be of interest to you. In addition, BlackRock restricts access to non-public personal information about its Clients to those BlackRock employees with a legitimate business need for the information. BlackRock maintains physical, electronic and procedural safeguards that are designed to protect the non-public personal information of its Clients, including procedures relating to the proper storage and disposal of such information.
Fund and Service Providers
Investment Adviser and Administrator
BlackRock Advisors, LLC
Wilmington, DE 19809
Accounting Agent and Transfer Agent
BNY Mellon Investment Servicing (US) Inc.
Wilmington, DE 19809
Sub-Advisors of Master Bond LLC
BlackRock International Limited
Edinburgh, EH3 8BL
United Kingdom
BlackRock (Singapore) Limited
079912 Singapore
Custodian of the Fund/Master Bond LLC
The Bank of New York Mellon
New York, NY 10286
Custodian of the Master LLC
Brown Brothers Harriman & Co.
Boston, MA 02109
Independent Registered Public Accounting Firm
Deloitte & Touche LLP
Boston, MA 19103
Distributor
BlackRock Investments, LLC
New York, NY 10022
Legal Counsel of Master Bond LLC
Willkie Farr & Gallagher LLP
New York, NY 10019
Legal Counsel of the Fund/Master LLC
Sidley Austin LLP
New York, NY 10019
Address of the Fund/Master LLC/Master Bond LLC
100 Bellevue Parkway
Wilmington, DE 19809
| | |
| 154 | | 2 0 2 0 B L A C K R O C K A N N U A L R E P O R T T O S H A R E H O L D E R S |
Glossary of Terms Used in this Report
| | |
| Currency Abbreviation |
| |
| AUD | | Australian Dollar |
| |
| BRL | | Brazilian Real |
| |
| CAD | | Canadian Dollar |
| |
| CLP | | Chilean Peso |
| |
| CNH | | Chinese Yuan Offshore |
| |
| CNY | | Chinese Yuan |
| |
| COP | | Colombian Peso |
| |
| EUR | | Euro |
| |
| GBP | | British Pound |
| |
| HKD | | Hong Kong Dollar |
| |
| HUF | | Hungarian Forint |
| |
| IDR | | Indonesian Rupiah |
| |
| JPY | | Japanese Yen |
| |
| KRW | | South Korean Won |
| |
| KZT | | Kazakhstani Tenge |
| |
| MXN | | Mexican Peso |
| |
| PLN | | Polish Zloty |
| |
| RUB | | Russian Ruble |
| |
| TRY | | Turkish Lira |
| |
| TWD | | Taiwan New Dollar |
| |
| USD | | United States Dollar |
| |
| ZAR | | South African Rand |
| | |
| Portfolio Abbreviation |
| |
| ABS | | Asset-Backed Security |
| |
| ADR | | American Depositary Receipt |
| |
| AKA | | Also Known As |
| |
| AMBAC | | AMBAC Assurance Corp. |
| |
| AMT | | Alternative Minimum Tax |
| |
| BZDIOVER | | Overnight Brazil CETIP - Interbank Rate |
| |
| CD | | Certificate of Deposit |
| |
| CDO | | Collateralized Debt Obligation |
| |
| CLO | | Collateralized Loan Obligation |
| |
| CORRA | | Canadian OvernightRepo Rate Average |
| |
| CVR | | Contingent Value Rights |
| |
| DAC | | Designated Activity Co. |
| |
| ETF | | Exchange-Traded Fund |
| |
| EURIBOR | | Euro Interbank Offered Rate |
| |
| FKA | | Formally Known As |
| |
| GMTN | | Global Medium-Term Note |
| |
| GNMA | | Government National Mortgage Association |
| |
| GO | | General Obligation Bonds |
| |
| HDA | | Housing Development Authority |
| |
| HFA | | Housing Finance Agency |
| |
| IO | | Interest Only |
| |
| LIBOR | | London Interbank Offered Rate |
| |
| LP | | Limited Partnership |
| |
| MTN | | Medium-Term Note |
| |
| MXIBTIIE | | Mexico Interbank TIIE 28-Day |
| |
| NPFGC | | National Public Finance Guarantee Corp. |
| |
| OTC | | Over-the-Counter |
| |
| PIK | | Payment-in-Kind |
| |
| RB | | Revenue Bonds |
| |
| REMIC | | Real Estate Mortgage Investment Conduit |
| |
| S&P | | Standard & Poor’s |
| |
| SCSDE | | South Carolina State Department of Education |
| |
| SONIA | | Sterling Overnight Index Average |
| |
| SPDR | | Standard & Poor’s Depository Receipt |
| |
| TA | | Tax Allocation |
| |
| TBA | | To-be-Announced |
| | |
G L O S S A R Y O F T E R M S U S E D I N T H I S R E P O R T | | 155 |
Want to know more?
blackrock.com | 800-441-7762
This report is intended for current holders. It is not authorized for use as an offer of sale or a solicitation of an offer to buy shares of the Fund unless preceded or accompanied by the Fund’s current prospectus. Past performance results shown in this report should not be considered a representation of future performance. Investment returns and principal value of shares will fluctuate so that shares, when redeemed, may be worth more or less than their original cost. Statements and other information herein are as dated and are subject to change.
BC-9/20-AR
| Item 2 – | Code of Ethics – Each registrant (or each, a “Fund”) has adopted a code of ethics, as of the end of the period covered by this report, applicable to the registrants’ principal executive officer, principal financial officer, principal accounting officer or controller, or persons performing similar functions. During the period covered by this report, the code of ethics was amended to update certain information and to make other non-material changes. During the period covered by this report, there have been no waivers granted under the code of ethics. The registrants undertake to provide a copy of the code of ethics to any person upon request, without charge, who calls 1-800-441-7762. |
| Item 3 – | Audit Committee Financial Expert – Each registrant’s board of directors (the “board of directors”), has determined that (i) the registrant has the following audit committee financial experts serving on its audit committee and (ii) each audit committee financial expert is independent: |
Neil A. Cotty
Henry R. Keizer
Kenneth L. Urish
Under applicable securities laws, a person determined to be an audit committee financial expert will not be deemed an “expert” for any purpose, including without limitation for the purposes of Section 11 of the Securities Act of 1933, as a result of being designated or identified as an audit committee financial expert. The designation or identification of a person as an audit committee financial expert does not impose on such person any duties, obligations, or liabilities greater than the duties, obligations, and liabilities imposed on such person as a member of the audit committee and board of directors in the absence of such designation or identification. The designation or identification of a person as an audit committee financial expert does not affect the duties, obligations, or liability of any other member of the audit committee or board of directors.
| Item 4 – | Principal Accountant Fees and Services |
The following table presents fees billed by Deloitte & Touche LLP (“D&T”) in each of the last two fiscal years for the services rendered to the Funds:
| | | | | | | | | | | | | | | | |
| | | (a) Audit Fees | | (b) Audit-Related Fees1 | | (c) Tax Fees2 | | (d) All Other Fees |
| Entity Name | | Current
Fiscal Year
End | | Previous
Fiscal Year
End | | Current
Fiscal Year
End | | Previous
Fiscal Year
End | | Current
Fiscal Year
End | | Previous
Fiscal Year
End | | Current
Fiscal Year
End | | Previous
Fiscal Year
End |
BlackRock Balanced Capital Fund, Inc. | | $23,460 | | $23,460 | | $0 | | $0 | | $16,400 | | $16,300 | | $0 | | $0 |
Master Advantage Large Cap Core Portfolio of Master Large Cap Series LLC | | $30,600 | | $36,210 | | $0 | | $0 | | $13,100 | | $13,500 | | $0 | | $0 |
Master Total Return Portfolio of Master Bond LLC | | $85,068 | | $85,068 | | $0 | | $0 | | $30,000 | | $20,000 | | $0 | | $0 |
The following table presents fees billed by D&T that were required to be approved by each registrant’s audit committee (the “Committee”) for services that relate directly to the operations or financial reporting of the Funds and that are rendered on behalf of BlackRock Advisors, LLC (the “Investment Adviser” or “BlackRock”) and entities controlling, controlled by, or under common control with BlackRock (not including any sub-adviser whose role is primarily portfolio management and is subcontracted with or overseen by another investment adviser) that provide ongoing services to the Funds (“Affiliated Service Providers”):
| | | | |
| | | Current Fiscal Year End | | Previous Fiscal Year End |
| (b) Audit-Related Fees1 | | $0 | | $0 |
(c) Tax Fees2 | | $0 | | $0 |
(d) All Other Fees3 | | $1,984,000 | | $2,050,500 |
1 The nature of the services includes assurance and related services reasonably related to the performance of the audit or review of financial statements not included in Audit Fees, including accounting consultations, agreed-upon procedure reports, attestation reports, comfort letters, out-of-pocket expenses and internal control reviews not required by regulators.
2 The nature of the services includes tax compliance and/or tax preparation, including services relating to the filing or amendment of federal, state or local income tax returns, regulated investment company qualification reviews, taxable income and tax distribution calculations.
3 Non-audit fees of $1,984,000 and $2,050,500 for the current fiscal year and previous fiscal year, respectively, were paid to each Fund’s principal accountant in their entirety by BlackRock, in connection with services provided to the Affiliated Service Providers of each Fund and of certain other funds sponsored and advised by BlackRock or its affiliates for a service organization review and an accounting research tool subscription. These amounts represent aggregate fees paid by BlackRock and were not allocated on a per fund basis.
(e)(1) Audit Committee Pre-Approval Policies and Procedures:
Each Committee has adopted policies and procedures with regard to the pre-approval of services. Audit, audit-related and tax compliance services provided to the registrants on an annual basis require specific pre-approval by each Committee. Each Committee also must approve other non-audit services provided to the registrants and those non-audit services provided to the Investment Adviser and Affiliated Service Providers that relate directly to the operations and the financial reporting of the registrants. Certain of these non-audit services that each Committee believes are (a) consistent with the SEC’s auditor independence rules and (b) routine and recurring services that will not impair the independence of the independent accountants may be approved by each Committee without consideration on a specific case-by-case basis (“general pre-approval”). The term of any general pre-approval is 12 months from the date of the pre-approval, unless each Committee provides for a different period. Tax or other non-audit services provided to the registrants, which have a direct impact on the operations or financial reporting of the registrants will only be deemed pre-approved provided that any individual project does not exceed $10,000 attributable to the registrants or $50,000 per project. For this purpose, multiple projects will be aggregated to determine if they exceed the previously mentioned cost levels.
Any proposed services exceeding the pre-approved cost levels will require specific pre-approval by each Committee, as will any other services not subject to general pre-approval (e.g., unanticipated but permissible services). Each Committee is informed of each service approved subject to general pre-approval at the next regularly scheduled in-person board meeting. At this meeting, an analysis of such services is presented to each Committee for ratification. Each Committee may delegate to the Committee Chairman the authority to approve the provision of and fees for any specific engagement of permitted non-audit services, including services exceeding pre-approved cost levels.
(e)(2) None of the services described in each of Items 4(b) through (d) were approved by either Committee pursuant to the de minimis exception in paragraph (c)(7)(i)(C) of Rule 2-01 of Regulation S-X.
(f) Not Applicable
(g) The aggregate non-audit fees, defined as the sum of the fees shown under “Audit-Related Fees,” “Tax Fees” and “All Other Fees,” paid to the accountant for services rendered by the accountant to the registrants, the Investment Adviser and the Affiliated Service Providers were:
| | | | | | |
| | Entity Name | | Current Fiscal Year
End | | Previous Fiscal Year
End |
| | BlackRock Balanced Capital Fund, Inc. | | $16,400 | | $16,300 |
| | Master Advantage Large Cap Core Portfolio of Master Large Cap Series LLC | | $13,100 | | $13,500 |
| | Master Total Return Portfolio of Master Bond LLC | | $30,000 | | $20,000 |
Additionally, the amounts billed by D&T in connection with services provided to the Affiliated Service Providers of the Funds and of other funds sponsored and advised by BlackRock or its affiliates during the current and previous fiscal years for a service organization review and an accounting research tool subscription were:
| | |
Current Fiscal Year End | | Previous Fiscal Year End |
$1,984,000 | | $2,050,500 |
These amounts represent aggregate fees paid by BlackRock and were not allocated on a per fund basis.
(h) Each Committee has considered and determined that the provision of non-audit services that were rendered to the Investment Adviser and the Affiliated Service Providers that were not pre-approved pursuant to paragraph (c)(7)(ii) of Rule 2-01 of Regulation S-X is compatible with maintaining the principal accountant’s independence.
| Item 5 – | Audit Committee of Listed Registrants – Not Applicable |
(a) The registrants’ Schedules of Investments are included as part of the Report to Stockholders filed under Item 1 of this Form.
(b) Not Applicable due to no such divestments during the semi-annual period covered since the previous Form N-CSR filing.
| Item 7 – | Disclosure of Proxy Voting Policies and Procedures for Closed-End Management Investment Companies – Not Applicable |
| Item 8 – | Portfolio Managers of Closed-End Management Investment Companies – Not Applicable |
| Item 9 – | Purchases of Equity Securities by Closed-End Management Investment Company and Affiliated Purchasers – Not Applicable |
| Item 10 – | Submission of Matters to a Vote of Security Holders – There have been no material changes to these procedures. |
| Item 11 – | Controls and Procedures |
(a) The registrants’ principal executive and principal financial officers, or persons performing similar functions, have concluded that the registrants’ disclosure controls and procedures (as defined in Rule 30a-3(c) under the Investment Company Act of 1940, as amended (the “1940 Act”)) are effective as of a date within 90 days of the filing of this report based on the evaluation of these controls and procedures required by Rule 30a-3(b) under the 1940 Act and Rule 15d-15(b) under the Securities Exchange Act of 1934, as amended.
(b) There were no changes in the registrants’ internal control over financial reporting (as defined in Rule 30a-3(d) under the 1940 Act) that occurred during the period covered by this report that have materially affected, or are reasonably likely to materially affect, the registrants’ internal control over financial reporting.
| Item 12 – | Disclosure of Securities Lending Activities for Closed-End Management Investment Companies – Not Applicable |
| Item 13 – | Exhibits attached hereto |
(a)(1) Code of Ethics – See Item 2
(a)(2) Section 302 Certifications are attached
(a)(3) Not Applicable
(a)(4) Not Applicable
(b) Section 906 Certifications are attached
Pursuant to the requirements of the Securities Exchange Act of 1934 and the Investment Company Act of 1940, each registrant has duly caused this report to be signed on its behalf by the undersigned, thereunto duly authorized.
BlackRock Balanced Capital Fund, Inc., Master Advantage Large Cap Core Portfolio of Master Large Cap Series LLC and Master Total Return Portfolio of Master Bond LLC
| | | | |
| | By: | | /s/ John M. Perlowski |
| | | | John M. Perlowski |
| | | | Chief Executive Officer (principal executive officer) of |
| | | | BlackRock Balanced Capital Fund, Inc., Master Advantage Large Cap Core Portfolio of Master Large Cap Series LLC and Master Total Return Portfolio of Master Bond LLC |
Date: December 3, 2020
Pursuant to the requirements of the Securities Exchange Act of 1934 and the Investment Company Act of 1940, this report has been signed below by the following persons on behalf of each registrant and in the capacities and on the dates indicated.
| | | | |
| | By: | | /s/ John M. Perlowski |
| | | | John M. Perlowski |
| | | | Chief Executive Officer (principal executive officer) of |
| | | | BlackRock Balanced Capital Fund, Inc., Master Advantage Large Cap Core Portfolio of Master Large Cap Series LLC and Master Total Return Portfolio of Master Bond LLC |
Date: December 3, 2020
| | | | |
| | By: | | /s/ Neal J. Andrews |
| | | | Neal J. Andrews |
| | | | Chief Financial Officer (principal financial officer) of |
| | | | BlackRock Balanced Capital Fund, Inc., Master Advantage Large Cap Core Portfolio of Master Large Cap Series LLC and Master Total Return Portfolio of Master Bond LLC |
Date: December 3, 2020