EXHIBIT 99.1
FINAL TRANSCRIPT

CCBN StreetEvents Conference Call Transcript
WLS—Q4 2003 William Lyon Homes Earnings Conference Call
Event Date/Time: Feb. 20. 2004 / 2:00PM ET
Event Duration: N/A
1
CORPORATE PARTICIPANTS
Mike Grubbs
William Lyon Homes—CFO & Sr. VP
Wade Cable
William Lyon Homes—President and COO
CONFERENCE CALL PARTICIPANTS
Robert Manowitz
UBS—Analyst
Michael Kinder
Citigroup—Analyst
Catherine Walsh
Capital Growth Management—Analyst
Dolores Glenn
Private Investor
Jim Rainey
UBS—Analyst
PRESENTATION
Operator
Good day, ladies and gentlemen, and welcome to the fourth-quarter and year-end William Lyon Homes earnings conference call for 2003. (OPERATOR INSTRUCTIONS). I would now like to turn the presentation over to your host for today’s call Mr. Mike Grubbs, Senior Vice President and Chief Financial Officer. Sir, over to you.
Mike Grubbs—William Lyon Homes—CFO & Sr. VP
Thank you, Jean. I want to welcome everyone to the William Lyon Homes fourth-quarter and year-end 2003 earnings release conference call. Joining me today on the call are General William Lyon, the Chairman and Chief Executive Officer; Wade Cable, President and Chief Operating Officer; Doug Harris, the Vice President, Corporate Controller and Corporate Secretary, and Bill H. Lyon, a Board of Director and Director of Corporate Affairs.
Today’s call is also being broadcast on our Website at www.lyonhomes.com where there is a detailed Investor Relations section which complements this site providing financial information, live and replay broadcast of previous earnings calls, as well as e-mail alerts for all future calls, press releases and filings. This conference call will also be available for replay within about two hours at the end of this call.
To get started, I would like to read a disclosure statement from our press release. Certain statements contained in this release and conference call that are not historical information contain forward-looking statements. The forward-looking statements involve risks and uncertainties, and actual results may differ materially from those projected or implied. Further, certain forward-looking statements are based on assumptions of future events which may not prove to be accurate. Factors that may impact such forward-looking statements include among others changes in general economic conditions and in the markets in which the Company competes, changes in interest rates and competition, as well as other factors discussed in the Company’s reports filed with the Securities and Exchange Commission.
2003 was the fourth full year of operations following the acquisition of substantially all the old assets of William Lyon Homes and the combination of the two companies in November 1999. We are very pleased with our overall results during those four years, which really culminated in a record fourth quarter and record year-end 2003.
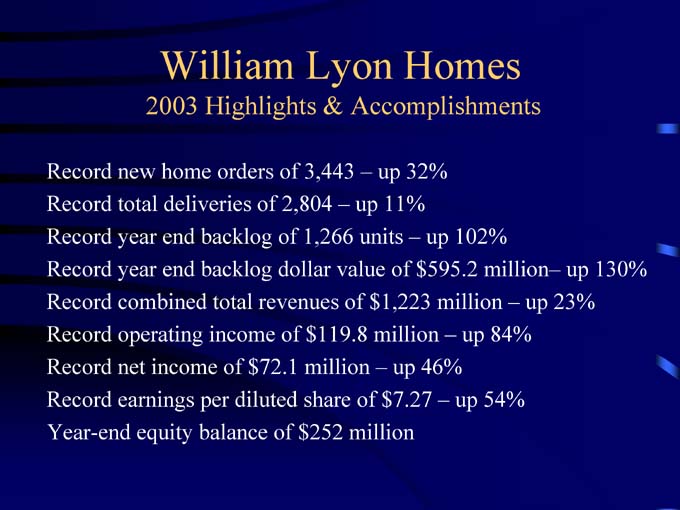
Our new home sales of 3,043 homes was up 32 percent year-over-year. Deliveries, including unconsolidated joint ventures, of 2,804, was up 11 percent with a record 1,290 deliveries in the fourth
2
quarter. Our year-end backlog was 1,266 units, up 102 percent, and the backlog dollar volume up 130 percent.
Our record combined total revenues of $1.2 billion, up 23 percent and our operating income of $119.8 million, up 84 percent for the year, ending in a net income of $72.1 million, up 46 percent for the year. Record earnings per diluted share of $7.27 was up 54 percent, and then we ended the year with an equity balance of $252 million.
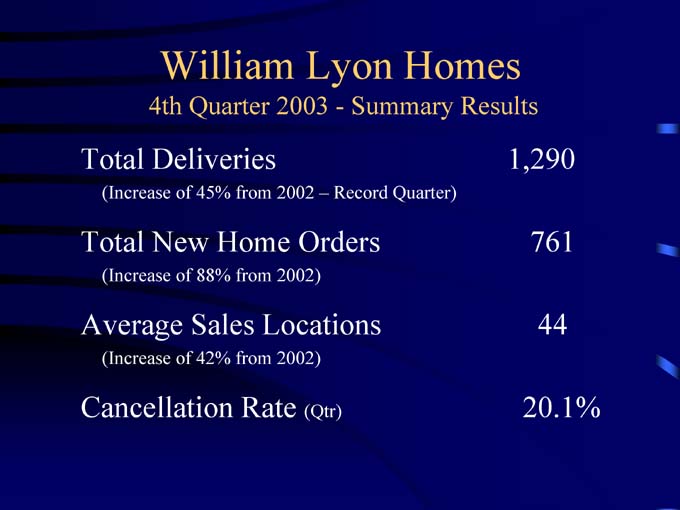
The next few comments will be related to the three months ended December 31st, 2003. As I previously mentioned, our new home deliveries, including unconsolidated joint ventures, were 1290 homes for the quarter, up 45 percent from 887 homes a year ago. Our net new home orders for the fourth quarter were 761 homes, up 88 percent from 405 homes for the quarter ended December 31st, 2002. The increase in the period over period net new home orders was primarily the result of the continued strength of the home building industry in our markets, as well as a 42 percent increase in the average number of sales locations to 44 for the quarter ended 2003 as compared to 31 in the comparable period a year ago.
We ended the year with 42 active sales locations, and I will talk more about the sales locations here in a minute.
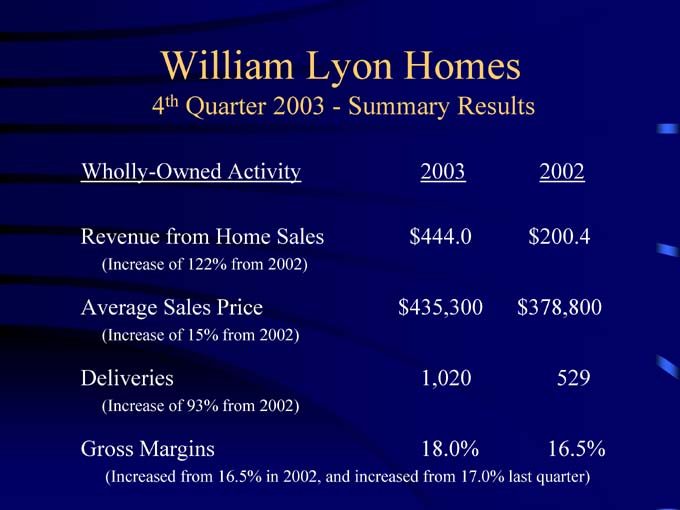
Our company-wide cancellation rate for the quarter was 20.1 percent. Revenues from our wholly-owned home sales for the fourth quarter were $444 million, up 122 percent compared to $200 million for the quarter ended December 31st, 2002. The higher revenues total was due to a 93 percent increase in our wholly-owned deliveries for the quarter to 1,020 combined with a 15 percent increase in the average sales price to $435,300 per unit.
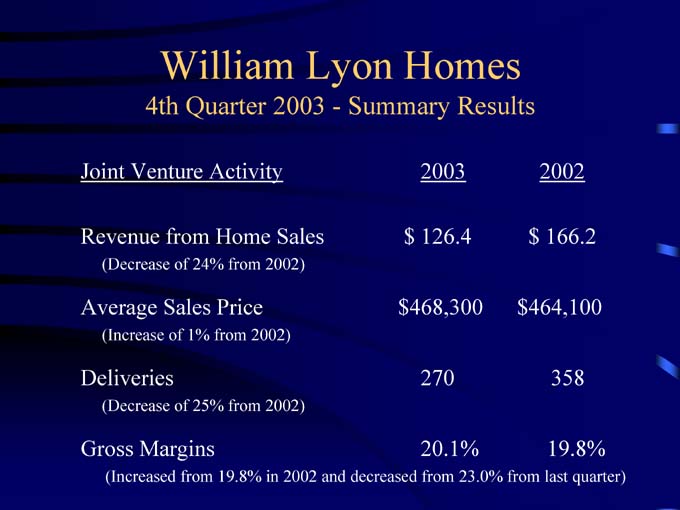
Our gross margins on our wholly-owned projects for the quarter were 18 percent, up from 16.5 percent for the same period last year and up from 17 percent for the quarter ended September 30, 2003. Revenues from our joint venture home sales for the fourth quarter were $126.4 million, down 24 percent when compared to $166.2 million for the quarter ended December 31st, 2002. The lower revenue total was primarily due to a 25 percent decrease in the joint venture deliveries to 270 from 358 last year.
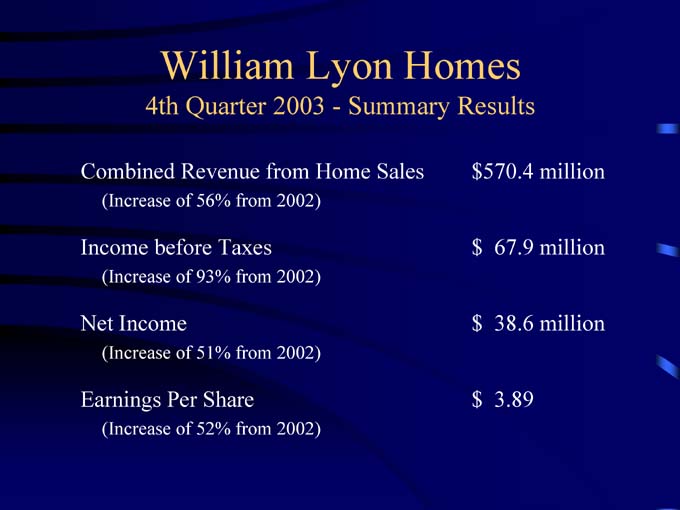
Gross margins on the Company’s joint ventures for the quarter ended December 31st, 2003 were 20.1 percent, down when compared to last quarter ended September 30th, but up from 19.8 percent for the quarter ended December 31st, 2002. Our combined revenues from home sales, including unconsolidated joint ventures, were $570 million for the fourth quarter, up 56 percent from $366 million for the comparable quarter a year ago, primarily again due to a 45 percent increase in deliveries to 1,290 combined with a 7 percent increase in the average sales price to $442,000.
Income before taxes increased 93 percent to $67.9 million for the quarter as compared to $35.2 million for the fourth quarter of 2002.
Our net income for the quarter increased 51 percent to $38.6 million or $3.89 per diluted share as compared to net income of $25.6 million or $2.56 per diluted share for the comparable period a year ago.
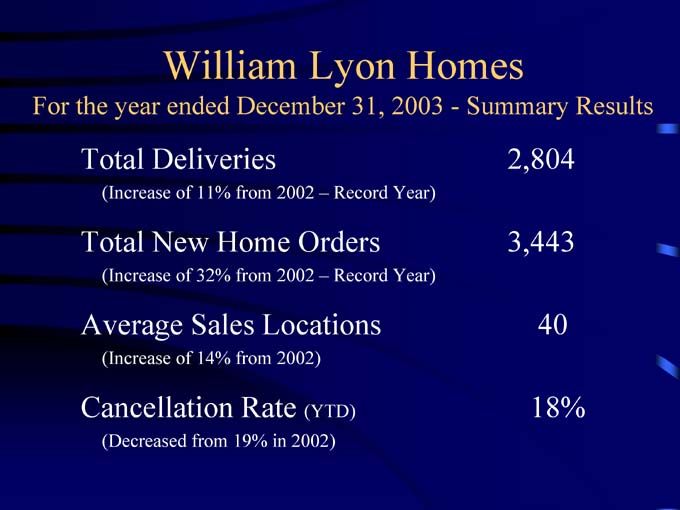
Now I will talk a little bit about the year 2003. We delivered a company record 2,804 homes in 2003, which is an increase of 11 percent from 2002. Approximately 69 percent of those were in California, 20 percent in Nevada and 11 percent in Arizona.
Our net new home orders for the year were also a company record—3,443, an increase of 32 percent as compared to 2,607 for 2002. The increase in year-over-year net new home orders was primarily the result of the continued strong demand in all of our markets combined with a 14 percent increase in the average number of sales locations to 40 for the year ended December 31st, 2003 as compared to 35 for the comparable period a year ago.
This overall 14 percent increase in sales locations was primarily generated in California and Nevada. In California, net new home orders increased 18 percent, while locations increased 12 percent to 28 locations from 25. And in Nevada, orders increased 117 percent, while locations increased 50 percent to 6 from 4.
Our net new home orders have continued to be relatively strong through January and the first couple of weeks in February where we have been averaging approximately 90 per week companywide through an average of 45 sales locations. Our companywide cancellation rate for 2003 decreased to 18 percent, which compares to 19 percent from 2002, and at the end of the year, we had only six completed and unsold units in inventory.
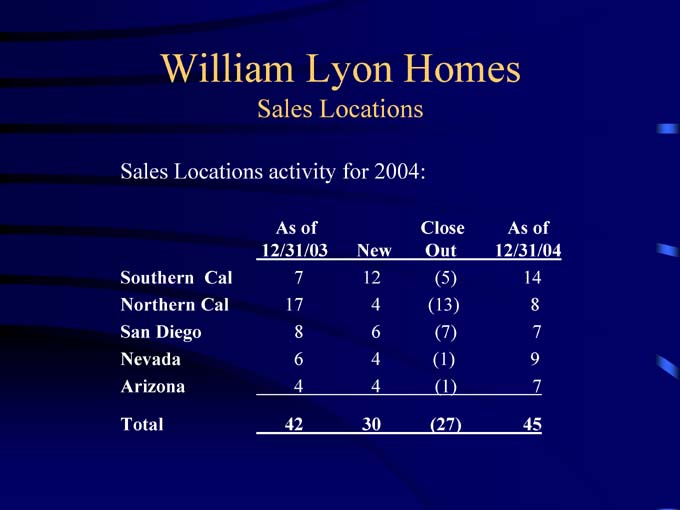
As I previously mentioned, we had 42 active sales locations open at December 31st, 2003, of which 32 were in California, six in Nevada and four in Arizona. During 2004, we anticipate opening 30 new sales locations, of which 22 are in California, four in Nevada and four in Arizona. This addition of 30 new communities, while closing out 27 communities, would result in approximately 45 active sales locations by the end of 2004. So it would represent about a 7 percent increase by the end of the year.
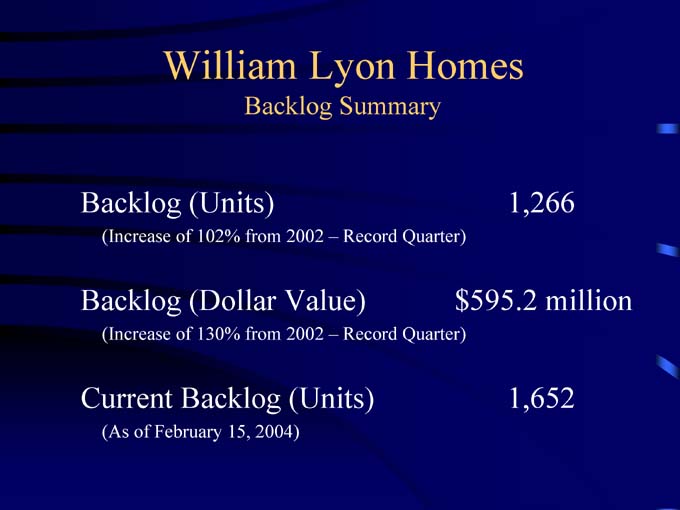
Companywide backlog of homes sold but not closed as of December 31st, 2003 was a year-end company record of 1,266 homes, up 102 percent from 627 units at December 31st, 2002. The dollar amount of backlog of homes sold but not closed was approximately $595 million, up 130 percent from $259 million a year ago. We anticipate delivering about 45 percent of those backlog units in the first quarter, and our current backlog as of the week ended February 15, 2004 has increased to 1,652 homes.
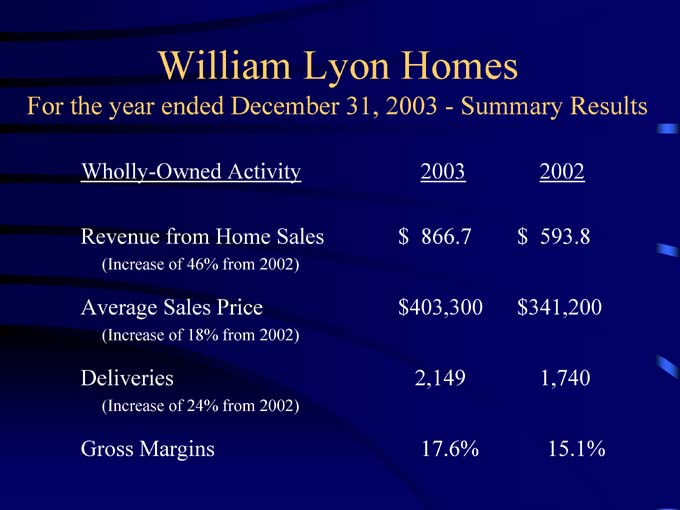
Revenues from our wholly-owned home sales for the year were $866 million, up 46 percent compared to the $593 million from 2002, and this higher revenue total was due to a 24 percent increase in our wholly-owned deliveries for the year to 2,149 combined with the 18 percent increase in the average sales price to $403,000.
3
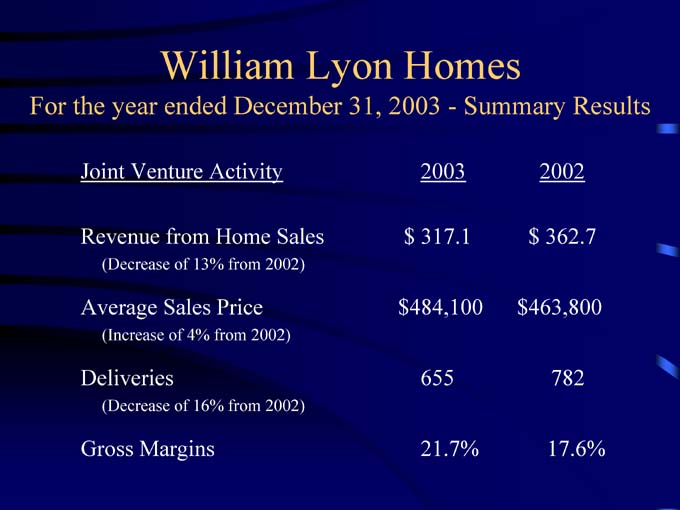
Gross margins on our wholly-owned projects for the year were at 17.6 percent, up from 15.1 percent for the year ended 2002. Revenues from our joint venture home sales for the year were $317 million, down 13 percent compared to $362 million from 2002. This lower revenue total again was primarily due to the result of the 16 percent decrease in the joint venture deliveries to 655 from 782 last year. Our gross margins on the Company’s joint ventures for the year ended December 31st were 21.7 percent, up from 17.6 percent for 2002.
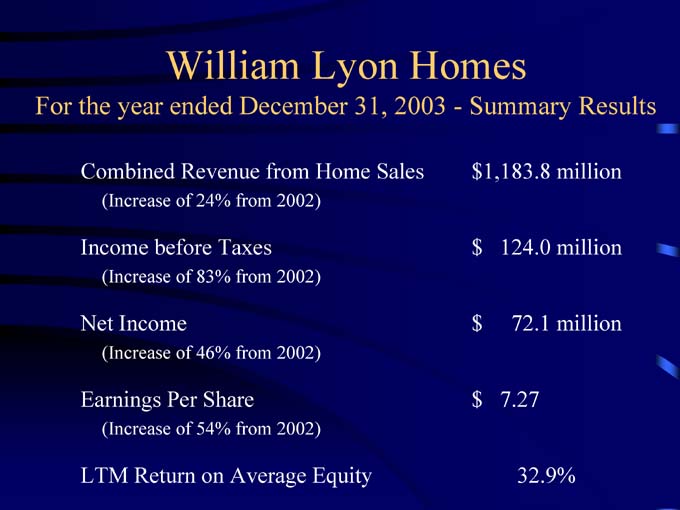
The result then is our combined revenues from home sales, including unconsolidated joint ventures. We are at $1.2 billion for the year, up 24 percent from $956 million for the comparable period a year ago, primarily due to a 11 percent increase in deliveries to the 2,804 combined with an 11 percent increase in our average sales price of $422,000.
Our combined SG&A expenses were 7.5 percent of combined revenues for the year, and that excludes $9.5 million of offsetting management fee income from our unconsolidated joint ventures. Our income before taxes increased 83 percent to $124 million for the year as compared to $67.8 million for 2002. Net income for the year increased 46 percent to a company record $72.1 million or $7.27 per diluted share as compared to net income of $49.5 million or $4.73 per share for 2002. And our return on average stockholders equity continues to be one of the highest in the industry at approximately 33 percent for the year.
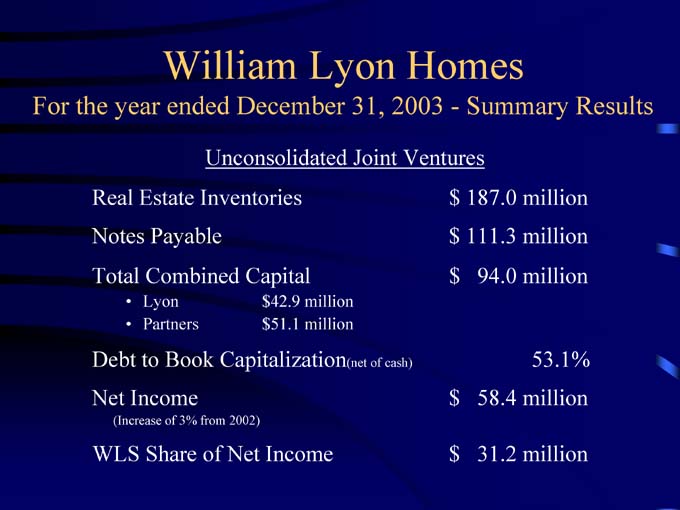
The Company continues to have a significant volume of activity in joint ventures. Our joint ventures accounted for approximately 27 percent of the Company’s combined revenue from the sale of homes and about 23 percent of the Company’s total deliveries. Real estate inventories from our unconsolidated joint ventures were approximately $187 million at the end of the year. These joint ventures have been financed with $94 million of equity, supporting $111 million of debt as of December 31st, 2003, which was a debt to cap ratio net of cash of about 53.1 percent.
Our total net income related to these ventures was approximately $58.4 million, up 3 percent from $56.7 million for the comparable period a year ago, and this was primarily due to about a 400 basis point increase in our gross margin to 21.7 percent and a 4 percent increase in the average sales price, which was offset then by that 16 percent reduction in our joint venture deliveries to 655. Our share of the income from the joint venture was approximately $31.2 million or about 53 percent.
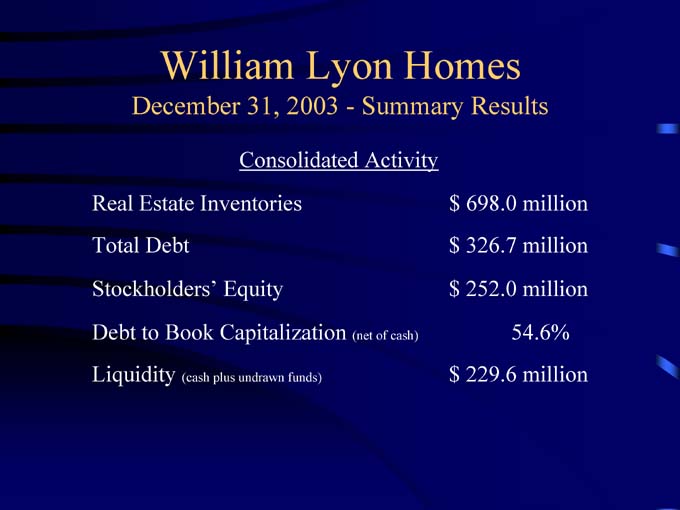
Our consolidated balance sheet was approximately $840 million in total assets, which included real estate inventories of close to $700 million, and $46 million was invested in the Company’s joint ventures as of the end of the year. Total debt was approximately $327 million at the end of the year, which included $246 million from our 10 3/4 percent notes and $71 million from our three revolving credit facilities and about $10 million from our nonrecourse mortgage notes. The Company’s debt to cap ratio net of cash was 54.6 percent as of December 31st, 2003.
In the fourth quarter, we did increase our commitment from $75 million on one of our credit facilities to $125 million, of which only $100 million is allowable at this time while we are looking for an additional participant. This facility was also extended to November of 2004. It is a 365 day loan. Given the increase in our current aggregate maximum loan on our commitments under these facilities, we are up to $325 million, again of which $25 million is not available currently. At the end of the year, we had approximately $205 million of availability under our credit facilities, which when added to our cash on hand brought our total liquidity to about $229.6 million.
Most of you are probably aware that on February 6 of this year we issued an additional $150 million of 7 1/2 percent senior notes, 10-year senior notes. The proceeds of those were used to repay outstanding indebtedness and for general corporate purposes.
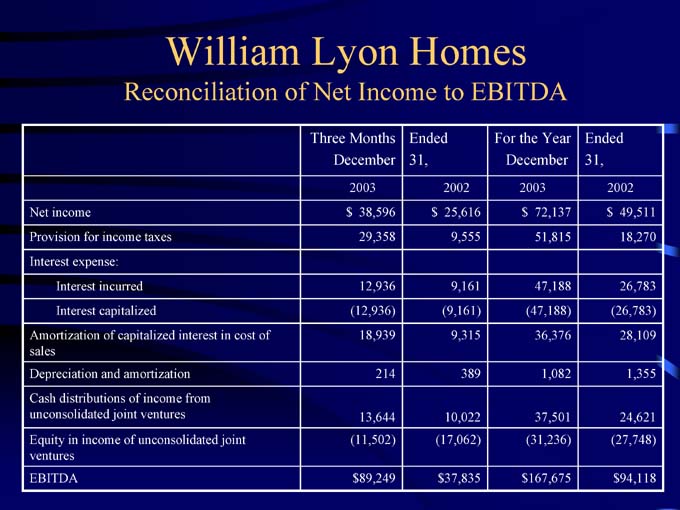
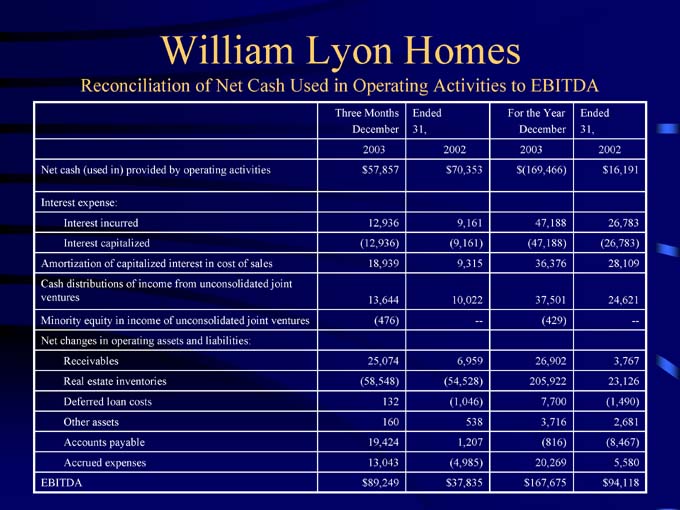
The next three slides—during this conference call, we will be referring to both GAAP and certain non-GAAP information. EBITDA is a non-GAAP financial measure, and management believes that this measure provides useful information to our investors regarding our financial condition and results of operations, and therefore, a definition and reconciliation of net income to EBITDA is presented in our press release and during this conference call, which are both available on our Website.
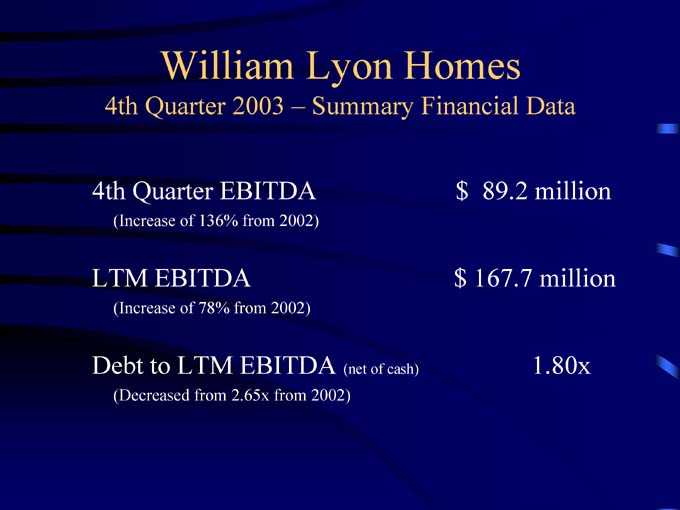
Our EBITDA increased 136 percent for the fourth quarter to $89.2 million. Our LTM EBITDA increased 78 percent for the year ended December 31st, 2003 to $167.7 million from $94.1 million for the comparable period a year ago. Our ratio then of net debt to LTM EBITDA was 1.8 times, which is an improvement from 2.65 times for the year ended December 31st, 2002.
Our stock price has seen an increase of over 1,500 percent from $3.75 at the close of the first business day after the acquisition in November of 1999 to $62.77 at December 31st, 2003. Last year our stock ranked number 15 on the New York Stock Exchange Best Stock list and was the number one home builder with an increase in stock price of 187.5 percent. The stock closed yesterday at $79.59, an increase of almost 20 percent year-to-date for 2004.
As of December 31st, 2003 our lots owned—I am sorry—are 6,174 of which 1,142 are in our unconsolidated joint ventures. Owned lots represent about 34 percent of our total lots controlled. Approximately 55 percent of the owned lots are in California, 21 percent in Nevada and 24 percent in Arizona. The Company had another almost 12,000 option lots representing about 66 percent of our total 18,172 lots. That is roughly about a six-year supply.
Lastly, given the continued strength of the home building industry and the strong demand for our homes in our markets, and particularly in many of our California markets where the demand
4
for housing continues to far exceed the available supply of housing, we wanted to provide some updated guidance for 2004. We are anticipating deliveries, including our joint ventures, to increase approximately 10 to 15 percent. Our combined home building revenue growth of 25 to 30 percent and our EBITDA growth of 35 to 40 percent.
2003 was again a spectacular year for the Company by virtually all measures. But we are very excited about the future years here at the Company to come, and we feel well-positioned for our growth in our markets.
At this point, Jean, then we will turn it over for questions for the group.
QUESTION AND ANSWER
Operator
(OPERATOR INSTRUCTIONS). Robert Manowitz, UBS.
Robert Manowitz—UBS—Analyst
Good afternoon. (inaudible). As you look at your California business, are there changes in the margin hurdle rates above which you would share the profits with the master plan developers? Is that hurdle rate getting higher and higher as we go forward?
Wade Cable—William Lyon Homes—President & COO
The deals are all—not all but in many of the big master plans, especially in Southern California—the deals are structured where we begin to split profits after a minimum return with the land seller. As the market is firming up and as supply of land is getting shorter, those deals are getting a little more difficult than they were, a little more rich for the land seller. But still given the markets they are in, the Irvine ranch and places like that, the deals still make a lot of economic sense.
Robert Manowitz—UBS—Analyst
How are they changing those specifically in terms of getting tougher? Is it the actual minimum return threshold that is going higher?
Wade Cable—William Lyon Homes—President & COO
Well, they are actually tightening down probably a little bit on the cost ratios. (multiple speakers) on what they allow—
Mike Grubbs—William Lyon Homes—CFO & Sr. VP
You have an allowable soft costs, and then the margin that it has been applied to is typically 6 to 7 percent, and historically they were sharing 50 percent of that. They are now going to—they get 70 percent of the profits over those margins.
Robert Manowitz—UBS—Analyst
Okay. Secondly, a little bit of a big picture question, but we have been looking at the percentage of ARMs as a percentage of the total financing out there, and it seems in California it has upticked above 50 percent.
5
My question is twofold. One is any sort of estimate as to what the percentage of ARMs that your buyers are using? And two, is there a level where you just think—obviously 100 percent would maybe maximum—but there is a level that you think realistically that ARMs peak out because you will have some buyers just not willing to take that shorter interest rate protection?
Wade Cable—William Lyon Homes—President & COO
I don’t have a specific number for you, but my sense is that something a little less than 50 percent. I would say in the 40s. It is a project by project situation. The higher-end projects where people with huge equity dollars tend to more 30 year fixed. It depends a little on the mix at the time. I think your trend is getting close.
Robert Manowitz—UBS—Analyst
Do you think there is a sort of a threshold, just your best guest as to what that maximum penetration of ARMs can be?
Wade Cable—William Lyon Homes—President & COO
No, I don’t.
Robert Manowitz—UBS—Analyst
Where I was heading was when you look at the uptick in ARMs and maybe it is a function of offsetting dollar price increases in homes, and I was wondering if that continued to offset the price appreciation, or if at some point, we could get to some sort of a glass ceiling?
Wade Cable—William Lyon Homes—President & COO
I don’t know.
Robert Manowitz—UBS—Analyst
Fair enough. It is just a big picture question. I just wanted to get your feedback. Thank you. Congratulations on the quarter.
Operator
Michael Kinder, Citigroup.
Michael Kinder—Citigroup—Analyst
I was wondering a couple of questions. One is you talked about your volumes, and so far in the first quarter, what type of price appreciation are you seeing, particularly Northern and Southern California year-over-year?
Wade Cable—William Lyon Homes—President & COO
Significant. I do not have a number, but I will show you a just last night story because there is one everyday. But we’re building down in Talega, which is in San Clemente. We had a preview meeting last night for the interest list. We invited roughly 200 people. 150 showed up at a hotel. In order to get a tour of the site, you had to be prequalified, fill out all the applications and give us a $10,000 deposit. We anticipate releasing 16 homes in the next couple of weeks. We have 72 people that gave us the $10,000. The appreciation is significant. The demand is incredible.
Michael Kinder—Citigroup—Analyst
That sounds strong. Right now you are interested in three states. You are a lot more profitable and a lot less leveraged than you were a couple of years ago. Any thoughts of expansion?
Wade Cable—William Lyon Homes—President & COO
Within our existing markets, and we are as you see—we have grown this company as Mike’s numbers indicate over the last year almost 30 percent. We still believe that the catch phrase we use. We can grow the bottom line without growing the top line by virtue of reducing the joint ventures which we are seeing that trend begin. So our much improved capital structure gives us a great deal of opportunity to growth.
But we have great opportunities in the markets that we are in. We have come up to be number 11 in the Inland Empire of Southern California from the low 20s, and I think we will significantly increase that and have very significant marketshares in all of our markets. So we feel like we can grow within our existing markets and have great opportunities. No, we do not plan on entering any new markets.
Michael Kinder—Citigroup—Analyst
Great. Thank you.
Operator
Catherine Walsh, Capital Growth Management.
Catherine Walsh—Capital Growth Management—Analyst
Good morning. I just wanted to ask you, how is it that you are able to get lost in a very competitive bidding situation?
6
Wade Cable—William Lyon Homes—President & COO
Do you mean land?
Catherine Walsh—Capital Growth Management—Analyst
Yes.
Wade Cable—William Lyon Homes—President & COO
Well, primarily relationship. But the formula that Mike described to you, which we share with the land seller and the upside, has a great deal to do with that. The more successful we are in a master plan community in producing profits, the more they are actually getting for their land. So we are even in the position today, which is almost unheard-of in two or three of the master plan communities, we have actually been invited in without going through this beauty contest situation that we normally do. Normally we would compete with a group of two or three builders and do a beauty contest and then have an economic contest.
So we just, I think, outperformed many of the peer groups, and we have been in the business in all of these markets we are in, with the exception of Las Vegas for 35, 40, 50 years.
Catherine Walsh—Capital Growth Management—Analyst
Great. I just have one quick follow-up. You mentioned something earlier on the call regarding how February—you mentioned something about business. Could you repeat that? I missed that part.
Mike Grubbs—William Lyon Homes—CFO & Sr. VP
What I talked about is our backlog was actually (multiple speakers) through February 15th to 1,652 homes, and we have been averaging about 90 sales per week.
Operator
(OPERATOR INSTRUCTIONS). Dolores Glenn (ph), William Lyon Homes.
Dolores Glenn—Private Investor
I am not really sure what I wanted to ask. Kind of ridiculous actually. Your stock, which I own a lot of. I am just very worried about it. It is just going to continue to go up is probably the question you are not going to be able to answer. But it did so good last year.
Wade Cable—William Lyon Homes—President and COO
It did pretty well this year. As Mike indicated, since the first of the year, we are up over 20 percent. We would not make a comment on what will happen with the stock.
Dolores Glenn—Private Investor
You cannot really. You cannot. Okay. Thank you.
Operator
(OPERATOR INSTRUCTIONS). Jim Rainey (ph). UBS.
Jim Rainey—UBS—Analyst
Good morning, gentlemen. Do you see the need for any debt or equity financing in the next six to nine months?
Mike Grubbs—William Lyon Homes—CFO & Sr. VP
No. I think our capital structure is pretty much in place for the next six or nine months. We may talk to one additional lender on another secure facility, but we just a new bond offering of $150 million about a week, two weeks ago.
Jim Rainey—UBS—Analyst
Okay. Thank you.
Operator
(OPERATOR INSTRUCTIONS). Gentlemen, I show no questions at this time. I would like to turn it back over to you for your closing remarks.
Mike Grubbs—William Lyon Homes—CFO & Sr. VP
Thanks, Jean. I appreciate everybody joining us on our call today. Again, as I mentioned, we look forward to great things in the year 2004, and we look forward to talking to you at the end of the first quarter. Thanks a lot.
Operator
Ladies and gentlemen, thank you for joining us on today’s call. You may now disconnect your lines.
7

William Lyon Homes
Fourth Quarter and Year End 2003 Earnings Conference Call
February 20, 2004

William Lyon Homes
Disclosure Statement
• Certain statements contained in this release and conference call that are not historical information contain forward-looking statements. The forward-looking statements involve risk and uncertainties and actual results may differ materially from those projected or implied. Further, certain forward-looking statements are based on assumptions of future events which may not prove to be accurate. Factors that may impact such forward-looking statements include, among others, changes in general economic conditions and in the markets in which the Company competes, changes in interest rates and competition, as well as the other factors discussed in the Company’s reports filed with the Securities and Exchange Commission.
William Lyon Homes
2003 Highlights & Accomplishments
Record new home orders of 3,443 – up 32% Record total deliveries of 2,804 – up 11% Record year end backlog of 1,266 units – up 102%
Record year end backlog dollar value of $595.2 million– up 130% Record combined total revenues of $1,223 million – up 23% Record operating income of $119.8 million – up 84% Record net income of $72.1 million – up 46% Record earnings per diluted share of $7.27 – up 54% Year-end equity balance of $252 million
William Lyon Homes
4th Quarter 2003—Summary Results
Total Deliveries 1,290
(Increase of 45% from 2002 – Record Quarter)
Total New Home Orders 761
(Increase of 88% from 2002)
Average Sales Locations 44
(Increase of 42% from 2002)
Cancellation Rate (Qtr) 20.1%
 ss
ss
William Lyon Homes
4th Quarter 2003—Summary Results
Wholly-Owned Activity 2003 2002
Revenue from Home Sales $444.0 $200.4
(Increase of 122% from 2002)
Average Sales Price $435,300 $378,800
(Increase of 15% from 2002)
Deliveries 1,020 529
(Increase of 93% from 2002)
Gross Margins 18.0% 16.5%
(Increased from 16.5% in 2002, and increased from 17.0% last quarter)
William Lyon Homes
4th Quarter 2003—Summary Results
Joint Venture Activity 2003 2002
Revenue from Home Sales $ 126.4 $ 166.2
(Decrease of 24% from 2002)
Average Sales Price $468,300 $464,100
(Increase of 1% from 2002)
Deliveries 270 358
(Decrease of 25% from 2002)
Gross Margins 20.1% 19.8%
(Increased from 19.8% in 2002 and decreased from 23.0% from last quarter)
William Lyon Homes
4th Quarter 2003—Summary Results
Combined Revenue from Home Sales $570.4 million
(Increase of 56% from 2002)
Income before Taxes $ 67.9 million
(Increase of 93% from 2002)
Net Income $ 38.6 million
(Increase of 51% from 2002)
Earnings Per Share $ 3.89
(Increase of 52% from 2002)
William Lyon Homes
For the year ended December 31, 2003—Summary Results
Total Deliveries 2,804
(Increase of 11% from 2002 – Record Year)
Total New Home Orders 3,443
(Increase of 32% from 2002 – Record Year)
Average Sales Locations 40
(Increase of 14% from 2002)
Cancellation Rate (YTD) 18%
(Decreased from 19% in 2002)
William Lyon Homes
Sales Locations
Sales Locations activity for 2004:
As of Close As of 12/31/03 New Out 12/31/04 Southern Cal 7 12 (5) 14 Northern Cal 17 4 (13) 8 San Diego 8 6 (7) 7 Nevada 6 4 (1) 9 Arizona 4 4 (1) 7
Total 42 30 (27) 45
William Lyon Homes
Backlog Summary
Backlog (Units) 1,266
(Increase of 102% from 2002 – Record Quarter)
Backlog (Dollar Value) $595.2 million
(Increase of 130% from 2002 – Record Quarter)
Current Backlog (Units) 1,652
(As of February 15, 2004)
William Lyon Homes
For the year ended December 31, 2003—Summary Results
Wholly-Owned Activity 2003 2002
Revenue from Home Sales $ 866.7 $ 593.8
(Increase of 46% from 2002)
Average Sales Price $403,300 $341,200
(Increase of 18% from 2002)
Deliveries 2,149 1,740
(Increase of 24% from 2002)
Gross Margins 17.6% 15.1%
William Lyon Homes
For the year ended December 31, 2003—Summary
Joint Venture Activity 2003 2002
Revenue from Home Sales $ 317.1 $ 362.7
(Decrease of 13% from 2002)
Average Sales Price $484,100 $463,800
(Increase of 4% from 2002)
Deliveries 655 782
(Decrease of 16% from 2002)
Gross Margins 21.7% 17.6%
William Lyon Homes
For the year ended December 31, 2003—Summary Results
Combined Revenue from Home Sales $1,183.8 million
(Increase of 24% from 2002)
Income before Taxes $ 124.0 million
(Increase of 83% from 2002)
Net Income $ 72.1 million
(Increase of 46% from 2002)
Earnings Per Share $ 7.27
(Increase of 54% from 2002)
LTM Return on Average Equity 32.9%
William Lyon Homes
For the year ended December 31, 2003—Summary Results
Unconsolidated Joint Ventures
Real Estate Inventories $ 187.0 million Notes Payable $ 111.3 million Total Combined Capital $ 94.0 million
• Lyon $42.9 million
• Partners $51.1 million
Debt to Book Capitalization(net of cash) 53.1% Net Income $ 58.4 million
(Increase of 3% from 2002)
WLS Share of Net Income $ 31.2 million
William Lyon Homes
December 31, 2003—Summary Results
Consolidated Activity
Real Estate Inventories $ 698.0 million Total Debt $ 326.7 million Stockholders’ Equity $ 252.0 million Debt to Book Capitalization (net of cash) 54.6% Liquidity (cash plus undrawn funds) $ 229.6 million

William Lyon Homes
EBITDA
• EBITDA means net income plus (i) provision for income taxes, (ii) interest expense, (iii) amortization of capitalized interest included in cost of sales, (iv) depreciation and amortization and (v) cash distributions of income from unconsolidated joint ventures less equity in income of unconsolidated joint ventures. Other companies may calculate EBITDA differently. EBITDA is not a financial measure prepared in accordance with generally accepted accounting principles. EBITDA is presented herein because it is a component of certain covenants in the Indenture governing the Company’s 10 ¾% Senior Notes and 7 ½% Senior Notes (“Indentures”).
• In addition, management believes the presentation of EBITDA provides useful information to the Company’s investors regarding the Company’s financial condition and results of operations because EBITDA is a widely utilized financial indicator of a company’s ability to service and/or incur debt. The calculations of EBITDA below are presented in accordance with the requirements of the Indentures. EBITDA should not be considered as an alternative for net income, cash flows from operating activities and other consolidated income or cash flow statement data prepared in accordance with accounting principles generally accepted in the United States or as a measure of profitability or liquidity.
William Lyon Homes
Reconciliation of Net Income to EBITDA
Three Months Ended For the Year Ended
December 31, December 31,
2003 2002 2003 2002
Net income $ 38,596 $ 25,616 $ 72,137 $ 49,511
Provision for income taxes 29,358 9,555 51,815 18,270
Interest expense:
Interest incurred 12,936 9,161 47,188 26,783
Interest capitalized (12,936) (9,161) (47,188) (26,783)
Amortization of capitalized interest in cost of 18,939 9,315 36,376 28,109
sales
Depreciation and amortization 214 389 1,082 1,355
Cash distributions of income from
unconsolidated joint ventures 13,644 10,022 37,501 24,621
Equity in income of unconsolidated joint (11,502) (17,062) (31,236) (27,748)
ventures
EBITDA $89,249 $ 37,835 $ 167,675 $94,118
William Lyon Homes
Reconciliation of Net Cash Used in Operating Activities to EBITDA
Three Months Ended For the Year Ended
December 31, December 31,
2003 2002 2003 2002
Net cash (used in) provided by operating activities $ 57,857 $ 70,353 $ (169,466) $ 16,191
Interest expense:
Interest incurred 12,936 9,161 47,188 26,783
Interest capitalized (12,936) (9,161) (47,188) (26,783)
Amortization of capitalized interest in cost of sales 18,939 9,315 36,376 28,109
Cash distributions of income from unconsolidated joint
ventures 13,644 10,022 37,501 24,621
Minority equity in income of unconsolidated joint ventures (476) — (429) —
Net changes in operating assets and liabilities:
Receivables 25,074 6,959 26,902 3,767
Real estate inventories (58,548) (54,528) 205,922 23,126
Deferred loan costs 132 (1,046) 7,700 (1,490)
Other assets 160 538 3,716 2,681
Accounts payable 19,424 1,207 (816) (8,467)
Accrued expenses 13,043 (4,985) 20,269 5,580
EBITDA $ 89,249 $ 37,835 $ 167,675 $ 94,118
William Lyon Homes
4th Quarter 2003 – Summary Financial Data
4th Quarter EBITDA $ 89.2 million
(Increase of 136% from 2002)
LTM EBITDA $ 167.7 million
(Increase of 78% from 2002)
Debt to LTM EBITDA (net of cash) 1.80x
(Decreased from 2.65x from 2002)
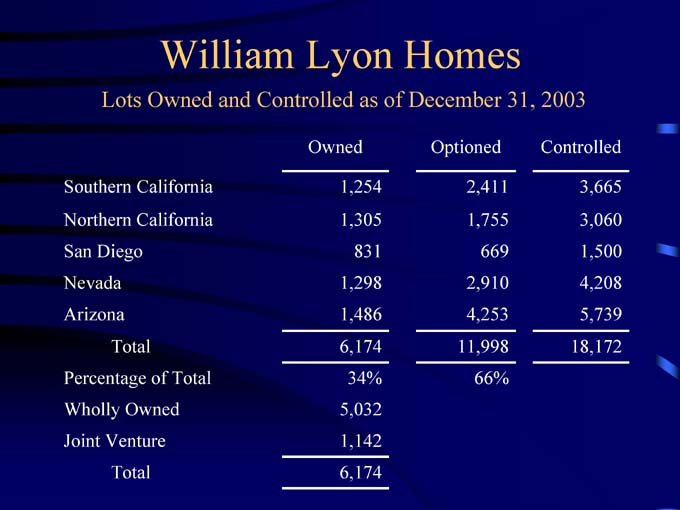
William Lyon Homes
Lots Owned and Controlled as of December 31, 2003
Owned Optioned Controlled
Southern California 1,254 2,411 3,665
Northern California 1,305 1,755 3,060
San Diego 831 669 1,500
Nevada 1,298 2,910 4,208
Arizona 1,486 4,253 5,739
Total 6,174 11,998 18,172
Percentage of Total 34% 66%
Wholly Owned 5,032
Joint Venture 1,142
Total 6,174
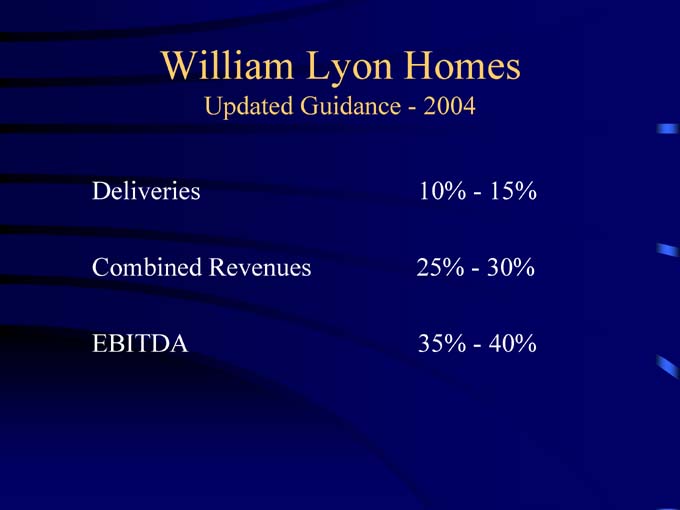
William Lyon Homes
Updated Guidance—2004 Deliveries 10%—15% Combined Revenues 25%—30% EBITDA 35%—40%

William Lyon Homes
Fourth Quarter and Year End 2003 Earnings Conference Call
February 20, 2004


 ss
ss


