EXHIBIT 99.2
FINAL TRANSCRIPT

CCBN StreetEvents Conference Call Transcript
WLS—Q1 2004 William Lyon Homes Earnings Conference Call
Event Date/Time: May. 12. 2004 / 2:00PM ET
Event Duration: N/A
1
CORPORATE PARTICIPANTS
Mike Grubbs
William Lyon Homes—Senior Vice President and Chief Financial Officer
General William Lyon
William Lyon Homes—Chairman and Chief Executive Officer
Wade Cable
William Lyon Homes—President and Chief Operating Officer
Doug Harris
William Lyon Homes—Vice President, Corporate Controller and Corporate Secretary
William H. Lyon
William Lyon Homes—Board of Director and Director of Corporate Affairs
CONFERENCE CALL PARTICIPANTS
Robert Manowitz
UBS—Analyst
Jim Raney
UBS—Analyst
Bob Cline
Bear Stearns—Analyst
Don Lucek
Decision Economics—Analyst
PRESENTATION
Operator
Good day, ladies and gentlemen, and welcome to the William Lyon Homes’ first-quarter 2004 earnings conference call. My name is Stephen and I will be your coordinator for today. At this time, all participants are in a listen-only mode. We will be facilitating a question-and-answer session toward the end of this conference. (OPERATOR INSTRUCTIONS) As a reminder this conference is being recorded for replay purposes. I would now like to turn the presentation over to your host for today’s call, Mr. Michael Grubbs. Please proceed, sir.
Mike Grubbs—William Lyon Homes—Senior Vice President and Chief Financial Officer
Thank you Stephen. I want to welcome everyone to today’s conference call. Also joining me today from the company are General William Lyon, Chairman and Chief Executive Officer; Wade Cable, President and Chief Operating Officer; Doug Harris, Vice President, Corporate Controller and Corporate Secretary; and Bill H. Lyon, Board of Director and Director of Corporate Affairs.
This conference call is also being broadcast on our website at www.WilliamLyonHomes.com, where there is a detailed investor relations section which complements the site providing financial information, live and replay broadcast of previous earnings conference calls, as well as e-mail alerts for all future calls, press releases, and filings. This conference call will also be available for replay within two hours of the end of this call.
I’ll read the disclosure first. Certain statements contained in this release and conference call that are not historical information contain forward-looking statements. The forward-looking statements involve risks and uncertainties, and actual results may differ materially from those projected or implied. Further, certain forward-looking statements are based on assumptions of future events, which may not prove to be accurate.
Factors that may impact such forward-looking statements include, among others, changes in general economic conditions and in the markets in which the company competes, changes in interest rates and competition, as well as other factors discussed in the company’s reports filed with the Securities and Exchange Commission.
Just to begin we are very pleased with our overall results for the quarter ended March 31, 2004, which culminated in many records for the company. We had record new home orders of 1,092 homes, up 44 percent year-over-year. Record deliveries including joint ventures of 603, which is up 91 percent over the previous quarter last year. Record first-quarter end backlog of 1,755 units, up 64 percent. Record quarter-end dollar value in backlog for any quarter in the company’s history of $916 million, up 122 percent.
2
Record first-quarter operating revenues of $254.5 million, up 251 percent. Record first-quarter operating income of $25.7 million, up 237 percent, which generated a record net income of $15.4 million, up 216 percent, and record earnings per diluted share of $1.55 per share, up 216 percent.
We ended the quarter with an equity balance of over $269 million; and subsequent to the end of the quarter, we were notified by both agencies, Moody’s and Standard & Poor’s, that we received an upgrade. Our new corporate credit rating is a B+/B1 and the Senior Notes were upgraded to a B/B2. Standard & Poor’s also left us with a positive outlook on the company.
As I previously mentioned, we delivered a company record 603 homes for the first quarter, an increase of 91 percent from 315 homes a year ago. Approximately 54 percent were in California, 26 percent in Nevada, and 10 percent in Arizona. Our net new home orders for the first quarter were 1,092 homes, up 44 percent from 757 homes for the quarter ended March 31, 2003.
The increase in period-over-period net new home orders was primarily the result of the continued strength in the homebuilding industry in our markets, at a 26 percent increase in the average number of sales locations to 44 for the quarter ended March 31, 2004, as compared to 35 in the comparable period a year ago.
We ended the quarter with 47 active sales locations. This overall 26 percent increase in average sales locations was generated all in California, offset by a slight reduction in Arizona. In California, our net new home orders increased 67 percent, while locations increased 43 percent to 33 locations from 23. I will talk a little bit more about our sales locations in a minute.
Our net new home orders have continued to be relatively strong through April and the first part of May, where we have been averaging approximately 85 per week companywide through an average of 44 sales locations. Our companywide cancellation rate for the quarter was 12 percent as compared to 16 percent for the quarter ended March 31, 2003. At the end of the quarter, we had only 5 completed and unsold units in inventory.
As I also previously mentioned we had 47 active sales locations open at the end of March 2004, of which 34 were in California, 7 in Nevada, and 6 in Arizona. During the balance of 2004 we anticipate opening an additional 20 new sales locations, of which 15 are in California, 3 in Nevada, and 2 in Arizona. This addition of 20 new communities and closing out 26 communities would result in approximately 41 active sales locations by the end of 2004, this would represent a slight decrease of one sales location from the end of 2003.
Our companywide backlog of homes sold but not closed as of March 31, 2004, was a first-quarter company record of 1,755 homes, up 64 percent from 1,069 units as of March 31, 2003. The dollar amount of backlog of homes sold but not closed was a record for any quarter end in the company’s history at $916.6 million, up 122 percent from $413.4 million a year ago. We anticipate delivering over 40 percent of those backlog units in the second quarter. Our current backlog as of the week ended May 9, 2004, has increased to 2,016 homes.
Revenues from our wholly-owned home sales for the first quarter were $193.6 million, up 175 percent compared to $70.4 million for the quarter ended March 31, 2003. The higher revenue total was due to a 153 percent increase in our wholly-owned deliveries for the quarter to 465 combined with a 9 percent increase in the average sales price of $416,300. Gross margins in our wholly-owned projects for the quarter were 20.8 percent, up from 17.1 percent for the same period last year and up from 18 percent for the quarter ended December 31, 2003.
Revenues from our joint venture home sales for the first quarter were $61 million, down 12 percent compared to $69.4 million for the quarter ended March 31, 2003. This lower revenue total was primarily due to a 16 percent decrease in the average sales price for joint ventures to $441,900 from $529,500 last year, offset by a 5 percent increase in the number of deliveries to 138. Gross margins on the company’s joint ventures for the quarter ended March 31, 2004, were 22.6 percent, up from 20.1 percent when compared to last quarter ended December 31, 2003; and up slightly from the same period a year ago.
Our consolidated revenue from home sales, which now includes joint ventures, were $254.5 million for the first quarter, up 262 percent from $70.4 million for the comparable period a year ago, primarily due to a 91 percent increase in deliveries to 603 and the implementation of FIN 46 which I will discuss here in a minute, offset by a 5 percent decrease in the average sales price to $442,100.
Our income before tax increased 212 percent to $25.8 million for the quarter, as compared to $8.3 million for the first quarter of 2003. Net income for the quarter increased 216 percent to $15.4 million, or $1.55 per diluted share, as compared to net income of $4.9 million or $0.49 per share for the comparable period a year ago. Our return on average stockholders equity continues to be one of the highest in the industry at approximately 35 percent for the last 12 months.
As I mentioned the company continues to have a significant volume of activity in joint ventures. Effective January 1, 2004, in accordance with Financial Accounting Standards Board Interpretation No. 46, certain joint ventures and land banking arrangements created prior to February 1, 2003, have been determined to be Variable Interest Entities, in which the company is considered to be the primary beneficiary; and accordingly the assets, liabilities, and operations of all of these joint ventures and land banking arrangements
3
have been consolidated with the company’s financial statements as of January 1, 2004, and for the three months ended March 31, 2004.
Because the company had already recognized its proportionate share of joint venture earnings and losses under the equity method of accounting, the adoption of FIN 46 does not affect the company’s consolidated income. Our joint ventures accounted for approximately 24 percent of the company’s consolidated revenue from the sale of homes and 23 percent of the company’s deliveries.
Real estate inventories for our consolidated joint ventures were approximately $415 million at March 31, 2004. These joint ventures are financed with $310 million of equity, supporting $99 million of debt, as of March 31, 2004. Total net income for the quarter ended March 31, 2004, from our consolidated joint ventures was approximately $9.4 million, of which our share of this income was approximately $5.1 million or about 54 percent.
Our consolidated balance sheet has approximately $1.2 billion in total assets, which included real estate inventories of approximately $1.1 billion as of March 31, 2004. Of the $1.1 billion in real estate inventories, approximately $400 million was related to the consolidation of our joint ventures and land banking arrangements.
Most of you are also probably aware that on February 6, 2004, we issued $150 million of 7.5 percent 10-year Senior Notes. The net proceeds were used to repay outstanding indebtedness and for other general corporate purposes. Our total debt at the end of the quarter, then, was approximately $570 million, which included $397 million from our Senior Notes; $57 million from our three revolving credit facilities; $17 million from our nonrecourse mortgage notes; and $99 million from our consolidated joint ventures and land banking arrangements.
Our stockholder equity has grown to over $269 million at the end of the quarter, which was a book value of $27.37 per share. The company’s debt, excluding FIN 46 debt, to book capitalization net of cash was 62.4 percent as of March 31, 2004.
Our current aggregate maximum loan commitment continues to be $325 million of which $25 million is not available. As of March 31, 2004 we had approximately $193.5 million of availability under these three lines which when added to our cash on hand brought our total liquidity to approximately $217 million at the end of the quarter.
During the conference call we have been referring to both GAAP and certain non-GAAP information. EBITDA is a non-GAAP financial measure. Management believes that this measure provides useful information to our investors regarding our financial condition and results of operations; and therefore a definition and reconciliation of net income to EBITDA is presented in our press release and during this conference call, which both are available on our website.
Our EBITDA increased 295 percent for the first quarter to $36.4 million, and our LTM EBITDA increased 116 percent for the 12 months ended March 31, 2004, to $194.9 million from $90.3 million for the comparable 12 months ended March 31, 2003. Our ratio of net debt, which excludes FIN 46 debt, of $99 million to LTM EBITDA was 2.41 times which is improved from 3.77 times for the same period ended March 31, 2003.
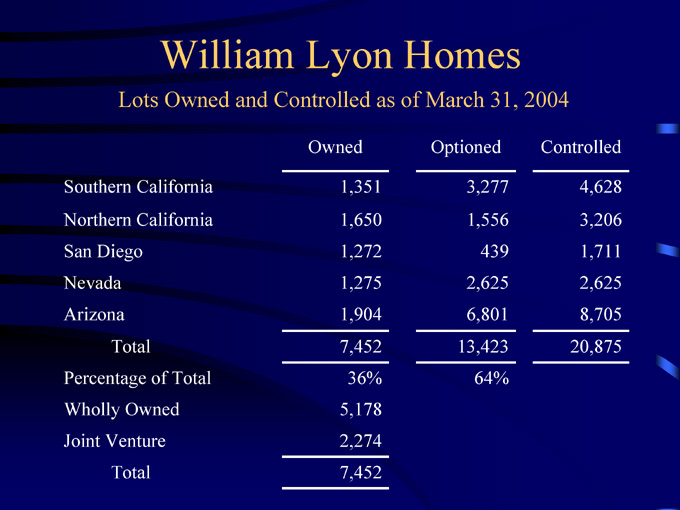
Our stock price closed the quarter at $93.20, and the closing price yesterday was $82.32, which was actually an increase of 31 percent year-to-date through 2004. Lots owned as of March 31, 2004, was 7,452, of which 2,274 are in our joint ventures. Owned lots represent about 36 percent of our total lots controlled. Approximately 57 percent of the owned lots are in California, 17 percent in Nevada, and 26 percent in Arizona. The company had another 13,423 optioned lots represented about 64 percent of our total. The total number of lots is 20,875 lots controlled.
At this point, Stephen, that is our remarks, and we would like to open it up for questions and answers.
4
QUESTION AND ANSWER
Operator
(OPERATOR INSTRUCTIONS) Robert Manowitz (ph) of UBS.
Robert Manowitz—UBS—Analyst
My suspicion is that April/May continued to be very solid. I am curious if you could compare April/May to the first quarter, understanding there is some seasonality. But did the strength continue to the same degree, or did things lighten up a little?
Mike Grubbs—William Lyon Homes—Senior Vice President and Chief Financial Officer
As I mentioned we have been averaging about 85 sales per week for the roughly six weeks that we have had sales since the end of the quarter, which is approximately about 500 sales. And we had 1,092 in the first quarter, so we have seen the continued strength if not a little bit stronger, actually.
Wade Cable—William Lyon Homes—President andChief Operating Officer
I think probably, if anything, it maybe have increased a bit.
Robert Manowitz—UBS—Analyst
Great. As I look out into the remainder of 2004, I’m kind of focused on your average price in backlog versus your unit change in backlog. Can you help me understand a little bit how the average price will play through in the next three quarters? It looks like you are easily going to sustain that 20 percent gross margin. Will that actually improve during the remainder of the year as well?
Mike Grubbs—William Lyon Homes—Senior Vice President and Chief Financial Officer
There’s a little bit of margin improvement. On the average sales price, I think our average sales price in backlog is about $522,000. That is a little bit higher than the company average for the year. As you know our first-quarter average was significantly below that.
Robert Manowitz—UBS—Analyst
Right. Okay. To the degree that— .
Mike Grubbs—William Lyon Homes—Senior Vice President and Chief Financial Officer
The change of product mixture over the balance of the year is going to bring that number down.
Robert Manowitz—UBS—Analyst
Fair enough, but to the degree that you exceed the 21 percent margins for the remainder of the year, are we talking 25 basis points? 100 basis points? What kind of outperformance?
Mike Grubbs—William Lyon Homes—Senior Vice President and Chief Financial Officer
I would say maybe 150 basis points.
Robert Manowitz—UBS—Analyst
Improvement? Okay. Thank you very much.
Operator
Jim Raney (ph), UBS.
Jim Raney—UBS—Analyst
Thank you very much and congratulations on a great quarter, gentleman. I’m wondering, I have noticed for the last year or two the number of lots under control substantially increasing. I know that from time to time during the downturn, real estate development companies have gotten into trouble when they own too many lots. Could you care to comment on what your situation is and what you see going forward?
Wade Cable—William Lyon Homes—President andChief Operating Officer
We basically only own about a third of the lots that we control. We control two-thirds; but we think that our strategy is pretty solid given your question. Especially understanding that we’re almost a pure merchant homebuilder. And most of these transactions are 100 to 150 lots, in some cases less than that. So we believe our inventory is pretty liquid in terms of being able to move through it in short order should that be necessary.
Jim Raney—UBS—Analyst
Thank you.
Operator
(OPERATOR INSTRUCTIONS) Bob Cline (ph) of Bear Stearns.
5
Bob Cline—Bear Stearns—Analyst
Following on the question regarding your land inventory, where have you been able to find lots recently? In terms of your plans going forward, where are you actively looking?
Wade Cable—William Lyon Homes—President and ChiefOperating Officer
I would say all of our divisions are doing quite well on land. We are in a real solid land position today. We have controlled a number of larger pieces in Arizona as part of our strategy. But each of our divisions has done quite well on land acquisition this year.
Bob Cline—Bear Stearns—Analyst
So specifically, now, let’s say in California, given the tightness of land supply, where are you able to find land?
Wade Cable—William Lyon Homes—President and ChiefOperating Officer
All over. San Diego, Inland Empire, Orange County, Northern California. We are not finding any real difficulty in finding land.
Bob Cline—Bear Stearns—Analyst
Okay. Thank you.
Operator
Don Lucek (ph), Decision Economics.
Don Lucek—Decision Economics—Analyst
I was just wondering if there was any change to your guidance that you gave our during the first-quarter call?
Mike Grubbs—William Lyon Homes—Senior Vice President and Chief Financial Officer
No, there is not. We may get some more guidance out after the second quarter.
Don Lucek—Decision Economics—Analyst
Terrific. Thank you.
Operator
(OPERATOR INSTRUCTIONS) It appears there are no further questions at this time, sir.
Mike Grubbs—William Lyon Homes—Senior Vice President and Chief Financial Officer
Okay. I want to thank everyone for joining us on the conference call. We look forward to our second-quarter results and speaking with you in about a quarter. Thank you for joining us. Bye.
Operator
Thank you for your participation in today’s conference. This concludes the presentation. You may now disconnect. Have a good day.
D I S C L A I M E R
CCBN reserves the right to make changes to documents, content, or other information on this web site without obligation to notify any person of such changes.
In the conference calls upon which Event Transcripts are based, companies may make projections or other forward-looking statements regarding a variety of items. Such forward-looking statements are based upon current expectations and involve risks and uncertainties. Actual results may differ materially from those stated in any forward-looking statement based on a number of important factors and risks, which are more specifically identified in the companies’ most recent SEC filings. Although the companies may indicate and believe that the assumptions underlying the forward-looking statements are reasonable, any of the assumptions could prove inaccurate or incorrect and, therefore, there can be no assurance that the results contemplated in the forward-looking statements will be realized.
THE INFORMATION CONTAINED IN EVENT TRANSCRIPTS IS A TEXTUAL REPRESENTATION OF THE APPLICABLE COMPANY’S CONFERENCE CALL AND WHILE EFFORTS ARE MADE TO PROVIDE AN ACCURATE TRANSCRIPTION, THERE MAY BE MATERIAL ERRORS, OMISSIONS, OR INACCURACIES IN THE REPORTING OF THE SUBSTANCE OF THE CONFERENCE CALLS. IN NO WAY DOES CCBN OR THE APPLICABLE COMPANY ASSUME ANY RESPONSIBILITY FOR ANY INVESTMENT OR OTHER DECISIONS MADE BASED UPON THE INFORMATION PROVIDED ON THIS WEB SITE OR IN ANY EVENT TRANSCRIPT. USERS ARE ADVISED TO REVIEW THE APPLICABLE COMPANY’S CONFERENCE CALL ITSELF AND THE APPLICABLE COMPANY’S SEC FILINGS BEFORE MAKING ANY INVESTMENT OR OTHER DECISIONS.
© 2004, CCBN, Inc. All Rights Reserved.
6

William Lyon Homes
First Quarter 2004 Earnings Conference Call
May 12, 2004

William Lyon Homes Disclosure Statement
• Certain statements contained in this release and conference call that are not historical information contain forward-looking statements. The forward-looking statements involve risk and uncertainties and actual results may differ materially from those projected or implied. Further, certain forward-looking statements are based on assumptions of future events which may not prove to be accurate. Factors that may impact such forward-looking statements include, among others, changes in general economic conditions and in the markets in which the Company competes, changes in interest rates and competition, as well as the other factors discussed in the Company’s reports filed with the Securities and Exchange Commission.
William Lyon Homes
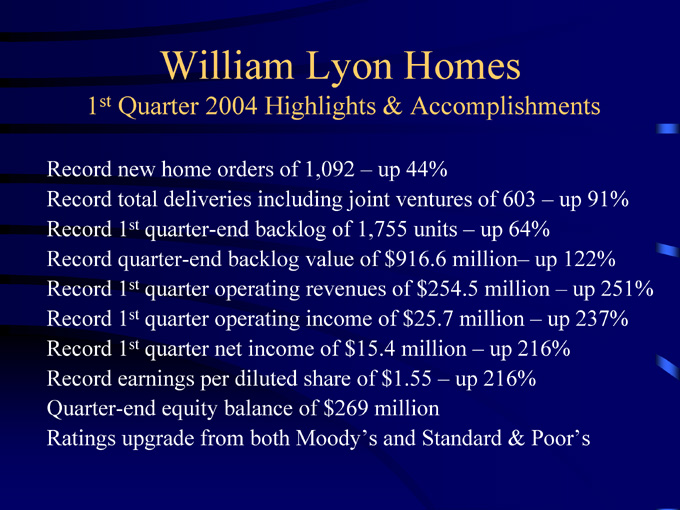
1st Quarter 2004 Highlights & Accomplishments
Record new home orders of 1,092 – up 44% Record total deliveries including joint ventures of 603 – up 91% Record 1st quarter-end backlog of 1,755 units – up 64% Record quarter-end backlog value of $916.6 million– up 122% Record 1st quarter operating revenues of $254.5 million – up 251% Record 1st quarter operating income of $25.7 million – up 237% Record 1st quarter net income of $15.4 million – up 216% Record earnings per diluted share of $1.55 – up 216% Quarter-end equity balance of $269 million Ratings upgrade from both Moody’s and Standard & Poor’s
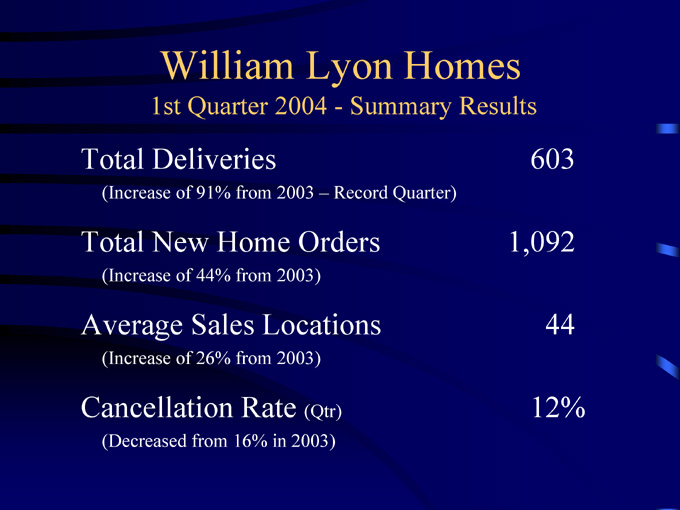
William Lyon Homes
1st Quarter 2004—Summary Results
Total Deliveries 603 (Increase of 91% from 2003 – Record Quarter)
Total New Home Orders 1,092 (Increase of 44% from 2003)
Average Sales Locations 44 (Increase of 26% from 2003)
Cancellation Rate (Qtr) 12% (Decreased from 16% in 2003)
William Lyon Homes
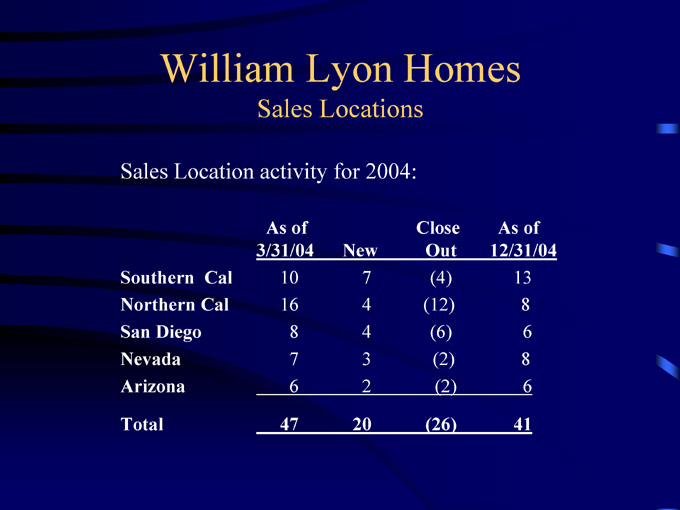
Sales Locations
Sales Location activity for 2004:
As of 3/31/04 New Close Out As of 12/31/04
Southern Cal 10 7 (4) 13
Northern Cal 16 4 (12) 8
San Diego 8 4 (6) 6
Nevada 7 3 (2) 8
Arizona 6 2 (2) 6
Total 47 20 (26) 41
William Lyon Homes
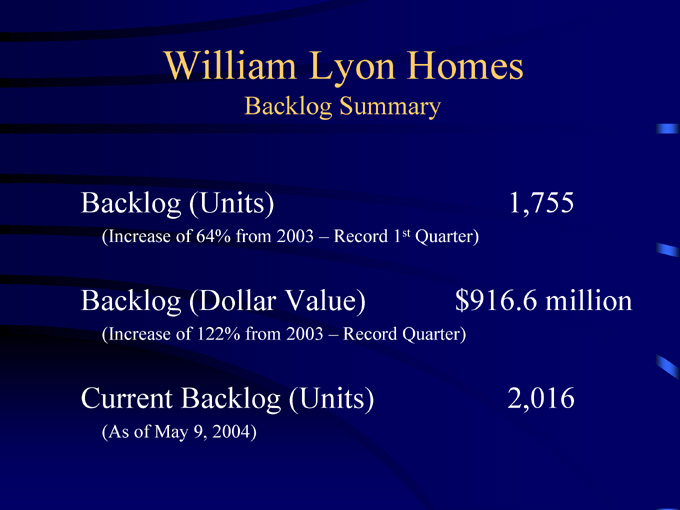
Backlog Summary
Backlog (Units) 1,755 (Increase of 64% from 2003 – Record 1st Quarter)
Backlog (Dollar Value) $916.6 million (Increase of 122% from 2003 – Record Quarter)
Current Backlog (Units) 2,016 (As of May 9, 2004)
William Lyon Homes
1st Quarter 2004—Summary Results
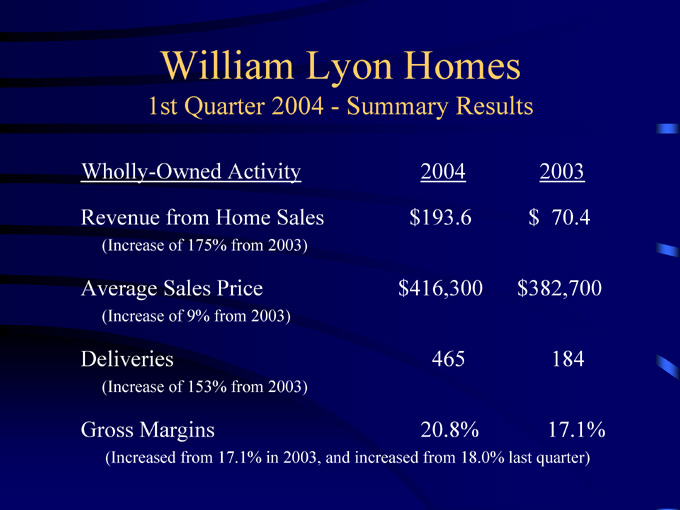
Wholly-Owned Activity 2004 2003
Revenue from Home Sales $193.6 $ 70.4 (Increase of 175% from 2003)
Average Sales Price $416,300 $382,700 (Increase of 9% from 2003)
Deliveries 465 184 (Increase of 153% from 2003)
Gross Margins 20.8% 17.1% (Increased from 17.1% in 2003, and increased from 18.0% last quarter)
William Lyon Homes
1st Quarter 2004—Summary Results
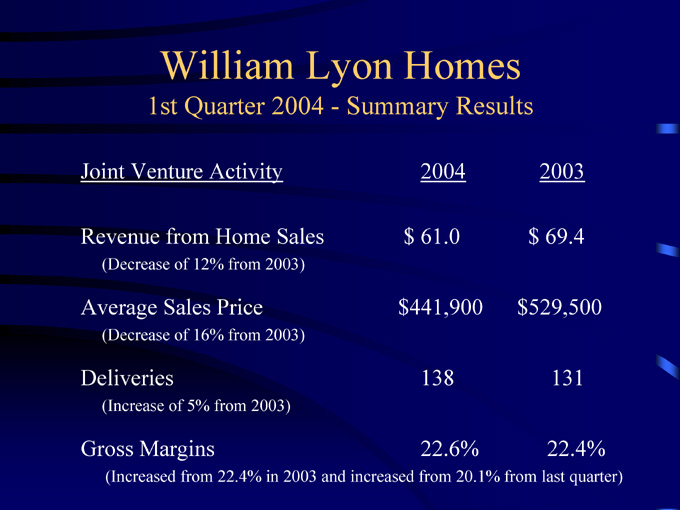
Joint Venture Activity 2004 2003
Revenue from Home Sales $ 61.0 $ 69.4 (Decrease of 12% from 2003)
Average Sales Price $441,900 $529,500 (Decrease of 16% from 2003)
Deliveries 138 131 (Increase of 5% from 2003)
Gross Margins 22.6% 22.4% (Increased from 22.4% in 2003 and increased from 20.1% from last quarter)
William Lyon Homes
1st Quarter 2004—Summary Results
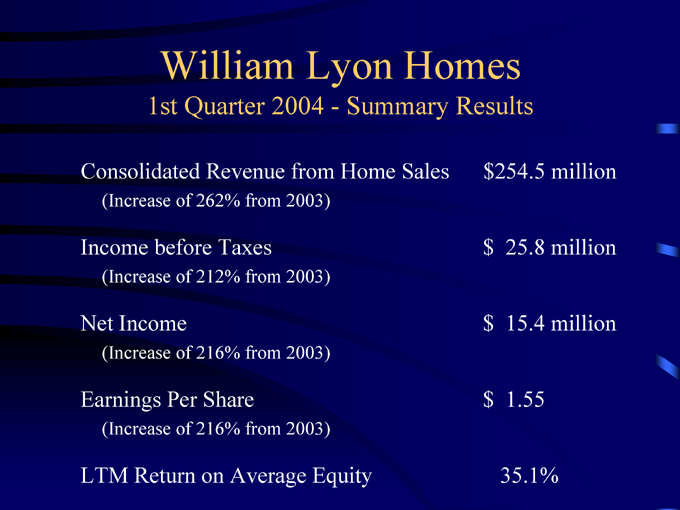
Consolidated Revenue from Home Sales $254.5 million (Increase of 262% from 2003)
Income before Taxes $ 25.8 million (Increase of 212% from 2003)
Net Income $ 15.4 million (Increase of 216% from 2003)
Earnings Per Share $ 1.55 (Increase of 216% from 2003)
LTM Return on Average Equity 35.1%
William Lyon Homes
For the quarter ended March 31, 2004—Summary Results
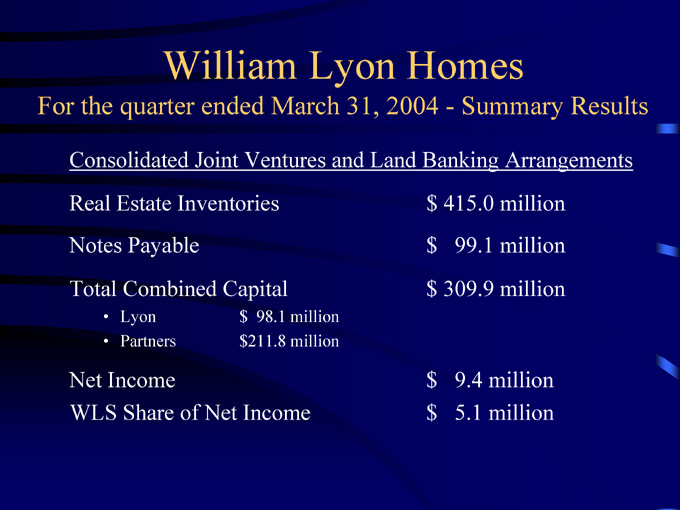
Consolidated Joint Ventures and Land Banking Arrangements Real Estate Inventories $ 415.0 million Notes Payable $ 99.1 million Total Combined Capital $ 309.9 million
• Lyon $ 98.1 million
• Partners $211.8 million
Net Income $ 9.4 million WLS Share of Net Income $ 5.1 million
William Lyon Homes
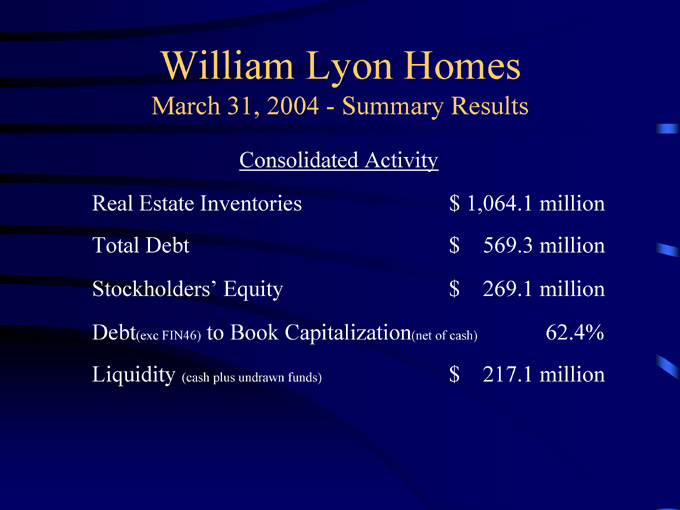
March 31, 2004—Summary Results
Consolidated Activity
Real Estate Inventories $ 1,064.1 million Total Debt $ 569.3 million Stockholders’ Equity $ 269.1 million Debt(exc FIN46) to Book Capitalization(net of cash) 62.4% Liquidity (cash plus undrawn funds) $ 217.1 million

William Lyon Homes
EBITDA
• EBITDA means net income plus (i) provision for income taxes, (ii) interest expense, (iii) amortization of capitalized interest included in cost of sales, (iv) depreciation and amortization and (v) cash distributions of income from unconsolidated joint ventures less equity in income of unconsolidated joint ventures. Other companies may calculate EBITDA differently. EBITDA is not a financial measure prepared in accordance with generally accepted accounting principles. EBITDA is presented herein because it is a component of certain covenants in the Indenture governing the Company’s 10 ¾% Senior Notes and 7 ½% Senior Notes (“Indentures”).
• In addition, management believes the presentation of EBITDA provides useful information to the Company’s investors regarding the Company’s financial condition and results of operations because EBITDA is a widely utilized financial indicator of a company’s ability to service and/or incur debt. The calculations of EBITDA below are presented in accordance with the requirements of the Indentures. EBITDA should not be considered as an alternative for net income, cash flows from operating activities and other consolidated income or cash flow statement data prepared in accordance with accounting principles generally accepted in the United States or as a measure of profitability or liquidity.
William Lyon Homes
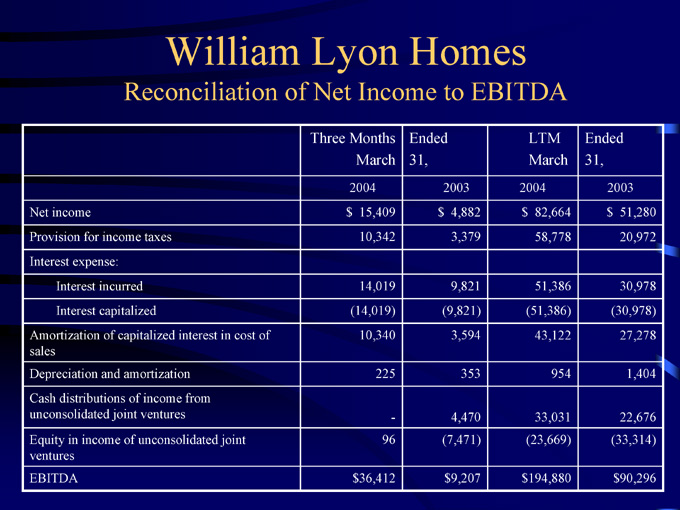
Reconciliation of Net Income to EBITDA
Three Months Ended March 31, LTM Ended March 31,
2004 2003 2004 2003
Net income $ 15,409 $ 4,882 $ 82,664 $ 51,280
Provision for income taxes 10,342 3,379 58,778 20,972
Interest expense:
Interest incurred 14,019 9,821 51,386 30,978
Interest capitalized (14,019) (9,821) (51,386) (30,978)
Amortization of capitalized interest in cost of sales 10,340 3,594 43,122 27,278
Depreciation and amortization 225 353 954 1,404
Cash distributions of income from unconsolidated joint ventures - 4,470 33,031 22,676
Equity in income of unconsolidated joint ventures 96 (7,471) (23,669) (33,314)
EBITDA $36,412 $9,207 $194,880 $90,296
William Lyon Homes
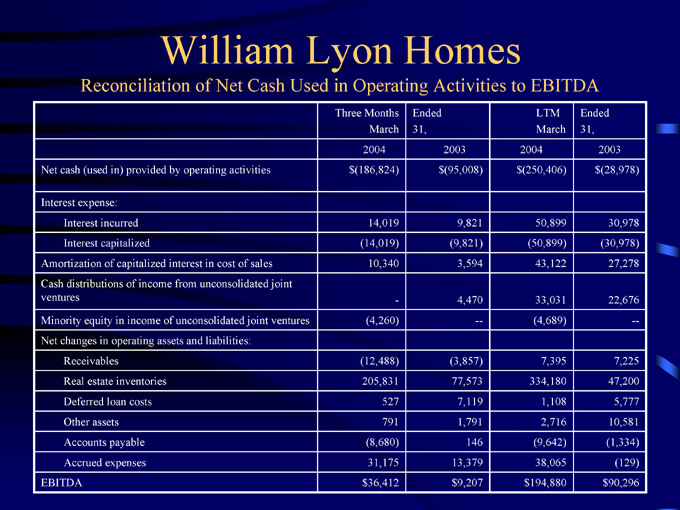
Reconciliation of Net Cash Used in Operating Activities to EBITDA
Three Months Ended March 31, LTM Ended March 31,
2004 2003 2004 2003
Net cash (used in) provided by operating activities $(186,824) $(95,008) $(250,406) $(28,978)
Interest expense:
Interest incurred 14,019 9,821 50,899 30,978
Interest capitalized (14,019) (9,821) (50,899) (30,978)
Amortization of capitalized interest in cost of sales 10,340 3,594 43,122 27,278
Cash distributions of income from unconsolidated joint ventures - 4,470 33,031 22,676
Minority equity in income of unconsolidated joint ventures (4,260) — (4,689) —
Net changes in operating assets and liabilities:
Receivables (12,488) (3,857) 7,395 7,225
Real estate inventories 205,831 77,573 334,180 47,200
Deferred loan costs 527 7,119 1,108 5,777
Other assets 791 1,791 2,716 10,581
Accounts payable (8,680) 146 (9,642) (1,334)
Accrued expenses 31,175 13,379 38,065 (129)
EBITDA $36,412 $9,207 $194,880 $90,296
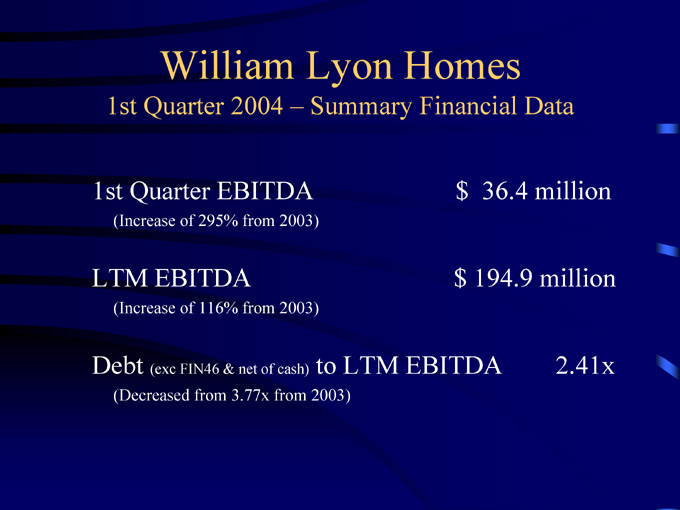
William Lyon Homes
1st Quarter 2004 – Summary Financial Data
1st Quarter EBITDA $ 36.4 million (Increase of 295% from 2003)
LTM EBITDA $ 194.9 million (Increase of 116% from 2003)
Debt (exc FIN46 & net of cash) to LTM EBITDA 2.41x (Decreased from 3.77x from 2003)
William Lyon Homes
Lots Owned and Controlled as of March 31, 2004
Owned Optioned Controlled
Southern California 1,351 3,277 4,628 Northern California 1,650 1,556 3,206 San Diego 1,272 439 1,711 Nevada 1,275 2,625 2,625 Arizona 1,904 6,801 8,705 Total 7,452 13,423 20,875 Percentage of Total 36% 64% Wholly Owned 5,178 Joint Venture 2,274 Total 7,452

FASB Interpretation No. 46
(FIN 46)
Consolidation of Variable Interest Entities

William Lyon Homes
FIN 46 Application
• Joint ventures and partnerships
• Land banking arrangements
• Land option arrangements
• Model sale/leaseback arrangements

William Lyon Homes
FIN 46 Effective Dates
• Variable interest entities created after January 31, 2003 – Immediately
• Variable interest entities created before February 1, 2003 – Beginning July 1, 2003