Table of Contents
As filed with the Securities and Exchange Commission on March 20, 2013
Registration No. 333-183249
UNITED STATES
SECURITIES AND EXCHANGE COMMISSION
WASHINGTON, DC 20549
POST-EFFECTIVE AMENDMENT NO. 1
TO
FORM S-1
REGISTRATION STATEMENT
UNDER
THE SECURITIES ACT OF 1933
WILLIAM LYON HOMES
(Exact Name of Registrant as Specified in its Charter)
| Delaware | 1531 | 33-0864902 | ||
| (State or other jurisdiction of incorporation or organization) | (Primary Standard Industrial Classification Code Number) | (I.R.S. Employer Identification Number) |
4490 Von Karman Avenue
Newport Beach, California 92660
(949) 833-3600
(Address, including zip code, and telephone number, including area code, of Registrant’s principal executive offices)
William H. Lyon
Chief Executive Officer
William Lyon Homes
4490 Von Karman Avenue
Newport Beach, California 92660
(949) 833-3600
(Name, address, including zip code, and telephone number, including area code, of agent for service)
with copies to:
Cary K. Hyden, Esq.
Michael A. Treska, Esq.
Latham & Watkins LLP
650 Town Center Drive, 20th Floor
Costa Mesa, California 92626
(714) 540-1235
Approximate date of commencement of proposed sale to the public: From time to time after the effective date of this registration statement.
If any of the securities being registered on this Form are to be offered on a delayed or continuous basis pursuant to Rule 415 under the Securities Act of 1933 check the following box: x
If this Form is filed to register additional securities for an offering pursuant to Rule 462(b) under the Securities Act, please check the following box and list the Securities Act registration statement number of the earlier effective registration statement for the same offering. ¨
If this Form is a post-effective amendment filed pursuant to Rule 462(c) under the Securities Act, check the following box and list the Securities Act registration statement number of the earlier effective registration statement for the same offering. ¨
If this Form is a post-effective amendment filed pursuant to Rule 462(d) under the Securities Act, check the following box and list the Securities Act registration statement number of the earlier effective registration statement for the same offering. ¨
Table of Contents
Indicate by check mark whether the registrant is a large accelerated filer, an accelerated filer, a non-accelerated filer, or a smaller reporting company. See the definitions of “large accelerated filer,” “accelerated filer” and “smaller reporting company” in Rule 12b-2 of the Exchange Act.
| Large accelerated filer ¨ | Accelerated filer ¨ | |||
| Non-accelerated filer x | (Do not check if a smaller reporting company) | Smaller reporting company ¨ |
CALCULATION OF REGISTRATION FEE
| ||||||||
| Title of Each Class of Securities to be Registered | Amount to be Registered | Proposed Maximum Offering Price per Share | Proposed Maximum Aggregate Offering Price | Amount of Registration Fee | ||||
Class A Common Stock, par value $0.01 per share | 178,952,742(1) | $1.05(2) | $90,222,993 | $10,717 | ||||
Class C Common Stock, par value $0.01 per share | 93,026,082(3) | $1.05(2) | $16,821,355 | $1,928 | ||||
Convertible Preferred Stock, par value $0.01 per share | 77,005,744(4) | $1.15(2) | $88,556,606 | $12,080 | ||||
Total | $24,725(5) | |||||||
| ||||||||
| ||||||||
| (1) | Represents (a) 29,224,017 shares of Class A Common Stock issued in connection with the Prepackaged Joint Plan of Reorganization, or the Plan, of William Lyon Homes and certain of its subsidiaries, (b) the maximum number of shares of Class A Common Stock issuable upon conversion of the shares of Class B Common Stock issued in connection with the Plan at a conversion rate of one share of Class A Common Stock for each share of Class B Common Stock, or the Class B Conversion Rate, which is 31,464,548 shares of Class A Common Stock, (c) the maximum number of shares of Class A Common Stock issuable upon conversion of Class C Common Stock registered hereby at a conversion rate of one share of Class A Common Stock for each share of Class C Common Stock, which is 16,020,338 shares of Class A Common Stock, (d) the maximum number of shares of Class A Common Stock issuable upon conversion of the Convertible Preferred Stock registered hereby at a conversion rate of one share of Class A Common Stock for each share of Convertible Preferred Stock, which is 77,005,744 shares of Class A Common Stock, (e) 10,000,000 shares of Class A Common Stock issued in connection with a real estate purchase transaction that took place on June 28, 2012 and 15,238,095 shares of Class A Common Stock issued pursuant to a privately negotiated stock issuance to an affiliate of Paulson & Co. Inc., or the Paulson Transaction. Pursuant to Rule 416 under the Securities Act of 1933, as amended, or the Securities Act, the registrants are also registering such indeterminate number of shares of Class A Common Stock as may be issued from time to time as a result of the anti-dilution provisions applicable to stock splits, stock dividends and similar transactions. |
| (2) | Estimated solely for the purpose of calculating the registration fee pursuant to Rule 457(a) under the Securities Act. |
| (3) | Represents (a) 12,876,338 shares of Class C Common Stock issued in connection with the Plan, (b) the maximum number of shares of Class C Common Stock issuable upon conversion of Convertible Preferred Stock registered hereby at a conversion rate of one share of Class C Common Stock for each share of Convertible Preferred Stock, which is 77,005,744 shares of Class C Common Stock and (c) 3,144,000 shares of Class C Common Stock issued pursuant to an agreement with certain selling stockholders to backstop the offering of shares of Class C Common Stock and shares of Convertible Preferred Stock in connection with the Plan. |
| (4) | Represents 64,831,831 shares of Convertible Preferred Stock issued in connection with the Plan and 12,173,913 shares of Convertible Preferred Stock issued in connection with the Paulson Transaction. |
| (5) | A registration fee of $30,413 was previously paid based on an estimate of the proposed maximum aggregate offering price. |
The registrants hereby amend this registration statement on such date or dates as may be necessary to delay its effective date until the registrants shall file a further amendment which specifically states that this registration statement shall thereafter become effective in accordance with Section 8(a) of the Securities Act of 1933, as amended, or until the registration statement shall become effective on such date as the Securities and Exchange Commission, acting pursuant to said Section 8(a), may determine.
Table of Contents
EXPLANATORY NOTE
This Post-Effective Amendment No. 1, or the Post-Effective Amendment No. 1, to the Registration Statement on Form S-1 (File No. 333-183249), as originally declared effective by the Securities and Exchange Commission, or the SEC, on February 13, 2013, is being filed to include information in the Registrant’s Annual Report on Form 10-K for the fiscal year ended December 31, 2012, which was filed with the SEC on March 18, 2013, and to update certain other information in the Registration Statement.
The information included in this filing amends the Registration Statement and the Prospectus contained therein. The Company is also registering additional securities under this Post-Effective Amendment No. 1 pursuant to certain registration rights granted to certain of our stockholders.
Table of Contents
The information in this prospectus is not complete and may be changed. These securities may not be sold until the registration statement filed with the Securities and Exchange Commission relating to these securities is effective. This prospectus is not an offer to sell these securities and it is not soliciting an offer to buy these securities in any state where the offer or sale is not permitted.
Subject to Completion, dated March 20, 2013
PROSPECTUS

William Lyon Homes
Shares of Class A Common Stock
Shares of Class C Common Stock
Convertible Preferred Stock
We are registering the following shares of Class A Common Stock, Class C Common Stock and Convertible Preferred Stock of William Lyon Homes, or the Company, to satisfy registration rights that we granted in connection with the Company’s Joint Plan of Reorganization on February 25, 2012 and certain recent corporate transactions, as more fully described elsewhere in the prospectus:
| • | 178,952,742 shares of the Company’s Class A Common Stock, $0.01 par value per share, or Class A Common Stock, which includes the shares of Class A Common Stock issuable upon conversion of the Company’s outstanding Class B Common Stock, $0.01 par value per share, or Class B Common Stock, upon conversion of the Company’s outstanding Class C Common Stock, $0.01 par value per share, or Class C Common Stock, and upon conversion of the Company’s Convertible Preferred Stock, $0.01 par value per share, or Convertible Preferred Stock; |
| • | 93,026,082 shares of Class C Common Stock, which includes the shares of Class C Common Stock issuable upon conversion of the outstanding Convertible Preferred Stock; and |
| • | 77,005,744 shares of Convertible Preferred Stock. |
We are not selling any securities under this prospectus and will not receive any proceeds from the sale of the securities by the selling stockholders. The securities to which this prospectus relates may be offered and sold from time to time directly by the selling stockholders or alternatively through underwriters, broker dealers or agents. The securities may be sold in one or more transactions, at the current fixed price per share of $1.05 for our Class A Common Stock and Class C Common Stock and $1.15 per share for our Convertible Preferred Stock until such shares are quoted on the OTC Bulletin Board or an exchange and thereafter at prevailing market prices at the time of sale or privately negotiated prices. Please read “Plan of Distribution.”
There is currently no public trading market for the capital stock of the Company and such capital stock is not presently traded on any market or securities exchange. We intend to have a registered broker-dealer apply to have the securities registered hereby quoted on the Over-the-Counter Bulletin Board.
You should read this prospectus carefully before you invest in our securities. You should read this prospectus together with additional information described under the headings “Where You Can Find More Information” before you make your investment decision.
Investing in our securities involves a high degree of risk. Before investing in any of our securities, you should read the discussion of material risks in the section entitled “Risk Factors” beginning on page 12 of this prospectus.
Neither the Securities and Exchange Commission nor any state securities commission has approved or disapproved of these securities or determined if this prospectus is truthful or complete. Any representation to the contrary is a criminal offense.
The date of this prospectus is , 2013.
Table of Contents
You should rely only on the information contained in this prospectus. We have not authorized anyone to provide you with different information. If anyone provides you with different or inconsistent information, you should not rely on it. This prospectus does not constitute an offer to sell, or a solicitation of an offer to purchase, the securities offered by this prospectus in any jurisdiction to or from any person to whom or from whom it is unlawful to make such offer or solicitation of an offer in such jurisdiction. The information contained in this prospectus is current only as of its date.
| Page | ||||
| 1 | ||||
| 12 | ||||
| 27 | ||||
RATIO OF EARNINGS TO FIXED CHARGES AND PREFERRED STOCK DIVIDENDS | 28 | |||
| 28 | ||||
| 28 | ||||
| 28 | ||||
| 29 | ||||
| 30 | ||||
| 43 | ||||
| 43 | ||||
MANAGEMENT’S DISCUSSION AND ANALYSIS OF FINANCIAL CONDITION AND RESULTS OF OPERATIONS | 46 | |||
| 84 | ||||
| 98 | ||||
SECURITY OWNERSHIP OF CERTAIN BENEFICIAL OWNERS AND MANAGEMENT | 114 | |||
| 117 | ||||
| 118 | ||||
| 122 | ||||
| 138 | ||||
| 144 | ||||
| 147 | ||||
| 150 | ||||
| 156 | ||||
| 156 | ||||
| 156 | ||||
Table of Contents
| 157 | ||||
| 157 | ||||
| F-1 | ||||
Table of Contents
This summary highlights the information contained elsewhere in this prospectus. Because this is only a summary, it does not contain all of the information that may be important to you. For a more complete understanding of this offering, we encourage you to carefully read this entire prospectus.
In this prospectus, unless otherwise stated or the context otherwise requires, the “Company,” “we,” “our,” and “us” refer to William Lyon Homes, a Delaware corporation, and its subsidiaries. In addition, unless otherwise stated or the context otherwise requires, “Parent” refers to William Lyon Homes, and “California Lyon” refers to William Lyon Homes, Inc., a California corporation and wholly-owned subsidiary of Parent.
Our Company
The Company is primarily engaged in the design, construction and sale of single family detached and attached homes in California, Arizona, Nevada and, as of December 2012, Colorado. Since the founding of the Company’s predecessor in 1956, the Company and its joint ventures have sold over 74,000 homes. The Company conducts its homebuilding operations through five reportable operating segments (Southern California, Northern California, Arizona, Nevada and, as of December 2012, Colorado). For the year ended December 31, 2012, 45% of home closings were derived from the Company’s California operations. In the 2012 period, on a consolidated basis, the Company had revenues from home sales of $261.3 million and delivered 950 homes. For the year ended December 31, 2011, approximately 59% of the home closings of the Company and its joint ventures were derived from its California operations. For the year ended December 31, 2011, on a consolidated basis, the Company had revenues from home sales of $207.1 million and delivered 614 homes.
The Company designs, constructs and sells a wide range of homes designed to meet the specific needs of each of its markets, although it primarily emphasizes sales to the entry-level and first time move-up home buyer markets. At December 31, 2012, the Company marketed its homes through 18 sales locations. In 2012, the average sales price for consolidated homes delivered by the Company was $275,100. Base sales prices for actively selling projects in 2012, including affordable projects, ranged from $88,000 to $690,000.
Bankruptcy Reorganization
On December 19, 2011, Parent and certain of its subsidiaries filed voluntary petitions, or the Chapter 11 Petitions, under Chapter 11 of Title 11 of the United States Code, as amended, or the Bankruptcy Code, in the U.S. Bankruptcy Court for the District of Delaware, or the Bankruptcy Court, to seek approval of the Prepackaged Joint Plan of Reorganization, or the Plan, of Parent and certain of its subsidiaries. The Chapter 11 Petitions are jointly administered under the captionIn re William Lyon Homes, et al., Case No. 11-14019, or the Chapter 11 Cases. The sole purpose of the Chapter 11 Cases was to restructure the debt obligations and strengthen the balance sheet of Parent and certain of its subsidiaries.
On February 10, 2012, the Bankruptcy Court confirmed the Plan. On February 25, 2012, Parent and certain of its subsidiaries consummated the principal transactions contemplated by the Plan, including:
| • | the issuance of 44,793,255 shares of Parent’s new Class A Common Stock, $0.01 par value per share, or Class A Common Stock, and $75 million aggregate principal amount of 12% Senior Subordinated Secured Notes due 2017, or the Notes, issued by California Lyon, in exchange for the claims held by the holders of the formerly outstanding notes of California Lyon; |
| • | the amendment of California Lyon’s loan agreement with ColFin WLH Funding, LLC and certain other lenders, or the Amended Term Loan Agreement, which resulted, among other things, in the increase in the principal amount outstanding under the prior loan agreement from $206 million to $235 million, the reduction in the interest rate payable under the prior loan agreement, and the elimination of any prepayment penalty under the prior loan agreement; |
1
Table of Contents
| • | the issuance, in exchange for aggregate cash consideration of $25 million, of 31,464,548 shares of Parent’s new Class B Common Stock, $0.01 par value per share, or Class B Common Stock, and a warrant to purchase 15,737,294 shares of Class B Common Stock; |
| • | the issuance of 64,831,831 shares of Parent’s new Convertible Preferred Stock, $0.01 par value per share, or Convertible Preferred Stock, and 12,966,366 shares of Parent’s new Class C Common Stock, $0.01 par value per share, or Class C Common Stock, in exchange for aggregate cash consideration of $60 million; and |
| • | the issuance of an additional 3,144,000 shares of Class C Common Stock to Luxor Capital Group LP, or Luxor, as a transaction fee in consideration for providing the backstop commitment of the offering of shares of Class C Common Stock and shares of Convertible Preferred Stock in connection with the Plan. |
Principal Holders of Securities Issued in Connection with the Plan
Entities affiliated with Luxor acquired 21,427,135 shares of Class A Common Stock (29.7% of the Class A Common Stock outstanding as of March 11, 2013), 15,445,838 shares of Class C Common Stock (95.9% of the Class C Common Stock outstanding as of March 11, 2013) and 61,509,204 shares of Convertible Preferred Stock (79.9% of the Convertible Preferred Stock outstanding as of March 11, 2013) in connection with the Plan, which provides Luxor with 37.1% of the total voting power of the Company’s outstanding capital stock. Luxor received 3,144,000 of its 15,445,838 shares of Class C Common stock as a transaction fee in consideration for providing the backstop commitment described above. Luxor also received $35.9 million aggregate principal amount of the Notes issued in connection with the Plan.
General William Lyon and William H. Lyon, or the Lyons, acquired beneficial ownership of 31,464,548 of Class B Common Stock (100% of the current outstanding Class B Common Stock) and a warrant to purchase an additional 15,737,294 shares of Class B Common Stock, or the Class B Warrant. The 31,464,548 shares of Class B Common Stock and the Class B Warrant are owned by Lyon Shareholder 2012, LLC, or Lyon LLC. Lyon LLC is now managed by William H. Lyon and all interests in Lyon LLC are held for the benefit of William H. Lyon. The William Harwell Lyon Separate Property Trust separately acquired 24,199 shares of Parent’s Class A Common Stock (less than 1% of the then outstanding Class A Common Stock) and $40,000 in aggregate principal amount of the Notes issued in connection with the Plan in exchange for prepetition notes held by the William Harwell Lyon Separate Property Trust. William H. Lyon’s Class B Common Stock holdings and Class A Common Stock holdings provide William H. Lyon with 36.1% of the total voting power of the Company’s outstanding capital stock as of March 11, 2013.
Recent Events
Colony Transaction
On June 28, 2012, the Company consummated the purchase of certain real property (comprising of approximately 165 acres) in San Diego County, California, San Bernardino County, California, Maricopa County, Arizona and Clark County, Nevada, representing seven separate residential for sale developments, comprising over 1,000 lots. The aggregate purchase price of the property was $21,500,000. The Company paid $11,000,000 cash, and issued 10,000,000 shares of Class A Common Stock of Parent (18.3% of the then current outstanding Class A Common Stock), to investment vehicles managed by affiliates of Colony Capital, LLC as consideration for the property, which provides Colony with 3.8% of the total voting power of the Company’s outstanding capital stock.
2
Table of Contents
Paulson Transaction
On October 12, 2012, the Company entered into a Subscription Agreement, or the Subscription Agreement, between the Company and WLH Recovery Acquisition LLC, a Delaware limited liability company and investment vehicle managed by affiliates of Paulson & Co. Inc., or Paulson, pursuant to which, the Company issued to Paulson (i) 15,238,095 shares of the Company’s Class A Common Stock, for $16,000,000 in cash, and (ii) 12,173,913 shares of the Company’s Convertible Preferred Stock, for $14,000,000 in cash, for an aggregate purchase price of $30,000,000, or the Paulson Transaction. Paulson currently holds 10.4% of the total voting power of the Company’s outstanding capital stock. In connection with the Paulson Transaction, the Company also amended (i) its Class A Common Stock Registration Rights Agreement and Convertible Preferred Stock and Class C Common Stock Registration Rights Agreement to include in such agreements the shares issued to Paulson so that Paulson may become a party to such agreements with equal rights, benefits and obligations as the other stockholders who are parties thereto, and (ii) its Amended and Restated Certificate of Incorporation, or the Charter, and Amended and Restated Bylaws to (a) increase the size of the Company’s board of directors, or the Board, from seven to eight members, up to and until the Conversion Date (as defined in “Description of Capital Stock”), (b) provide the holders of Class A Common Stock the right to elect the director to fill the newly created Board seat, (c) revise the definition of “Convertible Preferred Original Issue Price” to equal the price per share at which shares of Convertible Preferred Stock are issued and (d) incorporate various clarifying and conforming changes.
Equity Grants Under the Company’s 2012 Equity Incentive Plan
As previously disclosed in the Company’s Current Report on Form 8-K filed on October 16, 2012, the Company’s board of directors and stockholders approved the Company’s 2012 Equity Incentive Plan, or the 2012 Plan, in October 2012. The purpose of the 2012 Plan is to (1) provide an increased incentive for eligible employees, consultants and directors to assert their best efforts by conferring benefits based on the achievement of certain performance goals, (2) better align the interests of eligible participants with the interests of stockholders by providing an opportunity for increased stock ownership by such participants, and (3) encourage such participants to remain in the service of the Company. The Company approved its first grants under the 2012 Plan in October 2012 and has continued to make grants in accordance with the 2012 Plan under the administration of the Company’s Compensation Committee. See the section of this prospectus entitled “Executive Compensation” for additional information.
Senior Notes Offering and Debt Refinancing
On November 8, 2012, California Lyon completed its offering of 8.5% Senior Notes due 2020, or the New Notes, in an aggregate principal amount of $325 million. The New Notes were issued at 100% of their aggregate principal amount. The Company used the net proceeds from the sale of the New Notes, together with cash on hand, to refinance the Company’s (i) $235 million 10.25% Senior Secured Term Loan due 2015, (ii) approximately $76 million in aggregate principal amount of 12% Senior Subordinated Secured Notes due 2017, (iii) approximately $11 million in principal amount of project related debt, and (iv) to pay accrued and unpaid interest thereon.
Risks Affecting the Company
The Company’s business is subject to numerous risks, as more fully described in the section of this prospectus entitled “Risk Factors,” including the following:
| • | Adverse changes in general economic conditions could reduce the demand for homes and, as a result, could negatively impact the Company’s results of operations. |
3
Table of Contents
| • | Increases in the Company’s cancellation rate could have a negative impact on the Company’s home sale revenue and home building margins. |
| • | Limitations on the availability of mortgage financing can adversely affect demand for housing. |
| • | The Company’s high level of indebtedness could adversely affect its financial condition and prevent it from fulfilling its obligations. At March 11, 2013, the total outstanding principal amount of our debt was $344.2 million. |
| • | The Company cannot be certain that the bankruptcy proceedings will not adversely affect the Company’s operations going forward. |
| • | Concentration of ownership of the voting power of the Company’s capital stock may prevent other stockholders from influencing corporate decisions and create perceived conflicts of interest. |
| • | There is currently no public trading market for the Company’s capital stock and a trading market may not develop, making it difficult for the Company’s stockholders to sell their capital stock. |
General Corporate Information
The Company’s principal executive offices are located at 4490 Von Karman Avenue, Newport Beach, California 92660 and its telephone number is (949) 833-3600. The Company plans to relocate its principle executive offices to 4695 MacArthur Court, 8th floor, Newport Beach, California, by the end of the second quarter of 2013. The Company’s website address is www.lyonhomes.com. Information contained on the Company’s website is not a part of this prospectus and the inclusion of the website address in this prospectus is an inactive textual reference only. Parent was incorporated in the State of Delaware on July 15, 1999.
The Offering
The following summary contains basic information about the capital stock registered hereby and is not intended to be complete. It does not contain all of the information that is important to you. For a more complete understanding of these securities, please refer to the section of this prospectus entitled “Description of Capital Stock”.
4
Table of Contents
Diagram of the Company’s Corporate Structure
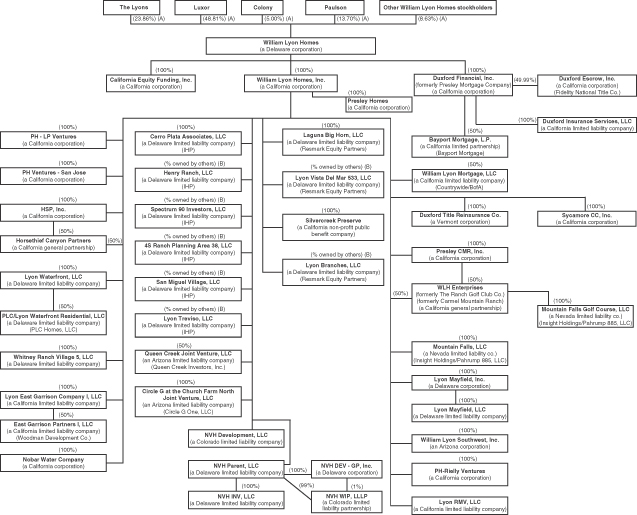
Footnotes:
| (A) | Represents combined equity ownership of each holder as of March 11, 2013. See “Security Ownership of Certain Beneficial Owners and Management” for information regarding each holder’s percentage of total voting power. |
| (B) | Due to waterfall provisions in each operating agreement, percentage ownership changes over time. |
5
Table of Contents
Offering of Capital Stock
Summary Description of Capital Stock
Issuer of Capital Stock | William Lyon Homes, a Delaware corporation |
Capital Stock of William Lyon Homes Offered by the Selling Stockholders | Class A Common Stock, par value $0.01 per share, Class C Common Stock, par value $0.01 per share and Convertible Preferred Stock, par value $0.01 per share. |
Conversion Rights of the Holders of Class B Common Stock and Class C Common Stock | All shares of Class B Common Stock will be converted into an equal number of shares of Class A Common Stock on or after the Conversion Date if a majority of the holders of shares of Class B Common Stock vote in favor of such conversion. If, at any time (whether before, on or after the Conversion Date), any share of Class B Common Stock is not owned, beneficially or of record, by William Lyon and William H. Lyon, their sibling, spouses and lineal descendants, any entities wholly owned by one or more of the foregoing persons, or any trusts or other estate planning vehicles for the benefit of any of the foregoing, then such share of Class B Common Stock will automatically convert into one share of Class A Common Stock. |
| All shares of Class C Common Stock will automatically convert into shares of Class A Common Stock at the rate of one share of Class A Common Stock for each share of Class C Common Stock at the Conversion Date, which occurs upon the earlier of: |
| • | the closing of a sale of at least $25,000,000 in shares of Class A Common Stock at a price that equals or exceeds 130% of the then-prevailing base price; |
| • | the date on which the majority of the holders of Class A Common Stock, voting together as a separate class, and the majority of the holders of Class C Common Stock and Convertible Preferred Stock, voting together as a separate class, vote in favor of the mandatory conversion of the shares of Class C Common Stock and the shares of Convertible Preferred Stock; or |
| • | the date on which the 30-day volume weighted average trading price on a national exchange equals or exceeds 130% of the then-prevailing base price and the aggregate dollar trading volume for such 30-day period is at least $4,000,000. |
| Holders of Class B Common Stock and Class C Common Stock may at any time elect to convert any or all of their shares into Class A Common Stock at the rate of one share of Class A Common Stock for each share of Class B Common Stock or Class C Common Stock. |
| The number of shares of Class A Common Stock issuable upon the conversion of shares of Class B Common Stock and Class C Common Stock is subject to customary adjustments for stock splits, stock dividends and transactions with similar effect. |
6
Table of Contents
Conversion Rights of the Holders of Convertible Preferred Stock | Holders of our Convertible Preferred Stock may elect to convert any and all of their Convertible Preferred Stock into such number of fully paid and non-assessable shares of Class C Common Stock as determined by the then-prevailing conversion ratio. |
| Upon the occurrence of the Conversion Date, each share of Convertible Preferred Stock will automatically convert into such number of fully paid and non-assessable shares of Class A Common Stock as is determined by the then applicable conversion ratio. See “Description of Capital Stock.” |
Redemption of Convertible Preferred Stock on Maturity Date | To the extent not previously converted to Class A Common Stock or Class C Common Stock, the Company is obligated to redeem all of the then outstanding shares of Convertible Preferred Stock on the fifteenth anniversary of the first issuance of Convertible Preferred Stock. See “Description of Capital Stock.” |
Voting Rights; Dividends | Each share of Class A Common Stock, Class B Common Stock and Class C Common Stock have identical powers, preferences, qualifications and limitations, except that so long as shares of Class B Common Stock remain outstanding, (i) each share of Class A Common Stock and Class C Common Stock are entitled to one vote per share and (ii) each share of Class B Common Stock is entitled to two votes per share. Following both the Conversion Date and the conversion of all Class B Common Stock, each share of Class A Common Stock is entitled to one vote per share. The voting, dividend and liquidation rights of the holders of the Company common stock are subject to and qualified by the rights, powers and preferences of the holders of the Company’s preferred stock. See “Management and Directors—Board of Directors” for a discussion of voting rights with respect to the election of directors. |
| Each share of Convertible Preferred Stock has the right to one vote for each share of Class C Common Stock into which such share could be converted. |
| We do not anticipate paying any cash dividends on our common stock following this offering. Any determination to pay dividends to holders of our common stock will be at the discretion of our board of directors. Except as described below, the payment of cash dividends is restricted under the terms of the indenture governing California Lyon’s 8.5% Senior Notes due 2020. |
| Holders of our Convertible Preferred Stock are entitled to receive cumulative dividends at a rate of 6% per annum consisting of (i) cash dividends at the rate of 4% paid quarterly in arrears, and (ii) accreting dividends accruing at the rate of 2% per annum. |
National Securities Exchange; Initial Public Offering | On or prior to the third anniversary of the date of first issuance of our Class A Common Stock, we are required to use best efforts to cause |
7
Table of Contents
our Class A Common Stock to become listed on a national securities exchange, and subject to certain exceptions, to complete a qualifying initial public offering. |
Use of Proceeds | We will not receive any of the proceeds from the sale by the selling stockholders of our capital stock. |
Material United States Federal Income Tax Considerations | For a discussion of United States federal income tax considerations for holders of the capital stock registered hereby, see “Material United States Federal Income Tax Considerations.” |
Absence of a Public Market for the Capital Stock | There is currently no established market for our capital stock. We intend to have a registered broker-dealer apply to have our capital stock registered hereby quoted on the Over-the-Counter Bulletin Board. However, we cannot assure you as to the development or liquidity of any market for our capital stock. |
8
Table of Contents
PRO FORMA OPERATING STATEMENT
(in thousands except number of shares and per share amounts)
The following table sets forth our operating statement as of December 31, 2011, and our operating statement as of December 31, 2011 as adjusted for the plan of reorganization adjustments, giving effect to the adjustments as if the Company emerged from bankruptcy on January 1, 2011. The information in this table should be read in conjunction with the notes below.
| Year Ended December 31, 2011 | Plan of Reorganization Adjustments | Pro forma Year Ended December 31, 2011 | ||||||||||
Operating revenue | ||||||||||||
Home sales | $ | 207,055 | — | $ | 207,055 | |||||||
Lots, land and other sales | — | — | — | |||||||||
Construction services | 19,768 | — | 19,768 | |||||||||
|
|
|
|
|
| |||||||
| 226,823 | — | 226,823 | ||||||||||
|
|
|
|
|
| |||||||
Operating costs | ||||||||||||
Cost of sales — homes | (184,489 | ) | 982 | (a) | (183,507 | ) | ||||||
Cost of sales — lots, land and other | (4,234 | ) | — | (4,234 | ) | |||||||
Impairment loss on real estate assets | (128,314 | ) | — | (128,314 | ) | |||||||
Construction services | (18,164 | ) | — | (18,164 | ) | |||||||
Sales and marketing | (16,848 | ) | — | (16,848 | ) | |||||||
General and administrative | (22,411 | ) | — | (22,411 | ) | |||||||
Amortization of intangible assets | — | (3,151 | )(b) | (3,151 | ) | |||||||
Other | (3,983 | ) | — | (3,983 | ) | |||||||
|
|
|
|
|
| |||||||
| (378,443 | ) | (2,169 | ) | (380,612 | ) | |||||||
|
|
|
|
|
| |||||||
Equity in income of unconsolidated joint ventures | 3,605 | — | 3,605 | |||||||||
|
|
|
|
|
| |||||||
Operating loss | (148,015 | ) | (2,169 | ) | (150,184 | ) | ||||||
Interest expense, net of amounts capitalized | (24,529 | ) | 9,778 | (c) | (14,751 | ) | ||||||
Other income, net | 838 | — | 838 | |||||||||
|
|
|
|
|
| |||||||
Loss before reorganization items and provision for income taxes | (171,706 | ) | 7,609 | (164,097 | ) | |||||||
Reorganization items, net | (21,182 | ) | 21,182 | (d) | — | |||||||
|
|
|
|
|
| |||||||
Loss before provision for income taxes | (192,888 | ) | 28,791 | (164,097 | ) | |||||||
Provision for income taxes | (10 | ) | — | (10 | ) | |||||||
|
|
|
|
|
| |||||||
Net loss | (192,898 | ) | 28,791 | (164,107 | ) | |||||||
Less: Net income attributable to noncontrolling interest | (432 | ) | — | (432 | ) | |||||||
|
|
|
|
|
| |||||||
Net loss attributable to William Lyon Homes | (193,330 | ) | 28,791 | (164,539 | ) | |||||||
Preferred stock dividends | — | (3,023 | )(e) | (3,023 | ) | |||||||
|
|
|
|
|
| |||||||
Net loss available to common stockholders | $ | (193,330 | ) | $ | 25,768 | $ | (167,562 | ) | ||||
|
|
|
|
|
| |||||||
Loss per common share, basic and diluted | $ | (193,330 | ) | $ | (1.81 | ) | ||||||
Weighted average common shares outstanding, basic and diluted | 1,000 | 92,368,169 | (f) | 92,368,169 | ||||||||
Weighted average additional common shares outstanding if preferred shares converted to common shares | — | 64,831,831 | (f) | 64,831,831 | ||||||||
| (a) | Reflects adjustments made to cost of sales based on the fair value of inventory per the plan of reorganization. Adjustments were made to real estate inventories on a per project basis, were allocated pro rata to the number of homes in the project, and relieved to cost of sales based on the number of homes closed during the year. |
| (b) | Reflects the adjustment to amortization of intangible assets based on the Company emerging from Chapter 11 on January 1, 2011. The Company would have recorded intangible assets relating to homes in backlog with a fair value of $2.4 million, which would have been fully amortized during the 2011 period, as all the homes in backlog at January 1, 2011 closed during the 2011 period. Additionally, the Company would have recorded intangible assets relating to construction management contracts of $4.6 million and joint venture management contracts of $0.8 million and would have recorded amortization expense based on the number of homes closed of $0.6 million and $0.2 million respectively. |
| (c) | Reflects the adjustment to interest expense based on Term Loan of $206.0 million at 14% interest and Old Notes of $283.5 million at interest rates between 7.5% and 10.75% versus post-emergence Term Loan of $235.0 million at 10.25% interest, no outstanding balance on Old Notes and new Senior Note of $75.0 million at 12% interest for the 2011 period. |
9
Table of Contents
| (d) | Reflects the reversal of reorganization items, which is comprised of legal and professional fees incurred in connection with the Chapter 11 cases. |
| (e) | Reflects the amount of preferred stock dividends that would have been accrued had the Company emerged from Chapter 11 on January 1, 2011. |
| (f) | Reflects the weighted average common shares outstanding in accordance with the plan of reorganization. |
The following table sets forth our operating statement for the year ended December 31, 2012, and our operating statement for the year ended December 31, 2012 as adjusted for the plan of reorganization adjustments, giving effect to the adjustments as if the Company emerged from bankruptcy on January 1, 2011. The information in this table should be read in conjunction with the notes below.
| Period Ended December 31, 2012 | Plan of Reorganization Adjustments | Pro forma December 31, 2012 | ||||||||||
Operating revenue | ||||||||||||
Home sales | $ | 261,297 | $ | — | $ | 261,297 | ||||||
Lots, land and other sales | 104,325 | — | 104,325 | |||||||||
Construction services | 32,708 | — | 32,708 | |||||||||
|
|
|
|
|
| |||||||
| 398,330 | — | 398,330 | ||||||||||
|
|
|
|
|
| |||||||
Operating costs | ||||||||||||
Cost of sales — homes | (217,801 | ) | 524 | (h) | (217,277 | ) | ||||||
Cost of sales — lots, land and other | (94,786 | ) | — | (94,786 | ) | |||||||
Impairment loss on real estate assets | — | — | — | |||||||||
Construction services | (29,639 | ) | — | (29,639 | ) | |||||||
Sales and marketing | (15,872 | ) | — | (15,872 | ) | |||||||
General and administrative | (29,397 | ) | — | (29,397 | ) | |||||||
Amortization of intangible assets | (5,757 | ) | 4,084 | (i) | (1,673 | ) | ||||||
Other | (3,096 | ) | — | (3,096 | ) | |||||||
|
|
|
|
|
| |||||||
| (396,348 | ) | 4,608 | (391,740 | ) | ||||||||
|
|
|
|
|
| |||||||
Equity in income of unconsolidated joint ventures | — | — | — | |||||||||
|
|
|
|
|
| |||||||
Operating income | 1,982 | 4,608 | 6,590 | |||||||||
Loss on extinguishment of debt | (1,392 | ) | (1,392 | ) | ||||||||
Interest expense, net of amounts capitalized — Note 1 | (11,634 | ) | 363 | (j) | (11,271 | ) | ||||||
Other income, net — Note 12 | 1,758 | — | 1,758 | |||||||||
|
|
|
|
|
| |||||||
Loss before reorganization items and provision for income taxes | (9,286 | ) | 4,971 | (4,315 | ) | |||||||
Reorganization items, net — Note 4 | 230,933 | (230,933 | )(k) | — | ||||||||
|
|
|
|
|
| |||||||
Income (loss) before provision from income taxes | 221,647 | (225,962 | ) | (4,315 | ) | |||||||
Provision for income taxes — Note 13 | (11 | ) | — | (11 | ) | |||||||
|
|
|
|
|
| |||||||
Net income (loss) | 221,636 | (225,962 | ) | (4,326 | ) | |||||||
Less: Net income attributable to noncontrolling interest | (2,112 | ) | — | (2,112 | ) | |||||||
|
|
|
|
|
| |||||||
Net income (loss) attributable to William Lyon Homes | 219,524 | (225,962 | ) | (6,438 | ) | |||||||
|
|
|
|
|
| |||||||
Preferred stock dividends | (2,743 | ) | (459 | )(l) | (3,202 | ) | ||||||
|
|
|
|
|
| |||||||
Net income (loss) available to common stockholders | $ | 216,781 | $ | (226,421 | ) | $ | (9,640 | ) | ||||
|
|
|
|
|
| |||||||
Income (loss) per common share, basic and diluted | $ | 2.10 | — | $ | (0.10 | ) | ||||||
Weighted average common shares outstanding, basic and diluted | 103,037,842 | — | 101,434,476 | |||||||||
Weighted average additional common shares outstanding if preferred shares converted to common shares | 68,002,529 | — | 67,526,058 | |||||||||
10
Table of Contents
| (h) | Reflects adjustments made to cost of sales based on the fair value of inventory per the plan or reorganization. Adjustments were made to real estate inventories on a per project basis, were allocated pro rata to the number of homes in the project, and relieved to cost of sales based on the number of homes closed during the period. |
| (i) | Reflects the adjustment to amortization of intangible assets based on the Company emerging from Chapter 11 on January 1, 2011. The adjustment is comprised primarily of $4.0 million relating to amortization of homes in backlog that would have been fully amortized in the prior year, as well as adjustments to amortization of construction management contracts and joint venture management contracts for the period from January 1, 2012 through February 24, 2012. |
| (j) | Reflects the adjustment to interest expense based on Term Loan of $206.0 million at 14% interest and Old Notes of $283.5 million at interest rates between 7.5% and 10.75%, post emergence Term Loan of $235.0 million at 10.25% interest, zero Old Notes and new Senior Note of $75.0 million at 12% interest for the period from January 1, 2012 through February 24, 2012. |
| (k) | Reflects the reversal of reorganization items comprised of cancellation of debt of $298.9 million, plan implementation adjustments of $49.3 million, professional fees of $9.7 million and write-off of deferred loan costs of $8.3 million. |
| (l) | Reflects the amount of preferred stock dividends that would have been accrued for the period from January 1, 2012 through February 24, 2012. |
11
Table of Contents
An investment in the Company entails the following risks and uncertainties. These risk factors should be carefully considered when evaluating any investment in the Company. Any of these risks and uncertainties could cause the actual results to differ materially from the results contemplated by the forward-looking statements set forth herein, and could otherwise have a significant adverse impact on the Company’s business, prospects, financial condition or results of operations. In addition, please read “Cautionary Statement Concerning Forward-Looking Statements” in this prospectus, where we describe additional uncertainties associated with our business and the forward-looking statements included in this prospectus.
Market and Operational Risks
Increases in the Company’s cancellation rate could have a negative impact on the Company’s home sales revenue and home building gross margins.
During the years ended December 31, 2012, 2011 and 2010, the Company experienced cancellation rates of 14%, 18% and 19%, respectively. Cancellations negatively impact the number of closed homes, net new home orders, home sales revenue and the Company’s results of operations, as well as the number of homes in backlog. Home order cancellations can result from a number of factors, including declines or slow appreciation in the market value of homes, increases in the supply of homes available to be purchased, increased competition, higher mortgage interest rates, homebuyers’ inability to sell their existing homes, homebuyers’ inability to obtain suitable financing, including providing sufficient down payments, and adverse changes in economic conditions. Continued high levels of home order cancellations would have a negative impact on the Company’s home sales revenue and financial and operating results.
Limitations on the availability of mortgage financing can adversely affect demand for housing.
In general, housing demand is negatively impacted by the unavailability of mortgage financing as a result of declining customer credit quality, tightening of mortgage loan underwriting standards, or other factors. Most buyers finance their home purchases through third-party lenders providing mortgage financing. Over the last several years, many third-party lenders have significantly increased underwriting standards, and many subprime and other alternate mortgage products are no longer available in the marketplace in spite of a decrease in mortgage rates. If these trends continue and mortgage loans continue to be difficult to obtain, the ability and willingness of prospective buyers to finance home purchases or to sell their existing homes will be adversely affected, which will adversely affect the Company’s results of operations through reduced home sales revenue, gross margin and cash flow.
Changes in federal income tax laws may also affect demand for new homes. Various proposals have been publicly discussed to limit mortgage interest deductions and to limit the exclusion of gain from the sale of a principal residence. Enactment of such proposals may have an adverse effect on the homebuilding industry in general. No meaningful prediction can be made as to whether any such proposals will be enacted and, if enacted, the particular form such laws would take.
Difficulty in obtaining sufficient capital could result in increased costs and delays in completion of projects.
The homebuilding industry is capital-intensive and requires significant up-front expenditures to acquire land and begin development. Land acquisition, development and construction activities may be adversely affected by any shortage or increased cost of financing or the unwillingness of third parties to engage in joint ventures. The Company’s current financial position may make it more difficult for the Company to obtain capital for development projects. Any difficulty in obtaining sufficient capital for planned development expenditures could cause project delays and any such delay could result in cost increases and may adversely affect the Company’s sales and future results of operations and cash flows.
12
Table of Contents
Financial condition and results of operations may be adversely affected by any decrease in the value of land inventory, as well as by the associated carrying costs.
The Company continuously acquires land for replacement and expansion of land inventory within the markets in which it builds. The risks inherent in purchasing and developing land increase as consumer demand for housing decreases, and thus, the Company may have bought and developed land on which homes cannot be profitably built and sold. The Company employs measures to manage inventory risks which may not be successful. In addition, inventory carrying costs can be significant and can result in losses in a poorly performing project or market, and the Company may have to sell homes at significantly lower margins or at a loss. Further, the Company may be required to write-down the book value of certain real estate assets in accordance with U.S. generally accepted accounting principles, or U.S. GAAP, and some of those write-downs could be material.
On February 24, 2012, the Company adopted fresh start accounting under ASC 852, Reorganizations, and recorded all real estate inventories at fair value. Subsequent to February 24, 2012 and throughout each quarter of 2012, there were no indicators of impairment, as sales prices and sales absorption rates have improved. For the 2012 period, there were no impairment charges recorded.
During 2011, the Company incurred non-cash impairment losses on real estate assets amounting to $128.3 million. As required by U.S. GAAP, in connection with our emergence from the Chapter 11 Cases, we adopted the fresh start accounting provisions of ASC 852,Reorganizations, effective February 24, 2012. See “Risks Related to Our Emergence from Chapter 11 Bankruptcy Proceedings” for further discussion. Under ASC 852, the reorganization value represents the fair value of the entity before considering liabilities and approximates the amount a willing buyer would pay for the assets of the Company immediately after restructuring. The reorganization value is allocated to the respective fair value of assets. The Company engaged a third-party valuation firm to assist with the analysis of the fair value of the entity, and respective assets and liabilities. In conjunction with the valuation of all of the assets of the Company, the Company re-set value on certain land holdings in the early stages of development, based on: (i) “as-is” development stages of the property instead of a discounted cash flow approach, (ii) relative comparables on similar stage properties that had recently sold, on a per acre basis, and (iii) location of the property, among other factors. As a result, the Company re-valued these particular assets as of February 24, 2012, and since the date of emergence from the Chapter 11 Cases is within six weeks of year end, management made the assumption that the values are approximately the same, and recorded the book value as fair value as of December 31, 2011. Therefore, the adjustment to fair value was made on December 31, 2011, with no subsequent adjustment necessary at February 24, 2012, on these particular assets. The difference between the new value applied to the property on December 31, 2011 and the carrying value as of December 31, 2011, was recorded as impairment loss on real estate assets.
In addition, the Company incurred non-cash impairment losses on real estate assets of $111.9 million for the year ended December 31, 2010. The Company assesses its projects on a quarterly basis, when indicators of impairment exist. Indicators of impairment include a decrease in demand for housing due to soft market conditions, competitive pricing pressures which reduce the average sales price of homes, which includes sales incentives for home buyers, sales absorption rates below management expectations, a decrease in the value of the underlying land and a decrease in projected cash flows for a particular project. The Company was required to write down the book value of its impaired real estate assets in accordance with Financial Accounting Standards Board Accounting Standards Codification Topic 360,Property, Plant and Equipment, or ASC 360.
If land is not available at reasonable prices, the Company’s home sales revenue and results of operations could be negatively impacted or the Company could be required to scale back the Company’s operations in a given market.
The Company’s operations depend on the Company’s ability to obtain land for the development of the Company’s residential communities at reasonable prices and with terms that meet the Company’s underwriting criteria. The Company’s ability to obtain land for new residential communities may be adversely affected by
13
Table of Contents
changes in the general availability of land, the willingness of land sellers to sell land at reasonable prices given the deterioration in market conditions, competition for available land, availability of financing to acquire land, zoning, regulations that limit housing density, and other market conditions. If the supply of land appropriate for development of residential communities continues to be limited because of these factors, or for any other reason, the number of homes that the Company’s homebuilding subsidiaries build and sell may continue to decline. Additionally, the ability of the Company to open new projects could be impacted if the Company elects not to purchase lots under option contracts. To the extent that the Company is unable to purchase land timely or enter into new contracts for the purchase of land at reasonable prices, due to the lag time between the time the Company acquires land and the time the Company begins selling homes, the Company’s home sales revenue and results of operations could be negatively impacted and/or the Company could be required to scale back the Company’s operations in a given market.
Adverse changes in general economic conditions could reduce the demand for homes and, as a result, could negatively impact the Company’s results of operations.
The homebuilding industry is sensitive to changes in economic conditions such as the level of employment, consumer confidence, consumer income, availability of financing and interest rate levels. The national recession, credit market disruption, high unemployment levels, the absence of home price stability, and the decreased availability of mortgage financing have, among other factors, adversely impacted the homebuilding industry and our operations and financial condition over the last several years. Although the housing market appears to be recovering in most of the geographies in which we operate, we cannot predict the pace or scope of the recovery. If market conditions deteriorate or do not improve as anticipated, our results of operations and financial condition could be adversely impacted.
Adverse weather and geological conditions may increase costs, cause project delays and reduce consumer demand for housing, all of which would adversely affect the Company’s results of operations and prospects.
As a homebuilder, the Company is subject to numerous risks, many of which are beyond management’s control, such as droughts, floods, wildfires, landslides, soil subsidence, earthquakes and other weather-related and geologic events which could damage projects, cause delays in completion of projects, or reduce consumer demand for housing, and shortages in labor or materials, which could delay project completion and cause increases in the prices for labor or materials, thereby affecting the Company’s sales and profitability. Many of the Company’s projects are located in California, which has experienced significant earthquake activity and seasonal wildfires. In addition to directly damaging the Company’s projects, earthquakes or other geologic events could damage roads and highways providing access to those projects, thereby adversely affecting the Company’s ability to market homes in those areas and possibly increasing the costs of completion.
There are some risks of loss for which the Company may be unable to purchase insurance coverage. For example, losses associated with landslides, earthquakes and other geologic events may not be insurable and other losses, such as those arising from terrorism, may not be economically insurable. A sizeable uninsured loss could adversely affect the Company’s business, results of operations and financial condition.
The Company’s business is geographically concentrated, and therefore, the Company’s sales, results of operations, financial condition and business would be negatively impacted by a decline in regional economies.
The Company presently conducts all of its business in five geographic regions: Southern California, Northern California, Arizona, Nevada and, as of December 2012, Colorado. The economic downturn in these markets has caused housing prices and sales to decline, which has caused a material adverse effect on the Company’s business, results of operations and financial condition because the Company’s operations are concentrated in these geographic areas.
14
Table of Contents
In particular, the Company generates a significant portion of its revenue and a significant amount of its profits from, and holds approximately one-half of the dollar value of its real estate inventory in, California. Over the last several years, land values, the demand for new homes and home prices have declined substantially in California, negatively impacting the Company’s profitability and financial position. In addition, the state of California is experiencing severe budget shortfalls and is considering raising taxes and increasing fees to offset the deficit. There can be no assurance that the profitability and financial position of the Company will not be further impacted if the challenging conditions in California continue or worsen.
The Company may not be able to compete effectively against competitors in the homebuilding industry.
The homebuilding industry is highly competitive. Homebuilders compete for, among other things, homebuying customers, desirable properties, financing, raw materials and skilled labor. The Company competes both with large homebuilding companies, some of which have greater financial, marketing and sales resources than the Company, and with smaller local builders. Our competitors may independently develop land and construct housing units that are substantially similar to our products. Many of these competitors also have longstanding relationships with subcontractors and suppliers in the markets in which we operate. We currently build in several of the top markets in the nation and, therefore, we expect to continue to face additional competition from new entrants into our markets. The Company also competes for sales with individual resales of existing homes and with available rental housing.
The Company’s success depends on key executive officers and personnel.
The Company’s success is dependent upon the efforts and abilities of its executive officers and other key employees, many of whom have significant experience in the homebuilding industry and in the Company’s divisional markets. In particular, the Company is dependent upon the services of General William Lyon, Chairman of the Board and Executive Chairman, William H. Lyon, Chief Executive Officer, and Matthew R. Zaist, President and Chief Operating Officer, as well as the services of the California region and other division presidents and division management teams and personnel in the corporate office. The loss of the services of any of these executives or key personnel, for any reason, could have a material adverse effect upon the Company’s business, operating results and financial condition.
Power shortages or price increases could have an adverse impact on operations.
In prior years, certain areas in Northern and Southern California have experienced power shortages, including mandatory periods without electrical power, as well as significant increases in utility costs. The Company may incur additional costs and may not be able to complete construction on a timely basis if such power shortages and utility rate increases continue. Furthermore, power shortages and rate increases may adversely affect the regional economies in which the Company operates, which may reduce demand for housing. The Company’s operations may be adversely impacted if further rate increases and/or power shortages occur.
The Company’s business and results of operations are dependent on the availability and skill of subcontractors.
Substantially all construction work is done by subcontractors with the Company acting as the general contractor. Accordingly, the timing and quality of construction depend on the availability and skill of the Company’s subcontractors. While the Company has been able to obtain sufficient materials and subcontractors during times of material shortages and believes that its relationships with suppliers and subcontractors are good, the Company does not have long-term contractual commitments with any subcontractors or suppliers. The inability to contract with skilled subcontractors at reasonable costs on a timely basis could have a material adverse effect on the Company’s business and results of operations.
15
Table of Contents
Construction defect, soil subsidence and other building-related claims may be asserted against the Company, and the Company may be subject to liability for such claims.
As a homebuilder, we have been, and continue to be, subject to construction defect, product liability and home warranty claims, including moisture intrusion and related claims, arising in the ordinary course of business. These claims are common to the homebuilding industry and can be costly.
California law provides that consumers can seek redress for patent (i.e., observable) defects in new homes within three or four years (depending on the type of claim asserted) from when the defect is discovered or should have been discovered. If the defect is latent (i.e., non-observable), consumers must still seek redress within three or four years (depending on the type of claim asserted) from the date when the defect is discovered or should have been discovered, but in no event later than ten years after the date of substantial completion of the work on the construction. Consumers purchasing homes in Arizona, Nevada and Colorado may also be able to obtain redress under state laws for either patent or latent defects in their new homes.
With respect to certain general liability exposures, including construction defect claims, product liability claims and related claims, assessment of claims and the related liability and reserve estimation process is highly judgmental due to the complex nature of these exposures, with each exposure exhibiting unique circumstances. Furthermore, once claims are asserted for construction defects, it can be difficult to determine the extent to which the assertion of these claims will expand. Although we have obtained insurance for construction defect claims subject to applicable self-insurance retentions, such policies may not be available or adequate to cover liability for damages, the cost of repairs, and/or the expense of litigation surrounding current claims, and future claims may arise out of events or circumstances not covered by insurance and not subject to effective indemnification agreements with our subcontractors.
Material shortages could delay or increase the cost of home construction and reduce our sales and earnings.
The residential construction industry experiences serious material shortages from time to time, including shortages of insulation, drywall, cement, steel and lumber. These material shortages can be more severe during periods of strong demand for housing and during periods where the regions in which we operate experience natural disasters that have a significant impact on existing residential and commercial structures. From time to time, we have experienced volatile price swings in the cost of materials, including in particular, the cost of lumber, cement, steel and drywall. Shortages and price increases could cause delays in and increase our costs of home construction, which in turn could harm our operating results.
The Company’s limited geographic diversification could adversely affect the Company if the homebuilding industry in our markets declines.
The Company has homebuilding operations in California, Nevada, Arizona and, as of December 2012, Colorado. The Company’s limited geographic diversification could adversely impact the Company if the homebuilding business in its current markets should decline, since there may not be a balancing opportunity in a stronger market in other geographic regions.
Inflation could adversely affect the Company’s business, financial condition and results of operations, particularly in a period of oversupply of homes.
Inflation can adversely affect the Company by increasing costs of land, materials and labor. However, the Company may be unable to offset these increases with higher sales prices. In addition, inflation is often accompanied by higher interest rates, which have a negative impact on housing demand. In such an environment, the Company may be unable to raise home prices sufficiently to keep up with the rate of cost inflation, and, accordingly, its margins could decrease. Moreover, with inflation, the purchasing power of the Company’s cash resources can decline. Efforts by the government to stimulate the economy may not be successful, but have increased the risk of significant inflation and its resulting adverse effect on the Company’s business, financial condition and results of operations.
16
Table of Contents
The Company’s business is seasonal in nature and quarterly operating results can fluctuate.
The Company’s quarterly operating results generally fluctuate by season. The Company typically achieves its highest new home sales orders in the spring and summer, although new homes sales order activity is also highly dependent on the number of active selling communities and the timing of new community openings. Because it typically takes the Company three to six months to construct a new home, the Company delivers a greater number of homes in the second half of the calendar year as sales orders convert to home deliveries. As a result, the Company’s revenues from homebuilding operations are higher in the second half of the year, particularly in the fourth quarter, and the Company generally experiences higher capital demands in the first half of the year when it incurs construction costs. If, due to construction delays or other causes, the Company cannot close its expected number of homes in the second half of the year, the Company’s financial condition and full year results of operations may be adversely affected.
The Company may be unable to obtain suitable bonding for the development of its communities.
The Company provides bonds to governmental authorities and others to ensure the completion of its projects. If the Company is unable to provide required surety bonds for its projects, the Company’s business operations and revenues could be adversely affected. As a result of the deterioration in market conditions, surety providers have become increasingly reluctant to issue new bonds and some providers are requesting credit enhancements in order to maintain existing bonds or to issue new bonds. If the Company is unable to obtain required bonds in the future, or is required to provide credit enhancements with respect to its current or future bonds, the Company’s liquidity could be negatively impacted.
Increased insurance costs and reduced insurance coverages may affect the Company’s results of operations and increase the potential exposure to liability.
Recently, lawsuits have been filed against builders asserting claims of personal injury and property damage caused by the presence of mold in residential dwellings. Some of these lawsuits have resulted in substantial monetary judgments or settlements against these builders. The Company’s insurance may not cover all of the potential claims, including personal injury claims, arising from the presence of mold or such coverage may become prohibitively expensive. If the Company is unable to obtain adequate insurance coverage, a material adverse effect on the Company’s business, financial condition and results of operations could result if the Company is exposed to claims arising from the presence of mold. At this time, the Company has not received any claims from homeowners arising from the presence of mold.
The cost of insurance for the Company’s operations has risen, deductibles and retentions have increased and the availability of insurance has diminished. Significant increases in the cost of insurance coverage or significant limitations on coverage could have a material adverse effect on the Company’s business, financial condition and results of operations from such increased costs or from liability for significant uninsurable or underinsured claims.
We periodically conduct certain of our operations through unconsolidated joint ventures with independent third parties in which we do not have a controlling interest and we can be adversely impacted by joint venture partners’ failure to fulfill their obligations.
We participate in land development joint ventures, or JVs, in which we have less than a controlling interest. We have entered into JVs in order to acquire attractive land positions, to manage our risk profile and to leverage our capital base. Our JVs are typically entered into with developers, other homebuilders and financial partners to develop finished lots for sale to the JV’s members and other third parties. However, our JV investments are generally very illiquid, due to a lack of a controlling interest in the JVs. In addition, our lack of a controlling interest results in the risk that the JV will take actions that we disagree with, or fail to take actions that we desire, including actions regarding the sale of the underlying property, which could have a negative impact on our operations.
17
Table of Contents
The Company is the managing member in joint venture limited liability companies and may become a managing member or general partner in future joint ventures, and therefore may be liable for joint venture obligations.
Certain of the Company’s active JVs are organized as limited liability companies. The Company is the managing member in some of these and may serve as the managing member or general partner, in the case of a limited partnership JV, in future JVs. As a managing member or general partner, the Company may be liable for a JV’s liabilities and obligations should the JV fail or be unable to pay these liabilities or obligations.
We may incur additional healthcare costs arising from federal healthcare reform legislation.
In March 2010, the Patient Protection and Affordable Care Act and the Health Care and Education Reconciliation Act of 2010, or the Healthcare Reform Legislation, was signed into law in the United States. The Healthcare Reform Legislation increases the level of regulatory complexity for companies that offer health and welfare benefits to their employees. Due to the breadth and complexity of the Healthcare Reform Legislation and the staggered implementation, the uncertain timing of the regulations and limited interpretive guidance, it is difficult to predict the overall impact of the healthcare reform legislation on our business over the coming years. Possible adverse effects include increased healthcare costs, which could adversely affect our business, financial condition and results of operations.
Risks Related to Our Indebtedness
The Company’s high level of indebtedness could adversely affect its financial condition and prevent it from fulfilling its obligations.
The Company is highly leveraged and, subject to certain restrictions, Parent, California Lyon and their subsidiaries may incur substantial additional indebtedness. At March 11, 2013, the total outstanding principal amount of our debt was $344.2 million. Based on the current outstanding principal amount of debt, the Company’s annual interest payments are $28.7 million. No principal payments are required for California Lyon’s outstanding 8.5% Senior Notes due 2020, or the New Notes, until 2020 and certain construction notes are due in 2015. The Company’s high level of indebtedness could have detrimental consequences, including the following:
| • | the ability to obtain additional financing as needed for working capital, land acquisition costs, building costs, other capital expenditures, or general corporate purposes, or to refinance existing indebtedness before its scheduled maturity, may be limited; |
| • | the Company will need to use a substantial portion of cash flow from operations to pay interest and principal on the New Notes and other indebtedness, which will reduce the funds available for other purposes; |
| • | if Parent or California Lyon is unable to comply with the terms of the agreements governing the indebtedness of the Company, the holders of that indebtedness could accelerate that indebtedness and exercise other rights and remedies against the Company; and |
| • | if the Company has a higher level of indebtedness than some of its competitors, it may put the Company at a competitive disadvantage and reduce the Company’s flexibility in planning for, or responding to, changing conditions in the industry, including increased competition. |
The Company cannot be certain that cash flow from operations will be sufficient to allow the Company to pay principal and interest on debt, support operations and meet other obligations. If the Company does not have the resources to meet these and other obligations, the Company may be required to refinance all or part of the existing debt, including the New Notes, sell assets or borrow more money. The Company may not be able to do so on acceptable terms, in a timely manner, or at all.
18
Table of Contents
The indenture governing the New Notes imposes significant operating and financial restrictions, which may prevent Parent and its subsidiaries from capitalizing on business opportunities and taking some corporate actions.
The indenture governing the New Notes, or the Indenture, imposes significant operating and financial restrictions. These restrictions limit the ability of Parent, California Lyon and their subsidiaries, among other things, to:
| • | incur or guarantee additional indebtedness or issue certain equity interests; |
| • | pay dividends or distributions, repurchase equity or prepay subordinated debt; |
| • | make certain investments; |
| • | sell assets; |
| • | incur liens; |
| • | create certain restrictions on the ability of restricted subsidiaries to transfer assets; |
| • | enter into transactions with affiliates; |
| • | create unrestricted subsidiaries; and |
| • | consolidate, merge or sell all or substantially all of the Company’s assets. |
In addition, Parent or its subsidiaries may in the future enter into other agreements refinancing or otherwise governing indebtedness which impose yet additional restrictions. These restrictions may adversely affect Parent’s and its subsidiaries’ ability to finance future operations or capital needs or to pursue available business opportunities. A breach of any of these covenants could result in a default in respect of the related indebtedness. If a default occurs, the relevant lenders could elect to declare the indebtedness, together with accrued interest and other fees, to be immediately due and payable and proceed against any collateral securing that indebtedness.
Potential future downgrades of our credit ratings could adversely affect our access to capital and could otherwise have a material adverse effect on us.
Over the past few years, the rating agencies have downgraded the Company’s corporate credit rating due to the deterioration in our homebuilding operations, credit metrics, other earnings-based metrics, because the Company is highly leveraged and the significant decrease in our tangible net worth. These ratings and our current credit condition affect, among other things, our ability to access new capital, especially debt, and negative changes in these ratings may result in more stringent covenants and higher interest rates under the terms of any new debt. Our credit ratings could be further lowered or rating agencies could issue adverse commentaries in the future, which could have a material adverse effect on our business, results of operations, financial condition and liquidity. In particular, a weakening of our financial condition, including a significant increase in our leverage or decrease in our profitability or cash flows, could adversely affect our ability to obtain necessary funds, result in a credit rating downgrade or change in outlook, or otherwise increase our cost of borrowing. The current corporate credit rating from the ratings agencies Moody’s and Standard & Poor’s is ‘Caa2’ and ‘B-’, respectively.
Risks Related to Our Emergence from Chapter 11 Bankruptcy Proceedings
We cannot be certain that the bankruptcy proceedings will not adversely affect our operations going forward.
We emerged from bankruptcy on February 25, 2012. The full extent to which our bankruptcy will impact our business operations, reputation and relationships with our customers, employees, regulators and agents may not be known for some time, and there may be adverse ongoing effects associated with our voluntary petitions, or the Chapter 11 Petitions, under Chapter 11 of Title 11 of the United States Code, as amended, or the Bankruptcy Code.
19
Table of Contents
Our actual financial results may vary significantly from the projections filed with the U.S. Bankruptcy Court, and investors should not rely on the projections.
Neither the projected financial information that we previously filed with the U.S. Bankruptcy Court, or Bankruptcy Court, in connection with the Chapter 11 Petitions nor the financial information included in the disclosure statement for the Plan filed with, and approved by, the Bankruptcy Court, or the Disclosure Statement, should be considered or relied on in connection with our securities. We were required to prepare projected financial information and include certain of such information in the Disclosure Statement to demonstrate to the Bankruptcy Court and creditor classes voting on the Plan the feasibility of the Plan and our ability to continue operations upon emergence from the Chapter 11 Petitions. The projections reflect numerous assumptions concerning our anticipated future performance and prevailing and anticipated market and economic conditions that were and continue to be beyond our control and that may not materialize. Projections are inherently subject to uncertainties and to a wide variety of significant business, economic and competitive risks. Our actual results will vary, potentially significantly, from those contemplated by the projections for a variety of reasons. Furthermore, the projections were limited by the information available to us as of the date of the preparation of the projections. These projections have since been updated in relation to our adoption of fresh start accounting in conjunction with the confirmation of the Plan. Therefore, variations from the projections may be material, and investors should not rely on such projections.
Because of the adoption of Debtor in Possession Accounting, financial information for the period from December 19, 2011 through February 24, 2012 will not be comparable to financial information prior to or subsequent to the debtor in possession accounting period.
Upon filing the Chapter 11 Petitions, we adopted Debtor in Possession Accounting, in accordance with Accounting Standards Codification No. 852,Reorganizations.Accordingly, our financial statements for the period from December 19, 2011 through February 24, 2012 will not be comparable in many respects to our financial statements prior to December 19, 2011 or subsequent to February 24, 2012. The lack of comparable historical financial information may discourage investors from purchasing our securities.
Because of the adoption of Fresh Start Accounting and the effects of the transactions contemplated by the Plan, financial information subsequent to February 24, 2012 will not be comparable to financial information prior to February 24, 2012.
Upon our emergence from the Chapter 11 Petitions, we adopted Fresh Start Accounting, in accordance with Accounting Standards Codification No. 852,Reorganizations, pursuant to which the midpoint of the range of our reorganization value was allocated to our assets in conformity with the procedures specified by Accounting Standards Codification No. 805,Business Combinations. Accordingly, our financial statements subsequent to February 24, 2012 will not be comparable in many respects to our financial statements prior to February 24, 2012. The lack of comparable historical financial information may discourage investors from purchasing our securities.
Regulatory Risks
Governmental laws and regulations may increase the Company’s expenses, limit the number of homes that the Company can build or delay completion of projects.
The Company is subject to numerous local, state, federal and other statutes, ordinances, rules and regulations concerning zoning, development, building design, construction and similar matters which impose restrictive zoning and density requirements in order to limit the number of homes that can eventually be built within the boundaries of a particular area. Projects that are not entitled may be subjected to periodic delays, changes in use, less intensive development or elimination of development in certain specific areas due to government regulations. The Company may also be subject to periodic delays or may be precluded entirely from developing in certain communities due to building moratoriums or “slow-growth” or “no-growth” initiatives that
20
Table of Contents
could be implemented in the future in the states in which the Company operates. Local and state governments also have broad discretion regarding the imposition of development fees for projects in their jurisdiction. Projects for which the Company has received land use and development entitlements or approvals may still require a variety of other governmental approvals and permits during the development process and can also be impacted adversely by unforeseen health, safety, and welfare issues, which can further delay these projects or prevent their development. As a result, home sales could decline and costs increase, which could negatively affect the Company’s results of operations.
The Company is subject to environmental laws and regulations, which may increase costs, limit the areas in which the Company can build homes and delay completion of projects.
The Company is also subject to a variety of local, state, federal and other statutes, ordinances, rules and regulations concerning the environment. The particular environmental laws which apply to any given homebuilding site vary according to the site’s location, its environmental conditions and the present and former uses of the site, as well as adjoining properties. Environmental laws and conditions may result in delays, may cause the Company to incur substantial compliance and other costs, and can prohibit or severely restrict homebuilding activity in environmentally sensitive regions or areas, which could negatively affect the Company’s results of operations. Under various environmental laws, current or former owners of real estate, as well as certain other categories of parties, may be required to investigate and clean up hazardous or toxic substances or petroleum product releases, and may be held liable to a governmental entity or to third parties for property damage and for investigation and clean-up costs incurred by such parties in connection with the contamination. In addition, in those cases where an endangered species is involved, environmental rules and regulations can result in the elimination of development in identified environmentally sensitive areas.
Risks Related to Ownership of Our Capital Stock and this Offering
Concentration of ownership of the voting power of our capital stock may prevent other stockholders from influencing corporate decisions and create perceived conflicts of interest.
Luxor Capital Group, or Luxor, William H. Lyon, and Paulson & Co. Inc., or Paulson, hold significant ownership interests in the Company, which may allow them to dictate the outcome of certain corporate actions requiring stockholder approval. As of March 11, 2013, entities affiliated with Luxor hold 29.7% of the Class A Common Stock, 95.9% of the Class C Common Stock and 79.9% of the Convertible Preferred Stock, which provides Luxor with 37.1% of the total voting power of the Company’s outstanding capital stock. As of March 11, 2013, William H. Lyon, through his management of Lyon Shareholder 2012, LLC, holds 100% of the Class B Common Stock and a warrant to purchase 15,737,294 additional shares of Class B Common Stock, which, in addition to 24,199 shares of Class A Common Stock held by The William Harwell Lyon Separate Property Trust, provides William H. Lyon with 36.1% of the total voting power of the Company’s outstanding capital stock. As of March 11, 2013, entities affiliated with Paulson hold 21.7% of the Class A Common stock and 15.8% of the Convertible Preferred Stock, which provides Paulson with 10.4% of the total voting power of the Company’s outstanding capital stock. See “Security Ownership of Certain Beneficial Owners and Management” below.
On all matters on which the holders of our common stock are entitled to vote, prior to the occurrence of both the Conversion Date and the conversion of all Class B Common Stock, each share of common stock is entitled to one vote per share, with the exception of our Class B Common Stock, which is entitled to two votes per share. Additionally, prior to the Conversion Date and while any shares of Class B Common Stock remain outstanding, the board of directors will include two directors elected by the holders of Class A Common Stock, two directors elected by the holders of Class B Common Stock and Class D Common Stock, voting together as a class, three directors elected by the holders of Class C Common Stock and Convertible Preferred Stock, voting together as a class, and one director elected by the holders of (i) 66 2/3% of the Class A Common Stock, voting separately as a class, (ii) the majority of the Class B Common Stock, voting separately as a class, and (iii) the majority of the Class C Common Stock and Convertible Preferred Stock, voting together as a separate class. In light of these and
21
Table of Contents
other voting rules provided in the Company’s Second Amended and Restated Certificate of Incorporation, or the Certificate of Incorporation, and described in greater detail in “Management and Directors – Board of Directors” below, Luxor, Paulson and William H. Lyon may be able to prevent other stockholders from influencing certain corporate decisions.
Luxor, Paulson and William H. Lyon may have interests that differ from yours and may vote in a way with which you disagree and which may be adverse to your interests. This ownership concentration may adversely impact the trading of our capital stock because of a perceived conflict of interest that may exist, thereby depressing the value of our capital stock.
There may be future sales or other dilution of our equity, which may adversely affect the market price of our capital stock and may negatively impact the holders’ investment.
We may issue additional capital stock, including securities that are convertible into or exchangeable for, or that represent the right to receive, capital stock or any substantially similar securities. In addition, with the applicable consent of the holders of our Convertible Preferred Stock, we may issue additional preferred stock. Under our Certificate of Incorporation, we are authorized to issue 340,000,000 shares of Class A Common Stock; 50,000,000 shares of Class B Common Stock; 120,000,000 shares of Class C Common Stock; 30,000,000 shares of Class D Common Stock; and 80,000,000 shares of preferred stock. As of March 11, 2013, we had (i) 70,121,378 shares of Class A Common Stock issued and outstanding, (ii) 31,464,548 shares of Class B Common Stock issued and outstanding, which can be converted into 31,464,548 shares of Class A Common Stock, (iii) 16,020,338 shares of Class C Common Stock issued and outstanding, which can be converted into 16,020,338 shares of Class A Common Stock, (iv) 5,501,432 shares of Class D Common Stock issued and outstanding, which can be converted into 5,501,432 shares of our Class A Common Stock, and (v) 77,005,744 shares of Convertible Preferred Stock issued and outstanding, which can be converted into shares of either our Class A Common Stock or Class C Common Stock (depending on the circumstances of the conversion). Accordingly, the Class B Common Stock, Class C Common Stock, Class D Common Stock and Convertible Preferred Stock, if converted, will have a dilutive effect on our outstanding Class A Common Stock and, potentially, on our Class C Common Stock. Further, if we issue additional shares of capital stock in the future and do not issue shares to all then-existing common and/or preferred stockholders in proportion to their interests, the issuance will result in dilution to each stockholder.
Additionally, as of March 11, 2013, there is a warrant outstanding exercisable for an additional 15,737,294 shares of Class B Common Stock. This warrant, if exercised, and if subsequently converted into shares of our Class A Common Stock, would also have a dilutive effect on our Class A Common Stock. As of March 11, 2013, we also have outstanding stock options to purchase 4,757,303 shares of the Company’s Class D Common Stock at an exercise price of $1.05 per share. To the extent these options are exercised, there will be further dilution.
The requirements of being a reporting company may strain our resources and divert management’s attention from other business concerns.
We have filed this registration statement pursuant to certain registration rights that we granted to certain of our shareholders and the holders of the Notes, and pursuant to which, we are subject to the reporting requirements of the Securities Exchange Act of 1934, or the Exchange Act, and the Sarbanes-Oxley Act of 2002, as amended, or the Sarbanes-Oxley Act. The Exchange Act requires, among other things, that we file annual, quarterly and current reports with respect to our business and operating results, and the Sarbanes-Oxley Act requires, among other things, that we maintain effective disclosure controls and procedures and internal control over financial reporting. In order to maintain and, if required, improve our disclosure controls and procedures and internal control over financial reporting to meet this standard, significant resources and management oversight may be required. As a result, management’s attention may be diverted from other business concerns, which could adversely affect our business and operating results. Although we have employees to comply with these requirements, we may need to hire more employees in the future or engage outside consultants, which will increase our costs and expenses.
22
Table of Contents
In addition, changing laws, regulations and standards relating to public disclosure are creating uncertainty for reporting companies. These new or changed laws, regulations and standards are subject to varying interpretations in many cases due to their lack of specificity, and, as a result, their application in practice may evolve over time as new guidance is provided by regulatory and governing bodies, which could result in continuing uncertainty regarding compliance matters and higher costs necessitated by ongoing revisions to disclosure practices. As a result, our efforts to comply with evolving laws, regulations and standards are likely to continue to result in increased general and administrative expenses and a diversion of management time and attention from revenue-generating activities to compliance activities.
If we fail to maintain proper and effective internal controls, our ability to produce accurate and timely financial statements could be impaired, which could harm our operating results, our ability to operate our business and investors’ views of us.
Ensuring that we have adequate internal financial and accounting controls and procedures in place to enable the Company to produce accurate financial statements on a timely basis is a costly and time-consuming effort that needs to be re-evaluated frequently. We have begun the process of documenting, reviewing and improving our internal controls and procedures in order to meet the requirements of Section 404 of the Sarbanes-Oxley Act. Section 404 of the Sarbanes-Oxley Act requires annual management assessments of the effectiveness of our internal controls over financial reporting beginning with our annual report for the year ending December 31, 2013. We and our independent auditors will be testing our internal controls pursuant to the requirements of Section 404 of the Sarbanes-Oxley Act and could, as part of that documentation and testing, identify areas for further attention or improvement. Implementing any appropriate changes to our internal controls may require additional personnel, specific compliance training of our directors, officers and employees, entail substantial costs in order to modify our existing accounting systems and require a significant period of time to complete.
We may become subject to certain corporate governance requirements, which may result in increased costs to us and affect our ability to attract or retain board members and executive officers.
We may incur costs associated with corporate governance requirements, including requirements under rules implemented by the SEC or any stock exchange or inter-dealer quotation system on which our capital stock may be listed in the future. The expenses incurred by companies for corporate governance purposes have increased dramatically in recent years. We expect these rules and regulations to substantially increase our legal and financial compliance costs and to make some activities more time-consuming and costly. We are unable to currently estimate these costs with any degree of certainty. We also expect that these rules and regulations may make it difficult and expensive for us to obtain director and officer liability insurance, and if we are able to obtain such insurance, we may be required to accept reduced policy limits and coverage or incur substantially higher costs to obtain such coverage. Further, our board members and executive officers could face an increased risk of personal liability in connection with the performance of their duties. As a result, we may have difficulty attracting and retaining qualified board members and executive officers, which could harm our business.
Anti-takeover provisions in our charter documents and under Delaware law could make an acquisition of our company more difficult, limit attempts by our stockholders to replace or remove our current management and limit the market price of our capital stock.
Provisions in our Certificate of Incorporation and Second Amended and Restated Bylaws, or the Bylaws, may have the effect of delaying or preventing a change of control or changes in our management. Our Certificate of Incorporation and Bylaws include the following provisions:
| • | that after the Conversion Date (as defined in “the Company’s Certificate of Incorporation”), any action to be taken by our stockholders must be effected at a duly called annual or special meeting and not by written consent; |
23
Table of Contents
| • | that after the Conversion Date, special meetings of our stockholders can be called only by our board of directors, the Chairman of our board of directors, or our President; |
| • | following the later of the Conversion Date and the date on which all of the shares of our Class B Common Stock have been converted into shares of Class A Common Stock, or the Specified Date, our directors may not be removed without cause; |
| • | that from and after the Specified Date, vacancies and newly created directorships resulting from any increase in the authorized number of directors may be filled by a majority of the directors then in office, although less than a quorum, or by a sole remaining director or by the stockholders entitled to vote at any annual or special meeting held in accordance with Article II of the Bylaws; and |
| • | the approval of a supermajority of our outstanding shares of capital stock is required to amend certain provisions of our Certificate of Incorporation. |
These provisions may frustrate or prevent attempts by our stockholders to replace or remove our current management by making it more difficult for stockholders to replace members of our board of directors, which is responsible for appointing the members of our management. In addition, because our parent entity is incorporated in Delaware, we are governed by the provisions of Section 203 of the Delaware General Corporation Law, which generally prohibits a Delaware corporation from engaging in any of a broad range of business combinations with any “interested” stockholder for a period of three years following the date on which the stockholder became an “interested” stockholder.
Risks Related Specifically to Common Stock
There is currently no public trading market for our common stock and a trading market may not develop, making it difficult for our stockholders to sell their shares.
There is currently no public trading market for our common stock. In the absence of an active public trading market, an investor may be unable to liquidate an investment in our common stock. As a result, investors: (i) may be precluded from transferring their shares of common stock; (ii) may have to hold their shares of common stock for an indefinite period of time; and (iii) must be able to bear the complete economic risk of losing their investment in us. In the event a market for our common stock should develop, there can be no assurance that the market price will equal or exceed the price paid for any of the shares offered herein.
In addition, we intend for our stock to be traded over-the-counter on the OTCBB. Over-the-counter transactions involve risks in addition to those associated with transactions in securities traded on a securities exchange. Many over-the-counter securities trade less frequently and in smaller volumes than exchange-listed securities. Accordingly, our common stock may be less liquid than it would otherwise be and may be difficult to sell. Also, the value of our common stock may be more volatile than exchange-listed securities. In addition, issuers of securities traded on the OTCBB do not have to meet the same specific quantitative and qualitative listing and maintenance standards.
We do not currently intend to pay dividends on our common stock.
We have not declared or paid any cash dividends on our common stock and we do not plan to do so in the foreseeable future. Any determination to pay dividends to the holders of our common stock will be at the discretion of our board of directors. Further, the payment of cash dividends is restricted under the terms of our Amended Term Loan Agreement. Therefore, you are not likely to receive any dividends on your common stock for the foreseeable future.
24
Table of Contents
Our issued and outstanding shares of Convertible Preferred Stock have rights, preferences and privileges senior to our common stock.
As of March 11, 2013, there were 77,005,744 shares of Convertible Preferred Stock issued and outstanding. Our Convertible Preferred Stock has rights, preferences and privileges senior to our common stock. For instance, the Convertible Preferred Stock ranks senior and prior to the common stock with respect to payment of dividends, redemption payments and rights upon liquidation, dissolution or winding up of the affairs of the Company. See “Description of Capital Stock” for a more detailed discussion of these rights, preferences and privileges.
Risks Related Specifically to Preferred Stock
An active trading market for the Convertible Preferred Stock does not exist and may not develop.
The Convertible Preferred Stock has no established trading market. Until the maturity date of the Convertible Preferred Stock, investors seeking liquidity will be limited to selling their shares of Convertible Preferred Stock in the secondary market or converting their shares of Convertible Preferred Stock into shares of common stock and subsequently seeking to sell those shares of common stock. In the event a market should develop for the Convertible Preferred Stock, there can be no assurance that the market price will equal or exceed the price paid for any of the shares offered herein.
We may not be able to repurchase the Convertible Preferred Stock when required.
To the extent not previously converted to common stock, the Company will be required to redeem all the then outstanding shares of Convertible Preferred Stock on the fifteenth anniversary of the date of first issuance of Convertible Preferred Stock, or the Maturity Date. We may not have sufficient funds at the Maturity Date to make the required repurchases or our ability to make such repurchases may be restricted by the terms of our other debt then outstanding. The source of funds for any repurchase required at the Maturity Date will be our available cash or cash generated from operating activities or other sources, including borrowings, sales of assets or sales of equity. We cannot assure you, however, that sufficient funds will be available or that the terms of our other debt then outstanding will permit us at the time of any such events to make any required repurchases of the Convertible Preferred Stock. Furthermore, the use of available cash to fund the repurchase of the Convertible Preferred Stock may impair our ability to obtain additional financing in the future.
The market price of the Convertible Preferred Stock may be directly affected by the market price of our Class A Common Stock and our Class C Common Stock, which may be volatile.
To the extent that a secondary market for the Convertible Preferred Stock develops, because the Convertible Preferred Stock may be converted into Class A Common Stock or Class C Common Stock upon the occurrence of certain events and/or conditions, we believe that the market price of the Convertible Preferred Stock will be significantly affected by the market price of our Class A Common Stock and Class C Common Stock, as applicable. Because there is currently no market for our Class A Common Stock and Class C Common Stock, we cannot predict how the shares of our Class A Common Stock or Class C Common Stock will trade in the future. This may result in greater volatility in the market price of the Convertible Preferred Stock than would be expected for non-convertible stock.
The Convertible Preferred Stock has not been rated.
The Convertible Preferred Stock has not been rated by any nationally recognized statistical rating organization. This factor may affect the trading price of the Convertible Preferred Stock.
25
Table of Contents
Holders of the Convertible Preferred Stock do not have identical rights as the holders of common stock until they acquire the common stock, but will be subject to all changes made with respect to our common stock.
Except for voting and dividend rights, the holders of the Convertible Preferred Stock have no rights with respect to the common stock until conversion of their Convertible Preferred Stock, but such stockholders’ investment in the Convertible Preferred Stock may be negatively affected by such events. Even though the holders of the Convertible Preferred Stock vote on an as-converted basis with the holders of the common stock, upon conversion of the Convertible Preferred Stock, holders will be entitled to exercise the rights of a holder of common stock only as to matters for which the record date occurs on or after the applicable conversion date and only to the extent permitted by law, although holders will be subject to any changes in the powers, preferences, or special rights of common stock that may occur as a result of any shareholder action taken before the applicable conversion date.
Other Risks
The Company may not be able to benefit from net operating loss, or NOL carryforwards.
At December 31, 2012, the Company had gross federal and state net operating loss carryforwards totaling approximately $243.8 million and $508.3 million, respectively. Federal net operating loss carryforwards begin to expire in 2028 and state net operating loss carryforwards begin to expire in 2013. In addition, as of December 31, 2012 and 2011, the Company had unused federal and state built-in losses of $42.1 million and $27.9 million, respectively, which expire in 2017. The Company has also has alternative minimum tax (AMT) credit carryforwards of $2.7 million which do not expire. We have fully reserved against our net deferred tax assets, including the NOL carryforward, due to the possibility that we may not have taxable income and the limitations required under the Internal Revenue Code, or IRC, Sections 382 and 383.
Our emergence from Chapter 11 proceedings may limit our ability to offset future U.S. taxable income with tax losses and credits incurred prior to emergence from Chapter 11 bankruptcy proceedings.
In connection with our emergence from Chapter 11 bankruptcy proceedings, we were able to retain a portion of our U.S. net operating loss and tax credit carryforwards, or the “Tax Attributes”. However, Internal Revenue Code, or IRC, Sections 382 and 383 provide an annual limitation with respect to the ability of a corporation to utilize its Tax Attributes against future U.S. taxable income in the event of a change in ownership. Our emergence from Chapter 11 bankruptcy proceedings is considered a change in ownership for purposes of IRC Section 382 and our annual Section 382 limitation is approximately $4.0 million. As a result, our future U.S. taxable income may not be fully offset by the Tax Attributes if such income exceeds our annual limitation, and we may incur a tax liability with respect to such income. In addition, subsequent changes in ownership for purposes of the IRC could further diminish our ability to utilize Tax Attributes.
Future terrorist attacks against the United States or increased domestic or international instability could have an adverse effect on our operations.
Adverse developments in the war on terrorism, future terrorist attacks against the United States, or any outbreak or escalation of hostilities between the United States and any foreign power, including the armed conflicts in Iraq and Afghanistan, may cause disruption to the economy, our Company, our employees and our customers, which could adversely affect our revenues, operating expenses and financial condition.
26
Table of Contents
CAUTIONARY STATEMENT CONCERNING FORWARD-LOOKING STATEMENTS
Investors are cautioned that this prospectus and any accompanying prospectus supplement contain forward-looking statements within the meaning of the Section 27A of the Securities Act and Section 21 of the Exchange Act. Statements which are predictive in nature, which depend upon or refer to future events or conditions, or which include words such as “expects,” “anticipates,” “intends,” “plans,” “believes,” “estimates,” “hopes” and similar expressions constitute forward-looking statements. In addition, any statements concerning future financial performance (including future revenues, earnings or growth rates), ongoing business strategies or prospects and possible future Company actions, which may be provided by management are also forward-looking statements as defined in the Securities Act of 1933, as amended. Forward-looking statements are based upon expectations and projections about future events and are subject to assumptions, risks and uncertainties about, among other things, the Company, economic and market factors and the homebuilding industry.
Although we believe that we have a reasonable basis for each forward-looking statement contained in this prospectus, we caution you that actual results may differ materially from those expressed or forecasted in the forward-looking statements due to a number of factors. The principal factors that could cause the Company’s actual performance and future events and actions to differ materially from such forward-looking statements include, but are not limited to, worsening in general economic conditions either nationally or in regions in which the Company operates, worsening in markets for residential housing, further decline in real estate values resulting in further impairment of the Company’s real estate assets, volatility in the banking industry and credit markets, terrorism or other hostilities involving the United States, whether an ownership change occurred which could, under certain circumstances, have resulted in the limitation of the Company’s ability to offset prior years’ taxable income with net operating losses, changes in home mortgage interest rates, changes in generally accepted accounting principles or interpretations of those principles, changes in prices of homebuilding materials, labor shortages, adverse weather conditions, the occurrence of events such as landslides, soil subsidence and earthquakes that are uninsurable, not economically insurable or not subject to effective indemnification agreements, changes in governmental laws and regulations, inability to comply with financial and other covenants under the Company’s debt instruments, whether the Company is able to refinance the outstanding balances of its debt obligations at their maturity, anticipated tax refunds, the timing of receipt of regulatory approvals and the opening of projects and the availability and cost of land for future growth. These and other risks and uncertainties are more fully described in the section in the prospectus entitled “Risk Factors.” While it is impossible to identify all such factors, factors which could cause actual results to differ materially from those estimated by the Company include, but are not limited to, those factors or conditions described under “Management’s Discussion and Analysis of Financial Condition and Results of Operations.” The Company’s past performance or past or present economic conditions in the Company’s housing markets are not indicative of future performance or conditions. Investors are urged not to place undue reliance on forward-looking statements. In addition, the Company undertakes no obligation to update or revise forward-looking statements to reflect changed assumptions, the occurrence of anticipated or unanticipated events or changes to projections over time unless required by federal securities laws.
27
Table of Contents
RATIO OF EARNINGS TO FIXED CHARGES AND PREFERRED STOCK DIVIDENDS
The Company has an excess of fixed charges to earnings. The following table presents the Company’s historical excess of fixed charges and preferred stock dividends to earnings for the periods indicated.
| Successor Period from February 25 through December 31, 2012 | Predecessor Period from January 1 through February 24, 2012 | Predecessor Year Ended December 31, | ||||||||||||||||||||||||||||
| 2011 | 2010 | 2009 | 2008 | 2007 | ||||||||||||||||||||||||||
Excess of fixed charges to earnings (loss)(1) | $ | — | $ | (16,050) | $ | (86,347 | ) | $ | (52,871 | ) | $ | (150,218 | ) | $ | (82,117 | ) | $ | (94,064 | ) | |||||||||||
Excess of combined fixed charges and preferred stock dividends to earnings (loss)(1) | $ | (2,097) | N/A | N/A | N/A | N/A | N/A | N/A | ||||||||||||||||||||||
| (1) | The term “fixed charges” means the sum of (a) interest expensed and capitalized, (b) amortized premiums, discounts and capitalized expenses related to indebtedness, (c) portion of rent expense considered to be interest, and (d) preference security dividend requirements of consolidated subsidiaries. The term “preference security dividend” is the amount of pre-tax earnings that is required to pay dividends on outstanding preference securities. The term “earnings” means the sum of (a) pre-tax income from continuing operations and (b) fixed charges. |
The selling stockholders will receive all of the proceeds from the sale of the capital stock registered hereby. We will not receive any proceeds.
We do not intend to pay dividends on our common stock in the near future. Any determination to pay dividends to holders of our common stock will be at the discretion of our board of directors. Other than as provided below, the payment of cash dividends is restricted under the terms of the indenture governing the New Notes.
Holders of our Convertible Preferred Stock are entitled to receive cumulative dividends at a rate of 6% per annum consisting of (i) cash dividends at the rate of 4% paid quarterly in arrears, and (ii) accreting dividends accruing at the rate of 2% per annum. See “Description of Capital Stock” below for additional information regarding dividend rights.
DETERMINATION OF OFFERING PRICE
All securities being offered hereby will be offered or sold from time to time directly by the selling stockholders or alternatively through underwriters, broker dealers or agents. The securities may be sold in one or more transactions at the current fixed price per share of $1.05 for our Class A Common Stock and Class C Common Stock and $1.15 per share for our Convertible Preferred Stock until such shares are quoted on the OTC Bulletin Board or an exchange, if ever, and thereafter at prevailing market prices at the time of sale or privately negotiated prices.
28
Table of Contents
This offering is for sales of the capital stock registered hereby by the selling stockholders on a continuous or delayed basis in the future. The capital stock is currently issued and outstanding. Accordingly, there will be no dilution to our existing stockholders, except for dilution caused by the conversion of our Class B Common Stock, Class C Common Stock, Class D Common Stock (including such shares issued upon exercise of our outstanding stock options) and Convertible Preferred Stock into Class A Common Stock, and the conversion of our Convertible Preferred Stock into Class C Common Stock, as described in “Description of Capital Stock” below. Further, purchasers of the capital stock from the selling stockholders will experience dilution to the extent of the difference between the amount per share paid and the net tangible book value per share of our capital stock at the time of the purchase. Net tangible book value per share represents total net tangible assets divided by the number of outstanding shares of our capital stock.
Additionally, there is a warrant outstanding exercisable for an additional 15,737,294 shares of Class B Common Stock. This warrant, if exercised, would have a dilutive effect on our Class B Common Stock and, if such shares of Class B Common Stock are subsequently converted, on our Class A Common Stock. As of March 11, 2013, we also have outstanding stock options to purchase 4,757,303 shares of the Company’s Class D common stock at an exercise price of $1.05 per share. To the extent these options are exercised, there will be further dilution.
29
Table of Contents
Chapter 11 Reorganization
On December 19, 2011, William Lyon Homes, or Parent, and certain of its direct and indirect wholly-owned subsidiaries filed voluntary petitions, or the Chapter 11 Petitions, in the U.S. Bankruptcy Court for the District of Delaware, or the Bankruptcy Court, to seek approval of the Prepackaged Joint Plan of Reorganization, or the Plan, of Parent and certain of its subsidiaries. The Chapter 11 Petitions are jointly administered under the captionIn re William Lyon Homes, et al., Case No. 11-14019, or the Chapter 11 Cases. The sole purpose of the Chapter 11 Cases was to restructure the debt obligations and strengthen the balance sheet of the Parent and certain of its subsidiaries.
On February 10, 2012, the Bankruptcy Court confirmed the Plan. On February 25, 2012, Parent and its subsidiaries consummated the principal transactions contemplated by the Plan, including:
| • | the issuance of 44,793,255 shares of Parent’s new Class A Common Stock, $0.01 par value per share, or Class A Common Stock, and $75 million aggregate principal amount of 12% Senior Subordinated Secured Notes due 2017, or the Notes, issued by Parent’s wholly-owned subsidiary, William Lyon Homes, Inc., or California Lyon, in exchange for the claims held by the holders of an aggregate outstanding amount of $299.1 million of the formerly outstanding notes of California Lyon (neither Parent nor California Lyon received any net proceeds from the issuance of the Notes); |
| • | the amendment of California Lyon’s loan agreement with ColFin WLH Funding, LLC and certain other lenders, or the Amended Term Loan, which resulted, among other things, in the increase in the principal amount outstanding under the loan agreement from $206 million to $235 million, the reduction in the interest rate payable under the loan agreement, and the elimination of any prepayment penalty under the loan agreement; |
| • | the issuance, in exchange for cash and land deposits of $25 million, of 31,464,548 shares of Parent’s new Class B Common Stock, $0.01 par value per share, or Class B Common Stock, and a warrant to purchase 15,737,294 shares of Class B Common Stock; |
| • | the issuance of 64,831,831 shares of Parent’s new Convertible Preferred Stock, $0.01 par value per share, or Convertible Preferred Stock, and 12,966,366 shares of Parent’s new Class C Common Stock, $0.01 par value per share, or Class C Common Stock, in exchange for aggregate cash consideration of $60 million; and |
| • | the issuance of an additional 3,144,000 shares of Class C Common Stock to Luxor Capital Group LP as a transaction fee in consideration for providing the backstop commitment of the offering of shares of Class C shares and shares of Convertible Preferred Stock in connection with the Plan. |
Principal Holders of Debt and Equity Issued In Connection with the Plan
Immediately prior to the consummation of the Plan, Luxor Capital Group LP, or Luxor, held $135.8 million in aggregate principal amount of California Lyon’s formerly outstanding prepetition notes, or the Prepetition Notes. In connection with the consummation of the principal transactions contemplated by the Plan, entities affiliated with Luxor acquired (i) 21,427,135 shares of Parent’s Class A Common Stock (47.8% of the then outstanding Class A Common Stock) and $35.9 million in aggregate principal amount of the Notes issued in connection with the Plan in exchange for the Prepetition Notes held by Luxor, (ii) 12,301,838 shares of Parent’s Class C Common Stock (76.4% of the then outstanding Class C Common Stock) for approximately $9.5 million in cash consideration, and (iii) 61,509,204 shares of Parent’s Convertible Preferred Stock (94.9% of the then outstanding Convertible Preferred Stock) for aggregate cash consideration of approximately $47.4 million. Luxor received an additional 3,144,000 shares of Parent’s Class C Common Stock (19.5% of the then outstanding Class C Common Stock) as a transaction fee in consideration for providing the backstop commitment of the
30
Table of Contents
offering of shares of Class C Common Stock and shares of Convertible Preferred Stock in connection with the Plan. As of March 11, 2013, Luxor holds approximately 37.1% of the total voting power of Parent’s outstanding capital stock.
Immediately prior to the consummation of the Plan, General William Lyon and William H. Lyon, or the Lyons, collectively held 100% of Parent’s then outstanding capital stock and The William Harwell Lyon Separate Property Trust, of which William H. Lyon is the trustee, separately held approximately $153,000 in aggregate principal amount of the Prepetition Notes. In connection with the recapitalization of Parent upon consummation of the Plan, the Lyons acquired beneficial ownership of 31,464,548 shares of Class B Common Stock (100% of Parent’s outstanding Class B Common Stock) and a warrant to purchase an additional 15,737,294 shares of Class B Common Stock for aggregate cash consideration of $25 million through Lyon Shareholder 2012, LLC, which is now managed by William H. Lyon and held for the benefit of William H. Lyon. The William Harwell Lyon Separate Property Trust separately acquired 24,199 shares of Parent’s Class A Common Stock (less than 1% of the then outstanding Class A Common Stock) and $40,000 in aggregate principal amount of the Notes issued in connection with the Plan in exchange for the Prepetition Notes held by The William Harwell Lyon Separate Property Trust. William H. Lyon’s Class B Common Stock holdings and Class A Common Stock holdings provide William H. Lyon with 36.1% of the total voting power of the Company’s outstanding capital stock as of March 11, 2013. Throughout the reorganization process, General William Lyon served as Parent’s Chief Executive Officer and a member of its board of directors and William H. Lyon served as Parent’s President and Chief Operating Officer and a member of its board of directors.
Events leading to Chapter 11 Reorganization
Prior to filing the Chapter 11 Petitions, California Lyon was in default under its prepetition loan agreement with ColFin WLH Funding, LLC and certain other lenders, or the Prepetition Term Loan Agreement, due to its failure to comply with certain financial covenants in the Prepetition Term Loan Agreement. In addition, the Company became increasingly uncertain of its ability to repay or refinance its then outstanding 7 5/8% Senior Notes when they matured on December 15, 2012. Beginning in April 2010, California Lyon entered into a series of amendments and temporary waivers with the lenders under the Prepetition Term Loan Agreement related to these defaults, which prevented acceleration of the indebtedness outstanding under the Prepetition Term Loan Agreement and enabled the Company to negotiate a financial reorganization to be implemented through the bankruptcy process with its key constituents prior to the Chapter 11 Petitions.
Overview
The Company is primarily engaged in the design, construction and sale of single family detached and attached homes in California, Arizona and Nevada. Since the founding of the Company’s predecessor in 1956, the Company and its joint ventures have sold over 74,000 homes. The Company’s predecessor, The Presley Companies, or Presley, was formed in 1956. In 1987, General William Lyon purchased 100% of the stock of Presley, which subsequently went public in 1991 and was listed on the New York Stock Exchange under the symbol “PDC.” In 1999, Presley acquired William Lyon Homes, Inc., a California corporation, and changed its name to William Lyon Homes and its ticker symbol to “WLS.” Parent was subsequently taken private in 2006 by way of a tender offer by General William Lyon for the shares of Parent that were then publicly owned. Prior to the consummation of the transactions contemplated by the Plan, Parent had one class of stock of which 1,000 shares were outstanding. Of these shares, 94.6% (946 shares) were owned by General William Lyon individually and the remaining 5.4% (54 shares) were owned by The William Harwell Lyon Separate Property Trust.
The Company conducts its homebuilding operations through five reportable operating segments (Southern California, Northern California, Arizona, Nevada, and Colorado). For the year ended December 31, 2012, which includes the “Predecessor” entity from January 1, 2012 through February 24, 2012, and the “Successor” entity from February 25, 2012 through December 31, 2012, or the 2012 Period, on a consolidated basis, which includes results from all five reportable operating segments, 45% of home closings were derived from our California operations. In the 2012 period, the Company had revenues from home sales of $261.3 million and delivered 950 homes. For the year ended December 31, 2011, approximately 59% of the home closings of the Company and its
31
Table of Contents
joint ventures were derived from its California operations. For the year ended December 31, 2011 the Company had revenues from home sales of $207.1 million and delivered 614 homes.
The Company acquired Village Homes of Denver, Colorado, on December 7, 2012, which marked the beginning of the Colorado segment. Financial data included herein as of December 31, 2012, and for the period from February 25, 2012 through December 31, 2012, includes operations of the Colorado segment from December 7, 2012 (date of acquisition) through December 31, 2012.
The Company designs, constructs and sells a wide range of homes designed to meet the specific needs of each of its markets, although it primarily emphasizes sales to the entry-level and first time move-up home buyer markets. In December 31, 2012, the Company marketed its homes through 18 sales locations. In 2012, the average sales price for consolidated homes delivered was $275,100. Base sales prices for actively selling projects in 2012, including affordable projects, ranged from $88,000 to $690,000.
The Company had total operating revenues of $398.3 million, $226.8 million, and $294.7 million for the years ended December 31, 2012, 2011, and 2010, respectively. Homes closed by the Company, including its joint ventures, were 950, 614, and 760 for the years ended December 31, 2012, 2011, and 2010, respectively. The Company’s dollar amount of backlog of homes sold but not closed as of December 31, 2012 was $115.4 million, a 294% increase compared to $29.3 million as of December 31, 2011, which was a 3% decrease from the $30.1 million as of December 31, 2010. The cancellation rate of buyers who contracted to buy a home but did not close escrow was approximately 14% during the year ended December 31, 2012 and 18% during the year ended December 31, 2011.
During the year ended December 31, 2012, the Company’s markets improved significantly in sales absorption rates, new home orders per average sales location and cancellation rates.
| • | In Southern California, net new home orders per average sales location increased 39% to 41.8 during the year ended December 31, 2012 from 30.1 for the same period in 2011. The cancellation rate in Southern California decreased to 15% during the year ended December 31, 2012 compared to 24% during the year ended December 31, 2011. |
| • | In Northern California, net new home orders per average sales location increased 71% to 62.7 during the year ended December 31, 2012 from 36.8 for the same period in 2011. In Northern California, the cancellation rate increased to 23% during the year ended December 31, 2012 from 18% during the year ended December 31, 2011. |
| • | In Arizona, net new home orders per average sales location increased to 138.3 during the year ended December 31, 2012 from 101.0 for the same period in 2011. In Arizona, the cancellation rate increased to 10% during the year ended December 31, 2012 compared to 7% during the year ended December 31, 2011. |
| • | In Nevada, net new home orders per average sales location increased to 44.7 during the year ended December 31, 2012 from 18.2 during the same period in 2011. In Nevada, the cancellation rate decreased to 14% during the year ended December 31, 2012 from 20% during the year ended December 31, 2011. |
| • | In Colorado, there were nine net new home orders during the period from December 7, 2012 through December 31, 2012 with no comparable amount during the year ended December 31, 2011. As of December 31, 2012, Colorado had five sales locations during the period from December 7, 2012 (date of acquisition) through December 31, 2012. In Colorado, the cancellation rate was 10% during the period from December 7, 2012 through December 31, 2012 with no comparable amount during the year ended December 31, 2011. |
The Company was incorporated in the State of Delaware on July 15, 1999. California Lyon was incorporated in the State of California on August 25, 1987.
32
Table of Contents
Seasonality
The Company’s operations are historically seasonal, with the highest new order activity in the spring and summer, which is impacted by the timing of project openings and competition in surrounding projects, among other factors. In addition, the Company’s home deliveries typically occur in the third and fourth quarter of each fiscal year, based on the construction cycle times of our homes between three and six months. As a result, the Company’s revenues, cash flow and profitability are higher in that same period.
Financing
The Company provides for its ongoing cash requirements principally from internally generated funds from the sales of real estate, outside borrowings and by forming new joint ventures with venture partners that provide a substantial portion of the capital required for certain projects. In addition, the Company makes use of the funds received from the equity raised in conjunction with the rights offerings provided for in the Plan.
As of March 11, 2013, California Lyon has outstanding its 8.5% Senior Notes due 2020 and certain construction notes payable. Parent, California Lyon and their subsidiaries have financed, and may in the future finance, certain project and land acquisitions with construction loans secured by real estate inventories, seller-provided financing, lot option agreements and land banking transactions.
Recent Events
Colony Transaction
On June 28, 2012, the Company consummated the purchase of certain real property (comprising of approximately 165 acres) in San Diego County, California; San Bernardino County, California; Maricopa County, Arizona; and Clark County, Nevada, representing seven separate residential for sale developments, comprising of over 1,000 lots. The aggregate purchase price of the property was $21,500,000. The Company paid $11,000,000 cash, and issued 10,000,000 shares of Class A Common Stock of Parent, to investment vehicles managed by affiliates of Colony Capital, LLC for consideration of the property.
Paulson Transaction
On October 12, 2012, the Company entered into a Subscription Agreement, or the Subscription Agreement, between the Company and WLH Recovery Acquisition LLC, a Delaware limited liability company and investment vehicle managed by affiliates of Paulson & Co. Inc., or Paulson, pursuant to which, the Company issued to Paulson (i) 15,238,095 shares of the Company’s Class A Common Stock, for $16,000,000 in cash, and (ii) 12,173,913 shares of the Company’s Convertible Preferred Stock, for $14,000,000 in cash, for an aggregate purchase price of $30,000,000, or the Paulson Transaction. In connection with the Paulson Transaction, the Company also amended (i) its Class A Common Stock Registration Rights Agreement and Convertible Preferred Stock and Class C Common Stock Registration Rights Agreement to include in such agreements the shares issued to Paulson so that Paulson may become a party to such agreements with equal rights, benefits and obligations as the other stockholders who are parties thereto, and (ii) its Amended and Restated Certificate of Incorporation, or the Charter, and Amended and Restated Bylaws to (a) increase the size of the Company’s board of directors, or the Board, from seven to eight members, up to and until the Conversion Date (as defined in the “Description of capital Stock”), (b) provide the holders of Class A Common Stock the right to elect the director to fill the newly created Board seat, (c) revise the definition of “Convertible Preferred Original Issue Price” to equal the price per share at which shares of Convertible Preferred Stock are issued and (d) incorporate various clarifying and conforming changes.
Equity Grants Under the Company’s 2012 Equity Incentive Plan
As previously disclosed in the Company’s Current Report on Form 8-K filed on October 16, 2012, the Company’s board of directors and stockholders approved the Company’s 2012 Equity Incentive Plan (the “2012
33
Table of Contents
Plan”) in October 2012. The purpose of the 2012 Plan is to (1) provide an increased incentive for eligible employees, consultants and directors to assert their best efforts by conferring benefits based on the achievement of certain performance goals, (2) better align the interests of eligible participants with the interests of stockholders by providing an opportunity for increased stock ownership by such participants, and (3) encourage such participants to remain in the service of the Company. The Company approved its first grants under the 2012 Plan in October 2012 and has continued to make grants in accordance with the 2012 Plan under the administration of the Company’s Compensation Committee. See the section of this prospectus entitled “Executive Compensation” for additional information.
Senior Notes Offering and Debt Refinancing
On November 8, 2012, California Lyon completed its offering of 8.5% Senior Notes due 2020, or the New Notes, in an aggregate principal amount of $325 million. The New Notes were issued at 100% of their aggregate principal amount. The Company used the net proceeds from the sale of the New Notes, together with cash on hand, to refinance the Company’s (i) $235 million 10.25% Senior Secured Term Loan due 2015, (ii) approximately $76 million in aggregate principal amount of 12% Senior Subordinated Secured Notes due 2017, (iii) approximately $11 million in principal amount of project related debt, and (iv) to pay accrued and unpaid interest thereon.
Outstanding Debt Obligations
The Company’s operations are dependent to a significant extent on debt financing. The Company’s principal outstanding debt obligations are its New Notes and certain construction notes payable. At March 11, 2013, the outstanding principal amount of the New Notes was $325 million.
8.5% Senior Notes Due 2020
As of March 11, 2013, the outstanding principal amount of the New Notes is $325 million, and the New Notes mature on November 15, 2020. The New Notes are senior unsecured obligations of California Lyon and are unconditionally guaranteed on a senior subordinated secured basis by Parent and by certain of Parent’s existing and future restricted subsidiaries. The New Notes and the guarantees rank senior to all of California Lyon’s and the guarantors’ existing and future unsecured senior debt and senior in right of payment to all of California Lyon’s and the guarantors’ future subordinated debt. The New Notes and the guarantees are and will be effectively junior to any of California Lyon’s and the guarantors’ existing and future secured debt.
The New Notes bear interest at an annual rate of 8.5% per annum and will be payable semiannually in arrears on May 15 and November 15, commencing on May 15, 2013.
On or after November 15, 2016, California Lyon may redeem all or a portion of the New Notes upon not less than 30 nor more than 60 days’ notice, at the redemption prices (expressed as percentages of the principal amount) set forth below plus accrued and unpaid interest to the applicable redemption date, if redeemed during the 12-month period beginning on November 15 of the years indicated below:
Year | Percentage | |||
2016 | 104.250 | % | ||
2017 | 102.125 | % | ||
2018 and thereafter | 100.000 | % | ||
Prior to November 15, 2016 the New Notes may be redeemed in whole or in part at a redemption price equal to 100% of the principal amount plus a “make-whole” premium, and accrued and unpaid interest to, the redemption date.
34
Table of Contents
In addition, any time prior to November 15, 2015, California Lyon may, at its option on one or more occasions, redeem New Notes in an aggregate principal amount not to exceed 35% of the aggregate principal amount of the New Notes issued prior to such date at a redemption price (expressed as a percentage of principal amount) of 108.5%, plus accrued and unpaid interest to the redemption date, with an amount equal to the net cash proceeds from one or more equity offerings.
The indenture contains covenants that limit the ability of the Company and its restricted subsidiaries to, among other things: (i) incur or guarantee certain additional indebtedness; (ii) pay dividends or make other distributions or repurchase stock; (iii) make certain investments; (iv) sell assets; (v) incur liens; (vi) enter into agreements restricting the ability of the Company’s restricted subsidiaries to pay dividends or transfer assets; (vii) enter into transactions with affiliates; (viii) create unrestricted subsidiaries; and (viii) consolidate, merge or sell all or substantially all of the Company’s and California Lyon’s assets. These covenants are subject to a number of important exceptions and qualifications as described in the Indenture. The Indenture also provides for events of default which, if any of them occurs, would permit or require the principal of and accrued interest on such New Notes to be declared due and payable.
12% Senior Subordinated Secured Notes Due 2017
Pursuant to the terms of the Prepackaged Joint Plan of Reorganization, or the Plan, on February 25, 2012, California Lyon issued $75.0 million principal amount of 12% Senior Subordinated Secured Notes, or the Old Notes, due February 25, 2017, in exchange for the claims held by the holders of the formerly outstanding notes of California Lyon. California Lyon received no net proceeds from this issuance.
As described above, California Lyon used a portion of the proceeds from the sale of the New Notes to refinance the Old Notes. On November 8, 2012, California Lyon announced the early settlement of its cash tender offer and consent solicitation for any and all outstanding Old Notes, or the Tender Offer. The Old Notes that remained outstanding following the expiration of the Tender Offer on November 23, 2012 were redeemed on December 10, 2012.
Construction Notes Payable
The Company used a portion of the proceeds from the issuance of the New Notes to pay in full the amounts outstanding under two construction notes payable that were outstanding as of September 30, 2012. In September 2012, the Company entered into two additional construction notes payable agreements. The first agreement has total availability under the facility of $19.0 million, to be drawn for land development and construction on one of its wholly-owned projects. The loan matures in September 2015 and bears interest at the prime rate + 1.0%, with a rate floor of 5.0%. As of December 31, 2012, the Company had borrowed $7.8 million under this facility and as of March 11 2013, the Company had borrowed $12.9 million under this facility. The loan will be repaid with proceeds from home closings of the project and is secured by the underlying project. The second construction notes payable agreement has total availability under the facility of $17.0 million, to be drawn for land development and construction on one of its joint venture projects. The loan matures in March 2015 and bears interest at prime rate + 1%, with a rate floor of 5.0%. As of December 31, 2012, the Company had borrowed $5.4 million under this facility and as of March 11, 2013, the Company had borrowed $6.3 million under this facility. The loan will be repaid with proceeds from home closings of the project and is secured by the underlying project.
Land Acquisition Note Payable
In October 2011, the Company secured an acquisition note payable in conjunction with the acquisition of a parcel of land in Northern California. The acquisition price of the land was $56.0 million, and the loan was for $55.0 million. The note was scheduled to mature in October 2012, and carried an interest rate of 1.5% per month, which was paid monthly on the loan. As part of the Company’s adoption of ASC 852, Reorganizations, the loan was valued at $56.3 million as of February 24, 2012, the confirmation date of the plan. In May 2012, the
35
Table of Contents
Company sold the parcel of land and repaid the note in full recognizing a gain on extinguishment of debt of $1.0 million, net of amortization expense of $0.3 million.
Seller Financing
At December 31, 2011, the Company had $3.0 million of notes payable outstanding related to a land acquisition for which seller financing was provided. The note bore interest at 7% and matured in March 2012. In March 2012, the seller note was paid in full.
The Company’s outstanding debt obligations and sources of financing are more fully described in “Management’s Discussion and Analysis of Financial Condition and Results of Operation—Financial Condition and Liquidity.”
The Company’s Markets
The Company is currently operating in five reportable operating segments: Southern California, Northern California, Arizona, Nevada, and Colorado. Each of the segments has responsibility for the management of the Company’s homebuilding and development operations within its geographic boundaries.
The following table sets forth homebuilding revenue from each of the Company’s homebuilding segments for the period from February 25, 2012 through December 31, 2012, the period from January 1, 2012 through February 24, 2012, and the years ended December 31, 2011, and 2010 (in thousands):
| Successor (1) |
| Predecessor (1) | Predecessor (1) | |||||||||||||||
| Period From February 25, through December 31, 2012 |
| Period From January 1, through February 24, 2012 | Year Ended December 31, | |||||||||||||||
| 2011 | 2010 | |||||||||||||||||
Southern California (2) | $ | 99,671 | $ | 5,640 | $ | 110,969 | $ | 195,613 | ||||||||||
Northern California (3) | 54,207 | 4,250 | 54,141 | 38,891 | ||||||||||||||
Arizona (4) | 47,989 | 4,316 | 20,074 | 16,595 | ||||||||||||||
Nevada (5) | 37,307 | 2,481 | 21,871 | 15,766 | ||||||||||||||
Colorado (6) | 5,436 | — | — | — | ||||||||||||||
|
|
|
|
|
|
|
|
| ||||||||||
| $ | 244,610 | $ | 16,687 | $ | 207,055 | $ | 266,865 | |||||||||||
|
|
|
|
|
|
|
|
| ||||||||||
| (1) | Successor refers to William Lyon Homes and its consolidated subsidiaries on and after February 25, 2012, or the Emergence Date, after giving effect to: (i) the cancellation of shares of our common stock issued prior to February 25, 2012; (ii) the issuance of shares of new common stock, and settlement of existing debt and other adjustments in accordance with the Prepackaged Joint Plan of Reorganization; and (iii) the application of fresh start accounting. Predecessor refers to William Lyon Homes and its consolidated subsidiaries up to the Emergence Date. All of the required information related to each operating segment is reflected in Note 6 in the accompanying financial statements for the years ending December 31, 2012, 2011, and 2010, respectively. |
| (2) | The Southern California Segment consists of operations in Orange, Los Angeles, and San Diego counties. The offices are located in a leased office building at 4490 Von Karman Avenue, Newport Beach, CA 92660. The operating segment is led by a California Region President. |
| (3) | The Northern California Segment consists of operations in Contra Costa, Placer, Sacramento, San Joaquin, Santa Clara and Solano counties. The offices are located in a leased office building at 4000 Executive Parkway, Suite 250, San Ramon, CA 94583. The operating segment is led by a division manager and a California Region President. |
| (4) | The Arizona Segment consists of operations in the Phoenix metropolitan area. The offices are located in a leased office building at 8840 E. Chaparral Road, Suite 200, Scottsdale, AZ 85250. The operating segment is led by a division president. |
36
Table of Contents
| (5) | The Nevada Segment consists of operations in the Las Vegas metropolitan area. The offices are located in a leased office building at 500 Pilot Road, Suite G, Las Vegas, NV 89119. The operating segment is led by a division president. |
| (6) | The Colorado Segment consists of operations in Douglas, Grand, Jefferson, and Larimer counties. The offices are located in a leased office building at 8480, East Orchard Road, Suite 1000, Greenwood Village, CO 80111. The operating segment is led by a division president. Colorado became the Company’s fifth operating segment on December 7, 2012, upon acquisition of various entities which operate under the name Village Homes. |
Strategy and Lot Position
The Company and its consolidated joint ventures owned approximately 10,593 lots and had options to purchase an additional 1,249 lots as of December 31, 2012. As used in this prospectus, “entitled” land has a development agreement and/or vesting tentative map, or a final recorded plat or map from the appropriate county or city government. Development agreements and vesting tentative maps generally provide for the right to develop the land in accordance with the provisions of the development agreement or vesting tentative map unless an issue arises concerning health, safety or general welfare. The Company’s sources of developed lots for its homebuilding operations are (1) purchase of smaller projects with shorter life cycles (merchant homebuilding) and (2) development of master-planned communities.
The Company will continue to utilize its current inventory of lots and future land acquisitions to conduct its operating strategy, which consists of:
| • | focusing on high growth core markets near employment centers or transportation corridors; |
| • | identifying future land positions to grow the business; |
| • | acquiring strong land positions through disciplined acquisition strategies; |
| • | maintaining a low cost structure; and |
| • | leveraging an experienced management team. |
Land Acquisition and Development
The Company estimates that its current inventory of lots owned and controlled is adequate to supply its homebuilding operations at current operating levels (including future land sales) for approximately three to five years.
To manage the risks associated with land ownership and development, the Company has a Corporate Land Committee. Members are the Executive Chairman, CEO, President and COO (Chairman of the Land Committee), VP & CFO and SVP of Finance and Acquisition. As potential land acquisitions are being analyzed, the Corporate Land Committee must approve all purchases prior to being submitted to the board. Due to the risks inherent in unentitled land, the Company requires the board of directors to approve all purchases of unentitled land, however, as of December 31, 2012, all of the Company’s land is entitled. For entitled land, the board of directors approves purchases of $3.0 million or higher. The Company’s land acquisition strategy has been to undertake projects with shorter life-cycles in order to reduce development and market risk while maintaining an inventory of owned lots sufficient for construction of homes over a two-year period. However, in Arizona and Nevada, the Company owns parcels with a longer term hold strategy. The Company’s long-term strategy consists of the following elements:
| • | completing due diligence prior to committing to acquire land; |
| • | reviewing the status of entitlements and other governmental processing to mitigate zoning and other development risk; |
| • | focusing on land as a component of a home’s cost structure, rather than on the land’s speculative value; |
37
Table of Contents
| • | limiting land acquisition size to reduce investment levels in any one project where possible; |
| • | utilizing option, joint venture and other non-capital intensive structures to control land where feasible; |
| • | funding land acquisitions whenever possible with non-recourse seller financing; |
| • | employing centralized control of approval over all land transactions; |
| • | homebuilding operations in the Southwest, particularly in the Company’s long established markets of California, Arizona, Nevada and more recently, Colorado; and |
| • | diversifying with respect to geography, markets and product types. |
Prior to committing to the acquisition of land, the Company conducts feasibility studies covering pertinent aspects of the proposed commitment. These studies may include a variety of elements from technical aspects such as title, zoning, soil and seismic characteristics, to marketing studies that review population and employment trends, schools, transportation access, buyer profiles, sales forecasts, projected profitability, cash requirements, and assessment of political risk and other factors. Prior to acquiring land, the Company considers assumptions concerning the needs of the targeted customer and determines whether the underlying land price enables the Company to meet those needs at an affordable price. Before purchasing land, the Company attempts to project the commencement of construction and sales over a reasonable time period. The Company utilizes outside architects and consultants, under close supervision, to help review acquisitions and design products.
Homebuilding and Market Strategy
The Company currently has a wide variety of product lines which enables it to meet the specific needs of each of its markets. Although the Company primarily emphasizes sales to the entry-level and move-up home markets, it believes that a diversified product strategy enables it to best serve a wide range of buyers and adapt quickly to a variety of market conditions. In order to reduce exposure to local market conditions, the Company’s sales locations are geographically dispersed.
Because the decision as to which product to develop is based on the Company’s assessment of market conditions and the restrictions imposed by government regulations, home styles and sizes vary from project to project. The Company’s attached housing ranges in size from 957 to 2,729 square feet, and the detached housing ranges from 1,284 to 5,417 square feet. Due to the Company’s product and geographic diversification strategy, the prices of the Company’s homes also vary substantially. Base sales prices for the Company’s attached housing ranged from approximately $280,000 to $600,000 and $103,000 to $565,000 during the years ended December 31, 2012 and 2011, respectively, and base sales prices for detached housing ranged from approximately $88,000 to $690,000 and $110,000 to $690,000 during the years ended December 31, 2012 and 2011, respectively. On a consolidated basis, the average sales prices of homes closed for the years ended December 31, 2012 and 2011 were $275,100 and $337,200, respectively.
The Company generally standardizes and limits the number of home designs within any given product line. This standardization permits on-site mass production techniques and bulk purchasing of materials and components, thus enabling the Company to better control and sometimes reduce construction costs and home construction cycles.
The Company contracts with a number of architects and other consultants who are involved in the design process of the Company’s homes. Designs are constrained by zoning requirements, building codes, energy efficiency laws and local architectural guidelines, among other factors. Engineering, landscaping, master-planning and environmental impact analysis work are subcontracted to independent firms which are familiar with local requirements.
Substantially all construction work is done by subcontractors with the Company acting as the general contractor. The Company manages subcontractor activities with on-site supervisory employees and management
38
Table of Contents
control systems. The Company does not have long-term contractual commitments with its subcontractors or suppliers; instead it contracts development work by project and where possible by phase size of 10 to 20 home sites. The Company generally has been able to obtain sufficient materials and subcontractors during times of material shortages. The Company believes its relationships with its suppliers and subcontractors are in good standing.
Sales and Marketing
The management team responsible for a specific project develops marketing objectives, formulates pricing and sales strategies and develops advertising and public relations programs for approval of senior management. The Company makes extensive use of advertising and other promotional activities, including on-line media, newspaper advertisements, brochures, direct mail and the placement of strategically located sign boards in the immediate areas of its developments. In addition, the Company markets all of its products through the internet via email lists and interest lists, as well as its website at www.lyonhomes.com. In general, the Company’s advertising emphasizes each project’s strengths, the quality and value of its products and its reputation in the marketplace.
The Company normally builds, decorates, furnishes and landscapes three to eight model homes for each product line and maintains on-site sales offices, which typically are open seven days a week. Management believes that model homes play a particularly important role in the Company’s marketing efforts. Consequently, the Company expends a significant amount of effort in creating an attractive atmosphere at its model homes. Interior decorations vary among the Company’s models and are carefully selected based upon the lifestyles of targeted buyers. Structural changes in design from the model homes are not generally permitted, but home buyers may select various other optional construction and design amenities.
The Company employs in-house commissioned sales personnel to sell its homes. In some cases, outside brokers are also involved in the selling of the Company’s homes, particularly in the Arizona and Nevada markets. The Company typically engages its sales personnel on a long-term, rather than a project-by-project basis, which it believes results in a more motivated sales force with an extensive knowledge of the Company’s operating policies and products. Sales personnel are trained by the Company and attend weekly meetings to be updated on the availability of financing, construction schedules and marketing and advertising plans.
The Company strives to provide a high level of customer service during the sales process and after a home is sold. The participation of the sales representatives, on-site construction supervisors and the post-closing customer service personnel, working in a team effort, is intended to foster the Company’s reputation for quality and service, and ultimately lead to enhanced customer retention and referrals.
The Company’s homes are typically sold before or during construction through sales contracts which are usually accompanied by a small cash deposit. Such sales contracts are usually subject to certain contingencies such as the buyer’s ability to qualify for financing. The cancellation rate of buyers who contracted to buy a home but did not close escrow at the Company and its joint ventures’ projects was approximately 14% during 2012 and 18% during 2011. Cancellation rates are subject to a variety of factors beyond the Company’s control such as the downturn in the homebuilding industry and current economic conditions. The Company and its joint ventures’ inventory of completed and unsold homes was 19 homes as of December 31, 2012 and 73 homes as of December 31, 2011.
Warranty
The Company provides its homebuyers with a one-year limited warranty covering workmanship and materials. The Company also provides its homebuyers with a limited warranty that covers “construction defects,” as defined in the limited warranty agreement provided to each home buyer, for the length of its legal liability for such defects (which may be up to ten years in some circumstances), as determined by the law of the state in
39
Table of Contents
which the Company builds. The limited warranty covering construction defects is transferable to subsequent buyers not under direct contract with the Company and requires that homebuyers agree to the definitions and procedures set forth in the warranty, including the submission of unresolved construction-related disputes to binding arbitration. The Company began providing this type of limited warranty at the end of 2001. In connection with the limited warranty covering construction defects, the Company obtained an insurance policy which expires on December 31, 2013, unless amended or renewed. The Company has been informed by the insurance carrier that this insurance policy will respond to construction defect claims on homes that close during each policy period for the duration of the Company’s legal liability and that the policy will respond, upon satisfaction of the applicable self-insured retention, to potential losses relating to construction, including soil subsidence. The insurance policy provides a single policy of insurance to the Company and the subcontractors enrolled in its insurance program. As a result, the Company is no longer required to obtain proof of insurance from these subcontractors nor be named as an additional insured under their individual insurance policies. The Company still requires that subcontractors not enrolled in the insurance program provide proof of insurance and name the Company as an additional insured under their insurance policy. Furthermore, the Company generally requires that its subcontractors provide the Company with an indemnity prior to receiving payment for their work.
There can be no assurance, however, that the terms and limitations of the limited warranty will be enforceable against the homebuyers, that the Company will be able to renew its insurance coverage or renew it at reasonable rates, that the Company will not be liable for damages, the cost of repairs, and/or the expense of litigation surrounding possible construction defects, soil subsidence or building-related claims or that claims will not arise out of uninsurable events not covered by insurance and not subject to effective indemnification agreements with the Company’s subcontractors.
Sale of Lots and Land
In the ordinary course of business, the Company continually evaluates land sales and has sold, and expects that it will continue to sell, land as market and business conditions warrant. The Company may also sell both multiple lots to other builders (bulk sales) and improved individual lots for the construction of custom homes where the presence of such homes adds to the quality of the community. In addition, the Company may acquire sites with commercial, industrial and multi-family parcels which will generally be sold to third-party developers.
Customer Financing
The Company seeks to assist its home buyers in obtaining mortgage financing for qualified buyers. Substantially all home buyers utilize long-term mortgage financing to purchase a home and mortgage lenders will usually make loans only to qualified borrowers.
Information Systems and Controls
The Company assigns a high priority to the development and maintenance of its budget and cost control systems and procedures. The Company’s division offices are connected to corporate headquarters through a fully integrated accounting, financial and operational management information system. Through this system, management regularly evaluates the status of its projects in relation to budgets to determine the cause of any variances and, where appropriate, adjusts the Company’s operations to capitalize on favorable variances or to limit adverse financial impacts.
Regulation
The Company and its competitors are subject to various local, state and federal statutes, ordinances, rules and regulations concerning zoning, building design, construction and similar matters, including local regulation which imposes restrictive zoning and density requirements in order to limit the number of homes that can ultimately be built within the boundaries of a particular project. The Company and its competitors may also be
40
Table of Contents
subject to periodic delays or may be precluded entirely from developing in certain communities due to building moratoriums or “slow-growth” or “no-growth” initiatives that could be implemented in the future in the states in which it operates. Because the Company usually purchases land with entitlements, the Company believes that the moratoriums would adversely affect the Company only if they arose from unforeseen health, safety and welfare issues such as insufficient water or sewage facilities. Local and state governments also have broad discretion regarding the imposition of development fees for projects in their jurisdiction. However, these are normally locked-in when the Company receives entitlements.
The Company and its competitors are also subject to a variety of local, state and federal statutes, ordinances, rules and regulations concerning protection of health and the environment. The particular environmental laws which apply to any given community vary greatly according to the community site, the site’s environmental conditions and the present and former uses of the site. These environmental laws may result in delays, may cause the Company and its competitors to incur substantial compliance and other costs, and may prohibit or severely restrict development in certain environmentally sensitive regions or areas. The Company’s projects in California are especially susceptible to restrictive government regulations and environmental laws. However, environmental laws have not, to date, had a material adverse impact on the Company’s operations. The Company’s wholly-owned subsidiary, California Lyon, is licensed as a general building contractor in California, Arizona and Nevada. In addition, California Lyon holds a corporate real estate license under the California Real Estate Law.
Competition
The homebuilding industry is highly competitive, particularly in the low and medium-price range where the Company currently concentrates its activities. The Company does not believe it has a significant market position in any geographic area which it serves due to the fragmented nature of the market. A number of the Company’s competitors have larger staffs, larger marketing organizations and substantially greater financial resources than those of the Company. However, the Company believes that it competes effectively in its existing markets as a result of its product and geographic diversity, substantial development expertise and its reputation as a low-cost producer of quality homes. Further, the Company sometimes gains a competitive advantage in locations where changing regulations make it difficult for competitors to obtain entitlements and/or government approvals which the Company has already obtained.
Corporate Organization and Personnel
The Company’s executive officers and divisional presidents average more than 21 years of experience in the homebuilding and development industries within California or the Southwestern United States. The Company combines decentralized management in those aspects of its business where detailed knowledge of local market conditions is important (such as governmental processing, construction, land development and sales and marketing), with centralized management in those functions where the Company believes central control is required (such as approval of land acquisitions, financial, treasury, human resources and legal matters).
As of December 31, 2012, the Company employed 225 full-time and 34 part-time employees, including corporate staff, supervisory personnel of construction projects, warranty service personnel for completed projects, as well as persons engaged in administrative, finance and accounting, engineering, golf course operations, sales and marketing activities.
The Company believes that its relations with its employees have been good. Some employees of the subcontractors the Company utilizes are unionized, but none of the Company’s employees are union members. Although there have been temporary work stoppages in the building trades in the Company’s areas of operation, none has had any material impact upon the Company’s overall operations.
41
Table of Contents
Legal Proceedings
We are a party to certain legal proceedings with respect to a variety of matters in the ordinary course of business. We do not believe that any legal proceedings to which we are a party would have a material impact on our results of operations, financial position or cash flows. However, in the future, we could incur judgments or fines or enter into settlements of claims that could have a material adverse effect on our results of operations, financial positions or cash flows.
Reports to Stockholders
We intend to furnish to our stockholders annual reports containing financial statements audited by our independent registered public accounting firm and to make available quarterly reports containing unaudited financial statements for each of the first three quarters of each year. The Company will also file Annual Reports on Form 10-K, Quarterly Reports on Form 10-Q and Current Reports on Form 8-K with the Securities and Exchange Commission, or the SEC, in order to meet our timely and continuous disclosure requirements. We may also file additional documents with the SEC if they become necessary in the course of our Company’s operations.
We also maintain a website at www.lyonhomes.com. You may access our reports, proxy statements and other information free of charge at this website as soon as reasonably practicable after such material is electronically filed with, or furnished to, the SEC. The information on our website does not constitute part of, and is not incorporated by reference into, this prospectus.
42
Table of Contents
FINANCIAL AND SUPPLEMENTARY DATA
As a result of the consummation of the Prepackaged Joint Plan of Reorganization on February 25, 2012, the Company adopted Fresh Start Accounting in accordance with Accounting Standards Codification No. 852,Reorganizations, or ASC 852. Accordingly, the financial statement information prior to February 25, 2012 is not comparable with the financial statement information for periods on and after February 25, 2012. Unless otherwise stated or the context otherwise requires, any reference hereinafter to the “Successor” reflects the operations of the Company post-emergence from February 25, 2012 through December 31, 2012 and any reference to the “Predecessor” refers to the operations of the Company pre-emergence prior to February 25, 2012.
SELECTED HISTORICAL CONSOLIDATED FINANCIAL DATA
The following table sets forth certain of the Company’s historical financial data. The selected historical consolidated financial data as of December 31, 2012 and 2011 and for the period from February 25, 2012 through December 31, 2012, the period from January 1, 2012 through February 24, 2012 and the years ended December 31, 2011 and 2010 has been derived from the Company’s audited consolidated financial statements and the related notes included elsewhere herein. The selected historical consolidated financial data as of December 31, 2010, 2009 and 2008 and for the years ended December 31, 2009 and 2008 has been derived from the Company’s audited financial statements for such years, which are not included herein.
The selected historical consolidated financial data set forth below are not necessarily indicative of the results of future operations. Upon emergence from the Chapter 11 Cases on February 25, 2012, we adopted fresh start accounting as prescribed under ASC 852 (as defined above), which required us to value our assets and liabilities to their related fair values. In addition, we adjusted our accumulated deficit to zero at the emergence date. Items such as accumulated depreciation, amortization and accumulated deficit were reset to zero. We allocated the reorganization value to the individual assets and liabilities based on their estimated fair values. Items such as accounts receivable, prepaid and other assets, accounts payable, certain accrued liabilities and cash, whose fair values approximated their book values, reflected values similar to those reported prior to emergence. Items such as real estate inventories, property, plant and equipment, certain notes receivable, certain accrued liabilities and notes payable were adjusted from amounts previously reported. Because we adopted fresh start accounting at emergence and because of the significance of liabilities subject to compromise that were relieved upon emergence, the historical financial statements of the Predecessor and the financial statements of the Successor are not comparable. Refer to the notes to our consolidated financial statements included in this prospectus for further details relating to fresh start accounting.
43
Table of Contents
You should read this summary in conjunction with the discussion under the heading “Management’s Discussion and Analysis of Financial Condition and Results of Operations,” and the historical consolidated financial statements and accompanying notes included elsewhere herein.
| Successor (1) | Predecessor (1) | |||||||||||||||||||||||||
| Period From | Period From | |||||||||||||||||||||||||
| February 25, | January 1, | |||||||||||||||||||||||||
| through | through | Year Ended | ||||||||||||||||||||||||
| December 31, | February 24, | December 31, | ||||||||||||||||||||||||
| 2012 | 2012 | 2011 | 2010 | 2009 | 2008 | |||||||||||||||||||||
| (in thousands except number of shares and per share data) | ||||||||||||||||||||||||||
Statement of Operations Data: | ||||||||||||||||||||||||||
Revenues | ||||||||||||||||||||||||||
Home sales | $ | 244,610 | $ | 16,687 | $ | 207,055 | $ | 266,865 | $ | 253,874 | $ | 468,452 | ||||||||||||||
Lots, land and other sales | 104,325 | — | — | 17,204 | 21,220 | 39,512 | ||||||||||||||||||||
Construction services | 23,825 | 8,883 | 19,768 | 10,629 | 34,149 | 18,114 | ||||||||||||||||||||
|
|
|
|
|
|
|
|
|
|
|
| |||||||||||||||
Total revenues | 372,760 | 25,570 | 226,823 | 294,698 | 309,243 | 526,078 | ||||||||||||||||||||
|
|
|
|
|
|
|
|
|
|
|
| |||||||||||||||
Operating income (loss) | 4,666 | (2,684 | ) | (148,015 | ) | (117,843 | ) | (161,301 | ) | (193,859 | ) | |||||||||||||||
Loss before reorganization items and (provision) benefit from income taxes | (4,325 | ) | (4,961 | ) | (171,706 | ) | (135,867 | ) | (122,861 | ) | (163,676 | ) | ||||||||||||||
Reorganization items, net (2) | (2,525 | ) | 233,458 | (21,182 | ) | — | — | — | ||||||||||||||||||
Net (loss) income | (6,861 | ) | 228,497 | (192,898 | ) | (135,455 | ) | (20,953 | ) | (122,084 | ) | |||||||||||||||
Net (loss) income available to common stockholders | $ | (11,602 | ) | $ | 228,383 | $ | (193,330 | ) | $ | (136,786 | ) | $ | (20,525 | ) | $ | (111,638 | ) | |||||||||
|
|
|
|
|
|
|
|
|
|
|
| |||||||||||||||
(Loss) income per common share: | ||||||||||||||||||||||||||
Basic and diluted | $ | (0.11 | ) | $ | 228,383 | $ | (193,330 | ) | $ | (136,786 | ) | $ | (20,525 | ) | $ | (111,638 | ) | |||||||||
Weighted average common shares outstanding: | ||||||||||||||||||||||||||
Basic and diluted | 103,037,842 | 1,000 | 1,000 | 1,000 | 1,000 | 1,000 | ||||||||||||||||||||
Operating Data (including consolidated joint ventures) (unaudited): | ||||||||||||||||||||||||||
Number of net new home orders | 956 | 175 | 669 | 650 | 869 | 1,221 | ||||||||||||||||||||
Number of homes closed | 883 | 67 | 614 | 760 | 915 | 1,260 | ||||||||||||||||||||
Average sales price of homes closed | $ | 277 | $ | 249 | $ | 337 | $ | 351 | $ | 278 | $ | 372 | ||||||||||||||
Cancellation rates | 15 | % | 8 | % | 18 | % | 19 | % | 21 | % | 28 | % | ||||||||||||||
Backlog at end of period, number of | 406 | 246 | 139 | 84 | 194 | 240 | ||||||||||||||||||||
Backlog at end of period, aggregate sales value (3) | $ | 115,449 | $ | 63,434 | $ | 29,329 | $ | 30,077 | $ | 56,472 | $ | 80,750 | ||||||||||||||
| Successor (1) | Predecessor (1) | |||||||||||||||||||||
| December 31, | December 31, | |||||||||||||||||||||
| 2012 | 2011 | 2010 | 2009 | 2008 | ||||||||||||||||||
| (in thousands) | ||||||||||||||||||||||
Balance Sheet Data: | ||||||||||||||||||||||
Cash and cash equivalents | $ | 71,075 | $ | 20,061 | $ | 71,286 | $ | 117,587 | $ | 67,017 | ||||||||||||
Real estate inventories—Owned | 421,630 | 398,534 | 488,906 | 523,336 | 754,489 | |||||||||||||||||
Real estate inventories—Not owned | 39,029 | 47,408 | 55,270 | 55,270 | 107,763 | |||||||||||||||||
Total assets | 581,147 | 496,951 | 649,004 | 860,099 | 1,044,843 | |||||||||||||||||
Total debt | 338,248 | 563,492 | 519,731 | 590,290 | 670,905 | |||||||||||||||||
Redeemable convertible preferred stock | 71,246 | — | — | — | — | |||||||||||||||||
Total William Lyon Homes stockholders’ equity (deficit) | 62,712 | (179,516 | ) | 13,814 | 150,600 | 171,125 | ||||||||||||||||
| (1) | Successor refers to William Lyon Homes and its consolidated subsidiaries on and after February 25, 2012, or the Emergence Date, after giving effect to: (i) the cancellation of shares of our common stock issued prior to February 25, 2012; (ii) the issuance of shares of new common stock, and settlement of existing debt and other adjustments in accordance with the Prepackaged Joint Plan of Reorganization; and (iii) the application of fresh start accounting. Predecessor refers to William Lyon Homes and its consolidated subsidiaries up to the Emergence Date. In relation to the adoption of fresh start accounting |
44
Table of Contents
| in conjunction with the confirmation of the Plan, the results of operations for 2012 separately present the period from January 1, 2012 through February 24, 2012 as the pre-emergence, predecessor entity and the period from February 25, 2012 through December 31, 2012 as the successor entity. As such, the application of fresh start accounting as described in Note 2 of the “Notes to Consolidated Financial Statements” is reflected in the period from February 25, 2012 through December 31, 2012 and not the period from January 1, 2012 through February 24, 2012. Certain statistics including (i) net new home orders, (ii) average number of sales locations, (iii) backlog, (iv) number of homes closed, (v) homes sales revenue and (vi) average sales price of homes closed are not affected by the fresh start accounting. |
| (2) | The Company recorded reorganization items of $(2.5) million, $233.5 million and $(21,182) million during the period from February 25, 2012 through December 31, 2012, the period from January 1, 2012 through February 24, 2012, and the year ended December 31, 2011, respectively. See Note 4 of “Notes to Consolidated Financial Statements.” |
| (3) | Backlog consists of homes sold under pending sales contracts that have not yet closed, some of which are subject to contingencies, including mortgage loan approval and the sale of existing homes by customers. There can be no assurance that homes sold under pending sales contracts will close. Of the total homes sold subject to pending sales contracts as of December 31, 2012, 352 represent homes completed or under construction and 54 represent homes not yet under construction. |
45
Table of Contents
MANAGEMENT’S DISCUSSION AND ANALYSIS OF FINANCIAL CONDITION
AND RESULTS OF OPERATIONS
The following discussion of results of operations and financial condition should be read in conjunction with the “Financial and Supplementary Data,” “Selected Historical Consolidated Financial Data,” the “Consolidated Financial Statements,” the “Notes to Consolidated Financial Statements,” and other financial information appearing elsewhere in this prospectus. As used herein, “on a consolidated basis” means the total of operations in wholly-owned projects and in consolidated joint venture projects.
The Company is primarily engaged in the design, construction and sale of single family detached and attached homes in California, Arizona, Nevada, and Colorado (under the Village Homes brand). The Company conducts its homebuilding operations through five reportable operating segments: Southern California, Northern California, Arizona, Nevada and Colorado. For the year ended December 31, 2012, which includes the “Predecessor” entity from January 1, 2012 through February 24, 2012, and the “Successor” entity from February 25, 2012 through December 31, 2012, or the 2012 Period, on a consolidated basis, which includes results from all five reportable operating segments, the Company had revenues from homes sales of $261.3 million, a 26% increase from $207.1 million for the year ended December 31, 2011, or the 2011 Period. The Company had net new home orders of 1,131 homes in the 2012 period, a 69% increase from 669 in the 2011 period, and the average sales price for homes closed decreased 18% to $275,100 in the 2012 period from $337,200 in the 2011 period.
The Company acquired Village Homes of Denver, Colorado on December 7, 2012, which marked the beginning of the Colorado segment. Financial data included herein as of December 31, 2012, and for the period from February 25, 2012 through December 31, 2012, includes operations of the Colorado segment from December 7, 2012 (date of acquisition) through December 31, 2012.
Comparing the 2011 period to the 2010 period, homebuilding revenues decreased 22% to $207.1 million in the 2011 period from $266.9 million in the 2010 period, the average sales price for homes closed decreased 4% to $337,200 in the 2011 period from $351,100 in the 2010 period and net new home orders increased 3% to 669 in the 2011 period from 650 in the 2010 period. The Company recorded non-cash impairment losses on real estate assets of $128.3 million in the 2011 period and $111.9 million in the 2010 period.
Chapter 11 Reorganization
On December 19, 2011, William Lyon Homes, or Parent, and certain of its direct and indirect wholly-owned subsidiaries filed voluntary petitions, or the Chapter 11 Petitions, in the U.S. Bankruptcy Court for the District of Delaware, or the Bankruptcy Court, to seek approval of the Prepackaged Joint Plan of Reorganization, or the Plan, of Parent and certain of its subsidiaries. Prior to filing the Chapter 11 Petitions, Parent’s wholly-owned subsidiary, William Lyon Homes, Inc., or California Lyon, was in default under its prepetition loan agreement with ColFin WLH Funding, LLC and certain other lenders, or the Prepetition Term Loan Agreement, due to its failure to comply with certain financial covenants in the Prepetition Term Loan Agreement. In addition, the Company became increasingly uncertain of its ability to repay or refinance its then outstanding 7 5/8% Senior Notes when they matured on December 15, 2012. Beginning in April 2010, California Lyon entered into a series of amendments and temporary waivers with the lenders under the Prepetition Term Loan Agreement related to these defaults, which prevented acceleration of the indebtedness outstanding under the Prepetition Term Loan Agreement and enabled the Company to negotiate a financial reorganization to be implemented through the bankruptcy process with its key constituents prior to the Chapter 11 Petitions. The Chapter 11 Petitions were jointly administered under the captionIn re William Lyon Homes, et al., Case No. 11-14019, or the Chapter 11 Cases. The sole purpose of the Chapter 11 Cases was to restructure the debt obligations and strengthen the balance sheet of the Parent and certain of its subsidiaries.
46
Table of Contents
On February 10, 2012, the Bankruptcy Court confirmed the Plan. On February 25, 2012, Parent and its subsidiaries consummated the principal transactions contemplated by the Plan, including:
| • | the issuance of 44,793,255 shares of Parent’s new Class A Common Stock, $0.01 par value per share, or the Class A Common Stock, and $75 million aggregate principal amount of 12% Senior Subordinated Secured Notes due 2017, or the Notes, issued by California Lyon, in exchange for the claims held by the holders of the formerly outstanding notes of California Lyon; |
| • | the amendment of California Lyon’s Prepetition Term Loan Agreement with ColFin WLH Funding, LLC and certain other lenders, or the Amended Term Loan Agreement, which resulted, among other things, in the increase in the principal amount outstanding under the Prepetition Term Loan Agreement, the reduction in the interest rate payable under the Prepetition Term Loan Agreement, and the elimination of any prepayment penalty under the Prepetition Term Loan Agreement; |
| • | the issuance, in exchange for cash and land deposits of $25 million, of 31,464,548 shares of Parent’s new Class B Common Stock, $0.01 par value per share, or Class B Common Stock, and a warrant to purchase 15,737,294 shares of Class B Common Stock; |
| • | the issuance of 64,831,831 shares of Parent’s new Convertible Preferred Stock, $0.01 par value per share, or Convertible Preferred Stock, and 12,966,366 shares of Parent’s new Class C Common Stock, $0.01 par value per share, or Class C Common Stock, in exchange for aggregate cash consideration of $60 million; and |
| • | the issuance of an additional 3,144,000 shares of Class C Common Stock pursuant to an agreement with certain selling stockholders to backstop the offering of shares of Class C Common Stock and shares of Convertible Preferred Stock in connection with the Plan. |
Basis of Presentation
The accompanying consolidated financial statements included herein have been prepared under U.S. Generally Accepted Accounting Principles, or U.S. GAAP, and the rules and regulations of the Securities and Exchange Commission, or the SEC, and are presented on a going concern basis, which assumes the Company will be able to operate in the ordinary course of its business and realize its assets and discharge its liabilities for the foreseeable future.
Consequences of Chapter 11 Cases—Debtor in Possession Accounting
Accounting Standards Codification Topic 852-10-45,Reorganizations-Other Presentation Matters, which is applicable to companies in Chapter 11 proceedings, generally does not change the manner in which financial statements are prepared. However, it does require that the financial statements for the periods subsequent to the filing of the Chapter 11 Cases (defined below) distinguish transactions and events that are directly associated with the reorganization from the ongoing operations of the business. Amounts that can be directly associated with the reorganization and restructuring of the business must be reported separately as reorganization items in the statement of operations for the year ended December 31, 2011 and all subsequent periods through the date of emergence. The balance sheet must distinguish pre-petition liabilities subject to compromise from both those pre-petition liabilities that are not subject to compromise and from post-petition liabilities. Liabilities that may be affected by a plan of reorganization must be reported at the amounts expected to be allowed, even if they may be settled for lesser amounts. In addition, cash provided or used by reorganization items must be disclosed separately in the statement of cash flows. The Company applied ASC 852-10-45 effective on December 19, 2011 and is segregating those items as outlined above for all reporting periods subsequent to such date through the date of emergence, as applicable.
47
Table of Contents
The Predecessor consolidated financial statements included in the consolidated financial statements provide for the outcome of the Plan, in particular:
| • | pre-petition liabilities, the amounts that will ultimately be allowed for claims or contingencies, or the status and priority thereof; |
| • | the reorganization items upon confirmation of the reorganization; |
| • | the fair value of all asset, liability and equity accounts and the effect of any changes that may be made in the capitalization. |
In preparing the Consolidated Financial Statements for the Predecessor, we applied ASC Topic 852Reorganization, or ASC 852, which requires that the financial statements for periods subsequent to the reorganization filing distinguish transactions and events that were directly associated with the reorganization from the ongoing operations of the business. Accordingly, professional fees associated with the Plan, interest income earned during the reorganization process and certain gains and losses resulting from reorganization of our business have been reported separately as reorganization items. In addition, interest expense has been reported only to the extent that it was paid or expected to be paid during the reorganization process or that it is probable that it will be an allowed priority, secured, or unsecured claim under the Plan.
Upon emergence from the reorganization process, we adopted fresh start accounting in accordance with ASC 852. The adoption of fresh start accounting results in our becoming a new entity for financial reporting purposes. Accordingly, the Consolidated Financial Statements on or after February 25, 2012 are not comparable to the Consolidated Financial Statements prior to that date. See Note 2 of “Notes to Consolidated Financial Statements”.
Fresh start accounting requires resetting the historical net book value of assets and liabilities to fair value by allocating the entity’s reorganization value to its assets pursuant to Accounting Standards Codification Topic 805,Business Combinations, or ASC 805, and Accounting Standards Codification Topic 820,Fair Value Measurements and Disclosures,or ASC 820. The excess reorganization value over the fair value of tangible and identifiable intangible assets is recorded as goodwill on the Consolidated Balance Sheet. Deferred taxes are determined in conformity with Accounting Standards Codification Topic 740,Income Taxes,or ASC 740. For additional information regarding the impact of fresh start accounting on our Consolidated Balance Sheet as of December 31, 2012, see Note 3 of “Notes to Consolidated Financial Statements.”
Results of Operations
During 2012, the Company has seen an improvement in all of its markets, with an increase in sales absorption rates, an increase in net sales prices, backlog units and an improvement in gross margins. Previous negative trends seem to be improving including (i) stabilizing unemployment rates, which correlate to improved consumer confidence, (ii) decreasing foreclosure activity with decreasing volumes of shadow inventory, (iii) sustained historically low mortgage rates, which is leading to increased homebuyer demand, as well as (iv) better overall economic conditions. The Company strives to optimize the momentum of 2012 and the signs of recovery by increasing prices where appropriate and reducing incentives.
The Company continues to review acquisitions of select land positions where it makes strategic and economic sense to do so, targeting finished lots in core coastal markets, near high employment job centers or transportation corridors. Management also evaluates owned lots and land parcels to determine if values support holding the parcels for future projects or selling projects at current values.
The Company acquired Village Homes of Denver, Colorado on December 7, 2012 which marked the Company’s entry into the Colorado market and the beginning of the Colorado segment. Financial data included herein as of and for the period ended December 31, 2012, includes operations of the Colorado segment from
48
Table of Contents
December 7, 2012 (date of acquisition) through December 31, 2012. There were no operations in our Colorado division as of or for the years ended December 31, 2011 and 2010, therefore year over year comparisons are not meaningful (“N/M”) as indicated in the comparative tables below.
In Southern California, net new home orders per average sales location increased to 41.8 during the year ended December 31, 2012 from 30.1 for the same period in 2011. In Northern California, net new home orders per average sales location increased to 62.7 during the 2012 period from 36.8 during the 2011 period. In Arizona, net new home orders per average sales location increased to 138.3 during the year ended December 31, 2012 from 101 for the same period in 2011. In Nevada, net new home orders per average sales location increased to 44.7 during the 2012 period from 18.2 during the 2011 period. In Southern California, the cancellation rate decreased to 15% in the 2012 period compared to 24% in the 2011 period. In Northern California, the cancellation rate increased to 23% in the 2012 period compared to 18% in the 2011 period. In Arizona, the cancellation rate increased to 10% in the 2012 period compared to 7% in the 2011 period. In Nevada, the cancellation rate decreased to 14% in the 2012 period compared to 20% in the 2011 period. In Colorado, the cancellation rate was 10% in the 2012 period with no comparable amount in the 2011 period. The lower overall cancellation rate is due to an increase in the number of highly qualified, credit worthy homebuyers.
The Company experienced increased homebuilding gross margin percentages of 16.6% for the year ended December 31, 2012 compared to 10.9% in the 2011 period particularly impacted by an increase in Northern California’s homebuilding gross margin percentages to 22.2% in the 2012 period compared to 11.1% in the 2011 period. Also contributing to the overall increase, was an increase in Nevada’s homebuilding gross margin percentages to 15.5% in the 2012 period from 9.7% in the 2011 period, an increase in Arizona’s homebuilding gross margin percentages to 13.1% in the 2012 period compared to 11.8% in the 2011 period, and an increase in Southern California’s homebuilding gross margin percentages to 15.9% in the 2012 period from 10.9% in the 2011 period. Colorado’s homebuilding gross margin percentages were 14.9% in the 2012 period with no comparable amount in the 2011 period. The increase in gross margins is primarily related to an increase in absorption, which decreases certain project related costs, and an increase in net sales prices during the year. The increase in gross margins is also attributed to the impact of fresh start accounting which resulted in a net decrease to the cost basis of our properties, which subsequently increased gross margins.
Comparisons of the Year Ended December 31, 2012 to December 31, 2011
On a combined basis, which combines the predecessor and successor entities for the year ended December 31, 2012, revenues from homes sales increased 26% to $261.3 million during the year ended December 31, 2012 compared to $207.1 million during the year ended December 31, 2011. The increase is primarily due to an increase of 55% in homes closed to 950 homes during the 2012 period compared to 614 homes during the 2011 period, offset by a decrease in the average sales price of homes closed to $275,100 in the 2012 period compared to $337,200 in the 2011 period. On a combined basis, the number of net new home orders for the year ended December 31, 2012 increased 69% to 1,131 homes from 669 homes for the year ended December 31, 2011.
The average number of sales locations of the Company decreased to 18 locations for the year ended December 31, 2012 compared to 19 at December 31, 2011. The Company’s number of new home orders per average sales location increased 78% to 62.8 for the year ended December 31, 2012 as compared to 35.2 for the year ended December 31, 2011.
In relation to the adoption of fresh start accounting in conjunction with the confirmation of the Plan, the results of operations for 2012 separately present the period from January 1, 2012 through February 24, 2012 as Predecessor and the period from February 25, 2012 through December 31, 2012 as Successor. As such, the application of fresh start accounting as described in Note 3 of the “Notes to Consolidated Financial Statements” is reflected in the period from February 25, 2012 through December 31, 2012 and not the period from January 1, 2012 through February 24, 2012. The accounts reflected in the tables below, include gross margin percentage, sales and marketing expense, and general and administrative expense, are affected by the fresh start accounting.
49
Table of Contents
Certain statistics including (i) net new home orders, (ii) average number of sales locations, (iii) backlog, (iv) number of homes closed, (v) homes sales revenue and (vi) average sales price of homes closed are not affected by the fresh start accounting. These items are described period over period “on a combined basis”, which combines the predecessor and successor entities for the year ended December 31, 2012.
| Successor | Predecessor | Combined | Predecessor | Increase (Decrease) | ||||||||||||||||||||||
| Period from | Period from | |||||||||||||||||||||||||
| February 25 through | January 1 through | Year Ended | ||||||||||||||||||||||||
| December 31, | February 24, | December 31, | ||||||||||||||||||||||||
| 2012 | 2012 | 2012 | 2011 | Amount | % | |||||||||||||||||||||
Number of Net New Home Orders | ||||||||||||||||||||||||||
Southern California | 213 | 38 | 251 | 211 | 40 | 19 | % | |||||||||||||||||||
Northern California | 165 | 23 | 188 | 147 | 41 | 28 | % | |||||||||||||||||||
Arizona | 322 | 93 | 415 | 202 | 213 | 105 | % | |||||||||||||||||||
Nevada | 247 | 21 | 268 | 109 | 159 | 146 | % | |||||||||||||||||||
Colorado | 9 | — | 9 | — | 9 | N/M | ||||||||||||||||||||
|
|
|
|
|
|
|
|
|
| |||||||||||||||||
Total | 956 | 175 | 1,131 | 669 | 462 | 69 | % | |||||||||||||||||||
|
|
|
|
|
|
|
|
|
| |||||||||||||||||
Cancellation Rate | 14 | % | 18 | % | (4 | %) | ||||||||||||||||||||
|
|
|
|
|
| |||||||||||||||||||||
Net new home orders in each segment increased period over period primarily attributable to improving market conditions. Excluding our Colorado division which only had sales activity from December 7, 2012 through December 31, 2012, the weekly average sales rates for the period were 1.2 sales per project during the 2012 period compared to 0.7 sales per project during the 2011 period. In Arizona, net new home orders more than doubled from 202 in the 2011 period to 415 in the 2012 period driven by the opening of three new projects in the second quarter of 2012 and an additional three new projects in the fourth quarter of 2012. In Nevada, net new home orders more than doubled from 109 in the 2011 period to 268 in the 2012 period. The increase in net new home orders is due to an improvement in the housing market and overall homebuyer demand. In addition, we have opened new communities in well located areas with strong homebuyer demand. The increase in net new home orders positively impacts the number of homes in backlog, which are homes that will close in future periods. As new home orders and backlog increase, it has a positive impact on revenues and cash flow in future periods.
Cancellation rates during the 2012 period decreased to 14% from 18% during the 2011 period. The change includes a decrease in Southern California’s cancellation rate to 15% in the 2012 period compared to 24% in the 2011 period, a decrease in Nevada’s cancellation rate to 14% in the 2012 period from 20% in the 2011 period, offset by an increase in Northern California’s cancellation rate to 23% in the 2012 period from 18% in the 2011 period and an increase in Arizona’s cancellation rate to 10% in the 2012 period from 7% in the 2011 period. The cancellation rate in Colorado was 10% in the 2012 period, with no comparable amount in the 2011 period. The overall lower cancellation rate is due to an increase in the number of highly qualified, credit worthy customers purchasing homes.
| Successor | Predecessor | |||||||||||||||||
| Year Ended December 31, | Increase (Decrease) | |||||||||||||||||
| 2012 | 2011 | Amount | % | |||||||||||||||
Average Number of Sales Locations | ||||||||||||||||||
Southern California | 6 | 7 | (1 | ) | (14 | %) | ||||||||||||
Northern California | 3 | 4 | (1 | ) | (25 | %) | ||||||||||||
Arizona | 3 | 2 | 1 | 50 | % | |||||||||||||
Nevada | 6 | 6 | — | 0 | % | |||||||||||||
|
|
|
|
|
| |||||||||||||
Total | 18 | 19 | (1 | ) | (5 | %) | ||||||||||||
|
|
|
|
|
| |||||||||||||
50
Table of Contents
The average number of sales locations for the Company decreased to 18 locations for the year ended December 31, 2012 compared to 19 at December 31, 2011. Southern California and Northern California each decreased by one sales location in the 2012 period compared to the 2011 period, while Arizona increased by one sales location and Nevada remained consistent in the 2012 period compared to the 2011 period. As of December 31, 2012, the Colorado division had five sales locations, however it is not included in the table above as there were only operations from December 7, 2012 (date of acquisition) through December 31, 2012.
| Successor | Predecessor | |||||||||||||||||
| December 31, | Increase (Decrease) | |||||||||||||||||
| 2012 | 2011 | Amount | % | |||||||||||||||
Backlog (units) | ||||||||||||||||||
Southern California | 32 | 22 | 10 | 45 | % | |||||||||||||
Northern California | 28 | 25 | 3 | 12 | % | |||||||||||||
Arizona | 172 | 75 | 97 | 129 | % | |||||||||||||
Nevada | 92 | 17 | 75 | 441 | % | |||||||||||||
Colorado | 82 | — | 82 | N/M | ||||||||||||||
|
|
|
|
|
| |||||||||||||
Total | 406 | 139 | 267 | 192 | % | |||||||||||||
|
|
|
|
|
|
| ||||||||||||
The Company’s backlog at December 31, 2012 increased 192% from 139 units at December 31, 2011 to 406 units at December 31, 2012. The increase is primarily attributable to an increase in net new home orders during the period driven by the Nevada division, which had a 146% increase in net new home orders, which contributed to a 441% increase in backlog, and the Arizona division, which had a 105% increase in net new home orders, which contributed to a 129% increase in backlog. The increase in backlog at year end reflects an increase in the number of homes closed to 950 during the year ended December 31, 2012 from 614 during the year ended December 31, 2011, and a 69% increase in total net new order activity to 1,131 homes during the year ended December 31, 2012 from 669 homes during the year ended December 31, 2011. All divisions continue their strong performance due to increased homebuyer confidence and improvement in all of our markets.
| Successor | Predecessor | |||||||||||||||||
| December 31, | Increase (Decrease) | |||||||||||||||||
| 2012 | 2011 | Amount | % | |||||||||||||||
| (dollars in thousands) | ||||||||||||||||||
Backlog (dollars) | ||||||||||||||||||
Southern California | $ | 15,640 | $ | 8,148 | $ | 7,492 | 92 | % | ||||||||||
Northern California | 8,948 | 7,125 | 1,823 | 26 | % | |||||||||||||
Arizona | 37,287 | 10,294 | 26,993 | 262 | % | |||||||||||||
Nevada | 20,487 | 3,762 | 16,725 | 445 | % | |||||||||||||
Colorado | 33,087 | — | 33,087 | N/M | ||||||||||||||
|
|
|
|
|
| |||||||||||||
Total | $ | 115,449 | $ | 29,329 | $ | 86,120 | 294 | % | ||||||||||
|
|
|
|
|
| |||||||||||||
The dollar amount of backlog of homes sold but not closed as of December 31, 2012 was $115.4 million, up 294% from $29.3 million as of December 31, 2011. The increase during this period reflects a 192% increase in the number of homes in backlog to 406 homes as of December 31, 2012 compared to 139 homes as of December 31, 2011. The increase in the dollar amount of backlog reflects an increase in average sales prices for new home orders. The Company experienced an increase of 35% in the average sales price of homes in backlog to $284,400 as of December 31, 2012 compared to $211,000 as of December 31, 2011. The increase is driven by a higher price point of our actively selling projects in Arizona in three new communities that opened in 2012, as well as an average sales price of homes in backlog in Colorado of $403, 500 with no comparable amount in the year ended December 31, 2011. The increase in the dollar amount of backlog of homes sold but not closed as described above generally results in an increase in operating revenues in the subsequent period as compared to the previous period.
51
Table of Contents
In Southern California, the dollar amount of backlog increased 92% to $15.6 million as of December 31, 2012 from $8.1 million as of December 31, 2011, which is attributable to a 45% increase in the number of homes in backlog in Southern California to 32 homes as of December 31, 2012 compared to 22 homes as of December 31, 2011, and a 19% increase in net new home orders to 251 for the year ended December 31, 2012 compared to 211 homes for the year ended December 31, 2011, and a 32% increase in the average sales price of homes in backlog to $488,800 as of December 31, 2012 compared to $370,400 as of December 31, 2011. In Southern California, the cancellation rate decreased to 15% for the year ended December 31, 2012 from 24% for the year ended December 31, 2011.
In Northern California, the dollar amount of backlog increased 26% to $8.9 million as of December 31, 2012 from $7.1 million as of December 31, 2011, which is attributable to a 12% increase in the number of units in backlog to 28 as of December 31, 2012 from 25 as of December 31, 2011, along with a 12% increase in the average sales price of homes in backlog to $319,600 as of December 31, 2012 compared to $285,000 as of December 31, 2011, as well as a 28% increase in net new home orders in Northern California to 188 homes for the year ended December 31, 2012 compared to 147 homes for the year ended December 31, 2011. In Northern California, the cancellation rate increased to 23% for the year ended December 31, 2012 from 18% for the year ended December 31, 2011.
In Arizona, the dollar amount of backlog increased 262% to $37.3 million as of December 31, 2012 from $10.3 million as of December 31, 2011, which is attributable to a 129% increase in the number of units in backlog to 172 as of December 31, 2012 from 75 as of December 31, 2011, along with a 105% increase in net new home orders in Arizona to 415 homes during the year ended December 31, 2012 compared to 202 homes during the year ended December 31, 2011, and a 58% increase in the average sales price of homes in backlog to $216,800 as of December 31, 2012 compared to $137,300 as of December 31, 2011. In Arizona, the cancellation rate increased to 10% for the year ended December 31, 2012 from 7% for the year ended December 31, 2011.
In Nevada, the dollar amount of backlog increased 445% to $20.5 million as of December 31, 2012 from $3.8 million as of December 31, 2011, which is attributable to a 441% increase in the number of units in backlog to 92 as of December 31, 2012 from 17 as of December 31, 2011, along with a 146% increase in net new home orders in Nevada to 268 homes during the year ended December 31, 2012 compared to 109 homes during the year ended December 31, 2011, and a slight increase in the average sales price of homes in backlog to $222,700 as of December 31, 2012 compared to $221,300 as of December 31, 2011. In Nevada, the cancellation rate decreased to 14% for the year ended December 31, 2012 from 20% for the year ended December 31, 2011.
In Colorado, the dollar amount of backlog was $33.1 million as of December 31, 2012, with no comparable amount as of December 31, 2011.
| Successor | Predecessor | Combined | Predecessor | Increase (Decrease) | ||||||||||||||||||||||
| Period from | Period from | |||||||||||||||||||||||||
| February 25 through | January 1 through | Year Ended | ||||||||||||||||||||||||
| December 31, | February 24, | December 31, | ||||||||||||||||||||||||
| 2012 | 2012 | 2012 | 2011 | Amount | % | |||||||||||||||||||||
Number of Homes Closed | ||||||||||||||||||||||||||
Southern California | 228 | 13 | 241 | 223 | 18 | 8 | % | |||||||||||||||||||
Northern California | 170 | 15 | 185 | 141 | 44 | 31 | % | |||||||||||||||||||
Arizona | 291 | 27 | 318 | 135 | 183 | 136 | % | |||||||||||||||||||
Nevada | 181 | 12 | 193 | 115 | 78 | 68 | % | |||||||||||||||||||
Colorado | 13 | — | 13 | — | 13 | N/M | ||||||||||||||||||||
|
|
|
|
|
|
|
|
|
| |||||||||||||||||
Total | 883 | 67 | 950 | 614 | 336 | 55 | % | |||||||||||||||||||
|
|
|
|
|
|
|
|
|
| |||||||||||||||||
52
Table of Contents
During the year ended December 31, 2012, the number of homes closed increased 55% to 950 in the 2012 period from 614 in the 2011 period. The increase in home closings is primarily attributable to an increase in beginning backlog for the period of 65% to 139 units at December 31, 2011 compared to 84 units at December 31, 2010. There was a 136% increase in Arizona to 318 homes closed in the 2012 period compared to 135 homes closed in the 2011 period, a 31% increase in homes closed in Northern California to 185 in the 2012 period from 141 in the 2011 period, and a 68% increase in homes closed in Nevada to 193 in the 2012 period compared to 115 in the 2011 period. Colorado had 13 home closings during the 2012 period, with no comparable activity in the 2011 period.
| Successor | Predecessor | Combined | Predecessor | Increase (Decrease) | ||||||||||||||||||||||
| Period from | Period from | |||||||||||||||||||||||||
| February 25 through | January 1 through | Year Ended | ||||||||||||||||||||||||
| December 31, | February 24, | December 31, | ||||||||||||||||||||||||
| 2012 | 2012 | 2012 | 2011 | Amount | % | |||||||||||||||||||||
| (dollars in thousands) | ||||||||||||||||||||||||||
Home Sales Revenue | ||||||||||||||||||||||||||
Southern California | $ | 99,671 | $ | 5,640 | $ | 105,311 | $ | 110,969 | $ | (5,658 | ) | (5 | %) | |||||||||||||
Northern California | 54,207 | 4,250 | 58,457 | 54,141 | 4,316 | 8 | % | |||||||||||||||||||
Arizona | 47,989 | 4,316 | 52,305 | 20,074 | 32,231 | 161 | % | |||||||||||||||||||
Nevada | 37,307 | 2,481 | 39,788 | 21,871 | 17,917 | 82 | % | |||||||||||||||||||
Colorado | 5,436 | — | 5,436 | — | 5,436 | N/M | ||||||||||||||||||||
|
|
|
|
|
|
|
|
|
| |||||||||||||||||
Total | $ | 244,610 | $ | 16,687 | $ | 261,297 | $ | 207,055 | $ | 54,242 | 26 | % | ||||||||||||||
|
|
|
|
|
|
|
|
|
| |||||||||||||||||
The increase in homebuilding revenue of 26% to $261.3 million for the period ending 2012 from $207.1 million for the period ending 2011 is primarily attributable to a 55% increase in the number of homes closed to 950 during the 2012 period from 614 in the 2011 period, offset by an 18% decrease in the average sales price of homes closed to $275,100 during the 2012 period from $337,200 during the 2011 period. The decrease in average home sale price resulted in a $59.0 million decrease in revenue, offset by a $113.2 million increase in revenue attributable to a 55% increase in the number of homes closed.
| Successor | Predecessor | Combined | Predecessor | Increase (Decrease) | ||||||||||||||||||||||
| Period from | Period from | |||||||||||||||||||||||||
| February 25 through | January 1 through | Year Ended | ||||||||||||||||||||||||
| December 31, | February 24, | December 31, | ||||||||||||||||||||||||
| 2012 | 2012 | 2012 | 2011 | Amount | % | |||||||||||||||||||||
Average Sales Price of Homes Closed | ||||||||||||||||||||||||||
Southern California | $ | 437,200 | $ | 433,800 | $ | 437,000 | $ | 497,600 | $ | (60,600 | ) | (12 | %) | |||||||||||||
Northern California | 318,900 | 283,300 | 316,000 | 384,000 | (68,000 | ) | (18 | %) | ||||||||||||||||||
Arizona | 164,900 | 159,900 | 164,500 | 148,700 | 15,800 | 11 | % | |||||||||||||||||||
Nevada | 206,100 | 206,800 | 206,200 | 190,200 | 16,000 | 8 | % | |||||||||||||||||||
Colorado | 418,200 | — | 418,200 | — | 418,200 | N/M | ||||||||||||||||||||
|
|
|
|
|
|
|
|
|
| |||||||||||||||||
Total | $ | 277,000 | $ | 249,100 | $ | 275,100 | $ | 337,200 | $ | (62,100 | ) | (18 | %) | |||||||||||||
|
|
|
|
|
|
|
|
|
| |||||||||||||||||
53
Table of Contents
The average sales price of homes closed for the 2012 period decreased primarily due to a lower price point of our actively selling projects to projects available to first time buyers or first time “move up” buyers. In the Southern California and Northern California segments, the overall average sales price decrease is primarily due to a change in product mix, in which the number of homes closed with a sale price in excess of $500,000 was 153 in the 2011 period and 81 in the 2012 period. The decrease in average sales prices for the period was due to new projects that were released during 2012 with an average sales price of $326,900, which is below the prior period average of $337,200.
| Successor | Predecessor | Predecessor | ||||||||||||
| Period from | Period from | Year | ||||||||||||
| February 25 through | January 1 through | Ended | ||||||||||||
| December 31, | February 24, | December 31, | ||||||||||||
| 2012 | 2012 | 2011 | ||||||||||||
Homebuilding Gross Margin Percentage | ||||||||||||||
Southern California | 16.1 | % | 11.8 | % | 10.9 | % | ||||||||
Northern California | 22.8 | % | 14.6 | % | 11.1 | % | ||||||||
Arizona | 13.2 | % | 11.6 | % | 11.8 | % | ||||||||
Nevada | 15.7 | % | 12.0 | % | 9.7 | % | ||||||||
Colorado | 14.9 | % | — | — | ||||||||||
|
|
|
|
|
| |||||||||
Total | 16.9 | % | 12.5 | % | 10.9 | % | ||||||||
|
|
|
|
|
| |||||||||
Adjusted Homebuilding Gross Margin Percentage | 26.2 | % | 20.7 | % | 19.6 | % | ||||||||
|
|
|
|
|
| |||||||||
For homebuilding gross margins, the comparison of the Successor entity from February 25, 2012 through December 31, 2012 and the Predecessor entity for the year ended December 31, 2011 are as follows:
| • | In Southern California, homebuilding gross margins increased to 16.1% during the 2012 period compared to 10.9% during the 2011 period. Margins were slightly impacted by fresh start accounting on the real estate values, which decreased the cost basis on some properties in the division and increased the cost basis on others, and subsequently increased gross margins by 0.9%. Average sales price of homes closed in Southern California for new projects released during 2012 was $585,400 as compared to prior period average sales price of homes closed of $497,600. In addition, the Company has experienced increases in sales prices and decreases in incentives during 2012. |
| • | In Northern California, homebuilding gross margins more than doubled to 22.8% in the 2012 period due to (i) the impact of fresh start accounting on the real estate values, which decreased the cost basis in each property in the division, and subsequently increased gross margins by 4.6%, and (ii) cost savings from previously closed out projects. In addition, the Company has experienced increases in sales prices and decreases in incentives during 2012. |
| • | In Arizona, homebuilding gross margins remained relatively consistent due to the impact of fresh start accounting on the real estate values, which increased the cost basis in each property in the division, and subsequently decreased gross margins by 1.1%, and an 11% increase in average sales price of homes closed. Average sales price of homes closed in Arizona for new projects released during 2012 was $217,000 as compared to prior period average sales price of homes closed of $148,700. In addition, the Company has experienced increases in sales prices and decreases in incentives during 2012. |
| • | In Nevada, homebuilding gross margins increased 6.0% due to the impact of fresh start accounting on the real estate values, which decreased the cost basis on some properties in the division and increased the cost basis on others, and subsequently increased gross margins by 0.8%, and an increase in average sales prices in Nevada from $190,200 in the 2011 period to $206,100 in the 2012 period. In addition, the Company has experienced increases in sales prices and decreases in incentives during 2012. |
| • | In Colorado, homebuilding gross margins were 14.9% during the 2012 period, with no comparable amount in the 2011 period. |
54
Table of Contents
For homebuilding gross margins, the comparison of the Predecessor entity from January 1, 2012 through February 24, 2012 and the Predecessor entity for the year ended December 31, 2011 are as follows:
| • | In Southern California, homebuilding gross margins remained relatively consistent due to a 13% decrease in the average sales price of homes closed of $433,800 in the 2012 period from $497,600 in the 2011 period, offset by a decrease in the average cost per home closed of 14% from $443,500 in the 2011 period to $382,500 in the 2012 period. |
| • | In Northern California, homebuilding gross margins increased 3.5% in the 2012 period due to a decrease in the average cost per home closed of 29% from $341,400 in the 2011 period to $241,900 in the 2012 period, offset by a 26% decrease in the average sales price of homes closed of $283,300 in the 2012 period from $384,000 in the 2011 period. |
| • | In Arizona, homebuilding gross margins remained relatively consistent due to an increase in the average cost per home closed of 8% from $131,200 in the 2011 period to $141,100 in the 2012 period, offset by an 8% increase in the average sales price of homes closed to $159,900 in the 2012 period from $148,700 in the 2011 period. |
| • | In Nevada, homebuilding gross margins increased 2.3% in the 2012 period due to a 9% increase in the average sales price of homes closed of $206,800 in the 2012 period from $190,200 in the 2011 period, offset by an increase in the average cost per home closed of 6% from $171,800 in the 2011 period to $181,900 in the 2012 period. |
For the comparison of the Successor entity from February 25, 2012 through December 31, 2012 and the Predecessor entity for the year ended December 31, 2011, adjusted homebuilding gross margin percentage, which excludes previously capitalized interest included in cost of sales, was 26.2% for the 2012 period compared to 19.6% for the 2011 period. The increase was primarily a result of the changes discussed for homebuilding gross margins described previously.
For the comparison of the Predecessor entity from January 1, 2012 through February 24, 2012 and the Predecessor entity for the year ended December 31, 2011, adjusted homebuilding gross margin percentage was 20.7% for the 2012 period compared to 19.6% for the 2011 period.
Adjusted homebuilding gross margin is a non-GAAP financial measure. The Company believes this information is meaningful as it isolates the impact that interest has on homebuilding gross margin and permits investors to make better comparisons with its competitors, who also break out and adjust gross margins in a similar fashion. See table set forth below reconciling this non-GAAP measure to homebuilding gross margin.
| Successor | Predecessor | Predecessor | ||||||||||||
| Period from | Period from | Year | ||||||||||||
| February 25 through | January 1 through | Ended | ||||||||||||
| December 31, | February 24, | December 31, | ||||||||||||
| 2012 | 2012 | 2011 | ||||||||||||
| (dollars in thousands) | ||||||||||||||
Home sales revenue | $ | 244,610 | $ | 16,687 | $ | 207,055 | ||||||||
Cost of home sales | 203,203 | 14,598 | 184,489 | |||||||||||
|
|
|
|
|
| |||||||||
Homebuilding gross margin | 41,407 | 2,089 | 22,566 | |||||||||||
Add: Interest in cost of sales | 22,728 | 1,360 | 18,082 | |||||||||||
|
|
|
|
|
| |||||||||
Adjusted homebuilding gross margin | $ | 64,135 | $ | 3,449 | $ | 40,648 | ||||||||
|
|
|
|
|
| |||||||||
Adjusted homebuilding gross margin percentage | 26.2 | % | 20.7 | % | 19.6 | % | ||||||||
|
|
|
|
|
| |||||||||
55
Table of Contents
Lots, Land, and Other Sales Revenue
Lots, land and other sales increased to $104.3 million in the 2012 period with no comparable amount in the 2011 period primarily attributable to the sale of a 27-acre parcel in Palo Alto and Mountain View, California for a sales price of $90.0 million in the second quarter of 2012, the sale of 58 lots in Mesa, Arizona for a sales price of $6.5 million in the third quarter of 2012, the sale of 40 lots in Elk Grove, California for a sales price of $2.8 million in the third quarter of 2012, and the sale of 84 lots in Peoria, Arizona for a sales price of $4.2 million in the fourth quarter of 2012. As a result of the sales described above, cost of sales – lots, land and other increased to $94.8 million, which includes adjustments to land basis for fresh start accounting, in the 2012 period compared to a negligible amount in the 2011 period.
Construction Services Revenue
Construction services revenue, which was all recorded in Southern California and Northern California, was $23.8 million for the period from February 25, 2012 through December 31, 2012, and $8.9 million for the period from January 1, 2012 through February 24, 2012 compared with $19.8 million in the 2011 period. The increase is primarily due to an increase in the number of construction services projects in the 2012 period, compared to the 2011 period. In Northern California, the Company started construction on one project which contributed approximately $14.4 million in the 2012 period. See Note 1 of “Notes to Consolidated Financial Statements” for further discussion.
Impairment Loss on Real Estate Assets
| Successor | Predecessor | Predecessor | ||||||||||||
| Period from | Period from | Year | ||||||||||||
| February 25 through | January 1 through | Ended | ||||||||||||
| December 31, | February 24, | December 31, | ||||||||||||
| 2012 | 2012 | 2011 | ||||||||||||
| (in thousands) | ||||||||||||||
Land under development and homes completed and under construction | ||||||||||||||
Southern California | $ | — | $ | — | $ | 17,962 | ||||||||
Northern California | — | — | 2,074 | |||||||||||
Arizona | — | — | 10,650 | |||||||||||
Nevada | — | — | 4,149 | |||||||||||
|
|
|
|
|
| |||||||||
Total | $ | — | $ | — | $ | 34,835 | ||||||||
Land held for future development or sold | ||||||||||||||
Arizona | — | — | 76,957 | |||||||||||
Nevada | — | — | 16,522 | |||||||||||
|
|
|
|
|
| |||||||||
Total | — | — | 93,479 | |||||||||||
|
|
|
|
|
| |||||||||
Total impairment loss on real estate assets | $ | — | $ | — | $ | 128,314 | ||||||||
|
|
|
|
|
| |||||||||
The Company evaluates homebuilding assets for impairment when indicators of impairments are present. Indicators of potential impairment include, but are not limited to, a decrease in housing market values, sales absorption rates, and sales prices. On February 24, 2012, the Company adopted fresh start accounting under ASC 852,Reorganizations, and recorded all real estate inventories at fair value. Subsequent to February 24, 2012 and throughout each quarter of 2012, there were no indicators of impairment, as sales prices and sales absorption rates have improved and incentives have decreased. For the 2012 period, there were no impairment charges recorded.
56
Table of Contents
During the year ended December 31, 2011, the Company recorded impairment loss on real estate assets of $128.3 million. The impairment loss related to land under development and homes completed and under construction recorded during the year ended December 31, 2011, resulted from (i) in certain projects, a decrease in home sales prices related to increased incentives and (ii) a decrease in sales absorption rates which increased the length of time of the project and increased period costs related to the project. During 2011, the Company updated project budgets and cash flows of each real estate project on a quarterly basis to determine whether the estimated remaining undiscounted future cash flows of the project are more or less than the carrying amount (net book value) of the asset. If the undiscounted cash flows were more than the net book value of the project, then there was no impairment. If the undiscounted cash flows were less than the net book value of the asset, then the asset was deemed to be impaired and was written-down to its fair value. During the 2011 period, the Company adjusted discount rates to a range of 18% to 22%.
The impairment loss related to land held for future development or sold during the year ended December 31, 2011, resulted from the reduced value of the land in the project. The Company values land held for future development using, (i) projected cash flows with the strategy of selling the land, on a finished or unfinished basis, or building out the project, (ii) recent, legitimate offers received, (iii) prices for land in recent comparable sales transactions, and other factors. In addition, the Company may use appraisals to best determine the as-is value. The Company continues to evaluate land values to determine whether to hold for development or to sell at current prices, which may lead to additional impairment on real estate assets.
Sales and Marketing Expense
| Successor | Predecessor | Predecessor | ||||||||||||
| Period from | Period from | Year | ||||||||||||
| February 25 through | January 1 through | Ended | ||||||||||||
| December 31, | February 24, | December 31, | ||||||||||||
| 2012 | 2012 | 2011 | ||||||||||||
| (in thousands) | ||||||||||||||
Sales and Marketing Expense | ||||||||||||||
Homebuilding | ||||||||||||||
Southern California | $ | 5,796 | $ | 942 | $ | 8,480 | ||||||||
Northern California | 2,732 | 463 | 4,227 | |||||||||||
Arizona | 2,805 | 260 | 1,318 | |||||||||||
Nevada | 2,291 | 279 | 2,823 | |||||||||||
Colorado | 304 | — | — | |||||||||||
|
|
|
|
|
| |||||||||
Total | $ | 13,928 | $ | 1,944 | $ | 16,848 | ||||||||
|
|
|
|
|
| |||||||||
For the comparison of the Successor entity from February 25, 2012 through December 31, 2012 and the Predecessor entity for the year ended December 31, 2011, sales and marketing expense as a percentage of homebuilding revenue decreased to 5.7% in the 2012 period compared to 8.1% in the 2011 period. This is primarily attributable to a decrease in advertising expense to $2.9 million in the 2012 period compared to $5.8 million in the 2011 period, due to cost reduction efforts to use more economically efficient platforms for advertising. Such decrease is partially offset by an increase in commission expense to $9.5 million in the 2012 period from $7.9 million in the 2011 period, due to a 55% increase in home closings in the 2012 period.
For the comparison of the Predecessor entity from January 1, 2012 through February 24, 2012 and the Predecessor entity for the year ended December 31, 2011, sales and marketing expense as a percentage of revenue increased to 11.6% in the 2012 period compared to 8.1 % in the 2011 period. This is primarily attributable to the cost of operating the sales models and base sales person compensation incurred on a monthly basis relative to the respective revenue in each period.
57
Table of Contents
General and Administrative Expense
| Successor | Predecessor | Predecessor | ||||||||||||
| Period from | Period from | Year | ||||||||||||
| February 25 through | January 1 through | Ended | ||||||||||||
| December 31, | February 24, | December 31, | ||||||||||||
| 2012 | 2012 | 2011 | ||||||||||||
| (in thousands) | ||||||||||||||
General and Administrative Expense | ||||||||||||||
Homebuilding | ||||||||||||||
Southern California | $ | 3,540 | $ | 707 | $ | 3,665 | ||||||||
Northern California | 1,098 | 222 | 1,388 | |||||||||||
Arizona | 2,102 | 318 | 1,884 | |||||||||||
Nevada | 2,114 | 357 | 2,349 | |||||||||||
Colorado | 235 | — | — | |||||||||||
Corporate | 17,006 | 1,698 | 13,125 | |||||||||||
|
|
|
|
|
| |||||||||
Total | $ | 26,095 | $ | 3,302 | $ | 22,411 | ||||||||
|
|
|
|
|
| |||||||||
For the comparison of the Successor entity from February 25, 2012 through December 31, 2012 and the Predecessor entity for the year ended December 31, 2011, general and administrative expense as a percentage of homebuilding revenues, remained consistent at 10.7% in the 2012 period and 10.8% in the 2011 period, reflecting the impact of higher housing revenues in the current period, partially offset by $3.7 million in stock based compensation expense recorded in the fourth quarter of 2012.
For the comparison of the Predecessor entity from January 1, 2012 through February 24, 2012 and the Predecessor entity for the year ended December 31, 2011, general and administrative expense as a percentage of homebuilding revenues increased to 19.8% in the 2012 period compared to 10.8% in the 2011 period. This is primarily attributable to the fixed costs of salaries and benefits incurred on a monthly basis relative to the respective revenue in each period.
Other Items
Combined other operating costs remained relatively consistent at $3.1 million in the 2012 period compared to $4.0 million in the 2011 period.
Equity in income of unconsolidated joint ventures was $0 in the 2012 period compared to income of $3.6 million during the 2011 period. The income during the 2011 period was primarily due to the sale of the Company’s interest in one of its unconsolidated joint ventures.
During the period from February 25, 2012 through December 31, 2012, and the period from January 1, 2012 through February 24, 2012, the Company incurred interest of $30.5 million, and $7.1 million, respectively. During the period from February 25, 2012 through December 31, 2012, and the period from January 1, 2012 through February 24, 2012, the Company capitalized interest of $21.4 million, and $4.6 million, respectively. During the period from February 25, 2012 through December 31, 2012, and the period from January 1, 2012 through February 24, 2012, the Company recorded $9.1 million, and $2.5 million, respectively, of interest expense. During the 2011 period, the Company incurred interest related to its outstanding debt of $61.4 million, of which $36.9 million was capitalized, resulting in net interest expense of $24.5 million. The decrease in interest expense in the 2012 period as compared to the 2011 period is primarily attributable to the lower interest rate and reduced outstanding debt obtained as a result of the debt restructuring in the 2012 period.
58
Table of Contents
Reorganization Items
During the period from January 1, 2012 through February 24, 2012, the Company recorded reorganization items of $233.5 million associated with or resulting from the reorganization and restructuring of the business. During the period from February 25, 2012 through December 31, 2012, the Company incurred reorganization costs of $2.5 million for legal and professional fees. The Company incurred reorganization costs of $21.2 million for legal and professional fees during the year ended December 31, 2011.
Noncontrolling Interest
For the comparison of the Successor entity from February 25, 2012 through December 31, 2012 and the Predecessor entity for the year ended December 31, 2011, net income attributable to noncontrolling interest increased to income of $2.0 million in the 2012 period compared to income of $0.4 million in the 2011 period. The change is primarily due to an increase in the numbers of homes closed in consolidated joint ventures to 45 in the 2012 period from 29 in the 2011 period.
Preferred Stock Dividends
The preferred stock dividends were $2.7 million in the 2012 period with no comparable amount in the 2011 period due to the issuance of preferred stock in conjunction with the Company’s reorganization.
Income Taxes
Income taxes are accounted for under the provisions of Financial Accounting Standards Board ASC 740, Income Taxes, using an asset and liability approach. Deferred income taxes reflect the net effects of temporary differences between the carrying amount of assets and liabilities for financial reporting purposes and the amounts used for income tax purposes, and operating loss and tax credit carryforwards measured by applying currently enacted tax laws. A valuation allowance is provided to reduce net deferred tax assets to an amount that is more likely than not to be realized. In 2012 and 2011, the Company only paid $11,000 and $10,000, respectively, in minimum tax payments for the year.
Net (Loss) Income Attributable to William Lyon Homes
Net income includes reorganization items of approximately $233.5 million for the period from January 1, 2012 through February 24, 2012 which primarily consists of a gain of approximately $298.8 million which resulted from cancellation of debt. The overall gain was partially offset by approximately $49.3 million in adjustments related to plan implementation and fresh start adjustments, approximately $7.8 million in professional fees, and approximately $8.3 million of debt financing cost write-off. For the period from February 25, 2012 through December 31, 2012, net loss includes reorganization items of $2.5 million which consist of professional fees relating to the restructure. As a result of the foregoing factors, net (loss) income attributable to William Lyon Homes for the period from February 25, 2012 through December 31, 2012, and the period from January 1, 2012 through February 24, 2012, was a net loss of $8.9 million, and net income of $228.4 million, respectively, compared to net loss for the year ended December 31, 2011 of $193.3 million.
59
Table of Contents
Lots Owned and Controlled
The table below summarizes the Company’s lots owned and controlled as of the periods presented:
| Successor | Predecessor | Increase (Decrease) | ||||||||||||||||
| December 31, | ||||||||||||||||||
| 2012 | 2011 | Amount | % | |||||||||||||||
Lots Owned | ||||||||||||||||||
Southern California | 1,114 | 713 | 401 | 56 | % | |||||||||||||
Northern California | 259 | 767 | (508 | ) | (66 | %) | ||||||||||||
Arizona | 6,082 | 6,194 | (112 | ) | (2 | %) | ||||||||||||
Nevada | 2,884 | 2,676 | 208 | 8 | % | |||||||||||||
Colorado | 254 | — | 254 | N/M | ||||||||||||||
|
|
|
|
|
| |||||||||||||
Total | 10,593 | 10,350 | 243 | 2 | % | |||||||||||||
|
|
|
|
|
| |||||||||||||
Lots Controlled(1) | ||||||||||||||||||
Southern California | 96 | 114 | (18 | ) | (16 | %) | ||||||||||||
Northern California | 674 | — | 674 | 100 | % | |||||||||||||
Colorado | 479 | — | 479 | N/M | ||||||||||||||
|
|
|
|
|
| |||||||||||||
Total | 1,249 | 114 | 1,135 | 996 | % | |||||||||||||
|
|
|
|
|
| |||||||||||||
Total Lots Owned and Controlled | 11,842 | 10,464 | 1,378 | 13 | % | |||||||||||||
|
|
|
|
|
| |||||||||||||
| (1) | Lots controlled may be purchased by the Company as consolidated projects or may be purchased by newly formed joint ventures. |
Total lots owned and controlled has increased 13% to 11,842 lots owned and controlled at December 31, 2012 from 10,464 lots at December 31, 2011. The increase is primarily due to certain lot acquisitions during the period, and the lots acquired through the purchase of Village Homes in December 2012, offset by the closing of 950 homes during the 2012 period.
Comparisons of Years Ended December 31, 2011 and 2010
On a consolidated basis, homes sales revenue decreased $59.8 million to $207.1 million during the year ended December 31, 2011 compared to $266.9 million for the year ended December 31, 2010. The decrease is primarily attributable to a decrease in homes closed of 19% to 614 homes for the year ended December 31, 2011 from 760 homes for the year ended December 31, 2010 and a decrease in average sales price of 4% to $337,200 in the year ended December 31, 2011, from $351,100 in the year ended December 31, 2010. The number of net new home orders for the year ended December 31, 2011 increased 3% to 669 homes from 650 homes for the year ended December 31, 2010. The cancellation rate of buyers who contracted to buy a home but did not close escrow at the Company’s projects was approximately 18% during 2011 and 19% during 2010. The inventory of completed and unsold homes was 73 homes as of December 31, 2011, compared to 107 homes as of December 31, 2010.
On a consolidated basis, the backlog of homes sold but not closed as of December 31, 2011 was 139 homes, up 65% from 84 homes as of December 31, 2010. Homes in backlog are generally closed within three to six months. The dollar amount of backlog of homes sold but not closed on a consolidated basis as of December 31, 2011 was $29.3 million, down 2% from $30.1 million as of December 31, 2010.
The Company’s average number of sales locations increased for the year ended December 31, 2011 to 19, up 6% from 18 for the year ended December 31, 2010. The Company’s number of new home orders per average sales location decreased to 35.2 for the year ended December 31, 2011 from 36.1 for the year ended December 31, 2010.
60
Table of Contents
The Company’s operations are historically seasonal, with the highest new order activity in the spring and summer, which is impacted by the timing of project openings and competition in surrounding projects, among other factors. In addition, the Company’s home deliveries typically occur in the third and fourth quarter of each fiscal year, based on the construction cycle times of our homes between three and six months. As a result, the Company’s revenues, cash flow and profitability are higher in that same period.
| Year Ended December 31, | Increase (Decrease) | |||||||||||||||
| 2011 | 2010 | Amount | % | |||||||||||||
Number of Net New Home Orders | ||||||||||||||||
Southern California | 211 | 369 | (158 | ) | (43 | )% | ||||||||||
Northern California | 147 | 114 | 33 | 29 | % | |||||||||||
Arizona | 202 | 90 | 112 | 124 | % | |||||||||||
Nevada | 109 | 77 | 32 | 42 | % | |||||||||||
|
|
|
|
|
| |||||||||||
Total | 669 | 650 | 19 | 3 | % | |||||||||||
|
|
|
|
|
| |||||||||||
Cancellation Rate | 18 | % | 19 | % | (1 | )% | ||||||||||
|
|
|
|
|
| |||||||||||
Three of the Company’s homebuilding segments experienced increases in net new home orders during the year ended December 31, 2011, primarily attributable to stabilized market conditions. However, the Company’s Southern California segment experienced a decrease in new home orders during this same period, due to slowing absorption in the markets in which the Company operates. The weekly average sales rates for the period were 0.7 sales per project during the 2011 period compared to 0.7 sales per project during the 2010 period. The increase in net new home orders positively impacts the number of homes in backlog, which are homes we will close in future periods. As new home orders and backlog increase, it has a positive impact on revenue and cash flow in future periods. The increase in the Company’s new home orders is driven by significant improvement in Arizona. New home orders during the 2010 period were 90 from three sales locations compared to 202 during the 2011 period from two sales locations. The increase is due to increased consumer confidence and diminished shadow foreclosure inventory, which has yielded stabilized prices.
Cancellation rates during the year ended December 31, 2011 decreased to 18% in the 2011 period from 19% during the 2010 period. The decline resulted from a decrease in the cancellation rate in two of the Company’s homebuilding segments. Northern California decreased to 18% in the 2011 period compared to 23% in the 2010 period, Arizona decreased to 7% in the 2011 period from 15% in the 2010 period, Southern California increased to 24% in the 2011 period from 19% in the 2010 period and Nevada increased to 20% in the 2011 period from 14% in the 2010 period. The decrease in cancellation rates, period over period, is an indication of an increase in home buyer confidence and stabilization in the Company’s markets.
| Year Ended December 31, | Increase (Decrease) | |||||||||||||||
| 2011 | 2010 | Amount | % | |||||||||||||
Average Number of Sales Locations | ||||||||||||||||
Southern California | 7 | 7 | — | — | ||||||||||||
Northern California | 4 | 5 | (1 | ) | (20 | )% | ||||||||||
Arizona | 2 | 3 | (1 | ) | (33 | )% | ||||||||||
Nevada | 6 | 3 | 3 | 100 | % | |||||||||||
|
|
|
|
|
| |||||||||||
Total | 19 | 18 | 1 | 6 | % | |||||||||||
|
|
|
|
|
| |||||||||||
The average number of sales locations in Southern California remained consistent with the prior year. However, the Southern California homebuilding segment had final deliveries and project close out in three projects and commenced selling in three new projects during the year. The average number of sales locations in Northern California and Arizona decreased by one in each segment, due to final deliveries and project close out.
61
Table of Contents
Nevada gained three additional sales locations on average due to the reintroduction of sales of two suspended projects and the addition of one newly acquired project during the year.
| December 31, | Increase (Decrease) | |||||||||||||||
| 2011 | 2010 | Amount | % | |||||||||||||
Backlog (units) | ||||||||||||||||
Southern California | 22 | 34 | (12 | ) | (35 | )% | ||||||||||
Northern California | 25 | 19 | 6 | 32 | % | |||||||||||
Arizona | 75 | 8 | 67 | 838 | % | |||||||||||
Nevada | 17 | 23 | (6 | ) | (26 | )% | ||||||||||
|
|
|
|
|
| |||||||||||
Total | 139 | 84 | 55 | 65 | % | |||||||||||
|
|
|
|
|
| |||||||||||
The Company’s backlog at December 31, 2011 increased 65% from levels at December 31, 2010, primarily resulting from a significant increase in the number of net new home orders in Arizona. The increase in backlog during this period reflects an increase in net new order activity in Arizona of 124% to 202 homes in the 2011 period compared to 90 homes in the 2010 period in addition to a decrease in the number of homes closed companywide by 19% to 614 in the 2011 period from 760 in the 2010 period. The increase in backlog is driven by the significant improvement in Arizona. The Arizona division had 202 new home orders during the 2011 period, offset by 135 closings, increasing backlog from 8 units as of December 31, 2010 to 75 units as of December 31, 2011.
| December 31, | Increase (Decrease) | |||||||||||||||
| 2011 | 2010 | Amount | % | |||||||||||||
| (Dollars in thousands) | ||||||||||||||||
Backlog | ||||||||||||||||
Southern California | $ | 8,148 | $ | 16,726 | $ | (8,578 | ) | (51 | )% | |||||||
Northern California | 7,125 | 8,184 | (1,059 | ) | (13 | )% | ||||||||||
Arizona | 10,294 | 995 | 9,299 | 935 | % | |||||||||||
Nevada | 3,762 | 4,172 | (410 | ) | (10 | )% | ||||||||||
|
|
|
|
|
| |||||||||||
Total | $ | 29,329 | $ | 30,077 | $ | (748 | ) | (2 | )% | |||||||
|
|
|
|
|
| |||||||||||
The dollar amount of backlog of homes sold but not closed on a consolidated basis as of December 31, 2011 was $29.3 million, slightly down from $30.1 million as of December 31, 2010. The slight decrease in dollar amount of backlog during this period reflects: (i) a decrease in the average sales price of homes in backlog to $211,000 as of December 31, 2011 compared to $358,000 as of December 31, 2010, which was driven by the number of homes in backlog in the Arizona division of 75, with an average price in backlog of $137,000 as of the 2011 period, compared to eight with an average price in backlog of $124,000 in the 2010 period, and (ii) an increase in the number of homes in backlog to 139 homes in the 2011 period compared to 84 in the 2010 period. In addition, the Company’s product mix continues to shift, with five homes, or 4% of total homes in backlog greater than $500,000 per unit at December 31, 2011, compared to 28 homes, or 33% in backlog greater than $500,000 per unit at December 31, 2010.
In Southern California, the dollar amount of backlog decreased 51% to $8.1 million as of December 31, 2011 from $16.7 million as of December 31, 2010, which is attributable to a 43% decrease in net new home orders in Southern California to 211 homes in the 2011 period compared to 369 homes in the 2010 period in addition to a decrease in the number of closings from 493 in the 2010 period to 223 in the 2011 period. In Southern California, the cancellation rate increased to 24% for the period ended December 31, 2011 compared to 19% for the period ended December 31, 2010.
In Northern California, the dollar amount of backlog decreased 13% to $7.1 million as of December 31, 2011 from $8.2 million as of December 31, 2010, which is attributable to a 34% decrease in the average sales
62
Table of Contents
price of homes in backlog to $285,000 as of December 31, 2011 compared to $430,700 as of December 31, 2010. However, homes in backlog increased 32% to 25 homes for the period ended December 31, 2011 from 19 homes for the same period ending 2010, primarily attributable to a 29% increase in the number of new orders to 147 in 2011 compared to 114 in 2010. In Northern California, the cancellation rate decreased to 18% for the period ended December 31, 2011 from 23% for the period ended December 31, 2010.
In Arizona, the dollar amount of backlog increased tenfold to $10.3 million as of December 31, 2011 from $1.0 million as of December 31, 2010, which is attributable to an eightfold increase in the number of homes in backlog to 75 homes at December 31, 2011 from 8 homes at December 31, 2010 and to a 10% increase in the average sales price of homes in backlog to $137,300 as of December 31, 2011 compared to $124,400 as of December 31, 2010. In Arizona, the cancellation rate decreased to 7% for the period ended December 31, 2011 from 15% for the period ended December 31, 2010.
In Nevada, the dollar amount of backlog decreased 10% to $3.8 million as of December 31, 2011 from $4.2 million as of December 31, 2010, which is attributable to a 26% decrease in homes in backlog to 17 homes at December 31, 2011 from 23 homes at December 31, 2010 offset by a 22% increase in the average sales price of homes in backlog to $221,300 as of December 31, 2011 compared to $181,400 as of December 31, 2010. In Nevada, the cancellation rate increased to 20% for the period ended December 31, 2011 from 14% for the period ended December 31, 2010.
The decrease in the dollar amount of backlog of homes sold but not closed as described above generally results in a reduction in operating revenues in the subsequent period as compared to the previous period. Revenue from sales of homes decreased 22% to $207.1 million during the period ended December 31, 2011 from $266.9 million during the period ended December 31, 2010. A decrease in homebuilding revenues on a project basis is a potential indicator for impairment. If market prices and home values decrease in certain of the Company’s projects and cancellation rates increase in the future, the Company’s revenue and liquidity would likely be negatively impacted.
| Year Ended December 31, | Increase (Decrease) | |||||||||||||||
| 2011 | 2010 | Amount | % | |||||||||||||
Number of Homes Closed | ||||||||||||||||
Southern California | 223 | 493 | (270 | ) | (55 | )% | ||||||||||
Northern California | 141 | 101 | 40 | 40 | % | |||||||||||
Arizona | 135 | 99 | 36 | 36 | % | |||||||||||
Nevada | 115 | 67 | 48 | 72 | % | |||||||||||
|
|
|
|
|
| |||||||||||
Total | 614 | 760 | (146 | ) | (19 | )% | ||||||||||
|
|
|
|
|
| |||||||||||
During the year ended December 31, 2011, the number of homes closed decreased 19% to 614 during the 2011 period from 760 in the 2010 period. The decrease was primarily driven by the completion and closeout of two larger projects in the Southern California segment in 2011, which had 145 closings in 2010 compared to 39 in 2011. The decrease in closings in the 2011 period for Southern California is related to decreased absorption rates at its projects as net new home orders decreased 43% on the same number of average sales locations. All
63
Table of Contents
three of the other divisions had an increase in home closings, related to an increase in net new home orders of 40% in Northern California, 36% in Arizona and 72% in Nevada.
| Year Ended December 31, | Increase (Decrease) | |||||||||||||||
| 2011 | 2010 | Amount | % | |||||||||||||
| (Dollars in thousands) | ||||||||||||||||
Home Sales Revenue | ||||||||||||||||
Southern California | $ | 110,969 | $ | 195,613 | $ | (84,644 | ) | (43 | )% | |||||||
Northern California | 54,141 | 38,891 | 15,250 | 39 | % | |||||||||||
Arizona | 20,074 | 16,595 | 3,479 | 21 | % | |||||||||||
Nevada | 21,871 | 15,766 | 6,105 | 39 | % | |||||||||||
|
|
|
|
|
| |||||||||||
Total | $ | 207,055 | $ | 266,865 | $ | (59,810 | ) | (22 | )% | |||||||
|
|
|
|
|
| |||||||||||
The decrease in homebuilding revenue of 22%, or $59.8 million, to $207.1 million during the year ended December 31, 2011 from $266.9 million during the year ended December 31, 2010 is attributable to (i) a decrease in average sales prices of homes closed of 4%, or $13,900 per unit, which contributed to $10.6 million of the decrease and (ii) a 19% decrease in closings, or 146 units, which contributed to $49.2 million of the decrease.
| Year Ended December 31, | Increase (Decrease) | |||||||||||||||
| 2011 | 2010 | Amount | % | |||||||||||||
Average Sales Price of Homes Closed | ||||||||||||||||
Southern California | $ | 497,600 | $ | 396,800 | $ | 100,800 | 25 | % | ||||||||
Northern California | 384,000 | 385,100 | (1,100 | ) | (0 | )% | ||||||||||
Arizona | 148,700 | 167,600 | (18,900 | ) | (11 | )% | ||||||||||
Nevada | 190,200 | 235,300 | (45,100 | ) | (19 | )% | ||||||||||
|
|
|
|
|
| |||||||||||
Total | $ | 337,200 | $ | 351,100 | $ | (13,900 | ) | (4 | )% | |||||||
|
|
|
|
|
| |||||||||||
The average sales price of homes closed during the year ended December 31, 2011 decreased 4% to $337,200 compared to $351,100 in 2010, particularly driven by an increase in Southern California of $100,800 per unit, offset by a decrease in Arizona and Nevada. The increase in Southern California was driven by product mix, due to the Company strategically closing out of projects in the Inland Empire sub-market of Southern California, which projects delivered 193 units in 2010 at sales prices ranging from $208,000 to $408,000, with 1 unit being delivered in 2011. In Arizona, average sales prices for homes closed decreased in the 2011 period due to strategic price decreases, in an attempt to increase absorption rates. The price ranges of homes closed in 2010 ranged from $121,000 to $200,000 and in 2011 the price ranges decreased to $104,000 to $181,000 on the same communities. In Nevada, average sales prices decreased as result of strategic price decreases in an attempt to spur absorption rates.
| Year Ended December 31, | Increase (Decrease) | |||||||||||
| 2011 | 2010 | |||||||||||
Homebuilding Gross Margin Percentage | ||||||||||||
Southern California | 10.9 | % | 14.6 | % | (3.7 | )% | ||||||
Northern California | 11.1 | % | 22.3 | % | (11.2 | )% | ||||||
Arizona | 11.8 | % | 4.9 | % | 6.9 | % | ||||||
Nevada | 9.7 | % | 19.7 | % | (10.0 | )% | ||||||
|
|
|
|
|
| |||||||
Total | 10.9 | % | 15.4 | % | (4.5 | )% | ||||||
|
|
|
|
|
| |||||||
64
Table of Contents
Homebuilding gross margin percentage during the year ended December 31, 2011 decreased to 10.9% from 15.4% during the year ended December 31, 2010, which is primarily attributable to a decrease in the average sales price of homes closed of 4% from $351,100 in the 2010 period to $337,200 in the 2011 period in addition to 1% increase in the average cost of homes closed from $297,000 in the 2010 period to $300,500 in the 2011 period.
Homebuilding gross margins may be negatively impacted by a weak economic environment, which includes homebuyers’ reluctance to purchase new homes, increase in foreclosure rates, tightening of mortgage loan origination requirements, high cancellation rates, which could affect our ability to maintain existing home prices and/or home sales incentive levels, and continued deterioration in the demand for new homes in our markets, among other things.
Lots, Land and Other
Land sales revenue was $17.2 million during the year ended December 31, 2010, with no comparable amount for the year ended December 31, 2011. As part of an opportunistic land sale, in June 2010, the Company sold land in Santa Clara County and generated a net profit of $2.9 million. The Company determined that the best economic value to the Company of these lots was to sell them in their current condition as opposed to holding the lots and eventually building and selling homes. The Company continues to evaluate its options and the marketplace with respect to developing lots.
During the year ended December 31, 2011, the Company recorded a loss of $4.2 million compared to a loss of $3.2 million during the 2010 period. Included in these amounts are the write-off of land deposits and pre-acquisition costs of $0.3 million and $6.0 million, respectively. The write-off of land deposits and pre-acquisition costs of $6.0 million in 2010 are attributable to projects where the value of the land was less than the contracted price. Management of the Company determined that the remaining purchase prices of the lots in the arrangements were priced above current market values.
Construction Services Revenue
Construction services revenue, which is all recognized in Southern California and Northern California, was $19.8 million during the year ended December 31, 2011, compared with $10.6 million in the 2010 period. The increase is due to an increase in the number of construction services projects from four in the 2010 period to five in the 2011 period, which contributed an incremental $9.1 million in revenue during the 2011 period.
Impairment Loss on Real Estate Assets
| Year Ended December 31, | Increase (Decrease) | |||||||||||
| 2011 | 2010 | |||||||||||
| (in thousands) | ||||||||||||
Impairment Loss on Real Estate Assets | ||||||||||||
Land under development and homes completed and under construction | ||||||||||||
Southern California | $ | 17,962 | $ | 70,801 | $ | (52,839 | ) | |||||
Northern California | 2,074 | 3,103 | (1,029 | ) | ||||||||
Arizona | 10,650 | 6,293 | 4,357 | |||||||||
Nevada | 4,149 | — | 4,149 | |||||||||
|
|
|
|
|
| |||||||
Total | $ | 34,835 | $ | 80,197 | $ | (45,362 | ) | |||||
|
|
|
|
|
| |||||||
Land held for future development or sold | ||||||||||||
Arizona | 76,957 | 16,116 | 60,841 | |||||||||
Nevada | 16,522 | 15,547 | 975 | |||||||||
|
|
|
|
|
| |||||||
Total | 93,479 | 31,663 | 61,816 | |||||||||
|
|
|
|
|
| |||||||
Total Impairment Loss on Real Estate Assets | $ | 128,314 | $ | 111,860 | $ | 16,454 | ||||||
|
|
|
|
|
| |||||||
65
Table of Contents
During the year ended December 31, 2011, the Company recorded impairment loss on real estate assets of $128.3 million, compared to $111.9 million during the year ended December 31, 2010.
The impairment loss related to land under development and homes completed and under construction recorded during the year ended December 31, 2011, resulted from (i) in certain projects, a decrease in home sales prices related to increased incentives and (ii) a decrease in sales absorption rates which increased the length of time of the project and increased period costs related to the project. The Company updates project budgets and cash flows of each real estate project on a quarterly basis to determine whether the estimated remaining undiscounted future cash flows of the project are more or less than the carrying amount (net book value) of the asset. If the undiscounted cash flows are more than the net book value of the project, then there is no impairment. If the undiscounted cash flows are less than the net book value of the asset, then the asset is deemed to be impaired and is written-down to its fair value. During the 2011 period, the Company adjusted discount rates to a range of 18% to 22% from a range of 21% to 29% during the 2010 period. During the 2011 period, the Company decreased discount rates due to (i) a decrease in the Company’s cancellation rate to 18% in the 2011 period from 19% in the 2010 period and (ii) an increase in the number of homes in backlog to 139 homes as of December 31, 2011 compared to 84 homes as of December 31, 2010.
The Company engaged a third-party valuation firm to assist with the analysis of the fair value of the entity, and respective assets and liabilities in connection with its reorganization. Since the valuation was completed near December 31, 2011, management used such valuation to evaluate the book value as of December 31, 2011.
The impairment loss related to land under development and homes completed and under construction incurred during the year ended December 31, 2010, resulted from (i) a decrease in certain projects in home sales prices related to increased incentives, (ii) increased future costs in certain projects for outside broker expense and sales and marketing expense, (iii) the decision by the Company in certain projects to cancel certain land option agreements to purchase lots in projects where sales were deteriorating and the underlying value of the land to be purchased was less than the purchase price using a residual land value approach, (iv) the need in certain projects to preserve the liquidity of the Company and, therefore, canceling certain land option agreements, and (v) the renegotiations in certain other projects of the land purchase schedule for land under option, to delay the required purchases, to allow markets to recover, and reduce the amount of lots to be purchased over time. The extended time of the projects increased carrying costs that lead to the future undiscounted cash flows of the projects being less than the current book value of the land. During the 2010 period, the Company increased discount rates to a range of 21% to 29%. These rates resulted from a full year of interest incurred on the Senior Secured Term Loan due 2014, or the Old Term Loan, of 14%. During the 2009 period, the Company increased the discount rates used in the estimated discounted cash flow assessments to a range of 19% to 27%. These rates resulted from an increase in the leverage component of our discount rate related to the interest cost on the Old Term Loan and a decrease in risk-related discount rates in California projects due to improving market conditions, including: (i) a decrease in the cancellation rate for the Company at 19% in the 2010 period compared to 21% in the 2009 period, (ii) an increase of 1.9% in the Company’s gross margin percentage and (iii) an increase in the number of net home orders per sale location from 34.8 in the 2009 period to 36.1 in the 2010 period.
The impairment loss related to land held for future development or sold incurred during the years ended December 31, 2011 and 2010, resulted from the reduced value of the land in the project. The Company values land held for future development using (i) projected cash flows with the strategy of selling the land on a finished or unfinished basis, or building out the project, (ii) considering recent, legitimate offers received, and (iii) prices for land in recent comparable sales transactions, among other factors. In addition, the Company may use appraisals to best determine the as-is value. The Company continues to evaluate land values to determine whether to hold for development or to sell at current prices, which may lead to additional impairment on real estate assets.
66
Table of Contents
Sales and Marketing Expenses
| Year Ended December 31, | Increase (Decrease) | |||||||||||||||
| 2011 | 2010 | Amount | % | |||||||||||||
| (Dollars in thousands) | ||||||||||||||||
Sales and Marketing Expenses | ||||||||||||||||
Homebuilding | ||||||||||||||||
Southern California | $ | 8,480 | $ | 12,582 | $ | (4,102 | ) | (33 | )% | |||||||
Northern California | 4,227 | 4,247 | (20 | ) | 0 | % | ||||||||||
Arizona | 1,318 | 1,207 | 111 | 9 | % | |||||||||||
Nevada | 2,823 | 1,710 | 1,113 | 65 | % | |||||||||||
|
|
|
|
|
| |||||||||||
Total | $ | 16,848 | $ | 19,746 | $ | (2,898 | ) | (15 | )% | |||||||
|
|
|
|
|
| |||||||||||
Sales and marketing expenses decreased $2.9 million to $16.8 million in the 2011 period from $19.7 million in the 2010 period primarily due to a decrease of $1.5 million in direct selling expenses, including a decrease of $1.3 million in salaries and commissions paid in 2011 as compared to 2010, and a decrease of $0.3 million in seller closing costs and referral fees in 2011 as compared to 2010 due to the decrease in units closed in 2011 as compared to 2010. In addition, advertising costs decreased $1.0 million, due to the opening of fewer new model complexes in 2011 as compared to 2010. Sales and marketing expenses as a percentage of homebuilding revenue remained relatively consistent at 8.1% and 7.4% for the period ended December 31, 2011 and 2010, respectively, as there was a decrease in both sales and marketing expenses and homebuilding revenues.
General and Administrative Expenses
| Year Ended December 31, | Increase (Decrease) | |||||||||||||||
| 2011 | 2010 | Amount | % | |||||||||||||
| (Dollars in thousands) | ||||||||||||||||
General and Administrative Expenses | ||||||||||||||||
Homebuilding | ||||||||||||||||
Southern California | $ | 3,665 | $ | 5,093 | $ | (1,428 | ) | (28 | )% | |||||||
Northern California | 1,388 | 2,960 | (1,572 | ) | (53 | )% | ||||||||||
Arizona | 1,884 | 2,568 | (684 | ) | (27 | )% | ||||||||||
Nevada | 2,349 | 2,651 | (302 | ) | (11 | )% | ||||||||||
Corporate | 13,125 | 11,857 | 1,268 | 11 | % | |||||||||||
|
|
|
|
|
| |||||||||||
Total | $ | 22,411 | $ | 25,129 | $ | (2,718 | ) | (11 | )% | |||||||
|
|
|
|
|
| |||||||||||
General and administrative expenses decreased $2.7 million, or 11%, in the 2011 period to $22.4 million from $25.1 million in the 2010 period. In 2010, the Company incurred $2.1 million in outside services expense in connection with the Old Term Loan, which is included in general and administrative expenses. In addition to the $2.1 million decrease in general and administrative expenses relating to outside services in connection with the Old Term Loan, the additional decrease in general and administrative expenses in 2011 reflects the Company’s overhead costs savings measures taken during the year. The bonus expense incurred in the 2010 and 2011 periods was a decision by management to award bonuses to employees in order to encourage employee retention and reward individual employee performance. General and administrative expense as a percentage of homebuilding revenue increased slightly to 10.8% for the period ended December 31, 2011 from 9.4% for the period ended December 31, 2010, as there was a decrease in both general and administrative expenses and homebuilding revenues.
67
Table of Contents
Other Items
Other operating costs increased to $4.0 million in the 2011 period compared to $2.7 million in the 2010 period. The increase is due to the increase in property tax expense incurred as a period expense on projects in which development was temporarily suspended. The Company incurred $1.8 million in the 2011 period, compared to $1.6 million in the 2010 period. In addition, operating losses realized by golf course operations decreased to $1.0 million in the 2011 period from $1.1 million in the 2010 period.
Equity in income from unconsolidated joint ventures increased to $3.6 million in the 2011 period compared to income of $0.9 million in the 2010 period, primarily due to the sale of the Company’s interest in one of its unconsolidated joint ventures.
During 2010, the Company redeemed $37.3 million principal amount of its then outstanding 7 5/8% Senior Notes due 2012, 10 3/4% Senior Notes due 2013 and 7 1/2% Senior Notes due 2014, or collectively, the Old Senior Notes, at a cost of $31.3 million, plus accrued interest. The net gain resulting from the redemptions, after giving effect to amortization of related deferred loan costs, was $5.6 million. During 2011, the Company did not redeem any of its outstanding Old Senior Notes.
During the year ended December 31, 2011, the Company incurred interest related to its outstanding debt of $61.4 million and capitalized $36.9 million, resulting in net interest expense of $24.5 million. During the year ended December 31, 2010, the Company incurred interest related to its outstanding debt of $62.8 million and capitalized $39.1 million, resulting in net interest expense of $23.7 million. The year over year increase in net interest expense is due to a decrease in real estate assets which qualify for interest capitalization during the 2011 period.
Other income primarily consists of marketing services and human resource management income slightly offset by mortgage company expense. During the 2011 period, the Company had income of $0.8 million compared to a negligible amount in the 2010 period.
Income from noncontrolling interest of consolidated entities decreased to $0.4 million in the 2011 period compared to $1.3 million in the 2010 period, primarily due to a decrease in the number of joint venture homes closed.
Income Taxes
On November 6, 2009, an expanded carry back election was signed into law as part of the Worker, Homeownership, and Business Assistance Act of 2009. As a result of this legislation, the Company elected to carry back for five years the taxable losses generated in 2009. As of December 31, 2009, the Company recorded an income tax refund receivable and the related income tax benefit of $101.8 million. The Company received the tax refund during the first quarter of 2010. As of December 31, 2010, the Company received an additional refund related to the 2009 loss carry back of $347,000 and recorded the related income tax benefit as of December 31, 2010. In 2011, the Company only paid $10,000 in minimum tax payments for the year.
Net (Loss) Income Attributable to William Lyon Homes
As a result of the foregoing factors, net loss for the year ended December 31, 2011 was $193.3 million compared to net loss for the year ended December 31, 2010 of $136.8 million.
68
Table of Contents
Lots Owned and Controlled
The table below summarizes the Company’s lots owned and controlled as of the periods presented:
| December 31, | Increase (Decrease) | |||||||||||||||
| 2011 | 2010 | Amount | % | |||||||||||||
Lots Owned | ||||||||||||||||
Southern California | 713 | 922 | (209 | ) | (23 | )% | ||||||||||
Northern California | 767 | 616 | 151 | 25 | % | |||||||||||
Arizona | 6,194 | 5,836 | 358 | 6 | % | |||||||||||
Nevada | 2,676 | 2,791 | (115 | ) | (4 | )% | ||||||||||
|
|
|
|
|
| |||||||||||
Total | 10,350 | 10,165 | 185 | 2 | % | |||||||||||
|
|
|
|
|
| |||||||||||
Lots Controlled(1) | ||||||||||||||||
Southern California | 114 | 114 | — | — | ||||||||||||
Northern California | — | 303 | (303 | ) | (100 | )% | ||||||||||
|
|
|
|
|
| |||||||||||
Total | 114 | 417 | (303 | ) | (73 | )% | ||||||||||
|
|
|
|
|
| |||||||||||
Total Lots Owned and Controlled | 10,464 | 10,582 | 118 | 1 | % | |||||||||||
|
|
|
|
|
| |||||||||||
| (1) | Lots controlled may be purchased by the Company as consolidated projects or may be purchased by newly formed unconsolidated joint ventures. |
Total lots owned and controlled has increased 1% to 10,464 lots owned and controlled at December 31, 2011 from 10,582 lots at December 31, 2010. The increase is primarily due to certain lot acquisitions during the period, offset by the closing of 614 homes during the 2011 period and cancelation of certain lot option contracts.
Financial Condition and Liquidity
During 2012, the Company has experienced an overall improvement in all of its markets, with an increase in sales absorption rates, an increase in net sales prices, backlog units and an improvement in gross margins. Previous negative trends seem to be improving including (i) stabilizing unemployment rates, which correlate to improved consumer confidence, (ii) decreasing foreclosure activity with decreasing volumes of shadow inventory, (iii) sustained historically low mortgage rates, which is leading to increased homebuyer demand, as well as (iv) better overall economic conditions. The Company continues to optimize on the momentum of the last two quarters and the signs of recovery by increasing prices where appropriate and reducing incentives. These trends are shown in our year over year results for the year ended December 31, 2012. During the year ended December 31, 2012, the Company recorded a 69% increase in net new home orders compared to the year ended December 31, 2011. In addition, the number of homes closed on a consolidated basis, increased 55% during the year ended December 31, 2012 compared to the year ended December 31, 2011, and the backlog of homes sold but not closed increased 192% from December 31, 2011 to December 31, 2012.
During the year ended December 31, 2012, the Company’s markets improved significantly in sales absorption rates, new home orders per average sales location and cancellation rates.
| • | In Southern California, net new home orders per average sales location increased 39% to 41.8 during the year ended December 31, 2012 from 30.1 for the same period in 2011. The cancellation rate in Southern California decreased to 15% during the year ended December 31, 2012 compared to 24% during the year ended December 31, 2011. |
| • | In Northern California, net new home orders per average sales location increased 71% to 62.7 during the year ended December 31, 2012 from 36.8 for the same period in 2011. In Northern California, the |
69
Table of Contents
cancellation rate increased to 23% during the year ended December 31, 2012 from 18% during the year ended December 31, 2011. |
| • | In Arizona, net new home orders per average sales location increased to 138.3 during the year ended December 31, 2012 from 101.0 for the same period in 2011. In Arizona, the cancellation rate increased to 10% during the year ended December 31, 2012 compared to 7% during the year ended December 31, 2011. |
| • | In Nevada, net new home orders per average sales location increased to 44.7 during the year ended December 31, 2012 from 18.2 during the same period in 2011. In Nevada, the cancellation rate decreased to 14% during the year ended December 31, 2012 from 20% during the year ended December 31, 2011. |
| • | In Colorado, there were nine net new home orders during the period from December 7, 2012 through December 31, 2012 with no comparable amount during the year ended December 31, 2011. As of December 31, 2012, Colorado had five sales locations during the period from December 7, 2012 (date of acquisition) through December 31, 2012. In Colorado, the cancellation rate was 10% during the period from December 7, 2012 through December 31, 2012 with no comparable amount during the year ended December 31, 2011. |
On a consolidated basis, the Company’s cancellation rate decreased to approximately 14% during the year ended December 31, 2012 compared to approximately 18% during the year ended December 31, 2011.
The Company continues to operate cautiously, particularly with the potential impact of (i) upward trending mortgage rates, as the current level of low mortgage rates is not expected to remain in the long-term; (ii) increased costs and standards related to FHA loans, which continue to be a significant source of homebuyer financing; (iii) an increase in the cost of building materials and sub-contractor labor costs; and (iv) an increase in land prices.
The Company continues to review acquisitions of select land positions where it makes strategic and economic sense to do so, targeting finished lots in core coastal markets, near high employment job centers or transportation corridors. In addition, management of the Company is focused on adding to its lots controlled in order to add to community count and position itself for growth in future periods. Management also continues to evaluate owned lots and land parcels to determine if values support holding the parcels for future projects or selling projects at current values.
On February 24, 2012, the Company received the proceeds from the Plan as discussed elsewhere herein. The Company received $50.0 million in cash related to the issuance of its Convertible Preferred Stock, $10.0 million related to the issuance of its Class C Common Stock, $21.0 million in cash and $4.0 million of land option value related to the assignment of an option to purchase certain real estate, related to the issuance of its Class B Common Stock, offset by certain fees and payments related to the Plan, for a net of $67.7 million in cash. The Plan allowed the Company to restructure its debt from $563.5 million as of December 31, 2011, to $384.5 million principal outstanding as of February 24, 2012, which subsequently reduces the Company’s interest exposure.
In June 2012, the Company consummated a transaction with Colony Capital which added over 1,000 lots, eight selling communities, and $21.5 million of inventory for $11 million in cash and $10.5 million in equity. In October 2012, the Company raised $30.0 million through the issuance of (i) 15,238,095 shares of Class A Common Stock, for $16,000,000 in cash and (ii) 12,173,913 shares of the Company’s Convertible Preferred Stock, for $14,000,000 in cash. In addition, the Company refinanced its outstanding debt with 8.5% Senior Notes due in 2020 as described below, which will reduce the amount of interest incurred by $6.4 million annually.
The Company provides for its ongoing cash requirements with the proceeds identified above, as well as from internally generated funds from the sales of homes and/or land sales. During the successor period from
70
Table of Contents
February 25, 2012 through December 31, 2012, the Company had cash flows provided by operations of $50.0 million. In addition, the Company has the option to use additional outside borrowings, form new joint ventures with venture partners that provide a substantial portion of the capital required for certain projects, one of which was closed in October 2012, buying land via lot options or land banking arrangements. The Company has financed, and may in the future finance, certain projects and land acquisitions with construction loans secured by real estate inventories, seller-provided financing and land banking transactions. The management of the Company continues to focus on generating positive cash flow, reducing overall debt levels and returning the Company to profitability by growing the Company through additional land acquisitions.
8.5% Senior Notes Due 2020
On November 8, 2012, California Lyon completed its offering of 8.5% Senior Notes due 2020, or the New Notes, in an aggregate principal amount of $325 million. The New Notes were issued at 100% of their aggregate principal amount. The Company used the net proceeds from the sale of the New Notes, together with cash on hand, to refinance the Company’s (i) $235 million 10.25% Senior Secured Term Loan due 2015, (ii) approximately $76 million in aggregate principal amount of 12% Senior Subordinated Secured Notes due 2017, (iii) approximately $11 million in principal amount of project related debt, and (iv) to pay accrued and unpaid interest thereon.
As of December 31, 2012, the outstanding principal amount of the New Notes is $325 million, and the New Notes mature on November 15, 2020. The New Notes are senior unsecured obligations of California Lyon and are unconditionally guaranteed on a senior subordinated secured basis by Parent and by certain of Parent’s existing and future restricted subsidiaries. The New Notes and the guarantees rank senior to all of California Lyon’s and the guarantors’ existing and future unsecured senior debt and senior in right of payment to all of California Lyon’s and the guarantors’ future subordinated debt. The New Notes and the guarantees are and will be effectively junior to any of California Lyon’s and the guarantors’ existing and future secured debt.
The New Notes bear interest at an annual rate of 8.5%��per annum and will be payable semiannually in arrears on May 15 and November 15, commencing on May 15, 2013.
The indenture contains covenants that limit the ability of the Company and its restricted subsidiaries to, among other things: (i) incur or guarantee certain additional indebtedness; (ii) pay dividends or make other distributions or repurchase stock; (iii) make certain investments; (iv) sell assets; (v) incur liens; (vi) enter into agreements restricting the ability of the Company’s restricted subsidiaries to pay dividends or transfer assets; (vii) enter into transactions with affiliates; (viii) create unrestricted subsidiaries; and (viii) consolidate, merge or sell all or substantially all of the Company’s and California Lyon’s assets. These covenants are subject to a number of important exceptions and qualifications as described in the Indenture. The Indenture also provides for events of default which, if any of them occurs, would permit or require the principal of and accrued interest on such New Notes to be declared due and payable.
Construction Notes Payable
In September 2012, the Company entered into two construction notes payable agreements. The first agreement has total availability under the facility of $19.0 million, to be drawn for land development and construction on one of its wholly-owned projects. The loan matures in September 2015 and bears interest at the prime rate + 1.0%, with a rate floor of 5.0%. As of December 31, 2012, the Company had borrowed $7.8 million under this facility. The loan will be repaid with proceeds from home closings of the project and is secured by the underlying project. The second construction notes payable agreement has total availability under the facility of $17.0 million, to be drawn for land development and construction on one of its joint venture projects. The loan matures in March 2015 and bears interest at prime rate + 1%, with a rate floor of 5.0%. As of December 31, 2012, the Company had borrowed $5.4 million under this facility. The loan will be repaid with proceeds from home closings of the project and is secured by the underlying project.
71
Table of Contents
Net Debt to Total Capital
The Company’s ratio of net debt to total capital was 65.0% as of December 31, 2012.The ratio of net debt to total capital is a non-GAAP financial measure, which is calculated by dividing notes payable and Senior Notes, net of cash and cash equivalents and restricted cash, by total capital (notes payable and Senior Notes, net of cash and cash equivalents and restricted cash, plus redeemable convertible preferred stock and total equity (deficit)). The Company believes this calculation is a relevant and useful financial measure to investors in understanding the leverage employed in its operations, and may be helpful in comparing the Company with other companies in the homebuilding industry to the extent they provide similar information. See table set forth below reconciling this non-GAAP measure to the ratio of debt to total capital.
| Successor | Predecessor | |||||||||
| December 31, | ||||||||||
| 2012 | 2011 | |||||||||
| (dollars in thousands) | ||||||||||
Notes payable and Senior Notes | $ | 338,248 | $ | 563,492 | ||||||
Redeemable convertible preferred stock | 71,246 | — | ||||||||
Total equity (deficit) | 72,119 | (169,870 | ) | |||||||
|
|
|
| |||||||
Total capital | $ | 481,613 | $ | 393,622 | ||||||
Ratio of debt to total capital | 70.2 | % | 143.2 | % | ||||||
Notes payable and Senior Notes | $ | 338,248 | $ | 563,492 | ||||||
Less: Cash and cash equivalents and restricted cash | (71,928 | ) | (20,913 | ) | ||||||
|
|
|
| |||||||
Net debt | 266,320 | 542,579 | ||||||||
Redeemable convertible preferred stock | 71,246 | — | ||||||||
Total equity (deficit) | 72,119 | (169,870 | ) | |||||||
|
|
|
| |||||||
Total capital | $ | 409,685 | $ | 372,709 | ||||||
Ratio of net debt to total capital | 65.0 | % | 145.6 | % | ||||||
Land Banking Arrangements
As a method of acquiring land in staged takedowns, thereby minimizing the use of funds from the Company’s available cash or other corporate financing sources and limiting the Company’s risk, the Company transfers its right in such purchase agreements to entities owned by third parties, or land banking arrangements. These entities use equity contributions and/or incur debt to finance the acquisition and development of the land being purchased. The entities grant the Company an option to acquire lots in staged takedowns. In consideration for this option, the Company makes a non-refundable deposit of 15% to 25% of the total purchase price. The Company is under no obligation to purchase the balance of the lots, but would forfeit remaining deposits and could be subject to penalties if the lots were not purchased. The Company does not have legal title to these entities or their assets and has not guaranteed their liabilities. These land banking arrangements help the Company manage the financial and market risk associated with land holdings. The use of these land banking arrangements is dependent on, among other things, the availability of capital to the option provider, general housing market conditions and geographic preferences.
The Company participates in one land banking arrangement that is not a variable interest entity in accordance with FASB ASC Topic 810,Consolidation, (“ASC 810”), but is consolidated in accordance with FASB ASC Topic 470,Debt, (“ASC 470”).Under the provisions of ASC 470, the Company has determined it is economically compelled, based on certain factors, to purchase the land in the land banking arrangement. Therefore, the Company has recorded the remaining purchase price of the land of $39.0 million as of December 31, 2012, which is included in real estate inventories not owned and liabilities from inventories not owned in the accompanying balance sheet.
72
Table of Contents
Summary information with respect to the Company’s land banking arrangements is as follows as of the periods presented (dollars in thousands):
| Successor |
| Predecessor | ||||||||
| December 31, | ||||||||||
| 2012 |
| 2011 | ||||||||
Total number of land banking projects | 1 | 1 | ||||||||
|
|
|
|
| ||||||
Total number of lots (1) | 610 | 625 | ||||||||
|
|
|
|
| ||||||
Total purchase price | $ | 161,465 | $ | 161,465 | ||||||
|
|
|
|
| ||||||
Balance of lots still under option and not purchased: | ||||||||||
Number of lots | 199 | 225 | ||||||||
|
|
|
|
| ||||||
Purchase price | $ | 39,029 | $ | 47,408 | ||||||
|
|
|
|
| ||||||
Forfeited deposits if lots are not purchased | $ | 27,734 | $ | 25,234 | ||||||
|
|
|
|
| ||||||
| (1) | Total number of lots in the land banking project was reduced by 15 as of December 31, 2012 as compared to December 31, 2011 because of a change in product mix in future projects. |
Joint Venture Financing
The Company and certain of its subsidiaries are general partners or members in joint ventures involved in the development and sale of residential projects. As described more fully in Critical Accounting Policies—Variable Interest Entities, certain joint ventures have been determined to be variable interest entities in which the Company is considered the primary beneficiary. Accordingly, the assets, liabilities and operations of these joint ventures have been consolidated with the Company’s financial statements for the periods presented. The financial statements of joint ventures in which the Company is not considered the primary beneficiary are not consolidated with the Company’s financial statements. The Company’s investments in unconsolidated joint ventures are accounted for using the equity method because the Company has a 50% or less voting or economic interest (and thus such joint ventures are not controlled by the Company). Based upon current estimates, substantially all future development and construction costs incurred by the joint ventures will be funded by the venture partners or from the proceeds of construction financing obtained by the joint ventures.
As of December 31, 2012 and 2011, the Company’s had no investment in and advances to unconsolidated joint ventures.
Assessment District Bonds
In some jurisdictions in which the Company develops and constructs property, assessment district bonds are issued by municipalities to finance major infrastructure improvements and fees. Such financing has been an important part of financing master-planned communities due to the long-term nature of the financing, favorable interest rates when compared to the Company’s other sources of funds and the fact that the bonds are sold, administered and collected by the relevant government entity. As a landowner benefited by the improvements, the Company is responsible for the assessments on its land. When the Company’s homes or other properties are sold, the assessments are either prepaid or the buyers assume the responsibility for the related assessments. See Note 15 of “Notes to Consolidated Financial Statements” for the year ended December 31, 2012.
Cash Flows — Comparison of Year Ended December 31, 2012 to Year Ended December 31, 2011
For the comparison of the Successor entity from February 25, 2012 through December 31, 2012 and the Predecessor entity for the year ended December 31, 2011, the comparison of cash flows is as follows:
| • | Net cash provided by (used in) operating activities increased to a source of $50.0 million in the 2012 period from a use of $38.7 million in the 2011 period. The change was primarily a result of (i) a net |
73
Table of Contents
decrease in real estate inventories-owned of $30.3 million in the 2012 period compared to a net decrease of $18.2 million in the 2011 period, primarily driven by the increase in homes closed in the 2012 period as compared to the 2011 period, (ii) a decrease in other assets of $0.6 million in the 2012 period compared to an increase of $4.4 million in the 2011 period attributable to insurance premiums payments and the related amortization expense, (iii) an increase in accounts payable of $7.7 million in the 2012 period compared to a decrease of $1.5 million in the 2011 period attributed to the timing of payments to subcontractors, and (iv) consolidated net loss of $192.9 million in the 2011 period compared to consolidated net loss of $6.9 million in the 2012 period, and (v) an increase in receivables of $2.9 million in the 2012 period compared to a decrease of $4.8 million in the 2011 period primarily attributable to the timing of proceeds received from escrow for home closings. |
| • | Net cash (used in) provided by investing activities decreased to a use of $33.5 million in the 2012 period from a source of $1.3 million in the 2011 period. The change was primarily a result of (i) net cash paid of $33.2 million related to the acquisition of a homebuilder in Colorado, known as Village Homes, with no comparable amount in the 2011 period, and (ii) distributions of income from unconsolidated joint ventures of $1.4 million in the 2011 period with no distributions of income from unconsolidated joint ventures in the 2012 period. |
| • | Net cash (used in) provided by financing activities increased to a use of $25.9 million in the 2012 period from a use of $13.9 million in the 2011 period. The change was primarily as a result of (i) principal payments on notes payable of $73.7 million in the 2012 period from $11.5 million in the 2011 period, (ii) principal payments on Senior Secured Term Loan of $235.0 million in the 2012 period with no comparable amount in the 2011 period, (iii) principal payments on Senior Subordinated Secured Notes of $75.9 million in the 2012 period with no comparable amount in the 2011 period, and (iv) payment of deferred loan costs of $7.2 million in the 2012 period with no comparable amount in the 2011 period, offset by (v) proceeds from borrowings on notes payable of $13.2 million in the 2012 period with no comparable amount in the 2011 period, (vi) proceeds from issuance of 8½% Senior Notes of $325.0 million with no comparable amount in the 2011 period, (vii) proceeds from issuance of convertible preferred stock of $14.0 million related to the issuance of 12,173,913 shares of the company’s convertible preferred stock to Paulson & Co in the 2012 period with no comparable amount in the 2011 period, and (viii) proceeds from issuance of common stock of $16.0 million related to the issuance of 15,238,095 shares of the company’s common stock to Paulson & Co in the 2012 period with no comparable amount in the 2011 period. |
For the comparison of the Predecessor entity from January 1, 2012 through February 24, 2012 and the Predecessor entity for the year ended December 31, 2011, the comparison of cash flows is as follows:
| • | Net cash used in operating activities decreased to a use of $17.3 million in the 2012 period from a use of $38.7 million in the 2011 period. The change was primarily a result of (i) equity in income of unconsolidated joint ventures of $3.6 million in the 2011 period due to the final cash distribution and related allocation of income from unconsolidated joint ventures with no comparable amount in the 2012 period, (ii) a decrease in other assets of $0.2 million in the 2012 period compared to an increase of $4.4 million in the 2011 period attributable to insurance premiums paid and the related amortization expense, (iii) an increase in accounts payable of $4.6 million in the 2012 period compared to a decrease of $1.5 million in the 2011 period attributed to the timing of payments to subcontractors, and (iv) consolidated net income of $228.5 million in the 2012 period compared to consolidated net loss of $192.9 million in the 2011 period, offset by (v) impairment loss on real estate assets of $128.3 million in the 2011 period with no comparable amount in the 2012 period, (vi) net reorganization items of $241.3 million in the 2012 period with no comparable amount in the 2011 period and (vii) a decrease in receivables of $0.9 million in the 2012 period compared to a decrease of $4.8 million in the 2011 period primarily attributable to the timing of proceeds received from escrow for home closings, (viii) an increase in real estate inventories-owned of $7.0 million in the 2012 period compared to an a decrease of $18.2 million in the 2011 period, primarily driven by fewer homes closed in the 2012 |
74
Table of Contents
period as compared to the 2011 period, and (iv) a decrease in accrued expenses of $3.9 million in the 2012 period relating to consulting costs incurred related to the restructure that were accrued at the end of 2011, compared to an increase of $7.8 million in the 2011 period. |
| • | Net cash (used in) provided by investing activities decreased to zero in the 2012 period from a source of $1.3 million in the 2011 period. The change was primarily a result of distributions of income from unconsolidated joint ventures of $1.4 million in the 2011 period with no distributions of income from unconsolidated joint ventures in the 2012 period. |
| • | Net cash provided by (used in) financing activities increased to a source of $77.8 million in the 2012 period from a use of $13.9 million in the 2011 period. The change was primarily as a result of (i) proceeds from preferred stock of $50.0 million in the 2012 period with no comparable amount in the 2011 period, (ii) proceeds from reorganization of $31.0 million in the 2012 period with no comparable amount in the 2011 period and (iii) a decrease in principal payments on notes payable to $0.6 million in the 2012 period from $11.5 million in the 2011 period. |
Based on the aforementioned, the Company believes they have sufficient cash and sources of financing for at least the next twelve months.
Cash Flows—Comparison of Years Ended December 31, 2011 and 2010
Net cash (used in) provided by operating activities decreased to a use of $38.7 million in the 2011 period from a source of $24.1 million in the 2010 period. The change was primarily a result of (i) a decrease in income tax refunds receivable of $107.4 million in the 2010 period relating to refunds received for the 2009 loss carry back, with no comparable amount in the 2011 period, (ii) a decrease in real estate inventories-owned of $18.2 million in the 2011 period compared to an increase of $66.3 million in the 2010 period, primarily driven by fewer homes under construction relative to the number of homes closings in the 2011 period as compared to the 2010 period, (iii) a decrease in accounts payable of $1.5 million in the 2011 period compared to a decrease of $4.1 million in the 2010 period due to the timing of payments to subcontractors, (iv) an increase in accrued expenses of $7.8 million in the 2011 period compared to a decrease of $3.6 million in the 2010 period primarily related to an increase in accrued interest due to the non-payment of interest in conjunction with the prepackaged joint plan of reorganization as described elsewhere herein, (v) a decrease in receivables of $4.8 million in the 2011 period compared to an increase of $2.2 million in the 2010 period primarily related to the timing of proceeds received from escrow for homes closed and the receipt of property tax refunds, and (vi) consolidated net loss of $192.9 million in the 2011 period compared to consolidated net loss of $135.5 million in the 2010 period, offset by (vii) impairment loss on real estate assets of $128.3 million in the 2011 period compared to $111.9 million in the 2010 period.
Net cash provided by investing activities decreased to a source of $1.3 million in the 2011 period from a source of $3.9 million in the 2010 period. The change was primarily a result of a decrease in distributions of capital from unconsolidated joint ventures to $1.4 million in the 2011 period from $4.2 million in the 2010 period.
Net cash used in financing activities decreased to a use of $13.9 million in the 2011 period from a use of $74.3 million in the 2010 period, primarily as a result of the decrease in net proceeds received from borrowings on notes payable of $7.1 million in the 2010 period with no comparable amount in the 2011 period, a decrease in the net cash paid for the redemption of Old Senior Notes of $31.3 million in the 2010 period, with no comparable amount in the 2011 period and a decrease in the net cash paid for principal payments on notes payable of $11.5 million in the 2011 period, compared to $52.8 million in the 2010 period.
Contractual Obligations and Off-Balance Sheet Arrangements
The Company enters into certain off-balance sheet arrangements including joint venture financing, option agreements, land banking arrangements and variable interests in consolidated and unconsolidated entities. These
75
Table of Contents
arrangements are more fully described above and in Notes 5 and 19 of “Notes to Consolidated Financial Statements.” In addition, the Company is party to certain contractual obligations, including land purchases and project commitments, which are detailed in Note 19 of “Notes to Consolidated Financial Statements.”
The Company’s contractual obligations consisted of the following at December 31, 2012 (in thousands):
| Payments due by period | ||||||||||||||||||||
| Total(1) | Less than 1 year (2013) | 1-3 years (2014-2015) | 3-5 years (2016-2017) | More than 5 years | ||||||||||||||||
Other notes payable | $ | 13,249 | $ | — | $ | 13,249 | $ | — | $ | — | ||||||||||
Other notes payable interest | 1,706 | 662 | 1,044 | — | — | |||||||||||||||
Senior Notes | 325,000 | — | — | — | 325,000 | |||||||||||||||
Senior Notes interest | 219,849 | 27,625 | 55,250 | 55,250 | 81,724 | |||||||||||||||
Operating leases | 7,017 | 1,349 | 1,878 | 1,136 | 2,654 | |||||||||||||||
Surety bonds | 64,400 | 12,571 | 51,723 | 106 | — | |||||||||||||||
Purchase obligations | ||||||||||||||||||||
Land purchases and option commitments(2) | 132,376 | 101,987 | 30,389 | — | — | |||||||||||||||
Project commitments(3) | 60,887 | 13,567 | 47,320 | — | — | |||||||||||||||
|
|
|
|
|
|
|
|
|
| |||||||||||
Total | $ | 824,484 | $ | 157,761 | $ | 200,853 | $ | 56,492 | $ | 409,378 | ||||||||||
|
|
|
|
|
|
|
|
|
| |||||||||||
| (1) | The summary of contractual obligations above includes interest on all interest-bearing obligations. Interest on all fixed rate interest-bearing obligations is based on the stated rate and is calculated to the stated maturity date. Interest on all variable rate interest bearing obligations is based on the rates effective as of December 31, 2012 and is calculated to the stated maturity date. |
| (2) | Represents the Company’s obligations in land purchases, lot option agreements and land banking arrangements. If the Company does not purchase the land under contract, it will forfeit its non-refundable deposit related to the land. |
| (3) | Represents the Company’s homebuilding project purchase commitments for developing and building homes in the ordinary course of business. |
Inflation
The Company’s revenues and profitability may be affected by increased inflation rates and other general economic conditions. In periods of high inflation, demand for the Company’s homes may be reduced by increases in mortgage interest rates. Further, the Company’s profits will be affected by its ability to recover through higher sales prices, increases in the costs of land, construction, labor and administrative expenses. The Company’s ability to raise prices at such times will depend upon demand and other competitive factors.
Critical Accounting Policies
The Company’s financial statements have been prepared in accordance with U.S. generally accepted accounting principles. The preparation of these financial statements requires management to make estimates and judgments that affect the reported amounts of assets and liabilities at the date of the financial statements and the reported amounts of revenues and costs and expenses during the reporting period. On an on-going basis, management evaluates its estimates and judgments, including those which impact its most critical accounting policies. Management bases its estimates and judgments on historical experience and on various other factors that are believed to be reasonable under the circumstances. Actual results may differ from these estimates under different assumptions or conditions. Management believes that the following accounting policies are among the most important to a portrayal of the Company’s financial condition and results of operations and require among the most difficult, subjective or complex judgments:
76
Table of Contents
Consequences of Chapter 11 Cases—Debtor in Possession Accounting
Accounting Standards Codification Topic 852-10-45,Reorganizations-Other Presentation Matters, which is applicable to companies in Chapter 11 proceedings, generally does not change the manner in which financial statements are prepared. However, it does require that the financial statements for the periods subsequent to the filing of the Chapter 11 Cases distinguish transactions and events that are directly associated with the reorganization from the ongoing operations of the business. Amounts that can be directly associated with the reorganization and restructuring of the business must be reported separately as reorganization items in the statement of operations for the year ended December 31, 2011 and all subsequent periods. The balance sheet must distinguish pre-petition liabilities subject to compromise from both those pre-petition liabilities that are not subject to compromise and from post-petition liabilities. Liabilities that may be affected by a plan of reorganization must be reported at the amounts expected to be allowed, even if they may be settled for lesser amounts. In addition, cash provided or used by reorganization items must be disclosed separately in the statement of cash flows. The Company applied ASC 852-10-45 effective on December 19, 2011 and segregated those items as outlined above for the reporting periods subsequent to such date through February 24, 2012.
Fresh Start Accounting
As required by U.S. GAAP, in connection with our emergence from the Chapter 11 Cases, we adopted the fresh start accounting provisions of ASC 852, reorganizations, effective February 24, 2012. Under ASC 852, reorganizations, the reorganization value represents the fair value of the entity before considering liabilities and approximates the amount a willing buyer would pay for the assets of the Company immediately after restructuring. The reorganization value is allocated to the respective fair value of assets. The excess reorganization value over the fair value of the identified tangible and intangible assets is recorded as goodwill. Liabilities, other than deferred taxes, are stated at present values of amounts expected to be paid. Fair values of assets and liabilities represent our best estimates based on our appraisals and valuations. Where the foregoing were not available, industry data and trends or references to relevant market rates and transactions were used. These estimates and assumptions are inherently subject to significant uncertainties and contingencies beyond our reasonable control. Moreover, the market value of our capital stock may differ materially from the fresh start equity valuation.
Real Estate Inventories and Cost of Sales
Real estate inventories are carried at cost net of impairment losses, if any. Real estate inventories consist primarily of deposits to purchase land, raw land, lots under development, homes under construction, completed homes and model homes of real estate projects. All direct and indirect land costs, offsite and onsite improvements and applicable interest and other carrying charges are capitalized to real estate projects during periods when the project is under development. Land, offsite costs and all other common costs are allocated to land parcels benefited based upon relative fair values before construction. Onsite construction costs and related carrying charges (principally interest and property taxes) are allocated to the individual homes within a phase based upon the relative sales value of the homes. The estimation process involved in determining relative fair values and sales values is inherently uncertain because it involves estimates of current market values for land parcels before construction as well as future sales values of individual homes within a phase. The Company’s estimate of future sales values is supported by the Company’s budgeting process. The estimate of future sales values is inherently uncertain because it requires estimates of current market conditions as well as future market events and conditions. Additionally, in determining the allocation of costs to a particular land parcel or individual home, the Company relies on project budgets that are based on a variety of assumptions, including assumptions about construction schedules and future costs to be incurred. It is possible that actual results could differ from budgeted amounts for various reasons, including construction delays, increases in costs which have not yet been committed, or unforeseen issues encountered during construction that fall outside the scope of contracts obtained. While the actual results for a particular construction project are accurately reported over time, a variance between the budget and actual costs could result in the understatement or overstatement of costs and a related impact on gross margins in a specific reporting period. To reduce the potential for such distortion, the Company has set forth procedures which have been
77
Table of Contents
applied by the Company on a consistent basis, including assessing and revising project budgets on a monthly basis, obtaining commitments from subcontractors and vendors for future costs to be incurred, reviewing the adequacy of warranty accruals and historical warranty claims experience, and utilizing the most recent information available to estimate costs. The variances between budget and actual amounts identified by the Company have historically not had a material impact on its consolidated results of operations. Management believes that the Company’s policies provide for reasonably dependable estimates to be used in the calculation and reporting of costs. The Company relieves its accumulated real estate inventories through cost of sales by the budgeted amount of cost of homes sold, as described more fully below in the section entitled “Sales and Profit Recognition.”
Impairment of Real Estate Inventories
The Company accounts for its real estate inventories in accordance with FASB ASC Topic 360,Property, Plant & Equipment. ASC Topic 360 requires impairment losses to be recorded on real estate inventories when indicators of impairment are present and the undiscounted cash flows estimated to be generated by real estate inventories are less than the carrying amount of such assets. Indicators of impairment include a decrease in demand for housing due to softening market conditions, competitive pricing pressures which reduce the average sales price of homes, which includes sales incentives for homebuyers, slowing sales absorption rates, a decrease in home values in the markets in which the Company operates, significant decreases in gross margins and a decrease in project cash flows for a particular project.
For land and land under development, homes completed and under construction and model homes, the Company estimates expected cash flows at the project level by maintaining current budgets using recent historical information and current market assumptions. The Company updates project budgets and cash flows of each real estate project on a quarterly basis to determine whether the estimated remaining undiscounted future cash flows of the project are more or less than the carrying amount (net book value) of the asset. If the undiscounted cash flows are more than the net book value of the project, then there is no impairment. If the undiscounted cash flows are less than the net book value of the asset, then the asset is deemed to be impaired and is written-down to its fair value. Fair value represents the amount at which an asset could be bought or sold in a current transaction between willing parties (i.e., other than a forced or liquidation sale). Management determines the estimated fair value of each project by determining the present value of estimated future cash flows at discount rates that are commensurate with the risk of each project. The estimation process involved in determining if assets have been impaired and in the determination of fair value is inherently uncertain because it requires estimates of future revenues and costs, current market yields as well as future events and conditions. As described more fully above in the section entitled “Real Estate Inventories and Cost of Sales,” estimates of revenues and costs are supported by the Company’s budgeting process.
Under FASB ASC Topic 360, the Company is required to make certain assumptions to estimate undiscounted future cash flows of a project, which include: (i) estimated sales prices, including sales incentives, (ii) anticipated sales absorption rates and sales volume, (iii) project costs incurred to date and the estimated future costs of the project based on the project budget, (iv) the carrying costs related to the time a project is actively selling until it closes the final unit in the project, and (v) alternative strategies including selling the land to a third-party or temporarily suspending development on the project. Each project has different assumptions and is based on management’s assessment of the current market conditions that exist in each project location. Interest incurred allocated to each project is included in future cash flows at effective borrowing rates of 11% for the reporting periods ended March 31, June 30, September 30 and December 31, 2012, which would yield discount rates of 21% to 29% for the 2012 period. Interest incurred allocated to each project is included in future cash flows at effective borrowing rates of 11% for the reporting periods ended March 31, June 30, September 30 and December 31, 2011, which would yield discount rates of 21% to 29% for the 2011 period. Interest allocated to each project for cash flows in 2013 and beyond is 8.75% based on the Company’s current capital structure.
The assumptions and judgments used by the Company in the estimation process to determine the future undiscounted cash flows of a project and its fair value are inherently uncertain and require a substantial degree of
78
Table of Contents
judgment. The realization of the Company’s real estate inventories is dependent upon future uncertain events and market conditions. Due to the subjective nature of the estimates and assumptions used in determining the future cash flows of a project, the continued decline in the current housing market, the uncertainty in the banking and credit markets, actual results could differ materially from current estimates.
These estimates are dependent on specific market or sub-market conditions for each subdivision. While the Company considers available information to determine what it believes to be its best estimates as of the end of a reporting period, these estimates are subject to change in future reporting periods as facts and circumstances change. Local market-specific conditions that may impact these estimates for a subdivision include:
| • | historical subdivision results, and actual operating profit, base selling prices and home sales incentives; |
| • | forecasted operating profit for homes in backlog; |
| • | the intensity of competition within a market or sub-market, including publicly available home sales prices and home sales incentives offered by our competitors; |
| • | increased levels of home foreclosures; |
| • | the current sales pace for active subdivisions; |
| • | subdivision specific attributes, such as location, availability of lots in the sub-market, desirability and uniqueness of subdivision location and the size and style of homes currently being offered; |
| • | changes by management in the sales strategy of a given subdivision; and |
| • | current local market economic and demographic conditions and related trends and forecasts. |
These and other local market-specific conditions that may be present are considered by personnel in the Company’s homebuilding divisions as they prepare or update the forecasted assumptions for each subdivision. Quantitative and qualitative factors other than home sales prices could significantly impact the potential for future impairments. The sales objectives can differ among subdivisions, even within a given sub-market. For example, facts and circumstances in a given subdivision may lead the Company to price its homes with the objective of yielding a higher sales absorption pace, while facts and circumstances in another subdivision may lead the Company to price its homes to minimize deterioration in home gross margins, even though this could result in a slower sales absorption pace. Furthermore, the key assumptions included in estimated future undiscounted cash flows may be interrelated. For example, a decrease in estimated base sales price or an increase in home sales incentives may result in a corresponding increase in sales absorption pace. Additionally, a decrease in the average sales price of homes to be sold and closed in future reporting periods for one subdivision that has not been generating what management believes to be an adequate sales absorption pace may impact the estimated cash flow assumptions of a nearby subdivision. Changes in key assumptions, including estimated construction and land development costs, absorption pace, selling strategies or discount rates could materially impact future cash flow and fair value estimates. Due to the number of possible scenarios that would result from various changes in these factors, the Company does not believe it is possible to develop a sensitivity analysis with a level of precision that would be meaningful to an investor.
Management assesses land deposits for impairment when estimated land values are deemed to be less than the agreed upon contract price. The Company considers changes in market conditions, the timing of land purchases, the ability to renegotiate with land sellers the terms of the land option contract in question, the availability and best use of capital, and other factors. If land values are determined to be less than the contract price, the future project will not be purchased. The Company records abandoned land deposits and related pre-acquisition costs to cost of sales-land in the consolidated statement of operations in the period that it is abandoned.
79
Table of Contents
The following table summarizes inventory impairment charges recorded during the period from February 25, 2012 through December 31, 2012, the period from January 1, 2012 through February 24, 2012, and the years ended December 31, 2011 and 2010:
| Successor | Predecessor | |||||||||||||||||
| Period from February 25 through December 31, 2012 |
| Period from January 1 through February 24, 2012 | Year Ended December 31, | |||||||||||||||
| 2011 | 2010 | |||||||||||||||||
| (dollars in thousands) | ||||||||||||||||||
Inventory impairments related to: | ||||||||||||||||||
Land under development and homes completed and under construction | $ | — | $ | — | $ | 34,835 | $ | 80,197 | ||||||||||
Land held for future development or sold | — | — | 93,479 | 31,663 | ||||||||||||||
|
|
|
|
|
|
|
| |||||||||||
Total inventory impairments | $ | — | $ | — | $ | 128,314 | $ | 111,860 | ||||||||||
|
|
|
|
|
|
|
| |||||||||||
Number of projects impaired during the year | — | — | 16 | 14 | ||||||||||||||
|
|
|
|
|
|
|
| |||||||||||
Number of projects assessed for impairment during the year | — | — | 42 | 73 | ||||||||||||||
|
|
|
|
|
|
|
| |||||||||||
The Company evaluates homebuilding assets for impairment when indicators of impairments are present. Indicators of potential impairment include, but are not limited to, a decrease in housing market values, sales absorption rates, and sales prices. On February 24, 2012, the Company adopted fresh start accounting under ASC 852,Reorganizations, and recorded all real estate inventories at fair value. For the year ended December 31, 2012, there were no impairment charges recorded.
During the year ended December 31, 2011, the Company recorded impairment loss on real estate assets of $128.3 million, compared to $111.9 million during the year ended December 31, 2010.
During the year ended December 31, 2011, impairment loss related to land under development and homes completed and under construction resulted from projected cash flows with the strategy of selling the lots on a finished or unfinished basis, or building out the project. During the 2011 period, the Company adjusted discount rates to a range of 18% to 22%, which were also validated by the third party valuation firm, discussed below.
The Company engaged a third-party valuation firm to assist with the analysis of the fair value of the entity, and respective assets and liabilities in connection with its reorganization. Since the valuation was completed near December 31, 2011, management used such valuation to evaluate the book value as of December 31, 2011.
These charges were included in impairment loss on real estate assets in the accompanying consolidated statements of operations. The impairment charges recorded during the periods noted above stemmed from lower home prices which were driven by increased incentives and discounts resulting from weakened demand experienced during 2007 through 2011.
Sales and Profit Recognition
A sale is recorded and profit recognized when a sale is consummated, the buyer’s initial and continuing investments are adequate, any receivables are not subject to future subordination, and the usual risks and rewards of ownership have been transferred to the buyer in accordance with the provisions of FASB ASC Topic 976-605-25,Real Estate. When it is determined that the earnings process is not complete, profit is deferred for recognition in future periods. The profit recorded by the Company is based on the calculation of cost of sales which is dependent on the Company’s allocation of costs which is described in more detail above in the section entitled “Real Estate Inventories and Cost of Sales.”
80
Table of Contents
Variable Interest Entities
The Company accounts for variable interest entities in accordance with ASC 810,Consolidation (“ASC 810”). Under ASC 810, a variable interest entity (“VIE”) is created when: (a) the equity investment at risk in the entity is not sufficient to permit the entity to finance its activities without additional subordinated financial support provided by other parties, including the equity holders; (b) the entity’s equity holders as a group either (i) lack the direct or indirect ability to make decisions about the entity, (ii) are not obligated to absorb expected losses of the entity or (iii) do not have the right to receive expected residual returns of the entity; or (c) the entity’s equity holders have voting rights that are not proportionate to their economic interests, and the activities of the entity involve or are conducted on behalf of the equity holder with disproportionately few voting rights. If an entity is deemed to be a VIE pursuant to ASC 810, the enterprise that has both (i) the power to direct the activities of a VIE that most significantly impact the entity’s economic performance and (ii) the obligation to absorb the expected losses of the entity or right to receive benefits from the entity that could be potentially significant to the VIE is considered the primary beneficiary and must consolidate the VIE. In accordance with ASC 810, we perform ongoing reassessments of whether an enterprise is the primary beneficiary of a VIE.
As of December 31, 2012, the Company had two joint ventures which were deemed to be VIEs. The Company manages the joint ventures, by using its sales, development and operations teams and has significant control over these projects and therefore the power to direct the activities that most significantly impact the joint venture’s performance in addition to being obligated to absorb expected losses or receive benefits from the joint venture, and therefore the Company is deemed to be the primary beneficiary of these VIEs.
Under ASC 810, a non-refundable deposit paid to an entity is deemed to be a variable interest that will absorb some or all of the entity’s expected losses if they occur. Our land purchase and lot option deposits generally represent our maximum exposure to the land seller if we elect not to purchase the optioned property. In some instances, we may also expend funds for due diligence, development and construction activities with respect to optioned land prior to takedown. Such costs are classified as inventories owned, which we would have to write-off should we not exercise the option. Therefore, whenever we enter into a land option or purchase contract with an entity and make a non-refundable deposit, a VIE may have been created. As of December 31, 2012 and December 31, 2011, the Company was not required to consolidate any VIEs nor did the Company write-off any costs that had been capitalized under lot option contracts. In accordance with ASC 810, we perform ongoing reassessments of whether we are the primary beneficiary of a VIE.
Related Party Transactions
See “Certain Relationships and Related Party Transactions” and Note 12 of “Notes to Consolidated Financial Statements” for the year ended December 31, 2012 for a description of the Company’s transactions with related parties.
Recent Events
Paulson Transaction
On October 12, 2012, the Company entered into a Subscription Agreement, or the Subscription Agreement, between the Company and WLH Recovery Acquisition LLC, a Delaware limited liability company and investment vehicle managed by affiliates of Paulson & Co. Inc., or Paulson, pursuant to which, the Company issued to Paulson (i) 15,238,095 shares of the Company’s Class A Common Stock, for $16,000,000 in cash and (ii) 12,173,913 shares of the Company’s Convertible Preferred Stock, for $14,000,000 in cash, for an aggregate purchase price of $30,000,000, or the Paulson Transaction. In connection with the Paulson Transaction, the Company also amended (i) its Class A Common Stock Registration Rights Agreement and Convertible Preferred Stock and Class C Common Stock Registration Rights Agreement to include in such agreements the shares issued to Paulson so that Paulson may become a party to such agreements with equal rights, benefits and obligations as the other stockholders who are parties thereto, and (ii) its Amended and Restated Certificate of Incorporation (the “Certificate of Incorporation”) and Amended and Restated Bylaws to (a) increase the size of
81
Table of Contents
the Company’s board of directors (the “Board”) from seven to eight members, up to and until the Conversion Date (as defined in the “Certificate of Incorporation”), (b) provide the holders of Class A Common Stock the right to elect the director to fill the newly created Board seat, (c) revise the definition of “Convertible Preferred Original Issue Price” to equal the price per share at which shares of Convertible Preferred Stock are issued and (d) incorporate various clarifying and conforming changes.
Equity Grants Under the Company’s 2012 Equity Incentive Plan
As previously disclosed in the Company’s Current Report on Form 8-K filed on October 16, 2012, the Company’s board of directors and stockholders approved the Company’s 2012 Equity Incentive Plan (the “2012 Plan”) in October 2012. The purpose of the 2012 Plan is to (1) provide an increased incentive for eligible employees, consultants and directors to assert their best efforts by conferring benefits based on the achievement of certain performance goals, (2) better align the interests of eligible participants with the interests of stockholders by providing an opportunity for increased stock ownership by such participants, and (3) encourage such participants to remain in the service of the Company. The Company approved its first grants under the 2012 Plan in October 2012 and has continued to make grants in accordance with the 2012 Plan under the administration of the Company’s Compensation Committee. See “Executive Compensation,” for additional information.
Senior Notes Offering and Debt Refinancing
On November 8, 2012, California Lyon completed its offering of 8.5% Senior Notes due 2020 in an aggregate principal amount of $325 million, or the New Notes. The New Notes were issued at 100% of their aggregate principal amount. The Company used the net proceeds from the sale of the New Notes, together with cash on hand, to refinance the Company’s (i) $235 million 10.25% Senior Secured Term Loan due 2015, (ii) approximately $76 million in aggregate principal amount of 12% Senior Subordinated Secured Notes due 2017, or the Old Notes, (iii) approximately $11 million in principal amount of project related debt, and (iv) to pay accrued and unpaid interest thereon. The issuance of the New Notes will reduce the amount of interest incurred by the Company by approximately $6.4 million annually.
Village Homes Acquisition
On December 7, 2012, the Company acquired various entities which operate under the Village Homes name in the Denver metro area, Fort Collins, and Granby, Colorado markets. Village Homes immediately began operating as a division of the Company, as its Colorado segment. The Village Homes brand was established in 1984 and has been a leading developer and builder of move-up homes, selling more than 10,000 homes in the Denver area over the past 25 years. At the time of acquisition, Village Homes had five actively selling communities and owned and controlled over 700 residential lots. At the time of acquisition, Village Homes’ backlog of homes sold, but not yet closed, was approximately $34 million. Its average home selling price for 2012 year-to-date was approximately $380,000.
Recently Issued Accounting Standards
See Note 1 of “Notes to Consolidated Financial Statements” for a description of the recently issued accounting standards.
Quantitative and Qualitative Disclosures About Market Risk
The Company’s exposure to market risk for changes in interest rates relates to the Company’s floating rate debt with a total outstanding balance at December 31, 2012 of $13.2 million where the interest rate is variable based upon certain bank reference or prime rates. The average prime rate during the year ended December 31, 2012 was 3.25%. If variable interest rates were to increase by 10%, there would be no impact on the Company’s consolidated financial statements because the outstanding debt has an interest rate floor of 5.0%.
82
Table of Contents
The following table presents principal cash flows by scheduled maturity, interest rates and the estimated fair value of our long-term fixed rate debt obligations as of December 31, 2012 (dollars in thousands):
| Year ended December 31, | Fair Value at December 31, 2012 | |||||||||||||||||||||||||||||||
| 2013 | 2014 | 2015 | 2016 | 2017 | Thereafter | Total | ||||||||||||||||||||||||||
Fixed rate debt | $ | — | $ | — | $ | — | $ | — | $ | — | $ | 325,000 | $ | 325,000 | $ | 338,000 | ||||||||||||||||
Interest rate | — | — | — | — | — | 8.5 | % | — | — | |||||||||||||||||||||||
The Company does not utilize swaps, forward or option contracts on interest rates, foreign currencies or commodities, or other types of derivative financial instruments as of or during the year ended December 31, 2012. The Company does not enter into or hold derivatives for trading or speculative purposes.
83
Table of Contents
Executive Officers and Directors
The following table sets forth certain information concerning the directors and executive officers of William Lyon Homes, or the Company, as of March 11, 2013. Each director holds office until the Company’s next Annual Meeting and until his successor is duly elected and qualified. The executive officers of the Company are chosen annually by the board of directors and each holds office until his or her successor is chosen and qualified or until his or her death, resignation or removal. Officers serve at the discretion of the board of directors, subject to rights, if any, under contracts of employment. There are no family relationships between any director or executive officer and any other director or executive officer of the Company, except for General William Lyon and William H. Lyon, who are father and son.
Name | Age | Position | ||||
General William Lyon | 90 | Chairman of the Board of Directors and Executive Chairman | ||||
William H. Lyon | 39 | Director and Chief Executive Officer | ||||
Matthew R. Zaist | 38 | President and Chief Operating Officer | ||||
Colin T. Severn | 41 | Vice President, Chief Financial Officer and Corporate Secretary | ||||
Richard S. Robinson | 65 | Senior Vice President of Finance | ||||
Mary J. Connelly | 61 | Senior Vice President and Nevada Division President | ||||
W. Thomas Hickcox | 60 | Senior Vice President and Arizona Division President | ||||
Brian W. Doyle | 49 | Senior Vice President and California Region President | ||||
J. Eric Eckberg | 52 | Senior Vice President and Colorado Division President | ||||
Maureen L. Singer | 49 | Vice President of Human Resources | ||||
Douglas K. Ammerman (a, b, c) | 61 | Director | ||||
Michael Barr (b, c) | 42 | Director | ||||
Gary H. Hunt (a, b, c) | 64 | Director | ||||
Matthew R. Niemann (a, b, c) | 48 | Director | ||||
Nathaniel Redleaf (c) | 28 | Director | ||||
Lynn Carlson Schell (a, b, c) | 52 | Director | ||||
| (a) | Member of the Audit Committee |
| (b) | Member of the Compensation Committee |
| (c) | Member of the Nominating and Corporate Governance Committee |
The following is a biographical summary of the experience of our directors and executive officers:
General William Lyon was elected director and Chairman of the Board of The Presley Companies, the predecessor of the Company, in 1987 and has served in that capacity in addition to his role as Chief Executive Officer of the Company since November 1999. General Lyon also served as the Chairman of the Board, President and Chief Executive Officer of the former William Lyon Homes, which sold substantially all of its assets to the Company in 1999 and subsequently changed its name to Corporate Enterprises, Inc. In his current role as Executive Chairman, General Lyon works with the top executives of the Company to set the leadership and strategic direction for the organization. In recognition of his distinguished career in real estate development, General Lyon was elected to the California Building Industry Foundation Hall of Fame in 1985. General Lyon is a retired USAF Major General and was Chief of the Air Force Reserve from 1975 to 1979. General Lyon is a director of Fidelity National Financial, Inc. and Woodside Credit LLC, and is Chairman of the Board of Directors of Commercial Bank of California. Since 2005, General Lyon has served on the Board of Leaders of USC’s Marshall School of Business. General Lyon has received countless awards and honors for his tremendous and sustained success in the building industry and his extensive public service record.
General Lyon provides our board of directors with extensive senior leadership and industry and operational experience and therefore is well-suited to serve as our Chairman of the Board. Through his experience, his knowledge of our operations and the markets in which we compete, and his professional relationships within our industry, General Lyon is exceptionally qualified to identify important matters for board review and deliberation
84
Table of Contents
and is instrumental in assisting the board of directors in determining our corporate strategy. In addition, by serving as both our Chairman of the Board and Executive Chairman, General Lyon serves as an invaluable bridge between management and the board of directors and ensures that they act with a common purpose.
William H. Lyon, the Company’s current Chief Executive Officer, worked full time with the former William Lyon Homes from November 1997 through November 1999 as an assistant project manager, has been employed by the Company since November 1999 and has been a member of the Board since January 25, 2000. Since joining the Company as assistant project manager, Mr. Lyon has served as a Project Manager, the Director of Corporate Development (beginning in 2002), the Director of Corporate Affairs (from February 2003 to February 2005), Vice President and Chief Administrative Officer (from February 2005 to March 2007), and Executive Vice President and Chief Administrative Officer (from March 2007 to March 2009). Mr. Lyon also actively served as the President of William Lyon Financial Services from June 2008 to April 2009. Effective on March 18, 2009, Mr. Lyon was appointed as President and Chief Operating Officer of the Company. In his current role as Chief Executive Officer, Mr. Lyon is responsible for the overall strategic leadership of the Company working closely with the Executive Chairman and executive leaders to establish implement and direct the long-range goals, strategies, plans and policies of the Company. Mr. Lyon is Chairman of the Company’s Management Development and Risk Management Committee and Vice Chair of the Executive Committee. Mr. Lyon is also a member of the Company’s Land Committee. Mr. Lyon is a member of the Board of Directors of Commercial Bank of California, Pretend City Children’s Museum in Irvine, CA and The Bowers Museum in Santa Ana, CA. Mr. Lyon holds a dual B.S. in Industrial Engineering and Product Design from Stanford University. Mr. Lyon is the son of General William Lyon.
With over 15 years of service with our Company, Mr. Lyon brings to our board of directors significant executive and real estate development and homebuilding industry experience, as well as an in-depth understanding of the Company’s business model and operations.
Matthew R. Zaist, the Company’s current President and Chief Operating Officer, joined the Company in 2000 as the Company’s Chief Information Officer. Since joining the Company, Mr. Zaist has served in a number of corporate operational roles, including Executive Vice President from January 2010 to March 2013 and previously, Corporate Vice President—Business Development & Operations from April 2009 to January 2010. Prior to that, Mr. Zaist served as Project Manager and Director of Land Acquisition for the Company’s Southern California Region. In his current role, Mr. Zaist is responsible for the overall management of the Company’s operations and is a member of the Company’s Executive Committee, Chairman of the Company’s Land Committee and Vice Chairman of the Company’s Management Development and Risk Management Committee. In his most recent role as Executive Vice President, Mr. Zaist oversaw and managed the Company’s restructuring efforts and successful recapitalization. Mr. Zaist is a member of the Executive Committee for the University of Southern California’s Lusk Center for Real Estate. Prior to joining William Lyon Homes, Mr. Zaist was a principal with American Management Systems (now CGI) in their State & Local Government practice. Mr. Zaist holds a B.S. from Rensselaer Polytechnic Institute in Troy, New York.
Colin T. Severn, Vice President, Chief Financial Officer and Corporate Secretary, joined the Company in December 2003, and served in the role of Financial Controller until April 3, 2009. Since April 3, 2009, Mr. Severn served as Vice President, Corporate Controller and Corporate Secretary until his promotion to Chief Financial Officer by approval of the board of directors of the Company on August 11, 2009. Mr. Severn oversees the Company’s accounting and finance, treasury, and investor relations functions. Mr. Severn is a member of the Company’s Land Committee. Mr. Severn is a CPA (inactive) and has more than 16 years of experience in real estate accounting and finance, including positions with an international accounting firm, and other real estate and homebuilding companies. Mr. Severn holds a B.A. in Business Administration with concentrations in Accounting and Finance from California State University, Fullerton.
Richard S. Robinson, Senior Vice President of Finance, has held this title and served in this capacity since joining the Company in 1999 when it acquired substantially all of the assets of the former William Lyon Homes,
85
Table of Contents
where Mr. Robinson had served since May 1997 as Senior Vice President, and as Vice President—Treasurer and other administrative positions at The William Lyon Company or one of its subsidiaries or affiliates since his hire in June 1979. His experience in residential real estate development and homebuilding finance totals more than 30 years.
Mary J. Connelly, Senior Vice President and Nevada Division President, has held this title and served in this capacity since joining The Presley Companies in May 1995, after eight years’ association with Gateway Development, six of which were served as Managing Partner in Nevada. Ms. Connelly was Vice President of Finance for the Company’s San Diego Division from 1985 to 1987, and she has more than 25 years of experience in the real estate development and homebuilding industry. She received her bachelor’s degree in Arts Business Administration with a concentration in accounting from the University of California, Los Angeles and Cal State University, Fullerton and her Masters of Science in Business Administration from the University of California, Irvine.
W. Thomas Hickcox, Senior Vice President and Arizona Division President, has held this title and served in this capacity since joining the Company in May 2000. Mr. Hickcox was previously President of Continental Homes in Phoenix, Arizona, with 16 years of service at that company. Mr. Hickcox has more than 25 years of experience in the real estate development and homebuilding industry. He received his bachelor’s degree in finance from Indiana University.
Brian W. Doyle, Senior Vice President and California Region President, joined the Company in 1999 when it acquired substantially all of the assets of the former William Lyon Homes, where Mr. Doyle had served as Director of Sales and Marketing for the Southern California Division after his hire in November 1997. In January 2006, Mr. Doyle became Vice President and Division Manager for the San Diego Division. In January 2008, Mr. Doyle became Division President for the San Diego/Inland Division. In February 2009, Mr. Doyle became the Southern California Division President and in 2010, was promoted to California Region President. Mr. Doyle has more than 23 years of experience in the real estate development and homebuilding industry.
J. Eric Eckberg, Senior Vice President and Colorado Division President, has held this position since the acquisition of Village Homes in December 2012, where he served as President of Village Homes. Mr. Eckberg has over 25 years of senior level experience in community development and homebuilding in Colorado. He serves on the Executive Committee for HomeAid Colorado as Past President and is a board member for the Homebuilders Association of Metropolitan Denver. Mr. Eckberg received a BBSA in Real Estate and Construction Management from the University of Denver.
Maureen L. Singer, Vice President of Human Resources, joined the Company in 2003 as Director of Human Resources, and was promoted to Vice President in 2007. Ms. Singer is responsible for all aspects of human resources including employee relations, compensation, benefits, compliance and staffing. Prior to joining the Company, she worked for Automatic Data Processing for over 16 years. Ms. Singer has more than 20 years of experience and holds a B.A. in Business Administration from California State University, Fullerton.
Douglas K. Ammerman was appointed to the board of directors on February 27, 2007. Mr. Ammerman’s business career includes almost three decades of service with KPMG, independent public accountants, until his retirement in 2002. He was the Managing Partner of the Orange County office and was a National Partner in Charge—Tax. He is a certified public accountant (inactive). Since 2005, Mr. Ammerman has served as a member of the Board of Directors of Fidelity National Financial (a company listed on the New York Stock Exchange), where he also serves as Chairman of the Audit Committee. He also is a member of the Board of Directors of El Pollo Loco, where he also serves as Chairman of the Audit Committee. From 2005 through March of this year, Mr. Ammerman served as a member of the Board of Directors of Quiksilver (a company listed on the New York Stock Exchange), where he served as Chairman of the Audit Committee and a member of both the Compensation and Nominating and Corporate Governance committees. Mr. Ammerman has served as a director of The Pacific Club for twelve years and is a past president. He also has served as a director of the UCI Foundation for fourteen years. Mr. Ammerman is a member of the Audit
86
Table of Contents
Committee of Stantec. Mr. Ammerman holds a B.A. in Accounting from California State University, Fullerton, and a master’s degree in Business Taxation from University of Southern California. Mr. Ammerman recently received the Distinguished Alumni Award from the University of Southern California (2010) and the Director of the Year Award from the Forum for Corporate Directors (2011).
With nearly three decades of accounting experience, as well as significant executive and board experience, Mr. Ammerman provides our board of directors with operational, financial and strategic planning insights. Mr. Ammerman developed his finance and accounting expertise while holding positions such as Managing Partner and National Partner at KPMG. With this experience, Mr. Ammerman possesses the financial acumen requisite to serve as our Audit Committee Financial Expert and provides the board with valuable insight into finance and accounting related matters.
Michael Barr was appointed to the board of directors on November 7, 2012 to fill a new Board seat created in connection with the Company’s execution of a Subscription Agreement with affiliates of Paulson & Co. Inc., or Paulson, pursuant to which the Company issued to Paulson (i) 15,238,095 shares of the Company’s Class A Common Stock for $16,000,000 and 12,173,193 shares of the Company’s Convertible Preferred Stock for $14,000,000 in cash, for an aggregate purchase price of $30,000,000. Mr. Barr currently serves as the Portfolio Manager for the Paulson Real Estate Funds where he is responsible for all aspects of the real estate private equity business. He is also a partner in Paulson & Co. Inc., which he joined in 2008.
From 2001 through 2008, Mr. Barr worked within the Lehman Brothers Real Estate Private Equity Group, serving most recently as a Managing Director of the firm and a principal of Lehman Brothers Real Estate Partners. In this capacity, he was responsible for identifying, evaluating and executing transactions throughout the United States and across all asset classes. While at Lehman Brothers, Mr. Barr led the acquisition of over $8 billion in assets. Prior to joining Lehman Brothers, Mr. Barr served as a principal and a member of the Investment Committee of Westbrook Partners, a real estate merchant banking firm founded by Tiger Management Corporation. During his tenure at Westbrook, which spanned three real estate investment funds, Mr. Barr originated and executed a wide range of real estate transactions. He began his career in the Real Estate Investment Banking group at Merrill Lynch & Co., where he participated in numerous financing and advisory assignments for both public and private real estate companies. Mr. Barr holds a B.B.A. from the University of Wisconsin. He currently serves on the board of Extended Stay Hotels and previously was a board member of Gables Residential Trust and Tishman Hotel & Realty.
With his extensive experience managing a wide variety of real estate transactions, Mr. Barr brings to our board of directors a deep understanding of and valuable expertise in real estate investment and finance.
Gary H. Hunt joined the board of directors on October 17, 2005 with over 30 years of experience in real estate. He spent 25 years with The Irvine Company, one of the nation’s largest master planning and land development organizations, serving 10 years as its Executive Vice President and member of its Board of Directors and Executive Committee. Mr. Hunt led the company’s major entitlement, regional infrastructure, planning, legal and strategic government relations, as well as media and community relations activities.
As a founding Partner in 2001 and now the Vice Chairman of California Strategies, LLC, Mr. Hunt serves as a Senior Advisor to the largest master-planned community and real estate developers in the Western United States, including Tejon Ranch, DMB Pacific Ventures, Five Point Communities, Lennar, Kennecott Land Company, Lewis Group of Companies, Newhall Land, Strategic Hotels and Resorts REIT, Inland American Trust REIT, to name a few. Mr. Hunt also works or has worked with major national financial institutions, including Morgan Stanley, Alvarez & Marsal Capital Group, LLC, and regional banks, to manage projects through the current real estate macro-economic restructuring and re-entitlement period.
Mr. Hunt currently serves on the boards of Glenair Corporation, University of California, Irvine Foundation and is Vice Chairman of CT Realty. He formally was a member and lead independent director of Grubb & Ellis Corporation and for sixteen months served as interim President and CEO.
87
Table of Contents
Matthew R. Niemannwas appointed to the board of directors on February 25, 2012. Mr. Niemann is a Managing Director and Head of Houlihan Lokey Capital’s Real Estate Investment Banking Group. He is a senior member of Houlihan Lokey’s Financial Restructuring business, and first joined the firm in 1999. Before rejoining Houlihan Lokey in 2008, Mr. Niemann spent three years with Cerberus Capital and served as senior managing director and chief strategic officer of GMAC ResCap (a Cerberus portfolio company) in charge of strategy for its $5.0 billion portfolio of builder and developer real estate investments. Mr. Niemann has been involved as a principal or advisor in a wide range of M&A, financing, restructuring and real estate transactions throughout his career, and is a frequent speaker and regularly testifies as an expert in these areas. Earlier in his career, Mr. Niemann was with KPMG and PricewaterhouseCoopers and practiced law for several years in the Corporate, Banking & Real Estate practice of Bryan Cave in St. Louis. Mr. Niemann holds a law and finance degree from St. Louis University, where he served on the Law Review. He was a guest lecturer at the Kellogg Graduate School of Management at Northwestern University in Chicago; a member of the Ph.D. Dissertation Committee at Webster University; and has also served on the Board of Directors and Executive Committee (Treasurer) of the Ronald McDonald Houses of Greater St. Louis.
With extensive experience as an attorney, financial advisor and investment principal, Mr. Niemann brings to the board of directors demonstrated leadership skills and expertise in capital markets, real estate investment and finance.
Nathaniel Redleaf was appointed to the board of directors on February 25, 2012. Since 2006, he has served in an analyst capacity at Luxor Capital Group, a diversified investment fund with several billion dollars under management. Mr. Redleaf’s investment practice focuses primarily on the homebuilding, commercial real estate, finance and gaming sectors. Mr. Redleaf currently serves as a member of the board of directors of Innovate Managed Holdings LLC and Eastland Tire Australia Pty. He holds a degree in Political Economy of Industrial Societies from UC Berkeley.
With his investment practice focusing primarily on the homebuilding and other-related sectors, Mr. Redleaf brings to our board of directors valuable experience in real estate investment and finance.
Lynn Carlson Schell was appointed to the board of directors on February 25, 2012. Ms. Carlson Schell currently serves as the Managing Principal and Chief Executive Officer of Shelter Corporation and The Waters Senior Living, directing the firm’s strategic planning and long-term growth. Since founding Shelter Corporation in 1993, Ms. Carlson Schell has developed or acquired multi-family and senior housing consisting of over 15,000 units and comprising $800 million of real estate. Ms. Carlson Schell’s core accomplishments include her leadership role in driving Shelter Corporation’s development of affordable housing and spearheading its successful diversification into senior living communities with the 1998 formation of The Waters Senior Living. In 2009, Ms. Carlson Schell was honored as an Industry Leader by the Minneapolis/St. Paul Business Journal. Prior to founding Shelter Corporation, Ms. Carlson Schell spent nine years working as an associate and senior developer with Can-American Corporation. She was responsible for residential, condominium and apartment developments in the Midwest and Florida. Ms. Carlson Schell currently serves as the chair of the board of directors at the Friends of the Hennepin County Library Foundation and previously served as the Treasurer of the Twin Cities Chapter of the Young Presidents’ Organization. She also serves on the board of directors of the Walker Art Center.
With over thirty years of real estate and executive experience, as well as significant board experience, Ms. Carlson Schell provides our board of directors with operational, financial and strategic planning insights.
On December 19, 2011, the Company and its subsidiaries filed voluntary petitions with the U.S. Bankruptcy Court for the District of Delaware to seek approval of the Prepackaged Joint Plan of Reorganization, or the Plan. At that time, the officers listed above, with the exception of Mr. Eckberg, served as executive officers of the Company in their respective capacities. Post-emergence from bankruptcy on February 25, 2012, such officers continued to serve as executive officers of the Company.
88
Table of Contents
Board of Directors
Our board of directors currently consists of eight directors, seven of whom were appointed pursuant to the Plan. In accordance with the Plan, the initial directors were appointed as follows: (i) Mr. Niemann was appointed by the holders of at least 66 2/3% of the Class A Common Stock, (ii) General William Lyon and William H. Lyon were appointed by the holders of at least a majority of the Class B Common Stock, (iii) Ms. Schell and Mr. Redleaf were appointed by the holders of at least a majority of the Class C Common Stock and Convertible Preferred Stock, voting as a single class, and (iv) Douglas K. Ammerman and Gary H. Hunt were appointed by the holders of (a) 66 2/3% of the Class A Common Stock, (b) a majority of the Class B Common Stock and (c) a majority of the Convertible Preferred Stock and the Class C Common Stock voting as a class. Our eighth director, Mr. Barr, was appointed by our board of directors on November 7, 2012, to fill a new board seat created in connection with the Company’s execution of a Subscription Agreement with affiliates of Paulson & Co., Inc., or Paulson, pursuant to which the Company issued to Paulson (i) 15,238,095 shares of the Company’s Class A Common Stock for $16,000,000 and 12,173,193 shares of the Company’s Convertible Preferred Stock for $14,000,000 in cash, for an aggregate purchase price of $30,000,000. The current directors will hold office until the annual meeting of stockholders to be held in 2013 and until his or her successor is duly elected and qualified, or until his or her earlier resignation or removal. Other than as provided for in the Paulson Subscription Agreement, we are not aware of any understandings between the directors or any other persons pursuant to which such individuals were elected as directors or are to be selected as a director or nominee in the future; however, pursuant to our Second Amended and Restated Certificate of Incorporation, or Certificate of Incorporation, and as described below, certain classes of stockholders have the right to elect certain of our directors.
Our Second Amended and Restated Bylaws, or Bylaws, provide that, prior to the later of the Conversion Date (as defined in our Certificate of Incorporation) and the date on which all of the shares of our Class B Common Stock have been converted into shares of our Class A Common Stock, or the Specified Date, our board of directors shall consist of eight members and shall be elected by the stockholders of record entitled to vote for such directors as set forth in the Certificate of Incorporation. Directors are elected by the holders of record of a plurality of the votes entitled to vote for such directors, and each director shall hold office until the next annual meeting of stockholders and until his or her successor is duly elected and qualified, or until his or her earlier resignation or removal.
Our Certificate of Incorporation provides that prior to the earlier to occur of (i) the Conversion Date and (ii) the conversion in full of all shares of Class B Common Stock into Class A Common Stock, the board of directors will consist of the following eight members: (i) two Class A Directors; (ii) two Class B/D Directors; (iii) two Class C Directors; (iv) one Class C Independent Director; and (v) one Class A/B/C Independent Director. Luxor Capital Group or Luxor, currently holds 29.7% of the Class A Common Stock, 95.9% of the Class C Common Stock and 79.9% of the Convertible Preferred Stock through its affiliated entities. William H. Lyon holds 100% of the Class B Common Stock through Lyon Shareholder 2012, LLC. Colony Capital Group LP currently holds 14.3% of the Class A Common Stock through its affiliated entities. Paulson currently holds 21.7% of the Class A Common Stock and 15.8% of the Convertible Preferred Stock. Certain officers, directors and employees of the Company hold an aggregate of 5,501,432 shares of Class D Common Stock, which constitutes 100% of the outstanding Class D shares, and options to purchase an additional 4,757,303 Class D shares. See “Security Ownership of Certain Beneficial Owners and Management” below.
Such directors will be elected, appointed and removed in the following manner:
| • | the Class A Directors will be elected (and may be removed with or without cause, at any time) by the holders of the Class A Common Stock, voting together as a class; |
| • | the Class B/D Directors will be elected (and may be removed with or without cause, at any time) by the holders of the Class B Common Stock and Class D Common Stock, voting together as a class; |
| • | the Class C Directors will be elected (and may be removed with or without cause, at any time) by the holders of the Class C Common Stock and the Convertible Preferred Stock, voting together as a class; |
89
Table of Contents
| • | the Class C Independent Director will be elected (and may be removed with or without cause, at any time) by the holders of a majority of the Class C Common Stock and the Convertible Preferred Stock, voting together as a class; and |
| • | the Class A/B/C Independent Director will be elected (and may be removed with or without cause, at any time) by the holders of (i) 66 2/3% of the Class A Common Stock, voting separately as a class, (ii) the majority of the Class B Common Stock, voting separately as a class, and (iii) the majority of the Class C Common Stock and Convertible Preferred Stock, voting together as a separate class. |
From and after the date of the first annual meeting, no individual may be nominated or appointed as a Class C Independent Director or Class A/B/C Independent Director, nor may any individual serve as a Class C Independent Director or Class A/B/C Independent Director, unless such individual is independent at the time of nomination and appointment and continues to be independent throughout such individual’s period of service.
On or following the Conversion Date while any shares of Class B Common Stock remain outstanding, the board of directors will consist of seven members, and such directors will be elected, appointed and removed in the following manner:
| • | three directors will be elected (and may be removed with or without cause, at any time) by the holders of the Class A Common Stock, voting together as a class; |
| • | two directors will be elected (and may be removed with or without cause, at any time) by the holders of the Class B Common Stock, voting together as a class; |
| • | one director will be elected (and may be removed with or without cause, at any time), by the holders of the Class A Common Stock, voting together as a class; provided, however, that no individual may be nominated or appointed as such director, nor may any individual serve as such director, unless such individual is independent at the time of nomination and appointment and continues to be independent throughout such individual’s period of service; and |
| • | one director will be elected (and may be removed with or without cause, at any time), by the holders of (i) the majority of the Class A Common Stock, voting separately as a class, and (ii) the majority of the Class B Common Stock, voting separately as a class; provided, however, that no individual may be nominated or appointed as such director, nor may any individual serve as such director, unless such individual is independent at the time of nomination and appointment and continues to be independent throughout such individual’s period of service. |
Following the conversion in full of all shares of Class B Common Stock and prior to the Conversion Date, the number of members of the board of directors will be fixed at eight, and such directors will be elected, appointed and removed in the following manner:
| • | four directors will be elected (and may be removed with or without cause, at any time) by the holders of the Class A Common Stock and the Class D Common Stock, voting together as a separate class; |
| • | two directors will be elected (and may be removed with or without cause, at any time) by the holders of the Class C Common Stock and the Convertible Preferred Stock, voting together as a class; |
| • | one director will be elected (and may be removed with or without cause, at any time), by the holders of the Class C Common Stock and the Convertible Preferred Stock, voting together as a class; provided, however, that no individual may be nominated or appointed as such director pursuant to, nor may any individual serve as such director, unless such individual is independent at the time of nomination and appointment and continues to be independent throughout such individual’s period of service; and |
| • | one director will be elected (and may be removed with or without cause, at any time), by the holders of (i) the majority of the Class A Common Stock, voting together as a separate class, and (ii) the majority of the Class C Common Stock and the Convertible Preferred Stock, voting together separately as a |
90
Table of Contents
class; provided, however, that no individual may be nominated or appointed as such director, nor may any individual serve as such director, unless such individual is independent at the time of nomination and appointment and continues to be independent throughout such individual’s period of service. |
From and after the Specified Date, the board of directors will consist of one or more members. The number of directors will be fixed and may be changed from time to time by resolution duly adopted by the board of directors or the stockholders, and all of the directors will be elected (and may be removed with or without cause, at any time) by the holders of the Class A Common Stock. Except as provided in the Certificate of Incorporation, directors will be elected by the holders of record of a plurality of the votes cast at annual meetings of stockholders, and each director so elected will hold office until the next annual meeting and until his or her successor is duly elected and qualified, or until his or her earlier resignation or removal. For additional information regarding voting rights of our stockholders, see “Description of Capital Stock.”
As the Company intends for its securities to be quoted on the Over-the-Counter Bulletin Board and not one of the national securities exchanges, it is not subject to any director independence requirements. However, based upon information requested from and provided by each director concerning his or her background, employment and affiliations, including family relationships, with us, our senior management and our independent registered public accounting firm, our board of directors has determined that all but two of our directors, General William Lyon and William H. Lyon, are independent directors under standards established by the Securities and Exchange Commission, or the SEC, and the New York Stock Exchange, or the NYSE.
Prior to the Specified Date, vacancies may be filled by the vote of the stockholders entitled to appoint such directors. From and after the Specified Date, vacancies and newly created directorships resulting from any increase in the authorized number of directors may be filled by a majority of the directors then in office, although less than a quorum, or by a sole remaining director or by the stockholders entitled to vote at any annual or special meeting held in accordance with the Certificate of Incorporation, and the directors so chosen will hold office until the next annual or special meeting called for that purpose and until their successors are duly elected and qualified, or until their earlier resignation or removal.
The board of directors seeks to ensure that the board of directors is composed of members whose particular experience, qualifications, attributes and skills, when taken together, will allow the board of directors to satisfy its oversight responsibilities effectively. New directors are approved by the board of directors after recommendation by the Nominating and Corporate Governance Committee. In the case of a vacancy on the board of directors, the board of directors approves a Director to fill the vacancy following the recommendation of a candidate by the Chairman of the Board. In identifying candidates for director, the Nominating and Corporate Governance Committee and the board of directors take into account (1) the comments and recommendations of board members regarding the qualifications and effectiveness of the existing board of directors or additional qualifications that may be required when selecting new board members that may be made in connection with annual assessments prepared by each director of the effectiveness of the board of directors and of each committee of the board of directors on which he or she serves, (2) the requisite expertise and sufficiently diverse backgrounds of the board of directors’ overall membership composition, (3) the independence of outside directors and other possible conflicts of interest of existing and potential members of the board of directors and (4) all other factors it considers appropriate.
When considering whether directors and nominees have the experience, qualifications, attributes and skills, taken as a whole, to enable the board of directors to satisfy its oversight responsibilities effectively in light of the Company’s business and structure, the Nominating and Corporate Governance Committee and the board of directors focused primarily on the information discussed in each of the directors’ individual biographies set forth above. Although diversity may be a consideration in the selection of directors, the Company and the board of directors do not have a formal policy with regard to the consideration of diversity in identifying director nominees.
91
Table of Contents
Board Meetings
Our board of directors held 16 meetings during fiscal year 2012. During fiscal year 2012, all incumbent directors attended at least 75% of the combined total of (i) all board of directors meetings and (ii) all meetings of committees of the board of directors of which the incumbent director was a member. Matthew R. Niemann, Nathaniel Redleaf and Lynn Carlson Schell were appointed to our board on February 25, 2012 and Michael Barr was appointed on November 7, 2012. Each of Messrs. Niemann, Redleaf and Barr and Ms. Carlson Schell attended at least 75% of the combined total of board meetings and committee meetings of which they were a member. The board has a policy that all directors attend the annual meeting of stockholders, absent unusual circumstances. The Company did not hold an annual meeting of its stockholders in 2012.
Committees of the Board of Directors
We currently have three standing committees: an audit committee, a compensation committee and a nominating and corporate governance committee. The charters of all three of our standing board committees are available on our website, www.lyonhomes.com, under the Company—Governance section. The inclusion of our website address in this prospectus does not include or incorporate by reference the information on our website into this prospectus.
Audit Committee
The Company has a standing Audit Committee, which is chaired by Douglas Ammerman and consists of Messrs. Ammerman, Hunt and Niemann and Ms. Schell. The board of directors has determined that each of these directors is independent as defined by the applicable rules of the NYSE and the SEC, and that each member of the Audit Committee meets the financial literacy and experience requirements of the applicable SEC and NYSE rules. In addition, the board of directors has determined that Mr. Ammerman is an “audit committee financial expert” as defined by the SEC. The Audit Committee met seven times in 2012.
Our Audit Committee charter requires that the Audit Committee oversee our corporate accounting and financial reporting processes. The primary responsibilities and functions of our Audit Committee are, among other things, as follows:
| • | approve in advance all auditing services, including the provision of comfort letters in connection with securities offerings and various non-audit services permitted by applicable law to be provided to the Company by its independent auditors; |
| • | evaluate our independent auditor’s qualifications, independence and performance; |
| • | determine and approve the engagement and compensation of our independent auditor; |
| • | meet with our independent auditor to review and approve the plan and scope for each audit and review and recommend action with respect to the results of such audit; |
| • | annually evaluate our independent auditor’s internal quality-control procedures and all relationships between the independent auditor and the Company which may impact their objectivity and independence; |
| • | monitor the rotation of partners and managers of the independent auditor as required; |
| • | review our consolidated financial statements; |
| • | review our critical accounting policies and estimates, including any significant changes in the Company’s selection or application of accounting principles; |
| • | review analyses prepared by management and/or the independent auditor setting forth significant financial reporting issues and judgments made in connection with the preparation of the financial statements; |
| • | resolve any disagreements between management and the independent auditor regarding financial reporting; |
92
Table of Contents
| • | review and discuss with the Company’s independent auditor and management the Company’s audited financial statements, including related disclosures; |
| • | discuss with our management and our independent auditor the results of our annual audit and the review of our audited financial statements; |
| • | meet periodically with our management and internal audit team to consider the adequacy of our internal controls and the objectivity of our financial reporting; |
| • | establish procedures for the receipt, retention and treatment of complaints regarding internal accounting controls or auditing matters and the confidential, anonymous submission by employees of concerns regarding questionable accounting or auditing matters; and |
| • | retain, in its sole discretion, its own separate advisors. |
Compensation Committee
The Company has a standing Compensation Committee, which is chaired by Matthew R. Niemann and consists of Messrs. Hunt, Ammerman, Barr, and Niemann and Ms. Schell. Our board of directors has determined that each of these directors is independent under NYSE rules and qualifies as a non-employee director for purposes of Rule 16b-3 under the Securities Exchange Act of 1934, as amended, or the Exchange Act. The Compensation Committee met five times in 2012.
Pursuant to its charter, the primary responsibilities and functions of our Compensation Committee are, among other things, as follows:
| • | evaluate the performance of executive officers in light of certain corporate goals and objectives and determine and approve their compensation packages; |
| • | recommend to the board of directors new compensation programs or arrangements if deemed appropriate; |
| • | recommend to the board of directors compensation programs for directors based on the practices of similarly situated companies; |
| • | counsel management with respect to personnel compensation policies and programs; |
| • | review and approve all equity compensation plans of the Company; |
| • | oversee the Company’s assessment of any risks arising from its compensation programs and policies likely to have a material adverse effect on the Company; |
| • | prepare an annual report on executive compensation for inclusion in our proxy statement; and |
| • | retain, in its sole discretion, its own separate advisors. |
Nominating and Corporate Governance Committee
The Company has a standing Nominating and Corporate Governance Committee, which is chaired by Gary H. Hunt and consists of Messrs. Hunt, Ammerman, Barr, Niemann and Redleaf and Ms. Schell. Our board of directors has determined that each of these directors is independent under NYSE rules. The Nominating and Corporate Governance Committee did not meet in 2012.
Pursuant to its charter, the primary responsibilities and functions of our Nominating and Corporate Governance Committee are, among other things, as follows:
| • | establish standards for service on our board of directors and nominating guidelines and principles; |
| • | identify, screen and review qualified individuals to be nominated for election to our board of directors |
93
Table of Contents
and to fill vacancies or newly created board positions; |
| • | assist the board of directors in making determinations regarding director independence as well as the financial literacy and expertise of Audit Committee members and nominees; |
| • | establish criteria for committee membership and recommend directors to serve on each committee; |
| • | consider and make recommendations to our board of directors regarding its size and composition, committee composition and structure and procedures affecting directors; |
| • | conduct an annual evaluation and review of the performance of existing directors; |
| • | review and monitor compliance with, and the effectiveness of, the Company’s Corporate Governance Guidelines and its Code of Business Conduct and Ethics; |
| • | monitor our corporate governance principles and practices and make recommendations to our board of directors regarding governance matters, including our certificate of incorporation, bylaws and charters of our committees; and |
| • | retain, in its sole discretion, its own separate advisors. |
Other Committees
Our board of directors may establish other committees as it deems necessary or appropriate from time to time.
Board Leadership Structure
Our current leadership structure permits the roles of Chairman of the Board and Chief Executive Officer to be filled by the same or different individuals. Effective as of March 6, 2013, William H. Lyon assumed the role of Chief Executive Officer, with General Lyon continuing as Chairman of the Board and Executive Chairman. Our board of directors has determined this structure to be in the best interests of the Company and its stockholders at this time due to General Lyon’s extensive history with the Company. Separating the Chairman of the Board and Chief Executive Officer roles further allows the Chief Executive Officer to focus his time and energy on operating and managing the Company and leveraging the experience and perspectives of the Chairman of the Board.
Furthermore, Mr. Hunt serves as our lead independent director, and has served in such role since May 2012. As the board’s lead independent director, Mr. Hunt holds a critical role in assuring effective corporate governance and in managing the affairs of our board of directors. Among other responsibilities, Mr. Hunt:
| • | presides over executive sessions of the board of directors and over board meetings when the Chairman of the Board is not in attendance; |
| • | consults with the Chairman of the Board and other board members on corporate governance practices and policies, and assuming the primary leadership role in addressing issues of this nature if, under the circumstances, it is inappropriate for the Chairman of the Board to assume such leadership; |
| • | meets informally with other outside directors between board meetings to assure free and open communication within the group of outside directors; |
| • | assists the Chairman of the Board in preparing the board agenda so that the agenda includes items requested by non-management members of our board of directors; |
| • | administers the annual board evaluation and reporting the results to the Nominating and Corporate Governance Committee; and |
| • | assumes other responsibilities that the non-management directors might designate from time to time. |
The Board periodically reviews the leadership structure and may make changes in the future.
94
Table of Contents
Board Risk Oversight
The board of directors is actively involved in oversight of risks that could affect the Company. The board of directors satisfies this responsibility through full reports by each committee chair (principally, the Audit Committee chair) regarding such committee’s considerations and actions, as well as through regular reports directly from the officers responsible for oversight of particular risks within the Company.
The Audit Committee is primarily responsible for overseeing the risk management function at the Company on behalf of the board of directors. In carrying out its responsibilities, the Audit Committee works closely with management. The Audit Committee meets at least quarterly with members of management and, among things, receives an update on management’s assessment of risk exposures (including risks related to liquidity, credit and operations, among others). The Audit Committee chair provides periodic reports on risk management to the full board of directors.
In addition to the Audit Committee, the other committees of the board of directors consider the risks within their areas of responsibility. For example, the Compensation Committee considers the risks that may be implicated by the Company’s executive compensation programs. The Company does not believe that risks relating to its compensation policies and practices are reasonably likely to have a material adverse effect on the Company.
Code of Ethics and Business Conduct
The board of directors has adopted a Code of Business Conduct and Ethics, or the Code of Ethics, that is applicable to all directors, employees and officers of the Company. The Code of Ethics constitutes the Company’s “code of ethics” within the meaning of Section 406 of the Sarbanes-Oxley Act. The Company intends to disclose future amendments to certain provisions of the Code of Ethics, or waivers of such provisions applicable to the Company’s directors and executive officers, on the Company’s website at www.lyonhomes.com.
The Code of Ethics is available on the Company’s website at www.lyonhomes.com. In addition, printed copies of the Code of Ethics are available upon written request to Investor Relations, William Lyon Homes, 4490 Von Karman Avenue, Newport Beach, California 92660.
Compensation Committee Interlocks and Insider Participation
The members of the Company’s Compensation Committee are Douglas K. Ammerman, Michael Barr, Gary H. Hunt, Matthew R. Niemann and Lynn Carlson Schell. None of the members of the Compensation Committee has ever been an officer or employee of the Company or any of its subsidiaries. None of the Company’s named executive officers has ever served as a director or member of the Compensation Committee (or other board committee performing equivalent functions) of another entity, one of whose executive officers served in either of those capacities for the Company.
Stockholder Communications with the Board of Directors
Stockholders may send communications to our board of directors by writing to the Company, c/o William Lyon Homes, 4490 Von Karman Avenue, Newport Beach, California 92660, Attention: Board of Directors.
Director Compensation
Our non-employee directors receive an annual cash retainer of $50,000 per year, payable in equal quarterly installments in advance, as well as $50,000 in equity compensation (described below). Mr. Hunt, as the lead independent director, receives an additional $50,000 annual cash retainer (payable quarterly) and $25,000 in equity
95
Table of Contents
compensation. Our non-employee directors also receive a $1,500 fee for each board meeting attended in person and $1,000 for each meeting attended via teleconference. In addition, the chairperson of the Audit Committee of the board of directors receives a fee of $20,000 per year, payable $5,000 per calendar quarter, to serve in such capacity, the chairperson of the Compensation Committee of the board of directors receives a fee of $15,000 per year, payable $3,750 per calendar quarter, to serve in such capacity, the chairperson of the Nominating and Corporate Governance Committee of the board of directors receives a fee of $10,000 per year, payable $2,500 per calendar quarter, to serve in such capacity, and other committee members receive a fee of $5,000 per year, payable $1,250 per calendar quarter, per committee for service on committees of the board of directors.
With respect to non-employee directors’ compensation, on October 1, 2012, the Company granted 57,000 shares of restricted stock to each of its non-employee directors, which were fully vested on the date of grant and subject to certain restrictions. On the same date, the Company granted Mr. Hunt, the lead independent director, an additional grant of 28,500 shares of restricted stock, which were also fully vested on the date of grant. On December 5, 2012, the Company cancelled Mr. Redleaf’s grant of 57,000 shares of restricted stock and in lieu thereof granted him a cash award with the equivalent value of $59,850 in respect of Mr. Redleaf’s services as a non-employee director. In consideration for their efforts and service through the restructuring, Messrs. Hunt and Ammerman also received a one-time cash bonus of $50,000 each in 2012.
The following table sets forth information concerning the compensation of the directors during the fiscal year ended December 31, 2012.
Name | Fees Earned or Paid in Cash ($) | Stock Awards ($) | Option Awards ($) | Non-Equity Incentive Plan Compensation ($) | Change in Pension Value and Nonqualified Deferred Compensation Earnings ($) | All Other Compensation ($)(1) | Total ($) | |||||||||||||||||||||
Douglas K. Ammerman | 165,500 | 59,850 | — | — | — | 50,000 | 275,350 | |||||||||||||||||||||
Michael Barr(2) | — | — | — | — | — | — | — | |||||||||||||||||||||
Harold H. Greene(3) | 18,500 | — | — | — | — | — | 18,500 | |||||||||||||||||||||
Gary H. Hunt | 199,250 | 89,775 | — | — | — | 50,000 | 339,025 | |||||||||||||||||||||
Alex Meruelo(3) | 17,875 | — | — | — | — | — | 17,875 | |||||||||||||||||||||
Matthew R. Niemann(3) | 96,125 | 59,850 | — | — | — | — | 155,975 | |||||||||||||||||||||
Nathaniel Redleaf(3)(4) | 134,350 | — | — | — | — | — | 134,350 | |||||||||||||||||||||
Lynn Carlson Schell(3) | 85,750 | 59,850 | — | — | — | — | 145,600 | |||||||||||||||||||||
| (1) | Includes one-time cash bonus of $50,000 paid to Messrs. Ammerman and Hunt for their efforts and service through the restructuring. |
| (2) | Mr. Barr was appointed to the Company’s board of directors on November 7, 2012 and waived director compensation for the 2012 calendar year. For 2013, Mr. Barr’s fees will be paid to a fund affiliated with Paulson. |
| (3) | On February 25, 2012, in connection with the confirmation of the Company’s plan of reorganization, Messrs. Greene and Meruelo resigned from the Company’s board of directors and Messrs. Niemann and Redleaf and Ms. Carlson Schell were appointed to the Company’s board of directors. |
| (4) | Mr. Redleaf’s fees are paid to an affiliate of Luxor Capital Group. |
Under the Company’s Non-Qualified Retirement Plan for Outside Directors (the Non-Qualified Retirement Plan), each non-employee director is eligible to receive $2,000 per month beginning on the first day of the month following death, disability or retirement at age 72; or, in the case of a non-employee director who ceases participation in the plan prior to death, disability or retirement at age 72 but has completed at least ten years of service as a director, eligibility for benefit payments pursuant to the plan begins on the first day of the month following the latter of (a) the day on which such person attains the age of 65, or (b) the day on which such person’s service terminates after completing at least ten years of service as a director. The monthly payments will
96
Table of Contents
continue for a number of months equal to the number of months the non-employee director served as a director and are payable to the director’s beneficiary in the event of the director’s death. If a retired non-employee director receiving payments under the plan resumes his status as a director or becomes an employee, the payments under the plan are suspended during the period of such service. The Non-Qualified Retirement Plan was terminated in May 2012 as to future deferrals. Each non-employee director eligible to receive benefits under the plan when terminated was “grandfathered” into the plan and such directors will continue to accrue and receive benefits in accordance with the provisions of the plan in effect at the time of its termination. Among our outside directors listed in the table above, only Mr. Greene is eligible to receive distributions under the Non-Qualified Retirement Plan.
97
Table of Contents
Executive Summary
Key Compensation Decisions and Actions in 2012:
| • | The Compensation Committee retained an independent compensation consultant to advise the Compensation Committee on executive compensation matters. |
| • | Base salaries remained the same for named executive officers in 2012. |
| • | The Company adopted an equity incentive plan and introduced long-term equity compensation as an element of its pay practices. |
| • | The Company entered into new employment agreements to retain key talent among its named executive officer group. |
Compensation Discussion and Analysis
This Compensation Discussion and Analysis section discusses the material elements of the compensation programs and policies in place for the Company’s named executive officers, or NEOs, during 2012. For the fiscal year ended December 31, 2012, the Company had five NEOs(1), as follows:
| • | General William Lyon, Chairman of the Board and Executive Chairman; |
| • | William H. Lyon, Director and Chief Executive Officer; |
| • | Matthew R. Zaist, President and Chief Operating Officer; |
| • | Colin T. Severn, Vice President, Chief Financial Officer and Corporate Secretary; and |
| • | Brian W. Doyle, Senior Vice President and California Region President. |
| (1) | The NEO titles listed above are current titles effective as of March 6, 2013. As of December 31, 2012, General William Lyon served as Chairman of the Board and Chief Executive Officer, William H. Lyon served as Director, President and Chief Operating Officer, and Matthew R. Zaist served as Executive Vice President. |
Compensation Philosophy and Objectives
The goals of the Company’s compensation program are to provide significant rewards for successful performance and to encourage retention of top executives who may have attractive opportunities at other companies, given the highly competitive homebuilding industry. At the same time, the Company tries to keep its selling, general and administrative, or SG&A, costs at competitive levels when compared with other major homebuilders.
Role of the Compensation Committee and Compensation Consultants
The Company’s executive compensation decisions are made by the Compensation Committee, which is composed entirely of independent non-employee members of the Company’s board of directors. The Compensation Committee receives recommendations from the Company’s senior executive management team regarding the compensation of the Company’s executives. The Compensation Committee also consults with outside independent compensation consultants as it deems appropriate. In March 2012, the Compensation Committee retained Christenson Advisors as its independent compensation consultant to advise the Compensation Committee with respect to various elements of our executive compensation pay structure for 2012 and going forward. In 2012, Mr. William H. Lyon and Mr. Zaist were involved in the compensation process by
98
Table of Contents
making recommendations to the Compensation Committee regarding compensation for the NEOs and other senior executives and by working with Christenson Advisors to give them the information necessary to enable them to complete their reports.
In general, the Compensation Committee strives to achieve an appropriate mix between equity incentive awards and cash payments in order to meet its compensation objectives. The objective of the Company’s non-cash and long-term incentive-based programs is to align the compensation of the NEOs with the interests of the Company’s stockholders. However, the Compensation Committee does not have rigid apportionment goals or policies for allocating compensation between long-term and short-term compensation or cash and non-cash compensation. The Company’s mix of compensation elements is designed to reward recent results and motivate long-term performance through a combination of cash and equity incentive awards. The differences in NEO compensation levels reflect to a significant degree the varying roles and responsibilities of each NEO.
During 2012, the Compensation Committee reviewed the Company’s compensation programs and practices in light of certain comparative data on long-term equity compensation, base salaries and bonuses compiled by its independent compensation consultant, Christenson Advisors, at the request of the Compensation Committee. Given the anticipation that the Company would become publicly traded, Christenson Advisors compiled information on the compensation practices of a public homebuilder peer group that included the following companies: Beazer Homes, DR Horton, Hovnanian Enterprises, KB Home, Lennar, MDC Holdings, Meritage Homes, Pulte Group, Ryland Group, Standard Pacific and Toll Brothers. In selecting the homebuilders most comparable to the Company to be included in the peer group, Christenson Advisors focused on companies’ size, location and development projects, as well as the background and experience of management. Christenson also provided the Compensation Committee with select compensation data for a number of private homebuilder companies, based on Christenson’s survey of such companies.
In setting the compensation levels of the Company’s executive officers for 2012, the Compensation Committee reviewed the peer group data compiled by Christenson Advisors and relied on Christenson Advisors’ peer group analyses of public and private homebuilders, utilizing this data to justify the Compensation Committee’s decisions regarding compensation levels for the Company’s executive officers for 2012. In arriving at its decisions, the Compensation Committee generally benchmarked its decisions against the bottom quartile of the public homebuilder peer group companies and the top quartile of the private homebuilder data in the analyses provided by Christenson Advisors. Benchmarking against peer group companies was one aspect of the process used to establish fiscal year 2012 compensation, as the Compensation Committee also relied on its experience and judgment as well as the Company’s recent performance and restructuring and the current economic environment to set overall compensation levels. The Compensation Committee also based its determinations for 2012 compensation levels on each individual NEO’s leadership qualities, operational performance, business responsibilities, career with our company, current compensation arrangements and long-term potential to enhance stockholder value. The Compensation Committee has been advised by Christenson Advisors that 2012 overall compensation for our NEOs fell within the targeted benchmark of the bottom quartile of the public homebuilder peer group companies and the top quartile of the private homebuilders surveyed by Christenson, adequately reflecting the Company’s relative market position and growth as it emerged from restructuring.
Elements of Compensation
Base Salary
The Company’s Compensation Committee generally reviews the base salary of the Company’s NEOs annually. Salary is the principal component of the compensation of General Lyon and Mr. Lyon, who together hold a significant equity stake in the Company and as a result have incentives generally aligned with the Company’s other stockholders. With respect to Messrs. Severn, Zaist and Doyle, the Company does not regard salary as the principal component of compensation, and also uses short-term annual bonuses and long-term equity incentives to reward performance and loyalty while keeping SG&A costs competitive. In 2012, the Compensation Committee balanced the goals of maintaining competitive salaries while also being mindful of the Company’s financial
99
Table of Contents
position, determining that each NEO’s base salary as of the end of 2011 would continue unchanged throughout 2012. The table below shows the annual base salary for each NEO as of December 31, 2012.
Name | Annual Base Salary ($) | |||
General William Lyon | 1,000,000 | |||
Colin T. Severn | 200,000 | |||
William H. Lyon | 500,000 | |||
Matthew R. Zaist | 350,000 | |||
Brian W. Doyle | 275,000 | |||
2012 Annual Bonuses
The Compensation Committee, in its sole discretion, determined awards of annual bonuses for fiscal year 2012 based on Christenson Advisors’ peer group analyses, described above, as well as a number of subjective Company and individual performance factors, including but not limited to, the Company’s profitability and growth emerging from Chapter 11 restructuring and each NEO’s contribution to the Company and leadership and initiative in helping the Company emerge from the restructuring. Because 2012 served as a transitional year for the Company as it emerged from restructuring, the Compensation Committee determined it would be more appropriate to award 2012 annual bonuses on a number of subjective factors, rather than objective performance criteria. No one subjective factor was determinative or given any specific weight in the Compensation Committee’s decisions, with respect to each NEO’s 2012 annual bonus award.
An NEO’s right to receive a bonus is conditioned on his being actively employed by the Company on the date of payment, except in the case of a termination of employment without cause or for good reason. Bonuses for a particular year will be paid out over two years, with 75% paid following the determination of the bonus, and 25% paid one year later, conditioned on continued employment to the date of payment, except in the case of a termination of employment without cause or for good reason. These provisions help ensure the loyalty and continued service of the Company’s NEOs.
In 2012, each NEO was eligible to receive a bonus pursuant to his individual employment agreement, in an amount to be determined at the discretion of the Compensation Committee. The Compensation Committee determined to award 2012 annual bonuses at target level for each eligible NEO, as set forth in his employment agreement, as shown in the table below based on the Company’s overall performance in 2012 as well as each NEO’s individual performance and contributions.
NAME | 2012 BONUS ($)(1) | |||
General William Lyon | 500,000 | |||
Colin T. Severn | 120,000 | |||
William H. Lyon | 250,000 | |||
Matthew R. Zaist | 437,500 | |||
Brian W. Doyle | 206,250 | |||
Long-Term Equity-Based Compensation
Pursuant to the Chapter 11 joint plan of reorganization, the Company was required to adopt the 2012 Equity Incentive Plan and grant up to 8% of the capital stock of the Company in the form of equity awards to eligible participants. The plan of reorganization required that the Company issue up to 4% of the capital stock of the Company to certain key executives, with 50% of such equity awards to be in the form of Class D service-based restricted shares and 50% in the form of service-based stock options to acquire Class D common shares, to be issued or awarded upon or as soon as practicable following the effective date of the plan of reorganization, which was February 25, 2012. The Compensation Committee, in consultation with Christenson Advisors, determined the number of shares to be reserved for issuance under the 2012 Equity Incentive Plan as required in the plan of reorganization and also determined the allocation of the 4% of the Company’s capital stock among the NEOs including the number of restricted shares and stock options to be granted to each NEO, based on the officer’s position with the Company and the fair market value of our stock at the time of grant.
100
Table of Contents
On October 1, 2012, the Company granted each of Messrs. Zaist, Severn and Doyle the following equity incentive awards under the 2012 Plan, pursuant to the plan of reorganization and in connection with the adoption of their new employment agreements, described in further detail below.
| Restricted Stock | 5-Year Options | 10-Year Options | ||||||||||
Matthew R. Zaist | 1,200,000 | 489,360 | 1,400,000 | |||||||||
Colin Severn | 200,000 | 73,360 | 234,000 | |||||||||
Brian Doyle | 550,000 | 201,740 | 642,000 | |||||||||
The ten-year options have a term of ten years. The five-year options have a term of five years and are subject to mandatory exercise upon the earlier of an initial public offering of the Company or the expiration of the five-year term, provided, that if the initial public offering occurs prior to the applicable vesting date of the options, such options will be exercised upon the applicable vesting date. The five-year options and ten-year options will be treated as incentive stock options to the maximum extent permitted by law.
Each of the restricted stock and option awards vests as follows: 50% of the restricted shares and 50% of the options vested on the date of grant (October 1, 2012), with the remaining 50% of the shares and options vesting in three equal installments on each of December 31, 2012, 2013 and 2014, subject to the executive’s continued employment through the applicable vesting date and accelerated vesting as set forth in the applicable award agreement.
The awards were partially vested on the date of grant to be consistent with the requirements of the plan of reorganization, which required the issuance of the equity awards to certain of the Company’s key executives upon or as soon as practicable following the effective date of the plan of reorganization, as well as to compensate the loyalty and hard work of the NEOs and management through the Company’s restructuring. The Compensation Committee also provided for additional vesting dates through 2014 to retain and incentivize the key executives of the Company and tie their interests to the long-term interests and goals of the Company and its stockholders.
Automobile Allowance
Each NEO is entitled to an annual automobile allowance of $4,800 ($400 per month), payable in accordance with the Company’s regular payroll schedule. In addition, each of Messrs. Zaist, Severn and Doyle is entitled to Company-paid gasoline for use of his personal vehicle.
Retirement Savings
The Company has established a 401(k) retirement savings plan for its employees, including the NEOs, who satisfy certain eligibility requirements. Under the 401(k) plan, eligible employees may elect to contribute pre-tax amounts, up to a statutorily prescribed limit, to the 401(k) plan. For 2012, the prescribed annual limit was $17,000, plus up to an additional $5,500 “catch-up” contribution available for eligible participants over age 50. The Company believes that providing a vehicle for tax-preferred retirement savings through the 401(k) plan adds to the overall desirability of its executive compensation package and further incents the Company’s employees, including the NEOs, in accordance with the Company’s compensation policies.
Employment Agreements and Severance Benefits
General William Lyon and William H. Lyon
Effective February 25, 2012, the Company and California Lyon entered into employment agreements with General William Lyon and William H. Lyon, pursuant to which General Lyon will continue to serve as the Chairman of the Board of Directors and Chief Executive Officer of the Company and California Lyon, and William H. Lyon will continue to serve as President and Chief Operating Officer of the Company and California
101
Table of Contents
Lyon. On March 6, 2013, the Company’s board of directors established the new role of Executive Chairman for General Lyon. General Lyon will no longer serve as Chief Executive Officer of the Company but will continue to serve as Chairman of the Board. The Company’s board of directors appointed William H. Lyon to serve as Chief Executive Officer of the Company.
The term of each employment agreement expires on December 31, 2014, subject to earlier termination as provided in the employment agreement. Under the employment agreements, General Lyon and William H. Lyon are entitled to annual salaries of $1 million and $500,000 per year, respectively.
Under these employment agreements, each executive has the right to earn a bonus of up to 50% of base salary during the 2012 fiscal year, as determined by the Compensation Committee. After 2012, bonuses will be payable under a senior executive bonus program to be established by the Company’s Compensation Committee. The payment of a portion of the bonuses will be deferred as provided in the employment agreements.
In the event of the termination of the executive’s employment by California Lyon without “cause” as defined in each employment agreement or the termination by the executive of his employment for “good reason” as defined in each employment agreement, the executive is entitled to receive (i) a payment equal to the greater of 18 months of salary or the amount of salary otherwise payable for the remainder of the scheduled term of employment; (ii) any deferred and unpaid bonuses; and (iii) the amount of bonus that the executive would have earned in the year of termination. In addition, the executive is entitled to receive reimbursement for certain health benefits coverage through the earlier of the end of the originally scheduled term of employment (but not less than 6 months after the date of termination) and the date when the executive becomes covered under another group health or disability plan.
Under the employment agreements, “good reason” will be deemed to have occurred, among other things, (i) if California Lyon breaches the employment agreement (including a material reduction in compensation, title, positions, responsibilities, authority or duties), (ii) if the Company or California Lyon ceases to acquire or develop land or materially changes its business, or invests or engages in new businesses that compete with Lyon Management Group, Inc. and/or Lyon Capital Ventures, LLC, (iii) upon the relocation (without the executive’s consent) of the executive’s or California Lyon’s principal place of business outside of Orange County, California; or (iv) upon the occurrence of a change of control, as defined in the employment agreement.
In the event of a termination of the executive’s employment due to death or disability, the executive (or his estate) will be entitled to receive (i) a payment equal to the amount of salary otherwise payable for the remainder of the scheduled term of employment; (ii) any deferred and unpaid bonuses; and (iii) continued health insurance coverage for a specified period of time following termination.
Matthew Zaist, Colin Severn and Brian Doyle
Effective July 1, 2011, California Lyon entered into executive employment agreements with Messrs. Zaist, Severn and Doyle (the “Old Employment Agreements”). The Old Employment Agreements were replaced by executive employment agreements entered into effective as of September 1, 2012, between California Lyon and each of Messrs. Zaist, Severn and Doyle (the “New Employment Agreements” and, together with the Old Employment Agreements, the “Employment Agreements”).
The term of Mr. Zaist’s New Employment Agreement will expire on August 31, 2015, subject to earlier termination as provided in the agreement. The term of each of Mr. Severn’s and Mr. Doyle’s New Employment Agreements will be for an initial period expiring March 31, 2013, with automatic one-year renewal periods annually thereafter unless either California Lyon or the executive provides the other with written notice of nonrenewal at least 60 days prior to the expiration of the term. Pursuant to the New Employment Agreements, Messrs. Zaist, Severn and Doyle will continue to serve as the (1) Executive Vice President, (2) Vice President, Chief Financial Officer and Corporate Secretary, and (3) Senior Vice President and California Region President,
102
Table of Contents
respectively, of the Company and California Lyon. Effective as of March 6, 2013, the Company’s board of directors appointed Mr. Zaist to serve as the Company’s President and Chief Operating Officer. The description below summarizes the Employment Agreements, noting where the New Employment Agreements differ materially from the Old Employment Agreements.
Under the Employment Agreements, Messrs. Zaist, Severn and Doyle are entitled to annual base salaries of $350,000, $200,000 and $275,000, respectively. Each executive’s annual base salary is subject to increase (but not decrease) from time to time, in the sole discretion of the Compensation Committee.
Messrs. Zaist, Severn and Doyle each have the right to earn a cash bonus during the 2012 fiscal year with a target amount equal to 125%, 60% and 75% of base salary, respectively. Under his Old Employment Agreement, Mr. Zaist’s target bonus was equal to 70% of his base salary, but the Compensation Committee determined to increase his target bonus percentage to reflect his growing leadership role with the Company. After 2012, target bonus levels will be established by the Compensation Committee in its sole discretion, provided that for Mr. Zaist, the target cash bonus will not be less than 125% of his annual base salary. If awarded, the bonus would be paid in part in 2013 and in part in 2014, as provided for in the employment agreements.
In the event of a termination of the executive’s employment due to death or disability, by California Lyon for “cause” or by the executive without “good reason,” the executive (or his estate) will be entitled to receive no benefits other than accrued but unpaid base salary and vacation benefits through the date of termination.
Under the New Employment Agreements, in the event of the termination of the executive’s employment by California Lyon without “cause,” as defined in the employment agreements, or the termination by the executive of his employment for “good reason,” as defined below, the executive is entitled to receive (i) a payment equal to the product of (A) 1.5, in the case of Mr. Zaist, and 1.0, in the case of Messrs. Severn and Doyle, multiplied by (B) the sum of the executive’s annual salary plus target cash bonus at the time of his termination of employment; (ii) any deferred and unpaid bonuses; (iii) in the case of Mr. Zaist, accelerated vesting in full of all restricted stock awards and options granted under the 2012 Plan and, in the case of each of Messrs. Severn and Doyle, if such termination occurs on or within 12 months following a change in control as defined in the employment agreement (and the executive’s respective equity awards are not assumed by the successor corporation), accelerated vesting in full of all restricted stock awards and options granted at the time of execution of such executive’s employment agreement; (iv) reimbursement for certain health benefits coverage through the earlier of (A) the end of the six-month period (twelve-month period in the case of Mr. Zaist) beginning on the first day of the month following the month of the executive’s termination of employment and (B) the date when the executive becomes covered under another employer’s group health or disability plan; and (v) in the case of Mr. Zaist, a release of claims from California Lyon, the Company and their affiliates.
Each executive’s receipt of the foregoing severance benefits is conditioned on his execution of a general release in favor of California Lyon and his compliance with certain noncompetition and nonsolicitation obligations. The Employment Agreements also provide that the executives will be indemnified to the maximum extent permitted by applicable law.
Under the Employment Agreements, “good reason” generally includes (i) a material breach of the employment agreement by California Lyon (including a material reduction in authority, duties or base salary), (ii) a relocation of the executive’s or California Lyon’s principal place of business outside a specified area, or (iii) the occurrence of a “change in control”, as defined in the employment agreement. In addition, under Mr. Zaist’s New Employment Agreement, “good reason” also includes certain changes with respect to Mr. Zaist’s reporting relationship within the Company or in the senior management structure of the Company.
103
Table of Contents
Tax and Accounting Considerations
Section 162(m) of the Internal Revenue Code
Generally, Section 162(m) of the Internal Revenue Code of 1986, as amended, or the Code, disallows a tax deduction to any publicly held corporation for any individual remuneration in excess of $1.0 million paid in any taxable year to its chief executive officer and each of its other NEOs, other than its chief financial officer. However, remuneration in excess of $1.0 million may be deducted if, among other things, it qualifies as “performance-based compensation” within the meaning of the Code. Because the Company is not currently subject to Section 162(m), it currently is not a factor in the Company’s compensation decisions.
Section 280G of the Internal Revenue Code
Section 280G of the Code disallows a tax deduction with respect to excess parachute payments to certain executives of companies that undergo a change in control. In addition, Section 4999 of the Code imposes a 20% excise tax on the individual with respect to the excess parachute payment. Parachute payments are those amounts of compensation linked to or triggered by a change in control and may include, but are not limited to, bonus payments, severance payments, certain fringe benefits, and payments and acceleration of vesting from long-term incentive plans including stock options and other equity-based compensation. Excess parachute payments are parachute payments that exceed a threshold determined under Section 280G of the Code based on the executive’s prior compensation. In approving certain compensation arrangements for the NEOs in the future, the Compensation Committee may consider all elements of the cost to the Company of providing such compensation, including the potential impact of Section 280G of the Code. However, the Compensation Committee may, in its judgment, authorize compensation arrangements that could give rise to loss of deductibility under Section 280G of the Code and the imposition of excise taxes under Section 4999 of the Code when it believes that such arrangements are appropriate to attract and retain executive talent.
Section 409A of the Internal Revenue Code
Section 409A of the Code requires that “nonqualified deferred compensation” be deferred and paid under plans or arrangements that satisfy the requirements of the statute with respect to the timing of deferral elections, timing of payments and certain other matters. Failure to satisfy these requirements can expose employees and other service providers to accelerated income tax liabilities, penalty taxes and interest on their vested compensation under such plans. Accordingly, as a general matter, it is the Company’s intention to design and administer its compensation and benefits plans and arrangements for all of its employees and other service providers, including the NEOs, so that they are either exempt from, or satisfy the requirements of, Section 409A.
104
Table of Contents
Summary Compensation Table
The following table sets forth certain information with respect to compensation for the 2012, 2011 and 2010 fiscal years earned by, awarded to or paid to the NEOs.
Name and Principal Position | Year | Salary ($)(1) | Bonus ($) | Stock Awards ($)(2) | Option Awards ($)(2) | Non-Equity Incentive Plan Compensation ($) | Change in Pension Value and Nonqualified Deferred Compensation Earnings ($) | All Other Compensation ($) | Total ($) | |||||||||||||||||||||||||||
General William Lyon(3) | 2012 | 1,000,000 | 500,000 | — | — | — | — | — | 1,500,000 | |||||||||||||||||||||||||||
Chairman of the Board | 2011 | 1,000,000 | — | — | — | — | — | — | 1,000,000 | |||||||||||||||||||||||||||
and Executive Chairman (Principal Executive Officer) | 2010 | 1,000,000 | — | — | — | — | — | — | 1,000,000 | |||||||||||||||||||||||||||
Colin T. Severn | 2012 | 200,000 | 120,000 | 210,000 | 196,014 | — | — | — | 726,014 | |||||||||||||||||||||||||||
Vice President, Chief | 2011 | 200,000 | — | — | — | 165,497 | — | — | 365,497 | |||||||||||||||||||||||||||
Financial Officer and Corporate Secretary (Principal Financial Officer) | 2010 | 200,000 | — | — | — | 137,330 | — | — | 337,330 | |||||||||||||||||||||||||||
William H. Lyon(3) | 2012 | 453,847 | (3) | 250,000 | — | — | — | — | — | 703,847 | ||||||||||||||||||||||||||
Director, Chief | 2011 | 490,385 | — | — | — | — | — | — | 490,385 | |||||||||||||||||||||||||||
Executive Officer | 2010 | 486,538 | — | — | — | — | — | — | 486,538 | |||||||||||||||||||||||||||
Matthew R. Zaist(3) | 2012 | 350,000 | 437,500 | 1,260,000 | 1,192,966 | — | — | — | 3,240,466 | |||||||||||||||||||||||||||
President and Chief | 2011 | 330,769 | — | — | — | 324,620 | — | — | 655,389 | |||||||||||||||||||||||||||
Operating Officer | 2010 | 225,000 | — | — | — | 187,328 | — | — | 412,328 | |||||||||||||||||||||||||||
Brian W. Doyle | 2012 | 275,000 | 206,250 | 577,500 | 537,971 | — | — | 11,767 | (4) | 1,608,488 | ||||||||||||||||||||||||||
Senior Vice President | 2011 | 267,308 | — | — | — | 318,743 | — | — | 586,051 | |||||||||||||||||||||||||||
and California Region President | 2010 | 221,154 | — | — | — | 204,665 | — | — | 425,819 | |||||||||||||||||||||||||||
| (1) | The annual base salary for each of our NEOs is disclosed in “—Elements of Compensation—Base Salary” above. |
| (2) | The amounts shown represent the grant date fair value of restricted stock and option grants computed in accordance with FASB ASC Topic 718. Each restricted stock and option award granted in 2012 vests as follows: 50% of the shares and options vested on the date of grant, with the remaining 50% of the shares and options vesting in three equal installments on each of December 31, 2012, 2013 and 2014. |
| (3) | The NEO titles listed below are current titles effective as of March 6, 2013. As of December 31, 2012, General William Lyon served as Chairman of the Board and Chief Executive Officer, William H. Lyon served as Director, President and Chief Operating Officer, and Matthew R. Zaist served as Executive Vice President. |
| (4) | Reflects Mr. Lyon’s annual base salary of $500,000 with $46,153 in forgone salary in 2012 resulting from unpaid vacation. |
| (5) | Reflects Mr. Doyle’s annual automobile allowance of $4,800 and $6,967 of gasoline paid by the Company for Mr. Doyle’s personal vehicle. |
105
Table of Contents
Grants of Plan-Based Awards
The following table sets forth summary information regarding all grants of plan-based awards made to our NEOs for the year ended December 31, 2012:
| All other stock awards: Number of shares of stock (#)(1) | All other option awards: Number of securities underlying options (#)(1) | Exercise or base price of option awards ($/Sh) (2) | Grant date fair value of stock and option awards ($)(3) | |||||||||||||||||
Name | Grant Date | |||||||||||||||||||
Colin T. Severn | 10/01/2012 | 200,000 | 210,000 | |||||||||||||||||
| 10/01/2012 | 307,360 | 1.05 | 196,014 | |||||||||||||||||
Matthew R. Zaist | 10/01/2012 | 1,200,000 | 1,260,000 | |||||||||||||||||
| 10/01/2012 | 1,889,360 | 1.05 | 1,192,966 | |||||||||||||||||
Brian W. Doyle | 10/01/2012 | 550,000 | 577,500 | |||||||||||||||||
| 10/01/2012 | 843,740 | 1.05 | 537,971 | |||||||||||||||||
| (1) | Each of the restricted stock and option awards granted on October 1, 2012, vests as follows: 50% of the shares and options vested on the date of grant, with the remaining 50% of the shares and options vesting in three equal installments on each of December 31, 2012, 2013 and 2014, subject to the executive’s continued employment through the applicable vesting date and accelerated vesting as set forth in the applicable award agreement. |
| (2) | The Company’s board of directors determined the fair market value of the Class D common stock on the date of grant to be $1.05. |
| (3) | The value of the restricted stock and option awards shown represents the grant date fair value as prescribed under FASB ASC Topic 718, based on the fair market value of the Class D common stock on the date of grant, which was determined by the Company’s board of directors to be $1.05. The restricted shares have a grant date fair value of $1.05 per share. The five-year options have a grant date fair value of $0.401 per share subject to the option. The ten-year options have a grant date fair value of $0.712 per share subject to the option. |
106
Table of Contents
Outstanding Equity Awards at Fiscal Year-End
The following table sets forth summary information regarding the outstanding equity awards held by our NEOs at December 31, 2012:
| Option Awards | Stock Awards | |||||||||||||||||||||||
Name | Number of securities underlying unexercised options exercisable (#) | Number of securities underlying unexercised options unexercisable (#)(1) | Option exercise price ($) | Option expiration date | Number of shares or units of stock that have not vested (#) (1) | Market value of shares or units of stock that have not vested ($)(2) | ||||||||||||||||||
Colin T. Severn | 48,906 | 24,454 | 1.05 | 10/01/2017 | 66,667 | 70,000 | ||||||||||||||||||
| 156,000 | 78,000 | 1.05 | 10/01/2022 | |||||||||||||||||||||
Matthew R. Zaist | 326,240 | 163,120 | 1.05 | 10/01/2017 | 400,000 | 420,000 | ||||||||||||||||||
| 933,333 | 466,667 | 1.05 | 10/01/2022 | |||||||||||||||||||||
Brian W. Doyle | 134,493 | 67,247 | 1.05 | 10/01/2017 | 183,334 | 192,501 | ||||||||||||||||||
| 428,000 | 214,000 | 1.05 | 10/01/2022 | |||||||||||||||||||||
| (1) | The table below shows on a grant-by-grant basis the vesting schedules relating to the restricted stock and option awards that are represented in the above table. |
Name | Grant Date | Award Type | Vesting Schedule | |||
Colin T. Severn | 10/01/2012 | Restricted Stock | 33,333 shares vest on 12/31/2013 and 33,334 shares vest on 12/31/2014 | |||
| 10/01/2012 | 5-year Options | 12,227 options vest on each of 12/31/2013 and 12/31/2014 | ||||
| 10/01/2012 | 10-year Options | 39,000 options vest on each of 12/31/2013 and 12/31/2014 | ||||
Matthew R. Zaist | 10/01/2012 | Restricted Stock | 200,000 shares vest on each of 12/31/2013 and 12/31/2014 | |||
| 10/01/2012 | 5-year Options | 81,560 options vest on each of 12/31/2013 and 12/31/2014 | ||||
| 10/01/2012 | 10-year Options | 233,333 options vest on 12/31/2013 and 233,334 options vest on 12/31/2014 | ||||
Brian W. Doyle | 10/01/2012 | Restricted Stock | 91,667 shares vest on each of 12/31/2013 and 12/31/2014 | |||
| 10/01/2012 | 5-year Options | 33,623 options vest on 12/31/2013 and 33,624 options vest on 12/31/2014 | ||||
| 10/01/2012 | 10-year Options | 107,000 options vest on each of 12/31/2013 and 12/31/2014 |
| (2) | Represents the fair market value of the Company’s Class D common stock on December 31, 2012, of $1.05 per share, multiplied by the number of shares that have not vested. |
107
Table of Contents
Options Exercised and Stock Vested
The following table summarizes the option exercises and vesting of restricted stock awards for each of our NEOs for the year ended December 31, 2012. The vesting of stock awards does not indicate the sale of stock by an NEO.
| Option Awards | Stock Awards | |||||||||||||||
Name | Number of securities acquired on exercise (#) | Value realized on exercise ($) | Number of shares acquired on vesting (#) | Value realized on vesting ($)(1) | ||||||||||||
Colin T. Severn | — | — | 133,333 | 140,000 | ||||||||||||
Matthew R. Zaist | — | — | 800,000 | 840,000 | ||||||||||||
Brian W. Doyle | — | — | 366,666 | 384,999 | ||||||||||||
| (1) | Represents the fair market value of the Company’s Class D common stock on the date of vesting, which was $1.05 for awards vesting on both October 1, 2012, and on December 31, 2012, multiplied by the number of shares that vested on such date. |
Pension Benefits
The NEOs did not participate in or have account balances in qualified or nonqualified defined benefit plans sponsored by the Company during the fiscal year ended December 31, 2012.
Nonqualified Deferred Compensation
The NEOs did not participate in or have account balances in nonqualified defined contribution plans or other nonqualified deferred compensation plans maintained by the Company during the fiscal year ended December 31, 2012.
108
Table of Contents
Potential Payments Upon Termination or Change in Control
The following table summarizes the potential payments to our NEOs upon a “qualifying termination” of employment (a termination by us without cause or the executive’s resignation for good reason) or upon the executive’s termination of employment as a result of death or disability. As described above in “—Employment Agreements and Severance Benefits,” a resignation by the executive in connection with a “change of control” would be deemed a resignation for good reason. None of the NEOs is entitled to payments or benefits solely upon a change in control of the Company, without an accompanying termination of employment. In the event an NEO is terminated for cause, by the NEO for any reason other than good reason, or, in the case of Messrs. Severn, Zaist and Doyle, due to death or disability, such NEO is not entitled to any severance payments or benefits. The amounts shown assume that such termination was effective as of December 31, 2012, the last business day of fiscal year 2012, and are only estimates of the amounts that would be paid to such NEOs. The actual amounts to be paid can be determined only at the time of such termination of employment.
Name, Type of Termination | Cash Severance ($)(1) | Unpaid Bonuses ($)(2) | Equity Acceleration ($)(3) | Benefits Continuation ($)(4) | Total ($) | |||||||||||||||
General William Lyon | ||||||||||||||||||||
Qualifying Termination (no CIC) | 2,500,000 | — | — | 53,589 | 2,553,589 | |||||||||||||||
Qualifying Termination + CIC | 2,500,000 | — | — | 53,589 | 2,553,589 | |||||||||||||||
Death or Disability | 2,000,000 | — | — | 53,589 | 2,053,589 | |||||||||||||||
Colin T. Severn | ||||||||||||||||||||
Qualifying Termination (no CIC) | 320,000 | 30,000 | — | 13,397 | 363,397 | |||||||||||||||
Qualifying Termination + CIC | 320,000 | 30,000 | 70,000 | 13,397 | 433,397 | |||||||||||||||
Death or Disability | — | — | — | — | — | |||||||||||||||
William H. Lyon | ||||||||||||||||||||
Qualifying Termination (no CIC) | 1,250,000 | — | — | 36,259 | 1,286,259 | |||||||||||||||
Qualifying Termination + CIC | 1,250,000 | — | — | 36,259 | 1,286,259 | |||||||||||||||
Death or Disability | 1,000,000 | — | — | 36,259 | 1,036,259 | |||||||||||||||
Matthew R. Zaist | ||||||||||||||||||||
Qualifying Termination (no CIC) | 1,181,250 | 61,250 | 420,000 | 18,898 | 1,681,398 | |||||||||||||||
Qualifying Termination + CIC | 1,181,250 | 61,250 | 420,000 | 18,898 | 1,681,398 | |||||||||||||||
Death or Disability | — | — | — | — | — | |||||||||||||||
Brian W. Doyle | ||||||||||||||||||||
Qualifying Termination (no CIC) | 481,250 | 51,250 | — | 13,397 | 545,897 | |||||||||||||||
Qualifying Termination + CIC | 481,250 | 51,250 | 192,501 | 13,397 | 738,398 | |||||||||||||||
Death or Disability | — | — | — | — | — | |||||||||||||||
| (1) | In the event of a “qualifying termination” of employment, represents an amount equal to: for each of General Lyon and Mr. Lyon, his base salary for twenty-four months, through the remainder of his scheduled term of employment, plus the bonus that would have been earned in 2012, which is reflected here as the target bonus for 2012; for Mr. Zaist, 1.5 times the sum of his annual salary plus target cash bonus for 2012; for each of Messrs. Severn and Doyle, the sum of his annual salary plus target cash bonus for 2012. (Under the employment agreements for General Lyon and Mr. Lyon, severance amounts are calculated based on actual cash bonuses earned, while under the employment agreements for Messrs. Zaist, Severn and Doyle, severance amounts are calculated based on target cash bonus, which for 2012 was equal to the actual bonus awarded.) In the event of a termination of General Lyon’s or Mr. Lyon’s employment due to death or disability, represents an amount equal to his base salary for twenty-four months, through the remainder of his scheduled term of employment. |
| (2) | Represents bonus amounts earned by the NEO that had not been paid prior to the date of termination. |
| (3) | Represents the intrinsic value of the accelerated vesting of all unvested stock options and restricted stock awards granted on October 1, 2012, based on the fair market value of the Company’s Class D common stock on December 31, 2012, of $1.05 per share. Upon a termination of Mr. Zaist’s employment by the |
109
Table of Contents
| Company without cause or by him for good reason, whether or not following a change in control of the Company, Mr. Zaist is entitled to accelerated vesting in full of all outstanding restricted stock and stock option awards. Upon a termination of Mr. Severn’s or Mr. Doyle’s employment by the Company without cause or by him for good reason, in either case on or within twelve months following a change in control of the Company (and the executive’s respective equity awards are not assumed by the successor corporation), he is entitled to accelerated vesting in full of all stock options and restricted stock awards granted on October 1, 2012. |
| (4) | Represents the value of the continuation of health benefits for the following number of months: twenty-four months for Messrs. Lyon and Lyon, twelve months for Mr. Zaist, and six months for Messrs. Severn and Doyle. |
2012 Equity Incentive Plan
The purpose of the 2012 Equity Incentive Plan (the “2012 Plan”) is to provide an increased incentive for eligible employees, consultants and directors to assert their best efforts by conferring benefits based on the achievement of certain performance goals, to better align the interests of eligible participants with the interests of stockholders by providing an opportunity for increased stock ownership by such participants, and to encourage such participants to remain in the service of the Company. The 2012 Plan is also designed to permit us to make cash-based awards and equity-based awards intended to qualify as “performance-based compensation” under Section 162(m) of the Code.
Share Reserve
Under the 2012 Plan, 13,699,565 shares of our Class D common stock will be initially reserved for issuance pursuant to a variety of stock-based compensation awards, including stock options, stock appreciation rights, or SARs, restricted stock awards, restricted stock unit awards, deferred stock awards, deferred stock unit awards, dividend equivalent awards, stock payment awards and performance awards and other stock-based awards. Upon the “conversion date,” which is defined in our amended and restated certificate of incorporation, all shares of Class D common stock will convert into shares of Class A common stock and references to Class D common stock in the Plan and award agreements will automatically be updated to refer to Class A common stock.
The following counting provisions will be in effect for the share reserve under the 2012 Plan: (i) to the extent that an award forfeits, expires, settles in cash or becomes unexercisable without having been exercised in full, the shares that were not purchased or received or that were cancelled will become available for future grants under the 2012 Plan; (ii) if we repurchase shares that were issued pursuant to the exercise or settlement of an award, the reacquired shares will not be available for future grants under the 2012 Plan; and (iii) to the extent shares are tendered or withheld to satisfy the grant, exercise price or tax withholding obligation with respect to any award under the 2012 Plan, such tendered or withheld shares will be available for future grants under the 2012 Plan.
Administration
The Compensation Committee of our board of directors will administer the 2012 Plan unless our board of directors assumes authority for administration. The Compensation Committee must consist of one or more members of our board of directors, each of whom is intended to qualify as an “outside director” within the meaning of Section 162(m) of the Code (to the extent applicable), a “non-employee director” for purposes of Rule 16b-3 under the Exchange Act and an “independent director” within the meaning of the rules of any securities market on which shares of our common stock are traded. The 2012 Plan provides that the board or Compensation Committee may delegate its authority to grant awards to employees other than executive officers and certain senior executives of the company to a committee consisting of one or more members of our board of directors or one or more of our officers, to the extent permitted by applicable law.
110
Table of Contents
Subject to the terms and conditions of the 2012 Plan, the administrator has the authority to select the persons to whom awards are to be made, to determine the number of shares to be subject to awards and the terms and conditions of awards, and to make all other determinations and to take all other actions necessary or advisable for the administration of the 2012 Plan.
Eligibility
Options, SARs, restricted stock and all other stock-based and cash-based awards under the 2012 Plan may be granted to employees who are part of our senior management, senior project managers, key employees, consultants, non-employee directors or individuals who hold such positions with certain of our subsidiaries. Only employees of our company or certain of our subsidiaries may be granted incentive stock options, or ISOs.
Awards
The 2012 Plan provides that the administrator may grant or issue stock options, SARs, restricted stock, restricted stock units, or RSUs, deferred stock, deferred stock units, dividend equivalents, performance awards, stock payments and other stock-based and cash-based awards, or any combination thereof. Each award will be set forth in a separate agreement with the person receiving the award and will indicate the type, terms, conditions and limitations of the award.
| • | Nonqualified stock options, or NQSOs, will provide for the right to purchase shares of our Class D common stock at a specified price which may not be less than fair market value on the date of grant, and usually will become exercisable (at the discretion of the administrator) in one or more installments after the grant date, subject to the participant’s continued employment or service with us and/or subject to the satisfaction of corporate performance targets and individual performance targets established by the administrator. NQSOs may be granted for any term specified by the administrator that does not exceed ten years. |
| • | Incentive stock options, or ISOs, will be designed in a manner intended to comply with the provisions of Section 422 of the Code and will be subject to specified restrictions contained in the Code. Among such restrictions, ISOs must have an exercise price of not less than the fair market value of a share of Class D common stock on the date of grant, may only be granted to employees, and must not be exercisable after a period of ten years measured from the date of grant. In the case of an ISO granted to an individual who owns (or is deemed to own) at least 10% of the total combined voting power of all classes of our capital stock, the 2012 Plan provides that the exercise price must be at least 110% of the fair market value of a share of Class D common stock on the date of grant and the ISO must not be exercisable after a period of five years measured from the date of grant. |
| • | Restricted stock may be granted to any eligible individual and made subject to such restrictions as may be determined by the administrator. Restricted stock, typically, may be forfeited for no consideration or repurchased by us at the original purchase price if the conditions or restrictions on vesting are not met. In general, restricted stock may not be sold or otherwise transferred until restrictions are removed or expire. Recipients of restricted stock, unlike recipients of options, generally will have voting rights and will have the right to receive dividends, if any, prior to the time when the restrictions lapse; however, extraordinary dividends will generally be placed in escrow, and will not be released until restrictions are removed or expire. |
| • | Restricted stock units, or RSUs, may be awarded to any eligible individual subject to vesting conditions based on continued employment or service or on performance criteria established by the administrator. Like restricted stock, RSUs may not be sold, or otherwise transferred or hypothecated, until vesting conditions are removed or expire. Unlike restricted stock, stock underlying RSUs will not be issued until the RSUs have vested, and recipients of RSUs generally will have no voting or dividend rights prior to the time when vesting conditions are satisfied. |
111
Table of Contents
| • | Deferred stock awards and deferred stock unit awards represent the right to receive shares of our Class D common stock on a future date. Deferred stock may not be sold or otherwise hypothecated or transferred until issued. Deferred stock will not be issued until the deferred stock award has vested, and recipients of deferred stock generally will have no voting or dividend rights prior to the time when the vesting conditions are satisfied and the shares are issued. Deferred stock awards generally will be forfeited, and the underlying shares of deferred stock will not be issued, if the applicable vesting conditions and other restrictions are not met. |
| • | Stock appreciation rights, or SARs, may be granted in connection with stock options or other awards, or separately. SARs granted in connection with stock options or other awards typically will provide for payments to the holder based upon increases in the price of our Class D common stock over a set exercise price. The exercise price of any SAR granted under the 2012 Plan must be at least 100% of the fair market value of a share of our Class D common stock on the date of grant. Except as required by Section 162(m) of the Code with respect to a SAR intended to qualify as performance-based compensation as described in Section 162(m) of the Code, there are no restrictions specified in the 2012 Plan on the exercise of SARs or the amount of gain realizable therefrom, although restrictions may be imposed by the administrator in individual SAR agreements. SARs under the 2012 Plan will be settled in cash or shares of our common stock, or in a combination of both, at the election of the administrator. |
| • | Dividend equivalents represent the value of the dividends, if any, per share paid by us, calculated with reference to the number of shares covered by the award. Dividend equivalents may be settled in cash or shares and at such times as determined by the Compensation Committee or board of directors, as applicable. No dividend equivalents will be payable with respect to stock options or SARs. |
| • | Performance awards may be granted by the administrator on an individual or group basis. Generally, these awards, which may include performance stock units, will be based upon specific performance targets and may be paid in cash or in Class D common stock or in a combination of both. Performance awards may also include bonuses that may be granted by the administrator on an individual or group basis and which may be payable in cash or in common stock or in a combination of both. |
| • | Stock payments may be authorized by the administrator in the form of Class D common stock or an option or other right to purchase Class D common stock as part of a deferred compensation or other arrangement in lieu of all or any part of compensation, including bonuses, that would otherwise be payable in cash to the employee, consultant or non-employee director. |
Change in Control; Adjustments of Awards
For any award granted under the 2012 Plan, the terms of the applicable award agreement may provide that in the event of a “change in control” of the Company (as defined in the 2012 Plan), the award will be subject to accelerated vesting such that 100% of such awards will become vested and exercisable or payable, as applicable, prior to the consummation of such transaction. The administrator may also make appropriate adjustments to awards under the 2012 Plan in the event of a change in control or certain other unusual or nonrecurring events or transactions.
In the event of any merger, reorganization, consolidation, recapitalization, dividend or distribution (whether in cash, shares or other property), stock split, reverse stock split, spin-off or similar transaction affecting the number of outstanding shares of our common stock or the share price of our common stock, the administrator, in its sole discretion, will make appropriate, proportionate adjustments and substitutions to the 2012 Plan and award agreements, including adjustments to: (i) the aggregate number, class and kind of securities that may be delivered under the 2012 Plan; (ii) in the aggregate or to any one participant, the number, class and kind of securities subject to outstanding awards granted under the 2012 Plan; and/or (iii) the grant or exercise price per share of any outstanding awards under the 2012 Plan.
112
Table of Contents
Amendment and Termination
The administrator of the 2012 Plan may alter, amend, suspend or terminate the 2012 Plan at any time and from time to time. However, we must obtain stockholder approval to the extent required by applicable law, rule or regulation (including any applicable stock exchange rule).
Expiration Date
No award may be granted pursuant to the 2012 Plan after September 30, 2022. Any award that is outstanding on the expiration date of the 2012 Plan will remain in force according to the terms of the 2012 Plan and the applicable award agreement.
Effective Date
The 2012 Plan became effective on October 1, 2012, when it was approved and adopted by our board of directors. The 2012 Plan was subsequently approved by our stockholders on October 10, 2012.
Compensation Risk Management
In March 2013, management assessed our compensation design, policies and practices to determine whether any risks arising from our compensation design, policies and practices are reasonably likely to have a material adverse effect on us. The Compensation Committee reviewed and agreed with management’s conclusion that our compensation policies and practices do not create such risks. In doing so, the Compensation Committee considered various features of our compensation policies and practices that discourage excessive or unnecessary risk taking, including but not limited to the following:
| • | effective balance in the design of our compensation programs, including: (i) cash and equity pay mix, (ii) short- and longer-term performance focus, (iii) corporate, business unit, and individual performance focus and measurement; and (iv) financial and non-financial performance measurement together with top management and board discretion to manage pay appropriately; and |
| • | stock ownership guidelines and independent Compensation Committee oversight of our compensation policies and practices. |
113
Table of Contents
SECURITY OWNERSHIP OF CERTAIN BENEFICIAL OWNERS AND MANAGEMENT
The following table sets forth the number of shares of our capital stock beneficially owned as of March 11, 2013, by (i) each person known by us to be the beneficial owner of more than 5% of the outstanding shares of our capital stock, (ii) each of our named executive officers and directors and (iii) all officers and directors as a group. Unless otherwise indicated in the table, the persons and entities named in the table have sole voting and sole investment power with respect to the shares set forth opposite the stockholder’s name, subject to community property laws, where applicable. Unless otherwise noted below, the address of each stockholder below is c/o William Lyon Homes, 4490 Von Karman Avenue, Newport Beach, California 92660.
| CLASS A COMMON STOCK(1) | CLASS B COMMON STOCK(1) | CLASS C COMMON STOCK(1) | CLASS D COMMON STOCK(1) | CONVERTIBLE PREFERRED STOCK(1) | PERCENT OF TOTAL VOTING POWER(2)(3) | |||||||||||||||||||||||||||||||||||||||||
NAME | TITLE | Number | Percent of Class | Number | Percent of Class | Number | Percent of Class | Number | Percent of Class | Number | Percent of Class | |||||||||||||||||||||||||||||||||||
Named Executive Officers and Directors: | ||||||||||||||||||||||||||||||||||||||||||||||
William H. Lyon | Director, Chief Executive Officer | 24,199 | (6) | * | 47,201,842 | (4) | 100 | % | — | — | 529,411 | (9) | 9.6 | % | — | — | 36.1 | % | ||||||||||||||||||||||||||||
Colin T. Severn | Vice President, Chief Financial Officer and Corporate Secretary | — | — | — | — | — | — | 441,840 | (5) | 7.7 | % | — | — | * | ||||||||||||||||||||||||||||||||
General William Lyon | Director, Chairman of Board & Executive Chairman | — | — | — | — | — | — | — | — | — | — | — | ||||||||||||||||||||||||||||||||||
Matthew R. Zaist | President & Chief Operating Officer | — | — | — | — | — | — | 2,411,389 | (7) | 35.7 | % | — | — | * | ||||||||||||||||||||||||||||||||
Brian W. Doyle | Vice President and Southern California Region President | — | — | — | — | — | — | 1,175,458 | (8) | 19.4 | % | — | — | * | ||||||||||||||||||||||||||||||||
Douglas K. Ammerman | Director | — | — | — | — | — | — | 130,529 | (9) | 2.4 | % | — | — | * | ||||||||||||||||||||||||||||||||
Michael Barr | Director | — | — | — | — | — | — | — | — | — | — | * | ||||||||||||||||||||||||||||||||||
Gary H. Hunt | Director | — | — | — | — | — | — | 202,647 | (9) | 3.7 | % | — | — | * | ||||||||||||||||||||||||||||||||
Matthew R. Niemann | Director | — | — | — | — | — | — | 130,529 | (9) | 2.4 | % | — | — | * | ||||||||||||||||||||||||||||||||
Nathaniel Redleaf | Director | — | — | — | — | — | — | — | (10) | — | — | — | * | |||||||||||||||||||||||||||||||||
Lynn Carlson Schell | Director | — | — | — | — | — | — | 130,529 | (9) | 2.4 | % | — | — | * | ||||||||||||||||||||||||||||||||
All executive officers and directors as a group (17 individuals) | 24,199 | — | 47,201,842 | (4) | 100 | % | — | — | 8,115,694 | (11) | 93.6 | % | — | — | 39.0 | % | ||||||||||||||||||||||||||||||
5% Stockholders(not listed above): | ||||||||||||||||||||||||||||||||||||||||||||||
Luxor Capital Group LP(12) | 20,817,163 | 29.7 | % | — | — | 15,355,810 | 95.9 | % | — | — | 61,509,204 | 79.9 | % | 37.1 | % | |||||||||||||||||||||||||||||||
114
Table of Contents
| CLASS A COMMON STOCK(1) | CLASS B COMMON STOCK(1) | CLASS C COMMON STOCK(1) | CLASS D COMMON STOCK(1) | CONVERTIBLE PREFERRED STOCK(1) | PERCENT OF TOTAL VOTING POWER(2)(3) | |||||||||||||||||||||||||||||||||||||||||
NAME | TITLE | Number | Percent of Class | Number | Percent of Class | Number | Percent of Class | Number | Percent of Class | Number | Percent of Class | |||||||||||||||||||||||||||||||||||
Colony Capital, LLC(13) | 10,000,000 | 14.3 | % | — | — | — | — | — | — | — | — | 3.8 | % | |||||||||||||||||||||||||||||||||
Paulson & Co. Inc.(14) | 15,238,095 | 21.7 | % | — | — | — | — | — | — | 12,173,913 | 15.8 | % | 10.4 | % | ||||||||||||||||||||||||||||||||
| * | Denotes less than 1.0% of beneficial ownership. |
| (1) | Beneficial ownership is determined in accordance with SEC rules, and includes any shares as to which the stockholder has sole or shared voting power or investment power, and also any shares which the stockholder has the right to acquire within 60 days of the date hereof, whether through the exercise or conversion of any stock option, convertible security, warrant or other right. The indication herein that shares are beneficially owned is not an admission on the part of the stockholder that he, she or it is a direct or indirect beneficial owner of those shares. |
| (2) | Each share of Class A Common Stock, Class C Common Stock and Class D Common Stock are entitled to one vote per share. Each share of Class B Common Stock is entitled to two votes per share. Each share of Convertible Preferred Stock has the right to one vote for each share of Class C Common Stock into which such share could be converted. The current conversion ratio for Convertible Preferred Stock into Class C Common Stock is one to one. |
| (3) | Calculation of total voting power includes the following (which represent the total number of shares of each class that are outstanding): (a) 70,121,378 shares of Class A Common Stock, (b) 31,464,548 shares of Class B Common Stock, (c) 16,020,338 shares of Class C Common Stock, (d) 5,501,432 shares of Class D Common Stock, (e) 77,005,744 shares of Convertible Preferred Stock and (f) 15,737,294 shares of Class B Common Stock issuable upon the exercise of a warrant held by Lyon Shareholder 2012, LLC, or Lyon LLC, or the Class B Warrant. The Class B Warrant is exercisable at any time prior to February 24, 2017. |
| (4) | Represents 31,464,548 shares of Class B Common Stock and the Class B Warrant held by Lyon Shareholder 2012, LLC, or Lyon LLC. The members of Lyon LLC are the LYON SHAREHOLDER 2012 IRREVOCABLE TRUST NO. 1 established December 24, 2012, the LYON SHAREHOLDER 2012 IRREVOCABLE TRUST NO. 2 established December 24, 2012 and the WILLIAM HARWELL LYON SEPARATE PROPERTY TRUST established July 28, 2000, the Trustee of each of which is William Harwell Lyon (our Chief Executive Officer and Director). The manager of Lyon LLC is William Harwell Lyon. William Harwell Lyon may be deemed to have voting and investment power of the securities held by Lyon LLC. William Harwell Lyon disclaims beneficial ownership of such securities, except to the extent of his pecuniary interest therein. The address of Lyon LLC is 4490 Von Karman Avenue, Newport Beach, California 92660. |
| (5) | Represents (i) 204,906 shares of Class D Common Stock subject to options exercisable within 60 days of March 11, 2013 and (ii) 236,934 restricted shares of Class D Common Stock. |
| (6) | Represents 24,199 shares of Class A Common Stock held by The William Harwell Lyon Separate Property Trust established July 28, 2000. William Harwell Lyon (our Chief Executive Officer and Director) is Trustee of the trust and holds voting and dispositive power over these shares. William Harwell Lyon disclaims beneficial ownership over these shares except to the extent of his pecuniary interest therein. The address of The William Harwell Lyon Separate Property Trust is c/o William H. Lyon, PO Box 8858, Newport Beach, CA 92658-8858. |
| (7) | Represents (i) 1,259,573 shares of Class D Common Stock subject to options exercisable within 60 days of March 11, 2013 and (ii) 1,151,816 restricted shares of Class D Common Stock. |
| (8) | Represents (i) 562,493 shares of Class D Common Stock subject to options exercisable within 60 days of March 11, 2013 and (ii) 612,965 restricted shares of Class D Common Stock. |
| (9) | Represents restricted shares of Class D Common Stock. |
| (10) | On December 5, 2012, the Company cancelled Mr. Redleaf’s grant of 57,000 restricted shares of Class D Common Stock, and Mr. Redleaf no longer holds this Restricted Stock grant. |
| (11) | Represents (i) 4,944,164 shares of Class D Common Stock and (ii) 3,171,530 shares of Class D Common Stock subject to options exercisable within 60 days of March 11, 2013. |
| (12) | Luxor Capital Group, LP acts as the investment manager of proprietary private investment funds and separately managed accounts that own the shares, collectively referred to as the “Luxor Investors.” Luxor Management, LLC is the general partner of Luxor Capital Group, LP. Christian Leone is the managing member of Luxor Management, LLC. Luxor Capital Group, LP, Luxor Management, LLC and Christian Leone are deemed to have shared voting and dispositive power over the securities held by each of the Luxor Investors. The address of Luxor Capital Group, LP is 1114 Avenue of the Americas, 29th Floor, New York City, New York 10036. |
| (13) | Represents shares held by ColFin WLH Land Acquisitions, LLC, a Delaware limited liability company, or “ColFin.” ColFin is indirectly managed and controlled by Colony Capital, LLC, a registered investment advisor. Thomas J. Barrack, Jr. is Chief Executive Officer and the sole managing member of Colony Capital, LLC, with sole voting and dispositive power over the securities held by ColFin. As a result, Mr. Barrack may be deemed to have indirect beneficial ownership of the shares held by ColFin through ultimate control over the entities that own or control ColFin, but the foregoing disclosure shall not be construed as an admission of such. The address of Colony Capital, LLC is 2450 Broadway, 6th Floor, Santa Monica, CA 90404. |
| (14) | Paulson & Co. Inc. is an investment advisor registered under the Investment Advisors Act of 1940 that furnishes investment advice to and manages various onshore and offshore investment funds and separately managed accounts, or, collectively, the “Funds”. In its role as investment advisor and manager of the Funds, Paulson & Co. Inc. possesses voting and/or investment power over the ordinary shares owned by the Funds. As the President and sole Director of Paulson & Co. Inc., John Paulson may be deemed to have voting and/or investment power over such shares. The address for the Funds is c/o Paulson & Co. Inc., 1251 Avenue of the Americas, NY, NY 10020. |
115
Table of Contents
Equity Compensation Plan Information
The following table summarizes information about our equity securities that may be issued upon the exercise of options, warrants and rights under all our equity compensation plans, as of December 31, 2012:
Plan Category | Number of Securities to be Issued Upon Exercise of Outstanding Options, Warrants and Rights (a) | Weighted- Average Exercise Price of Outstanding Options, Warrants and Rights (b) | Number of Securities Remaining Available for Future Issuance Under Equity Compensation Plans (Excluding Securities Reflected in Column (a)) (c) | |||||||||
Equity compensation plans approved by security holders | 20,494,596 | (1) | $ | 1.83 | (2) | 6,442,970 | (3) | |||||
Equity compensation plans not approved by security holders | — | $ | — | — | ||||||||
Total | 20,494,596 | $ | 1.83 | 6,442,970 | ||||||||
| (1) | Represents an outstanding warrant to purchase 15,737,294 shares of the Company’s Class B common stock, and an aggregate of 4,757,302 outstanding options to purchase shares of Class D common stock of the Company, of which 1,115,302 represent “five-year” options and 3,642,000 represent “ten-year” options granted to certain officers of California Lyon. |
| (2) | Represents the weighted average exercise price of an outstanding warrant to purchase 15,737,294 shares of the Company’s Class B common stock at $2.07 per share and 4,757,302 outstanding options to purchase shares of Class D common stock of the Company at $1.05 per share. |
| (3) | Represents the number of securities remaining available for issuance under the Company’s 2012 Equity Incentive Plan. |
116
Table of Contents
MARKET FOR OUR COMMON STOCK AND RELATED STOCKHOLDER MATTERS
No Public Market for Capital Stock
At present, there is no established public trading market for any of our capital stock. We intend to have a registered broker-dealer apply to have our capital stock quoted on the Over-the-Counter Bulletin Board. However, we cannot offer any assurance about the development or an active trading market or as to whether the market price of our capital stock will equal or exceed the price paid for them.
Historical Trading of our Common Stock on the New York Stock Exchange and the OTC Bulletin Board
The Company’s predecessor, The Presley Companies, or Presley, was formed in 1956. In 1987, General William Lyon, then serving as both our Chairman of the Board and Chief Executive Officer, purchased 100% of the stock of Presley, which subsequently went public in 1991 and was listed on the New York Stock Exchange, or the NYSE, under the symbol “PDC.” In 1999, Presley acquired William Lyon Homes, Inc. and changed its name to William Lyon Homes and its ticker symbol to “WLS.” Our common stock was traded on the NYSE until June 13, 2006. We were taken private by way of a tender offer by General William Lyon. Over-the-counter trading of the Company’s common stock (OTC Pink sheets: WLSM.PK) was also discontinued and the Company continued as a privately held company.
Holders
As of March 11, 2013, there are approximately 1,687 holders of record for our Class A Common Stock, one holder of record for our Class B Common Stock and related warrant, twelve holders of record for our Class C Common Stock, seventeen holders of our Class D Common Stock and thirteen holders of record for our Convertible Preferred Stock.
Convertible Common Equity and Warrants
The issued and outstanding 31,464,548 shares of Class B Common Stock, 16,020,338 shares of Class C Common Stock, 5,501,432 shares of Class D Common Stock and 77,005,744 shares of Convertible Preferred Stock are convertible into Class A Common Stock. The issued and outstanding shares of Convertible Preferred Stock are also convertible into Class C Common Stock. See “Description of Capital Stock” below.
Additionally, the holders of Class B Common Stock hold a warrant to purchase 15,737,294 shares of Class B Common Stock at an exercise price of $2.07 per share. The expiration date of the Class B Warrant is February 24, 2017. As of March 11, 2013, we also have outstanding stock options to purchase 4,757,303 shares of the Company’s Class D common stock at an exercise price of $1.05 per share. To the extent these options are exercised, there will be further dilution.
Dividends
Holders of our Convertible Preferred Stock are entitled to receive cumulative dividends at a rate of 6% per annum consisting of (i) cash dividends at the rate of 4% paid quarterly in arrears, and (ii) accreting dividends accruing at the rate of 2% per annum. Such dividend rights are described more fully in “Description of Capital Stock” below. With the exception of the dividends to be paid out to holders of our Convertible Preferred Stock, the Company does not intend to declare or pay cash dividends in the foreseeable future. Any determination to pay dividends to holders of our common stock will be at the discretion of our board of directors. The payment of cash dividends is restricted under the terms of the indenture governing California Lyon’s 8.5% Senior Notes due 2020.
117
Table of Contents
CERTAIN RELATIONSHIPS AND RELATED PARTY TRANSACTIONS
Policies and Procedures for Review, Approval or Ratification of Transactions with Related Persons
Our board of directors plans to adopt a written statement of policy for the evaluation of and the approval, disapproval and monitoring of transactions involving us and “related persons.” For purposes of this policy, “related persons” will include our executive officers, directors and director nominees or their immediate family members, or stockholders owning five percent or more of our voting securities.
Our related person transactions policy will require:
| • | that any transaction in which a related person has a material direct or indirect interest and which exceeds $120,000, such transaction referred to as a “related person transaction,” and any material amendment or modification to a related person transaction, be evaluated and approved or ratified by our audit committee or by the disinterested members of the audit committee; and |
| • | that any employment relationship or transaction involving an executive officer and any related compensation solely resulting from that employment relationship or transaction must be approved by the compensation committee of our board of directors or recommended by the compensation committee to the board of directors for its approval. |
In connection with the review and approval or ratification of a related person transaction:
| • | management must disclose to the audit committee or the disinterested members of the audit committee, as applicable, the material terms of the related person transaction, including the approximate dollar value of the amount involved in the transaction, and all the material facts as to the related person’s direct or indirect interest in, or relationship to, the related person transaction; |
| • | management must advise the audit committee or the disinterested members of the audit committee, as applicable, the material terms of the related person transaction, including the approximate dollar value of the amount involved in the transaction, and all the material facts as to the related person’s direct or indirect interest in, or relationship to, the related person transaction; |
| • | management must advise the audit committee or the disinterested members of the audit committee, as applicable, as to whether the related person transaction will be required to be disclosed in our SEC filings. To the extent it is required to be disclosed, management must ensure that the related person transaction is disclosed in accordance with SEC rules; and |
| • | management must advise the audit committee or the disinterested members of the audit committee, as applicable, as to whether the related person transaction constitutes a “personal loan” for purposes of Section 402 of Sarbanes-Oxley. |
In addition, the related person transaction policy will provide that the audit committee, in connection with any approval or ratification of a related person transaction involving a non-employee director or director nominee, should consider whether such transaction would compromise the director or director nominee’s status as an “independent,” “outside” or “non-employee” director, as applicable, under the rules and regulations of the SEC, the NYSE and the Internal Revenue Code of 1986, as amended.
Employment Agreements
We have entered into employment agreements with certain of our executive officers. For more information regarding these agreements, see “Compensation Discussion and Analysis—Employment Agreements and Severance Benefits.”
118
Table of Contents
Indemnification Agreements and Liability Insurance Policy
The company has entered into indemnification agreements with certain of our executive officers and each of our directors pursuant to which the company has agreed to indemnify such executive officers and directors against liability incurred by them by reason of their services as an executive officer or director to the fullest extent allowable under applicable law. We also provide liability insurance for each director and officer for certain losses arising from claims or charges made against them while acting in their capacities as our directors or officers.
Certain Relationships and Transactions
We describe below transactions and series of similar transactions that have occurred this year or during our last three fiscal years to which we were a party or will be a party in which:
| • | the amounts involved exceeded or will exceed $120,000; and |
| • | a director, executive officer, holder of more than 5% of our voting securities or any member of their immediate family had or will have a direct or indirect material interest. |
The following persons and entities that participated in the transactions listed in this section were related persons at or immediately following the time of the transaction.
General William Lyon.General Lyon is our Executive Chairman and Chairman of our board of directors.
William H. Lyon.Mr. Lyon is our President and Chief Executive Officer and a member of our board of directors.
Matthew R. Niemann. Mr. Niemann is a member of our board of directors.
Luxor Capital Group LP. Entities affiliated with Luxor Capital Group LP hold over 5% of our outstanding capital stock.
Colony Capital, LLC. Entities affiliated with Colony Capital, LLC hold over 5% of our outstanding Class A Common Stock.
Paulson & Co. Inc.An entity affiliated with Paulson & Co. Inc. holds over 5% of our outstanding Class A Common Stock and 5% of our Convertible Preferred Stock.
Payments Made to an Entity Where a Company Director is an Officer and Shareholder
Matthew R. Niemann, a member of our board of directors, serves as Managing Director and Head of Houlihan Lokey Howard & Zukin Financial Advisors, Inc.’s, or Houlihan, Real Estate Advisory Group and owns shares of Houlihan. Houlihan received payments from the Company in 2011 and 2012 for services performed on behalf of creditors during the recent Chapter 11 restructuring, and for services performed related to the Company’s Senior Notes offering and debt refinancing. The Company paid $1.2 million and $0.2 million to Houlihan during the years ended December 31, 2011 and 2012, respectively.
Transactions with Certain Beneficial Owners
On February 25, 2012, in connection with the consummation of the principal transactions contemplated by the Company’s Prepackaged Joint Plan of Reorganization, or the Plan, entities affiliated with Luxor Capital Group LP, or Luxor, acquired (i) 21,427,135 shares of Parent’s Class A Common Stock, in exchange for the old senior notes held, (ii) 15,445,838 shares of Parent’s Class C Common Stock for approximately $9.5 million in cash consideration and (iii) 61,509,204 shares of Parent’s Convertible Preferred Stock for approximately $47.4 million in cash. As of March 11, 2013, Luxor holds approximately 37.1% of the total voting power of Parent’s outstanding capital stock. See Note 2 of “Notes to Consolidated Financial Statements” for additional information. Nathaniel Redleaf, one of Parent’s directors, has served in an analyst capacity at Luxor Capital Group LP since 2006.
119
Table of Contents
On June 28, 2012, California Lyon consummated the purchase of certain real property (comprising approximately 165 acres) in San Diego County, California; San Bernardino County, California; Maricopa County, Arizona; and Clark County, Nevada, representing seven separate residential for sale developments, comprising over 1,000 lots. The aggregate purchase price of the property was $21,500,000. The Company paid $11,000,000 cash, and issued 10,000,000 shares of Class A Common Stock of Parent, or approximately 18.3% of Parent’s then outstanding Class A Common Stock, to investment vehicles managed by affiliates of Colony Capital, LLC, or Colony, for consideration of the property. As of March 11, 2013, Colony holds approximately 3.8% of the total voting power of Parent’s outstanding capital stock.
California Lyon was a party to that certain Amended and Restated Senior Secured Term Loan Agreement, or the Amended Term Loan Agreement, dated February 25, 2012, with ColFin WLH Funding, LLC, as Administrative Agent and as a lender. ColFin WLH Funding, LLC is an affiliate of Colony. The principal amount outstanding under the Amended Term Loan Agreement was $235.0 million and bore interest at a rate of 10.25% per annum with interest payments of $24.1 million annually. As discussed in the section entitled “Description of Certain Indebtedness,” California Lyon used a portion of the proceeds from the sale of its 8.5% Senior Notes due 2020 to pay in full the amounts outstanding under the Amended Term Loan Agreement.
On October 12, 2012, the Company entered into a Subscription Agreement, or the Subscription Agreement, between the Company and WLH Recovery Acquisition LLC, a Delaware limited liability company and investment vehicle managed by affiliates of Paulson & Co. Inc., or Paulson, pursuant to which, the Company issued to Paulson (i) 15,238,095 shares of the Company’s Class A Common Stock for $16,000,000 in cash and (ii) 12,173,913 shares of the Company’s Convertible Preferred Stock for $14,000,000 in cash, for an aggregate purchase price of $30,000,000. As of March 11, 2013, Paulson currently holds approximately 10.4% of the total voting power of Parent’s outstanding capital stock. Michael Barr, who was appointed as a member of our board of directors on November 7, 2012, to fill a newly created board seat in connection with the Subscription Agreement, is currently a partner of Paulson, which he joined in 2008.
Agreements with Entities Controlled by General William Lyon and William H. Lyon
For the years ended December 31, 2012, 2011, and 2010, the Company incurred reimbursable on-site labor costs of $303,000, $318,000, and $217,000, respectively, for providing customer service to real estate projects developed by entities controlled by General William Lyon and William H. Lyon, of which $7,000 and $24,000 was due to the Company at December 31, 2012 and 2011, respectively, all of which has been paid. The Company earned fees of $157,000, $130,000, and $24,000, respectively, for tax and accounting services performed for entities controlled by General William Lyon and William H. Lyon during the years ended December 31, 2012, 2011 and 2010. The Company does not expect to incur reimbursable on-site labor costs or to perform tax and accounting services for entities controlled by General William Lyon or William H. Lyon beyond 2012.
The Company earned fees of $232,000, $362,000, and $426,000 during the years ended December 31, 2012, 2011 and 2010, respectively, related to a Human Resources and Payroll Services contract between William Lyon Homes, Inc, and an entity controlled by General William Lyon and William H. Lyon. Effective April 1, 2011, the Company and this entity amended the Human Resources and Payroll Services contract to provide for a payment by the affiliate to the Company of a base monthly fee of $21,335 and a variable monthly fee equal to $23 multiplied by the number of active employees employed by such entity (which initially resulted in a variable monthly fee of approximately $8,000). The amended contract also provided that the Company would be reimbursed by such affiliate for a pro rata share of any bonuses paid to the Company’s Human Resources staff (other than any bonus paid to the Vice President of Human Resources). The Company believes that the compensation paid to it for the services provided to the affiliate was at a market rate of compensation, and that as a result of the fees paid to the Company under this contract, the overall cost to the Company of its Human Resources department was reduced. This contract expired on August 31, 2012 and was not renewed. Any future services provided to the affiliate will be on an as needed basis and will be paid for based on an hourly rate.
120
Table of Contents
Rent Paid to a Trust of which William H. Lyon is the Sole Beneficiary
In each of the three years ended December 31, 2012, 2011 and 2010, the Company incurred charges of $0.8 million related to rent on the Company’s corporate office, which is owned by two trusts of which William H. Lyon is the sole beneficiary. For the year ended December 31, 2012, the Company has made rental payments totaling $0.8 million. The current lease expires in March 2013 and the Company has decided to relocate its corporate office upon expiration of the lease. The Company has entered into a lease for the new location with an unrelated third party.
Charges Incurred Related to the Charter, Use and Sale of Aircraft
Note Receivable from Sale of Aircraft
Presley CMR, Inc., a California corporation, or Presley CMR, and wholly owned subsidiary of California Lyon, entered into an Aircraft Purchase and Sale Agreement, or PSA, with an affiliate of General William Lyon to sell the aircraft, owned by the Company. The PSA provides for an aggregate purchase price for the aircraft of $8.3 million (which value was the appraised fair market value of the aircraft), which consists of: (i) cash in the amount of $2.1 million which was paid at closing and (ii) a promissory note from the affiliate in the amount of $6.2 million, which is included in receivables in the accompanying consolidated balance sheet. The closing of this sale occurred on September 9, 2009. The note is secured by the aircraft. As part of the Company’s fresh start accounting, the note was adjusted to its fair value of $5.2 million. The discount on the fresh start adjustment is amortized over the remaining life of the note. The note requires semiannual interest payments to California Lyon of approximately $132,000. The note is due in September 2016.
Certain Family Relationships
William H. Lyon, one of the Company’s directors and the Chief Executive Officer of the Company, is the son of General William Lyon. General William Lyon is the Company’s Chairman of the board of directors and the Chief Executive Chairman. Mr. Lyon’s compensation is disclosed in the Summary Compensation Table above.
Director Independence
Based upon information requested from and provided by each director concerning his or her background, employment and affiliations, including family relationships, with us, our senior management and our independent registered public accounting firm, our board of directors has determined that all but two of our directors, General William Lyon and William H. Lyon, are independent directors under standards established by the SEC and the NYSE.
121
Table of Contents
The following table sets forth information with respect to the number of shares of registrable stock owned by each selling stockholder that may be offered pursuant to this prospectus. The selling stockholders acquired the registrable stock offered hereby in connection with one of the following transactions, as described more fully elsewhere in the prospectus: (i) the consummation of the Company’s Joint Plan of Reorganization on February 25, 2012, (ii) a real estate purchase transaction that took place on June 28, 2012, with the affiliate of Colony Capital, LLC that is listed below, (iii) a privately negotiated stock issuance that took place on October 12, 2012, with the affiliate of Paulson & Co., Inc. that is listed below or (iv) transfers or other dispositions of the registrable stock that occurred after the Company’s original issuance of such securities in one of the corporate transactions described in (i), (ii) and (iii) immediately above.
The information in the following table is based on information provided by or on behalf of the selling stockholders on or before March 11, 2013. The selling stockholders may offer all, some or none of the registrable stock. Because the selling stockholders may offer all or some portion of the registrable stock, we cannot estimate the amount of the registrable stock that will be held by the selling stockholders upon completion of this offering. In addition, the selling stockholders identified below may have sold, transferred or otherwise disposed of all or a portion of their registrable stock since the date on which they provided the information regarding their registrable stock. Information concerning other selling stockholders will be set forth in prospectus supplements or post-effective amendments from time to time, if required.
The number of shares of registrable stock shown below in the columns representing the Class A Common Stock, Class C Common Stock and Convertible Preferred Stock registered hereby assume, where applicable: (i) the conversion of all outstanding shares of our Convertible Preferred Stock offered hereby into an aggregate of 77,005,744 shares of our Class C Common Stock, (ii) the conversion of all outstanding shares of our Class C Common Stock offered hereby (including such number of shares convertible from our Convertible Preferred Stock) into an aggregate of 92,936,054 shares of our Class A Common Stock and (iii) the conversion of all outstanding shares of our Class B Common Stock into an aggregate of 31,464,548 shares of our Class A Common Stock.
As indicated in the footnotes to the table below, certain selling stockholders have advised us that they are (i) broker-dealers registered pursuant to Section 15 of the Exchange Act or (ii) affiliates of broker-dealers. Each holder that is an affiliate of a broker-dealer has advised us that it acquired the securities being registered hereunder in the ordinary course of business and, at the time of purchase, had no agreements or understandings, directly or indirectly, with any other person to distribute such shares. Each holder that is a broker-dealer is deemed to be an underwriter with respect to any registrable stock sold by it pursuant to this prospectus.
Certain information regarding relationships between certain of the selling stockholders and the Company is set forth in the footnotes below.
122
Table of Contents
Name | Class A Common Stock Beneficially Owned Prior to Offering | Percentage of Class A Common Stock Ownership Before Offering | Class A Common Stock Offered Hereby(1) | Percentage of Class A Common Stock Beneficially Owned After the Offering(2) | Class C Common Stock Beneficially Owned Prior to Offering | Percentage of Class C Common Stock Ownership Before Offering | Class C Common Stock Offered Hereby(1) | Percentage of Class C Common Stock Beneficially Owned After the Offering(2) | Convertible Preferred Stock Beneficially Owned Prior to Offering | Percentage of Convertible Preferred Stock Ownership Before Offering | Convertible Preferred Stock Offered Hereby | Percentage of Convertible Preferred Stock Beneficially Owned After the Offering(2) | ||||||||||||||||||||||||||||||||||||
453, LLC(5) | 6,453 | * | 6,453 | 0.0 | % | — | — | — | — | — | — | — | — | |||||||||||||||||||||||||||||||||||
Barbara Alagna | 2,734 | * | 2,734 | 0.0 | % | — | — | — | — | — | — | — | — | |||||||||||||||||||||||||||||||||||
Charles B. Albright | 7,527 | * | 7,527 | 0.0 | % | — | — | — | — | — | — | — | — | |||||||||||||||||||||||||||||||||||
Dorothy Jean Allen Living Trust(6) | 460 | * | 460 | 0.0 | % | — | — | — | — | — | — | — | — | |||||||||||||||||||||||||||||||||||
George D. Allen and Tatiana Allen | 967 | * | 967 | 0.0 | % | — | — | — | — | — | — | — | — | |||||||||||||||||||||||||||||||||||
Norman L. Altman | 1,613 | * | 1,613 | 0.0 | % | — | — | — | — | — | — | — | — | |||||||||||||||||||||||||||||||||||
John Walter Armagost | 6,139 | * | 6,139 | 0.0 | % | — | — | — | — | — | — | — | — | |||||||||||||||||||||||||||||||||||
Armory Master Fund Ltd.(7) | 635,548 | * | 635,548 | 0.0 | % | — | — | — | — | — | — | — | — | |||||||||||||||||||||||||||||||||||
Robert Edward Armstrong | 6,453 | * | 6,453 | 0.0 | % | — | — | — | — | — | — | — | — | |||||||||||||||||||||||||||||||||||
D&P Ayres Family Trust DTD 04/04/02(8) | 3,069 | * | 3,069 | 0.0 | % | — | — | — | — | — | — | — | — | |||||||||||||||||||||||||||||||||||
Eleanor Baer(9) | 8,066 | * | 8,066 | 0.0 | % | — | — | — | — | — | — | — | — | |||||||||||||||||||||||||||||||||||
Estate of Maurice W. Baehr, Sr.(10) | 8,066 | * | 8,066 | 0.0 | % | — | — | — | — | — | — | — | — | |||||||||||||||||||||||||||||||||||
John Bejerand | 2,176 | * | 2,176 | 0.0 | % | — | — | — | — | — | — | — | — | |||||||||||||||||||||||||||||||||||
Anthony Z. Berkowitz | 30,337 | * | 30,337 | 0.0 | % | — | — | — | — | — | — | — | — | |||||||||||||||||||||||||||||||||||
Booth Foundation Inc.(11) | 16,133 | * | 16,133 | 0.0 | % | — | — | — | — | — | — | — | — | |||||||||||||||||||||||||||||||||||
Kavita V. Borsum | 1,554 | * | 1,554 | 0.0 | % | — | — | — | — | — | — | — | — | |||||||||||||||||||||||||||||||||||
Bruce Bortniker | 767 | * | 767 | 0.0 | % | — | — | — | — | — | — | — | — | |||||||||||||||||||||||||||||||||||
Ronald M. Bringewatt | 50,000 | * | 50,000 | 0.0 | % | — | — | — | — | — | — | — | — | |||||||||||||||||||||||||||||||||||
Bobby Lynn Bundy | 1,710 | * | 1,710 | 0.0 | % | — | — | — | — | — | — | — | — | |||||||||||||||||||||||||||||||||||
The Bureau Family Revocable Trust U/A DTD 11/10/2004(12) | 806 | * | 806 | 0.0 | % | — | — | — | — | — | — | — | — | |||||||||||||||||||||||||||||||||||
Dalton L. Caley Trust(13) | 613 | * | 613 | 0.0 | % | — | — | — | — | — | — | — | — | |||||||||||||||||||||||||||||||||||
Bernard J. & Lillian T. Call Revocable Trust U/A DTD 10/26/2000(14) | 3,226 | * | 3,226 | 0.0 | % | — | — | — | — | — | — | — | — | |||||||||||||||||||||||||||||||||||
Douglas Felipe Viloria Castro | 3,837 | * | 3,837 | 0.0 | % | — | — | — | — | — | — | — | — | |||||||||||||||||||||||||||||||||||
Viola J. Christof | 10,000 | * | 10,000 | 0.0 | % | — | — | — | — | — | — | — | — | |||||||||||||||||||||||||||||||||||
ColFin WLH Land Acquisitions, LLC(15) | 10,000,000 | 14.3 | % | 10,000,000 | 0.0 | % | — | — | — | — | — | — | — | — | ||||||||||||||||||||||||||||||||||
The Cook Family Trust U/A DTD 12/04/2004(16) | 7,674 | * | 7,674 | 0.0 | % | — | — | — | — | — | — | — | — | |||||||||||||||||||||||||||||||||||
Corre Opportunities Fund LP(17) | 1,099,383 | * | 1,099,383 | 0.0 | % | — | — | — | — | — | — | — | — | |||||||||||||||||||||||||||||||||||
123
Table of Contents
Name | Class A Common Stock Beneficially Owned Prior to Offering | Percentage of Class A Common Stock Ownership Before Offering | Class A Common Stock Offered Hereby(1) | Percentage of Class A Common Stock Beneficially Owned After the Offering(2) | Class C Common Stock Beneficially Owned Prior to Offering | Percentage of Class C Common Stock Ownership Before Offering | Class C Common Stock Offered Hereby(1) | Percentage of Class C Common Stock Beneficially Owned After the Offering(2) | Convertible Preferred Stock Beneficially Owned Prior to Offering | Percentage of Convertible Preferred Stock Ownership Before Offering | Convertible Preferred Stock Offered Hereby | Percentage of Convertible Preferred Stock Beneficially Owned After the Offering(2) | ||||||||||||||||||||||||||||||||||
Curtiswood Capital, LLC(18)(4) | 15,861 | * | 534,516 | 0.0 | % | 86,443 | * | 518,655 | 0.0 | % | 432,212 | * | 432,212 | 0.0 | % | |||||||||||||||||||||||||||||||
Douglas C. Cranmer | 767 | * | 767 | 0.0 | % | — | — | — | — | — | — | — | — | |||||||||||||||||||||||||||||||||
Steven D. Cranmer | 306 | * | 306 | 0.0 | % | — | — | — | — | — | — | — | — | |||||||||||||||||||||||||||||||||
Jesse Cranmer Trust U/A DTD 12/28/1998(19) | 306 | * | 306 | 0.0 | % | — | — | — | — | — | — | — | — | |||||||||||||||||||||||||||||||||
Michael J. Cunningham | 3,376 | * | 3,376 | 0.0 | % | — | — | — | — | — | — | — | — | |||||||||||||||||||||||||||||||||
Frank DiMucci | 1,534 | * | 1,534 | 0.0 | % | — | — | — | — | — | — | — | — | |||||||||||||||||||||||||||||||||
Alan L. Doyon | 6,445 | * | 6,445 | 0.0 | % | — | — | — | — | — | — | — | — | |||||||||||||||||||||||||||||||||
Dunavant Enterprises, Inc.(20) | 48,399 | * | 48,399 | 0.0 | % | — | — | — | — | — | — | — | — | |||||||||||||||||||||||||||||||||
The Jean M. Durbin Family Trust U/A DTD 07/08/1991(21) | 3,069 | * | 3,069 | 0.0 | % | — | — | — | — | — | — | — | — | |||||||||||||||||||||||||||||||||
Mark Eberle(3) | 286,296 | * | 286,296 | 0.0 | % | — | — | — | — | — | — | — | — | |||||||||||||||||||||||||||||||||
Steven Epperson | 3,837 | * | 3,837 | 0.0 | % | — | — | — | — | — | — | — | — | |||||||||||||||||||||||||||||||||
Ron Farino | 1,554 | * | 1,554 | 0.0 | % | — | — | — | — | — | — | — | — | |||||||||||||||||||||||||||||||||
Thomas Ferrara and Antonina Ferrara | 1,613 | * | 1,613 | 0.0 | % | — | — | — | — | — | — | — | — | |||||||||||||||||||||||||||||||||
Anthony R. Fischer | 80,655 | * | 113,071 | 0.0 | % | 5,403 | * | 32,416 | 0.0 | % | 27,013 | * | 27,013 | 0.0 | % | |||||||||||||||||||||||||||||||
Lewis C. Foster(22) | 8,066 | * | 8,066 | 0.0 | % | — | — | — | — | — | — | — | — | |||||||||||||||||||||||||||||||||
Michael A. Foster | 806 | * | 806 | 0.0 | % | — | — | — | — | — | — | — | — | |||||||||||||||||||||||||||||||||
Steven Frei | 2,302 | * | 2,302 | 0.0 | % | — | — | — | — | — | — | — | — | |||||||||||||||||||||||||||||||||
GAM Equity Six Inc.(23) | 209,554 | * | 3,448,199 | 0.0 | % | 737,146 | 4.6 | % | 3,238,645 | 0.0 | % | 2,501,499 | 3.2 | % | 2,501,499 | 0.0 | % | |||||||||||||||||||||||||||||
Allison J. Gardner | 1,380 | * | 1,380 | 0.0 | % | — | — | — | — | — | — | — | — | |||||||||||||||||||||||||||||||||
Frances V. Garland | 1,554 | * | 1,554 | 0.0 | % | — | — | — | — | — | — | — | — | |||||||||||||||||||||||||||||||||
Ray L. Garland and Jane M. Garland | 1,554 | * | 1,554 | 0.0 | % | — | — | — | — | — | — | — | — | |||||||||||||||||||||||||||||||||
Kelley Hearne Gill(24) | 4,033 | * | 4,033 | 0.0 | % | — | — | — | — | — | — | — | — | |||||||||||||||||||||||||||||||||
Mary Helen Ginger | 306 | * | 306 | 0.0 | % | — | — | — | — | — | — | — | — | |||||||||||||||||||||||||||||||||
124
Table of Contents
Name | Class A Common Stock Beneficially Owned Prior to Offering | Percentage of Class A Common Stock Ownership Before Offering | Class A Common Stock Offered Hereby(1) | Percentage of Class A Common Stock Beneficially Owned After the Offering(2) | Class C Common Stock Beneficially Owned Prior to Offering | Percentage of Class C Common Stock Ownership Before Offering | Class C Common Stock Offered Hereby(1) | Percentage of Class C Common Stock Beneficially Owned After the Offering(2) | Convertible Preferred Stock Beneficially Owned Prior to Offering | Percentage of Convertible Preferred Stock Ownership Before Offering | Convertible Preferred Stock Offered Hereby | Percentage of Convertible Preferred Stock Beneficially Owned After the Offering(2) | ||||||||||||||||||||||||||||||||||||
Glendale Partners GP(25)(4) | 161 | * | 518,816 | 0.0 | % | 86,443 | * | 518,655 | 0.0 | % | 432,212 | * | 432,212 | 0.0 | % | |||||||||||||||||||||||||||||||||
Mary Gonzalez Family Trust DTD 09/08/89(26) | 3,223 | * | 3,223 | 0.0 | % | — | — | — | — | — | — | — | — | |||||||||||||||||||||||||||||||||||
Wynona W. Gordon Revocable Trust U/A DTD 05/30/1986(27) | 4,604 | * | 4,604 | 0.0 | % | — | — | — | — | — | — | — | — | |||||||||||||||||||||||||||||||||||
Louise J. Gribben | 306 | * | 306 | 0.0 | % | — | — | — | — | — | — | — | — | |||||||||||||||||||||||||||||||||||
Daniel L. Grieshaber | 767 | * | 767 | 0.0 | % | — | — | — | — | — | — | — | — | |||||||||||||||||||||||||||||||||||
Dr. R. Bryan Griffith, Jr., M.D.(28) | 9,195 | * | 9,195 | 0.0 | % | — | — | — | — | — | — | — | — | |||||||||||||||||||||||||||||||||||
M. Lorraine Hall Living Trust U/A DTD 04/24/2003(29) | 10,486 | * | 10,486 | 0.0 | % | — | — | — | — | — | — | — | — | |||||||||||||||||||||||||||||||||||
Farron R. Harrison | 4,478 | * | 4,478 | 0.0 | % | — | — | — | — | — | — | — | — | |||||||||||||||||||||||||||||||||||
Patricia A. Hart | 10,486 | * | 10,486 | 0.0 | % | — | — | — | — | — | — | — | — | |||||||||||||||||||||||||||||||||||
Haslam Blind Trust U/A DTD 01/14/11(30) | 161,330 | * | 161,330 | 0.0 | % | — | — | — | — | — | — | — | — | |||||||||||||||||||||||||||||||||||
Terry John Horn | 50,000 | * | 50,000 | 0.0 | % | — | — | — | — | — | — | — | — | |||||||||||||||||||||||||||||||||||
George Huffman | 920 | * | 920 | 0.0 | % | — | — | — | — | — | — | — | — | |||||||||||||||||||||||||||||||||||
Indemnity National Insurance Company(31) | 72,598 | * | 72,598 | 0.0 | % | — | — | — | — | — | — | — | — | |||||||||||||||||||||||||||||||||||
Janis L. Jansen | 766 | * | 766 | 0.0 | % | — | — | — | — | — | — | — | — | |||||||||||||||||||||||||||||||||||
Michael Jilka | 306 | * | 306 | 0.0 | % | — | — | — | — | — | — | — | — | |||||||||||||||||||||||||||||||||||
JLP Credit Opportunity Master Fund Ltd.(32) | 2,620,840 | 3.7 | % | 2,620,840 | 0.0 | % | — | — | — | — | — | — | — | — | ||||||||||||||||||||||||||||||||||
JLP Partners Master Fund LP(33) | 100,000 | * | 100,000 | 0.0 | % | — | — | — | — | — | — | — | — | |||||||||||||||||||||||||||||||||||
JLP Stressed Credit Fund LP(34) | 132,259 | * | 132,259 | 0.0 | % | — | — | — | — | — | — | — | — | |||||||||||||||||||||||||||||||||||
J.P. Morgan Securities LLC(35)(4) | 164,493 | * | 488,649 | 0.0 | % | 54,026 | * | 324,156 | 0.0 | % | 270,130 | * | 270,130 | 0.0 | % | |||||||||||||||||||||||||||||||||
Darwin L. Johnson and Marjorie N. Johnson | 310 | * | 310 | 0.0 | % | — | — | — | — | — | — | — | — | |||||||||||||||||||||||||||||||||||
Rosemarie Johnson | 1,613 | * | 1,613 | 0.0 | % | — | — | — | — | — | — | — | — | |||||||||||||||||||||||||||||||||||
125
Table of Contents
Name | Class A Common Stock Beneficially Owned Prior to Offering | Percentage of Class A Common Stock Ownership Before Offering | Class A Common Stock Offered Hereby(1) | Percentage of Class A Common Stock Beneficially Owned After the Offering(2) | Class C Common Stock Beneficially Owned Prior to Offering | Percentage of Class C Common Stock Ownership Before Offering | Class C Common Stock Offered Hereby(1) | Percentage of Class C Common Stock Beneficially Owned After the Offering(2) | Convertible Preferred Stock Beneficially Owned Prior to Offering | Percentage of Convertible Preferred Stock Ownership Before Offering | Convertible Preferred Stock Offered Hereby | Percentage of Convertible Preferred Stock Beneficially Owned After the Offering(2) | ||||||||||||||||||||||||||||||||||||
Margaret Johnston Trust U/A DTD 09/23/2004(36) | 3,070 | * | 3,070 | 0.0 | % | — | — | — | — | — | — | — | — | |||||||||||||||||||||||||||||||||||
Marvin Kaphan | 3,069 | * | 3,069 | 0.0 | % | — | — | — | — | — | — | — | — | |||||||||||||||||||||||||||||||||||
Patrick M. Kerney(37) | 40,332 | * | 40,332 | 0.0 | % | — | — | — | — | — | — | — | — | |||||||||||||||||||||||||||||||||||
KJ Partners(38) | 16,133 | * | 16,133 | 0.0 | % | — | — | — | — | — | — | — | — | |||||||||||||||||||||||||||||||||||
Knox Holdings, Inc.(39) | 24,199 | * | 24,199 | 0.0 | % | — | — | — | — | — | — | — | — | |||||||||||||||||||||||||||||||||||
Joseph H. Koch, Sr. Revocable Trust U/A DTD 05/11/1998(40) | 1,613 | * | 1,613 | 0.0 | % | — | — | — | — | — | — | — | — | |||||||||||||||||||||||||||||||||||
Pete M. Koury | 7,870 | * | 7,870 | 0.0 | % | — | — | — | — | — | — | — | — | |||||||||||||||||||||||||||||||||||
Kylher Investments 11, LLC(41) | 36,299 | * | 36,299 | 0.0 | % | — | — | — | — | — | — | — | — | |||||||||||||||||||||||||||||||||||
The Learch Trust U/A DTD 04/28/1999(42) | 1,534 | * | 1,534 | 0.0 | % | — | — | — | — | — | — | — | — | |||||||||||||||||||||||||||||||||||
Edmun L. Leckert, III | 1,613 | * | 1,613 | 0.0 | % | — | — | — | — | — | — | — | — | |||||||||||||||||||||||||||||||||||
Judy H. Lieberman | 4,033 | * | 4,033 | 0.0 | % | — | — | — | — | — | — | — | — | |||||||||||||||||||||||||||||||||||
Ernest H. Little | 2,302 | * | 2,302 | 0.0 | % | — | — | — | — | — | — | — | — | |||||||||||||||||||||||||||||||||||
Yueh Mei Liu | 1,554 | * | 1,554 | 0.0 | % | — | — | — | — | — | — | — | — | |||||||||||||||||||||||||||||||||||
Donald A. Lockwood Revocable Trust U/A DTD 04/22/2002(43) | 3,226 | * | 3,226 | 0.0 | % | — | — | — | — | — | — | — | — | |||||||||||||||||||||||||||||||||||
The Lokovsek Family Trust U/A DTD 06/25/93(44) | 3,109 | * | 3,109 | 0.0 | % | — | — | — | — | — | — | — | — | |||||||||||||||||||||||||||||||||||
Barbara Jane Louie | 1,381 | * | 1,381 | 0.0 | % | — | — | — | — | — | — | — | — | |||||||||||||||||||||||||||||||||||
Barbara Lowe | 1,534 | * | 1,534 | 0.0 | % | — | — | — | — | — | — | — | — | |||||||||||||||||||||||||||||||||||
Allison T. Luter & Warren E. Luter Children’s Trust U/A DTD 12/24/02(45) | 1,613 | * | 1,613 | 0.0 | % | — | — | — | — | — | — | — | �� | — | ||||||||||||||||||||||||||||||||||
Luxor Capital II Company(46) | — | — | 25,463,768 | 0.0 | % | 4,243,970 | 26.3 | % | 25,463,768 | 0.0 | % | 21,219,798 | 27.6 | % | 21,219,798 | 0.0 | % | |||||||||||||||||||||||||||||||
Luxor Capital Partners LP(47) | 7,761,913 | 11.1 | % | 41,247,277 | 0.0 | % | 7,694,008 | 47.8 | % | 33,485,364 | 0.0 | % | 25,791,356 | 33.5 | % | 25,791,356 | 0.0 | % | ||||||||||||||||||||||||||||||
126
Table of Contents
Name | Class A Common Stock Beneficially Owned Prior to Offering | Percentage of Class A Common Stock Ownership Before Offering | Class A Common Stock Offered Hereby(1) | Percentage of Class A Common Stock Beneficially Owned After the Offering(2) | Class C Common Stock Beneficially Owned Prior to Offering | Percentage of Class C Common Stock Ownership Before Offering | Class C Common Stock Offered Hereby(1) | Percentage of Class C Common Stock Beneficially Owned After the Offering(2) | Convertible Preferred Stock Beneficially Owned Prior to Offering | Percentage of Convertible Preferred Stock Ownership Before Offering | Convertible Preferred Stock Offered Hereby | Percentage of Convertible Preferred Stock Beneficially Owned After the Offering(2) | ||||||||||||||||||||||||||||||||||||
Luxor Capital Partners Offshore Master Fund LP(48) | 7,984,457 | 11.4 | % | 7,984,457 | 0.0 | % | — | — | — | — | — | — | — | — | ||||||||||||||||||||||||||||||||||
Luxor Spectrum Offshore Master Fund LP(49) | 1,453,799 | 2.1 | % | 7,344,098 | 0.0 | % | 981,718 | 6.1 | % | 5,890,299 | 0.0 | % | 4,908,581 | 6.4 | % | 4,908,581 | 0.0 | % | ||||||||||||||||||||||||||||||
Luxor Wavefront LP(50) | 2,581,222 | 3.7 | % | 7,832,601 | 0.0 | % | 875,232 | 5.4 | % | 5,251,379 | 0.0 | % | 4,376,147 | 5.7 | % | 4,376,147 | 0.0 | % | ||||||||||||||||||||||||||||||
Lyon Shareholder 2012, LLC(51) | — | — | 31,464,548 | 0.0 | % | — | — | — | — | — | — | — | — | |||||||||||||||||||||||||||||||||||
The William Harwell Lyon Separate Property Trust(52) | 24,199 | * | 24,199 | 0.0 | % | — | — | — | — | — | — | — | — | |||||||||||||||||||||||||||||||||||
Katherine Magerovsky | 2,419 | * | 2,419 | 0.0 | % | — | — | — | — | — | — | — | — | |||||||||||||||||||||||||||||||||||
Ashley T. Manning(53) | 2,903 | * | 2,903 | 0.0 | % | — | — | — | — | — | — | — | — | |||||||||||||||||||||||||||||||||||
Karen Mansfield | 1,554 | * | 1,554 | 0.0 | % | — | — | — | — | — | — | — | — | |||||||||||||||||||||||||||||||||||
Joan Martin | 6,219 | * | 6,219 | 0.0 | % | — | — | — | — | — | — | — | — | |||||||||||||||||||||||||||||||||||
John M. McCarty | 5,372 | * | 5,372 | 0.0 | % | — | — | — | — | — | — | — | — | |||||||||||||||||||||||||||||||||||
Mary Kim McMillan(54) | 6,452 | * | 6,452 | 0.0 | % | — | — | — | — | — | — | — | — | |||||||||||||||||||||||||||||||||||
Micaro Reinsurance Company, LTD(55) | 8,066 | * | 8,066 | 0.0 | % | — | — | — | — | — | — | — | — | |||||||||||||||||||||||||||||||||||
Bessie Meisler | 1,534 | * | 1,534 | 0.0 | % | — | — | — | — | — | — | — | — | |||||||||||||||||||||||||||||||||||
Kenneth D. Miller(56) | 16,133 | * | 16,133 | 0.0 | % | — | — | — | — | — | — | — | — | |||||||||||||||||||||||||||||||||||
Daniel R. Moore and Susan S. Moore | 1,613 | * | 1,613 | 0.0 | % | — | — | — | — | — | — | — | — | |||||||||||||||||||||||||||||||||||
Fred Morrison and Barbara Morrison | 1,613 | * | 1,613 | 0.0 | % | — | — | — | — | — | — | — | — | |||||||||||||||||||||||||||||||||||
Patrick Mulcahy | 483 | * | 483 | 0.0 | % | — | — | — | — | — | — | — | — | |||||||||||||||||||||||||||||||||||
Yong L. Nee | 1,613 | * | 1,613 | 0.0 | % | — | — | — | — | — | — | — | — | |||||||||||||||||||||||||||||||||||
Edward F. Nenon(57) | 4,033 | * | 4,033 | 0.0 | % | — | — | — | — | — | — | — | — | |||||||||||||||||||||||||||||||||||
Irene B. Newman | 3,226 | * | 3,226 | 0.0 | % | — | — | — | — | — | — | — | — | |||||||||||||||||||||||||||||||||||
NFC Partners, LLC(58) | 261,354 | * | 261,354 | 0.0 | % | — | — | — | — | — | — | — | — | |||||||||||||||||||||||||||||||||||
Scott Nieboer(3) | 390,000 | * | 390,000 | 0.0 | % | — | — | — | — | — | — | — | — | |||||||||||||||||||||||||||||||||||
Francis P. O’Brien and Elvira M. O’Brien | 2,332 | * | 2,332 | 0.0 | % | — | — | — | — | — | — | — | — | |||||||||||||||||||||||||||||||||||
127
Table of Contents
Name | Class A Common Stock Beneficially Owned Prior to Offering | Percentage of Class A Common Stock Ownership Before Offering | Class A Common Stock Offered Hereby(1) | Percentage of Class A Common Stock Beneficially Owned After the Offering(2) | Class C Common Stock Beneficially Owned Prior to Offering | Percentage of Class C Common Stock Ownership Before Offering | Class C Common Stock Offered Hereby(1) | Percentage of Class C Common Stock Beneficially Owned After the Offering(2) | Convertible Preferred Stock Beneficially Owned Prior to Offering | Percentage of Convertible Preferred Stock Ownership Before Offering | Convertible Preferred Stock Offered Hereby | Percentage of Convertible Preferred Stock Beneficially Owned After the Offering(2) | ||||||||||||||||||||||||||||||||||||
OC 19 Master Fund LP-LCG(59) | 826,218 | 1.2 | % | 4,361,777 | 0.0 | % | 823,736 | 5.1 | % | 3,535,559 | 0.0 | % | 2,711,823 | 3.5 | % | 2,711,823 | 0.0 | % | ||||||||||||||||||||||||||||||
Robert Dudley Park(60) | 8,066 | * | 8,066 | 0.0 | % | — | — | — | — | — | — | — | — | |||||||||||||||||||||||||||||||||||
Robert Dudley Park, Jr. Trust U/A DTD 12/29/89(61) | 8,066 | * | 8,066 | 0.0 | % | — | — | — | — | — | — | — | — | |||||||||||||||||||||||||||||||||||
Michael Erb Park Trust U/A DTD 12/29/89(62) | 8,066 | * | 8,066 | 0.0 | % | — | — | — | — | — | — | — | — | |||||||||||||||||||||||||||||||||||
Mavis A. Winter Pasternack Trust U/A DTD 08/16/1999(63) | 1,534 | * | 1,534 | 0.0 | % | — | — | — | — | — | — | — | — | |||||||||||||||||||||||||||||||||||
James D. Prause Trust DTD 08/02/99(64) | 1,613 | * | 1,613 | 0.0 | % | — | — | — | — | — | — | — | — | |||||||||||||||||||||||||||||||||||
WLH Recovery Acquisition LLC(65)(3) | 15,238,095 | 21.8 | % | 27,412,008 | 0.0 | % | — | — | 12,173,913 | 0.0 | % | 12,173,913 | 15.8 | % | 12,173,913 | 0.0 | % | |||||||||||||||||||||||||||||||
James D. Pirkle | 4,605 | * | 4,605 | 0.0 | % | — | — | — | — | — | — | — | — | |||||||||||||||||||||||||||||||||||
Gordon P. Pratt | 3,069 | * | 3,069 | 0.0 | % | — | — | — | — | — | — | — | — | |||||||||||||||||||||||||||||||||||
Jack & Lenore Press Family Revocable Trust U/A DTD 03/03/1998(66) | 3,069 | * | 3,069 | 0.0 | % | — | — | — | — | — | — | — | — | |||||||||||||||||||||||||||||||||||
Shirley S. Preston | 2,609 | * | 2,609 | 0.0 | % | — | — | — | — | — | — | — | — | |||||||||||||||||||||||||||||||||||
Meredith Pritchartt(67) | 8,066 | * | 8,066 | 0.0 | % | — | — | — | — | — | — | — | — | |||||||||||||||||||||||||||||||||||
Earnest Propis | 1,534 | * | 1,534 | 0.0 | % | — | — | — | — | — | — | — | — | |||||||||||||||||||||||||||||||||||
Jose C. Ramirez | 155 | * | 155 | 0.0 | % | — | — | — | — | — | — | — | — | |||||||||||||||||||||||||||||||||||
Josephine G. Reader and Malcolm C. Reader | 9,679 | * | 9,679 | 0.0 | % | — | — | — | — | — | — | — | — | |||||||||||||||||||||||||||||||||||
Dwight Reed | 460 | * | 460 | 0.0 | % | — | — | — | — | — | — | — | — | |||||||||||||||||||||||||||||||||||
Howard Brian Rosen | 3,070 | * | 3,070 | 0.0 | % | — | — | — | — | — | — | — | — | |||||||||||||||||||||||||||||||||||
Glen Bret Rosenberg | 1,613 | * | 1,613 | 0.0 | % | — | — | — | — | — | — | — | — | |||||||||||||||||||||||||||||||||||
John B. Rosenman and Jane P. Rosenman) | 2,581 | * | 2,581 | 0.0 | % | — | — | — | — | — | — | — | — | |||||||||||||||||||||||||||||||||||
Ross Foundation(68) | 1,534 | * | 1,534 | 0.0 | % | — | — | — | — | — | — | — | — | |||||||||||||||||||||||||||||||||||
Michael J. Roth and Donna M. Roth | 23,024 | * | 23,024 | 0.0 | % | — | — | — | — | — | — | — | — | |||||||||||||||||||||||||||||||||||
Edward R. Rubenstein | 1,688 | * | 1,688 | 0.0 | % | — | — | — | — | — | — | — | — | |||||||||||||||||||||||||||||||||||
Charles G. Saliba | 3,837 | * | 3,837 | 0.0 | % | — | — | — | — | — | — | — | — | |||||||||||||||||||||||||||||||||||
Jose A. Samartin | 2,302 | * | 2,302 | 0.0 | % | — | — | — | — | — | — | — | — | |||||||||||||||||||||||||||||||||||
128
Table of Contents
Name | Class A Common Stock Beneficially Owned Prior to Offering | Percentage of Class A Common Stock Ownership Before Offering | Class A Common Stock Offered Hereby(1) | Percentage of Class A Common Stock Beneficially Owned After the Offering(2) | Class C Common Stock Beneficially Owned Prior to Offering | Percentage of Class C Common Stock Ownership Before Offering | Class C Common Stock Offered Hereby(1) | Percentage of Class C Common Stock Beneficially Owned After the Offering(2) | Convertible Preferred Stock Beneficially Owned Prior to Offering | Percentage of Convertible Preferred Stock Ownership Before Offering | Convertible Preferred Stock Offered Hereby | Percentage of Convertible Preferred Stock Beneficially Owned After the Offering(2) | ||||||||||||||||||||||||||||||||||||
Lee E. Sauer | 777 | * | 777 | 0.0 | % | — | — | — | — | — | — | — | — | |||||||||||||||||||||||||||||||||||
Hermann Schamoni | 3,837 | * | 3,837 | 0.0 | % | — | — | — | — | — | — | — | — | |||||||||||||||||||||||||||||||||||
Gerald J. Schramm | 3,224 | |||||||||||||||||||||||||||||||||||||||||||||||
Roberta L. Schwinn | 2,419 | * | 2,419 | 0.0 | % | — | — | — | — | — | — | — | — | |||||||||||||||||||||||||||||||||||
Sea Port Group Securities, LLC(4) | 120,000 | * | 120,000 | 0.0 | % | — | — | — | — | — | — | — | — | |||||||||||||||||||||||||||||||||||
John L. Seymour | 40,332 | * | 40,332 | 0.0 | % | — | — | — | — | — | — | — | — | |||||||||||||||||||||||||||||||||||
Gregory Alan Shanabrook | 161 | * | 161 | 0.0 | % | — | — | — | — | — | — | — | — | |||||||||||||||||||||||||||||||||||
William S. Solmson(69) | 16,133 | * | 16,133 | 0.0 | % | — | — | — | — | — | — | — | — | |||||||||||||||||||||||||||||||||||
Constance F. Solmson Conservatorship(70) | 12,099 | * | 12,099 | 0.0 | % | — | — | — | — | — | — | — | — | |||||||||||||||||||||||||||||||||||
The Jacilyn Susan Solmson Revocable Trust U/A DTD 01/28/04(71) | 8,066 | * | 8,066 | 0.0 | % | — | — | — | — | — | — | — | — | |||||||||||||||||||||||||||||||||||
John C. Sosnowski and Annabella C. Pitkin | 30,000 | * | 30,000 | 0.0 | % | — | — | — | — | — | — | — | — | |||||||||||||||||||||||||||||||||||
Laura M. Starnes(72) | 4,033 | * | 4,033 | 0.0 | % | — | — | — | — | — | — | — | — | |||||||||||||||||||||||||||||||||||
Morris A. Michael Steiner and Randy A. Steiner | 4,033 | * | 4,033 | 0.0 | % | — | — | — | — | — | — | — | — | |||||||||||||||||||||||||||||||||||
Estella Terwes | 306 | * | 306 | 0.0 | % | — | — | — | — | — | — | — | — | |||||||||||||||||||||||||||||||||||
Betty L. Taylor and James Taylor | 767 | * | 767 | 0.0 | % | — | — | — | — | — | — | — | — | |||||||||||||||||||||||||||||||||||
United Equities Commodities Company(73) | 1,075,910 | 1.5 | % | 3,669,183 | 0.0 | % | 432,213 | 2.7 | % | 2,593,273 | 0.0 | % | 2,161,060 | 2.8 | % | 2,161,060 | 0.0 | % | ||||||||||||||||||||||||||||||
Marsha G. Thompson Children’s Insurance Trust U/A DTD 06/22/88(74) | 4,033 | * | 4,033 | 0.0 | % | — | — | — | — | — | — | — | — | |||||||||||||||||||||||||||||||||||
Tri-State Consumer Insurance Company(75) | 258,128 | * | 258,128 | 0.0 | % | — | — | — | — | — | — | — | — | |||||||||||||||||||||||||||||||||||
U/W/O David Waldman Trust U/A DTD 06/16/1995(76) | 5,646 | * | 5,646 | 0.0 | % | — | — | — | — | — | — | — | — | |||||||||||||||||||||||||||||||||||
Walter Jay Unger | 6,907 | * | 6,907 | 0.0 | % | — | — | — | — | — | — | — | — | |||||||||||||||||||||||||||||||||||
JMS LLC, as custodian FBO Dr. Robert F. Vacchiano (IRA)(77) | 1,534 | * | 1,534 | 0.0 | % | — | — | — | — | — | — | — | — | |||||||||||||||||||||||||||||||||||
Allen Edwards Vanover | 806 | * | 806 | 0.0 | % | ��� | — | — | — | — | — | — | — | |||||||||||||||||||||||||||||||||||
Billy M. Watkins | 460 | * | 460 | 0.0 | % | — | — | — | — | — | — | — | — | |||||||||||||||||||||||||||||||||||
129
Table of Contents
Name | Class A Common Stock Beneficially Owned Prior to Offering | Percentage of Class A Common Stock Ownership Before Offering | Class A Common Stock Offered Hereby(1) | Percentage of Class A Common Stock Beneficially Owned After the Offering(2) | Class C Common Stock Beneficially Owned Prior to Offering | Percentage of Class C Common Stock Ownership Before Offering | Class C Common Stock Offered Hereby(1) | Percentage of Class C Common Stock Beneficially Owned After the Offering(2) | Convertible Preferred Stock Beneficially Owned Prior to Offering | Percentage of Convertible Preferred Stock Ownership Before Offering | Convertible Preferred Stock Offered Hereby | Percentage of Convertible Preferred Stock Beneficially Owned After the Offering(2) | ||||||||||||||||||||||||||||||||||||
Herbert Wegener and Marion Wegener | 3,837 | * | 3,837 | 0.0 | % | — | — | — | — | — | — | — | — | |||||||||||||||||||||||||||||||||||
The Estate of Emily V. Weinberg(78) | 8,066 | * | 8,066 | 0.0 | % | — | — | — | — | — | — | — | — | |||||||||||||||||||||||||||||||||||
Robert L. Wells | 1,381 | * | — | — | — | — | — | — | — | — | — | — | ||||||||||||||||||||||||||||||||||||
Etheline W. Westbrook | 3,227 | * | 3,227 | 0.0 | % | — | — | — | — | — | — | — | — | |||||||||||||||||||||||||||||||||||
Don Wilhelm and Mary Wilhelm | 613 | * | 613 | 0.0 | % | — | — | — | — | — | — | — | — | |||||||||||||||||||||||||||||||||||
Patricia S. Wilson(79) | 4,033 | * | 4,033 | 0.0 | % | — | — | — | — | — | — | — | — | |||||||||||||||||||||||||||||||||||
Paul Gene Wingo | 1,534 | * | 1,534 | 0.0 | % | — | — | — | — | — | — | — | — | |||||||||||||||||||||||||||||||||||
Joan T. Woods-Smith | 767 | * | 767 | 0.0 | % | — | — | — | — | — | — | — | — | |||||||||||||||||||||||||||||||||||
Wucetich Revocable Family Trust | 767 | * | 767 | 0.0 | % | — | — | — | — | — | — | — | — | |||||||||||||||||||||||||||||||||||
WT Holdings, Inc.(81) | 48,399 | * | 48,399 | 0.0 | % | — | — | — | — | — | — | — | — | |||||||||||||||||||||||||||||||||||
Erna Mae Yeagley and Janet Bryant | 306 | * | 306 | 0.0 | % | — | — | — | — | — | — | — | — | |||||||||||||||||||||||||||||||||||
|
|
|
|
|
|
|
|
|
|
|
| |||||||||||||||||||||||||||||||||||||
Totals: | 54,462,112 | 178,952,742 | 16,020,338 | 93,026,082 | 77,005,744 | 77,005,744 | ||||||||||||||||||||||||||||||||||||||||||
|
|
|
|
|
|
|
|
|
|
|
| |||||||||||||||||||||||||||||||||||||
| * | Denotes less than 1.0% of beneficial ownership. |
| (1) | Assumes the sale of all shares offered. |
| (2) | Assumes, where applicable, (i) the conversion of all outstanding shares of our Convertible Preferred Stock offered hereby into an aggregate of 77,005,744 shares of our Class C Common Stock, (ii) the conversion of all outstanding shares of our Class C Common Stock offered hereby (including such number of shares convertible from our Convertible Preferred Stock) into an aggregate of 93,026,082 shares of our Class A Common Stock and (iii) the conversion of all outstanding shares of our Class B Common Stock into an aggregate of 31,464,548 shares of our Class A Common Stock. |
| (3) | Holder has advised us that he/she/it is an affiliate of a broker-dealer registered pursuant to Section 15 of the Exchange Act. Holder has advised us that he/she/it acquired the securities being registered hereunder in the ordinary course of business and at the time of purchase, had no agreements or understandings, directly or indirectly, with any other person to distribute such shares. |
| (4) | Holder has advised us that it is a broker-dealer registered pursuant to Section 15 of the Exchange Act. |
| (5) | Represents shares held by 453, LLC, a Virginia limited liability company. Mark Merriner and Rebecca E. McCoy are the general managers of LLC and they each hold voting and dispositive power over these shares. The address of 453, LLC is P.O. Box 485, 401 Main Street, Matthews, Virginia 23109. |
130
Table of Contents
| (6) | Dorothy J. Allen is the trustee of the Dorothy Jean Allen Living Trust and holds voting and dispositive power over these shares. |
| (7) | Armory Partners LLC is the sole general partner of Armory Master Fund Ltd. Michael Meagher and Stephen Smith are the sole members of Armory Partners LLC and may be deemed to have shared voting and dispositive power over these shares. The address of Armory Master Fund Ltd. is 360 Madison Ave., 22nd Floor, New York, New York 10017. |
| (8) | H. Patrick Ayres is the trustee of the D&P Ayres Family Trust DTD 04/04/02 and holds voting and dispositive power over these shares. |
| (9) | These shares are held in an investment account managed by NFC Investments, LLC. Charles K. Slatery is the manager of NFC Investments, LLC and may be deemed to hold shared voting and dispositive power over these shares with the named holder. Charles K. Slatery disclaims beneficial ownership over these shares except to the extent of his pecuniary interest therein. The address of NFC Investments, LLC is 5101 Wheelis Drive, Suite 207, Memphis, Tennessee 38117. |
| (10) | Maurice W. Baehr, Jr. and Maureen B. Baehr are co-executors of the estate of Maurice W. Baehr, Sr. and each hold voting and dispositive power over these shares. |
| (11) | Alex E. Booth, Jr. is the President of Booth Foundation, Inc. and may be deemed to hold sole voting and dispositive power over these shares. Alex E. Booth, Jr. disclaims beneficial ownership over these shares except to the extent of his pecuniary interest therein. The address of Booth Foundation, Inc. is 2001 Sailfish Point Blvd. Apt. 316 Stuart, FL 34996-1982. |
| (12) | Edward D. Bureau is the trustee of The Bureau Family Revocable Trust U/A DTD 11/10/2004 and holds voting and dispositive power over these shares. |
| (13) | Dalton L. Caley is the trustee of the Dalton L. Caley Trust and holds voting and dispositive power over these shares. |
| (14) | Bernard J. Call and Lillian T. Call are co-trustees of the Bernard J. & Lillian T. Call Revocable Trust U/A DTD 10/26/2000 and each holds voting and dispositive power over these shares. |
| (15) | ColFin WLH Land Acquisitions, LLC, a Delaware limited liability company, or ColFin, acquired these shares in connection with a real estate transaction with the Company that took place on June 28, 2012. ColFin is indirectly managed and controlled by Colony Capital, LLC, a registered investment advisor. Thomas J. Barrack, Jr. is Chief Executive Officer and the sole managing member of Colony Capital, LLC, with sole voting and dispositive power over the securities held by ColFin. As a result, Mr. Barrack may be deemed to have indirect beneficial ownership of the shares held by ColFin through ultimate control over the entities that own or control ColFin, but the foregoing disclosure shall not be construed as an admission of such. The address of Colony Capital, LLC is 2450 Broadway, 6th Floor, Santa Monica, CA 90404. |
| (16) | Jimmy G. Cook and Diana J. Cook are co-trustees of The Cook Family Trust U/A DTD 12/4/2004 and each holds voting and dispositive power over these shares. |
| (17) | The sole general partner at Corre Opportunities Fund LP is Corre Partners Advisors LLC, the managers of which are Eric Soderland and John Barrett. These individuals may be deemed to have shared voting and dispositive power over these shares. The address of Corre Opportunities Fund LP is 1370 Avenue of the Americas, 29th Floor, New York, NY 10019. |
| (18) | Scott Neiboer is the Chief Manager and Mark Eberle is the Managing Director of Curtiswood Capital, LLC and each holds voting and dispositive power over these shares. Scott Nieboer and Mark Eberle disclaim beneficial ownership over these shares except to the extent of their pecuniary interest therein. The address of Curtiswood Capital, LLC is 104 Woodmont Boulevard, Suite 200, Nashville, Tennessee 37205. |
| (19) | Douglas E. Cranmer and Russell B. Cranmer are co-trustees of the Jesse Cranmer Trust U/A DTD 12/28/1998 and each holds voting and dispositive power over these shares. |
131
Table of Contents
| (20) | These shares are held in an investment account managed by NFC Investments, LLC. Charles K. Slatery is the manager of NFC Investments, LLC and may be deemed to hold shared voting and dispositive power over these shares with the named holder. Charles K. Slatery disclaims beneficial ownership over these shares except to the extent of his pecuniary interest therein. The address of NFC Investments, LLC is 5101 Wheelis Drive, Suite 207, Memphis, Tennessee 38117. |
| (21) | John F. Durbin is the trustee of the Jean M. Durbin Family Trust U/A DTD 07/08/1991 and holds voting and dispositive power over these shares. |
| (22) | These shares are held in an investment account managed by NFC Investments, LLC. Charles K. Slatery is the manager of NFC Investments, LLC and may be deemed to hold shared voting and dispositive power over these shares with the named holder. Charles K. Slatery disclaims beneficial ownership over these shares except to the extent of his pecuniary interest therein. The address of NFC Investments, LLC is 5101 Wheelis Drive, Suite 207, Memphis, Tennessee 38117. |
| (23) | Luxor Capital Group, LP acts as the investment manager of GAM Equity Six Inc. Luxor Management, LLC is the general partner of Luxor Capital Group, LP. Christian Leone is the managing member of Luxor Management, LLC. Luxor Capital Group, LP, Luxor Management, LLC and Christian Leone are deemed to have shared voting and dispositive power over the securities held by each of the Luxor Investors. The address of Luxor Capital Group, LP is 1114 Avenue of the Americas, 29th Floor, New York City, New York 10036. Since 2006, Nathaniel Redleaf, one of our current directors, has served in an analyst capacity at Luxor Capital Group LP. |
| (24) | These shares are held in an investment account managed by NFC Investments, LLC. Charles K. Slatery is the manager of NFC Investments, LLC and may be deemed to hold shared voting and dispositive power over these shares with the named holder. Charles K. Slatery disclaims beneficial ownership over these shares except to the extent of his pecuniary interest therein. The address of NFC Investments, LLC is 5101 Wheelis Drive, Suite 207, Memphis, Tennessee 38117. |
| (25) | Scott Neiboer and Mark Eberle collectively own 100% of the outstanding equity interests of Glendale Partners, GP and may be deemed to hold shared voting and dispositive power over these shares. Scott Nieboer and Mark Eberle disclaim beneficial ownership over these shares except to the extent of their pecuniary interest therein. The address of Glendale Partners, GP is 104 Woodmont Boulevard, Suite 200, Nashville, Tennessee 37205. |
| (26) | Mary Gonzalez is the trustee of the Mary Gonzalez Family Trust DTD 09/08/89 and holds voting and dispositive power over the shares. |
| (27) | Wynona W. Gordon and Thomas J. Gordon are co-trustees of the Wynona W. Gordon Revocable Trust U/A DTD 05/30/1986 and each holds voting and dispositive power over these shares. |
| (28) | These shares are held in an investment account managed by NFC Investments, LLC. Charles K. Slatery is the manager of NFC Investments, LLC and may be deemed to hold shared voting and dispositive power over these shares with the named holder. Charles K. Slatery disclaims beneficial ownership over these shares except to the extent of his pecuniary interest therein. The address of NFC Investments, LLC is 5101 Wheelis Drive, Suite 207, Memphis, Tennessee 38117. |
| (29) | Evan Eastman Hall and Allen Carleton Hall are co-trustees of the M. Lorraine Hall Living Trust U/A 04/24/2006 and each holds voting and dispositive power over these shares. |
| (30) | These shares are held in an investment account managed by NFC Investments, LLC. Charles K. Slatery is the manager of NFC Investments, LLC and may be deemed to hold shared voting and dispositive power over these shares with the named holder. Charles K. Slatery disclaims beneficial ownership over these shares except to the extent of his pecuniary interest therein. The address of NFC Investments, LLC is 5101 Wheelis Drive, Suite 207, Memphis, Tennessee 38117. |
132
Table of Contents
| (31) | These shares are held in an investment account managed by NFC Investments, LLC. Charles K. Slatery is the manager of NFC Investments, LLC and may be deemed to hold shared voting and dispositive power over these shares with the named holder. Charles K. Slatery disclaims beneficial ownership over these shares except to the extent of his pecuniary interest therein. The address of NFC Investments, LLC is 5101 Wheelis Drive, Suite 207, Memphis, Tennessee 38117. |
| (32) | Phoenix Investment Adviser LLC is the investment manager of JLP Credit Opportunity Master Fund Ltd. Jeffrey Peskind is the managing member of Phoenix Investment Adviser LLC and holds voting and dispositive power over these shares. The address of JLP Stressed Credit Fund LP is 420 Lexington Avenue, Suite 2040, New York, New York 10170. |
| (33) | Phoenix Investment Adviser LLC is the investment manager of JLP Partners Master Fund Ltd. Jeffrey Peskind is the managing member of Phoenix Investment Adviser LLC and holds voting and dispositive power over these shares. The address of JLP Stressed Credit Fund LP is 420 Lexington Avenue, Suite 2040, New York, New York 10170. |
| (34) | Phoenix Investment Adviser LLC is the investment manager of JLP Stressed Credit Fund LP. Jeffrey Peskind is the managing member of Phoenix Investment Adviser LLC and holds voting and dispositive power over these shares. The address of JLP Stressed Credit Fund LP is 420 Lexington Avenue, Suite 2040, New York, New York 10170. |
| (35) | The controlling entity for J.P. Morgan Securities LLC is J.P. Morgan Broker-Dealer Holdings, Inc., which in turn is a wholly owned subsidiary of JP Morgan Chase & Co., a public holding company. The address of J.P. Morgan Securities LLC is 383 Madison Avenue, New York, New York 10179. |
| (36) | Margaret Johnston is the trustee of the Margaret Johnston Trust U/A DTD 09/23/2004 and holds voting and dispositive power over these shares. |
| (37) | These shares are held in an investment account managed by NFC Investments, LLC. Charles K. Slatery is the manager of NFC Investments, LLC and may be deemed to hold shared voting and dispositive power over these shares with the named holder. Charles K. Slatery disclaims beneficial ownership over these shares except to the extent of his pecuniary interest therein. The address of NFC Investments, LLC is 5101 Wheelis Drive, Suite 207, Memphis, Tennessee 38117. |
| (38) | These shares are held in an investment account managed by NFC Investments, LLC. Charles K. Slatery is the manager of NFC Investments, LLC and may be deemed to hold shared voting and dispositive power over these shares with the named holder. Charles K. Slatery disclaims beneficial ownership over these shares except to the extent of his pecuniary interest therein. The address of NFC Investments, LLC is 5101 Wheelis Drive, Suite 207, Memphis, Tennessee 38117. |
| (39) | These shares are held in an investment account managed by NFC Investments, LLC. Charles K. Slatery is the manager of NFC Investments, LLC and may be deemed to hold shared voting and dispositive power over these shares with the named holder. Charles K. Slatery disclaims beneficial ownership over these shares except to the extent of his pecuniary interest therein. The address of NFC Investments, LLC is 5101 Wheelis Drive, Suite 207, Memphis, Tennessee 38117. |
| (40) | Joseph H. Koch, Sr. is the trustee of the Joseph H. Koch, Sr. Revocable Trust U/A DTD 05/11/1998 and holds voting and dispositive power over these shares. |
| (41) | These shares are held in an investment account managed by NFC Investments, LLC. Charles K. Slatery is the manager of NFC Investments, LLC and may be deemed to hold shared voting and dispositive power over these shares with the named holder. Charles K. Slatery disclaims beneficial ownership over these shares except to the extent of his pecuniary interest therein. The address of NFC Investments, LLC is 5101 Wheelis Drive, Suite 207, Memphis, Tennessee 38117. |
| (42) | John M. Learch and Odelia A. Learch are co-trustees of The Learch Trust U/A DTD 04/28/1999 and each holds voting and dispositive power over these shares. |
133
Table of Contents
| (43) | Donald A. Lockwood is the trustee of the Donald A. Lockwood Revocable Trust U/A DTD 04/22/2002 and holds voting and dispositive power over these shares. |
| (44) | Harold A. Lokovsek and Barbara Jill Lokovsek are co-trustees of The Lokovsek Family Trust U/A DTD 06/25/93 and each holds voting and dispositive power over these shares. |
| (45) | These shares are held in an investment account managed by NFC Investments, LLC. Charles K. Slatery is the manager of NFC Investments, LLC and may be deemed to hold shared voting and dispositive power over these shares with the named holder. Charles K. Slatery disclaims beneficial ownership over these shares except to the extent of his pecuniary interest therein. The address of NFC Investments, LLC is 5101 Wheelis Drive, Suite 207, Memphis, Tennessee 38117. |
| (46) | Luxor Capital Group, LP acts as the investment manager of Luxor Capital II Company. Luxor Management, LLC is the general partner of Luxor Capital Group, LP. Christian Leone is the managing member of Luxor Management, LLC. Luxor Capital Group, LP, Luxor Management, LLC and Christian Leone are deemed to have shared voting and dispositive power over the securities held by each of the Luxor Investors. The address of Luxor Capital Group, LP is 1114 Avenue of the Americas, 29th Floor, New York City, New York 10036. Since 2006, Nathaniel Redleaf, one of our current directors, has served in an analyst capacity at Luxor Capital Group LP. |
| (47) | Luxor Capital Group, LP acts as the investment manager of Luxor Capital Partners LP. Luxor Management, LLC is the general partner of Luxor Capital Group, LP. Christian Leone is the managing member of Luxor Management, LLC. Luxor Capital Group, LP, Luxor Management, LLC and Christian Leone are deemed to have shared voting and dispositive power over the securities held by each of the Luxor Investors. The address of Luxor Capital Group, LP is 1114 Avenue of the Americas, 29th Floor, New York City, New York 10036. Since 2006, Nathaniel Redleaf, one of our current directors, has served in an analyst capacity at Luxor Capital Group LP. |
| (48) | Luxor Capital Group, LP acts as the investment manager of Luxor Capital Partners Offshore Master Fund LP. Luxor Management, LLC is the general partner of Luxor Capital Group, LP. Christian Leone is the managing member of Luxor Management, LLC. Luxor Capital Group, LP, Luxor Management, LLC and Christian Leone are deemed to have shared voting and dispositive power over the securities held by each of the Luxor Investors. The address of Luxor Capital Group, LP is 1114 Avenue of the Americas, 29th Floor, New York City, New York 10036. Since 2006, Nathaniel Redleaf, one of our current directors, has served in an analyst capacity at Luxor Capital Group LP. |
| (49) | Luxor Capital Group, LP acts as the investment manager of Luxor Spectrum Offshore Master Fund LP. Luxor Management, LLC is the general partner of Luxor Capital Group, LP. Christian Leone is the managing member of Luxor Management, LLC. Luxor Capital Group, LP, Luxor Management, LLC and Christian Leone are deemed to have shared voting and dispositive power over the securities held by each of the Luxor Investors. The address of Luxor Capital Group, LP is 1114 Avenue of the Americas, 29th Floor, New York City, New York 10036. Since 2006, Nathaniel Redleaf, one of our current directors, has served in an analyst capacity at Luxor Capital Group LP. |
| (50) | Luxor Capital Group, LP acts as the investment manager of Luxor Wavefront LP. Luxor Management, LLC is the general partner of Luxor Capital Group, LP. Christian Leone is the managing member of Luxor Management, LLC. Luxor Capital Group, LP, Luxor Management, LLC and Christian Leone are deemed to have shared voting and dispositive power over the securities held by each of the Luxor Investors. The address of Luxor Capital Group, LP is 1114 Avenue of the Americas, 29th Floor, New York City, New York 10036. Since 2006, Nathaniel Redleaf, one of our current directors, has served in an analyst capacity at Luxor Capital Group LP. |
| (51) | The Class A Common Stock offered by Lyon Shareholder 2012, LLC, or Lyon LLC, represents the Class A Common Stock issuable upon conversion of the shares of Class B Common Stock held by Lyon LLC, which is 31,464,548 shares of Class A Common Stock. The members of Lyon LLC are the LYON SHAREHOLDER 2012 IRREVOCABLE TRUST NO. 1 established December 24, 2012, the LYON |
134
Table of Contents
| SHAREHOLDER 2012 IRREVOCABLE TRUST NO. 2 established December 24, 2012 and the WILLIAM HARWELL LYON SEPARATE PROPERTY TRUST established July 28, 2000, the Trustee of each of which is William Harwell Lyon (our President, Chief Operating Officer and Director). The manager of Lyon LLC is William Harwell Lyon. William Harwell Lyon may be deemed to have voting and investment power of the securities held by Lyon LLC. William Harwell Lyon disclaims beneficial ownership of such securities, except to the extent of his pecuniary interest therein. The address of Lyon LLC is 4490 Von Karman Avenue, Newport Beach, California 92660. |
| (52) | Represents 24,199 shares of Class A Common Stock held by The William Harwell Lyon Separate Property Trust established July 28, 2000. William Harwell Lyon (our President, Chief Operating Officer and Director) is Trustee of the trust and holds voting and dispositive power over these shares. William Harwell Lyon disclaims beneficial ownership over these shares except to the extent of his pecuniary interest therein. |
| (53) | These shares are held in an investment account managed by NFC Investments, LLC. Charles K. Slatery is the manager of NFC Investments, LLC and may be deemed to hold shared voting and dispositive power over these shares with the named holder. Charles K. Slatery disclaims beneficial ownership over these shares except to the extent of his pecuniary interest therein. The address of NFC Investments, LLC is 5101 Wheelis Drive, Suite 207, Memphis, Tennessee 38117. |
| (54) | These shares are held in an investment account managed by NFC Investments, LLC. Charles K. Slatery is the manager of NFC Investments, LLC and may be deemed to hold shared voting and dispositive power over these shares with the named holder. Charles K. Slatery disclaims beneficial ownership over these shares except to the extent of his pecuniary interest therein. The address of NFC Investments, LLC is 5101 Wheelis Drive, Suite 207, Memphis, Tennessee 38117. |
| (55) | These shares are held in an investment account managed by NFC Investments, LLC. Charles K. Slatery is the manager of NFC Investments, LLC and may be deemed to hold shared voting and dispositive power over these shares with the named holder. Charles K. Slatery disclaims beneficial ownership over these shares except to the extent of his pecuniary interest therein. The address of NFC Investments, LLC is 5101 Wheelis Drive, Suite 207, Memphis, Tennessee 38117. |
| (56) | These shares are held in an investment account managed by NFC Investments, LLC. Charles K. Slatery is the manager of NFC Investments, LLC and may be deemed to hold shared voting and dispositive power over these shares with the named holder. Charles K. Slatery disclaims beneficial ownership over these shares except to the extent of his pecuniary interest therein. The address of NFC Investments, LLC is 5101 Wheelis Drive, Suite 207, Memphis, Tennessee 38117. |
| (57) | These shares are held in an investment account managed by NFC Investments, LLC. Charles K. Slatery is the manager of NFC Investments, LLC and may be deemed to hold shared voting and dispositive power over these shares with the named holder. Charles K. Slatery disclaims beneficial ownership over these shares except to the extent of his pecuniary interest therein. The address of NFC Investments, LLC is 5101 Wheelis Drive, Suite 207, Memphis, Tennessee 38117. |
| (58) | Charles K. Slatery is the manager of NFC Investments, LLC and holds shared voting and dispositive power over these shares with each holder. Charles K. Slatery disclaims beneficial ownership over these shares except to the extent of his pecuniary interest therein. The address of NFC Investments, LLC is 5101 Wheelis Drive, Suite 207, Memphis, Tennessee 38117. |
| (59) | Luxor Capital Group, LP acts as the investment manager of OC 19 Master Fund LP-LCG. Luxor Management, LLC is the general partner of Luxor Capital Group, LP. Christian Leone is the managing member of Luxor Management, LLC. Luxor Capital Group, LP, Luxor Management, LLC and Christian Leone are deemed to have shared voting and dispositive power over the securities held by each of the Luxor Investors. The address of Luxor Capital Group, LP is 1114 Avenue of the Americas, 29th Floor, New York City, New York 10036. Since 2006, Nathaniel Redleaf, one of our current directors, has served in an analyst capacity at Luxor Capital Group LP. |
135
Table of Contents
| (60) | These shares are held in an investment account managed by NFC Investments, LLC. Charles K. Slatery is the manager of NFC Investments, LLC and may be deemed to hold shared voting and dispositive power over these shares with the named holder. Charles K. Slatery disclaims beneficial ownership over these shares except to the extent of his pecuniary interest therein. The address of NFC Investments, LLC is 5101 Wheelis Drive, Suite 207, Memphis, Tennessee 38117. |
| (61) | These shares are held in an investment account managed by NFC Investments, LLC. Charles K. Slatery is the manager of NFC Investments, LLC and may be deemed to hold shared voting and dispositive power over these shares with the named holder. Charles K. Slatery disclaims beneficial ownership over these shares except to the extent of his pecuniary interest therein. The address of NFC Investments, LLC is 5101 Wheelis Drive, Suite 207, Memphis, Tennessee 38117. |
| (62) | These shares are held in an investment account managed by NFC Investments, LLC. Charles K. Slatery is the manager of NFC Investments, LLC and may be deemed to hold shared voting and dispositive power over these shares with the named holder. Charles K. Slatery disclaims beneficial ownership over these shares except to the extent of his pecuniary interest therein. The address of NFC Investments, LLC is 5101 Wheelis Drive, Suite 207, Memphis, Tennessee 38117. |
| (63) | Mavis A. Winter Pasternack is the trustee of the Mavis A. Winter Pasternack Trust U/A DTD 08/16/1999 and holds voting and dispositive power over these shares. |
| (64) | James D. Prause is the trustee of the James D. Prause Trust DTD 08/02/99 and holds voting and dispositive power over the shares. |
| (65) | WLH Recovery Acquisition LLC, a Delaware limited liability company, acquired these shares in connection with a privately negotiated stock issuance that took place on October 12, 2012. Paulson & Co. Inc. is an investment advisor registered under the Investment Advisors Act of 1940 that furnishes investment advice to and manages various onshore and offshore investment funds and separately managed accounts, or, collectively, the “Funds.” WLH Recovery Acquisition LLC is one of the Funds. In its role as investment advisor and manager of the Funds, Paulson & Co. Inc. possesses voting and/or investment power over the ordinary shares owned by the Funds. As the President and sole Director of Paulson & Co. Inc., John Paulson may be deemed to have voting and/or investment power over such shares. The address for the Funds is c/o Paulson & Co. Inc., 1251 Avenue of the Americas, NY, NY 10020. |
| (66) | Jack M. Press and Lenore Press are co-trustees of the Jack & Lenore Press Family Revocable Trust U/A DTD 03/03/1998 and each holds voting and dispositive power over these shares. |
| (67) | These shares are held in an investment account managed by NFC Investments, LLC. Charles K. Slatery is the manager of NFC Investments, LLC and may be deemed to hold shared voting and dispositive power over these shares with the named holder. Charles K. Slatery disclaims beneficial ownership over these shares except to the extent of his pecuniary interest therein. The address of NFC Investments, LLC is 5101 Wheelis Drive, Suite 207, Memphis, Tennessee 38117. |
| (68) | Hal Ross is trustee of the Ross Foundation and holds voting and dispositive power over these shares. The address of the Ross Foundation is 100 N. Broadway St., Wichita, Kansas 67202. |
| (69) | These shares are held in an investment account managed by NFC Investments, LLC. Charles K. Slatery is the manager of NFC Investments, LLC and may be deemed to share voting and dispositive power over these shares with William S. Solmson and Ron G. Nance, as co-conservators. Charles K. Slatery disclaims beneficial ownership over these shares except to the extent of his pecuniary interest therein. The address of NFC Investments, LLC is 5101 Wheelis Drive, Suite 207, Memphis, Tennessee 38117. |
| (70) | These shares are held in an investment account managed by NFC Investments, LLC. Charles K. Slatery is the manager of NFC Investments, LLC and may be deemed to hold shared voting and dispositive power over these shares with the named holder. Charles K. Slatery disclaims beneficial ownership over these shares except to the extent of his pecuniary interest therein. The address of NFC Investments, LLC is 5101 Wheelis Drive, Suite 207, Memphis, Tennessee 38117. |
136
Table of Contents
| (71) | These shares are held in an investment account managed by NFC Investments, LLC. Charles K. Slatery is the manager of NFC Investments, LLC and may be deemed to hold shared voting and dispositive power over these shares with the named holder. Charles K. Slatery disclaims beneficial ownership over these shares except to the extent of his pecuniary interest therein. The address of NFC Investments, LLC is 5101 Wheelis Drive, Suite 207, Memphis, Tennessee 38117. |
| (72) | These shares are held in an investment account managed by NFC Investments, LLC. Charles K. Slatery is the manager of NFC Investments, LLC and may be deemed to hold shared voting and dispositive power over these shares with the named holder. Charles K. Slatery disclaims beneficial ownership over these shares except to the extent of his pecuniary interest therein. The address of NFC Investments, LLC is 5101 Wheelis Drive, Suite 207, Memphis, Tennessee 38117. |
| (73) | United Equities Commodities Company is a New York general partnership. Moses Marx is the controlling partner of United Equities Commodities Company and holds voting and dispositive power over these shares. The address of United Equities Commodities Company is 160 Broadway, First Floor, New York, New York 10038. |
| (74) | These shares are held in an investment account managed by NFC Investments, LLC. Charles K. Slatery is the manager of NFC Investments, LLC and may be deemed to share voting and dispositive power over these shares with Marvin Palmer, as Trustee. Charles K. Slatery disclaims beneficial ownership over these shares except to the extent of his pecuniary interest therein. The address of NFC Investments, LLC is 5101 Wheelis Drive, Suite 207, Memphis, Tennessee 38117. |
| (75) | These shares are held in an investment account managed by NFC Investments, LLC. Charles K. Slatery is the manager of NFC Investments, LLC and may be deemed to hold shared voting and dispositive power over these shares with the named holder. Charles K. Slatery disclaims beneficial ownership over these shares except to the extent of his pecuniary interest therein. The address of NFC Investments, LLC is 5101 Wheelis Drive, Suite 207, Memphis, Tennessee 38117. |
| (76) | Fay Waldman, Hannah Waldman and Fred Waldman are co-trustees of the U/W/O David Waldman Trust U/A DTD 06/16/1995. So long as Fay Waldman is a trustee, she has sole voting and dispositive power over these shares. |
| (77) | Holder has voting and dispositive power over these securities. |
| (78) | These shares are held in an investment account managed by NFC Investments, LLC. Charles K. Slatery is the manager of NFC Investments, LLC and may be deemed to hold shared voting and dispositive power over these shares with the named holder. Charles K. Slatery disclaims beneficial ownership over these shares except to the extent of his pecuniary interest therein. The address of NFC Investments, LLC is 5101 Wheelis Drive, Suite 207, Memphis, Tennessee 38117. |
| (79) | These shares are held in an investment account managed by NFC Investments, LLC. Charles K. Slatery is the manager of NFC Investments, LLC and may be deemed to hold shared voting and dispositive power over these shares with the named holder. Charles K. Slatery disclaims beneficial ownership over these shares except to the extent of his pecuniary interest therein. The address of NFC Investments, LLC is 5101 Wheelis Drive, Suite 207, Memphis, Tennessee 38117. |
| (80) | Robert Daniel Wucetich and Betty Anne Wucetich are co-trustees of the Wucetich Revocable Family Trust U/DEC. DTD 09/02/2000 and each holds voting and dispositive power over these shares. |
| (81) | These shares are held in an investment account managed by NFC Investments, LLC. Charles K. Slatery is the manager of NFC Investments, LLC and may be deemed to hold shared voting and dispositive power over these shares with the named holder. Charles K. Slatery disclaims beneficial ownership over these shares except to the extent of his pecuniary interest therein. The address of NFC Investments, LLC is 5101 Wheelis Drive, Suite 207, Memphis, Tennessee 38117. |
137
Table of Contents
Our authorized capital stock consists of 540,000,000 shares of common stock, $0.01 par value per share, and 80,000,000 shares of preferred stock. Our common stock is comprised of four classes, 340,000,000 shares of Class A Common Stock, 50,000,000 shares of Class B Common Stock, 120,000,000 shares of Class C Common Stock and 30,000,000 shares of Class D Common Stock. The following summary of our common stock and preferred stock is not complete and may not contain all the information you should consider before investing in the capital stock. This description is subject to and qualified in its entirety by provisions, of our Second Amended and Restated Certificate of Incorporation, or the Charter, and our Second Amended and Restated Bylaws or the Bylaws. References to the “Company” herein solely refer to William Lyon Homes.
Common Stock
As of March 11, 2013, we had 123,107,696 shares of common stock outstanding and held of record, including: (i) 70,121,378 shares of Class A Common Stock, (ii) 31,464,548 of Class B Common Stock, (iii) 16,020,338 of Class C Common Stock and (iv) 5,501,432 shares of Class D Common Stock outstanding. All of our outstanding shares of common stock have been validly issued and fully paid and are nonassessable. The rights of the holders of common stock will be subject to, and may be adversely affected by, the rights of the holders of preferred stock. Holders of our common stock have no preference, exchange, sinking fund, redemption or appraisal rights and have no preemptive rights to subscribe for any of our securities.
Mandatory Conversion of Class C Common Stock and Class D Common Stock. Upon the occurrence of the Conversion Date (as defined below), each share of Class C Common Stock and Class D Common Stock will automatically convert into one share of Class A Common Stock.
Mandatory Conversion of Class B Common Stock.On or after the Conversion Date (as defined below), each share of Class B Common Stock will automatically convert into one share of Class A Common Stock if a majority of the shares of Class B Common Stock then outstanding vote in favor of such conversion. If, at any time (whether before, on or after the Conversion Date), any share of Class B Common Stock is not owned, beneficially or of record, by either General William Lyon or William H. Lyon, their siblings, spouses and lineal descendants, any entities wholly owned by one or more of the foregoing persons, or any trusts or other estate planning vehicles for the benefit of any of the foregoing, then such share of Class B Common Stock will automatically convert into one share of Class A Common Stock.
Optional Conversion of Class C Common Stock and Class B Common Stock. Holders of Class B Common Stock and Class C Common Stock may elect at any time to convert any or all of their shares into Class A Common Stock at the rate of one share of Class A Common Stock for each share of Class B Common Stock or Class C Common Stock, as applicable.
Conversion Date.The “Conversion Date” shall occur upon the earlier of (i) the date on which (a) the holders of a majority of the shares of Class A Common Stock then outstanding, voting separately as a class, and (b) the holders of a majority of the shares of Class C Common Stock and Convertible Preferred Stock then outstanding, voting separately as a class, vote in favor of such conversion; and (ii) upon the occurrence of (a) the Company closing a sale of its Class A Common Stock in a firmly underwritten public offering pursuant to an effective registration statement filed under the Securities Act, where the gross proceeds to the Company are not less than $25,000,000 and the offering price per share to the public equals or exceeds 130% of the then-prevailing Convertible Preferred Conversion Price (as defined in the Charter); or (b) if the Class A Common Stock is listed on a national securities exchange, then the date on which the thirty-day volume weighted average trading price equals or exceeds 130% of the then-prevailing Convertible Preferred Conversion Price and the average daily trading volume equals or exceeds $4,000,000. The number of shares of Class A Common Stock issuable upon the conversion of shares of Class B Common Stock and Class C Common Stock is subject to customary adjustments for stock splits, stock dividends and transactions with similar effect.
138
Table of Contents
Status of Converted Stock. In the event any shares of Class B Common Stock, Class C Common Stock or Class D Common Stock are converted into shares of Class A Common Stock, the shares of Class B Common Stock, Class C Common Stock or Class D Common Stock so converted will be cancelled and will no longer be issuable by the Company. In addition, following the conversion of all of the outstanding shares of our Class B Common Stock, Class C Common Stock or Class D Common Stock, respectively, into shares of Class A Common Stock, the Company will no longer issue any further shares of Class B Common Stock, Class C Common Stock or Class D Common Stock, respectively, and will no longer have any authorized Class B Common Stock, Class C Common Stock or Class D Common Stock, as applicable.
Voting. On all matters on which the holders of our common stock are entitled to vote, prior to the occurrence of both the Conversion Date and the conversion of all Class B Common Stock, each share of common stock is entitled to one vote per share, with the exception of our Class B Common Stock, which is entitled to two votes per share. Following both the Conversion Date and the conversion of all Class B Common Stock, each share of Class A Common Stock is entitled to one vote per share. See “Risk Factors–Risks Related to Ownership of Our Capital Stock and this Offering–Concentration of ownership of the voting power of our capital stock may prevent other stockholders from influencing corporate decisions and create perceived conflicts of interest.” Holders of our capital stock do not have cumulative voting rights in the election of directors. Accordingly, holders of a majority of the voting shares are able to prevent other stockholders from influencing corporate decisions. Prior to the Conversion Date, stockholders may take action at annual or special meetings or by means of written consent. From and after the Conversion Date, all actions of stockholders must be taken at a special or annual meeting.
Any amendment to our certificate of incorporation (whether by merger, consolidation or otherwise) or any share exchange of all of the outstanding stock of the Company for securities of another entity, or consolidation or merger involving the Company, or to which the Company is otherwise a party, with or into any other corporation or other entity or person, the sale or disposition of substantially all of the assets of the Company, the conversion of the Company into another form or entity or for any dissolution or liquidation of the Company, requires the vote or consent of (i) 66 2/3% of our Class A Common Stock, voting separately as a class, (ii) the majority of voting power of our Class B Common Stock and Class D Common Stock, voting together as a separate class, except that if all authorized and issued shares of Class B Common Stock are converted or if no shares of Class B Common Stock are authorized or outstanding, in which case an amendment to our certificate of incorporation will require the vote or consent of 66 2/3% of the voting power of our Class A Common Stock and our Class D Common Stock, voting together as a separate class, and, in either case, (iii) the majority of our Class C Common Stock and Convertible Preferred Stock, voting together as a separate class.
National Securities Exchange or Initial Public Offering. On or prior to the third anniversary of the date of first issuance of our Class A Common Stock, we are required to use best efforts to cause our Class A Common Stock to become listed on a national securities exchange, and subject to certain exceptions, to complete a qualifying initial public offering.
Dividend Rights. Subject to applicable law, any contractual restrictions, and the rights of the holders of any outstanding series of preferred stock, if any, holders of our common stock are entitled to receive such dividends and other distributions that the board of directors may declare from time to time in its sole discretion. Any dividends declared by the board of directors on a share of our common stock will be declared in equal amounts with respect to each share of every class of common stock. If dividends are declared on our common stock that are payable in shares of common stock, or securities convertible into, or exercisable or exchangeable for our common stock, the dividends payable to the holders of each class of our common stock will be paid only in kind for the same class of common stock (or in securities convertible into, or exercisable or exchangeable for in kind shares) and such dividends will be paid in the same number of shares (or fraction thereof) of common stock (or securities convertible into, or exercisable or exchangeable for the same number of shares (or fraction thereof) on an in kind per share basis.
139
Table of Contents
Liquidation Rights.Upon the dissolution, liquidation or winding up of the Company, whether voluntary or involuntary, subject to the rights of the holders of any outstanding series of preferred stock, if any, and after payment on the debts and other liabilities of the Company, holders of our common stock are entitled to receive the assets of the Company available for distribution to its stockholders ratably in proportion to the number of shares of Class A Common Stock that such holders would have held if all shares of Class B Common Stock, Class C Common Stock and Class D Common Stock were converted into Class A Common Stock prior to any such dissolution, liquidation or winding up of the Company.
Warrants
On February 25, 2012, in connection with the issuance of Class B Common Stock and subject to the terms of the Class B Common Stock and Warrant Purchase Agreement, we issued to the holders of Class B Common Stock a warrant to purchase 15,737,294 shares of Class B Common Stock, or the Class B Warrant, at an exercise price of $2.07 per share. The expiration date of the Class B Warrant is February 24, 2017.
Preferred Stock
As of March 11, 2013, there were 77,005,744 shares of Convertible Preferred Stock, $0.01 par value per share, or the Convertible Preferred Stock, outstanding. Our Second Amended and Restated Certificate of Incorporation, or the Charter, authorizes the issuance of up to 80,000,000 shares of preferred stock, in one or more series and with such rights, preferences, privileges and restrictions, including voting rights, redemption provisions (including sinking fund provisions), dividend rights, dividend rates, liquidation rates, liquidation preferences and conversion rights, as our board of directors may determine without further action by the holders of common stock. Any such issuance of preferred stock could adversely affect the voting power and other rights of the holders of common stock. Additionally, the issuance of preferred stock may have the effect of decreasing the market price of our Class A Common Stock, may adversely affect the voting and other rights of the holders of our common stock, and could have the effect of delaying, deferring or preventing a change of control of our company or other corporate action. See “Risk Factors—Risks Related to Ownership of Our Capital Stock and this Offering—Anti-takeover provisions in our charter documents and under Delaware law could make an acquisition of our company more difficult, limit attempts by our stockholders to replace or remove our current management and limit the market price of our common stock.”
Dividend Rights. Holders of Convertible Preferred Stock, in preference to the holders of our common stock, are entitled to receive cumulative dividends at a rate of 6% per annum paid consisting of (i) cash dividends at the rate of 4% of the Base Amount per share and (ii) accreting dividends accruing at a rate of 2% of the then applicable base amount per share; or, together, the Convertible Preferred Dividends. The base amount is calculated as the sum of the Convertible Preferred Original Issue Price and the amount of any and all accrued but unpaid Convertible Preferred Dividends on such shares. In the event that the Company declares or pays any dividends upon any common stock (whether payable in cash, securities, other property or otherwise), the Company will also declare and pay to the holders of the Convertible Preferred Stock at the same time that it declares and pays such dividends to the holders of such common stock the dividends declared and paid with respect to such common stock as if all of the outstanding Convertible Preferred Stock had been converted into such common stock immediately prior to the record date for such dividend. Any such dividends will be in addition to the Convertible Preferred Dividends.
Mandatory Conversion. Upon the occurrence of the Conversion Date, each share of Convertible Preferred Stock will automatically convert into such number of fully paid and non-assessable shares of Class A Common Stock as is determined by dividing the Convertible Preferred Original Issue Price (as defined in the Charter) by the then applicable Convertible Preferred Conversion Price (as defined in the Charter). At March 11, 2013, the then applicable Convertible Preferred Conversion Price was equal to the Convertible Preferred Original Issue Price. In connection with any such conversion, the Company will also pay (i) any accrued but unpaid Convertible Preferred Dividends on any shares of Convertible Preferred Stock being converted (including, without limitation,
140
Table of Contents
any accreting dividends not previously paid), which amounts will be paid in cash out of funds legally available therefor if such payment would not violate any covenants imposed by agreements entered into in good faith governing the indebtedness of the Company and its subsidiaries, or, to the extent not so permitted or so available, in shares of Class A Common Stock, based on the fair market value of such common stock at such time, and (ii) in cash, the value of any fractional share of Class A Common Stock otherwise issuable to any such Convertible Preferred Stockholder.
Optional Conversion.Holders of Convertible Preferred Stock may elect to convert any and all of their Convertible Preferred shares into such number of fully paid and non-assessable shares of Class C Common Stock as is determined by dividing the Convertible Preferred Original Issue Price by the Convertible Preferred Conversion Price applicable to Class C Common Stock. In connection with any such conversion, the Company must pay to electing holder(s) (i) any accrued but unpaid Convertible Preferred Dividends on any shares of Convertible Preferred Stock being converted (including, without limitation, any accreting dividends not previously paid), which amounts will be paid in cash out of funds legally available therefor if such payment would not violate any covenants imposed by agreements entered into in good faith governing the indebtedness of the Company, or, to the extent not so permitted or not available, in shares of Class C Common Stock, based on the fair market value of such common stock at such time, and (ii) in cash, the value of any fractional share of Class C Common Stock otherwise issuable to such holder(s) of our Convertible Preferred Stock.
Status of Converted Stock. In the event any shares of Convertible Preferred Stock are converted, such shares will be cancelled and will no longer be issuable by the Company. In addition, following the conversion of all of the outstanding shares of Convertible Preferred Stock into shares of Class A Common Stock or Class C Common Stock, as applicable, the Company will no longer issue any further shares of Convertible Preferred Stock and will no longer have any authorized Convertible Preferred Stock.
Conversion Price Adjustments of Convertible Preferred Stock for Certain Splits and Combinations.In the event the Company subdivides or effects a stock split of its Class A Common Stock or Class C Common Stock or makes a distribution of common stock on any such shares of common stock, the Convertible Preferred Conversion Price with respect to a conversion of Convertible Preferred Stock into Class A Common Stock or Class C Common Stock, respectively, in effect immediately prior to such subdivision, stock split or such distribution will be proportionately decreased and, in case the Company will at any time combine the outstanding shares of, or effect a reverse stock split on its Class A Common Stock or Class C Common Stock, the Convertible Preferred Conversion Price with respect to a conversion of Convertible Preferred Stock into Class A Common Stock or Class C Common Stock, respectively, in effect immediately prior to such combination or reverse stock split will be proportionately increased.
Voting. Each share of Convertible Preferred Stock has the right to one vote for each share of Class C Common Stock into which such share could be converted, and to participate in the election and removal of directors in accordance with the guidelines contained in our certificate of incorporation. See “Management and Directors—Board of Directors” for a discussion of voting rights with respect to the election of directors. In addition, the affirmative vote of the holders of at least a majority of the outstanding shares of Convertible Preferred Stock is required for the Company to take action with respect to certain matters, including the authorization and/or issuance of senior classes of preferred stock and the amendment of our certificate of incorporation or bylaws so as to adversely affect the rights of such holders.
Liquidation Rights. Upon the dissolution, liquidation or winding up of the Company, whether voluntary or involuntary, after payment on the debts and other liabilities of the Company but prior and in preference to any distributions or payments to holders of common stock or junior preferred stock, holders of our Convertible Preferred Stock are entitled to be paid out of the assets of the Company an amount per share equal to the greater of (i) all accrued but unpaid Convertible Preferred Dividends per share of Convertible Preferred Stock, plus an amount equal to the Convertible Preferred Original Issue Price per share and (ii) the per share amount of all cash, securities and other property to be distributed in respect of the common stock such holder would have been
141
Table of Contents
entitled to receive had it converted its convertible preferred stock immediately prior to any such dissolution, liquidation or winding up of the Company.
Redemption Rights. To the extent not previously converted to common stock, the Company will redeem all then outstanding shares of Convertible Preferred Stock on the fifteenth anniversary of the date of first issuance at a price per share payable in cash and equal to the Convertible Preferred Original Issue Price plus accrued and unpaid Convertible Preferred Dividends in respect thereof.
Transfer Agent and Registrar
The transfer agent and registrar for our common stock is American Stock Transfer & Trust Company, LLC.
Delaware Anti-Takeover Law
Delaware Anti-Takeover Statute. We are not currently subject to Section 203 of the Delaware General Corporation Law, which we refer to as the DGCL, an anti-takeover law. However, this may soon change if, following this registration process, our common stock and/or preferred stock shares are listed on a securities exchange or traded over-the-counter. In general, Section 203 prohibits a publicly held Delaware corporation from engaging in a merger or other business combination with any interested stockholder for a period of three years following the date that the stockholder became an interested stockholder, unless:
(1) prior to the time the stockholder became an interested stockholder, the board of directors of the corporation approved either the business combination or the transaction that resulted in the stockholder becoming an interested stockholder;
(2) upon consummation of the transaction that resulted in the stockholder becoming an interested stockholder, the interested stockholder owned at least 85% of the voting stock of the corporation outstanding at the time the transaction commenced, subject to certain exclusions; or
(3) on or subsequent to the time the stockholder became an interested stockholder, the business combination is approved by the board of directors of the corporation and authorized at an annual or special meeting of stockholders, by the affirmative vote of at least 66 2/3% of the outstanding voting stock that is not owned by the interested stockholder.
In general, Section 203 of the Delaware General Corporation Law, or the DGCL, defines an “interested stockholder” as:
(1) any entity or person beneficially owning 15% or more of the outstanding voting stock of the corporation;
(2) any entity or person that is an affiliate or associate of the corporation and was the owner of 15% or more of the outstanding voting stock of the corporation at any time within the three-year period immediately prior to the date on which it is sought to be determined whether such person is an interested stockholder; and
(3) the affiliates or associates of any such entities or persons.
The provisions of Section 203 of the DGCL described above could have the following effects on the Company, among others:
(1) delaying, deferring or preventing a change in control;
(2) delaying, deferring or preventing the removal of existing management;
(3) deterring potential acquirers from making an offer to the stockholders of the Company; and
(4) limiting any opportunity of stockholders of the Company to realize premiums over prevailing market prices of the common stock in connection with offers by potential acquirers.
142
Table of Contents
This could be the case even if a majority of the Company’s stockholders might benefit from a change of control or offer.
Special Meetings of Stockholders. Prior to the Conversion Date, special meetings of the stockholders may be called by the board of directors, the Chairman of the Board, the President, or by holders of more than 50% of the shares of any class of the Company’s common stock or preferred stock (excluding Class D Common Stock). On and after the Conversion Date, special meetings of the stockholders may be called by the board of directors, the Chairman of the Board or the President.
No Action by Written Consent. Prior to the Conversion Date, any action which may be taken at an annual or special meeting may be taken without a meeting, without prior notice and without a vote, if a consent in writing, signed by the holders of outstanding stock having not less than the minimum number of votes that would be necessary to authorize or take such action at a meeting. On and after the Conversion Date, stockholders will no longer be entitled to take action by written consent, and all actions of stockholders must be taken at a special or annual meeting.
Registration Rights Agreements
On the effective date of the Prepackaged Joint Plan of Reorganization, or the Plan, we entered into registration rights agreements with each of the holders of Class A Common Stock, Class B Common Stock, Class C Common Stock and Convertible Preferred Stock, or the Registration Rights Agreements. Pursuant to the Registration Rights Agreements, we have prepared and filed, at our expense, this registration statement covering the resale of the shares of our capital stock issued in connection with the Plan. Under the Registration Rights Agreement, we are further required to use commercially reasonable efforts to cause the shares to be listed or quoted on a securities exchange or automated interdealer quotation system.
On June 28, 2012, in connection with the purchase of certain real property, or the Colony Transaction, the Company issued 10,000,000 shares of Class A Common Stock as consideration for the property to investment vehicles managed by affiliates of Colony Capital, LLC, or Colony. In connection with the Colony Transaction, the Company amended its Class A Common Stock Registration Rights Agreement to include in such agreement the shares issued to Colony so that Colony may become a party to such agreement with equal rights, benefits and obligations as the other stockholders who are party thereto.
On October 12, 2012, the Company issued to an investment vehicle managed by affiliates of Paulson & Co. Inc., or Paulson, (i) 15,238,095 shares of the Company’s Class A Common Stock, for $16,000,000 in cash and (ii) 12,173,913 shares of the Company’s Convertible Preferred Stock, for $14,000,000 in cash, for an aggregate purchase price of $30,000,000, or the Paulson Transaction. In connection with the Paulson Transaction, the Company further amended its Class A Common Stock Registration Rights Agreement and Convertible Preferred Stock and Class C Common Stock Registration Rights Agreement to include in such agreements the shares issued to Paulson so that Paulson may become a party to such agreements with equal rights, benefits and obligations as the other stockholders who are parties thereto.
The Registration Rights Agreements do not provide for any cash penalties, liquidated damages or other specific penalties resulting from delays in registering the securities covered by each of the agreements. The holders of the securities covered by the Registration Rights Agreements have the right to pursue an injunction in order to prevent a breach and to enforce their rights under the Registration Rights Agreements. The Company may be required to pay reasonable legal fees and expenses incurred in connection with such enforcement proceedings.
143
Table of Contents
DESCRIPTION OF CERTAIN INDEBTEDNESS
8.5% Senior Notes Due 2020
On November 8, 2012, William Lyon Homes, Inc., or California Lyon, a wholly-owned subsidiary of William Lyon Homes, or Parent, issued $325 million aggregate principal amount of 8.5% Senior Notes due 2020, or the New Notes. Interest on the New Notes will be paid semi-annually on May 15 and November 15 of each year, commencing May 15, 2013.
The New Notes are California Lyon’s senior unsecured obligations and are unconditionally guaranteed on a senior unsecured basis by Parent and certain of Parent’s existing and future wholly-owned subsidiaries. The New Notes and the guarantees rank equally in right of payment with all of California Lyon’s and the guarantors’ existing and future unsecured senior debt and senior in right of payment to all of California Lyon’s and the guarantors’ future subordinated debt. The New Notes and the guarantees are and will be effectively junior to any of California Lyon’s and the guarantors’ existing and future secured debt.
On or after November 15, 2016, California Lyon may redeem all or a portion of the New Notes upon not less than 30 nor more than 60 days’ notice, at the redemption prices (expressed as percentages of the principal amount) set forth below plus accrued and unpaid interest to the applicable redemption date, if redeemed during the 12-month period beginning on November 15 of the years indicated below:
Year | Percentage | |||
2016 | 104.250 | % | ||
2017 | 102.125 | % | ||
2018 and thereafter | 100.000 | % | ||
|
| |||
Prior to November 15, 2016 the New Notes may be redeemed in whole or in part at a redemption price equal to 100% of the principal amount plus a “make-whole” premium, and accrued and unpaid interest to, the redemption date.
In addition, any time prior to November 15, 2015, California Lyon may, at its option on one or more occasions, redeem notes in an aggregate principal amount not to exceed 35% of the aggregate principal amount of the New Notes issued prior to such date at a redemption price (expressed as a percentage of principal amount) of 108.5%, plus accrued and unpaid interest to the redemption date, with an amount equal to the net cash proceeds from one or more equity offerings.
If California Lyon experiences certain change of control events, it must offer to repurchase the New Notes at 101% of their principal amount thereof on the date of purchase plus accrued and unpaid interest, if any, to the date of purchase, subject to the right of holders of record on the relevant record date to receive interest due on the relevant interest payment date.
If California Lyon sells assets and does not use the proceeds for specified purposes, California Lyon must offer to repurchase the New Notes at 100% of their principal amount, plus accrued and unpaid interest to the applicable repurchase date.
The indenture governing the New Notes contains certain covenants limiting, among other things, the ability of Parent and its restricted subsidiaries to:
| • | incur or guarantee additional indebtedness or issue certain equity interests; |
| • | pay dividends or distributions, repurchase equity or make payments in respect of subordinated indebtedness; |
144
Table of Contents
| • | make certain investments; |
| • | sell assets; |
| • | incur liens; |
| • | create certain restrictions on the ability of restricted subsidiaries to pay dividends or to transfer assets; |
| • | enter into transactions with affiliates; |
| • | create unrestricted subsidiaries; and |
| • | consolidate, merge or sell all or substantially all of assets. |
These covenants are subject to a number of exceptions and qualifications as set forth in the indenture governing the New Notes. The indenture governing the New Notes also contains events of default which, if any of them occurs, would permit or require the principal of and accrued interest on such notes to be declared due and payable.
In connection with the issuance of the New Notes, California Lyon and the guarantors entered into a registration rights agreement, which requires California Lyon and the guarantors to use commercially reasonable efforts to file a registration statement with respect to an offer to exchange the New Notes for a new issue of substantially identical notes registered under the Securities Act, consummate the exchange offer within 240 days after closing of the offering of the New Notes, and file a shelf registration statement to cover resales of the New Notes if California Lyon and the guarantors cannot effect an exchange offer within such time periods and under certain other circumstances.
A portion of the net proceeds from the issuance of the New Notes was used to prepay all amounts outstanding under the California Lyon’s previously existing $235 million 10.25% Senior Secured Term Loan due 2015, and to pay in full the amounts outstanding under two construction notes payable that were outstanding as of December 31, 2011. In addition, California Lyon used a portion of the net proceeds from the issuance of the New Notes to purchase and redeem the remaining principal amount outstanding of the Old Notes, as defined and described below.
12% Senior Subordinated Secured Notes Due 2017
Pursuant to the terms of the Prepackaged Joint Plan of Reorganization, or the Plan, on February 25, 2012, California Lyon issued $75.0 million principal amount of 12% Senior Subordinated Secured Notes, or the Old Notes, due February 25, 2017, in exchange for the claims held by the holders of the formerly outstanding notes of California Lyon. California Lyon received no net proceeds from this issuance.
As described above, California Lyon used a portion of the proceeds from the sale of the New Notes to refinance the Old Notes. On November 8, 2012, California Lyon announced the early settlement of its cash tender offer and consent solicitation for any and all outstanding Old Notes, or the Tender Offer. The Old Notes that remained outstanding following the expiration of the Tender Offer on November 23, 2012 were redeemed on December 10, 2012.
Construction Notes Payable
The Company used a portion of the proceeds from the issuance of the New Notes to pay in full the amounts outstanding under two construction notes payable that were outstanding as of December 31, 2011. In September 2012, the Company entered into two additional construction notes payable agreements. The first agreement has total availability under the facility of $19.0 million, to be drawn for land development and construction on one of its wholly-owned projects. The loan matures in September 2015 and bears interest at the prime rate + 1.0%, with a rate floor of 5.0%. As of December 31, 2012 the Company had borrowed $7.8 million under this facility and as of March 11, 2013, the Company had borrowed $12.9 million under this facility. The
145
Table of Contents
loan will be repaid with proceeds from home closings of the project and is secured by the underlying project. The second construction notes payable agreement has total availability under the facility of $17.0 million, to be drawn for land development and construction on one of its joint venture projects. The loan matures in March 2015 and bears interest at prime rate + 1%, with a rate floor of 5.0%. As of December 31, 2012, the Company had borrowed $5.4 million under this facility and as of March 11, 2013, the Company had borrowed $6.3 million under this facility. The loan will be repaid with proceeds from home closings of the project and is secured by the underlying project.
146
Table of Contents
The selling stockholders and their successors, which term includes their transferees, pledgees or donees or their successors may sell the capital stock directly to purchasers or through underwriters, broker-dealers or agents, who may receive compensation in the form of discounts, concessions or commissions from the selling stockholders or the purchasers. These discounts, concessions or commissions as to any particular underwriter, broker-dealer or agent may be in excess of those customary in the types of transactions involved.
The capital stock may be sold in one or more transactions at:
| • | fixed prices; |
| • | prevailing market prices at the time of sale; |
| • | prices related to the prevailing market prices; |
| • | varying prices determined at the time of sale; or |
| • | negotiated prices. |
These sales may be effected in transactions:
| • | on any national securities exchange or quotation service on which our capital stock or notes may be listed or quoted at the time of sale; |
| • | in the over-the-counter market; |
| • | otherwise than on such exchanges or services or in the over-the-counter market; |
| • | through the writing of options, whether the options are listed on an options exchange or otherwise; |
| • | ordinary brokerage transactions and transactions in which the broker-dealer solicits purchasers; |
| • | block trades in which the broker-dealer will attempt to sell the shares as agent but may position and resell a portion of the block as principal to facilitate the transaction; |
| • | purchases by a broker-dealer as principal and resale by the broker-dealer for its account; |
| • | an exchange distribution in accordance with the rules of the applicable exchange |
| • | privately negotiated transactions; |
| • | sales pursuant to Rule 144 of the Securities Act of 1933, as amended, or the Securities Act; |
| • | with broker-dealers who may agree with the selling stockholder to sell a specified number of shares at a stipulated price per share; |
| • | in an underwritten offering; |
| • | a combination of any such methods of sale; or |
| • | any other method permitted pursuant to applicable law. |
In connection with the sale of the capital stock described in this prospectus, the selling stockholders may enter into hedging transactions with broker-dealers or other financial institutions. These broker-dealers or financial institutions may in turn engage in short sales of common stock in the course of hedging the positions they assume with selling stockholders. The selling stockholders may also sell the capital stock short and deliver these securities to close out such short positions, or loan or pledge the capital stock or the notes to broker-dealers who in turn may sell these securities.
147
Table of Contents
The aggregate proceeds to the selling stockholders from the sale of the capital stock offered by them hereby will be the purchase price of the capital stock less discounts and commissions, if any. Each of the selling stockholders reserves the right to accept and, together with their agents from time to time, to reject, in whole or in part, any proposed purchase of capital stock to be made directly or through agents. We will not receive any of the proceeds from this offering.
While there is currently no public trading market for the capital stock, we intend to apply for the listing of our securities on the Over-the-Counter Bulletin Board in the future. However, we cannot offer any assurance about the development of an active trading market or as to whether the market price of our securities will equal or exceed the price paid for them.
In order to comply with the securities laws of some states, if applicable, the capital stock may be sold in these jurisdictions only through registered or licensed brokers or dealers. In addition, in some states the common stock may not be sold unless it has been registered or qualified for sale or an exemption from registration or qualification requirements is available and is complied with.
The selling stockholders may be, and any broker-dealers or agents that participate in the sale of the capital stock will be, deemed to be “underwriters” within the meaning of Section 2(11) of the Securities Act. Profits on the sale of the capital stock by selling stockholders and any discounts, commissions or concessions received by any broker-dealers or agents might be deemed to be underwriting discounts and commissions under the Securities Act. Selling stockholders who are deemed to be “underwriters” within the meaning of Section 2(11) of the Securities Act will be subject to the prospectus delivery requirements of the Securities Act. To the extent the selling stockholders may be deemed to be “underwriters,” they may be subject to statutory liabilities, including, but not limited to, Sections 11, 12 and 17 of the Securities Act.
The selling stockholders and any other person participating in a distribution will be subject to applicable provisions of the Securities Exchange Act of 1934, as amended, or the Exchange Act, and the rules and regulations thereunder. Regulation M of the Exchange Act may limit the timing of purchases and sales of any of the securities by the selling stockholders and any other person. In addition, Regulation M may restrict the ability of any person engaged in the distribution of the securities to engage in market-making activities with respect to the particular securities being distributed for a period of up to five business days before the distribution.
To our knowledge, there are currently no plans, arrangements or understandings between any selling stockholder and any underwriter, broker-dealer or agent regarding the sale of the capital stock by the selling stockholders.
A selling stockholder may decide not to sell the capital stock described in this prospectus. We cannot assure holders that any selling stockholder will use this prospectus to sell any or all of the capital stock. Any securities covered by this prospectus which qualify for sale pursuant to Rule 144 or Rule 144A of the Securities Act may be sold under Rule 144 or Rule 144A rather than pursuant to this prospectus. In addition, a selling stockholder may transfer, devise or gift the capital stock by other means not described in this prospectus.
With respect to a particular offering of the capital stock, to the extent required, an accompanying prospectus supplement or, if appropriate, a post-effective amendment to the registration statement of which this prospectus is a part will be prepared and will set forth the following information:
| • | the specific capital stock to be offered and sold; |
| • | the names of the selling stockholders; |
| • | the respective purchase prices and public offering prices and other material terms of the offering; |
| • | the names of any participating agents, broker-dealers or underwriters; and |
| • | any applicable commissions, discounts, concessions and other items constituting, compensation from the selling stockholders. |
148
Table of Contents
We entered into registration rights agreements for the benefit of holders of the capital stock to register their capital stock under applicable federal and state securities laws under certain circumstances and at certain times. The registration rights agreements provide that the selling stockholders and the Company will indemnify each other and our respective directors, officers and controlling persons against specific liabilities in connection with the offer and sale of the capital stock, including liabilities under the Securities Act, or will be entitled to contribution in connection with those liabilities. We will pay all of our expenses and specified expenses incurred by the selling stockholders incidental to the registration, offering and sale of the capital stock to the public, but each selling stockholder will be responsible for payment, if any, of commissions, concessions, fees and discounts of underwriters, broker-dealers and agents.
149
Table of Contents
MATERIAL UNITED STATES FEDERAL INCOME TAX CONSIDERATIONS
The following is a summary of the material United States federal income tax consequences to you of the acquisition, ownership and disposition of the Class A Common Stock, Class C Common Stock, and Convertible Preferred Stock offered pursuant to this prospectus and our Class A and Class C Common Stock into which certain of our capital stock may be converted. This discussion is not a complete analysis of all of the potential United States federal income tax consequences relating thereto, nor does it address any estate and gift tax consequences or any tax consequences arising under any state, local or foreign tax laws, or any other United States federal tax laws. This discussion is based on the Internal Revenue Code of 1986, as amended, or the Internal Revenue Code, Treasury Regulations promulgated thereunder, judicial decisions, and published rulings and administrative pronouncements of the Internal Revenue Service, or IRS, all as in effect as of the date of this prospectus. These authorities may change, possibly retroactively, resulting in United States federal income tax consequences different from those discussed below. No ruling has been or will be sought from the IRS with respect to the matters discussed below, and there can be no assurance that the IRS will not take a contrary position regarding the tax consequences of the acquisition, ownership or disposition of Convertible Preferred Stock or common stock, or that any such contrary position would not be sustained by a court.
This discussion is limited to holders who purchase shares of our Convertible Preferred Stock and common stock offered pursuant to this prospectus and who hold our Convertible Preferred Stock and common stock as a “capital asset” within the meaning of Section 1221 of the Internal Revenue Code (generally, property held for investment). This discussion also does not consider any specific facts or circumstances that may be relevant to holders subject to special rules under the United States federal income tax laws, including, without limitation:
| • | financial institutions, banks and thrifts; |
| • | insurance companies; |
| • | tax-exempt organizations; |
| • | “S” corporations, partnerships or other pass-through entities; |
| • | traders in securities that elect to mark to market; |
| • | holders subject to the alternative minimum tax; |
| • | regulated investment companies and real estate investment trusts; |
| • | broker-dealers or dealers in securities or currencies; |
| • | United States expatriates; |
| • | persons subject to the alternative minimum tax; |
| • | persons holding our stock as a hedge against currency risks or as a position in a straddle; or |
| • | U.S. holders (as defined below) whose functional currency is not the United States dollar. |
If a partnership (or other entity taxed as a partnership for United States federal income tax purposes) holds shares of our Convertible Preferred Stock or common stock, the tax treatment of a partner in the partnership will depend on the status of the partner, upon the activities of the partnership, and upon certain determinations made at the partner level. Accordingly, partnerships holding shares of our Convertible Preferred Stock or common stock and the partners in such partnerships should consult their tax advisors regarding the specific U.S. federal income tax consequences to them.
PROSPECTIVE INVESTORS SHOULD CONSULT THEIR TAX ADVISORS REGARDING THE PARTICULAR UNITED STATES FEDERAL INCOME TAX CONSEQUENCES TO THEM OF ACQUIRING, OWNING AND DISPOSING OF OUR CONVERTIBLE PREFERRED STOCK OR COMMON STOCK, AS WELL AS ANY TAX CONSEQUENCES ARISING UNDER ANY STATE, LOCAL OR FOREIGN TAX LAWS AND ANY OTHER UNITED STATES FEDERAL TAX LAWS.
150
Table of Contents
For purposes of this discussion, a “U.S. holder” is any beneficial owner of our Convertible Preferred Stock or common stock who, for United States federal income tax purposes, is:
| • | an individual who is a citizen or resident of the United States; |
| • | a corporation (or other entity treated as a corporation for United States federal income tax purposes) created or organized in or under the laws of the United States or of any state or in the District of Columbia; |
| • | an estate the income of which is subject to United States federal income taxation regardless of its source; or |
| • | a trust, if a United States court can exercise primary supervision over the administration of the trust and one or more United States persons have the authority to control all substantial decisions of the trust, or if the trust has a valid election in place to be treated as a United States person. |
A “non-U.S. holder” is any beneficial owner of our Convertible Preferred Stock or common stock that is not a “U.S. holder.”
Taxation of U.S. Holders
Distributions on Our Convertible Preferred Stock and Common Stock. If we make cash or other property distributions on our Convertible Preferred Stock or common stock, such distributions generally will constitute dividends for United States federal income tax purposes to the extent paid from our current or accumulated earnings and profits, as determined under United States federal income tax principles. These distributions may be eligible for the dividends-received deduction in the case of U.S. holders that are corporations. Dividends paid to non-corporate U.S. holders in taxable years beginning before January 1, 2013 generally will qualify for taxation at special rates if such holders meet certain holding period and other applicable requirements. Amounts not treated as dividends for United States federal income tax purposes will constitute a return of capital and will first be applied against and reduce a holder’s tax basis in the Convertible Preferred Stock or common stock, but not below zero. Distributions in excess of our current and accumulated earnings and profits and in excess of a U.S. holder’s tax basis in its shares will be taxable as capital gain realized on the sale or other disposition of the Convertible Preferred Stock or common stock and will be treated as described under “—Sale or Other Taxable Dispositions of Our Convertible Preferred Stock, or Common Stock” below. Although it is not entirely clear under applicable law, we intend to take the position that accrued and unpaid amounts, including the PIK dividends on the Convertible Preferred Stock that are not currently paid in cash, including any such accrued amounts that are received on liquidation or conversion of the shares, should not be treated as distributions for purposes of the rules described above. U.S. holders should consult their tax advisors regarding the specific tax treatment of such accrued amounts, including PIK dividends.
In addition, a corporate U.S. holder may be required to reduce its basis in stock with respect to certain “extraordinary dividends,” as provided under Section 1059 of the Internal Revenue Code. U.S. holders should consult their tax advisors in determining the application of these rules in light of their particular circumstances.
Adjustments to Conversion Rate. The conversion rate of our Convertible Preferred Stock is subject to adjustment under specified circumstances. In certain circumstances, if we make adjustments to the conversion rate and pay distributions of cash or other property on other stock or securities which may be outstanding from time to time, U.S. holders of Convertible Preferred Stock may be deemed to have received a distribution which may be taxable as a dividend to the extent of our current and accumulated earnings and profits, even though such holder has not received any cash or property as a result of such adjustments. In addition, the failure to provide for such an adjustment in certain circumstances may also result in a deemed dividend distribution to U.S. holders who hold our Convertible Preferred Stock. Adjustments to the conversion rate made pursuant to abona fide reasonable adjustment formula which has the effect of preventing the dilution of the interest of the holders of the Convertible Preferred Stock generally will not be deemed to result in a constructive distribution. The tax
151
Table of Contents
consequences of the receipt of a distribution from us are described above under “—Distributions on Our Convertible Preferred Stock and Common Stock.” Because constructive distributions deemed received by a U.S. holder would not be paid in cash from which any applicable withholding could be satisfied, if we pay backup withholding on behalf of a U.S. holder (because such U.S. holder failed to establish an exemption from backup withholding), we may, at our option, set off any such payment against actual payments of cash or shares of common stock payable to such U.S. holder.
Sale or Other Taxable Dispositions of Our Convertible Preferred Stock or Common Stock. If a U.S. holder sells or disposes of shares of Convertible Preferred Stock (other than pursuant to a conversion described below) or common stock, it generally will recognize gain or loss for United States federal income tax purposes in an amount equal to the difference between the amount of cash and the fair market value of any property received on the sale or other disposition and the holder’s adjusted basis in the shares for United States federal income tax purposes. This gain or loss generally will be long-term capital gain or loss if the holder has held the Convertible Preferred Stock or common stock, as applicable, for more than one year. The deductibility of capital losses is subject to limitations.
Conversion of Convertible Preferred Stock and Class C Common Stock into Class A and Class C Common Stock. A U.S. holder generally will not recognize gain or loss upon the conversion of our Convertible Preferred Stock into our Class A or Class C Common Stock or upon the conversion of our Class C Common Stock into Class A Common Stock, as applicable, except that any cash received in lieu of fractional shares will be treated as described below. A U.S. holder’s basis and holding period in the common stock received upon conversion generally will be the same as those of the converted Convertible Preferred Stock or Class C Common Stock (but the basis will be reduced by the portion of adjusted tax basis allocated to any fractional share of common stock exchanged for cash).
Cash received upon conversion of our Convertible Preferred Stock in lieu of a fractional common share generally will be treated as a payment in a taxable exchange for such fractional common share, and gain or loss will be recognized on the receipt of cash in an amount equal to the difference between the amount of cash received and the adjusted tax basis allocable to the fractional common share deemed exchanged. This gain or loss will be long-term capital gain or loss if the U.S. holder has held the Convertible Preferred Stock for more than one year at the time of conversion.
In the event a U.S. holder’s Convertible Preferred Stock is converted pursuant to certain transactions (including our consolidation or merger into another person), the tax treatment of such a conversion will depend upon the facts underlying the particular transaction triggering such a conversion. U.S. Holders should consult their tax advisors to determine the specific tax treatment of a conversion under such circumstances.
Backup Withholding and Information Reporting. We report to U.S. holders of our Convertible Preferred Stock and common stock and the IRS the amount of dividends paid on the Convertible Preferred Stock and common stock, and the proceeds received upon the sale, redemption or other taxable disposition of such Convertible Preferred Stock or common stock during each calendar year, and the amount of any tax withheld. Under the backup withholding rules, a holder may be subject to backup withholding with respect to dividends paid on our Convertible Preferred Stock and common stock, and proceeds received from a disposition of such Convertible Preferred Stock and common stock. Backup withholding applies only if the U.S. holder is not otherwise exempt and:
| • | such holder fails to furnish its taxpayer identification number (“TIN”), which for an individual is ordinarily his or her social security number, in the manner required by the Internal Revenue Code and applicable Treasury Regulations; |
| • | we or our agent (or other payor) are notified by the IRS that the TIN such holder furnished is incorrect; |
| • | such holder has been notified by the IRS that it is subject to backup withholding because it did not report all of its reportable interest or dividends on its tax returns; |
152
Table of Contents
| • | such holder has failed to certify under penalty of perjury that it has furnished a correct TIN and that it is not subject to backup withholding under the Internal Revenue Code; or |
| • | such holder otherwise fails to comply with applicable certification requirements. |
Backup withholding is not an additional tax. Any amount paid as backup withholding will be creditable against the U.S. holder’s United States federal income tax liability, provided the required information is furnished to the IRS. Certain persons are exempt from backup withholding. U.S. holders are encouraged to consult their tax advisors as to their qualification for exemption from backup withholding and the procedure to obtain such exemption.
Taxation of Non-U.S. Holders
Distributions on Our Convertible Preferred Stock and Common Stock. Distributions that are treated as dividends (see “—Taxation of U.S. Holders—Distributions on Our Convertible Preferred Stock and Common Stock”) generally will be subject to United States federal withholding tax at a rate of 30% of the gross amount of the dividends, or such lower rate specified by an applicable income tax treaty. For withholding purposes, we expect to treat all distributions as made out of our current or accumulated earnings and profits. However, amounts withheld should generally be refundable if it is subsequently determined that the distribution was, in fact, in excess of our current and accumulated earnings and profits. To receive the benefit of a reduced treaty rate, a non-U.S. holder must furnish to us or our paying agent a valid IRS Form W-8BEN (or applicable successor form) certifying such holder’s qualification for the reduced rate. This certification must be provided to us or our paying agent prior to the payment of dividends and must be updated periodically. Non-U.S. holders that do not timely provide us or our paying agent with the required certification, but that qualify for a reduced treaty rate, may obtain a refund of any excess amounts withheld by timely filing an appropriate claim for refund with the IRS.
If a non-U.S. holder holds our Convertible Preferred Stock or common stock in connection with the conduct of a trade or business in the United States, and dividends paid on the Convertible Preferred Stock or common stock are effectively connected with such holder’s United States trade or business (and if required by an applicable income tax treaty, attributable to a permanent establishment maintained by the non-U.S. holder in the United States), the non-U.S. holder will be exempt from United States federal withholding tax. To claim the exemption, the non-U.S. holder must generally furnish to us or our paying agent a properly executed IRS Form W-8ECI (or applicable successor form). Any dividends paid on our Convertible Preferred Stock or common stock that are effectively connected with a non-U.S. holder’s United States trade or business (and if required by an applicable income tax treaty, attributable to a permanent establishment maintained by the non-U.S. holder in the United States) generally will be subject to United States federal income tax on a net income basis at the regular graduated United States federal income tax rates in much the same manner as if such holder were a resident of the United States. A non-U.S. holder that is a foreign corporation also may be subject to an additional branch profits tax equal to 30% (or such lower rate specified by an applicable income tax treaty) of its effectively connected earnings and profits for the taxable year, as adjusted for certain items. Non-U.S. holders should consult their tax advisors regarding any applicable income tax treaties that may provide for different rules.
In general, the rules applicable to distributions to non-U.S. holders discussed above are also applicable to deemed distributions to non-U.S. holders that may result from adjustments to the conversion rate of the Convertible Preferred Stock. See “—Taxation of U.S. Holders—Adjustments to Conversion Rate.” We will satisfy any withholding obligation with respect to such deemed dividends by applying such withholding against actual payments of cash, shares of common stock, or sales proceeds otherwise paid to a non-U.S. holder.
Sale or Other Taxable Dispositions of Our Convertible Preferred Stock and Common Stock. Subject to the discussion of backup withholding below, a non-U.S. holder generally will not be subject to United States federal income tax on any gain realized upon the sale or other disposition of the Convertible Preferred Stock or common stock, unless:
| • | the gain is effectively connected with the non-U.S. holder’s conduct of a trade or business in the United States, and if required by an applicable income tax treaty, attributable to a permanent establishment maintained by the non-U.S. holder in the United States; |
153
Table of Contents
| • | the non-U.S. holder is a nonresident alien individual present in the United States for 183 days or more during the taxable year of the disposition, and certain other requirements are met; or |
| • | such stock constitutes a “United States real property interest,” or USRPI, within the meaning of the Foreign Investment in Real Property Tax Act, or FIRPTA, by reason of our status as a “United States real property holding corporation,” or USRPHC, for United States federal income tax purposes. |
Gain described in the first bullet point above will be subject to United States federal income tax on a net income basis at the regular graduated United States federal income tax rates in much the same manner as if such holder were a resident of the United States. A non-U.S. holder that is a foreign corporation also may be subject to an additional branch profits tax equal to 30% (or such lower rate specified by an applicable income tax treaty) of its effectively connected earnings and profits for the taxable year, as adjusted for certain items. Non-U.S. holders should consult any applicable income tax treaties that may provide for different rules.
Gain described in the second bullet point above will be subject to United States federal income tax at a flat 30% rate (or such lower rate specified by an applicable income tax treaty), but may be offset by United States source capital losses (even though the individual is not considered a resident of the United States).
With respect to the third bullet point above, we believe we are and will remain a USRPHC for United States federal income tax purposes. Because the determination of whether we are a USRPHC depends on the fair market value of our United States real property interests relative to the fair market value of our other trade or business assets and our foreign real property interests, it is possible we may not remain a USRPHC in the future. As a USRPHC, if a class of our stock is regularly traded on an established securities market, such stock will be treated as a USRPI only with respect to a non-U.S. holder that actually or constructively holds more than five percent of such class of stock at any time during the shorter of the five-year period preceding the date of disposition or the holder’s holding period for such stock. If a class of securities is not regularly traded on an established securities market but is convertible into a class of stock (“convertible securities”), such convertible securities will be not treated as a USRPI if the class of stock into which it is convertible is “regularly traded” on an established securities market (“regularly traded class of stock”) and the applicable non-U.S. holder has not, at the time it acquired the convertible securities, and at certain other times described in the applicable Treasury Regulations, directly or indirectly held such convertible securities (and in certain cases other direct or indirect interests in our stock) that have a fair market value in excess of five percent of the fair market value of all of the outstanding shares of such regularly traded class of stock. As of the date of this prospectus, we are not able to determine whether our Convertible Preferred Stock or any class of our common stock is or will be regularly traded on an established securities market, and no assurance can be given that any class of our stock will become or remain regularly traded in the future.
If gain on the sale or other taxable disposition of our stock were subject to taxation under FIRPTA as a sale of USRPI, the non-U.S. holder would be subject to regular United States federal income tax with respect to such gain in the same manner as a taxable U.S. holder (subject to any applicable alternative minimum tax and a special alternative minimum tax in the case of nonresident alien individuals). In addition, if the sale or other taxable disposition of our stock is subject to tax under FIRPTA, the purchaser of the stock would be required to withhold and remit to the IRS 10% of the purchase price unless an exception applies.
Conversion of Convertible Preferred Stock and Class C Common Stock into Class A and Class C Common Stock. Except as provided below, a non-U.S. holder generally will not recognize gain or loss upon the conversion of our Convertible Preferred Stock into our Class A or Class C Common Stock or upon the conversion of our Class C Common Stock into Class A Common Stock, as applicable, provided that such Convertible Preferred Stock or Class C Common Stock does not constitute a USRPI. Even if such Convertible Preferred Stock or Class C Common Stock does constitute a USRPI, provided our Class A or Class C Common Stock into which it is convertible also constitutes a USRPI, a non-U.S. holder generally will not recognize gain or loss upon such a conversion. A non-U.S. holder’s basis and holding period in the common stock received upon
154
Table of Contents
conversion of Convertible Preferred Stock or Class C Common Stock will generally be the same as the non-U.S. holder’s basis and holding period in the Convertible Preferred Stock or Class C Common Stock so converted (although a non-U.S. holder’s basis in Class A or Class C common stock received upon conversion of Convertible Preferred Stock will be reduced by the portion of adjusted tax basis allocated to any fractional share of common stock treated as exchanged for cash). Cash received upon conversion in lieu of a fractional Class A or Class C Common Stock share generally will be treated as a payment in a taxable exchange for such fractional common share. See “—Sale or Other Taxable Dispositions of Our Convertible Preferred Stock and Common Stock.” Non-U.S. holders should consult their tax advisors regarding the application of these rules in light of their particular circumstances.
Backup Withholding Tax and Information Reporting. We must report annually to each non-U.S. holder of our Convertible Preferred Stock and common stock and to the IRS the amount of payments on the Convertible Preferred Stock or common stock paid to such holder and the amount of any tax withheld with respect to those payments. These information reporting requirements apply even if no withholding was required because the payments were effectively connected with the non-U.S. holder’s conduct of a United States trade or business, or withholding was reduced or eliminated by an applicable income tax treaty. This information also may be made available under a specific treaty or agreement with the tax authorities in the country in which the non-U.S. holder resides or is established. Backup withholding, however, generally will not apply to distribution payments to a non-U.S. holder of the Convertible Preferred Stock or common stock provided the non-U.S. holder furnishes to us or our paying agent the required certification as to its non-U.S. status, such as by providing a valid IRS Form W-8BEN or IRS Form W-8ECI, or certain other requirements are met. Notwithstanding the foregoing, backup withholding may apply if either we or our paying agent has actual knowledge, or reason to know, that the holder is a U.S. person that is not an exempt recipient.
Backup withholding is not an additional tax. Any amounts withheld under the backup withholding rules may be allowed as a refund or a credit against a non-U.S. holder’s United States federal income tax liability, provided the required information is timely furnished to the IRS.
Additional Withholding Tax Relating to Foreign Accounts. Withholding taxes may apply to certain types of payments made to “foreign financial institutions” (as specially defined in the Internal Revenue Code) and certain other non-United States entities. Specifically, a 30% withholding tax may be imposed on dividends on, and gross proceeds from the sale or other disposition of, our Convertible Preferred Stock or common stock paid to a foreign financial institution or to a non-financial foreign entity, unless (1) the foreign financial institution undertakes certain diligence and reporting, (2) the non-financial foreign entity either certifies it does not have any substantial United States owners or furnishes identifying information regarding each substantial United States owner, or (3) the foreign financial institution or non-financial foreign entity otherwise qualifies for an exemption from these rules. If the payee is a foreign financial institution and is subject to the diligence and reporting requirements in clause (1) above, it must enter into an agreement with the U.S. Treasury requiring, among other things, that it undertake to identify accounts held by certain U.S. persons or U.S.-owned foreign entities, annually report certain information about such accounts, and withhold 30% on payments to non-compliant foreign financial institutions and certain other account holders.
Although these rules currently apply to applicable payments made after December 31, 2012, Proposed Treasury Regulations and subsequent IRS guidance provide that the withholding provisions described above will generally apply to payments of dividends made on or after January 1, 2014 and to payments of gross proceeds from a sale or other disposition of stock on or after January 1, 2017.
The Proposed Treasury Regulations described above will not be effective until they are issued in their final form, and as of the date of this prospectus, it is not possible to determine whether the proposed regulations will be finalized in their current form or at all. Prospective investors should consult their tax advisors regarding these withholding provisions.
155
Table of Contents
The validity of the capital stock offered by this prospectus has been passed upon for us by Latham & Watkins LLP, Costa Mesa, California.
The consolidated financial statements of William Lyon Homes as of December 31, 2012 and for the period from January 1, 2012 through February 24, 2012, and the period from February 25, 2012 through December 31, 2012, have been included herein and in the registration statement in reliance upon the report of KPMG LLP, an independent registered public accounting firm, appearing elsewhere herein, and upon the authority of said firm as experts in accounting and auditing.
The report covering the December 31, 2012 consolidated financial statements contains an explanatory paragraph that states that the Company entered into a plan of reorganization and emerged from bankruptcy on February 24, 2012, as discussed in notes 2 and 3 to the consolidated financial statements. As a result of the reorganization, the Company applied fresh start accounting and the consolidated financial information for periods after the reorganization date is presented on a different cost basis than that for the periods before the reorganization and, therefore, is not comparable.
The Company’s audited consolidated financial statements as of December 31, 2011 and for the two years then ended, included in this prospectus and elsewhere in the registration statement have been so included in reliance upon the report of Windes & McClaughry Accountancy Corporation, an independent registered public accounting firm, upon the authority of said firm as experts in accounting and auditing in giving said report.
CHANGE IN INDEPENDENT REGISTERED PUBLIC ACCOUNTING FIRM
Windes & McClaughry Accountancy Corporation, an independent registered public accounting firm, or Windes, audited our financial statements for the year ended December 31, 2009 through the year ended December 31, 2011. Windes’ reports for each of the years ended December 31, 2010 and December 31, 2011 did not contain an adverse opinion or disclaimer of opinion and were not qualified or modified as to uncertainty, audit scope or accounting principles.
During the Company’s fiscal years ended December 31, 2010 and December 31, 2011, and through the current date there were no disagreements between Windes and us on any matter of accounting principles or practices, financial statements disclosure or auditing scope or procedure, which disagreements, if not resolved to the satisfaction of Windes, would have caused Windes to make reference to such disagreements in the firm’s reports on our financial statements for such periods. In addition, no reportable events, as defined in Item 304(a)(1)(v) of Regulation S-K, occurred during our two most recent fiscal years or the interim period preceding Windes’ dismissal.
On April 24, 2012, the board of directors of the Company based on the recommendation of the Audit Committee, formally engaged KPMG LLP, or KPMG, as the Company’s independent registered public accounting firm. Upon its completion of its audit of the Company’s financial statements for the fiscal year ended December 31, 2011, Windes was dismissed as the Company’s independent registered public accounting firm.
During the Company’s fiscal years ended December 31, 2010 and December 31, 2011, and the subsequent interim period through April 24, 2012, neither the Company nor anyone operating on its behalf has consulted with KPMG regarding (i) either the application of accounting principles to a specific transaction, either completed or proposed; or the type of audit opinion that might be rendered on the Company’s financial
156
Table of Contents
statements, or (ii) any matter that was either the subject of a disagreement of the type described in Item 304(a)(1)(iv) of Regulation S-K, or a “reportable event” involving the Company, within the meaning of Item 304(a)(1)(v) of Regulation S-K. Furthermore, KPMG has not provided the Company a written report or oral advice that KPMG concluded was an important factor considered by the Company in reaching a decision as to any accounting, auditing or financial reporting issue.
We have provided Windes with a copy of the foregoing disclosure and have requested that Windes furnish us with a letter addressed to the SEC stating whether or not Windes agrees with the above statements and, if not, stating the respects in which it does not agree. A copy of the letter from Windes, in which Windes agrees with the above statements, is filed at exhibit 16.1 to the registration statement of which this prospectus is a part.
This prospectus is not an offer or solicitation in respect to these securities in any jurisdiction in which such offer or solicitation would be unlawful. This prospectus is part of a registration statement on Form S-1 that we filed with the Securities and Exchange Commission under the Securities Act with respect to the capital stock described herein. This prospectus, which constitutes a part of the registration statement, does not contain all of the information set forth in the registration statement, some items of which are contained in exhibits to the registration statement as permitted by the rules and regulations of the SEC. For further information with respect to us and the capital stock, we refer you to the registration statement, including the exhibits and the consolidated financial statements and notes filed as a part of the registration statement. Statements contained in this prospectus concerning the contents of any contract or any other document are not necessarily complete. If a contract or document has been filed as an exhibit to the registration statement, please see the copy of the contract or document that has been filed. Each statement in this prospectus relating to a contract or document filed as an exhibit is qualified in all respects by the filed exhibit. The exhibits to the registration statement should be reviewed for the complete contents of these contracts and documents. That registration statement can be read at the SEC web site or at the SEC’s offices mentioned under the heading “Where You Can Find More Information.” We have not authorized anyone else to provide you with different information or additional information. You should not assume that the information in this prospectus, or any supplement or amendment to this prospectus, is accurate at any date other than the date indicated on the cover page of such documents.
WHERE YOU CAN FIND MORE INFORMATION
A copy of the registration statement, including the exhibits and the financial statements and notes filed as a part of the registration statement, may be inspected without charge at the SEC’s Public Reference Room at 100 F Street, N.E., Washington, D.C. 20549, and copies of all or any part of the registration statement may be obtained from the SEC upon the payment of fees prescribed by it. You may call the SEC at 1-800-SEC-0330 for more information on the operation of the public reference facilities. The SEC maintains a website at http://www.sec.gov that contains reports, proxy and information statements and other information regarding companies that file electronically with it.
As a result of this offering, we will become subject to the information and reporting requirements of the Securities Exchange Act of 1934, as amended, and, in accordance therewith, will file periodic reports, proxy statements and other information with the SEC. These periodic reports, proxy statements and other information will be available for inspection and copying at the SEC’s public reference facilities and the website of the SEC referred to above. We maintain a website at www.lyonhomes.com. You may access our reports, proxy statements and other information free of charge at this website as soon as reasonably practicable after such material is electronically filed with, or furnished to, the SEC. The information on our website does not constitute part of, and is not incorporated by reference into, this prospectus.
157
Table of Contents
| Page | ||||
Financial Statements as of December 31, 2012 and 2011 and for the period from January 1, 2012 through February 24, 2012, the period from February 25, 2012 through December 31, 2012, and for the years ended December 31, 2011 and 2010 | ||||
| F-4 | ||||
| F-5 | ||||
| F-6 | ||||
| F-7 | ||||
| F-9 | ||||
F-1
Table of Contents
REPORT OF INDEPENDENT REGISTERED PUBLIC ACCOUNTING FIRM
The Board of Directors and Stockholders
William Lyon Homes:
We have audited the accompanying consolidated balance sheet of William Lyon Homes and subsidiaries (the Company) as of December 31, 2012 (Successor), and the related consolidated statements of operations, equity (deficit) and cash flows for the periods from January 1, 2012 through February 24, 2012 (Predecessor) and February 25, 2012 through December 31, 2012 (Successor). These consolidated financial statements are the responsibility of the Company’s management. Our responsibility is to express an opinion on these consolidated financial statements based on our audit.
We conducted our audit in accordance with the standards of the Public Company Accounting Oversight Board (United States). Those standards require that we plan and perform the audit to obtain reasonable assurance about whether the financial statements are free of material misstatement. An audit includes examining, on a test basis, evidence supporting the amounts and disclosures in the financial statements. An audit also includes assessing the accounting principles used and significant estimates made by management, as well as evaluating the overall financial statement presentation. We believe that our audit provides a reasonable basis for our opinion.
In our opinion, the consolidated financial statements referred to above present fairly, in all material respects, the financial position of William Lyon Homes and subsidiaries as of December 31, 2012 (Successor) and the results of their operations and their cash flows for the periods from January 1, 2012 through February 24, 2012 (Predecessor) and February 25, 2012 through December 31, 2012 (Successor) in conformity with U.S. generally accepted accounting principles.
As discussed in notes 2 and 3 to the consolidated financial statements, the Company entered into a plan of reorganization and emerged from bankruptcy on February 24, 2012. As a result of the reorganization, the Company applied fresh start accounting and the consolidated financial information for periods after the reorganization date is presented on a different cost basis than that for the periods before the reorganization and, therefore, is not comparable.
/s/ KPMG LLP
Irvine, California
March 15, 2013
F-2
Table of Contents
REPORT OF INDEPENDENT REGISTERED PUBLIC ACCOUNTING FIRM
To the Board of Directors and Stockholders
William Lyon Homes
We have audited the accompanying consolidated balance sheets of William Lyon Homes (the “Company”) as of December 31, 2011, and the related consolidated statements of operations, equity (deficit) and cash flows for each of the two years in the period ended December 31, 2011. These financial statements are the responsibility of the Company’s management. Our responsibility is to express an opinion on these financial statements based on our audits.
We conducted our audits in accordance with the standards of the Public Company Accounting Oversight Board (United States). Those standards require that we plan and perform the audit to obtain reasonable assurance about whether the financial statements are free of material misstatement. The Company is not required to have, nor were we engaged to perform, an audit of its internal control over financial reporting. Our audits included consideration of internal control over financial reporting as a basis for designing audit procedures that are appropriate in the circumstances, but not for the purpose of expressing an opinion on the effectiveness of the Company’s internal control over financial reporting. Accordingly, we express no such opinion. An audit also includes examining, on a test basis, evidence supporting the amounts and disclosures in the financial statements, assessing the accounting principles used and significant estimates made by management, as well as evaluating the overall financial statement presentation. We believe that our audits provide a reasonable basis for our opinion.
In our opinion, the consolidated financial statements referred to above present fairly, in all material respects, the financial position of William Lyon Homes as of December 31, 2011, and the results of their operations and their cash flows for each of the two years in the period ended December 31, 2011, in conformity with accounting principles generally accepted in the United States of America.
As more fully described in Note 2, the Company filed for protection under Chapter 11 of the Bankruptcy Code on December 19, 2011 and emerged from bankruptcy on February 24, 2012. Accordingly, the accompanying consolidated financial statements as of December 31, 2011 and for the year then ended, which includes the impact of the period from December 19, through December 31, 2011, have been prepared in accordance with Accounting Standards Codification Topic 852,Reorganizations.The Company applied debtor in possession reporting for the period described above resulting in a lack of comparability with the prior financial statements.
/s/ WINDES & MCCLAUGHRY
Irvine, California
January 21, 2013
F-3
Table of Contents
WILLIAM LYON HOMES
(in thousands except number of shares and par value per share)
| Successor | Predecessor | |||||||
| December 31, | ||||||||
| 2012 | 2011 | |||||||
| ASSETS | ||||||||
Cash and cash equivalents — Note 1 | $ | 71,075 | $ | 20,061 | ||||
Restricted cash — Note 1 | 853 | 852 | ||||||
Receivables | 14,789 | 13,732 | ||||||
Real estate inventories — Note 7 | ||||||||
Owned | 421,630 | 398,534 | ||||||
Not owned | 39,029 | 47,408 | ||||||
Deferred loan costs, net | 7,036 | 8,810 | ||||||
Goodwill — Note 8 | 14,209 | — | ||||||
Intangibles, net of accumulated amortization of $5,757 as of December 31, 2012 — Note 9 | 4,620 | — | ||||||
Other assets, net | 7,906 | 7,554 | ||||||
|
|
|
| |||||
Total assets | $ | 581,147 | $ | 496,951 | ||||
|
|
|
| |||||
| LIABILITIES AND EQUITY (DEFICIT) | ||||||||
Liabilities not subject to compromise | ||||||||
Accounts payable | $ | 18,735 | $ | 1,436 | ||||
Accrued expenses | 41,770 | 2,082 | ||||||
Liabilities from inventories not owned — Note 15 | 39,029 | 47,408 | ||||||
Notes payable — Note 10 | 13,248 | 74,009 | ||||||
Senior Secured Term Loan due January 31, 2015 — Note 10 | — | 206,000 | ||||||
8 1/2% Senior Notes due November 15, 2020 — Note 10 | 325,000 | — | ||||||
|
|
|
| |||||
| 437,782 | 330,935 | |||||||
|
|
|
| |||||
Liabilities subject to compromise | ||||||||
Accounts payable | — | 3,946 | ||||||
Accrued expenses | — | 48,457 | ||||||
7 5/8% Senior Notes due December 15, 2012 — Note 10 | — | 66,704 | ||||||
10 3/4% Senior Notes due April 1, 2013 — Note 10 | — | 138,912 | ||||||
7 1/2% Senior Notes due February 15, 2014 — Note 10 | — | 77,867 | ||||||
|
|
|
| |||||
| — | 335,886 | |||||||
|
|
|
| |||||
Commitments and contingencies — Note 19 | ||||||||
Redeemable convertible preferred stock — Note 16: | ||||||||
Redeemable convertible preferred stock, par value $0.01 per share; 80,000,000 shares authorized; 77,005,744 shares issued and outstanding at December 31, 2012 | 71,246 | — | ||||||
Equity (deficit): | ||||||||
William Lyon Homes stockholders’ equity (deficit) — Note 17 | ||||||||
Common stock (Predecessor), par value $0.01 per share; 3,000 shares authorized; 1,000 shares outstanding at December 31, 2011 | — | — | ||||||
Common stock, Class A, par value $0.01 per share; 340,000,000 shares authorized; 70,121,378 shares issued and outstanding at December 31, 2012 | 701 | — | ||||||
Common stock, Class B, par value $0.01 per share; 50,000,000 shares authorized; 31,464,548 shares issued and outstanding at December 31, 2012 | 315 | — | ||||||
Common stock, Class C, par value $0.01 per share; 120,000,000 shares authorized; 16,020,338 shares issued and outstanding at December 31, 2012 | 160 | — | ||||||
Common stock, Class D, par value $0.01 per share; 30,000,000 shares authorized; 2,499,293 shares outstanding at December 31, 2012 | 25 | — | ||||||
Additional paid-in capital | 73,113 | 48,867 | ||||||
Accumulated deficit | (11,602 | ) | (228,383 | ) | ||||
|
|
|
| |||||
Total William Lyon Homes stockholders’ equity (deficit) | 62,712 | (179,516 | ) | |||||
Noncontrolling interest — Note 5 | 9,407 | 9,646 | ||||||
|
|
|
| |||||
Total equity (deficit) | 72,119 | (169,870 | ) | |||||
|
|
|
| |||||
Total liabilities and equity (deficit) | $ | 581,147 | $ | 496,951 | ||||
|
|
|
| |||||
See accompanying notes to consolidated financial statements
F-4
Table of Contents
WILLIAM LYON HOMES
CONSOLIDATED STATEMENTS OF OPERATIONS
(in thousands except number of shares and per share data)
| Successor | Predecessor | |||||||||||||||
| Period from February 25 through December 31, 2012 | Period from January 1 through February 24, 2012 | Year Ended December 31, | ||||||||||||||
| 2011 | 2010 | |||||||||||||||
Operating revenue | ||||||||||||||||
Home sales | $ | 244,610 | $ | 16,687 | $ | 207,055 | $ | 266,865 | ||||||||
Lots, land and other sales | 104,325 | — | — | 17,204 | ||||||||||||
Construction services — Note 1 | 23,825 | 8,883 | 19,768 | 10,629 | ||||||||||||
|
|
|
|
|
|
|
| |||||||||
| 372,760 | 25,570 | 226,823 | 294,698 | |||||||||||||
|
|
|
|
|
|
|
| |||||||||
Operating costs | ||||||||||||||||
Cost of sales — homes | (203,203 | ) | (14,598 | ) | (184,489 | ) | (225,751 | ) | ||||||||
Cost of sales — lots, land and other | (94,786 | ) | — | (4,234 | ) | (20,426 | ) | |||||||||
Impairment loss on real estate assets — Note 7 | — | — | (128,314 | ) | (111,860 | ) | ||||||||||
Construction services — Note 1 | (21,416 | ) | (8,223 | ) | (18,164 | ) | (7,805 | ) | ||||||||
Sales and marketing | (13,928 | ) | (1,944 | ) | (16,848 | ) | (19,746 | ) | ||||||||
General and administrative | (26,095 | ) | (3,302 | ) | (22,411 | ) | (25,129 | ) | ||||||||
Amortization of intangible assets — Note 9 | (5,757 | ) | — | — | — | |||||||||||
Other | (2,909 | ) | (187 | ) | (3,983 | ) | (2,740 | ) | ||||||||
|
|
|
|
|
|
|
| |||||||||
| (368,094 | ) | (28,254 | ) | (378,443 | ) | (413,457 | ) | |||||||||
|
|
|
|
|
|
|
| |||||||||
Equity in income of unconsolidated joint ventures | — | — | 3,605 | 916 | ||||||||||||
|
|
|
|
|
|
|
| |||||||||
Operating income (loss) | 4,666 | (2,684 | ) | (148,015 | ) | (117,843 | ) | |||||||||
(Loss) gain on extinguishment of debt — Note 10 | (1,392 | ) | — | — | 5,572 | |||||||||||
Interest expense, net of amounts capitalized — Note 1 | (9,127 | ) | (2,507 | ) | (24,529 | ) | (23,653 | ) | ||||||||
Other income, net | 1,528 | 230 | 838 | 57 | ||||||||||||
|
|
|
|
|
|
|
| |||||||||
Loss before reorganization items and (provision) benefit from income taxes | (4,325 | ) | (4,961 | ) | (171,706 | ) | (135,867 | ) | ||||||||
Reorganization items, net — Note 4 | (2,525 | ) | 233,458 | (21,182 | ) | — | ||||||||||
|
|
|
|
|
|
|
| |||||||||
(Loss) income before (provision) benefit from income taxes | (6,850 | ) | 228,497 | (192,888 | ) | (135,867 | ) | |||||||||
(Provision) benefit from income taxes — Note 13 | (11 | ) | — | (10 | ) | 412 | ||||||||||
|
|
|
|
|
|
|
| |||||||||
Net (loss) income | (6,861 | ) | 228,497 | (192,898 | ) | (135,455 | ) | |||||||||
Less: Net income attributable to noncontrolling interest | (1,998 | ) | (114 | ) | (432 | ) | (1,331 | ) | ||||||||
|
|
|
|
|
|
|
| |||||||||
Net (loss) income attributable to William Lyon Homes | (8,859 | ) | 228,383 | (193,330 | ) | (136,786 | ) | |||||||||
Preferred stock dividends | (2,743 | ) | — | — | — | |||||||||||
|
|
|
|
|
|
|
| |||||||||
Net (loss) income available to common stockholders | $ | (11,602 | ) | $ | 228,383 | $ | (193,330 | ) | $ | (136,786 | ) | |||||
|
|
|
|
|
|
|
| |||||||||
(Loss) income per common share, basic and diluted | $ | (0.11 | ) | $ | 228,383 | $ | (193,330 | ) | $ | (136,786 | ) | |||||
Weighted average common shares outstanding, basic and diluted | 103,037,842 | 1,000 | 1,000 | 1,000 | ||||||||||||
See accompanying notes to consolidated financial statements
F-5
Table of Contents
WILLIAM LYON HOMES
CONSOLIDATED STATEMENTS OF EQUITY (DEFICIT)
(in thousands)
| William Lyon Homes Stockholders | Non- Controlling Interest | Total | ||||||||||||||||||||||
| Common Stock | Additional Paid-In Capital | Retained Earnings (Accumulated Deficit) | ||||||||||||||||||||||
| Shares | Amount | |||||||||||||||||||||||
Balance — December 31, 2009 (Predecessor) | 1 | $ | — | $ | 48,867 | $ | 101,733 | $ | 7,599 | $ | 158,199 | |||||||||||||
Cash contributions to members of consolidated entities | — | — | — | — | 6,546 | 6,546 | ||||||||||||||||||
Cash distributions to members of consolidated entities | — | — | — | — | (3,913 | ) | (3,913 | ) | ||||||||||||||||
Net (loss) income | — | — | — | (136,786 | ) | 1,331 | (135,455 | ) | ||||||||||||||||
|
|
|
|
|
|
|
|
|
|
|
| |||||||||||||
Balance — December 31, 2010 (Predecessor) | 1 | — | 48,867 | (35,053 | ) | 11,563 | 25,377 | |||||||||||||||||
Cash contributions to members of consolidated entities | — | — | — | — | 6,605 | 6,605 | ||||||||||||||||||
Cash distributions to members of consolidated entities | — | — | — | — | (8,954 | ) | (8,954 | ) | ||||||||||||||||
Net (loss) income | — | — | — | (193,330 | ) | 432 | (192,898 | ) | ||||||||||||||||
|
|
|
|
|
|
|
|
|
|
|
| |||||||||||||
Balance — December 31, 2011 (Predecessor) | 1 | — | 48,867 | (228,383 | ) | 9,646 | (169,870 | ) | ||||||||||||||||
Cash contributions to members of consolidated entities | — | — | — | — | 1,825 | 1,825 | ||||||||||||||||||
Cash distributions to members of consolidated entities | — | — | — | — | (1,897 | ) | (1,897 | ) | ||||||||||||||||
Net (loss) income | — | — | — | (7,201 | ) | 114 | (7,087 | ) | ||||||||||||||||
|
|
|
|
|
|
|
|
|
|
|
| |||||||||||||
Balance — February 24, 2012 (Predecessor) | 1 | — | 48,867 | (235,584 | ) | 9,688 | (177,029 | ) | ||||||||||||||||
Cancellation of predecessor common stock | (1 | ) | — | — | — | — | — | |||||||||||||||||
Plan of reorganization and fresh start valuation adjustments | — | — | — | 186,717 | (1,588 | ) | 185,129 | |||||||||||||||||
Elimination of predecessor accumulated deficit | — | — | (48,867 | ) | 48,867 | — | — | |||||||||||||||||
|
|
|
|
|
|
|
|
|
|
|
| |||||||||||||
Balance — February 24, 2012 (Predecessor) | — | — | — | — | 8,100 | 8,100 | ||||||||||||||||||
Issuance of new common stock in connection with emergence from Chapter 11 | 92,368 | 924 | 43,191 | — | — | 44,115 | ||||||||||||||||||
|
|
|
|
|
|
|
|
|
|
|
| |||||||||||||
|
|
|
|
|
|
|
|
|
|
|
| |||||||||||||
Balance — February 24, 2012 (Successor) | 92,368 | 924 | 43,191 | — | 8,100 | 52,215 | ||||||||||||||||||
Net (loss) income | — | — | — | (8,859 | ) | 1,998 | (6,861 | ) | ||||||||||||||||
Cash contributions to members of consolidated entities | — | — | — | — | 15,313 | 15,313 | ||||||||||||||||||
Cash distributions to members of consolidated entities | — | — | — | — | (16,004 | ) | (16,004 | ) | ||||||||||||||||
Issuance of common stock | 25,239 | 252 | 26,248 | — | — | 26,500 | ||||||||||||||||||
Issuance of restricted stock | 2,499 | 25 | (25 | ) | — | — | — | |||||||||||||||||
Stock based compensation | — | — | 3,699 | — | — | 3,699 | ||||||||||||||||||
Preferred stock dividends | — | — | — | (2,743 | ) | — | (2,743 | ) | ||||||||||||||||
|
|
|
|
|
|
|
|
|
|
|
| |||||||||||||
Balance — December 31, 2012 (Successor) | 120,106 | $ | 1,201 | $ | 73,113 | $ | (11,602 | ) | $ | 9,407 | $ | 72,119 | ||||||||||||
|
|
|
|
|
|
|
|
|
|
|
| |||||||||||||
See accompanying notes to consolidated financial statements
F-6
Table of Contents
WILLIAM LYON HOMES
CONSOLIDATED STATEMENTS OF CASH FLOWS
(in thousands)
| Successor | Predecessor | |||||||||||||||
| Period from February 25 through December 31, 2012 | Period from January 1 through February 24, 2012 | Year Ended December 31, | ||||||||||||||
| 2011 | 2010 | |||||||||||||||
Operating activities | ||||||||||||||||
Net (loss) income | $ | (6,861 | ) | $ | 228,497 | $ | (192,898 | ) | $ | (135,455 | ) | |||||
Adjustments to reconcile net (loss) income to net cash provided by (used in) operating activities: | ||||||||||||||||
Depreciation and amortization | 6,631 | 586 | 3,875 | 3,718 | ||||||||||||
Impairment loss on real estate assets | — | — | 128,314 | 111,860 | ||||||||||||
Stock based compensation expense | 3,699 | — | — | — | ||||||||||||
Equity in income of unconsolidated joint ventures | — | — | (3,605 | ) | (916 | ) | ||||||||||
Loss on sale of fixed asset | — | — | 83 | 122 | ||||||||||||
Reorganization items: | ||||||||||||||||
Cancellation of debt | — | (298,831 | ) | — | — | |||||||||||
Plan implementation and fresh start adjustments | — | 49,302 | — | — | ||||||||||||
Write-off of deferred loan costs | — | 8,258 | — | — | ||||||||||||
Accrued professional fees | — | — | 1,000 | — | ||||||||||||
Loss (gain) on extinguishment of debt | 1,104 | — | — | (5,572 | ) | |||||||||||
Net changes in operating assets and liabilities: | ||||||||||||||||
Restricted cash | (1 | ) | — | (211 | ) | 3,711 | ||||||||||
Receivables | (2,924 | ) | 941 | 4,767 | (2,205 | ) | ||||||||||
Income tax refunds receivable | — | — | — | 107,401 | ||||||||||||
Real estate inventories — owned | 30,256 | (7,047 | ) | 18,151 | (66,317 | ) | ||||||||||
Real estate inventories — not owned | 7,129 | 1,250 | — | — | ||||||||||||
Other assets | 605 | 206 | (4,422 | ) | 15,898 | |||||||||||
Accounts payable | 7,706 | 4,618 | (1,522 | ) | (4,142 | ) | ||||||||||
Accrued expenses | 9,778 | (3,851 | ) | 7,817 | (3,984 | ) | ||||||||||
Liabilities from real estate inventories not owned | (7,129 | ) | (1,250 | ) | — | — | ||||||||||
|
|
|
|
|
|
|
| |||||||||
Net cash provided by (used in) operating activities | 49,993 | (17,321 | ) | (38,651 | ) | 24,119 | ||||||||||
|
|
|
|
|
|
|
| |||||||||
Investing activities | ||||||||||||||||
Investment in and advances to unconsolidated joint ventures | — | — | — | (194 | ) | |||||||||||
Distributions from unconsolidated joint ventures | — | — | 1,435 | 4,183 | ||||||||||||
Cash paid for acquisitions, net | (33,201 | ) | — | — | — | |||||||||||
Purchases of property and equipment | (312 | ) | — | (128 | ) | (64 | ) | |||||||||
|
|
|
|
|
|
|
| |||||||||
Net cash (used in) provided by investing activities | (33,513 | ) | — | 1,307 | 3,925 | |||||||||||
|
|
|
|
|
|
|
| |||||||||
F-7
Table of Contents
WILLIAM LYON HOMES
CONSOLIDATED STATEMENTS OF CASH FLOWS—(Continued)
(in thousands)
| Successor | Predecessor | |||||||||||||||
| Period from February 25 through December 31, 2012 | Period from January 1 through February 24, 2012 | Year Ended December 31, | ||||||||||||||
| 2011 | 2010 | |||||||||||||||
Financing activities | ||||||||||||||||
Proceeds from borrowings on notes payable | 13,248 | — | — | 7,087 | ||||||||||||
Proceeds from issuance of 8 1/2% Senior Notes | 325,000 | — | — | — | ||||||||||||
Principal payments on notes payable | (73,676 | ) | (616 | ) | (11,532 | ) | (52,797 | ) | ||||||||
Principal payments on Senior Secured Term Loan | (235,000 | ) | — | — | — | |||||||||||
Principal payments on Senior Subordinated Secured Notes | (75,916 | ) | — | — | — | |||||||||||
Proceeds from reorganization | — | 30,971 | — | — | ||||||||||||
Proceeds from issuance of convertible preferred stock | 14,000 | 50,000 | — | — | ||||||||||||
Proceeds from issuance of common stock | 16,000 | — | — | — | ||||||||||||
Proceeds from debtor in possession financing | — | 5,000 | — | — | ||||||||||||
Principal payment of debtor in possession financing | — | (5,000 | ) | — | — | |||||||||||
Payment of deferred loan costs | (7,181 | ) | (2,491 | ) | — | — | ||||||||||
Net cash paid for repurchase of Senior Notes | — | — | — | (31,268 | ) | |||||||||||
Payment of preferred stock dividends | (1,721 | ) | — | — | — | |||||||||||
Noncontrolling interest contributions | 15,313 | 1,825 | 6,605 | 6,546 | ||||||||||||
Noncontrolling interest distributions | (16,004 | ) | (1,897 | ) | (8,954 | ) | (3,913 | ) | ||||||||
|
|
|
|
|
|
|
| |||||||||
Net cash (used in) provided by financing activities | (25,937 | ) | 77,792 | (13,881 | ) | (74,345 | ) | |||||||||
|
|
|
|
|
|
|
| |||||||||
Net (decrease) increase in cash and cash equivalents | (9,457 | ) | 60,471 | (51,225 | ) | (46,301 | ) | |||||||||
Cash and cash equivalents — beginning of period | 80,532 | 20,061 | 71,286 | 117,587 | ||||||||||||
|
|
|
|
|
|
|
| |||||||||
Cash and cash equivalents — end of period | $ | 71,075 | $ | 80,532 | $ | 20,061 | $ | 71,286 | ||||||||
|
|
|
|
|
|
|
| |||||||||
Supplemental disclosures: | ||||||||||||||||
Cash paid for professional fees relating to the reorganization | $ | 3,228 | $ | 7,813 | $ | 20,182 | $ | — | ||||||||
|
|
|
|
|
|
|
| |||||||||
Supplemental disclosures of non-cash investing and financing activities: | ||||||||||||||||
Issuance of common stock related to land acquisition | $ | 10,500 | $ | — | $ | — | $ | — | ||||||||
|
|
|
|
|
|
|
| |||||||||
Land contributed in lieu of cash for common stock | $ | — | $ | 4,029 | $ | — | $ | — | ||||||||
|
|
|
|
|
|
|
| |||||||||
Distributions of real estate from unconsolidated joint ventures | $ | — | $ | — | $ | 800 | $ | — | ||||||||
|
|
|
|
|
|
|
| |||||||||
Accretion of payable in kind dividends on convertible preferred stock | $ | 860 | $ | — | $ | — | $ | — | ||||||||
|
|
|
|
|
|
|
| |||||||||
Preferred stock dividends, accrued | $ | 162 | $ | — | $ | — | $ | — | ||||||||
|
|
|
|
|
|
|
| |||||||||
Net change in real estate inventories—not owned and liabilities from inventories not owned | $ | — | $ | — | $ | 7,862 | $ | 10,652 | ||||||||
|
|
|
|
|
|
|
| |||||||||
Note payable issued in conjunction with land acquisition | $ | — | $ | — | $ | 55,000 | | $ | — | |||||||
|
|
|
|
|
|
|
| |||||||||
See accompanying notes to consolidated financial statements
F-8
Table of Contents
WILLIAM LYON HOMES
NOTES TO CONSOLIDATED FINANCIAL STATEMENTS
Note 1—Basis of Presentation and Significant Accounting Policies
Operations
William Lyon Homes, a Delaware corporation (“Parent” and together with its subsidiaries, the “Company”), are primarily engaged in designing, constructing and selling single family detached and attached homes in California, Arizona, Nevada and Colorado (under the Village Homes brand).
Basis of Presentation
We applied the accounting under Financial Accounting Standards Board (“FASB”) Accounting Standards Codification (“ASC”) Topic 852 (“ASC 852”), “Reorganizations,” as of February 24, 2012 (see Note 3). Therefore, our consolidated balance sheet as of December 31, 2012, which is referred to as that of the “Successor”, includes adjustments resulting from the reorganization and application of ASC 852 and is not comparable to our balance sheet as of December 31, 2011, which is referred to as that of the “Predecessor”. References to the “Successor” in the consolidated financial statements and the notes thereto refer to the Company after giving effect to the reorganization and application of ASC 852. References to the “Predecessor” refer to the Company prior to the reorganization and application of ASC 852.
The preparation of the Company’s financial statements in conformity with U.S. generally accepted accounting principles requires management to make estimates and assumptions that affect the reported amounts of the assets and liabilities as of December 31, 2012 and 2011 and revenues and expenses for the period from January 1, 2012 through February 24, 2012, period from February 25, 2012 through December 31, 2012, and years ended December 31, 2011 and 2010. Accordingly, actual results could differ from those estimates. The significant accounting policies using estimates include real estate inventories and cost of sales, impairment of real estate inventories, warranty reserves, loss contingencies, sales and profit recognition, accounting for variable interest entities, and fresh start accounting. The current economic environment increases the uncertainty inherent in these estimates and assumptions.
The consolidated financial statements include the accounts of the Company and all majority-owned and controlled subsidiaries and joint ventures, and certain joint ventures and other entities which have been determined to be variable interest entities in which the Company is considered the primary beneficiary (see Note 5). The accounting policies of the joint ventures are substantially the same as those of the Company. All significant intercompany accounts and transactions have been eliminated in consolidation.
Real Estate Inventories
Real estate inventories are carried at cost net of impairment losses, if any. Real estate inventories consist primarily of land deposits, land and land under development, homes completed and under construction, and model homes. All direct and indirect land costs, offsite and onsite improvements and applicable interest and other carrying charges are capitalized to real estate projects during periods when the project is under development. Land, offsite costs and all other common costs are allocated to land parcels benefited based upon relative fair values before construction. Onsite construction costs and related carrying charges (principally interest and property taxes) are allocated to the individual homes within a phase based upon the relative sales value of the homes. The Company relieves its accumulated real estate inventories through cost of sales for the estimated cost of homes sold. Selling expenses and other marketing costs are expensed in the period incurred. A provision for warranty costs relating to the Company’s limited warranty plans is included in cost of sales and accrued expenses at the time the sale of a home is recorded. The Company generally reserves approximately one to one and one quarter percent of the sales price of its homes against the possibility of future charges relating to its one-year limited warranty and similar potential claims. Factors that affect the Company’s warranty liability include the
F-9
Table of Contents
WILLIAM LYON HOMES
NOTES TO CONSOLIDATED FINANCIAL STATEMENTS—(Continued)
number of homes under warranty, historical and anticipated rates of warranty claims, and cost per claim. The Company periodically assesses the adequacy of its recorded warranty liability and adjusts the amounts as necessary. Changes in the Company’s warranty liability for the period from February 25, 2012 through December 31, 2012, period from January 1, 2012 through February 24, 2012, and the year ended December 31, 2011and 2010 are as follows (in thousands):
| Successor | Predecessor | |||||||||||||||
| Period from February 25 through December 31, 2012 | Period from January 1 through February 24, 2012 | Year Ended December 31, | ||||||||||||||
| 2011 | 2010 | |||||||||||||||
Warranty liability, beginning of period | $ | 14,000 | $ | 14,314 | $ | 16,341 | $ | 21,365 | ||||||||
Warranty provision during period | 2,731 | 187 | 2,380 | 2,574 | ||||||||||||
Warranty payments during period | (3,216 | ) | (845 | ) | (4,699 | ) | (8,277 | ) | ||||||||
Warranty charges related to pre-existing warranties during period | 802 | 199 | 292 | 679 | ||||||||||||
Fresh start adjustment | — | 145 | — | — | ||||||||||||
|
|
|
|
|
|
|
| |||||||||
Warranty liability, end of period | $ | 14,317 | $ | 14,000 | $ | 14,314 | $ | 16,341 | ||||||||
|
|
|
|
|
|
|
| |||||||||
Interest incurred under the Company’s debt obligations, as more fully discussed in Note 10, is capitalized to qualifying real estate projects under development. Any additional interest charges related to real estate projects not under development are expensed in the period incurred. Interest activity for the period from February 25, 2012 through December 31, 2012, period from January 1, 2012 through February 24, 2012, and the year ended December 31, 2011and 2010 are as follows (in thousands):
| Successor | Predecessor | |||||||||||||||
| Period from February 25 through December 31, 2012 | Period from January 1 through February 24, 2012 | Year Ended December 31, | ||||||||||||||
| 2011 | 2010 | |||||||||||||||
Interest incurred | $ | 30,526 | $ | 7,145 | $ | 61,464 | $ | 62,791 | ||||||||
Less: Interest capitalized | (21,399 | ) | (4,638 | ) | (36,935 | ) | (39,138 | ) | ||||||||
|
|
|
|
|
|
|
| |||||||||
Interest expense, net of amounts capitalized | $ | 9,127 | $ | 2,507 | $ | 24,529 | $ | 23,653 | ||||||||
|
|
|
|
|
|
|
| |||||||||
Cash paid for interest | $ | 26,560 | $ | 8,924 | $ | 48,018 | $ | 59,748 | ||||||||
|
|
|
|
|
|
|
| |||||||||
Construction Services
The Company accounts for construction management agreements using thePercentage of Completion Method in accordance with FASB ASC Topic 605Revenue Recognition (“ASC 605”). Under ASC 605, the Company records revenues and expenses as a contracted project progresses, and based on the percentage of costs incurred to date compared to the total estimated costs of the contract.
The Company entered into construction management agreements to build, sell and market homes in certain communities. For such services, the Company will receive fees (generally 3 to 5 percent of the sales price, as defined) and may, under certain circumstances, receive additional compensation if certain financial thresholds are achieved.
F-10
Table of Contents
WILLIAM LYON HOMES
NOTES TO CONSOLIDATED FINANCIAL STATEMENTS—(Continued)
Financial Instruments
Financial instruments that potentially subject the Company to concentrations of credit risk are primarily cash investments, receivables, and deposits. The Company typically places its cash investments in investment grade short-term instruments. Deposits, included in other assets, are due from municipalities or utility companies and are generally collected from such entities through fees assessed to other developers. The Company is an issuer of, or subject to, financial instruments with off-balance sheet risk in the normal course of business which exposes it to credit risks. These financial instruments include letters of credit and obligations in connection with assessment district bonds. These off-balance sheet financial instruments are described in more detail in Note 19.
Cash and Cash Equivalents
Short-term investments with a maturity of three months or less when purchased are considered cash equivalents. The Company’s cash and cash equivalents balance exceeds federally insurable limits as of December 31, 2012 and 2011. The Company monitors the cash balances in its operating accounts and adjusts the cash balances as appropriate; however, these cash balances could be negatively impacted if the underlying financial institutions fail or are subject to other adverse conditions in the financial markets. To date, the Company has experienced no loss or lack of access to cash in its operating accounts.
Restricted Cash
Restricted cash consists of deposits made by the Company to a bank account as collateral for the use of letters of credit to guarantee the Company’s financial obligations under certain other contractual arrangements in the normal course of business.
Deferred Loan Costs
Deferred loan costs represent debt issuance cost and are primarily amortized to interest expense using the straight line method which approximates the effective interest method.
Goodwill
In accordance with the provisions of ASC 350,Intangibles, Goodwill and Other, goodwill amounts are not amortized, but rather are analyzed for impairment at the reporting segment level. Goodwill is analyzed on an annual basis, or when indicators of impairment exist. We have determined that we have five reporting segments, as discussed in Note 6, and we will perform an annual goodwill impairment analysis during the fourth quarter of each fiscal year, with the first annual testing carried out in the fourth quarter of fiscal year 2012.
Intangible Assets
Recorded intangible assets primarily relate to construction management contracts, homes in backlog, and joint venture management fee contracts recorded in conjunction with ASC 852. Such assets were valued based on expected cash flows related to home closings, and the asset is amortized on a per unit basis, as homes under the contracts close.
Income (loss) per common share
The Company computes income (loss) per common share in accordance with FASB ASC Topic 260,Earnings per Share, which requires income (loss) per common share for each class of stock to be calculated using the two-class method. The two-class method is an allocation of income (loss) between the holders of common stock and a company’s participating security holders.
F-11
Table of Contents
WILLIAM LYON HOMES
NOTES TO CONSOLIDATED FINANCIAL STATEMENTS—(Continued)
Basic income (loss) per common share is computed by dividing income or loss available to common stockholders by the weighted average number of shares of common stock outstanding. For purposes of determining diluted income (loss) per common share, basic income (loss) per common share is further adjusted to include the effect of potential dilutive common shares outstanding.
Income Taxes
Income taxes are accounted for under the provisions of Financial Accounting Standards Board ASC 740, Income Taxes,using an asset and liability approach. Deferred income taxes reflect the net effects of temporary differences between the carrying amount of assets and liabilities for financial reporting purposes and the amounts used for income tax purposes, and operating loss and tax credit carryforwards measured by applying currently enacted tax laws. A valuation allowance is provided to reduce net deferred tax assets to an amount that is more likely than not to be realized. ASC 740 prescribes a recognition threshold and a measurement criteria for the financial statement recognition and measurement of tax positions taken or expected to be taken in a tax return. For those benefits to be recognized, a tax position must be considered “more-likely-than-not” to be sustained upon examination by taxing authorities. The Company has taken positions in certain taxing jurisdictions for which it is more likely than not that previously unrecognized tax benefits will be recognized. In addition, the Company has elected to recognize interest and penalties related to uncertain tax positions in the income tax provision.
Impact of Recent Accounting Pronouncements
In 2011, the FASB issued ASU 2011-04,Fair Value Measurement (Topic 820): Amendments to Achieve Common Fair Value Measurement and Disclosure Requirements in U.S. GAAP and IFRSs.This ASU represents the converged guidance of the FASB and the IASB (the Boards) on fair value measurement and results in common requirements for measuring fair value and for disclosing information about fair value measurements, including a consistent meaning of the term “fair value.” Our adoption of these new provisions of ASU 2011-04 on January 1, 2012 did not have an impact on our consolidated financial statements.
In 2012, the FASB issued ASU 2012-02,Intangibles – Goodwill and Other(Topic 350):Testing Indefinite-Lived Intangible Assets for Impairment. The amendments permit an entity first to assess qualitative factors to determine whether it is more likely than not that an indefinite-lived intangible asset is impaired as a basis for determining whether it is necessary to perform the quantitative impairment test in accordance with Subtopic 350-30. Previous guidance required an entity to test indefinite-lived intangible assets for impairment, on at least an annual basis, by comparing the fair value of the asset with its carrying amount. If the carrying amount of the intangible asset exceeds its fair value, an entity should recognize an impairment loss in the amount of that excess. An entity has the option not to calculate annually the fair value of an indefinite-lived intangible asset if the entity determines that it is not more likely than not that the asset is impaired. For the year ended December 31, 2012, the Company did not elect to use qualitative assessment option permitted by this amendment; however, the Company anticipates using the qualitative assessment option in future periods.
Reclassifications
Certain balances on the financial statements and certain amounts presented in the notes have been reclassified in order to conform to current year presentation.
Note 2—Emergence from Chapter 11
On December 19, 2011, William Lyon Homes (the “Company”) and certain of its direct and indirect wholly-owned subsidiaries filed voluntary petitions, under chapter 11 of Title 11 of the United States Code, as
F-12
Table of Contents
WILLIAM LYON HOMES
NOTES TO CONSOLIDATED FINANCIAL STATEMENTS—(Continued)
amended (the “Chapter 11 Petitions”), in the United States Bankruptcy Court for the District of Delaware (the “Bankruptcy Court”) to seek approval of the Prepackaged Joint Plan of Reorganization (the “Plan”) of the Company and certain of its subsidiaries. The Chapter 11 Petitions were jointly administered under the captionIn re William Lyon Homes, et al., Case No. 11-14019 (the “Chapter 11 Cases”). The sole purpose of the Chapter 11 Cases was to restructure the Company’s debt obligations and strengthen its balance sheet.
On February 10, 2012, the Bankruptcy Court confirmed the Plan. On February 24, 2012, the Company and its subsidiaries consummated the principal transactions contemplated by the Plan, including:
| • | the issuance of 44,793,255 shares of the Company’s new Class A Common Stock, $0.01 par value per share (“Class A Common Stock”) and $75 million aggregate principal amount of 12% Senior Subordinated Secured Notes due 2017 (“Second Lien Notes”) issued by the Company’s wholly-owned subsidiary, William Lyon Homes, Inc. (“Borrower”) in exchange for the claims held by the holders of the formerly outstanding notes of Borrower; |
| • | the amendment of the Borrower’s loan agreement with ColFin WLH Funding, LLC and certain other lenders which resulted, among other things, in the increase in the principal amount outstanding under the loan agreement, the reduction in the interest rate payable under the loan agreement, and the elimination of any prepayment penalty under the loan agreement; |
| • | the issuance, in exchange for cash and land deposits of $25 million, of 31,464,548 shares of the Company’s new Class B Common Stock, $0.01 par value per share (“Class B Common Stock”) and warrants to purchase 15,737,294 shares of Class B Common Stock; |
| • | the issuance of 64,831,831 shares of Parent’s new Convertible Preferred Stock, $0.01 par value per share, or Convertible Preferred Stock, for $50.0 million in cash, and 12,966,366 shares of Parent’s new Class C Common Stock, $0.01 par value per share or Class C Common Stock, for $10.0 million in cash. The aggregate cash consideration of $60 million was apportioned between Common and Preferred in accordance with the Plan; and |
| • | the issuance of an additional 3,144,000 shares of Class C Common Stock to Luxor Capital Group LP as a transaction fee in consideration for providing the backstop commitment of the offering of shares of Class C Common Stock and Convertible Preferred Stock in connection with the Plan. |
Note 3—Fresh Start Accounting and Effects of the Plan
As required by U.S. GAAP, effective as of February 24, 2012, we adopted fresh start accounting following the guidance of ASC 852. Fresh start accounting results in the Company becoming a new entity for financial reporting purposes. Accordingly, our consolidated financial statements for periods prior to February 25, 2012 are not comparable to consolidated financial statements presented on or after February 25, 2012. Fresh start accounting was required upon emergence from Chapter 11 because holders of voting shares immediately before confirmation of the Plan received less than 50% of the emerging entity and the reorganization value of our assets immediately before confirmation of our Plan was less than our post-petition liabilities and allowed claims. Fresh start accounting results in a new basis of accounting and reflects the allocation of our estimated fair value to underlying assets and liabilities. Our estimates of fair value are inherently subject to significant uncertainties and contingencies beyond our reasonable control. Accordingly, there can be no assurance that the estimates, assumptions, valuations, appraisals and financial projections will be realized, and actual results could vary materially. Moreover, the market value of our common stock may differ materially from the equity valuation for accounting purposes under ASC 852. In addition, the cancellation of debt income and the allocation of the attribute reduction for tax purposes is an estimate and will not be finalized until the 2012 tax return is filed. Any change resulting from this estimate could impact deferred taxes.
F-13
Table of Contents
WILLIAM LYON HOMES
NOTES TO CONSOLIDATED FINANCIAL STATEMENTS—(Continued)
Under ASC 852, the Successor Company must determine a value to be assigned to the equity of the emerging company as of the date of adoption of fresh-start accounting, which was February 24, 2012 for the Company, the date the Debtors emerged from Chapter 11. To facilitate the adoption of fresh start accounting, the Company engaged a third-party valuation firm to assist with assessing enterprise value, and the allocation of value to the assets and liabilities of the Company. To calculate enterprise value, the Company used a discounted cash flow analysis, considering a weighted average cost of capital of 16.5%, and utilized a Gordon Growth model with a 3.0% growth rate to calculate terminal value. The analysis resulted in an enterprise value of $485.0 million, which was used as the enterprise value for fresh start accounting. The Company’s total debt was valued at $384.5 million, which consists of the following:
| • | $6.3 million related to a construction note payable with an outstanding principal amount of $6.5 million, which reflects an adjustment of $(0.2) million. The Company discounted the contractual interest and principal payments using a risk adjusted rate of 12.5%. |
| • | $56.3 million related to a construction note payable with an outstanding principal amount of $55.0 million, which reflects an adjustment of $1.3 million. The Company discounted the contractual interest and principal payments using a risk adjusted rate of 12.5%. |
| • | $2.9 million related to a seller note arrangement that matured on March 1, 2012, 6 days after the plan of reorganization was approved. The payment was made in full, therefore the value of the note was the amount paid. |
| • | The remaining debt that was renegotiated as part of the Company’s plan of reorganization, consists of a construction note payable of $9.0 million, the $235.0 million Senior Secured Term Loan and the $75.0 million Senior Subordinated Secured Notes due 2017. In accordance with ASC 820,Fair Value Measurements and Disclosures, fair value is defined as, “the price that would be received to sell an asset or paid to transfer a liability in an orderly transaction between market participants at the measurement date”. As these debt amounts were negotiated as part of the reorganization by market participants, their carrying value at that date is representative of fair value. |
The enterprise value of the Company was $485.0 million, which includes $384.5 million fair value of debt, as detailed above, and $100.5 million of equity value. The value of each type of equity security was determined using an option pricing model used in accordance with ASC 718,Valuation of Stock Compensation,and treated the redeemable convertible preferred stock, the common stock and the common stock warrants as separate securities. Based on the rights and preferences of each security, the Company valued each security based on a series of five events:
| (i) | liquidation preference of the redeemable convertible preferred stock, |
| (ii) | timing of participation of Class A and B shares of common stock, |
| (iii) | timing of participation of Class C shares of common stock, |
| (iv) | conversion of preferred shares into common shares, and |
| (v) | exercise of warrants |
The Company used an option pricing model and the relative rights of the securities to allocate the $100.5 million among the redeemable convertible preferred stock, the common stock and the warrants. Each security was valued based on the relative rights and preferences and a three year term to liquidity event, volatility of 59% based on public company comparables, a risk free rate of .43% based on a three year treasury rate. In addition, the redeemable convertible preferred stock has a dividend yield of 6% and the common stock and warrants have a discount for lack of marketability of 38%. Based on these inputs and the assumptions, the redeemable
F-14
Table of Contents
WILLIAM LYON HOMES
NOTES TO CONSOLIDATED FINANCIAL STATEMENTS—(Continued)
convertible preferred stock was valued at $56.4 million, the common stock was valued at $43.1 million and the warrants were valued at $1.0 million.
The estimated enterprise value and the equity value are highly dependent on the achievement of the future financial results contemplated in the projections that were set forth in the disclosure statement to the Plan. The estimates and assumptions made in the valuation are inherently subject to significant uncertainties. The primary assumptions for which there is a reasonable possibility of the occurrence of a variation that would have significantly affected the reorganization value include the assumptions regarding the number of homes sold and homes closed, average sales prices, operating expenses, the amount and timing of construction costs and the discount rate utilized.
Fresh-start accounting reflects the value of the Successor as determined in the confirmed Plan. Under fresh-start accounting, asset values are remeasured and allocated based on their respective fair values in conformity with the purchase method of accounting for business combinations in FASB ASC Topic 805, “Business Combinations” (“FASB ASC 805”). Liabilities existing as of February 24, 2012, the Effective Date, other than deferred taxes, were recorded at the present value of amounts expected to be paid using appropriate risk adjusted interest rates. Deferred taxes were determined in conformity with applicable accounting standards. Predecessor accumulated depreciation, accumulated amortization and retained deficit were eliminated.
In conjunction with the adoption of fresh start accounting, certain intangible assets including, the value of the Company’s homes in backlog, construction management contracts and joint venture management fee contracts were recorded at their estimated fair values as of February 24, 2012 in the amount of $9.5 million. The Company’s backlog was valued using the With/Without Method of the Income Approach to estimate the fair value of the backlog. This asset is amortized on a straight line basis, as homes that were in backlog as of February 24, 2012, are closed or the contract is cancelled.
The construction management contracts and joint venture management fee contracts were valued using the Multi-period Excess Earnings method of the Income Approach to estimate the fair value. Since these assets are valued based on expected cash flows related to home closings, the asset is amortized on a straight line basis, as homes under the contracts close.
The following fresh start consolidated balance sheet presents the implementation of the Plan and the adoption of fresh start accounting as of the Effective Date. Reorganization adjustments have been recorded within the consolidated balance sheet to reflect the effects of the Plan, including discharge of liabilities subject to compromise and the adoption of fresh start accounting in accordance with ASC 852.
F-15
Table of Contents
WILLIAM LYON HOMES
NOTES TO CONSOLIDATED FINANCIAL STATEMENTS—(Continued)
CONSOLIDATED BALANCE SHEETS
(in thousands except number of shares and par value per share)
| February 24, 2012 | ||||||||||||||||
| Predecessor | Plan of Reorganization Adjustments | Fresh Start Accounting Adjustments | Successor | |||||||||||||
| ASSETS | ||||||||||||||||
Cash and cash equivalents | $ | 12,787 | $ | 67,746 | (a) | $ | — | $ | 80,533 | |||||||
Restricted cash | 852 | — | — | 852 | ||||||||||||
Receivables | 12,790 | — | (996 | )(m) | 11,794 | |||||||||||
Real estate inventories | ||||||||||||||||
Owned | 405,632 | 4,029 | (b) | (1,198 | )(n) | 408,463 | ||||||||||
Not owned | 46,158 | — | — | 46,158 | ||||||||||||
Property & equipment, net | 962 | — | (421 | )(o) | 541 | |||||||||||
Deferred loan costs | 8,258 | (5,767 | )(c) | — | 2,491 | |||||||||||
Goodwill | — | — | 14,209 | (p) | 14,209 | |||||||||||
Intangibles | — | — | 9,470 | (q) | 9,470 | |||||||||||
Other assets | 6,307 | 47 | (d) | — | 6,354 | |||||||||||
|
|
|
|
|
|
|
| |||||||||
Total assets | $ | 493,746 | $ | 66,055 | $ | 21,064 | $ | 580,865 | ||||||||
|
|
|
|
|
|
|
| |||||||||
| LIABILITIES AND EQUITY (DEFICIT) | ||||||||||||||||
Liabilities not subject to compromise | ||||||||||||||||
Accounts payable | $ | 10,000 | $ | — | $ | — | $ | 10,000 | ||||||||
Accrued expenses | 31,391 | — | 221 | (r) | 31,612 | |||||||||||
Liabilities from inventories not owned | 46,158 | — | — | 46,158 | ||||||||||||
Notes payable | 78,394 | (5,000 | )(f) | 1,100 | (s) | 74,494 | ||||||||||
Senior Secured Term Loan due January 31, 2015 | 206,000 | 29,000 | (g) | — | 235,000 | |||||||||||
Senior Subordinated Secured Notes due February 25, 2017 | — | 75,000 | (h) | — | 75,000 | |||||||||||
|
|
|
|
|
|
|
| |||||||||
| 371,943 | 99,000 | 1,321 | 472,264 | |||||||||||||
|
|
|
|
|
|
|
| |||||||||
Liabilities subject to compromise | ||||||||||||||||
Accrued expenses | 15,297 | (15,297 | )(e) | — | — | |||||||||||
75/8% Senior Notes due December 15, 2012 | 66,704 | (66,704 | )(e) | — | — | |||||||||||
103/4% Senior Notes due April 1, 2013 | 138,964 | (138,964 | )(e) | — | — | |||||||||||
71/2% Senior Notes due February 15, 2014 | 77,867 | (77,867 | )(e) | — | — | |||||||||||
|
|
|
|
|
|
|
| |||||||||
| 298,832 | (298,832 | ) | — | — | ||||||||||||
|
|
|
|
|
|
|
| |||||||||
Redeemable convertible preferred stock | — | 56,386 | (i) | — | 56,386 | |||||||||||
Equity (deficit): | ||||||||||||||||
William Lyon Homes stockholders’ equity (deficit) | ||||||||||||||||
Common stock, Class A | — | 448 | (j) | — | 448 | |||||||||||
Common stock, Class B | — | 315 | (j) | — | 315 | |||||||||||
Common stock, Class C | — | 161 | (j) | — | 161 | |||||||||||
Additional paid-in capital | 48,867 | (21,177 | )(k) | 15,501 | (t) | 43,191 | ||||||||||
Accumulated deficit | (235,584 | ) | 229,754 | (l) | 5,830 | (u) | — | |||||||||
|
|
|
|
|
|
|
| |||||||||
Total William Lyon Homes stockholder’s equity (deficit) | (186,717 | ) | 209,501 | 21,331 | 44,115 | |||||||||||
Noncontrolling interest | 9,688 | — | (1,588 | )(v) | 8,100 | |||||||||||
|
|
|
|
|
|
|
| |||||||||
Total equity (deficit) | (177,029 | ) | 209,501 | 19,743 | 52,215 | |||||||||||
|
|
|
|
|
|
|
| |||||||||
Total liabilities and equity (deficit) | $ | 493,746 | $ | 66,055 | $ | 21,064 | $ | 580,865 | ||||||||
|
|
|
|
|
|
|
| |||||||||
F-16
Table of Contents
WILLIAM LYON HOMES
NOTES TO CONSOLIDATED FINANCIAL STATEMENTS—(Continued)
Notes to Plan of Reorganization and Fresh Start Accounting Adjustments:
| a | Reflects net cash received of $81.0 million from the issuance of new equity, reduced by the repayment of DIP financing of $5.2 million, payment of financing fees of $2.6 million and other reorganization related costs of $5.4 million. |
| b | Reflects contribution of land option deposit in lieu of cash for Class B Common Stock. |
| c | Reflects the write-off of the remaining deferred loan costs of the Old Notes net of capitalization of deferred loan costs related to the Amended Term Loan. |
| d | Reflects prepaid property taxes to obtain title insurance for the second lien notes. Deferred tax assets are not reflected on the balance sheet as they have been fully reserved. |
| e | Reflects the extinguishment of liabilities subject to compromise (“LSTC”) at emergence. LSTC was comprised of $283.5 million of Old Notes and $15.3 million of related accrued interest. The holders of the Old Notes received Class A common stock of the Successor entity. |
| f | Reflects repayment of amounts outstanding under the DIP Credit Agreement pursuant to the Plan. |
| g | Reflects the additional principal added to the Amended Term Loan, in accordance with the Plan. |
| h | Reflects the issuance of Senior Subordinated Secured Notes of $75.0 million, in accordance with the Plan. |
| i | Reflects the fair value of the Convertible Preferred Stock issued pursuant to the Plan. The fair value of the total residual equity interest of $100.5 million was determined based on the enterprise value of $485.0 million determined as of the date of the plan, less the $384.5 million fair value of Long-Term debt. Cash received for the convertible preferred was $50.0 million, however as discussed previously, the Company valued the redeemable convertible preferred stock at $56.4 million. |
| j | Reflects the issuance of 92.4 million total shares in new common stock at $0.01 par value and the extinguishment of 1,000 shares ($0.01 par) of Old Common Stock, in accordance with the plan (see Note 2 for allocation of shares). |
| k | Reflects the elimination of $48.9 million of additional paid-in capital (“APIC”) relating to Old Common Stock, offset by $27.7 million of net cash received from the issuance of the Class B and Class C shares of common stock. |
| l | Reflects the elimination of $235.6 million of accumulated deficit of the Predecessor company in addition to the net impact of Plan adjustments to assets, liabilities and stockholder’s equity. |
| m | Reflects adjustment of $1.0 million to notes receivable with a book value of $6.2 million to fair value of $5.2 million using the discounted cash flow approach. The Company discounted the future interest to be received at a discount rate of 10%, which is above the stated rate of the note. |
| n | Reflects adjustment of $1.2 million to real estate inventory using the discounted cash flow approach. The Company used project forecasts and an unlevered discount rate of 20% to arrive at fair value. Certain projects that are held for future development were valued on an “As-Is” Basis using market comparables. |
| o | Reflects adjustment of $0.4 million to property and equipment with a book value of $1.0 million to fair value of $ $0.6 million, based on the estimated sales value of the assets determined on an “As Is” Basis using market comparables. |
| p | Goodwill represents the excess of enterprise value upon emergence over fair value of net tangible and identifiable intangible assets acquired. |
F-17
Table of Contents
WILLIAM LYON HOMES
NOTES TO CONSOLIDATED FINANCIAL STATEMENTS—(Continued)
| q | Reflects identifiable intangible assets comprised of $4.6 million relating to construction management contracts, $4.0 million relating to homes in backlog, and $0.8 million relating to joint venture management fees. The value of the construction management contracts and the joint venture management fees was estimated using the discounted cash flows of each related project at a discount rate ranging from 17% to 19%. The value of the backlog contracts was determined using the With/Without method of the income approach and the expected closing date of the home in backlog and the contracted sales price of the home. |
| r | Reflects adjustments to warranty and construction defect litigation liabilities which were valued based on the estimated costs of warranty spending on homes previously closed plus an estimated margin of 9.4%, plus a reasonable margin required to transfer the liability or to fulfill the obligation. |
| s | Reflects adjustment of one note payable of $(0.2) million, with a book value of $6.5 million to a fair value of $6.3 million. The Company used a discounted cash flow on contracted interest and principal to be received and a risk adjusted discount rate of 12.5%. Also reflects adjustment of one note payable of $1.3 million, with a book value of $55.0 million to a fair value of $56.3 million. The Company used a discounted cash flow on contracted interest and principal to be received and a risk adjusted discount rate of 12.5%. |
| t | Reflects the adjustment to a combined common stock and warrants value of $44.1 million for the calculation of fair value under the provisions of fresh start accounting, based on the remaining residual equity interest of $100.5 million, as discussed in note (i) above, less the allocation to convertible preferred of $56.4 million, as also discussed in note (i). |
| u | Reflects the elimination of a balance in accumulated deficit of $5.8 million to reduce any accumulated deficit or retained earnings in conjunction with fresh start accounting, which requires the successor entity to begin with a zero balance in retained earnings. |
| v | Reflects adjustment of $1.6 million to minority interest in a consolidated entity with a book value of $9.7 million to fair value of $8.1 million. The Company used a discounted cash flow approach to the project and the estimated cash to be distributed to the minority member of the entity, using a discount rate of 17.8%. |
Reconciliation of enterprise value to the reorganized value of the Company’s assets and determination of goodwill (in thousands):
Total enterprise value | $ | 485,000 | ||
Add: liabilities (excluding debt and equity) | 87,765 | |||
Add: noncontrolling interest | 8,100 | |||
|
| |||
Reorganization value of assets | 580,865 | |||
Fair value of assets (excluding goodwill) | 566,656 | |||
|
| |||
Reorganization value in excess of fair value (goodwill) | $ | 14,209 | ||
|
|
F-18
Table of Contents
WILLIAM LYON HOMES
NOTES TO CONSOLIDATED FINANCIAL STATEMENTS—(Continued)
Note 4—Reorganization Items
In accordance with authoritative accounting guidance issued by the FASB, separate disclosure is required for reorganization items, such as certain expenses, provisions for losses and other charges directly associated with or resulting from the reorganization and restructuring of the business, which have been realized or incurred during the Chapter 11 Cases. Reorganization items were comprised of the following (in thousands):
| Successor | Predecessor | |||||||||||||||
| Period from February 25 through December 31, 2012 | Period from January 1 through February 24, 2012 | |||||||||||||||
| Year Ended December 31, | ||||||||||||||||
| 2011 | 2010 | |||||||||||||||
Cancellation of debt | $ | — | $ | 298,831 | $ | — | $ | — | ||||||||
Plan implementation and fresh start valuation adjustments | — | (49,302 | ) | — | — | |||||||||||
Professional fees | (2,525 | ) | (7,813 | ) | (21,182 | ) | — | |||||||||
Write-off of Old Notes deferred loan costs | — | (8,258 | ) | — | — | |||||||||||
|
|
|
|
|
|
|
| |||||||||
Total reorganization items, net | $ | (2,525 | ) | $ | 233,458 | $ | (21,182 | ) | $ | — | ||||||
|
|
|
|
|
|
|
| |||||||||
Note 5—Variable Interest Entities and Noncontrolling Interests
The Company accounts for variable interest entities in accordance with ASC 810,Consolidation (“ASC 810”). Under ASC 810, a variable interest entity (“VIE”) is created when: (a) the equity investment at risk in the entity is not sufficient to permit the entity to finance its activities without additional subordinated financial support provided by other parties, including the equity holders; (b) the entity’s equity holders as a group either (i) lack the direct or indirect ability to make decisions about the entity, (ii) are not obligated to absorb expected losses of the entity or (iii) do not have the right to receive expected residual returns of the entity; or (c) the entity’s equity holders have voting rights that are not proportionate to their economic interests, and the activities of the entity involve or are conducted on behalf of the equity holder with disproportionately few voting rights. If an entity is deemed to be a VIE pursuant to ASC 810, the enterprise that has both (i) the power to direct the activities of a VIE that most significantly impact the entity’s economic performance and (ii) the obligation to absorb the expected losses of the entity or right to receive benefits from the entity that could be potentially significant to the VIE is considered the primary beneficiary and must consolidate the VIE. In accordance with ASC 810, we perform ongoing reassessments of whether an enterprise is the primary beneficiary of a VIE.
Joint Ventures
As of December 31, 2012 and 2011, the Company had two and one joint ventures, respectively, which were deemed to be VIEs under ASC 810 for which the Company is considered the primary beneficiary. The Company manages the joint ventures, by using its sales, development and operations teams and has significant control over these projects and therefore the power to direct the activities that most significantly impact the joint venture’s performance, in addition to being obligated to absorb expected losses or receive benefits from the joint venture, and therefore the Company is deemed to be the primary beneficiary of these VIEs.
These joint ventures are each engaged in homebuilding and land development activities. Certain of these joint ventures have not obtained construction financing from outside lenders, but are financing their activities through equity contributions from each of the joint venture partners. The Company has no rights, nor does the Company have any obligation with respect to the liabilities of the VIEs, and none of the Company’s assets serve
F-19
Table of Contents
WILLIAM LYON HOMES
NOTES TO CONSOLIDATED FINANCIAL STATEMENTS—(Continued)
as collateral for the creditors of these VIEs. The assets of the joint ventures are the sole collateral for the liabilities of the joint ventures and as such, the creditors and equity investors of these joint ventures have no recourse to assets of the Company held outside of these joint ventures. Creditors of these VIEs have no recourse against the general credit of the Company. The liabilities of each VIE are restricted to the assets of each VIE. Additionally, the creditors of the Company have no access to the assets of the VIEs. Income allocations and cash distributions to the Company are based on predetermined formulas between the Company and their joint venture partners as specified in the applicable partnership or operating agreements. The Company generally receives, after partners’ priority returns and return of partners’ capital, approximately 50% of the profits and cash flows from the joint ventures.
During the year ended December 31, 2012, the Company formed a joint venture, Lyon Branches, LLC, for the purpose of land development and homebuilding activities. The Company, as the managing member, has the power to direct the activities of the VIE since it manages the daily operations and has exposure to the risks and rewards of the VIE, as based on the division of income and loss per the joint venture agreement. Therefore, the Company is the primary beneficiary of the joint venture, and the VIE was consolidated as of December 31, 2012.
As of December 31, 2012, the assets of the consolidated VIEs totaled $24.7 million, of which $1.1 million was cash and $20.4 was real estate inventories. The liabilities of the consolidated VIEs totaled $6.4 million, primarily comprised of accounts payable and accrued liabilities. The Company recorded a $1.6 million valuation adjustment to the noncontrolling interest account on one VIE in accordance with the adoption of ASC 852.
As of December 31, 2011, the assets of the consolidated VIEs totaled $14.0 million, of which $2.1 million was cash and $8.7 million was real estate inventories. The liabilities of the consolidated VIEs totaled $1.3 million, primarily comprised of accounts payable and accrued liabilities.
Note 6—Segment Information
The Company operates one principal homebuilding business. In accordance with FASB ASC Topic 280,Segment Reporting(“ASC 280”), the Company has determined that each of its operating divisions is an operating segment.
Operating segments are defined as components of an enterprise about which separate financial information is available that is evaluated regularly by the chief operating decision-maker in deciding how to allocate resources and in assessing performance. The Company’s Executive Chairman, Chief Executive Officer and Chief Operating Officer have been identified as the chief operating decision makers. The Company’s chief operating decision makers direct the allocation of resources to operating segments based on the profitability and cash flows of each respective segment.
The Company’s homebuilding operations design, construct and sell a wide range of homes designed to meet the specific needs in each of its markets. In accordance with the aggregation criteria defined by ASC 280, the Company’s homebuilding operating segments have been grouped into five reportable segments: Southern California, consisting of an operating division with operations in Orange, Los Angeles, San Bernardino and San Diego counties; Northern California, consisting of an operating division with operations in Contra Costa, Sacramento, San Joaquin, Santa Clara, Solano and Placer counties; Arizona, consisting of operations in the Phoenix, Arizona metropolitan area; Nevada, consisting of operations in the Las Vegas, Nevada metropolitan area; and Colorado, consisting of operations in the Denver, Colorado metropolitan area, Fort Collins, and Granby, Colorado. Colorado does not meet the quantitative requirements for segment reporting per ASC 280, however management believes that information about the segment is useful to readers of the financial statements.
F-20
Table of Contents
WILLIAM LYON HOMES
NOTES TO CONSOLIDATED FINANCIAL STATEMENTS—(Continued)
Corporate develops and implements strategic initiatives and supports the Company’s operating divisions by centralizing key administrative functions such as finance and treasury, information technology, risk management and litigation and human resources.
Segment financial information relating to the Company’s operations was as follows (in thousands):
| Successor | Predecessor | |||||||||||||||
| Period from February 25 through December 31, 2012 | Period from January 1 through February 24, 2012 | Year Ended December 31, | ||||||||||||||
| 2011 | 2010 | |||||||||||||||
Operating revenue: | ||||||||||||||||
Southern California | $ | 116,619 | $ | 7,759 | $ | 130,737 | $ | 206,241 | ||||||||
Northern California | 154,684 | 11,014 | 54,141 | 56,095 | ||||||||||||
Arizona | 58,714 | 4,316 | 20,074 | 16,595 | ||||||||||||
Nevada | 37,307 | 2,481 | 21,871 | 15,767 | ||||||||||||
Colorado | 5,436 | — | — | — | ||||||||||||
|
|
|
|
|
|
|
| |||||||||
Total operating revenue | $ | 372,760 | $ | 25,570 | $ | 226,823 | $ | 294,698 | ||||||||
|
|
|
|
|
|
|
| |||||||||
| Successor | Predecessor | |||||||||||||||
| Period from February 25 through December 31, 2012 | Period from January 1 through February 24, 2012 | Year Ended December 31, | ||||||||||||||
| 2011 | 2010 | |||||||||||||||
(Loss) income before (provision) benefit from income taxes: | ||||||||||||||||
Southern California | $ | 3,345 | $ | (19,131 | ) | $ | (26,406 | ) | $ | (83,176 | ) | |||||
Northern California | 16,179 | 6,195 | (6,307 | ) | (41 | ) | ||||||||||
Arizona | 2,073 | 9,928 | (95,184 | ) | (26,887 | ) | ||||||||||
Nevada | (1,146 | ) | (1,738 | ) | (30,500 | ) | (21,449 | ) | ||||||||
Colorado | 130 | — | — | — | ||||||||||||
Corporate | (27,431 | ) | 233,243 | (34,491 | ) | (4,314 | ) | |||||||||
|
|
|
|
|
|
|
| |||||||||
(Loss) income before (provision) | $ | (6,850 | ) | $ | 228,497 | $ | (192,888 | ) | $ | (135,867 | ) | |||||
|
|
|
|
|
|
|
| |||||||||
(Loss) income before (provision) benefit from income taxes includes the following pretax inventory impairment charges recorded in the following segments (in thousands):
| Successor | Predecessor | |||||||||||||||
| Period from February 25 through December 31, 2012 | Period from January 1 through February 24, 2012 | Year Ended December 31, 2011 | Year Ended December 31, 2010 | |||||||||||||
Southern California | $ | — | $ | — | $ | 17,962 | $ | 70,801 | ||||||||
Northern California | — | — | 2,074 | 3,103 | ||||||||||||
Arizona | — | — | 87,607 | 22,409 | ||||||||||||
Nevada | — | — | 20,671 | 15,547 | ||||||||||||
Colorado | — | — | — | — | ||||||||||||
|
|
|
|
|
|
|
| |||||||||
Total impairment loss on real estate assets | $ | — | $ | — | $ | 128,314 | $ | 111,860 | ||||||||
|
|
|
|
|
|
|
| |||||||||
F-21
Table of Contents
WILLIAM LYON HOMES
NOTES TO CONSOLIDATED FINANCIAL STATEMENTS—(Continued)
| Successor | Predecessor | |||||||
| December 31, | ||||||||
| 2012 | 2011 | |||||||
Homebuilding assets: | ||||||||
Southern California | $ | 195,688 | $ | 182,781 | ||||
Northern California | 31,293 | 105,298 | ||||||
Arizona | 173,847 | 129,920 | ||||||
Nevada | 51,141 | 42,183 | ||||||
Colorado | 37,668 | — | ||||||
Corporate (1) | 91,510 | 36,769 | ||||||
|
|
|
| |||||
Total homebuilding assets | $ | 581,147 | $ | 496,951 | ||||
|
|
|
| |||||
| (1) | Comprised primarily of cash and cash equivalents, receivables, deferred loan costs, and other assets. |
Note 7—Real Estate Inventories
Real estate inventories consist of the following (in thousands):
| Successor | Predecessor | |||||||
| December 31, | ||||||||
| 2012 | 2011 | |||||||
Real estate inventories owned: | ||||||||
Land deposits | $ | 31,855 | $ | 26,939 | ||||
Land and land under development | 318,327 | 267,348 | ||||||
Homes completed and under construction | 50,847 | 90,824 | ||||||
Model homes | 20,601 | 13,423 | ||||||
|
|
|
| |||||
Total | $ | 421,630 | $ | 398,534 | ||||
|
|
|
| |||||
Real estate inventories not owned: (1) | ||||||||
Other land options contracts — land banking arrangement | $ | 39,029 | $ | 47,408 | ||||
|
|
|
| |||||
| (1) | Represents the consolidation of a land banking arrangement which does not obligate the Company to purchase the lots, however, based on certain factors, the Company has determined it is economically compelled to purchase the lots in the land banking arrangement, which has been consolidated. Amounts are net of deposits. |
The Company accounts for its real estate inventories under FASB ASC 360Property, Plant, & Equipment(“ASC 360”).
ASC 360 requires impairment losses to be recorded on real estate inventories when indicators of impairment are present and the undiscounted cash flows estimated to be generated by real estate inventories are less than the carrying amount of such assets. Indicators of impairment include a decrease in demand for housing due to softening market conditions, competitive pricing pressures, which reduce the average sales price of homes including an increase in sales incentives offered to buyers, slowing sales absorption rates, decreases in home values in the markets in which the Company operates, significant decreases in gross margins and a decrease in project cash flows for a particular project.
For land, construction in progress, completed inventory, including model homes, and inventories not owned, the Company estimates expected cash flows at the project level by maintaining current budgets using recent
F-22
Table of Contents
WILLIAM LYON HOMES
NOTES TO CONSOLIDATED FINANCIAL STATEMENTS—(Continued)
historical information and current market assumptions. The Company updates project budgets and cash flows of each real estate project on a quarterly basis to determine whether the estimated remaining undiscounted future cash flows of the project are more or less than the carrying amount (net book value) of the asset. If the undiscounted cash flows are more than the net book value of the project, then there is no impairment. If the undiscounted cash flows are less than the net book value of the asset, then the asset is deemed to be impaired and is written-down to its fair value.
Fair value represents the amount at which an asset could be bought or sold in a current transaction between willing parties (i.e., other than a forced or liquidation sale). Management determines the estimated fair value of each project by determining the present value of estimated future cash flows at discount rates that are commensurate with the risk of each project and each domain, market or sub-market or may use recent appraisals if they more accurately reflect fair value. The estimation process involved in determining if assets have been impaired and in the determination of fair value is inherently uncertain because it requires estimates of future revenues and costs, as well as future events and conditions. Estimates of revenues and costs are supported by the Company’s budgeting process, and are based on recent sales in backlog, pricing required to get the desired pace of sales, pricing of competitive projects, incentives offered by competitors and current estimates of costs of development and construction or current appraisals.
The Company engaged a third-party valuation firm to assist with the analysis of the fair value of the entity, and respective assets and liabilities in connection with its reorganization. In conjunction with the valuation of all of the assets of the Company, the Company re-set value on certain land holdings in the early stages of development, based on: (i) “as-is” development stages of the property instead of a discounted cash flow approach, (ii) relative comparables on similar stage properties that had recently sold, on a per acre basis, and (iii) location of the property, among other factors. Since the valuation was completed near December 31, 2011, management used such valuation to evaluate the book value as of December 31, 2011.
Under the provisions of FASB ASC 360, the Company is required to make certain assumptions to estimate undiscounted future cash flows of a project, which include: (i) estimated sales prices, including sales incentives, (ii) anticipated sales absorption rates and sales volume, (iii) project costs incurred to date and the estimated future costs of the project based on the project budget, (iv) the carrying costs related to the time a project is actively selling until it closes the final unit in the project, and (v) alternative strategies including selling the land to a third-party or temporarily suspending development at the project. Each project has different assumptions and is based on management’s assessment of the current market conditions that exist in each project location. The Company’s assumptions include moderate absorption increases in certain projects beginning in 2013. In addition, the Company has assumed some moderate reduction in sales incentives in certain projects in certain markets beginning in 2013.
The assumptions and judgments used by the Company in the estimation process to determine the future undiscounted cash flows of a project and its fair value are inherently uncertain and require a substantial degree of judgment. The realization of the Company’s real estate inventories is dependent upon future uncertain events and market conditions. Due to the subjective nature of the estimates and assumptions used in determining the future cash flows of a project, actual results could differ materially from current estimates.
Management assesses land deposits for impairment when estimated land values are deemed to be less than the agreed upon contract price. The Company considers changes in market conditions, the timing of land purchases, the ability to renegotiate with land sellers, the terms of the land option contracts in question, the availability and best use of capital, and other factors. The Company records abandoned land deposits and related pre-acquisition costs in cost of sales-lots, land and other in the consolidated statements of operations in the period that it is abandoned.
F-23
Table of Contents
WILLIAM LYON HOMES
NOTES TO CONSOLIDATED FINANCIAL STATEMENTS—(Continued)
As of February 24, 2012, the Company made fair value adjustments to inventory in accordance with fresh start accounting. During the period from February 25, 2012 through December 31, 2012, the Company did not record any impairments.
During the year ended December 31, 2011, the Company recorded impairment loss on real estate assets of $128.3 million. The impairment loss related to land under development and homes completed and under construction recorded during the year ended December 31, 2011, resulted from (i) in certain projects, a decrease in home sales prices related to increased incentives and (ii) a decrease in sales absorption rates which increased the length of time of the project and increased period costs related to the project. The impairment loss related to land held for future development or sold incurred during the year ended December 31, 2011, resulted from the reduced value of the land in the project. The Company values land held for future development using, (i) projected cash flows with the strategy of selling the land, on a finished or unfinished basis, or building out the project, (ii) considering recent, legitimate offers received, (iii) prices for land in recent comparable sales transactions, and other factors. For three of the Company’s projects which are entitled land categorized as “land held for future development” in the table above, the Company engaged a third-party valuation firm to value the land of each project, on an as-is basis, using several factors including the existing land sale market and market comparables as a barometer for each project.
Note 8—Goodwill
Goodwill of $14.2 million at December 31, 2012 represents the excess of our enterprise value upon emergence over the fair value of our net tangible and identifiable intangible assets. The Company recordedgoodwill of $14.2 million as of February 24, 2012 in connection with fresh start accounting(refer to Notes 2, 3, and 4 for further details relating to fresh start accounting and valuation of goodwill).
Goodwill by operating segment as of December 31, 2012 and 2011 is as follows (in thousands):
| Successor | Predecessor | |||||||
| December 31, | ||||||||
| 2012 | 2011 | |||||||
Southern California | $ | 4,885 | $ | — | ||||
Northern California | 1,916 | — | ||||||
Arizona | 5,951 | — | ||||||
Nevada | 1,457 | — | ||||||
Colorado | — | — | ||||||
|
|
|
| |||||
Total goodwill | $ | 14,209 | $ | — | ||||
|
|
|
| |||||
F-24
Table of Contents
WILLIAM LYON HOMES
NOTES TO CONSOLIDATED FINANCIAL STATEMENTS—(Continued)
Note 9—Intangibles
The carrying value and accumulated amortization of intangible assets at December 31, 2012, by major intangible asset category, is as follows (in thousands):
| Successor | ||||||||||||
| December 31, 2012 | ||||||||||||
| Carrying Value | Accumulated Amortization | Net Carrying Amount | ||||||||||
Construction management contracts | $ | 4,640 | $ | (1,295 | ) | $ | 3,345 | |||||
Homes in backlog | 4,937 | (4,169 | ) | 768 | ||||||||
Joint venture management fee contracts | 800 | (293 | ) | 507 | ||||||||
|
|
|
|
|
| |||||||
Total intangibles | $ | 10,377 | $ | (5,757 | ) | $ | 4,620 | |||||
|
|
|
|
|
| |||||||
Amortization expense related to intangible assets for the period from February 25, 2012 through December 31, 2012 was $5.8 million. There was no amortization expense related to intangible assets for the period from January 1, 2012 through February 24, 2012 or prior, since intangible assets of $9.5 million were recorded in conjunction with ASC 852 and intangible assets of $0.9 million were recorded in conjunction with the purchase of Village Homes on December 7, 2012.
Estimated future amortization expense related to intangible assets is as follows (in thousands):
| Total | ||||
| Amortization | ||||
2013 | $ | 1,725 | ||
2014 | 1,244 | |||
2015 | 1,651 | |||
|
| |||
Total | $ | 4,620 | ||
|
| |||
The weighted average remaining useful life of intangible assets as of December 31, 2012 is 24 months.
F-25
Table of Contents
WILLIAM LYON HOMES
NOTES TO CONSOLIDATED FINANCIAL STATEMENTS—(Continued)
Note 10—Senior Notes and Secured Indebtedness
Notes payable consist of the following (in thousands):
| Successor | Predecessor | |||||||
| December 31, | ||||||||
| 2012 | 2011 | |||||||
Notes payable: | ||||||||
Notes payable | $ | 13,248 | $ | 74,009 | ||||
|
|
|
| |||||
Senior Notes: | ||||||||
8 1/2% Senior Notes due November 15, 2020 | 325,000 | — | ||||||
Senior Secured Term Loan due Janaury 31, 2015 | — | 206,000 | ||||||
7 5/8% Senior Notes due December 15, 2012 | — | 66,704 | ||||||
10 3/4% Senior Notes due April 1, 2013 | — | 138,912 | ||||||
7 1/2% Senior Notes due February 15, 2014 | — | 77,867 | ||||||
|
|
|
| |||||
Total Senior Notes | 325,000 | 489,483 | ||||||
|
|
|
| |||||
Total notes payable and Senior Notes | $ | 338,248 | $ | 563,492 | ||||
|
|
|
| |||||
The maturities of the Notes Payable and 8 ½ Senior Notes are as follows as of December 31, 2012 (in thousands):
Year Ended December 31, | ||||
2013 | $ | — | ||
2014 | — | |||
2015 | 13,248 | |||
2016 | — | |||
2017 | — | |||
Thereafter | 325,000 | |||
|
| |||
| $ | 338,248 | |||
|
| |||
8.5% Senior Notes Due 2020
On November 8, 2012, William Lyon Homes, Inc., a California corporation and wholly-owned subsidiary of the Company (“California Lyon”) completed its offering of 8.5% Senior Notes due 2020, or the New Notes, in an aggregate principal amount of $325 million. The New Notes were issued at 100% of their aggregate principal amount. The Company used the net proceeds from the sale of the New Notes, together with cash on hand, to refinance the Company’s (i) $235 million 10.25% Senior Secured Term Loan due 2015 (“Amended Term Loan”), (ii) approximately $76 million in aggregate principal amount of 12% Senior Subordinated Secured Notes due 2017 (“Old Notes”), (iii) approximately $11 million in principal amount of project related debt, and (iv) to pay accrued and unpaid interest thereon.
As of December 31, 2012, the outstanding principal amount of the New Notes is $325 million. The New Notes bear interest at an annual rate of 8.5% per annum and is payable semiannually in arrears on May 15 and November 15, commencing on May 15, 2013, and mature on November 15, 2020. The New Notes are senior unsecured obligations of California Lyon and are unconditionally guaranteed on a senior subordinated secured basis by Parent and by certain of Parent’s existing and future restricted subsidiaries. The New Notes and the guarantees rank senior to all of California Lyon’s and the guarantors’ existing and future unsecured senior debt and senior in right of payment to all of California Lyon’s and the guarantors’ future subordinated debt. The New
F-26
Table of Contents
WILLIAM LYON HOMES
NOTES TO CONSOLIDATED FINANCIAL STATEMENTS—(Continued)
Notes and the guarantees are and will be effectively junior to any of California Lyon’s and the guarantors’ existing and future secured debt.
On or after November 15, 2016, California Lyon may redeem all or a portion of the New Notes upon not less than 30 nor more than 60 days’ notice, at the redemption prices (expressed as percentages of the principal amount) set forth below plus accrued and unpaid interest to the applicable redemption date, if redeemed during the 12-month period beginning on November 15 of the years indicated below:
Year | Percentage | |||
2016 | 104.250 | % | ||
2017 | 102.125 | % | ||
2018 and thereafter | 100.000 | % | ||
Prior to November 15, 2016 the New Notes may be redeemed in whole or in part at a redemption price equal to 100% of the principal amount plus a “make-whole” premium, and accrued and unpaid interest to, the redemption date.
In addition, any time prior to November 15, 2015, California Lyon may, at its option on one or more occasions, redeem New Notes in an aggregate principal amount not to exceed 35% of the aggregate principal amount of the New Notes issued prior to such date at a redemption price (expressed as a percentage of principal amount) of 108.5%, plus accrued and unpaid interest to the redemption date, with an amount equal to the net cash proceeds from one or more equity offerings.
The indenture governing the New Notes (the “Indenture”) contains covenants that limit the ability of the Company and its restricted subsidiaries to, among other things: (i) incur or guarantee certain additional indebtedness; (ii) pay dividends or make other distributions or repurchase stock; (iii) make certain investments; (iv) sell assets; (v) incur liens; (vi) enter into agreements restricting the ability of the Company’s restricted subsidiaries to pay dividends or transfer assets; (vii) enter into transactions with affiliates; (viii) create unrestricted subsidiaries; and (viii) consolidate, merge or sell all or substantially all of the Company’s and California Lyon’s assets. These covenants are subject to a number of important exceptions and qualifications as described in the Indenture. The Company is in compliance with all such covenants as of December 31, 2012.
Amended Senior Secured Term Loan
Prior to completing its offering of the New Notes, California Lyon was a party to that certain Amended and Restated Senior Secured Term Loan Agreement (the “Amended Term Loan Agreement”), dated February 25, 2012. The Senior Secured Term Loan was renegotiated into the terms below in conjunction with the Plan of Reorganization as discussed in Notes 2, 3, and 4.
The Amended Term Loan Agreement provided for a first lien secured term loan of $235.0 million, secured by substantially all of the assets of California Lyon, Parent (excluding stock in California Lyon) and certain wholly-owned subsidiaries of Parent. The Amended Term Loan was guaranteed by Parent and certain wholly-owned subsidiaries of Parent.
The Amended Term Loan bore interest at a rate of 10.25% per annum. Prior to its repayment in conjunction with the New Notes offering, the Amended Term Loan was scheduled to mature on January 31, 2015. In addition, there was no pre-payment penalty associated with the Amended Term Loan.
F-27
Table of Contents
WILLIAM LYON HOMES
NOTES TO CONSOLIDATED FINANCIAL STATEMENTS—(Continued)
The Company recognized a loss of $1.9 million upon the early extinguishment of the Amended Term Loan related to unamortized debt issuance costs. The loss is included in (loss) gain on extinguishment of debt in the consolidated statement of operations for the period from February 25, 2012 through December 31, 2012.
Senior Secured Term Loan
Prior to the Plan of Reorganization, as discussed in Notes 2, 3, and 4, California Lyon was a party to a certain Senior Secured Term Loan Agreement (the “Term Loan Agreement”), dated October 20, 2009. As of December 31, 2011, the Term Loan outstanding balance was $206.0 million.
The Term Loan had interest at a rate of 14.0% and was scheduled to mature on October 20, 2014. However, California Lyon had also agreed that, upon any repayment of any portion of the principal amount under the Term Loan (whether or not at maturity), California Lyon would also pay an exit fee equal to the difference (if positive) between (x) the interest that would have been accrued and been then payable on the repaid portion if the interest rate under the Term Loan Agreement were 15.625% and (y) the internal rate of return realized by the Lenders on such repaid portion, taking into account all cash amounts actually received by the Lenders with respect thereto, including the loan fee and interest payments, other than any make whole payments described below.
Upon any prepayment of any portion of the Term Loan prior to its scheduled maturity (other than any prepayment required in connection with a payment of all or any portion of the outstanding principal balance of any of the indentures governing the Term Loan), the Term Loan Agreement provided that California Lyon make a “make whole payment” equal to an amount, if positive, of the present value of all future payments of interest which would become due with respect to such prepaid amount from the date of prepayment thereof through and including the maturity date, discounted at a rate of 14%.
The Company was in technical default of the term loan as of December 31, 2011, due to (a) expiration of the tangible net worth covenant waiver on October 27, 2011 and (b) a cross default under the senior notes indentures. The term loan was restructured into the Amended Term Loan as described above.
Senior Subordinated Secured Notes
Prior to completing its offering of New Notes as discussed above, pursuant to the terms of the Plan, on February 25, 2012, California Lyon issued $75.0 million principal amount of 12% Senior Subordinated Secured Notes, or the Old Notes, due February 25, 2017, in exchange for the claims held by the holders of the formerly outstanding Senior Notes of California Lyon. California Lyon received no net proceeds from this issuance.
Cash interest of 8% on the outstanding principal amount of the Old Notes was due in semi-annual installments in arrears on June 15 and December 15 of each year. The remaining interest of 4% on the outstanding principal amount of the Old Notes was payable in kind semi-annually in arrears by increasing the principal amount of the Old Notes.
The Old Notes were redeemable at the option of California Lyon at any time, in whole or in part, at a redemption price equal to 100% of the principal amount redeemed, plus accrued and unpaid interest, if any.
As described above, California Lyon used a portion of the proceeds from the sale of the New Notes to refinance the Old Notes. The Old Notes were paid off as of December 31, 2012. The Company recognized a loss of $0.3 million upon the early extinguishment of the Old Notes related to an early tender premium. The loss is included in (loss) gain on extinguishment of debt in the consolidated statement of operations for the period from February 25, 2012 through December 31, 2012.
F-28
Table of Contents
WILLIAM LYON HOMES
NOTES TO CONSOLIDATED FINANCIAL STATEMENTS—(Continued)
Senior Notes
On December 31, 2011, the Senior Notes had the following principal amounts outstanding (in thousands):
| December 31, 2011 | ||||
7 5/8% Senior Notes due December 15, 2012 | $ | 66,704 | ||
10 3/4% Senior Notes due April 1, 2013 | 138,912 | |||
7 1/2% Senior Notes due February 15, 2014 | 77,867 | |||
|
| |||
| $ | 283,483 | |||
|
| |||
7 5/8% Senior Notes
On November 22, 2004, California Lyon issued $150.0 million principal amount of the 7 5/8% Senior Notes. Of the initial $150.0 million, $66.7 million in aggregate principal amount remained outstanding as of December 31, 2011.
10 3/4% Senior Notes
On March 17, 2003, California Lyon issued $250.0 million of the 10 3/4% Senior Notes at a price of 98.493% to the public, resulting in net proceeds to the Company of approximately $246.2 million. The redemption price reflected a discount to yield 11% under the effective interest method, and the notes have been reflected net of the unamortized discount in the consolidated balance sheet. Of the initial $250.0 million, $138.9 million aggregate principal amount remained outstanding as of December 31, 2011.
10 3/4% Senior Notes Indenture Interest Payment Default
On October 31, 2011, California Lyon did not make the scheduled interest payment on the 10 3/4% Senior Notes within the 30-day grace period specified in the 103/4% Senior Notes Indenture, resulting in an event of default under the 10 3/4% Senior Notes Indenture, and a cross-default under the Term Loan Agreement. In the event that Holders of the 10 3/4% Senior Notes exercised their right to accelerate the 10 3/4% Senior Notes, a cross-default under the other prepetition indentures would have resulted. Since the Company was in negotiations with certain holders of the Senior Notes to reorganize and restructure the debt of the Company, the holders did not exercise their right to accelerate the 10 3/4% Senior Notes.
7 1/2% Senior Notes
On February 6, 2004, California Lyon issued $150.0 million principal amount of the 7 1/2% Senior Notes, resulting in net proceeds to the Company of approximately $147.6 million. Of the initial $150.0 million, $77.9 million aggregate principal amount remained outstanding as of December 31, 2011.
During the year ended December 31, 2010, the Company redeemed, in privately negotiated transactions, $37.3 million principal amount of its outstanding Senior Notes at a cost of $31.3 million, plus accrued interest. The net gain resulting from the redemptions, after giving effect to amortization of related deferred loan costs, was $5.6 million, and is included in (loss) gain on extinguishment of debt in the consolidated statement of operations for the year ended December 31, 2010.
F-29
Table of Contents
WILLIAM LYON HOMES
NOTES TO CONSOLIDATED FINANCIAL STATEMENTS—(Continued)
Notes Payable
Construction Notes Payable
In September 2012, the Company entered into two construction notes payable agreements. The first agreement has total availability under the facility of $19.0 million, to be drawn for land development and construction on one of its wholly-owned projects. The loan matures in September 2015 and bears interest at the Prime Rate + 1.0%, with a rate floor of 5.0%, which was the effective interest rate as of December 31, 2012. As of December 31, 2012, the Company had borrowed $7.8 million under this facility. The loan will be repaid with proceeds from home closings of the project and is secured by the underlying project. The second agreement has total availability under the facility of $17.0 million, to be drawn for land development and construction on one of its joint venture projects, which is consolidated in accordance with ASC 810 (See Note 5 for further discussion). The loan matures in March 2015 and bears interest at Prime + 1%, with a rate floor of 5.0%, which was the effective interest rate as of December 31, 2012. As of December 31, 2012, the Company had borrowed $5.4 million under this facility. The loan will be repaid with proceeds from home closings of the project and is secured by the underlying project.
At December 31, 2011, the Company had two construction notes payable totaling $16.0 million. One of the notes totaling $9.0 million matured in January 2012, with interest at rates based on either LIBOR or prime with an interest rate floor of 6.5%. However, in conjunction with the Plan, the construction note payable was renegotiated to mature January 2013 with an option to extend for one year to December 2013. Interest on the note was paid monthly at a rate based on LIBOR or prime, with a floor of 5.5%, and the principal was repaid ratably in quarterly installments, beginning March 31, 2012 and continuing through maturity. In November 2012, the construction note was paid in full with proceeds from the New Notes.
The other construction note had a remaining balance at December 31, 2011 of $7.0 million, and was not renegotiated in conjunction with the Plan. The note had a maturity date in May 2015 and required monthly interest payments at a fixed rate of 10.0%, with quarterly principal payments of $500,000. In November 2012, the construction note was paid in full with proceeds from the New Notes. The Company recognized a loss of $0.2 million upon the early extinguishment of the note related to the unamortized debt discount. The loss is included in (loss) gain on extinguishment of debt in the consolidated statement of operations for the period from February 25, 2012 through December 31, 2012.
Land Acquisition Note Payable
In October 2011, the Company secured an acquisition note payable in conjunction with the acquisition of a parcel of land in Northern California. The acquisition price of the land was $56.0 million, and the loan was for $55.0 million. The note was scheduled to mature in October 2012, and carried an interest rate of 1.5% per month, which was paid monthly on the loan. As part of the Company’s adoption of ASC 852, the loan was valued at $56.3 million as of February 24, 2012, the confirmation date of the plan. In May 2012, the Company sold the parcel of land and repaid the note in full recognizing a gain on extinguishment of debt of $1.0 million, net of amortization expense of $0.3 million. The gain is included in (loss) gain on extinguishment of debt in the consolidated statement of operations for the period from February 25, 2012 through December 31, 2012.
Seller Financing
At December 31, 2011, the Company had $3.0 million of notes payable outstanding related to a land acquisition for which seller financing was provided. The note bore interest at 7% and matured in March 2012. In March 2012, the seller note was paid in full.
F-30
Table of Contents
WILLIAM LYON HOMES
NOTES TO CONSOLIDATED FINANCIAL STATEMENTS—(Continued)
GUARANTOR AND NON-GUARANTOR FINANCIAL STATEMENTS
The following consolidating financial information includes:
(1) Consolidating balance sheets as of December 31, 2012 and 2011; consolidating statements of operations for the period from February 25, 2012 through December 31, 2012, the period from January 1, 2012 through February 24, 2012, and the years ended December 31, 2011 and 2010; and consolidating statements of cash flows for the period from February 25, 2012 through December 31, 2012, the period from January 1, 2012 through February 24, 2012, and the years ended December 31, 2011 and 2010, of (a) William Lyon Homes, as the parent, or “Delaware Lyon”, (b) William Lyon Homes, Inc., as the subsidiary issuer, or “California Lyon”, (c) the guarantor subsidiaries, (d) the non-guarantor subsidiaries and (e) William Lyon Homes, Inc. on a consolidated basis; and
(2) Elimination entries necessary to consolidate Delaware Lyon, with William Lyon Homes, Inc. and its guarantor and non-guarantor subsidiaries.
William Lyon Homes owns 100% of all of its guarantor subsidiaries and all guarantees are full and unconditional, joint and several. As a result, in accordance with Rule 3-10 (d) of Regulation S-X promulgated by the SEC, no separate financial statements are required for these subsidiaries as of December 31, 2012 and 2011, and for the period from February 25, 2012 through December 31, 2012, the period from January 1, 2012 through February 24, 2012, and the years ended December 31, 2011 and 2010.
F-31
Table of Contents
WILLIAM LYON HOMES
NOTES TO CONSOLIDATED FINANCIAL STATEMENTS—(Continued)
CONSOLIDATING BALANCE SHEET
December 31, 2012 (Successor)
(in thousands)
| Unconsolidated | ||||||||||||||||||||||||
| Delaware Lyon | California Lyon | Guarantor Subsidiaries | Non-Guarantor Subsidiaries | Eliminating Entries | Consolidated Company | |||||||||||||||||||
ASSETS | ||||||||||||||||||||||||
Cash and cash equivalents | $ | — | $ | 69,376 | $ | 65 | $ | 1,634 | $ | — | $ | 71,075 | ||||||||||||
Restricted cash | — | 853 | — | — | — | 853 | ||||||||||||||||||
Receivables | — | 11,278 | 296 | 3,215 | — | 14,789 | ||||||||||||||||||
Real estate inventories | ||||||||||||||||||||||||
Owned | — | 398,952 | 13 | 22,665 | — | 421,630 | ||||||||||||||||||
Not owned | — | 39,029 | — | — | — | 39,029 | ||||||||||||||||||
Deferred loan costs | — | 7,036 | — | — | — | 7,036 | ||||||||||||||||||
Goodwill | — | 14,209 | — | — | — | 14,209 | ||||||||||||||||||
Intangibles | — | 4,620 | — | — | — | 4,620 | ||||||||||||||||||
Other assets | — | 7,437 | 146 | 323 | — | 7,906 | ||||||||||||||||||
Investments in subsidiaries | 62,712 | 22,148 | — | — | (84,860 | ) | — | |||||||||||||||||
Intercompany receivables | — | — | 207,239 | 18,935 | (226,174 | ) | — | |||||||||||||||||
|
|
|
|
|
|
|
|
|
|
|
| |||||||||||||
Total assets | $ | 62,712 | $ | 574,938 | $ | 207,759 | $ | 46,772 | $ | (311,034 | ) | $ | 581,147 | |||||||||||
|
|
|
|
|
|
|
|
|
|
|
| |||||||||||||
LIABILITIES AND EQUITY (DEFICIT) | ||||||||||||||||||||||||
Accounts payable | $ | — | $ | 17,998 | $ | 39 | $ | 698 | $ | — | $ | 18,735 | ||||||||||||
Accrued expenses | — | 41,505 | 213 | 52 | — | 41,770 | ||||||||||||||||||
Liabilities from inventories not owned | — | 39,029 | — | — | — | 39,029 | ||||||||||||||||||
Notes payable | — | 7,809 | — | 5,439 | — | 13,248 | ||||||||||||||||||
8 1/2% Senior Notes | — | 325,000 | — | — | — | 325,000 | ||||||||||||||||||
Intercompany payables | — | 217,146 | — | 9,028 | (226,174 | ) | — | |||||||||||||||||
|
|
|
|
|
|
|
|
|
|
|
| |||||||||||||
Total liabilities | — | 648,487 | 252 | 15,217 | (226,174 | ) | 437,782 | |||||||||||||||||
|
|
|
|
|
|
|
|
|
|
|
| |||||||||||||
Redeemable convertible preferred stock | — | 71,246 | — | — | — | 71,246 | ||||||||||||||||||
Equity (deficit) | ||||||||||||||||||||||||
William Lyon Homes stockholders’ equity (deficit) | 62,712 | (144,795 | ) | 207,507 | 22,148 | (84,860 | ) | 62,712 | ||||||||||||||||
Noncontrolling interest | — | — | — | 9,407 | — | 9,407 | ||||||||||||||||||
|
|
|
|
|
|
|
|
|
|
|
| |||||||||||||
Total liabilities and equity (deficit) | $ | 62,712 | $ | 574,938 | $ | 207,759 | $ | 46,772 | $ | (311,034 | ) | $ | 581,147 | |||||||||||
|
|
|
|
|
|
|
|
|
|
|
| |||||||||||||
F-32
Table of Contents
WILLIAM LYON HOMES
NOTES TO CONSOLIDATED FINANCIAL STATEMENTS—(Continued)
CONSOLIDATING BALANCE SHEET
(DEBTOR-IN-POSSESSION)
December 31, 2011 (Predecessor)
(in thousands)
| Unconsolidated | ||||||||||||||||||||||||
| Delaware Lyon | California Lyon | Guarantor Subsidiaries | Non-Guarantor Subsidiaries | Eliminating Entries | Consolidated Company | |||||||||||||||||||
ASSETS | ||||||||||||||||||||||||
Cash and cash equivalents | $ | — | $ | 14,333 | $ | 47 | $ | 5,681 | $ | — | $ | 20,061 | ||||||||||||
Restricted cash | — | 852 | — | — | — | 852 | ||||||||||||||||||
Receivables | — | 9,897 | 310 | 3,525 | — | 13,732 | ||||||||||||||||||
Real estate inventories | ||||||||||||||||||||||||
Owned | — | 278,939 | — | 119,595 | — | 398,534 | ||||||||||||||||||
Not owned | — | 47,408 | — | — | — | 47,408 | ||||||||||||||||||
Deferred loan costs, net | — | 8,810 | — | — | — | 8,810 | ||||||||||||||||||
Other assets, net | — | 6,671 | 159 | 724 | — | 7,554 | ||||||||||||||||||
Investments in subsidiaries | (179,516 | ) | (85,714 | ) | — | — | 265,230 | — | ||||||||||||||||
Intercompany receivables | — | — | 203,517 | 12 | (203,529 | ) | — | |||||||||||||||||
|
|
|
|
|
|
|
|
|
|
|
| |||||||||||||
Total assets | $ | (179,516 | ) | $ | 281,196 | $ | 204,033 | $ | 129,537 | $ | 61,701 | $ | 496,951 | |||||||||||
|
|
|
|
|
|
|
|
|
|
|
| |||||||||||||
LIABILITIES AND (DEFICIT) EQUITY | ||||||||||||||||||||||||
Liabilities not subject to compromise | ||||||||||||||||||||||||
Accounts payable | $ | — | $ | 1,436 | $ | — | $ | — | $ | — | $ | 1,436 | ||||||||||||
Accrued expenses | — | 2,082 | — | — | — | 2,082 | ||||||||||||||||||
Liabilities from inventories not owned | — | 47,408 | — | — | — | 47,408 | ||||||||||||||||||
Notes payable | — | 3,010 | — | 70,999 | — | 74,009 | ||||||||||||||||||
Senior Secured Term Loan | — | 206,000 | — | — | — | 206,000 | ||||||||||||||||||
Intercompany payables | — | 71,459 | — | 132,070 | (203,529 | ) | — | |||||||||||||||||
|
|
|
|
|
|
|
|
|
|
|
| |||||||||||||
| — | 331,395 | — | �� | 203,069 | (203,529 | ) | 330,935 | |||||||||||||||||
Liabilities subject to compromise | ||||||||||||||||||||||||
Accounts payable | — | 2,560 | 38 | 1,348 | — | 3,946 | ||||||||||||||||||
Accrued expenses | — | 47,051 | 218 | 1,188 | — | 48,457 | ||||||||||||||||||
7 5/8% Senior Notes | — | 66,704 | — | — | — | 66,704 | ||||||||||||||||||
10 3/4% Senior Notes | — | 138,912 | — | — | — | 138,912 | ||||||||||||||||||
7 1/2% Senior Notes | — | 77,867 | — | — | — | 77,867 | ||||||||||||||||||
|
|
|
|
|
|
|
|
|
|
|
| |||||||||||||
| — | 333,094 | 256 | 2,536 | — | 335,886 | |||||||||||||||||||
|
|
|
|
|
|
|
|
|
|
|
| |||||||||||||
Total liabilities | — | 664,489 | 256 | 205,605 | (203,529 | ) | 666,821 | |||||||||||||||||
|
|
|
|
|
|
|
|
|
|
|
| |||||||||||||
(Deficit) equity | ||||||||||||||||||||||||
William Lyon Homes stockholders’ (deficit) equity | (179,516 | ) | (383,293 | ) | 203,777 | (85,714 | ) | 265,230 | (179,516 | ) | ||||||||||||||
Noncontrolling interest | — | — | — | 9,646 | — | 9,646 | ||||||||||||||||||
|
|
|
|
|
|
|
|
|
|
|
| |||||||||||||
Total liabilities and (deficit) equity | $ | (179,516 | ) | $ | 281,196 | $ | 204,033 | $ | 129,537 | $ | 61,701 | $ | 496,951 | |||||||||||
|
|
|
|
|
|
|
|
|
|
|
| |||||||||||||
F-33
Table of Contents
WILLIAM LYON HOMES
NOTES TO CONSOLIDATED FINANCIAL STATEMENTS—(Continued)
CONSOLIDATING STATEMENT OF OPERATIONS
Period from February 25, 2012 through
December 31, 2012 (Successor)
(in thousands)
| Unconsolidated | ||||||||||||||||||||||||
| Delaware Lyon | California Lyon | Guarantor Subsidiaries | Non-Guarantor Subsidiaries | Eliminating Entries | Consolidated Company | |||||||||||||||||||
Operating revenue | ||||||||||||||||||||||||
Sales | $ | — | $ | 198,108 | $ | 47,989 | $ | 102,838 | $ | — | $ | 348,935 | ||||||||||||
Construction services | — | 23,825 | — | — | — | 23,825 | ||||||||||||||||||
Management fees | — | 534 | — | — | (534 | ) | — | |||||||||||||||||
|
|
|
|
|
|
|
|
|
|
|
| |||||||||||||
| — | 222,467 | 47,989 | 102,838 | (534 | ) | 372,760 | ||||||||||||||||||
|
|
|
|
|
|
|
|
|
|
|
| |||||||||||||
Operating costs | ||||||||||||||||||||||||
Cost of sales | — | (163,083 | ) | (41,516 | ) | (93,924 | ) | 534 | (297,989 | ) | ||||||||||||||
Construction services | — | (21,416 | ) | — | — | — | (21,416 | ) | ||||||||||||||||
Sales and marketing | — | (10,705 | ) | (2,617 | ) | (606 | ) | — | (13,928 | ) | ||||||||||||||
General and administrative | — | (25,872 | ) | (221 | ) | (2 | ) | — | (26,095 | ) | ||||||||||||||
Amortization of intangible assets | — | (5,757 | ) | — | — | — | (5,757 | ) | ||||||||||||||||
Other | — | (3,027 | ) | (2 | ) | 120 | — | (2,909 | ) | |||||||||||||||
|
|
|
|
|
|
|
|
|
|
|
| |||||||||||||
| — | (229,860 | ) | (44,356 | ) | (94,412 | ) | 534 | (368,094 | ) | |||||||||||||||
|
|
|
|
|
|
|
|
|
|
|
| |||||||||||||
(Loss) income from subsidiaries | (8,859 | ) | 11,681 | — | — | (2,822 | ) | — | ||||||||||||||||
|
|
|
|
|
|
|
|
|
|
|
| |||||||||||||
Operating (loss) income | (8,859 | ) | 4,288 | 3,633 | 8,426 | (2,822 | ) | 4,666 | ||||||||||||||||
Loss on extinguishment of debt | — | (1,392 | ) | — | — | — | (1,392 | ) | ||||||||||||||||
Interest expense, net of amounts capitalized | — | (9,227 | ) | — | 100 | — | (9,127 | ) | ||||||||||||||||
Other income (expense), net | — | 618 | (61 | ) | 971 | — | 1,528 | |||||||||||||||||
|
|
|
|
|
|
|
|
|
|
|
| |||||||||||||
(Loss) income before reorganization items and provision for income taxes | (8,859 | ) | (5,713 | ) | 3,572 | 9,497 | (2,822 | ) | (4,325 | ) | ||||||||||||||
Reorganization items, net | — | (3,073 | ) | 1 | 547 | — | (2,525 | ) | ||||||||||||||||
|
|
|
|
|
|
|
|
|
|
|
| |||||||||||||
(Loss) income before provision for income taxes | (8,859 | ) | (8,786 | ) | 3,573 | 10,044 | (2,822 | ) | (6,850 | ) | ||||||||||||||
Provision for income taxes | — | (11 | ) | — | — | — | (11 | ) | ||||||||||||||||
|
|
|
|
|
|
|
|
|
|
|
| |||||||||||||
Net (loss) income | (8,859 | ) | (8,797 | ) | 3,573 | 10,044 | (2,822 | ) | (6,861 | ) | ||||||||||||||
Less: Net income attributable to noncontrolling interest | — | — | — | (1,998 | ) | — | (1,998 | ) | ||||||||||||||||
|
|
|
|
|
|
|
|
|
|
|
| |||||||||||||
Net (loss) income attributable to William Lyon Homes | (8,859 | ) | (8,797 | ) | 3,573 | 8,046 | (2,822 | ) | (8,859 | ) | ||||||||||||||
Preferred stock dividends | (2,743 | ) | — | — | — | — | (2,743 | ) | ||||||||||||||||
|
|
|
|
|
|
|
|
|
|
|
| |||||||||||||
Net (loss) income available to common stockholders | $ | (11,602 | ) | $ | (8,797 | ) | $ | 3,573 | $ | 8,046 | $ | (2,822 | ) | $ | (11,602 | ) | ||||||||
|
|
|
|
|
|
|
|
|
|
|
| |||||||||||||
F-34
Table of Contents
WILLIAM LYON HOMES
NOTES TO CONSOLIDATED FINANCIAL STATEMENTS—(Continued)
CONSOLIDATING STATEMENT OF OPERATIONS
Period from January 1, 2012 through
February 24, 2012 (Predecessor)
(in thousands)
| Unconsolidated | ||||||||||||||||||||||||
| Delaware Lyon | California Lyon | Guarantor Subsidiaries | Non-Guarantor Subsidiaries | Eliminating Entries | Consolidated Company | |||||||||||||||||||
Operating revenue | ||||||||||||||||||||||||
Home sales | $ | — | $ | 10,024 | $ | 4,316 | $ | 2,347 | $ | — | $ | 16,687 | ||||||||||||
Construction services | — | 8,883 | — | — | — | 8,883 | ||||||||||||||||||
Management fees | — | 110 | — | — | (110 | ) | — | |||||||||||||||||
|
|
|
|
|
|
|
|
|
|
|
| |||||||||||||
| — | 19,017 | 4,316 | 2,347 | (110 | ) | 25,570 | ||||||||||||||||||
|
|
|
|
|
|
|
|
|
|
|
| |||||||||||||
Operating costs | ||||||||||||||||||||||||
Cost of sales — homes | �� | — | (8,819 | ) | (3,820 | ) | (2,069 | ) | 110 | (14,598 | ) | |||||||||||||
Construction services | — | (8,223 | ) | — | — | — | (8,223 | ) | ||||||||||||||||
Sales and marketing | — | (1,496 | ) | (260 | ) | (188 | ) | — | (1,944 | ) | ||||||||||||||
General and administrative | — | (3,246 | ) | (56 | ) | — | — | (3,302 | ) | |||||||||||||||
Other | — | (16 | ) | — | (171 | ) | — | (187 | ) | |||||||||||||||
|
|
|
|
|
|
|
|
|
|
|
| |||||||||||||
| — | (21,800 | ) | (4,136 | ) | (2,428 | ) | 110 | (28,254 | ) | |||||||||||||||
|
|
|
|
|
|
|
|
|
|
|
| |||||||||||||
Income from subsidiaries | 228,383 | 11,536 | — | — | (239,919 | ) | — | |||||||||||||||||
|
|
|
|
|
|
|
|
|
|
|
| |||||||||||||
Operating income (loss) | 228,383 | 8,753 | 180 | (81 | ) | (239,919 | ) | (2,684 | ) | |||||||||||||||
Interest expense, net of amounts capitalized | — | (2,407 | ) | — | (100 | ) | — | (2,507 | ) | |||||||||||||||
Other income (expense), net | — | 266 | (25 | ) | (11 | ) | — | 230 | ||||||||||||||||
|
|
|
|
|
|
|
|
|
|
|
| |||||||||||||
Income (loss) before reorganization items and provision for income taxes | 228,383 | 6,612 | 155 | (192 | ) | (239,919 | ) | (4,961 | ) | |||||||||||||||
Reorganization items | — | 221,796 | (1 | ) | 11,663 | — | 233,458 | |||||||||||||||||
|
|
|
|
|
|
|
|
|
|
|
| |||||||||||||
Income before provision for income taxes | 228,383 | 228,408 | 154 | 11,471 | (239,919 | ) | 228,497 | |||||||||||||||||
Provision for income taxes | — | — | — | — | — | — | ||||||||||||||||||
|
|
|
|
|
|
|
|
|
|
|
| |||||||||||||
Net income | 228,383 | 228,408 | 154 | 11,471 | (239,919 | ) | 228,497 | |||||||||||||||||
Less: Net income attributable to noncontrolling interest | — | — | — | (114 | ) | — | (114 | ) | ||||||||||||||||
|
|
|
|
|
|
|
|
|
|
|
| |||||||||||||
Net income attributable to William Lyon Homes | $ | 228,383 | $ | 228,408 | $ | 154 | $ | 11,357 | $ | (239,919 | ) | $ | 228,383 | |||||||||||
|
|
|
|
|
|
|
|
|
|
|
| |||||||||||||
F-35
Table of Contents
WILLIAM LYON HOMES
NOTES TO CONSOLIDATED FINANCIAL STATEMENTS—(Continued)
CONSOLIDATING STATEMENT OF OPERATIONS
(DEBTOR-IN-POSSESSION)
Year Ended December 31, 2011 (Predecessor)
(in thousands)
| Unconsolidated | ||||||||||||||||||||||||
| Delaware Lyon | California Lyon | Guarantor Subsidiaries | Non-Guarantor Subsidiaries | Eliminating Entries | Consolidated Company | |||||||||||||||||||
Operating revenue | ||||||||||||||||||||||||
Home sales | $ | — | $ | 176,992 | $ | 19,954 | $ | 10,109 | $ | — | $ | 207,055 | ||||||||||||
Construction services | — | 19,768 | — | — | — | 19,768 | ||||||||||||||||||
Management fees | — | 468 | — | — | (468 | ) | — | |||||||||||||||||
|
|
|
|
|
|
|
|
|
|
|
| |||||||||||||
| — | 197,228 | 19,954 | 10,109 | (468 | ) | 226,823 | ||||||||||||||||||
|
|
|
|
|
|
|
|
|
|
|
| |||||||||||||
Operating costs | — | |||||||||||||||||||||||
Cost of sales | — | (162,148 | ) | (18,225 | ) | (8,818 | ) | 468 | (188,723 | ) | ||||||||||||||
Impairment loss on real estate assets | — | (70,742 | ) | — | (57,572 | ) | — | (128,314 | ) | |||||||||||||||
Construction services | — | (18,164 | ) | — | — | — | (18,164 | ) | ||||||||||||||||
Sales and marketing | — | (14,528 | ) | (1,318 | ) | (1,002 | ) | — | (16,848 | ) | ||||||||||||||
General and administrative | — | (22,070 | ) | (340 | ) | (1 | ) | — | (22,411 | ) | ||||||||||||||
Other | — | (2,979 | ) | — | (1,004 | ) | — | (3,983 | ) | |||||||||||||||
|
|
|
|
|
|
|
|
|
|
|
| |||||||||||||
| — | (290,631 | ) | (19,883 | ) | (68,397 | ) | 468 | (378,443 | ) | |||||||||||||||
|
|
|
|
|
|
|
|
|
|
|
| |||||||||||||
Equity in income of unconsolidated joint ventures | — | 3,605 | — | — | — | 3,605 | ||||||||||||||||||
Loss from subsidiaries | (193,330 | ) | (59,588 | ) | — | — | 252,918 | — | ||||||||||||||||
|
|
|
|
|
|
|
|
|
|
|
| |||||||||||||
Operating (loss) income | (193,330 | ) | (149,386 | ) | 71 | (58,288 | ) | 252,918 | (148,015 | ) | ||||||||||||||
Interest expense, net of amounts capitalized | — | (23,639 | ) | — | (890 | ) | — | (24,529 | ) | |||||||||||||||
Other income (expense), net | — | 1,018 | (131 | ) | (49 | ) | — | 838 | ||||||||||||||||
|
|
|
|
|
|
|
|
|
|
|
| |||||||||||||
Loss before reorganization items and provision for income taxes | (193,330 | ) | (172,007 | ) | (60 | ) | (59,227 | ) | 252,918 | (171,706 | ) | |||||||||||||
Reorganization items | — | (21,182 | ) | — | — | — | (21,182 | ) | ||||||||||||||||
|
|
|
|
|
|
|
|
|
|
|
| |||||||||||||
Loss before provision for income taxes | (193,330 | ) | (193,189 | ) | (60 | ) | (59,227 | ) | 252,918 | (192,888 | ) | |||||||||||||
Provision for income taxes | — | (10 | ) | — | — | — | (10 | ) | ||||||||||||||||
|
|
|
|
|
|
|
|
|
|
|
| |||||||||||||
Net loss | (193,330 | ) | (193,199 | ) | (60 | ) | (59,227 | ) | 252,918 | (192,898 | ) | |||||||||||||
Less: Net income attributable to noncontrolling interest | — | — | — | (432 | ) | — | (432 | ) | ||||||||||||||||
|
|
|
|
|
|
|
|
|
|
|
| |||||||||||||
Net loss attributable to William Lyon Homes | $ | (193,330 | ) | $ | (193,199 | ) | $ | (60 | ) | $ | (59,659 | ) | $ | 252,918 | $ | (193,330 | ) | |||||||
|
|
|
|
|
|
|
|
|
|
|
| |||||||||||||
F-36
Table of Contents
WILLIAM LYON HOMES
NOTES TO CONSOLIDATED FINANCIAL STATEMENTS—(Continued)
CONSOLIDATING STATEMENT OF OPERATIONS
Year Ended December 31, 2010 (Predecessor)
(in thousands)
| Unconsolidated | ||||||||||||||||||||||||
| Delaware Lyon | California Lyon | Guarantor Subsidiaries | Non-Guarantor Subsidiaries | Eliminating Entries | Consolidated Company | |||||||||||||||||||
Operating revenue | ||||||||||||||||||||||||
Sales | $ | — | $ | 263,864 | $ | 16,595 | $ | 3,610 | $ | — | $ | 284,069 | ||||||||||||
Construction services | — | 10,629 | — | — | — | 10,629 | ||||||||||||||||||
Management fees | — | 165 | — | — | (165 | ) | — | |||||||||||||||||
|
|
|
|
|
|
|
|
|
|
|
| |||||||||||||
| — | 274,658 | 16,595 | 3,610 | (165 | ) | 294,698 | ||||||||||||||||||
|
|
|
|
|
|
|
|
|
|
|
| |||||||||||||
Operating costs | ||||||||||||||||||||||||
Cost of sales | — | (228,542 | ) | (16,167 | ) | (1,633 | ) | 165 | (246,177 | ) | ||||||||||||||
Impairment loss on real estate assets | — | (111,860 | ) | — | — | — | (111,860 | ) | ||||||||||||||||
Construction services | — | (7,805 | ) | — | — | — | (7,805 | ) | ||||||||||||||||
Sales and marketing | — | (17,953 | ) | (1,208 | ) | (585 | ) | — | (19,746 | ) | ||||||||||||||
General and administrative | — | (24,795 | ) | (313 | ) | (21 | ) | — | (25,129 | ) | ||||||||||||||
Other | — | (2,740 | ) | — | — | — | (2,740 | ) | ||||||||||||||||
|
|
|
|
|
|
|
|
|
|
|
| |||||||||||||
| — | (393,695 | ) | (17,688 | ) | (2,239 | ) | 165 | (413,457 | ) | |||||||||||||||
|
|
|
|
|
|
|
|
|
|
|
| |||||||||||||
Equity in income of unconsolidated joint ventures | — | 916 | — | — | — | 916 | ||||||||||||||||||
(Loss) income from subsidiaries | (136,786 | ) | (1,053 | ) | 12 | — | 137,827 | — | ||||||||||||||||
|
|
|
|
|
|
|
|
|
|
|
| |||||||||||||
Operating (loss) income | (136,786 | ) | (119,174 | ) | (1,081 | ) | 1,371 | 137,827 | (117,843 | ) | ||||||||||||||
Gain on extinguishment of debt | — | 5,572 | — | — | — | 5,572 | ||||||||||||||||||
Interest expense, net of amounts capitalized | — | (23,653 | ) | — | — | — | (23,653 | ) | ||||||||||||||||
Other income (expense), net | — | 280 | (235 | ) | 12 | — | 57 | |||||||||||||||||
|
|
|
|
|
|
|
|
|
|
|
| |||||||||||||
(Loss) income before benefit from income taxes | (136,786 | ) | (136,975 | ) | (1,316 | ) | 1,383 | 137,827 | (135,867 | ) | ||||||||||||||
Benefit from income taxes | — | 412 | — | — | — | 412 | ||||||||||||||||||
|
|
|
|
|
|
|
|
|
|
|
| |||||||||||||
Net (loss) income | (136,786 | ) | (136,563 | ) | (1,316 | ) | 1,383 | 137,827 | (135,455 | ) | ||||||||||||||
Less: Net income attributable to noncontrolling interest | — | — | — | (1,331 | ) | — | (1,331 | ) | ||||||||||||||||
|
|
|
|
|
|
|
|
|
|
|
| |||||||||||||
Net (loss) income attributable to William Lyon Homes | $ | (136,786 | ) | $ | (136,563 | ) | $ | (1,316 | ) | $ | 52 | $ | 137,827 | $ | (136,786 | ) | ||||||||
|
|
|
|
|
|
|
|
|
|
|
| |||||||||||||
F-37
Table of Contents
WILLIAM LYON HOMES
NOTES TO CONSOLIDATED FINANCIAL STATEMENTS—(Continued)
CONSOLIDATING STATEMENT OF CASH FLOWS
Period from February 25, 2012 through
December 31, 2012 (Successor)
(in thousands)
| Unconsolidated | ||||||||||||||||||||||||
| Delaware Lyon | California Lyon | Guarantor Subsidiaries | Non-Guarantor Subsidiaries | Eliminating Entries | Consolidated Company | |||||||||||||||||||
Operating activities | ||||||||||||||||||||||||
Net cash (used in) provided by operating activities | $ | — | $ | (72,014 | ) | $ | 3,579 | $ | 118,428 | $ | — | $ | 49,993 | |||||||||||
|
|
|
|
|
|
|
|
|
|
|
| |||||||||||||
Investing activities | ||||||||||||||||||||||||
Cash paid for acquisitions, net | — | (33,201 | ) | — | — | — | (33,201 | ) | ||||||||||||||||
Purchases of property and equipment | — | (271 | ) | (20 | ) | (21 | ) | — | (312 | ) | ||||||||||||||
Investments in subsidiaries | — | (84,828 | ) | — | — | 84,828 | — | |||||||||||||||||
|
|
|
|
|
|
|
|
|
|
|
| |||||||||||||
Net cash used in investing activities | — | (118,300 | ) | (20 | ) | (21 | ) | 84,828 | (33,513 | ) | ||||||||||||||
|
|
|
|
|
|
|
|
|
|
|
| |||||||||||||
Financing activities | ||||||||||||||||||||||||
Proceeds from borrowings on notes payable | — | 7,809 | — | 5,439 | — | 13,248 | ||||||||||||||||||
Proceeds from issurance of 8 1/2% Senior Notes | — | 325,000 | — | — | — | 325,000 | ||||||||||||||||||
Principal payments on notes payable | — | (3,994 | ) | — | (69,682 | ) | — | (73,676 | ) | |||||||||||||||
Principal payments on Senior Secured Term Loan | — | (235,000 | ) | — | — | — | (235,000 | ) | ||||||||||||||||
Principal payments on Senior Subordinated Secured Notes | — | (75,916 | ) | — | — | — | (75,916 | ) | ||||||||||||||||
Proceeds from issuance of convertible preferred stock | — | 14,000 | — | — | — | 14,000 | ||||||||||||||||||
Proceeds from issuance of common stock | — | 16,000 | — | — | — | 16,000 | ||||||||||||||||||
Payment of deferred loan costs | — | (7,181 | ) | — | — | — | (7,181 | ) | ||||||||||||||||
Payment of preferred stock dividends | — | (1,721 | ) | — | — | — | (1,721 | ) | ||||||||||||||||
Noncontrolling interest contributions | — | — | — | 15,313 | — | 15,313 | ||||||||||||||||||
Noncontrolling interest distributions | — | — | — | (16,004 | ) | — | (16,004 | ) | ||||||||||||||||
Advances to affiliates | — | — | 3 | 78,817 | (78,820 | ) | — | |||||||||||||||||
Intercompany receivables/payables | — | 144,535 | (3,549 | ) | (134,978 | ) | (6,008 | ) | — | |||||||||||||||
|
|
|
|
|
|
|
|
|
|
|
| |||||||||||||
Net cash provided (used in) by financing activities | — | 183,532 | (3,546 | ) | (121,095 | ) | (84,828 | ) | (25,937 | ) | ||||||||||||||
|
|
|
|
|
|
|
|
|
|
|
| |||||||||||||
Net (decrease) increase in cash and cash equivalents | — | (6,782 | ) | 13 | (2,688 | ) | — | (9,457 | ) | |||||||||||||||
Cash and cash equivalents at beginning of period | — | 76,158 | 52 | 4,322 | — | 80,532 | ||||||||||||||||||
|
|
|
|
|
|
|
|
|
|
|
| |||||||||||||
Cash and cash equivalents at end of period | $ | — | $ | 69,376 | $ | 65 | $ | 1,634 | $ | — | $ | 71,075 | ||||||||||||
|
|
|
|
|
|
|
|
|
|
|
| |||||||||||||
F-38
Table of Contents
WILLIAM LYON HOMES
NOTES TO CONSOLIDATED FINANCIAL STATEMENTS—(Continued)
CONSOLIDATING STATEMENT OF CASH FLOWS
Period from January 1, 2012 through
February 24, 2012 (Predecessor)
(in thousands)
| Unconsolidated | ||||||||||||||||||||||||
| Delaware Lyon | California Lyon | Guarantor Subsidiaries | Non-Guarantor Subsidiaries | Eliminating Entries | Consolidated Company | |||||||||||||||||||
Operating activities | ||||||||||||||||||||||||
Net cash (used in) provided by operating activities | $ | — | $ | (13,638 | ) | $ | 181 | $ | (3,864 | ) | $ | — | $ | (17,321 | ) | |||||||||
|
|
|
|
|
|
|
|
|
|
|
| |||||||||||||
Investing activities | ||||||||||||||||||||||||
Purchases of property and equipment | — | (419 | ) | (3 | ) | 422 | — | — | ||||||||||||||||
Investments in subsidiaries | — | 183 | — | — | (183 | ) | — | |||||||||||||||||
|
|
|
|
|
|
|
|
|
|
|
| |||||||||||||
Net cash (used in) provided by investing activities | — | (236 | ) | (3 | ) | 422 | (183 | ) | — | |||||||||||||||
|
|
|
|
|
|
|
|
|
|
|
| |||||||||||||
Financing activities | ||||||||||||||||||||||||
Principal payments on notes payable | — | (116 | ) | — | (500 | ) | — | (616 | ) | |||||||||||||||
Proceeds from reorganization | — | 30,971 | — | — | — | 30,971 | ||||||||||||||||||
Proceeds from issuance of convertible preferred stock | — | 50,000 | — | — | — | 50,000 | ||||||||||||||||||
Proceeds from debtor in possession financing | — | 5,000 | — | — | — | 5,000 | ||||||||||||||||||
Principal payment of debtor in possession financing | — | (5,000 | ) | — | — | — | (5,000 | ) | ||||||||||||||||
Payment of deferred loan costs | — | (2,491 | ) | — | — | — | (2,491 | ) | ||||||||||||||||
Noncontrolling interest contributions | — | — | — | 1,825 | — | 1,825 | ||||||||||||||||||
Noncontrolling interest distributions | — | — | — | (1,897 | ) | — | (1,897 | ) | ||||||||||||||||
Advances to affiliates | — | — | — | (4 | ) | 4 | — | |||||||||||||||||
Intercompany receivables/payables | — | (2,665 | ) | (173 | ) | 2,659 | 179 | — | ||||||||||||||||
|
|
|
|
|
|
|
|
|
|
|
| |||||||||||||
Net cash provided by (used in) financing activities | — | 75,699 | (173 | ) | 2,083 | 183 | 77,792 | |||||||||||||||||
|
|
|
|
|
|
|
|
|
|
|
| |||||||||||||
Net increase (decrease) in cash and cash equivalents | — | 61,825 | 5 | (1,359 | ) | — | 60,471 | |||||||||||||||||
Cash and cash equivalents at beginning of period | — | 14,333 | 47 | 5,681 | — | 20,061 | ||||||||||||||||||
|
|
|
|
|
|
|
|
|
|
|
| |||||||||||||
Cash and cash equivalents at end of period | $ | — | $ | 76,158 | $ | 52 | $ | 4,322 | $ | — | $ | 80,532 | ||||||||||||
|
|
|
|
|
|
|
|
|
|
|
| |||||||||||||
F-39
Table of Contents
WILLIAM LYON HOMES
NOTES TO CONSOLIDATED FINANCIAL STATEMENTS—(Continued)
CONSOLIDATING STATEMENT OF CASH FLOWS
(DEBTOR-IN-POSSESSION)
Year Ended December, 2011 (Predecessor)
(in thousands)
| Unconsolidated | ||||||||||||||||||||||||
| Delaware Lyon | California Lyon | Guarantor Subsidiaries | Non-Guarantor Subsidiaries | Eliminating Entries | Consolidated Company | |||||||||||||||||||
Operating activities | ||||||||||||||||||||||||
Net cash provided by (used in) operating activities | $ | — | $ | 127,757 | $ | 87 | $ | (166,495 | ) | $ | — | $ | (38,651 | ) | ||||||||||
|
|
|
|
|
|
|
|
|
|
|
| |||||||||||||
Investing activities | ||||||||||||||||||||||||
Distributions from unconsolidated joint ventures | — | 1,435 | — | — | — | 1,435 | ||||||||||||||||||
Purchases of property and equipment | — | 725 | (131 | ) | (722 | ) | — | (128 | ) | |||||||||||||||
Investments in subsidiaries | — | 29,412 | — | — | (29,412 | ) | — | |||||||||||||||||
|
|
|
|
|
|
|
|
|
|
|
| |||||||||||||
Net cash provided by (used in) investing activities | — | 31,572 | (131 | ) | (722 | ) | (29,412 | ) | 1,307 | |||||||||||||||
|
|
|
|
|
|
|
|
|
|
|
| |||||||||||||
Financing activities | ||||||||||||||||||||||||
Principal payments on notes payable | — | (82,531 | ) | — | 70,999 | — | (11,532 | ) | ||||||||||||||||
Noncontrolling interest contributions | — | — | — | 6,605 | — | 6,605 | ||||||||||||||||||
Noncontrolling interest distributions | — | — | — | (8,954 | ) | — | (8,954 | ) | ||||||||||||||||
Advances to affiliates | — | — | (3 | ) | (29,341 | ) | 29,344 | — | ||||||||||||||||
Intercompany receivables/payables | — | (131,964 | ) | (37 | ) | 131,933 | 68 | — | ||||||||||||||||
|
|
|
|
|
|
|
|
|
|
|
| |||||||||||||
Net cash (used in) provided by financing activities | — | (214,495 | ) | (40 | ) | 171,242 | 29,412 | (13,881 | ) | |||||||||||||||
|
|
|
|
|
|
|
|
|
|
|
| |||||||||||||
Net (decrease) increase in cash and cash equivalents | — | (55,166 | ) | (84 | ) | 4,025 | — | (51,225 | ) | |||||||||||||||
Cash and cash equivalents at beginning of period | — | 69,499 | 131 | 1,656 | — | 71,286 | ||||||||||||||||||
|
|
|
|
|
|
|
|
|
|
|
| |||||||||||||
Cash and cash equivalents at end of period | $ | — | $ | 14,333 | $ | 47 | $ | 5,681 | $ | — | $ | 20,061 | ||||||||||||
|
|
|
|
|
|
|
|
|
|
|
| |||||||||||||
F-40
Table of Contents
WILLIAM LYON HOMES
NOTES TO CONSOLIDATED FINANCIAL STATEMENTS—(Continued)
CONSOLIDATING STATEMENT OF CASH FLOWS
Year Ended December 30, 2010 (Predecessor)
(in thousands)
| Unconsolidated | ||||||||||||||||||||||||
| Delaware Lyon | California Lyon | Guarantor Subsidiaries | Non-Guarantor Subsidiaries | Eliminating Entries | Consolidated Company | |||||||||||||||||||
Operating activities | ||||||||||||||||||||||||
Net cash provided by (used in) operating activities | $ | — | $ | 27,863 | $ | (1,245 | ) | $ | (2,499 | ) | $ | — | $ | 24,119 | ||||||||||
|
|
|
|
|
|
|
|
|
|
|
| |||||||||||||
Investing activities | ||||||||||||||||||||||||
Investment in and advances to unconsolidated joint ventures | — | (194 | ) | — | — | — | (194 | ) | ||||||||||||||||
Distributions from unconsolidated joint venture | — | 4,183 | — | — | — | 4,183 | ||||||||||||||||||
Purchases of property and equipment | — | 101 | (165 | ) | — | — | (64 | ) | ||||||||||||||||
Investments in subsidiaries | — | (361 | ) | 12 | — | 349 | — | |||||||||||||||||
|
|
|
|
|
|
|
|
|
|
|
| |||||||||||||
Net cash provided by (used in) investing activities | — | 3,729 | (153 | ) | — | 349 | 3,925 | |||||||||||||||||
|
|
|
|
|
|
|
|
|
|
|
| |||||||||||||
Financing activities | ||||||||||||||||||||||||
Proceeds from borrowings on notes payable | — | 7,087 | — | — | — | 7,087 | ||||||||||||||||||
Principal payments on notes payable | — | (52,797 | ) | — | — | — | (52,797 | ) | ||||||||||||||||
Net cash paid for repurchase of Senior Notes | — | (31,268 | ) | — | — | — | (31,268 | ) | ||||||||||||||||
Noncontrolling interest contributions | — | — | — | 6,546 | — | 6,546 | ||||||||||||||||||
Noncontrolling interest distributions | — | — | — | (3,913 | ) | — | (3,913 | ) | ||||||||||||||||
Advances to affiliates | — | — | (19 | ) | (744 | ) | 763 | — | ||||||||||||||||
Intercompany receivables/payables | — | (362 | ) | 1,437 | 37 | (1,112 | ) | — | ||||||||||||||||
|
|
|
|
|
|
|
|
|
|
|
| |||||||||||||
Net cash (used in) provided by financing activities | — | (77,340 | ) | 1,418 | 1,926 | (349 | ) | (74,345 | ) | |||||||||||||||
|
|
|
|
|
|
|
|
|
|
|
| |||||||||||||
Net (decrease) increase in cash and cash equivalents | — | (45,748 | ) | 20 | (573 | ) | — | (46,301 | ) | |||||||||||||||
Cash and cash equivalents at beginning of period | — | 115,247 | 111 | 2,229 | — | 117,587 | ||||||||||||||||||
|
|
|
|
|
|
|
|
|
|
|
| |||||||||||||
Cash and cash equivalents at end of period | $ | — | $ | 69,499 | $ | 131 | $ | 1,656 | $ | — | $ | 71,286 | ||||||||||||
|
|
|
|
|
|
|
|
|
|
|
| |||||||||||||
F-41
Table of Contents
WILLIAM LYON HOMES
NOTES TO CONSOLIDATED FINANCIAL STATEMENTS—(Continued)
Note 11—Fair Value of Financial Instruments
In accordance with FASB ASC Topic 820Fair Value Measurements and Disclosure, (“ASC 820”) the Company is required to disclose the estimated fair value of financial instruments. As of December 31, 2012 and 2011, the Company used the following assumptions to estimate the fair value of each type of financial instrument for which it is practicable to estimate:
| • | Notes Payable—The carrying amount is a reasonable estimate of fair value of the notes payable because the loans were entered into during the final quarter of the year and/or the outstanding balance at year end is expected to be repaid within one year; |
| • | 8 1/2 Senior Notes—The 8 1/2 Senior Notes are traded over the counter and their fair values were based upon quotes from industry sources; |
| • | Senior Secured Term Loan—The face amount of the term loan as of December 31, 2011 is $206.0 million. However, the renegotiated principal amount of the loan in accordance with the joint plan of reorganization is $235.0 million. Since the joint plan of reorganization was filed on December 19, 2011, the renegotiated amount of the term loan is a reasonable fair value as of December 31, 2011; and |
| • | Old Senior Notes Payable—The Senior Notes were traded over the counter and their fair values were based upon quotes from industry sources, as of December 31, 2011. |
The following table excludes cash and cash equivalents, restricted cash, receivables and accounts payable, which had fair values approximating their carrying amounts due to the short maturities and liquidity of these instruments. The estimated fair values of financial instruments are as follows (in thousands):
| Successor | Predecessor | |||||||||||||||||
| December 31, 2012 | December 31, 2011 | |||||||||||||||||
| Carrying | Fair | Carrying | Fair | |||||||||||||||
| Amount | Value | Amount | Value | |||||||||||||||
Financial liabilities: | ||||||||||||||||||
Notes payable | $ | 13,248 | $ | 13,248 | $ | 74,009 | $ | 74,009 | ||||||||||
8 1/2% Senior Notes due 2020 | $ | 325,000 | $ | 338,000 | $ | — | $ | — | ||||||||||
Senior Secured Term Loan due 2015 | $ | — | $ | — | $ | 206,000 | $ | 235,000 | ||||||||||
7 5/8% Senior Notes due 2012 | $ | — | $ | — | $ | 66,704 | $ | 20,469 | ||||||||||
10 3/4% Senior Notes due 2013 | $ | — | $ | — | $ | 138,912 | $ | 40,614 | ||||||||||
7 1/2% Senior Notes due 2014 | $ | — | $ | — | $ | 77,867 | $ | 21,742 | ||||||||||
ASC 820 establishes a framework for measuring fair value, expands disclosures regarding fair value measurements and defines fair value as the price that would be received to sell an asset or paid to transfer a liability in an orderly transaction between market participants at the measurement date. ASC 820 requires the Company to maximize the use of observable market inputs, minimize the use of unobservable market inputs and disclose in the form of an outlined hierarchy the details of such fair value measurements. The Company used Level 3 to measure the fair value of its Notes Payable, and Senior Secured Term Loan, and Level 2 to measure the fair value of its 81/2 Senior Notes and Old Senior Notes Payable. ASC 820 specifies a hierarchy of valuation techniques based on whether the inputs to a fair value measurement are considered to be observable or unobservable in a marketplace. The three levels of the hierarchy are as follows:
| • | Level 1—quoted prices for identical assets or liabilities in active markets; |
| • | Level 2—quoted prices for similar assets or liabilities in active markets; quoted prices for identical or similar assets or liabilities in markets that are not active; and model-derived valuations in which significant inputs and significant value drivers are observable in active markets; and |
F-42
Table of Contents
WILLIAM LYON HOMES
NOTES TO CONSOLIDATED FINANCIAL STATEMENTS—(Continued)
| • | Level 3—valuations derived from valuation techniques in which one or more significant inputs or significant value drivers are unobservable. |
The following table represents a reconciliation of the beginning and ending balance for the Company’s Level 3 fair value measurements:
| Senior | ||||||||
| Notes | Secured | |||||||
| Payable | Term Loan | |||||||
| (in thousands) | ||||||||
Fair Value at December 31, 2011 (Predecessor) | $ | 74,009 | $ | 235,000 | ||||
Change in balance related to plan of reorganization (1) | — | — | ||||||
Repayments of principal (2) | (74,009 | ) | (235,000 | ) | ||||
Borrowings of principal (3) | 13,248 | — | ||||||
Increase in value during the period | — | — | ||||||
|
|
|
| |||||
Fair Value at December 31, 2012 (Successor) | $ | 13,248 | $ | — | ||||
|
|
|
| |||||
| (1) | Change is representative of payoff of the loan for the value reported at December 31, 2011, and not the face amount of the notes that were eliminated in accordance with the joint plan of reorganization. |
| (2) | Represents the actual amount of principal repaid |
| (3) | Represents the actual amount of principal borrowed |
Non-financial Instruments
The Company adopted FASB ASC Topic 820 in 2008, however, disclosure of certain non-financial portions of the statement were deferred until the 2009 reporting period. These non-financial homebuilding assets are those assets for which the Company recorded valuation adjustments during 2011 on a nonrecurring basis. See Note 7, “Real Estate Inventories” for further discussion of the valuation of real estate inventories.
The following table summarizes the fair-value measurements of its non-financial assets for the year ended December 31, 2011:
| Fair Value Hierarchy | Fair Value at Measurement Date(1) | Impairment Charges for the Year Ended December 31, 2011(1) | ||||||||||
| (in thousands) | ||||||||||||
Land under development and homes completed and under construction(2) | Level 3 | $ | 94,751 | $ | 34,835 | |||||||
Inventory held for future development(3) | Level 3 | $ | 74,146 | $ | 93,479 | |||||||
| (1) | Amounts represent the aggregate fair values for communities where the Company recognized noncash inventory impairment charges during the year ended December 31, 2011. |
| (2) | In accordance with FASB ASC 360-10-35, inventory under this caption with a carrying value of $129.6 million was written down to its fair value of $94.8 million, resulting in total impairments of $34.8 million for the year ended December 31, 2011. |
| (3) | In accordance with FASB ASC 360-10-35, inventory under this caption with a carrying value of $167.6 million was written down to its fair value of $74.1 million, resulting in total impairments of $93.5 million for the year ended December 31, 2011. |
F-43
Table of Contents
WILLIAM LYON HOMES
NOTES TO CONSOLIDATED FINANCIAL STATEMENTS—(Continued)
Fair values determined to be Level 3 include the use of internal assumptions, estimates and financial forecasts. Valuations of these items are therefore sensitive to the assumptions used. Fair values represent the Company’s best estimates as of the measurement date, based on conditions existing and information available at the date of issuance of the consolidated financial statements. Subsequent changes in conditions or information available may change assumptions and estimates, as outlined in more detail within “Management’s Discussion and Analysis of Financial Condition and Results of Operations.” Fair values determined using Level 3 inputs, were primarily based on the estimated future cash flows discounted for inherent risk associated with each asset. These discounted cash flows are impacted by: the risk-free rate of return; expected risk premium based on estimated land development; construction and delivery timelines; market risk from potential future price erosion; cost uncertainty due to development or construction cost increases; and other risks specific to the asset or conditions in the market in which the asset is located at the time the assessment is made.
In addition, for the year ended December 31, 2011, the Company engaged a third-party valuation advisor to assess values of market comparables on land held for future development. These factors are specific to each community and may vary among communities.
Note 12—Related Party Transactions
For the period from January 1, 2012 through February 24, 2012, and the period from February 25, 2012 through December 31, 2012, the Company incurred reimbursable on-site labor costs of $27,000 and $276,000, respectively, and for the year ended December 31, 2011 and 2010, the Company incurred reimbursable on-site labor costs of $318,000 and $217,000, respectively, for providing customer service to real estate projects developed by entities controlled by William Lyon and William H. Lyon. At December 31, 2012 and December 31, 2011, $7,000 and $24,000, respectively, was due to the Company for reimbursable on-site labor costs, all of which was paid.
Effective April 1, 2011 upon approval by the Company’s board of directors at that time, the Company and an entity controlled by General William Lyon and William H. Lyon entered into a Human Resources and Payroll Services contract to provide that the affiliate will pay the Company a base monthly fee of $21,335 and a variable monthly fee equal to $23 multiplied by the number of active employees employed by such entity (which will initially result in a variable monthly fee of approximately $8,000). The amended contract also provides that the Company will be reimbursed by such affiliate for a pro rata share of any bonuses paid to the Company’s Human Resources staff (other than any bonus paid to the Vice President of Human Resources). The Company believes that the compensation being paid to it for the services provided to the affiliate is at a market rate of compensation, and that as a result of the fees that are paid to the Company under this contract, the overall cost to the Company of its Human Resources department will be reduced. The Company earned fees of $52,000 and $180,000, during the period from January 1, 2012 through February 24, 2012, and the period from February 25, 2012 through December 31, 2012, respectively, and fees of $362,000 and $426,000 during the year ended December 31, 2011 and 2010, respectively, related to this agreement. This contract expired on August 31, 2012 and was not renewed. Any future services provided to the affiliate will be on an as needed basis and will be paid for based on an hourly rate.
On September 3, 2009, Presley CMR, Inc., a California corporation (“Presley CMR”) and wholly owned subsidiary of California Lyon, entered into an Aircraft Purchase and Sale Agreement (“PSA”) with an affiliate of General William Lyon to sell an aircraft. The PSA provided for an aggregate purchase price for the Aircraft of $8.3 million, (which value was the appraised fair market value of the Aircraft), which consisted of: (i) cash in the amount of $2.1 million to be paid at closing and (ii) a promissory note from the affiliate in the amount of $6.2 million. The note is secured by the Aircraft. As part of the Company’s fresh start accounting, the note was adjusted to its fair value of $5.2 million. The discount on the fresh start adjustment is amortized over the
F-44
Table of Contents
WILLIAM LYON HOMES
NOTES TO CONSOLIDATED FINANCIAL STATEMENTS—(Continued)
remaining life of the note. The note requires semiannual interest payments to California Lyon of approximately $132,000. The note is due in September 2016.
For the period from January 1, 2012 through February 24, 2012, and the period from February 25, 2012 through December 31, 2012, the Company incurred charges of $118,000 and $668,000, respectively, and for the year ended December 31, 2011 and 2010, the Company incurred charges of $786,000 and $786,000, respectively, related to rent on its corporate office, from a trust of which William H. Lyon is the sole beneficiary. The current lease expires in March 2013 and the Company has decided to relocate its corporate office upon expiration of the lease. The Company has entered into a lease for the new location with an unrelated third party.
Note 13—Income Taxes
On December 19, 2011, the Parent and certain of its subsidiaries filed voluntary petitions under Chapter 11 of Title 11 of the United States Code in the U.S. Bankruptcy Court for the District of Delaware. On February 25, 2012, the group of companies emerged from the Chapter 11 bankruptcy proceedings.
The following summarizes the (provision) benefit from income taxes (in thousands):
| Successor | Predecessor | |||||||||||||||
| Period from February 25 through December 31, 2012 | Period from January 1 through February 24, 2012 | Year Ended December 31, | ||||||||||||||
| 2011 | 2010 | |||||||||||||||
Current | ||||||||||||||||
Interest on uncertain tax provisions | $ | — | $ | — | $ | — | $ | 75 | ||||||||
Federal | — | — | — | 347 | ||||||||||||
State | (11 | ) | — | (10 | ) | (10 | ) | |||||||||
|
|
|
|
|
|
|
| |||||||||
| $ | (11 | ) | $ | — | $ | (10 | ) | $ | 412 | |||||||
|
|
|
|
|
|
|
| |||||||||
F-45
Table of Contents
WILLIAM LYON HOMES
NOTES TO CONSOLIDATED FINANCIAL STATEMENTS—(Continued)
Income taxes differ from the amounts computed by applying the applicable federal statutory rates due to the following (in thousands):
| Successor | Predecessor | |||||||||||||||||
| Period from February 25 through December 31, 2012 | Period from January 1 through February 24, 2012 | Year Ended December 31, | ||||||||||||||||
| 2011 | 2010 | |||||||||||||||||
Benefit (provision) for federal income taxes at the statuatory rate | $ | 3,098 | $ | (79,935 | ) | $ | 67,662 | $ | 48,019 | |||||||||
Provision for state income taxes, net of federal income tax benefits | (7 | ) | — | (6 | ) | (6 | ) | |||||||||||
Valuation allowance | (2,195 | ) | (14,991 | ) | (66,265 | ) | (47,949 | ) | ||||||||||
Nondeductible items-reorganization costs | (709 | ) | 94,925 | (1,379 | ) | — | ||||||||||||
Nondeductible items-other | (194 | ) | (3 | ) | (22 | ) | — | |||||||||||
Other | (4 | ) | 4 | — | 348 | |||||||||||||
|
|
|
|
|
|
|
| |||||||||||
| $ | (11 | ) | $ | — | $ | (10 | ) | $ | 412 | |||||||||
|
|
|
|
|
|
|
| |||||||||||
Temporary differences giving rise to deferred income taxes consist of the following (in thousands):
| December 31, | ||||||||
| 2012 | 2011 | |||||||
Deferred tax assets | ||||||||
Impairment and other reserves | $ | 73,947 | $ | 102,216 | ||||
Compensation deductible for tax purposes when paid | 987 | 970 | ||||||
State income tax provisions deductible when paid for federal tax purposes | 4 | 3 | ||||||
Effect of book/tax differences for joint ventures | 1,002 | 1,563 | ||||||
Effect of book/tax differences for capitalized interest/general and administrative | — | 891 | ||||||
Other | 318 | 318 | ||||||
AMT credit carryover | 2,698 | 2,698 | ||||||
Unused recognized built-in loss | 16,349 | — | ||||||
Net operating loss | 113,314 | 99,586 | ||||||
Valuation allowance | (200,048 | ) | (202,322 | ) | ||||
|
|
|
| |||||
| 8,571 | 5,923 | |||||||
Deferred tax liabilities | ||||||||
Effect of book/tax differences for joint ventures | (5,597 | ) | (5,923 | ) | ||||
Effect of book/tax differences for capitalized interest/general and administrative | (2,974 | ) | — | |||||
|
|
|
| |||||
| (8,571 | ) | (5,923 | ) | |||||
|
|
|
| |||||
| $ | — | $ | — | |||||
|
|
|
| |||||
At December 31, 2012, the Company had gross federal and state net operating loss carryforwards totaling approximately $243.8 million and $508.3 million, respectively. Federal net operating loss carryforwards begin to expire in 2028 and state net operating loss carryforwards begin to expire in 2013. In addition, as of December 31, 2012, the Company had unused federal and state built-in losses of $42.1 million and $27.9 million, respectively, which expire in 2017.
F-46
Table of Contents
WILLIAM LYON HOMES
NOTES TO CONSOLIDATED FINANCIAL STATEMENTS—(Continued)
In connection with the Company’s emergence from the Chapter 11 bankruptcy proceedings, the Company experienced an “ownership change” as defined in Section 382 of the Internal Revenue Code, or the IRC, as of February 25, 2012. Section 382 of the IRC contains rules that limit the ability of a company that undergoes an “ownership change” to utilize its net operating loss carryforwards and certain built-in losses or deductions recognized during the five-year period after the ownership change. The Company is able to retain a portion of its U.S. federal and state net operating loss and tax credit carryforwards, or the “Tax Attributes”, in connection with the ownership change. However the IRC, Sections 382 and 383 provide an annual limitation with respect to the ability of a corporation to utilize its Tax Attributes against future U.S. taxable income in the event of a change in ownership. In the Company’s situation, the limitation under the IRC will generally be based on the value of the equity (for purposes of the applicable tax rules) on or immediately following the time of emergence. As a result, the Company’s future U.S. taxable income may not be fully offset by the Tax Attributes if such income exceeds the Company’s annual limitation, and the Company may incur a tax liability with respect to such income. In addition, subsequent changes in ownership for purposes of the IRC could further diminish the Company’s ability to utilize Tax Attributes.
In assessing the benefits of the deferred tax assets, management considers whether it is more likely than not that some portion or all of the deferred tax assets will not be realized. The ultimate realization of deferred tax assets is dependent upon the generation of future taxable income during the periods in which those temporary differences become deductible. Management considers taxable income in carry back years, the scheduled reversal of deferred tax liabilities, tax planning strategies and projected future taxable income in making this assessment. As of December 31, 2012, due to uncertainties surrounding the realization of the cumulative federal and state deferred tax assets, the Company has a full valuation allowance against the deferred tax assets. The valuation allowance for the years ended December 31, 2012, 2011 and 2010 was $200.0 million, $202.3 million and $125.8 million, respectively.
Effective January 1, 2007, the Company adopted the provisions of FASB Interpretation No. 48, “Accounting for Uncertainty in Income Taxes—an interpretation of FASB Statement No. 109” (“FIN 48”) which is now codified as FASB ASC 740, Income Taxes. FASB ASC 740 prescribes a recognition threshold and a measurement criteria for the financial statement recognition and measurement of tax positions taken or expected to be taken in a tax return. For those benefits to be recognized, a tax position must be considered more likely than not to be sustained upon examination by taxing authorities. The Company has taken positions in certain taxing jurisdictions for which it is more likely than not that previously unrecognized tax benefits will be recognized. The Company records interest and penalties related to uncertain tax positions as a component of the provision for income taxes. At January 1, 2008, and for the years ended December 31, 2008 through December 31, 2012, the Company has no unrecognized tax benefits.
In compliance with the Company’s election to recognize interest income (expense) and penalties related to uncertain tax positions in the income tax provision, $75,000 of interest income related to the income tax refund receivable, recorded under the provisions of FASB ASC 740, is included in the benefit from income taxes for the twelve months ended December 31, 2010.
The Company and its subsidiaries file income tax returns in the U.S. federal jurisdiction and various state jurisdictions. The Company is subject to U.S. federal income tax examination for calendar tax years ending 2009 through 2012. The Company is subject to various state income tax examinations for calendar tax years ending 2008 through 2012.
F-47
Table of Contents
WILLIAM LYON HOMES
NOTES TO CONSOLIDATED FINANCIAL STATEMENTS—(Continued)
Note 14—Business Combination
The Company acquired 100% of various entities which operate under the Village Homes brand (“Village Homes”) in the Denver metropolitan area, Fort Collins, and Granby, Colorado markets on December 7, 2012. The purchase price was $33.2 million in cash and the acquisition has been accounted for as a business combination in accordance with FASB ASC Topic 805,Business Combinations. Village Homes immediately began operating as a division of the Company, as its Colorado segment. The Village Homes brand was established in 1984 and has been a leading developer and builder of move-up homes, selling more than 10,000 homes in the Denver area over the past 25 years. The acquisition of Village Homes allowed the Company to expand into the Denver market, one of the largest and fastest growing housing markets in the United States, adding a fifth region while diversifying the Company’s existing portfolio. The acquisition eliminated lead-time and start-up costs of expanding into a new market, and provided a platform that can grow significantly without the need for additional general and administrative expenses.
The assets and liabilities acquired through the purchase of Village Homes were as follows (in thousands):
Real estate inventories owned | $ | 32,923 | ||
Other assets, net | 1,463 | |||
Intangibles | 907 | |||
Receivables | 70 | |||
Accounts payable | (1,029 | ) | ||
Accrued expenses | (1,133 | ) | ||
|
| |||
Cash paid for acquisitions, net | $ | 33,201 | ||
|
|
In connection with the acquisition of Village Homes, the Company incurred acquisition related expenses of $0.2 million which are included in general and administrative expense in the consolidated statement of operations for the period from February 25, 2012 through December 31, 2012.
Since acquisition, Village Homes contributed $5.4 million in home sales revenue and $0.01 million in net income which is included in the consolidated statement of operations for the period from February 25, 2012 through December 31, 2012.
For the period from February 25, 2012 through December 31, 2012, period from January 1, 2012 through February 24, 2012, and the year ended December 31, 2011, the below unaudited pro forma information has been prepared to give effect to the Village Homes acquisition as if it occurred on January 1, 2011 (in thousands except number of shares and per share data):
| (unaudited) | ||||||||||||||
| Successor | Predecessor | |||||||||||||
| Period from February 25 through December 31, 2012 |
| Period from January 1 through February 24, 2012 | Year Ended December 31, 2011 | |||||||||||
Revenue | $ | 405,635 | $ | 28,521 | $ | 261,933 | ||||||||
Net (loss) income available to common stockholders | $ | (9,617 | ) | $ | 228,074 | $ | (189,457 | ) | ||||||
(Loss) income per common share, basic and diluted | $ | (0.09 | ) | $ | 228,074 | $ | (189,457 | ) | ||||||
Weighted average common shares outstanding, basic and diluted | 103,037,842 | 1,000 | 1,000 | |||||||||||
F-48
Table of Contents
WILLIAM LYON HOMES
NOTES TO CONSOLIDATED FINANCIAL STATEMENTS—(Continued)
The pro forma results are not necessarily indicative of the operating results that would have been obtained had the acquisitions occurred at the beginning of the periods presented, nor are they necessarily indicative of future operating results.
Note 15—(Loss) Income Per Common Share
Basic and diluted (loss) income per common share for the period from February 25, 2012 through December 31, 2012, the period from January 1, 2012 through February 24, 2012 and the year ended December 31, 2011 and 2010 were calculated as follows (in thousands, except number of shares and per share amounts):
| Successor | Predecessor | |||||||||||||||||
| Period from February 25 through December 31, 2012 | Period from January 1 through February 24, 2012 | Year Ended December 31, | ||||||||||||||||
| 2011 | 2010 | |||||||||||||||||
Basic weighted average number of shares outstanding | 103,037,842 | 1,000 | 1,000 | 1,000 | ||||||||||||||
Effect of dilutive securities: | ||||||||||||||||||
Preferred shares, stock options, and warrants (1) | — | N/A | N/A | N/A | ||||||||||||||
|
|
|
|
|
|
|
| |||||||||||
Diluted average shares outstanding | 103,037,842 | 1,000 | 1,000 | 1,000 | ||||||||||||||
Net (loss) income available to common stockholders | $ | (11,602 | ) | $ | 228,383 | $ | (193,330 | ) | $ | (136,786 | ) | |||||||
|
|
|
|
|
|
|
| |||||||||||
Basic (loss) income per common share | $ | (0.11 | ) | $ | 228,383 | $ | (193,330 | ) | $ | (136,786 | ) | |||||||
Dilutive (loss) income per common share | $ | (0.11 | ) | $ | 228,383 | $ | (193,330 | ) | $ | (136,786 | ) | |||||||
Antidilutive securities not included in the calculation of diluted (loss) income per common share (weighted average): | ||||||||||||||||||
Preferred shares | 68,002,529 | N/A | N/A | N/A | ||||||||||||||
Vested stock options | 3,171,535 | N/A | N/A | N/A | ||||||||||||||
Unvested stock options | 1,585,767 | N/A | N/A | N/A | ||||||||||||||
Warrants | 15,737,294 | N/A | N/A | N/A | ||||||||||||||
| (1) | For periods with a net loss, all potentially dilutive shares related to the preferred shares, options to acquire common stock, and warrants were excluded from the diluted loss per common share calculations because the effect of their inclusion would be antidilutive, or would decrease the reported loss per common share. |
Note 16—Redeemable Convertible Preferred Stock
As of December 31, 2012, there were 77,005,744 shares of Convertible Preferred Stock, $0.01 par value per share, or the Convertible Preferred Stock, outstanding, of which 64,831,831 shares were issued in accordance with our plan of reorganization, in exchange for aggregate cash consideration of $50.0 million. In conjunction with the application of fresh start accounting, the fair value of the Convertible Preferred Stock was $56.4 million upon emergence.
On October 12, 2012, the Company entered into a Subscription Agreement between the Company and WLH Recovery Acquisition LLC, a Delaware limited liability company and investment vehicle managed by affiliates of Paulson & Co. Inc. (“Paulson”), pursuant to which, the Company issued to Paulson (i) 15,238,095 shares of Class A Common Stock, for $16.0 million in cash and (ii) 12,173,913 shares of the Company’s Convertible Preferred Stock, for $14.0 million in cash, for an aggregate purchase price of $30.0 million.
F-49
Table of Contents
WILLIAM LYON HOMES
NOTES TO CONSOLIDATED FINANCIAL STATEMENTS—(Continued)
Our Second Amended and Restated Certificate of Incorporation (the “Charter”) authorizes the issuance of up to 80,000,000 shares of redeemable convertible preferred stock, in one or more series and with such rights, preferences, privileges and restrictions, including voting rights, redemption provisions (including sinking fund provisions), dividend rights, dividend rates, liquidation rates, liquidation preferences and conversion rights, as our board of directors may determine without further action by the holders of common stock.
Holders of our Convertible Preferred Stock are entitled to receive cumulative dividends at a rate of 6% per annum consisting of (i) cash dividends at the rate of 4% paid quarterly in arrears, and (ii) accreting dividends accruing at the rate of 2% per annum (the “Convertible Preferred Dividends”). During the period from February 25, 2012 through December 31, 2012, the company recorded preferred stock dividends of $2.7 million. During the period from February 25, 2012 through December 31, 2012, $1.7 million was paid in cash and $0.9 million of accreting dividends are included in Convertible Preferred Stock as of December 31, 2012.
In the event that the Corporation declares or pays any dividends upon any Common Stock (whether payable in cash, securities, other property or otherwise), the Corporation shall also declare and pay to the holders of the Convertible Preferred Stock at the same time that it declares and pays such dividends to the holders of such Common Stock the dividends declared and paid with respect to such Common Stock as if all of the outstanding Convertible Preferred Stock had been converted into such Common Stock immediately prior to the record date for such dividend, or if no record date is fixed, the date as of which the record holders of such Common Stock entitled to such dividends are to be determined.
Upon the occurrence of the Conversion Date (as defined in the Charter), each share of Convertible Preferred Stock will automatically convert into such number of fully paid and non-assessable shares of Class A Common Stock as is determined by dividing the Convertible Preferred Original Issue Price (as defined in the Charter) by the then applicable Convertible Preferred Conversion Price (as defined in the Charter). In connection with any such conversion, the Company will also pay (i) any accrued but unpaid Convertible Preferred Dividends on any shares of Convertible Preferred Stock being converted (including, without limitation, any accreting dividends not previously paid), which amounts will be paid in cash out of funds legally available therefore if such payment would not violate any covenants imposed by agreements entered into in good faith governing the indebtedness of the Company and its subsidiaries, or, to the extent not so permitted or so available, in shares of Class A Common Stock, based on the fair market value of such common stock at such time, and (ii) in cash, the value of any fractional share of Class A Common Stock otherwise issuable to any such Convertible Preferred Stockholder.
To the extent not previously converted to common stock, the Company will redeem all the outstanding shares of Convertible Preferred Stock on the fifteenth anniversary of the date of first issuance at a price per share payable in cash and equal to the Convertible Preferred Original Issue Price plus accrued and unpaid Convertible Preferred Dividends in respect thereof.
The Company initially recorded the redeemable convertible preferred stock at its fair value based on the option pricing model stated above in Note 3. Since the initial measurement and recording of the redeemable convertible preferred stock is greater than its redemption value, the Company would assess the probability of redemption at each reporting date. As of December 31, 2012, the preferred stock is not currently redeemable and ultimate redemption is not currently probable, since the redemption would only occur if the preferred stock is still outstanding in 15 years. In addition, the preferred stock will likely convert to common shares prior to that date. At such time that redemption was deemed probable, the Company would adjust the carrying value to its redemption value with the offsetting adjustment to additional paid in capital. Further, upon a conversion of the preferred into common shares, the carrying value of the preferred stock would be reclassified to common stock and additional paid in capital on that date. The redemption value of the redeemable convertible preferred stock as of December 31, 2012 was $64.0 million, excluding the accreted dividends of $0.9 million.
F-50
Table of Contents
WILLIAM LYON HOMES
NOTES TO CONSOLIDATED FINANCIAL STATEMENTS—(Continued)
Note 17—Equity
Common Stock
As of December 31, 2012, we had 120,105,557 shares of common stock outstanding. In conjunction with the Plan as discussed in Notes 2, 3 and 4, the Company issued the following shares of common stock: (i) 44,793,255 shares of Class A, $0.01 par value per share, in exchange for old senior notes claims, as described above, (ii) 31,464,548 shares of Class B, $0.01 par value per share, in exchange for aggregate consideration of $25 million, and a warrant to purchase 15,737,294 shares of Class B Common Stock, at $2.07 per share, (iii) 12,966,366 shares of Class C, $0.01 par value per share, in exchange for cash consideration of $10.0 million, and (iv) the issuance of an additional 3,144,000 shares of Class C Common Stock to Luxor Capital Group LP as a transaction fee in consideration for providing the backstop commitment of the offering of Class C shares and shares of Convertible Preferred Stock in connection with the Plan. In December 2012, an affiliate of Luxor Capital Group LP elected to convert 90,028 shares of its Class C Common Stock into 90,028 shares of Class A Common Stock.
On June 28, 2012, the Company consummated the purchase of certain real property (comprising of approximately 165 acres) in San Diego County, California; San Bernardino County, California; Maricopa County, Arizona; and Clark County, Nevada, representing seven separate residential for sale developments, comprising of over 1,000 lots. The aggregate purchase price of the property was $21.5 million. The Company paid $11.0 million cash, and issued 10,000,000 shares of Class A Common Stock, to investment vehicles managed by affiliates of Colony Capital, LLC as consideration for the property.
On October 1, 2012, the Company approved the grant of an aggregate of 3,120,000 restricted shares of Class D common stock of the Company, and an aggregate of 4,757,302 options to purchase shares of Class D common stock of the Company, of which 1,115,302 represent “five-year” options and 3,642,000 represent “ten-year” options to certain officers of California Lyon. In addition, the Company granted 256,500 shares of Restricted Stock to its non-employee directors, which were fully vested on the date of grant.
On October 12, 2012, the Company entered into a Subscription Agreement between the Company and WLH Recovery Acquisition LLC, a Delaware limited liability company and investment vehicle managed by affiliates of Paulson & Co. Inc. (“Paulson”), pursuant to which, the Company issued to Paulson (i) 15,238,095 shares of Class A Common Stock, for $16.0 million in cash and (ii) 12,173,913 shares of the Company’s Convertible Preferred Stock, for $14.0 million in cash, for an aggregate purchase price of $30.0 million.
Upon the occurrence of the Conversion Date, each share of Class C Common Stock will automatically convert into one share of Class A Common Stock, and each share of Class B Common Stock will automatically convert into one share of Class A Common Stock, if a majority of the shares of Class B Common Stock then outstanding vote in favor of such conversion. If, at any time (whether before, on or after the Conversion Date),
any share of Class B Common Stock is not owned, beneficially or of record, by either General William Lyon or William H. Lyon, their sibling, spouses and lineal descendants, any entities wholly owned by one or more of the foregoing persons, or any trusts or other estate planning vehicles for the benefit of any of the foregoing, then such share of Class B Common Stock will automatically convert into one share of Class A Common Stock.
All of our outstanding shares of common stock have been validly issued and fully paid and are non-assessable. The rights of the holders of common stock will be subject to, and may be adversely affected by, the rights of the holders of preferred stock. Holders of our common stock have no preference, exchange, sinking fund, redemption or appraisal rights and have no preemptive rights to subscribe for any of our securities.
With the exception of the dividends to be paid out to holders of our Convertible Preferred Stock, the Company does not intend to declare or pay cash dividends in the foreseeable future. Any determination to pay
F-51
Table of Contents
WILLIAM LYON HOMES
NOTES TO CONSOLIDATED FINANCIAL STATEMENTS—(Continued)
dividends to holders of our common stock will be at the discretion of our board of directors. The payment of cash dividends is restricted under the terms of our Amended and Restated Senior Secured Term Loan Agreement and the indenture governing the Notes.
In conjunction with the adoption of fresh start accounting, the Company allocated the fair market value of the common stock of $43.1 million as of February 24, 2012.
Warrants
The holders of Class B Common Stock hold warrants to purchase 15,737,294 shares of Class B Common Stock at an exercise price of $2.07 per share. The expiration date of the Class B Warrants is February 24, 2017. The Warrants were assigned a value of $1.0 million in conjunction with the adoption of fresh start accounting and are recorded in additional paid-in capital.
Note 18—Stock Based Compensation
In 2012, the Company adopted the William Lyon Homes 2012 Equity Incentive Plan (the “Plan”). The Plan was approved by the Board of Directors and the Company’s stockholders, and is administered by the Compensation Committee of the Board. The provisions of the Plan allow for a variety of stock-based compensation awards, including stock options, stock appreciation rights, or SARs, restricted stock awards, restricted stock unit awards, deferred stock awards, deferred stock unit awards, dividend equivalent awards, stock payment awards and performance awards and other stock-based awards, to certain executives, directors, and non-executives of California Lyon. The Company believes that such awards provide a means of compensation to attract and retain qualified employees and better align the interests of our employees with those of our stockholders. Option awards are granted with an exercise price equal to the market price at the date of grant.
Under the plan, 13,699,565 shares of the Company’s Class D common stock have been reserved for issuance. In 2012, the Company granted an aggregate of 2,499,293 restricted shares of Class D common stock of the Company, and an aggregate of 4,757,302 stock options to purchase shares of Class D common stock of the Company, of which 1,115,302 represent “five-year” options and 3,642,000 represent “ten-year” options.
The five-year options are subject to mandatory exercise upon the earlier of an initial public offering (“IPO”) of the Company, or five years, provided, that if the IPO occurs prior to the applicable vesting date of the options, such options will be exercised upon the applicable vesting date. The five-year options and ten-year options will be incentive stock options to the maximum extent permitted by law. Each of the restricted stock and option awards vests as follows: 50% of the shares and options vested on October 1, 2012, the date of grant, with the remaining 50% of the shares and options vesting in three equal installments on each of December 31, 2012, 2013 and 2014, subject to the recipient’s continued employment through the applicable vesting date and accelerated vesting as set forth in the applicable award agreement. In addition, the Company granted 256,500 shares of Restricted Stock to its non-employee directors, which were fully vested on the date of grant.
The Company uses the fair value method of accounting for stock options granted to employees which requires us to measure the cost of employee services received in exchange for the stock options, based on the grant date fair value of the award. The fair value of the awards is estimated using the Black-Scholes option-pricing model. The resulting cost is recognized on a straight line basis over the period during which an employee is required to provide service in exchange for the award, usually the vesting period.
F-52
Table of Contents
WILLIAM LYON HOMES
NOTES TO CONSOLIDATED FINANCIAL STATEMENTS—(Continued)
The fair value of each employee option awarded was estimated on the grant date using the Black-Scholes option-pricing model with the following weighted-average assumptions.
| Period from February 25, 2012 through December 31, | ||||||||
| 2012 | 2011 | 2010 | ||||||
Expected dividend yield | 0 | % | N/A | N/A | ||||
Risk-free interest rate | 0.55 | % | N/A | N/A | ||||
Expected volatility | 79 | % | N/A | N/A | ||||
Expected life (in years) | 4.73 | N/A | N/A | |||||
The Black-Scholes option-pricing model requires inputs such as the risk-free interest rate, expected term and expected volatility. Further, the forfeiture rate also affects the amount of aggregate compensation. These inputs are subjective and generally require significant judgment.
The risk-free interest rate that we use is based on the United States Treasury yield in effect at the time of grant for zero coupon United States Treasury notes with maturities approximating each grant’s expected life. Given our limited history with employee grants, we use the “simplified” method in estimating the expected term for our employee grants. The “simplified” method is calculated as the average of the time-to-vesting and the contractual life of the options. Our expected volatility is derived from the historical volatilities of several unrelated public companies within the homebuilding industry, because we have no trading history on our common stock. When making the selections of our peer companies within the homebuilding industry to be used in the volatility calculation, we also considered the stage of development, size and financial leverage of potential comparable companies. We estimate our forfeiture rate based on an analysis of our actual forfeitures, of which we had none, and will continue to evaluate the appropriateness of the forfeiture rate based on actual forfeiture experience, analysis of employee turnover behavior and other factors.
Summary of Stock Option Activity
Stock option activity under the Plan at December 31, 2012 and changes during the period from February 25, 2012 through December 31, 2012 were as follows (there is no activity in prior periods as the options were granted in the fourth quarter of 2012):
| Period from February 25, 2012 through December 31, 2012 | ||||||||||||||||
| Options | Weighted Average Exercise Price | Weighted Average Remaining Contractual Life (in years) | Aggregate Intrinsic Value | |||||||||||||
Options outstanding at beginning of year | — | N/A | N/A | N/A | ||||||||||||
Granted (1) | 4,757,302 | $ | 1.05 | 4.48 | $ | — | ||||||||||
Exercised | — | N/A | N/A | N/A | ||||||||||||
Cancelled | — | N/A | N/A | N/A | ||||||||||||
Options outstanding at end of year | 4,757,302 | $ | 1.05 | 4.48 | $ | — | ||||||||||
Options vested and expected to vest | 4,757,302 | $ | 1.05 | 4.48 | $ | — | ||||||||||
Options exercisable at end of year (2) | 3,171,535 | $ | 1.05 | 4.48 | $ | — | ||||||||||
Price range of options exercised | N/A | |||||||||||||||
Price range of options outstanding | $ | 1.05 | ||||||||||||||
Total shares available for future grants at end of year | 6,442,970 | |||||||||||||||
F-53
Table of Contents
WILLIAM LYON HOMES
NOTES TO CONSOLIDATED FINANCIAL STATEMENTS—(Continued)
| (1) | The weighted average grant date fair value of the stock options was $0.64. |
| (2) | The fair value of shares vested during the period from February 25, 2012 through December 31, 2012 was $2.0 million. |
The following table summarizes information associated with stock options granted to executives, directors, and non-executives that are vested and expected to vest in future reporting periods:
| Period from February 25, 2012 through December 31, 2012 | ||||||||||||||||
| Number of Shares | Weighted Average Exercise Price | Weighted Average Remaining Contractual Life (in years) | Aggregate Intrinsic Value | |||||||||||||
Executives | 4,467,892 | $ | 1.05 | |||||||||||||
Directors | — | N/A | ||||||||||||||
Non-Executives | 289,410 | $ | 1.05 | |||||||||||||
|
| |||||||||||||||
Total | 4,757,302 | $ | 1.05 | 4.48 | $ | — | ||||||||||
The following table summarizes information associated with stock options granted to executives, directors, and non-executives that are exercisable at December 31, 2012:
| Period from February 25, 2012 through December 31, 2012 | ||||||||||||||||
| Number of Shares | Weighted Average Exercise Price | Weighted Average Remaining Contractual Life (in years) | Aggregate Intrinsic Value | |||||||||||||
Executives | 2,978,595 | $ | 1.05 | |||||||||||||
Directors | — | N/A | ||||||||||||||
Non-Executives | 192,940 | $ | 1.05 | |||||||||||||
|
| |||||||||||||||
Total | 3,171,535 | $ | 1.05 | 4.48 | $ | — | ||||||||||
Summary of Nonvested (Restricted) Shares Activity
| Period from February 25, 2012 through December 31, 2012 | ||||||||
| Number of Shares | Weighted Average Grant Date Fair Value | |||||||
Non-vested shares at beginning of year | — | N/A | ||||||
Granted | 2,499,293 | $ | 1.05 | |||||
Vested | 1,592,965 | $ | 1.05 | |||||
Cancelled | — | $ | 1.05 | |||||
Non-vested shares at end of year | 906,328 | $ | 1.05 | |||||
In conjunction with the issuance of the equity grants in October 2012, the Company recorded stock based compensation expense of $3.7 million which is included in general and administrative expense in the consolidated statement of operations for the period from February 25, 2012 through December 31, 2012, and expects to record approximately $1.0 million per year thereafter. There was no stock based compensation expense recognized in the years ended December 31, 2011 and 2010. As of December 31, 2012, $2.0 million of
F-54
Table of Contents
WILLIAM LYON HOMES
NOTES TO CONSOLIDATED FINANCIAL STATEMENTS—(Continued)
total unrecognized stock based compensation expense is expected to be recognized as an expense by the Company in the future over a weighted average period of two years. The total value of restricted stock awards which fully vested during the period from February 25, 2012 through December 31, 2012 was $1.7 million. There is no recognized tax benefit for the period from February 25, 2012 through December 31, 2012, period from January 1, 2012 through February 25, 2012 and the year ended December 31, 2011, and 2010.
Note 19—Commitments and Contingencies
The Company’s commitments and contingent liabilities include the usual obligations incurred by real estate developers in the normal course of business. In the opinion of management, these matters will not have a material effect on the Company’s consolidated financial position, results of operations or cash flows.
The Company is a defendant in various lawsuits related to its normal business activities. We believe that the accruals we have recorded for probable and reasonably estimable losses with respect to these proceedings are adequate and that, as of December 31, 2012, it was not reasonably possible that an additional material loss had been incurred in an amount in excess of the estimated amounts already recognized on our consolidated financial statements. We evaluate our accruals for litigation and regulatory proceedings at least quarterly and, as appropriate, adjust them to reflect (i) the facts and circumstances known to us at the time, including information regarding negotiations, settlements, rulings and other relevant events and developments; (ii) the advice and analyses of counsel; and (iii) the assumptions and judgment of management. Similar factors and considerations are used in establishing new accruals for proceedings as to which losses have become probable and reasonably estimable at the time an evaluation is made. Based on our experience, we believe that the amounts that may be claimed or alleged against us in these proceedings are not a meaningful indicator of our potential liability. The outcome of any of these proceedings, including the defense and other litigation-related costs and expenses we may incur, however, is inherently uncertain and could differ significantly from the estimate reflected in a related accrual, if made. Therefore, it is possible that the ultimate outcome of any proceeding, if in excess of a related accrual or if no accrual had been made, could be material to our consolidated financial statements.
We have non-cancelable operating leases primarily associated with our office facilities. Rent expense under cancelable and non-cancelable operating leases totaled $2.6 million, $0.7 million, $4.4 million and $4.4 million in the period from February 25, 2012 through December 31, 2012, the period from January 1, 2012 through February 24, 2012 and the years ended December 31, 2011 and 2010, respectively, and is included in general and administrative expense in our consolidated statements of operations for the respective periods. The table below shows the future minimum payments under non-cancelable operating leases at December 31, 2012 (in thousands).
Year Ended December 31 | ||||
2013 | $ | 1,349 | ||
2014 | 1,260 | |||
2015 | 618 | |||
2016 | 556 | |||
2017 | 580 | |||
Thereafter | 2,654 | |||
|
| |||
Total | $ | 7,017 | ||
|
| |||
In some jurisdictions in which the Company develops and constructs property, assessment district bonds are issued by municipalities to finance major infrastructure improvements. As a land owner benefited by these improvements, the Company is responsible for the assessments on its land. When properties are sold, the
F-55
Table of Contents
WILLIAM LYON HOMES
NOTES TO CONSOLIDATED FINANCIAL STATEMENTS—(Continued)
assessments are either prepaid or the buyers assume the responsibility for the related assessments. Assessment district bonds issued after May 21, 1992 are accounted for under the provisions of EITF 91-10, “Accounting for Special Assessment and Tax Increment Financing Entities” issued by the Emerging Issues Task Force of the Financial Accounting Standards Board on May 21, 1992, now codified as FASB ASC Topic 970-470,Real Estate—Debt, and recorded as liabilities in the Company’s consolidated balance sheet, if the amounts are fixed and determinable.
As of December 31, 2012, the Company had $0.9 million in deposits as collateral for outstanding irrevocable standby letters of credit to guarantee the Company’s financial obligations under certain contractual arrangements in the normal course of business. The standby letters of credit were secured by cash as reflected as restricted cash on the accompanying consolidated balance sheet. The beneficiary may draw upon these letters of credit in the event of a contractual default by the Company relating to each respective obligation. These letters of credit generally have a stated term of 12 months and have varying maturities throughout 2013, at which time the Company may be required to renew to coincide with the term of the respective arrangement.
The Company also had outstanding performance and surety bonds of $64.4 million at December 31, 2012 related principally to its obligations for site improvements at various projects. The Company does not believe that draws upon these bonds, if any, will have a material effect on the Company’s financial position, results of operations or cash flows. As of December 31, 2012, the Company had $60.9 million of project commitments relating to the construction of projects.
The Company has provided unsecured environmental indemnities to certain lenders, joint venture partners and land sellers. In each case, the Company has performed due diligence on the potential environmental risks including obtaining an independent environmental review from outside environmental consultants. These indemnities obligate the Company to reimburse the guaranteed parties for damages related to environmental matters. There is no term or damage limitation on these indemnities; however, if an environmental matter arises, the Company could have recourse against other previous owners.
See Note 10 for additional information relating to the Company’s guarantee arrangements.
In addition to the land bank agreements discussed below, the Company has entered into various purchase option agreements with third parties to acquire land. As of December 31, 2012, the Company has made non-refundable deposits of $3.8 million. The Company is under no obligation to purchase the land, but would forfeit remaining deposits if the land were not purchased. The total purchase price under the option agreements is $97.1 million as of December 31, 2012.
Land Banking Arrangements
The Company enters into purchase agreements with various land sellers. As a method of acquiring land in staged takedowns, thereby minimizing the use of funds from the Company’s available cash or other corporate financing sources and limiting the Company’s risk, the Company transfers the Company’s right in such purchase agreements to entities owned by third parties (“land banking arrangements”). These entities use equity contributions and/or incur debt to finance the acquisition and development of the land. The entities grant the Company an option to acquire lots in staged takedowns. In consideration for this option, the Company makes a non-refundable deposit of 15% to 25% of the total purchase price. The Company is under no obligation to purchase the balance of the lots, but would forfeit existing deposits and could be subject to penalties if the lots were not purchased. The Company does not have legal title to these entities or their assets and has not guaranteed their liabilities. These land banking arrangements help the Company manage the financial and market risk
F-56
Table of Contents
WILLIAM LYON HOMES
NOTES TO CONSOLIDATED FINANCIAL STATEMENTS—(Continued)
associated with land holdings. ASC 810 requires the consolidation of the assets, liabilities and operations of the Company’s land banking arrangements that are VIEs, of which none existed at December 31, 2012.
The Company participates in one land banking arrangement, which is not a VIE in accordance with ASC 810, but which is consolidated in accordance with FASB ASC Topic 470,Debt(“ASC 470”). Under the provisions of ASC 470, the Company has determined it is economically compelled, based on certain factors, to purchase the land in the land banking arrangement. The Company has recorded the remaining purchase price of the land of $39.0 million, which is included in real estate inventories not owned and liabilities from inventories not owned in the accompanying consolidated balance sheet as of December 31, 2012, and represents the remaining net cash to be paid on the remaining land takedowns.
In 2012, the Company made additional deposits of $2.5 million. In conjunction with the deposits, the Company reduced real estate inventories not owned and liabilities from inventories not owned in the amount of $2.5 million.
Summary information with respect to the Company’s land banking arrangements is as follows as of the periods presented (dollars in thousands):
| Successor |
| Predecessor | ||||||||
| December 31, | ||||||||||
| 2012 |
| 2011 | ||||||||
Total number of land banking projects | 1 | 1 | ||||||||
|
|
|
|
| ||||||
Total number of lots (1) | 610 | 625 | ||||||||
|
|
|
|
| ||||||
Total purchase price | $ | 161,465 | $ | 161,465 | ||||||
|
|
|
|
| ||||||
Balance of lots still under option and not purchased: | ||||||||||
Number of lots | 199 | 225 | ||||||||
|
|
|
|
| ||||||
Purchase price | $ | 39,029 | $ | 47,408 | ||||||
|
|
|
|
| ||||||
Forfeited deposits if lots are not purchased | $ | 27,734 | $ | 25,234 | ||||||
|
|
|
|
| ||||||
| (1) | Total number of lots in the land banking project was reduced by 15 as of December 31, 2012 as compared to December 31, 2011 because of a change in product mix in future projects. |
Note 20—Subsequent Events
No events have occurred subsequent to December 31, 2012, that have required recognition or disclosure in the Company’s financial statements.
F-57
Table of Contents
WILLIAM LYON HOMES
NOTES TO CONSOLIDATED FINANCIAL STATEMENTS—(Continued)
Note 21— Unaudited Summarized Quarterly Financial Information
Summarized unaudited quarterly financial information for the years ended December 31, 2012 and 2011 is as follows (in thousands except per share data):
| Predecessor | Successor | |||||||||||||||||||||
| Period from January 1 through February 24, 2012 | Period from February 25 through March 31, 2012 | |||||||||||||||||||||
| Three Months Ended | ||||||||||||||||||||||
| June 30, | September 30, | December 31, | ||||||||||||||||||||
| 2012 | 2012 | 2012 | ||||||||||||||||||||
Sales | $ | 16,687 | $ | 15,109 | $ | 145,051 | $ | 85,942 | $ | 102,833 | ||||||||||||
Cost of sales | (14,598 | ) | (13,063 | ) | (131,272 | ) | (70,795 | ) | (82,859 | ) | ||||||||||||
|
|
|
|
|
|
|
|
|
| |||||||||||||
Gross profit | 2,089 | 2,046 | 13,779 | 15,147 | 19,974 | |||||||||||||||||
Other income, costs and expenses, net | 226,408 | (7,028 | ) | (14,836 | ) | (14,681 | ) | (21,262 | ) | |||||||||||||
|
|
|
|
|
|
|
|
|
| |||||||||||||
Net income (loss) | 228,497 | (4,982 | ) | (1,057 | ) | 466 | (1,288 | ) | ||||||||||||||
|
|
|
|
|
|
|
|
|
| |||||||||||||
Net income (loss) available to common stockholders | $ | 228,383 | $ | (5,351 | ) | $ | (2,550 | ) | $ | (1,507 | ) | $ | (2,194 | ) | ||||||||
|
|
|
|
|
|
|
|
|
| |||||||||||||
Income (loss) per common share, basic and diluted | $ | 228,383 | $ | (0.06 | ) | $ | (0.03 | ) | $ | (0.01 | ) | $ | (0.02 | ) | ||||||||
| Predecessor | ||||||||||||||||
| Three Months Ended | ||||||||||||||||
| March 31, | June 30, | September 30, | December 31, | |||||||||||||
| 2011 | 2011 | 2011 | 2011 | |||||||||||||
Sales | $ | 36,574 | $ | 57,795 | $ | 53,703 | $ | 58,983 | ||||||||
Cost of sales | (31,885 | ) | (51,121 | ) | (46,645 | ) | (59,072 | ) | ||||||||
|
|
|
|
|
|
|
| |||||||||
Gross profit (loss) | 4,689 | 6,674 | 7,058 | (89 | ) | |||||||||||
Other income, costs and expenses, net | (15,866 | ) | (17,759 | ) | (46,758 | ) | (130,837 | ) | ||||||||
|
|
|
|
|
|
|
| |||||||||
Net loss | (11,177 | ) | (11,095 | ) | (39,700 | ) | (130,926 | ) | ||||||||
Net loss attributable to William Lyon Homes | $ | (11,225 | ) | $ | (11,171 | ) | $ | (39,634 | ) | $ | (131,300 | ) | ||||
|
|
|
|
|
|
|
| |||||||||
Loss per common share, basic and diluted | $ | (11,225 | ) | $ | (11,171 | ) | $ | (39,634 | ) | $ | (131,300 | ) | ||||
F-58
Table of Contents
PART II
INFORMATION NOT REQUIRED IN PROSPECTUS
| ITEM 13. | OTHER EXPENSES OF ISSUANCE AND DISTRIBUTION |
The following table sets forth our best estimate as to our anticipated costs and expenses expected to be paid by us in connection with a distribution of shares registered hereby. All amounts are estimates except for the Securities and Exchange Commission registration fee:
SEC registration fee | $ | 24,547 | ||
Printing and engraving expenses | $ | 300,000 | ||
Accounting fees and expenses | $ | 670,000 | ||
Legal fees and expenses | $ | 1,000,000 | ||
|
| |||
Total | $ | 1,994,547 | ||
|
|
| ITEM 14. | INDEMNIFICATION OF DIRECTORS AND OFFICERS |
Delaware Registrant
Subsection (a) of Section 145 of the General Corporation Law of the State of Delaware, or the DGCL, empowers a corporation to indemnify any person who was or is a party or who is threatened to be made a party to any threatened, pending or completed action, suit or proceeding, whether civil, criminal, administrative or investigative (other than an action by or in the right of the corporation) by reason of the fact that the person is or was a director, officer, employee or agent of the corporation, or is or was serving at the request of the corporation as a director, officer, employee or agent of another corporation, partnership, joint venture, trust or other enterprise, against expenses (including attorneys’ fees), judgments, fines and amounts paid in settlement actually and reasonably incurred by the person in connection with such action, suit or proceeding if the person acted in good faith and in a manner the person reasonably believed to be in or not opposed to the best interests of the corporation, and, with respect to any criminal action or proceeding, had no reasonable cause to believe the person’s conduct was unlawful.
Subsection (b) of Section 145 empowers a corporation to indemnify any person who was or is a party or is threatened to be made a party to any threatened, pending or completed action or suit by or in the right of the corporation to procure a judgment in its favor by reason of the fact that the person acted in any of the capacities set forth above, against expenses (including attorneys’ fees) actually and reasonably incurred by the person in connection with the defense or settlement of such action or suit if the person acted in good faith and in a manner the person reasonably believed to be in or not opposed to the best interests of the corporation, except that no indemnification shall be made in respect of any claim, issue or matter as to which such person shall have been adjudged to be liable to the corporation unless and only to the extent that the Court of Chancery or the court in which such action or suit was brought shall determine upon application that, despite the adjudication of liability but in view of all the circumstances of the case, such person is fairly and reasonably entitled to indemnity for such expenses which the Court of Chancery or such other court shall deem proper.
Section 145 further provides that to the extent a director or officer of a corporation has been successful on the merits or otherwise in the defense of any action, suit or proceeding referred to in subsections (a) and (b) of Section 145, or in defense of any claim, issue or matter therein, such person shall be indemnified against expenses (including attorneys’ fees) actually and reasonably incurred by such person in connection therewith; that indemnification provided for by Section 145 shall not be deemed exclusive of any other rights to which the indemnified party may be entitled; and the indemnification provided for by Section 145 shall, unless otherwise
II-1
Table of Contents
provided when authorized or ratified, continue as to a person who has ceased to be a director, officer, employee or agent and shall inure to the benefit of such person’s heirs, executors and administrators. Section 145 also empowers the corporation to purchase and maintain insurance on behalf of any person who is or was a director, officer, employee or agent of the corporation, or is or was serving at the request of the corporation as a director, officer, employee or agent of another corporation, partnership, joint venture, trust or other enterprise against any liability asserted against such person and incurred by such person in any such capacity, or arising out of his status as such, whether or not the corporation would have the power to indemnify such person against such liabilities under Section 145.
Section 102(b)(7) of the DGCL provides that a corporation’s certificate of incorporation may contain a provision eliminating or limiting the personal liability of a director to the corporation or its stockholders for monetary damages for breach of fiduciary duty as a director, provided that such provision shall not eliminate or limit the liability of a director (i) for any breach of the director’s duty of loyalty to the corporation or its stockholders, (ii) for acts or omissions not in good faith or which involve intentional misconduct or a knowing violation of law, (iii) under Section 174 of the DGCL, or (iv) for any transaction from which the director derived an improper personal benefit.
As permitted by Section 102(b)(7) of the DGCL, the Second Amended and Restated Certificate of Incorporation of William Lyon Homes provides that a director of the company shall not be liable to the company or its stockholders for monetary damages for breach of fiduciary duty as a director. Further, it states that the liability of a director of the company to the company or its stockholders for monetary damages shall be eliminated to the fullest extent permissible under applicable law in the event it is determined that Delaware law does not apply.
Article VIII of the Second Amended and Restated Bylaws of William Lyon Homes, or Parent, eliminates the personal liability of its directors for breach of their fiduciary duty as directors, except that a director shall be liable (i) for any breach of the director’s duty of loyalty to the company or its stockholders, (ii) for acts or omissions not in good faith or which involve intentional misconduct or a knowing violation of law, (iii) pursuant to Section 174 of the Delaware General Corporation Law or (iv) for any transaction from which the director derived an improper personal benefit. The Amended and Restated Bylaws provides for indemnification of the officers and directors to the full extent permitted by the DGCL. These indemnification provisions may be sufficiently broad to permit indemnification of the company’s officers and directors for liabilities (including reimbursement of expenses incurred) arising under the Securities Act of 1933, as amended, or the Securities Act.
Other
To the extent that indemnification for liabilities arising under the Securities Act may be permitted to directors, officers or persons controlling our company pursuant to the foregoing provisions, we have been informed that, in the opinion of the U.S. Securities and Exchange Commission, or the SEC, such indemnification is against public policy as expressed in the Securities Act and is therefore unenforceable. If a claim for indemnification against such liabilities (other than the payment by us of expenses incurred or paid by a director, officer or controlling person of our company in the successful defense of any action, suit or proceeding) is asserted by any of our directors, officers or controlling persons in connection with the securities being registered, we will, unless in the opinion of our counsel the matter has been settled by controlling precedent, submit to a court of appropriate jurisdiction the question whether such indemnification by us is against public policy as expressed in the Securities Act and will be governed by the final adjudication of that issue.
In addition, the company has entered into indemnification agreements with certain of our executive officers and each of our directors pursuant to which the company has agreed to indemnify such executive officers and directors against liability incurred by them by reason of their services as an executive officer or director to the fullest extent allowable under applicable law. We also provide liability insurance for each director and officer for certain losses arising from claims or charges made against them while acting in their capacities as our directors or officers.
II-2
Table of Contents
| ITEM 15. | RECENT SALES OF UNREGISTERED SECURITIES |
On February 25, 2012, in connection with the Prepackaged Joint Plan of Reorganization, or the Plan, of William Lyon Homes, or Parent, and certain of its subsidiaries, Parent and its subsidiaries consummated the following principal transactions contemplated by the Plan: (i) the issuance of 44,793,255 shares of Parent’s new Class A Common Stock, $0.01 par value per share, and the issuance of $75 million aggregate principal amount of 12% Senior Subordinated Secured Notes due 2017, or the Notes, by Parent’s wholly-owned subsidiary, William Lyon Homes, Inc., or California Lyon, in exchange for the claims held by the holders of the formerly outstanding notes of California Lyon; (ii) the issuance, in exchange for aggregate cash consideration of $25 million, of 31,464,548 shares of Parent’s new Class B Common Stock, $0.01 par value per share, or Class B Common Stock, and a warrant to purchase 15,737,294 shares of Class B Common Stock, or the Class B Warrant; and (iii) the issuance of 64,831,831 shares of Parent’s new Convertible Preferred Stock, $0.01 par value per share, or Convertible Preferred Stock, and 12,966,366 shares of Parent’s new Class C Common Stock, $0.01 par value per share, or Class C Common Stock, in exchange for aggregate cash consideration of $60 million. Parent issued an additional 3,144,000 shares of Class C Common Stock pursuant to an agreement with certain selling securityholders to backstop the offering of shares of capital stock in connection with the Plan.
The shares of Class A Common Stock and Notes described in clause (i) of the paragraph above were issued pursuant to the Plan in reliance on the provisions of Section 1145 of the U.S. Bankruptcy Code, or the Bankruptcy Code and such issuance was exempt from registration requirements under the federal securities laws pursuant to Section 1145 of the Bankruptcy Code.
The shares of Class B Common Stock and the Class B Warrant described in clause (ii) of the paragraph above were issued in reliance upon the exemption from securities registration afforded by the provisions of Section 4(2) of the Securities Act of 1933, as amended, or the Securities Act, and/or Regulation D, as promulgated by the SEC under the Securities Act, based upon the following: (a) the purchaser of such shares, or the Class B Purchaser, confirmed to the Company that it is an “accredited investor,” as defined in Rule 501 of Regulation D promulgated under the Securities Act and has such background, education and experience in financial and business matters as to be able to evaluate the merits and risks of an investment in the securities, (b) there was no public offering or general solicitation with respect to the offering of such securities, (c) the owners of the Class B Purchaser had a longstanding relationship with the Company and had access to information requested with respect to the Company, (d) the Class B Purchaser acknowledged that all securities being purchased were being purchased for investment intent and were “restricted securities” for purposes of the Securities Act, and agreed to transfer such securities only in a transaction registered under the Securities Act or exempt from registration under the Securities Act and (e) a legend has been, or will be, placed on the certificates representing each such security stating that it was restricted and could only be transferred if subsequently registered under the Securities Act or transferred in a transaction exempt from registration under the Securities Act.
The shares of Class C Common Stock and Convertible Preferred Stock described in clause (iii) of the paragraph above were issued in reliance upon the exemption from securities registration afforded by the provisions of Section 4(2) of the Securities Act, and/or Regulation D, as promulgated by the SEC under the Securities Act, based upon the following: (a) each of the persons to whom the shares of Class C Common Stock and Convertible Preferred Stock were issued, or a Class C Investor, confirmed to the Company that it or he is an “accredited investor,” as defined in Rule 501 of Regulation D promulgated under the Securities Act and has such background, education and experience in financial and business matters as to be able to evaluate the merits and risks of an investment in the securities, (b) there was no public offering or general solicitation with respect to the offering of such shares, (c) each Class C Investor was provided with certain disclosure materials with respect to the Company, (d) each Class C Investor acknowledged that all securities being purchased were being purchased for investment intent and were “restricted securities” for purposes of the Securities Act, and agreed to transfer such securities only in a transaction registered under the Securities Act or exempt from registration under the Securities Act and (e) a legend has been, or will be, placed on the certificates representing each such security
II-3
Table of Contents
stating that it was restricted and could only be transferred if subsequently registered under the Securities Act or transferred in a transaction exempt from registration under the Securities Act.
The additional 3,144,000 shares of Class C Common Stock issued pursuant to the backstop arrangement described in the first paragraph above were issued in reliance upon the exemption from securities registration afforded by the provisions of Section 4(2) of the Securities Act, and/or Regulation D, as promulgated by the SEC under the Securities Act, based upon the following: (a) each of the persons to whom the shares of Class C Common Stock were issued confirmed to the Company that it or he is an “accredited investor,” as defined in Rule 501 of Regulation D promulgated under the Securities Act and has such background, education and experience in financial and business matters as to be able to evaluate the merits and risks of an investment in the securities, (b) there was no public offering or general solicitation with respect to the offering of such shares, (c) such persons were provided with certain disclosure materials with respect to the Company, (d) such persons acknowledged that all securities being purchased were being purchased for investment intent and were “restricted securities” for purposes of the Securities Act, and agreed to transfer such securities only in a transaction registered under the Securities Act or exempt from registration under the Securities Act and (e) a legend has been, or will be, placed on the certificates representing each such security stating that it was restricted and could only be transferred if subsequently registered under the Securities Act or transferred in a transaction exempt from registration under the Securities Act.
On June 28, 2012, Parent issued an additional 10,000,000 shares of Class A Common Stock to investment vehicles managed by affiliates of Colony Capital, LLC, or Colony, as partial consideration in a real property purchase transaction, or the Colony Transaction.
On October 12, 2012, the Company issued to an investment vehicle managed by affiliates of Paulson & Co. Inc., or Paulson, (i) 15,238,095 shares of the Company’s Class A Common Stock, for $16,000,000 in cash and (ii) 12,173,913 shares of the Company’s Convertible Preferred Stock, for $14,000,000 in cash, for an aggregate purchase price of $30,000,000, or the Paulson Transaction.
The shares of Class A Common Stock issued in the Colony Transaction and the shares Class A Common Stock and Convertible Preferred Stock issued in the Paulson Transaction were issued in reliance upon the exemption from securities registration afforded by the provisions of Section 4(2) of the Securities Act, and/or Regulation D, as promulgated by the SEC under the Securities Act, based upon the following: (a) the offer and sale of the securities was part of a privately negotiated transaction only with Colony or Paulson, as applicable, and did not involve a general solicitation and (b) Colony or Paulson, as applicable, represented in the transaction documents that it was an accredited investor as defined in Regulation D of the Securities Act.
On October 1, 2012, the Company granted an aggregate of 3,120,000 restricted shares of Class D common stock of the Company, or the Restricted Stock, and an aggregate of 4,757,303 options to purchase shares of Class D common stock of the Company, or the Options, to certain officers of California Lyon. Also on October 1, 2012, the Company granted 313,500 shares of Restricted Stock to its non-employee directors. The Restricted Stock and Option grants were subject to the approval by the Company’s stockholders of the Company’s 2012 Equity Incentive Plan, or the 2012 Plan, which approval was obtained on October 10, 2012. On December 5, 2012, the Company cancelled Mr. Redleaf’s grant of 57,000 shares of Restricted Stock and in lieu thereof granted him a cash award with the equivalent value of $59,850 in respect of Mr. Redleaf’s services as a non-employee director.
On December 5, 2012, the Company granted an aggregate of 238,095 shares of Restricted Stock to certain employees of California Lyon.
On March 1, 2013, the Company granted an aggregate of 2,651,464 shares of Restricted Stock to certain officers and employees of California Lyon, of which 2,404,406 will be earned based on the Company’s performance during the 2013 fiscal year and continued service, and of which the remaining 247,058 will be
II-4
Table of Contents
earned based on continued service through each annual vesting date. Also on March 1, 2013, the Company granted 338,234 shares of Restricted Stock to its non-employee directors.
The Company made the grants of Options and Restricted Stock in reliance upon the exemption from securities registration afforded by (1) Rule 701 promulgated by the Securities and Exchange Commission under the Securities Act based upon the securities being offered and sold either pursuant to written compensatory benefit plans or contracts relating to compensation, or, to the extent Rule 701 was not available, (2) the provisions of Section 4(2) of the Securities Act based upon the offer and sale of the securities being part of a non-public offering only with certain officers and directors of the Company that did not involve a general solicitation.
On November 8, 2012, California Lyon issued $325 million principal amount of its 8.5% Senior Notes due 2020, or the New Notes. The New Notes were offered only to qualified institutional buyers under Rule 144A of the Securities Act, and to persons outside the United States pursuant to Regulation S of the Securities Act.
| ITEM 16. | EXHIBITS AND FINANCIAL STATEMENT SCHEDULES |
Exhibit | Description | |
| 3.1 | Second Amended and Restated Certificate of Incorporation of William Lyon Homes (incorporated by reference to the Company’s Quarterly Report on Form 10-Q filed with the Commission on October 25, 2012). | |
| 3.2 | Second Amended and Restated Bylaws of William Lyon Homes (incorporated by reference to the Company’s Quarterly Report on Form 10-Q filed with the Commission on October 25, 2012). | |
| 3.3 | Certificate of Ownership and Merger (incorporated by reference to the Company’s Current Report on Form 8-K filed with the Commission on January 5, 2000). | |
| 3.4 | Certificate of Ownership and Merger (incorporated by reference to the Company’s Annual Report on Form 10-K for the year-ended December 31, 2006). | |
| 3.5 | Articles of Incorporation of William Lyon Homes, Inc. (incorporated by reference to William Lyon Homes, Inc.’s Form T-3 filed with the Commission on November 17, 2011). | |
| 3.6 | Bylaws of William Lyon Homes, Inc. (incorporated by reference to William Lyon Homes, Inc.’s Form T-3 filed with the Commission on November 17, 2011). | |
| 4.1 | Indenture, dated as of February 25, 2012, among William Lyon Homes, Inc., as Issuer, the Guarantors (as defined therein) and U.S. Bank National Association, as Note Trustee and Collateral Trustee (incorporated by reference to the Company’s Form T-3/A (Amendment No. 2) filed with the Commission on February 22, 2012). | |
| 4.2 | Form of 12% Senior Subordinated Secured Note Due 2017 (incorporated by reference to the Company’s Current Report on Form 8-K filed with the Commission on March 6, 2012). | |
| 4.3 | Supplemental Indenture dated as of November 8, 2012, by and between William Lyon Homes, Inc., William Lyon Homes, and certain of William Lyon Homes’ subsidiaries (as guarantors) and U.S. Bank National Association, as trustee (incorporated by reference to the Company’s Current Report on Form 8-K filed with the Commission on November 8, 2012). | |
| 4.5 | Indenture (including form of 8.5% Senior Note due 2020), dated as of November 8, 2012, by and between William Lyon Homes, Inc., William Lyon Homes, certain of William Lyon Homes’ subsidiaries (as guarantors) and U.S. Bank National Association, as trustee (incorporated by reference to the Company’s Current Report on Form 8-K filed with the Commission on November 8, 2012). | |
II-5
Table of Contents
Exhibit | Description | |
| 5.1+ | Opinion of Latham & Watkins LLP. | |
| 10.1† | Form of Indemnity Agreement, between William Lyon Homes, a Delaware corporation, and the directors and officers of William Lyon Homes (incorporated by reference to the Company’s Annual Report on Form 10-K for the year-ended December 31, 1999). | |
| 10.2 | Property Management Agreement between Corporate Enterprises, Inc., a California corporation (Owner) and William Lyon Homes, Inc., a California corporation (Manager) dated and effective November 5, 1999 (incorporated by reference to the Company’s Annual Report on Form 10-K for the year-ended December 31, 1999). | |
| 10.3 | Warranty Service Agreement between Corporate Enterprises, Inc., a California corporation and William Lyon Homes, Inc., a California corporation dated and effective November 5, 1999 (incorporated by reference to the Company’s Annual Report on Form 10-K for the year-ended December 31, 1999). | |
| 10.4 | Standard Industrial/Commercial Single-Tenant Lease—Net between William Lyon Homes, Inc. and a trust of which William H. Lyon is the sole beneficiary (incorporated by reference to the Company’s Annual Report on Form 10-K for the year-ended December 31, 2000). | |
| 10.5† | The Presley Companies Non-Qualified Retirement Plan for Outside Directors (incorporated by reference to the Company’s Annual Report on Form 10-K for the year-ended December 31, 2002). | |
| 10.6* | Sixth Extension and Modification agreement dated December 30, 2011, by and between Circle G at the Church Farm North Joint Venture, LLC, an Arizona limited liability company, and U.S. Bank National Association, a national banking association. | |
| 10.7 | Aircraft Purchase and Sale Agreement dated as of September 3, 2009, by and between Presley CMR, Inc., and Martin Aviation, Inc., or its designee (incorporated by reference to the Company’s Current Report on Form 8-K filed with the Commission on September 10, 2009). | |
| 10.8 | Secured Promissory Note dated September 9, 2009 from Martin Aviation, Inc., a California corporation payable to William Lyon Homes, Inc., a California corporation (incorporated by reference to the Company’s Current Report on Form 8-K filed with the Commission on September 10, 2009). | |
| 10.9 | Aircraft Mortgage and Security Agreement between Martin Aviation, Inc., a California corporation and William Lyon Homes, Inc., dated as of September 9, 2009 (incorporated by reference to the Company’s Current Report on Form 8-K filed with the Commission on September 10, 2009). | |
| 10.10† | Project Completion Bonus Plan (incorporated by reference to the Company’s Current Report on Form 8-K filed with the Commission on September 20, 2010). | |
| 10.11 | Form of Second Lien Notes Registration Rights Agreement, dated as of February 25, 2012, by and among William Lyon Homes, Inc. and the Holders (as defined therein) (incorporated by reference to the Company’s Current Report on Form 8-K filed with the Commission on March 6, 2012). | |
| 10.12 | Form of Class A Common Stock Registration Rights Agreement, dated as of February 25, 2012, by and among William Lyon Homes and the Holders (as defined therein) (incorporated by reference to the Company’s Current Report on Form 8-K filed with the Commission on March 6, 2012). | |
| 10.13 | Class B Common Stock and Warrant Purchase Agreement, dated as of February 25, 2012, by and between William Lyon Homes and the Purchaser (as defined therein) (incorporated by reference to the Company’s Current Report on Form 8-K filed with the Commission on March 6, 2012). | |
II-6
Table of Contents
Exhibit | Description | |
| 10.14 | Warrant to Purchase Shares of Class B Common Stock of William Lyon Homes, dated as of February 25, 2012 (incorporated by reference to the Company’s Current Report on Form 8-K filed with the Commission on March 6, 2012). | |
| 10.15 | Class B Common Stock Registration Rights Agreement, dated as of February 25, 2012, by and among William Lyon Homes and the Holders (as defined therein) (incorporated by reference to the Company’s Current Report on Form 8-K filed with the Commission on March 6, 2012). | |
| 10.16 | Form of Convertible Preferred Stock and Class C Common Stock Registration Rights Agreement, dated as of February 25, 2012, by and among William Lyon Homes and the Holders party thereto (incorporated by reference to the Company’s Current Report on Form 8-K filed with the Commission on March 6, 2012). | |
| 10.17† | Employment Agreement, dated as of February 25, 2012, by and among William Lyon Homes, William Lyon Homes, Inc. and General William Lyon (incorporated by reference to the Company’s Current Report on Form 8-K filed with the Commission on March 6, 2012). | |
| 10.18† | Employment Agreement, dated as of February 25, 2012, by and among William Lyon Homes, William Lyon Homes, Inc. and William H. Lyon (incorporated by reference to the Company’s Current Report on Form 8-K filed with the Commission on March 6, 2012). | |
| 10.19* | Amended and Restated loan agreement, dated April 23, 2010, between Bank of the West, a California Banking Corporation, Mountain Falls, LLC, a Nevada limited liability company, and Mountain Falls Golf Course, LLC, a Nevada limited liability company. | |
| 10.20* | Purchase and Sale Agreement and Joint Escrow Instructions, dated June 28, 2012, by and among ColFin WLH Land Acquisitions, LLC, a Delaware limited liability company, William Lyon Homes, Inc., a California corporation, and William Lyon Homes, a Delaware corporation. | |
| 10.21† | Form of Employment Agreement, dated as of July 1, 2011, by William Lyon Homes and each of Matthew R. Zaist, Colin T. Severn and Bryan W. Doyle (incorporated by reference to Exhibit 10.1 to the Company’s Current Report on Form 8-K filed with the Commission on July 8, 2011). | |
| 10.22† | 2011 Key Employee Bonus Program (incorporated by reference to Exhibit B to Exhibit 10.1 to the Company’s Current Report on Form 8-K filed with the Commission on July 8, 2011). | |
| 10.23* † | William Lyon Homes 2012 Equity Incentive Plan. | |
| 10.24* † | William Lyon Homes 2012 Equity Incentive Plan form of Stock Option Agreement. | |
| 10.25* † | William Lyon Homes 2012 Equity Incentive Plan form of Restricted Stock Award Agreement. | |
| 10.26* † | Form of Employment Agreement, dated September 1, 2012, by William Lyon Homes, Inc. and each of Matthew R. Zaist, Colin T. Severn, Tom Hickcox, Mary Connelly, Rick Robinson, Carl Morabito, Terry Connelly and Julie Collins. | |
| 10.27* | Registration Rights Agreement, dated November 8, 2012, by and between William Lyon Homes, certain of William Lyon Homes’ subsidiaries, and Credit Suisse Securities, as representative to the Initial Purchasers (as defined therein). | |
| 10.28* | Class A Common Stock and Convertible Preferred Stock Subscription Agreement, dated October 12, 2012, by and between William Lyon Homes and WLH Recovery Acquisition LLC. | |
| 10.29* | Amendment of and Joinder to Class A Common Stock Registration Rights Agreement, dated October 12, 2012, by and between WLH Recovery Acquisition LLC and William Lyon Homes. | |
II-7
Table of Contents
Exhibit | Description | |
| 10.30* | Amendment of and Joinder to Class A Common Stock Registration Rights Agreement, dated October 12, 2012, by and between ColFin WLH Land Acquisitions, LLC and William Lyon Homes. | |
| 10.31* | Amendment of and Joinder to Convertible Preferred Stock and Class C Common Stock Registration Rights Agreement, dated October 12, 2012, by and between WLH Recovery Acquisition LLC and William Lyon Homes. | |
| 10.32 | Construction Loan Agreement dated as of September 20, 2012 by and between Lyon Branches, LLC, a Delaware limited liability company and California Bank & Trust, a California banking corporation (incorporated by reference to the Company’s Quarterly Report for the quarter-ended September 30, 2012). | |
| 10.33 | Construction Loan Agreement dated as of September 26, 2012 by and between William Lyon Homes, Inc., a California corporation and California Bank & Trust, a California banking corporation (incorporated by reference to the Company’s Quarterly Report for the quarter-ended September 30, 2012). | |
| 12.1+ | Statement Regarding the Computation of Ratio of Earnings (Loss) to Fixed Charges and Preferred Stock Dividends for the Period from January 1, 2012 through February 24, 2012, and the Period from February 25, 2012 through December 31, 2012, and for the Years Ended December 31, 2011, 2010, 2009, 2008 and 2007. | |
| 16.1* | Letter from Windes & McClaughry Accountancy Corporation, as to the change in certifying accountant, dated as of August 9, 2012. | |
| 21.1* | List of Subsidiaries of the Company. | |
| 23.1+ | Consent of Windes & McClaughry Accountancy Corporation, Independent Registered Public Accounting Firm. | |
| 23.2+ | Consent of KPMG LLP, Independent Registered Public Accounting Firm. | |
| 23.3+ | Consent of Latham & Watkins LLP (included in Exhibit 5.1). | |
| 24.1* | Powers of Attorney (included on signature page hereto). | |
| 25.1 | Statement of Eligibility and Qualification of U.S. Bank National Association on Form T-1 (incorporated by reference to William Lyon Homes, Inc.’s Form T-3 filed with the Commission on November 17, 2011). | |
| 101.INS* ** | XBRL Instance Document | |
| 101.SCH* ** | XBRL Taxonomy Extension Schema Document | |
| 101.CAL* ** | XBRL Taxonomy Extension Calculation Linkbase Document | |
| 101.DEF* ** | XBRL Taxonomy Extension Definition Linkbase Document | |
| 101.LAB* ** | XBRL Taxonomy Extension Label Linkbase Document | |
| 101.PRE* ** | XBRL Taxonomy Extension Presentation Linkbase Document | |
| + | Filed herewith |
| † | Management contract or compensatory agreement |
| * | Previously filed |
| ** | Pursuant to Rule 406T of Regulation S-T, the XBRL information will not be deemed filed for purposes of Section 18 of the Securities Exchange Act of 1934 and will not be deemed filed or part of a registration statement or prospectus for purposes of Sections 11 and 12 of the Securities Act of 1933, or otherwise subject to liability under those Sections. |
II-8
Table of Contents
| ITEM 17. | UNDERTAKINGS |
| (a) | The undersigned registrants hereby undertake: |
(1) To file, during any period in which offers or sales are being made, a post-effective amendment to this registration statement:
(i) To include any prospectus required by Section 10(a)(3) of the Securities Act;
(ii) To reflect in the prospectus any facts or events arising after the effective date of the registration statement (or the most recent post-effective amendment thereof) which, individually or in the aggregate, represent a fundamental change in the information set forth in the registration statement. Notwithstanding the foregoing, any increase or decrease in volume of securities offered (if the total dollar value of securities offered would not exceed that which was registered) and any deviation from the low or high end of the estimated maximum offering range may be reflected in the form of prospectus filed with the Securities and Exchange Commission pursuant to Rule 424(b) if, in the aggregate, the changes in volume and price represent no more than a 20% change in the maximum aggregate offering price set forth in the “Calculation of Registration Fee” table in the effective registration statement; and
(iii) To include any material information with respect to the plan of distribution not previously disclosed in the registration statement or any material change to such information in the registration statement.
(2) That, for the purpose of determining any liability under the Securities Act of 1933, each such post-effective amendment shall be deemed to be a new registration statement relating to the securities offered therein, and the offering of such securities at that time shall be deemed to be the initialbona fide offering thereof.
(3) To remove from registration by means of a post-effective amendment any of the securities being registered which remain unsold at the termination of the offering.
| (h) | Insofar as indemnification for liabilities arising under the Securities Act of 1933 may be permitted to directors, officers and controlling persons of the registrants pursuant to the foregoing provisions, or otherwise, the registrant has been advised that in the opinion of the SEC such indemnification is against public policy as expressed in the Securities Act and is, therefore, unenforceable. In the event that a claim for indemnification against such liabilities (other than the payment by the registrants of expenses incurred or paid by a director, officer or controlling person of the registrant in the successful defense of any action, suit or proceeding) is asserted by such director, officer or controlling person in connection with the securities being registered, the registrants will, unless in the opinion of their counsel the matter has been settled by controlling precedent, submit to a court of appropriate jurisdiction the question whether such indemnification by them is against public policy as expressed in the Securities Act and will be governed by the final adjudication of such issue. |
II-9
Table of Contents
SIGNATURES
Pursuant to the requirements of the Securities Act of 1933, the registrant has duly caused this amendment to the registration statement on Form S-1 to be signed on its behalf by the undersigned, thereunto duly authorized, in the City of Newport Beach, State of California, on March 20, 2013.
| WILLIAM LYON HOMES, | ||
| a Delaware corporation | ||
By: | /S/ WILLIAM H. LYON | |
| William H. Lyon | ||
| Chief Executive Officer | ||
Pursuant to the requirements of the Securities Act, this amendment to the registration statement on Form S-1 has been signed on March 20, 2013 by the following persons in the capacities indicated.
Signature | Title | |||
/S/ WILLIAM H. LYON William H. Lyon | Chief Executive Officer, Director (Principal Executive Officer)
| |||
/s/ COLIN T. SEVERN Colin T. Severn |
Vice President, Chief Financial Officer and Corporate Secretary (Principal Financial and Accounting Officer) | |||
* General William Lyon | Chairman of the Board
| |||
* Douglas K. Ammerman |
Director | |||
* Michael Barr |
Director | |||
* Gary H. Hunt |
Director | |||
* Matthew R. Niemann |
Director | |||
* Nathaniel Redleaf |
Director | |||
* Lynn Carlson Schell |
Director | |||
*By: | /S/ COLIN T. SEVERN | |
| Colin T. Severn, as Attorney-in-Fact | ||
Table of Contents
EXHIBIT INDEX
The following is a list of exhibits filed as part of this registration statement.
Exhibit | Description | |
| 3.1 | Second Amended and Restated Certificate of Incorporation of William Lyon Homes (incorporated by reference to the Company’s Quarterly Report on Form 10-Q filed with the Commission on October 25, 2012). | |
| 3.2 | Second Amended and Restated Bylaws of William Lyon Homes (incorporated by reference to the Company’s Quarterly Report on Form 10-Q filed with the Commission on October 25, 2012). | |
| 3.3 | Certificate of Ownership and Merger (incorporated by reference to the Company’s Current Report on Form 8-K filed with the Commission on January 5, 2000). | |
| 3.4 | Certificate of Ownership and Merger (incorporated by reference to the Company’s Annual Report on Form 10-K for the year-ended December 31, 2006). | |
| 3.5 | Articles of Incorporation of William Lyon Homes, Inc. (incorporated by reference to William Lyon Homes, Inc.’s Form T-3 filed with the Commission on November 17, 2011). | |
| 3.6 | Bylaws of William Lyon Homes, Inc. (incorporated by reference to William Lyon Homes, Inc.’s Form T-3 filed with the Commission on November 17, 2011). | |
| 4.1 | Indenture, dated as of February 25, 2012, among William Lyon Homes, Inc., as Issuer, the Guarantors (as defined therein) and U.S. Bank National Association, as Note Trustee and Collateral Trustee (incorporated by reference to the Company’s Form T-3/A (Amendment No. 2) filed with the Commission on February 22, 2012). | |
| 4.2 | Form of 12% Senior Subordinated Secured Note Due 2017 (incorporated by reference to the Company’s Current Report on Form 8-K filed with the Commission on March 6, 2012). | |
| 4.3 | Supplemental Indenture dated as of November 8, 2012, by and between William Lyon Homes, Inc., William Lyon Homes, and certain of William Lyon Homes’ subsidiaries (as guarantors) and U.S. Bank National Association, as trustee (incorporated by reference to the Company’s Current Report on Form 8-K filed with the Commission on November 8, 2012). | |
| 4.5 | Indenture (including form of 8.5% Senior Note due 2020), dated as of November 8, 2012, by and between William Lyon Homes, Inc., William Lyon Homes, certain of William Lyon Homes’ subsidiaries (as guarantors) and U.S. Bank National Association, as trustee (incorporated by reference to the Company’s Current Report on Form 8-K filed with the Commission on November 8, 2012). | |
| 5.1+ | Opinion of Latham & Watkins LLP. | |
| 10.1† | Form of Indemnity Agreement, between William Lyon Homes, a Delaware corporation, and the directors and officers of William Lyon Homes (incorporated by reference to the Company’s Annual Report on Form 10-K for the year-ended December 31, 1999). | |
| 10.2 | Property Management Agreement between Corporate Enterprises, Inc., a California corporation (Owner) and William Lyon Homes, Inc., a California corporation (Manager) dated and effective November 5, 1999 (incorporated by reference to the Company’s Annual Report on Form 10-K for the year-ended December 31, 1999). | |
| 10.3 | Warranty Service Agreement between Corporate Enterprises, Inc., a California corporation and William Lyon Homes, Inc., a California corporation dated and effective November 5, 1999 (incorporated by reference to the Company’s Annual Report on Form 10-K for the year-ended December 31, 1999). | |
| 10.4 | Standard Industrial/Commercial Single-Tenant Lease—Net between William Lyon Homes, Inc. and a trust of which William H. Lyon is the sole beneficiary (incorporated by reference to the Company’s Annual Report on Form 10-K for the year-ended December 31, 2000). | |
Table of Contents
Exhibit | Description | |
| 10.5† | The Presley Companies Non-Qualified Retirement Plan for Outside Directors (incorporated by reference to the Company’s Annual Report on Form 10-K for the year-ended December 31, 2002). | |
| 10.6* | Sixth Extension and Modification agreement dated December 30, 2011, by and between Circle G at the Church Farm North Joint Venture, LLC, an Arizona limited liability company, and U.S. Bank National Association, a national banking association. | |
| 10.7 | Aircraft Purchase and Sale Agreement dated as of September 3, 2009, by and between Presley CMR, Inc., and Martin Aviation, Inc., or its designee (incorporated by reference to the Company’s Current Report on Form 8-K filed with the Commission on September 10, 2009). | |
| 10.8 | Secured Promissory Note dated September 9, 2009 from Martin Aviation, Inc., a California corporation payable to William Lyon Homes, Inc., a California corporation (incorporated by reference to the Company’s Current Report on Form 8-K filed with the Commission on September 10, 2009). | |
| 10.9 | Aircraft Mortgage and Security Agreement between Martin Aviation, Inc., a California corporation and William Lyon Homes, Inc., dated as of September 9, 2009 (incorporated by reference to the Company’s Current Report on Form 8-K filed with the Commission on September 10, 2009). | |
| 10.10† | Project Completion Bonus Plan (incorporated by reference to the Company’s Current Report on Form 8-K filed with the Commission on September 20, 2010). | |
| 10.11 | Form of Second Lien Notes Registration Rights Agreement, dated as of February 25, 2012, by and among William Lyon Homes, Inc. and the Holders (as defined therein) (incorporated by reference to the Company’s Current Report on Form 8-K filed with the Commission on March 6, 2012). | |
| 10.12 | Form of Class A Common Stock Registration Rights Agreement, dated as of February 25, 2012, by and among William Lyon Homes and the Holders (as defined therein) (incorporated by reference to the Company’s Current Report on Form 8-K filed with the Commission on March 6, 2012). | |
| 10.13 | Class B Common Stock and Warrant Purchase Agreement, dated as of February 25, 2012, by and between William Lyon Homes and the Purchaser (as defined therein) (incorporated by reference to the Company’s Current Report on Form 8-K filed with the Commission on March 6, 2012). | |
| 10.14 | Warrant to Purchase Shares of Class B Common Stock of William Lyon Homes, dated as of February 25, 2012 (incorporated by reference to the Company’s Current Report on Form 8-K filed with the Commission on March 6, 2012). | |
| 10.15 | Class B Common Stock Registration Rights Agreement, dated as of February 25, 2012, by and among William Lyon Homes and the Holders (as defined therein) (incorporated by reference to the Company’s Current Report on Form 8-K filed with the Commission on March 6, 2012). | |
| 10.16 | Form of Convertible Preferred Stock and Class C Common Stock Registration Rights Agreement, dated as of February 25, 2012, by and among William Lyon Homes and the Holders party thereto (incorporated by reference to the Company’s Current Report on Form 8-K filed with the Commission on March 6, 2012). | |
| 10.17† | Employment Agreement, dated as of February 25, 2012, by and among William Lyon Homes, William Lyon Homes, Inc. and General William Lyon (incorporated by reference to the Company’s Current Report on Form 8-K filed with the Commission on March 6, 2012). | |
| 10.18† | Employment Agreement, dated as of February 25, 2012, by and among William Lyon Homes, William Lyon Homes, Inc. and William H. Lyon (incorporated by reference to the Company’s Current Report on Form 8-K filed with the Commission on March 6, 2012). | |
| 10.19* | Amended and Restated loan agreement, dated April 23, 2010, between Bank of the West, a California Banking Corporation, Mountain Falls, LLC, a Nevada limited liability company, and Mountain Falls Golf Course, LLC, a Nevada limited liability company. | |
Table of Contents
Exhibit | Description | |
| 10.20* | Purchase and Sale Agreement and Joint Escrow Instructions, dated June 28, 2012, by and among ColFin WLH Land Acquisitions, LLC, a Delaware limited liability company, William Lyon Homes, Inc., a California corporation, and William Lyon Homes, a Delaware corporation. | |
| 10.21† | Form of Employment Agreement, dated as of July 1, 2011, by William Lyon Homes and each of Matthew R. Zaist, Colin T. Severn and Bryan W. Doyle (incorporated by reference to Exhibit 10.1 to the Company’s Current Report on Form 8-K filed with the Commission on July 8, 2011). | |
| 10.22† | 2011 Key Employee Bonus Program (incorporated by reference to Exhibit B to Exhibit 10.1 to the Company’s Current Report on Form 8-K filed with the Commission on July 8, 2011). | |
| 10.23* † | William Lyon Homes 2012 Equity Incentive Plan. | |
| 10.24* † | William Lyon Homes 2012 Equity Incentive Plan form of Stock Option Agreement. | |
| 10.25* † | William Lyon Homes 2012 Equity Incentive Plan form of Restricted Stock Award Agreement. | |
| 10.26* † | Form of Employment Agreement, dated September 1, 2012, by William Lyon Homes, Inc. and each of Matthew R. Zaist, Colin T. Severn, Tom Hickcox, Mary Connelly, Rick Robinson, Carl Morabito, Terry Connelly and Julie Collins. | |
| 10.27* | Registration Rights Agreement, dated November 8, 2012, by and between William Lyon Homes, certain of William Lyon Homes’ subsidiaries, and Credit Suisse Securities, as representative to the Initial Purchasers (as defined therein). | |
| 10.28* | Class A Common Stock and Convertible Preferred Stock Subscription Agreement, dated October 12, 2012, by and between William Lyon Homes and WLH Recovery Acquisition LLC. | |
| 10.29* | Amendment of and Joinder to Class A Common Stock Registration Rights Agreement, dated October 12, 2012, by and between WLH Recovery Acquisition LLC and William Lyon Homes. | |
| 10.30* | Amendment of and Joinder to Class A Common Stock Registration Rights Agreement, dated October 12, 2012, by and between ColFin WLH Land Acquisitions, LLC and William Lyon Homes. | |
| 10.31* | Amendment of and Joinder to Convertible Preferred Stock and Class C Common Stock Registration Rights Agreement, dated October 12, 2012, by and between WLH Recovery Acquisition LLC and William Lyon Homes. | |
| 10.32 | Construction Loan Agreement dated as of September 20, 2012 by and between Lyon Branches, LLC, a Delaware limited liability company and California Bank & Trust, a California banking corporation (incorporated by reference to the Company’s Quarterly Report for the quarter-ended September 30, 2012). | |
| 10.33 | Construction Loan Agreement dated as of September 26, 2012 by and between William Lyon Homes, Inc., a California corporation and California Bank & Trust, a California banking corporation (incorporated by reference to the Company’s Quarterly Report for the quarter-ended September 30, 2012). | |
| 12.1+ | Statement Regarding the Computation of Ratio of Earnings (Loss) to Fixed Charges and Preferred Stock Dividends for the Period from January 1, 2012 through February 24, 2012, and the Period from February 25, 2012 through December 31, 2012, and for the Years Ended December 31, 2011, 2010, 2009, 2008 and 2007. | |
| 16.1* | Letter from Windes & McClaughry Accountancy Corporation, as to the change in certifying accountant, dated as of August 9, 2012. | |
| 21.1* | List of Subsidiaries of the Company. | |
| 23.1+ | Consent of Windes & McClaughry Accountancy Corporation, Independent Registered Public Accounting Firm. | |
Table of Contents
Exhibit | Description | |
| 23.2+ | Consent of KPMG LLP, Independent Registered Public Accounting Firm. | |
| 23.3+ | Consent of Latham & Watkins LLP (included in Exhibit 5.1). | |
| 24.1* | Powers of Attorney (included on signature page hereto). | |
| 25.1 | Statement of Eligibility and Qualification of U.S. Bank National Association on Form T-1 (incorporated by reference to William Lyon Homes, Inc.’s Form T-3 filed with the Commission on November 17, 2011). | |
| 101.INS* ** | XBRL Instance Document | |
| 101.SCH* ** | XBRL Taxonomy Extension Schema Document | |
| 101.CAL* ** | XBRL Taxonomy Extension Calculation Linkbase Document | |
| 101.DEF* ** | XBRL Taxonomy Extension Definition Linkbase Document | |
| 101.LAB* ** | XBRL Taxonomy Extension Label Linkbase Document | |
| 101.PRE* ** | XBRL Taxonomy Extension Presentation Linkbase Document | |
| + | Filed herewith |
| † | Management contract or compensatory agreement |
| * | Previously filed |
| ** | Pursuant to Rule 406T of Regulation S-T, the XBRL information will not be deemed filed for purposes of Section 18 of the Securities Exchange Act of 1934 and will not be deemed filed or part of a registration statement or prospectus for purposes of Sections 11 and 12 of the Securities Act of 1933, or otherwise subject to liability under those Sections. |