
Board of Directors Meeting Q3 2017 2017 Q4 and Year-End Earnings Call February 20, 2018, 9:00 am PT Exhibit 99.3
Forward Looking Statements and Non-GAAP Information Certain statements contained in the Company’s press release for the three months and year ended December 31, 2017 and the accompanying comments during our conference call that are not historical information may constitute “forward-looking statements” as defined by the Private Securities Litigation Reform Act of 1995, including, but not limited to, forward-looking statements related to: anticipated pre-tax income, gross margin performance, backlog conversion rates, operating and financial results for 2018, community count growth and project performance, market and industry trends, the continued housing market recovery, average sale price of homes to be closed in various periods, SG&A percentage, future cash needs and liquidity, minority interest from our homebuilding joint ventures, leverage ratios and reduction strategies, land acquisition spending the consummation of the proposed transaction with RSI Communities (“RSI Communities”) described herein and the anticipated benefits to be realized therefrom and the anticipated financial or operational performance resulting from the proposed RSI Communities transaction. The forward-looking statements involve risks and uncertainties and actual results may differ materially from those projected or implied. The Company makes no commitment, and disclaims any duty, to update or revise any forward-looking statements to reflect future events or changes in these expectations. Further, certain forward-looking statements are based on assumptions of future events which may not prove to be accurate. Factors that may impact such forward-looking statements include, among others: the Company's ability to successful integrate RSI Communities' homebuilding operations with its existing operations; any adverse effect on the Company's, or RSI Communities', business operations before or after the completion of the proposed acquisition the availability of labor and homebuilding materials and increased construction cycle times; the availability and timing of mortgage financing; adverse weather conditions; our financial leverage and level of indebtedness and any inability to comply with financial and other covenants under our debt instruments; continued volatility and worsening in general economic or geopolitical conditions; increased outside broker costs; changes in governmental laws and regulations; potential changes to the tax code; worsening in markets for residential housing; the impact of construction defect, product liability and home warranty claims, including the applicability and sufficiency of our insurance coverage; decline in real estate values resulting in impairment of our real estate assets; volatility in the banking industry, credit and capital markets; building moratorium or "slow-growth" or "no-growth" initiatives that could be implemented in states in which we operate; changes in mortgage and other interest rates; conditions in the capital, credit and financial markets, including mortgage lending standards and the availability of mortgage financing; changes in generally accepted accounting principles or interpretations of those principles; and additional factors discussed under the sections captioned "Risk Factors" included in our annual and quarterly reports filed with the Securities and Exchange Commission. The foregoing list is not exhaustive. New risk factors may emerge from time to time and it is not possible for management to predict all such risk factors or to assess the impact of such risk factors on our business. This presentation contains certain supplemental financial measures that are not calculated pursuant to U.S. GAAP. These non-GAAP measures are in addition to, not a substitute for or superior to, measures of financial performance prepared in accordance with GAAP. A reconciliation of non-GAAP measures to GAAP measures is contained in the Appendix to this presentation. A copy of the press release reporting the Company’s financial results for the three months and year ended December 31, 2017 is available on the Company's website at www.lyonhomes.com. This presentation contains market data and industry forecasts and projections prepared by independent research providers and consulting firms. Any forecasts prepared by these sources are based on data (including third-party data), models and experiences of various professionals, and are based on various assumptions (including the completeness and accuracy of third-party data), all of which are subject to change without notice. We have not independently verified the data obtained from these sources. Forecasts and other forward-looking information obtained from these sources are subject to the same qualifications and additional uncertainties regarding other forward-looking statements in this presentation, as set forth above.

Management Presenters William H. Lyon Chairman of the Board and Executive Chairman Matthew R. Zaist President and Chief Executive Officer Colin T. Severn Senior Vice President and Chief Financial Officer
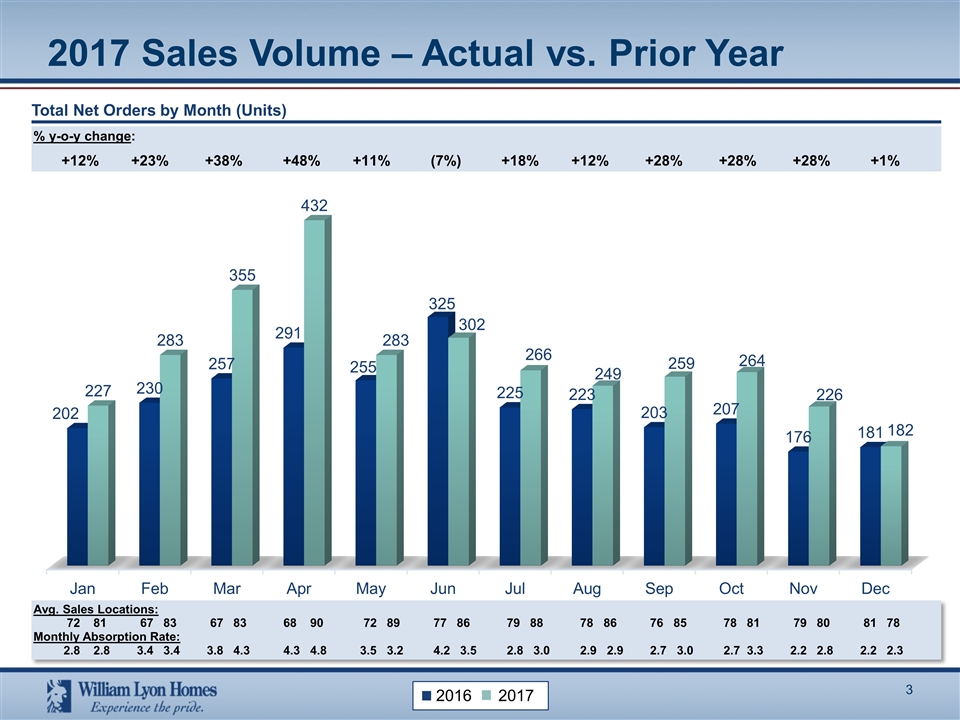
2017 Sales Volume – Actual vs. Prior Year Total Net Orders by Month (Units) % y-o-y change: +12% +23% +38% +48% +11% (7%) +18% +12% +28% +28% +28% +1% Avg. Sales Locations: 72 81 67 83 67 83 68 90 72 89 77 86 79 88 78 86 76 85 78 81 79 80 81 78 Monthly Absorption Rate: 2.8 2.8 3.4 3.4 3.8 4.3 4.3 4.8 3.5 3.2 4.2 3.5 2.8 3.0 2.9 2.9 2.7 3.0 2.7 3.3 2.2 2.8 2.2 2.3 2016 2017
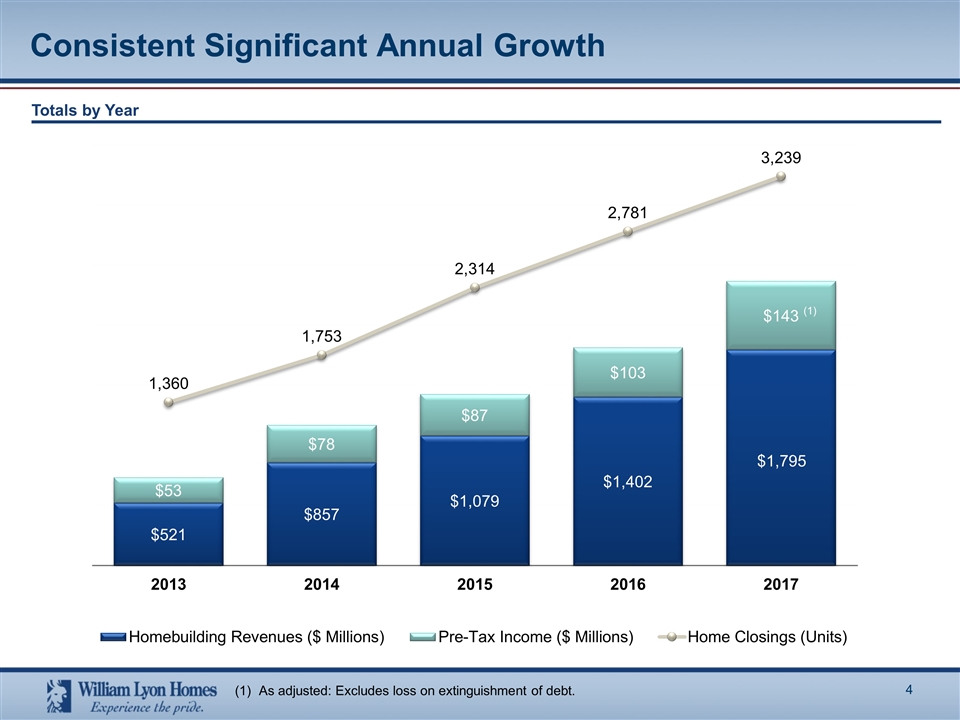
Consistent Significant Annual Growth Totals by Year (1) As adjusted: Excludes loss on extinguishment of debt.

Year over Year Comparisons % y-o-y change: +26% +17% +19% +19% % y-o-y change: +19% +22% +10% +1% % y-o-y change: +6% (4%) +7% +17% Net New Orders (Units) Orders Value (In Millions) Average Community Count Monthly Order Absorption Rate/Avg. Community % y-o-y change: +35% +31% +22% +24% Order ASP ($ In Thousands) $486 $523 $486 $545 $536 $550 $504 $523 2016 2017
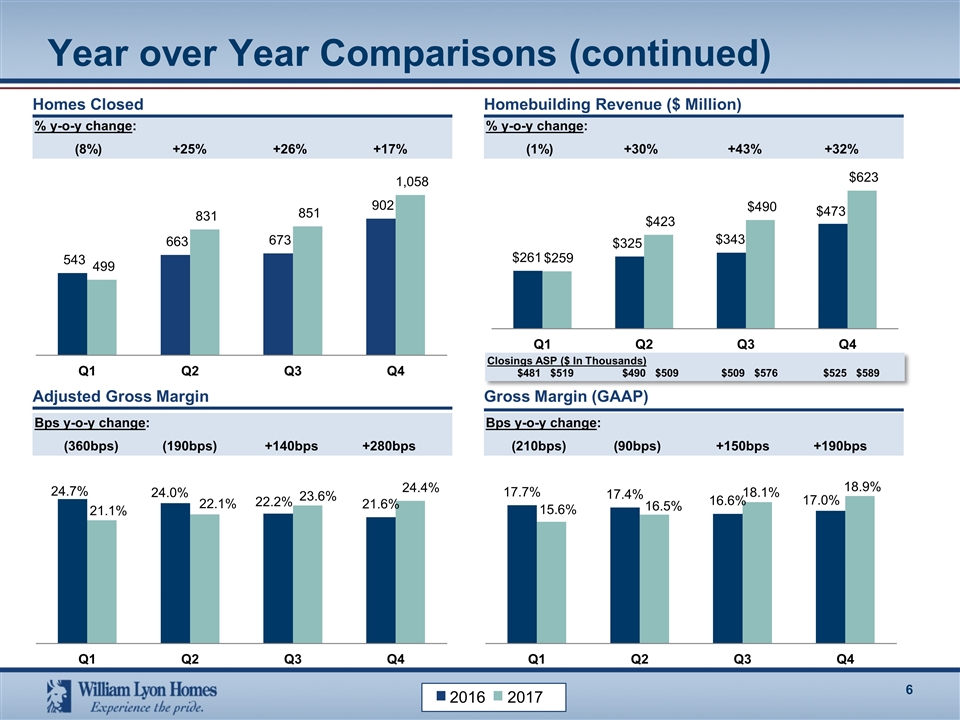
% y-o-y change: (1%) +30% +43% +32% Year over Year Comparisons (continued) % y-o-y change: (8%) +25% +26% +17% Homes Closed Homebuilding Revenue ($ Million) Bps y-o-y change: (360bps) (190bps) +140bps +280bps Bps y-o-y change: (210bps) (90bps) +150bps +190bps Adjusted Gross Margin Gross Margin (GAAP) Closings ASP ($ In Thousands) $481 $519 $490 $509 $509 $576 $525 $589 2016 2017
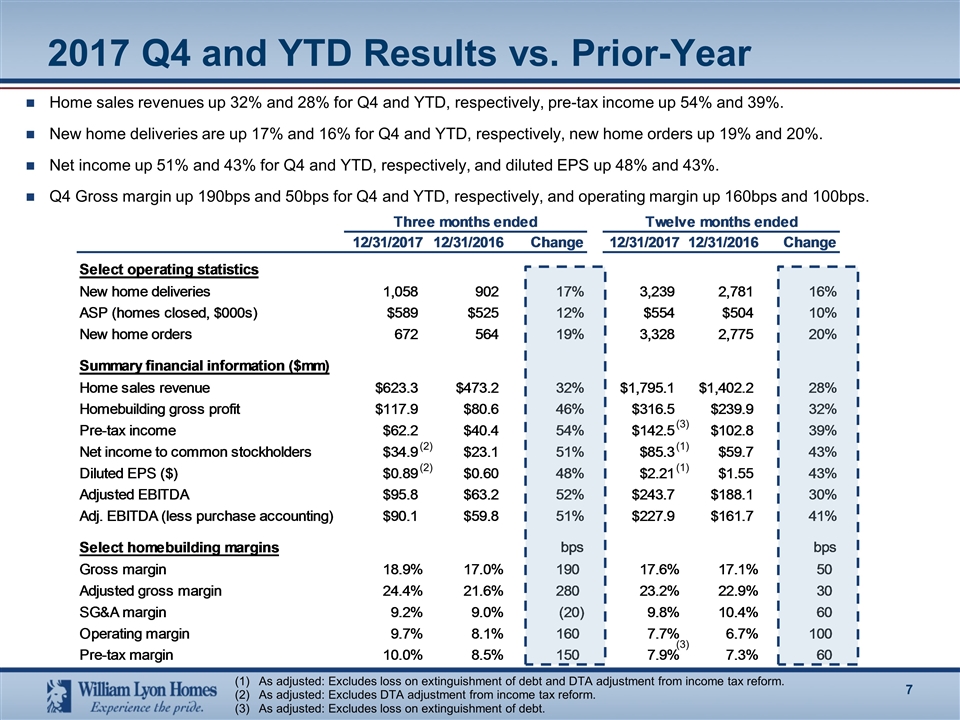
Home sales revenues up 32% and 28% for Q4 and YTD, respectively, pre-tax income up 54% and 39%. New home deliveries are up 17% and 16% for Q4 and YTD, respectively, new home orders up 19% and 20%. Net income up 51% and 43% for Q4 and YTD, respectively, and diluted EPS up 48% and 43%. Q4 Gross margin up 190bps and 50bps for Q4 and YTD, respectively, and operating margin up 160bps and 100bps. 2017 Q4 and YTD Results vs. Prior-Year As adjusted: Excludes loss on extinguishment of debt and DTA adjustment from income tax reform. As adjusted: Excludes DTA adjustment from income tax reform. As adjusted: Excludes loss on extinguishment of debt. (1) (1) (3) (3) (2) (2)
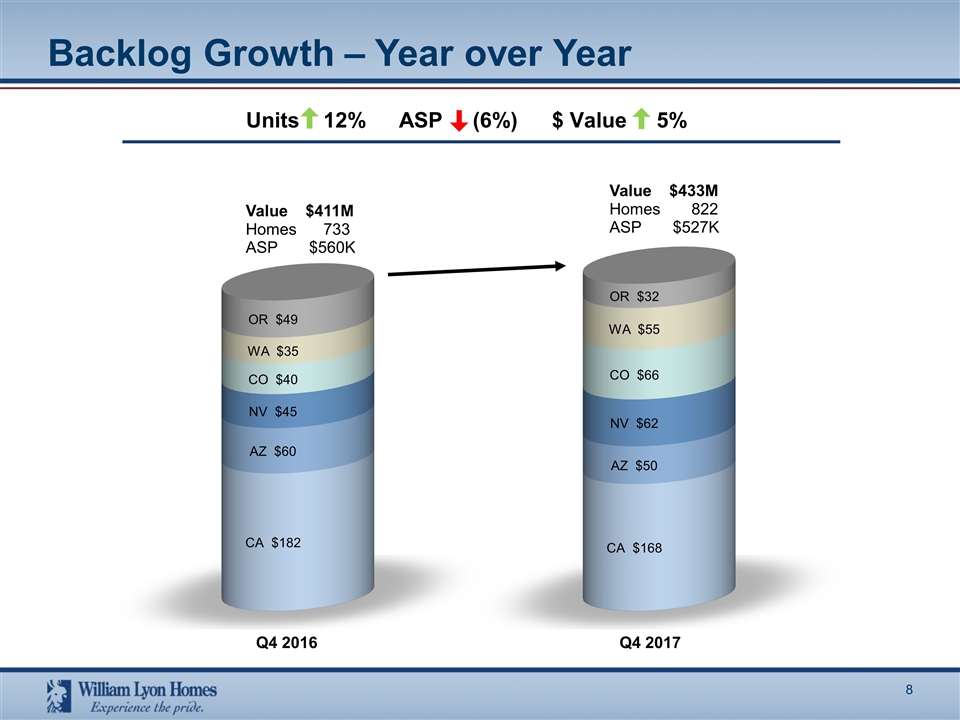
Backlog Growth – Year over Year Value $411M Homes 733 ASP $560K Q4 2016 Value $433M Homes 822 ASP $527K Units 12%ASP (6%)$ Value 5% Q4 2017
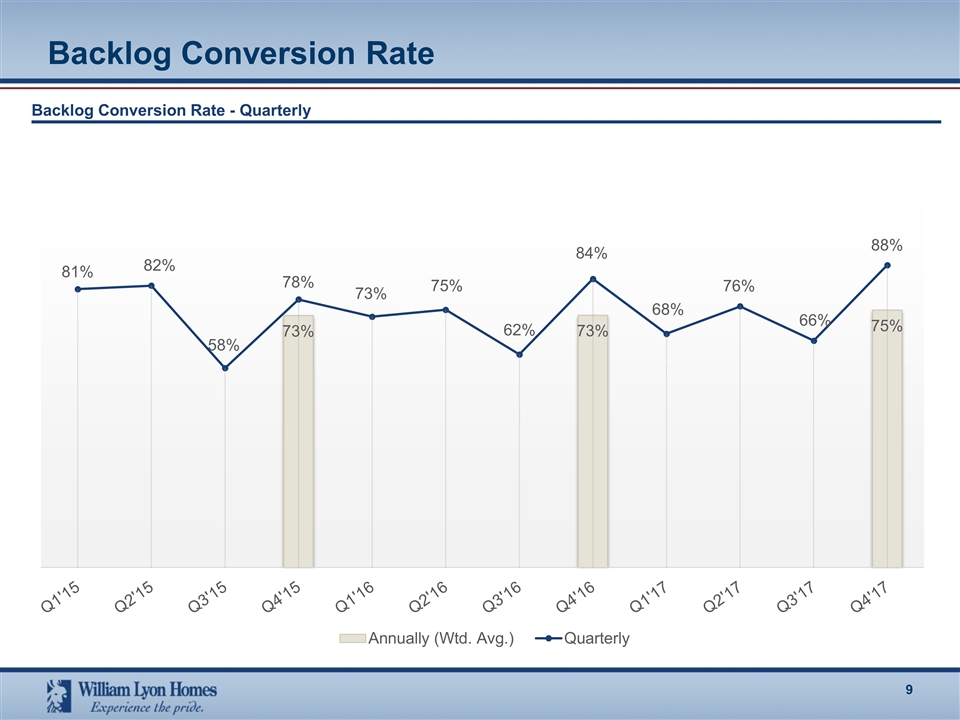
Backlog Conversion Rate Backlog Conversion Rate - Quarterly
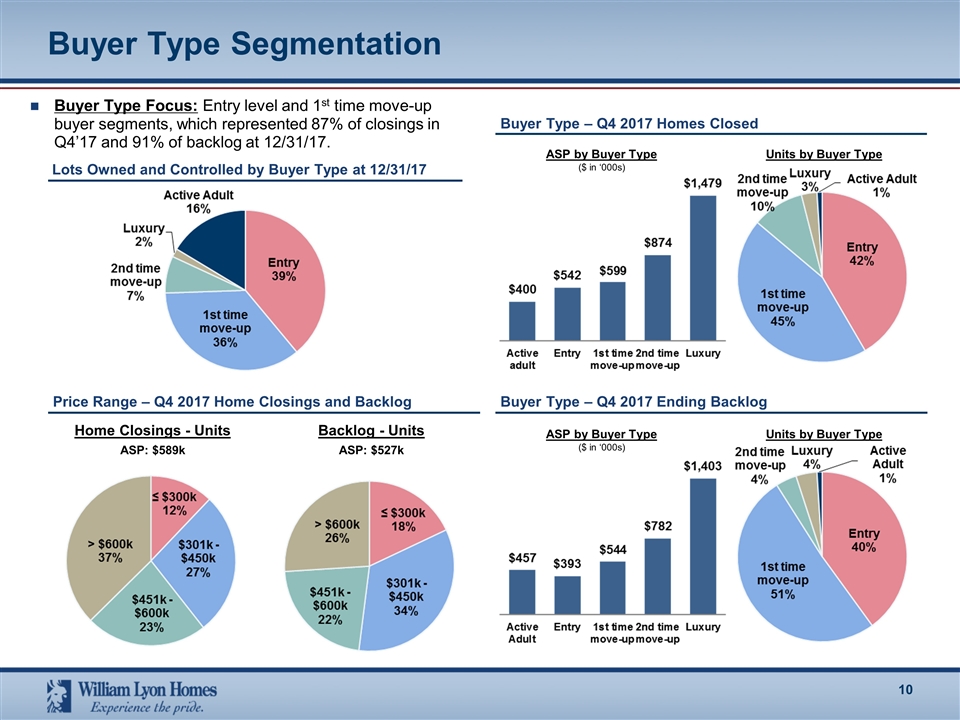
1 Buyer Type Focus: Entry level and 1st time move-up buyer segments, which represented 87% of closings in Q4’17 and 91% of backlog at 12/31/17. ASP by Buyer Type ($ in ‘000s) Units by Buyer Type Buyer Type Segmentation Buyer Type – Q4 2017 Homes Closed Price Range – Q4 2017 Home Closings and Backlog Home Closings - Units Backlog - Units ASP: $589k ASP: $527k Buyer Type – Q4 2017 Ending Backlog ASP by Buyer Type ($ in ‘000s) Units by Buyer Type Lots Owned and Controlled by Buyer Type at 12/31/17
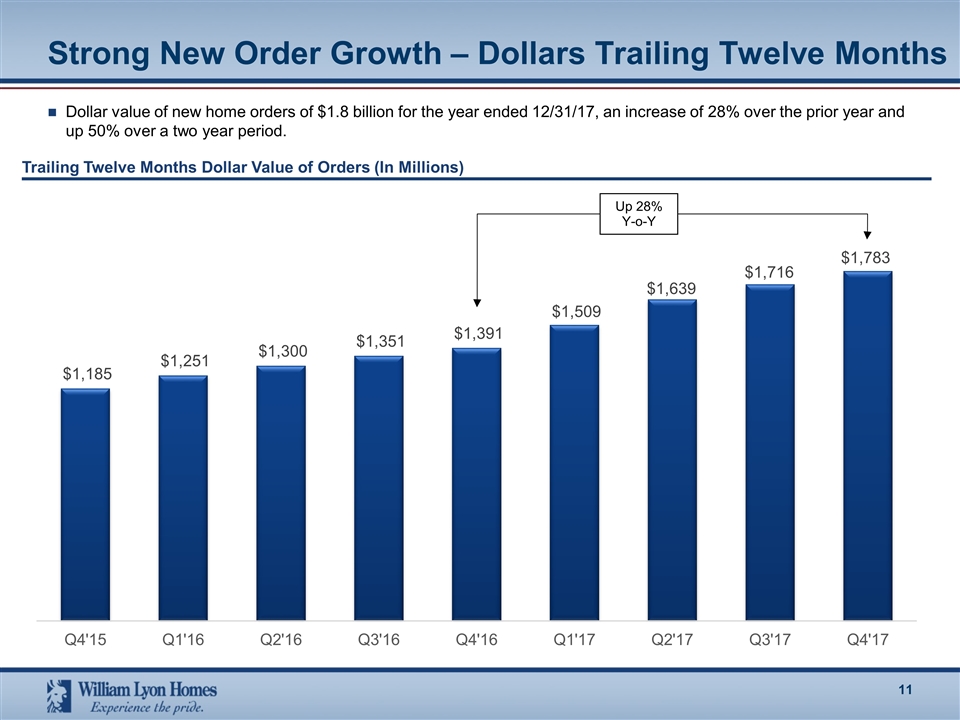
Strong New Order Growth – Dollars Trailing Twelve Months Dollar value of new home orders of $1.8 billion for the year ended 12/31/17, an increase of 28% over the prior year and up 50% over a two year period. Up 28% Y-o-Y Trailing Twelve Months Dollar Value of Orders (In Millions)
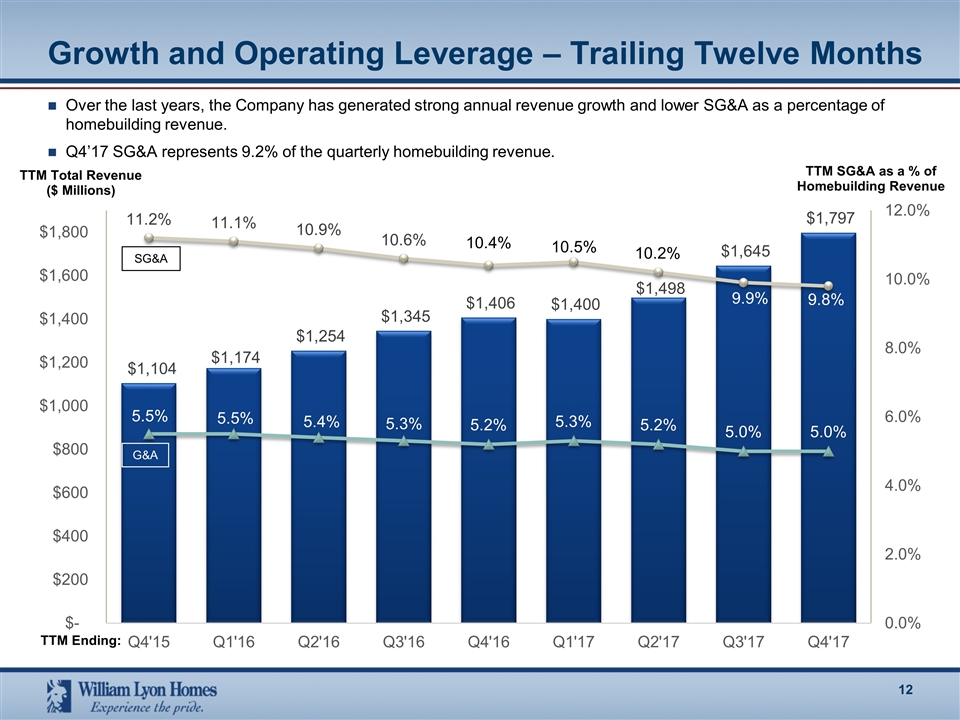
Growth and Operating Leverage – Trailing Twelve Months Over the last years, the Company has generated strong annual revenue growth and lower SG&A as a percentage of homebuilding revenue. Q4’17 SG&A represents 9.2% of the quarterly homebuilding revenue. TTM Total Revenue ($ Millions) TTM Ending: TTM SG&A as a % of Homebuilding Revenue SG&A G&A
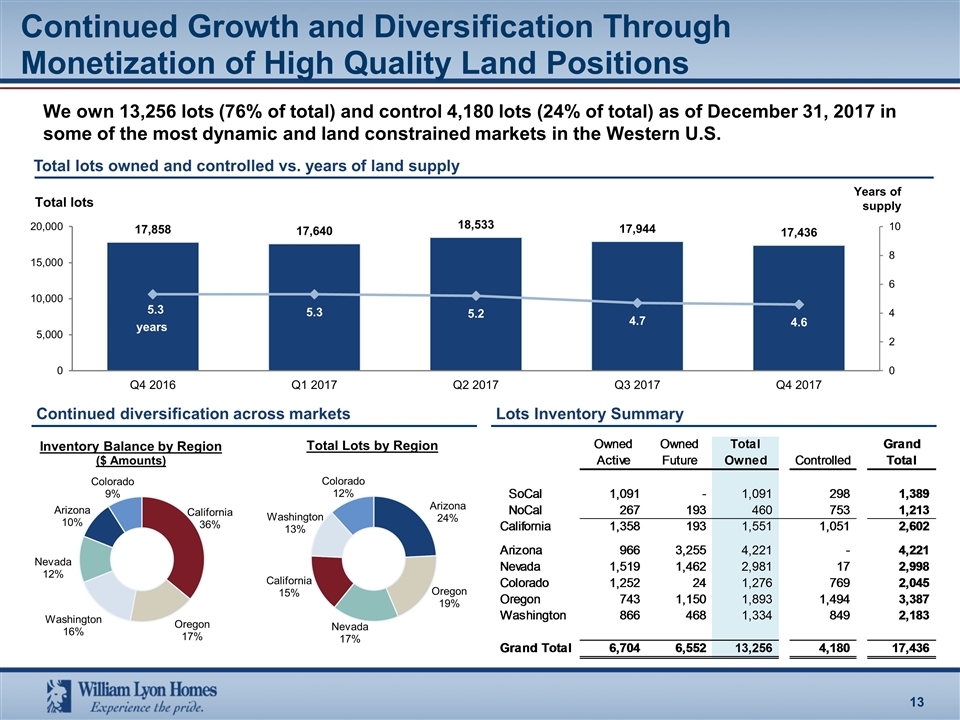
Continued Growth and Diversification Through Monetization of High Quality Land Positions Total lots owned and controlled vs. years of land supply Inventory Balance by Region ($ Amounts) Continued diversification across markets Lots Inventory Summary We own 13,256 lots (76% of total) and control 4,180 lots (24% of total) as of December 31, 2017 in some of the most dynamic and land constrained markets in the Western U.S. Total Lots by Region
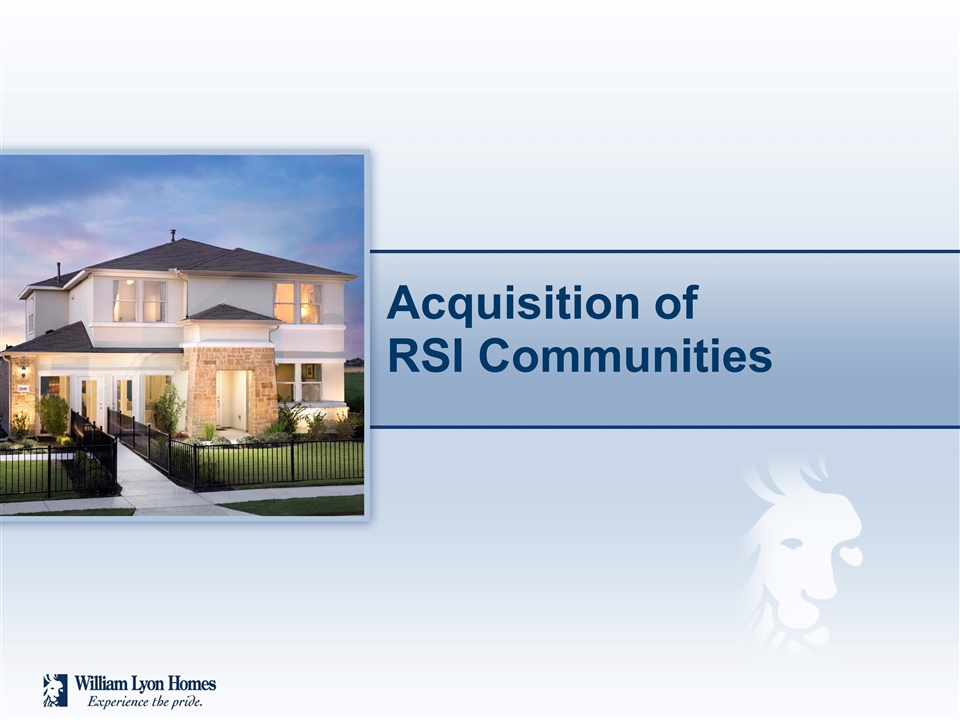
Acquisition of RSI Communities
Transaction Overview This morning we announced a definite agreement to acquire (the “Acquisition”) RSI Communities LLC and three additional homebuilding assets currently managed by RSI Communities LLC (together, “RSI” or “RSI Communities”) Total cash purchase price of approximately $460 million All cash No debt assumed Purchase price subject to customary working capital adjustment upon closing Anticipated transaction closing in the first quarter of 2018 We intend to fund the transaction through a combination of cash on hand, debt and approximately $200 million of land banking proceeds Unless otherwise indicated in this presentation, all of RSI’s historical financial information and operational data presented herein includes the three additional homebuilding assets acquired as part of the acquisition. (1)
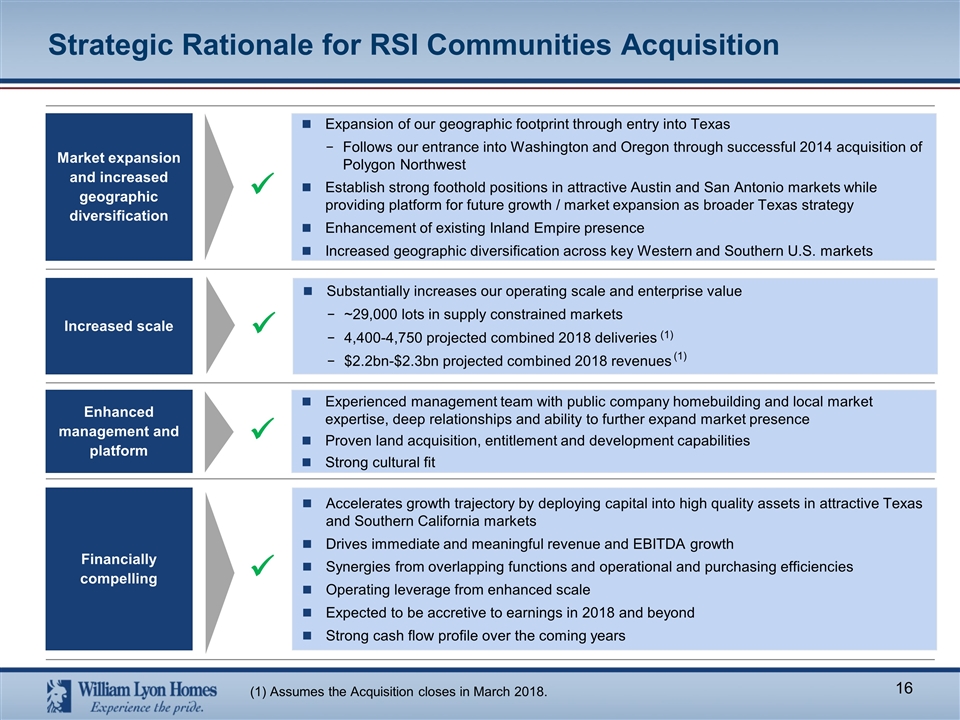
Strategic Rationale for RSI Communities Acquisition Market expansion and increased geographic diversification Expansion of our geographic footprint through entry into Texas Follows our entrance into Washington and Oregon through successful 2014 acquisition of Polygon Northwest Establish strong foothold positions in attractive Austin and San Antonio markets while providing platform for future growth / market expansion as broader Texas strategy Enhancement of existing Inland Empire presence Increased geographic diversification across key Western and Southern U.S. markets ü Enhanced management and platform Experienced management team with public company homebuilding and local market expertise, deep relationships and ability to further expand market presence Proven land acquisition, entitlement and development capabilities Strong cultural fit ü Increased scale Substantially increases our operating scale and enterprise value ~29,000 lots in supply constrained markets 4,400-4,750 projected combined 2018 deliveries $2.2bn-$2.3bn projected combined 2018 revenues ü Financially compelling Accelerates growth trajectory by deploying capital into high quality assets in attractive Texas and Southern California markets Drives immediate and meaningful revenue and EBITDA growth Synergies from overlapping functions and operational and purchasing efficiencies Operating leverage from enhanced scale Expected to be accretive to earnings in 2018 and beyond Strong cash flow profile over the coming years ü (1) Assumes the Acquisition closes in March 2018. (1) (1)
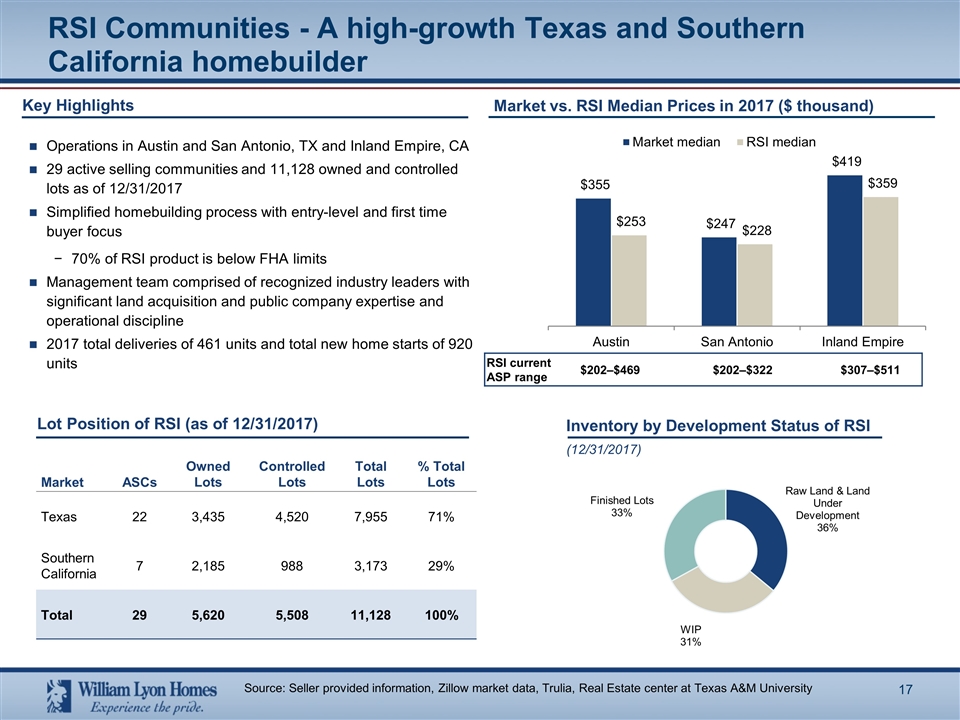
RSI Communities - A high-growth Texas and Southern California homebuilder Lot Position of RSI (as of 12/31/2017) Key Highlights Operations in Austin and San Antonio, TX and Inland Empire, CA 29 active selling communities and 11,128 owned and controlled lots as of 12/31/2017 Simplified homebuilding process with entry-level and first time buyer focus 70% of RSI product is below FHA limits Management team comprised of recognized industry leaders with significant land acquisition and public company expertise and operational discipline 2017 total deliveries of 461 units and total new home starts of 920 units Market ASCs Owned Lots Controlled Lots Total Lots % Total Lots Texas 22 3,435 4,520 7,955 71% Southern California 7 2,185 988 3,173 29% Total 29 5,620 5,508 11,128 100% Market vs. RSI Median Prices in 2017 ($ thousand) RSI current ASP range $202–$469 $202–$322 $307–$511 Inventory by Development Status of RSI (12/31/2017) Source: Seller provided information, Zillow market data, Trulia, Real Estate center at Texas A&M University
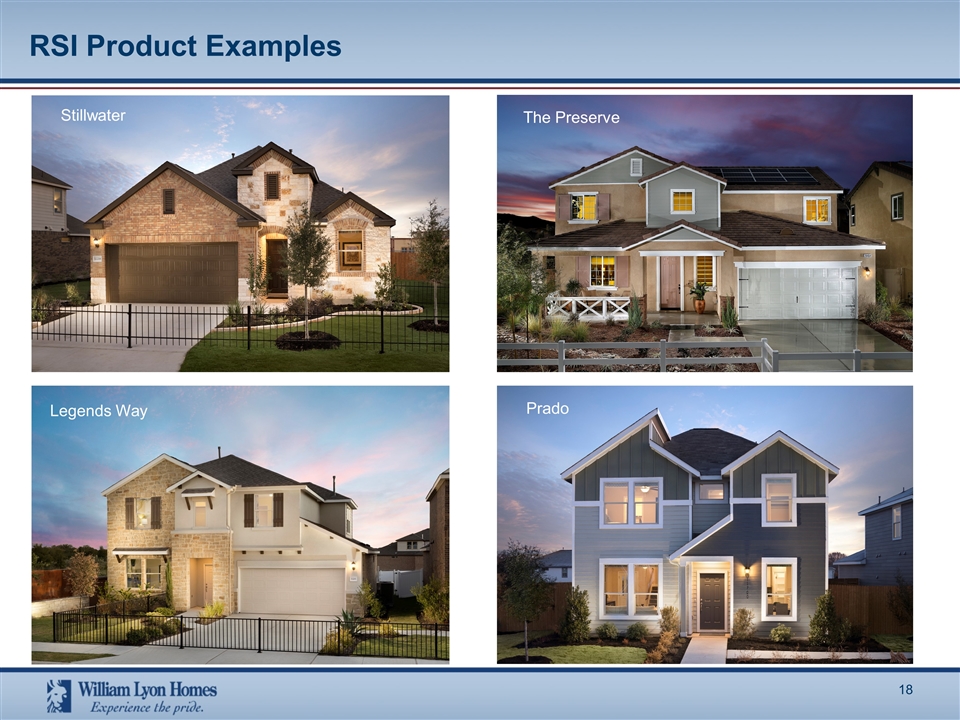
RSI Product Examples The Preserve Pinehurst Willow Creek - Angelina Stillwater Legends Way Prado
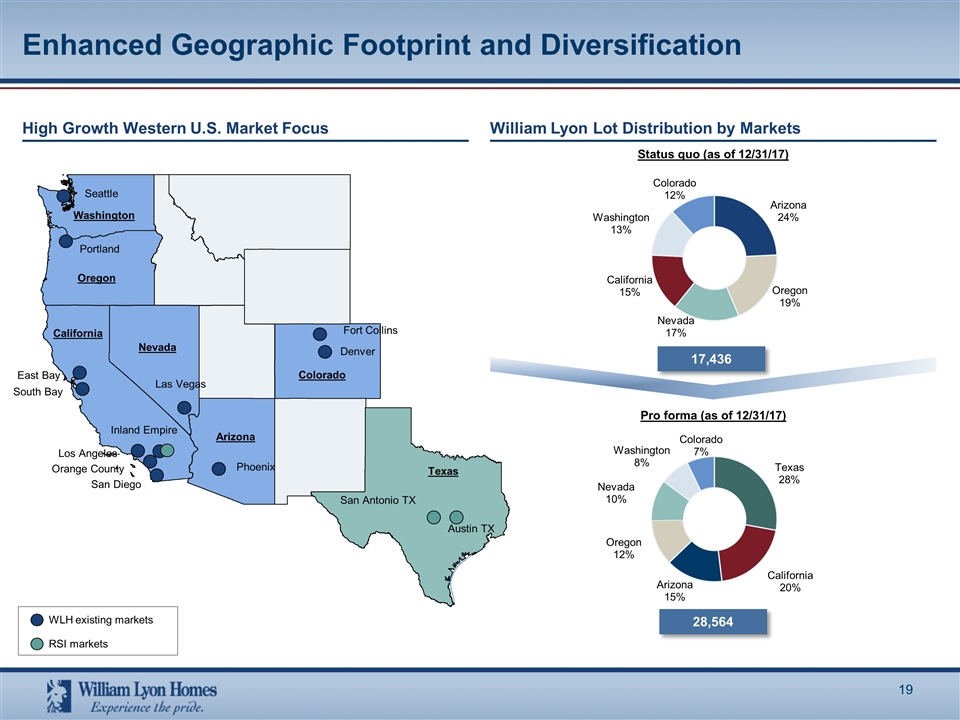
Enhanced Geographic Footprint and Diversification High Growth Western U.S. Market Focus WLH existing markets RSI markets Seattle Portland East Bay South Bay Inland Empire Los Angeles Orange County San Diego Washington Oregon California Arizona Texas Colorado Fort Collins Denver Las Vegas Phoenix Austin TX San Antonio TX Nevada William Lyon Lot Distribution by Markets Status quo (as of 12/31/17) Pro forma (as of 12/31/17) 28,564 17,436
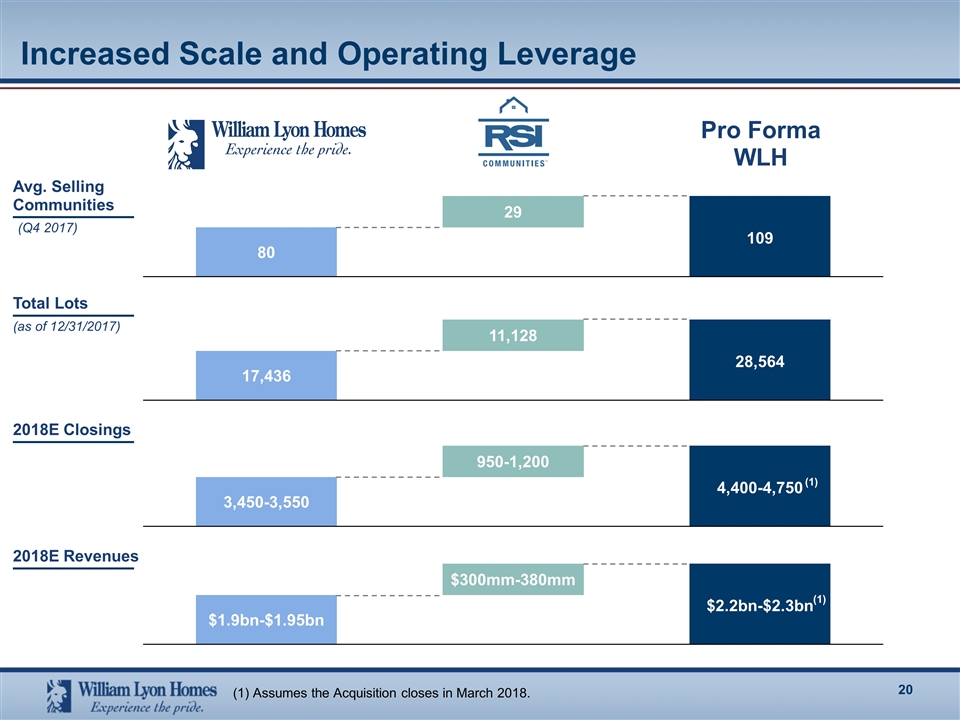
Increased Scale and Operating Leverage Avg. Selling Communities 2018E Closings 2018E Revenues Total Lots (as of 12/31/2017) Pro Forma WLH (Q4 2017) (1) (1) (1) Assumes the Acquisition closes in March 2018.
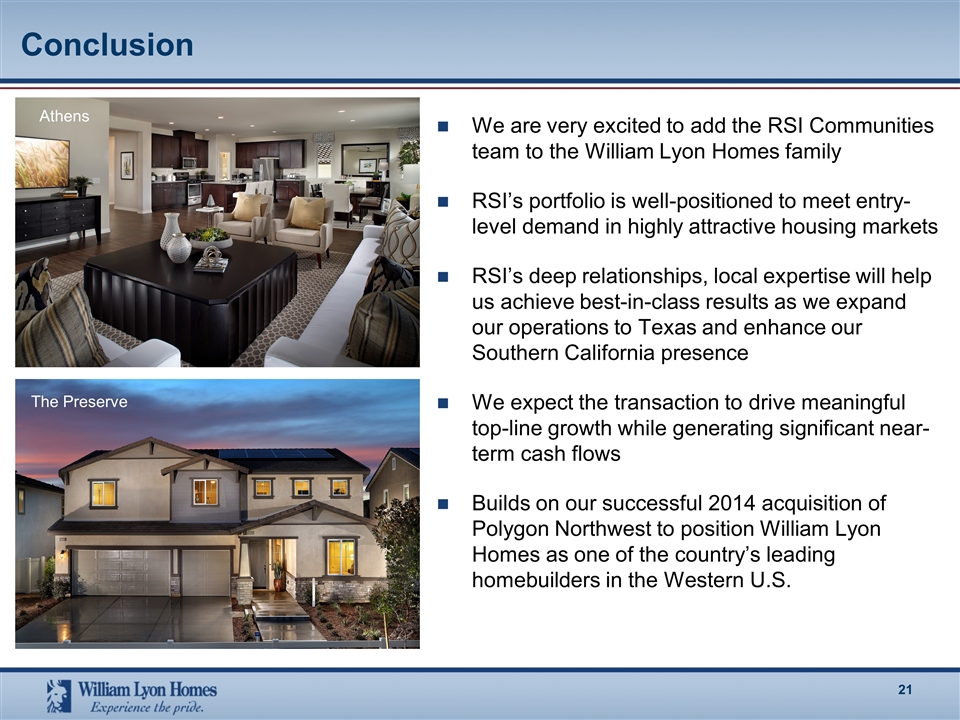
Conclusion We are very excited to add the RSI Communities team to the William Lyon Homes family RSI’s portfolio is well-positioned to meet entry-level demand in highly attractive housing markets RSI’s deep relationships, local expertise will help us achieve best-in-class results as we expand our operations to Texas and enhance our Southern California presence We expect the transaction to drive meaningful top-line growth while generating significant near-term cash flows Builds on our successful 2014 acquisition of Polygon Northwest to position William Lyon Homes as one of the country’s leading homebuilders in the Western U.S. Athens The Preserve
Appendix
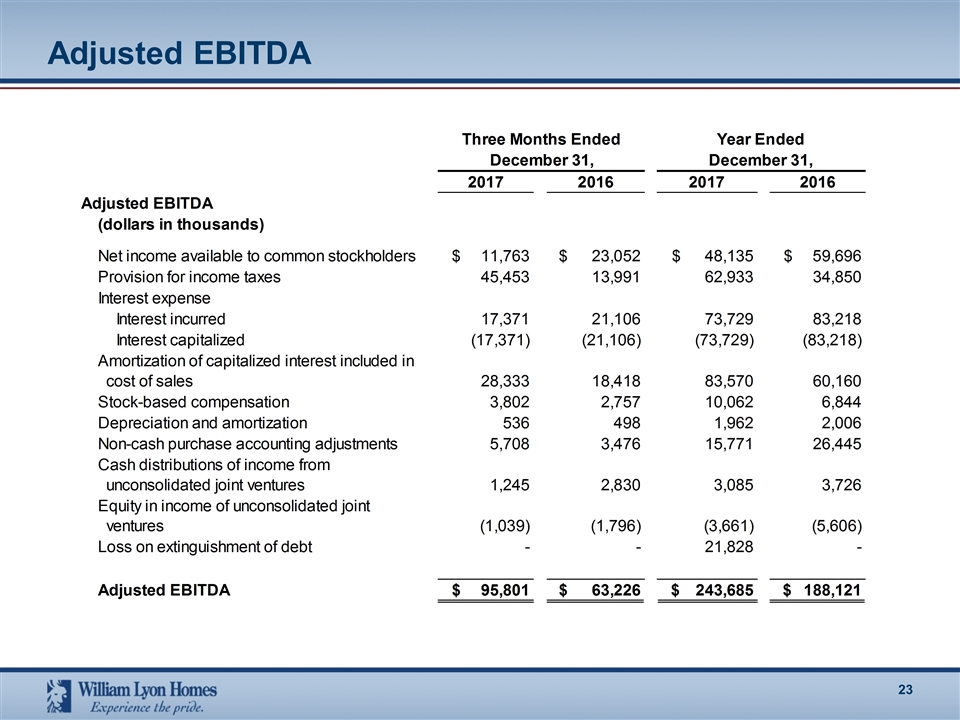
Adjusted EBITDA
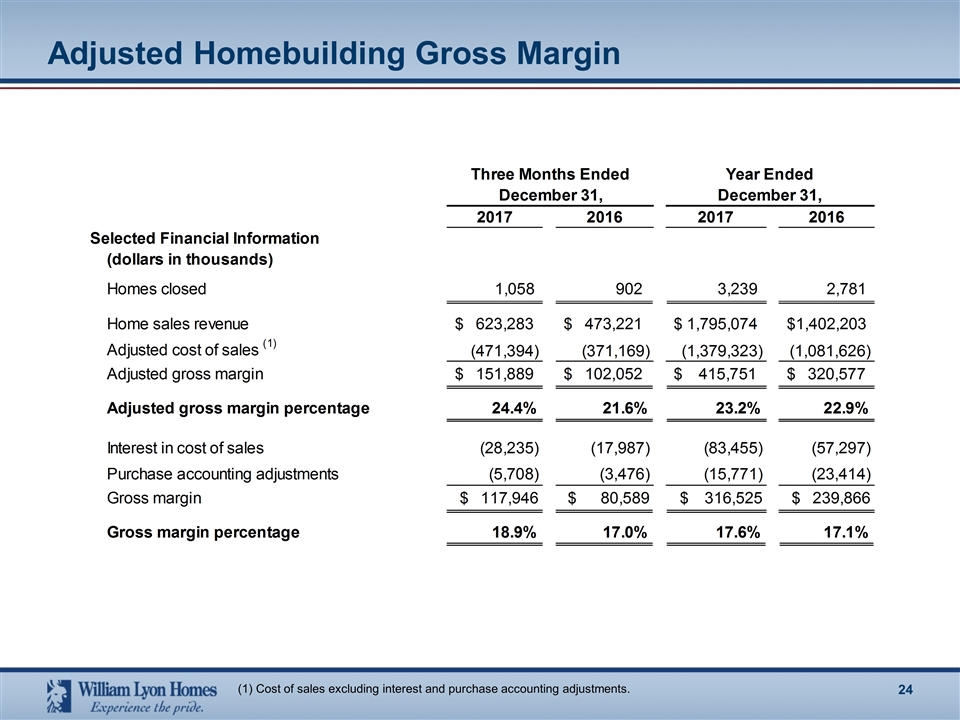
Adjusted Homebuilding Gross Margin (1) Cost of sales excluding interest and purchase accounting adjustments.
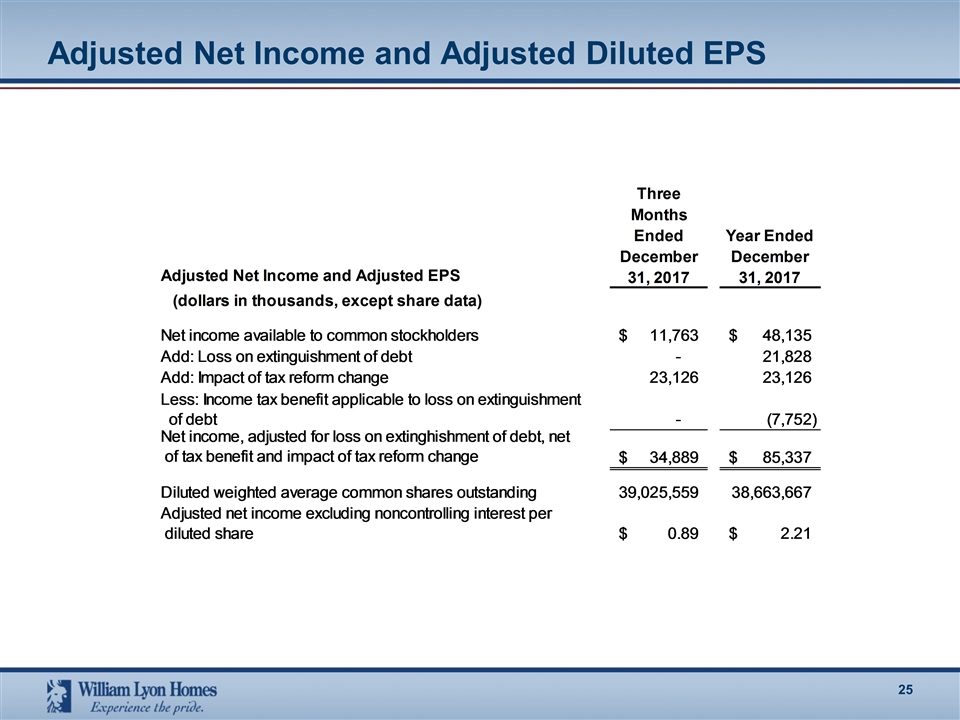
Adjusted Net Income and Adjusted Diluted EPS


