
CUSTOMER FIRST • INTEGRITY • ACCOUNTABILITY • INNOVATION • PERSONAL DEVELOPMENT • TEAMWORK 1 INVESTOR PRESENTATION November 9, 2021
CUSTOMER FIRST • INTEGRITY • ACCOUNTABILITY • INNOVATION • PERSONAL DEVELOPMENT • TEAMWORK 2 This presentation contains forward-looking statements. Examples of such forward-looking statements include but are not limited to: (i) statements regarding the Company’s results of operations and financial condition, (ii) statements of plans, objectives or goals of the Company or its management, including those related to financing, products or services, (iii) statements of future economic performance; and (iv) statements of assumptions underlying such statements. Words such as “believes”, “anticipates”, “expects”, “intends”, “forecasts” and “plans” and similar expressions are intended to identify forward-looking statements but are not the exclusive means of identifying such statements. By their very nature, forward-looking statements involve inherent risks and uncertainties, both general and specific, and risks exist that the predictions, forecasts, projections and other forward-looking statements will not be achieved. The Company cautions that a number of important factors could cause actual results to differ materially from the plans, objectives, expectations, estimates and intentions expressed in such forward-looking statements. These factors include, but are not limited to: (i) future revenues being lower than expected; (ii) increasing competitive pressures in the industry; (iii) general economic conditions or conditions affecting demand for the services offered by us in the markets in which we operate, both domestically and internationally, including as a result of the post-Brexit regulation, being less favorable than expected; (iv) worldwide economic and business conditions and conditions in the industries in which we operate; (v) fluctuations in the cost of raw materials and utilities; (vi) currency fluctuations and hedging risks; (vii) our ability to protect our intellectual property; and (viii) the significant amount of indebtedness we have incurred and may incur and the obligations to service such indebtedness and to comply with the covenants contained therein; (ix) risks related to the impact of the global COVID-19 pandemic, such as the scope and duration of the outbreak, government actions and restrictive measures implemented in response, supply chain disruptions and other impacts to the business, and the Company’s ability to execute business continuity plans, as a result of the COVID-19 pandemic. The Company cautions that the foregoing list of important factors is not exhaustive. These factors are more fully discussed in the sections “Forward-Looking Statements” and “Risk factors” in our Annual Report on Form 10-K for the year ended December 31,2020, which was filed with the U.S. Securities and Exchange Commission on March 2, 2021. When relying on forward- looking statements to make decisions with respect to the Company, investors and others should carefully consider the foregoing factors and other uncertainties and events. Such forward-looking statements speak only as of the date on which they are made, and the Company does not undertake any obligation to update or revise any of them, whether as a result of new information, future events or otherwise. FORWARD-LOOKING STATEMENTS

CUSTOMER FIRST • INTEGRITY • ACCOUNTABILITY • INNOVATION • PERSONAL DEVELOPMENT • TEAMWORK 3 Industrial company focused on advanced material applications 54% 66% 46% 34% Sales Adj. EBITDA Elektron Advanced Materials High Performance Gas Cylinders 1 As of 10/31/2021 2 Adjusted non-GAAP numbers. Reconciliation in Appendix and published in 10-K, available at www.luxfer.com 3 Change noted over Q4 2016 TTM. COMPANY SNAPSHOT Founded 1898 Headquarters U.K. Market Cap1 ~$582M Net Debt/Adj. EBITDA2 0.6x ROIC on Adj. Earnings2 19.0% FINANCIALS (Q3 2021 TTM) Net Sales $358M -%3 Adj. EBITDA2 $63M 6.1%3 Adj. EBITDA2 Margin 18% 5.5%3 Adj. EPS2 $1.28 9.2%3 Net Debt $35M $68M3 Q3 2021 TTM - Sales and Adj. EBITDA2 by Segment 33% 31% 36% Q3 2021 TTM Sales by Global End Market Exposure Eco Friendly Transportation General Industrial Defense & First Response 4-year CAGR/Change $358M LUXFER OVERVIEW (NYSE: LXFR)
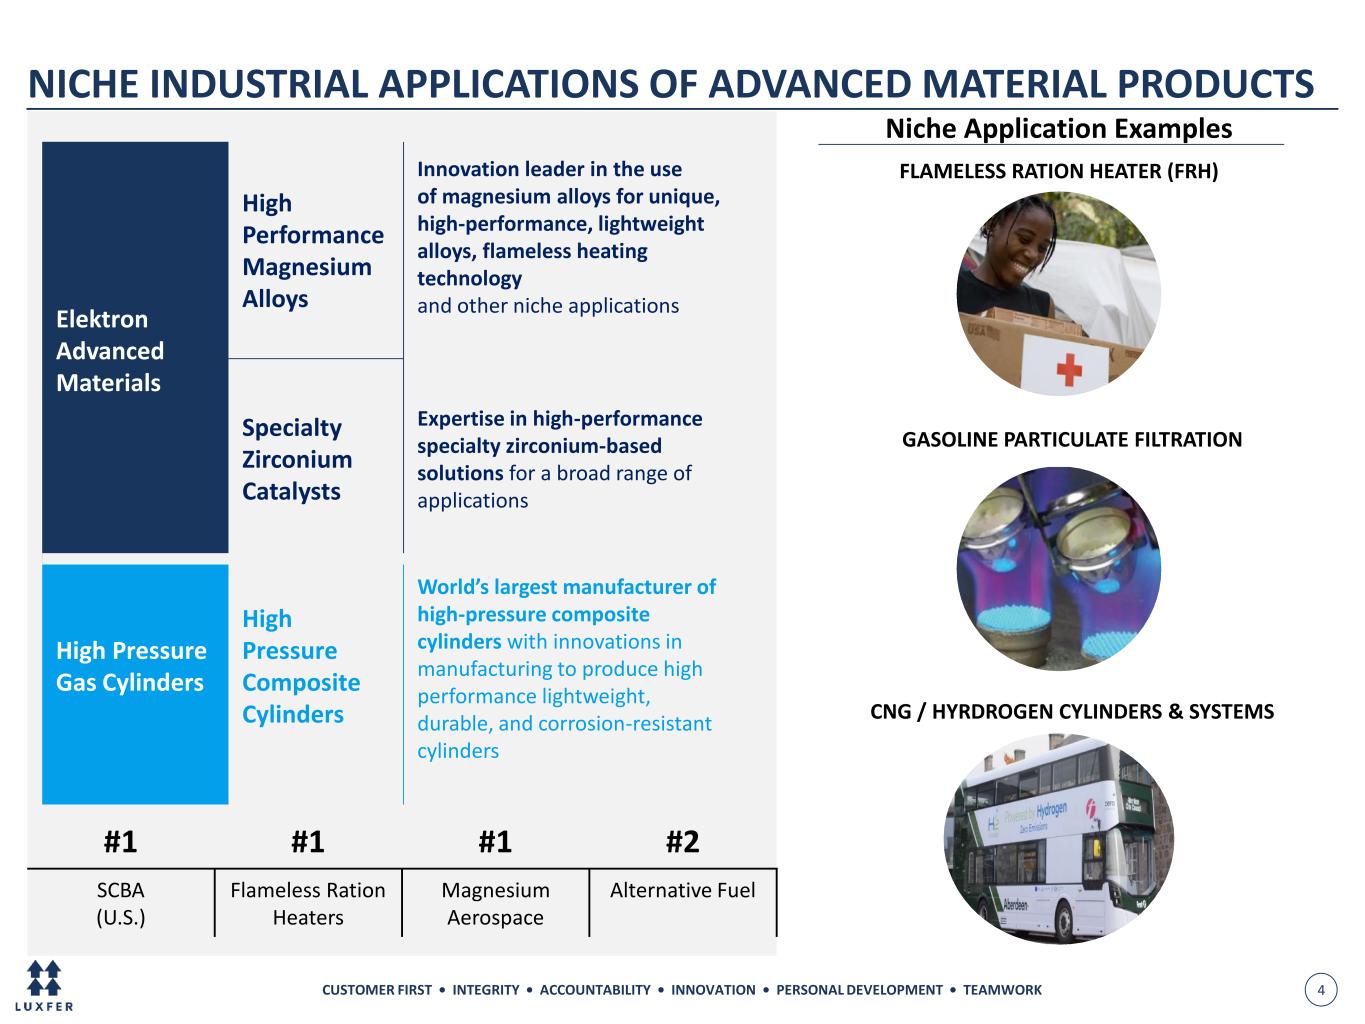
CUSTOMER FIRST • INTEGRITY • ACCOUNTABILITY • INNOVATION • PERSONAL DEVELOPMENT • TEAMWORK 4 Niche Application Examples Elektron Advanced Materials High Performance Magnesium Alloys Innovation leader in the use of magnesium alloys for unique, high-performance, lightweight alloys, flameless heating technology and other niche applications Specialty Zirconium Catalysts Expertise in high-performance specialty zirconium-based solutions for a broad range of applications High Pressure Gas Cylinders High Pressure Composite Cylinders World’s largest manufacturer of high-pressure composite cylinders with innovations in manufacturing to produce high performance lightweight, durable, and corrosion-resistant cylinders GASOLINE PARTICULATE FILTRATION #1 #1 #1 #2 SCBA (U.S.) Flameless Ration Heaters Magnesium Aerospace Alternative Fuel FLAMELESS RATION HEATER (FRH) NICHE INDUSTRIAL APPLICATIONS OF ADVANCED MATERIAL PRODUCTS CNG / HYRDROGEN CYLINDERS & SYSTEMS
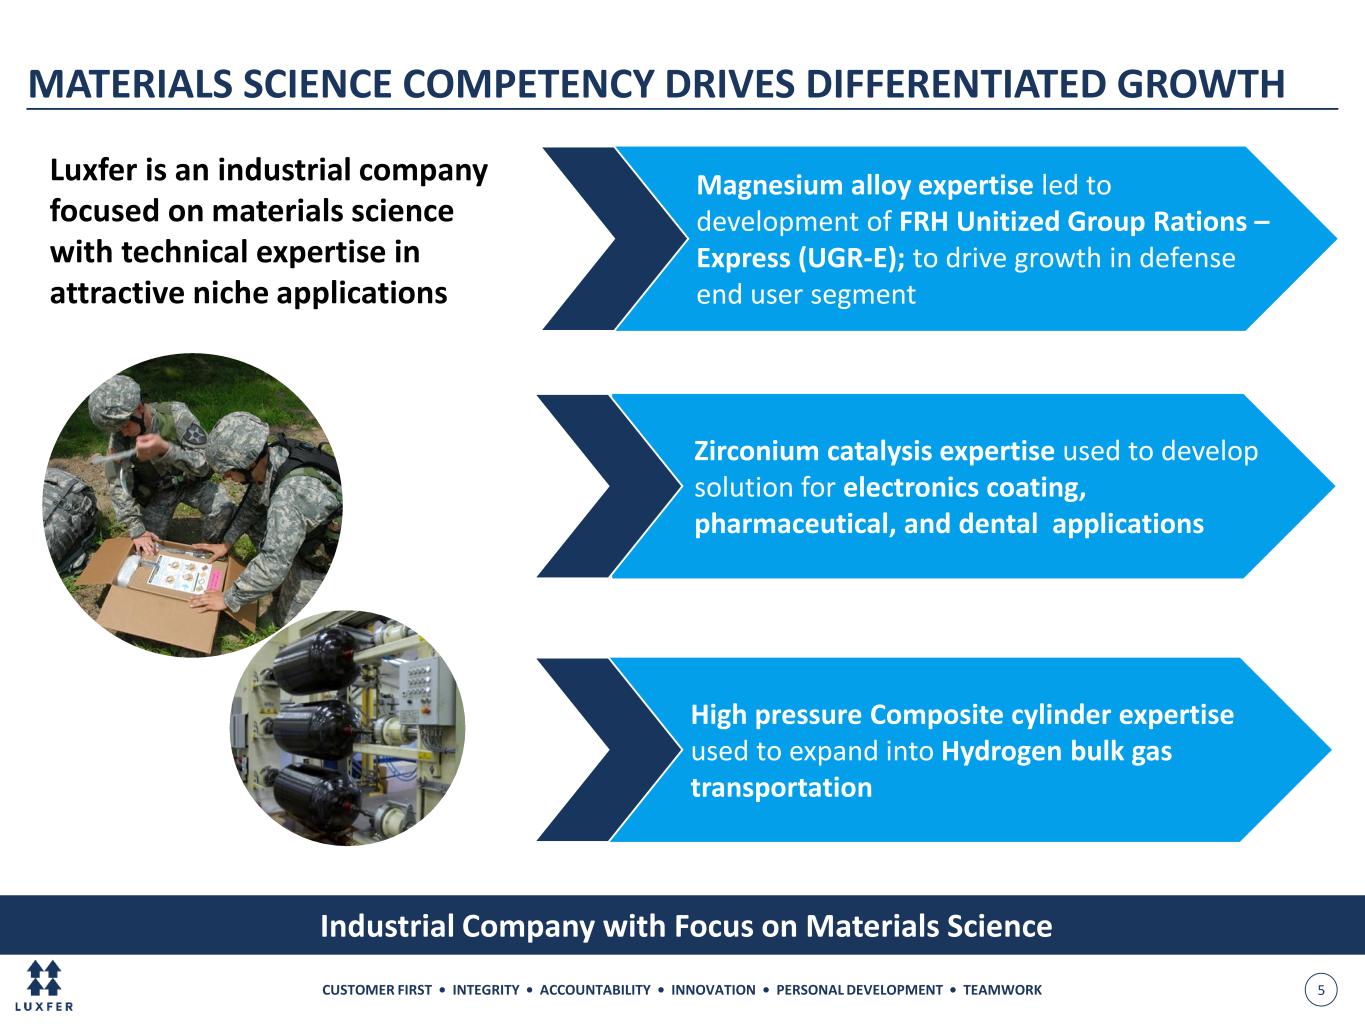
CUSTOMER FIRST • INTEGRITY • ACCOUNTABILITY • INNOVATION • PERSONAL DEVELOPMENT • TEAMWORK 5 Zirconium catalysis expertise used to develop solution for electronics coating, pharmaceutical, and dental applications Industrial Company with Focus on Materials Science MATERIALS SCIENCE COMPETENCY DRIVES DIFFERENTIATED GROWTH Luxfer is an industrial company focused on materials science with technical expertise in attractive niche applications High pressure Composite cylinder expertise used to expand into Hydrogen bulk gas transportation Magnesium alloy expertise led to development of FRH Unitized Group Rations – Express (UGR-E); to drive growth in defense end user segment

CUSTOMER FIRST • INTEGRITY • ACCOUNTABILITY • INNOVATION • PERSONAL DEVELOPMENT • TEAMWORK 6 Light Weighting Clean Environment & Emissions Safe & Healthy Lifestyle • Magnesium & carbon fiber composite products • Aerospace alloys • CNG & Hydrogen Storage • Auto emission control • Meals Ready-to-Eat • Portable oxygen cylinders for medical applications and SCBA Significant Tailwinds for Growth 5-year Industry CAGR (2021-2026) Profitability (EBITDA%) High Performance Gas Cylinders 4% - 8% 10% - 15% Elektron Advanced Materials1 3% - 7% 15% - 25% ~$10B2 ~$8B ~$2B 1 Defined as high performance alloys, ceramics, and composites used in general industrial, transportation, defense, and medical applications. Target addressable high-performance market is 10% of the total available market which is $85B in size. 2 Luxfer analysis, industry annual reports, Deloitte, Spears and Associates, Mordor intelligence, Grandview research, William Blair. Large Addressable Market Higher Growth Opportunity Alignment with Secular Growth Trends SOLID UNDERLYING GROWTH IN LARGE ADDRESSABLE MARKET
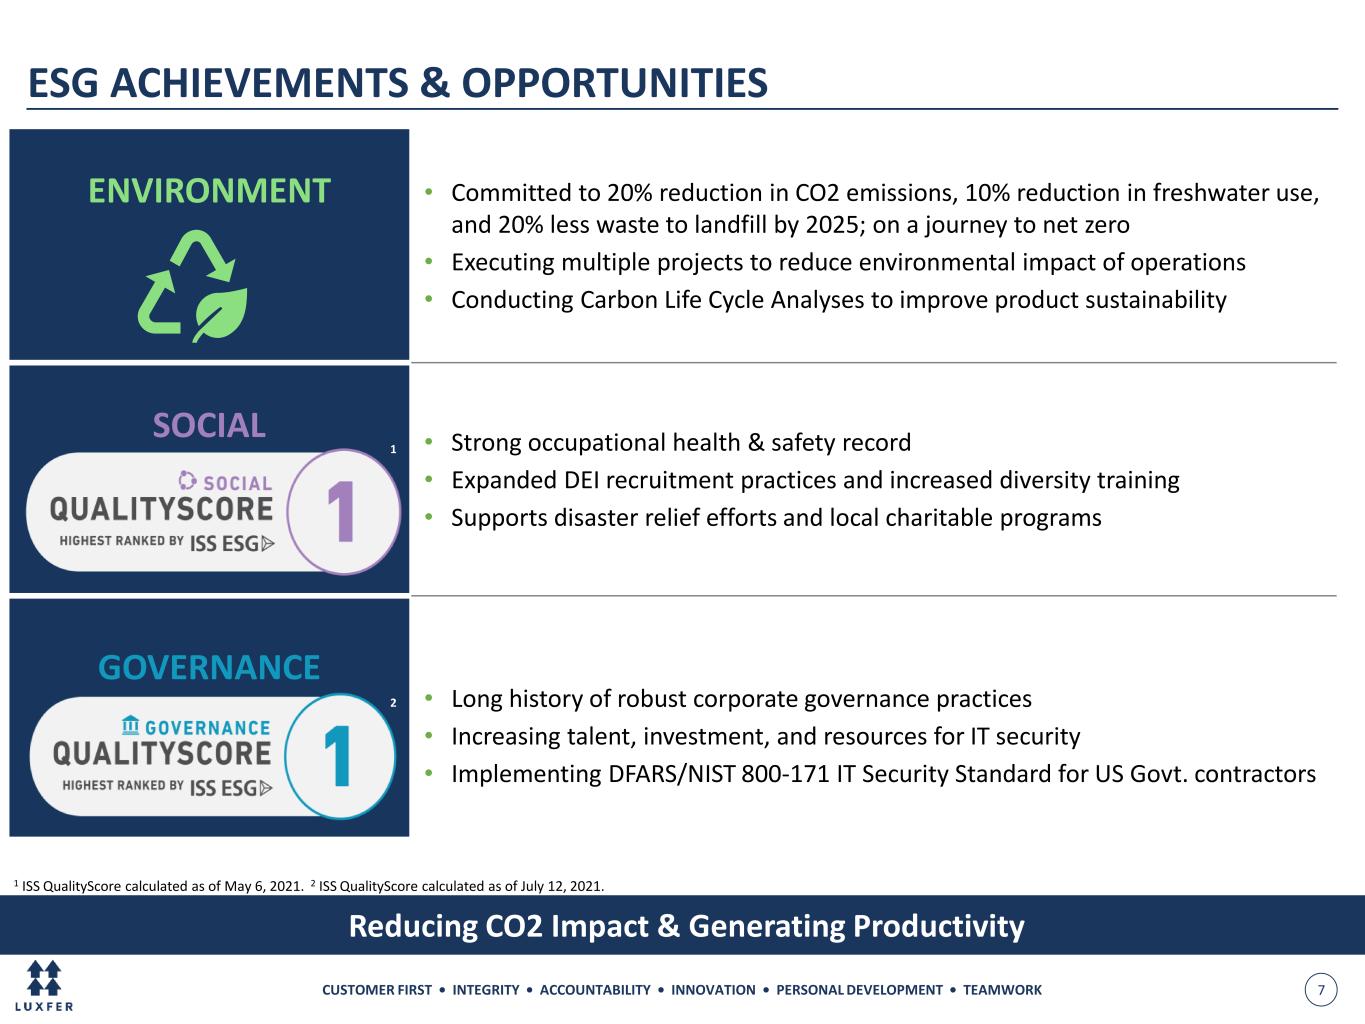
CUSTOMER FIRST • INTEGRITY • ACCOUNTABILITY • INNOVATION • PERSONAL DEVELOPMENT • TEAMWORK 7 ESG ACHIEVEMENTS & OPPORTUNITIES Reducing CO2 Impact & Generating Productivity ENVIRONMENT • Committed to 20% reduction in CO2 emissions, 10% reduction in freshwater use, and 20% less waste to landfill by 2025; on a journey to net zero • Executing multiple projects to reduce environmental impact of operations • Conducting Carbon Life Cycle Analyses to improve product sustainability SOCIAL 1 • Strong occupational health & safety record • Expanded DEI recruitment practices and increased diversity training • Supports disaster relief efforts and local charitable programs GOVERNANCE 2 • Long history of robust corporate governance practices • Increasing talent, investment, and resources for IT security • Implementing DFARS/NIST 800-171 IT Security Standard for US Govt. contractors 1 ISS QualityScore calculated as of May 6, 2021. 2 ISS QualityScore calculated as of July 12, 2021.
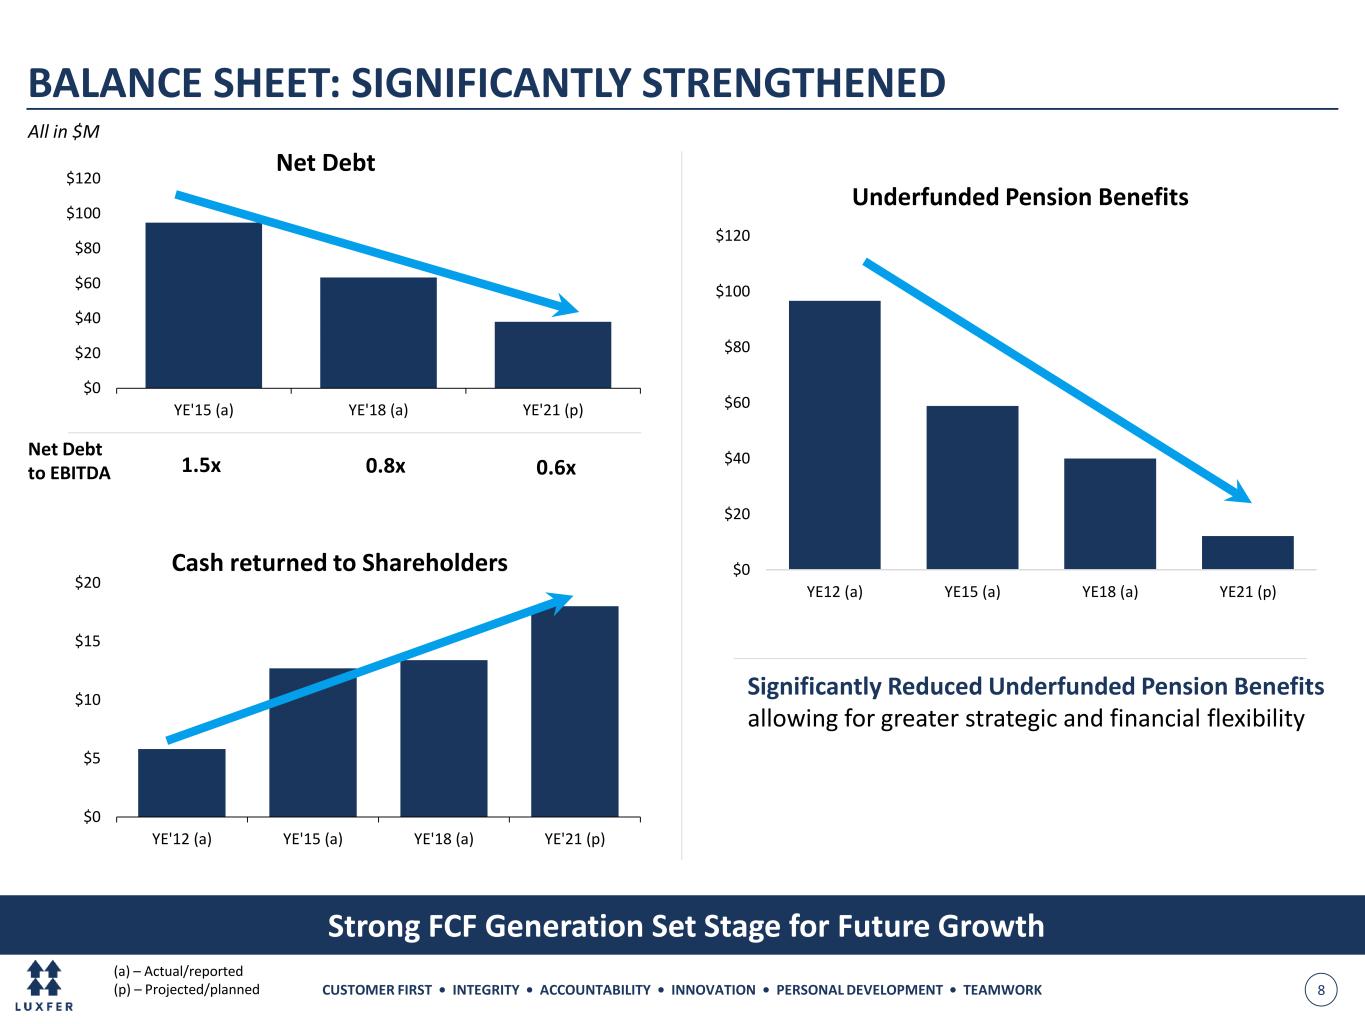
CUSTOMER FIRST • INTEGRITY • ACCOUNTABILITY • INNOVATION • PERSONAL DEVELOPMENT • TEAMWORK 8 Strong FCF Generation Set Stage for Future Growth $0 $20 $40 $60 $80 $100 $120 YE'15 (a) YE'18 (a) YE'21 (p) Net Debt All in $M 1.5x 0.6x Net Debt to EBITDA BALANCE SHEET: SIGNIFICANTLY STRENGTHENED $0 $20 $40 $60 $80 $100 $120 YE12 (a) YE15 (a) YE18 (a) YE21 (p) Underfunded Pension Benefits Significantly Reduced Underfunded Pension Benefits allowing for greater strategic and financial flexibility 0.8x (a) – Actual/reported (p) – Projected/planned $0 $5 $10 $15 $20 YE'12 (a) YE'15 (a) YE'18 (a) YE'21 (p) Cash returned to Shareholders
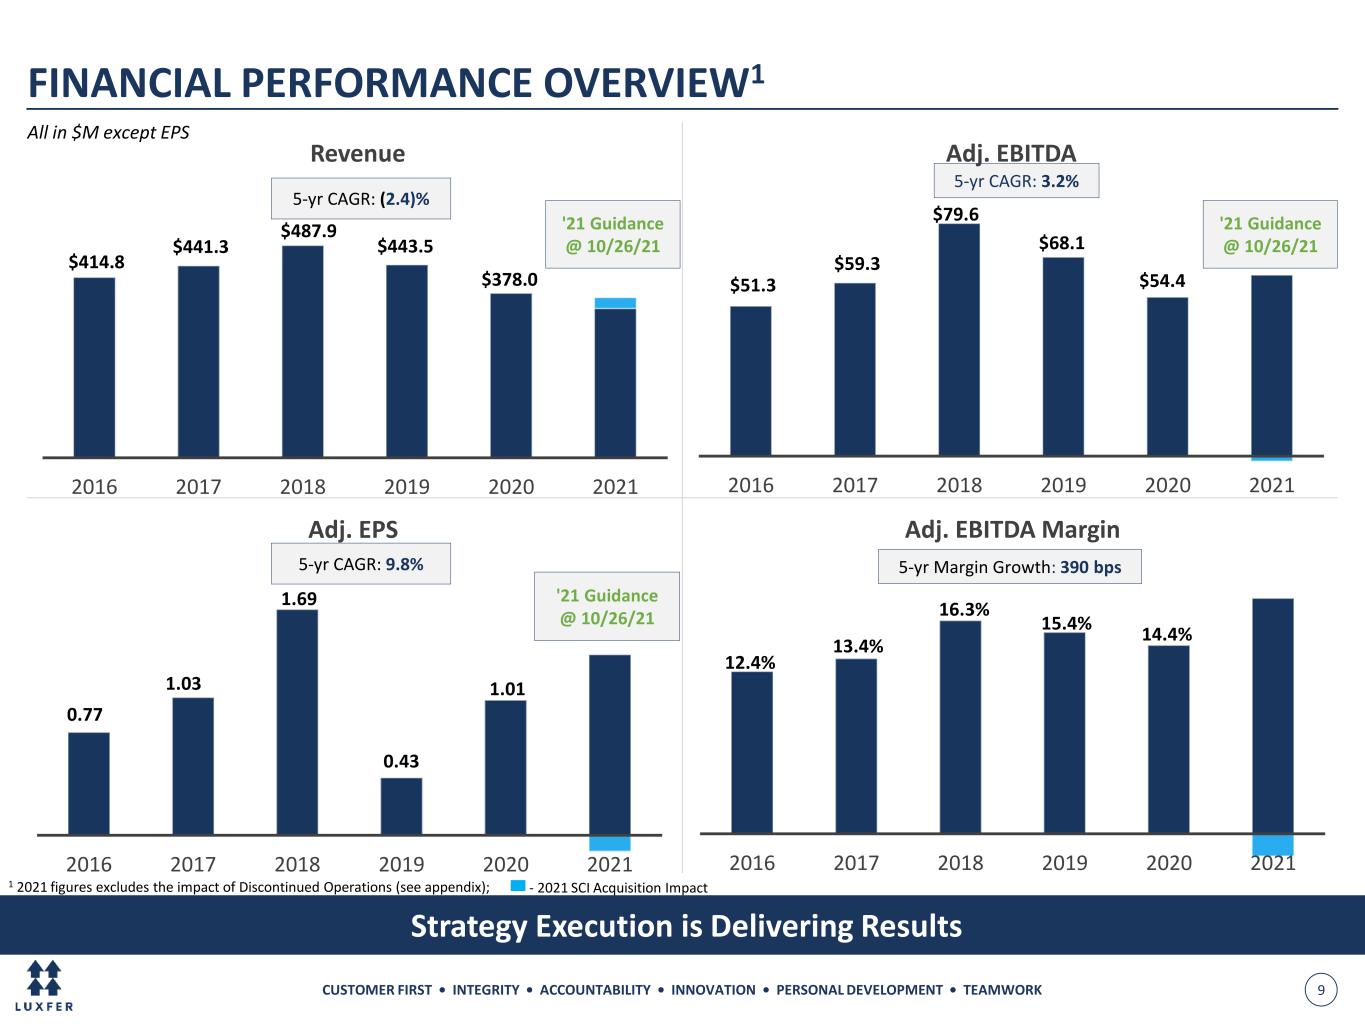
CUSTOMER FIRST • INTEGRITY • ACCOUNTABILITY • INNOVATION • PERSONAL DEVELOPMENT • TEAMWORK 9 FINANCIAL PERFORMANCE OVERVIEW1 Strategy Execution is Delivering Results 1 2021 figures excludes the impact of Discontinued Operations (see appendix); $414.8 $441.3 $487.9 $443.5 $378.0 2016 2017 2018 2019 2020 2021 Revenue 5-yr CAGR: (2.4)% 5-yr CAGR: 9.8% All in $M except EPS '21 Guidance @ 10/26/21 '21 Guidance @ 10/26/21 5-yr CAGR: 3.2% 5-yr Margin Growth: 390 bps $51.3 $59.3 $79.6 $68.1 $54.4 2016 2017 2018 2019 2020 2021 Adj. EBITDA 0.77 1.03 1.69 0.43 1.01 2016 2017 2018 2019 2020 2021 Adj. EPS 12.4% 13.4% 16.3% 15.4% 14.4% 2016 2017 2018 2019 2020 2021 Adj. EBITDA Margin - 2021 SCI Acquisition Impact '21 Guidance @ 10/26/21
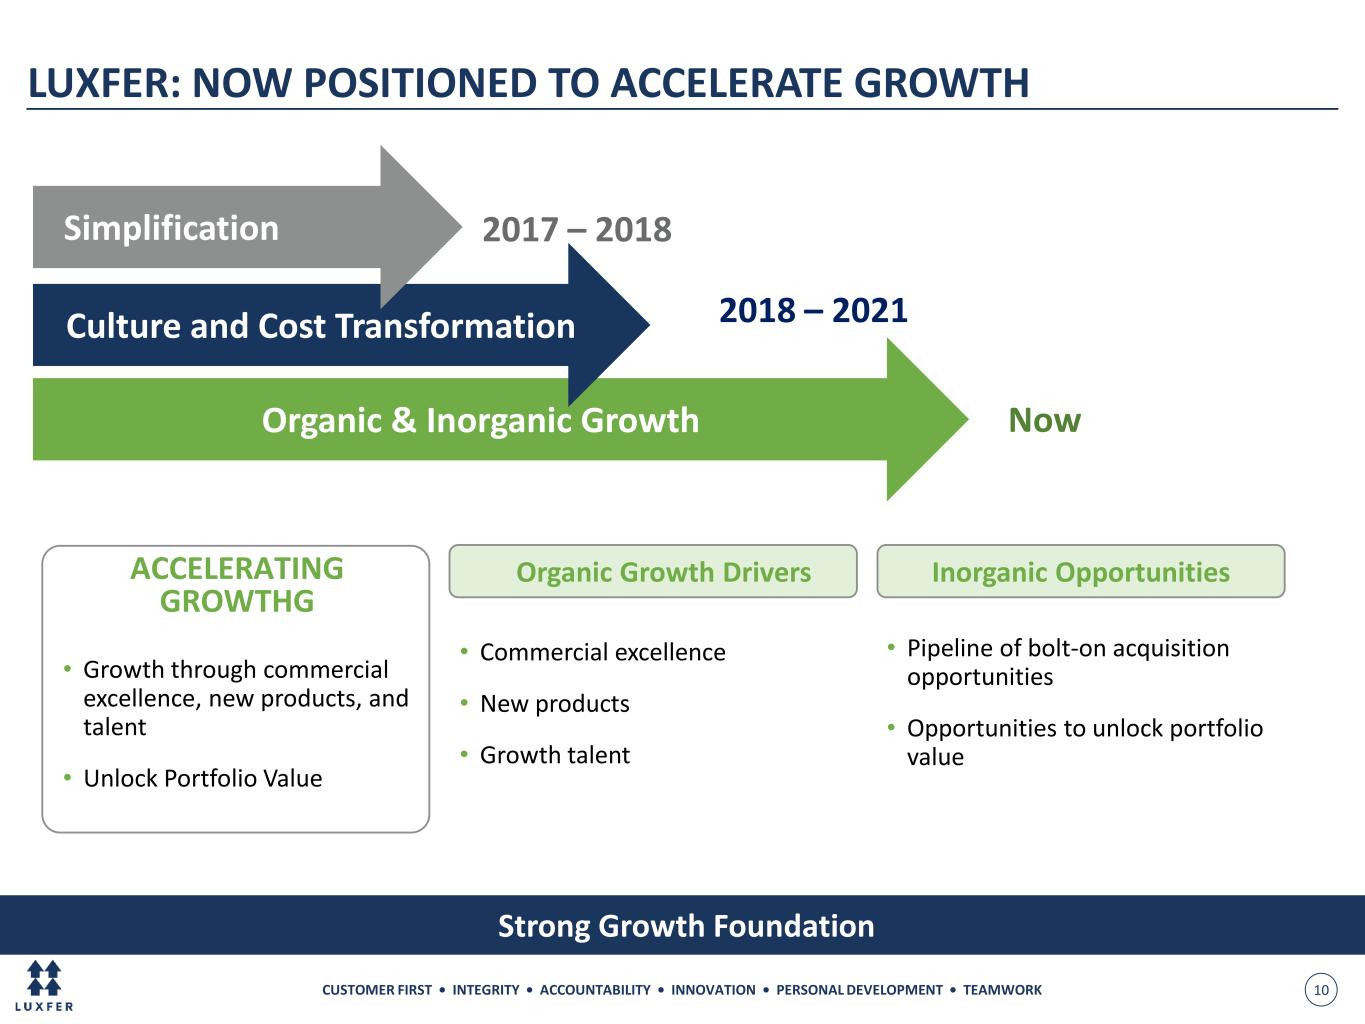
CUSTOMER FIRST • INTEGRITY • ACCOUNTABILITY • INNOVATION • PERSONAL DEVELOPMENT • TEAMWORK 10 Organic & Inorganic Growth LUXFER: NOW POSITIONED TO ACCELERATE GROWTH Culture and Cost Transformation ACCELERATING GROWTHG • Growth through commercial excellence, new products, and talent • Unlock Portfolio Value Simplification Organic Growth Drivers • Commercial excellence • New products • Growth talent • Pipeline of bolt-on acquisition opportunities • Opportunities to unlock portfolio value Inorganic Opportunities 2017 – 2018 2018 – 2021 Now Strong Growth Foundation
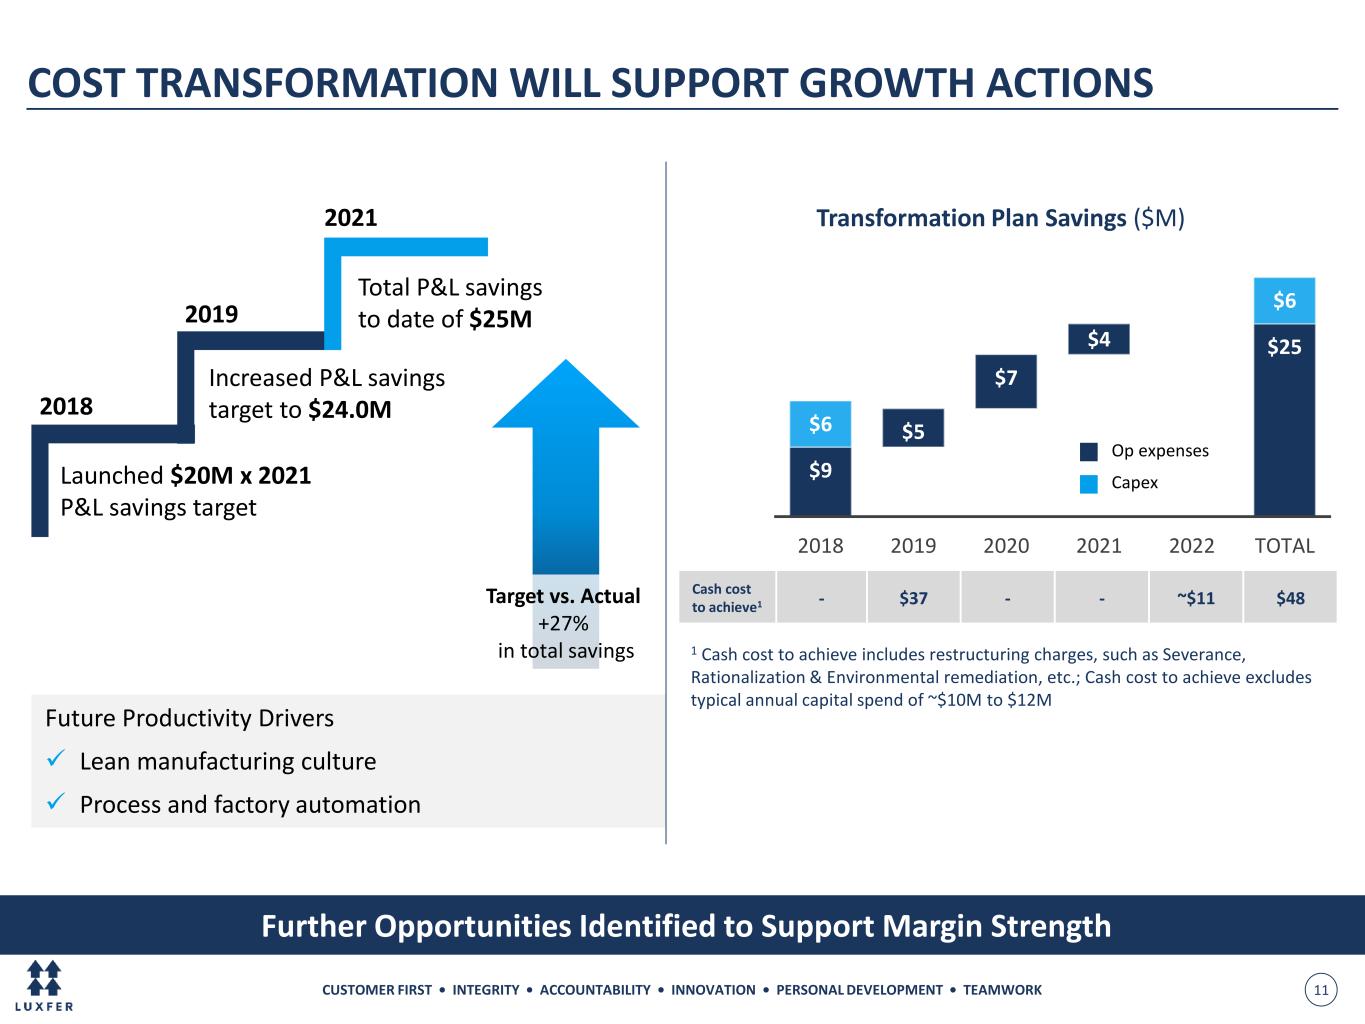
CUSTOMER FIRST • INTEGRITY • ACCOUNTABILITY • INNOVATION • PERSONAL DEVELOPMENT • TEAMWORK 11 COST TRANSFORMATION WILL SUPPORT GROWTH ACTIONS Further Opportunities Identified to Support Margin Strength Launched $20M x 2021 P&L savings target Increased P&L savings target to $24.0M Total P&L savings to date of $25M Future Productivity Drivers ✓ Lean manufacturing culture ✓ Process and factory automation 2019 2021 2018 Target vs. Actual +27% in total savings $9 $9 $14 $21 $0 $25 $6 $5 $7 $4 $6 2018 2019 2020 2021 2022 TOTAL Transformation Plan Savings ($M) Op expenses Capex Cash cost to achieve1 - $37 - - ~$11 $48 1 Cash cost to achieve includes restructuring charges, such as Severance, Rationalization & Environmental remediation, etc.; Cash cost to achieve excludes typical annual capital spend of ~$10M to $12M
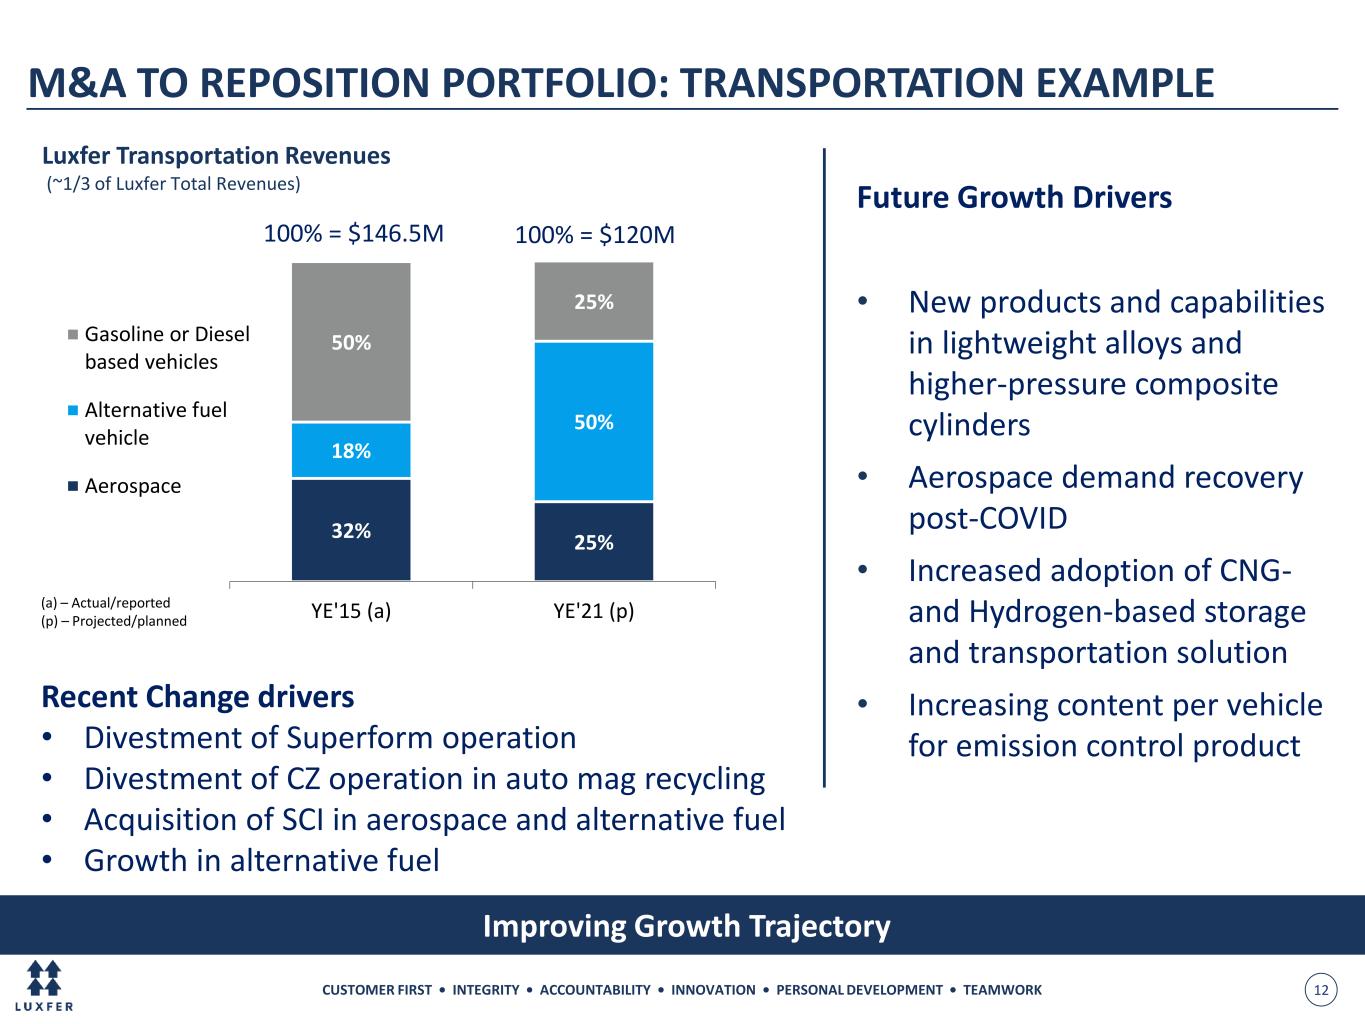
CUSTOMER FIRST • INTEGRITY • ACCOUNTABILITY • INNOVATION • PERSONAL DEVELOPMENT • TEAMWORK 12 Improving Growth Trajectory Future Growth Drivers • New products and capabilities in lightweight alloys and higher-pressure composite cylinders • Aerospace demand recovery post-COVID • Increased adoption of CNG- and Hydrogen-based storage and transportation solution • Increasing content per vehicle for emission control product M&A TO REPOSITION PORTFOLIO: TRANSPORTATION EXAMPLE Recent Change drivers • Divestment of Superform operation • Divestment of CZ operation in auto mag recycling • Acquisition of SCI in aerospace and alternative fuel • Growth in alternative fuel 32% 25% 18% 50% 50% 25% YE'15 (a) YE'21 (p) Luxfer Transportation Revenues (~1/3 of Luxfer Total Revenues) Gasoline or Diesel based vehicles Alternative fuel vehicle Aerospace 100% = $146.5M 100% = $120M (a) – Actual/reported (p) – Projected/planned
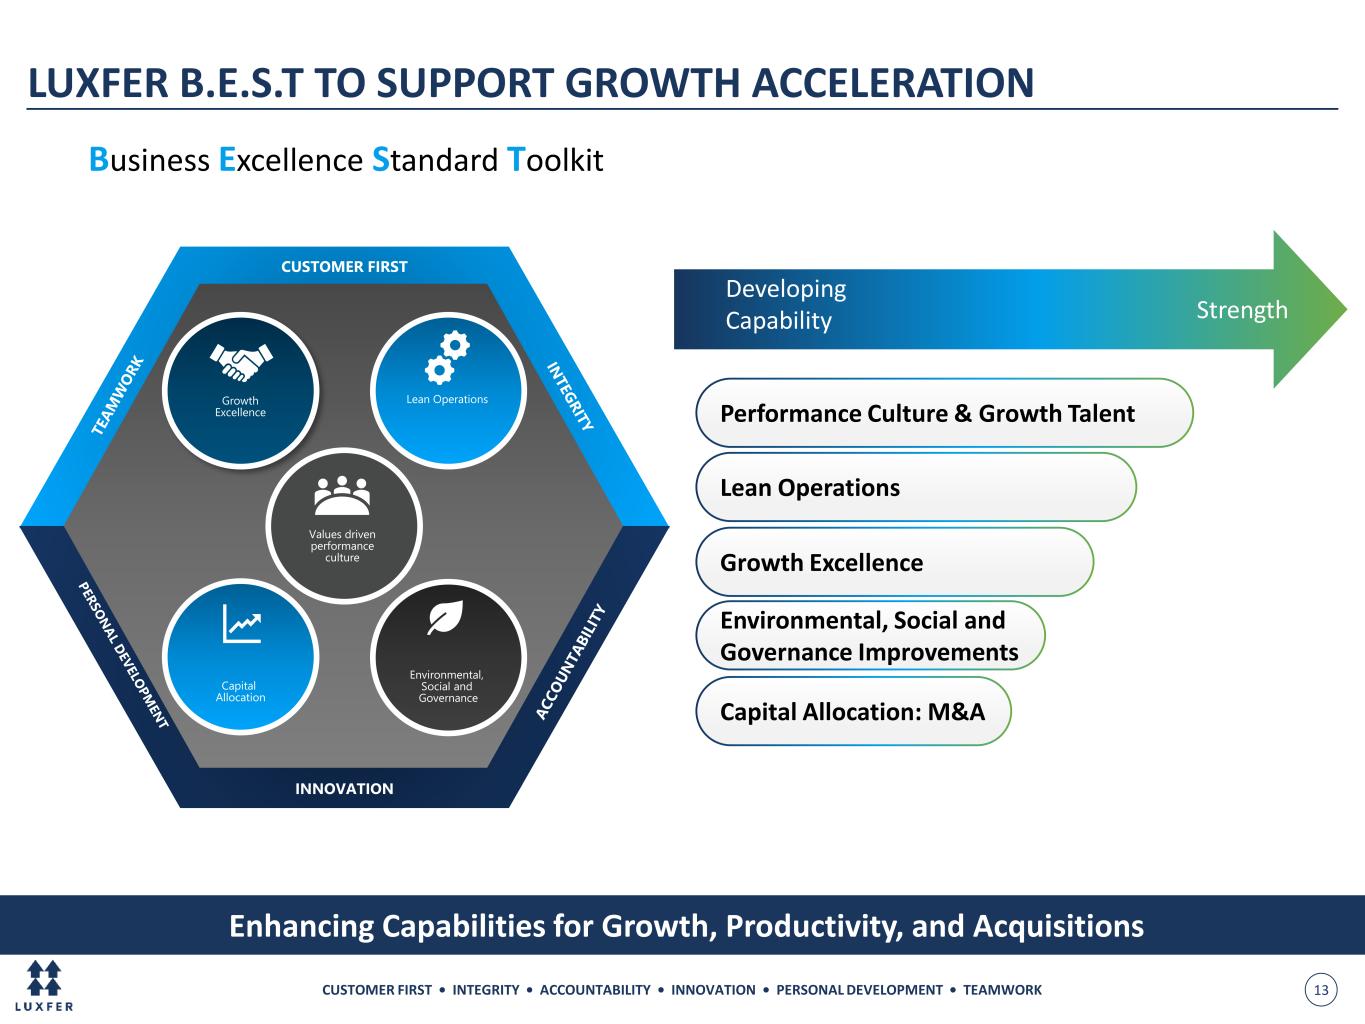
CUSTOMER FIRST • INTEGRITY • ACCOUNTABILITY • INNOVATION • PERSONAL DEVELOPMENT • TEAMWORK 13 LUXFER B.E.S.T TO SUPPORT GROWTH ACCELERATION Enhancing Capabilities for Growth, Productivity, and Acquisitions INNOVATION CUSTOMER FIRST Growth Excellence Capital Allocation Values driven performance culture Environmental, Social and Governance Lean Operations Capital Allocation: M&A Lean Operations Growth Excellence Performance Culture & Growth Talent Strength Developing Capability Business Excellence Standard Toolkit Environmental, Social and Governance Improvements
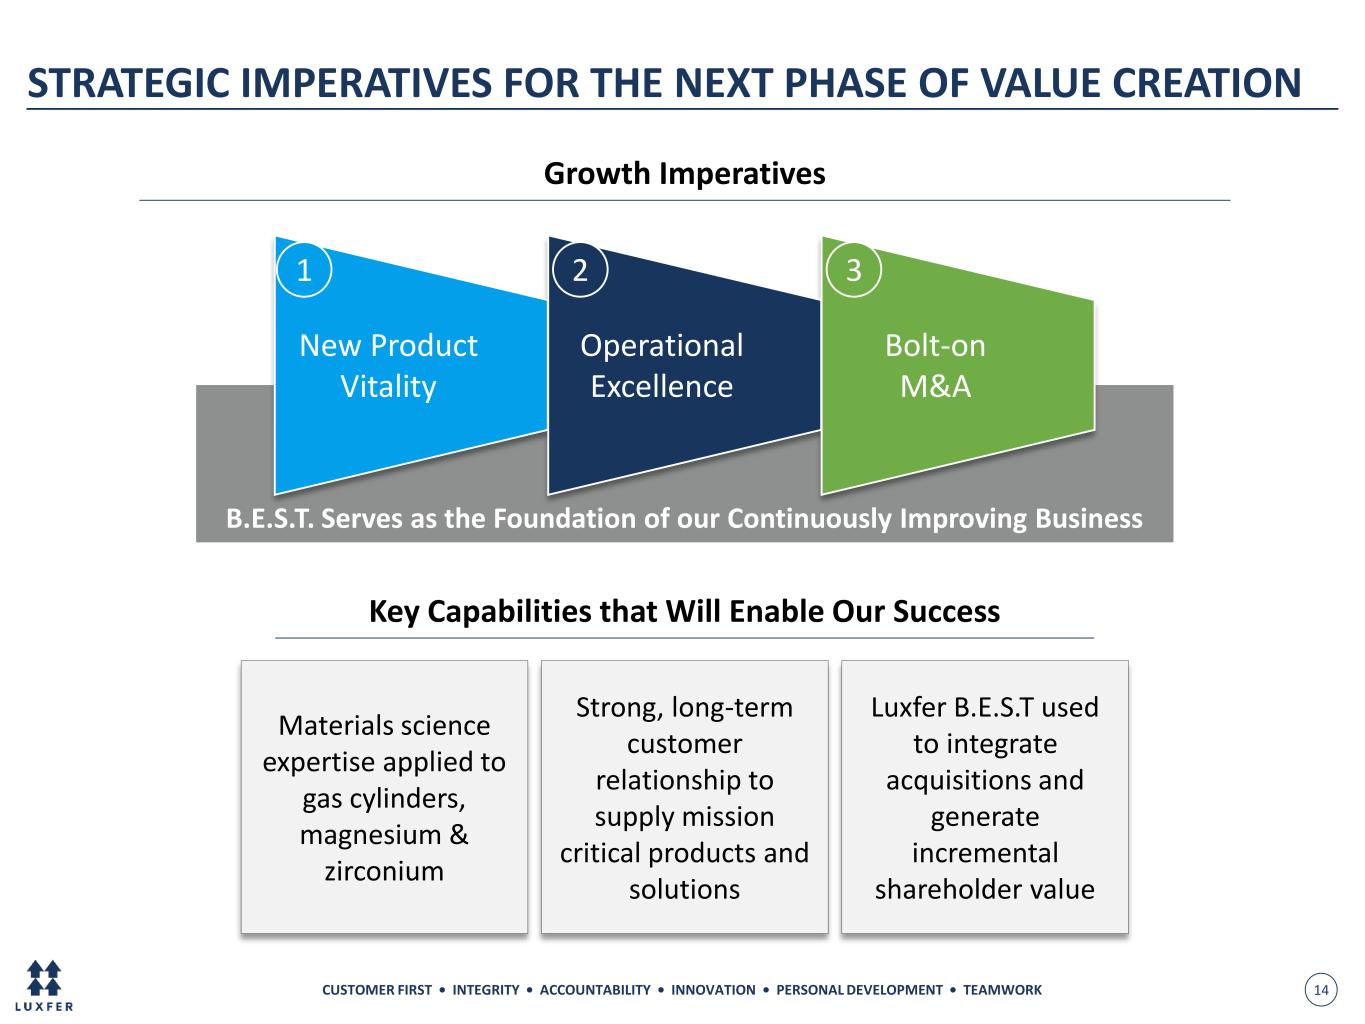
CUSTOMER FIRST • INTEGRITY • ACCOUNTABILITY • INNOVATION • PERSONAL DEVELOPMENT • TEAMWORK 14 Key Capabilities that Will Enable Our Success Materials science expertise applied to gas cylinders, magnesium & zirconium Strong, long-term customer relationship to supply mission critical products and solutions Luxfer B.E.S.T used to integrate acquisitions and generate incremental shareholder value B.E.S.T. Serves as the Foundation of our Continuously Improving Business STRATEGIC IMPERATIVES FOR THE NEXT PHASE OF VALUE CREATION Growth Imperatives New Product Vitality 1 Operational Excellence 2 Bolt-on M&A 3

CUSTOMER FIRST • INTEGRITY • ACCOUNTABILITY • INNOVATION • PERSONAL DEVELOPMENT • TEAMWORK 15 Actively Working Deal Pipeline; Remaining Disciplined on Strategic/Financial Goals IP, Critical Process Technology Niche Products, Applications Geographic Expansion Customer Relationships Strong Cultural Fit Compelling Growth & Margin Profile Cost and Revenue Synergies STRATEGIC FILTERS Attractive Valuation Post Synergy FINANCIAL CRITERIA Accretive to EPS within 2-3 Years ROIC > WACC within 3 Years LUXFER ACQUISITION FRAMEWORK
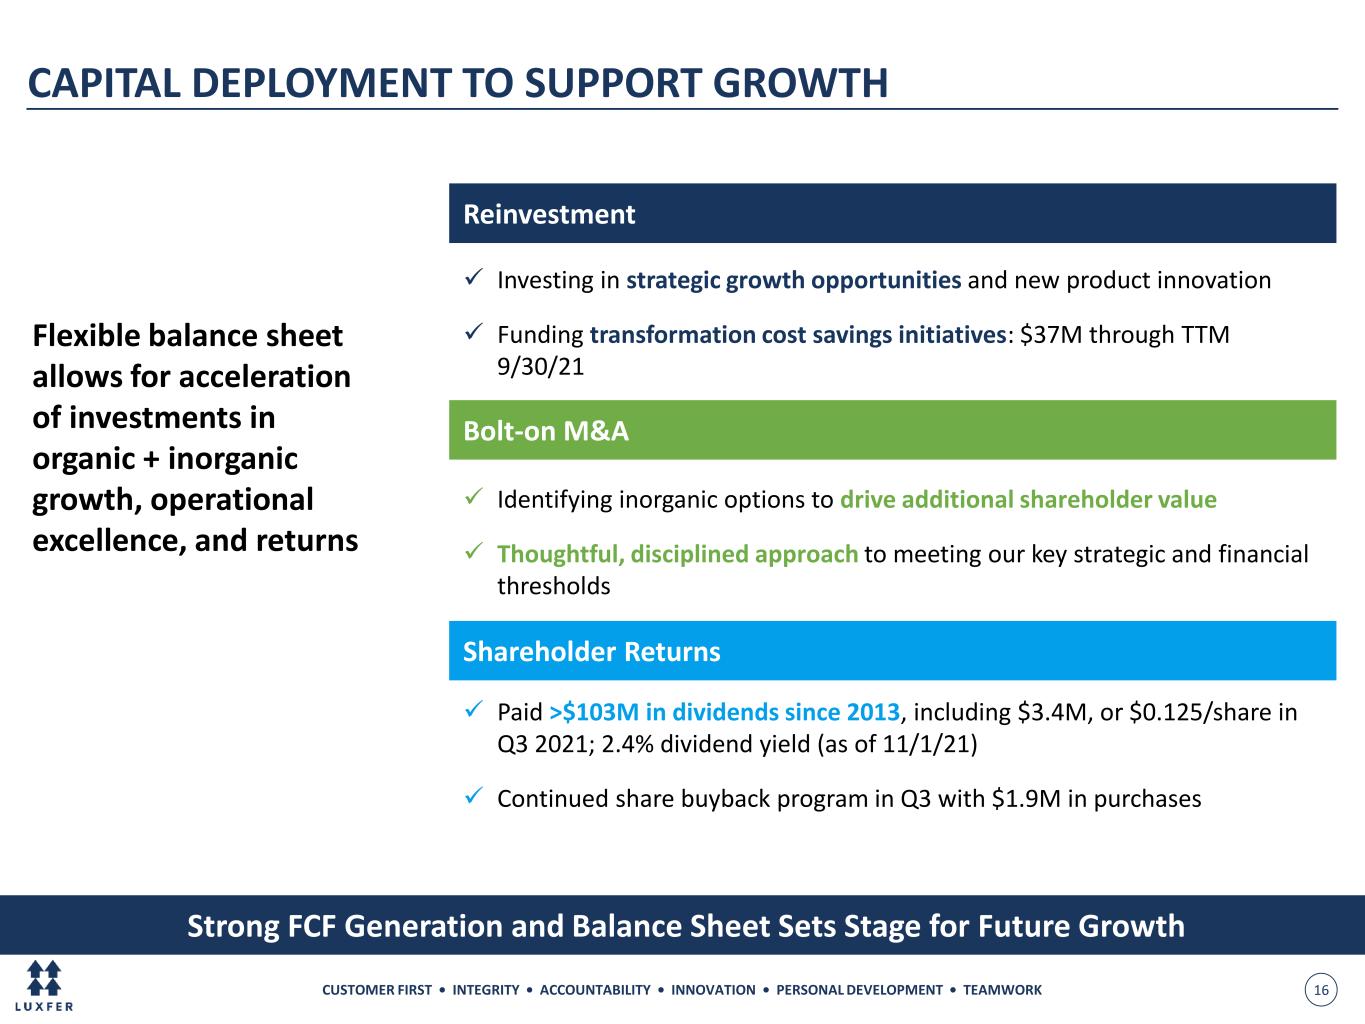
CUSTOMER FIRST • INTEGRITY • ACCOUNTABILITY • INNOVATION • PERSONAL DEVELOPMENT • TEAMWORK 16 Reinvestment Strong FCF Generation and Balance Sheet Sets Stage for Future Growth CAPITAL DEPLOYMENT TO SUPPORT GROWTH ✓ Investing in strategic growth opportunities and new product innovation ✓ Funding transformation cost savings initiatives: $37M through TTM 9/30/21 Flexible balance sheet allows for acceleration of investments in organic + inorganic growth, operational excellence, and returns Bolt-on M&A ✓ Paid >$103M in dividends since 2013, including $3.4M, or $0.125/share in Q3 2021; 2.4% dividend yield (as of 11/1/21) ✓ Continued share buyback program in Q3 with $1.9M in purchases ✓ Identifying inorganic options to drive additional shareholder value ✓ Thoughtful, disciplined approach to meeting our key strategic and financial thresholds Shareholder Returns
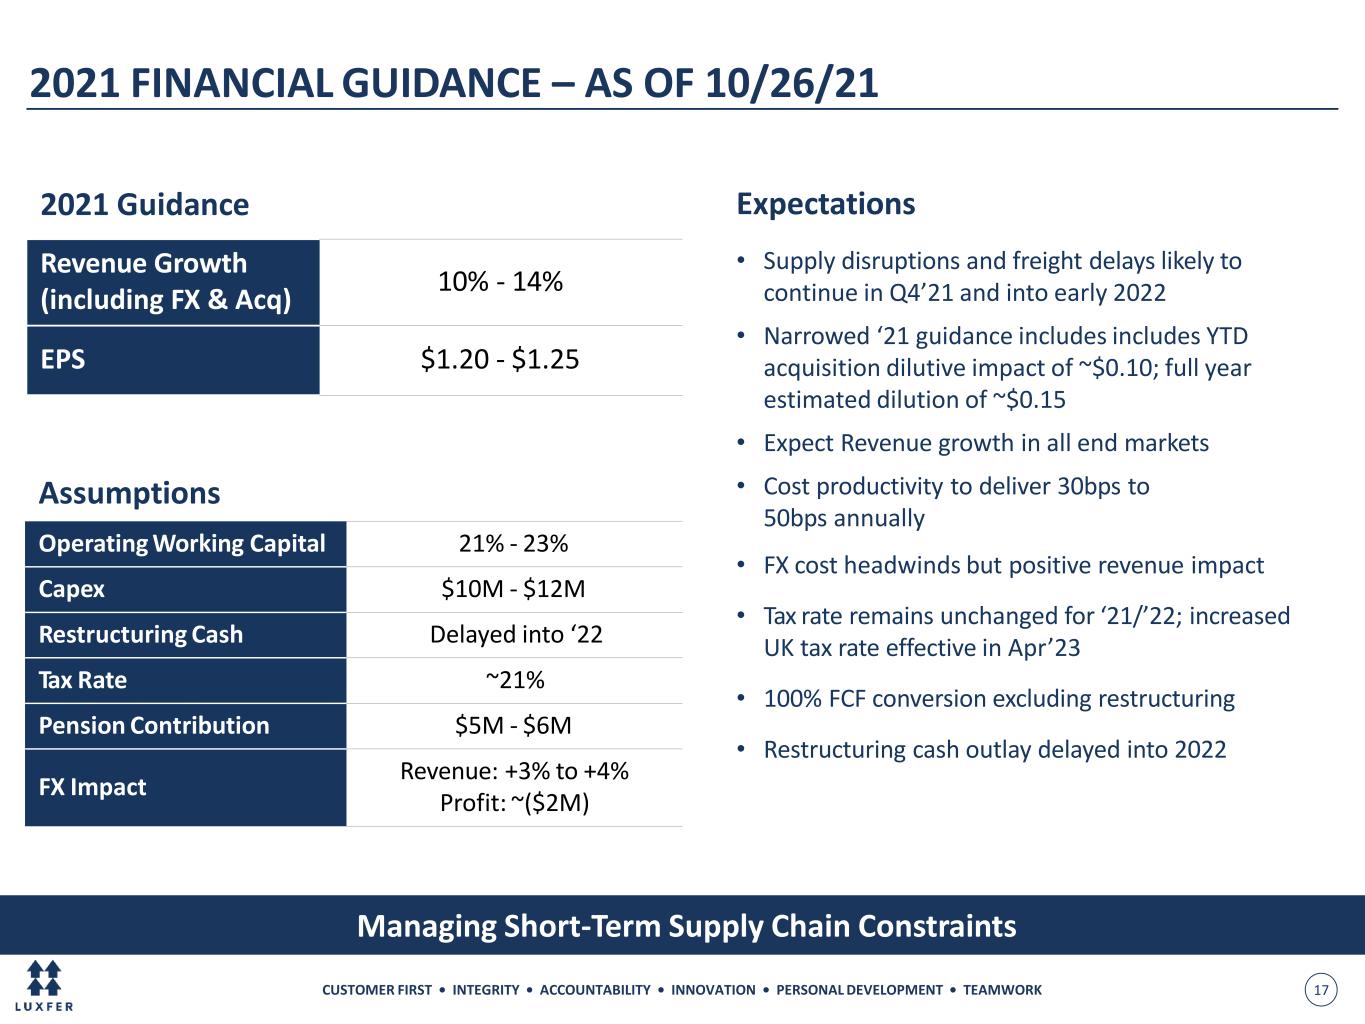
CUSTOMER FIRST • INTEGRITY • ACCOUNTABILITY • INNOVATION • PERSONAL DEVELOPMENT • TEAMWORK 17 2021 FINANCIAL GUIDANCE – AS OF 10/26/21 Managing Short-Term Supply Chain Constraints 2021 Guidance Revenue Growth (including FX & Acq) 10% - 14% EPS $1.20 - $1.25 Assumptions Operating Working Capital 21% - 23% Capex $10M - $12M Restructuring Cash Delayed into ‘22 Tax Rate ~21% Pension Contribution $5M - $6M FX Impact Revenue: +3% to +4% Profit: ~($2M) Expectations • Supply disruptions and freight delays likely to continue in Q4’21 and into early 2022 • Narrowed ‘21 guidance includes includes YTD acquisition dilutive impact of ~$0.10; full year estimated dilution of ~$0.15 • Expect Revenue growth in all end markets • Cost productivity to deliver 30bps to 50bps annually • FX cost headwinds but positive revenue impact • Tax rate remains unchanged for ‘21/’22; increased UK tax rate effective in Apr’23 • 100% FCF conversion excluding restructuring • Restructuring cash outlay delayed into 2022
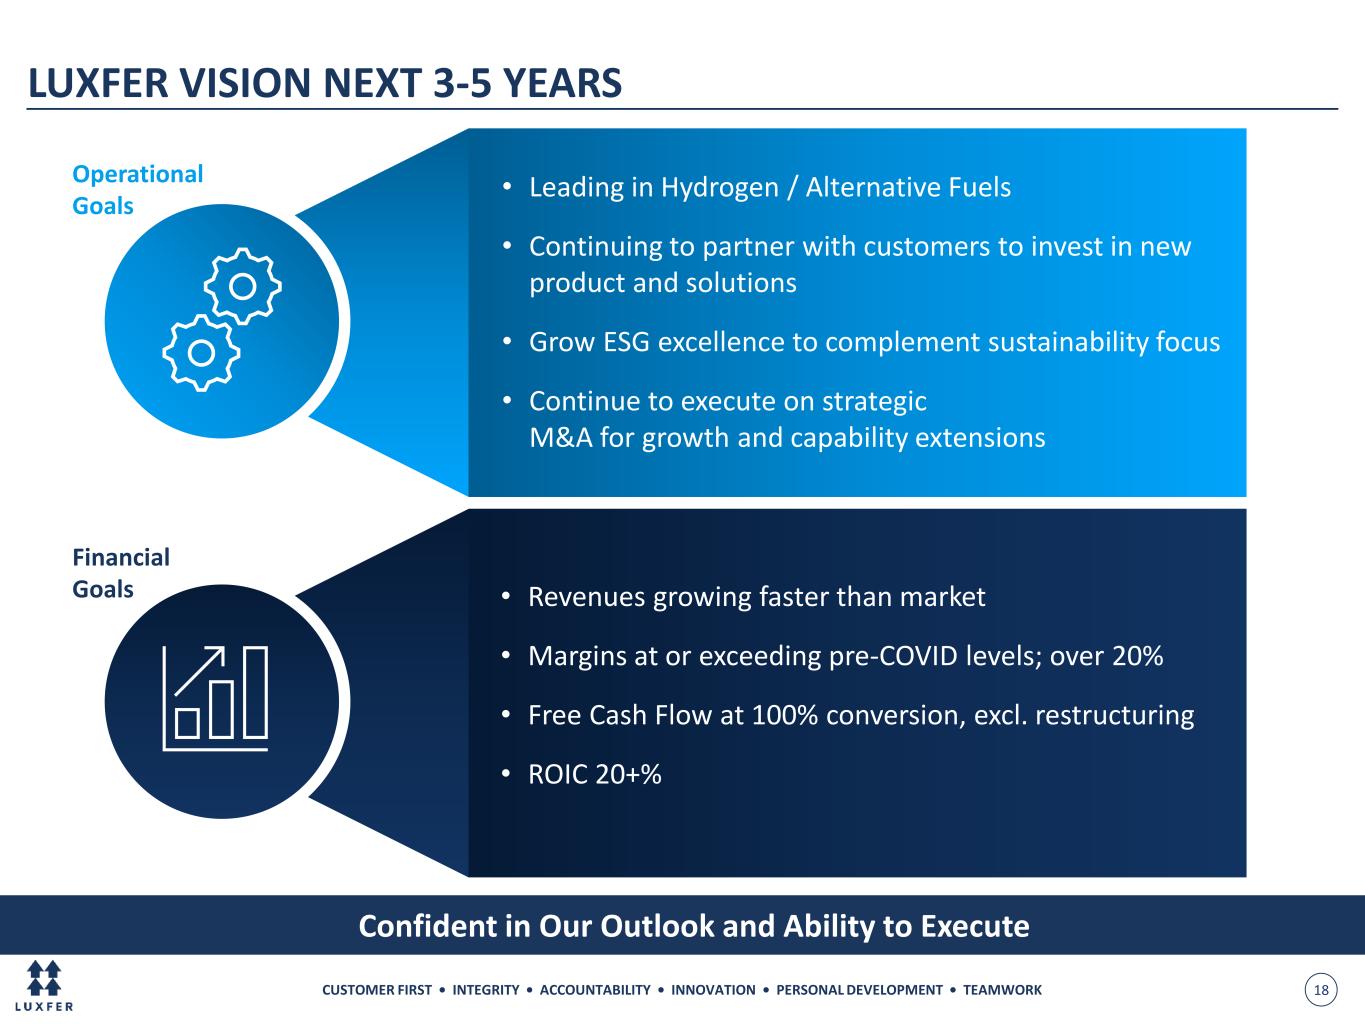
CUSTOMER FIRST • INTEGRITY • ACCOUNTABILITY • INNOVATION • PERSONAL DEVELOPMENT • TEAMWORK 18 Confident in Our Outlook and Ability to Execute • Leading in Hydrogen / Alternative Fuels • Continuing to partner with customers to invest in new product and solutions • Grow ESG excellence to complement sustainability focus • Continue to execute on strategic M&A for growth and capability extensions • Revenues growing faster than market • Margins at or exceeding pre-COVID levels; over 20% • Free Cash Flow at 100% conversion, excl. restructuring • ROIC 20+% Operational Goals Financial Goals LUXFER VISION NEXT 3-5 YEARS
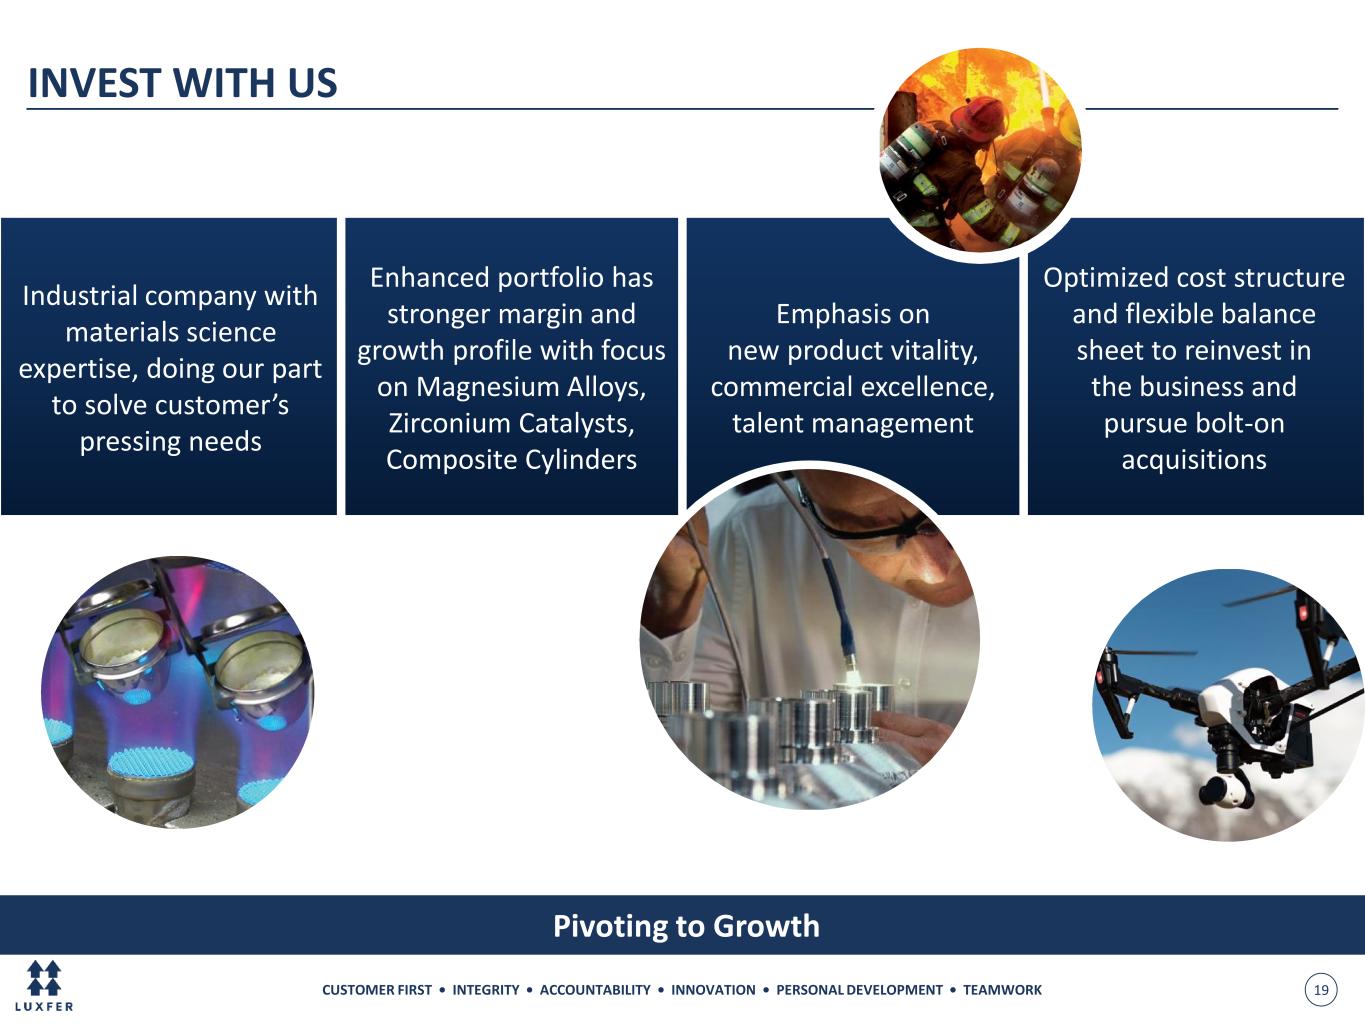
CUSTOMER FIRST • INTEGRITY • ACCOUNTABILITY • INNOVATION • PERSONAL DEVELOPMENT • TEAMWORK 19 Pivoting to Growth Industrial company with materials science expertise, doing our part to solve customer’s pressing needs Enhanced portfolio has stronger margin and growth profile with focus on Magnesium Alloys, Zirconium Catalysts, Composite Cylinders Emphasis on new product vitality, commercial excellence, talent management Optimized cost structure and flexible balance sheet to reinvest in the business and pursue bolt-on acquisitions INVEST WITH US
CUSTOMER FIRST • INTEGRITY • ACCOUNTABILITY • INNOVATION • PERSONAL DEVELOPMENT • TEAMWORK 20 APPENDIX Summary Financial Statements and Reconciliation of Non-GAAP Measures APPENDICES
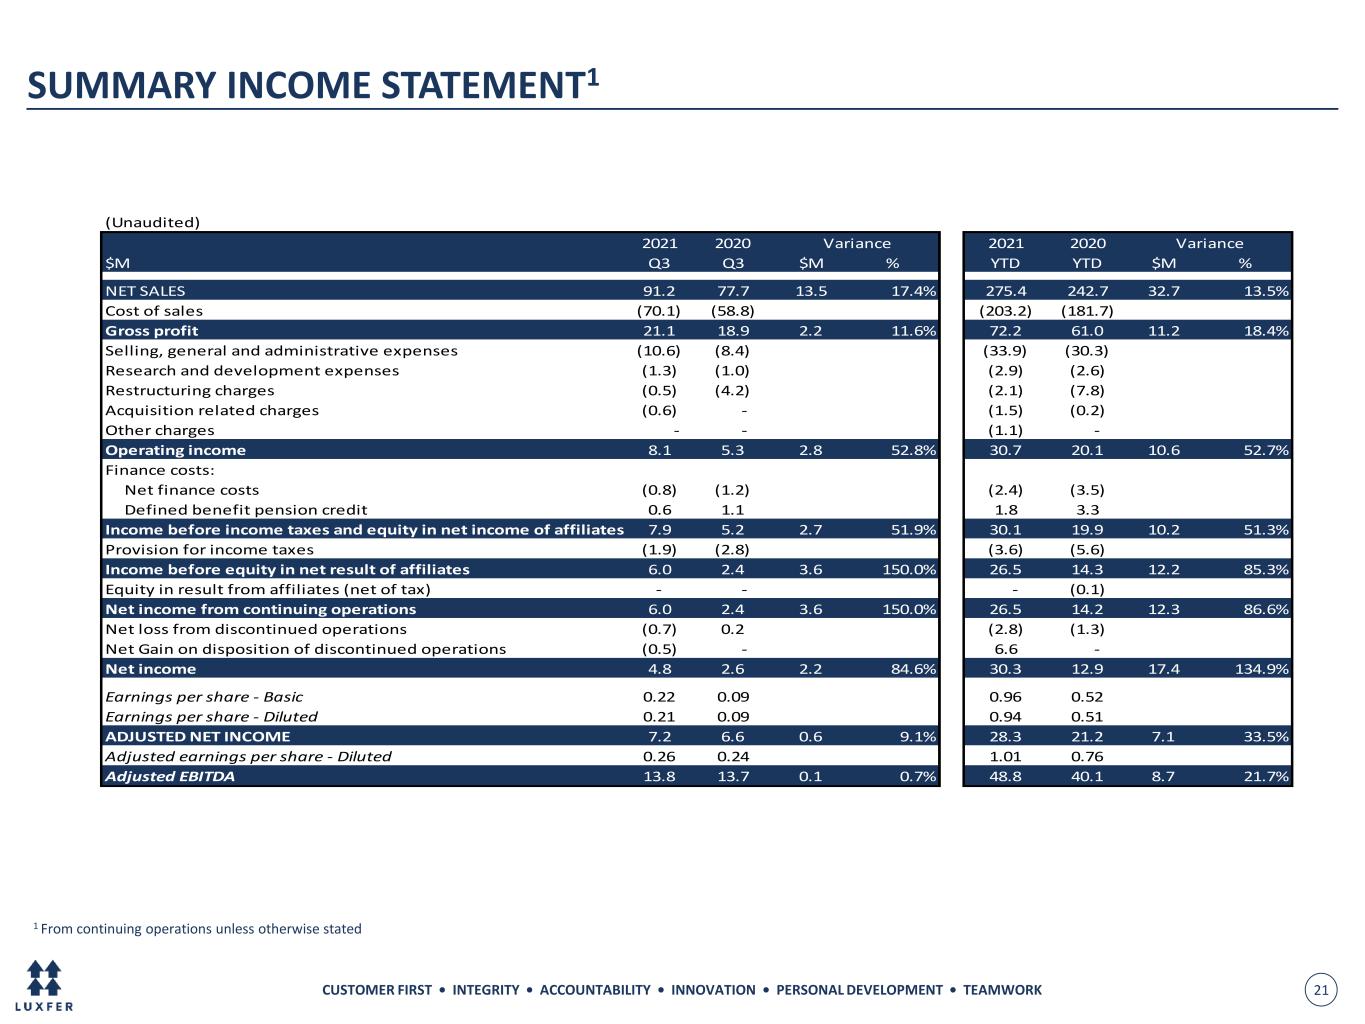
CUSTOMER FIRST • INTEGRITY • ACCOUNTABILITY • INNOVATION • PERSONAL DEVELOPMENT • TEAMWORK 21 SUMMARY INCOME STATEMENT1 (Unaudited) 2021 2020 2021 2020 $M Q3 Q3 $M % YTD YTD $M % NET SALES 91.2 77.7 13.5 17.4% 275.4 242.7 32.7 13.5% Cost of sales (70.1) (58.8) (203.2) (181.7) Gross profit 21.1 18.9 2.2 11.6% 72.2 61.0 11.2 18.4% Selling, general and administrative expenses (10.6) (8.4) (33.9) (30.3) Research and development expenses (1.3) (1.0) (2.9) (2.6) Restructuring charges (0.5) (4.2) (2.1) (7.8) Acquisition related charges (0.6) - (1.5) (0.2) Other charges - - (1.1) - Operating income 8.1 5.3 2.8 52.8% 30.7 20.1 10.6 52.7% Finance costs: Net finance costs (0.8) (1.2) (2.4) (3.5) Defined benefit pension credit 0.6 1.1 1.8 3.3 Income before income taxes and equity in net income of affiliates 7.9 5.2 2.7 51.9% 30.1 19.9 10.2 51.3% Provision for income taxes (1.9) (2.8) (3.6) (5.6) Income before equity in net result of affiliates 6.0 2.4 3.6 150.0% 26.5 14.3 12.2 85.3% Equity in result from affiliates (net of tax) - - - (0.1) Net income from continuing operations 6.0 2.4 3.6 150.0% 26.5 14.2 12.3 86.6% Net loss from discontinued operations (0.7) 0.2 (2.8) (1.3) Net Gain on disposition of discontinued operations (0.5) - 6.6 - Net income 4.8 2.6 2.2 84.6% 30.3 12.9 17.4 134.9% Earnings per share - Basic 0.22 0.09 0.96 0.52 Earnings per share - Diluted 0.21 0.09 0.94 0.51 ADJUSTED NET INCOME 7.2 6.6 0.6 9.1% 28.3 21.2 7.1 33.5% Adjusted earnings per share - Diluted 0.26 0.24 1.01 0.76 Adjusted EBITDA 13.8 13.7 0.1 0.7% 48.8 40.1 8.7 21.7% Variance Variance 1 From continuing operations unless otherwise stated
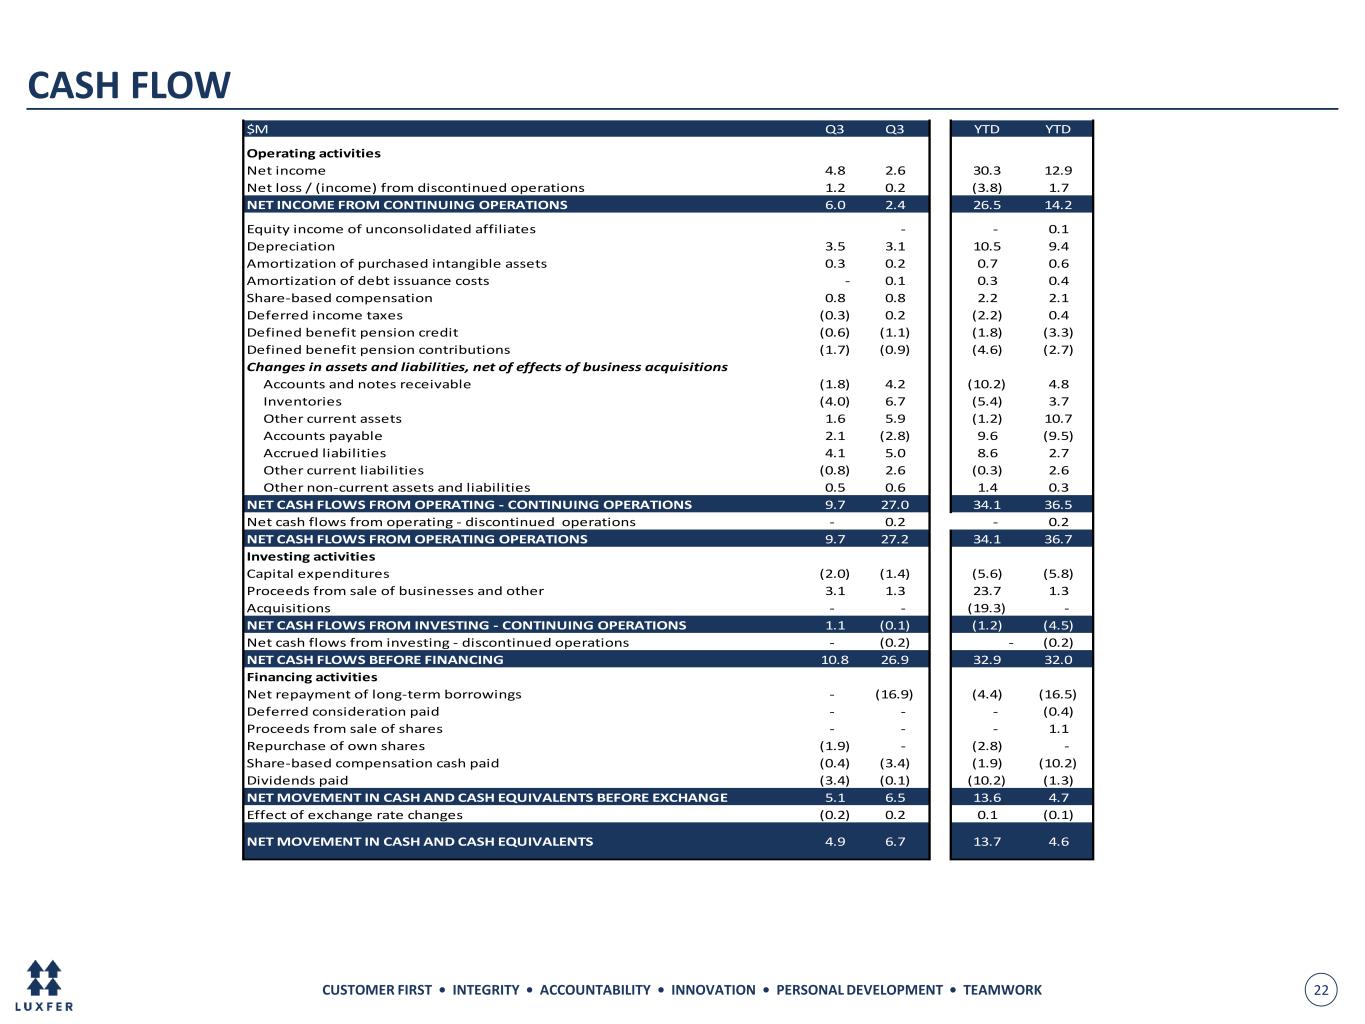
CUSTOMER FIRST • INTEGRITY • ACCOUNTABILITY • INNOVATION • PERSONAL DEVELOPMENT • TEAMWORK 22 $M Q3 Q3 YTD YTD Operating activities Net income 4.8 2.6 30.3 12.9 Net loss / (income) from discontinued operations 1.2 0.2 (3.8) 1.7 NET INCOME FROM CONTINUING OPERATIONS 6.0 2.4 26.5 14.2 Equity income of unconsolidated affiliates - - 0.1 Depreciation 3.5 3.1 10.5 9.4 Amortization of purchased intangible assets 0.3 0.2 0.7 0.6 Amortization of debt issuance costs - 0.1 0.3 0.4 Share-based compensation 0.8 0.8 2.2 2.1 Deferred income taxes (0.3) 0.2 (2.2) 0.4 Defined benefit pension credit (0.6) (1.1) (1.8) (3.3) Defined benefit pension contributions (1.7) (0.9) (4.6) (2.7) Changes in assets and liabilities, net of effects of business acquisitions Accounts and notes receivable (1.8) 4.2 (10.2) 4.8 Inventories (4.0) 6.7 (5.4) 3.7 Other current assets 1.6 5.9 (1.2) 10.7 Accounts payable 2.1 (2.8) 9.6 (9.5) Accrued liabilities 4.1 5.0 8.6 2.7 Other current liabilities (0.8) 2.6 (0.3) 2.6 Other non-current assets and liabilities 0.5 0.6 1.4 0.3 NET CASH FLOWS FROM OPERATING - CONTINUING OPERATIONS 9.7 27.0 34.1 36.5 Net cash flows from operating - discontinued operations - 0.2 - 0.2 NET CASH FLOWS FROM OPERATING OPERATIONS 9.7 27.2 34.1 36.7 Investing activities Capital expenditures (2.0) (1.4) (5.6) (5.8) Proceeds from sale of businesses and other 3.1 1.3 23.7 1.3 Acquisitions - - (19.3) - NET CASH FLOWS FROM INVESTING - CONTINUING OPERATIONS 1.1 (0.1) (1.2) (4.5) Net cash flows from investing - discontinued operations - (0.2) - (0.2) NET CASH FLOWS BEFORE FINANCING 10.8 26.9 32.9 32.0 Financing activities Net repayment of long-term borrowings - (16.9) (4.4) (16.5) Deferred consideration paid - - - (0.4) Proceeds from sale of shares - - - 1.1 Repurchase of own shares (1.9) - (2.8) - Share-based compensation cash paid (0.4) (3.4) (1.9) (10.2) Dividends paid (3.4) (0.1) (10.2) (1.3) NET MOVEMENT IN CASH AND CASH EQUIVALENTS BEFORE EXCHANGE 5.1 6.5 13.6 4.7 Effect of exchange rate changes (0.2) 0.2 0.1 (0.1) NET MOVEMENT IN CASH AND CASH EQUIVALENTS 4.9 6.7 13.7 4.6 CASH FLOW

CUSTOMER FIRST • INTEGRITY • ACCOUNTABILITY • INNOVATION • PERSONAL DEVELOPMENT • TEAMWORK 23 RECONCILIATION OF NON-GAAP MEASURES1 (Unaudited) 2021 2020 2021 2020 $M Q3 Q3 YTD YTD Net income 6.0 2.4 26.5 14.2 Accounting charges relating to acquisitions and disposals of businesses: Amortization on acquired intangibles 0.3 0.2 0.7 0.6 Acquisitions and disposals 0.6 - 1.5 0.2 Defined benefit pension credit (0.6) (1.1) (1.8) (3.3) Restructuring charges 0.5 4.2 2.1 7.8 Other charges - - 1.1 - Share-based compensation charges 0.8 0.8 2.2 2.1 Other non-recurring tax items - - (2.2) - Income tax on adjusted items (0.4) 0.1 (1.8) (0.4) Adjusted net income 7.2 6.6 28.3 21.2 Add back / (deduct): Other non-recurring tax items - - 2.2 - Income tax on adjusted items 0.4 (0.1) 1.8 0.4 Provision for income taxes 1.9 2.8 3.6 5.6 Net finance costs 0.8 1.2 2.4 3.5 Adjusted EBITA 10.3 10.5 38.3 30.7 Depreciation 3.5 3.2 10.5 9.4 Adjusted EBITDA 13.8 13.7 48.8 40.1 1 From continuing operations unless otherwise stated

CUSTOMER FIRST • INTEGRITY • ACCOUNTABILITY • INNOVATION • PERSONAL DEVELOPMENT • TEAMWORK 24 RECONCILIATION OF NON-GAAP MEASURES1 (Unaudited) 2020 2020 2020 2020 2021 2021 2021 $M Q1 Q2 Q3 Q4 Q1 Q2 Q3 EBITA 12.7 7.5 10.5 10.5 14.5 13.5 10.3 Effective tax rate - per income statement 19.1% 19.0% 53.8% 16.5% 24.8% 21.0% 24.0% Notional tax (2.4) (1.4) (5.7) (1.7) (3.6) (2.8) (2.5) EBITA after notional tax 10.3 6.1 4.8 8.8 10.9 10.7 7.8 Rolling 12 month EBITA after notional tax 37.7 31.5 23.9 30.0 30.6 35.2 38.2 Bank and other loans 108.8 90.5 74.2 53.4 73.0 49.6 49.6 Net cash and cash equivalents (17.3) (8.1) (14.9) (1.5) (31.8) (10.3) (15.1) Net debt 91.5 82.4 59.3 51.9 41.2 39.3 34.5 Total equity 169.8 173.3 176.7 167.1 179.4 187.3 186.7 Held-for-sale net assets2 (33.1) (28.2) (24.2) (20.9) (13.4) (13.6) (13.0) Invested capital 228.2 227.5 211.8 198.1 207.2 213.0 208.2 4 point average invested capital 230.0 229.3 223.3 216.4 211.2 207.5 206.6 Return on invested capital 16.4% 13.7% 10.7% 13.8% 14.5% 17.0% 18.5% Adjusted net income for the period 9.4 5.2 6.6 7.7 10.9 10.2 7.2 Provision for income taxes 1.7 1.1 2.8 1.3 2.3 (0.6) 1.9 Income tax on adjustments to net income 0.4 0.1 (0.1) - 0.5 3.1 0.4 Adjusted income tax charge 2.1 1.2 2.7 1.3 2.8 2.5 2.3 Adjusted profit before taxation 11.5 6.4 9.3 9.0 13.7 12.7 9.5 Adjusted effective tax rate 18.3% 18.8% 29.0% 14.4% 20.4% 19.7% 24.3% EBITA (as above) 12.7 7.5 10.5 10.5 14.5 13.5 10.3 Adjusted notional tax (2.3) (1.4) (3.0) (1.5) (3.0) (2.7) (2.5) Adjusted EBITA after notional tax 10.4 6.1 7.5 9.0 11.6 10.8 7.8 Rolling 12 month adjusted EBITA after notional tax 42.3 34.5 30.4 32.9 34.1 38.9 39.2 Adjusted return on invested capital 18.4% 15.0% 13.6% 15.2% 16.2% 18.7% 19.0% 1 From continuing operations unless otherwise stated 2Held-for-sale net assets relating to discontinued operations
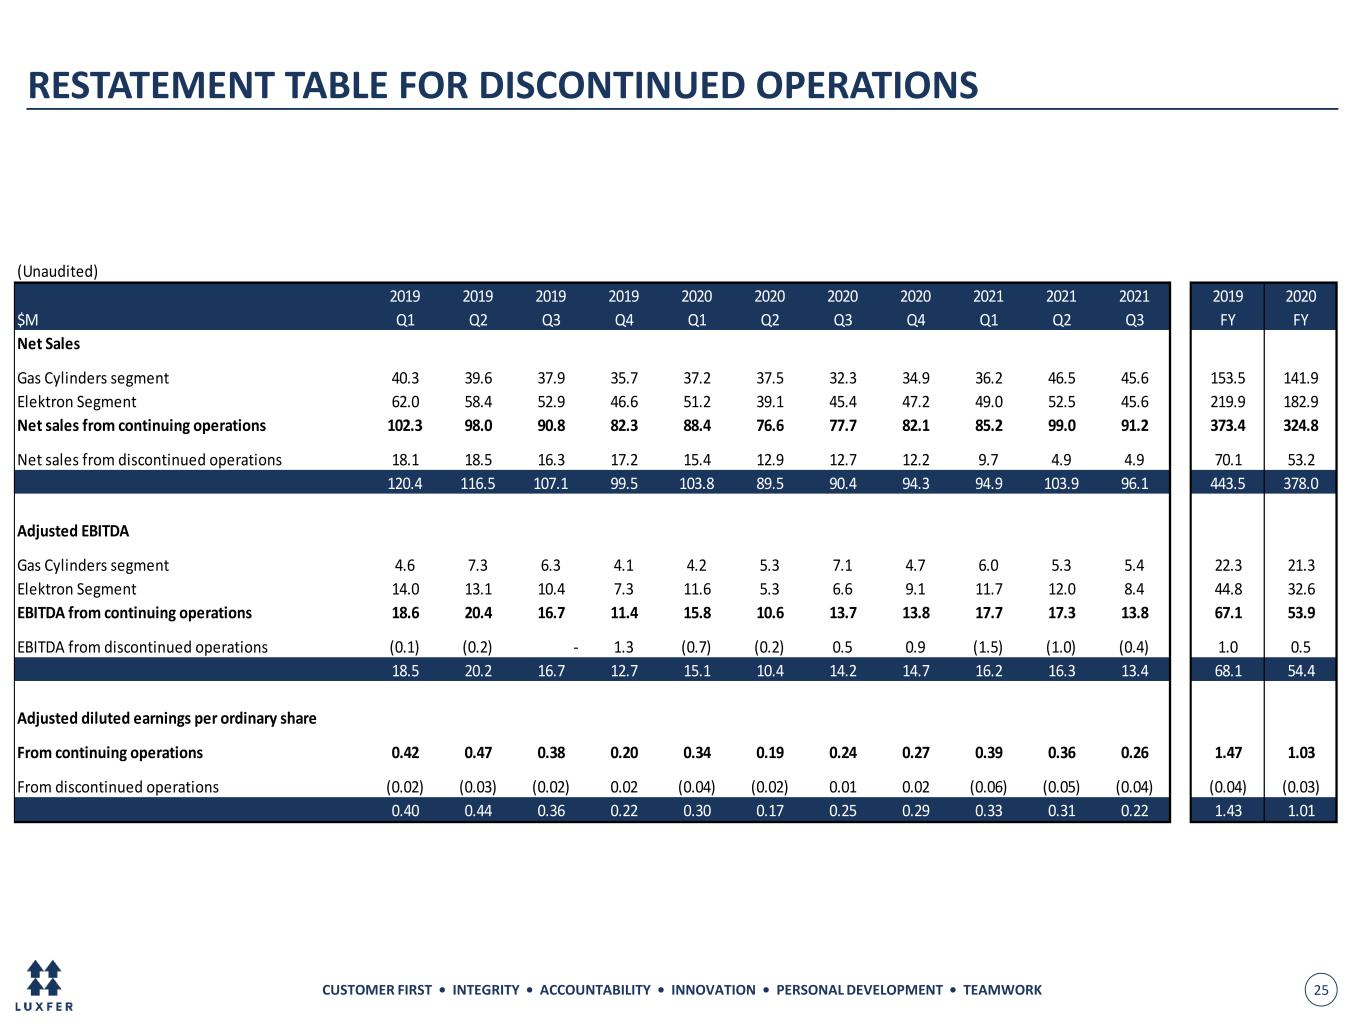
CUSTOMER FIRST • INTEGRITY • ACCOUNTABILITY • INNOVATION • PERSONAL DEVELOPMENT • TEAMWORK 25 RESTATEMENT TABLE FOR DISCONTINUED OPERATIONS (Unaudited) 2019 2019 2019 2019 2020 2020 2020 2020 2021 2021 2021 2019 2020 $M Q1 Q2 Q3 Q4 Q1 Q2 Q3 Q4 Q1 Q2 Q3 FY FY Net Sales Gas Cylinders segment 40.3 39.6 37.9 35.7 37.2 37.5 32.3 34.9 36.2 46.5 45.6 153.5 141.9 Elektron Segment 62.0 58.4 52.9 46.6 51.2 39.1 45.4 47.2 49.0 52.5 45.6 219.9 182.9 Net sales from continuing operations 102.3 98.0 90.8 82.3 88.4 76.6 77.7 82.1 85.2 99.0 91.2 373.4 324.8 Net sales from discontinued operations 18.1 18.5 16.3 17.2 15.4 12.9 12.7 12.2 9.7 4.9 4.9 70.1 53.2 120.4 116.5 107.1 99.5 103.8 89.5 90.4 94.3 94.9 103.9 96.1 443.5 378.0 Adjusted EBITDA Gas Cylinders segment 4.6 7.3 6.3 4.1 4.2 5.3 7.1 4.7 6.0 5.3 5.4 22.3 21.3 Elektron Segment 14.0 13.1 10.4 7.3 11.6 5.3 6.6 9.1 11.7 12.0 8.4 44.8 32.6 EBITDA from continuing operations 18.6 20.4 16.7 11.4 15.8 10.6 13.7 13.8 17.7 17.3 13.8 67.1 53.9 EBITDA from discontinued operations (0.1) (0.2) - 1.3 (0.7) (0.2) 0.5 0.9 (1.5) (1.0) (0.4) 1.0 0.5 18.5 20.2 16.7 12.7 15.1 10.4 14.2 14.7 16.2 16.3 13.4 68.1 54.4 Adjusted diluted earnings per ordinary share From continuing operations 0.42 0.47 0.38 0.20 0.34 0.19 0.24 0.27 0.39 0.36 0.26 1.47 1.03 From discontinued operations (0.02) (0.03) (0.02) 0.02 (0.04) (0.02) 0.01 0.02 (0.06) (0.05) (0.04) (0.04) (0.03) 0.40 0.44 0.36 0.22 0.30 0.17 0.25 0.29 0.33 0.31 0.22 1.43 1.01


