I. EXECUTIVE SUMMARY
1.1 Introduction
On January 4, 2006, Gentiva Health Services, Inc. (“Gentiva” or the “Company”) and The Healthfield Group, Inc. (“Healthfield”) entered into a definitive merger agreement whereby a wholly owned subsidiary of Gentiva will merge with and into Healthfield, with Healthfield surviving as a wholly owned subsidiary of Gentiva (the “Merger”). Under the terms of the agreement, Gentiva will pay cash and issue shares of its common stock to Healthfield’s existing securityholders in exchange for all of the outstanding shares, options and warrants of Healthfield, with Healthfield securityholders receiving an aggregate merger consideration of approximately $274.0 million and a total purchase price, excluding transaction costs and subject to post-closing adjustments, of $454.0 million. Pro forma for the Merger, Gentiva would have had net revenues and Adjusted EBITDA of approximately $1.2 billion and $85.2 million, respectively, for the twelve month period ended September 30, 2005.(1)(2)(3)
Gentiva is the nation’s largest provider of comprehensive home health services. The Company serves patients through (i) more than 350 direct service delivery units within approximately 250 locations in 35 states, and (ii) CareCentrix, which manages home healthcare services for many major managed care organizations throughout the United States. CareCentrix provides its services in all 50 states through a network of more than 2,500 third-party provider locations, as well as Gentiva locations. For the twelve month period ended October 2, 2005, Gentiva had net revenues of $872.1 million and EBITDA of $35.5 million. (3) Gentiva is listed on the Nasdaq Stock Market’s National Market (ticker: GTIV) and had a market capitalization as of February 1, 2006 of approximately $462.8 million.
Healthfield is a leading provider of home healthcare and hospice with approximately 130 locations primarily in eight southeastern states. Founded in 1986, Atlanta-based Healthfield operates offices in Alabama, Florida, Georgia, Michigan, North Carolina, South Carolina, Tennessee, Virginia and West Virginia. Healthfield also offers a complete range of durable medical and respiratory equipment and infusion therapy. For the twelve month period ended September 30, 2005, Healthfield had revenues of $291.3 million and Adjusted EBITDA of $49.7 million.(2)(3)
In conjunction with the Merger, Gentiva has engaged Lehman Brothers Inc. (“LBI”) as Sole Lead Arranger and Sole Bookrunner to arrange $445.0 million of senior secured credit facilities (the “Credit Facilities”). The Credit Facilities will consist of:
| (i) | a $75.0 million, 6-year Revolving Credit Facility (the “Revolver”); and | ||
| (ii) | a $370.0 million, 7-year Term Loan B Facility (the “Term Loan”). |
Proceeds from the Term Loan will be used to: (i) fund the acquisition of Healthfield; (ii) refinance approximately $183.5 million of existing Healthfield indebtedness; and (iii) pay related transaction fees and expenses (together with the Merger, the “Transaction”).
| 1 | Gentiva’s fiscal third quarter ended on October 2, 2005. For illustrative purposes, pro forma information in this Confidential Memorandum has been provided without adjustment assuming Gentiva’s fiscal periods had ended on March 31, June 30, September 30 and December 31, as applicable, to coincide with Healthfield’s reportable periods. | |
| 2 | Adjusted EBITDA of Healthfield and the combined Company is pro forma for a full twelve month contribution of Capital Health Management Group Inc. (“Capital Health”), which was acquired by Healthfield in June 2005, and certain other companies that were acquired during the period. | |
| 3 | For a reconciliation of EBITDA to net income please refer to Section VII. |
| 1 |  |
1.2 Sources & Uses of Funds
The following sets forth the estimated sources and uses of funds for the Transaction.
Sources & Uses
| ($ in millions) | ||||||||||
| Sources | Uses | |||||||||
| Balance Sheet Cash | $ | 58.0 | Purchase Healthfield Equity | $ | 273.6 | |||||
Revolver(1) | 0.0 | Refinance Healthfield Debt (12/31/05E) | ||||||||
| Term Loan | 370.0 | Revolver | 11.1 | |||||||
| Gentiva Equity | 54.7 | Term Loan A | 142.5 | |||||||
| Term Loan B | 29.9 | |||||||||
| Transaction Costs and Other Expenses | 25.7 | |||||||||
Total Sources | $ | 482.8 | Total Uses | $ | 482.8 | |||||
| (1) | $75.0 million Revolver is undrawn at closing, with availability reduced only by letters of credit. Approximately $20 million of letters of credit are expected to be issued at closing. |
1.3 Pro Forma Capitalization
The table sets forth Gentiva’s and Healthfield’s capitalization as of September 30, 2005 on an actual basis and as adjusted to reflect the Transaction.
Pro Forma Capitalization
| Last Twelve Months Ended September 30, 2005 | ||||||||||||||||
| Status Quo | Status Quo | Merger | Pro Forma | |||||||||||||
| ($ in millions) | Gentiva | Healthfield | Adjustments | Company | ||||||||||||
| Cash | $ | 94.4 | $ | 13.3 | ($58.0 | ) | $ | 49.6 | ||||||||
| Existing Revolver | — | 9.6 | (9.6 | ) | — | |||||||||||
| Existing Term Loans | — | 180.0 | (180.0 | ) | — | |||||||||||
| Revolver (1) | — | — | — | — | ||||||||||||
| Term Loan | — | — | 370.0 | 370.0 | ||||||||||||
| Total Debt | — | $ | 189.6 | $ | 180.4 | $ | 370.0 | |||||||||
| Shareholders’ Equity | 181.1 | 36.2 | 18.6 | 235.8 | ||||||||||||
| Total Capitalization | $ | 181.1 | $ | 225.8 | $ | 199.0 | $ | 605.8 | ||||||||
| Debt / Adj. EBITDA | NM | 3.8 | x | 4.3 | x | |||||||||||
| Net Debt / Adj. EBITDA | NM | 3.5 | x | 3.8 | x | |||||||||||
| Adj. EBITDA / Interest Expense | NM | 3.8 | x | 3.2 | x | |||||||||||
| Debt / Capitalization | NM | 84.0 | % | 61.1 | % | |||||||||||
| Adj. EBITDA | $ | 35.5 | $ | 49.7 | $ | 85.2 | ||||||||||
| Interest Expense | NA | 13.0 | 26.8 | |||||||||||||
| (1) | $75.0 million Revolver is undrawn at closing, with availability reduced only by letters of credit. Approximately $20 million of letters of credit are expected to be issued at closing. |
| 2 | |
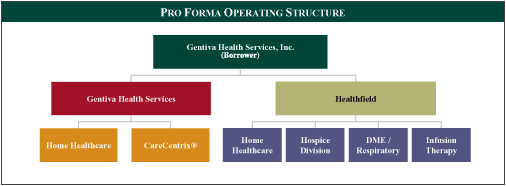
1.4 Pro Forma Operating Structure
The following chart presents the operating structure of Gentiva pro forma for the Merger. Upon consummation of the Merger, all of Gentiva’s subsidiaries will be wholly owned. Neither Gentiva nor Healthfield operate through any foreign subsidiaries.
1.5 Summary Historical Financial Results
Combined summary financial information of Gentiva and Healthfield for the twelve month period ended September 30, 2005 is provided below. Healthfield results are pro forma for a full year contribution of Capital Health, which was acquired by Healthfield in June 2005, and certain other companies acquired during the period.
Combined Summary Financial Information
| Last Twelve Months Ended September 30, 2005 | ||||||||||||
| ($ in millions) | Gentiva | Healthfield | Pro Forma | |||||||||
| Revenue | $ | 872.1 | $ | 291.3 | $ | 1,163.4 | ||||||
| Adj. EBITDA | 35.5 | 49.7 | 85.2 | |||||||||
% Margin | 4.1 | % | 17.1 | % | 7.3 | % | ||||||
| Capital Expenditures | 11.0 | 6.7 | 17.7 | |||||||||
% Revenue | 1.3 | % | 2.3 | % | 1.5 | % | ||||||
| 3 | |
1.6 Summary of Senior Credit Facility
Below are the summary terms and conditions of the Credit Facilities.
Senior Secured Credit Facilities — Summary Terms and Conditions
Borrower: | Gentiva Health Services, Inc. (the “Company”) | |
Sole Lead Arranger and Sole Bookrunner: | Lehman Brothers Inc. | |
Administrative Agent: | Lehman Commercial Paper Inc. | |
Description of the Facilities: | $445.0 million Senior Secured Credit Facilities (the “Credit Facilities”) consisting of: (i) $75.0 million, 6-year Revolving Credit Facility (the “Revolver”) (ii) $370.0 million, 7-year Term Loan B Facility (the “Term Loan”) | |
Initial LIBOR Margins: | TBD | |
Undrawn Fee: | 50 bps on undrawn portion of the Revolver, with step-down to 37.5 bps below 3.5x leverage | |
Security: | First priority lien on substantially all assets of the Company and its subsidiaries | |
Guarantees: | All restricted subsidiaries, subject to certain exceptions | |
Use of Proceeds: | Revolver (undrawn at closing): support issuances of letters of credit and fund working capital, and other general corporate purposes | |
| Term Loan: to finance the Transaction and pay related fees and expenses | ||
Amortization: | Revolver: Bullet at maturity | |
| Term Loan: 1% per annum; balance at maturity | ||
Mandatory Prepayments (subject to customary exceptions and carve-outs): | 100% of asset sales and dispositions and net insurance proceeds 100% of debt issuances 50% of equity issuances, with step-down to 0% below 3.0x leverage 50% of Excess Cash Flow, with step-down to 0% below 3.0x leverage | |
Financial Covenants: | Maximum Total Leverage Ratio Minimum Interest Coverage Ratio | |
| 4 | |
1.7 The Merger of Gentiva and Healthfield
A summary comparison of Gentiva and Healthfield is presented below:
Executive Summary
| Gentiva | Healthfield | |||||||
Company Description | u u | Nation’s leading provider of comprehensive home health services Provides (i) direct nursing, therapy and other services delivered through local delivery units, and (ii) integrated homecare solutions to managed care customers through CareCentrix® | u | Healthfield is a leading provider of home healthcare in the Southeast. Healthfield was formed in 1986 and provides a comprehensive suite of services to patients ranging from pediatric to geriatric | ||||
Headquarters | u | Melville, NY | u | Atlanta, GA | ||||
Areas of Operations | u | Home health services enhanced through specialty programs | u | Comprehensive business model including: | ||||
- Orthopedics, Safe StridesSM, Cardiopulmonary, Rehab Without Walls® | - Home Health - Hospice - DME/ Respiratory - Infusion therapy | |||||||
| u | CareCentrix® provides an array of administrative services and coordinates delivery of comprehensive home health services for managed care | |||||||
Geographic Footprint | u | Home health services delivered through 350 direct service delivery units operating from 250 locations in 35 states | u | Approximately 130 branch locations in 9 states, primarily throughout the Southeastern United States including: West Virginia, Virginia, North Carolina, South Carolina, Georgia, Alabama, Tennessee and Florida, as well as Michigan | ||||
| u | CareCentrix® operates in all 50 states through an extensive nationwide network of more than 2,500 third party provider locations and through Gentiva locations | |||||||
LTM 9/30/05 Revenue | u | $872.1 million | u | $291.3 million(1) | ||||
LTM 9/30/05 EBITDA | u | $35.5 million | u | $49.7 million (1) | ||||
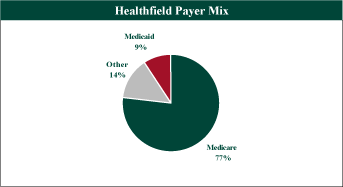
Payer Mix | uuu | Medicare –30% CIGNA –29% Other Commercial –24% | uuu | Medicare –77% Other (primarily Commercial) –14% Medicaid –9% | ||||
| u | Medicaid –17% | |||||||
Employees(2) | u | Approximately 4,300 full-time employees, 9,700 non-salaried clinical associates | u | Approximately 2,700 full-time employees and 1,300 non-salaried clinical associates |
| (1) | Pro forma for a full twelve month contribution of Capital Health and certain other companies that were acquired during the period. | |
| (2) | As at 9/30/05. |
| 5 | |
The compelling merits of the Gentiva and Healthfield combination, which are discussed in further detail in this Confidential Memorandum, include the following:
| u | Strengthens and expands operations of a leading provider of comprehensive home healthcare services |
| — | Pro forma LTM 9/30/05 revenue and Adjusted EBITDA of $1.2 billion and $85.2 million, respectively |
| u | Expands geographical footprint and scale with limited overlap |
| — | Strengthens and expands Gentiva’s presence in the Southeast, which has favorable demographic trends and includes important certificate of need states |
| — | Over 375 facilities in 36 states | ||
| — | Approximately 18,000 full- and part-time employees | ||
| — | Serves over 600,000 patients each year |
| u | Increases line-of business and payer diversification | |
| u | Expands continue into attractive new business segments, including a meaningful platform in hospice |
| — | Pro forma company will be among the nation’s top 10 providers of hospice, with a significant platform for growth |
| u | Provides significant synergy opportunities |
| — | Revenue growth will be enhanced by cross-application of Gentiva’s specialty programs and expansion of Healthfield’s hospice business |
| — | Operating expenses will be reduced as the pro forma company leverages against a consolidation of back office and support functions, technology improvements and senior management |
| u | Maximizes operational best practices |
| — | The Merger bolsters management strength with considerable operational and healthcare services experience |
| 6 | |
II. INVESTMENT HIGHLIGHTS
2.1 Strong Industry Fundamentals
Since 2000, Medicare has instituted several rate increases and, most recently, increased reimbursements rates by 2.3% effective January 1, 2005. CMS announced on November 3, 2005 a 2.8% increase in home health reimbursement; however, on February 1, 2006, Congress acted to hold constant existing reimbursement rates for 2006 (except for a 5% rural add-on premium reflected in reimbursement rates for specifically defined rural areas of the country for calendar 2006). Similarly, Medicare has also increased rates for hospice services since 2000, with the most recent increase of 3.3% for fiscal year 2005 (bringing the routine care rate to approximately $122 per-patient day); however, there has been increased focus on average length of stay.
Homecare is more cost effective than facilities-based care and benefits from positive demographic trends (i.e., an aging population). As government payers continue to search for better, more affordable healthcare, the Company believes home health and hospice care will continue to be among the most attractive options. The Company also believes home health and hospice agencies can provide the same, if not better, care than hospitals and skilled nursing facilities. The chart below demonstrates the cost effectiveness of home health and hospice agencies.
Cost of Care Comparison
| 2001 | 2002 | 2003 | 2004(1) | |||||||||||||
| Hospital charges per day | $ | 3,069 | $ | 3,164 | $ | 3,354 | $ | 3,502 | ||||||||
| Skilled nursing facility charges per day | 422 | 444 | 465 | 493 | ||||||||||||
Home health charges per visit | 105 | 108 | 109 | NA | ||||||||||||
Hospice charges per covered day of care | 125 | 128 | 123 | 127 | ||||||||||||
Source: National Association for Home Care & Hospice.
(1) Hospital and skilled nursing facility charges per day are based on preliminary data.
(1) Hospital and skilled nursing facility charges per day are based on preliminary data.
As shown in the chart below, CMS has projected significant growth in the demand for home health services. The Company believes the growth is driven by demographic and economic factors, a growing preference of patients to be treated in the comfort of their own homes and technological advances.
Home Healthcare Expenditure Projections (2004 – 2014)
($ in billions)
| Other | ||||||||||||||||||||||||
| Private Health | Private | State and | ||||||||||||||||||||||
| Total | Out-of Pocket | Insurance | Funds | Federal | Local | |||||||||||||||||||
| 2004 | $ | 45.2 | $ | 7.1 | $ | 7.9 | $ | 1.3 | $ | 21.5 | $ | 7.4 | ||||||||||||
| 2005 | 50.0 | 7.6 | 8.6 | 1.4 | 23.8 | 8.6 | ||||||||||||||||||
| 2006 | 54.8 | 8.2 | 9.2 | 1.5 | 26.5 | 9.4 | ||||||||||||||||||
| 2007 | 59.5 | 8.8 | 10.0 | 1.6 | 28.9 | 10.2 | ||||||||||||||||||
| 2008 | 64.2 | 9.5 | 10.8 | 1.7 | 31.1 | 11.1 | ||||||||||||||||||
| 2009 | 68.9 | 10.1 | 11.6 | 1.9 | 33.3 | 12.1 | ||||||||||||||||||
| 2010 | 73.6 | 10.8 | 12.4 | 2.0 | 35.4 | 13.1 | ||||||||||||||||||
| 2011 | 78.5 | 11.5 | 13.3 | 2.1 | 37.5 | 14.1 | ||||||||||||||||||
| 2012 | 83.8 | 12.3 | 14.3 | 2.3 | 39.8 | 15.2 | ||||||||||||||||||
| 2013 | 89.6 | 13.1 | 15.3 | 2.4 | 42.4 | 16.4 | ||||||||||||||||||
| 2014 | 95.9 | 14.0 | 16.7 | 2.6 | 45.0 | 17.7 | ||||||||||||||||||
| CAGR | 7.8 | % | 7.0 | % | 7.8 | % | 7.2 | % | 7.7 | % | 9.1 | % | ||||||||||||
Source: Centers for Medicare and Medicaid Services.
| 7 | |
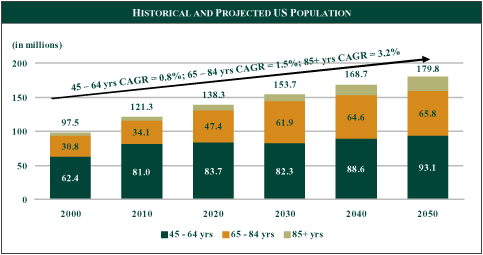
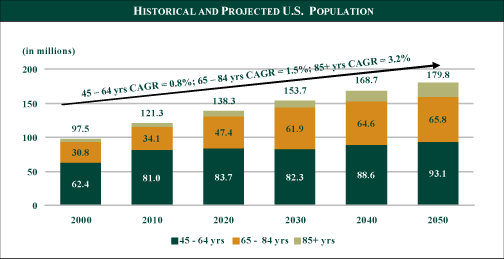
“Growth in the home health and hospice segments is further driven by the aging of the population as the baby boom” generation reaches retirement age. As the country’s population continues to age, the need for all forms of healthcare services increases in terms of both frequency and intensity.
By 2000, baby boomers ages ranged between 36 and 54 years old. According to the U.S. Census projections, there will be approximately 70 million elderly people by 2030, doubling the amount in 2000 of approximately 35 million. This fundamental shift in the age of the population should have a positive effect on the number of patients eligible to receive the Company’s services.
Source: U.S. Census Bureau.
| 8 | |
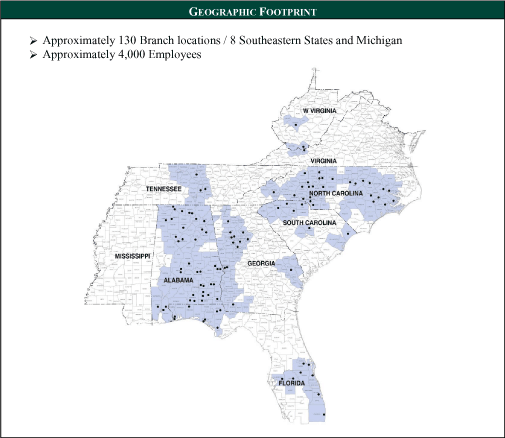
| 2.2 | Largest Comprehensive Home Healthcare Provider in the Nation with Geographic Diversity and Scale |
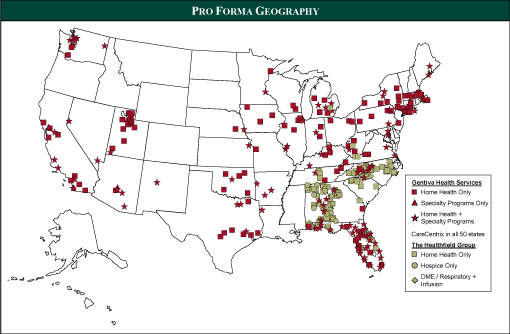
The Merger strengthens and expands Gentiva’s presence in the Southeast, which has favorable demographic trends and provides a platform in important certificate of need states. Pro forma for the Merger, the Company will operate through over 375 facilities in 36 states, employ approximately 18,000 full- and part-time employees and serve over 600,000 patients each year.
| 9 | |
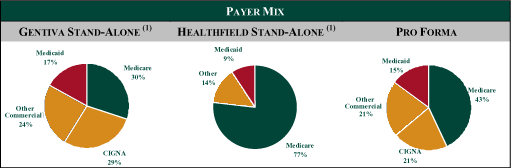
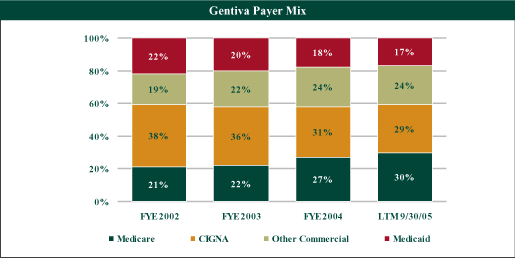
2.3 Diversified Payer Mix
The Merger increases Gentiva’s pro forma Medicare mix, and as a result, improves margins and cash flow. The Merger also reduces both the significance of CIGNA Health Corporation (“CIGNA”) as a payer source as well as the participation in the lower margin Medicaid business.
(1) Based on results for the nine months ended 9/30/05.
2.4 Diversified Business Mix
The Merger expands Gentiva’s product mix into attractive new business segments, including a meaningful platform in hospice. New business lines, including durable medical equipment (“DME”) and respiratory therapy, will also be added to Gentiva’s existing operations as a result of the Merger, while CareCentrix’s proportional contribution to pro forma revenue will be reduced.
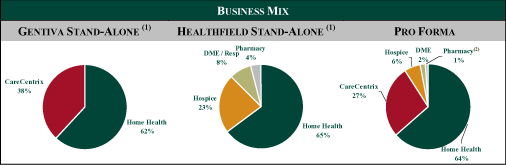
(1) Based on results for the nine months ended 9/30/05.
(2) Gentiva entered into certain restrictive covenants in connection with the June 2002 sale of its specialty pharmaceutical services business to Accredo Health which may limit Gentiva’s ability to operate in certain pharmacy product lines.
(2) Gentiva entered into certain restrictive covenants in connection with the June 2002 sale of its specialty pharmaceutical services business to Accredo Health which may limit Gentiva’s ability to operate in certain pharmacy product lines.
| 10 | |
2.5 Significant Cash Flow and Low Capital Expenditure Requirements
Home healthcare companies are not as capital intensive as facility-based long-term care providers. These modest capital expenditure levels help the Company achieve strong and consistent free cash flows.
Cash Flow and Capital Expenditures
| Last Twelve Months Ended | ||||||||||||
| September 30, 2005 | ||||||||||||
| ($ in millions) | Gentiva | Healthfield | Pro Forma | |||||||||
| Revenue | $ | 872.1 | $ | 291.3 | $ | 1,163.4 | ||||||
| Adj. EBITDA | 35.5 | 49.7 | 85.2 | |||||||||
% Margin | 4.1 | % | 17.1 | % | 7.3 | % | ||||||
| Capital Expenditures | 11.0 | 6.7 | 17.7 | |||||||||
% Revenue | 1.3 | % | 2.3 | % | 1.5 | % | ||||||
| Adj. EBITDA — Capex | 24.5 | 42.9 | 67.4 | |||||||||
% Margin | 2.8 | % | 14.7 | % | 5.8% | |||||||
2.6 Moderate Leverage and Significant Equity Cushion
As a result of the Transaction, Gentiva’s total debt increases to $370.0 million and pro forma total debt/Adjusted EBITDA as of September 30, 2005 increases to a moderate level of 4.3x. Based on a closing price of $18.76 per share on February 1, 2006 and pro forma diluted outstanding shares of 27.9 million1, Gentiva had a pro forma market enterprise value of $844.5 million, representing a pro forma enterprise value/Adjusted EBITDA ratio of approximately 9.9x. As a result, pro forma debt currently constitutes less than one half the market enterprise value of the Company.
| 1 | Assumes that shares issued to Healthfield at merger closing (assumed to be February 1, 2006 for illustrative purposes) are based on the average trading price of: (i) the 10-day trading period two days prior to signing, which is the 10-day period ended January 3, 2006, and (ii) the 10-day trading period ending two days prior to closing, which is assumed to be the 10-day period ended January 30, 2006. |
| 11 | |
2.7 Experienced Management Team Augmented by Additions from Healthfield
Upon closing, Rod Windley, Healthfield’s Chairman and CEO, will join Gentiva’s Board of Directors and serve as Vice Chairman, and Tony Strange, Healthfield’s President and COO will join Gentiva’s senior leadership team. Both Mr. Windley and Mr. Strange have a wealth of experience in the healthcare services industry. Mr. Windley has served in his current capacity as Chairman and CEO of Healthfield since he founded the Company in 1986. He has also held various leadership roles for the National Association for Homecare. Mr. Strange has been with Healthfield since 1990 and has risen from the position of a General Manager to President and Chief Operating Officer of the Company. Both Mr. Windley and Mr. Strange also bring a significant amount of transaction experience, as both have successfully integrated over 15 home health, hospice and home infusion acquisitions into Healthfield since 1996.
Gentiva’s senior management team, including Ron Malone and John Potapchuk, has significant experience in the healthcare services industry. In recent years, the management team has streamlined and focused the Company through the divestiture of its specialty pharmaceutical services business to Accredo Health in 2002 and through exiting underperforming markets. The management team has also improved operations, developed specialty programs and diversified its payer mix.
| 12 | |
III. TERM SHEET
See the Commitment Letter, dated January 4, 2006, among Gentiva Health Services, Inc., Lehman Commercial Paper Inc. and Lehman Brothers Inc. filed on Company’s Form 8-K dated January 31, 2006.
| 13 | |
IV. GENTIVA HEALTH SERVICES, INC.
4.1 Company Overview
Headquartered in Melville, NY, Gentiva is the nation’s largest provider of comprehensive home health services, based on revenues derived from the provision of skilled home nursing and therapy services to patients. The Company’s services can be delivered across the United States 24 hours a day, 7 days a week. The Company’s operations involve servicing patients and customers through its two business segments: Home Healthcare Services and CareCentrix®.
Home Healthcare Services (62% of LTM 10/2/05 Revenues)
The Home Healthcare Services segment is comprised of direct home nursing and therapy services operations, including specialty programs, Gentiva Rehab Without Walls® and Gentiva Consulting. The Company’s Home Healthcare Services segment conducts its business through more than 350 direct service delivery units operating from more than 250 locations under its Gentiva brand.
The Company’s direct home nursing and therapy services operations are conducted through licensed and Medicare-certified agencies located in 35 states, substantially all of which are currently accredited by the Joint Commission on Accreditation of Healthcare Organizations (“JCAHO”). Gentiva’s direct home nursing and therapy operations are organized into five geographic regions, each staffed with clinical, operational and sales teams. Regions are further separated into operating areas. Each operating area includes branch locations through which home healthcare agencies operate. Each agency is led by a director and is staffed with clinical and administrative support staff as well as clinical associates who deliver direct patient care. The clinical associates are employed on either a full-time basis or are paid on a per visit, per shift, per diem or per hour basis.
The Company’s direct home nursing and therapy services operations also deliver services to its customers through focused specialty programs that include:
| u | Gentiva Orthopedics, which provides individualized home orthopedic rehabilitation services to patients recovering from joint replacement or other major orthopedic surgery; | ||
| u | Gentiva Safe StridesSM, which provides therapies for patients with balance issues who are prone to injury or immobility as a result of falling; and | ||
| u | Gentiva Cardiopulmonary, which helps patients and their physicians manage heart and lung health in a home-based environment. |
Gentiva Rehab Without Walls® provides home and community-based neurorehabilitation therapies for patients with traumatic brain injury, cerebrovascular accident injury and acquired brain injury, as well as a number of other complex rehabilitation cases.
The Company also provides consulting services to home health agencies through its Gentiva Consulting unit. These services include billing and collection activities, on-site agency support and consulting, operational support and individualized strategies for reduction of days sales outstanding.
| 14 | |
CareCentrix® (38% of LTM 10/2/05 Revenues)
The CareCentrix segment encompasses Gentiva’s ancillary care benefit management and coordination of integrated homecare services for managed care organizations and health benefit plans through a network of more than 2,500 third-party provider locations, as well as Gentiva locations. CareCentrix operations provide an array of administrative services and coordinate the delivery of home nursing services, acute and chronic infusion therapies, DME, and respiratory products and services for managed care organizations and health plans. These administrative services are coordinated through regional centers and are delivered through Gentiva direct home nursing and therapy locations as well as through an extensive nationwide network of third-party provider locations in all 50 states.
CIGNA has historically constituted a significant customer of Gentiva’s CareCentrix group. As Gentiva announced on October 24, 2005, CareCentrix ended its coordination of respiratory therapy and certain DME services to CIGNA members as of January 31, 2006. On October 27, 2005, the Company announced the amendment of its contract and extension of its national relationship with CIGNA through January 31, 2009. Under the amended contract, CareCentrix will continue to coordinate the provision of direct home nursing and related services through the CareCentrix network of credentialed, third-party providers or through Gentiva’s own home healthcare locations, as well as home infusion services and certain other specialty medical equipment solely through the CareCentrix network. The Company recently further expanded its relationship with CIGNA to include the New England States.
4.2 Products and Services
Gentiva’s agencies provide various combinations of skilled nursing and therapy services, paraprofessional nursing services and homemaker services to pediatric, adult and elder patients. Reimbursement sources include government programs, such as Medicare and Medicaid, and private sources, such as health insurance plans, managed care organizations, long term care insurance plans and personal funds.
| 15 | |
The table below presents Gentiva’s referral flow through its Home Healthcare and CareCentrix segments.
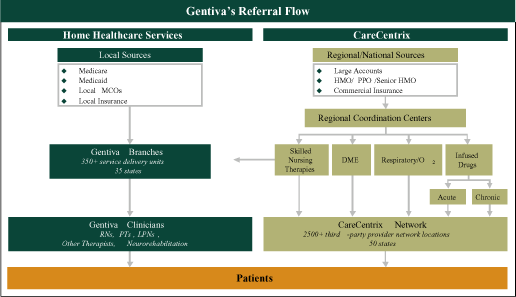
Home Healthcare (62% of LTM 9/30/05 Revenues)
| u Gentiva Home Healthcare |
| – | Skilled nursing | ||
| – | Skilled therapies – physical, occupational, speech | ||
| – | Medical social work | ||
| – | Assistance with daily living | ||
| – | Disease management | ||
| – | Gentiva Consulting |
| • | Consulting, application service provider, billing and accounts receivable solutions for home health agencies and other companies |
| u National population served |
| – | Adult, older adult and pediatric patients | ||
| – | Other home health agencies through Gentiva Consulting |
| u Specialty Programs |
| – | Gentiva Orthopedics |
| • | Rehabilitation following joint replacement surgery |
| 16 | |
| • | Reimbursed under Medicare and commercial insurance programs |
| – | Gentiva Safe StridesSM |
| • | Therapies for patients with balance problems who are prone to falling | ||
| • | Treatment minimizes causes of falls | ||
| • | Reimbursed under Medicare and commercial insurance programs |
| – | Gentiva Cardiopulmonary |
| • | Prevent progression of heart- and lung-related diseases | ||
| • | Limit or eliminate need for institutional care | ||
| • | Reimbursed under Medicare and commercial insurance programs |
| – | Gentiva Rehab Without Walls® |
| • | Home and community-based neurorehabilitation | ||
| • | Reimbursed by managed care and workers compensation insurers |
CareCentrix®(38% of LTM 9/30/05 Revenues)
| u Integrated Managed Homecare Solutions |
| – | Focus on improving access, quality, service and information and controlling costs related to home healthcare services |
| u Core Capabilities |
| – | Central access, care coordination, utilization management and claims processing |
| u Services to Managed Care Members |
| – | Direct home health nursing, chronic and acute infusion services, home medical equipment, respiratory products and devices |
| u Service Delivery Network |
| – | More than 2,500 nationwide third-party provider locations | ||
| – | Gentiva branch operations |
| 17 | |
4.3 Payer Mix
As the table below highlights, Gentiva’s payer mix has shifted in the last four years as the Company has increased its exposure to higher margin Medicare business and has de-emphasized its reliance on CIGNA and Medicaid. This decrease resulted, in part, from a change to a lower cost DME delivery model as well as lower membership in CIGNA plans. As a result of the Merger, Gentiva will further reduce the significance of CIGNA as a payer source.
On October 27, 2005, the Company announced the amendment of its contract and extension of its national relationship with CIGNA through January 31, 2009. Under the amended contract, CareCentrix is continuing to coordinate the provision of direct home nursing and related services through the CareCentrix network of credentialed, third-party providers or through Gentiva’s own home healthcare locations, as well as home infusion services and certain other specialty medical equipment solely through the CareCentrix network. Among the specialty equipment to be provided to CIGNA members through CareCentrix are insulin pumps, wound suction devices and other products. As Gentiva announced on October 24, 2005, CareCentrix ended its coordination of respiratory therapy and certain DME services to CIGNA members as of January 31, 2006.
| 18 | |
4.4 Senior Management
Gentiva Executive Management
| Name | Position / Description | |||
| Ron Malone | u | CEO and Chairman of the Board | ||
| – Previously President of North American Staffing for Olsten Corporation | ||||
| – Served as executive with Emery Worldwide | ||||
| John Potapchuk | u | SVP, CFO and Treasurer | ||
| – Previously held senior management positions at two major independent public accounting firms — PricewaterhouseCoopers, LLP and Deloitte & Touche | ||||
| Bob Creamer | u | SVP, Home Healthcare Operations | ||
| – Previously VP/Division Controller for Olsten Health Services (Gentiva predecessor) | ||||
| – Served as VP, Investment Banking for Merrill Lynch | ||||
| Mary Morrisey-Gabriel | u | SVP and Chief Marketing Officer | ||
| – Previously SVP of National Accounts / North American Sales for Adecco | ||||
| Steve Paige | u | SVP, General Counsel & Secretary | ||
| – Previously held senior legal positions with several large healthcare, consumer product and technology companies | ||||
| Brian Jones | u | VP and Chief Information Officer | ||
| – Previously Director of Business Technology Solutions for Pepsi Cola North America | ||||
| Murray Mease | u | VP, CareCentrix® | ||
| – Previously developed and managed Medical Care America’s Memphis-based patient management and distribution hub in partnership with Federal Express | ||||
| John Camperlengo | u | VP, Deputy General Counsel and Chief Compliance Officer | ||
| – Previously Vice President & Associate General Counsel in the law department of Prudential Securities Incorporated | ||||
Senior Management
Ron Malone–CEO and Chairman of the Board– Ron joined Gentiva in 2000 as Executive Vice President. In 2001, he was named President of Gentiva’s Home Health Care Services Division. He assumed his current position in 2002 following the sale of Gentiva’s Specialty Pharmaceutical Services business.
Prior to Gentiva, Ron served for more than a decade with Olsten Corporation, a major provider of professional and temporary staffing, home healthcare and information technology services. He held a number of management positions with the company’s staffing division and rose to become President of North American Staffing. Previously, he was an executive with Emery Worldwide, an international air freight company, where he held sales, customer service management and operations management positions.
Ron currently serves on the board of directors of the American Association for Homecare and the National Association for Homecare and Hospice. He holds a bachelor’s degree from Furman University.
John Potapchuk–Senior Vice President, Chief Financial Officer and Treasurer– John has served as Senior Vice President and Chief Financial Officer of Gentiva since June 2002. He served as Vice President of Finance and Controller of the Company from March 2000 to June 2002. He joined Gentiva in 1991 and served in various corporate financial management positions, including Vice President and Operations Controller and Vice President of Finance. Prior to joining Gentiva, John served in senior management positions at two major independent public accounting firms — PricewaterhouseCoopers,
| 19 | |
LLP and Deloitte & Touche. John holds a BA in mathematics from Boston College. He is a certified public accountant.
Bob Creamer–Senior Vice President, Home Healthcare Operations– Bob oversees Gentiva’s day-to-day home healthcare operations and works with the field leadership teams to ensure that the extensive branch network is moving in the proper strategic direction. He’s dedicated to empowering caregivers and associates with the appropriate tools, framework and technology to help each branch excel in what is a very local business. Bob is a CPA and a member of the Health Care Finance Management Association. He received his BBA in Accounting from Hofstra University.
Mary Morrisey-Gabriel–Senior Vice President and Chief Marketing Officer– Mary oversees Gentiva’s company-wide sales and marketing initiatives. She has served as Senior Vice President and Chief Marketing Officer of the Company since February 2005, focusing on the development of the Company’s strategic plan and new branding strategy to better reflect Gentiva’s mission, vision and values. From July 2002 to February 2005, she served as Senior Vice President, Sales of the Company. Mary attended Rutgers University.
Steve Paige–Senior Vice President, General Counsel & Secretary– Steve is responsible for Gentiva’s legal affairs, providing advice to the Company’s senior management team, business associates and Board of Directors. He also oversees the Company’s Contracts Department and Corporate Licensure Department. Steve is a graduate of Georgetown University Law Center.
John Camperlengo–Vice President, Deputy General Counsel and Chief Compliance Officer– John is responsible for overseeing Gentiva’s compliance program, regulatory affairs, HIPAA management, privacy, billing compliance review, real estate, policy development and the Company’s Contracts Department. In addition, John is the Deputy General Counsel of Gentiva’s Law Department. John holds degrees from St. John’s University and Seton Hall University. He also holds the rank of Lieutenant Colonel in the Marine Corps Reserves.
4.5 Employees
As of October 2, 2005, Gentiva’s workforce consisted of approximately 4,300 full-time associates, including 1,200 salaried clinical associates. The average number of non-salaried clinical associates employed on a weekly basis in the home health services business was approximately 9,700.
| 20 | |
V. THE HEALTHFIELD GROUP, INC.
5.1 Company Overview
Based in Atlanta, GA, Healthfield is a leading provider of comprehensive home healthcare in the Southeast. Through its operating subsidiaries, Healthfield offers a comprehensive suite of services to a broad patient base ranging from neonatal to geriatric. Healthfield’s largest payer is Medicare; however, Healthfield also receives payment from Medicaid, commercial insurers and self-pay individuals. Healthfield is organized into four operating divisions offering (i) home based nursing and related care, (ii) hospice care, (iii) DME, and (iv) pharmacy services. The following chart presents revenue by division for the twelve month period ended September 30, 2005.

Note: Does not include intercompany revenues.
During June 2005, Healthfield acquired Capital Health Management Group (“Capital Health”), a home health service provider in six states in the Southeast for approximately $70 million. Pro forma for a full year contribution, Capital Health represented approximately 30% of Healthfield’s total home health net revenue for the twelve month period ended September 30, 2005. During July 2004, Healthfield acquired certain assets of Wiregrass Hospice, Inc, (“Wiregrass”), a hospice and homecare service provider in Alabama, Florida, and Georgia, including voting control of Hospice of the Emerald Coast, a not-for-profit membership corporation providing hospice services in Florida, for approximately $77 million. Wiregrass represented approximately 90% of the total hospice care revenue for the twelve month period ended September 30, 2005.
Healthfield has grown through a series of other home health agency acquisitions in recent years, including the acquisition of Total Care for $17.3 million in June 2003 and eight smaller acquisitions (each for less than $3.0 million).
| 21 | |
Company and Merger History:
| 1986 | Incorporated | |
| 1991 | First Capitated Contract | |
| 1996 | Healthfield, Inc. Acquired Metro Home Health | |
| 1997 | Balanced Budget Act ‘97 | |
| 1998 | Healthfield, Inc. Acquired Mid South Home Health | |
| 2000 | Implemented PPS | |
| 2001 | Management forms Four Seasons Healthcare, Inc. | |
| 2002 | Acquired Chattahoochee Valley | |
| 2003 | Acquired Total Care | |
| 2003 | Acquired Vaughn Homecare |
| 22 | |
| 2004 | Acquired Riverview Home Health (HMA) | |
| 2004 | Acquired Wiregrass Hospice a.k.a. Horizon | |
| 2004 | Acquired Ogeechee Home Health (HMA) | |
| 2004 | Acquired Franklin Regional Home Health (HMA) | |
| 2004 | The Healthfield Group, Inc. Holding Company Formed | |
| 2005 | Acquired UAB Hospice | |
| 2005 | Acquired Medical Home Care, TN (HMA) | |
| 2005 | Acquired Donelson Home Health, TN (HMA) | |
| 2005 | Acquired Capital Health |
5.2 Products and Services
The Company’s programs and services include:
| u | Skilled Nursing Care | |
| u | Home Health Aides | |
| u | Physical Therapy | |
| u | Occupational Therapy | |
| u | Enterostomal Therapy | |
| u | Oncology Services | |
| u | Chemotherapy | |
| u | IV Therapy | |
| u | Speech Therapy | |
| u | Nutritional Guidance | |
| u | Medical Equipment | |
| u | Pediatrics | |
| u | Catheter Care | |
| u | Medications | |
| u | Injections | |
| u | Cardiac Monitoring | |
| u | AIDS Education | |
| u | Respiratory Therapy | |
| u | Patient Teaching | |
| u | Physical Assessment | |
| u | Case Management | |
| u | Family Support Services | |
| u | Special Education |
Home Health Division (65% of Healthfield LTM 9/30/05 Revenue)
The Home Health division is a Medicare / Medicaid certified homecare provider with 92 locations in nine states. Through the Home Health division, Healthfield maintains a position as one of the top providers of home health services in key states such as Alabama, Florida, Georgia, North Carolina, and South Carolina. The home health division offers services including: (i) registered nurses, who provide skilled nursing care, (ii) physical therapists, who help patients restore strength and range of motion, (iii) occupational therapists, who assist in the performance of daily living activities, (iv) speech therapists, who retrain patients to overcome speech impairments, (v) social workers, who help patients and their families deal with issues and concerns that arise from health problems, and (vi) home health aides, who provide personal care such as bathing or assistance with walking.
Hospice Division (23% of Healthfield LTM 9/30/05 Revenue)
Healthfield’s hospice division serves patients through 24 locations in three states. Healthfield maintains a position as one of the top providers of hospice care in the states of Alabama, Florida and Georgia. The hospice division offers comprehensive management of the healthcare services and products needed by hospice patients and their families through the use of an interdisciplinary team. Each hospice patient is assigned an interdisciplinary team comprised of a physician, nurse(s), home health aide(s), medical social worker(s), a chaplain, as well as other care professionals.
| 23 | |
Durable Medical Equipment and Respiratory Therapy Division (“DME”) (8% of Healthfield LTM 9/30/05 Revenue)
Healthfield provides DME and respiratory therapy to patients at home through 31 locations in five states. The DME division offers patients a broad portfolio of products and services that serve as an adjunct to traditional home health nursing and hospice care. Particularly, the division provides respiratory therapy services to patients who suffer from a variety of conditions including asthma, chronic obstructive pulmonary diseases, cystic fibrosis and other respiratory conditions. Home medical equipment includes hospital beds, wheelchairs, ambulatory aids, bathroom aids, patient lifts and rehabilitation equipment.
Infusion Therapy (Pharmacy) Division (4% of Healthfield LTM 9/30/05 Revenue)
The infusion therapy division prescribes home infusion therapy to patients at home through 15 locations in four states. Infusion therapy serves as a complement to Healthfield’s traditional service offering, providing clients with a comprehensive home health provider while diversifying Healthfield’s revenue base. Services provided include: (i) enteral nutrition, (ii) antibiotic therapy, (iii) total parenteral nutrition, (iv) pain management, (iv) chemotherapy, (v) patient education and training, and (vi) nutrition management.
5.3 Payer Mix
As the table below highlights, Healthfield is a dominant Medicare provider in the Southeast, particularly in home health and hospice. Healthfield is also the primary provider for Blue Cross Blue Shield patients across Healthfield’s geographic coverage area in the Southeast.
| 24 | |
5.4 Retained Management
Retained Management
| Name | Position / Description | |
| Rod Windley | u Chairman and CEO | |
| – Founder, Healthfield, Inc. | ||
| – Founder, R.D. Windley & Associates | ||
| – Former Director, National Association for Home Care | ||
| – Began career with Ernst & Ernst | ||
| Tony Strange | u President and COO | |
| – President since 2001 | ||
| – Joined the Company in 1990, previously serving as Regional Manager and VP — Development | ||
| – Held several management positions at Glassrock Home Health Care | ||
| Doug Caddell | u EVP of Business Development | |
| – Joined in 1989 | ||
| – Held several executive and senior management sales and operational positions at Glassrock Home Health Care | ||
| – Former owner-operator of Respiratory Home Care | ||
| Jeff Shaner | u VP of Home Health Division | |
| – VP of Home Health since 2004 | ||
| – VP of Operations, Total Care, 2000 – 2003 | ||
| Ray Shrout | u VP of Hospice Division | |
| – Joined the Company as its first VP of Hospice in 2004 when Wiregrass Hospice was acquired | ||
| – Former President and CEO, Wiregrass Hospice | ||
| – 10+ years experience in the Hospice industry |
5.5 Employees
Healthfield currently has approximately 2,700 full-time employees and 1,300 non-salaried clinical associates.
| 25 | |
VI. INDUSTRY OVERVIEW
6.1 Industry Overview
From 1990 to 1997, home healthcare was among the fastest growing segments of national healthcare expenditures because, among other things, it provided low-cost healthcare services to many homebound patients. During this period, home healthcare expenditures rose from $3.7 billion to $17.8 billion. The Balanced Budget Act of 1997 (“BBA”), however, was drafted to substantially decrease Medicare expenditures over five years and targeted the home healthcare industry to generate approximately 14% of the total savings—a number that exceeded the industry’s percentage of total Medicare spending.
Medicare-certified (Part A) home health nursing agencies and providers of respiratory therapy to Medicare patients were most impacted by BBA’s cuts. In the two years following BBA’s passage, a significant number of nursing and home oxygen providers closed nationwide.
Precipitating the impact of the BBA were media reports highlighting fraud at many levels of the industry. The government’s declarations that as much as 40% (later shown to be less than 3%) of all home health billing claims might be fraudulent only exacerbated regulatory scrutiny. Legislative attention was gained when the rapid increase in Medicare home health expenditures was shown to be disproportionate due to an increase in the number of home health visits provided to each patient as opposed to an increase in the number of beneficiaries receiving services. From 1990 to 1996, Medicare beneficiaries receiving home health services increased from 1.9 million to 3.6 million, or 89%, while the number of home health visits provided to each beneficiary increased from 36 to 79, or 119%.
These statistics, pointing to an overutilization of services, moved Congress and the Health Care Finance Administration (“HCFA”) to overhaul the Medicare home health payment system. The payment reform imposed per beneficiary cost caps in addition to existing per visit cost-limit caps. This modified payment methodology—also known as the Interim Payment System (“IPS”) negatively impacted the industry as well. Medicare home health nursing expenditures decreased from $16 billion in 1997 (pre-IPS) to approximately $7 billion in 1999.
Congress mandated the move to a prospective payment system (“PPS”) effective October 1, 2000. PPS compensates providers by paying on a 60-day episodic or prospective basis for homecare and on a per-patient day for hospice care. It allows providers to keep any profits collected from maintaining costs below a prospective rate schedule. Since 2000, Medicare has instituted several rate increases and most recently, increased reimbursements rates by 2.3% effective January 1, 2005. The Centers for Medicare and Medicaid Services (“CMS”) announced on November 3, 2005 a 2.8% increase in home health reimbursement; however, on February 1, 2006, Congress passed legislation to hold existing reimbursement rates constant for 2006 (except for a 5% rural add-on premium reflected in reimbursement rates for specifically defined rural areas of the country for calendar 2006).
Similarly, Medicare has also increased rates for hospice services since 2000, with the most recent increase of 3.3% for fiscal year 2005 (bringing the routine care rate to approximately $122 per-patient day); however, there has been increased focus and concern on average length of stay.
A key driver of the anticipated growth in the home health and hospice industries is the aging population. As the country’s population continues to age and as the “baby boom” generation reaches retirement age, the need for all forms of healthcare services increases in terms of both frequency and intensity.
By 2000, baby boomers’ ages ranged between 36 and 54 years old. According to U.S. Census projections, there will be approximately 70 million elderly people by 2030, double the elderly
| 26 | |
population in 2000. This fundamental age shift in the population should have a positive effect on the number of patients eligible to receive the Company’s services.
Source: U.S. Census Bureau.
In addition to positive demographic trends, home healthcare can be significantly more cost effective than facilities-based care. The chart below demonstrates the cost effectiveness of home health and hospice agencies.
Cost of Care Comparison
| 2001 | 2002 | 2003 | 2004(1) | |||||||||||||
| Hospital charges per day | $ | 3,069 | $ | 3,164 | $ | 3,354 | $ | 3,502 | ||||||||
| Skilled nursing facility charges per day | 422 | 444 | 465 | 493 | ||||||||||||
Home health charges per visit | 105 | 108 | 109 | NA | ||||||||||||
Hospice charges per covered day of care | 125 | 128 | 123 | 127 | ||||||||||||
Source: National Association for Home Care & Hospice.
| (1) | Hospital and skilled nursing facility charges per day are based on preliminary data. |
As shown in the chart below, CMS has projected significant growth in the demand for home health services. The Company believes the growth is driven by demographic and economic factors, a growing preference of patients to be treated in the comfort of their own homes and technological advances.
| 27 | |
Home Healthcare Expenditure Projections (2004 – 2014)
($ in billions)
($ in billions)
| Other | ||||||||||||||||||||||||
| Private Health | Private | |||||||||||||||||||||||
| Total | Out-of Pocket | Insurance | Funds | Federal | State and Local | |||||||||||||||||||
| 2004 | $ | 45.2 | $ | 7.1 | $ | 7.9 | $ | 1.3 | $ | 21.5 | $ | 7.4 | ||||||||||||
| 2005 | 50.0 | 7.6 | 8.6 | 1.4 | 23.8 | 8.6 | ||||||||||||||||||
| 2006 | 54.8 | 8.2 | 9.2 | 1.5 | 26.5 | 9.4 | ||||||||||||||||||
| 2007 | 59.5 | 8.8 | 10.0 | 1.6 | 28.9 | 10.2 | ||||||||||||||||||
| 2008 | 64.2 | 9.5 | 10.8 | 1.7 | 31.1 | 11.1 | ||||||||||||||||||
| 2009 | 68.9 | 10.1 | 11.6 | 1.9 | 33.3 | 12.1 | ||||||||||||||||||
| 2010 | 73.6 | 10.8 | 12.4 | 2.0 | 35.4 | 13.1 | ||||||||||||||||||
| 2011 | 78.5 | 11.5 | 13.3 | 2.1 | 37.5 | 14.1 | ||||||||||||||||||
| 2012 | 83.8 | 12.3 | 14.3 | 2.3 | 39.8 | 15.2 | ||||||||||||||||||
| 2013 | 89.6 | 13.1 | 15.3 | 2.4 | 42.4 | 16.4 | ||||||||||||||||||
| 2014 | 95.9 | 14.0 | 16.7 | 2.6 | 45.0 | 17.7 | ||||||||||||||||||
| CAGR | 7.8 | % | 7.0 | % | 7.8 | % | 7.2 | % | 7.7 | % | 9.1 | % | ||||||||||||
| Source: Centers for Medicare and Medicaid Services. |
6.2 Competition
The home healthcare and hospice fields are highly competitive and fragmented in each state in which the Company operates. Gentiva and Healthfield compete with numerous other licensed as well as certified home healthcare agencies in each of the markets they serve. Healthfield also competes against several hospice providers in the Southeast. In addition, each company competes with home healthcare agencies that, in addition to providing home health aide and skilled nursing services, also provide pharmaceutical products and other homecare services that can generate additional referrals. Beyond the scope of services, competition also involves the quality of services provided and the pricing for such services. As a result of changes in Medicare reimbursement, competitive pressures of managed care, and the highly fragmented nature of both industries, the home healthcare and hospice industries continue to experience consolidation.
| 28 | |
Number of Medicare-Certified Agencies: 1990 – 2003
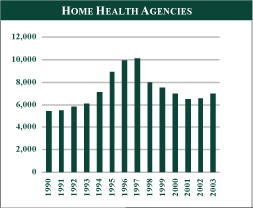 | 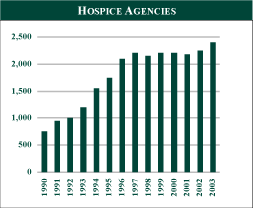 |
Source: Centers for Medicare and Medicaid Services.
In addition to competition for customers, the home healthcare and hospice sectors also are experiencing intense competition for qualified personnel. Among other ways, the Company recruits personnel through newspaper advertisements, job fairs, solicitations on websites and referrals from existing personnel to meet the growing staffing needs.
| 29 | |
VII. FINANCIAL OVERVIEW
7.1 Gentiva Historical Financial Performance and Discussion
The following tables and management discussion provide a summary of Gentiva’s audited financial statements for the 2002, 2003 and 2004 fiscal periods and its unaudited financial statements for the nine month periods ended September 26, 2004 and October 2, 2005 and the last twelve months ended October 2, 2005. Investors should refer to Gentiva’s annual, quarterly and current reports, proxy statements and other information filed with the Securities and Exchange Commission (the “SEC”) for a more comprehensive description of its business. Gentiva’s filings are available at the SEC’s website athttp://www.sec.govand its common stock is listed and traded on the Nasdaq Stock Market’s National Market under the trading symbol GTIV.
Gentiva Historical Statements of Operations
| ($ in thousands) | Fiscal Year Ended | Nine Months Ended | LTM | |||||||||||||||||||||
| 2002 | 2003 | 2004(1) | 9/26/2004 | 10/2/2005 | 10/2/2005(1) | |||||||||||||||||||
| Net revenues | $ | 768,501 | $ | 814,029 | $ | 845,764 | $ | 620,223 | $ | 646,801 | $ | 872,342 | ||||||||||||
| Cost of services sold | 520,901 | 531,987 | 521,835 | 383,092 | 404,401 | 543,144 | ||||||||||||||||||
| Gross profit | $ | 247,600 | $ | 282,042 | $ | 323,929 | $ | 237,131 | $ | 242,400 | $ | 329,198 | ||||||||||||
| Selling, general and administrative expenses | (276,355 | ) | (252,334 | ) | (278,342 | ) | (201,405 | ) | (216,443 | ) | (293,380 | ) | ||||||||||||
| Depreciation and amortization | (7,185 | ) | (6,851 | ) | (7,329 | ) | (5,505 | ) | (5,938 | ) | (7,762 | ) | ||||||||||||
| Operating income (loss) | ($35,940 | ) | $ | 22,857 | $ | 38,258 | $ | 30,221 | $ | 20,019 | $ | 28,056 | ||||||||||||
| Gain on sale of Canadian investment | — | — | 946 | 946 | — | — | ||||||||||||||||||
| Interest income, net | 834 | 441 | 977 | 538 | 1,262 | 1,701 | ||||||||||||||||||
| Income (loss) from continuing operations before income taxes | ($35,106 | ) | $ | 23,298 | $ | 40,181 | $ | 31,705 | $ | 21,281 | $ | 29,757 | ||||||||||||
| Income tax (expense) benefit | (18,437 | ) | 33,468 | (13,693 | ) | (12,111 | ) | (4,255 | ) | (5,837 | ) | |||||||||||||
| Income (loss) from continuing operations | ($53,543 | ) | $ | 56,766 | $ | 26,488 | $ | 19,594 | $ | 17,026 | $ | 23,920 | ||||||||||||
| Discontinued operations, net of tax | 191,578 | — | — | — | — | — | ||||||||||||||||||
| Income before cumulative effect of accounting change | $ | 138,035 | $ | 56,766 | $ | 26,488 | $ | 19,594 | $ | 17,026 | $ | 23,920 | ||||||||||||
| Cumulative effect of accounting change, net of tax | (187,068 | ) | — | — | — | — | — | |||||||||||||||||
| Net income (loss) | ($49,033 | ) | $ | 56,766 | $ | 26,488 | $ | 19,594 | $ | 17,026 | $ | 23,920 | ||||||||||||
Supplemental Information(2) | ||||||||||||||||||||||||
A reconciliation of income (loss) from continuing operations between as reported and as adjusted amounts follow:(2) | ||||||||||||||||||||||||
| �� | ||||||||||||||||||||||||
Income (loss) from continuing operations — as reported(A) | ($53,543 | ) | $ | 56,766 | $ | 26,488 | $ | 19,594 | $ | 17,026 | $ | 23,920 | ||||||||||||
Add: Income tax expense (benefit) — as reported(E) | 18,437 | (33,468 | ) | 13,693 | 12,111 | 4,255 | 5,837 | |||||||||||||||||
| Income (loss) from continuing operations before taxes — as reported | ($35,106 | ) | $ | 23,298 | $ | 40,181 | $ | 31,705 | $ | 21,281 | $ | 29,757 | ||||||||||||
Less: Medicare cost report settlements(B) | — | — | (10,365 | ) | (10,087 | ) | — | (278 | ) | |||||||||||||||
Add: Revenue adjustment for estimated Medicare repayment(B) | — | — | 1,000 | 1,000 | — | — | ||||||||||||||||||
Less: Gain on sale of Canadian investment(C) | — | — | (946 | ) | (946 | ) | — | — | ||||||||||||||||
Add: Restructuring and special charges(D) | 46,056 | — | — | — | — | — | ||||||||||||||||||
| Income from continuing operations before taxes — as adjusted | $ | 10,950 | $ | 23,298 | $ | 29,870 | $ | 21,672 | $ | 21,281 | $ | 29,479 | ||||||||||||
Less: Income tax expense — at normalized rate(E) | (4,271 | ) | (9,086 | ) | (11,649 | ) | (8,278 | ) | (8,455 | ) | (11,826 | ) | ||||||||||||
Income from continuing operations — as adjusted(A) | $ | 6,679 | $ | 14,212 | $ | 18,221 | $ | 13,394 | $ | 12,826 | $ | 17,653 | ||||||||||||
| (1) | Period includes 53 weeks of activity. | |
| (2) | See Notes A through E to Supplemental Information provided in the Appendix. |
| 30 | |
Gentiva Historical Balance Sheets
| Fiscal Year Ended | ||||||||||||
| ($ in thousands) | 2003 | 2004 | 10/2/2005 | |||||||||
ASSETS | ||||||||||||
| Current assets: | ||||||||||||
| Cash, cash equivalents and restricted cash | $ | 97,438 | $ | 31,924 | $ | 52,234 | ||||||
| Short-term investments | 20,000 | 81,100 | 42,150 | |||||||||
| Receivables, less allowance for doubtful accounts of $7,936, $7,040 and $8,349 at fiscal year end 2004, 2003 and Oct. 2, 2005, respectively | 132,998 | 132,002 | 142,339 | |||||||||
| Deferred tax assets | 26,464 | 23,861 | 22,894 | |||||||||
| Prepaid expenses and other current assets | 6,524 | 6,057 | 8,013 | |||||||||
Total current assets | $ | 283,424 | $ | 274,944 | $ | 267,630 | ||||||
| Fixed assets, net | 15,135 | 19,687 | 20,688 | |||||||||
| Deferred tax assets, net | 28,025 | 21,233 | 17,792 | |||||||||
| Goodwill | 1,325 | 1,325 | 6,865 | |||||||||
| Other assets | 14,604 | 14,909 | 22,896 | |||||||||
Total assets | $ | 342,513 | $ | 332,098 | $ | 335,871 | ||||||
LIABILITIES AND SHAREHOLDERS’ EQUITY | ||||||||||||
| Current liabilities: | ||||||||||||
| Accounts payable | $ | 23,504 | $ | 25,896 | $ | 23,542 | ||||||
| Payroll and related taxes | 12,932 | 9,356 | 15,772 | |||||||||
| Medicare liabilities | 12,736 | 9,949 | 6,864 | |||||||||
| Cost of claims incurred but not reported | 28,525 | 27,361 | 26,244 | |||||||||
| Obligations under insurance programs | 37,200 | 34,660 | 32,228 | |||||||||
| Other accrued expenses | 32,230 | 31,117 | 30,306 | |||||||||
Total current liabilities | $ | 147,127 | $ | 138,339 | $ | 134,956 | ||||||
| Other liabilities | 18,207 | 21,819 | 19,814 | |||||||||
| Shareholders’ equity: | ||||||||||||
| Common stock, $0.10 par value; authorized 100,000,000 shares; issued and outstanding 25,598,301, 23,722,408 and 23,356,750 shares, at fiscal year end 2004, 2003 and Oct. 2, 2005, respectively | 2,560 | 2,372 | 2,336 | |||||||||
| Additional paid-in capital | 270,468 | 238,929 | 231,100 | |||||||||
| Accumulated deficit | (95,849 | ) | (69,361 | ) | (52,335 | ) | ||||||
Total shareholders’ equity | $ | 177,179 | $ | 171,940 | $ | 181,101 | ||||||
Total liabilities and shareholders’ equity | $ | 342,513 | $ | 332,098 | $ | 335,871 | ||||||
| 31 | |
Gentiva Historical Statements of Cash Flows
| Fiscal Year Ended | Nine Months Ended | LTM | ||||||||||||||||||||||
| ($ in thousands) | 2002 | 2003 | 2004 | 9/26/2004 | 10/2/2005 | 10/2/2005 | ||||||||||||||||||
OPERATING ACTIVITIES: | ||||||||||||||||||||||||
| Net income (loss) | $ | ( 49,033 | ) | $ | 56,766 | $ | 26,488 | $ | 19,594 | $ | 17,026 | $ | 23,920 | |||||||||||
| Adjustments to reconcile net income (loss) to net cash provided by operating activities | ||||||||||||||||||||||||
| Income from discontinued operations | (191,578 | ) | — | — | — | — | — | |||||||||||||||||
| Cumulative effect of accounting change | 187,068 | — | — | — | — | — | ||||||||||||||||||
| Depreciation and amortization | 7,185 | 6,851 | 7,329 | 5,505 | 5,938 | 7,762 | ||||||||||||||||||
| Provision for doubtful accounts | 4,936 | 7,684 | 6,722 | 4,708 | 4,329 | 6,343 | ||||||||||||||||||
| Gain on sale of Canadian investment | — | — | (946 | ) | (946 | ) | — | — | ||||||||||||||||
| Loss (gain) on disposal / writedown of fixed assets | 951 | (209 | ) | 1,361 | — | — | 1,361 | |||||||||||||||||
| Stock option tender offer | 21,388 | — | — | — | — | — | ||||||||||||||||||
| Reversal of tax audit reserves | — | — | — | — | (4,200 | ) | (4,200 | ) | ||||||||||||||||
| Deferred income tax (benefit) expense | 12,837 | (35,035 | ) | 9,114 | 9,743 | 4,408 | 3,779 | |||||||||||||||||
| Changes in assets and liabilities, net of acquisitions/divestitures | ||||||||||||||||||||||||
| Accounts receivable | 10,281 | (15,604 | ) | (5,726 | ) | 945 | (14,666 | ) | (21,337 | ) | ||||||||||||||
| Prepaid expenses and other current assets | 7,825 | 3,048 | 25 | (1,144 | ) | (1,856 | ) | (687 | ) | |||||||||||||||
| Accounts payable | — | — | — | (2,843 | ) | (719 | ) | 2,124 | ||||||||||||||||
| Payroll and related taxes | — | — | — | (2,956 | ) | 6,416 | 9,372 | |||||||||||||||||
| Medicare liabilities | — | — | — | (145 | ) | (3,085 | ) | (2,940 | ) | |||||||||||||||
| Cost of claims incurred but not reported | — | — | — | (2,228 | ) | (1,117 | ) | 1,111 | ||||||||||||||||
| Obligations under insurance programs | — | — | — | (609 | ) | (2,432 | ) | (1,823 | ) | |||||||||||||||
| Other accrued expenses | — | — | — | (3,321 | ) | (965 | ) | 2,356 | ||||||||||||||||
| Current liabilities | 6,393 | 7,065 | (10,372 | ) | — | — | (10,372 | ) | ||||||||||||||||
| Change in net assets held for sale | 3,300 | — | — | — | — | — | ||||||||||||||||||
| Other, net | (3,024 | ) | 137 | 858 | 657 | 178 | 379 | |||||||||||||||||
| Net cash provided by operating activities | $ | 18,529 | $ | 30,703 | $ | 34,853 | $ | 26,960 | $ | 9,255 | $ | 17,148 | ||||||||||||
INVESTING ACTIVITIES: | ||||||||||||||||||||||||
| Purchase of fixed assets — continuing operations | $ | (4,116 | ) | $ | (8,777 | ) | $ | (12,593 | ) | $ | (7,607 | ) | $ | (6,043 | ) | $ | (11,029 | ) | ||||||
| Purchase of fixed assets — discontinued operations | (2,121 | ) | — | — | — | — | — | |||||||||||||||||
| Proceeds from sale of assets / business | 206,564 | 200 | 4,123 | 4,123 | — | — | ||||||||||||||||||
| Acquisition of businesses | — | (1,300 | ) | — | — | (12,059 | ) | (12,059 | ) | |||||||||||||||
| Purchase of short-term investments available-for-sale | — | (10,000 | ) | (145,950 | ) | (80,000 | ) | (125,000 | ) | (190,950 | ) | |||||||||||||
| Maturities of short-term investments available-for-sale | — | — | 84,850 | 25,000 | 153,950 | 213,800 | ||||||||||||||||||
| Purchase of short-term investments | — | (24,900 | ) | (10,000 | ) | (10,000 | ) | — | — | |||||||||||||||
| Maturities of short-term investments | — | 14,935 | 10,000 | 10,000 | 10,000 | 10,000 | ||||||||||||||||||
| Net cash (used in) provided by investing activities | $ | 200,327 | $ | (29,842 | ) | $ | (69,570 | ) | $ | (58,484 | ) | $ | 20,848 | $ | 9,762 | |||||||||
FINANCING ACTIVITIES: | ||||||||||||||||||||||||
| Proceeds from issuance of common stock | $ | 6,971 | $ | 2,336 | $ | 6,675 | $ | 3,420 | $ | 5,650 | $ | 8,905 | ||||||||||||
| Change in book overdrafts | — | 7,425 | 1,223 | 2,300 | (1,635 | ) | (2,712 | ) | ||||||||||||||||
| Repurchases of common stock | — | (14,425 | ) | (38,402 | ) | (30,163 | ) | (13,514 | ) | (21,753 | ) | |||||||||||||
| Repayment of capital lease obligations | — | — | (293 | ) | (228 | ) | (294 | ) | (359 | ) | ||||||||||||||
| Debt issuance costs | (1,321 | ) | — | — | — | — | — | |||||||||||||||||
| Cash distribution to shareholders | (203,983 | ) | — | — | — | — | — | |||||||||||||||||
| Payments for stock option tender | (21,388 | ) | — | — | — | — | — | |||||||||||||||||
| Advance paid to Medicare program | (5,038 | ) | — | — | — | — | — | |||||||||||||||||
| Net cash used in financing activities | $ | (224,759 | ) | $ | (4,664 | ) | $ | (30,797 | ) | $ | (24,671 | ) | $ | (9,793 | ) | $ | (15,919 | ) | ||||||
| Net change in cash, cash equivalents and restricted cash | $ | (5,903 | ) | $ | (3,803 | ) | $ | (65,514 | ) | $ | (56,195 | ) | $ | 20,310 | $ | 10,991 | ||||||||
| Cash, cash equivalents and restricted cash at beginning of period | 107,144 | 101,241 | 97,438 | 97,438 | 31,924 | 41,243 | ||||||||||||||||||
| Cash, cash equivalents and restricted cash at end of period | $ | 101,241 | $ | 97,438 | $ | 31,924 | $ | 41,243 | $ | 52,234 | $ | 52,234 | ||||||||||||
| Short-term investments | — | 20,000 | 81,100 | 75,000 | 42,150 | 42,150 | ||||||||||||||||||
| Cash items and short-term investments | $ | 101,241 | $ | 117,438 | $ | 113,024 | $ | 116,243 | $ | 94,384 | $ | 94,384 | ||||||||||||
| 32 | |
Gentiva Management Discussion and Analysis
Nine Months Ended October 2, 2005 compared to Nine Months Ended September 26, 2004
Net Revenues
Net Revenues
| Nine Months Ended | ||||||||||||
| (Dollars in millions) | 10/2/05 | 9/26/04 | Percentage Variance | |||||||||
| Medicare | $ | 194.4 | $ | 168.7 | 15.2 | % | ||||||
| Medicaid and Local Government | 112.0 | 115.9 | (3.3 | %) | ||||||||
| Commercial Insurance and Other | 340.4 | 335.6 | 1.4 | % | ||||||||
| $ | 646.8 | $ | 620.2 | 4.3 | % | |||||||
Source: Gentiva 2005 Q3 Form 10-Q.
For the nine months ended October 2, 2005, net revenues were $646.8 million, a $26.6 million (or 4.3 percent) increase over the $620.2 million reported for the nine months ended September 26, 2004.
Home Healthcare Services segment revenues are derived from all three payer groups: Medicare, Medicaid and Local Government, and Commercial Insurance and Other. CareCentrix segment revenues are derived from the Commercial Insurance and Other payer group only.
Medicare revenue growth for the fiscal 2005 period as compared to the fiscal 2004 period was driven by several factors including: (i) an increase in admissions, of approximately 14 percent for the first nine months, including the Company’s specialty programs and exclusive of acquired operations; (ii) improvement in revenue per admission, (iii) reimbursement rate changes, as noted below and (iv) the impact of the Heritage Home Care Services acquisition in Utah, which closed on May 1, 2005 and constituted approximately 3.0 percent of the 15.2 percent increase in Medicare revenue for the first nine months of the year. These positive factors were offset somewhat for the first nine months of the year by the absence of three special items which are described below.
Medicare revenue included special items of $9.1 million for the first nine months of fiscal 2004. Special items represented (i) $1.1 million recorded and received during the third quarter of fiscal 2004 in settlement of the Company’s appeal filed with the U.S. Provider Relations Review Board (“PRRB”) related to the reopening of its 1998 cost reports, (ii) $9.0 million received in settlement of the Company’s appeal filed with the PRRB related to the reopening of its 1997 cost reports and (iii) a revenue adjustment of $1 million to reflect the estimated repayment to Medicare in connection with services rendered to certain patients since the inception of the PPS in October 2000. In connection with the estimated repayment, CMS had determined that homecare providers should have received lower reimbursements for certain services rendered to beneficiaries discharged from inpatient hospitals within fourteen days immediately preceding admission to home healthcare.
The reimbursement rate changes included a 2.3 percent market basket increase that became effective for patients on service on or after January 1, 2005, partially offset by the elimination of the 5 percent rate increase related to home health services performed in specifically defined rural areas of the country (rural add-on provision) effective for patients on service on or after April 1, 2005. The rate adjustments
| 33 | |
relating to the market basket change and rural add-on provision represented incremental revenue of approximately $4.8 million for the first nine months of fiscal 2005.
Medicaid and Local Government revenues decreased for the fiscal 2005 periods as compared to the fiscal 2004 periods, due primarily to a reduction in the Company’s participation in certain low-margin Medicaid and state and county programs partially offset by an increase in skilled visits within Medicaid programs. Revenues relating to hourly Medicaid and state and county programs decreased $6.0 million for the first nine months of fiscal 2005, as compared to the corresponding period of fiscal 2004, while revenues relating to intermittent care visits increased $2.1 million for the first nine months of fiscal 2005, as compared to the corresponding period of fiscal 2004.
Commercial Insurance and Other revenues increased $4.8 million, or 1.4 percent for the first nine months, as compared to the first nine months of fiscal 2004. Revenues relating to the CIGNA contract for the first nine months of fiscal 2005 declined by $5.4 million, or 2.9 percent, as compared to the first nine months of fiscal 2004, due primarily to a reduction in the number of enrolled CIGNA members in 2005 resulting in lower revenues from CIGNA’s capitated plans, partially offset by the addition of the members in five New England states, effective July 1, 2005, as well as higher volumes in CIGNA’s fee for service plans. Non-CIGNA, Commercial Insurance and Other revenues increased by $10.2 million, or 7.1 percent, for the first nine months of fiscal 2005, as compared to the corresponding period of fiscal 2004, primarily by increased unit volume from existing business and new contracts signed during the past year, as well as the impact of adding the Heritage operations ($1.8 million for the first nine months of fiscal 2005).
For the nine months ended October 2, 2005, Home Healthcare Services revenues were $409.9 million, an increase of $20.9 million, or 5.4 percent, from $389.0 million for the first nine months of fiscal 2004. Revenues for the first nine months of fiscal 2004 were positively impacted by the Medicare special items totaling $9.1 million, as discussed above. In addition, for the first nine months of fiscal 2004, Medicare revenues and Commercial Insurance and Other revenues were negatively impacted by four hurricanes in the Southeastern United States.
CareCentrix segment revenues for the first nine months of fiscal 2005 were $250.6 million, an increase of $3.9 million, or 1.6 percent from $246.7 million for the first nine months of fiscal 2004. This increase was driven primarily by increases in the non-CIGNA Commercial Insurance and Other revenues.
Gross Profit
| Nine Months Ended | ||||||||||||
| (Dollars in millions) | 10/2/05 | 9/26/04 | Variance | |||||||||
| Gross profit | $ | 242.4 | $ | 237.1 | $ | 5.3 | ||||||
| As a percent of revenue | 37.5 | % | 38.2 | % | (0.7 | %) | ||||||
Source: Gentiva 2005 Q3 Form 10-Q.
As a percentage of revenue, gross profit decreased by 0.7 percentage points in the first nine months of fiscal 2005 as compared to the corresponding period of fiscal 2004. The decrease in gross profit margins was primarily attributable to the CareCentrix segment (impact of 0.5 percentage points for the nine month period) and the Medicare special items recorded in the 2004 periods (impact of 0.9 percentage points for the nine month period) offset by improvements in the Home Healthcare Services segment (impact of 0.7 percentage points for the nine month period).
| 34 | |
The decline in gross profit margins in the fiscal 2005 periods as compared to the fiscal 2004 periods in the CareCentrix segment occurred principally in the third quarter and resulted from (i) a positive adjustment relating to a change in estimated costs in the 2004 period as the Company completed its reconfiguration of the home medical equipment network and (ii) lower margins in the fiscal 2005 period due to changes in the Company’s arrangements with TriWest Healthcare Alliance.
The increase in gross profit margins in the Home Healthcare Services segment resulted from several factors including (i) the favorable change in business mix due to increased volume of Medicare business, including growth from higher margin specialty programs, (ii) increased revenue per Medicare admission in the third quarter of fiscal 2005 as a result of improvements in the training and orientation of full-time clinicians and (iii) rate increases in Medicare and certain non-Medicare business. These increases were offset somewhat by increased direct cost of services including clinician wages, benefits and fuel costs as well as costs relating to orientation, training and productivity as the Company transitioned more of its skilled clinical care to a dedicated full-time workforce.
Selling, General and Administrative Expenses
Selling, general and administrative expenses, including depreciation and amortization, increased $15.5 million to $222.4 million for the nine months ended October 2, 2005, as compared to $206.9 million for the nine months ended September 26, 2004.
This increase was driven primarily by (i) over $2.5 million in field operating costs associated with the Heritage operations following its acquisition in May 2005, (ii) approximately $9.5 million of incremental field operating and administrative costs to service increased Medicare volume and develop and manage the Company’s growing specialty programs in the Home Healthcare Services segment, (iii) a $3.0 million increase in selling and patient care coordination expenses, primarily in the Home Healthcare Services segment, (iv) $0.3 million in severance and other costs relating to the closing of selected Home Healthcare Services branch locations and (v) $1.0 million in incremental costs at the CareCentrix regional coordination centers to service increased unit volume, as well as incremental costs relating to the hiring of full-time clinicians and other personnel. These increases were partially offset by lower corporate general and administrative expenses ($1.3 million) and a favorable arbitration settlement ($0.8 million).
Gain on Sale of Canadian Investment
On March 30, 2004, the Company sold its minority interest in a homecare nursing services business in Canada. The business had been acquired as partial consideration for the sale of the Company’s Canadian operations in the fourth quarter of fiscal 2000. In connection with the March 30, 2004 sale, the Company received cash proceeds of $4.1 million and recorded a pre-tax gain on sale of approximately $0.9 million which is reflected in the consolidated statements of operations for the nine months ended September 26, 2004.
Interest Income, Net
Net interest income was $1.3 million for the nine months ended October 2, 2005 compared to $0.5 million for the nine months ended September 26, 2004. Net interest income for the first nine months of
| 35 | |
fiscal years 2005 and 2004 represented interest income of $2.1 million and $1.3 million, respectively, partially offset by fees relating to the revolving credit facility and outstanding letters of credit.
Income Taxes
For the nine months ended October 2, 2005, the Company recorded a federal and state income tax provision of $4.3 million representing a current tax benefit of $0.1 million and a deferred tax provision of $4.4 million. The income tax provision for the first nine months of fiscal 2005 included a $4.2 million release of tax reserves related to the favorable resolution of tax audit issues for the years 1997 through 2000. The Company agreed to assume responsibility for these items in connection with its Split-Off from Olsten Corporation in March 2000. The difference between the federal statutory income tax rate and the Company’s effective rate of 20 percent for the first nine months of fiscal 2005 is primarily due to the release of tax reserves and state taxes.
Federal and state income taxes of $12.1 million were recorded for the first nine months of fiscal 2004. The difference between the federal statutory income tax rate and the Company’s effective tax rate of 39 percent was due primarily to state taxes.
Net Income
For the first nine months of fiscal 2005, net income was $17.0 million, or $0.68 per diluted share, compared with net income of $19.6 million, or $0.74 per diluted share for the first nine months of fiscal 2004.
Net income for the first nine months of fiscal 2005 included $4.2 million, or $0.17 per diluted share, relating to the favorable resolution of tax audit issues noted under the heading “Income Taxes” above. Net income for the first nine months of fiscal 2004 included three special items related to Medicare, noted under the heading “Net Revenues” above, which had a net positive impact of $5.6 million, or $0.22 per diluted share. Net income for the first nine months of fiscal 2004 also included a net gain of $0.6 million, or $0.02 per diluted share, on the sale of the Company’s minority interest in a homecare nursing services business in Canada.
Liquidity and Capital Resources
Liquidity
The Company’s principal source of liquidity is the collection of its accounts receivable. For healthcare services, the Company grants credit without collateral to its patients, most of whom are insured under third party commercial or governmental payer arrangements.
The Company realized net cash provided by operating activities of $9.3 million in the nine months ended October 2, 2005 as compared to net cash provided by operating activities of $27.0 million in the nine months ended September 26, 2004. The decrease of $17.7 million in net cash provided by operating activities was primarily driven by changes impacting the statement of income ($11.1 million decrease), changes in accounts receivable ($15.6 million decrease) and changes in current liabilities ($10.2 million increase).
A summary of each of the aforementioned drivers is as follows:
| • | The $11.1 million difference is primarily related to the special Medicare item of $9.1 million in cash received in fiscal 2004 in settlement of the Company's appeal with the PRRB in connection with the reopening of all of the Company's 1997 and 1998 cost reports. | |
| • | Cash flow from operating activities between the 2004 and 2005 reporting periods was negatively impacted by $15.6 million as a result of changes in accounts receivable of $0.9 million in the 2004 period and ($14.7) million in the 2005 period. The increase in accounts receivable relates primarily to incremental receivables attributable to the TriWest account, for which there were processing delays in adjudicating the Company’s claims, and the Heritage operations which were acquired on May 1, 2005. | |
| • | Cash flow from operating activities was positively impacted by $10.2 million as a result of changes in current liabilities of ($12.1) million in the 2004 period and ($1.9) million in the 2005 period. The primary driver for the $10.2 million difference results from the timing of payments related to administrative payroll and payroll taxes. The difference of $9.4 million between reporting periods is attributable to the timing of the remittance of administrative payroll and related payroll taxes at October 2, 2005 compared to September 26, 2004. |
Capital Expenditures
The Company’s capital expenditures for the nine months ended October 2, 2005 were $6.0 million as compared to $7.6 million for the same period in fiscal 2004, which excludes equipment capitalized
| 36 | |
under capital lease obligations of $1.4 million. The Company intends to make investments and other expenditures to, among other things, upgrade its computer technology and system infrastructure and comply with regulatory changes in the industry.
| 37 | |
Year Ended January 2, 2005 Compared to Year Ended December 28, 2003
Net Revenues
Net Revenues
(Dollars in millions)
| Fiscal Year | ||||||||||||
| 2004 | 2003 | Percentage Variance | ||||||||||
| Medicare | $ | 228.1 | $ | 178.7 | 27.7 | % | ||||||
| Medicaid and Local Government | 154.4 | 165.1 | (6.5 | ) | ||||||||
| Commercial Insurance and Other | 463.3 | 470.2 | (1.5 | ) | ||||||||
| $ | 845.8 | $ | 814.0 | 3.9 | % | |||||||
Source: Gentiva 2004Form 10-K, as amended.
For fiscal year 2004 as compared to fiscal year 2003, net revenues increased by $31.8 million to $845.8 million from $814.0 million.
Medicare revenue growth in fiscal year 2004 as compared to fiscal year 2003 was driven by several factors including special items, volume growth, mix and process enhancement changes and rate increases. Medicare revenue included special items of $9.4 million for fiscal 2004. Special items represented (i) $10.4 million recorded and received during fiscal 2004 in settlement of the Company’s appeal filed with the Provider Reimbursement Review Board (“PRRB”) related to the reopening of its 1997 and 1998 cost reports and (ii) a revenue adjustment of $1.0 million recorded in the fiscal year of 2004 to reflect the estimated repayment to Medicare in connection with services rendered to certain patients since the inception of the Prospective Payment Reimbursement System in October 2000. In connection with the estimated repayments, the CMS has determined that homecare providers should have received lower reimbursements for certain services rendered to beneficiaries discharged from inpatient hospitals within fourteen days immediately preceding admission to home healthcare.
Medicare admissions grew by 13 percent in fiscal 2004 as compared to fiscal 2003. Medicare revenue was also positively impacted in the fiscal year 2004 by growth in specialty programs, which generally generate higher revenue per episode than other Medicare services, and by various operational and clinical process enhancements. Furthermore, Medicare revenue in the fiscal 2004 period as compared to the fiscal 2003 period in creased as a result of reimbursement rate changes, including a 3.3 percent market basket rate increase that became effective for patients on service on or after October 1, 2003, which was adjusted downward by 0.8 percent to 2.5 percent effective April 1, 2004, and a 5 percent rate increase effective April 1, 2004 for the rural add-on related to home health services performed in specifically defined rural areas of the country. The rate increases relating to the market basket change and rural add-on provision represented incremental revenue of $5.7 million for fiscal year 2004.
Medicaid and Local Government revenue decreased in fiscal year 2004 as compared to fiscal year 2003 primarily due to a reduction in the Company’s participation in certain low-margin, hourly Medicaid and state” county health programs, partially offset by an increase in skilled visits within Medicaid programs. Revenues relating to hourly Medicaid and state and county programs decreased $13.6 million for fiscal year 2004 as compared to fiscal year 2003. Revenues relating to skilled visits within Medicaid programs increased $2.9 million for fiscal year 2004.
| 38 | |
Commercial Insurance and Other revenue decreased in fiscal year 2004 as compared to fiscal year 2003 due to a decline in revenue derived from CIGNA of $31.0 million, or 10.7 percent, related to a reduction in the number of enrolled CIGNA members in 2004, and lower revenue as well as related costs resulting from a change in the Company’s delivery model of certain durable home medical and respiratory equipment (“DME”) products and services. The decline in CIGNA revenues was partially offset by an increase of $24.1 million, or 13.5 percent, for fiscal year 2004 in non-CIGNA, Commercial Insurance and Other revenue driven by unit volume and pricing increases from existing business as well as new contracts signed during the past year.
In addition, for the fiscal year 2004, Medicare revenues and Commercial Insurance and Other revenues were negatively impacted by four hurricanes in the southeastern United States and net revenues for fiscal year 2004 were positively impacted by an extra week of activity as compared to fiscal year 2003.
Gross Profit
Gross Profit
(Dollars in millions)
| Fiscal Year | ||||||||||||
| 2004 | 2003 | Variance | ||||||||||
| Gross profit | $ | 323.9 | $ | 282.0 | $ | 41.9 | ||||||
| As a percent of revenue | 38.3 | % | 34.6 | % | 3.7 | % | ||||||
Source: Gentiva 2004Form 10-K, as amended.
As a percent of revenues, gross profit margins for the fiscal year 2004 were positively impacted by (i) 1.4 percentage points due to the favorable change in business mix in which the volume of Medicare business, including growth in specialty programs, more than offset the anticipated revenue loss in certain low-margin hourly Medicaid and local government programs, (ii) 1.0 percentage points due to the reconfiguration of the DME provider network earlier this year, as well as the impact of new CareCentrix contracts and (iii) 0.7 percentage points related to the special items discussed above. The remaining increase in gross profit percentage can be attributed to several factors, including the positive Medicare rate changes, lower workers compensation expense and various operational and clinical process enhancements.
Selling, General and Administrative Expenses
Selling, general and administrative expenses, increased $26.5 million, or 10.2 percent, to $285.7 million for the fiscal year ended January 2, 2005, as compared to $259.2 million for the fiscal year ended December 28, 2003.
Of the increases in selling, general and administrative expenses, approximately $5 million related to the extra week of activity in fiscal 2004. Approximately $8 million of the remaining increase related to field operating and administrative costs to service incremental revenues, including revenues from the Company’s specialty programs and approximately $4 million related to higher selling and clinical care coordination expenses. The remaining increases related to costs associated with the reconfiguration of the Company’s CareCentrix DME provider network (approximately $3 million) and incremental costs associated with the implementation of the Sarbanes-Oxley requirements, ongoing information technology initiatives and field development training as well as a writedown of $1.4 million relating to purchased software for which it was determined there was minimal future value.
| 39 | |
Gain on Sale of Canadian Investment
On March 30, 2004, the Company sold its minority interest in a homecare nursing services business in Canada. The business had been acquired as partial consideration for the sale of the Company’s Canadian operations in the fourth quarter of fiscal 2000. In connection with the March 30, 2004 sale, the Company received cash proceeds of $4.1 million in the second quarter of fiscal 2004 and recorded a gain on sale of approximately $0.9 million, which is reflected in the consolidated statement of income for the fiscal year ended January 2, 2005.
Interest Income, Net
Net interest income was approximately $1.0 million for the fiscal year ended January 2, 2005, and $0.4 million for the fiscal year ended December 28, 2003. Net interest income included interest income of approximately $2.0 million for fiscal year 2004 and $1.5 million for fiscal year 2003, partially offset by fees relating to the revolving credit facility and outstanding letters of credit.
Income from Continuing Operations before Income Taxes
Income from continuing operations before income taxes was approximately $40.2 million and $23.3 million for the fiscal years ended January 2, 2005 and December 28, 2003, respectively. For fiscal 2004, income from continuing operations before income taxes included special items of $9.4 million as discussed in “Net Revenues” above and a pre-tax gain $0.9 million on the sale of a Canadian investment.
Income Taxes
The Company recorded federal and state income taxes of approximately $13.7 million for fiscal 2004 compared to an income tax benefit of $33.5 million for fiscal 2003. The difference between the Company’s effective tax rate of approximately 34.1% for fiscal 2004 and the statutory income tax rate was due primarily to the recognition of certain state net operating loss carryforwards.
Prior to fiscal year 2004, the state tax history of certain subsidiaries indicated cumulative losses and a lack of state tax audit experience. As a result, the Company believed there was a remote likelihood that the value of related state tax loss carryforwards would be realized, and no deferred tax assets were recorded. During fiscal 2004, these subsidiaries reflected cumulative income on a state filing basis and certain state tax audits were settled. The Company performed a review of state net operating loss carryforwards and recorded a deferred tax asset of $7.0 million in the fourth quarter of fiscal 2004. A valuation allowance of $4.5 million has been recorded to recognize that certain state net operating loss carryforwards may expire before realization. The Company continues to monitor the need for a valuation allowance for its deferred tax assets based on the realizability of such assets. The amount of the deferred tax assets considered realizable could be increased or reduced in the near term if estimates of future taxable income during the carryforward period are adjusted.
The Company had maintained a valuation allowance for its deferred tax assets as of December 29, 2002, since the absence of historical pre-tax income created uncertainty about the Company’s ability to realize tax benefits in future years. During the interim periods of fiscal 2003, a portion of the valuation allowance ($9.4 million) was utilized to offset a corresponding decrease in net deferred tax assets. The remaining valuation allowance was reversed at the end of fiscal 2003 based on management’s belief that it was more likely than not that all of the Company’s net deferred tax assets would be realized due to the Company’s achieved earnings trends and outlook. In this regard, $44.4 million was recorded as an
| 40 | |
income tax benefit in fiscal 2003 and $19.5 million was credited directly to shareholders’ equity to reflect the portion of the valuation allowance associated with stock compensation tax benefits.
At January 2, 2005, current net deferred tax assets were $23.9 million and non-current net deferred tax assets were $21.2 million. At January 2, 2005, the Company had federal tax credit carryforwards of $0.8 million and state net operating loss carryforwards of $7.0 million.
Net Income
The Company recorded net income of $26.5 million or $1.00 per diluted share in fiscal 2004 compared to net income of $56.8 million or $2.07 per diluted share in fiscal 2003.
Net income for fiscal 2004 included special items related to Medicare, noted in the Net Revenues section above, and a pre-tax gain of $0.9 million on the sale of the Company’s 19.9 percent interest in a Canadian homecare company.
Net income for fiscal 2004 reflected the positive impact of an effective tax rate of 34.1 percent due primarily to the recognition of certain state net operating loss carryforwards, which was lower than the statutory income tax rate.
Liquidity and Capital Resources
Liquidity
The Company’s principal source of liquidity is the collection of its accounts receivable. For healthcare services, the Company grants credit without collateral to its patients, most of whom are insured under third party commercial or governmental payer arrangements. Net cash provided by operating activities was $34.9 million in fiscal 2004. In addition, during fiscal 2004 the Company received cash proceeds of $4.1 million in connection with the sale of the Company’s investment in a Canadian homecare business and $6.7 million in connection with the issuance of common stock. This cash was used to fund capital expenditures of $12.6 million and repurchase shares of common stock of $38.4 million during fiscal 2004.
Capital Expenditures
The Company’s capital expenditures from continuing operations for the fiscal year 2004 were $11.2 million, excluding equipment capitalized under capital lease obligations of $1.4 million, as compared to $8.8 million and $4.1 million for fiscal years 2003 and 2002, respectively.
| 41 | |
7.2 Healthfield Historical Financial Performance and Discussion
The following charts set forth Healthfield’s actual and pro forma adjusted income statements for the fiscal year 2004, the nine month periods ended September 30, 2004 and 2005 and the last twelve months ended September 30, 2005. The unaudited pro forma adjusted income statements reflect a full year contribution of all acquisitions completed by Healthfield to date, which Gentiva believes provides the best representation of Healthfield’s earnings. Healthfield’s actual results for the fiscal 2004 period were audited by KPMG LLP, with an unqualified audit opinion.
For the last twelve months ended September 30, 2005, Healthfield had pro forma adjusted net revenue of $291.3 million and adjusted EBITDA of $49.7 million, representing an EBITDA margin of 17.1%.
Summary Healthfield Historical Income Statements (Pro Forma Adjusted)(1)
| Unaudited | ||||||||||||||||
| ($ in thousands) | Fiscal Year Ended | Nine Months Ended | LTM Ended | |||||||||||||
| 2004 | 9/30/04 | 9/30/05 | 9/30/05 | |||||||||||||
| Net revenue | $ | 253,673 | $ | 184,976 | $ | 222,574 | $ | 291,271 | ||||||||
| Direct costs | 125,705 | 91,355 | 109,069 | 143,419 | ||||||||||||
| Gross profit | 127,968 | 93,621 | 113,505 | 147,852 | ||||||||||||
| Program costs | 77,671 | 57,854 | 60,984 | 80,801 | ||||||||||||
| Corporate costs | 16,735 | 12,048 | 16,818 | 21,505 | ||||||||||||
| Operating income | $ | 33,562 | $ | 23,719 | $ | 35,703 | $ | 45,546 | ||||||||
| Reconciliation to Adjusted EBITDA: | ||||||||||||||||
| Operating income | $ | 33,562 | $ | 23,719 | $ | 35,703 | $ | 45,546 | ||||||||
| Depreciation | 3,861 | 2,837 | 3,119 | 4,143 | ||||||||||||
| Adjusted EBITDA | $ | 37,423 | $ | 26,556 | $ | 38,822 | $ | 49,689 | ||||||||
Summary Healthfield Historical Income Statements (Actual)(1)
| Unaudited | ||||||||||||||||
| ($ in thousands) | Fiscal Year Ended | Nine Months Ended | LTM Ended | |||||||||||||
| 2004 | 9/30/04 | 9/30/05 | 9/30/05 | |||||||||||||
| Net revenue | $ | 156,169 | $ | 102,615 | $ | 190,036 | $ | 243,590 | ||||||||
| Direct costs | 78,415 | 50,747 | 95,550 | 123,218 | ||||||||||||
| Gross profit | 77,754 | 51,868 | 94,486 | 120,372 | ||||||||||||
| Program costs | 45,171 | 31,103 | 50,746 | 64,814 | ||||||||||||
| Corporate costs | 13,828 | 9,048 | 14,819 | 19,599 | ||||||||||||
| Operating income | $ | 18,755 | $ | 11,717 | $ | 28,921 | $ | 35,959 | ||||||||
| Reconciliation to EBITDA: | ||||||||||||||||
| Operating income | $ | 18,755 | $ | 11,717 | $ | 28,921 | $ | 35,959 | ||||||||
| Depreciation | 4,284 | 2,173 | 3,111 | 5,222 | ||||||||||||
| EBITDA | $ | 23,039 | $ | 13,890 | $ | 32,032 | $ | 41,181 | ||||||||
| 1 | EBITDA and adjusted EBITDA are non-GAAP financial measures. EBITDA is defined as income from continuing operations before interest expense (net of interest income), income taxes, depreciation and amortization. Adjusted EBITDA is defined as income from continuing operations before interest expense (net of interest income), income taxes, depreciation, amortization and other items including the impact of acquisitions and non-recurring expenses. These non-recurring expenses may occur in future periods but the amounts recognized can very significantly from period to period and do not directly relate to ongoing operations. See the chart titled “Adjusted EBITDA Reconciliation by Acquisition” on the following page for a reconciliation of reported and pro forma EBITDA. Management and investors review EBITDA and adjusted EBITDA to evaluate overall performance and compare current operating results with other companies in the health care industry. EBITDA and adjusted EBITDA should not be considered in isolation or as a substitute for net income, operating income or other cash flow statement data determined in accordance with accounting principles generally accepted in the United States. Because EBITDA and adjusted EBITDA are not measures of financial performance under accounting principles generally accepted in the United States and are susceptible to varying calculations, they may not be comparable to similarly titled measures of other companies. |
| 42 | |
The table below presents a reconciliation of Healthfield’s reported EBITDA to pro forma adjusted EBITDA for the historical period by material acquisition. The Wiregrass and Capital Health acquisitions, which took place in July 2004 and June 2005, respectively, represented the most significant transactions in the historical period.
Adjusted EBITDA Reconciliation by Acquisition
| ($ in thousands) | Fiscal Year Ended | Nine Months Ended | LTM Ended | |||||||||||||
| 2004A | 9/30/04 | 9/30/05 | 9/30/05 | |||||||||||||
| EBITDA, as reported | $ | 23,039 | $ | 13,890 | $ | 32,032 | $ | 41,181 | ||||||||
| Impact of acquisitions: | ||||||||||||||||
| Capital Health | 6,938 | 4,988 | 6,592 | 8,542 | ||||||||||||
| Wiregrass | 6,905 | 6,905 | — | — | ||||||||||||
| All others | 973 | 773 | 890 | 1,090 | ||||||||||||
| Adjusted EBITDA, pro forma for acquisitions | 37,855 | 26,556 | 39,514 | 50,813 | ||||||||||||
| Hospice Medicare Cap Liability adjustment | (432 | ) | — | (692 | ) | (1,124 | ) | |||||||||
| Pro forma Adjusted EBITDA | $ | 37,423 | $ | 26,556 | $ | 38,822 | $ | 49,689 | ||||||||
| Adjusted EBITDA margins: | ||||||||||||||||
| As reported | 14.8 | % | 13.5 | % | 16.9 | % | 16.9 | % | ||||||||
| Pro forma | 14.8 | % | 14.4 | % | 17.4 | % | 17.1 | % | ||||||||
| 43 | |
The table below sets forth Healthfield’s balance sheets as of December 31, 2004 and September 30, 2005. The increase in Goodwill between fiscal years 2004 and September 30, 2005 is primarily driven by the acquisition of Capital Health.
Healthfield Historical Balance Sheets
| Unaudited | ||||||||
| ($ in thousands) | 12/31/04 | 9/30/05 | ||||||
| Current assets: | ||||||||
| Cash | $ | 3,568 | $ | 13,949 | ||||
| Accounts receivable, net | 30,397 | 34,385 | ||||||
| Due from related parties | 198 | 191 | ||||||
| Other accounts receivable | 474 | 297 | ||||||
| Inventory | 1,110 | 1,242 | ||||||
| Prepaid Expenes | 436 | 1,198 | ||||||
| Deferred taxes | 2,771 | 625 | ||||||
| Total current assets | 38,954 | 51,887 | ||||||
| Property, plant and equipment, net | 12,215 | 15,191 | ||||||
| Goodwill, net | 54,141 | 129,126 | ||||||
| Other intangible assets, net | 49,990 | 49,990 | ||||||
| Deferred tax assets | — | 545 | ||||||
| Deferred expenses | 1,831 | 5,336 | ||||||
| Deposits | 361 | 597 | ||||||
| Total assets | $ | 157,492 | $ | 252,672 | ||||
| Current liabilities: | ||||||||
| Accounts payable | $ | 6,899 | $ | 5,229 | ||||
| Accrued expenses | 10,836 | 21,012 | ||||||
| Due to third-party payors | 2,887 | 303 | ||||||
| Long term debt, current | 9,087 | 15,669 | ||||||
| Total current liabilities | 29,709 | 42,213 | ||||||
| Long term debt, less current maturities | 90,090 | 170,194 | ||||||
| Deferred income taxes | 3,219 | 3,253 | ||||||
| Due to third party payors | 1,737 | 172 | ||||||
| Stockholders’ equity | 32,737 | 36,840 | ||||||
| Total liabilities and stockholders’ equity | $ | 157,492 | $ | 252,672 | ||||
| 44 | |
7.3 EBITDA Reconciliation
Below is a reconciliation of Gentiva and Healthfield’s net income to adjusted EBITDA for the last twelve months ended September 30, 2005. The reconciliation is pro forma for the Merger, but not the financing transaction.
EBITDAReconciliation
| Last Twelve Months Ended, | ||||||||||||
| September 30, 2005 | ||||||||||||
| ($ in millions) | Gentiva | Healthfield(1) | Pro Forma | |||||||||
| Net income | $ | 23.9 | $ | 17.0 | $ | 40.9 | ||||||
| Provision for income taxes | 5.8 | 10.9 | 16.7 | |||||||||
| Interest (income) expense, net | (1.7 | ) | 13.0 | 11.3 | ||||||||
| Depreciation and amortization | 7.8 | 6.4 | 14.2 | |||||||||
EBITDA(2) | $ | 35.8 | $ | 47.3 | $ | 83.1 | ||||||
| Non-recurring expenses | (0.3 | ) | 2.4 | 2.1 | ||||||||
Adjusted EBITDA(2) | $ | 35.5 | $ | 49.7 | $ | 85.2 | ||||||
| (1) | Pro forma for a full twelve month contribution of Capital Health and certain other companies that were acquired during the period. | |
| (2) | EBITDA and adjusted EBITDA are non-GAAP financial measures. EBITDA is defined as income from continuing operations before interest expense (net of interest income), income taxes, depreciation and amortization. Adjusted EBITDA is defined as income from continuing operations before interest expense (net of interest income), income taxes, depreciation, amortization and other items included in the caption above labeled “Non-recurring expenses.” These non-recurring expenses may occur in future periods but the amounts recognized can very significantly from period to period and do not directly relate to ongoing operations. Management and investors review EBITDA and adjusted EBITDA to evaluate overall performance and compare current operating results with other companies in the health care industry. EBITDA and adjusted EBITDA should not be considered in isolation or as a substitute for net income, operating cash flows or other cash flow statement data determined in accordance with accounting principles generally accepted in the United States. Because EBITDA and adjusted EBITDA are not measures of financial performance under accounting principles generally accepted in the United States and are susceptible to varying calculations, they may not be comparable to similarly titled measures of other companies. |
| 45 | |
VIII. APPENDIX
8.1 Notes to Supplemental Information
| A. | Although “Income from the continuing operations — as adjusted” is a non-GAAP financial measure, management believes that the presentation of income from continuing operations as calculated using a normalized tax rate, which excludes the non-recurring items as described in Note E, and excluding the PRRB settlements and the estimated Medicare payment as described in Note B, as well as the gain on the sale of Gentiva’s investment in a Canadian homecare company as described in Note C and restructuring and special charges as described in Note D is a useful adjunct to “Income from continuing operations — as reported” under GAAP because it measures the Company’s performance in a consistent manner for all periods presented. Management believes that adjustments relating to tax valuation allowances and the favorable resolution of tax audit issues as described in Note E should be excluded from “Income from continuing operations — as adjusted” as these are nonrecurring items which relate to prior periods. In addition, the Medicare cost report settlements resulting from the PRRB appeals, reduced by the revenue adjustment for Medicare estimated repayment, should be excluded from “Income from continuing operations — as adjusted” as these items relate to reimbursement activities for the periods described in Note B. Furthermore, the gain on the sale of the Canadian investment and restructuring and other charges should be excluded from “Income from continuing operations — as adjusted,” since these are non-recurring items. For these reasons, management believes that “Income from continuing operations — as adjusted” is useful to investors. Investors should not view “Income from continuing operations — as adjusted” as an alternative to the GAAP measure of income (loss) from continuing operations. | ||
| B. | Medicare revenues for the first nine months and the fourth quarter of fiscal 2004 included approximately $10.1 million and $0.3 million, respectively, received in settlement of the Company’s appeal filed with the U.S. Provider Reimbursement Review Board (“PRRB”) related to the reopening of all of its 1998 and 1997 cost reports, net of a $1 million estimated repayment to Medicare recorded for the first nine months of fiscal 2004 in connection with services rendered to certain patients since the inception of the Prospective Payment Reimbursement System in October 2000. The Centers for Medicare & Medicaid Services determined that homecare providers should have received lower reimbursements for certain services rendered to beneficiaries discharged from inpatient hospitals within fourteen days immediately preceding admission to home healthcare. | ||
| C. | Income before income taxes for the first nine months of fiscal 2004 included a gain of $946,000 from the sale of Gentiva’s 19.9% interest in a Canadian homecare company to which Gentiva sold its Canadian operations in November 2000. | ||
| D. | Restructuring and special charges recorded by Gentiva during the fiscal year 2002 aggregated $46.1 million, of which $6.3 million was recorded in cost of services sold and $39.8 million was recorded in selling, general and administrative expenses. These charges consisted primarily of restructuring charges relating to severance and lease payments associated with the realignment and consolidation of business activities of $6.9 million; cash payments and related expenses in connection with the Company’s tender offer to purchase and cancel outstanding stock options of $21.4 million; settlement costs of $7.7 million; a refinement of the estimation process associated with the Company’s actuarially determined workers’ compensation and professional liability |
46
| insurance reserves of $6.3 million; and, asset writedowns and the write-off of deferred debt issuance costs associated with the terminated credit facility of $3.8 million. | |||
| E. | Income tax expense/benefit included the following non-recurring items: |
| • | For fiscal year 2002, income tax expense relating to continuing operations of $18.4 million included a provision of $26.9 million to establish a valuation allowance against certain deferred tax assets that were recorded with the adoption of Statement of Financial Accounting Standards No.142 (Goodwill and Other Intangible Assets) and subsequent write-off of goodwill; the corresponding tax benefit for the same amount was recorded in the cumulative effect of accounting change line during the 2002 period. | ||
| • | For fiscal year 2003, the Company recorded an income tax benefit of $33.5 million due primarily to the reversal of the valuation allowance against net deferred tax assets in the fourth quarter of fiscal 2003. | ||
| • | For the nine months ended and last twelve months ended October 2, 2005, income tax expense of $4.3 million and $5.8 million, respectively, included a $4.2 million income tax benefit resulting from a favorable resolution of tax audit issues relating to fiscal 1997 through fiscal 2000. | ||
| • | Management has excluded these non-recurring items and has incorporated a normalized tax rate in its presentation of “Income from continuing operations- as adjusted”. |
47