Exhibit 99.1
SELECTED INFORMATION CONTAINED IN
CONFIDENTIAL INFORMATION MEMORANDUM
Target Overview – Harden Healthcare Holdings, Inc.
Founded in 2001, Harden is a leading provider of a continuum of healthcare services in 13 states. Harden is majority owned by Capstar Partners, LLC, a private investment firm based in Austin, Texas, founded by R. Steven Hicks in 2000. Harden serves over 35,000 patients and operates in four main business segments, which include: Community Care, Home Health, Hospice, and Long-Term Care.
Gentiva’s acquisition of Harden is focused on the Community Care, Home Health, and Hospice business segments. Gentiva will not be acquiring the Long-Term Care segment.
Community Care
Community Care provides support services to patients who have chronic care needs or long-term disabilities that require assistance with routine personal care in the home. Harden’s Community Care services are primarily funded through Medicaid and serve as a low cost alternative to inpatient care.
Home Health
Home Health offers a range of skilled nursing services for home-based patients in a lower cost setting versus facility-based care. Harden’s Home Health services are primarily funded through Medicare Fee-For-Service as well as Medicare Advantage.
Hospice
Hospice provides end-of-life care focused on enhancing the quality of life for patients and their families. Care may occur in private home or community facility settings. The business is almost exclusively Medicare reimbursed.

2
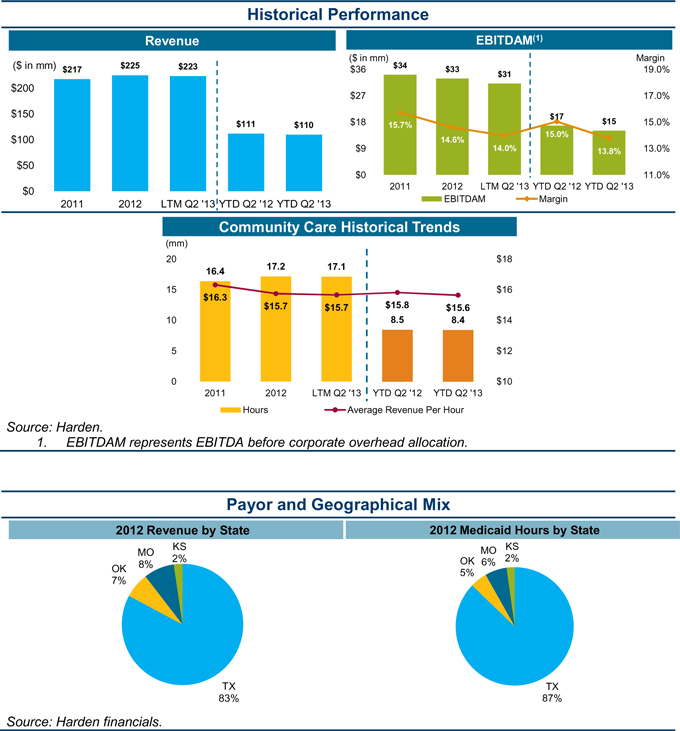
Community Care
Community Care segment provides support services to patients who have chronic care needs or long-term disabilities that require assistance with routine personal care in the home. Harden has 34 locations in 4 states with Texas being the largest. The ongoing shift from Medicaid Fee-For-Service to Managed Medicaid as well as the 2014 Medicaid expansion under PPACA pose significant opportunities for the segment. Community Care offers significant cost advantages as opposed to traditional facility-based care, which creates a compelling selling point in the current healthcare environment focused on using low-cost, high quality care. Furthermore, the ability to remain and receive care in the home is attractive to patients.
Smaller competitors include Texas Home Health, Jordan Health Services (Texas) and HCI (Oklahoma).
3
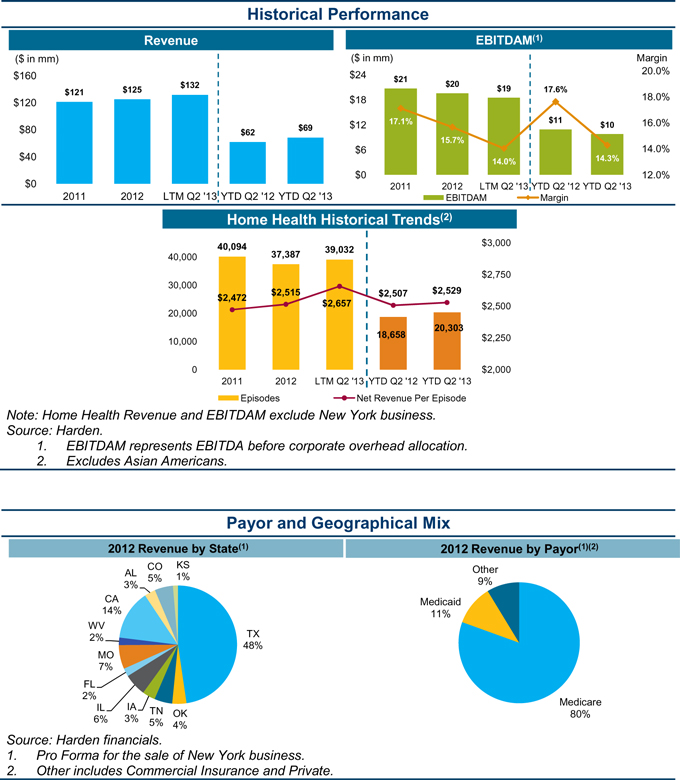
Home Health
Home Health offers a range of skilled nursing services for home-based patients in a lower cost setting. Individual care plans range from the management of complex diseases to physical, occupational and speech therapy and personal care services. Harden’s Home Health services are primarily funded through Medicare Fee-For-Service with an increasing importance of Medicare Advantage. The Home Health segment serves 8,600 patients across 59 locations in 12 states.
4
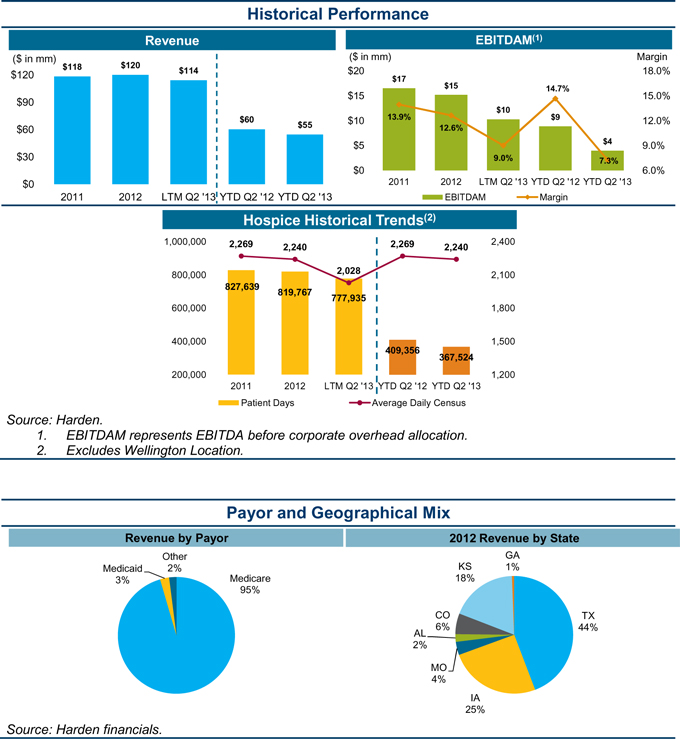
Hospice
Hospice provides end-of-life care focused on enhancing the quality of life for patients and their families. Hospice care teams may consist of consulting physicians, skilled nurses, Home Health aides, pastoral caregivers, social work services and more. Care may occur in private home or community facility settings. The business is almost exclusively Medicare reimbursed. The Hospice segment serves 2,100 patients across 67 locations in 7 states.
Harden’s historical growth in Hospice was spurred by its acquisition of Voyager, which occurred in 2010 and fully contributed to revenues in 2011.
5
Historical Financials – Harden Healthcare Holdings, Inc.
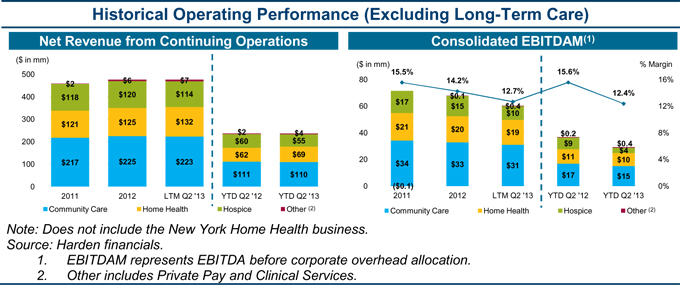
Historical Financial Information (Excluding Long-Term Care)
| | | | | | | | | | | | | | | | | | | | |
| | | | | | | | | 6 Months Ended | | | 6 Months Ended | | | LTM | |
| ($ in millions) | | 12/31/2011 | | | 12/31/2012 | | | 6/30/2012 | | | 6/30/2013 | | | 6/30/2013 | |
Revenue | | | | | | | | | | | | | | | | | | | | |
Community Care | | | 217.2 | | | | 224.8 | | | | 111.5 | | | | 109.6 | | | | 222.9 | |
Home Health | | | 121.2 | | | | 125.3 | | | | 61.9 | | | | 68.5 | | | | 131.9 | |
Hospice | | | 118.4 | | | | 120.1 | | | | 60.4 | | | | 54.6 | | | | 114.2 | |
Clinical Services | | | 1.7 | | | | 3.3 | | | | 1.3 | | | | 2.2 | | | | 4.2 | |
Private Pay | | | 0.0 | | | | 2.6 | | | | 1.2 | | | | 1.7 | | | | 3.1 | |
| | | | | | | | | | | | | | | | | | | | |
Consolidated Revenues | | $ | 458.5 | | | $ | 476.0 | | | $ | 236.2 | | | $ | 236.5 | | | $ | 476.3 | |
EBITDAM(1) | | | | | | | | | | | | | | | | | | | | |
Community Care | | | 34.2 | | | | 32.8 | | | | 16.8 | | | | 15.1 | | | | 31.1 | |
Home Health | | | 20.7 | | | | 19.6 | | | | 10.9 | | | | 9.8 | | | | 18.5 | |
Hospice | | | 16.5 | | | | 15.2 | | | | 8.9 | | | | 4.0 | | | | 10.3 | |
Clinical Services | | | (0.1 | ) | | | 0.3 | | | | 0.2 | | | | 0.5 | | | | 0.7 | |
Private Pay | | | (0.0 | ) | | | (0.2 | ) | | | 0.0 | | | | (0.1 | ) | | | (0.3 | ) |
| | | | | | | | | | | | | | | | | | | | |
Consolidated EBITDAM | | $ | 71.3 | | | $ | 67.8 | | | $ | 36.7 | | | $ | 29.3 | | | $ | 60.3 | |
% Margin | | | 15.5 | % | | | 14.2 | % | | | 15.6 | % | | | 12.4 | % | | | 12.7 | % |
Note: Does not include the New York Home Health business.
Source: Harden financials.
| 1. | EBITDAM represents EBITDA before corporate overhead allocation. |
6

| | | | | | | | | | | | | | | | | | | | |
| | | Fiscal Year | | | Fiscal Year | | | Six Months Ended | | | Six Months Ended | | | LTM | |
| ($ in millions) | | 2011 | | | 2012 | | | 6/30/2012 | | | 6/30/2013 | | | 6/30/2013 | |
Revenue | | | | | | | | | | | | | | | | | | | | |
Community Care | | $ | 217.2 | | | $ | 224.8 | | | $ | 111.5 | | | $ | 109.6 | | | $ | 222.9 | |
Home Health | | | 121.2 | | | | 125.3 | | | | 61.9 | | | | 68.5 | | | | 131.9 | |
Hospice | | | 118.4 | | | | 120.1 | | | | 60.4 | | | | 54.6 | | | | 114.2 | |
Private Pay | | | 0.0 | | | | 2.6 | | | | 1.2 | | | | 1.7 | | | | 3.1 | |
Clinical Services | | | 1.7 | | | | 3.3 | | | | 1.3 | | | | 2.2 | | | | 4.2 | |
| | | | | | | | | | | | | | | | | | | | |
Total (Excluding Long-Term Care & Other(2)) | | $ | 458.5 | | | $ | 476.0 | | | $ | 236.2 | | | $ | 236.5 | | | $ | 476.3 | |
Long-Term Care & Other | | | 347.0 | | | | 320.9 | | | | 165.5 | | | | 155.8 | | | | 311.2 | |
| | | | | | | | | | | | | | | | | | | | |
Consolidated Revenues | | $ | 805.5 | | | $ | 796.9 | | | $ | 401.7 | | | $ | 392.3 | | | $ | 787.5 | |
Consolidated Net Income (Loss) | | ($ | 0.0 | ) | | ($ | 6.3 | ) | | $ | 3.5 | | | ($ | 12.5 | ) | | ($ | 22.3 | ) |
Depreciation and Amortization | | | 10.7 | | | | 12.0 | | | | 5.7 | | | | 6.4 | | | | 12.6 | |
Interest Expense | | | 41.1 | | | | 41.6 | | | | 20.8 | | | | 21.0 | | | | 41.8 | |
Tax Expense (Benefit) | | | (1.8 | ) | | | (2.4 | ) | | | 1.6 | | | | 0.3 | | | | (3.7 | ) |
Corporate Overhead | | | 31.9 | | | | 34.1 | | | | 16.1 | | | | 18.4 | | | | 36.4 | |
Other Adjustments(3) | | | 8.5 | | | | 7.1 | | | | (1.5 | ) | | | 3.8 | | | | 12.4 | |
| | | | | | | | | | | | | | | | | | | | |
Consolidated EBITDAM | | $ | 90.4 | | | $ | 86.2 | | | $ | 46.3 | | | $ | 37.4 | | | $ | 77.3 | |
Community Care | | | 34.2 | | | | 32.8 | | | | 16.8 | | | | 15.1 | | | | 31.1 | |
Home Health | | | 20.7 | | | | 19.6 | | | | 10.9 | | | | 9.8 | | | | 18.5 | |
Hospice | | | 16.5 | | | | 15.2 | | | | 8.9 | | | | 4.0 | | | | 10.3 | |
Private Pay | | | (0.0 | ) | | | (0.2 | ) | | | 0.0 | | | | (0.1 | ) | | | (0.3 | ) |
Clinical Services | | | (0.1 | ) | | | 0.3 | | | | 0.2 | | | | 0.5 | | | | 0.7 | |
| | | | | | | | | | | | | | | | | | | | |
Total (Excluding Long-Term Care & Other) | | $ | 71.3 | | | $ | 67.8 | | | $ | 36.7 | | | $ | 29.3 | | | $ | 60.3 | |
Long-Term Care & Other | | | 19.1 | | | | 18.4 | | | | 9.6 | | | | 8.2 | | | | 17.0 | |
| | | | | | | | | | | | | | | | | | | | |
Consolidated EBITDAM | | $ | 90.4 | | | $ | 86.2 | | | $ | 46.3 | | | $ | 37.4 | | | $ | 77.3 | |
EBITDAM Margins | | | | | | | | | | | | | | | | | | | | |
Community Care | | | 15.7 | % | | | 14.6 | % | | | 15.0 | % | | | 13.8 | % | | | 14.0 | % |
Home Health | | | 17.1 | % | | | 15.7 | % | | | 17.6 | % | | | 14.3 | % | | | 14.0 | % |
Hospice | | | 13.9 | % | | | 12.6 | % | | | 14.7 | % | | | 7.3 | % | | | 9.0 | % |
Private Pay | | | 0.0 | % | | | 0.0 | % | | | 0.0 | % | | | 0.0 | % | | | 0.0 | % |
Clinical Services | | | (8.4 | %) | | | 10.6 | % | | | 15.9 | % | | | 24.4 | % | | | 16.3 | % |
Total (Excluding Long-Term Care & Other) | | | 15.5 | % | | | 14.2 | % | | | 15.6 | % | | | 12.4 | % | | | 12.7 | % |
Long-Term Care & Other | | | 5.5 | % | | | 5.7 | % | | | 5.8 | % | | | 5.2 | % | | | 5.5 | % |
Consolidated EBITDAM | | | 11.2 | % | | | 10.8 | % | | | 11.5 | % | | | 9.5 | % | | | 9.8 | % |
| 1. | EBITDAM represents EBITDA before corporate overhead. |
| 2. | Other includes Private Pay, Clinical Services and New York Home Health business. |
| 3. | Other adjustments includes non-cash, non-recurring and other adjustments. |
7