UNITED STATES SECURITIES AND EXCHANGE COMMISSION
Washington, D.C. 20549
_________________
Form 10-K/A
Washington, D.C. 20549
_________________
Form 10-K/A
Amendment No. 1
_________________
_________________
| x | ANNUAL REPORT PURSUANT TO SECTION 13 OR 15(d) OF THE SECURITIES EXCHANGE ACT OF 1934 | |
For the fiscal year ended July 31, 2007 | ||
Or | ||
| o | TRANSITION REPORT PURSUANT TO SECTION 13 OR 15(d) OF THE SECURITIES EXCHANGE ACT OF 1934. | |
For the transition period from______to______. | |
Commission File Number: 000-28369 | |
SourceForge, Inc. | |
| Delaware (State or other jurisdiction of incorporation or organization) | 77-0399299 (I.R.S. Employer Identification No.) |
| 650 Castro Street, Suite 450, Mountain View, CA 94041 (Address, including zip code, of principal executive offices) | |
(650) 694-2100 | |
| Securities registered pursuant to Section 12(g) of the Act: Common Stock, $0.001 par value (Title of Class) | |
Indicate by check mark if the registrant is a well-known seasoned issuer, as defined in Rule 405 of the Securities Act. Yeso Nox
Indicate by check mark if the registrant is not required to file reports pursuant to Section 13 or Section 15(d) of the Act. Yeso Nox
Indicate by check mark whether the registrant: (1) has filed all reports required to be filed by Section 13 or 15(d) of the Securities Exchange Act of 1934 during the preceding 12 months (or for such shorter period that the registrant was required to file such reports), and (2) has been subject to such filing requirements for the past 90 days. Yes x Noo
Indicate by check mark if disclosure of delinquent filers pursuant to Item 405 of Regulation S-K is not contained herein, and will not be contained, to the best of the registrant’s knowledge, in definitive proxy or information statements incorporated by reference in Part III of this Form 10-K or any amendment to this Form 10-K.o
Indicate by check mark whether the registrant is a large accelerated filer, an accelerated filer, or a non-accelerated filer. See definition of “accelerated filer and large accelerated filer” in Rule 12b-2 of the Exchange Act). (Check one):
Large accelerated filer o Accelerated filer x Non-accelerated filero
Indicate by check mark whether the Registrant is a shell company (as defined in Rule 12b-2 of the Exchange Act). Yeso Nox
As of September 28, 2007, there were 68,468,573 shares of the Registrant’s Common Stock outstanding. The aggregate market value of the Common Stock held by non-affiliates of the Registrant as of January 31, 2007 (based on the closing price for the Common Stock on the NASDAQ Global Market for such date) was approximately $282.0 million. Shares of common stock held by each of our officers and directors and by each person or group who owns 5% or more of our outstanding common stock have been excluded in that such persons or groups may be deemed to be our affiliate. This determination of affiliate status is not necessarily a conclusive determination for other purposes.
DOCUMENTS INCORPORATED BY REFERENCE
Portions of the Proxy Statement for the 2007 Annual Meeting of Stockholders (“Proxy Statement”) which will be held on December 5, 2007, and to be filed pursuant to Regulation 14A within 120 days after the Registrant’s fiscal year ended July 31, 2007, are incorporated by reference into Part III of this Form 10-K.
EXPLANATORY NOTE
This Amendment No. 1 to the Annual Report on Form 10-K is being filed solely to correct typographical errors in the Consolidated Statements of Cash Flows, which appears in Item 8 of Part II of the Form 10-K. The typographical errors were the incorrect reflections of Net income (loss) and Net income (loss) from discontinued operations when compared with the Consolidated Statements of Operations. This Amendment contains the complete text of the original report with the correct information contained in Item 8 of Part II.
Except as described above, no other changes have been made to the original Form 10-K, and this Form 10-K/A does not amend, update or change any other financial statements, Items or disclosures in the original Form 10-K. This Form 10-K/A does not reflect events occurring after the filing of the Form 10-K or modify or update those disclosures, including any exhibits to the Form 10-K affected by subsequent events. Information not affected by the changes described above is unchanged and reflects the disclosures made at the time of the original filing of the Form 10-K on October 9, 2007.
2
TABLE OF CONTENTS
3
Special Note Regarding Forward-Looking Statements
This Form 10-K contains forward-looking statements that involve risks and uncertainties. Words such as “intend,” “expect,” “believe,” “in our view,” and variations of such words and similar expressions, are intended to identify such forward-looking statements, which include, but are not limited to, statements regarding our expectations and beliefs regarding future revenue growth; gross margins; financial performance and results of operations; technological trends in, and demand for online advertising; management’s strategy, plans and objectives for future operations; employee relations and our ability to attract highly-qualified personnel; the amount of cash utilized by operations; our intent to continue to invest significant resources in development; competition, competitors and our ability to compete; liquidity and capital resources; the outcome of any litigation to which we are a party; our accounting policies; and sufficiency of our cash resources, cash generated from operations and investments to meet our operating and working capital requirements. Actual results may differ materially from those expressed or implied in such forward-looking statements due to various factors, including those set forth in this Business section under “Competition” and in the Risk Factors contained in Item 1.A of this Form 10-K. We undertake no obligation to update the forward-looking statements to reflect events or circumstances occurring after the date of this Form 10-K.
Introduction
We own and operate a network of media web sites, serving IT management and IT professional, software development and open source communities. Through our ThinkGeek, Inc. subsidiary, we also provide online sales of a variety of retail products of interest to these communities and other consumers. Our network of web sites includes: SourceForge.net, Slashdot.org, ThinkGeek.com, Linux.com, freshmeat.net, ITManagersJournal.com and NewsForge.com. We provide a combination of user-developed content, online marketplaces and e-commerce, and intend to serve as the global technology community’s nexus for information exchange, open source software distribution and services and goods for geeks.
We were incorporated in California in January 1995 and reincorporated in Delaware in December 1999. From the date of our incorporation through October 2001, we sold Linux-based hardware systems and services under the name VA Linux Systems, Inc. In December 2001 reflecting our decision to pursue our Software, Online Media, E-commerce, and Online Images businesses, we changed our name to VA Software Corporation. In December 2005, we sold our Online Images business to Jupitermedia Corporation (“Jupitermedia”) and in April 2007, we sold our Software business to CollabNet, Inc. (“CollabNet”). In May 2007, reflecting our strategic decision to focus on our network of media and e-commerce web sites, we changed our name to SourceForge, Inc. and merged with our wholly-owned subsidiary, OSTG, Inc.
As a result of the disposition of our Software business to CollabNet and the sale of our Online Images business to Jupitermedia, we no longer have operations in these segments. In conjunction with the sale of our Software business, we restructured our facilities for the excess facility space formerly used by our Software business and also terminated the employment of those employees of our Software business not offered positions at CollabNet.
We are subject to the informational requirements of the Securities Exchange Act of 1934 (the “Exchange Act”). Therefore, we file periodic reports, proxy statements and other information with the Securities and Exchange Commission (the “SEC”). Such reports, proxy statements and other information may be obtained by visiting the Public Reference Room of the SEC at 100 F Street, NE, Washington, DC 20549 or by calling the SEC at 1-800-SEC-0330. In addition, the SEC maintains an Internet site (http://www.sec.gov) that contains reports, proxy and information statements and other information regarding issuers that file electronically.
You can access other information at our Investor Relations web site. The address ishttp://web.sourceforge.com/investors.php. The content of this web site is not intended to be incorporated by reference into this report or any other report we file with the SEC. We make available, free of charge, copies of our annual report on Form 10-K as soon as reasonably practicable after filing such material electronically or otherwise furnishing it to the SEC, and have made our annual reports on Form 10-K available on our web site since November 2002.
4
We currently view our business in two operating segments: Online Media and E-commerce. Our Online Media segment consists of a network of Internet web sites that connect millions of influential technology managers, professionals and enthusiasts. Our E-commerce segment sells online goods of interest to the software development and IT communities and other consumers, through our ThinkGeek.com web site.
Online Media
Our Online Media’s network of web sites, each of which are described below, connect millions of influential technology professionals and enthusiasts. These web sites served an average of more than 32 million unique visitors per month* over the past twelve months (*Source: Google Analytics and Omniture, July 2007). During fiscal 2007 we served 779 million downloads from our SourceForge.net web site, a 36% increase from the 574 million downloads in fiscal 2006. We believe that our web sites constitute a dynamic community-driven media network and a cornerstone of the open source software development community. Our Online Media segment attracts IT decision-makers and buyers, from chief technology officers to project managers. IT professionals, technology enthusiasts and developers turn to the Online Media sites to create content, debate and discuss current issues facing the technology marketplace, and to create IT news. The Online Media business is supported by sponsors and advertisers who want to reach the unique demographic of IT professionals and developers who visit our web sites. Our web sites include:
- SourceForge.net, our flagship web site providing Open Source project hosting and hosted downloads of leading Open Source code and applications. SourceForge.net is the home for more than 158,000 Open Source projects and nearly 1.7 million registered users.
- Slashdot.org, our leading site focused on user-generated content, news and reviews for IT Professionals and technology enthusiasts. Slashdot.org is dedicated to providing the IT and business communities with an interactive platform to publish and comment on cutting-edge technology, hardware, software, games and online rights news.
- Linux.com, our comprehensive web site for Linux and open source news and information. Linux.com caters to business and IT managers looking for migration strategies to Linux.
- Freshmeat.net, one of the Internet’s most comprehensive indices of downloadable Linux, Unix and cross-platform software.
- ITManagersJournal.com, a web site delivering strategic and technical information to help top-level IT professionals implement enterprise-level open source and proprietary architecture, applications, and infrastructure solutions.
- NewsForge.com, the online newspaper of record for Linux and open source software and business issues.
In May 2007, we announced the public beta of our SourceForge.Net Marketplace (“Marketplace”). Marketplace allows developers and consultants to offer fee-based services to buyers on our SourceForge.net web site.
Our Online Media segment represented 38%, 39% and 35% of net revenue from continuing operations during fiscal 2007, fiscal 2006 and fiscal 2005, respectively.
E-commerce
Our E-commerce segment provides online sales of a variety of retail products of interest to the software development and IT communities and other consumers through our ThinkGeek.com web site. We believe we offer a significantly broader range of unique products in a centralized location than are available in traditional stores. We do not have the shelf display space limitations that brick-and-mortar stores do. Our customers are able to buy office gadgets, apparel, caffeinated products, electronics and other specialty items with a single check-out. Consumers can either access the information directly through our web site, or get free help from our customer care representatives and experts by contacting them by e-mail atorders@thinkgeek.com or by telephone at 1-888-GEEKSTUFF.
Our E-commerce segment represented 62%, 61% and 65% of net revenue from continuing operations during fiscal 2007, fiscal 2006 and fiscal 2005, respectively.
5
Online Media
We sell our Internet advertisements via our direct sales organization and also use our web sites to increase public awareness of our products. In addition, we have entered into co-marketing agreements with certain third-party online advertising and remnant sales networks with respect to marketing and/or selling advertising space on our web sites.
E-commerce
Our E-commerce marketing and promotion strategy is designed to increase customer traffic to our online store, add new customers, build strong customer loyalty, maximize repeat purchases and develop incremental revenue opportunities. We intend to continue to use the unique capabilities of the Internet as a means to encourage new and repeat customers to visit our web sites. Our advertising campaigns for our E-Commerce business generally run on our Online Media business’s web sites where we direct customers to our E-Commerce products through links to pages on our ThinkGeek.com E-Commerce web site. In addition, we currently offer a customer retention program, Geek Points, which is designed to add new customers and build customer loyalty. Through this program, customers are rewarded for shopping with us. When the customers sign up for Geek Points, they earn points on all of their purchases from our ThinkGeek.com web site. Rewards for Geek Points participants include special promotions, discounts and access to products available only to those customers enrolled in the program.
Online Media
We believe that the success of our Online Media business will depend partly on our ability to enhance our web sites and underlying technology to meet the needs of a rapidly-evolving marketplace and increasingly-sophisticated and demanding customers. We intend to continue to extend and strengthen the infrastructure and architecture underlying our online sites. In addition, we intend to enhance existing features and add additional features including, but not limited to, enhancing certain tools on SourceForge.net to improve the development experience for our registered users and enhancing our existing moderation system on Slashdot.org to provide a better layer of functionality to our comment system.
In May 2007, we commenced the public beta of Marketplace, our platform that allows developers and consultants to offer fee-based services to buyers on our SourceForge.net web site. We intend to add additional features and functionality designed to improve the marketing and consummation of fee-based service transactions by developers and consultants.
E-commerce
We have implemented a broad array of services and systems for customer service, product searching, customer communication, order processing and order fulfillment functions. These services and systems use a combination of our own proprietary technologies and commercially-available, licensed technologies. We focus our internal development efforts on creating and enhancing the specialized, proprietary software that is unique to our business.
Our core online merchandise catalog, customer interaction, order collection, fulfillment and back-end systems are proprietary to ThinkGeek. The systems are designed to provide real-time connectivity to our distribution center systems. These include an inventory-tracking system, a real-time order tracking system, an executive information system and an inventory replenishment system. Our Internet servers use secure sockets layer (SSL) technology to help conduct secure communications and transactions. We continue to invest in improving the E-commerce customer service, order processing, shipping and tracking systems.
6
Online Media
The market for Internet media services provided by the Online Media business is highly competitive. Advertisers have many alternatives available to reach their target audience, including print (e.g., Ziff Davis Media’seWeek and International Data Group’sComputerworld), general portal sites (e.g., aol.com, yahoo.com, google.com and msn.com) and other web sites focused on vertical markets (e.g., CNET Networks, Inc.’scnet.com andtechrepublic.com; Jupitermedia Corporation’sinternet.com,EarthWeb.com andDevX.com; and TechTarget’s network of web sites) and general business sites (BusinessWeek.com, Forbes.com and Fortune.com). In July 2006, Google, Inc. (“Google”) began offering open source code hosting capabilities that may be viewed as competitive to SourceForge.net’s offering; other companies and organizations also offer open source code hosting, open source code search, and open source software development-related services. This competition may impact traffic to our SourceForge.net web site.
Many of our competitors in our Online Media business have substantial competitive advantages, including greater resources that can be devoted to the development, promotion and sale of their online services, more established sales forces and channels, greater software and web site development experience and greater name recognition.
E-commerce
The market for retail products similar to those offered by ThinkGeek is highly competitive. We compete with Internet portals and online service providers that feature shopping services, (e.g. Amazon.com and Yahoo!) and with online or mail-order retailers (e.g. Sharper Image Corporation’sSharperImage.com; X-tremegeek, Firebox (UK) and Computergear). More recently some online retailers have developed sites which aim at the computer enthusiast and computer gaming markets. We believe that there are a number of competitive factors in our market, including company credibility, product selection and availability, convenience, price, privacy, web site features, functionality and performance, ease of purchasing, customer service and reliability and speed of order shipment.
Many of our competitors in our E-commerce business have substantial competitive advantages, including greater resources that can be devoted to the development, promotion and sale of their online products, more established sales forces and channels, greater software and web site development experience, and greater name recognition.
To be competitive, we must respond promptly and effectively to the challenges of technological change, evolving standards and our competitors’ innovations by continuing to enhance our services and products. Any pricing pressures or loss of potential customers resulting from our failure to compete effectively would reduce our revenue.
We protect our intellectual property through a combination of copyright, trademark, trade secret laws, employee and third-party nondisclosure agreements, and other methods of protection.
SourceForge, SourceForge.net, Slashdot, ThinkGeek, Freshmeat, and the SourceForge logo are some of our trademarks and/or registered trademarks that we use in the United States and in other countries.
Because the media publishing industry is characterized by rapid technological change, we believe that factors such as the technological and creative skills of our personnel, new feature development, name recognition and reliable web sites are more important to establishing and maintaining a technology leadership position than the various legal protections of our technology.
In the past several years, a substantial portion of our E-commerce revenue occurred in our second fiscal quarter, which in fiscal year 2008 will begin on November 1, 2007, and end on January 31, 2008. As is typical in the retail industry, we generally experience lower E-commerce revenue during the other quarters. Therefore, our E-commerce revenue in a particular quarter is not necessarily indicative of future E-commerce revenue for a subsequent quarter or our full fiscal year.
7
As noted above, our E-commerce business is highly seasonal, reflecting the general pattern associated with the retail industry of peak sales and earnings during the holiday shopping season. We have also noticed lower traffic and reduced advertising spending on our Online Media web sites during the summer months.
We believe our success will depend in part on our continued ability to attract and retain highly-qualified personnel in a competitive market for experienced and talented software engineers and sales and marketing personnel. Our employees are not represented by any collective bargaining organization; we have never experienced a work stoppage; and we believe that our relations with our employees are good. As of July 31, 2007, our employee base totaled 101, including 33 in operations, 20 in sales and marketing, 28 in research and development and 20 in finance and administration.
CURRENT AND PROSPECTIVE INVESTORS IN SOURCEFORGE SECURITIES SHOULD CAREFULLY CONSIDER THE RISKS DESCRIBED BELOW BEFORE MAKING AN INVESTMENT DECISION. IN ADDITION, THESE RISKS ARE NOT THE ONLY ONES FACING OUR COMPANY. ADDITIONAL RISKS OF WHICH WE ARE NOT PRESENTLY AWARE OR THAT WE CURRENTLY BELIEVE ARE IMMATERIAL MAY ALSO IMPAIR OUR BUSINESS OPERATIONS. OUR BUSINESS COULD BE HARMED BY ANY OF THESE RISKS. THE TRADING PRICE OF OUR COMMON STOCK COULD DECLINE DUE TO ANY OF THESE RISKS, AND INVESTORS MAY LOSE ALL OR PART OF THEIR INVESTMENT.
Risks Related to Our Online Media Business
If our Online Media business fails to attract and retain users, particularly users who create and post original content on our sites, our financial results will be adversely affected.
Our reliance upon user-generated content requires that we develop and maintain tools and services designed to facilitate:
- creation of user-generated content,
- participation in discussion surrounding such user-generated content, and
- evaluation of user-generated content.
We cannot assure that any new tools or services that we offer to facilitate creation of user-generated content will be developed and/or improved in a timely or cost-effective manner. If we are unable to develop and/or improve tools and services facilitating creation of user-generated content, or if our infrastructure is not sufficiently robust to ensure that such tools and services are highly available, we will be unable to attract, retain and expand a loyal user base that is desirable to advertisers, resulting in an inability to generate sufficient revenue to grow our online business.
If our Online Media business fails to deliver innovative marketing programs, we will be unable to attract and retain advertisers, which will adversely affect our financial results.
The successful development and production of marketing programs is subject to numerous uncertainties, including our ability to:
- enable advertisers to showcase products, services and/or brands to their intended audience;
- anticipate and successfully respond to emerging trends in online advertising; and
- attract and retain qualified marketing and technical personnel.
We cannot assure that our online marketing programs will enable us to attract and retain advertisers and generate revenue consistent with our estimates or sufficient to sustain operations. In addition, we cannot assure that any new marketing programs will be developed in a timely or cost-effective manner. If we are unable to deliver innovative marketing programs that allow us to expand our advertiser base, we will be unable to generate sufficient revenue to grow our online business.
8
Decreases or delays in advertising spending due to general economic conditions could harm our ability to generate advertising revenue, which would adversely affect our financial results.
Our advertiser’s spending patterns tend to be cyclical, reflecting both overall economic conditions and seasonality as well as their company-specific budgeting and buying patterns. Because we derive a large part of our Online Media revenue from these advertisers, decreases in or delays of advertising spending could reduce our revenue or negatively impact our ability to grow our revenue.
The market in which SourceForge.net participates is becoming more competitive, and if we do not compete effectively, our Online Media business could be harmed.
SouceForge.net hosts more than 158,000 open source software projects, and we derive revenue from SourceForge.net primarily through advertisements and sponsorship campaigns run on the site. Google, Inc. (“Google”) offers open source code hosting capabilities that may be viewed as competitive to SourceForge.net’s offering. Because Google enjoys substantial competitive advantages in the online space generally, including powerful brand identity, established marketing relationships, larger visitor base, and greater financial, technical, and other resources, we may be unable to compete effectively with Google’s offering. Further, other companies and organizations offer open source code hosting, open source code search, and open source software development-related services. Our competitors may be able to respond more quickly and effectively than we can to new or changing open source software opportunities, technologies, standards, or user requirements. Because of competitors’ advantages, even if our services are more effective than those of our competitors, users might accept the services of our competitors in lieu of ours. If we fail to compete effectively, our Online Media business could be negatively impacted.
We are devoting significant research and development resources and spending on development of the SourceForge.net Marketplace, so if it does not achieve market acceptance our business and operating results will be materially and adversely affected.
In fiscal year 2007, we spent $5.4 million on research and development within our Online Media business, including $1.8 million on internally developed software related to our SourceForge.net Marketplace offering. We expect to allocate a substantial portion of our research and development resources to the SourceForge.net Marketplace for the foreseeable future, a portion of which may be capitalized as internally developed software. There can be no assurance, however, that we will be sufficiently successful in marketing, upgrading and supporting the SourceForge.net Marketplace to offset our substantial research and development expenditures. On May 15, 2007, we began offering a beta version of the SourceForge.net Marketplace. Failure to grow revenue derived from the SourceForge.net Marketplace sufficiently to offset the significant research and development costs will materially and adversely affect our business and operating results.
Unplanned system interruptions and capacity constraints and failure to effect efficient transmission of user communications and data over the Internet could harm our business and reputation.
The success of our Online Media business largely depends on the efficient and uninterrupted operation of the computer and communications hardware and network systems that power our web sites. We do not currently have a formal disaster recovery plan and our computer and communications systems are located in a single data center in Santa Clara County, California. Although we intend to build a new data center during fiscal year 2008, given the current location of our single data center and our lack of a formal disaster recovery plan, our systems and operations remain vulnerable to damage or interruption from earthquake, fire, power loss, telecommunications failure and similar events.
During fiscal year 2007, we experienced service interruptions with our online sites, including service outages associated with our SourceForge.net and Slashdot.org sites. Service interruptions during fiscal year 2007 were caused by a variety of factors, including capacity constraints, single points of hardware failure, software design flaws and bugs, and third party denial of service attacks. Although we continue to work to improve the performance and uptime of our web sites, and have taken steps to mitigate these risks, we expect that service interruptions will continue to occur from time to time. If our web sites experience frequent or lengthy service interruptions, our business and reputation will be seriously harmed.
9
Risks Related to Our E-Commerce Business
We are exposed to significant inventory risks as a result of seasonality, new product launches, rapid changes in product cycles and changes in consumer tastes with respect to our products offered at our ThinkGeek E-commerce web site. Failure to properly assess our inventory needs will adversely affect our financial results.
In order to be successful, we must accurately predict our customers’ tastes and avoid over-stocking or under-stocking products. Demand for products can change significantly between the time inventory is ordered and the date of sale. In addition, when we begin selling a new product, it is particularly difficult to forecast product demand accurately. The acquisition of certain types of inventory, or inventory from certain sources, may require significant lead-time and prepayment, and such inventory may not be returnable. We carry a broad selection and significant inventory levels of certain products and we may be unable to sell products in sufficient quantities or during the relevant selling seasons.
We cannot predict our E-commerce customers’ preferences with certainty and such preferences may change rapidly. If we fail to accurately assess and predict our E-commerce customers’ preferences, it will adversely impact our financial results.
Our E-commerce offerings on our ThinkGeek.com web site are designed to appeal to IT professionals, software developers and others in technical fields. Misjudging either the market for our products or our customers’ purchasing habits will cause our sales to decline, our inventories to increase and/or require us to sell our products at lower prices, all of which would have a negative effect on our gross margins and our results of operations.
We are subject to risks as a result of our reliance on foreign sources of production for certain products.
In order to offer cost effective and innovative products, we are increasingly relying on manufacturers, located outside of the United States, most of which are located in Asia (primarily China), to supply us with these products in sufficient quantities to our forecasted customer demand and deliver these products in a timely manner.
Our arrangements with these manufacturers are usually not formalized and are generally limited to purchase orders tied to specific lots of goods. We are subject to the risks of relying on products manufactured outside the United States, including political unrest, trade restrictions, customs and tariffs, local business practice and political issues. Additionally, significant reliance on foreign sources of productions increases the risk of issues relating to compliance with domestic or international labor standards, compliance with domestic or international manufacturing and product safety standards, currency fluctuations, restrictions on the transfer of funds, work stoppages or slowdowns and other labor issues, economic uncertainties including inflation and government regulations, availability and costs of raw materials, potentially adverse tax consequences and other uncertainties. China, in particular, has in recent years experienced rapid social, political and economic change, and further changes may adversely affect our ability to procure our products from Chinese suppliers.
Our ability to obtain goods on a cost effective basis is also subject to our ability to maintain relationships with our suppliers, and our ability to negotiate and maintain supply arrangements on favorable terms. There is increasing political pressure on China to permit the exchange rate of its currency, the Chinese Yuan (“CNY”), to float against the U.S. Dollar (“USD”). Although substantially all of our purchase orders are denominated in USD, our suppliers could attempt to renegotiate these contracts and increase costs to us if the CNY/USD exchange rate were to change in a manner adverse to the USD. In addition, because our purchases are usually on a case by case basis, we are subject to the risk of unexpected changes in pricing or supply from these suppliers. We may also be unable to develop beneficial relationships with new vendors in the future.
We may be subject to product liability claims if people or property are harmed by the products we sell on our E-commerce web sites, which could be costly to defend and subject us to significant damage claims.
Some of the products we offer for sale on our E-commerce web sites, such as consumer electronics, toys, computers and peripherals, toiletries, beverages and clothing, may expose us to product liability claims relating to personal injury, death or property damage caused by such products, and may require us to take actions such as product recalls. Although we maintain liability insurance, we cannot be certain that our coverage will be adequate
10
for liabilities actually incurred or that insurance will continue to be available to us on economically reasonable terms, or at all. In addition, some of our vendor agreements with our suppliers do not indemnify us from product liability, and even if such agreement provides for indemnification, it may be prohibitively costly to avail ourselves of the benefits of the protection.
If we do not maintain sufficient E-commerce inventory levels, or if we are unable to deliver our E-commerce products to our customers in sufficient quantities, our E-commerce business operating results will be adversely affected.
We must be able to deliver our merchandise in sufficient quantities to meet the demands of our customers and deliver this merchandise to customers in a timely manner. We must be able to maintain sufficient inventory levels, particularly during the peak holiday selling seasons. If we fail to achieve these goals, we may be unable to meet customer demand, and our financial results will be adversely affected.
Our ThinkGeek E-commerce web site is dependent upon a single third party fulfillment and warehouse provider. The satisfaction of our E-commerce customers is highly dependent upon fulfillment of orders in a professional and timely manner, so any decrease in the quality of service offered by our fulfillment and warehouse provider will adversely affect our reputation and the growth of our E-commerce business.
Our ThinkGeek E-commerce web site’s ability to receive inbound inventory and ship completed orders efficiently to our customers is substantially dependent on a third-party contract fulfillment and warehouse provider. We currently utilize the services of Dotcom Distribution, Inc. (“Dotcom Distribution”), located in Edison, New Jersey. If Dotcom Distribution fails to meet our future distribution and fulfillment needs, our relationship with and reputation among our E-commerce customers will suffer and this will adversely affect our E-commerce growth. Additionally, if Dotcom Distribution cannot meet our distribution and fulfillment needs, particularly during the peak holiday selling seasons, or our contract with Dotcom Distribution terminates, we may fail to secure a suitable replacement or second-source distribution and fulfillment provider on comparable terms, which would adversely affect our E-commerce financial results.
Risks Related to Our Financial Results
Certain factors specific to our businesses over which we have limited or no control may nonetheless adversely impact our total revenue and financial results.
The primary factors over which we have limited or no control that may adversely impact our total revenue and financial results include the following:
- specific economic conditions relating to online advertising spending;
- the discretionary nature of our online media customers’ purchase and budget cycles;
- the size and timing of online media customer orders;
- long online media sales cycles;
- our ability to retain skilled engineering and sales personnel;
- economic conditions relating to online advertising and sponsorship, and E-commerce;
- our ability to demonstrate and maintain attractive online user demographics;
- the addition or loss of specific online advertisers or sponsors, and the size and timing of advertising or sponsorship purchases by individual customers; and
- our ability to keep our web sites operational at a reasonable cost.
If our revenue and operating results fall below our expectations, the expectations of securities analysts or the expectations of investors, the trading price of our common stock will likely be materially and adversely affected. You should not rely on the results of our business in any past periods as an indication of our future financial performance.
11
Disruptions and liquidity issues in the credit market may unfavorably impact our financial condition and results of operations
We invest excess funds in specific instruments and issuers approved for inclusion in our cash and short-term investments accounts pursuant to a written investment policy established by our Board of Directors and overseen by the Audit Committee of our Board of Directors. Our investment criteria are to invest only in top tier quality investments or federally sponsored investments. Top tier quality investments are determined by our investment advisors in conjunction with ratings of those investments provided by outside ratings agencies as well as our investment advisors’ internal credit specialists. Our cash consists of overnight instruments and instruments that will mature within ninety days after then end of our fiscal reporting period. Our investment portfolio consists of instruments that mature between ninety-one days and two years after the end of our fiscal reporting period.
Based up on recent events in the credit market, we may be impacted by the following risks:
- we may experience temporary or permanent declines in the value of certain instruments which would be reflected in our financial statements;
- we may experience rating agency downgrades of instruments we currently own which may degrade our portfolio quality and cause us to take impairment charges;
- we may not be able to reasonably value our investments if there is not a liquid resale market for those instruments.
Future changes in financial accounting standards, including pronouncements and interpretations of accounting pronouncements on revenue recognition, share-based payments, fair value measurements and financial instruments, may cause adverse unexpected revenue fluctuations and affect our reported results of operations.
From time to time, the American Institute of Certified Public Accountants (“AICPA”) and the SEC may issue accounting pronouncements, guidelines and interpretations regarding accounting pronouncements. A change in an accounting policy can have a significant effect on our reported results and may even affect our reporting of transactions completed before a change is announced. Accounting policies affecting our business, including rules relating to revenue recognition, share-based payments and financial instruments have recently been revised or are under review. In particular, new accounting pronouncements and varying interpretations of existing pronouncements on revenue recognition, share-based payments and financial instruments have occurred with frequency, may occur in the future and could impact our revenue and results of operations. There have also been recent accounting pronouncements on the reporting of changes in accounting policies and the consideration of the effects on prior year misstatements. Required changes in our application of accounting pronouncements could cause changes in our reported results of operations and our financial condition.
If we fail to adequately monitor and minimize our use of existing cash, we may need additional capital to fund continued operations beyond the next 12 months.
Although we generated cash from continuing operations during fiscal 2007 and fiscal 2006, which ended July 31, 2007 and July 31, 2006, respectively, we have historically experienced annual cash shortfalls. Unless we monitor and minimize the level of use of our existing cash, cash equivalents and marketable securities, we may require additional capital to fund continued operations beyond the next 12 months. While we believe we will not require additional capital to fund continued operations for the next 12 months, we may require additional funding within this time frame, and this additional funding, if needed, may not be available on terms acceptable to us, or at all. A slowdown in online advertising spending, as well as other factors that may arise, could affect our future capital requirements and the adequacy of our available funds. As a result, we may be required to raise additional funds through private or public financing facilities, strategic relationships or other arrangements. Any additional equity financing would likely be dilutive to our stockholders. Debt financing, if available, may involve restrictive covenants on our operations and financial condition. Our inability to raise capital when needed could seriously harm our business.
12
We have a history of losses and may incur net losses in the foreseeable future. Failure to remain profitable may materially and adversely affect the market price of our common stock and our ability to raise capital and continue operations.
Although we generated income from continuing operations during fiscal year 2007, which ended on July 31, 2007, and fiscal year 2006, which ended on July 31, 2006, we do not have a long history of profitability and have an accumulated deficit of $732.4 million as of July 31, 2007. We may incur net losses in the future. Failure to remain profitable may materially and adversely affect the market price of our common stock and our ability to raise capital and continue operations beyond the next 12 months.
Risks Related to Competition
Online competition is intense. Our failure to compete successfully could adversely affect our revenue and financial results.
The market for Internet content and services is intensely competitive and rapidly evolving. It is not difficult to enter this market and current and new competitors can launch new Internet sites at relatively low cost. We derive revenue from online advertising and sponsorships, for which we compete with various media including newspapers, radio, magazines and various Internet sites. We also derive revenue from E-commerce, for which we compete with other E-commerce companies as well as traditional, “brick and mortar” retailers. We may fail to compete successfully with current or future competitors. Moreover, increased competition could result in price reductions, reduced margins or loss of market share, any of which could have a material adverse effect on our future revenue and financial results. If we do not compete successfully for new users and advertisers, our financial results may be materially and adversely affected.
Risks Related to Intellectual Property
We are vulnerable to claims that our web sites infringe third-party intellectual property rights. Any resulting claims against us could be costly to defend or subject us to significant damages.
We expect that our web sites will increasingly be subject to infringement claims as the number of competitors in our industry segment grows and the functionality of web sites in different Internet industry segments overlaps. The scope of United States patent protection for software is not well defined and will evolve as the United States Patent and Trademark Office grants additional patents. Because patent applications in the United States are not publicly disclosed until the patent is issued, applications may have been filed that would relate to our products. In addition, we may receive patent infringement claims as companies increasingly seek to patent their software. Our developers may fail to perform patent searches and may therefore unwittingly infringe on third-party patent rights. We cannot prevent current or future patent holders or other owners of intellectual property from suing us and others seeking monetary damages or an injunction against our web site offerings. A patent holder may deny us a license or force us to pay royalties. In either event, our operating results could be seriously harmed. In addition, employees hired from competitors might utilize proprietary and trade secret information from their former employers without our knowledge, even though our employment agreements and policies clearly prohibit such practices.
Any litigation regarding our intellectual property, with or without merit, could be costly and time consuming to defend, divert the attention of our management and key personnel from our business operations and cause interruption in our web site offerings. Claims of intellectual property infringement may require us to enter into royalty and licensing agreements that may not be available on terms acceptable to us, or at all. In addition, parties making claims against us may be able to obtain injunctive or other equitable relief that could effectively block our ability to offer one or more of our web sites, or services thereon in the United States and abroad and could result in an award of substantial damages against us. Defense of any lawsuit or failure to obtain any required license could delay shipment of our products and increase our costs. If a successful claim is made against us and we fail to develop or license a substitute technology, our business, results of operations, financial condition or cash flows could be immediately and materially adversely affected.
13
If we fail to adequately protect our intellectual property rights, competitors may use our technology and trademarks, which could weaken our competitive position, reduce our revenue, and increase our costs.
We rely on a combination of copyright, trademark and trade-secret laws, employee and third-party nondisclosure agreements, and other arrangements to protect our proprietary rights. Despite these precautions, it may be possible for unauthorized third parties to copy our web sites, or services thereon or obtain and use information that we regard as proprietary to create sites that compete against ours. Some license provisions protecting against unauthorized use, copying, transfer, and disclosure of our licensed programs may be unenforceable under the laws of certain jurisdictions and foreign countries.
In addition, the laws of some countries do not protect proprietary rights to the same extent as do the laws of the United States. To the extent that we increase our international activities, our exposure to unauthorized copying and use of our web sites and proprietary information will increase.
Our collection of trademarks is important to our business. The protective steps we take or have taken may be inadequate to deter misappropriation of our trademark rights. We have filed applications for registration of and registered some of our trademarks in the United States and internationally. Effective trademark protection may not be available in every country in which we offer or intend to offer our products and services. Failure to protect our trademark rights adequately could damage our brand identity and impair our ability to compete effectively. Furthermore, defending or enforcing our trademark rights could result in the expenditure of significant financial and managerial resources.
Our success depends significantly upon our proprietary technology. Despite our efforts to protect our proprietary technology, it may be possible for unauthorized third parties to copy certain portions of our products or to reverse engineer or otherwise obtain and use our proprietary information. We do not have any software patents, and existing copyright laws afford only limited protection. In addition, we cannot be certain that others will not develop substantially equivalent or superseding proprietary technology, or that equivalent products will not be marketed in competition with our products, thereby substantially reducing the value of our proprietary rights. We cannot assure that we will develop proprietary offerings or technologies that are patentable, that any patent, if issued, would provide us with any competitive advantages or would not be challenged by third parties, or that the patents of others will not adversely affect our ability to do business. Litigation may be necessary to protect our proprietary technology. This litigation may be time-consuming and expensive.
Other Risks Related to Our Overall Business
We may be subject to claims as a result of information published on, posted on or accessible from our Internet sites, which could be costly to defend and subject us to significant damage claims.
We may be subject to claims of defamation, negligence, copyright or trademark infringement (including contributory infringement) or other claims relating to the information contained on our Internet sites, whether written by third parties or us.
Claims of defamation have been brought against online services in the past and can be costly to defend regardless of the merit of the lawsuit. Although federal legislation protects online services from some claims when third parties write the material, this protection is limited. Furthermore, the law in this area remains in flux and varies from state to state. We receive notification from time to time of potential claims, but have not been named as a party to litigation involving such claims. While no formal defamation complaints have been filed against us to date, our business could be seriously harmed if one were asserted.
Claims of infringement or other violations of intellectual property rights are common among Internet, media and technology companies because such companies often own large numbers of patents, copyrights, trademarks and trade secrets. Such claims often result in litigation, which is time consuming and can be costly to litigate, regardless of the merits of the claim or the eventual outcome of the claim. In addition, any time one of our online services links to or hosts material in which others allegedly own copyrights, we face the risk of being sued for copyright infringement or related claims. Because hosting of third party content comprises the majority of the online services that we offer, the risk of harm from such lawsuits could be substantial. Intellectual property claims are often time-consuming and may also be expensive to litigate or settle.
14
In addition to substantial defense costs, to the extent claims against us are successful, we may have to pay substantial monetary damages or discontinue one or more of our services or practices that are found to be in violation of another party’s rights. We may also acquire licenses or pay royalties in order to continue such practices, which may increase our operating expenses and have an adverse impact on our results of operations.
In September 2007, the Societe des Producteurs de Phonogrammes Francais filed copyright claims under French law against us alleging that the hosting on our SourceForge.net website of a certain third party open source software project, which may be used for so-called “peer-to-peer” file sharing, purportedly violates French law. An adverse result in this lawsuit may include an award of substantial monetary damages, costly royalty or licensing agreements or orders preventing us from offering downloads of certain third party open source software in France, which could result in a loss of revenue or an increase in operating expenses. In addition, this claim may require us to change in our business practices, which could result in a loss of revenue or otherwise harm to our business.
We make significant investments in our web sites and services offered thereon that may fail to become profitable endeavors.
We have made and will continue to make significant investments in research, development and marketing for our web sites and services offered thereon. For example, we are building a SourceForge.net Marketplace platform, including related support systems and infrastructure. Investments in new technology are inherently speculative.
Commercial success for web sites and services offered thereon depend on many factors including innovativeness, visitor support, and effective marketing. Significant revenue from our investments may not be achieved for a number of years, if at all. Moreover, our web sites and/or services offered thereon may not be profitable, and even if they are profitable, operating margins may not meet our internal expectations or the expectations of investors and securities analysts. If our web sites and/or services offered thereon fail to achieve financial results that meet public expectations, our business could be seriously harmed and our stock price will likely decline.
We may not detect weaknesses in our internal control over financial reporting in a timely manner, or at all.
Pursuant to Section 404 of the Sarbanes-Oxley Act of 2002 (“Section 404”), we are required to evaluate the effectiveness of our internal control over financial reporting as well as our disclosure controls and procedures each fiscal year. As of July 31, 2007 management has concluded that our internal control over financial reporting and our disclosure controls and procedures were effective. We will need to continue to evaluate, upgrade and enhance our internal controls. Because of inherent limitations, our internal control over financial reporting may not prevent or detect misstatements, errors or omissions, and any projections of any evaluation of effectiveness of internal controls to future periods are subject to the risk that the controls may become inadequate because of changes in conditions or that the degree of compliance with our policies or procedures may deteriorate. We cannot be certain in future periods that other control deficiencies that may constitute one or more “significant deficiencies” (as defined by the relevant auditing standards) or material weaknesses in our internal control over financial reporting will not be identified. If we fail to maintain the adequacy of our internal controls, including any failure to implement or difficulty in implementing required or new or improved controls, our business and results of operations could be harmed, the results of operations we report could be subject to adjustments, we could fail to be able to provide reasonable assurance as to our financial results or the effectiveness of our internal controls or meet our reporting obligations.
If we are unable to implement appropriate systems, procedures and controls, we may not be able to successfully offer our services and grow our business.
Our ability to successfully offer our services and grow our business requires an effective planning and management process. We updated our operations and financial systems, procedures and controls following our strategic decision to exit the hardware business, however, we still rely on manual processes and procedures that may not scale commensurately with growth. Our systems will continue to require automation, modifications and improvements to respond to current and future changes in our business. If we cannot grow our businesses, and manage that growth effectively, or if we fail to implement in a timely manner appropriate internal systems, procedures, controls and necessary automation and improvements to these systems, our businesses will suffer.
15
If we lose key personnel or fail to integrate replacement personnel successfully, our ability to manage our business could be impaired.
Our future success depends upon the continued service of our key management, technical, sales, and other critical personnel. Our officers and other key personnel are employees-at-will, and we cannot assure that we will be able to retain them. Key personnel have left our company in the past and there likely will be additional departures of key personnel from time to time in the future. The loss of any key employee could result in significant disruptions to our operations, including adversely affecting the timeliness of product releases, the successful implementation and completion of company initiatives, and the results of our operations. Competition for these individuals is intense, and we may not be able to attract, assimilate or retain highly qualified personnel. Competition for qualified personnel in our industry and the San Francisco Bay Area, as well as other geographic markets in which we recruit, is intense and characterized by increasing salaries, which may increase our operating expenses or hinder our ability to recruit qualified candidates. In addition, the integration of replacement personnel could be time consuming, may cause additional disruptions to our operations, and may be unsuccessful.
Our stock price has been volatile historically and may continue to be volatile.
The trading price of our common stock has been and may continue to be subject to wide fluctuations. During our fiscal year ended July 31, 2007, the closing sale prices of our common stock on the NASDAQ Global Market ranged from $3.32 to $5.44 per share and the closing sale price on July 31, 2007, the last trading day of our fiscal year 2007, was $3.71 per share. Our stock price may fluctuate in response to a number of events and factors, such as quarterly variations in operating results, announcements of technological innovations or new products and media properties by us or our competitors, changes in financial estimates and recommendations by securities analysts, the operating and stock price performance of other companies that investors may deem comparable to us, and news reports relating to trends in our markets or general economic conditions.
In addition, the stock market in general, and the market prices for Internet-related companies in particular, have experienced volatility that often has been unrelated to the operating performance of such companies. These broad market and industry fluctuations may adversely affect the price of our stock, regardless of our operating performance. Additionally, volatility or a lack of positive performance in our stock price may adversely affect our ability to retain key employees, all of whom have been granted stock options.
Sales of our common stock by significant stockholders may cause the price of our common stock to decrease.
Several of our stockholders own significant portions of our common stock. If these stockholders were to sell substantial amounts of their holdings of our common stock, then the market price of our common stock could be negatively impacted. The effect of such sales, or of significant portions of our stock being offered or made available for sale, could result in strong downward pressure on our stock price. Investors should be aware that they could experience significant short-term volatility in our stock if such stockholders decide to sell a substantial amount of their holdings of our common stock at once or within a short period of time.
Our networks may be vulnerable to unauthorized persons accessing our systems, which could disrupt our operations and result in the theft of our proprietary information.
A party who is able to circumvent our security measures could misappropriate proprietary information or cause interruptions or malfunctions in our Internet operations. We may be required to expend significant capital and resources to protect against the threat of security breaches or to alleviate problems caused by breaches in security.
Increasing regulation of the Internet or imposition of sales and other taxes on products or services sold or distributed over the Internet could harm our business.
The e-commerce market on the Internet is relatively new and rapidly evolving. While this is an evolving area of the law in the United States and overseas, currently there are relatively few laws or regulations that directly apply to commerce on the Internet. Changes in laws or regulations governing the Internet and e-commerce, including, without limitation, those governing an individual’s privacy rights, pricing, content, encryption, security, acceptable payment methods and quality of products or services could have a material adverse effect on our business, operating results and financial condition. Taxation of Internet commerce, or other charges imposed by government agencies or by private organizations, may also be imposed. Any of these regulations could have an adverse effect on our future sales and revenue growth.
16
Business disruptions could affect our future operating results.
Our operating results and financial condition could be materially and adversely affected in the event of a major earthquake, fire or other catastrophic event. Our corporate headquarters, the majority of our research and development activities, our third-party data center and certain other critical business operations are located in California, near major earthquake faults. A catastrophic event that results in the destruction of any of our critical business or information technology systems could severely affect our ability to conduct normal business operations and as a result our future operating results could be adversely affected.
System disruptions could adversely affect our future operating results.
Our ability to attract and maintain relationships with users, advertisers, merchants and strategic partners will depend on the satisfactory performance, reliability and availability of our Internet channels and network infrastructure. Our Internet advertising revenue relates directly to the number of advertisements delivered to our users. System interruptions or delays that result in the unavailability of Internet channels or slower response times for users would reduce the number of advertisements and sales leads delivered to such users and reduce the attractiveness of our Internet channels to users, strategic partners and advertisers or reduce the number of impressions delivered and thereby reduce revenue. In the past twelve months, some of our sites have experienced a small number of brief service interruptions. We will continue to suffer future interruptions from time to time whether due to capacity constraints, natural disasters, telecommunications failures, other system failures, rolling blackouts, viruses, hacking or other events. System interruptions or slower response times could have a material adverse effect on our revenue and financial condition.
ITEM 1B.Unresolved Staff Comments
None.
Our principal locations are as follows:
| Location | Purpose | Approximate Size (in square feet) | Expiration of Lease | |||
| United States of America | ||||||
| Fremont, California | 100% sublet through lease expiration date | 102,544 | 2010 | |||
| Fremont, California | Former corporate headquarters; Online-media sales and marketing, finance and administration, research and development | 36,767 | 2010 | |||
| Mountain View, California | New Corporate headquarters (effective October 2007); Online-media sales and marketing, finance and administration, research and development | 14,583 | 2012 | |||
| Fairfax, Virginia | ThinkGeek operations | 5,139 | 2009 |
Information with respect to this Item may be found in Note 5 of the Notes to Consolidated Financial Statements of this Annual Report on Form 10-K, which information is incorporated into this Item 3 by reference.
ITEM 4.Submission of Matters to a Vote of Security Holders
Not applicable.
17
| ITEM 5. | Market for Registrant’s Common Equity, Related Stockholder Matters and Issuer Purchases of Equity Securities |
Our common stock is traded on the NASDAQ Global Market under the symbol LNUX. As of September 28, 2007, there were 754 holders of record of our common stock. We have not declared any cash dividends since our inception and do not expect to pay any dividends in the foreseeable future. The high and low closing sales prices, as reported by NASDAQ, of our common stock are as follows:
| High | Low | ||
| Fiscal Year Ended July 31, 2007: | |||
| Fourth Quarter | $4.50 | $3.48 | |
| Third Quarter | $5.35 | $3.63 | |
| Second Quarter | $5.44 | $4.01 | |
| First Quarter | $4.64 | $3.32 | |
| Fiscal Year Ended July 31, 2006: | |||
| Fourth Quarter | $5.55 | $3.58 | |
| Third Quarter | $5.83 | $1.88 | |
| Second Quarter | $1.89 | $1.36 | |
| First Quarter | $1.80 | $1.32 |
The foregoing reflects interdealer prices without retail markup, markdown, or commissions and may not necessarily reflect actual transactions.
Stock Performance Graph
Set forth below is a line graph comparing the percentage change in the cumulative return to the stockholders of our Common Stock with the cumulative return of the NASDAQ Stock Market (U.S.) Index, the Goldman Sachs Technology Index (“GSTI”) Internet and the Standard & Poors (“S&P”) Application Software Index for the period commencing July 31, 2002 and ending on July 31, 2007. Returns for the indices are weighted based on market capitalization at the beginning of each measurement point.
COMPARISON OF 5 YEAR CUMULATIVE TOTAL RETURN*
Among SourceForge Inc., The NASDAQ Composite Index,
The S&P Application Software Index And The GSTI Internet Index
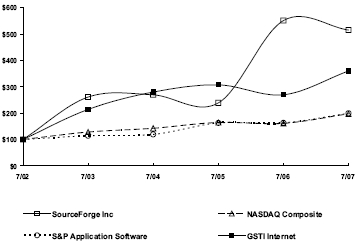
| * | The graph assumes that $100 was invested on July 31, 2002, in our Common Stock, at the closing price of $0.72 per share, and $100 was invested on July 31, 2002, in the NASDAQ Stock Market (U.S.) Index, the GSTI Internet index and the S&P Application Software Index, and that all dividends were reinvested. We have not declared or paid any dividends on our Common Stock. Stockholder returns over the indicated period should not be considered indicative of future stockholder returns. |
18
ITEM 6.Selected Consolidated Financial Data
You should read the selected consolidated financial data set forth below in conjunction with “Management’s Discussion and Analysis of Financial Condition and Results of Operations” and our financial statements and the related notes included elsewhere in this Form 10-K.
The statement of operations data for the fiscal years ended July 31, 2007, July 31, 2006 and July 31, 2005 and the balance sheet data as of July 31, 2007 and July 31, 2006 are derived from the audited financial statements and related notes appearing elsewhere in this Form 10-K. The statement of operations data for the fiscal years ended July 31, 2004 and July 31, 2003 and the balance sheet data as of July 31, 2005, July 31, 2004 and July 31, 2003 are derived from audited financial statements not appearing in this Form 10-K. The revenue, cost of revenue and operating expenses data excludes the results of our Software business, which was sold in April 2007 and our Online Images business, which was sold in December 2005. The historical results are not necessarily indicative of results that may be expected for any future period.
Summary Financial Information
(In thousands, except per share data)
| For the years ended | |||||||||||||||||
| July 31, 2007 | July 31, 2006 | July 31, 2005 | July 31, 2004 | July 31, 2003 | |||||||||||||
| Selected Consolidated Statements of Operations Data: | |||||||||||||||||
| Net revenue from continuing operations | $ | 45,599 | $ | 33,658 | $ | 23,048 | $ | 22,344 | $ | 19,730 | |||||||
| Cost of revenue from continuing operations | 25,933 | 19,337 | 14,911 | 13,182 | 10,445 | ||||||||||||
| Gross margin from continuing operations | 19,666 | 14,321 | 8,137 | 9,162 | 9,285 | ||||||||||||
| Income (loss) from continuing operations | 5,955 | 3,923 | (257 | ) | 638 | (1,660 | ) | ||||||||||
| Income (loss) from discontinued operations, netof income taxes | 2,773 | 7,039 | (4,437 | ) | (8,278 | ) | (13,222 | ) | |||||||||
| Net income (loss) | $ | 8,728 | $ | 10,962 | $ | (4,694 | ) | $ | (7,640 | ) | $ | (14,882 | ) | ||||
| Income (loss) per share from continuing operations: | |||||||||||||||||
| Basic | $ | 0.09 | $ | 0.06 | $ | — | $ | 0.01 | $ | (0.03 | ) | ||||||
| Diluted | $ | 0.09 | $ | 0.06 | $ | — | $ | 0.01 | $ | (0.03 | ) | ||||||
| Income (loss) per share from discontinuedoperations: | |||||||||||||||||
| Basic | $ | 0.04 | $ | 0.11 | $ | (0.07 | ) | $ | (0.14 | ) | $ | (0.24 | ) | ||||
| Diluted | $ | 0.04 | $ | 0.11 | $ | (0.07 | ) | $ | (0.14 | ) | $ | (0.24 | ) | ||||
| Net income (loss) per share: | |||||||||||||||||
| Basic | $ | 0.13 | $ | 0.18 | $ | (0.08 | ) | $ | (0.13 | ) | $ | (0.28 | ) | ||||
| Diluted | $ | 0.13 | $ | 0.17 | $ | (0.08 | ) | $ | (0.13 | ) | $ | (0.28 | ) | ||||
| Shares used in per share calculation: | |||||||||||||||||
| Basic | 66,254 | 62,328 | 61,454 | 59,684 | 54,110 | ||||||||||||
| Diluted | 68,489 | 64,704 | 61,454 | 59,684 | 54,110 | ||||||||||||
| Selected Balance Sheet data at year-end: | |||||||||||||||||
| Cash, cash equivalents and investments | $ | 56,640 | $ | 53,043 | $ | 38,420 | $ | 44,042 | $ | 38,847 | |||||||
| Working capital | $ | 44,103 | $ | 51,265 | $ | 34,369 | $ | 25,866 | $ | 28,825 | |||||||
| Total assets | $ | 76,863 | $ | 63,212 | $ | 47,381 | $ | 53,679 | $ | 48,495 | |||||||
| Liabilities, net of current portion | $ | 4,121 | $ | 5,693 | $ | 7,378 | $ | 9,192 | $ | 11,953 | |||||||
| Total stockholders’ equity | $ | 65,094 | $ | 49,378 | $ | 31,665 | $ | 35,770 | $ | 27,202 | |||||||
19
| ITEM 7. | Management’s Discussion and Analysis of Financial Condition and Results of Operations |
The following discussion and analysis should be read in conjunction with “Selected Consolidated Financial Data” and our financial statements and the related notes included elsewhere in this Form 10-K. This discussion contains forward-looking statements that involve risks and uncertainties. Our actual results could differ materially from those anticipated in the forward-looking statements as a result of certain factors including the risks discussed in “Item 1A. Risk Factors” and elsewhere in this Form 10-K. See Part I — Item 1 — “Special Note Regarding Forward-Looking Statements.”
Overview
We own and operate a network of media web sites, serving IT management and IT professional, software development and open source communities. Through our ThinkGeek, Inc. subsidiary, we also provide online sales of a variety of retail products of interest to these communities and other consumers. Our network of web sites include: SourceForge.net, Slashdot.org, ThinkGeek.com, Linux.com, freshmeat.net, ITManagersJournal.com and NewsForge.com. We provide a combination of user-developed content, online marketplaces and e-commerce, and intend to serve as the global technology community’s nexus for information exchange, open source software distribution and services and goods for geeks.
We were incorporated in California in January 1995 and reincorporated in Delaware in December 1999. From the date of our incorporation through October 2001, we sold Linux-based hardware systems and services under the name VA Linux Systems, Inc. On June 27, 2001, we announced our decision to exit our Linux-based hardware business. In December 2001, we changed our name to VA Software Corporation to reflect our decision to pursue our Software, Online Media, E-commerce, and Online Images businesses. In December 2005, we sold our Online Images business to Jupitermedia Corporation (“Jupitermedia”) and in April 2007, we sold our Software business to CollabNet, Inc. (“CollabNet”). On May 24, 2007, reflecting our strategic decision to focus on our network of media and e-commerce web sites, we changed our name to SourceForge, Inc. and merged with our wholly-owned subsidiary, OSTG, Inc.
As a result of the sale of our Software business to CollabNet and the sale of our Online Images business to Jupitermedia, we no longer have operations in these segments. In conjunction with the sale of our Software business, we restructured our facilities for the excess facility space formerly used by our Software business and also terminated the employment of those employees of our Software business not offered positions at CollabNet.
We currently view our business in two operating segments: Online Media and E-commerce. Our Online Media segment consists of a network of Internet web sites which connect millions of influential technology managers, professionals and enthusiasts. Our Online Media’s network of web sites include: SourceForge.net, Slashdot.org, Linux.com, freshmeat.net, ITManagersJournal.com and NewsForge.com. Our E-commerce segment sells online goods of interest to the software development and IT communities and other consumers, through our ThinkGeek.com web site.
Our network of web sites served an average of over 32 million unique visitors per month* over the past twelve months (*Source: Google Analytics and Omniture). During fiscal 2007 we served 779 million downloads from our SourceForge.net web site. Within the E-commerce segment, we continued to increase our customer base, increasing the number of orders shipped by 37% during fiscal 2007 as compared to fiscal 2006.
Our sales continue to be primarily attributable to customers located in the United States of America.
Net revenue from continuing operations increased 35% in fiscal 2007 as compared to fiscal 2006 due to revenue increases of 32% in our Online Media business and 38% in our E-commerce business. Within the Online Media segment, revenue increased due to our focus on developing innovative campaigns for targeted customers as well as increased revenue from greater levels of contextually-relevant advertising. E-commerce revenue increased due to a 37% increase in orders shipped to our customer base in this segment.
20
Net revenue from continuing operations increased 46% in fiscal 2006 as compared to fiscal 2005 due to increases of 63% in our Online Media business and 37% in our E-commerce business. Within the Online Media segment, revenue increased due to our focus on developing campaigns for targeted customers as well as increased revenue from greater levels of contextually-relevant advertising. E-commerce revenue increased due to an increase in orders from our customer base in this segment.
Our net income (loss) from continuing operations was $6.0 million, $3.9 million and ($0.3) million during fiscal years 2007, 2006 and 2005, respectively, or basic and diluted income per share of $0.09, $0.06 and $0.00, respectively.
Critical Accounting Policies
Accounting policies, methods and estimates are an integral part of the consolidated financial statements prepared by management and are based upon management’s current judgments. Those judgments are normally based on knowledge and experience with regard to past and current events and assumptions about future events. Certain accounting policies, methods and estimates are particularly sensitive because of their significance to the financial statements and because of the possibility that future events affecting them may differ markedly from management’s current judgments. While there are a number of accounting policies, methods and estimates affecting our financial statements, areas that are particularly significant include revenue recognition policies, the assessment of impairment of long-lived assets, restructuring reserves for excess facilities for non-cancelable leases, income taxes, and contingencies and litigation.
Revenue Recognition
Online Media Revenue
Online Media revenue is derived from the sale of advertising space on our various web sites. We recognize Online Media revenue in accordance with SEC Staff Accounting Bulletin (“SAB”) No. 104, “Revenue Recognition” over the period in which the advertisements are displayed, provided that persuasive evidence of an arrangement exists, no significant obligations remain, the fee is fixed or determinable, and collection of the receivable is reasonably assured. Our obligations typically include guarantees of a minimum number of “impressions” (times that an advertisement is viewed by users of our online services). To the extent that minimum guaranteed impressions are not met in the specified time frame, we do not recognize the corresponding revenue until the guaranteed impressions are achieved.
We measure revenue on barter transactions based on the recorded amount of the non-monetary asset relinquished. Our barter transactions generally consist of the exchange of advertising on our Online Media web sites in exchange for access and advertising at industry trade shows. Accordingly, we do not record any revenue as a result of these transactions.
E-commerce Revenue
E-commerce revenue is derived from the online sale of consumer goods. We recognize E-commerce revenue from the sale of consumer goods in accordance with SAB 104. Under SAB 104, product revenue is recognized when persuasive evidence of an arrangement exists, delivery has occurred, the sale price is fixed or determinable, and collectibility is reasonably assured. In general, we recognize E-commerce revenue upon the shipment of goods. We grant customers a right to return E-commerce products within 30 days of the shipment date. Such returns are recorded as incurred and have been immaterial for the periods presented.
Impairment of Long-Lived Assets
We continually evaluate whether events and circumstances have occurred that indicate the remaining estimated useful life of long-lived assets may warrant revision or that the remaining balance of long-lived assets may not be recoverable in accordance with Statement of Financial Accounting Standards “SFAS” No. 144, “Accounting for Impairment of Long-Lived Assets and for Long-Lived Assets to be Disposed of.” When factors indicate that long-lived assets should be evaluated for possible impairment, we use an estimate of the related undiscounted future cash flows over the remaining life of the long-lived assets in measuring whether they are recoverable. If the estimated
21
undiscounted future cash flows exceed the carrying value of the asset, a loss is recorded as the excess of the asset’s carrying value over fair value. Long-lived assets and certain identifiable intangible assets to be disposed of are reported at the lower of carrying amount or fair value less costs to sell.
Restructuring Costs and Other Special Charges
As discussed in Note 3 of the notes to the consolidated financial statements, we recorded significant restructuring charges in connection with exiting our hardware systems, managed services, and professional services and Linux software engineering services businesses during the fiscal years ended 2002 and 2001. A significant portion of these charges related to excess facilities, which were subject to non-cancelable leases or other costs relating to the abandonment or disposal of property and equipment. In fiscal 2005, we recorded a credit adjustment of $0.1 million to accurately reflect the current common area maintenance fees associated with the Fremont facilities. In conjunction with the sale of our Software business in fiscal 2007 we recorded an additional reserve of $0.6 million as discontinued operations expense due to the idle space resulting from this transaction. These accruals are subject to change should actual circumstances change. We will continue to evaluate and update, if applicable, these accruals quarterly.
�� Income Taxes
We estimate our income taxes in each of the jurisdictions in which we operate as part of the process for preparing our consolidated financial statements. This process involves estimating our actual current tax exposure together with assessing temporary differences resulting from differing treatment of items, such as deferred revenue, for tax and accounting purposes. These differences result in deferred tax assets or liabilities. We then assess the likelihood that our net deferred tax assets will be recovered from future taxable income and to the extent that we believe recovery is not likely, we establish a valuation allowance. In the event that we determine that realization of our deferred tax exceeds the recorded amount, we will adjust the deferred tax asset valuation allowance, which will increase income in the period in which such determination is made.
Contingencies and Litigation
We are subject to proceedings, lawsuits and other claims. We assess the likelihood of any adverse judgments or outcomes to these matters as well as ranges of probable losses. A determination of the amount of loss contingency required, if any, is assessed in accordance with SFAS No. 5, “Contingencies and Commitments” and recorded if probable after careful analysis of each individual matter. The required loss contingencies may change in the future as the facts and circumstances of each matter change.
Results of Operations
We believe that the application of accounting standards is central to a company’s reported financial position, results of operations and cash flows. We review our annual and quarterly results, along with key accounting policies, with our audit committee prior to the release of financial results. In addition, we have not entered into any significant transactions with related parties. We do not use off-balance-sheet arrangements with unconsolidated related parties, nor do we use other forms of off-balance-sheet arrangements such as research and development arrangements.
22
The following table sets forth our operating results for the periods indicated as a percentage of net revenue, represented by selected items from the consolidated statements of operations. This table should be read in conjunction with the consolidated financial statements and the accompanying notes included in this Form 10-K.
| For the Year Ended July 31, | ||||||||
| 2007 | 2006 | 2005 | ||||||
| Consolidated Statements of Operations Data: | ||||||||
| Online Media revenue | 38.4 | % | 39.3 | % | 35.3 | % | ||
| E-commerce revenue | 61.6 | 60.7 | 64.7 | |||||
| Net revenue | 100.0 | % | 100.0 | % | 100.0 | % | ||
| Online Media cost of revenue | 10.4 | 11.1 | 14.4 | |||||
| E-commerce cost of revenue | 46.5 | 46.4 | 50.3 | |||||
| Cost of revenue | 56.9 | 57.5 | 64.7 | |||||
| Gross margin | 43.1 | 42.5 | 35.3 | |||||
| Operating expenses: | ||||||||
| Sales and marketing | 13.4 | 13.1 | 15.3 | |||||
| Research and development | 8.3 | 9.0 | 8.8 | |||||
| General and administrative | 14.1 | 13.4 | 16.5 | |||||
| Impairment of Long Lived Assets | — | — | 0.4 | |||||
| Restructuring costs and other special charges | — | — | (0.4 | ) | ||||
| Total operating expenses | 35.8 | 35.5 | 40.6 | |||||
| Income (loss) from operations | 7.3 | 7.0 | (5.3 | ) | ||||
| Interest and other income, net | 6.4 | 4.9 | 4.2 | |||||
| Income (loss) from continuing operations before income taxes | 13.7 | 11.9 | (1.1 | ) | ||||
| Provision for income taxes | 0.6 | 0.3 | — | |||||
| Income (loss) from continuing operations | 13.1 | % | 11.6 | % | (1.1 | %) | ||
| Net Revenue | |||||||||||||||
| % Change Fiscal 2007 to 2006 | % Change Fiscal 2006 to 2005 | ||||||||||||||
| Year Ended July 31, | |||||||||||||||
| ($ in thousands) | 2007 | 2006 | 2005 | ||||||||||||
| Online Media revenue | 17,496 | 13,242 | 8,130 | 32 | % | 63 | % | ||||||||
| E-commerce revenue | 28,103 | 20,416 | 14,918 | 38 | % | 37 | % | ||||||||
| Net revenue | $ | 45,599 | $ | 33,658 | $ | 23,048 | 35 | % | 46 | % | |||||
Sales for the fiscal years ended 2007, 2006, and 2005 were primarily to customers located in the United States of America.
For the fiscal years ended July 31, 2007, 2006, and 2005, respectively, no one customer represented 10% or greater of net revenue. Going forward, we do not anticipate that any one customer will represent more than 10% of net revenue.
| Online Media Revenue | ||||||||||||||||||
| % Change Fiscal 2007 to 2006 | % Change Fiscal 2006 to 2005 | |||||||||||||||||
| Year Ended July 31, | ||||||||||||||||||
| ($ in thousands) | 2007 | 2006 | 2005 | |||||||||||||||
| Online Media revenue | $ | 17,496 | $ | 13,242 | $ | 8,130 | 32 | % | 63 | % | ||||||||
| Percentage of total net revenue | 38 | % | 39 | % | 35 | % | ||||||||||||
23
Online Media revenue was derived primarily from cash sales of advertising space on our various web sites as well as sponsorship-related arrangements and contextually-relevant advertising associated with advertising on these web sites.
| % Change Fiscal 2007 to 2006 | % Change Fiscal 2006 to 2005 | ||||||||||||||
| Year Ended July 31, | |||||||||||||||
| ($ in thousands) | 2007 | 2006 | 2005 | ||||||||||||
| Cash advertising | $ | 11,091 | $ | 9,193 | $ | 5,805 | 21 | % | 58 | % | |||||
| Sponsorships | 1,339 | 739 | 390 | 81 | % | 89 | % | ||||||||
| Other revenue | 5,066 | 3,310 | 1,935 | 53 | % | 71 | % | ||||||||
| Online Media revenue | $ | 17,496 | $ | 13,242 | $ | 8,130 | 32 | % | 63 | % | |||||
Cash advertising revenue is derived from advertisements or services delivered to advertisers. Such advertisements may be in the form of an advertising impression, a click, the display of a text link, the download of a file or the collection of some data, generally a lead.
The increase in cash advertising revenue during fiscal 2007 as compared to fiscal 2006 was due to the addition of new advertisers as well as additional spending by existing customers. The new customers were primarily due to the attractive demographics of the users of our web sites to these advertisers while the increased spending by existing customers was due to customers taking advantage of the programs we offer, such as our download program and custom landing page program.
The increase in cash advertising revenue during fiscal 2006 as compared to fiscal 2005 was due primarily to increased spending by existing customers and to a lesser extent the addition of new customers. The increase in spending by existing customers was due to our creating new programs, (e.g. the download and custom landing page program) for these customers.
Sponsorship revenue is derived from web marketing programs that are used to increase brand awareness. Revenue related to sponsorships is recognized ratably over the term of the marketing program or in conjunction with the delivery requirements set forth in the contract. The increase in sponsorship revenue in fiscal 2007 as compared to fiscal 2006 was primarily due to additional advertisers participating in our sponsorship programs as well as increased revenue from existing advertisers whose campaigns ran partially during fiscal 2006 and for a full year in fiscal 2007. The increase in sponsorship revenue in fiscal 2006 as compared to fiscal 2005 was due to new customers participating in our sponsorship and a fixed advertisement placement on certain of our web sites which links to a custom landing page, which is known as our powerbar, offerings.
Other revenue consists primarily of paid search, contextually-relevant advertising and referral fees. The increase in other revenue during fiscal 2007 as compared to fiscal 2006 was primarily due to an increase in revenue resulting from a higher allocation of unsold inventory to the providers of contextually-relevant advertising, including $0.7 million related to a new program with our largest partner. The increase in other revenue during fiscal 2006 as compared to fiscal 2005 was primarily due to an increase in revenue resulting from an increase in the allocation of unsold inventory and our selection of partners who are able to obtain improved yields on the inventory allocated to them.
We believe that our prominent position in serving the growing open source software, Linux markets and IT communities, along with our favorable online visitor demographics, makes us an attractive advertising vehicle for advertising customers. We expect our Online Media revenue to increase in the future as we continue to focus on increasing revenue from companies seeking to reach our web site visitors.
E-commerce Revenue
| % Change Fiscal 2007 to 2006 | % Change Fiscal 2006 to 2005 | |||||||||||||||||
| Year Ended July31, | ||||||||||||||||||
| 2007 | 2006 | 2005 | ||||||||||||||||
| E-commerce revenue (in thousands) | $ | 28,103 | $ | 20,416 | $ | 14,918 | 38 | % | 37 | % | ||||||||
| Percentage of total net revenue | 62 | % | 61 | % |
| 65 | % | |||||||||||
| Number of orders (per year) | 431,919 | 316,060 | 235,375 | 37 | % | 34 | % | |||||||||||
| Average order size (in dollars) | $ | 65.07 | $ | 64.60 | $ | 63.38 | 1 | % | 2 | % | ||||||||
24
E-commerce revenue is derived from the online sale of consumer goods, including shipping, net of any returns and allowances.
The growth in E-Commerce revenue in fiscal 2007 and 2006 as compared to the prior year was primarily due to increased consumer awareness of our web site as a result of broader product offerings, catalog marketing and media coverage of our web site which attracted a larger customer base, as well as web site enhancements, including improved search capability and customer communication features, that drove an increasing number of unique visitors to our web site. This increase in unique visitors resulted in a 37% and 34% increase in the number of orders shipped during fiscal 2007 and 2006, respectively. The average order size increased by 1% and 2% in fiscal 2007 and fiscal 2006, respectively, when compared to the prior fiscal year.
We expect E-commerce revenue to continue to grow as our E-commerce customer base grows.
Cost of Revenue/Gross Margin
| % Change Fiscal 2007 to 2006 | % Change Fiscal 2006 to 2005 | |||||||||||||||||
| Year Ended July 31, | ||||||||||||||||||
| ($ in thousands) | 2007 | 2006 | 2005 | |||||||||||||||
| Cost of revenue | $ | 25,933 | $ | 19,337 | $ | 14,911 | 34 | % | 30 | % | ||||||||
| Gross margin | 19,666 | 14,321 | 8,137 | 37 | % | 76 | % | |||||||||||
| Gross margin % | 43 | % | 43 | % | 35 | % | ||||||||||||
| Headcount | 33 | 29 | 24 | |||||||||||||||
Gross margins increased in fiscal 2007 as compared to fiscal 2006 and increased fiscal 2006 as compared to fiscal 2005. The increase in gross margins in fiscal 2007 as compared to fiscal 2006 was primarily due to the 35% increase in net revenue, substantially offset by a 34% increase in cost of revenue. The increase in gross margins in fiscal 2006 as compared to fiscal 2005 was primarily due to increased gross margins in our Online Media business primarily due to the significant increase in revenue.
Cost of Revenue/Gross Margin by Segment
Online Media Cost of Revenue/Gross Margin
| % Change Fiscal 2007 to 2006 | % Change Fiscal 2006 to 2005 | |||||||||||||||||
| Year Ended July 31, | ||||||||||||||||||
| ($ in thousands) | 2007 | 2006 | 2005 | |||||||||||||||
| Online Media cost of revenue | $ | 4,733 | $ | 3,732 | $ | 3,320 | 27 | % | 12 | % | ||||||||
| Online Media gross margin | 12,763 | 9,510 | 4,810 | 34 | % | 98 | % | |||||||||||
| Online Media gross margin % | 73 | % | 72 | % | 59 | % | ||||||||||||
Online Media cost of revenue consists of personnel costs and related overhead associated with developing the editorial content of our sites and personnel and related overhead, equipment and bandwidth associated with delivering our media content. Online Media cost of revenue includes both costs which do not vary directly with revenue (fixed costs), such as equipment, personnel and editorial costs, as well as costs which are more directly affected by revenue (variable costs), such as bandwidth for delivering content and ad-serving costs. Our fixed costs will generally not vary directly with revenue; however, they will increase to the extent that we expand or upgrade the equipment necessary to operate our network or if we add additional sites to our network of web sites. Our variable costs generally vary based on the delivery of web pages or content. To the extent that we are able to increase our revenue without increasing our fixed costs, our gross margins will increase; however, to the extent that we expand our equipment in anticipation of increased activity, we may experience decreased gross margins. During fiscal 2007, we capitalized approximately $1.8 million of internally developed software costs related to our SourceForge.net Marketplace platform. We will begin amortization of these costs over the estimated useful life of the platform when the platform is ready for its intended use, which is expected to be in the first six months of our fiscal 2008.
25
The slight increase in Online Media gross margin percentage for fiscal 2007 as compared to fiscal 2006 was due to a 32% increase in revenue, partially offset by a $1.0 million, or 27%, increase in cost of revenue. The increase in cost of revenue was primarily due to an increase in personnel costs related to providing editorial content and additional maintenance of our web sites of $0.6 million, an increase in our co-location costs of $0.3 million, including bandwidth costs to deliver content to users, and an increase in ad-serving costs of $0.1 million due primarily to higher volumes of units served and to a lesser extent to the serving of rich media ads and Really Simple Syndication (“RSS”) feeds.
The increase in Online Media gross margin percentage for fiscal 2006 as compared to fiscal 2005 was primarily due to the 63% increase in Online Media revenue, partially offset by slightly higher cost of revenue of $0.4 million. The increase in cost of revenue was primarily due to an increase in the cost of our outsourcing our advertising serving system of $0.2 million and an increase in personnel overhead costs related to editorial content of $0.2 million.
We expect Online Media cost of revenue to increase in absolute dollars resulting from depreciation expense related to network equipment purchased for our new data center, as well as the associated ongoing operating costs, and amortization of software costs associated with the development of our SourceForge.net Marketplace platform. To the extent that Online Media revenue does not increase proportionately, our Online Media gross margins may decline.
E-commerce Cost of Revenue/Gross Margin
| % Change Fiscal 2007 to 2006 | % Change Fiscal 2006 to 2005 | |||||||||||||||||
| Year Ended July 31, | ||||||||||||||||||
| ($ in thousands) | 2007 | 2006 | 2005 | |||||||||||||||
| E-commerce cost of revenue | $ | 21,200 | $ | 15,605 | $ | 11,591 | 36 | % | 35 | % | ||||||||
| E-commerce gross margin | 6,903 | 4,811 | 3,327 | 43 | % | 45 | % | |||||||||||
| E-commerce gross margin % | 25 | % | 24 | % | 22 | % | ||||||||||||
E-commerce cost of revenue consists of product costs, shipping and fulfillment costs and personnel and related overhead associated with the operations and merchandising functions.
E-commerce gross margin percentage increased slightly in fiscal 2007 as compared to fiscal 2006 primarily as a result of lower affiliate commission, due to our replacing our largest affiliate with additional direct revenue, and to a lesser extent to lower operating expenses as a percent of revenue, offset slightly by lower product margins due to product mix. The increase in E-commerce cost of revenue in absolute dollars in fiscal 2007 as compared to fiscal 2006 was primarily due to increased product costs of $3.7 million, shipping costs of $1.2 million, and fulfillment costs of $0.6 million. Increases in product costs were the result of increased E-commerce revenue levels, shipping costs were directly related to the increased volume of orders shipped and fulfillment costs were directly related to increased revenue levels.
E-commerce gross margin percentage increased in fiscal 2006 as compared to fiscal 2005. E-commerce cost of revenue in fiscal 2006 increased as compared to fiscal 2005 consistent with increased E-commerce revenue levels; however, merchandising expenses increased at a lower rate than the increase in revenue, resulting in a slight improvement in gross margin percentage. The increase in E-commerce cost of revenue in absolute dollars in fiscal 2006 as compared to fiscal 2005 was primarily due to increased product costs of $2.5 million, fulfillment costs of $0.6 million, shipping costs of $0.5 million, affiliate commission of $0.2 million and merchandising costs of $0.2 million. The increase in product costs was the result of increased E-commerce revenue levels. The increase in fulfillment costs was due to increased third party fulfillment costs resulting from an increased number of orders, increased levels of inventory managed during fiscal 2006 and increased rates charged by the fulfillment house. The increase in shipping costs was partially related to increased revenue levels and fuel surcharges, partially offset by lower shipping rates. The increase in affiliate commission is due to increased revenue levels. The increase in merchandising costs was due to increased personnel and related overhead costs to increase the range of our product offering.
We expect E-commerce cost of revenue in absolute dollars to increase proportionately with E-commerce revenue. In addition, we expect E-commerce overall gross margins will remain relatively constant.
26
Operating Expenses
Sales and Marketing Expenses
Sales and marketing expenses consist primarily of personnel and related overhead expenses, including sales commission, for personnel engaged in sales, marketing and sales support functions, as well as costs associated with advertising and promotional activities.
| % Change Fiscal 2007 to 2006 | % Change Fiscal 2006 to 2005 | |||||||||||||||||
| Year Ended July 31, | ||||||||||||||||||
| ($ in thousands) | 2007 | 2006 | 2005 | |||||||||||||||
| Sales and Marketing | $ | 6,108 | $ | 4,426 | $ | 3,523 | 38 | % | 26 | % | ||||||||
| Percentage of total net revenue | 13 | % | 13 | % | 15 | % | ||||||||||||
| Headcount | 20 | 16 | 14 | |||||||||||||||
The increase in absolute dollars spent on sales and marketing in fiscal 2007 as compared to fiscal 2006 was primarily related to an increase in personnel and related overhead expenses in our Online Media business of $0.8 million, an increase in marketing expense of $0.7 million, an increase in credit card fees of $0.3 million and an increase in recruiting fees of $0.2 million, offset by a decrease in commission expense of $0.3 million. The increase in employee expense was primarily related to an increase in headcount including $0.3 million of stock-based compensation expense. The increase in marketing expense was primarily due to market research programs for our SourceForge.net Marketplace product, our corporate name change and the branding of our new corporate name and to a lesser extent marketing catalogs for our E-commerce business. The increase in credit card fees was due to our E-commerce segment and resulted from increased sales volumes. The increase in recruiting fees related to new hires in fiscal 2007 and executive search fees paid for our Online Media business’ executives. The $0.3 million decrease in commission expense was a direct result of the Online Media sales team over achieving their quota levels in the prior fiscal year.
The increase in absolute dollars spent on sales and marketing in fiscal 2006 as compared to 2005 was primarily related to an increase in personnel and related overhead expenses of $0.5 million, an increase in commission of $0.4 million and an increase in credit card fees associated with our E-commerce business of $0.2 million, partially offset by lower recruiting fees of $0.1 million and lower discretionary marketing expenses of $0.1 million. The increase in personnel and related overhead expenses was a direct result of the additional headcount. The increase in commission expense was a direct result of increased revenue in the Online Media business. The increase in credit card fees was directly related to the year-over-year increase in our E-commerce business. Lower recruiting fees were due to fewer new hires and lower discretionary marketing expenses were primarily due to lower levels of research and online advertising in our Online Media business. The decrease in sales and marketing expenses as a percentage of net revenue was primarily due to increased revenue levels.
We believe that our sales and marketing expenses in absolute dollars will increase in the future as we increase our revenue, grow our sales force and expand our marking organization and marketing programs. However, in the future, we expect sales and marketing expenses to decrease slightly as a percentage of revenue.
Research and Development Expenses
Research and development (“R&D”) expenses consist primarily of personnel and related overhead expenses for software engineers involved in developing our Online Media and E-Commerce web sites. We expense all of our R&D costs as they are incurred; however, certain costs, including personnel related expenses, incurred in the development of our SourceForge.net Marketplace platform are capitalized.
| % Change Fiscal 2007 to 2006 | % Change Fiscal 2006 to 2005 | |||||||||||||||||
| Year Ended July 31, | ||||||||||||||||||
| ($ in thousands) | 2007 | 2006 | 2005 | |||||||||||||||
| Online Media R&D | $ | 3,531 | $ | 2,766 | $ | 1,800 | 28 | % | 54 | % | ||||||||
| E-commerce R&D | 240 | 247 | 234 | (3 | %) | 6 | % | |||||||||||
| Total Research & Development | $ | 3,771 | $ | 3,013 | $ | 2,034 | 25 | % | 48 | % | ||||||||
| Percentage of total net revenue | 8 | % | 9 | % | 9 | % | ||||||||||||
| Headcount | 28 | 24 | 16 | |||||||||||||||
27
In accordance with SOP 98-1, “Accounting for the Cost of Computer Software Developed or Obtained for Internal Use,” costs related to the planning and post implementation phases of internal use software products are recorded as an operating expense. Direct costs incurred in the development phase are capitalized and amortized over the product’s estimated useful life as charges to cost of revenue. During fiscal 2007, we capitalized $1.8 million of software development costs relating to the development of our SourceForge.net Marketplace platform.
The increase in absolute dollars in fiscal 2007 as compared to fiscal 2006 was primarily due to an increase in Online Media R&D expense. The increase in Online Media R&D expense was primarily related to increased personnel and related overhead expenses of $1.6 million and increased contractor expenses of $0.9 million, offset by the capitalization of internally developed software costs related to the development of our SourceForge.net Marketplace platform of $1.8 million. The increase in personnel and the contractor expenses were primarily related to additional resources required to support the development of the Marketplace platform as well as enhancements to our SourceForge.net web site. The decrease as a percentage of net revenue was primarily due to increased revenue levels, offset in part by higher expenses.
The increase in R&D expense in absolute dollars in fiscal 2006 compared to fiscal 2005 was primarily due to an increase in our Online Media R&D expense. The increase in Online Media expense is primarily related to increased personnel and related overhead expenses and increased contractor expenses related to enhancements of the performance of our SourceForge.net web site. Personnel and related overhead expenses, including allocated facility expenses, increased approximately $0.7 million as a result of additional employees and contractor expenses increased $0.1 million.
We expect R&D expenses to increase in absolute dollars, but not change significantly as a percentage of revenue in the future.
General and Administrative Expenses
General and administrative expenses consist of salaries and related expenses for finance and accounting, human resources and legal personnel, professional fees for accounting and legal services as well as insurance and other public company related costs.
| ($ in thousands) | Year Ended July 31, | % Change Fiscal 2007 to 2006 | % Change Fiscal 2006 to 2005 | |||||||||||||||||||
| 2007 | 2006 | 2005 | ||||||||||||||||||||
| General & Administrative | $ | 6,439 | $ | 4,502 | $ | 3,797 | 43 | % | 19 | % | ||||||||||||
| Percentage of total net revenue | 14 | % | 13 | % | 16 | % | ||||||||||||||||
| Headcount | 20 | 19 | 19 | |||||||||||||||||||
The increase in general and administrative expenses in fiscal 2007 as compared to fiscal 2006 was primarily related to stock-based compensation expense of $0.6 million, increased personnel and related overhead expenses of $0.4 million, contractor expenses of $0.2 million, higher legal fees of $0.1 million, and general and administrative expenses of $0.8, million which were previously allocated to our discontinued Software business, partially offset by lower bad debt expenses of $0.2 million due to reduced levels of bad debt write-offs in fiscal 2007. The increase in stock-based compensation was primarily related to stock options granted to executive personnel hired in the fourth quarter of fiscal 2006 and to a lesser extent to stock awards granted in fiscal 2007; the increase in personnel related expenses was primarily due to increased headcount; the contractor expenses were primarily related to temporary help to cover maternity leave and vacant positions, and the higher legal fees were due to increased legal defense costs.
The increase in general and administrative expenses in absolute dollars in fiscal 2006 as compared to fiscal 2005 was primarily related to stock-based compensation expense of $0.5 million, increased bonus expense of $0.5 million, increased personnel and related overhead expenses of $0.3 million, Board of Director expenses of $0.2 million, contractor expenses of $0.1 million, recruiting fees of $0.1 million and higher bad debt expenses of $0.2 million, resulting from increased revenue levels, partially offset by an increase in general and administrative expenses of $0.7 million which were allocated to our discontinued Software business, decreased accounting fees of $0.4 million, relating from lower fees associated with our second year of compliance with the Sarbanes-Oxley Act of 2002 and lower legal fees of $0.2 million. The decrease in general and administrative expense as a percentage of net revenue was primarily due to the increase in revenue.
28
We expect general and administrative expenses to increase from fiscal 2007 levels in absolute dollars as we will no longer allocate any general and administrative costs to our Software business, which was reported as a discontinued operation in fiscal 2007, and also as a percentage of revenue in the future.
Restructuring Costs and Other Special Charges
In fiscal 2001 and 2002, we adopted plans to exit our hardware systems and hardware-related software engineering and professional services businesses, as well as exit a sublease agreement and to reduce our general and administrative overhead costs. We exited these activities to pursue our Software, Online Media, E-commerce and Online Images businesses and reduce our operating losses to improve cash flow. We recorded restructuring charges of $168.5 million related to exiting these activities, including charges related to excess facilities from non-cancelable leases. In fiscal 2005, a minor credit adjustment of $0.1 million was recorded to accurately reflect the current common area maintenance fees associated with the Fremont facilities. In conjunction with the sale of our Software business in fiscal 2007 we recorded an additional reserve of $0.6 million as discontinued operations expense due to the idle space resulting from this transaction. The remaining accrual from non-cancelable lease payments, which continue through 2010, is based on current circumstances. These accruals are subject to change should actual circumstances change. We will continue to evaluate and update, if applicable, these accruals quarterly. As of July 31, 2007, we had an accrual of approximately $5.0 million outstanding related to these non-cancelable leases, all of which was originally included in operating expenses.
In July 2007, we entered into a 5 year lease for a new corporate headquarters facility with a proposed occupancy start date of October 2007. We have begun efforts to sub-lease our Fremont corporate headquarters. In the event that we are unable to successfully sub-lease our Fremont corporate headquarters, we will assess the need for an additional restructuring reserve for the remaining lease commitment. We have estimated the future rent and common area expense on our Fremont corporate headquarters to be in excess of $2.1 million as of July 31, 2007.
Below is a summary of the changes to the restructuring liability (in thousands):
| Balance at Beginning of Period | Charged to Costs and Expenses | Deductions | Balance at End ofPeriod | |||||||||||||||||
| For the year ended: | ||||||||||||||||||||
| July 31, 2005 | $ | 11,283 | $ | (101 | ) | $ | (3,327 | ) | $ | 7,855 | ||||||||||
| July 31, 2006 | $ | 7,855 | $ | — | $ | (1,748 | ) | $ | 6,107 | |||||||||||
| July 31, 2007 | $ | 6,107 | $ | 581 | $ | (1,640 | ) | $ | 5,048 | |||||||||||
Components of the total accrued restructuring liability are as follows (in thousands):
| Short Term | Long Term | Total Liability | |||||||||||||
| As of July 31, 2005 | $ | 1,748 | $ | 6,107 | $ | 7,855 | |||||||||
| As of July 31, 2006 | $ | 1,592 | $ | 4,515 | $ | 6,107 | |||||||||
| As of July 31, 2007 | $ | 1,781 | $ | 3,267 | $ | 5,048 | |||||||||
Share-Based Compensation Expense
In December 2004, the FASB issued SFAS 123—revised 2004 (“SFAS 123R”), “Share-Based Payment” which requires the measurement of all share-based payments to employees, including grants of employee stock options, using a fair-value-based method and the recording of such expense in our consolidated statements of income. We have adopted the provisions of SFAS 123R effective August 1, 2005 (the beginning of our fiscal 2006). Prior to August 1, 2005, we accounted for stock option expense using the provisions of SFAS 123. During fiscal 2007 and fiscal 2006, we recognized $1.4 million and $0.4 million in stock-based compensation expense from continuing operations, respectively, related to options granted to employees and directors.
On June 8, 2005, our Compensation Committee of the Board of Directors approved the vesting acceleration of certain unvested, out-of-the-money stock options outstanding under our employee stock option plans, effective June 7, 2005. Vesting was accelerated for stock options that had exercise prices greater than $1.67 per share, which
29
was the closing price of our common stock on June 7, 2005. This action was taken to reduce the impact of future compensation expense that we would otherwise be required to recognize in future consolidated statements of operations pursuant to SFAS 123R, which was applicable to us beginning in the first fiscal quarter of 2006. As a result of the acceleration, we estimate a reduction in future compensation expense by approximately $8.1 million over fiscal years 2006, 2007 and 2008.
Intangible Assets
Intangible assets are amortized on a straight-line basis over three to five years. Intangible asset amortization was insignificant in fiscal 2007, 2006 and 2005, respectively. Intangible assets at July 31, 2007 related to domain and trade names associated with our Media businesses. This balance has been included in “Other Assets” in the Consolidated Balance Sheets. We continually evaluate whether events or circumstances have occurred that indicate the remaining estimated useful lives of these intangible assets may not be recoverable. No events or circumstances occurred during fiscal 2007 that would indicate a possible impairment in the carrying value of intangible assets at July 31, 2007.
Related Party Transactions
As of July 31, 2007, we hold investments of approximately 14% of VA Linux Systems Japan, K.K.’s (“VA Linux Japan”) outstanding common stock and approximately 9% of CollabNet, Inc. (“CollabNet”) consisting of CollabNet’s Series C-1 preferred stock. VA Linux Japan acts as a reseller of our former SFEE application to customers in Japan and provides open source software related services for the Japanese market and CollabNet is a developer of software used in collaborative software development. In April 2007, CollabNet acquired the assets of our former Software business. As of July 31, 2007, we had an investment balance of $7.0 million. This balance has been included in “Other Assets” in the Consolidated Balance Sheets and is comprised as follows (in thousands):
| As ofJuly 31, | ||||||
| 2007 | 2006 | |||||
| CollabNet, Inc. | $ | 6,564 | $ | — | ||
| VA Linux Systems Japan, KK | 387 | 387 | ||||
| Total investments | $ | 6,951 | $ | 387 | ||
We continually evaluate whether events or circumstances have occurred that indicate the remaining value of these investments may be impaired. In fiscal 2007 and fiscal 2006, no impairment was recorded on these investments. Based on the valuation performed in fiscal 2005, a small impairment of $0.1 million was recorded for VA Linux Japan. There is no quoted market price for these investments; accordingly, fair value is estimated by management based on the estimated fair value of the underlying net assets or an annual appraisal performed by an independent valuation firm. The impairment has been included in “Impairment of long-lived assets” in the Consolidated Statements of Operations.
There were $0.02 million and $0.02 million of related-party receivables and $0.01 million and $0.01 million of related-party deferred revenue associated with VA Linux Japan and CollabNet as of July 31, 2007 and July 31, 2006, respectively, that are included in trade receivables and deferred revenue in the accompanying Consolidated Balance Sheets. There were $0.4 million, $0.1 million and $0.1 million of related-party revenue associated with VA Linux Japan and CollabNet for the years ended July 31, 2007, July 31, 2006 and July 31, 2005, respectively.
Interest and Other Income, Net
| Year Ended July31, | % Change Fiscal 2007 to 2006 | % Change Fiscal 2006 to 2005 | ||||||||||||||||||||
| ($ in thousands) | 2007 | 2006 | 2005 | |||||||||||||||||||
| Interest Income | $ | 2,898 | $ | 1,784 | $ | 914 | 62 | % | 95 | % | ||||||||||||
| Interest Expense | $ | (4 | ) | $ | (10 | ) | $ | (39 | ) | (60 | %) | (74 | %) | |||||||||
| Other Income (Expense) | $ | 2 | $ | (135 | ) | $ | 83 | (101 | %) | (263 | %) | |||||||||||
30
Interest income increased in fiscal 2007 as compared to fiscal 2006 as a result of increased cash balances, primarily related to cash generated from operating activities and the proceeds from the exercise of stock options, as well as increased yields on our investments due to rising interest rates.
Interest income increased in fiscal 2006 as compared to fiscal 2005 as a result of increased cash balances, primarily related to the proceeds from the sale of our Online Images business in December 2005 and to a lesser extent from the proceeds from the exercise of stock options, as well as increased yields on our investments due to rising interest rates.
We expect interest income to fluctuate as interest rates and cash balances fluctuate. For additional information, please refer to Item 7A “Quantitative and Qualitative Disclosures About Market Risk”.
Other income (expense) increased in fiscal 2007 as compared to fiscal 2006 primarily due to loss recorded on the liquidation of three of our European subsidiaries during fiscal 2006.
Other income (expense) decreased in fiscal 2006 as compared to fiscal 2005, primarily due to the loss recorded on the liquidation of three of our European subsidiaries during fiscal 2006.
Income Taxes
| Year Ended July 31, | % Change Fiscal 2007 to 2006 | % Change Fiscal 2006 to 2005 | |||||||||||||
| ($ in thousands) | 2007 | 2006 | 2005 | ||||||||||||
| Provision for income taxes | $ | 285 | $ | 92 | $ — | 210 | % | — | |||||||
As of July 31, 2007, we had $252.4 million of federal net operating loss carry-forwards available to offset future federal taxable income, which expire at various dates through fiscal year 2026. Approximately $23.2 million of federal net operating losses usage is limited pursuant to section 382 of the Internal Revenue Code due to certain changes in our ownership which occurred between 1996 and 1999, and a change in ownership resulting from our June 2000 acquisition of Andover.net. We also have California net operating loss carryforwards of approximately $75.5 million to offset future California taxable income, which expire at various dates through fiscal year 2016. We have not recognized any benefit from these net operating loss carry-forwards because a valuation allowance has been recorded for the total deferred tax assets as a result of uncertainties regarding realization of the assets based on our limited history of profitability and the uncertainty of future profitability.
Liquidity and Capital Resources
| Year Ended July 31, | |||||||||||||
| ($ in thousands) | 2007 | 2006 | 2005 | ||||||||||
| Net cash provided by (used in): | |||||||||||||
| Continuing operations | |||||||||||||
| Operating activities | $ | 4,213 | $ | 1,969 | $ | (2,263 | ) | ||||||
| Investing activities | (12,620 | ) | (2,775 | ) | (2,673 | ) | |||||||
| Financing activities | 4,219 | 5,688 | 552 | ||||||||||
| Effect of exchange rate changes on cash and cash equivalents | — | (16 | ) | (69 | ) | ||||||||
| Discontinued operations | (2,208 | ) | 7,389 | (4,013 | ) | ||||||||
| Net increase (decrease) in cash and cash equivalents | $ | (6,396 | ) | $ | 12,255 | $ | (8,466 | ) | |||||
Our principal sources of cash as of July 31, 2007 were our existing cash, cash equivalents, short-term and long-term investments of $56.6 million, which excludes restricted cash of $1.0 million (refer to financing activities below for discussion on restricted cash). Cash and cash equivalents decreased by $6.4 million and we had net purchases of securities of $10.0 million during fiscal 2007, resulting in an overall increase in cash and investments of $3.6 million in fiscal 2007. This overall increase was primarily due to cash generated from continuing operations of $4.2 million and proceeds from the issuance of common stock upon the exercise of stock of options of $4.2 million, offset in part by capitalized internally developed software of $1.8 million and purchases of property and equipment of $0.8 million and cash used in discontinued operations of $2.2 million.
31
Our net cash generated during the year ended July 31, 2006 was $12.3 million and we had net purchases of securities of $2.3 million during fiscal 2006, resulting in an overall increase in cash and investments of $14.6 million in fiscal 2006. This overall increase was primarily due to net cash proceeds from the sale of our Online Images business segment of $8 million, cash generated from continuing operations of $2.0 million and cash proceeds from the issuance of common stock upon the exercise of stock options of $5.7 million, offset by cash used in discontinued operations of $1.6 million and purchases of property and equipment of $0.5 million.
Our net use of cash during the year ended July 31, 2005 was primarily due to cash used in operations and payments related to idle facilities and capital expenditures.
Discontinued Operations
Cash flow from discontinued operations has been reported separately for operating, investing and financing activities in the Consolidated Statements of Cash Flows.
The absence of cash flows from discontinued operations in our on-going operations is not expected to materially impact our future cash flow or liquidity due to the relatively modest amounts historically contributed by the discontinued operations.
Operating Activities
Net cash provided by operating activities of $4.2 million for fiscal 2007 was primarily due to income from continuing operations of $6.0 million, stock-based compensation of $1.4 million, an increase in accounts payable of $1.3 million, depreciation and amortization of $0.6 million and an increase in deferred revenue of $0.4 million. This was partly offset by cash used for increases in accounts receivable of $2.5 million, inventory of $0.9 million and prepaid expenses and other assets of $0.7 million and decreases in restructuring liabilities of $1.6 million and other long-term liabilities of $0.3 million.
The cash provided by accounts payable is the result of higher levels of inventory received and higher marketing expenses in the fourth quarter of fiscal 2007 and deferred revenue is primarily due to a program credit on an Online Media agreement entered into in fiscal 2007. The cash used for accounts receivable is primarily due to higher revenue and slower collection efforts in our Online Media business; inventory is primarily the result of higher inventory levels as we broaden our product range and we maintain higher inventory levels as we expand our inventory sources outside of the United States which require longer lead times; prepaid expenses and other current assets is due to higher levels of prepayments for inventory related to our E-commerce business, resulting from our increased purchases of product from suppliers located in countries where deposits or prepayments are customarily required to order product; restructuring liabilities is due to cash payments on facilities included in the restructuring reserve; and other long-term liabilities is due to a reduction in deferred rent expense.
Net cash provided by operating activities of $2.0 million for fiscal 2006 was primarily due to income from continuing operations of $3.9 million, stock-based compensation of $0.4 million and depreciation and amortization of $0.4 million. This was partly offset by cash used for increases in accounts receivable of $0.5 million and inventory of $0.4 million and decreases in restructuring liabilities of $1.7 million and accounts payable of $0.4 million. The cash used for accounts receivable is primarily due to increased revenue in our Online Media business; inventory is primarily the result of increased volume in our E-Commerce segment and to a lesser extent purchases of long lead time inventory; restructuring liabilities is due to cash payments on facilities included in the restructuring reserve; and accounts payable is the result of reduced levels of accrued expenses.
Net cash used in operating activities of $2.3 million for fiscal 2005 was primarily due to loss from continuing operations of $0.3 million, a decrease in accrued restructuring liabilities of $3.3 million and an increase in accounts receivable of $0.4 million. This was partly offset by cash provided by depreciation and amortization of $0.8 million, a decrease in inventory of $0.2 million and an increase in accrued liabilities and other of $0.9 million.
The cash used for accounts receivable is primarily due to increased revenue in our Online Media business and restructuring liabilities is due to cash payments on facilities included in the restructuring reserve. The cash provided by inventory is primarily due to decreased purchasing levels and increased revenue and accrued liabilities is primarily due to accounting accruals related to the Company’s Sarbanes-Oxley efforts.
32
We expect that the above cash utilization trends will continue as we grow our business and pay off our remaining lease obligations related to excess facilities and to the extent we do not successfully sub-lease our Fremont corporate headquarters, which we vacated in October 2007, the additional lease obligation on this facility.
Investing Activities
Our investing activities primarily include purchases of property and equipment and purchases and sales of marketable securities.
Cash usage related to purchases of property and equipment in fiscal 2007 of $2.6 million, was primarily due to internally developed software related to our SourceForge.net Marketplace platform of $1.8 million and to a lesser extent additional equipment purchases. Cash usage related to purchases of property and equipment in fiscal 2006 and 2005 was primarily related to additional equipment purchases.
In fiscal 2005, we generated $0.5 million of cash from investing activities due to a reduction in restricted cash resulting from a reduction in our outstanding letter of credit.
Financing Activities
Our financing activities have primarily included cash proceeds from the sale of our common stock through employee benefit plans.
For the fiscal years ended July 31, 2007, July 31, 2006 and July 31, 2005, respectively, exchange rate changes had an immaterial effect on cash and cash equivalents. We expect that exchange rate changes will have an immaterial effect on cash and cash equivalents in the near future due to our focus on U.S.-based business.
As of July 31, 2007 and July 31, 2006, we had an outstanding letter of credit of approximately $1.0 million, related to the corporate facility lease. The amount related to this letter of credit is recorded in the “Restricted cash” section of the consolidated balance sheet. The outstanding letter of credit will decline as the Company meets certain financial covenants.
Our liquidity and capital requirements depend on numerous factors, including our investment in inventory to support the E-commerce business, market acceptance of our online products, the resources we devote to developing, marketing, selling and supporting our online products, the timing and expense associated with expanding our distribution channels, potential acquisitions and other factors.
We expect to devote capital resources to continue our research and development efforts, to invest in our sales, support, marketing and product development organizations, to enhance and introduce marketing programs, to invest in capital projects to continue to support our operations and build out of our SourceForge.net Marketplace platform and related support systems and infrastructure, and for other general corporate activities. We believe that our existing cash balances will be sufficient to fund our operations through fiscal 2008 under our current business strategy.
Contractual Obligations
The contractual obligations presented in the table below represent our estimates of future payments under fixed contractual obligations and commitments. Changes in our business needs, cancellation provisions and other factors may result in actual payments differing from the estimates. We cannot provide certainty regarding the timing and amounts of payments. The following table summarizes our fixed contractual obligations and commitments as of July 31, 2007 (in thousands):
| Fiscal years ending July 31, | ||||||||||||||||
| Total | 2008 | 2009 and 2010 | 2011 and 2012 | |||||||||||||
| Gross Operating Lease Obligations | $ | 13,654 | $ | 4,137 | $ | 8,176 | $ | 1,236 | ||||||||
| Sublease Income | 3,098 | 1,064 | 2,034 | — | ||||||||||||
| Net Operating Lease Obligations | 10,556 | 3,073 | 6,142 | 1,236 | ||||||||||||
| Purchase Obligations | 2,777 | 2,777 | — | — | ||||||||||||
| Total Obligations | $ | 13,333 | $ | 5,850 | $ | 6,142 | $ | 1,236 | ||||||||
33
Sublease income represents our expectations of payments to be received from our subtenants. As of July 31, 2007, our excess facility is sublet through the remainder of its lease term. In July 2007, we entered into a 5 year lease for a new corporate headquarters facility with a proposed occupancy date of October 2007. We have begun efforts to sub-lease our Fremont corporate headquarters. In the event that we are unable to successfully sub-lease our Fremont corporate headquarters, we will be required to pay the remaining lease amounts as they become due and may also record an expense in our statement of operations in the period in which the facility is vacated.
Financial Risk Management
As a primarily U.S.-centric company, we face limited exposure to adverse movements in foreign currency exchange rates and we do not engage in hedging activity. We do not anticipate significant currency gains or losses in the near term. These exposures may change over time as business practices evolve and could have a material adverse impact on our financial results.
We maintain investment portfolio holdings of various issuers, types and maturities. These securities are classified as available-for-sale, and consequently are recorded on the consolidated balance sheet at fair value with unrealized gains and losses reported as a separate component of accumulated other comprehensive income (loss). These securities are not leveraged and are held for purposes other than trading.
Recent Accounting Pronouncements
In July 2006, the FASB issued Financial Interpretation No. 48, “Accounting for Uncertainty in Income Taxes-an interpretation of FASB Statement No. 109” (“FIN 48”), which is a change in accounting for income taxes. FIN 48 specifies how tax benefits for uncertain tax positions are to be recognized, measured, and derecognized in financial statements; requires certain disclosures of uncertain tax matters; specifies how reserves for uncertain tax positions should be classified on the balance sheet; and provides transition and interim period guidance, among other provisions. FIN 48 is effective for fiscal years beginning after December 15, 2006. We do not expect the adoption of FIN 48 will have a material impact on our financial position or results of operations.
In September 2006, the FASB issued SFAS No. 157 (“SFAS 157”), “Fair Value Measurements.” Among other requirements, SFAS No. 157 defines fair value and establishes a framework for measuring fair value and also expands disclosure about the use of fair value to measure assets and liabilities. SFAS No. 157 is effective beginning the first fiscal year that begins after November 15, 2007. We do not believe that the adoption of SFAS No. 157 will have a material impact on our financial position or results of operations.
In September 2006, the SEC issued Staff Accounting Bulletin No. 108, “Considering the Effects of Prior Year Misstatements When Quantifying Misstatements in Current Year Financial Statements” (“SAB 108”), which provides interpretive guidance on how the effects of the carryover or reversal of prior year misstatements should be considered in quantifying a current year misstatement. The guidance is applicable for fiscal years ending after November 15, 2006. We have applied the provisions of SAB 108 beginning in the first quarter of fiscal 2007 and there was no impact to our financial position or results of operations.
In February 2007, the FASB issued SFAS No. 159 (“SFAS 159”), “The Fair Value Option for Financial Assets and Financial Liabilities,” SFAS No. 159 amends SFAS 115 and permits fair value measurement of financial instruments and certain other items. SFAS No. 159 is effective beginning the first fiscal year that begins after November 15, 2007. We are currently evaluating the impact of SFAS No. 159 on our financial position and results of operations.
ITEM 7A. Quantitative and Qualitative Disclosures About Market Risk
The primary objective of our investment activities is to preserve principal while at the same time maximizing the income we receive from our investments without significantly increasing risk. Some of the securities that we have invested in may be subject to market risk. This means that a change in prevailing interest rates may cause the principal amount of the investment to fluctuate.
For example, if we hold a security that was issued with a fixed interest rate at the then-prevailing rate and the prevailing interest rate later rises, the principal amount of our investment will probably decline. To minimize this risk, we maintain a portfolio of cash equivalents, short-term investments and long-term investments in a variety of
34
securities, including commercial paper, money market funds and government and non-government debt securities. In general, money market funds are not subject to market risk because the interest paid on such funds fluctuates with the prevailing interest rate.
The following table presents the amounts of our cash equivalents, short-term investments and long-term investments (in thousands) that are subject to market risk and weighted-average interest rates, categorized by expected maturity dates, as of July 31, 2007. This table does not include money market funds because those funds are not subject to market risk.
| (in thousands) | Maturing within three months | Maturing within three months to one year | Maturing greater than one year | |||||||||||||||
| As of July 31, 2007: | ||||||||||||||||||
| Cash equivalents | $ | 2,822 | ||||||||||||||||
| Weighted-average interest rate | 5.31 | % | ||||||||||||||||
| Short-term investments | $ | 34,412 | ||||||||||||||||
| Weighted-average interest rate | 5.29 | % | ||||||||||||||||
| Long-term investments | $ | 13,871 | ||||||||||||||||
| Weighted-average interest rate | 5.27 | % | ||||||||||||||||
We have operated primarily in the United States, and virtually all sales have been made in U.S. dollars. Accordingly, we have not had any material exposure to foreign currency rate fluctuations.
The estimated fair value of our cash, cash equivalents and investments approximate carrying value. We do not currently hold any derivative instruments and do not engage in hedging activities.
35
ITEM 8. Consolidated Financial Statements and Supplementary Data
TABLE OF CONTENTS
All other schedules are omitted because they are not applicable, not required, or because the required information is included in the consolidated financial statements or notes thereto.
36
REPORT OF STONEFIELD JOSEPHSON, INC.
INDEPENDENT REGISTERED PUBLIC ACCOUNTING FIRM
To The Board of Directors and Stockholders of SourceForge, Inc.:
We have audited the accompanying consolidated balance sheet of SourceForge, Inc. (the “Company”) as of July 31, 2007 and July 31, 2006, and the related consolidated statements of operations and other comprehensive income (loss), stockholders’ equity, and cash flows for the two years in the period ended July 31, 2007. Our audits also included the financial statement schedule listed in the Index at Item 15(a). These consolidated financial statements and schedule are the responsibility of the Company’s management. Our responsibility is to express an opinion on these financial statements and schedule based on our audits.
We conducted our audits in accordance with the standards of the Public Company Accounting Oversight Board (United States). Those standards require that we plan and perform the audit to obtain reasonable assurance about whether the financial statements and schedule are free of material misstatement. An audit includes examining, on a test basis, evidence supporting the amounts and disclosures in the financial statements and schedule. An audit also includes assessing the accounting principles used and significant estimates made by management, as well as evaluating the overall presentation of the financial statements and schedule. We believe that our audits provide a reasonable basis for our opinion.
In our opinion, the consolidated financial statements referred to above present fairly, in all material respects, the financial position of SourceForge, Inc. as of July 31, 2007 and July 31, 2006, and the results of its operations and its cash flows for the two years in the period ended July 31, 2007, in conformity with accounting principles generally accepted in the United States. Also, in our opinion, the financial statement schedule as of July 31, 2007 and July 31, 2006 for the two years in the period ended July 31, 2007, when considered in relation to the basic financial statements taken as a whole, presents fairly, in all material respects, the information set forth therein.
We also have audited, in accordance with the standards of the Public Company Accounting Oversight Board (United States), the effectiveness of the SourceForge, Inc.’s internal control over financial reporting as of July 31, 2007, based on criteria established inInternal Control—Integrated Framework issued by the Committee of Sponsoring Organizations of the Treadway Commission (COSO) and our report dated October 8, 2007 expressed an unqualified opinions on management’s assessment of internal control over financial reporting and an unqualified opinion on the effectiveness of internal control over financial reporting.
We have also audited the adjustments to the July 31, 2005 consolidated financial statements to retrospectively apply the change in accounting, as described in Note 11. In our opinion, such adjustments are appropriate and have been properly applied. We were not engaged to audit, review or apply any procedures to the 2005 financial statements of the Company other than with respect to the adjustments and, accordingly, we do not express an opinion or any other form of assurance on the 2005 financial statements taken as a whole.
/s/ Stonefield Josephson, Inc.
San Francisco, California
October 8, 2007
37
REPORT OF STONEFIELD JOSEPHSON, INC.
INDEPENDENT REGISTERED PUBLIC ACCOUNTING FIRM
To the Board of Directors and Stockholders of SourceForge, Inc.:
We have audited management’s assessment, included in the accompanying “Management’s Report on Internal Control over Financial Reporting”, that SourceForge, Inc. maintained effective internal control over financial reporting as of July 31, 2007, based on criteria established in Internal Control— Integrated Framework issued by the Committee of Sponsoring Organizations of the Treadway Commission (COSO). SourceForge, Inc.’s management is responsible for maintaining effective internal control over financial reporting and for its assessment of the effectiveness of internal control over financial reporting. Our responsibility is to express an opinion on management’s assessment and an opinion on the effectiveness of the company’s internal control over financial reporting based on our audit.
We conducted our audit in accordance with the standards of the Public Company Accounting Oversight Board (United States). Those standards require that we plan and perform the audit to obtain reasonable assurance about whether effective internal control over financial reporting was maintained in all material respects. Our audit included obtaining an understanding of internal control over financial reporting, evaluating management’s assessment, testing and evaluating the design and operating effectiveness of internal control, and performing such other procedures as we considered necessary in the circumstances. We believe that our audit provides a reasonable basis for our opinion.
A company’s internal control over financial reporting is a process designed to provide reasonable assurance regarding the reliability of financial reporting and the preparation of financial statements for external purposes in accordance with generally accepted accounting principles. A company’s internal control over financial reporting includes those policies and procedures that (1) pertain to the maintenance of records that, in reasonable detail, accurately and fairly reflect the transactions and dispositions of the assets of the company; (2) provide reasonable assurance that transactions are recorded as necessary to permit preparation of financial statements in accordance with generally accepted accounting principles, and that receipts and expenditures of the company are being made only in accordance with authorizations of management and directors of the company; and (3) provide reasonable assurance regarding prevention or timely detection of unauthorized acquisition, use, or disposition of the company’s assets that could have a material effect on the financial statements.
Because of its inherent limitations, internal control over financial reporting may not prevent or detect misstatements. Also, projections of any evaluation of effectiveness to future periods are subject to the risk that controls may become inadequate because of changes in conditions, or that the degree of compliance with the policies or procedures may deteriorate.
In our opinion, management’s assessment that SourceForge, Inc. maintained effective internal control over financial reporting as of July 31, 2007, is fairly stated, in all material respects, based on criteria established in Internal Control—Integrated Framework issued by the Committee of Sponsoring Organizations of the Treadway Commission (COSO). Also, in our opinion, SourceForge, Inc. maintained, in all material respects, effective internal control over financial reporting as of July 31, 2007, based on criteria established in Internal Control—Integrated Framework issued by the Committee of Sponsoring Organizations of the Treadway Commission (COSO).
We also have audited, in accordance with the standards of the Public Company Accounting Oversight Board (United States), the balance sheet and the related statements of income and comprehensive loss, stockholders’ equity and cash flows of SourceForge, Inc. as of July 31, 2007 and July 31, 2006 and our report dated October 8, 2007 expressed an unqualified opinion thereon.
| /s/ Stonefield Josephson, Inc. |
| San Francisco, California |
| October 8, 2007 |
38
REPORT OF BDO SEIDMAN, LLP
INDEPENDENT REGISTERED PUBLIC ACCOUNTING FIRM
To The Board of Directors and Stockholders of SourceForge, Inc. (formerly known as VA Software Corporation):
We have audited, before the effects of the adjustments to retrospectively account for the software business as a discontinued operation as described in Notes 1 and 11, the accompanying consolidated statements of operations and other comprehensive income (loss), stockholders’ equity, and cash flows of SourceForge, Inc. (formerly known as VA Software Corporation) (the “Company”) for the year ended July 31, 2005. We have also audited the financial statement schedule listed in the Index at Item 15(a) as of and for the year ended July 31, 2005. The 2005 financial statements and schedule before the effects of the adjustments discussed in Notes 1 and 11 are not presented herein. These financial statements and schedule are the responsibility of the Company’s management. Our responsibility is to express an opinion on these financial statements and schedule based on our audits.
We conducted our audit in accordance with the standards of the Public Company Accounting Oversight Board (United States). Those standards require that we plan and perform the audit to obtain reasonable assurance about whether the financial statements and schedule are free of material misstatement. An audit includes examining, on a test basis, evidence supporting the amounts and disclosures in the financial statements and schedule. An audit also includes assessing the accounting principles used and significant estimates made by management, as well as evaluating the overall presentation of the financial statements and schedule. We believe that our audit provides a reasonable basis for our opinion.
In our opinion, the consolidated financial statements referred to above, before the effects of the adjustments to retrospectively account for the software business as a discontinued operation as described in Notes 1 and 11, present fairly, in all material respects, the results of operations and cash flows of SourceForge, Inc. (formerly known as VA Software Corporation) for the year ended July 31, 2005, in conformity with accounting principles generally accepted in the United States.
Also, in our opinion, the financial statement schedule as of and for the year ended July 31, 2005, before the effects of the adjustments to retrospectively account for the software business as a discontinued operation as described in Notes 1 and 11, presents fairly in all material respects the information set forth therein.
We were not engaged to audit, review, or apply any procedures to the adjustments to retrospectively account for the software business as a discontinued operation as described in Notes 1 and 11 and, accordingly, we do not express an opinion or any other form of assurance about whether the adjustments are appropriate and have been properly applied. Those adjustments were audited by Stonefield Josephson, Inc.
/s/ BDO Seidman, LLP
San Jose, California
October 31, 2005
39
SOURCEFORGE, INC.
CONSOLIDATED BALANCE SHEETS
(In thousands, except per share information)
| July 31, | July 31, | |||||||
| 2007 | 2006 | |||||||
| ASSETS | ||||||||
| Current assets: | ||||||||
| Cash and cash equivalents | $ | 8,357 | $ | 14,753 | ||||
| Short-term investments | 34,412 | 37,138 | ||||||
| Accounts receivable, net of allowance of $76 and $122, respectively | 5,288 | 2,822 | ||||||
| Related party receivables | 21 | �� | 21 | |||||
| Inventories | 2,052 | 1,091 | ||||||
| Prepaid expenses and other current assets | 1,529 | 863 | ||||||
| Current assets of discontinued operations | 92 | 2,718 | ||||||
| Total current assets | 51,751 | 59,406 | ||||||
| Property and equipment, net | 2,640 | 546 | ||||||
| Long-term investments | 13,871 | 1,152 | ||||||
| Restricted cash, non-current | 1,000 | 1,000 | ||||||
| Other assets | 7,601 | 1,027 | ||||||
| Other assets of discontinued operations | — | 81 | ||||||
| Total assets | $ | 76,863 | $ | 63,212 | ||||
| LIABILITIES AND STOCKHOLDERS’ EQUITY | ||||||||
| Current liabilities: | ||||||||
| Accounts payable | $ | 2,348 | $ | 1,096 | ||||
| Accrued restructuring liabilities, current portion | 1,781 | 1,592 | ||||||
| Deferred revenue (including $14 and $14 related party deferred revenue, | ||||||||
| respectively) | 733 | 293 | ||||||
| Accrued liabilities and other | 2,786 | 2,378 | ||||||
| Current liabilities of discontinued operations | — | 2,782 | ||||||
| Total current liabilities | 7,648 | 8,141 | ||||||
| Accrued restructuring liabilities, net of current portion | 3,267 | 4,515 | ||||||
| Other long-term liabilities | 854 | 1,114 | ||||||
| Non-current liabilities of discontinued operations | — | 64 | ||||||
| Total liabilities | 11,769 | 13,834 | ||||||
| Commitments and contingencies (Note 4) | ||||||||
| Stockholders’ equity: | ||||||||
| Common stock , $0.001 par value; authorized -- 250,000; issued and | ||||||||
| outstanding -- 69,160 shares in 2007 and 64,997 shares in 2006 | 69 | 65 | ||||||
| Treasury stock -- 490 shares in 2007 and 2006 | (4 | ) | (4 | ) | ||||
| Additional paid-in capital | 797,422 | 790,437 | ||||||
| Accumulated other comprehensive loss | (26 | ) | (25 | ) | ||||
| Accumulated deficit | (732,367 | ) | (741,095 | ) | ||||
| Total stockholders’ equity | 65,094 | 49,378 | ||||||
| Total liabilities and stockholders’ equity | $ | 76,863 | $ | 63,212 | ||||
The accompanying notes are an integral part of these consolidated financial statements.
40
SOURCEFORGE, INC.
CONSOLIDATED STATEMENTS OF OPERATIONS AND OTHER COMPREHENSIVE INCOME (LOSS)
(In thousands, except per share amounts)
| Year Ended July 31, | ||||||||||||
| 2007 | 2006 | 2005 | ||||||||||
| Net revenue: | ||||||||||||
| Online Media revenue, including $361, $64 and $86 of related | ||||||||||||
| party revenue, respectively | $ | 17,496 | $ | 13,242 | $ | 8,130 | ||||||
| E-commerce revenue | 28,103 | 20,416 | 14,918 | |||||||||
| Total net revenue | 45,599 | 33,658 | 23,048 | |||||||||
| Cost of revenue: | ||||||||||||
| Online Media cost of revenue | 4,733 | 3,732 | 3,320 | |||||||||
| E-commerce cost of revenue | 21,200 | 15,605 | 11,591 | |||||||||
| Total cost of revenue | 25,933 | 19,337 | 14,911 | |||||||||
| Gross margin | 19,666 | 14,321 | 8,137 | |||||||||
| Operating expenses: | ||||||||||||
| Sales and marketing | 6,108 | 4,426 | 3,523 | |||||||||
| Research and development | 3,771 | 3,013 | 2,034 | |||||||||
| General and administrative | 6,439 | 4,502 | 3,797 | |||||||||
| Impairment of long lived assets | — | — | 87 | |||||||||
| Restructuring costs and other special charges | — | — | (101 | ) | ||||||||
| Amortization of intangible assets | 4 | 4 | 12 | |||||||||
| Total operating expenses | 16,322 | 11,945 | 9,352 | |||||||||
| Income (loss) from operations | 3,344 | 2,376 | (1,215 | ) | ||||||||
| Interest income | 2,898 | 1,784 | 914 | |||||||||
| Interest expense | (4 | ) | (10 | ) | (39 | ) | ||||||
| Other income (expense), net | 2 | (135 | ) | 83 | ||||||||
| Income (loss) from continuing operations before income taxes | 6,240 | 4,015 | (257 | ) | ||||||||
| Provision for income taxes | 285 | 92 | — | |||||||||
| Income (loss) from continuing operations | 5,955 | 3,923 | (257 | ) | ||||||||
| Discontinued operations: | ||||||||||||
| Loss from operations, net of taxes | (2,801 | ) | (2,278 | ) | (4,437 | ) | ||||||
| Gain on sale, net of taxes | 5,574 | 9,317 | — | |||||||||
| Income (loss) from discontinued operations | 2,773 | 7,039 | (4,437 | ) | ||||||||
| Net income (loss) | $ | 8,728 | $ | 10,962 | $ | (4,694 | ) | |||||
| Other comprehensive income (loss): | ||||||||||||
| Unrealized gain (loss) on marketable securities and investments | (1 | ) | 104 | 9 | ||||||||
| Foreign currency translation (loss) gain | — | 102 | (69 | ) | ||||||||
| Comprehensive income (loss) | $ | (1 | ) | $ | 206 | $ | (60 | ) | ||||
| Income per share from continuing operations: | ||||||||||||
| Basic | $ | 0.09 | $ | 0.06 | $ | — | ||||||
| Diluted | $ | 0.09 | $ | 0.06 | $ | — | ||||||
| Income (loss) per share from discontinued operations: | ||||||||||||
| Basic | $ | 0.04 | $ | 0.11 | $ | (0.07 | ) | |||||
| Diluted | $ | 0.04 | $ | 0.11 | $ | (0.07 | ) | |||||
| Net income (loss) per share: | ||||||||||||
| Basic | $ | 0.13 | $ | 0.18 | $ | (0.08 | ) | |||||
| Diluted | $ | 0.13 | $ | 0.17 | $ | (0.08 | ) | |||||
| Shares used in per share calculations: | ||||||||||||
| Basic | 66,254 | 62,328 | 61,454 | |||||||||
| Diluted | 68,489 | 64,704 | 61,454 | |||||||||
The accompanying notes are an integral part of these consolidated financial statements.
41
SOURCEFORGE, INC.
CONSOLIDATED STATEMENTS OF STOCKHOLDERS’ EQUITY
(In thousands)
| Accumulated | |||||||||||||||||||||||||||||||||||||
| Additional | Other | Total | |||||||||||||||||||||||||||||||||||
| Common Stock | Treasury | Paid-in | Comprehensive | Accumulated | Stockholders’ | ||||||||||||||||||||||||||||||||
| Shares | Amount | Stock | Capital | Income (Loss) | Deficit | Equity | |||||||||||||||||||||||||||||||
| BALANCE AT JULY 31, 2004 | 61,185 | $ | 62 | $ | (4 | ) | $ | 783,246 | $ | (171 | ) | $ | (747,363 | ) | $ | 35,770 | |||||||||||||||||||||
| Issuance of common stock | 474 | — | — | 595 | — | — | 595 | ||||||||||||||||||||||||||||||
| Issuance costs associated with Private Placement | — | — | — | (14 | ) | — | — | (14 | ) | ||||||||||||||||||||||||||||
| Acceleration of stock options related to terminations | — | — | — | 68 | — | — | 68 | ||||||||||||||||||||||||||||||
| Foreign currency translation adjustment and unrealized | |||||||||||||||||||||||||||||||||||||
| gain or loss on marketable securities | — | — | — | — | (60 | ) | — | (60 | ) | ||||||||||||||||||||||||||||
| Net loss | — | — | — | — | — | (4,694 | ) | (4,694 | ) | ||||||||||||||||||||||||||||
| BALANCE AT JULY 31, 2005 | 61,659 | 62 | (4 | ) | 783,895 | (231 | ) | (752,057 | ) | 31,665 | |||||||||||||||||||||||||||
| Issuance of common stock | 2,848 | 3 | — | 5,696 | — | — | 5,699 | ||||||||||||||||||||||||||||||
| Stock based compensation | — | — | — | 740 | — | — | 740 | ||||||||||||||||||||||||||||||
| Tax benefits associated with exercise of stock options | — | — | — | 106 | — | — | 106 | ||||||||||||||||||||||||||||||
| Foreign currency translation adjustment and unrealized | |||||||||||||||||||||||||||||||||||||
| gain or loss on marketable securities | — | — | — | — | 206 | — | 206 | ||||||||||||||||||||||||||||||
| Net income | — | — | — | — | — | 10,962 | 10,962 | ||||||||||||||||||||||||||||||
| BALANCE AT JULY 31, 2006 | 64,507 | 65 | (4 | ) | 790,437 | (25 | ) | (741,095 | ) | 49,378 | |||||||||||||||||||||||||||
| Issuance of common stock | 4,163 | 4 | — | 4,214 | — | — | 4,218 | ||||||||||||||||||||||||||||||
| Stock based compensation | — | — | — | 2,558 | — | — | 2,558 | ||||||||||||||||||||||||||||||
| Tax benefits associated with exercise of stock options | — | — | — | 213 | — | — | 213 | ||||||||||||||||||||||||||||||
| Unrealized gain (loss) on marketable securities | — | — | — | — | (1 | ) | — | (1 | ) | ||||||||||||||||||||||||||||
| Net income | — | — | — | — | — | 8,728 | 8,728 | ||||||||||||||||||||||||||||||
| BALANCE AT JULY 31, 2007 | 68,670 | $ | 69 | $ | (4 | ) | $ | 797,422 | $ | (26 | ) | $ | (732,367 | ) | $ | 65,094 | |||||||||||||||||||||
The accompanying notes are an integral part of these consolidated financial statements.
42
SOURCEFORGE, INC.
CONSOLIDATED STATEMENTS OF CASH FLOWS
(In thousands)
| Year Ended July 31, | ||||||||||||
| 2007 | 2006 | 2005 | ||||||||||
| (Revised) (1) | (Revised) (1) | |||||||||||
| Cash flows from operating activities from continuing operations: | ||||||||||||
| Net income (loss) | $ | 8,728 | $ | 10,962 | $ | (4,694 | ) | |||||
| Income/(loss) from discontinued operations | 2,773 | 7,039 | (4,437 | ) | ||||||||
| Income (loss) from continuing operations | 5,955 | 3,923 | (257 | ) | ||||||||
| Adjustments to reconcile net income from continuing operations | ||||||||||||
| to net cash used in operating activities: | ||||||||||||
| Depreciation and amortization of intangibles | 574 | 423 | 822 | |||||||||
| Stock-based compensation expense | 1,443 | 435 | 68 | |||||||||
| Tax benefit from employee option plan | 213 | 106 | — | |||||||||
| Provision for bad debts | 27 | 138 | 36 | |||||||||
| Provision for excess and obsolete inventory | (33 | ) | 58 | 57 | ||||||||
| Loss on sale of assets | 42 | 125 | 9 | |||||||||
| Non-cash restructuring expense | — | — | (101 | ) | ||||||||
| Impairment of long-lived assets | — | — | 87 | |||||||||
| Changes in assets and liabilities, net of disposition: | ||||||||||||
| Accounts receivable | (2,493 | ) | (514 | ) | (438 | ) | ||||||
| Inventories | (928 | ) | (399 | ) | 239 | |||||||
| Prepaid expenses and other assets | (679 | ) | (44 | ) | 20 | |||||||
| Accounts payable | 1,252 | (393 | ) | (133 | ) | |||||||
| Accrued restructuring liabilities | (1,640 | ) | (1,749 | ) | (3,327 | ) | ||||||
| Deferred revenue | 440 | 10 | (127 | ) | ||||||||
| Accrued liabilities and other | 300 | 7 | 854 | |||||||||
| Other long-term liabilities | (260 | ) | (157 | ) | (72 | ) | ||||||
| Net cash provided by (used in) operating activitiesfrom continuing operations | 4,213 | 1,969 | (2,263 | ) | ||||||||
| Cash flows from investing activities from continuing operations: | ||||||||||||
| Change in restricted cash | — | — | 450 | |||||||||
| Purchase of property and equipment | (2,626 | ) | (506 | ) | (334 | ) | ||||||
| Sale of property and equipment | — | — | 49 | |||||||||
| Purchase of marketable securities | (81,331 | ) | (55,307 | ) | (25,622 | ) | ||||||
| Sale of marketable securities | 71,337 | 53,040 | 22,788 | |||||||||
| Other, net | — | (2 | ) | (4 | ) | |||||||
| Net cash used in investing activities from continuing operations | (12,620 | ) | (2,775 | ) | (2,673 | ) | ||||||
| Cash flows from financing activities from continuing operations: | ||||||||||||
| Payments on notes payable | — | (11 | ) | (29 | ) | |||||||
| Proceeds from issuance of common stock, net | 4,219 | 5,699 | 581 | |||||||||
| Net cash provided by financing activities from continuing operations | 4,219 | 5,688 | 552 | |||||||||
| Effect of exchange rate changes on cash and cash equivalents | — | (16 | ) | (69 | ) | |||||||
| Cash flows from discontinued operations: | ||||||||||||
| Net cash used in operating activities | (1,550 | ) | (1,643 | ) | (3,872 | ) | ||||||
| Net cash provided by (used in) investing activities | (658 | ) | 64 | (141 | ) | |||||||
| Proceeds from sale of Online Images business, net | — | 8,968 | — | |||||||||
| Net cash provided by (used in) discontinued operations | (2,208 | ) | 7,389 | (4,013 | ) | |||||||
| Net increase (decrease) in cash and cash equivalents | (6,396 | ) | 12,255 | (8,466 | ) | |||||||
| Cash and cash equivalents, beginning of year | 14,753 | 2,498 | 10,964 | |||||||||
| Cash and cash equivalents, end of year | $ | 8,357 | $ | 14,753 | $ | 2,498 | ||||||
(1) | Revised for discontinued operations. See Note 11 – Discontinued Operations. |
The accompanying notes are an integral part of these consolidated financial statements.
43
SOURCEFORGE, INC.
NOTES TO CONSOLIDATED FINANCIAL STATEMENTS
1. Organization and Operations of the Company:
Overview
SourceForge, Inc. (“SourceForge” or the “Company”), formerly VA Software Corporation, owns and operates a network of media web sites, serving the IT management and IT professional, software development and open source communities and other consumers. Through its ThinkGeek, Inc. subsidiary, SourceForge also provides online sales of a variety of retail products of interest to these communities. The Company’s network of web sites includes: SourceForge.net, Slashdot.org, ThinkGeek.com, Linux.com, freshmeat.net, ITManagersJournal.com and NewsForge.com. Combining user-developed content, online marketplaces and e-commerce, SourceForge provides the global technology community a nexus for information exchange, open source software distribution and services and goods for geeks.
SourceForge was incorporated in California in January 1995 and reincorporated in Delaware in December 1999. From the date of its incorporation through October 2001, the Company sold Linux-based hardware systems and services under the name VA Linux Systems, Inc. In December 2001, the Company changed its name to VA Software Corporation to reflect its decision to pursue its Online Media, E-commerce, Software and Online Images businesses. In December 2005, the Company sold its Online Images business to Jupitermedia Corporation (“Jupitermedia”) and in April 2007, the Company sold its Software business to CollabNet, Inc. (“CollabNet”). On May 24, 2007, reflecting the Company’s strategic decision to focus on its network of media and e-commerce web sites, the Company changed its name to SourceForge, Inc. and merged with and into its wholly-owned subsidiary, OSTG, Inc.
As a result of the sale of the Company’s Software business to CollabNet and the sale of its Online Images business to Jupitermedia, the Company no longer has operations in these segments. These dispositions meet the criteria in Statement of Financial Standards (“SFAS”) No. 144, “Accounting for the Impairment or Disposal of Long-Lived Assets,” to be presented as discontinued operations. Accordingly, all financial information related to the Software and Online Images businesses have been presented as discontinued operations in the accompanying condensed consolidated financial statements. See Note 11 — Discontinued Operations.
2. Summary of Significant Accounting Policies:
Use of Estimates in Preparation of Consolidated Financial Statements
The preparation of consolidated financial statements in conformity with accounting principles generally accepted by the United States of America requires management to make estimates and assumptions that affect the reported amounts of assets and liabilities and the disclosure of contingent assets and liabilities at the date of such financial statements, as well as the reported amounts of revenue and expenses during the periods indicated. Actual results could differ from those estimates.
Reclassifications
Certain reclassifications have been made to the prior year consolidated financial statements to conform to the current year presentation. These reclassifications have no impact on previously reported net loss or cash flows.
Principles of Consolidation
These consolidated financial statements include the accounts of the Company and its wholly-owned subsidiaries. All significant intercompany accounts and transactions have been eliminated in consolidation.
Related Party Transactions
As of July 31, 2007, the Company owned approximately 14% of VA Linux Systems Japan, K.K.’s (“VA Linux Japan”) outstanding common stock and approximately 9% of CollabNet, Inc. (“CollabNet”) consisting of CollabNet’s Series C-1 preferred stock. As the Company holds less than 20% of the voting stock of these companies and does
44
not otherwise exercise significant influence, these investments are accounted for under the cost method. VA Linux Japan is a reseller of the Company’s former Software business in Japan and also, resyndicates certain Media business web sites for the Japanese market. CollabNet is a developer of software used in collaborative software development. In April 2007, CollabNet acquired our Software business, see Note 11 Discontinued Operations. There are $0.02 million and $0.02 million of related-party receivables and $0.01 million and $0.01million of related-party deferred revenue associated with related parties as of July 31, 2007 and 2006, respectively, that are included in trade receivables and deferred revenue in the accompanying Consolidated Balance Sheets. There were $0.4 million, $0.1 million and $0.1 million of related-party revenue associated with VA Linux Japan and CollabNet for the years ended July 31, 2007, July 31, 2006 and July 31, 2005, respectively.
Foreign Currency Translation
The functional currency of all the Company’s foreign subsidiaries is the country’s local currency. Operations related to all of the Company’s wholly-owned foreign subsidiaries were discontinued in 2001 and were included in the fiscal 2001 restructuring plan. At July 31, 2007, the only remaining foreign subsidiary is the Company’s Belgium subsidiary. No revenue was generated from these entities for any of the periods presented and the expenses were administrative in nature and were immaterial to the consolidated results of operations for all periods presented. A minimal cash balance is maintained in the Company’s Belgian subsidiary for legal purposes. Remaining balance sheet accounts are translated into U.S. dollars at exchange rates prevailing at balance sheet dates. Expenses are translated into U.S. dollars at average rates for the period. Gains and losses resulting from translation are charged or credited in other comprehensive income as a component of stockholders’ equity. As of July 31, 2007 the Company did not hold any foreign currency derivative instruments.
Segment and Geographic Information
Statement of Financial Accounting Standards (“SFAS”) No. 131, “Disclosures about Segments of an Enterprise and Related Information,” establishes standards for reporting information regarding operating segments in annual financial statements and requires selected information for those segments to be presented in interim financial reports issued to stockholders. SFAS No. 131 also establishes standards for related disclosures about products and services and geographic areas. Operating segments are identified as components of an enterprise about which separate discrete financial information is available for evaluation by the chief operating decision-maker, or decision-making group, in making decisions how to allocate resources and assess performance. The Company’s chief decision-making group, as defined under SFAS No. 131, are the Chief Executive Officer and the executive team. The Company currently operates as two reportable business segments: Online Media and E-commerce.
The Company markets its products in the United States through its direct sales force and its online web site. Revenue for each of the years ended July 31, 2007, July 31, 2006 and July 31, 2005 were primarily generated from sales to end users in the United States.
Cash, Cash Equivalents, Short-Term Investments and Long-Term Investments
The Company considers all highly liquid investments with an original maturity of three months or less to be cash equivalents. Cash and cash equivalents consist principally of cash deposited in money market and checking accounts.
The Company accounts for its investments under the provisions of SFAS No. 115, “Accounting for Certain Investments in Debt and Equity Securities.” Investments in highly liquid financial instruments with remaining maturities greater than three months and maturities of less than one year are classified as short-term investments. Financial instruments with remaining maturities greater than one year are classified as long-term investments. Investments in related party companies are included in “Other Assets” in the Consolidated Balance Sheets. All investments are classified as available-for-sale and are reported at fair value with net unrealized gains (losses) reported, net of tax, using the specific identification method as other comprehensive gain/(loss) in stockholders’ equity. The cost of the investments was not significantly different than the fair value for the fiscal years presented. The fair value of the Company’s available-for-sale securities are based on quoted market prices at the balance sheet dates.
45
Cash, cash equivalents and investments consist of the following (in thousands) at market value:
| July 31, | July 31, | ||||
| 2007 | 2006 | ||||
| Cash and cash equivalents: | |||||
| Cash | $ | 3,799 | $ | 2,774 | |
| Money market funds | 1,736 | 2,615 | |||
| Corporate securities | 2,822 | 9,364 | |||
| Total cash and cash equivalents | $ | 8,357 | $ | 14,753 | |
| Short-term investments: | |||||
| Government securities | $ | 9,394 | $ | 23,483 | |
| Corporate securities | 10,950 | 3,245 | |||
| Asset backed securities | 7,534 | 3,742 | |||
| Money market securities | 6,534 | 6,668 | |||
| Total short-term investments | $ | 34,412 | $ | 37,138 | |
| Long-term investments: | |||||
| Asset backed securities | $ | 3,798 | $ | — | |
| Government securities | 3,000 | 752 | |||
| Corporate securities | 7,073 | 400 | |||
| Total long-term investments | $ | 13,871 | $ | 1,152 | |
The contractual maturities of debt securities classified as available-for-sale at July 31, 2007 are as follows (in thousands):
| Maturing 90 days or less from purchase | $ | 2,822 | |
| Maturing between 90 days and one year from purchase | 34,412 | ||
| Maturing more than one year from purchase | 13,871 | ||
| Total available-for-sale debt securities | $ | 51,105 |
Restricted Cash
The Company had an outstanding letter of credit of $1.0 million at July 31, 2007 and 2006, which is used to collateralize its Fremont headquarters building lease. The Company has a restricted cash balance with its bank to support this letter of credit.
Trade Accounts Receivable
Trade accounts receivable are recorded at the invoiced amount and are not interest bearing. The Company maintains an allowance for doubtful accounts to reserve for potentially uncollectible trade receivables. The Company also reviews its trade receivables by aging category to identify specific customers with known disputes or collectibility issues. The Company exercises judgment when determining the adequacy of these reserves and evaluates historical bad debt trends, general economic conditions in the United States and internationally, and changes in customer financial conditions.
Inventories
Inventories related to the Company’s E-commerce segment consist solely of finished goods that are valued using the average cost method. Provisions, when required, are made to reduce excess and obsolete inventories to their estimated net realizable values.
46
Property and Equipment
Property and equipment are stated at cost and are depreciated using the straight-line method over the estimated useful lives of the assets. Leasehold improvements are amortized over the lesser of the estimated useful lives or the corresponding lease term. Property and equipment consist of the following (in thousands):
| July 31, | July 31, | ||||||
| 2007 | 2006 | ||||||
| Computer and office equipment (useful lives of 2 to 3 years) | $ | 2,868 | $ | 3,600 | |||
| Furniture and fixtures (useful lives of 2 to 4 years) | 497 | 493 | |||||
| Leasehold improvements (useful lives of lesser of estimated life or lease term) | 281 | 281 | |||||
| Software (useful lives of 2 to 5 years) | 1,980 | 2,033 | |||||
| Total property and equipment | 5,626 | 6,407 | |||||
| Less: Accumulated depreciation and amortization | (2,986 | ) | (5,861 | ) | |||
| Property and equipment, net | $ | 2,640 | $ | 546 | |||
Depreciation expense for the years ended July 31, 2007, July 31, 2006, and July 31, 2005 was $0.6 million, $0.4 million, and $0.8 million, respectively.
Intangible Assets
Intangible assets are amortized on a straight-line basis over three to five years. Intangible asset amortization was insignificant during fiscal 2007, 2006 and 2005. The intangible asset at July 31, 2007 relates to domain and trade names associated with our current Online Media business. This balance has been included in “Other Assets” in the Consolidated Balance Sheets. The Company continually evaluates whether events or circumstances have occurred that indicate the remaining estimated useful lives of these intangible assets may not be recoverable. No events or circumstances occurred during fiscal year 2007 that would indicate a possible impairment in the carrying value of intangible assets at July 31, 2007.
The changes in the carrying amount of the intangible assets are as follows (in thousands):
| As ofJuly 31, 2007 | As ofJuly 31, 2006 | ||||||||||||||
| Gross Carrying | Accumulated | Gross Carrying | Accumulated | ||||||||||||
| Amount | Amortization | Amount | Amortization | ||||||||||||
| Domain and trade names | $ 5,933 | $ (5,931 | ) | $ 5,933 | $ (5,929 | ) | |||||||||
| Purchased technology | 2,534 | (2,534 | ) | 2,534 | (2,534 | ) | |||||||||
| Total intangible assets | $ 8,467 | $ (8,465 | ) | $ 8,467 | $ (8,463 | ) | |||||||||
Impairment of Long-Lived Assets
As of July 31, 2007, the Company held investments of approximately 14% in VA Linux Systems Japan, K.K. (“VA Linux Japan”) and approximately 9% of CollabNet, Inc. (“CollabNet”) consisting of CollabNet’s Series C-1 preferred stock. The Company continually evaluates whether events or circumstances have occurred that indicate the remaining value of these investment may be impaired. There is no quoted price for these investments; accordingly, fair value was estimated by management based on the estimated fair value of the underlying net assets or an annual appraisal performed by an independent valuation firm. Based on the valuations performed during the years ended July 31, 2007 and July 31, 2006, there were no impairment of the investments. On July 31, 2005, an impairment loss of $0.1 million was included in “Impairment of long-lived assets” in the Consolidated Statements of Operations and Other Comprehensive Income/(Loss)”. The Company’s investments balance is included in “Other Assets” in the Consolidated Balance Sheets and consists of the following (in thousands):
| As of July 31, | |||||
| 2007 | 2006 | ||||
| CollabNet, Inc. | $ | 6,564 | $ | — | |
| VA Linux Systems Japan, KK | 387 | 387 | |||
| Total investments | $ | 6,951 | $ | 387 | |
47
Revenue Recognition
Online Media Revenue
Online media revenue is primarily derived from cash sales of advertising space on the Company’s various web sites, as well as sponsorship and royalty related arrangements associated with advertising on these web sites. The Company recognizes Online Media revenue in accordance with SEC Staff Accounting Bulletin (“SAB”) No. 104, “Revenue Recognition” over the period in which the advertisements are displayed, provided that persuasive evidence of an arrangement exists, no significant obligations remain, the fee is fixed or determinable, and collection of the receivable is reasonably assured. The Company’s obligations typically include guarantees of a minimum number of “impressions” (times that an advertisement is viewed by users of our online services). To the extent that minimum guaranteed impressions are not met in the specified time frame, the Company does not recognize the corresponding revenue until the guaranteed impressions are delivered.
The Company recognizes revenue on barter transaction in accordance with SFAS 153, Exchanges of Nonmonetary Assets an amendment of APB Opinion No. 29.” In accordance with SFAS 153, the Company measures these transactions based on the recorded amount of the non-monetary asset relinquished. The Company’s barter transactions generally consist of the exchange of advertising on its Online Media web sites in exchange for access and advertising at industry trade shows. Accordingly, the Company does not record any revenue as a result of these transactions. The fair value of barter revenue is insignificant.
E-commerce Revenue
E-commerce revenue is derived from the online sale of consumer goods. The Company recognizes E-commerce revenue from the sale of consumer goods in accordance with SAB 104. Under SAB 104, product revenue is recognized when persuasive evidence of an arrangement exists, delivery has occurred, the sale price is fixed or determinable, and collectibility is reasonably assured. In general, the Company recognizes E-commerce revenue upon the shipment of goods. The Company does grant customers a right to return E-commerce products. Such returns are recorded as incurred and have been immaterial for the periods presented.
Advertising Expenses
The Company expenses advertising costs as incurred. Total advertising expenses for continuing operations were $1.0 million, $0.5 million and $0.6 million for fiscal years ending July 31, 2007, July 31, 2006 and July 31, 2005, respectively.
Stock-Based Compensation
The Company adopted SFAS 123(R) “Share-Based Payment”, a revision of SFAS 123, “Accounting for Stock-Based Compensation” and a supersession of Accounting Principles Board (“APB”) Opinion No. 25, “Accounting for Stock Issued to Employees”, and its related implementation guidance on August 1, 2005. SFAS 123(R) establishes standards for the accounting for transactions where an entity exchanges its equity instruments for goods or services. It also addresses transactions in which an entity incurs liabilities in exchange for goods or services that are based on the fair value of the entity’s equity instruments. The principal focus of SFAS 123(R) however, is the accounting for transactions in which an entity obtains employee services in share-based payment transactions, and where the measurement of the cost of employee services received in exchange for an award of equity instruments is based on the grant-date fair value of the award. That cost will be recognized over the period during which an employee is required to provide service in exchange for the award, the requisite service period, and, unless observable market prices for the same or similar instruments are available, will be estimated using option-pricing models adjusted for the unique characteristics of the instruments. If an equity award is modified after the grant date, incremental compensation cost will be recognized in an amount equal to the excess of the fair value of the modified award over the fair value of the original award immediately before the modification. During the years ended July 31, 2007 and July 31, 2006, the Company recognized $1.8 million and $0.7 million, respectively in compensation expense related to options granted to employees and directors.
48
The Company adopted SFAS 123(R) using the modified prospective transition method, which requires the application of the accounting standard as of August 1, 2005, the first day of the Company’s 2006 fiscal year. The Company’s Consolidated Financial Statements as of and for the year ended July 31, 2006 reflect the impact of SFAS 123(R). In accordance with the modified prospective transition method, the Company’s Consolidated Financial Statements for prior periods have not been restated to reflect, and do not include, the impact of SFAS 123(R).
Software Development Costs
In accordance with SFAS No. 86, “Accounting for the Cost of Computer Software to be Sold, Leased, or Otherwise Marketed,” development costs incurred in the research and development of new software products are expensed as incurred until technological feasibility in the form of a working model has been established at which time such costs are capitalized, subject to a net realizable value evaluation. Technological feasibility is established upon the completion of an integrated working model. To date, the Company’s software development, which related entirely to its discontinued Software business, has been completed concurrent with the establishment of technological feasibility and, accordingly, all software development costs have been charged to research and development expense in the accompanying consolidated statements of operations.
In accordance with SOP 98-1 “Accounting for the Cost of Computer Software Developed or Obtained for Internal Use,” costs incurred related to internal use software are capitalized and amortized over their useful lives. During the year ended July 31, 2007, the Company capitalized $1.8 million of internal use software costs. No costs were capitalized prior to the July 31, 2006.
Computation of Per Share Amounts
In accordance with SFAS No. 128 “Earnings Per Share,” basic net loss per common share has been calculated using the weighted-average number of shares of common stock outstanding during the period, less shares subject to repurchase. For the fiscal year ended July 31, 2005, the Company has excluded all stock options and warrants from the calculation of diluted net loss per common share because all such securities are antidilutive for those periods.
The following table presents the calculation of basic and diluted net loss per share (in thousands, except per share data):
| Year Ended July 31, | ||||||||||
| 2007 | 2006 | 2005 | ||||||||
| Income (loss) from continuing operations | $ | 5,955 | $ | 3,923 | $ | (257 | ) | |||
| Income (loss) from discontinued operations | 2,773 | 7,039 | (4,437 | ) | ||||||
| Net income (loss) | $ | 8,728 | $ | 10,962 | $ | (4,694 | ) | |||
| Weighted average shares - basic | 66,254 | 62,328 | 61,454 | |||||||
| Effect of dilutive potential common shares | 2,235 | 2,376 | — | |||||||
| Weighted average shares - diluted | 68,489 | 64,704 | 61,454 | |||||||
| Income per share from continuing operations: | ||||||||||
| Basic | $ | 0.09 | $ | 0.06 | $ | — | ||||
| Diluted | $ | 0.09 | $ | 0.06 | $ | — | ||||
| Income (loss) per share from discontinued operations: | ||||||||||
| Basic | $ | 0.04 | $ | 0.11 | $ | (0.07 | ) | |||
| Diluted | $ | 0.04 | $ | 0.11 | $ | (0.07 | ) | |||
| Net income (loss) per share: | ||||||||||
| Basic | $ | 0.13 | $ | 0.18 | $ | (0.08 | ) | |||
| Diluted | $ | 0.13 | $ | 0.17 | $ | (0.08 | ) | |||
49
The following potential common shares have been excluded from the calculation of diluted net loss per share for all periods presented because they are anti-dilutive (in thousands):
| Year Ended July 31, | |||||
| 2007 | 2006 | 2005 | |||
| Anti-dilutive securities: | |||||
| Options to purchase common stock | 3,191 | 3,917 | 11,226 | ||
| Warrants | — | 731 | 731 | ||
| Total | 3,191 | 4,648 | 11,957 | ||
Comprehensive Loss
Comprehensive loss is comprised of net loss and other non-owner changes in stockholders’ equity, including foreign currency translation gains or loss and unrealized gains or losses on available-for sale marketable securities.
Income Taxes
The Company accounts for income taxes using the liability method in accordance with SFAS No. 109, “Accounting for Income Taxes.” Due to the Company’s loss position in fiscal year 2005, there was no provision for income taxes in that year. Deferred tax assets are recognized for anticipated future tax consequences attributable to differences between the financial statement carrying amounts of existing assets and their respective tax bases. A valuation allowance has been recorded for the total deferred tax assets as management believes it is more likely than not that these assets will not be realized as a result of uncertainties regarding realization of the assets based on the Company’s limited history of profitability and the uncertainty of future profitability.
Recent Accounting Pronouncements
In July 2006, the FASB issued Financial Interpretation No. 48 (“FIN 48”), “Accounting for Uncertainty in Income Taxes-an interpretation of FASB Statement No. 109,” which is a change in accounting for income taxes. FIN 48 specifies how tax benefits for uncertain tax positions are to be recognized, measured, and derecognized in financial statements; requires certain disclosures of uncertain tax matters; specifies how reserves for uncertain tax positions should be classified on the balance sheet; and provides transition and interim period guidance, among other provisions. FIN 48 is effective for fiscal years beginning after December 15, 2006. The Company does not expect the adoption of FIN 48 will have a material impact on its financial position or results of operations.
In September 2006, the FASB issued SFAS No. 157 (“SFAS 157”), “Fair Value Measurements.” Among other requirements, SFAS No. 157 defines fair value and establishes a framework for measuring fair value and also expands disclosure about the use of fair value to measure assets and liabilities. SFAS No. 157 is effective beginning the first fiscal year that begins after November 15, 2007. The Company does not believe that the adoption of SFAS No. 157 will have a material impact on its financial position or results of operations.
In September 2006, the SEC issued SAB No. 108 (“SAB 108”), “Considering the Effects of Prior Year Misstatements When Quantifying Misstatements in Current Year Financial Statements,”, which provides interpretive guidance on how the effects of the carryover or reversal of prior year misstatements should be considered in quantifying a current year misstatement. The guidance is applicable for fiscal years ending after November 15, 2006. The Company applied the provisions of SAB 108 beginning in the first quarter of fiscal 2007 and there was no impact to its financial position or results of operations.
In February 2007, the FASB issued SFAS No. 159 (“SFAS 159”), “The Fair Value Option for Financial Assets and Financial Liabilities,” SFAS No. 159 amends SFAS 115 and permits fair value measurement of financial instruments and certain other items. SFAS No. 159 is effective beginning the first fiscal year that begins after November 15, 2007. The Company is currently evaluating the impact of SFAS No. 159 on its financial position and results of operations.
Supplier Concentration
No supplier concentration exists in the Company’s Online Media or E-commerce businesses.
50
Concentrations of Credit Risk and Significant Customers
The Company’s investments are managed by two reputable financial institutions; both institutions are headquartered in the United States. The Company’s investment policy, which is designed to preserve capital and maintain liquidity, limits the amount of risk exposure.
Financial instruments that potentially subject the Company to concentrations of credit risk consist primarily of cash trade receivables. The Company provides credit, in the normal course of business, to a number of companies and performs ongoing credit evaluations of its customers. The credit risk in the Company’s trade receivables is substantially mitigated by its credit evaluation process and reasonably short collection terms. The Company maintains reserves for potential credit losses and such losses have been within management’s expectations. As of July 31, 2007 one advertising agency accounted for 20.7% of gross accounts receivables and as of July 31, 2006 another advertising agency accounted for 16.6% of gross accounts receivables.
For the fiscal years ended July 31, 2007, July 31, 2006 and July 31, 2005 no one customer represented more than 10% of net revenue. Going forward, the company does not anticipate that any one customer will represent more than 10% of net revenue.
3. Restructuring Costs and Other Special Charges
In fiscal 2001 and 2002, the Company adopted plans to exit its hardware systems and hardware-related software engineering and professional services businesses, exit a sublease agreement and reduce its general and administrative overhead costs. The Company exited these activities to pursue its Software, Online Media, E-commerce and Online Images businesses and reduce its operating losses to improve cash flow. The Company recorded restructuring charges of $168.5 million related to exiting these activities, including charges related to excess facilities from non-cancelable leases. In fiscal 2005, a credit adjustment of $0.1 million was recorded to accurately reflect the current common area maintenance fees associated with the Fremont facilities. In conjunction with the sale of the Software business in fiscal 2007 an additional reserve of $0.6 million was recorded as discontinued operations expense due to the idle space resulting from this transaction. This idle facilities charge has been included as discontinued operations in the consolidated statements of operations. The remaining accrual from non-cancelable lease payments, which continue through 2010, is based on current circumstances. These accruals are subject to change should actual circumstances change. The Company will continue to evaluate and update, if applicable, these accruals quarterly. As of July 31, 2007, the Company had an accrual of approximately $5.0 million outstanding related to these non-cancelable leases, all of which was originally included in operating expenses.
Below is a summary of the restructuring charges in operating expenses (in thousands):
| Year ended July 31, | ||||||||
| 2007 | 2006 | 2005 | ||||||
| Cash provision: | ||||||||
| Facilities charges | $ 581 | $ — | $ | (101 | ) | |||
| $581 | $ — | $ | (101 | ) | ||||
Below is a summary of the changes to the restructuring liability (in thousands):
| Balance at | Charged to | ||||||||||||
| Beginning of | Costs and | Balance at End | |||||||||||
| Period | Expenses | Deductions | of Period | ||||||||||
| For the year ended: | |||||||||||||
| July 31, 2005 | $ | 11,283 | $ | (101 | ) | $ | (3,327 | ) | $7,855 | ||||
| July 31, 2006 | $ | 7,855 | $ | — | $ | (1,748 | ) | $6,107 | |||||
| July 31, 2007 | $ | 6,107 | $ | 581 | $ | (1,640 | ) | $5,048 | |||||
51
Components of the total accrued restructuring liability are as follows (in thousands):
| Short Term | Long Term | Total Liability | ||||
| As of July 31, 2005 | $1,748 | $6,107 | $7,855 | |||
| As of July 31, 2006 | $1,592 | $4,515 | $6,107 | |||
| As of July 31, 2007 | $1,781 | $3,267 | $5,048 |
The Company’s restructuring liability is comprised of non-cancelable operating lease payments of $1.8 million, $1.8 million and $1.5 million for the years ending July 31, 2008, July 31, 2009 and July 31, 2010, respectively.
4. Commitments and Contingencies
The Company leases its facilities under operating leases that expire at various dates through fiscal year 2012. Future minimum lease payments under non-cancelable operating leases, net of sublease income, as of July 31, 2007 are as follows (in thousands):
| Included in | ||||||||||||||||
| Gross Operating | Net Operating | Restructuring | ||||||||||||||
| Leases | Sublease Income | Leases | Liability | |||||||||||||
| 2008 | 4,137 | 1,064 | 3,073 | 1,781 | ||||||||||||
| 2009 | 4,396 | 1,096 | 3,300 | 1,782 | ||||||||||||
| 2010 | 3,780 | 938 | 2,842 | 1,485 | ||||||||||||
| 2011 | 609 | — | 609 | — | ||||||||||||
| 2012 | 627 | — | 627 | — | ||||||||||||
| Thereafter | 105 | — | 105 | — | ||||||||||||
| Total minimum lease obligations | $13,654 | $3,098 | $10,556 | $5,048 | ||||||||||||
Gross rent expense for the years ended July 31, 2007, July 31, 2006 and July 31, 2005 was approximately $2.5 million, $2.6 million and $2.8 million, respectively. This rent expense was offset by sublease income of $1.5 million, $1.6 million and $1.8 million for the years ended July 31, 2007, July 31, 2006 and July 31, 2005, respectively. No rent expense as a result of idle facilities charges was recorded for the years ended July 31, 2007, July 31, 2006 and July 31, 2005. The idle facilities charge for the year ended July 31, 2007 has been included in discontinued operations in the consolidated statements of operations.
5. Litigation
The Company, two of its former officers (the “Former Officers”), and the lead underwriter in its initial public offering (“IPO”) were named as defendants in a consolidated shareholder lawsuit in the United States District Court for the Southern District of New York, captioned In re VA Software Corp. Initial Public Offering Securities Litigation, 01-CV-0242. This is one of a number of actions coordinated for pretrial purposes as In re Initial Public Offering Securities Litigation, 21 MC 92 with the first action filed on January 12, 2001. Plaintiffs in the coordinated proceeding are bringing claims under the federal securities laws against numerous underwriters, companies, and individuals, alleging generally that defendant underwriters engaged in improper and undisclosed activities concerning the allocation of shares in the IPOs of more than 300 companies during late 1998 through 2000. Among other things, the plaintiffs allege that the underwriters’ customers had to pay excessive brokerage commissions and purchase additional shares of stock in the aftermarket in order to receive favorable allocations of shares in an IPO. The consolidated amended complaint in the Company’s case seeks unspecified damages on behalf of a purported class of purchasers of its common stock between December 9, 1999 and December 6, 2000. Pursuant to a tolling agreement, the individual defendants were dismissed without prejudice. On February 19, 2003, the court denied the Company’s motion to dismiss the claims against it. The issuer defendants and plaintiffs negotiated a stipulation of settlement for the claims against the issuer defendants, including the Company, that was submitted to the Court for approval in June 2004. In August 2005, the Court preliminarily approved the settlement. In December 2006, the appellate court overturned the certification of classes in the six test cases that were selected by the underwriter defendants and
52
plaintiffs in the coordinated proceedings. Because class certification was a condition of the settlement, it was unlikely that the settlement would receive final Court approval. On June 25, 2007, the Court entered an order terminating the proposed settlement based upon a stipulation among the parties to the settlement. Plaintiffs have filed an amended complaint and filed a motion for class certification based on their amended allegations. It is uncertain whether there will be any revised or future settlement. The Company believes that it has meritorious defenses to plaintiffs’ claims and intends to defend the action vigorously.
On Nov 9, 2001, a former employee of the Company, who had worked as a sales person in the Company’s former hardware business, filed a complaint captioned Okerman v. VA Linux Systems, Inc. & Larry Augustin, Civil No. 01-01825 (Norfolk Superior Court), in the Commonwealth of Massachusetts. As amended, the complaint alleges that changes made to certain commission and bonus plans during the plaintiff’s tenure at the Company entitled him to recover damages for Breach of Contract, Breach of the Implied Covenant of Good Faith and Fair Dealing, violation of the Massachusetts Wage Act Statute, Promissory Estoppel, and Quantum Meruit. On June 25, 2002, the Court dismissed the Massachusetts Wage Act claim brought against the Company’s former chief executive officer. On July 26, 2002, dismissal of the Wage Act claim in favor of the Company’s former chief executive officer was upheld on interlocutory appeal. On July 9, 2003, the Court granted summary judgment in the Company’s favor regarding claims for Breach of Contract, Promissory Estoppel, and Quantum Meruit, and granted judgment on the pleadings in favor of the Company regarding the Massachusetts Wage Act claim. On September 24, 2004, following a jury trial on the sole remaining claim for Breach of the Covenant of Good Faith and Fair Dealing, a jury awarded damages of $136,876 to the plaintiff, which have been included in accrued liabilities and other in the Company’s condensed consolidated balance sheets as of April 30, 2007. The plaintiff and the Company filed their appellate briefs and the Appeals Court for the Commonwealth of Massachusetts heard oral arguments on May 17, 2007.On August 20, 2007, the Appeals Court issued its decision, vacating the Superior Court’s dismissal of the Wage Act Claims and affirming all other counts. On September 17, 2007, Mr. Okerman and the Company filed petitions for rehearing and, on September 24, 2007, the Company filed an application for further appellate review with the Supreme Judicial Court regarding the Wage Act Claims. The Company believes that it has meritorious defenses to plaintiff’s claims and intends to defend the action vigorously.
The Company is subject to various claims and legal actions arising in the ordinary course of business. The Company has accrued for estimated losses in the accompanying consolidated financial statements for those matters where it believes that the likelihood that a loss will occur is probable and the amount of loss is reasonably estimable.
As described in Note 12 – Subsequent Event, on September 26, 2007, Company received notification that it had been named as a defendant in a civil action filed in Paris, France.
6. Guarantees and Indemnifications
The following is a summary of our agreements that we have determined are within the scope of FIN 45, “Guarantor’s Accounting and Disclosure Requirements for Guarantees, Including Indirect Guarantees of Indebtedness of Others,” some of which are specifically grandfathered because the guarantees were in effect prior to December 31, 2002. Accordingly, we have no liabilities recorded for these agreements as of July 31, 2007.
In conjunction with the sale of its Software business to CollabNet, the Company has agreed to indemnify CollabNet for damages arising from any misrepresentation of representations and warranties, the breach of a covenant or agreement or the failure by the Company to assume certain liabilities excluded from the sale of the business. Except in the case of fraud, the indemnification is limited to the 2,933,444 shares of CollabNet preferred stock held in escrow; however the maximum amount of the indemnification for breach of the non-competition covenant is equal to the 11,733,777 shares of CollabNet Series C-1 preferred stock, owned by the Company. CollabNet may not make an indemnification claim until their aggregate losses under the indemnification provisions exceed $0.1 million. The term of the indemnification is generally through April 24, 2008, except for certain claims for fraud or breaches of the non-competition covenant. The Company believes that it has complied with all of those items for which it has agreed to indemnify CollabNet, and the Company has not been subject to any claims or suffered any losses, and CollabNet has not made any claims pursuant to the Company’s indemnification obligations. Accordingly, the Company has no liabilities recorded for this indemnification as of July 31, 2007.
53
In conjunction with the sale of its Online Images business to Jupitermedia, the Company agreed to indemnify Jupitermedia for losses arising from any misrepresentation of representations and warranties, the breach of a covenant or agreement or the failure by the Company to assume certain liabilities excluded from the sale of the business. The maximum amount of the indemnification is $1.4 million and no claim for indemnification may be made until aggregate losses exceed $0.08 million. The term of the indemnification was generally through June 23, 2007; however, certain items have different indemnification periods. The Company believes that it has complied with all of those items for which it has agreed to indemnify Jupitermedia, and the Company has not been subject to any claims or suffered any losses, and Jupitermedia has not made any claims pursuant to the Company’s indemnification obligations. Accordingly, the Company has no liabilities recorded for this indemnification as of July 31, 2007.
As permitted under Delaware law, the Company has agreements whereby the Company’s officers and directors are indemnified for certain events or occurrences while the officer or director is, or was, serving at the Company’s request in such capacity. The maximum potential amount of future payments the Company could be required to make under these indemnification agreements is unlimited; however, the Company has obtained director and officer liability insurance designed to limit the Company’s exposure and to enable the Company to recover a portion of any future amounts paid. As a result of the Company’s insurance policy coverage, the Company believes the estimated fair value of these indemnification agreements is minimal. Accordingly, the Company has no liabilities recorded for these agreements as of July 31, 2007.
The Company enters into standard indemnification agreements in the ordinary course of business. Pursuant to these agreements, the Company indemnifies, holds harmless, and agrees to reimburse the indemnified party for losses suffered or incurred by the indemnified party, generally, the Company’s business partners, subsidiaries and/or customers, in connection with any patent, copyright or other intellectual property infringement claim by any third party with respect to the Company’s products. The term of these indemnification agreements is generally perpetual any time after execution of the agreement. The maximum potential amount of future payments the Company could be required to make under these indemnification agreements is unlimited. The Company has not incurred significant costs to defend lawsuits or settle claims related to these indemnification agreements. As a result, the Company believes the estimated fair value of these agreements is insignificant. Accordingly, the Company has no liabilities recorded for these agreements as of July 31, 2007.
The Company’s former Software business warranted that its software products would perform in all material respects in accordance with the Company’s standard published specifications in effect at the time of delivery of the licensed products to the customer for a specified period, which generally did not exceed 90 days. Additionally, the Company warranted that its maintenance services performed consistently with generally accepted industry standards through the completion of the agreed upon services. In conjunction with the Company’s sale of its Software business to CollabNet, certain of these warranties were assumed by CollabNet. As a result, the Company believes the estimated fair value of these agreements is minimal. Accordingly, the Company has no liabilities recorded for these agreements as of July 31, 2007.
7. Retirement Savings Plan
The Company maintains an employee savings and retirement plan which is qualified under Section 401(k) of the Internal Revenue Code and is available to substantially all full-time employees of the Company. The plan provides for tax deferred salary deductions and after-tax employee contributions. Contributions include employee salary deferral contributions and discretionary employer contributions. To date, there have been no employer discretionary contributions.
8. Common Stock
Warrants
On November 6, 2003, the Company issued two warrants to purchase up to 705,883 and 25,000 shares of common stock to The Riverview Group LLC and Wharton Capital Partners Ltd., respectively in connection with a private placement of the Company’s common stock. These warrants were exercisable at exercise prices of $6.00 and $6.14 per share and the warrants expired unexercised on November 6, 2006.
54
Stock option plans
In fiscal year 1999, the Company adopted and the Board of Directors approved the 1998 Stock Option Plan (the “1998 Plan”). Since inception, a total of 37,824,386 shares of common stock have been reserved for issuance under the 1998 Plan, subject to an annual increase of the lesser of 4,000,000 shares or 4.9% of the then outstanding common stock or an amount to be determined by the Board of Directors. Through July 31, 2007, 50,087,162 options and stock purchase rights have been granted under the 1998 Plan. Under the 1998 Plan, the Board of Directors may grant to employees and consultants options and/or stock purchase rights to purchase the Company’s common stock at terms and prices determined by the Board of Directors. The 1998 Plan will terminate in 2008. Nonqualified options granted under the 1998 Plan must be issued at a price equal to at least 85% of the fair market value of the Company’s common stock at the date of grant. All options may be exercised at any time within 10 years of the date of grant or within one month of termination of employment, or such shorter time as may be provided in the stock option agreement, and vest over a vesting schedule determined by the Board of Directors. The Company’s policy is to issue new shares upon exercise of options under the 1998 Plan.
The Company’s 1999 Director’s Option Plan (the “Directors’ Plan”) was adopted by the Company’s Board of Directors in October 1999. Since inception, a total of 1,500,000 shares of common stock have been reserved for issuance under the Directors’ Plan, subject to an annual increase of the lesser of 250,000 shares, or 0.5% of the then outstanding common stock or an amount determined by the Board of Directors. Through July 31, 2007, 1,210,000 options have been granted under the Directors’ Plan. Under the Directors’ Plan, options are granted when a non-employee director joins the Board of Directors and at each annual meeting where the director continues to serve on the Board of Directors. The Directors’ Plan establishes an automatic grant of 80,000 shares of common stock to each non-employee director who is elected. The Directors’ Plan also provides that upon the date of each annual stockholders’ meeting, each non-employee director who has been a member of the Board of Directors for at least six months prior to the date of the stockholders’ meeting will receive automatic annual grants of options to acquire 20,000 shares of common stock. On September 5, 2007, the Compensation Committee of the Board of Directors amended the grants as further described in Note 12 - Subsequent Events. Each automatic grant has an exercise price per share equal to the fair market value of the common stock at the date of grant, vest 25% immediately upon the grant date, one thirty-sixth per month thereafter and become fully vested three years after the date of grant. Each automatic grant has a term of ten years. In the event of a merger with another corporation or the sale of substantially all of its assets, each non-employee director’s outstanding options will become fully vested and exercisable. Options granted under the Directors’ Plan must be exercised within 3 months of the end of the non-employee director’s tenure as a member of the Board of Directors, or within 12 months after a non-employee director’s termination by death or disability, provided that the option does not terminate earlier under its terms earlier. Unless terminated sooner, the Directors’ Plan terminates automatically in 2009. The Company’s policy is to issue new shares upon exercise of options under the Director’s Plan.
The Company has assumed certain option plans and the underlying options of companies which the Company has acquired (the “Assumed Plans”). Options under the Assumed Plans have been converted into the Company’s options and adjusted to effect the appropriate conversion ratio as specified by the applicable acquisition agreement, but are otherwise administered in accordance with the terms of the Assumed Plans. Options under the Assumed Plans generally vest over four years and expire ten years from the date of grant. No additional options will be granted under the Assumed Plans.
Restricted Stock Awards
During the fiscal year ended July 31, 2007, the Board of Directors granted executive management as well as certain other employees, 1,507,500 restricted shares at $0.001 per share. Restricted stock award grants are generally measured at fair value on the date of grant based on the number of shares granted and the quoted price of the Company’s common stock. This fair value has been reduced for estimated forfeitures based on the awards ultimately expected to vest and is recognized as an expense over the corresponding service period. The restricted stock awards have both service and performance conditions attached to them. The weighted-average grant date fair value per share was $3.90.
55
A total of 1,275,000 restricted shares were granted with service conditions. The service conditions have a three year vesting period. A total of 232,500 restricted shares were granted with performance conditions and vest based on the Company attaining certain performance conditions during its fiscal year ending July 31, 2007, of which 182,500 shares were outstanding at July 31, 2007. The Company did not attain these performance conditions and the shares were repurchased by the Company in August 2007.
As of July 31, 2007, the Company had reserved shares of its common stock for future issuance as follows:
| 1998 Stock Option Plan and Assumed Plans | 14,713,523 |
| 1999 Director Option Plan | 1,140,002 |
| 15,853,525 |
The following table summarizes option and restricted stock activities from July 31, 2004 through July 31, 2007:
| Stock Options Outstanding | Stock Options | ||||||||||||||||||||
| Weighted- | |||||||||||||||||||||
| Weighted- | Average | Aggregate | |||||||||||||||||||
| Restricted Stock | Average | Remaining | Intrinsic | ||||||||||||||||||
| Available for | Outstanding | Number | Exercise Price | Contractual | Value | ||||||||||||||||
| Grant | (1) | Outstanding | per Share | Term | ($ 000’s) | ||||||||||||||||
| Balance at July 31, 2004 | 10,908,627 | — | 12,131,872 | $ | 3.58 | ||||||||||||||||
| Granted | (1,552,900 | ) | — | 1,552,900 | $ | 2.05 | |||||||||||||||
| Exercised | — | — | (300,374 | ) | $ | 1.09 | |||||||||||||||
| Cancelled | 2,152,685 | — | (2,158,352 | ) | $ | 5.27 | |||||||||||||||
| Balance at July 31, 2005 | 11,508,412 | — | 11,226,046 | $ | 3.11 | ||||||||||||||||
| Granted | (1,902,000 | ) | — | 1,902,000 | $ | 3.68 | |||||||||||||||
| Exercised | — | — | (2,847,520 | ) | $ | 2.00 | |||||||||||||||
| Cancelled | 1,317,974 | — | (1,327,111 | ) | $ | 3.28 | |||||||||||||||
| Balance at July 31, 2006 | 10,924,386 | — | 8,953,415 | $ | 3.56 | ||||||||||||||||
| Granted | (2,661,475 | ) | 1,507,500 | 1,153,975 | $ | 4.21 | |||||||||||||||
| Exercised | — | (2,820,406 | ) | $ | 1.50 | ||||||||||||||||
| Restricted stock released | — | (25,000 | ) | — | $ | — | |||||||||||||||
| Restricted stock repurchased | 165,000 | (165,000 | ) | — | $ | — | |||||||||||||||
| Cancelled | 703,989 | — | (716,738 | ) | $ | 6.26 | |||||||||||||||
| Balance at July 31, 2007 | 9,131,900 | 1,317,500 | 6,570,246 | $ | 4.26 | 6.07 | $4,131 | ||||||||||||||
| Exercisable at July 31, 2007 | 4,760,716 | $ | 4.33 | 4.93 | $3,785 | ||||||||||||||||
| (1) | Restricted stock outstanding is included in common stock outstanding. |
The total intrinsic value of options exercised was $8.6 million, $5.5 million and $0.3 million during the years ended July 31 2007, July 31, 2006 and July 31, 2005, respectively. The Company issues new shares upon the exercise of options. During the years ended July 31, 2007 and July 31, 2006, the Company realized tax benefits of $0.2 million and $0.1 million, respectively, from exercised options. For the year ended July 31, 2005 no tax benefit was realized from exercised options.
56
The value of the option grants has been calculated on the date of grant using the Black-Scholes option pricing model with the following weighted-average assumptions:
| Year Ended July 31, | |||||
| 2007 | 2006 | ||||
| Expected life (years) | 6.13 | 6.5 | |||
| Risk-free interest rate | 4.8 | % | 4.9 | % | |
| Volatility | 71 | % | 83 | % | |
| Dividend yield | None | None | |||
| Weighted-average fair value at grant date | 2.84 | 2.74 | |||
The options outstanding and currently exercisable by exercise price at July 31, 2007 were as follows (in thousands, except years and per-share amounts):
| OPTIONS | |||||||||||||||||
| OPTIONS OUTSTANDING | EXERCISABLE | ||||||||||||||||
| Weighted | |||||||||||||||||
| Average | Weighted | Weighted | |||||||||||||||
| Remaining | Average | Average | |||||||||||||||
| Range of Exercise | Number | Life (in | Exercise | Exercise | |||||||||||||
| Prices | Outstanding | years) | Price | Shares | Price | ||||||||||||
| $ 0.23 - $1.85 | 668 | 6.60 | $ | 1.44 | 508 | $ | 1.36 | ||||||||||
| $ 1.90 - $2.18 | 241 | 7.24 | 1.98 | 238 | 1.98 | ||||||||||||
| $ 2.45 - $2.45 | 889 | 5.50 | 2.45 | 889 | 2.45 | ||||||||||||
| $ 2.52 - $2.98 | 823 | 5.66 | 2.90 | 810 | 2.90 | ||||||||||||
| $ 3.00 - $3.70 | 649 | 4.19 | 3.08 | 617 | 3.05 | ||||||||||||
| $ 3.70 - $4.10 | 771 | 8.68 | 3.94 | 201 | 3.97 | ||||||||||||
| $ 4.10 - $4.33 | 621 | 8.52 | 4.15 | 183 | 4.15 | ||||||||||||
| $ 4.33 - $4.64 | 543 | 1.21 | 4.57 | 502 | 4.57 | ||||||||||||
| $ 4.64 - $5.50 | 759 | 8.94 | 4.83 | 207 | 4.79 | ||||||||||||
| $ 5.50 - $64.12 | 606 | 3.36 | 13.57 | 606 | 13.57 | ||||||||||||
| $ 0.23 $64.12 | 6,570 | 6.07 | $ | 4.26 | 4,761 | $ | 4.33 | ||||||||||
The total intrinsic value of stock options outstanding and stock options exercisable as of July 31, 2007 was $4.1 million and $3.8 million, respectively. The intrinsic value is calculated as the difference between the market value as of July 31, 2007 and the exercise price of the shares. The market value as of July 31, 2007 was $3.71 as reported by the NASDAQ Global Market System. The weighted-average remaining contractual life of options exercisable as of July 31, 2007 was 4.93 years. The total number of in-the-money options exercisable as of July 31, 2007 was 3.1 million.
The total fair value of options vested during the years ended July 31, 2007, July 31, 2006 and July 31, 2005 were $0.3 million, $0.9 million, and $0.9 million, respectively. As of July 31, 2007, total compensation cost related to nonvested stock options not yet recognized was $4.5 million which is expected to be recognized over a weighted-average term of 3.0 years.
57
Valuation and Expense Information under SFAS 123(R)
On August 1, 2005, the Company adopted SFAS 123(R), which requires the measurement and recognition of compensation expense for all share-based payment awards made to the Company’s employees and directors, including employee stock options based on estimated fair values. The following table summarizes stock-based compensation expense related to employee stock options under SFAS 123(R) which was allocated as follows (in thousands):
| Year Ended July 31, | |||||
| 2007 | 2006 | ||||
| Online Media cost of revenue | $ | 76 | $ | 16 | |
| E-commerce cost of revenue | 25 | 9 | |||
| Included in cost of revenue | 101 | 25 | |||
| Sales and marketing | 236 | 32 | |||
| Research and development | 113 | 22 | |||
| General and administrative | 993 | 356 | |||
| Included in operating expenses | 1,342 | 410 | |||
| Discontinued operations | 434 | 305 | |||
| Total share-based compensation expense | $ | 1,877 | $ | 740 | |
The table below reflects net loss and diluted net loss per share compared with the pro forma information for the year ended July 31, 2005 as follows (in thousands except per-share amounts):
| Year Ended | |||
| July 31, 2005 | |||
| Net loss — as reported | $ | (4,694 | ) |
| Add back employee stock-based compensation expense related | |||
| to stock options included in reported net loss | $ | 68 | |
| Stock-based compensation expense related to employee stock options | (13,335 | ) | |
| Net loss, including the effect of stock-based compensation expense | $ | (17,961 | ) |
| Basic and diluted net loss per share — as reported | $ | (0.08 | ) |
| Basic and diluted net loss per share, including the effect of stock-based compensation expense | $ | (0.29 | ) |
The weighted-average estimated value of employee stock options granted during the year ended July 31, 2005 was $1.51 using the Black-Scholes model with the following weighted-average assumptions:
| Year Ended | ||||
| July 31, 2005 | ||||
| Expected life (years) | 4.8 | |||
| Risk-free interest rate | 3.6 | % | ||
| Volatility | 98 | % | ||
| Dividend yield | None | |||
Upon adoption of SFAS 123(R), the Company began estimating the value of employee stock options on the date of grant using the Black-Scholes model. The Company has used the simplified method for determining the expected term of options granted during the fiscal years ending July 31, 2007 and July 31, 2006. Prior to fiscal 2006, the value of each employee stock option was estimated on the date of grant using the Black-Scholes model for the purpose of pro forma financial information in accordance with SFAS 123.
As stock-based compensation expense recognized in the Consolidated Statement of Operations for the years ended July 31, 2007 and July 31, 2006 is based on awards ultimately expected to vest; it has been reduced for estimated forfeitures. SFAS 123(R) requires forfeitures to be estimated at the time of grant and revised, if necessary, in subsequent periods if actual forfeitures differ from those estimates. Forfeitures were estimated based on historical experience. In the Company’s pro forma information required under SFAS 123 for the periods prior to August 1, 2005, the Company accounted for forfeitures as they occurred.
58
Employee Stock Purchase Plan
In October 1999, the Company adopted an Employee Stock Purchase Plan (“ESPP”). Under the terms of the ESPP, as authorized by the Board of Directors in September 2003, the maximum aggregate number of shares of stock that were to issued under the ESPP was 3,000,000, cumulatively increased annually by an amount equal to the lesser of (a) 1% of the then issued and outstanding shares of common stock, (b) an amount determined by the Board of Directors, or (c) 500,000 shares of common stock. During each six-month offering period, employees could choose to have up to 10% of their annual base earnings withheld to purchase the Company’s common stock. The purchase price of the common stock was 85% of the lesser of the fair value as of the beginning or ending of the offering period. A total of 173,888 shares of common stock were issued under the ESPP through July 31, 2005. The Company cancelled its Employee Stock Purchase Plan on July 28, 2005.
9. Income Taxes
The Company provides for income taxes using an asset and liability approach, under which deferred income taxes are provided based upon enacted tax laws and rates applicable to periods in which the taxes become payable.
Income (loss) from continuing operations before income taxes consists of the following components (in thousands):
| Year Ended July 31, | |||||||||
| 2007 | 2006 | 2005 | |||||||
| ($ in thousands) | |||||||||
| United States | $ | 6,240 | $ | 1,934 | $ | (2,787 | ) | ||
| Foreign | — | 2,081 | 2,530 | ||||||
| $ | 6,240 | $ | 4,015 | $ | (257 | ) | |||
The components of the provision for income taxes from continuing operations for the years ended July 31, 2007 and July 31, 2006 are as follows (in thousands):
| Year Ended July 31, | ||||||
| 2007 | 2006 | |||||
| ($ in thousands) | ||||||
| Current: | ||||||
| Federal | $ | 137 | $ | 43 | ||
| State | 148 | 52 | ||||
| Foreign | — | (3 | ) | |||
| $ | 285 | $ | 92 | |||
| Deferred: | ||||||
| Federal | $ | — | $ | — | ||
| State | — | — | ||||
| Foreign | — | — | ||||
| $ | — | $ | — | |||
| $ | 285 | $ | 92 | |||
A summary of total tax expense, by classification, included in the accompanying consolidated statements of income is as follows (in thousands):
| Year Ended July 31, | |||||
| 2007 | 2006 | ||||
| ($ in thousands) | |||||
| Continuing operations | $ | 285 | $ | 92 | |
| Discontinued operations | 74 | 197 | |||
| $ | 359 | $ | 289 | ||
59
Deferred tax assets (liabilities) consist of the following (in thousands):
| Year Ended July 31, | |||||||
| 2007 | 2006 | ||||||
| ($ in thousands) | |||||||
| Deferred tax assets: | |||||||
| Accruals and reserves | $ | 5,768 | $ | 6,636 | |||
| Net operating loss carryforwards | 90,230 | 93,796 | |||||
| Research and development credit carryforward | 2,559 | 2,819 | |||||
| Gross deferred tax asset | 98,557 | 103,251 | |||||
| Valuation allowance | (98,557 | ) | (103,251 | ) | |||
| Net deferred tax asset | $ | — | $ | — | |||
Reconciliation of the statutory federal income tax to the Company’s effective tax for the years ended July 31, 2007 and July 31, 2006 are as follows:
| Year Ended July 31, | |||||
| 2007 | 2006 | ||||
| Tax at Federal statutory rate | 34.0% | 34.0% | |||
| State, net of Federal benefit | 1.2% | 0.8% | |||
| Meals and entertainment | 0.5% | 3.0% | |||
| Stock compensation | 3.6% | 16.4% | |||
| Fines and penalties | 0.0% | 0.1% | |||
| Foreign income exclusion | 0.0% | (51.9% | ) | ||
| Research and development credit | (1.2% | ) | (1.5% | ) | |
| Change in valuation allowance | (35.0% | ) | (0.9% | ) | |
| Provision for taxes | 3.1% | 0.0% | |||
A reconciliation for the fiscal year ended July 31, 2005 is not presented as the Company incurred losses during the period.
Included in the July 31, 2007 valuation allowance is approximately $31.0 million related to stock options, which will be credited to stockholder’s equity when realized for tax purposes.
At July 31, 2007, management believes that, based on a number of factors, the available objective evidence creates sufficient uncertainty regarding the realizability of the deferred tax assets such that a full valuation allowance was recorded.
As of July 31, 2007, the Company has approximately $252.4 million of federal net operating losses available to offset future federal taxable income, which expire at various dates through fiscal year 2026. This amount includes approximately $12.5 million of net operating loss carryforwards from the acquisition of Andover.net in fiscal 2000. The deferred tax assets related to this of approximately $5.6 million as of June 7, 2000, may be used to reduce the tax provision if and when realized. Approximately $23.2 million of federal net operating losses usage is limited pursuant to section 382 of the Internal Revenue Code due to certain changes in the Company’s ownership which occurred between 1996 and 1999, and a change in ownership resulting from the Company’s June 2000 acquisition of Andover.net. The Company also has California net operating loss carryforwards of approximately $75.5 million to offset future California taxable income, which expire at various dates through fiscal year 2016. The net operating loss carryforwards stated above are reflective of various federal and state tax limitations.
10. Segment and Geographic Information
The Company’s operating segments are significant strategic business units that offer different products and services. The Company has two operating segments: Online Media and E-commerce. In April 2007, the Company sold its Software business to CollabNet and in December 2005, the Company completed the sale of its Online Images business to Jupitermedia and no longer has operations in these segments.
60
The Company’s Online Media segment consists of a network of Internet web sites serving the IT professional, software development and open source communities and the Company’s E-commerce segment provides online sales of a variety of retail products of interest to the software development and IT communities. The Company’s network of web sites that comprise the Online Media segment include: SourceForge.net, Slashdot, ThinkGeek, Linux.com, freshmeat.net, ITManagersJournal and NewsForge.com. Those corporate expenses that are not allocated to the individual operating segments and are not considered by the Company’s chief decision-making group in evaluating the performance of the operating segments are included in Other.
The accounting policies of the segments are consistent with those described in the summary of significant accounting policies. All intersegment sales have been stated separately in the table below. The Company’s chief decision-making group, as defined under SFAS No. 131, consists of the Chief Executive Officer and the executive team. The Company’s chief decision-making group excludes all intersegment sales when evaluating the performance of the segments. The Company’s assets and liabilities are not discretely allocated or reviewed by operating segment. The depreciation of the Company’s property, equipment and leasehold improvements are allocated based on headcount, unless specifically identified by operating segment.
| Online | Total | ||||||||||||||||||
| (in thousands) | Media | E-commerce | Other | Eliminations | Company | ||||||||||||||
| Year Ended July 31, 2007 | |||||||||||||||||||
| Revenue from external customers | $ | 17,496 | $ | 28,103 | $ | — | $ | — | $ | 45,599 | |||||||||
| Revenue from intersegments | $ | 211 | $ | — | $ | — | $ | (211 | ) | $ | — | ||||||||
| Cost of revenue | $ | 4,733 | $ | 21,200 | $ | — | $ | — | $ | 25,933 | |||||||||
| Gross margin | $ | 12,974 | $ | 6,903 | $ | — | $ | (211 | ) | $ | 19,666 | ||||||||
| Operating income | $ | 177 | $ | 3,336 | $ | — | $ | (169 | ) | $ | 3,344 | ||||||||
| Depreciation expense | $ | 381 | $ | 18 | $ | — | $ | — | $ | 399 | |||||||||
| Year Ended July 31, 2006 | |||||||||||||||||||
| Revenue from external customers | $ | 13,242 | $ | 20,416 | $ | — | $ | — | $ | 33,658 | |||||||||
| Revenue from intersegments | $ | 60 | $ | — | $ | — | $ | (60 | ) | $ | — | ||||||||
| Cost of revenue | $ | 3,732 | $ | 15,605 | $ | — | $ | — | $ | 19,337 | |||||||||
| Gross margin | $ | 9,570 | $ | 4,811 | $ | — | $ | (60 | ) | $ | 14,321 | ||||||||
| Operating income | $ | 360 | $ | 1,999 | $ | 17 | $ | — | $ | 2,376 | |||||||||
| Depreciation expense | $ | 218 | $ | 14 | $ | — | $ | — | $ | 232 | |||||||||
| Year Ended July 31, 2005 | |||||||||||||||||||
| Revenue from external customers | $ | 8,130 | $ | 14,918 | $ | — | $ | — | $ | 23,048 | |||||||||
| Revenue from intersegments | $ | 279 | $ | — | $ | — | $ | (279 | ) | $ | — | ||||||||
| Cost of revenue | $ | 3,320 | $ | 11,591 | $ | — | $ | — | $ | 14,911 | |||||||||
| Gross margin | $ | 5,089 | $ | 3,327 | $ | — | $ | (279 | ) | $ | 8,137 | ||||||||
| Operating income (loss) | $ | (1,624 | ) | $ | 673 | $ | (264 | ) | $ | — | $ | (1,215 | ) | ||||||
| Depreciation expense | $ | 346 | $ | 29 | $ | — | $ | — | $ | 375 | |||||||||
During the time period covered by the table above, the Company marketed its products in the United States through its direct sales force and its online web sites. Revenue for each of the fiscal years ended July 31, 2007, July 31, 2006 and July 31, 2005 were primarily generated from sales to end users in the United States of America.
11. Discontinued Operations
In February 2007, the Company announced that it had engaged a financial advisor to explore various alternatives for its Software business in order to allow management to focus on it core Online Media and E-commerce business. In April 2007, the Company sold substantially all of the assets and certain liabilities of its Software business to CollabNet, Inc. (“CollabNet”) in exchange for a minority equity interest in CollabNet, comprised of 11,733,777 shares of its Series C-1 Preferred Stock, valued at $6.6 million, which is included in “Other Assets” in the Consolidated Balance Sheets.
61
In conjunction with the sale, the Company has agreed to indemnify CollabNet for damages arising from any misrepresentation of representations and warranties, the breach of a covenant or agreement or the failure by the Company to assume certain liabilities excluded from the sale of the business. The indemnification is generally limited to the 2,933,444 shares of CollabNet preferred stock which are held in escrow; however the maximum amount of the indemnification for breach of the non-competition covenant is equal to the 11,733,777 shares of CollabNet Series C-1 preferred stock, owned by the Company. CollabNet may not make an indemnification claim until their aggregate losses under the indemnification provisions exceed $0.1 million. The term of the indemnification is generally through April 24, 2008, except for certain claims for fraud or breaches of the non-competition covenant. The Company believes that it has complied with all of those items for which it has agreed to indemnify CollabNet, and the Company has not been subject to any claims or suffered any losses, and CollabNet has not made any claims pursuant to the Company’s indemnification obligations. Accordingly, the Company has no liabilities recorded for this indemnification as of July 31, 2007.
As specified in the agreement, the assets sold to CollabNet consisted primarily of intellectual property and property and equipment. In conjunction with the sale, the Company terminated those employees of our Software business who were not offered employment by CollabNet and also recorded a restructuring reserve for the excess facility space formerly used by its Software business. The Company’s gain on the sale of this business is as follows (in thousands):
| Proceeds from sale: | |||
| CollabNet, Inc. Series C-1 Preferred Stock | $ | 6,564 | |
| Cash | 19 | ||
| Total proceeds | 6,583 | ||
| Costs and expenses | (676 | ) | |
| Net proceeds | 5,907 | ||
| Net book value of assets and liabilities sold | 1,533 | ||
| Severance and benefits of terminated employees | (1,080 | ) | |
| Idle space restructuring charge | (581 | ) | |
| Other | (57 | ) | |
| Gain on sale, before income taxes | 5,722 | ||
| Provision for income taxes | 148 | ||
| Gain on sale, net of income taxes | $ | 5,574 |
In December 2005, the Company sold the assets, net of deferred revenue, of its Online Images business to Jupitermedia Corporation (“Jupitermedia”) for $9.4 million. The Company received $8.4 million in cash, and $0.9 million in an escrow account, which was fully paid as of July 31, 2007. As specified in the agreement, the assets sold to Jupitermedia consisted primarily of intellectual property, inventories and property and equipment.
62
Income from discontinued operations consists of direct revenue and direct expenses of the Software and Online Images businesses, including cost of revenue, as well as other fixed and allocated costs. A summary of the operating results of the discontinued operations in the accompanying condensed consolidated statements of income is as follows:
| Year Ended July 31, | |||||||||||
| 2007 | 2006 | 2005 | |||||||||
| ($ in thousands) | |||||||||||
| Revenue: | |||||||||||
| Software | $ | 5,236 | $ | 9,974 | $ | 7,555 | |||||
| Online Images | — | 914 | 2,284 | ||||||||
| Revenue | $ | 5,236 | $ | 10,888 | $ | 9,839 | |||||
| Loss from operations: | |||||||||||
| Software | $ | (2,875 | ) | $ | (2,699 | ) | $ | (5,392 | ) | ||
| Online Images | — | 340 | 955 | ||||||||
| Loss from operations before income taxes | (2,875 | ) | (2,359 | ) | (4,437 | ) | |||||
| Income taxes | (74 | ) | (81 | ) | — | ||||||
| Loss from operations, net of income taxes | $ | (2,801 | ) | $ | (2,278 | ) | $ | (4,437 | ) | ||
| Gain from sale of assets: | |||||||||||
| Software | 5,722 | $ | — | $ | — | ||||||
| Online Images | — | 9,595 | — | ||||||||
| Gain from sale of assets before income taxes | 5,722 | 9,595 | — | ||||||||
| Income taxes | 148 | 278 | — | ||||||||
| Gain from sale, net of income taxes | $ | 5,574 | $ | 9,317 | $ | — | |||||
12. Subsequent Events
On September 5, 2007, the Compensation Committee of the Board of Directors approved an amendment to the Directors’ Plan which reduced the automatic grant of options from 80,000 shares to 70,000 shares for each newly-elected non-employee director. In addition, the annual automatic grant of options for 20,000 shares to each non-employee director who has been a member of the Board of Directors for at least six months prior to the annual stockholders’ meeting was replaced by a restricted stock award of 10,000 shares at $0.001 per share at each annual stockholders’ meeting.
On September 26, 2007, Company received notification that it had been named as a defendant in a civil action filed by the Societe des Producteurs de Phonogrammes Francais (“SPPF”) in Paris, France. The action asserted statutory claims under the French Intellectual Property Code. The Company believes that it has meritorious defenses to the action and intends to defend itself vigorously.
63
| Quarterly Financial Data | |||||||||||||
| For the three months ended | |||||||||||||
| (in thousands) | October 31 | January 31 | April 30 | July 31 | |||||||||
| Fiscal Year 2007 | |||||||||||||
| Net revenue | $ | 8,164 | $ | 17,104 | $ | 10,252 | $ | 10,079 | |||||
| Gross margin | 3,517 | 6,310 | 4,887 | 4,952 | |||||||||
| Operating income (loss) | (11 | ) | 2,253 | 1,096 | 6 | ||||||||
| Income from continuing operations | 669 | 2,817 | 1,761 | 708 | |||||||||
| Net income (loss): | $ | (140 | ) | $ | 1,776 | $ | 6,491 | $ | 601 | ||||
| Income per share from continuing operations: | |||||||||||||
| Basic | $ | 0.01 | $ | 0.04 | $ | 0.03 | $ | 0.01 | |||||
| Diluted | $ | 0.01 | $ | 0.04 | $ | 0.03 | $ | 0.01 | |||||
| Net income per share: | |||||||||||||
| Basic | $ | — | $ | 0.03 | $ | 0.10 | $ | 0.01 | |||||
| Diluted | $ | — | $ | 0.03 | $ | 0.09 | $ | 0.01 | |||||
| Fiscal Year 2006 | |||||||||||||
| Net revenue | $ | 6,167 | $ | 11,756 | $ | 7,901 | $ | 7,834 | |||||
| Gross margin | 2,462 | 4,290 | 3,797 | 3,772 | |||||||||
| Operating income (loss) | (127 | ) | 1,202 | 778 | 521 | ||||||||
| Income from continuing operations | 142 | 1,436 | 1,172 | 1,173 | |||||||||
| Net income (loss): | $ | (1,234 | ) | $ | 10,502 | $ | 997 | $ | 697 | ||||
| Income per share from continuing operations: | |||||||||||||
| Basic | $ | — | $ | 0.02 | $ | 0.02 | $ | 0.02 | |||||
| Diluted | $ | — | $ | 0.02 | $ | 0.02 | $ | 0.02 | |||||
| Net income (loss) per share: | |||||||||||||
| Basic | $ | (0.02 | ) | $ | 0.17 | $ | 0.02 | $ | 0.01 | ||||
| Diluted | $ | (0.02 | ) | $ | 0.17 | $ | 0.02 | $ | 0.01 | ||||
| ITEM 9. | Changes in and Disagreements with Accountants on Accounting and Financial Disclosure |
Not applicable.
ITEM 9A.Controls and Procedures
Evaluation of Disclosure Controls and Procedures
The Company’s management, with the participation of the Company’s chief executive officer and chief financial officer, evaluated the effectiveness of the Company’s disclosure controls and procedures (as defined in Rules 13a-15(e) and 15d-15(e) under the Securities Exchange Act of 1934) as of July 31, 2007. Based on this evaluation, the Company’s chief executive officer and chief financial officer concluded that as of July 31, 2007, the Company’s disclosure controls and procedures were effective.
Changes in Internal Control over Financial Reporting
No change in the Company’s internal controls over financial reporting (as defined in Rules 13a-15(f) and 15d-15(f) under the Securities Exchange Act) occurred during the fourth quarter ended July 31, 2007, that has materially affected, or is reasonably likely to materially affect, the Company’s internal control over financial reporting.
Management’s Report on Internal Control over Financial Reporting
Management is responsible for establishing and maintaining adequate internal control over financial reporting and for the assessment of the effectiveness of internal control over financial reporting. As defined in Rules 13a-15(f) and 15d-15(f) under the Securities Exchange Act of 1934, internal control over financial reporting is a process
64
designed by, or under the supervision of, the Company’s principal executive and principal financial officers and effected by the Company’s Board of Directors, management and other personnel, to provide reasonable assurance regarding the reliability of financial reporting and the preparation of financial statements for external purposes in accordance with generally accepted accounting principles.
The Company’s internal control over financial reporting is supported by written policies and procedures that: (1) pertain to the maintenance of records that, in reasonable detail, accurately and fairly reflect the transactions and dispositions of the Company’s assets; (2) provide reasonable assurance that transactions are recorded as necessary to permit preparation of financial statements in accordance with generally accepted accounting principles and that receipts and expenditures of the company are being made only in accordance with authorizations of the Company’s management and directors; and (3) provide reasonable assurance regarding prevention or timely detection of unauthorized acquisition, use or disposition of the Company’s assets that could have a material effect on the financial statements.
In connection with the preparation of the Company’s annual financial statements, management of the Company has undertaken an assessment of the effectiveness of the Company’s internal control over financial reporting as of July 31, 2007 based on criteria established inInternal Control – Integrated Framework issued by the Committee of Sponsoring Organizations of the Treadway Commission (the “COSO Framework”). Management’s assessment included an evaluation of the design of the Company’s internal control over financial reporting and testing of the operational effectiveness of the Company’s internal control over financial reporting. As a result of this assessment, management has concluded that, as of July 31, 2007, the Company’s internal control over financial reporting was effective based on those criteria.
Our independent registered public accounting firm, Stonefield Josephson, Inc., has issued an attestation report on management’s assessment of our internal control over financial reporting, which is included in this Annual Report on Form 10-K.
Limitations on Effectiveness of Controls
SourceForge, Inc.’s management, including our chief executive officer and chief financial officer, does not expect that our disclosure controls or our internal control over financial reporting will prevent or detect all error and all fraud. A control system, no matter how well designed and operated, can provide only reasonable, not absolute, assurance that the control system’s objectives will be met. The design of a control system must reflect the fact that there are resource constraints, and the benefits of controls must be considered relative to their costs. Further, because of the inherent limitations in all control systems, no evaluation of controls can provide absolute assurance that misstatements due to error or fraud will not occur or that all control issues and instances of fraud, if any, within the Company have been detected. These inherent limitations include the realities that judgments in decision-making can be faulty and that breakdowns can occur because of simple error or mistake. Controls can also be circumvented by the individual acts of some persons, by collusion of two or more people, or by management override of the controls. The design of any system of controls is based in part on certain assumptions about the likelihood of future events, and there can be no assurance that any design will succeed in achieving its stated goals under all potential future conditions. Projections of any evaluation of the effectiveness of controls to future periods are subject to risks. Over time, controls may become inadequate because of changes in conditions or deterioration in the degree of compliance with policies or procedures.
65
ITEM 10.Directors, Executive Officers and Corporate Governance
The information called for by this item is incorporated by reference to the sections entitled “Certain Beneficial Owners”, “Security Ownership of Directors and Executive Officers” and “Information About The Directors, Nominees And Executive Officers” in the Company’s 2007 Proxy Statement, which will be delivered to stockholders in connection with the Company’s annual stockholders’ meeting to be held on December 5, 2007.
Code of Ethics
In addition to the Company’s Code of Business Conduct and Ethics that is applicable to all employees and directors, the Company has adopted a Code of Ethics for Principal Executive and Senior Financial Officers. The Company has posted the text of its Code of Ethics for Principal Executive and Senior Financial Officers on its Internet web site at:
http://media.corporate-ir.net/media_ files/irol/82/82629/corpgov/execFinancial_Officer_Code.pdf
ITEM 11.Executive Compensation
The information called for by this item is incorporated by reference to the section entitled “Compensation of Directors and Executive Officers” in the Company’s 2007 Proxy Statement, which will be delivered to stockholders in connection with the Company’s annual stockholders’ meeting to be held on December 5, 2007.
| ITEM 12. | Security Ownership of Certain Beneficial Owners and Management and Related Stockholder Matters |
Equity Compensation Plans
The following table summarizes our equity compensation plans as of July 31, 2007, all of which have been approved by our stockholders:
| A | B | C | ||||
| Number of securities remaining | ||||||
| Number of securities to be | Weighted average | available for future issuance under | ||||
| issued upon exercise of | exercise price of | equity compensation plan (excluding | ||||
| Plan Category (1) | outstanding options | outstanding options | securities reflected in column A) | |||
| Equity compensation plans | ||||||
| approved by stockholders | 6,500,635 (2) | $3.89 | 9,131,900 (3)-(4) |
| (1) | The table does not include information for equity compensation plans assumed by the Company in acquisitions. As of July 31, 2007, a total of 69,611 shares of the Company’s common stock remain issuable and outstanding upon exercise of options granted under plans assumed by the Company in its acquisition of OSTG. The weighted average exercise price of all outstanding options granted under these plans at July 31, 2007 is $39.19. The Company does not grant additional awards under these assumed plans. | |
| (2) | Includes 5,795,633 options outstanding under the Company’s 1998 Stock Plan and 705,002 options outstanding under the Company’s 1999 Director’s Plan. | |
| (3) | Subject to the terms of the 1998 Stock Plan, an annual increase is to be added on the first day of the Company’s fiscal year equal to the lesser of: 4,000,000 shares, or 4.9% of the outstanding shares on the first day of the new fiscal year or an amount determined by the Board of Directors. | |
| (4) | Subject to the terms of the 1999 Directors Plan, an annual increase is to be added on the first day of the Company’s fiscal year equal to the lesser of: 250,000 shares, or 0.5% of the outstanding shares on the first day of the new fiscal year or an amount determined by the Board of Directors. | |
66
The information called for by this item is incorporated by reference to the sections entitled “Certain Beneficial Owners” and “Security Ownership of Directors and Executive Officers” in the Company’s 2007 Proxy Statement, which will be delivered to stockholders in connection with the Company’s annual stockholders’ meeting to be held on December 5, 2007.
ITEM 13.Certain Relationships and Related Transactions, and Director Independence
The information called for by this item is incorporated by reference to the section entitled “Certain Relationships and Related Transactions” in the Company’s 2007 Proxy Statement, which will be delivered to stockholders in connection with the Company’s annual stockholders’ meeting to be held on December 5, 2007.
ITEM 14.Principal Accountant Fees and Services
The information called for by this item is incorporated by reference to the section entitled “Principal Accountant Fees and Services” in the Company’s 2007 Proxy Statement, which will be delivered to stockholders in connection with the Company’s annual stockholders’ meeting to be held on December 5, 2007.
ITEM 15.Exhibits and Financial Statement Schedule
(a) The following documents are filed as part of this report:
1. All Financial Statements:
See the Consolidated Financial Statements and notes thereto in Item 8 above.
2. Schedule II — Valuation and Qualifying Accounts are filed as part of this Form 10-K.
3. Exhibits:
See the Exhibit Index.
67
Pursuant to the requirements of Section 13 or 15(d) of the Securities Exchange Act of 1934, the Registrant has duly caused this report to be signed on its behalf by the undersigned, thereunto duly authorized.
| SOURCEFORGE, INC. | |||
| By: | /s/ ALIJENAB | ||
| ALIJENAB | |||
| Chief Executive Officer and President | |||
| Date: October 17, 2007 | |||
68
SCHEDULE II — VALUATION AND QUALIFYING ACCOUNTS
(In thousands)
| Balance | Charged to | ||||||||
| Beginning | Costs and | Balance End | |||||||
| Description | of Period | Expenses | Deductions | of Period | |||||
| Year Ended July 31, 2005 | |||||||||
| Allowance for doubtful accounts | $ 71 | 36 | 7 | $100 | |||||
| Allowance for excess and obsolete inventory | $ 33 | 57 | 31 | $ 59 | |||||
| Year Ended July 31, 2006 | |||||||||
| Allowance for doubtful accounts | $100 | 84 | 62 | $122 | |||||
| Allowance for excess and obsolete inventory | $ 59 | 40 | 3 | $ 96 | |||||
| Year Ended July 31, 2007 | |||||||||
| Allowance for doubtful accounts | $122 | 7 | 53 | $ 76 | |||||
| Allowance for excess and obsolete inventory | $ 96 | (38 | ) | 1 | $ 57 | ||||
69
EXHIBIT INDEX
| Exhibit | |||||
| Number | |||||
| 2.1(11 | ) | — | Asset Purchase Agreement by and between VA Software Corporation and CollabNet, Inc., dated April 24, 2007 | ||
| 3.1(1 | ) | — | Amended and Restated Certificate of Incorporation of the Registrant | ||
| 3.2(14 | ) | — | Bylaws of the Registrant | ||
| 3.3(13 | ) | — | Certificate of Ownership and Merger of OSTG, Inc. with and into VA Software Corporation, dated May 22, 2007 | ||
| 4.1(1 | ) | — | Specimen Common Stock Certificate | ||
| 4.2(2 | ) | — | Warrant to Purchase Shares of Common Stock issued to The Riverview Group LLC | ||
| 10.1(1 | ) ‡ | — | Form of Indemnification Agreement between the Registrant and each of its directors and officers | ||
| 10.2(1 | ) ‡ | — | 1998 Stock Plan and forms of agreement thereunder | ||
| 10.3(1 | ) ‡ | — | 1999 Employee Stock Purchase Plan | ||
| 10.4(1 | ) ‡ | — | 1999 Director Option Plan | ||
| 10.6†(3 | ) | — | Master Lease Agreement between Boca Global, Inc. and Bordeaux Partners LLC | ||
| 10.7†(4 | ) | — | Master Lease Agreement between Registrant and Renco Investment Company | ||
| 10.8(5 | ) | — | Consent of Linus Torvalds | ||
| 10.9(7 | ) | — | Sublease between registrant and @Road, Inc., dated June 9, 2004. | ||
| 10.10(8 | ) | — | Consent to Sublease Agreement between registrant, @Road, Inc. and Renco Investment Company, dated June 9, 2004. | ||
| 10.11(6 | ) | — | Registration Rights Agreement between Registrant and certain holders of Common Stock, dated November 6, 2003 | ||
| 10.12(9 | ) | — | First Amendment to Registration Rights Agreement between Registrant and certain holders of Common Stock, dated October 13, 2004 | ||
| 10.13(10 | ) | — | Asset Purchase Agreement dated December 23, 2005 by and between JupiterImages Corporation, SourceForge, Inc., and Animation Factory, Inc. | ||
| 10.14(12 | ) | — | Separation Agreement and Release by and between Darryll E. Dewan and VA Software Corporation, dated May 4, 2007 | ||
| 10.15(15 | ) | — | Mountain View City Center Net Office Lease by and between SourceForge, Inc. and Eagle Square Partners dated July 14, 2007 | ||
| 10.16(16 | ) ‡ | — | Fiscal Year 2008 Named Executive Officer Bonus Policy and Plan | ||
| 10.17(17 | ) | — | Separation Agreement and Release by and between Richard J. Marino, Jr. and SourceForge, Inc., dated October 4, 2007. | ||
| 23.1 | — | Consent of Stonefield Josephson, Inc., Independent Registered Public Accounting Firm | |||
| 23.2 | — | Consent of BDO Seidman, LLP, Independent Registered Public Accounting Firm | |||
| 24.1 | — | Power of Attorney (see signature page) | |||
| 31. 1 | — | Certification of Chief Executive Officer Pursuant to Section 302 of The Sarbanes-Oxley Act Of 2002 | |||
| 31.2 | — | Certification of Chief Financial Officer Pursuant to Section 302 of The Sarbanes-Oxley Act Of 2002 | |||
70
| Exhibit | |||||
| Number | |||||
| 32.1 | — | Certification of Chief Executive Officer Pursuant to Section 906 of The Sarbanes-Oxley Act Of 2002 | |||
| 32.2 | — | Certification of Chief Financial Officer Pursuant to Section 906 of The Sarbanes-Oxley Act Of 2002 | |||
| † | Confidential treatment has been requested by the Registrant as to certain portions of this exhibit. The omitted portions have been separately filed with the Commission. | |
| (1) | Incorporated by reference to the corresponding exhibit of Registrant’s form S-1 and the amendment thereto (Commission registration no. 333-88687). | |
| (2) | Incorporated by reference from Exhibit 4.1 of Registrant’s Current Report on Form 8-K filed on November 7, 2003. | |
| (3) | Incorporated by reference from Exhibit 10.16 of Registrant’s form S-1 and the amendments thereto (Commission registration no. 333-88687). | |
| (4) | Incorporated by reference from Exhibit 10.14 of Registrant’s Annual Report on Form 10-K for the period ended June 28, 2000 filed on October 26, 2000 (Commission file number 000-28369). | |
| (5) | Incorporated by reference from Exhibit 10.18 of Registrant’s Quarterly Report on Form 10-Q for the period ended January 28, 2000 filed on March 13, 2000 (Commission file number 000-28369). | |
| (6) | Incorporated by reference from Exhibit 10.2 of Registrant’s Current Report on Form 8-K filed on November 7, 2003. | |
| (7) | Incorporated by reference from Exhibit 10.42 of Registrant’s Annual Report on Form 10-K for the period ended July 31, 2004 filed on October 31, 2005 (Commission file number 000-28369). | |
| (8) | Incorporated by reference from Exhibit 10.43 of Registrant’s Annual Report on Form 10-K for the period ended July 31, 2004 filed on October 31, 2005 (Commission file number 000-28369). | |
| (9) | Incorporated by reference from Exhibit 10.12 of Registrant’s Annual Report on Form 10-K for the period ended July 31, 2004 filed on October 31, 2005 (Commission file number 000-28369). | |
| (10) | Incorporated by reference from Exhibit 2.1 of Registrant’s Quarterly Report on Form 10-Q for the period ended January 31, 2006 filed on April 10, 2006 (Commission file number 000-28369). | |
| (11) | Incorporated by reference from Exhibit 2.1 of Registrant’s Current Report on Form 8-K filed on April 25, 2007. | |
| (12) | Incorporated by reference from Exhibit 10.1 of Registrant’s Current Report on Form 8-K filed on May 4, 2007. | |
| (13) | Incorporated by reference from Exhibit 3.1 of Registrant’s Current Report on Form 8-K filed on May 24, 2007. | |
| (14) | Incorporated by reference from Exhibit 3.2 of Registrant’s Current Report on Form 8-K filed on May 24, 2007. | |
| (15) | Incorporated by reference from Exhibit 10.1 of Registrant’s Current Report on Form 8-K filed on July 18, 2007. | |
| (16) | Incorporated by reference from Exhibit 10.1 of Registrant’s Current Report on Form 8-K filed on September 11, 2007. | |
| (17) | Incorporated by reference from Exhibit 10.1 of Registrant's Current Report on Form 8-K filed on October 4, 2007. | |
| ‡ | Denotes a management contract or compensatory plan or arrangement. |
71