Table of Contents
As filed with the Securities and Exchange Commission on August 12, 2010
Registration No. 333-165142
UNITED STATES
SECURITIES AND EXCHANGE COMMISSION
Washington, D.C. 20549
Pre-effective
Amendment No. 4
to
FORM S-1
REGISTRATION STATEMENT
Under
The Securities Act of 1933
Force10 Networks, Inc.
(Exact name of Registrant as specified in its charter)
| Delaware | 3576 | 94-3340753 | ||
(State or other jurisdiction of incorporation or organization) | (Primary Standard Industrial Classification Code Number) | (I.R.S. Employer Identification Number) |
Force10 Networks, Inc.
350 Holger Way
San Jose, California 95134
(408) 571-3500
(Address, including zip code, and telephone number, including area code, of Registrant’s principal executive offices)
Henry Wasik
President and Chief Executive Officer
Force10 Networks, Inc.
350 Holger Way
San Jose, California 95134
(408) 571-3500
(Name, address, including zip code, and telephone number, including area code, of agent for service)
Copies to:
| Mark A. Leahy, Esq. | Leah Maher, Esq. | Katharine A. Martin, Esq. | ||
| Jeffrey R. Vetter, Esq. | Vice President and | Wilson Sonsini Goodrich & | ||
| Fenwick & West LLP | General Counsel | Rosati, Professional | ||
| Silicon Valley Center | Force10 Networks, Inc. | Corporation | ||
| 801 California Street | 350 Holger Way | 650 Page Mill Road | ||
| Mountain View, California 94041 | San Jose, California 95134 | Palo Alto, California 94304 | ||
| (650) 988-8500 | (408) 571-3500 | (650) 493-9300 |
Approximate date of commencement of proposed sale to the public:As soon as practicable after the effective date of this Registration Statement.
If any of the securities being registered on this Form are to be offered on a delayed or continuous basis pursuant to Rule 415 under the Securities Act of 1933 check the following box. ¨
If this Form is filed to register additional securities for an offering pursuant to Rule 462(b) under the Securities Act, please check the following box and list the Securities Act registration statement number of the earlier effective registration statement for the same offering. ¨
If this Form is a post-effective amendment filed pursuant to Rule 462(c) under the Securities Act, check the following box and list the Securities Act registration statement number of the earlier effective registration statement for the same offering. ¨
If this Form is a post-effective amendment filed pursuant to Rule 462(d) under the Securities Act, check the following box and list the Securities Act registration statement number of the earlier effective registration statement for the same offering. ¨
Indicate by check mark whether the registrant is a large accelerated filer, an accelerated filer, a non-accelerated filer, or a smaller reporting company. See the definitions of “large accelerated filer,” “accelerated filer” and “smaller reporting company” in Rule 12b-2 of the Exchange Act. (Check one):
Large accelerated filer ¨ | Accelerated filer ¨ | Non-accelerated filerx | Smaller reporting company ¨ | |||
| (Do not check if a smaller reporting company) |
CALCULATION OF REGISTRATION FEE
| Title of Each Class of Securities to be Registered | Proposed Maximum Aggregate Offering Price(1) | Amount of Registration Fee | ||
Common Stock, par value $0.0001 per share | $143,750,000 | $10,250(2) | ||
| (1) | Estimated solely for the purpose of calculating the registration fee in accordance with Rule 457(o) under the Securities Act of 1933, as amended. |
| (2) | Previously paid. |
The registrant hereby amends this registration statement on such date or dates as may be necessary to delay its effective date until the registrant shall file a further amendment which specifically states that this registration statement shall thereafter become effective in accordance with Section 8(a) of the Securities Act of 1933 or until the registration statement shall become effective on such date as the Securities and Exchange Commission, acting pursuant to said Section 8(a), may determine.
Table of Contents
The information in this preliminary prospectus is not complete and may be changed. We and the selling stockholders may not sell these securities until the registration statement filed with the Securities and Exchange Commission is effective. This preliminary prospectus is not an offer to sell these securities, and we and the selling stockholders are not soliciting an offer to buy these securities in any state where the offer or sale is not permitted.
Subject to completion, dated August 12, 2010
Preliminary Prospectus
shares
Force10 Networks, Inc.

Common stock
This is an initial public offering of shares of common stock by Force10 Networks, Inc. We are selling shares of common stock. The selling stockholders identified in this prospectus are selling an additional shares of common stock. We will not receive any proceeds from the sale of shares of common stock by the selling stockholders. The estimated initial public offering price is between $ and $ per share.
We are applying to list our common stock for trading on the New York Stock Exchange under the symbol “FCTN.”
| Per share | Total | |||||
Initial public offering price | $ | $ | ||||
Underwriting discounts and commissions | $ | $ | ||||
Proceeds to us, before expenses | $ | $ | ||||
Proceeds to selling stockholders, before expenses | $ | $ | ||||
We have granted the underwriters an option for a period of 30 days to purchase from us up to additional shares of common stock at the initial public offering price, less the underwriting discounts and commissions.
Investing in our common stock involves a high degree of risk. See “Risk factors” beginning on page 13.
Neither the Securities and Exchange Commission nor any state securities commission has approved or disapproved of these securities or passed on the adequacy or accuracy of this prospectus. Any representation to the contrary is a criminal offense.
The underwriters expect to deliver the shares of common stock to purchasers on .
| J.P. Morgan | Deutsche Bank Securities | Barclays Capital | ||
| Baird | Cowen and Company | RBC Capital Markets | ||
| Pacific Crest Securities | ||||
, 2010
Table of Contents
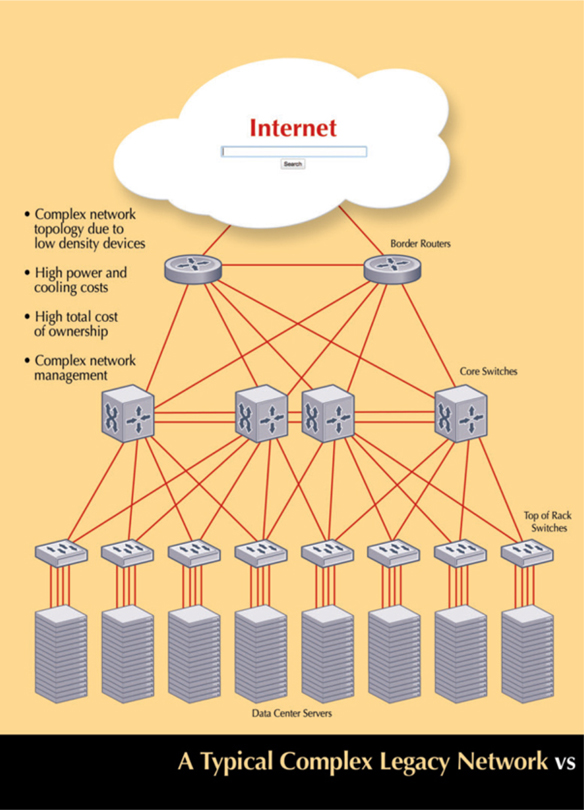
Table of Contents
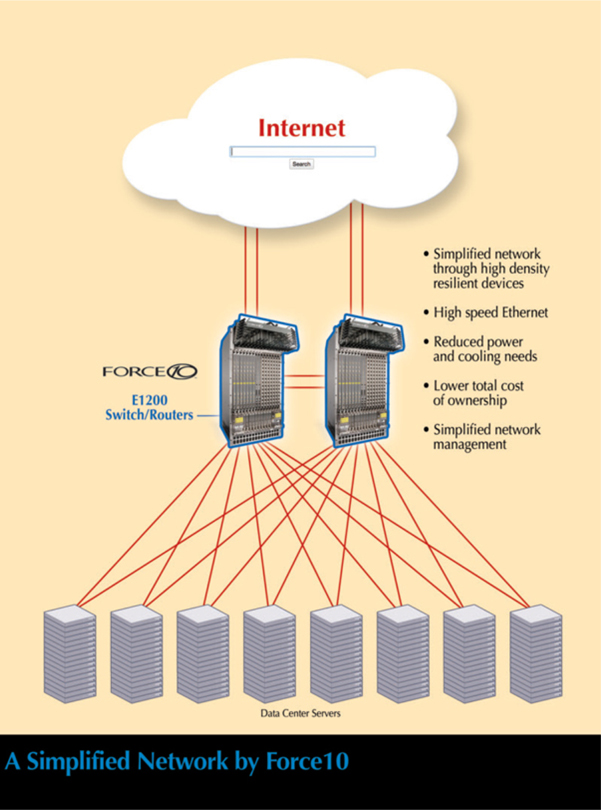
Table of Contents
| Page | ||
| 1 | ||
| 13 | ||
Special note regarding forward-looking statements and industry data | 33 | |
| 34 | ||
| 34 | ||
| 35 | ||
| 37 | ||
| 39 | ||
Management’s discussion and analysis of financial condition and results of operations | 42 | |
| 87 | ||
| 102 | ||
| 109 | ||
| 130 | ||
| 134 | ||
| 140 | ||
| 145 | ||
Material United States federal income tax consequences to non-U.S. holders | 148 | |
| 153 | ||
| 159 | ||
| 159 | ||
| 160 | ||
| F-1 | ||
You should rely only on the information contained in this prospectus. Neither we nor the selling stockholders have authorized anyone to provide you with information different from that contained in this prospectus. We and the selling stockholders are offering to sell, and seeking offers to buy, common stock only in jurisdictions where offers and sales are permitted. The information contained in this prospectus is accurate only as of the date of this prospectus, regardless of the time of delivery of this prospectus or of any sale of our common stock.
No action is being taken in any jurisdiction outside the United States to permit a public offering of the common stock or possession or distribution of this prospectus in that jurisdiction. Persons who come into possession of this prospectus in jurisdictions outside the United States are required to inform themselves about and to observe any restrictions as to this offering and the distribution of this prospectus applicable to that jurisdiction.
i
Table of Contents
The following summary highlights information contained elsewhere in this prospectus. Before deciding whether to purchase shares of our common stock, you should read this summary and the more detailed information in this prospectus, including our consolidated financial statements and related notes and the discussion of the risks of investing in our common stock in the section entitled “Risk factors.”
Overview
We provide high performance networking solutions for data center and other network deployments. Our solutions include switches and routers that deliver the high density, performance, resiliency and reliability that our customers demand in a cost-effective manner.
We are organized in two operating segments—Ethernet, which consists of our E-Series, C-Series and S-Series products, and Transport, which includes our multi-service transport and access products. Our broad portfolio of Ethernet products helps our customers deploy a seamless, high-capacity, scalable network fabric extending from the server and storage edge to the network core and into the cloud. Our Ethernet products are deployed in data center, high performance enterprise and service provider networks utilizing 1 Gigabit Ethernet, or GbE, and 10 GbE technologies. Our E-Series and C-Series products are also designed to support future customer deployments of 40 and 100 GbE technologies. Our products combine the features of our modular Force10 Operating System, or FTOS, software and our scalable system architecture to forward or route network traffic at the maximum throughput capacity of each port. This maximum throughput port capacity is referred to as “non-blocking line-rate” throughput. This enables maximum network capacity utilization, by minimizing performance bottlenecks, even under heavy traffic conditions, and reduces the number of network systems required to handle the same aggregate network traffic. Our solutions also use less power, generate less heat and therefore require less cooling power than competing systems. As a result, our solutions allow customers to reduce capital expenditures and operating costs and support “green” initiatives in data centers.
We complement our family of Ethernet products with multi-service transport and access products targeted at service providers. Multi-service transport products are used within telecommunications network infrastructure to transport voice, video and data traffic between different carrier facilities. Access products are networking devices that provide end users access to a wide area network. These products support the delivery of a wide range of legacy telecommunications services to metro networks, which span metropolitan areas or large campuses, and to access networks, which are located between end users and service provider central offices. These products also support Ethernet services to enable the transition from legacy telecommunications networks, which are the technologies and infrastructure originally designed to carry phone-based traffic and services, but are not optimized for Internet-based traffic and services such as data and video, to packet-optimized Ethernet-based networks, which are the technologies and infrastructure optimized for carrying Internet-based traffic and services, including voice. Our family of multi-service transport and access products includes the Traverse and TraverseEdge products, the MASTERseries and Axxius products and the Adit product.
1
Table of Contents
In fiscal 2009, our products were shipped to more than 1,100 end customers in 63 countries worldwide that have some of the most demanding performance environments, including Fortune 100 companies, Internet portals, global carriers, leading research laboratories and government organizations. We sell our products through our direct sales force, resellers, distributors and system integrators. For the three months ended March 31, 2010, we generated revenue of $46.6 million and had net income of $0.2 million, and for the 12 months ended March 31, 2010, we generated revenue of $164.1 million and had a net loss of $40.7 million.
Industry overview
The proliferation of rich media content, network-connected devices and on-demand software applications is driving disruptive change throughout the networking industry, resulting in tremendous growth in Internet Protocol, or IP, network traffic and the need for more resilient and scalable networks in organizations. These trends have also caused network traffic to become increasingly volatile and unpredictable in nature, requiring higher capacity and bandwidth management in the network.
Due to its cost-effectiveness, scalability and increasing reliability, Ethernet has emerged as the leading technology for building IP-based networks to address the increasing bandwidth demands for a wide variety of network traffic both internal and external to organizations. As the fastest available standard for Ethernet technology, 10 GbE is emerging as the Ethernet technology of choice to satisfy increasing bandwidth demands. The Dell’Oro Group, an independent market research firm, estimates that the worldwide 10 GbE network equipment market will grow from $2.8 billion in 2009 to $8.5 billion in 2014, representing a 25% compounded annual growth rate, or CAGR.(1)
The pervasiveness and increasing complexity of computing, combined with the growth in IP traffic, driven by the demand for anytime and anywhere access to applications and network content, has made high performance IP-based networks essential for organizations. High performance networking equipment is especially important for data centers, which are increasingly being used to centralize computing and storage resources. Organizations that utilize data centers as a core part of their operations require cost-effective networking solutions that provide high density, performance, resiliency and reliability, as network downtime often results in lost revenue and increased costs. As organizations initially build-out or continue to upgrade their networks to high performance IP-based networks, several trends have developed that further exacerbate the challenge to cost-effectively deploy these high performance networking solutions:
| • | data center consolidation; |
| • | increasing adoption of virtualization and cloud computing technologies; and |
| • | increasing focus on managing operating costs. |
These trends are driving customers to evaluate new data center architectures for initial deployments and are accelerating upgrade and replacement cycles within existing data center deployments. According to IDC, an independent market research firm, worldwide data center Ethernet switching revenue is expected to grow from $3.1 billion in 2009 to $4.3 billion in 2013, representing a 9% CAGR.(2)
| (1) | Source: The Dell’Oro Group,Ethernet Forecast Tables, February 2010. |
| (2) | Source: IDC,Worldwide Datacenter Network 2009-2013 Forecast, Doc #220397, October 2009. |
2
Table of Contents
Next-generation data center networking architectures must continue to address the following challenges:
| • | Density. Solutions need to provide high port density in order to reduce the cost of networking and the physical space required to support current and future bandwidth needs. |
| • | High performance. Solutions need to be architected to efficiently accommodate high-throughput and volatile traffic patterns that, if blocked, can create congestion, resulting in degraded network and application performance. |
| • | Resiliency and reliability. Solutions need to be resilient and reliable as networks have become essential for most organizations. Without failure isolation and reliable recovery mechanisms, a large number of users can experience interruptions and delays, which can have significant adverse financial and business impacts. |
| • | Ease of use. Solutions need to be easily deployed and managed in heterogeneous network environments. Products that support standards-based technologies can help to reduce the challenges associated with managing and provisioning equipment from multiple vendors. |
| • | Cost-effectiveness. Solutions need to address the challenges described above while minimizing both capital expenditures and operating costs. |
Our solutions
Our solutions offer the following key benefits to our customers:
| • | High density architecture. We believe our solutions offer the highest port density per rack inch in the industry, which enables our products to handle the same aggregate traffic using fewer ports. With high port density, our products can process more traffic per card, leaving more chassis space available to accommodate future capacity expansion. This enables our customers to cost-effectively deploy more compact, high performance and scalable networks. Additionally, our 40 GbE- and 100 GbE-ready solutions are designed to help our customers make seamless transitions to emerging Ethernet standards. |
| • | High performance architecture. Our solutions are able to perform at non-blocking line-rate throughput in order to minimize network congestion and meet latency requirements for real-time data and application delivery. Our solutions can also maintain performance even under heavy load or abnormal network conditions by rapidly processing network changes and determining the best way to forward or route traffic. |
| • | Resiliency and reliability. Our solutions can meet the requirements of the most complex and demanding network environments. The combination of both modular software and no “single point of failure” hardware design helps to reduce the impact of component or process failures by isolating errors, which in turn minimizes network disruptions. |
| • | Ease of use. Our standards-based solutions can be easily deployed and managed in heterogeneous network environments. Our FTOS software uses industry-standard commands and management interfaces to enable seamless interoperability and deployment with minimal staff retraining. |
3
Table of Contents
| • | Low total cost of ownership. Our high-density solutions help our customers reduce the physical footprint required to handle the same aggregate network traffic. Our solutions are also designed to use less power, generate less heat and therefore require less cooling power than competing systems. As a result, our systems enable customers to reduce capital expenditures and operating costs and support “green” initiatives in data centers. |
Our strategy
Our goal is to become the industry’s leading supplier of high performance networking solutions. Key elements of our strategy include:
| • | Maintain and extend our technological advantages. We intend to continue to invest in high-capacity, compact, power-efficient and resilient system architectures as well as standards-based convergence, virtualization, automation and provisioning technologies. |
| • | Extend our position as a leading data center networking provider. We intend to enhance our position as a leader and innovator in the data center market. Through our direct sales organization, channel partners, professional services offerings and increased marketing activities, we intend to aggressively pursue data center opportunities. |
| • | Leverage our position as a leading data center networking provider in adjacent markets. We intend to focus on adjacent markets where our technology can be leveraged for other applications, and to continue to sell new solutions into our installed base. |
| • | Leverage and grow our channel partners and global presence. We intend to further augment our sales efforts in the United States and internationally with additional resellers, distributors and system integrators. |
| • | Pursue opportunistic acquisitions. We intend to opportunistically pursue acquisition opportunities that have complementary technologies and services and that can accelerate the growth of our business. |
Risk factors
We are subject to a number of risks which you should be aware of before you invest in our common stock, including:
| • | our markets are extremely competitive and one competitor in particular has a dominant share of the market; |
| • | it is difficult to evaluate our current business and prospects as a result of our prior acquisitions; |
| • | our future financial performance depends on growth in the market for standards-based GbE and 10 GbE technologies; |
| • | we have a history of losses and we may not be able to become profitable; |
| • | the success of our business depends on increased sales of our Ethernet products; and |
| • | our operating results have fluctuated in the past and are difficult to predict. |
These risks are discussed more fully in the section entitled “Risk factors” following this prospectus summary.
4
Table of Contents
Corporate information
We incorporated in the State of Delaware in 1999 as Turin Networks, Inc., with headquarters in Petaluma, California. In February 2008, we acquired Carrier Access Corporation, which we refer to as Carrier Access. In March 2009, we acquired Force10 Networks, Inc., which we refer to as “Legacy Force10.” We then moved our corporate headquarters to San Jose, California and changed our name to Force10 Networks, Inc. Our executive offices are located at 350 Holger Way, San Jose, California 95134, and our telephone number is (408) 571-3500. Our website address is www.force10networks.com. The information on, or that can be accessed through, our website is not part of this prospectus.
In this prospectus, unless otherwise noted, “Force10 Networks,” “we,” “us” and “our” refer to Force10 Networks, Inc. and its subsidiaries.
The Force10 logo and the names Force10 Networks, E-Series, Traverse, TraverseEdge, TransAccess, Axxius and Adit are registered trademarks and ExaScale, C-Series, S-Series, TeraScale, FTOS, and MASTERseries are trademarks of Force10 Networks, Inc. All other trademarks and trade names appearing in this prospectus are the property of their respective owners.
5
Table of Contents
The offering
Common stock offered by Force10 Networks, Inc. | shares |
Common stock offered by the selling stockholders | shares |
Over-allotment option | shares |
Common stock to be outstanding after this offering | shares |
Use of proceeds | We intend to use our net proceeds from this offering for working capital and general corporate purposes. Accordingly, our management will have broad discretion in the application of our net proceeds from this offering, and investors will be relying on management’s judgment regarding the application of these net proceeds. We also may use a portion of our net proceeds from this offering to acquire complementary businesses, products, services or technologies, but we currently have no agreements, commitments or understandings relating to any material acquisitions. We will not receive any proceeds from the sale of shares by the selling stockholders. |
Risk factors | You should carefully consider the information set forth under “Risk factors” together with all of the other information set forth in this prospectus before deciding to invest in shares of our common stock. |
Proposed NYSE symbol | FCTN |
The shares of our common stock to be outstanding after this offering are based on 56,289,880 shares of our common stock outstanding on a pro forma basis as of March 31, 2010 and exclude:
| • | 7,280,423 shares of common stock issuable upon the exercise of options outstanding as of March 31, 2010, with a weighted average exercise price of $0.36 per share; |
| • | 3,121,041 shares of common stock issuable upon the exercise of options granted between April 1, 2010 and June 7, 2010, with a weighted average exercise price of $2.89 per share; |
| • | shares of common stock reserved for future issuance under our 2010 equity incentive plan and 2010 employee stock purchase plan, which will become effective in connection with this offering; and |
| • | 5,924,152 shares of common stock issuable upon exercise of warrants outstanding as of March 31, 2010, with a weighted average exercise price of $8.96 per share. |
6
Table of Contents
Unless otherwise noted, all information in this prospectus gives effect to a 1-for-175 reverse stock split effected in March 2009 and a 40-for-1 forward stock split effected in October 2009 and assumes:
| • | no exercise of the underwriters’ over-allotment option; |
| • | the conversion of all shares of our outstanding convertible preferred stock into an aggregate of 52,733,480 shares of our common stock upon completion of this offering; |
| • | a -for- reverse split of our outstanding capital stock to be effective upon the completion of this offering; and |
| • | no exercise of options, warrants or rights outstanding as of the date of this prospectus. |
7
Table of Contents
Summary consolidated financial information
The following summary consolidated financial data should be read together with our consolidated financial statements and related notes and “Management’s discussion and analysis of financial condition and results of operations” appearing elsewhere in this prospectus. The actual consolidated statements of operations data for the fiscal years ended September 30, 2007, 2008 and 2009 are derived from our audited consolidated financial statements included elsewhere in this prospectus. The actual consolidated statements of operations data for the six months ended March 31, 2009 and 2010 and the actual consolidated balance sheet data as of March 31, 2010 are derived from our unaudited consolidated financial statements included elsewhere in this prospectus. The unaudited consolidated financial statements include, in the opinion of management, all adjustments, which include only normal recurring adjustments, that management considers necessary for the fair presentation of the financial information set forth in those financial statements. Our historical results are not necessarily indicative of the results to be expected in any future period.
As a result of our acquisition of Legacy Force10 in March 2009, management believes that a pro forma combined presentation, which includes a comparison of the combined results of operations with the results of operations of us and Legacy Force10 for fiscal 2009, provides a meaningful basis of presentation for investors in evaluating our historical financial performance. The pro forma condensed combined statement of operations data assumes that our acquisition of Legacy Force10 occurred on October 1, 2008 and combines our results of operations for the year ended September 30, 2009, which includes the results of Legacy Force10 since March 31, 2009, with the results of operations of Legacy Force10 for the six months ended January 31, 2009. The pro forma combined data may not, however, be indicative of our consolidated results of operations that actually would have occurred had the transaction reflected in the pro forma combined results of operations occurred on that date, or of the consolidated results of operations that we may achieve in the future. You should read this pro forma combined information together with the unaudited pro forma condensed combined financial statements included elsewhere in this prospectus.
The other operational data presented are used in addition to the financial measures reflected in the consolidated statements of operations data to help us evaluate growth trends, establish budgets, measure the effectiveness of our sales and marketing efforts and assess operational efficiencies.
8
Table of Contents
| Actual | Pro forma combined | Actual | ||||||||||||||||||||||
| Fiscal year ended September 30, | Six months ended March 31, | |||||||||||||||||||||||
(in thousands, except percentages and per share data) | 2007 | 2008(3) | 2009(4) | 2009 | 2009 | 2010 | ||||||||||||||||||
Consolidated statements of operations data: | ||||||||||||||||||||||||
Revenue | ||||||||||||||||||||||||
Product | $ | — | $ | 48,225 | $ | 86,120 | $ | 113,005 | $ | 29,232 | $ | 66,494 | ||||||||||||
Service | — | 5,370 | 16,290 | 22,398 | 6,613 | 13,227 | ||||||||||||||||||
Ratable product and service | 31,562 | 102,303 | 16,660 | 63,820 | 8,729 | 9,894 | ||||||||||||||||||
Total revenue | 31,562 | 155,898 | 119,070 | 199,223 | 44,574 | 89,615 | ||||||||||||||||||
Cost of goods sold(1) | ||||||||||||||||||||||||
Product | — | 28,072 | 66,012 | 84,861 | 24,295 | 37,210 | ||||||||||||||||||
Service | — | 2,440 | 8,213 | 13,155 | 2,536 | 8,200 | ||||||||||||||||||
Ratable product and service | 19,507 | 56,977 | 8,079 | 28,787 | 4,711 | 3,922 | ||||||||||||||||||
Total cost of goods sold | 19,507 | 87,489 | 82,304 | 126,803 | 31,542 | 49,332 | ||||||||||||||||||
Gross profit | ||||||||||||||||||||||||
Product | — | 20,153 | 20,108 | 28,144 | 4,937 | 29,284 | ||||||||||||||||||
Service | — | 2,930 | 8,077 | 9,243 | 4,077 | 5,027 | ||||||||||||||||||
Ratable product and service | 12,055 | 45,326 | 8,581 | 35,033 | 4,018 | 5,972 | ||||||||||||||||||
Total gross profit | 12,055 | 68,409 | 36,766 | 72,420 | 13,032 | 40,283 | ||||||||||||||||||
| �� | ||||||||||||||||||||||||
Operating expenses | ||||||||||||||||||||||||
Research and development(1) | 13,443 | 23,611 | 34,137 | 52,249 | 11,695 | 19,681 | ||||||||||||||||||
Sales and marketing(1) | 19,650 | 27,265 | 36,010 | 61,785 | 11,158 | 22,842 | ||||||||||||||||||
General and administrative(1) | 6,027 | 9,427 | 12,871 | 22,917 | 4,346 | 8,094 | ||||||||||||||||||
Restructuring | — | — | — | 3,119 | — | 1,841 | ||||||||||||||||||
In-process research and development and amortization of intangible assets | — | 3,119 | 7,459 | 7,584 | 6,918 | 463 | ||||||||||||||||||
Total operating expenses | 39,120 | 63,422 | 90,477 | 147,654 | 34,117 | 52,921 | ||||||||||||||||||
Operating income (loss) | (27,065 | ) | 4,987 | (53,711 | ) | (75,234 | ) | (21,085 | ) | (12,638 | ) | |||||||||||||
Interest and other income (expense), net | (2,368 | ) | 544 | (920 | ) | (848 | ) | (396 | ) | 5,384 | ||||||||||||||
Income (loss) before income taxes | (29,433 | ) | 5,531 | (54,631 | ) | (76,082 | ) | (21,481 | ) | (7,254 | ) | |||||||||||||
Benefit from (provision for) income taxes | (22 | ) | (87 | ) | 41 | (209 | ) | 175 | (118 | ) | ||||||||||||||
Net income (loss) | $ | (29,455 | ) | $ | 5,444 | $ | (54,590 | ) | $ | (76,291 | ) | $ | (21,306 | ) | $ | (7,372 | ) | |||||||
Net income (loss) per share(2) | ||||||||||||||||||||||||
Basic | $ | 121.06 | $ | (12.88 | ) | $ | 52.15 | $ | 13.70 | $ | 245.79 | $ | (8.54 | ) | ||||||||||
Diluted | $ | (46.70 | ) | $ | (12.88 | ) | $ | (20.79 | ) | $ | (24.41 | ) | $ | (2.58 | ) | $ | (8.54 | ) | ||||||
Weighted average shares outstanding(2) | ||||||||||||||||||||||||
Basic | 344 | 386 | 640 | 852 | 435 | 863 | ||||||||||||||||||
Diluted | 1,030 | 386 | 4,563 | 4,775 | 8,268 | 863 | ||||||||||||||||||
Pro forma net loss per share (unaudited)(2) | ||||||||||||||||||||||||
Basic and diluted | $ | (2.40 | ) | $ | (0.14 | ) | ||||||||||||||||||
Pro forma weighted average shares outstanding (unaudited)(2) | ||||||||||||||||||||||||
Basic and diluted | 22,763 | 53,596 | ||||||||||||||||||||||
9
Table of Contents
| Actual | Pro forma combined | Actual | ||||||||||||||||||||||
| Fiscal year ended September 30, | Six months ended March 31, | |||||||||||||||||||||||
(in thousands, except percentages and per share data) | 2007 | 2008(3) | 2009(4) | 2009 | 2009 | 2010 | ||||||||||||||||||
Other operational data: | ||||||||||||||||||||||||
Ethernet segment revenue | $ | — | $ | — | $ | 34,367 | $ | 114,520 | $ | — | $ | 48,501 | ||||||||||||
Transport segment revenue | 31,562 | 155,898 | 84,703 | 84,703 | 44,574 | 41,114 | ||||||||||||||||||
Change in total deferred revenue(5) | 16,672 | (60,137 | ) | 5,234 | (8,592 | ) | (3,703 | ) | ||||||||||||||||
Non-GAAP operating income (loss) | (26,431 | ) | 10,013 | (35,188 | ) | (13,411 | ) | (6,528 | ) | |||||||||||||||
Non-GAAP net income (loss) | (28,598 | ) | 10,470 | (36,067 | ) | (13,632 | ) | (7,029 | ) | |||||||||||||||
Ethernet segment gross margin | — | % | — | % | 27.8 | % | 39.7 | % | — | % | 48.7 | % | ||||||||||||
Transport segment gross margin | 38.2 | 43.9 | 32.1 | 32.1 | 29.2 | 40.5 | ||||||||||||||||||
| (1) | Includes stock-based compensation expense as follows: |
| Actual | Pro forma combined | Actual | ||||||||||||||||
| Fiscal year ended September 30, | Six months ended March 31, | |||||||||||||||||
| (in thousands) | 2007 | 2008(3) | 2009(4) | 2009 | 2009 | 2010 | ||||||||||||
Cost of goods sold | $ | 44 | $ | 95 | $ | 38 | $ | 38 | $ | 23 | $ | 9 | ||||||
Research and development | 150 | 322 | 212 | 212 | 118 | 173 | ||||||||||||
Sales and marketing | 215 | 335 | 177 | 177 | 116 | 142 | ||||||||||||
General and administrative | 225 | 637 | 195 | 195 | 107 | 232 | ||||||||||||
Total stock-based compensation | $ | 634 | $ | 1,389 | $ | 622 | $ | 622 | $ | 364 | $ | 556 | ||||||
| (2) | See note 7 to the notes to our consolidated financial statements for a description of the method used to compute basic and diluted net income (loss) and pro forma basic and diluted net income (loss) per share. |
| (3) | Includes the results of operations of Carrier Access from February 8, 2008. |
| (4) | Includes the results of operations of Legacy Force10 from March 31, 2009. |
| (5) | Excludes deferred revenue assumed in the acquisition of Legacy Force10. |
10
Table of Contents
The following table presents consolidated balance sheet data as of March 31, 2010 (1) on an actual basis, (2) on a pro forma basis to reflect the conversion of all shares of our outstanding convertible preferred stock into an aggregate of 52,733,480 shares of our common stock and the reclassification of the preferred stock warrant liability to additional paid-in capital upon completion of this offering and (3) on a pro forma as adjusted basis to further reflect the sale of shares of common stock in this offering by us at an assumed initial public offering, or IPO, price of $ per share, which is the midpoint of the price range set forth on the cover page of this prospectus, after deducting estimated underwriting discounts and commissions and estimated offering expenses payable by us.
| March 31, 2010 (unaudited) (in thousands) | Actual | Pro forma | Pro forma as adjusted(1) | ||||||
Consolidated summary balance sheet data: | |||||||||
Cash and cash equivalents and short-term investments | $ | 55,157 | $ | 55,157 | $ | ||||
Working capital | 15,742 | 31,763 | |||||||
Total assets | 190,990 | 190,990 | |||||||
Preferred stock warrant liability | 16,021 | — | |||||||
Convertible preferred stock | 204,539 | — | |||||||
Common stock and additional paid-in capital | 20,031 | 240,591 | |||||||
Total stockholders’ equity | 63,117 | 79,138 | |||||||
| (1) | Each $1.00 increase or decrease in the assumed IPO price of $ per share, which is the midpoint of the price range set forth on the cover page of this prospectus, would increase or decrease, as applicable, our pro forma as adjusted cash, cash equivalents and short-term investments, working capital, total assets, common stock and additional paid-in capital and total stockholders’ equity by approximately $ million, assuming the number of shares offered by us remains the same as set forth on the cover page of this prospectus and after deducting the estimated underwriting discounts and commissions and estimated offering expenses that we must pay. |
Non-GAAP financial results
We believe that non-GAAP operating income (loss) and non-GAAP net income (loss) are helpful financial measures for an investor determining whether to invest in our common stock. In computing these measures, we exclude certain items outside ongoing operating results, such as inventory purchase accounting adjustments, in-process research and development expenses and restructuring charges. We believe excluding these items helps investors compare our operating performance with our results in prior periods, as well as with the performance of other companies, as they are not indicative of ongoing operating results and therefore limit comparability of our historical and current financial statements. In addition, we exclude stock-based compensation expense because we believe it allows for more accurate comparisons of our operating results to our peer companies because of the varying available valuation methodologies, subjective assumptions and the variety of award types. While amortization of intangible assets is a recurring item, we believe that excluding these charges provides for more accurate comparisons of our historical and our current operating results and those of similar companies due to the varying nature and significance of acquisitions that we and similar companies may complete, and the varying valuation methodologies and amortization periods related to intangible assets. See “Management’s discussion and analysis of financial condition and results of operations” for a discussion of the adjustments in computing these non-GAAP financial measures.
These non-GAAP financial measures may not provide information that is directly comparable to that provided by other companies in our industry, as other companies in our industry may
11
Table of Contents
calculate such financial measures differently, particularly as it relates to nonrecurring, unusual items. Our non-GAAP financial measures are not measurements of financial performance under GAAP, and should not be considered as alternatives to operating income (loss) or net income (loss) or as indications of operating performance or any other measure of performance derived in accordance with GAAP. We do not consider these non-GAAP financial measures to be a substitute for, or superior to, the information provided by GAAP financial measures.
The following table reflects the reconciliation of non-GAAP operating income (loss) and non-GAAP net income (loss) to GAAP operating income (loss) and GAAP net income (loss).
| Fiscal year ended September 30, | Six months ended March 31, | ||||||||||||||||||
| (in thousands) | 2007 | 2008 | 2009 | 2009 | 2010 | ||||||||||||||
GAAP operating income (loss) | $ | (27,065 | ) | $ | 4,987 | $ | (53,711 | ) | $ | (21,085 | ) | $ | (12,638 | ) | |||||
Non-GAAP adjustments | |||||||||||||||||||
Add: Amortization of intangible assets included in cost of goods sold | — | 518 | 2,126 | 392 | 634 | ||||||||||||||
Add: Inventory purchase accounting adjustment | — | — | 8,316 | 2,616 | |||||||||||||||
Add: Restructuring | — | — | — | 1,841 | |||||||||||||||
Add: In-process research and development and amortization of intangible assets included in operating expenses | — | 3,119 | 7,459 | 6,918 | 463 | ||||||||||||||
Add: Employee stock-based compensation | 634 | 1,389 | 622 | 364 | 556 | ||||||||||||||
Non-GAAP operating income (loss) | $ | (26,431 | ) | $ | 10,013 | $ | (35,188 | ) | $ | (13,411 | ) | $ | (6,528 | ) | |||||
GAAP net income (loss) | $ | (29,455 | ) | $ | 5,444 | $ | (54,590 | ) | $ | (21,306 | ) | $ | (7,372 | ) | |||||
Non-GAAP adjustments | |||||||||||||||||||
Add: Amortization of intangible assets included in cost of goods sold | — | 518 | 2,126 | 392 | 634 | ||||||||||||||
Add: Inventory purchase accounting adjustment | — | — | 8,316 | — | 2,616 | ||||||||||||||
Add: Restructuring | — | — | — | — | 1,841 | ||||||||||||||
Add: In-process research and development and amortization of intangible assets included in operating expenses | — | 3,119 | 7,459 | 6,918 | 463 | ||||||||||||||
Add: Employee stock-based compensation | 634 | 1,389 | 622 | 364 | 556 | ||||||||||||||
Add (subtract): Change in fair value of preferred stock warrant liability | 2,025 | — | — | (5,767 | ) | ||||||||||||||
Subtract: Gain on extinguishment of preferred stock warrants | (1,802 | ) | — | — | |||||||||||||||
Non-GAAP net income (loss) | $ | (28,598 | ) | $ | 10,470 | $ | (36,067 | ) | $ | (13,632 | ) | $ | (7,029 | ) | |||||
See “Management’s discussion and analysis of financial condition and results of operations” for a discussion of these non-GAAP financial measures. The income tax effect of the above non-GAAP adjustments was insignificant for all periods presented.
12
Table of Contents
Investing in our common stock involves a high degree of risk. You should carefully consider the following risk factors and all other information contained in this prospectus before purchasing our common stock. If any of the following risks occur, our business, financial condition or results of operations could be materially harmed. In that case, the trading price of our common stock could decline, and you may lose some or all of your investment.
Risks related to our business and industry
We have a history of losses and we may not be able to become profitable.
We have a history of losses and have not yet achieved profitability. We incurred net losses of $54.6 million for the fiscal year ended September 30, 2009 and $7.4 million for the six months ended March 31, 2010. In addition, prior to our acquisition of Legacy Force10, both we and Legacy Force10 had incurred substantial losses. As of March 31, 2010, we had an accumulated deficit of $161.4 million. This accumulated deficit was due to our history of losses. We expect our operating expenses to increase in the future due to our expected development activities, sales and marketing expenses, operations costs and general and administrative costs, including additional finance, legal and accounting costs as a result of being a public company. Accordingly, we expect to continue to incur losses for the foreseeable future and we cannot assure you that we will achieve profitability in the future or, if we do become profitable, that we will sustain profitability.
Because we have a limited history operating as a combined company, it is difficult to evaluate our current business and prospects.
We acquired Legacy Force10 in March 2009 and we acquired Carrier Access in February 2008. Prior to these acquisitions, we developed, marketed and sold our Traverse and TraverseEdge products targeted at service providers. Carrier Access developed, marketed and sold wireless aggregation and converged business access products targeted at service providers and enterprises. As a combined company, we have limited experience offering all of the products of each company. In addition, we restructured our operations after the acquisition of Legacy Force10. Accordingly, we only have a limited operating history operating our current combined business, which makes it difficult to evaluate our current business and prospects.
Our operating results have fluctuated in the past and are difficult to predict, which could cause our stock price to fluctuate.
Our quarterly results of operations have fluctuated in the past and may continue to fluctuate as a result of a variety of factors, some of which may be outside of our control. If our quarterly results of operations fall below our expectations or the expectations of securities analysts or investors, the price of our common stock could decline substantially. Fluctuations in our quarterly results of operations may be due to a number of factors, including, but not limited to:
| • | the mix of products sold during the period; |
| • | the timing and volume of shipments of our products during a particular quarter; |
| • | potential seasonal variations in the demand for our products; |
| • | the amount and timing of operating costs related to the maintenance and expansion of our business, operations and infrastructure; |
13
Table of Contents
| • | our ability to control costs, including third-party manufacturing costs and costs of components; |
| • | our ability to forecast our manufacturing requirements and manage our inventory; |
| • | changes in our or our competitors’ pricing policies or sales and service terms; |
| • | changes in costs of components, manufacturing costs or lead times; |
| • | our ability to obtain sufficient supplies of components; |
| • | our ability to maintain sufficient production volumes for our products; |
| • | the timing and success of new product introductions by us or our competitors; |
| • | volatility in our stock price, which may lead to higher stock compensation expenses; |
| • | the timing of costs related to the development of new products or the acquisition of technologies or businesses; |
| • | general economic, industry and market conditions and those conditions specific to the networking industry; |
| • | the length and unpredictability of the purchasing and budgeting cycles of our customers; |
| • | our lack of long-term, committed volume purchase agreements with our customers; and |
| • | geopolitical events such as war, threat of war or terrorist actions. |
In addition, our revenue in a given quarter is largely dependent upon sales closed in that quarter. Because our operating expenses are largely fixed in the short-term and difficult to adjust quickly, any shortfalls in revenue in a given quarter would have a direct and material adverse effect on our operating results in that quarter. Historically, we have received a substantial portion of a quarter’s sales orders during the last month and often, the last two weeks of the quarter. If expected sales at the end of any quarter are delayed for any reason, including the failure of anticipated purchase orders to materialize, or our inability to ship products prior to quarter-end to fulfill purchase orders received near the end of the quarter, our results for that quarter could fall below our expectations or those of securities analysts and investors, resulting in a decline in our stock price. Our quarterly revenue and results of operations may vary significantly from period to period and period-to-period comparisons of our operating results may not be meaningful. In addition, because of our prior acquisitions, our past financial results are not indicative of our future performance.
Our markets are extremely competitive and if we are unable to compete effectively, we may experience decreased sales or pricing pressure, which would negatively impact our future operating results.
Our market is intensely competitive. For example, Cisco Systems, Inc. currently maintains a dominant position in our markets, offers products and services that compete directly with our products and services, and is able to adopt aggressive pricing policies and leverage its customer base and extensive portfolio to gain market share. Other principal competitors for our Ethernet products include Brocade Communications Systems, Inc., Extreme Networks, Inc., Hewlett-Packard Company (which recently completed the acquisition of 3Com Corporation, another competitor), Huawei Technologies Co., Ltd. and Juniper Networks, Inc. Other principal competitors for our transport and access products include ADTRAN, Inc., Alcatel-Lucent SA, Fujitsu Limited, Huawei Technologies Co., Ltd. and Tellabs, Inc. Many of these other competitors are substantially larger
14
Table of Contents
and have greater financial, technical, research and development, sales and marketing, manufacturing, distribution, services capabilities and other resources. We could also face competition from new market entrants, whether from new ventures or from established companies moving into these markets.
Because many of our competitors have greater financial strength than we do and are able to offer a more diversified and comprehensive bundle of products and services, they may have the ability to significantly undercut our prices, which could make us uncompetitive or force us to reduce our selling prices, negatively impacting our margins. In addition to price, we also compete with other companies on the basis of product features, service offerings, performance, reliability and scalability. Our competitors may also be able to develop products and services that are superior to ours in these respects, or may be able to offer products and services that provide significant price advantages over those we offer. In addition, if our competitors’ products and services become more accepted than ours, our competitive position will be impaired and we may not be able to increase our revenue.
Conditions in our markets could change rapidly and significantly as a result of technological advancements or continuing market consolidation. Our current and potential competitors may also establish cooperative relationships among themselves or with third parties that may further enhance their resources. In addition, current or potential competitors may be acquired by third parties with greater available resources, such as Hewlett Packard’s acquisition of 3Com Corporation and Brocade Communications’ acquisition of Foundry Networks. As a result of such acquisitions, our current or potential competitors might be able to adapt more quickly to new technologies and customer needs, devote greater resources to the promotion or sale of their products and services, initiate or withstand substantial price competition, take advantage of acquisition or other opportunities more readily or develop and expand their product and service offerings more quickly than we do.
As the industry evolves and as we introduce additional products and services, we expect to encounter additional competitors and other emerging companies that may announce network product and services offerings. Moreover, our current and potential competitors, including companies with whom we currently have strategic alliances, may establish cooperative relationships among themselves or with other third parties. If this occurs, new competitors or alliances may emerge that could negatively affect our competitive position and negatively impact our future operating results.
Our future financial performance depends on growth in the market for standards-based Gigabit Ethernet technology. If this market does not continue to grow at the rate that we forecast, our operating results would be materially and adversely impacted.
Historically, we offered our products and services to telecommunications service providers. After our acquisition of Legacy Force10 in March 2009, we also began to offer 10 GbE products, targeting data center customers. We have been experiencing rapid growth in the sales of these Ethernet-based products and services, as compared to our traditional transport and access products and services, and we expect that our future revenue growth will be largely dependent upon the continued increase in demand for our current 10 GbE products and services and future standards-based Gigabit Ethernet products we may introduce, including 40 GbE and 100 GbE products. This is a new and emerging market. Accordingly, our future financial performance will depend in large part on growth in this market and on our ability to adapt to the emerging demands in this market. In addition, service providers have historically relied on technologies,
15
Table of Contents
such as synchronous optical networking, synchronous digital hierarchy, or SONET/SDH, which were developed specifically to satisfy service provider requirements in their networks and have been slow to adopt emerging technologies. If service providers do not adopt Ethernet to replace SONET/SDH technology, demand for our Ethernet products from these customers may not develop. A reduction in demand for our Ethernet-based products caused by lack of customer acceptance, weakening economic conditions, competing technologies and products, decreases in corporate spending or otherwise would result in decreased revenue or a lower revenue growth rate.
The success of our business depends on increased sales of our E-Series, C-Series and S-Series products, some of which have been introduced recently. If market acceptance of these products does not continue, our future operating results could be harmed.
Prior to our acquisition, Legacy Force10 derived substantially all of its revenue from its E-Series, C-Series and S-Series products. We intend to continue to aggressively market these products and intend to devote significant portions of our development resources to these and other Ethernet products. Therefore, we expect that in the future we will depend on these products for a substantial majority of our revenue. If these products are unable to remain competitive, or if we experience pricing pressure or reduced demand for these products, our future revenue and business would be harmed.
We introduced the first release of our newest E-Series product, ExaScale, in March 2009 and intend to continue to release additional boards and features for this product. We first recognized revenue from sales of ExaScale during the second quarter of 2009. We cannot assure you that this product will become widely accepted in the marketplace or that we will be able to derive substantial revenue from the sale of this product.
We have derived a substantial majority of our historic revenue from telecommunications service providers. If we fail to generate continued revenue from this market or from additional markets, our revenue could decline.
Historically, we have derived a substantial majority of our revenue from telecommunications service providers. Our future success depends upon the continued demand for our products from customers in this industry. This industry is cyclical and reactive to geopolitical and general economic conditions. In the past, this industry has experienced restructurings, consolidations and reorganizations. These can cause delays and reductions in capital expenditures and operating costs, which could reduce demand for the type of equipment we sell. In addition, if this industry were to widely adopt products of our competitors or if this industry is otherwise more reluctant to adopt and move to Ethernet products, our future revenue and operating results could be harmed.
We use third party distributors, resellers and system integrators to sell our products, and disruptions to, or our failure to effectively develop and manage, our distribution channel and the processes and procedures that support it could adversely affect our ability to generate revenue from the sale of our products.
We depend on distributors, resellers and system integrators, which we refer to collectively as channel partners, to sell our products, particularly in international markets, and our success depends on our ability to establish and maintain relationships with these channel partners. Our channel partners may not promote or market our products effectively, or they may experience financial difficulties or cease operations. These entities are generally not contractually obligated
16
Table of Contents
to sell or promote our products, and may also sell or promote our competitors’ products. If our competitors offer more favorable terms or more attractive sales incentives to these entities for sales of their products, sales of our products through these entities could be adversely affected. If our channel partners do not promote our products effectively, or if we lose the services of certain partners, we would have to develop additional relationships with other third parties or devote more resources to directly marketing our products, either of which could harm our operating results.
Our sales cycle can be lengthy and unpredictable, which may cause our sales and operating results to vary.
The sales cycle for our products can be lengthy, in some cases over 12 months. We expend substantial time, effort and money educating our current and prospective customers as to the value of our products, but we may ultimately fail to produce a sale. The success of our product sales process is subject to many factors, some of which we have little or no control over, including:
| • | the timing of our end customers’ budget cycles and approval processes; |
| • | customers’ or system integrators’ willingness to use our products as part of a larger system implementation; |
| • | the length and timing of design and testing cycles for end customers; |
| • | our ability to introduce new products, features or functionality in a timely manner; |
| • | the announcement or introduction of competing products; and |
| • | established relationships between our competitors and our potential customers. |
If we are unsuccessful in closing sales after expending significant resources, our revenue and operating results will be adversely affected. Because of the lengthy sales cycle, the timing of the actual sale is unpredictable and may lead to variances in our operating results from quarter to quarter. In addition, because our products are incorporated into larger network systems, if our products are not designed into a new system after a long sales cycle, we may also find it more difficult to sell future products for that network, which could also harm our revenue and other operating results.
We are dependent on third party contract manufacturers and our business may be harmed if our contract manufacturers are not able to provide us with adequate supplies of our products in a timely manner.
We outsource the manufacturing of our products to third party contract manufacturers, including Flextronics International USA, Inc., or Flextronics, and AsteelFlash U.S., Inc., or AsteelFlash, each of which manufacture products for other enterprises. Our reliance on outside manufacturers involves a number of potential risks, including the absence of adequate capacity, the unavailability of or interruptions in access to necessary manufacturing processes and reduced control over delivery schedules. Even if our manufacturers fulfill our orders, it is possible that the products may not meet our specifications. Due to the inherent statistical variation and life of electronic components, and due to our inability to inspect the physical quality of our products, our products have in the past and may in the future contain defects or otherwise not meet our quality standards, which could result in warranty claims, product returns or harm to our reputation, any of which could adversely affect our operating results and future sales.
17
Table of Contents
If our manufacturers are unable or unwilling to continue manufacturing our products in required volumes, if they fail to meet our quality specifications, or if they significantly increase their prices, we will have to transition to one or more alternative manufacturers. The process of identifying and qualifying a new manufacturer can be time consuming and expensive. Additionally, transitioning to new manufacturers may cause delays in supply if the new manufacturers have difficulty manufacturing products to our specifications or quality standards or meeting our transition timing requirements. Also, the addition of manufacturing locations or contract manufacturers would increase the complexity of our supply chain management. Each of these factors could adversely affect our business, financial condition, and results of operations.
If we fail to accurately forecast demand or manage our inventory, we could experience increased inventory levels and write-offs or we could experience manufacturing or shipment delays, shortages, additional costs and lose revenue.
Under our agreements with our contract manufacturers, we generally provide rolling forecasts to our manufacturers every four weeks. Based on these forecasts, the manufacturers plan to produce a certain quantity of products and order certain components required for the products on our behalf. While we can adjust our forecasts, due to complexity and demand, certain of our components must be ordered several months to up to one year in advance and it is difficult to adjust quantities on a timely basis. We are currently purchasing additional inventory to ensure that we can fulfill future orders.
If we overestimate production requirements, our manufacturers may purchase excess components that are unique to our products or build excess products. If the inventory is held on a long-term basis, we could experience write-downs, particularly if this inventory becomes obsolete. Any such fees or write-downs could have an adverse effect on our gross margin and other results of operations.
If we underestimate production requirements, and experience unanticipated demand for our products, we could experience difficulty in obtaining additional components, increased costs of components or shipping delays. Our contract manufacturers also may not be able to manufacture additional products from those set forth in our forecasts. As a result, we could experience cancellations or delays of orders or lost customers, which could harm our reputation and operating results.
We depend on sole source and limited source suppliers for several components. If we are unable to source these components on a timely or cost-effective basis, we will not be able to deliver products for our customers.
We depend on sole source and limited source suppliers for several components of our products. For example, certain of our ASIC processors and network chipsets are purchased from sole source suppliers. Any of the sole source and limited source suppliers or manufacturers upon whom we rely could stop producing our components or products, cease operations or be acquired by, or enter into exclusive arrangements with, our competitors. Because we sometimes offer long-term warranties on some of our products, we may be forced to buy more components than we need to service our products over time if providers of our components cease operations or stop producing certain components used in our products. We generally do not have long term supply agreements with our suppliers and our purchase volumes are currently too low for us to be considered a priority customer by most of our suppliers. As a result, most of these suppliers could stop selling to us at commercially reasonable terms, or at all. In addition, if any of these limited or single source component suppliers experience capacity constraints, work stoppages, financial
18
Table of Contents
difficulties or other reductions or disruptions in output, they may not be able to meet, or may choose not to meet, our delivery schedules. Any interruptions or delays may force us to seek similar components from alternative sources, which may not be available in time to meet demand or on commercially reasonable terms, if at all. If our suppliers are no longer able to provide certain components we may be required to find an alternative supplier which will require us to retest components and requalify products with our customers, which would be costly and time-consuming. In certain cases, we may be required to redesign our products if a component becomes unavailable. In addition, we must successfully manage the supply of components to our contract manufacturers. Any failure by us to effectively manage our supply chain could adversely affect our supply of finished goods and our ability to fulfill customer demand, which could adversely affect our revenue and our reputation.
Any price increases, shortages or interruptions of supply would adversely affect our revenue and gross profits.
We may be vulnerable to price increases for components. In addition, in the past we have occasionally experienced shortages or interruptions in supply for certain components, which caused us to purchase components at a higher cost or delayed production for a longer period of time than we had initially forecasted. We are currently experiencing a period of constrained supply for some components. To help address these issues, we may decide to purchase “safety stock” in quantities that are above our foreseeable requirements. As a result, we could be forced to increase our excess and obsolete inventory reserves to account for excess quantities. If we experience any shortage of components or receive components of unacceptable quality or if we are not able to procure components from alternate sources at acceptable prices and within a reasonable period of time, our revenue and gross profit could decrease.
Our gross margin may fluctuate from quarter to quarter and may be adversely affected by a number of factors.
Our gross margin has been and will continue to be affected by a variety of factors, including:
| • | the products and services mix in any particular period; |
| • | our willingness to negotiate price discounts with our customers; |
| • | competitive pressure to reduce sales prices; |
| • | charges for excess or obsolete inventory or purchase commitments; |
| • | changes in the price or availability of components; |
| • | variations in production volumes, which may result in higher relative costs at lower volumes due to fixed costs; |
| • | warranty or repair costs that exceed our expectations; and |
| • | the timing of revenue recognition and related cost of goods sold. |
The networking equipment industry has experienced price erosion due to a number of factors, including competitive pricing pressures, increased negotiated sales discounts, rapid technological change and new product introductions. We expect these trends to continue. As a result, our gross margin will decline if we cannot maintain our selling prices by offering new products and product enhancements or offset declines in average selling prices with a reduction in the cost of
19
Table of Contents
products and services through manufacturing efficiencies, design improvements and other cost reductions. Our failure to do so would cause our sales, revenue and gross margin to decline, which could materially and adversely affect our operating results.
If we fail to develop and introduce new products in a timely manner, or if we fail to effectively manage product transitions, we could experience decreased revenue.
Our future growth depends on our ability to develop and introduce new products successfully. For example, we introduced the first release of our ExaScale product in March 2009 and intend to continue to release additional boards and features for this product. Due to the complexity of our products, there are significant technical risks that may affect our ability to introduce new products successfully. If we are unable to develop and introduce new products in a timely manner or in response to changing market conditions or customer requirements, or if these products do not achieve market acceptance, our growth could be negatively impacted and our operating results could be materially and adversely affected.
In addition, components used in our products are periodically discontinued by our suppliers which results in our having to change our product designs. We also periodically redesign some of our products in order to remain competitive because of increased functionality or higher performance afforded by new components. If these redesigns are not timely, of if they result in unexpected issues related to quality or performance, sales of our products could be adversely affected.
Product introductions by us in future periods may also reduce demand for our existing products. As new or enhanced products are introduced, we must successfully manage the transition from older products, avoid excessive levels of older product inventories and ensure that sufficient supplies of new products can be delivered to meet customer demand. Our failure to do so could adversely affect our operating results.
If we fail to respond to technological changes, evolving industry standards or customer demand for new features, our products could become obsolete or less competitive in the future.
Our products must respond to technological changes and evolving industry standards. If we are unable to develop enhancements to, and new features for, our existing products or acceptable new products that keep pace with technological developments, industry standards or customer demand for new features, our products may become obsolete, less marketable and less competitive and our business will be harmed.
Our products are highly complex and may contain undetected software or hardware errors, which could harm our reputation and future product sales.
Our products are deployed in large and complex networks and must be compatible with other system components. Our products can only be fully tested for reliability when deployed in these networks for long periods of time and accordingly, errors, defects or incompatibilities may not be discovered until after they have been installed and used by customers. In addition, our products are often used in applications that place heavy use and strain on networking equipment. Our customers may discover errors, defects or incompatibilities in our products only after they have been fully deployed and operated under peak stress conditions. For example, in the second quarter of fiscal 2010 we detected a defect in the power supply subsystem included in the line cards for our ExaScale product. The defect, which was only detectable under peak stress conditions, caused us to incur additional costs and expenses of approximately $1.2 million to remediate the error and caused delays in sales for the quarter. We do not expect to incur significant additional costs or expenses for any further remediation.
20
Table of Contents
In addition, our products must successfully interoperate with products from other vendors. As a result, when problems occur in a network, it may be difficult to identify the sources of these problems. Errors, defects, incompatibilities or other problems with our products or other products within a larger system could result in a number of negative effects on our business, including:
| • | loss of customers; |
| • | loss of or delay in revenue; |
| • | loss of market share; |
| • | damage to our brand and reputation; |
| • | inability to attract new customers or achieve market acceptance; |
| • | diversion of development resources; |
| • | increased service and warranty costs; |
| • | legal actions by our customers; and |
| • | increased insurance costs. |
If any of these occurs, our operating results could be harmed.
If our products do not interoperate with other systems, installations could be delayed or cancelled.
Our products may be required to interoperate with existing customer equipment or systems, each of which may have different specifications. A lack of interoperability between our products and our customers’ existing systems may result in significant support and repair costs and harm relations with our customers. If our products do not interoperate with those of our customers’ networks, installations could be delayed or orders for our products could be cancelled, which would result in losses of revenue and customers that could have an adverse effect on our business and operating results.
Our business is subject to the risk of warranty claims.
We could face claims for product liability, tort or breach of warranty. Our agreements with customers typically contain warranty disclaimers and liability limitations, which may not be upheld. Defending a lawsuit, regardless of its merit, is costly and may divert management’s attention and adversely affect the market’s perception of us and our products. In addition, our business liability insurance coverage may not be adequate to cover the full amount of any future claims.
Our success depends on our ability to attract and retain key personnel, and our failure to do so could harm our ability to grow our business.
Our success depends on our ability to attract and retain our key personnel, namely our management team and experienced sales and engineering personnel. We must also attract, assimilate and retain other highly qualified employees, including our chief executive officer and our technology, marketing, sales and support personnel. Despite current economic conditions, there is substantial competition for highly-skilled employees particularly in the Silicon Valley
21
Table of Contents
where our headquarters is located. The members of our management and key employees are at-will employees and do not have employment agreements. If we fail to attract and retain key employees, our ability to grow our business could be harmed.
Our company has grown significantly during the last two years as a result of two large acquisitions and if we fail to manage our growth and integration effectively, our business could be harmed.
We recently acquired two companies, Legacy Force10 in March 2009 and Carrier Access in February 2008, and are currently refocusing our strategy, which has required us to restructure our business. These changes have placed, and will continue to place, a significant strain on our management, administrative, operational and financial infrastructure. For example, we are still in the process of integrating our accounting and financial reporting systems with those acquired as part of our acquisition of Legacy Force10. Our success will depend in part upon the ability of our senior management to manage these changes effectively. To manage these changes, we will need to continue to improve and expand our operational, financial and management controls and our reporting systems and procedures. Further, we need to establish an internal audit function. If we fail to successfully manage our growth, we will be unable to execute our business plan and our business could be harmed.
Adverse economic conditions or reduced network technology product spending may adversely impact our business.
Our business depends on the overall demand for network technology products and on the economic health of our current and prospective customers. We are particularly susceptible to weakness in capital and IT spending because purchases of our products are often discretionary and involve a significant commitment of capital and other resources. Continued weakness in the global economy, or a further reduction in network technology spending even if economic conditions improve, could adversely impact our business, financial condition and results of operations in a number of ways, including longer sales cycles, lower prices for our products and services, reduced unit sales and lower or no growth.
We have operations worldwide and intend to expand our international operations, which exposes us to significant risks.
We have research and development and sales support employees in Australia, Canada, China, Germany, India, Indonesia, Japan, South Korea, Malaysia, Singapore, Spain and the United Kingdom, in addition to the United States. We intend to grow our large India operations and expand into other geographic areas. The success of our business depends, in large part, on our ability to continue to operate successfully worldwide and to further expand our international operations and sales. Operating in international markets requires significant resources and management attention and will subject us to regulatory, economic and political risks that are different from those in the United States. We cannot be sure that further international expansion will be successful. In addition, we face risks in doing business internationally that could expose us to reduced demand for our products, lower prices for our products or other adverse effects on our operating results. Among the risks we believe are most likely to affect us are:
| • | difficulties and costs associated with staffing and managing foreign operations; |
| • | longer and more difficult customer qualification and credit checks; |
| • | greater difficulty collecting accounts receivable and longer payment cycles; |
22
Table of Contents
| • | the need for various local approvals in order to sell products in some countries; |
| • | difficulties in entering some foreign markets, such as China, without larger-scale local operations; |
| • | compliance with local laws and regulations on a timely basis; |
| • | lack of adequate physical infrastructure, including power and cooling; |
| • | unexpected changes in regulatory requirements, including the extension of tax holidays; |
| • | reduced protection for intellectual property rights in some countries; |
| • | adverse tax consequences, including as a result of repatriating cash generated from foreign operations to the United States, if we were deemed to have permanent establishments outside of the United States, or if our compliance with applicable transfer pricing laws and regulations were challenged, including under our existing and future intercompany agreements and transfer pricing methodologies and practices; |
| • | the effectiveness of our policies and procedures designed to ensure compliance with the Foreign Corrupt Practices Act and similar regulations; |
| • | fluctuations in currency exchange rates, which could increase the price of our products to customers outside of the United States, increase the expenses of our international operations by reducing the purchasing power of the U.S. dollar and expose us to foreign currency exchange rate risk if, in the future, we denominate our international sales in currencies other than the U.S. dollar; |
| • | our dependence on third-parties to provide international back-office support; |
| • | new and different sources of competition; and |
| • | political and economic instability and terrorism. |
Our failure to manage any of these risks successfully could harm our international operations and reduce our international revenue.
We intend to grow our research and development operations and our ability to introduce new products cost-effectively depends on our ability to manage remote development sites successfully.
Our success depends on our ability to develop new products and enhance our existing products rapidly and cost-effectively. We have a research and development center in India, and on April 30, 2010, we had 121 personnel at this location. We intend to expand our headcount and to conduct more fundamental product development in this location. As we do not have substantial experience managing core product development operations that are remote from our U.S. headquarters, we may not be able to manage these remote operations successfully. We could incur unexpected costs or delays in product development that could impair our ability to meet market windows or cause us to forego certain new product opportunities.
Our use of open source software and other third-party technology and intellectual property could impose limitations on our ability to market our products.
We incorporate open source software into our products. Although we monitor our use of open source closely, the terms of many open source licenses have not been interpreted by U.S. courts,
23
Table of Contents
and there is a risk that such licenses could be construed in a manner that could impose unanticipated conditions or restrictions on our ability to market or sell our products or to develop new products. In such event, we could be required to seek licenses from third-parties in order to continue offering our products, to disclose and offer royalty-free licenses in connection with our own source code, to re-engineer our products or to discontinue the sale of our products in the event re-engineering cannot be accomplished on a timely basis, any of which could adversely affect our business.
We also incorporate certain third-party technologies, including software programs and patented standards into our products and may need to utilize additional third-party technologies in the future. However, licenses to relevant third-party technology may not continue to be available to us on commercially reasonable terms, or at all. Therefore, we could face delays in product releases until equivalent technology can be identified, licensed or developed, and integrated into our products. These delays, if they occur, could materially adversely affect our business.
Failure to protect our intellectual property could substantially harm our business.
Our success and ability to compete are substantially dependent upon our intellectual property. We rely on patent, trademark and copyright law, trade secret protection and confidentiality or license agreements with our employees, customers, channel partners and others to protect our intellectual property rights. We cannot assure you that any patents will be issued from the patent applications we have filed and we cannot assure you that the steps we take to protect our intellectual property rights will be adequate, particularly in foreign jurisdictions. Patents may not adequately protect our intellectual property rights or our products against competitors, and third-parties may challenge the scope, validity and/or enforceability of our issued patents. In addition, other parties may independently develop similar or competing technologies designed around any patents that may be issued to us.
We intend to enforce our intellectual property rights vigorously, and from time to time we may initiate claims against third-parties that we believe are infringing our intellectual property rights if we are unable to resolve matters satisfactorily through negotiation. Litigation brought to protect and enforce our intellectual property rights could be costly, time-consuming and distracting to management and could result in the impairment or loss of portions of our intellectual property. Our failure to secure, protect and enforce our intellectual property rights could materially harm our business.
If a third party asserts that we are infringing its intellectual property, whether successful or not, it could subject us to costly and time-consuming litigation or expensive licenses, which could harm our business.
Third parties have in the past sent us correspondence regarding intellectual property infringement and in the future we may receive claims that our products infringe or violate their intellectual property rights. Any claims or litigation could cause us to incur significant expenses and, if successfully asserted against us, could require us to pay substantial damages and prevent us from selling our products. We may also be obligated to indemnify our customers or business partners in connection with any such litigation, which could further exhaust our resources. Furthermore, as a result of an intellectual property challenge, we may be required to enter into royalty, license or other agreements, but such agreements may not be available to us on commercially reasonable terms, or at all. Litigation over patent rights and other intellectual property rights is not uncommon with respect to networking technologies, and sometimes
24
Table of Contents
involves patent holding companies or other adverse patent owners who have no relevant product revenue and against whom our own patents may provide little or no deterrence. Even if we were to prevail, any litigation regarding our intellectual property could be costly and time-consuming and divert the attention of our management and key personnel from our business operations.
We are subject to governmental export controls that could subject us to liability or adversely affect our ability to sell our products in international markets.
Some of our products are subject to U.S. export controls and may be exported outside the United States only with the required export license or through an export license exception. Various countries regulate the import of certain encryption technology and have enacted laws that could limit our ability to distribute our products or could limit our customers’ ability to deploy our products in those countries. Changes in our products or changes in export and import regulations may create delays in the introduction of our products in international markets or prevent the export or import of our products to certain countries altogether. Any change in export or import regulations or related legislation, shift in approach to the enforcement or scope of existing regulations, or change in the countries, persons or technologies targeted by such regulations, could result in decreased use of our products by, or in our decreased ability to export or sell our products to, existing or potential customers with international operations. Any decreased use of our products or limitation on our ability to export or sell our products would likely adversely affect our business.
We are subject to environmental and other health and safety regulations that may increase our costs of operations or limit our activities.
We are subject to various environmental laws and regulations including laws governing the hazardous material content of our products and laws relating to the recycling of electrical and electronic equipment. The laws and regulations to which we are subject include the European Union, or EU, Restriction of Hazardous Substances, or RoHS, and the EU Waste Electrical and Electronic Equipment, or WEEE, Directive as well as the implementing legislation of the EU member states. Similar laws and regulations have been passed or are pending in China, South Korea, Norway and Japan and may be enacted in other regions, including in the United States and we are, or may in the future be, subject to these laws and regulations.
The EU RoHS and the similar laws of other jurisdictions ban the use of certain hazardous materials such as lead, mercury and cadmium in the manufacture of electrical equipment, including our products. We have incurred costs to comply with these laws, including research and development costs, costs associated with assuring the supply of compliant components and costs associated with writing off noncompliant inventory. We expect to incur more of these costs in the future. With respect to the EU RoHS, we and our competitors rely on an exemption for lead in network infrastructure equipment. It is possible this exemption will be revoked in the near future. If revoked, if there are other changes to these laws (or their interpretation) or if new similar laws are passed in other jurisdictions, we may be required to re-engineer our products to use components that are compatible with these regulations. This re-engineering and component substitution could result in additional costs to us or disrupt our operations or logistics.
The EU WEEE Directive requires electronic goods producers to be responsible for the collection, recycling and treatment of such products. Although currently our EU international channel partners are responsible for compliance with this directive as the importer of record in most of the European countries in which we sell our products, changes in interpretation of the
25
Table of Contents
regulations may cause us to incur costs or have to meet additional regulatory requirements in the future in order to comply with this directive, or with any similar laws adopted in other jurisdictions.
We may not be able to comply in all cases with applicable environmental and other regulations or compliance may be prohibitively expensive, and if we do not comply, we may incur remediation costs or inventory write-offs, reputational damage, penalties or we may not be able to offer our products for sale in certain countries.
We have engaged in acquisitions in the past and plan to continue to expand through acquisitions of, or investments in, other companies, each of which may divert our management’s attention, result in additional dilution to stockholders or use resources that are necessary to operate other parts of our business.
In the past, we have grown our business through acquisitions, and we plan in the future to acquire or invest in businesses, products or technologies that we believe could complement or expand our products, enhance our technical capabilities or otherwise offer growth opportunities. Such acquisitions or investments could create risks for us, including:
| • | difficulties in assimilating acquired personnel, operations and technologies or realizing synergies expected in connection with an acquisition, particularly with acquisitions of companies with large and widespread operations or complex products; |
| • | unanticipated costs or liabilities, including possible litigation, associated with the acquisition; |
| • | incurrence of acquisition-related costs; |
| • | diversion of management’s attention from other business concerns; |
| • | use of resources that are needed in other parts of our business; and |
| • | use of substantial portions of our available cash to consummate the acquisition. |
In addition, a significant portion of the purchase price of companies we acquire may be allocated to acquired goodwill and other intangible assets, which must be assessed for impairment at least annually. In the future, if our acquisitions do not yield expected returns, we may be required to take charges to our earnings based on this impairment assessment process, which could harm our results of operations.
We may be unable to complete acquisitions at all or on commercially reasonable terms, which could limit our future growth. Acquisitions could also result in dilutive issuances of equity securities or the incurrence of debt, which could adversely affect our operating results and result in a decline in our stock price. In addition, if an acquired business fails to meet our expectations, our operating results may suffer.
Our ability to use net operating losses to offset future taxable income may be subject to significant limitations.
In general, under Section 382 of the Internal Revenue Code of 1986, as amended, or the Internal Revenue Code, a corporation that undergoes an “ownership change” is subject to limitations on its ability to utilize its pre-change net operating losses to offset future taxable income. We believe it is probable that we have had one or more ownership changes, as a result of which our existing net operating loss carryforwards may be subject to substantial limitations. The existing net operating loss carryforwards of corporations we have acquired also may be subject to substantial limitations arising from ownership changes prior to, or in connection with, their
26
Table of Contents
acquisition by us. In addition, if we undergo an ownership change in connection with or after this public offering, our ability to utilize net operating loss carryforwards could be further limited by Section 382 of the Internal Revenue Code. Future changes in our stock ownership, some of which are outside of our control, could result in an ownership change under Section 382 of the Internal Revenue Code. For these reasons, it is likely that we may not be able to utilize a significant portion of our net operating loss carryforwards if we attain profitability.
The issuance of new accounting standards or future interpretations of existing accounting standards could adversely affect our operating results.
We prepare our financial statements to conform to GAAP. A change in those principles could have a significant effect on our reported results and might affect our reporting of transactions completed before a change is announced. Generally accepted accounting principles in the United States are issued by and are subject to interpretation by the Public Company Accounting Oversight Board, the Financial Accounting Standards Board, or FASB, the American Institute of Certified Public Accountants, or AICPA, the Securities and Exchange Commission, or SEC, and various other bodies formed to promulgate and interpret appropriate accounting principles. A change in these principles or interpretations could have a significant effect on our reported financial results, and could affect the reporting of transactions completed before the announcement of a change. The AICPA continues to issue interpretations and guidance for applying the relevant accounting standards to a wide range of sales practices and business arrangements. The issuance of new accounting standards or future interpretations of existing accounting standards, or changes in our business practices could result in future changes in our revenue recognition or other accounting policies that could have a material adverse effect on our results of operations.
Our principal offices and facilities and some of those of our contract manufacturers are located near known earthquake fault zones, and the occurrence of an earthquake or other catastrophic disaster could damage our facilities or the facilities of our contract manufacturers, which could cause us to curtail our operations.
Our principal offices and some of our facilities and some of those of our contract manufacturers are located in California near known earthquake fault zones and, therefore, are vulnerable to damage from earthquakes. We are also vulnerable to damage from other types of disasters, such as power loss, fire, floods and similar events. If any disaster were to occur, our ability to operate our business could be seriously impaired. In addition, we may not have adequate insurance to cover our losses resulting from disasters or other similar significant business interruptions. Any significant losses that are not recoverable under our insurance policies could seriously impair our business and financial condition.
Risks related to this offering, the securities market and investment in our common stock
As a result of becoming a public company, we will be obligated to develop and maintain effective internal control over financial reporting. We may not complete our analysis of our internal control over financial reporting in a timely manner, or these internal controls may not be determined to be effective, which may adversely affect investor confidence in our company and, as a result, the value of our common stock.
We will be required, pursuant to Section 404 of the Sarbanes-Oxley Act, to furnish a report by management on, among other things, the effectiveness of our internal control over financial reporting for the first fiscal year beginning after the effective date of this offering. This
27
Table of Contents
assessment will need to include disclosure of any material weaknesses identified by our management in our internal control over financial reporting. Beginning with our 2011 fiscal year, our auditors will also have to issue an opinion on the effectiveness of our internal control over financial reporting.
We are in the very early stages of the costly and challenging process of enhancing our internal controls and compiling the system and processing documentation necessary to perform the evaluation needed to comply with Section 404. We currently estimate that our costs to enhance our controls in order to comply with the requirements of Section 404 will be in the range of $0.8 to $1.2 million. We may also incur significant additional unforeseen expenses as part of this process. We may not be able to complete our evaluation, testing and any required remediation in a timely fashion. During the evaluation and testing process, if we identify one or more material weaknesses in our internal control over financial reporting, we will be unable to assert that our internal controls are effective. If we are unable to conclude that our internal control over financial reporting is effective, or if our auditors were to express an adverse opinion on the effectiveness of our internal controls because we had one or more material weaknesses, we could lose investor confidence in the accuracy and completeness of our financial reports, which could cause the price of our common stock to decline.
During our fiscal 2009 audit and fiscal 2010 interim reviews, we identified a material weakness in our internal control over financial reporting related to the accounting for infrequent and complex stockholders’ equity transactions, involving (a) the issuance of our Series B preferred stock in June through August 2009 at a fair value substantially higher than the amount paid by investors and (b) the presentation in the consolidated statement of cash flows of payments of costs related to our initial public offering. We have also identified during our fiscal 2009 audit significant deficiencies in our internal control over financial reporting related to insufficient independent review of accounting analyses, revenue recognition related to certain Transport customer arrangements, balance sheet classification, valuation of certain property and equipment and deferred tax liabilities in the purchase price allocation related to our acquisition of Legacy Force10 and a lack of documented policies and procedures related to information systems. While the attestation as to our internal control over financial reporting will not occur until the end of our 2011 fiscal year, we cannot assure you that this material weakness or these significant deficiencies will be remediated until the completion of the testing and attestation process, or that other material weaknesses or significant deficiencies will not arise.
During fiscal 2010, we hired additional accounting and finance personnel, who will, among other things, assist with our remediation efforts, and we will continue to enhance our procedures regarding the preparation and review of accounting analyses. Although we believe these actions will remediate this material weakness and these significant deficiencies during our fiscal year ending September 30, 2010, we could experience unforeseen difficulties and we may need to operate for an extended period of time with the new or revised controls in place before the material weakness and these significant deficiencies will be determined to be remediated.
We will incur increased costs and demands upon management as a result of complying with the laws and regulations affecting public companies, which could harm our operating results.
As a public company, we will incur significant legal, accounting, investor relations and other expenses that we did not incur as a private company, including costs associated with public company reporting requirements. We also have incurred and will incur costs associated with
28
Table of Contents
current corporate governance requirements, including requirements under Section 404 and other provisions of the Sarbanes-Oxley Act, as well as rules implemented by the SEC and the New York Stock Exchange on which we expect our common stock will be traded. The expenses incurred by public companies for reporting and corporate governance purposes have increased dramatically over the past several years. We expect that complying with these rules and regulations will increase our legal and financial compliance costs substantially and make some activities more time consuming and costly. We are unable currently to estimate these costs with any degree of certainty. We also expect that, as a public company, it will be more expensive for us to obtain director and officer liability insurance.
We might require additional capital to support business operations, and this capital might not be available on acceptable terms, or at all.
If our cash and cash equivalents balances and any cash generated from operations and from this offering are not sufficient to meet our cash requirements, we will need to seek additional capital, potentially through debt or equity financings, to fund our operations. We cannot assure you that we will be able to raise needed cash on terms acceptable to us or at all. Financings, if available, may be on terms that are dilutive or potentially dilutive to our stockholders, and the prices at which new investors would be willing to purchase our securities may be lower than the IPO price. The holders of new securities may also receive rights, preferences or privileges that are senior to those of existing holders of common stock. In addition, if we were to raise cash through a debt financing, such debt may impose conditions or restrictions on our operations, which could adversely affect our business. If new sources of financing are required but are insufficient or unavailable, we would be required to modify our operating plans to the extent of available funding, which would harm our ability to grow our business.
If securities analysts do not publish research or reports about our business and our stock or if they publish negative evaluations, the price of our stock could decline.
We expect that the trading price for our common stock will be affected by research or reports that industry or financial analysts publish about us or our business. There are many large, well-established publicly-traded companies active in our industry and market, which may mean that we receive less widespread analyst coverage than our competitors. If one or more of the analysts who covers us downgrade their evaluations of our company or our stock, the price of our stock could decline. If one or more of these analysts cease coverage of our company, our stock may lose visibility in the market, which in turn could cause our stock price to decline.
Our common stock has no prior public market and could trade at prices below the IPO price.
There has not been a public trading market for shares of our common stock prior to this offering. An active trading market may not develop or be sustained after this offering. The IPO price for our common stock sold in this offering will be determined by negotiations among us, the selling stockholders and representatives of the underwriters. This price may not be indicative of the price at which our common stock will trade after this offering, and our common stock could trade below the IPO price.
The concentration of ownership of our capital stock with insiders upon the completion of this offering will limit your ability to influence corporate matters.
We anticipate that our executive officers, directors, current 5% or greater stockholders and entities affiliated with them together will beneficially own approximately % of our common
29
Table of Contents
stock outstanding after this offering. This significant concentration of share ownership may adversely affect the trading price for our common stock because investors often perceive disadvantages in owning stock in companies with controlling stockholders. Also, these stockholders, acting together, will be able to exert significant influence over our management and affairs and matters requiring stockholder approval, including the election of directors and the approval of significant corporate transactions, such as mergers, consolidations or the sale of substantially all of our assets. Consequently, this concentration of ownership may have the effect of delaying or preventing a change of control, including a merger, consolidation or other business combination involving us, or discouraging a potential acquirer from making a tender offer or otherwise attempting to obtain control, even if that change of control would benefit our other stockholders.
Our stock price could decline due to the large number of outstanding shares of our common stock eligible for future sale.
Sales of substantial amounts of our common stock in the public market following this offering, or the perception that these sales could occur, could cause the market price of our common stock to decline. These sales could also make it more difficult for us to sell equity or equity related securities in the future at a time and price that we deem appropriate.
Upon completion of this offering, we will have outstanding shares of common stock, assuming no exercise of the underwriters’ over-allotment option and no exercise of options, warrants or rights outstanding as of the date of this prospectus. Of the outstanding shares, all of the shares sold in this offering, plus any additional shares sold upon exercise of the underwriters’ over-allotment option, will be freely tradable, except that any shares purchased by “affiliates” (as that term is defined in Rule 144 under the Securities Act of 1933, or the Securities Act) may only be sold in compliance with the limitations described in the section entitled “Shares eligible for future sale—Rule 144.” Taking into consideration the effect of the lock-up agreements described below and the provisions of Rule 144 and Rule 701 under the Securities Act, based on an assumed IPO date of July 31, 2010, the remaining shares of our common stock will be available for sale in the public market as follows:
| • | no shares will be eligible for sale on the date of this prospectus; |
| • | shares will be eligible for sale upon the expiration of the lock-up agreements described below; and |
| • | the remaining shares will be eligible for sale in the public market from time to time thereafter upon the lapse of our right of repurchase with respect to any unvested shares. |
The lock-up agreements expire 180 days after the date of this prospectus, subject to extension upon the occurrence of specified events. The representatives of the underwriters may, in their sole discretion and at any time without notice, release all or any portion of the securities subject to lock-up agreements. After this offering, we intend to register on a Form S-8 up to 9,968,597 shares of common stock that may be issued upon exercise of outstanding stock options granted under our stock plans and shares of common stock that are authorized for future issuance under our 2010 equity incentive plan and 2010 employee stock purchase plan, which we expect to adopt in connection with this offering.
30
Table of Contents
Because our estimated IPO price is substantially higher than the pro forma as adjusted net tangible book value per share of our outstanding common stock, new investors will incur immediate and substantial dilution.
The assumed IPO price of $ , which is the midpoint of the price range set forth on the cover page of this prospectus, is substantially higher than the pro forma as adjusted net tangible book value per share of our common stock based on the total value of our tangible assets less our total liabilities immediately following this offering. Therefore, if you purchase common stock in this offering, you will experience immediate and substantial dilution of approximately $ per share, based on an assumed IPO price of $ , which is the midpoint of the price range set forth on the cover page of this prospectus, the difference between the price you pay for our common stock and its pro forma as adjusted net tangible book value after completion of the offering. To the extent outstanding options and warrants to purchase our capital stock are exercised, there will be further dilution.
Our management has broad discretion in the use of the net proceeds from this offering and may not use the net proceeds effectively.
Our management will have broad discretion in the application of the net proceeds of this offering. We cannot specify with certainty the uses to which we will apply these net proceeds. The failure by our management to apply these funds effectively could adversely affect our ability to maintain and expand our business.
Our charter documents and Delaware law could prevent a takeover that stockholders consider favorable and could also reduce the market price of our stock.
Our amended and restated certificate of incorporation and our bylaws, in effect upon the closing of this offering, will contain provisions that could delay or prevent a change in control of us. These provisions could also make it more difficult for stockholders to elect directors and take other corporate actions. These provisions include:
| • | providing for a classified board of directors with staggered, three year terms; |
| • | authorizing the board of directors to issue, without stockholder approval, preferred stock with rights senior to those of our common stock; |
| • | vacancies on our board of directors are filled by appointment of the board of directors; |
| • | prohibiting stockholder action by written consent; |
| • | limiting the persons who may call special meetings of stockholders; and |
| • | requiring advance notification of stockholder nominations and proposals. |
In addition, we are subject to the Section 203 of the Delaware General Corporate Law, or DGCL, which may prohibit large stockholders, in particular those owning 15% or more of our outstanding voting stock, from merging or combining with us for a certain period of time without the consent of our board of directors.
These and other provisions in our amended and restated certificate of incorporation and our bylaws, as in effect upon completion of this offering, and under the DGCL could discourage potential takeover attempts, reduce the price that investors might be willing to pay in the future for shares of our common stock and result in the market price of our common stock being lower than it would be without these provisions. See the section entitled “Description of capital stock.”
31
Table of Contents
We do not anticipate paying any dividends on our common stock.
We do not anticipate paying any cash dividends on our common stock in the foreseeable future. Further, our loan and security agreement with Silicon Valley Bank limits our ability to pay dividends. If we do not pay cash dividends, you would receive a return on your investment in our common stock only if the market price of our common stock is greater than the IPO price at the time you sell your shares.
Our stock price may be volatile, and you may be unable to sell your shares at or above the IPO price.
The market price of our common stock could be subject to wide fluctuations in response to, among other things, the factors described in this “Risk factors” section or otherwise, and other factors beyond our control, such as fluctuations in the valuations of companies perceived by investors to be comparable to us.
Furthermore, the stock markets have experienced price and volume fluctuations that have affected and continue to affect the market prices of equity securities of many companies. These fluctuations often have been unrelated or disproportionate to the operating performance of those companies. These broad market fluctuations, as well as general economic, systemic, political and market conditions, such as recessions, interest rate changes or international currency fluctuations, may negatively affect the market price of our common stock.
In the past, many companies that have experienced volatility in the market price of their stock have become subject to securities class action litigation. We may be the target of this type of litigation in the future. Securities litigation against us could result in substantial costs and divert our management’s attention from other business concerns, which could harm our business.
32
Table of Contents
Special note regarding forward-looking statements
and industry data
This prospectus contains forward-looking statements that are based on our management’s beliefs and assumptions and on information currently available to our management. The forward-looking statements are contained principally in the sections entitled “Prospectus summary,” “Risk factors,” “Management’s discussion and analysis of financial condition and results of operations,” “Business” and “Executive compensation—Compensation discussion and analysis.” Forward-looking statements include information concerning our possible or assumed future results of operations, business strategies, financing plans, product development and releases, competitive position, industry environment, potential growth opportunities and the effects of competition. Forward-looking statements include statements that are not historical facts and can be identified by terms such as “anticipates,” “believes,” “could,” “seeks,” “estimates,” “expects,” “intends,” “may,” “plans,” “potential,” “predicts, “projects,” “should,” “will,” “would” or similar expressions and the negatives of those terms.
Forward-looking statements involve known and unknown risks, uncertainties and other factors that may cause our actual results, performance or achievements to be materially different from any future results, performance or achievements expressed or implied by the forward-looking statements. We discuss these risks in greater detail in “Risk factors” and elsewhere in this prospectus. Given these uncertainties, you should not place undue reliance on these forward-looking statements. Also, forward-looking statements represent our management’s beliefs and assumptions only as of the date of this prospectus. You should read this prospectus and the documents that we have filed as exhibits to the registration statement, of which this prospectus is a part, completely and with the understanding that our actual future results may be materially different from what we expect.
Except as required by law, we assume no obligation to update these forward-looking statements, or to update the reasons actual results could differ materially from those anticipated in these forward-looking statements, even if new information becomes available in the future.
This prospectus also contains estimates and other information concerning our industry, including market size and growth rates based on industry publications, surveys and forecasts, including those generated by IDC and The Dell’Oro Group. This information involves a number of assumptions and limitations, and you are cautioned not to give undue weight to these estimates. These industry publications, surveys and forecasts generally indicate that their information has been obtained from sources believed to be reliable. Although we believe the publications to be reliable, we have not independently verified their data. The industry in which we operate is subject to a high degree of uncertainty and risk due to variety of factors, including those described in the section entitled “Risk factors.”
33
Table of Contents
We estimate that the net proceeds from our sale of shares of common stock in this offering at an assumed IPO price of $ per share, which is the midpoint of the price range set forth on the cover page of this prospectus, after deducting estimated underwriting discounts and commissions and estimated offering expenses payable by us, will be approximately $ million, or $ million if the underwriters’ option to purchase additional shares is exercised in full. A $1.00 increase or decrease in the assumed IPO price of $ per share would increase or decrease, as applicable, the net proceeds to us from this offering by approximately $ million, assuming the number of shares offered by us remains the same as set forth on the cover page of this prospectus and after deducting the estimated underwriting discounts and commissions and estimated offering expenses that we must pay. We will not receive any proceeds from the sale of shares of our common stock by the selling stockholders.
We intend to use our net proceeds from this offering for working capital and general corporate purposes. Accordingly, our management will have broad discretion in the application of our net proceeds from this offering, and investors will be relying on management’s judgment regarding the application of these net proceeds. We also may use a portion of our net proceeds from this offering to acquire complementary businesses, products, services or technologies, but we currently have no agreements, commitments or understandings relating to any material acquisitions.
Pending their use, we plan to invest our net proceeds from this offering in short term, interest-bearing obligations, investment-grade instruments, certificates of deposit or direct or guaranteed obligations of the U.S. government.
We have never declared or paid dividends on our common stock and do not expect to pay dividends on our common stock for the foreseeable future. Instead, we anticipate that all of our earnings in the foreseeable future will be used for the operation and growth of our business. Any future determination to pay dividends on our common stock would be subject to the discretion of our board of directors and would depend upon various factors, including our results of operations, financial condition, liquidity requirements, restrictions that may be imposed by applicable law and our contracts and other factors deemed relevant by our board of directors. In addition, our loan and security agreement with Silicon Valley Bank limits our ability to pay dividends.
34
Table of Contents
The following table sets forth our consolidated cash, cash equivalents and short-term investments and total capitalization as of March 31, 2010 on:
| • | an actual basis; |
| • | a pro forma basis to reflect (1) the conversion of all outstanding shares of our convertible preferred stock into an aggregate of 52,733,480 shares of our common stock, (2) the reclassification of the preferred stock warrant liability to additional paid-in capital effective upon the closing of this offering, and (3) the amendment and restatement of our certificate of incorporation upon the closing of this offering; and |
| • | a pro forma as adjusted basis to further reflect the sale by us of shares of common stock in this offering at an assumed IPO price of $ per share, which is the midpoint of the price range set forth on the cover page of this prospectus, after deducting estimated underwriting discounts and commissions and estimated offering expenses payable by us. |
The information below is illustrative only and our capitalization following the completion of this offering will be adjusted based on the actual IPO price and other terms of this offering determined at pricing. You should read this table together with the section entitled “Management’s discussion and analysis of financial condition and results of operations” and our consolidated financial statements and the related notes appearing elsewhere in this prospectus.
| As of March 31, 2010 | |||||||||||
| (in thousands, except share and per share data) | Actual | Pro forma | Pro forma as adjusted(1) | ||||||||
| (unaudited) | |||||||||||
Cash, cash equivalents and short-term investments | $ | 55,157 | $ | 55,157 | $ | ||||||
Total debt and capital lease obligations | $ | 26,788 | $ | 26,788 | $ | ||||||
Preferred stock warrant liability | 16,021 | — | |||||||||
Stockholders’ equity: | |||||||||||
Preferred stock, $0.0001 par value; no shares authorized, issued or outstanding, actual; 5,000,000 shares authorized, no shares issued or outstanding, pro forma and pro forma as adjusted | |||||||||||
Convertible preferred stock, $0.0001 par value: 31,702,920 shares authorized, 24,981,240 shares issued and outstanding, actual; no shares authorized, issued or outstanding, pro forma and pro forma as adjusted | 204,539 | — | |||||||||
Common stock, $0.0001 par value; 86,000,000 shares authorized, 3,556,400 shares issued and outstanding, actual; 86,000,000 shares authorized, 56,289,880 shares issued and outstanding, pro forma; and shares authorized, shares issued and outstanding, pro forma as adjusted | 3 | 56 | |||||||||
Additional paid-in capital | 20,028 | 240,535 | |||||||||
Other comprehensive loss | (7 | ) | (7 | ) | |||||||
Accumulated deficit | (161,446 | ) | (161,446 | ) | |||||||
Total stockholders’ equity | 63,117 | 79,138 | |||||||||
Total capitalization | $ | 105,926 | $ | 105,926 | $ | ||||||
| (1) | Each $1.00 increase or decrease in the assumed IPO price of $ per share would increase or decrease, as applicable, the amount of cash, cash equivalents and short-term investments, additional paid-in capital, total stockholders’ equity and total capitalization by approximately $ million, assuming the number of shares offered by us remains the same as set forth on the cover page of this prospectus and after deducting the estimated underwriting discounts and commissions and estimated offering expenses that we must pay. |
35
Table of Contents
The information on the preceding page excludes:
| • | 7,280,423 shares of common stock issuable upon the exercise of options outstanding as of March 31, 2010, with a weighted average exercise price of $0.36 per share; |
| • | 3,121,041 shares of common stock issuable upon the exercise of options granted between April 1, 2010 and June 7, 2010, with a weighted average exercise price of $2.89 per share; |
| • | shares of common stock reserved for future issuance under our 2010 equity incentive plan and 2010 employee stock purchase plan, which will become effective in connection with this offering; and |
| • | 5,924,152 shares of common stock issuable upon exercise of warrants outstanding as of March 31, 2010, with a weighted average exercise price of $8.96 per share. |
36
Table of Contents
As of March 31, 2010, our pro forma net tangible book value was approximately $41.5 million, or $0.74 per share of common stock. Our pro forma net tangible book value per share represents our tangible assets less our liabilities, reflecting the reclassification of the preferred stock warrant liability to additional paid-in capital effective upon the closing of this offering, divided by our shares of common stock outstanding as of March 31, 2010 after giving effect to the conversion of all outstanding shares of our convertible preferred stock into 52,733,480 shares of common stock in this offering.
After giving effect to our sale of shares of common stock in this offering at the assumed IPO price of $ per share, which is the midpoint of the price range set forth on the cover page of this prospectus, and after deducting estimated underwriting discounts and commissions and estimated offering expenses payable by us, our pro forma as adjusted net tangible book value as of March 31, 2010 would have been $ , or $ per share of common stock. This represents an immediate increase in pro forma as adjusted net tangible book value of $ per share to existing stockholders and an immediate dilution of $ per share to new investors.
The following table illustrates this dilution:
Assumed IPO price per share | $ | |||||
Pro forma net tangible book value per share as of March 31, 2010 | $ | 0.74 | ||||
Increase per share attributable to this offering | ||||||
Pro forma as adjusted net tangible book value per share after this offering | ||||||
Net tangible book value dilution per share to new investors in this offering | $ | |||||
If all our outstanding options had been exercised, the pro forma net tangible book value as of March 31, 2010 would have been $44.1 million, or $0.69 per share, and the pro forma net tangible book value after this offering would have been $ million, or $ per share, causing dilution to new investors of $ per share.
A $1.00 increase or decrease in the assumed IPO price of $ per share, which is the midpoint of the price range set forth on the cover page of this prospectus, would increase or decrease, as applicable, our pro forma as adjusted net tangible book value per share by approximately $ , assuming the number of shares offered by us remains the same as set forth on the cover page of this prospectus and after deducting the estimated underwriting discounts and commissions and estimated offering expenses that we must pay.
If the underwriters’ over-allotment option to purchase additional shares from us is exercised in full, our pro forma as adjusted net tangible book value per share after this offering would be $ per share, the increase in pro forma as adjusted net tangible book value per share to existing stockholders would be $ per share and the dilution to new investors purchasing shares in this offering would be $ per share.
37
Table of Contents
The following table summarizes, on a pro forma as adjusted basis as of March 31, 2010, the total number of shares of common stock purchased from us, the total consideration paid to us and the average price per share paid to us by existing stockholders and by new investors purchasing shares in this offering at the assumed IPO price of $ , the midpoint of the price range set forth on the cover page of this prospectus, before deducting estimated underwriting discounts and commissions and estimated offering expenses payable by us:
| Shares purchased | Total consideration | Average price per share | |||||||||||||
| Number | Percent | Amount | Percent | ||||||||||||
Existing stockholders | % | $ | (1) | % | $ | ||||||||||
New investors | |||||||||||||||
Total | 100 | % | $ | 100 | % | $ | |||||||||
| (1) | Includes approximately $ million of consideration from the issuance of shares of capital stock in connection with our acquisition of Legacy Force10. |
A $1.00 increase or decrease in the assumed IPO price of $ per share, which is the midpoint of the price range set forth on the cover page of this prospectus, would increase or decrease, as applicable, total consideration paid to us by new investors and total consideration paid to us by all stockholders by approximately $ million, assuming the number of shares offered by us remains the same as set forth on the cover page of this prospectus and without deducting the estimated underwriting discounts and commissions and estimated offering expenses that we must pay.
If the underwriters’ over-allotment option to purchase additional shares from us is exercised in full, our existing stockholders would own % and our new investors would own % of the total number of shares of our common stock outstanding after this offering.
The foregoing calculations exclude:
| • | 7,280,423 shares of common stock issuable upon the exercise of options outstanding as of March 31, 2010, with a weighted average exercise price of $0.36 per share; |
| • | 3,121,041 shares of common stock issuable upon the exercise of options granted between April 1, 2010 and June 7, 2010, with a weighted average exercise price of $2.89 per share; |
| • | shares of common stock reserved for future issuance under our 2010 equity incentive plan and 2010 employee stock purchase plan, which will become effective in connection with this offering; and |
| • | 5,924,152 shares of common stock issuable upon exercise of warrants outstanding as of March 31, 2010, with a weighted average exercise price of $8.96 per share. |
38
Table of Contents
Selected consolidated financial data
The following selected consolidated financial data should be read together with our consolidated financial statements and related notes and “Management’s discussion and analysis of financial condition and results of operations” appearing elsewhere in this prospectus. The actual consolidated statements of operations data for the fiscal years ended September 30, 2007, 2008 and 2009 and the consolidated balance sheet data as of September 30, 2008 and 2009, are derived from our audited consolidated financial statements included elsewhere in this prospectus. The consolidated statements of operations data for the fiscal years ended September 30, 2005 and 2006, and consolidated balance sheet data as of September 30, 2005, 2006 and 2007, are derived from our audited consolidated financial statements not included in this prospectus. The consolidated statements of operations data for the six months ended March 31, 2009 and 2010 and the consolidated balance sheet data as of March 31, 2010 are derived from our unaudited consolidated financial statements included elsewhere in this prospectus. The unaudited consolidated financial statements include, in the opinion of management, all adjustments, which include only normal recurring adjustments, that management considers necessary for the fair presentation of the financial information set forth in those financial statements. Our historical results are not necessarily indicative of the results to be expected in any future period. See “Management’s discussion and analysis of financial condition and results from operations—Significant issues affecting comparability from period-to-period” for a discussion of factors you should consider in reviewing our historical financial results.
As a result of our acquisition of Legacy Force10 in March 2009, management believes that a pro forma combined presentation, which includes a comparison of the combined results of operations with the results of operations of us and Legacy Force10 for fiscal 2009, provides a meaningful basis of presentation for investors in evaluating our historical financial performance.
The pro forma condensed combined statement of operations data assumes that our acquisition of Legacy Force10 occurred on October 1, 2008 and combines our results of operations for the year ended September 30, 2009, which includes the results of Legacy Force10 since March 31, 2009, with the results of operations of Legacy Force10 for the six months ended January 31, 2009. The pro forma combined data may not, however, be indicative of our consolidated results of operations that actually would have occurred had the transaction reflected in the pro forma combined results of operations occurred on that date, or of the consolidated results of operations that we may achieve in the future. You should read this pro forma combined information together with the unaudited pro forma condensed combined financial statements included elsewhere in this prospectus.
39
Table of Contents
| Actual | Pro forma combined | Actual | ||||||||||||||||||||||||||||||
| Fiscal year ended September 30, | Six months ended March 31, | |||||||||||||||||||||||||||||||
(in thousands, except per share data) | 2005(3) | 2006(3) | 2007 | 2008 | 2009 | 2009 | 2009 | 2010 | ||||||||||||||||||||||||
Consolidated statements of operations data: | ||||||||||||||||||||||||||||||||
Revenue | ||||||||||||||||||||||||||||||||
Product | $ | — | $ | — | $ | — | $ | 48,225 | $ | 86,120 | $ | 113,005 | $ | 29,232 | $ | 66,494 | ||||||||||||||||
Service | — | — | — | 5,370 | 16,290 | 22,398 | 6,613 | 13,227 | ||||||||||||||||||||||||
Ratable product and service | 9,183 | 19,243 | 31,562 | 102,303 | 16,660 | 63,820 | 8,729 | 9,894 | ||||||||||||||||||||||||
Total revenue | 9,183 | 19,243 | 31,562 | 155,898 | 119,070 | 199,223 | 44,574 | 89,615 | ||||||||||||||||||||||||
Cost of goods sold(1) | ||||||||||||||||||||||||||||||||
Product | — | — | — | 28,072 | 66,012 | 84,861 | 24,295 | 37,210 | ||||||||||||||||||||||||
Service | — | — | — | 2,440 | 8,213 | 13,155 | 2,536 | 8,200 | ||||||||||||||||||||||||
Ratable product and service | 7,525 | 14,440 | 19,507 | 56,977 | 8,079 | 28,787 | 4,711 | 3,922 | ||||||||||||||||||||||||
Total cost of goods sold | 7,525 | 14,440 | 19,507 | 87,489 | 82,304 | 126,803 | 31,542 | 49,332 | ||||||||||||||||||||||||
Gross profit | ||||||||||||||||||||||||||||||||
Product | — | — | — | 20,153 | 20,108 | 28,144 | 4,937 | 29,284 | ||||||||||||||||||||||||
Service | — | — | — | 2,930 | 8,077 | 9,243 | 4,077 | 5,027 | ||||||||||||||||||||||||
Ratable product and service | 1,658 | 4,803 | 12,055 | 45,326 | 8,581 | 35,033 | 4,018 | 5,972 | ||||||||||||||||||||||||
Total gross profit | 1,658 | 4,803 | 12,055 | 68,409 | 36,766 | 72,420 | 13,032 | 40,283 | ||||||||||||||||||||||||
Operating expenses | ||||||||||||||||||||||||||||||||
Research and development(1) | 12,287 | 10,635 | 13,443 | 23,611 | 34,137 | 52,249 | 11,695 | 19,681 | ||||||||||||||||||||||||
Sales and marketing(1) | 10,497 | 12,857 | 19,650 | 27,265 | 36,010 | 61,785 | 11,158 | 22,842 | ||||||||||||||||||||||||
General and administrative(1) | 3,986 | 4,241 | 6,027 | 9,427 | 12,871 | 22,917 | 4,346 | 8,094 | ||||||||||||||||||||||||
Restructuring | — | — | — | — | — | 3,119 | — | 1,841 | ||||||||||||||||||||||||
In-process research and development and amortization of intangible assets | — | — | — | 3,119 | 7,459 | 7,584 | 6,918 | 463 | ||||||||||||||||||||||||
Total operating expenses | 26,770 | 27,733 | 39,120 | 63,422 | 90,477 | 147,654 | 34,117 | 52,921 | ||||||||||||||||||||||||
Operating income (loss) | (25,112 | ) | (22,930 | ) | (27,065 | ) | 4,987 | (53,711 | ) | (75,234 | ) | (21,085 | ) | (12,638 | ) | |||||||||||||||||
Interest and other income (expense), net | 457 | (5,176 | ) | (2,368 | ) | 544 | (920 | ) | (848 | ) | (396 | ) | 5,384 | |||||||||||||||||||
Income (loss) before provision for income taxes and cumulative effect of change in accounting principle | (24,655 | ) | (28,106 | ) | (29,433 | ) | 5,531 | (54,631 | ) | (76,082 | ) | (21,481 | ) | (7,254 | ) | |||||||||||||||||
Benefit from (provision for) income taxes | (29 | ) | (33 | ) | (22 | ) | (87 | ) | 41 | (209 | ) | 175 | (118 | ) | ||||||||||||||||||
Income (loss) before cumulative effect of change in accounting principle | (24,684 | ) | (28,139 | ) | (29,455 | ) | 5,444 | (54,590 | ) | (76,291 | ) | (21,306 | ) | (7,372 | ) | |||||||||||||||||
Cumulative effect of change in accounting principle | — | 206 | — | — | — | — | — | — | ||||||||||||||||||||||||
Net income (loss) | $ | (24,684 | ) | $ | (27,933 | ) | $ | (29,455 | ) | $ | 5,444 | $ | (54,590 | ) | $ | (76,291 | ) | $ | (21,306 | ) | $ | (7,372 | ) | |||||||||
40
Table of Contents
| Actual | Pro forma combined | Actual | ||||||||||||||||||||||||||||||
| Fiscal year ended September 30, | Six months ended March 31, | |||||||||||||||||||||||||||||||
(in thousands, except per share data) | 2005(3) | 2006(3) | 2007 | 2008 | 2009 | 2009 | 2009 | 2010 | ||||||||||||||||||||||||
Net income (loss) per share(2) | ||||||||||||||||||||||||||||||||
Basic | $ | (88.71 | ) | $ | (82.16 | ) | $ | 121.06 | $ | (12.88 | ) | $ | 52.15 | $ | 13.70 | $ | 245.79 | $ | (8.54 | ) | ||||||||||||
Diluted | $ | (88.71 | ) | $ | (82.16 | ) | $ | (46.70 | ) | $ | (12.88 | ) | $ | (20.79 | ) | $ | (24.41 | ) | $ | (2.58 | ) | $ | (8.54 | ) | ||||||||
Weighted average shares used in computing net income (loss) per share(2) | ||||||||||||||||||||||||||||||||
Basic | 280 | 340 | 344 | 386 | 640 | 852 | 435 | 863 | ||||||||||||||||||||||||
Diluted | 280 | 340 | 1,030 | 386 | 4,563 | 4,775 | 8,268 | 863 | ||||||||||||||||||||||||
| (1) | Includes stock-based compensation expense as follows: |
| Actual | Pro forma combined | Actual | ||||||||||||||||||||||
| Fiscal year ended September 30, | Six months ended March 31, | |||||||||||||||||||||||
| (in thousands) | 2005(4) | 2006(4) | 2007 | 2008 | 2009 | 2009 | 2009 | 2010 | ||||||||||||||||
Cost of goods sold | $ | — | $ | — | $ | 44 | $ | 95 | $ | 38 | $ | 38 | $ | 23 | $ | 9 | ||||||||
Research and development | — | — | 150 | 322 | 212 | 212 | 118 | 173 | ||||||||||||||||
Sales and marketing | — | — | 215 | 335 | 177 | 177 | 116 | 142 | ||||||||||||||||
General and administrative | — | — | 225 | 637 | 195 | 195 | 107 | 232 | ||||||||||||||||
Total stock-based compensation | $ | — | $ | — | $ | 634 | $ | 1,389 | $ | 622 | $ | 622 | $ | 364 | $ | 556 | ||||||||
| (2) | See note 7 to the notes to our consolidated financial statements for a description of the method used to compute basic and diluted net income (loss) per share. |
| (3) | Certain reclassifications have been made to the 2005 and 2006 consolidated statements of operations data to conform to the current year presentation. These reclassifications did not have any impact on the previously-reported net loss. |
| (4) | In fiscal years 2005 and 2006, we recognized an expense in the consolidated statement of operations only for options with intrinsic value at the date of grant. As all options granted to employees prior to October 1, 2006 were granted with an exercise price equal to the fair value of the underlying stock, no compensation cost was recorded in these fiscal years. |
| As of September 30, | As of March 31, 2010 | ||||||||||||||||||||
| (in thousands) | 2005 | 2006 | 2007 | 2008 | 2009 | ||||||||||||||||
Consolidated balance sheet data: | |||||||||||||||||||||
Cash, cash equivalents and short-term investments | $ | 12,814 | $ | 9,027 | $ | 40,067 | $ | 50,572 | $ | 67,165 | $ | 55,157 | |||||||||
Working capital | 4,457 | (35,565 | ) | (199 | ) | 39,589 | 47,910 | 15,742 | |||||||||||||
Total assets | 64,267 | 73,761 | 117,577 | 126,078 | 209,383 | 190,990 | |||||||||||||||
Total debt and capital lease obligations | 4,709 | 8,214 | 11,292 | 18,288 | 28,145 | 26,788 | |||||||||||||||
Other long-term liabilities | 356 | 312 | 491 | 467 | 6,015 | 5,546 | |||||||||||||||
Preferred stock warrant liability | — | 12,696 | — | — | — | 16,021 | |||||||||||||||
Redeemable convertible preferred stock | 32,089 | 32,089 | — | — | — | — | |||||||||||||||
Convertible preferred stock | 139,475 | 139,475 | 152,024 | 197,216 | 204,539 | 204,539 | |||||||||||||||
Common stock and additional paid-in capital | 23,448 | 15,645 | 32,500 | 36,284 | 39,018 | 20,031 | |||||||||||||||
Total stockholders’ equity (deficit)(1) | (36,485 | ) | (72,221 | ) | (1,160 | ) | 48,282 | 91,707 | 63,117 | ||||||||||||
| (1) | 2005 and 2006 figures have been updated to reflect the correction of stockholders’ equity (deficit) as described in note 15 to the consolidated financial statements included elsewhere in this prospectus. |
41
Table of Contents
Management’s discussion and analysis of
financial condition and results of operations
The following discussion and analysis of our financial condition and results of operations should be read in conjunction with our consolidated financial statements and related notes included elsewhere in this prospectus. In addition to historical consolidated financial information, the following discussion contains forward-looking statements that reflect our plans, estimates and beliefs. Our actual results could differ materially from those discussed in the forward-looking statements. Factors that could cause or contribute to these differences include those discussed below and elsewhere in this prospectus, particularly in the section entitled “Risk factors.” References to fiscal 2007, 2008 and 2009 refer to our fiscal years ended September 30, 2007, 2008 and 2009, respectively.
Business overview
We provide high performance networking solutions for data center and other network deployments. Our solutions include switches and routers that deliver the high density, performance, resiliency and reliability that our customers demand in a cost-effective manner.
We are organized in two operating segments—Ethernet, which consists of our E-Series, C-Series and S-Series products, and Transport, which includes our multi-service transport and access products. Our Ethernet segment consists of 1 GbE and 10 GbE switches and routers. These products are targeted at data center, high performance enterprise and service provider networks. Our Transport segment, which includes the Traverse and TraverseEdge products for metro networks, the MASTERseries and Axxius products for wireless aggregation networks, and the Adit product for converged business access networks.
Historically, we developed, sold and marketed products to telecommunications service providers. Beginning in the fourth quarter of our fiscal 2009, we increased our focus on the data center market, which we believe has significant growth opportunities, with the goal of leveraging this investment into high performance enterprise and service provider markets.
We sell our products and associated services in the United States, primarily through our direct sales force. We also rely on channel partners, such as resellers, distributors and system integrators, particularly in international markets. We believe our channel strategy allows us to reach a larger number of prospective customers more effectively than if we were to sell directly. Our channel partners generally perform installation and implementation services. In most cases, our channel partners provide post-contractual support, or PCS, by providing first-level support services and purchasing additional services from us under a PCS contract.
Revenue from international sales comprised 21.2% and 21.6% of our total revenue for our fiscal year 2009 and the first six months of fiscal 2010, respectively. Although we intend to focus on increasing international sales, we expect that sales to customers in the United States will continue to comprise the majority of our sales for the foreseeable future.
We outsource the manufacturing of our products to contract manufacturers. Our outsourced manufacturing model allows us to scale our business without the significant capital investment and on-going expenses required to establish and maintain a manufacturing operation. Our contract manufacturers provide us with a range of operational and manufacturing services, including component procurement and final testing and assembly of our products. We work
42
Table of Contents
closely with our contract manufacturers and key suppliers to manage the procurement, quality and cost of components. We seek to maintain an optimal level of finished goods inventory to meet our forecasted product sales and unanticipated shifts in sales volume and product mix.
We believe several emerging trends and developments will be integral to the future growth of our business. The pervasiveness and increasing complexity of computing, combined with the growth in IP traffic, driven by the demand for anytime and anywhere access to applications and network content, has made high performance IP-based networks more essential for organizations. We also believe several additional trends, such as data center consolidation, increased adoption of virtualization and cloud computing technologies and increased focus on managing operating costs are exacerbating the need for high performance networking equipment. As a result, our plan is to capitalize on these trends by focusing our business on selling products targeted at this growing market. While we currently expect this market to grow, we cannot offer a specific timetable as to when or if we will be able to capitalize on these trends and achieve profitability on a GAAP basis.
Our ability to capitalize on emerging trends and developments will depend, in part, on our ability to execute our growth strategy of extending our market position, maintaining and extending our technological advantages, and expanding our relationships with our channel partners. We also intend to focus efforts on improving our supply chain management and to outsource functions that we have historically performed internally to help reduce our costs and expenses. Our ability to achieve and maintain profitability in the future will be affected by, among other things, the continued acceptance of our products, the timing and size of orders, the average selling prices for our products and services, the costs of our products, and the extent to which we invest in our sales and marketing, research and development, and general and administrative resources. However, we can offer no assurance that we will succeed in these efforts. We intend for our operating expenses to increase in absolute dollars but decline as a percentage of total revenue on an annual basis.
Significant issues affecting comparability from period-to-period
Certain significant items or events should be considered to better understand differences in our results of operations from period-to-period. We believe that the following items or events have significantly affected our financial results for prior periods and the results we may achieve in the future:
Recent acquisitions
In March 2009, we acquired Legacy Force10, which developed, marketed and sold Ethernet switch and router products. With this acquisition, we established our Ethernet business segment and began to market our products for use in data centers and high performance enterprise networks. The aggregate purchase consideration consisted of 7,826,800 shares of our Series A preferred stock, 424,200 shares of our common stock, and warrants to purchase 1,036,948 shares of our convertible preferred stock, which was valued at $69.1 million in the aggregate. We also incurred $3.1 million in direct acquisition costs, resulting in total purchase consideration of $72.2 million. As a result of the acquisition of Legacy Force10, we immediately expensed $6.5 million of in-process research and development, and we recognized $16.0 million of acquired intangible assets and $15.3 million of goodwill. Our historical results of operations include the results from our Ethernet segment, which was established following the acquisition of Legacy Force10, beginning with the quarter ended June 30, 2009.
43
Table of Contents
In February 2008, we acquired Carrier Access, which provided wireless aggregation and converged business access equipment to wireless and wireline communications carriers. With this acquisition, we began to sell our MASTERseries and Axxius wireless aggregation platforms and Adit converged business access product to wireless and wireline carriers. The aggregate purchase price for Carrier Access was approximately $95.4 million, including approximately $69.0 million of Carrier Access’ cash on hand. As a result of the acquisition of Carrier Access, we immediately expensed $2.6 million of in-process research and development, and we recognized $5.8 million of acquired intangible assets and $5.8 million of goodwill. The results of operations of Carrier Access are reflected in our consolidated results of operations beginning with the quarter ended March 31, 2008.
Revenue recognition
Our revenue as reported under GAAP, increased from fiscal 2007 to fiscal 2008, but decreased in fiscal 2009. We believe this trend in revenue is not indicative of our expected revenue in future periods due to the following:
| • | Prior to fiscal 2007, the substantial majority of our sales had an implied customer support element due to the fact that we provided PCS free of charge to substantially all of our customers, sometimes in excess of their contractual rights. As a result, in fiscal 2007 and prior years, substantially all revenue was deferred and recognized as ratable product and service revenue over periods of up to 48 months, the estimated useful life of the product. On December 1, 2007, we terminated the implied customer support element in the majority of our sales arrangements by no longer providing customer support to customers who were not entitled to receive such services. For customers where we terminated these services on that date, we then recognized any previously deferred revenue and direct costs immediately. For other customers where we entered into a new PCS contractual arrangement, we adjusted the amortization period in accordance with the terms of the new arrangement and accelerated our revenue recognition to ratable product and service revenue over the shortened contract period. This change in revenue recognition resulted in the acceleration of the recognition of a significant amount of ratable product and service revenue in fiscal 2008. |
| • | Prior to April 1, 2008, we did not have vendor-specific objective evidence, or VSOE, for PCS, which meant all product and PCS revenue were deferred and recognized as ratable product and service revenue over the contractual support period, or 48 months, for shipments prior to December 1, 2007. As of April 1, 2008, we established VSOE for PCS and certain other bundled elements, which allowed us to recognize product revenue upon shipment or delivery of the product, and to recognize PCS revenue over the contractual support period. |
| • | As a result of our acquisitions of Carrier Access and Legacy Force10, we recognized incremental revenue since the respective acquisition dates as compared to the prior periods. For example, in fiscal 2009 and the first six months of fiscal 2010, we recognized revenue from sales of Legacy Force10 products and services of $34.4 million and $48.5 million, respectively. |
Gross margin
Our gross margin decreased from fiscal 2008 to fiscal 2009. We believe this decrease in gross margin is not indicative of our expected gross margin in future periods due to the following:
| • | In connection with our acquisition of Legacy Force10, we recorded a purchase accounting adjustment to increase the inventory acquired to its current fair market value, less normal selling costs and a normal profit margin on such costs, which resulted in an $11.4 million |
44
Table of Contents
increase in inventory as of April 1, 2009. Upon the sale of this inventory in fiscal 2009 and the first six months of fiscal 2010, we incurred $8.3 million and $2.6 million, respectively, of incremental product cost of goods sold due to the stepped-up fair value of this inventory. |
| • | In connection with our acquisitions of Legacy Force10 and Carrier Access, amortization associated with acquired developed technology and backlog was amortized to product cost of goods sold in the amount of $2.1 million and $0.6 million in fiscal 2009 and the first six months of fiscal 2010, respectively. |
| • | In connection with our acquisition of Legacy Force10, we recorded a purchase accounting adjustment to reduce deferred service revenue to its fair value, representing our estimated future costs to fulfill acquired contractual service obligations plus a normal profit margin. As a result, upon our acquisition of Legacy Force10 on March 31, 2009, we recorded the deferred service revenue at a value that was $8.4 million less than its carrying value on Legacy Force10’s financial statements. The impact of this purchase accounting adjustment during fiscal 2009 and the first six months of fiscal 2010 was a reduction in service revenue of $4.2 million and $2.2 million, respectively, compared to the amounts that would have been recognized had we not made this adjustment. |
Other purchase accounting expenses
In connection with our acquisitions of Carrier Access and Legacy Force10, we incurred other purchase accounting expenses of $3.1 million, $7.5 million and $0.5 million in fiscal 2008, fiscal 2009 and the first six months of fiscal 2010, respectively. These expenses related to the write- off of purchased in-process research and development related to development projects that had not yet reached technological feasibility and had no alternative future use, and the amortization of acquired intangible assets with defined useful lives.
Restructuring, severance and other expenses
| • | Subsequent to our acquisition of Legacy Force10, we embarked on a plan to realign our operations by eliminating redundant positions in the combined company. We incurred severance and other expenses related to this realignment plan of $0.8 million in fiscal year 2009 and $2.4 million in the first six months of fiscal 2010. As a result of these efforts, we have significantly reduced our operating expenses. For the six months ended March 31, 2010, we incurred a total of $50.6 million of research and development, sales and marketing and general and administrative expenses, as compared to a total of $81.1 million for the six months ended March 31, 2009 on a pro forma as combined basis. See our unaudited pro forma condensed combined financial statements included elsewhere in this prospectus. |
| • | In October 2009, we announced that we were shutting down our design center in Shanghai, China. In March 2010, we exited our office facility in Boulder, Colorado. As a result of these actions, we incurred total restructuring expenses of $1.8 million for our Transport segment during the first six months of fiscal 2010, consisting of severance payments related to a headcount reduction of 58 employees in Shanghai, and asset impairment charges, other termination benefits and facility exit costs for both locations. |
New accounting standards
With the adoption of FASB Accounting Standards Codification, or ASC, 605-25 (formerly referred to as Emerging Issues Task Force, or EITF, Issue No. 08-1) and ASC 985-605 (formerly referred to as EITF Issue 09-3), effective for our fiscal year beginning October 1, 2010, our revenue recognition
45
Table of Contents
could change significantly in future periods. While we expect the adoption of these standards to result in the accelerated recognition of product revenue for certain bundled arrangements entered into after the adoption, we have not completed our evaluation of the impact of these standards. See note 1 to the notes to our consolidated financial statements included elsewhere in this prospectus.
Key metrics
We monitor the key financial metrics set forth below to help us evaluate future growth trends, establish budgets, measure the effectiveness of our sales and marketing efforts and assess operational efficiencies.
| Actual | Pro forma(1) combined | Actual | ||||||||||||||||||||||
| Fiscal year ended September 30, | Six months ended March 31, | |||||||||||||||||||||||
| (dollars in thousands) | 2007 | 2008 | 2009 | 2009 | 2009 | 2010 | ||||||||||||||||||
Revenue | ||||||||||||||||||||||||
Product | $ | — | $ | 48,225 | $ | 86,120 | $ | 113,005 | $ | 29,232 | $ | 66,494 | ||||||||||||
Service | — | 5,370 | 16,290 | 22,398 | 6,613 | 13,227 | ||||||||||||||||||
Ratable product and service | 31,562 | 102,303 | 16,660 | 63,820 | 8,729 | 9,894 | ||||||||||||||||||
Total revenue | $ | 31,562 | $ | 155,898 | $ | 119,070 | $ | 199,223 | $ | 44,574 | $ | 89,615 | ||||||||||||
Revenue by segment | ||||||||||||||||||||||||
Ethernet | $ | — | $ | — | $ | 34,367 | $ | 114,520 | $ | — | $ | 48,501 | ||||||||||||
Transport | 31,562 | 155,898 | 84,703 | 84,703 | 44,574 | 41,114 | ||||||||||||||||||
Change in total deferred revenue | 16,672 | (60,137 | ) | 5,234 | (8,592 | ) | (3,703 | ) | ||||||||||||||||
GAAP operating income (loss) | (27,065 | ) | 4,987 | (53,711 | ) | (21,085 | ) | (12,638 | ) | |||||||||||||||
Non-GAAP operating income (loss) | (26,431 | ) | 10,013 | (35,188 | ) | (13,411 | ) | (6,528 | ) | |||||||||||||||
GAAP net income (loss) | (29,455 | ) | 5,444 | (54,590 | ) | (21,306 | ) | (7,372 | ) | |||||||||||||||
Non-GAAP net income (loss) | (28,598 | ) | 10,470 | (36,067 | ) | (13,632 | ) | (7,029 | ) | |||||||||||||||
Gross margin by segment | ||||||||||||||||||||||||
Ethernet | — | % | — | % | 27.8 | % | 39.7 | % | — | % | 48.7 | % | ||||||||||||
Transport | 38.2 | 43.9 | 32.1 | 32.1 | 29.2 | 40.5 | ||||||||||||||||||
| (1) | The unaudited pro forma condensed combined information is based on our separate historical financial information and that of Legacy Force10, presented as if the acquisition had occurred on October 1, 2008 with recurring acquisition-related adjustments reflected in this information. The unaudited pro forma condensed combined information is provided for informational purposes only and is not necessarily and should not be assumed to be an indication of the results that would have been achieved had the transaction been completed as of the dates indicated or that may be achieved in the future. See our unaudited pro forma condensed combined financial statements included elsewhere in this prospectus. |
Total revenue. Total revenue is comprised of product revenue generated from sales of our Ethernet and transport and access products, service revenue generated primarily from PCS, and ratable product and service revenue generated from sales of our products and services in cases where the fair value of the services being provided cannot be segregated from the value of the entire sale. Historically, we developed, sold and marketed products to telecommunications service providers. Subsequent to the
46
Table of Contents
acquisition of Legacy Force10 in 2009, management determined that the revenue growth and gross margin potential for the Ethernet segment was higher than the Transport segment. Therefore, management decided to make a shift in strategic focus in the fourth quarter of fiscal 2009 by increasing our efforts in growing our market share in our Ethernet segment by initially focusing on the data center market, which we believe has significant growth opportunities, with the goal of leveraging this investment into high performance enterprise and service provider markets. Total revenue increased 101.0% in the first six months of fiscal 2010 compared to the first six months of 2009, but decreased by 23.6% in fiscal 2009 compared to fiscal 2008. For a more complete description of the reasons for changes in total revenue, please see the section “Results of operations” below.
Revenue by segment. We are organized in two operating segments – Ethernet, which consists of our E-Series, C-Series and S-Series products, and Transport, which includes our multi-service transport and access products. On March 31, 2009, with the acquisition of Legacy Force10, we established our Ethernet business segment. Prior to the acquisition, all revenue was generated by our Transport business segment. Our management monitors revenue by segment on a regular basis in deciding how to allocate resources and in assessing our performance as a whole, and of each business segment in particular. Since the acquisition of Legacy Force10 we have focused on investing resources in key technology initiatives aimed at growing our Ethernet segment revenue, and intend to continue to do so for the foreseeable future as we believe there is potential for greater revenue growth and higher margins in the Ethernet segment. In connection with this strategy, we anticipate increasing our engineering, sales and marketing headcount focused on the Ethernet segment. For a more complete description of the reasons for changes in revenue by segment, please see the section “Results of operations” below.
Change in total deferred revenue. Our deferred revenue consists of amounts that have been invoiced but that have not yet been recognized as revenue. The majority of our total deferred revenue balance as of March 31, 2010 consisted of the unamortized portion of service revenue from PCS and revenue deferred due to non delivery of certain elements under the sales arrangement. We monitor our deferred revenue balance because it represents a significant portion of revenue to be recognized in future periods. We also assess the change in our deferred revenue balance plus revenue we recognized in a particular period as a measure of our sales activity in that period. We also believe that it is an important metric for investors evaluating our operating results in a given period. The increase in deferred revenue in fiscal 2007 and the decrease in deferred revenue in fiscal 2008 were primarily due to changes in revenue recognition described above under “—Significant issues affecting comparability from period-to-period.” The increase in deferred revenue in fiscal 2009 was due to increased sales of PCS, commensurate with our increase in product sales during the same period. The decrease in deferred revenue in the first six months of fiscal 2010 was due to the recognition of $7.2 million of previously deferred product and service revenue as we satisfied the remaining deliverables under two existing customer contracts for transport products and services, offset by deferred revenue related to current period shipments.
Gross margin by segment. Gross margin, defined as gross profit as a percentage of total revenue, has been and will continue to be affected by a variety of factors, including the mix of products sold, manufacturing costs and any write-offs of excess or obsolete inventory, and the mix of revenue between products and services. Our management monitors gross margin by segment on a regular basis in assessing the performance of the respective business segments. In comparing gross margin by segment over the last four quarters, management determined that our Ethernet segment products generate higher unit gross margin than our Transport segment
47
Table of Contents
products, and therefore our overall gross margin is affected by the level of sales of these products. This was a factor management considered in making its strategic decision to focus more of our efforts and resources in growing our Ethernet segment revenue. For a more complete description of the reasons for changes in gross margin by segment, please see the section “Results of operations” below.
Non-GAAP financial results. We believe that the use of non-GAAP operating income (loss) and non-GAAP net income (loss) are helpful financial measures for an investor determining whether to invest in our common stock. In computing these measures, we exclude certain items that are considered by us to be outside ongoing operating results, such as inventory purchase accounting adjustments, in-process research and development expenses and restructuring charges. Management believes excluding these items helps investors compare our operating performance with our results in prior periods, as well as with the performance of other companies, as they are not indicative of ongoing operating results and therefore limit comparability between periods.
| • | Restructuring charges. These charges related to severance, lease termination, asset impairment, and other costs for the Transport segment associated with the closures of our development center in Shanghai and office facility in Boulder, Colorado. |
| • | Inventory purchase accounting adjustment. In the acquisition of Legacy Force10, we were required to record acquired inventory at its fair market value, less normal selling costs and a normal profit margin on such costs, which resulted in an $11.4 million increase in inventory, as of April 1, 2009. As we have sold this inventory, our cost of goods sold has been significantly impacted by this purchase accounting adjustment. |
| • | Change in fair value of warrant liability. This represents a non-cash charge representing the difference in the fair value of our preferred stock warrant liability between the beginning and end of the period. |
| • | Gain on extinguishment of preferred stock warrants. This represents a non-cash gain upon the exchange of certain preferred stock warrants in 2007 for warrants to purchase a different series of preferred stock. |
| • | In-process research and development and amortization of intangible assets. These charges relate to our acquisitions of Carrier Access and Legacy Force10. Under GAAP, we were required to immediately charge to expense the fair value of acquired in-process research and development, and to record intangible assets and amortize them over their useful lives. While amortization is a recurring item, we believe that excluding these charges provides for more accurate comparisons of our historical and our current operating results and those of similar companies due to the varying nature and significance of acquisitions that we and similar companies may complete, and the varying valuation methodologies and amortization periods related to intangible assets. |
| • | Employee stock-based compensation. This represents non-cash charges for the fair value of stock options and other awards granted to employees. While this is a recurring item, we believe that excluding these charges provides for more accurate comparisons of our historical and our current operating results and those of similar companies due to the varying available valuation methodologies, subjective assumptions and the variety of stock-based award types issued. |
These non-GAAP financial measures may not provide information that is directly comparable to that provided by other companies in our industry, as other companies in our industry may
48
Table of Contents
calculate such financial measures differently, particularly as it relates to nonrecurring, unusual items. Our non-GAAP financial measures are not measurements of financial performance under GAAP, and should not be considered as alternatives to net income (loss) or as indications of operating performance or any other measure of performance derived in accordance with GAAP. We do not consider these non-GAAP financial measures to be a substitute for, or superior to, the information provided by GAAP financial measures.
The following table reflects the reconciliation of non-GAAP operating income (loss) and non-GAAP net income (loss) to GAAP operating income (loss) and GAAP net income (loss).
| Fiscal year ended September 30, | Six months ended March 31, | ||||||||||||||||||
| (in thousands) | 2007 | 2008 | 2009 | 2009 | 2010 | ||||||||||||||
GAAP operating income (loss) | $ | (27,065 | ) | $ | 4,987 | $ | (53,711 | ) | $ | (21,085 | ) | $ | (12,638 | ) | |||||
Non-GAAP adjustments | |||||||||||||||||||
Add: Amortization of intangible assets included in cost of goods sold | — | 518 | 2,126 | 392 | 634 | ||||||||||||||
Add: Inventory purchase accounting adjustment | — | — | 8,316 | — | 2,616 | ||||||||||||||
Add: Restructuring | — | — | — | — | 1,841 | ||||||||||||||
Add: In-process research and development and amortization of intangible assets included in operating expenses | — | 3,119 | 7,459 | 6,918 | 463 | ||||||||||||||
Add: Employee stock-based compensation | 634 | 1,389 | 622 | 364 | 556 | ||||||||||||||
Non-GAAP operating income (loss) | $ | (26,431 | ) | $ | 10,013 | $ | (35,188 | ) | $ | (13,411 | ) | $ | (6,528 | ) | |||||
GAAP net income (loss) | $ | (29,455 | ) | $ | 5,444 | $ | (54,590 | ) | $ | (21,306 | ) | $ | (7,372 | ) | |||||
Non-GAAP adjustments | |||||||||||||||||||
Add: Amortization of intangible assets included in cost of goods sold | — | 518 | 2,126 | 392 | 634 | ||||||||||||||
Add: Inventory purchase accounting adjustment | — | — | 8,316 | — | 2,616 | ||||||||||||||
Add: Restructuring | — | — | — | — | 1,841 | ||||||||||||||
Add: In-process research and development and amortization of intangible assets included in operating expenses | — | 3,119 | 7,459 | 6,918 | 463 | ||||||||||||||
Add: Employee stock-based compensation | 634 | 1,389 | 622 | 364 | 556 | ||||||||||||||
Add: Change in fair value of preferred stock warrant liability | 2,025 | — | — | — | (5,767 | ) | |||||||||||||
Subtract: Gain on extinguishment of preferred stock warrants | (1,802 | ) | — | — | — | — | |||||||||||||
Non-GAAP net income (loss) | $ | (28,598 | ) | $ | 10,470 | $ | (36,067 | ) | $ | (13,632 | ) | $ | (7,029 | ) | |||||
The income tax effect of the above non-GAAP adjustments was insignificant for all periods presented.
49
Table of Contents
Components of operating results
Revenue
Our total revenue is comprised of the following:
| • | Product revenue. Product revenue is generated from sales of our Ethernet and transport and access products. Prior to our acquisition of Legacy Force10 on March 31, 2009, substantially all of our product revenue was generated from sales of products in our Transport segment. We began selling our Ethernet products in April 2009. |
| • | Service revenue. Service revenue is generated primarily from PCS, which typically includes technical support services for software updates, maintenance releases and patches, telephone and Internet access to technical support personnel and hardware warranty. We recognize revenue from support services ratably over the service performance period. Our typical PCS term is one year from the date of product shipment, and generally does not exceed 36 months. We also generate a small portion of our revenue from professional services and training services, which are recognized when such services are delivered. |
| • | Ratable product and service revenue. Ratable product and service revenue is generated from sales of our products and services in cases where the fair value of the services being provided cannot be segregated from the value of the entire sale. In these cases, the value of the entire sale is deferred and recognized ratably over the life of the service performance period. See “—Critical accounting policies and estimates—Revenue recognition.” In fiscal 2009 and the first six months of fiscal 2010, ratable product and service revenue represented approximately 14.0% and 11.0% of total revenue, respectively, and we expect the percentage of ratable product and service revenue to decline in the future as a result of the impact of our adoption of ASC 605-25 and ASC 985-605 effective October 1, 2010 as discussed under note 1 to the notes to our consolidated financial statements. |
The variability of our revenue directly impacts our operating results in any particular period because a significant portion of our operating costs, such as personnel costs, facilities expense, depreciation expense and sales commissions are either fixed in the short term or may not vary proportionately with recorded revenue.
Cost of goods sold
Our cost of goods sold is comprised of the following:
| • | Cost of product revenue. The substantial majority of the cost of product revenue consists of third-party manufacturing costs. Our cost of product revenue also includes write-offs of excess and obsolete inventory, royalty payments, amortization and any impairment of certain acquired intangible assets, warranty costs, shipping and allocated facilities costs, and personnel costs associated with our operations team. |
| • | Cost of service revenue. Cost of service revenue is primarily comprised of personnel costs associated with our technical assistance center, professional services and training teams, as well as depreciation, supplies, data center, data communications, and facility-related costs. We expect our cost of service revenue will increase in absolute dollars as we continue to invest in support services to meet the needs of our customer base. |
| • | Cost of ratable product and service revenue. Cost of ratable product and service revenue is comprised primarily of the amortization of deferred product and services costs associated with |
50
Table of Contents
sales that we classify as ratable product and service revenue. We expect that cost of ratable product and service revenue as a percentage of cost of goods sold will decline commensurate with ratable product and service revenue in the future. |
Gross margin
Gross profit as a percentage of total revenue, or gross margin, has been and will continue to be affected by a variety of factors, including the mix of products sold, manufacturing costs and any write-offs of excess and obsolete inventories, and the mix of revenue between products and services. Because our Ethernet segment products generate higher unit gross margin than our Transport segment products, we expect that our overall gross margin will be affected by the level of sales of, and gross margin on, these products.
Service revenue has increased over time as a percentage of total revenue and this trend has had a positive effect on our total gross margin given the higher service gross margin compared to product gross margin. We expect service gross margin to remain relatively constant in the future as we continue to invest in our support infrastructure.
Operating expenses
Our operating expenses consist of research and development, sales and marketing, general and administrative, restructuring expenses, and amortization of purchased intangibles and other purchase accounting charges. Personnel costs are the most significant component of operating expenses and consist of costs such as salaries, benefits, bonuses, stock-based compensation and, with regard to sales and marketing expense, sales commissions.
| • | Research and development. Research and development expense consists of personnel costs, as well as system prototype and certification-related expenses, depreciation of capital equipment and facility-related expenses. We record all research and development expenses as incurred. We expect our spending for research and development to increase in absolute dollars but intend for research and development expenses to decline as a percentage of total revenue on an annual basis as we grow our revenue base. |
| • | Sales and marketing. Sales and marketing expense primarily consists of personnel costs, as well as promotional and other marketing expenses, travel, depreciation of capital equipment and facility-related expenses. We intend to hire additional personnel focused on sales and marketing and expand our sales and marketing efforts worldwide in order to add new customers and increase penetration within our existing customer base. We also plan to continue to invest in our worldwide marketing activities to help build brand awareness and generate sales leads. Accordingly, we expect sales and marketing expenses to increase in absolute dollars and to continue to be our largest operating expense, but intend for sales and marketing expenses to decline as a percentage of total revenue on an annual basis as we grow our revenue base. |
| • | General and administrative. General and administrative expense consists of personnel costs as well as professional fees, depreciation of capital equipment and software, and facility-related expenses. General and administrative personnel include our executive, finance, human resources, information technology and legal organizations. We expect that general and administrative expense will increase in absolute dollars as we hire additional personnel, make improvements to our information technology infrastructure and incur significant additional costs to comply with the requirements of operating as a public company, including the costs |
51
Table of Contents
associated with SEC reporting, Sarbanes-Oxley Act compliance and insurance. However, we intend for general and administrative expenses to decline as a percentage of total revenue on an annual basis. |
| • | Restructuring. Restructuring expense, primarily related to our Transport segment, consists of severance payments, other termination benefits, asset impairment charges and facility exit costs related to the shutdown of our design center in Shanghai, China announced in October 2009 as well as the closing of our office facility in Boulder, Colorado in March 2010. |
| • | In-process research and development and amortization of intangible assets. These expenses consist of the write-off of purchased in-process research and development related to projects that had not yet reached technological feasibility and have no alternative use, and amortization of acquired intangible assets with defined useful lives. |
Interest and other income (expense), net
Interest income consists of income earned on our cash, cash equivalents and short-term investments. Interest expense consists of amounts paid for interest on our short-term and long-term debt borrowings and capital lease obligations.
Other income (expense), net consists primarily of costs incurred with the extinguishment of debt and foreign exchange gains and losses. Foreign exchange gains and losses relate to transactions denominated in currencies other than the functional currency of the associated entity.
Increase in fair value of preferred stock warrant liability
Effective October 1, 2009, we adopted ASC 815, formerly referred to as EITF Issue No. 07-5, Determining Whether an Instrument (or an Embedded Feature) Is Indexed to an Entity’s Own Stock. Under the provisions of ASC 815, we determined that the warrants to purchase our preferred stock should be classified as liabilities and marked to market at each reporting date. The fair value of these warrants was $21.8 million and $16.0 million as of October 1, 2009 and March 31, 2010, respectively. Accordingly, the $5.8 million decrease in value during the six months ended March 31, 2010 was recorded in the consolidated statement of operations as a component of other income (expense).
Provision for income taxes
Our provision for income taxes relates to taxes paid on the income of our foreign subsidiaries. Due to our history of net losses, we have a full valuation allowance against our gross deferred tax assets, other than with respect to $0.1 million at September 30, 2009. As a result, we have recorded no provision or benefit related to federal or state income taxes for any period presented. We expect our provision for income taxes to remain relatively consistent, as we do not expect to reverse any significant portion of our valuation allowance for the foreseeable future.
Critical accounting policies and estimates
Our discussion and analysis of our financial condition and results of operations are based upon our consolidated financial statements, which have been prepared in accordance with GAAP. These principles require us to make estimates and judgments that affect the reported amounts of assets, liabilities, revenue and expenses, cash flows and related disclosure of contingent assets and liabilities. We base our estimates on historical experience and on various other assumptions
52
Table of Contents
that we believe to be reasonable under the circumstances. Actual results may differ from these estimates. To the extent that there are material differences between these estimates and our actual results, our future financial statements will be affected.
We believe that of our significant accounting policies, which are described in note 1 to the notes to our consolidated financial statements included elsewhere in this prospectus, the following accounting policies involve a greater degree of judgment and complexity. Accordingly, we believe these are the most critical to fully understand and evaluate our financial condition and results of operations.
Revenue recognition
We derive revenue primarily from the sales of products, including hardware and software, and services, including PCS, installation and training. PCS typically includes unspecified software updates and upgrades on an if-and-when available basis and telephone and internet access to technical support personnel.
The majority of our products are integrated with software that is essential to the functionality of the hardware. Further, we provide unspecified software upgrades and PCS to our customers for these products. As a result, we account for revenue from these products in accordance with ASC 985-605 (formerly referred to as Statement of Position No. 97-2,Software Revenue Recognition) and all related interpretations. Revenue is recognized when persuasive evidence of an arrangement exists, delivery has occurred or services have been rendered, the price or fee is fixed or determinable and collection is probable.
Certain of our access products are integrated with software that management does not consider to be essential to the functionality of the equipment. Accordingly, we account for revenue from sales of these products in accordance with SEC Staff Accounting Bulletin, or SAB, No. 104,Revenue Recognition,and ASC 605-25-30 (formerly referred to as EITF Issue No. 00-21,Revenue Arrangements with Multiple Deliverables). We recognize revenue on sales of these products and services when persuasive evidence of an arrangement exists, delivery has occurred or services have been rendered, the price or fee is fixed or determinable, and collection is reasonably assured.
See note 1 to the notes to our consolidated financial statements for a discussion of new revenue recognition standards that we will be required to adopt effective October 1, 2010. We are still assessing the impact of the new standards and have not reflected in this prospectus any impact such standards may have on our consolidated financial statements.
Evidence of an arrangement. Contracts and customer purchase orders are used to determine the existence of an arrangement.
Delivery. Delivery is considered to occur when title to our products and risk of loss has transferred to the customer, which typically occurs when products are delivered to a common carrier. Delivery of services occurs when performed. Some customer agreements commit us to provide future-specified software or hardware deliverables. Delivery is considered to have occurred only when all such deliverables have been provided to the customer.
Fixed or determinable fee. We assess whether the sales price is fixed or determinable at the time of sale based on payment terms and whether the sales price is subject to refund or adjustment. If the fee is not fixed or determinable, revenue is recognized as payments become due from the customer. Some of our customer agreements contain acceptance clauses that grant the customer the right to return or exchange products that do not conform to specifications. If
53
Table of Contents
there is insufficient historical evidence of customer acceptance, delivery is considered to have occurred when the conditions of acceptance have been met or the acceptance provisions lapse.
Collectibility. Collectibility is assessed based on the creditworthiness of the customer as determined by credit checks and the customer’s payment history to us. If collectibility is not considered probable, revenue is not recognized until the fee is collected.
Bundled arrangements and establishment of VSOE. Typically, our sales involve multiple elements, such as sales of products bundled with PCS. When a sale involves multiple elements, ASC 985-605 requires that we allocate the entire fee from the arrangement to each respective element based on its VSOE of fair value and recognize revenue when each element’s revenue recognition criteria is met. Prior to April 1, 2008, we had not established VSOE of fair value for any of the elements in sales of our multiple-element arrangements with respect to transport products, thus we accounted for each of these sales arrangements as a single element. As of April 1, 2008, we determined that we had sufficient standalone sales of PCS and certain other elements at consistent prices in order to establish VSOE for these elements. Accordingly, for new multiple-element arrangements after that time that include PCS or other undelivered elements for which VSOE has been established, we allocate and defer revenue related to the undelivered elements using VSOE, with the residual fees allocated to the product. We recognize product revenue upon delivery, assuming that all other criteria for revenue recognition have been met and that VSOE exists for all undelivered elements, and recognize PCS revenue over the contractual support period. Revenue from all bundled transactions with respect to transport products entered into prior to the establishment of VSOE on April 1, 2008, and those entered into subsequently but for which VSOE of services has not been established, is included in ratable product and service revenue in the accompanying consolidated statements of operations.
For sales arrangements occurring in certain regions and with certain specific customers, we have not established VSOE of fair value for PCS and certain other elements. Accordingly, we account for each of these sales arrangements as a single element. The entire fee from each arrangement is deferred until all elements except for the PCS are delivered and all other criteria of ASC 985-605 are met, and then amortized ratably over the contractual service period, generally ranging between 12 and 36 months from the date of initial shipment. This revenue is included in ratable product and service revenue in the accompanying consolidated statements of operations.
The establishment of VSOE for PCS and other elements on April 1, 2008 did not have any impact on the accounting for sales made prior to that date. Any revenue and costs deferred for prior sales continue to be amortized over the contractual service period.
Implied PCS. Historically, we had provided software upgrades and technical support services to substantially all of our Transport customers, sometimes in excess of the customers’ contractual entitlements. This practice created an implied PCS arrangement, for which we did not have VSOE. Therefore, the length of the PCS period was considered to be the longer of (a) the contractual term, or (b) the period over which the implied PCS was expected to be provided, which, in the absence of specific historical experience, was considered to be the life of the product itself. Based upon management’s review of technical innovations, competitive obsolescence, and the relationship between software and hardware development cycles, among other factors, we determined that the life cycle of the products is approximately four years. Accordingly, the entire fee from each arrangement was deferred until all elements except for PCS were delivered and all other criteria of ASC 985-605 were met, and then amortized ratably over the longer of the remaining contractual service period or 48 months, from the date of initial shipment.
54
Table of Contents
On December 1, 2007, we terminated the implied customer support element in the majority of our sales arrangements for transport products by no longer providing customer support to customers who are not entitled to receive such services. For some customers, such services were terminated immediately, in which case any previously deferred revenue and direct costs were recognized immediately. For other customers, the implied PCS arrangement was replaced with a contractual arrangement, upon the expiration of which the customer would be required to pay for PCS. In these instances, we did not immediately recognize any previously deferred revenue or direct costs, but rather adjusted the amortization thereof on a prospective basis to match the new contractual period.
Channel partner arrangements. We complement our direct sales and marketing efforts by using reseller, distributor and system integrator channels to extend our market reach. Resellers and system integrators generally place orders with us after first receiving firm orders from an end customer. Sales to certain resellers and system integrators are on business terms that are similar to sales arrangements with our direct customers, and revenue recognition begins upon sell-in of product to the reseller or system integrator. With respect to sales to distributors or resellers with rights of return, when adequate sales and returns history does not exist to allow management to make a reasonable estimate of future returns, revenue is recognized upon sale by the distributor or reseller to the end customer. Otherwise, revenue is recognized upon shipment and reserves for possible returns are recorded.
Shipping charges. Shipping charges billed to customers are included in revenue and the related shipping costs are included in cost of goods sold.
Deferred product costs. When our products have been delivered, but the product revenue associated with the arrangement has been deferred as a result of not meeting the revenue recognition criteria in ASC 985-605 or SAB 104, we also defer the direct and incremental costs, primarily product costs, associated with the sale, and amortize those costs over the same period as the associated revenue is amortized. Deferred costs related to sales for which revenue will be recognized within one year are classified as current assets, while all deferred costs related to sales for which revenue will be recognized over a period longer than one year are classified as noncurrent assets, with no portion classified as current assets.
Stock-based compensation
Our stock-based compensation expense is as follows:
| Fiscal year ended September 30, | Six months ended March 31, | ||||||||||||||
| (in thousands) | 2007 | 2008 | 2009 | 2009 | 2010 | ||||||||||
Cost of goods sold | $ | 44 | $ | 95 | $ | 38 | $ | 23 | $ | 9 | |||||
Research and development | 150 | 322 | 212 | 118 | 173 | ||||||||||
Sales and marketing | 215 | 335 | 177 | 116 | 142 | ||||||||||
General and administrative | 225 | 637 | 195 | 107 | 232 | ||||||||||
Total stock-based compensation | $ | 634 | $ | 1,389 | $ | 622 | $ | 364 | $ | 556 | |||||
Effective October 1, 2006, we adopted the fair value recognition provisions of ASC 718-10 (formerly referred to as FASB Statement No. 123 (revised 2004),Share-Based Payment) using the prospective transition method. Under the prospective transition method, employee stock-based compensation expense for the years ended September 30, 2007, 2008 and 2009 includes
55
Table of Contents
compensation expense only for stock-based awards granted or modified by us after September 30, 2006, based on the grant date fair value. The fair value of each employee stock option is estimated on the date of grant using the Black-Scholes valuation model. Prior to the adoption of ASC 718-10 on October 1, 2006 we recognized an expense in the statement of operations only for options with intrinsic value at the date of grant. As all options granted to employees prior to October 1, 2006 were granted with an exercise price equal to the fair value of the underlying stock, no compensation cost was recorded. Accordingly, employee stock-based compensation expense in all periods presented relates solely to options granted or modified subsequent to September 30, 2006. For all employee stock options, we recognize expense over the requisite service period using the straight-line method. Option grants to nonemployees have not been significant for any period presented.
The Black-Scholes pricing model was developed for use in estimating the fair value of traded options that have no vesting restrictions and are fully transferable; characteristics not present in our option grants. Existing valuation models, including the Black-Scholes model, may not provide reliable measures of the fair values of our stock-based compensation. Consequently, there is a risk that our estimates of the fair values of our stock-based compensation awards on the grant dates may bear little resemblance to the actual values realized upon exercise. Stock options may expire or otherwise result in zero intrinsic value as compared to the fair values originally estimated on the grant date and reported in our financial statements. Alternatively, values may be realized from these instruments that are significantly higher than the fair values originally estimated on the grant date and reported in our financial statements.
As of September 30, 2009, there was approximately $2.1 million of unrecognized stock-based compensation expense related to non-vested stock option awards, net of estimated forfeitures that we expect to be recognized over a weighted-average period of 2.3 years.
We calculated the fair value of options granted to employees using the Black-Scholes pricing model using the following weighted average assumptions:
| Fiscal year ended September 30, | Six months 2010 | |||||||||||
| 2007 | 2008 | 2009 | ||||||||||
Expected volatility | 61 | % | 52 | % | 51 | % | 50 | % | ||||
Expected term, in years | 6.0 | 6.0 | 6.1 | 6.3 | ||||||||
Dividend yield | — | — | — | — | ||||||||
Risk-free interest rate | 4.6 | % | 3.2 | % | 2.9 | % | 2.9 | % | ||||
Because our stock is not publicly traded, we estimate expected volatility based on historical volatilities of comparable publicly traded companies. The expected term was determined utilizing the “simplified” method as prescribed by authoritative guidance, which uses the average between the weighted average vesting period and the contractual term. For those options for which the simplified method is not appropriate, the expected term is based on our best estimate. The risk-free interest rate is based on U.S. Treasury zero-coupon issues with remaining terms similar to the expected term on the options. Because we have never declared or paid cash dividends and do not expect to pay cash dividends in the foreseeable future, the expected dividend yield was assumed to be zero. If we determine that another method to estimate expected volatility or expected term is more reasonable than our current methods, or if another method for calculating these assumptions is prescribed by authoritative guidance, the fair value
56
Table of Contents
calculated for future stock-based awards could change significantly from past awards, even if the principal terms of the awards are similar. Higher volatility and longer expected terms result in an increase to stock-based compensation determined at the date of grant. The expected dividend rate and expected risk-free interest rate are not as significant to the calculation of fair value. A hypothetical 10% increase or decrease to any of the above assumptions would not have had a material impact on the amount of stock-based compensation expense we recognized in any of the periods presented.
In addition, in determining stock-based compensation expense, we develop an estimate of the number of stock-based awards that we expect to vest. Changes in our estimates of award forfeiture rates and further adjustments when the awards actually vest can have a significant effect on reported stock-based compensation. Increases to the estimated forfeiture rate will result in a decrease to the expense recognized in our financial statements during the period of the change and future periods. Decreases in the estimated forfeiture rate will result in an increase to the expense recognized in the financial statements during the period of the change and future periods. These adjustments affect our cost of goods sold, research and development expense, sales and marketing expense and general and administrative expense. The expense we recognize in future periods could differ significantly from the current period and our forecasts due to adjustments in the estimated number of stock-based awards that we expect to vest and further adjustments when the awards actually vest.
The table below summarizes all stock option grants from March 31, 2009 through June 30, 2010:
| Grant date | Shares subject to options granted | Common stock fair value per share at grant for financial reporting purposes | Exercise price | ||||||
August 14, 2009 | 8,281,080 | $ | 0.06 | $ | 0.06 | ||||
September 16, 2009 | 98,600 | 0.06 | 0.06 | ||||||
October 18, 2009 | 1,038,600 | 0.57 | (1) | 0.06 | |||||
December 24, 2009 | 1,218,520 | 2.15 | (1) | 1.11 | |||||
January 15, 2010 | 53,200 | 3.23 | (1) | 2.36 | |||||
February 9, 2010 | 9,400 | 3.51 | 3.51 | ||||||
March 26, 2010 | 208,950 | 3.81 | 3.81 | ||||||
June 3, 2010 | 3,121,041 | 2.89 | 2.89 | ||||||
| (1) | At the time of these grants, our board of directors determined that the fair value of our common stock was $0.06 per share as of October 18, 2009, $1.11 per share as of December 24, 2009 and $2.36 per share as of January 15, 2010 (as further discussed below). Subsequent to these grants, we obtained valuations of our common and preferred stock as of October 1, 2009 and December 31, 2009 for the purposes of adopting new accounting guidance impacting the accounting for warrants to purchase our preferred stock. These valuations indicated a fair value of our common stock of $0.57 as of October 1, 2009, $2.15 as of December 31, 2009 and $3.23 as of January 15, 2010 which, for financial reporting purposes, we have determined to be more precise estimates of the fair value of our common stock at these grant dates. As such, we have recorded additional expense in our statement of operations related to these options due to the difference between the exercise price and the reassessed grant date fair value. See below for further discussion regarding the change in fair value of our common stock between each valuation date. |
Based upon the assumed IPO price of $ per share, which is the midpoint of the price range set forth on the cover page of this prospectus, the aggregate intrinsic value of options outstanding as of March 31, 2010 was $ million, of which $ million related to vested options and $ million to unvested options.
57
Table of Contents
We believe it is appropriate to only present stock option grant activity since March 31, 2009, due to our recapitalization in March 2009 and the acquisition of Legacy Force10 on March 31, 2009. These events significantly altered our capitalization structure, business prospects and valuation. Further, from the start of fiscal 2009 until March 31, 2009, we granted options to purchase only a total of 6,137 shares, all of which were cancelled in the stock option exchange program discussed below. As such, we do not believe that a description of grants prior to April 1, 2009 would provide meaningful information.
In July 2009, our board of directors approved a voluntary stock option exchange program, or the stock option exchange, for certain holders of our stock options. The stock option exchange offered to replace outstanding options granted to holders of stock options under the 2007 equity incentive plan and 1999 stock plan. The stock option exchange commenced on July 15, 2009 and expired on August 12, 2009. Under the terms of this stock option exchange, previously granted options were exchanged for new replacement options with revised vesting terms to purchase shares of our common stock at an exercise price per share equal to the fair value of our common stock on the date of grant. On August 14, 2009, our board of directors approved and ratified the grant of the replacement options, and, in accordance with the terms of the stock option exchange, we cancelled outstanding options to purchase 1,053,640 shares of common stock and issued new options to purchase 4,468,120 shares of common stock at an exercise price of $0.06 per share, which are included in the table above.
Determining the fair value of our common stock
The fair value of our common stock at the date of each option grant is determined by our board of directors. For all of the options listed above, the board of directors’ intent was to grant the options with exercise prices at least equal to the fair value of our common stock at the date of grant. Given the absence of an active market for our common stock prior to this offering, our board of directors engaged a third party appraisal firm to assist in performing contemporaneous valuations of our common stock as of August 7, 2009, November 29, 2009, February 3, 2010, March 16, 2010 and May 25, 2010.
The August 7, 2009 valuation was used as a basis for the options granted on August 14, 2009, September 16, 2009 and October 18, 2009; the November 29, 2009 valuation was used as a basis for setting the exercise price of the options granted on December 24, 2009 and January 15, 2010; the February 3, 2010 valuation was used as a basis for setting the exercise price of the options granted on February 9, 2010; the March 16, 2010 valuation was used as a basis for setting the exercise price of the options granted on March 26, 2010; and the May 25, 2010 valuation was used as a basis for setting the exercise price of the options granted on June 3, 2010.
Our management and board of directors reviewed each valuation, including the valuation methodologies employed, the assumptions made, and the resulting value of common stock, and concluded that the valuations represented the board of directors’ and managements’ best estimate of the fair value of our common stock as of each valuation date. In addition, our board of directors considered numerous objective and subjective factors in valuing our common stock in accordance with the guidance in the American Institute of Certified Public Accountants Technical Practice Aid,Valuation of Privately-Held-Company Equity Securities Issued as Compensation, which we refer to as the AICPA Practice Aid. These objective and subjective factors included:
| • | the significant liquidation preferences, which were $612.3 million in the aggregate at September 30, 2009, as well as other rights and privileges, of our convertible preferred stock relative to those of our common stock; |
58
Table of Contents
| • | our ability to successfully integrate our recent acquisition of Legacy Force10 into our company; |
| • | changes to our business plan; |
| • | the low likelihood we assigned to achieving an IPO as a liquidity event, as compared to a sale of our company, given the prevailing market conditions and the nature and history of our business; |
| • | our operating and financial performance; |
| • | our stage of development and revenue growth; |
| • | the lack of an active public market for our common and preferred stock; |
| • | industry information such as market growth and volume; |
| • | the execution of sales agreements; and |
| • | the risks inherent in the development and expansion of our products. |
In determining the fair value of our common stock at each valuation date, we used a combination of income approaches and market approaches, as further described below. The significant input assumptions used in the valuation models are based on subjective future expectations combined with management judgment, as follows:
Assumptions utilized in the income approach are:
| • | our expected revenue, operating performance, cash flow and EBITDA for the current and future years, determined as of the valuation date based on our estimates; |
| • | a discount rate, which is applied to discretely forecasted future cash flows in order to calculate the present value of those cash flows; and |
| • | a terminal value multiple, which is applied to our last year of discretely forecasted EBITDA to calculate the residual value of our future cash flows. |
Assumptions utilized in the market approach are:
| • | our expected revenue, operating performance, cash flow and EBITDA for the current and future years, determined as of the valuation date based on our estimates; |
| • | multiples of market value to trailing 12 months revenue, determined as of the valuation date, based on a group of comparable public companies we identified; and |
| • | multiples of market value to expected future revenue, determined as of the valuation date, based on the same group of comparable public companies. |
In determining the most appropriate comparable companies, we considered several factors, including the other companies’ industry, size and their specific products and services.
August 7, 2009 valuation
This valuation was prepared contemporaneously by management, with the assistance of a third-party appraisal firm, for the purpose of granting stock options on August 14, 2009. It was also used by the board of directors as a basis for granting stock options on September 16, 2009 and October 18, 2009.
59
Table of Contents
In determining our enterprise value at August 7, 2009, we used both a market approach (using the guideline public company method) and an income approach. We weighted each of the two approaches equally in determining our estimate of the value of our company. In order to allocate that value between the various classes of stock, we utilized the Option Pricing Method. We utilized both the Black-Scholes Option Pricing Method and the Binomial Lattice Option Pricing Method in our analysis. The analysis was performed for each equity class (preferred and common) considering the rights and preferences of each class, resulting in a per share value for each class.
This valuation included an assumption that a sale of us was significantly more likely than the completion of a successful IPO. The board of directors (of whom the members controlled approximately 45.3% of our outstanding preferred stock at August 7, 2009) believed that an IPO would only be agreed to by a majority of preferred stockholders if our valuation in an IPO was at least equal to 90% of the aggregate liquidation preferences, and further that even at such a valuation, there would only be a 10% likelihood of the preferred stockholders accepting an IPO as the form of liquidation. In arriving at its conclusions regarding the likelihood of a successful IPO, the board of directors also considered the low number of venture-backed technology IPOs in 2008 and 2009, as well as the significant merger and acquisition activity in the telecommunications networking industry. These factors, combined with the significant liquidation preferences, led the board of directors to conclude that a successful IPO was very unlikely as of the valuation date.
Significant assumptions used in the income approach included the following: an annual revenue growth rate of 10%, gross margins of 51.4% to 55.0% over the forecast period, a terminal growth rate of 4%, and a discount rate of 15%.
Significant assumptions used in the market approach included the following: a multiple of 0.72 times trailing twelve months’ revenue, a multiple of 0.77 times next twelve months’ revenue, and equal weighting between the outcomes of these multiples.
Other significant assumptions used in applying the Option Pricing Model and Binomial Lattice Option Pricing Model included the following: estimated time to a liquidity event of 1.5 years, estimated volatility of 50.4%, risk-free interest rate of 0.9%, and no expected dividends.
We also applied a discount for lack of marketability of 25% in arriving at the value of common stock, which reflected the assessment in August 2009 that an IPO was very unlikely.
October 1, 2009 valuation
This valuation was completed in February 2010 by management, with the assistance of a third-party appraisal firm, for purposes of adopting new accounting guidance related to warrants to purchase our convertible preferred stock. Due to the proximity of the valuation date to the October 18, 2009 option grants, this valuation has been used for financial reporting purposes as a basis to record stock-based compensation expense, as management believes it provides a more precise estimate of fair value on October 18, 2009.
In determining our enterprise value at October 1, 2009, we used the Probability-Weighted Expected Return, or PWER, method as described in the AICPA Practice Aid. We determined the probability of a successful IPO to be 10%, based on management’s and the board of directors’ best estimate of the probability at that time. This probability reflects the fact that we had not begun any substantive discussions with underwriters regarding a potential IPO and we had not yet begun to execute on our revised business plan.
60
Table of Contents
For each of the scenarios used in the PWER model as of October 1, 2009, the significant assumptions used were as follows:
| Probability | Time to liquidity event (years) | Revenue multiples(1) | ||||
Unfavorable Sale | 30% | 0.50 | 2.00x – 2.25x | |||
Strategic Sale | 60% | 0.75 | 2.75x – 3.00x | |||
IPO—low | 5% | 1.00 | 2.50x – 2.75x | |||
IPO—high | 5% | 1.25 | 2.75x – 3.25x | |||
| (1) | The first number in this column represents the multiple applied to the next twelve months’ forecasted revenue, and the second number represents the multiple applied to the twelve months’ trailing revenue. For all scenarios except “unfavorable sale” the outcomes of these two multiples were weighted equally. For the “unfavorable sale” scenario the forecasted revenue multiple was weighted 25% and the historical revenue multiple was weighted 75%. |
The fair value of common stock as of October 1, 2009 was calculated by discounting the future values under each scenario at an annual discount rate of 27.5%.
We also applied a discount for lack of marketability of 20% in arriving at the fair value of common stock. The discount decreased from the 25% used in the August 7, 2009 valuation due primarily to the slight increase in the probability of a successful IPO.
November 29, 2009 valuation
This valuation was prepared contemporaneously by management, with the assistance of a third-party appraisal firm, for the purpose of granting stock options on December 24, 2009. It was also used by the board of directors as a basis for granting stock options on January 15, 2010.
In determining our enterprise value at November 29, 2009, we used the PWER method. The recent growth of our business, initial execution of our revised business plan and the general improvement of the capital markets allowed us to better forecast the occurrence of a liquidity event within the next year.
In applying the PWER method, our board of directors reviewed our enterprise value determined by the guideline public company method. Our board of directors, based on its discussions with our management, reviewed and determined the probability of the occurrence of each of the four scenarios over the following one-year period. We used the same comparable companies and other assumptions as we did for the October 1, 2009 valuation described above. Our board of directors then considered an appropriate marketability discount, reflecting the lack of marketability of our common stock, to determine the estimated fair value of our common stock at such valuation date.
The probability of an IPO was estimated to be 10% in the one-year period following the valuation date in each of the two scenarios, and the probability of the two strategic sale scenarios were estimated to be 25% and 55%. This reflected the board of directors’ view that while we had initiated the process to file our initial registration statement related to our planned IPO prior to November 29, 2009, there was still a strong likelihood that we would be acquired prior to successfully completing the IPO.
61
Table of Contents
For each of the scenarios used in the PWER model as of November 29, 2009, the significant assumptions used were as follows:
| Probability | Time to liquidity event (years) | Revenue multiples(1) | ||||
Unfavorable Sale | 25% | 0.33 | 2.00x – 2.25x | |||
Strategic Sale | 55% | 0.58 | 2.50x – 2.75x | |||
IPO—low | 10% | 0.84 | 2.25x – 2.50x | |||
IPO—high | 10% | 1.09 | 2.50x – 3.00x | |||
| (1) | The weighting of historical and forecasted revenue multiples in this valuation were consistent with those in the October 1, 2009 valuation. |
The fair value of common stock as of November 29, 2009 was calculated by discounting the future values under each scenario at an annual discount rate of 27.5%.
We also applied a discount for lack of marketability of 20% in arriving at the fair value of common stock, which was consistent with that used at October 1, 2009.
December 31, 2009 valuation
This valuation was completed in February 2010 by management, with the assistance of a third-party appraisal firm, for purposes of adopting new accounting guidance related to warrants to purchase our convertible preferred stock. Due to the proximity of the valuation date to the December 24, 2009 option grants, this valuation has been used for financial reporting purposes to record stock-based compensation expense, as management believes it provides a more precise estimate of fair value on December 24, 2009.
For each of the scenarios used in the PWER model as of December 31, 2009, the significant assumptions used were as follows:
| Probability | Time to liquidity event (years) | Revenue multiples(1) | ||||
Unfavorable Sale | 25% | 0.25 | 2.00x – 2.25x | |||
Strategic Sale | 55% | 0.50 | 3.00x – 3.25x | |||
IPO—low | 10% | 0.75 | 2.75x – 3.00x | |||
IPO—high | 10% | 1.00 | 3.00x – 3.50x | |||
| (1) | The weighting of historical and forecasted revenue multiples in this valuation were consistent with those in the prior valuations for which we used the PWER model. |
The fair value of common stock as of December 31, 2009 was calculated by discounting the future values under each scenario at an annual discount rate of 27.5%.
We also applied a discount for lack of marketability of 20% in arriving at the fair value of common stock, which was consistent with that used at October 1, 2009 and November 29, 2009.
February 3, 2010 valuation
This valuation was prepared contemporaneously by management with the assistance of a third-party appraisal firm, for the purpose of granting stock options on February 9, 2010.
The board of directors estimated the probability of an IPO to be 25% in the one-year period following the valuation date in each of the two scenarios and the probability of the two strategic sale scenarios were estimated to be 10% and 40%. This reflected the board of directors’ view that the likelihood of completing a successful IPO had increased significantly since December 2009, given our performance and the state of the overall public equity markets.
62
Table of Contents
For each of the scenarios used in the PWER model as of February 3, 2010, the significant assumptions used were as follows:
| Probability | Time to liquidity event (years) | Revenue multiples(1) | ||||
Unfavorable Sale | 10% | 0.15 | 2.25x – 2.50x | |||
Strategic Sale | 40% | 0.40 | 2.75x – 3.00x | |||
IPO—low | 25% | 0.91 | 2.50x – 2.75x | |||
IPO—high | 25% | 0.91 | 2.75x – 3.00x | |||
| (1) | The weighting of historical and forecasted revenue multiples in this valuation were consistent with those in the prior valuations for which we used the PWER model. |
The fair value of common stock as of February 3, 2010 was calculated by discounting the future values under each scenario at an annual discount rate of 20.0%.
We also applied a discount for lack of marketability of 10% in arriving at the fair value of common stock. The discount decreased from the 20% previously used due primarily to the increase in the probability of a successful IPO from 20% to 50%.
March 16, 2010 valuation
This valuation was prepared contemporaneously by management with the assistance of a third-party appraisal firm, for the purpose of granting stock options on March 26, 2010.
The board of directors estimated the probability of an IPO to be 32.5% in each of the two scenarios used in the PWER model (for a cumulative probability of a successful IPO of 65%) and the probability of the two sale scenarios were estimated to be 10% and 25%. This reflected the board of directors’ view that the likelihood of completing a successful IPO had increased since February 2010, given our performance, the state of the overall public equity markets and the filing of our initial registration statement related to our planned IPO on March 2, 2010.
For each of the scenarios used in the PWER model as of March 16, 2010, the significant assumptions used were as follows:
| Probability | Time to liquidity event (years) | Revenue multiples(1) | ||||
Unfavorable Sale | 10% | 0.29 | 1.75x – 2.00x | |||
Strategic Sale | 25% | 0.29 | 2.00x – 2.25x | |||
IPO—low | 32.5% | 0.79 | 2.00x – 2.25x | |||
IPO—high | 32.5% | 0.79 | 2.50x – 2.75x | |||
| (1) | The weighting of historical and forecasted revenue multiples in this valuation were consistent with those in the prior valuations for which we used the PWER model. |
The fair value of common stock as of March 16, 2010 was calculated by discounting the future values under each scenario at an annual discount rate of 20.0%.
We also applied a discount for lack of marketability of 10% in arriving at the fair value of common stock, which was consistent with that used in our February 3, 2010 valuation.
May 25, 2010 valuation
This valuation was prepared contemporaneously by management with the assistance of a third-party appraisal firm, for the purpose of granting stock options on June 3, 2010.
The board of directors estimated the probability of an IPO to be 35% in each of the two scenarios used in the PWER model (for a cumulative probability of a successful IPO of 70%) and
63
Table of Contents
the probability of the strategic sale scenario was estimated to be 25%. This reflected the board of directors’ view that the likelihood of completing a successful IPO had increased slightly since March 2010, but at a significantly reduced valuation, given the decline in equity values of the comparable companies used in our valuation, the state of the overall public equity markets and investor concerns over macroeconomic conditions in Europe.
For each of the scenarios used in the PWER model as of May 25, 2010, the significant assumptions used were as follows:
| Probability | Time to liquidity event (years) | Revenue multiples(1) | ||||
Strategic Sale | 30.0% | 0.35 | 1.25x – 1.50x | |||
IPO—low | 35.0% | 0.85 | 1.50x – 1.75x | |||
IPO—high | 35.0% | 1.35 | 1.75x – 2.00x | |||
| (1) | The weighting of historical and forecasted revenue multiples in this valuation were consistent with those in the prior valuations for which we used the PWER model. |
The fair value of common stock as of June 3, 2010 was calculated by discounting the future values under each scenario at an annual discount rate of 15%.
We also applied a discount for lack of marketability of 10% in arriving at the fair value of common stock, which was consistent with that used in our March 16, 2010 valuation.
Significant factors contributing to the changes in the fair value of our common stock at the date of each grant beginning in fiscal 2009 were as follows:
| • | August 14, 2009 grants. Our common stock fair value as of August 7, 2009 decreased significantly from prior valuation dates. In August 2009 our board of directors assumed in excess of a 90% probability that we would be acquired in a strategic sale, and our enterprise value at August 7, 2009 was estimated at $178.4 million. The acquisition of Legacy Force10, as well as the issuance of Series B convertible preferred stock in June, July and August 2009, resulted in an increase in the liquidation preferences of our preferred stockholders from $271.6 million at September 30, 2008 to approximately $612.7 million at August 7, 2009. Given that the liquidation preferences significantly exceeded our enterprise value, our board of directors concluded that it was extremely unlikely that we would be able to sell our company for proceeds above liquidation preferences, in which case common stockholders would receive no value for their shares. This contributed significantly to the decrease in common stock value as of August 7, 2009. In addition, at August 7, 2009, we had only been operating as a combined company with Legacy Force10 for four months, and our integration efforts were still ongoing. As such, there was a significant amount of execution risk related to combining the two companies and a significant amount of uncertainty existing related to our ability to achieve our revenue and earnings targets for the quarter ending September 30, 2009 and beyond. |
| • | September 16, 2009 grants. Our common stock fair value as of September 16, 2009 remained unchanged from the prior valuation date since the board of directors determined none of the factors indicated above had changed or improved as of that date. |
| • | October 18, 2009 grants. The increase from the August 7, 2009 value of $0.06 per share to $0.57 per share at October 18, 2009 was due primarily to the following factors: |
| • | During the fourth quarter of fiscal 2009 and into October 2009, our management developed, and our board of directors approved, a new strategic plan focusing on data |
64
Table of Contents
center customers, with the goal of leveraging this investment into enterprise and service provider customers and markets. As a result, the comparable companies used in our valuation changed, resulting in a significantly higher revenue multiple in the November valuation than at prior valuation dates. As a result, our aggregate equity value increased from $178.4 million at August 7, 2009 to a range of $402 to $704 million as of October 18, 2009. |
| • | Our shipments and revenue for the month of September were stronger than expected, which resulted in us exceeding our financial forecasts for the quarter ended September 30, 2009, and thus somewhat reducing the execution risk associated with the combination of our company and Legacy Force10. |
| • | December 24, 2009 grants. The increase from the October 1, 2009 value of $0.57 per share to $2.15 per share at December 24, 2009 was due primarily to the following factors: |
| • | In early November, our board of directors authorized us to retain investment bankers to prepare for an IPO. Accordingly, as of November 29, 2009 our board of directors increased the probability of completing a successful IPO to 20%, and this same probability was used in the December 31, 2009 valuation. Absent any other changes in our valuation, this increase in probability would have doubled the value of our common stock from October 1, 2009 to December 24, 2009 based on the December 31, 2009 valuation. |
| • | The market value of our comparable companies increased, thus increasing the revenue multiples we used in our valuation, which increased our aggregate equity value and the value attributable to common stock in our December 31, 2009 valuation. Specifically, the changes from October 1, 2009 to December 31, 2009 that most significantly impacted the valuation of our common stock were as follows: |
| — | our valuation under the low IPO scenario increased by 9.2%, and our valuation under the high IPO scenario increased by 8.1%; and |
| — | at December 31, 2009, the value under the strategic sale scenario exceeded the aggregate liquidation preferences. As such, this scenario resulted in value being attributable to common stock, whereas in the October 1, 2009 valuation, all of the value under this scenario was attributable to preferred stock, as the calculated value was below the aggregate liquidation preferences. |
| • | January 15, 2010 grants. The increase from the December 24, 2009 value of $2.15 per share to $3.23 per share at January 15, 2010 was entirely due to an increase in the probability of a successful IPO to 40%, reflecting the board of directors’ view that the market conditions and the execution of our business plan had continued to improve, thus making a successful IPO significantly more likely. |
| • | February 9, 2010 grants. The increase from the January 15, 2010 value of $3.23 per share to $3.51 per share at February 3, 2010 was due to an increase in the probability of a successful IPO from 40% to 50%, reflecting the board of directors’ continued view that the market conditions and the execution of our business plan had continued to improve, thus making a successful IPO more likely. Absent any other changes in our valuation, this increase in the probability of an IPO would have increased the value of our common stock by $0.73 per share. This increase was offset by decreases in equity value of 7.7% under the favorable sale scenario, 4.6% under the low IPO scenario, and 11.0% under the high IPO scenario due to decreases in the values of our comparable companies, which reduced the revenue multiples we used. While the value under |
65
Table of Contents
the unfavorable sale scenario increased from January 15, 2010 to February 3, 2010, this did not have any impact on the value of our common stock, as the value under that scenario was below aggregate liquidation preferences, thus no value was attributable to common stock. |
| • | March 26, 2010 grants. The increase from the February 3, 2010 value of $3.51 per share to $3.81 per share at March 16, 2010 was due to an increase in the probability of a successful IPO from 50% to 65%, reflecting the board of directors’ continued view that the market conditions and the execution of our business plan had continued to improve, thus making a successful IPO more likely. Absent any other changes in our valuation, this increase in the probability of an IPO would have increased the stock prices of our common stock by $1.05 per share. This increase was offset by decreases in equity value of 17.4% under the low IPO scenario and 7.2% under the high IPO scenario due to decreases in the stock prices of our comparable companies, which reduced the revenue multiples we used. While the values under the two sale scenarios also decreased from February 3, 2010 to March 16, 2010, this did not have any impact on the value of our common stock, as the values under those scenarios were below aggregate liquidation preferences at both valuation dates, thus no value was attributable to common stock. |
| • | June 3, 2010 grants. The decrease from the March 16, 2010 value of $3.81 per share to $2.89 per share at May 25, 2010 was due primarily to the following factors: |
| • | Overall market conditions resulted in a significant decline in the equity values of the comparable companies used in our valuation, which resulted in a decline in our value under the low and high IPO scenarios of 30.3% and 27.7%, respectively, which offset the 5% increase in the probability of an IPO at lower valuations. The group of comparable companies has not changed since the previous valuation date. While the value of the strategic sale scenario also decreased significantly from March 16, 2010 to May 25, 2010, this did not have any impact on the value of our common stock, as the value under this scenario was below aggregate liquidation preferences at both valuation dates, thus no value was attributable to common stock. |
| • | While our total revenue for the March 2010 quarter grew 8.2% sequentially from the December 2009 quarter, our Ethernet segment revenue declined 13.8% sequentially from the December 2009 quarter. |
Notwithstanding the above, our common stock valuation continues to be low relative to the value of our preferred stock due to the significant liquidation preferences of our preferred stock.
We believe consideration of the factors described above by our board of directors was a reasonable approach to estimating the fair value of our common stock for those periods. However, the assumptions around fair value that we have made represent our board of directors’ and management’s best estimate, but they are highly subjective and inherently uncertain. If we had made different assumptions, our calculation of the fair value of common stock and the resulting stock-based compensation expense could have differed materially from the amounts recognized in our financial statements.
Valuation of inventory
Inventory is recorded at the lower of cost (using the first-in, first-out method) or market, after we give appropriate consideration to obsolescence and inventory in excess of anticipated future demand. In assessing the ultimate recoverability of inventory, we are required to make estimates
66
Table of Contents
regarding future customer demand, the timing of new product introductions, economic trends and market conditions. If the actual product demand is significantly lower than forecasted, we could be required to record additional inventory write-downs which would be charged to cost of product revenue. If the actual product demand is significantly higher than forecasted, we could realize benefits from selling previously written-down inventories. Any write-downs could have an adverse impact on our gross margin and profitability. During fiscal 2009, we wrote-off $6.8 million of excess inventory, the majority of which pertained to our wireless aggregation products in our Transport segment. During the first six months of fiscal 2010, we wrote-off $4.5 million of excess inventory and realized a benefit of $3.9 million related to the sale of previously written-down inventories.
Valuation of goodwill and long-lived assets
As required by ASC 350-20 (formerly referred to as FASB Statement No. 142,Goodwill and Other Intangible Assets), goodwill is not amortized but is subject to impairment testing annually, or more frequently if indicators of potential impairment exist, using a fair-value-based approach. Goodwill is recorded when the consideration paid for an acquisition exceeds the fair value of net tangible and intangible assets acquired. We conducted our annual evaluation of goodwill on February 28, 2010, and concluded that there was no impairment.
With the acquisition of Legacy Force10 on March 31, 2009, we determined that we have two operating segments—Ethernet and Transport. Each of these operating segments is also considered a reporting unit for purposes of our evaluation of goodwill for impairment. Accordingly, in our annual goodwill impairment test as of February 28, 2010, we considered the fair value and carrying value of each of these reporting units separately. In addition to goodwill, we also tested for impairment the trade name acquired in the acquisition of Legacy Force10, as we determined that it has an indefinite life and is not amortized. We concluded that there was no impairment to the trade name.
We periodically evaluate the carrying value of long-lived assets, including acquired intangible assets, to be held and used when indicators of impairment exist. The carrying value of a long-lived asset to be held and used is considered impaired when the estimated separately identifiable undiscounted cash flows from such an asset are less than the carrying value of the asset. In that event, a loss is recognized based on the amount by which the carrying value exceeds the fair value of the long-lived asset. Fair value is determined primarily using the estimated cash flows discounted at a rate commensurate with the risk involved. No impairment charges have been recorded in any of the periods presented.
Determining the fair value of a reporting unit or a long-lived asset is subjective in nature and requires the use of significant estimates and assumptions, including, among others, revenue growth rates and operating margins, discount rates and future market conditions. Unanticipated changes in our revenue, gross margin, projected long-term growth rates or discount rates could result in a material impact on the estimated fair values of our reporting units, and could require us to record impairment losses on our goodwill or with respect to our long-lived assets in future periods.
Warranty liabilities
We generally provide a one to two-year warranty on hardware products and up to a one-year warranty on software. A provision for estimated future costs related to warranty activities is charged to cost of product revenue based upon historical product failure rates and historical costs
67
Table of Contents
incurred in correcting product failures. If we experience an increase in warranty claims compared with our historical experience, or if the cost of servicing warranty claims is greater than expected, our gross margin could be adversely affected.
Deferred tax assets
At September 30, 2009, we had $327.8 million of total deferred tax assets, a $4.0 million deferred tax liability related to an intangible asset with an indefinite life, and a valuation allowance of $327.7 million. The significant majority of our deferred tax assets relate to net operating loss carryforwards which could be used to offset against future taxable income. In assessing the realizability of our deferred tax assets, we consider whether it is more likely than not that some or all of the deferred tax assets will be realized. The ultimate realization of deferred tax assets is dependent upon the generation of future taxable income prior to the expiration of the net operating loss carryforwards. Due to our history of net losses and the uncertainty surrounding our ability to realize such deferred tax assets, a significant valuation allowance has been established. If our future results support the realization of all or a portion of our deferred tax assets, our effective tax rate in future periods could increase significantly.
At September 30, 2009, we had federal and state net operating loss carryforwards available to reduce future taxable income of approximately $742.7 million and $491.7 million, respectively. Both the federal and state net operating loss carryforwards begin to expire in 2010. Section 382 of the Internal Revenue Code imposes significant restrictions on the utilization of net operating loss carryforwards and experimental tax credits in the event of a change in ownership. While we believe that it is probable that our ability to utilize our net operating loss carryforwards may be significantly limited due to past ownership changes, we have not completed an analysis to determine the amount of such limitation.
Preferred stock warrant liability
At March 31, 2010, we had a preferred stock warrant liability of $16.0 million. We are required to determine the fair value of this liability at each balance sheet date and record any increases or decreases in our consolidated statement of operations. We use the Black-Scholes option pricing model to value these warrants, and this model includes certain assumptions that are highly subjective, such as the fair value of the underlying convertible preferred stock, the expected term of the warrants and the estimated future volatility of our stock price. To the extent our judgments on any of these assumptions change from one balance sheet date to the next, we could record significant charges or credits to our consolidated statement of operations related to the change in fair value of the preferred stock warrant liability. Upon the closing of this offering, the fair value of this liability will be reclassified to stockholders’ equity, and we will not be required to record the warrants at fair value subsequent to that date.
68
Table of Contents
Results of operations
First six months of fiscal 2010 and 2009
Revenue
| Six months ended March 31, | |||||||||||||||||||
| 2009 | 2010 | ||||||||||||||||||
| (dollars in thousands) | Amount | Percent of revenue | Amount | Percent of revenue | Change | Percent change | |||||||||||||
Revenue | |||||||||||||||||||
Product | $ | 29,232 | 65.6 | % | $ | 66,494 | 74.2 | % | $ | 37,262 | 127.5 | % | |||||||
Service | 6,613 | 14.8 | 13,227 | 14.8 | 6,614 | 100.0 | |||||||||||||
Ratable product and service | 8,729 | 19.6 | 9,894 | 11.0 | 1,165 | 13.3 | |||||||||||||
Total revenue | $ | 44,574 | 100.0 | % | $ | 89,615 | 100.0 | % | $ | 45,041 | 101.0 | % | |||||||
Revenue by segment | |||||||||||||||||||
Ethernet | $ | — | — | % | $ | 48,501 | 54.1 | % | $ | 48,501 | n/a | ||||||||
Transport | 44,574 | 100.0 | 41,114 | 45.9 | (3,460 | ) | (7.8 | )% | |||||||||||
Total revenue | $ | 44,574 | 100.0 | % | $ | 89,615 | 100.0 | % | $ | 45,041 | 101.0 | % | |||||||
Total revenue increased $45.0 million, or 101.0%, in the first six months of fiscal 2010 compared to the same period in fiscal 2009. Product revenue increased $37.3 million, or 127.5%, in the first six months of fiscal 2010 compared to the same period in fiscal 2009 due to $35.6 million of incremental Ethernet product revenue following our acquisition of Legacy Force10 and an increase in transport product revenue of $1.7 million in the first six months of fiscal 2010 compared to the same period in fiscal 2009. The increase in transport product revenue was due to the recognition of approximately $6.5 million of previously deferred product revenue as we satisfied the remaining deliverables under contracts with certain customers during the quarter ended March 31, 2010, partially offset by a decrease in the volume of sales of our Traverse and converged access products. There were no significant changes to our average selling prices between periods.
Service revenue increased $6.6 million, or 100.0%, in the first six months of fiscal 2010 compared to the same period in fiscal 2009 due to $6.4 million of incremental Ethernet service revenue following our acquisition of Legacy Force10 and an increase in transport service revenue of $0.2 million. This increase in transport service revenue was due to the recognition of approximately $0.6 million of previously deferred service revenue as we satisfied the remaining deliverables under contracts with certain customers during the quarter ended March 31, 2010, partially offset by a decrease in installation and professional service revenue as fewer customers required us to perform such services in connection with the related product sales.
Ratable product and service revenue increased $1.2 million, or 13.3%, in the first six months of fiscal 2010 compared to the same period in fiscal 2009. Our acquisition of Legacy Force10 contributed incremental Ethernet ratable product and service revenue of $6.5 million in the first six months of fiscal 2010 as compared to the same period in fiscal 2009. This incremental revenue was offset by a decrease in transport ratable product and service revenue of $5.3 million due to the termination of the implied PCS element in the majority of our sales arrangements effective December 1, 2007.
69
Table of Contents
Cost of goods sold and gross margin
| Six months ended March 31, | |||||||||||||||
| (dollars in thousands) | 2009 | 2010 | Change | Percent change | |||||||||||
Cost of goods sold | |||||||||||||||
Product | $ | 24,295 | $ | 37,210 | $ | 12,915 | 53.2 | % | |||||||
Service | 2,536 | 8,200 | 5,664 | 223.3 | |||||||||||
Ratable product and service | 4,711 | 3,922 | (789 | ) | (16.7 | ) | |||||||||
Total cost of goods sold | $ | 31,542 | $ | 49,332 | $ | 17,790 | 56.4 | % | |||||||
Gross margin | |||||||||||||||
Product | 16.9 | % | 44.0 | % | 27.2 | % | |||||||||
Service | 61.7 | 38.0 | (23.6 | ) | |||||||||||
Ratable product and service | 46.0 | 60.4 | 14.3 | ||||||||||||
Total gross margin | 29.2 | % | 45.0 | % | 15.7 | % | |||||||||
Cost of goods sold by segment | |||||||||||||||
Ethernet | $ | — | $ | 24,883 | $ | 24,883 | n/a | ||||||||
Transport | 31,542 | 24,449 | (7,093 | ) | (22.5 | )% | |||||||||
Total cost of goods sold | $ | 31,542 | $ | 49,332 | $ | 17,790 | 56.4 | % | |||||||
Gross margin by segment | |||||||||||||||
Ethernet | — | % | 48.7 | % | n/a | ||||||||||
Transport | 29.2 | 40.5 | 11.3 | % | |||||||||||
Total gross margin | 29.2 | % | 45.0 | % | 15.7 | % | |||||||||
Total gross margin increased by 15.7 percentage points in the first six months of fiscal 2010 compared to the same period in fiscal 2009 primarily due to the contribution of incremental Ethernet product and ratable product and service revenue in the first six months of fiscal 2010 from the acquisition of Legacy Force10 at significantly higher gross margin compared to gross margin from Transport segment products. In addition, we wrote off $5.8 million of excess inventory related primarily to our wireless aggregation products in our Transport segment in the first six months of fiscal 2009. This increase was offset by a decrease in service gross margin due to a $2.3 million impact in the first six months of fiscal 2010 of a purchase accounting adjustment related to our acquisition of Legacy Force10 that required deferred service revenue at the date of acquisition to be recorded at fair value. This resulted in a reduction of service gross margin by 9.2 percentage points in the first six months of fiscal 2010. In addition, we incurred approximately $1.2 million of incremental service cost of goods sold in the quarter ended March 31, 2010 related to warranty repair costs for a defect in the power supply subsystem included in the line cards of our ExaScale product in our Ethernet segment. This resulted in a reduction of service gross margin by 9.1 percentage points in the first six months of fiscal 2010.
70
Table of Contents
Operating expenses
| Six months ended March 31, | |||||||||||||||||||
| 2009 | 2010 | ||||||||||||||||||
| (dollars in thousands) | Amount | Percent of revenue | Amount | Percent of revenue | Change | Percent change | |||||||||||||
Operating expenses | |||||||||||||||||||
Research and development | $ | 11,695 | 26.2 | % | $ | 19,681 | 22.0 | % | $ | 7,986 | 68.3 | % | |||||||
Sales and marketing | 11,158 | 25.0 | 22,842 | 25.5 | 11,684 | 104.7 | |||||||||||||
General and administrative | 4,346 | 9.8 | 8,094 | 9.0 | 3,748 | 86.2 | |||||||||||||
Restructuring | — | — | 1,841 | 2.1 | 1,841 | — | |||||||||||||
In-process research and development and amortization of intangible assets | 6,918 | 15.5 | 463 | 0.5 | (6,455 | ) | (93.3 | ) | |||||||||||
Total operating expenses | $ | 34,117 | 76.5 | % | $ | 52,921 | 59.1 | % | $ | 18,804 | 55.1 | % | |||||||
Research and development expense
Research and development expense increased $8.0 million, or 68.3%, in the first six months of fiscal 2010 from the same period in fiscal 2009 primarily due to an increase of $4.5 million in cash-based personnel costs as a result of increasing headcount primarily from the acquisition of Legacy Force10, an increase of $0.9 million for rent and occupancy related expenses, an increase of $0.8 million in prototype and other materials as a result of our increased design efforts, and an increase of $1.9 million in allocated facilities and depreciation expense, both as a result of facilities and assets acquired in the acquisition of Legacy Force10.
Sales and marketing expense
Sales and marketing expense increased $11.7 million, or 104.7%, in the first six months of fiscal 2010 from the same period in fiscal 2009 primarily due to an increase of $5.6 million in cash-based personnel costs resulting from merger-related growth in headcount, an increase of $3.0 million in sales commission expense due to an increase in commissionable sales and a change in our commission payment structure, an increase of $1.7 million in trade show, advertising, travel and other variable sales and marketing costs as we began the execution of our new business plan after the integration of Legacy Force10 with our company and an increase of $0.8 million in allocated facilities and depreciation expense, both as a result of facilities and assets acquired in the acquisition of Legacy Force10.
General and administrative expense
General and administrative expense increased $3.7 million, or 86.2%, in the first six months of fiscal 2010 from the same period in fiscal 2009 primarily due to an increase of $2.4 million in cash-based personnel costs as a result of increased headcount primarily due to the acquisition of Legacy Force10, and an increase of $0.9 million in professional service expense due to the increased size and complexity of our business.
Restructuring expense
Restructuring expense, primarily related to our Transport segment, of $1.8 million in the first six months of fiscal 2010 is comprised of severance, asset impairment charges and facility exit costs due to the shutdown of our engineering design center in Shanghai, China in October 2009, as well as the closing of our office facility in Boulder, Colorado in March 2010.
71
Table of Contents
In-process research and development and amortization of intangible assets
During the six months ended March 31, 2009, we incurred a charge of $6.5 million in conjunction with our acquisition of Legacy Force10 for the write-off of purchased in-process research and development related to projects that had not yet reached technological feasibility and had no alternative use. The other amounts in both periods relate entirely to amortization of acquired intangible assets with defined useful lives acquired from Legacy Force10 and Carrier Access. We expect to record amortization expense related to these assets of $0.9 million during the remainder of fiscal 2010.
Interest income (expense), increase in fair value of preferred stock warrant liability and other income (expense)
| Six months ended March 31, | |||||||||||||||
| (dollars in thousands) | 2009 | 2010 | Change | Percent change | |||||||||||
Interest income | $ | 50 | $ | 30 | $ | (20 | ) | (40.0 | )% | ||||||
Interest expense | (445 | ) | (251 | ) | 194 | (43.6 | ) | ||||||||
Decrease in fair value of preferred stock warrant liability | — | 5,767 | 5,767 | n/a | |||||||||||
Other income (expense), net | (1 | ) | (162 | ) | (161 | ) | * | ||||||||
| * | Not meaningful. |
Net interest expense declined in the first six months of fiscal 2010 compared to the same period in fiscal 2009 due to lower average borrowings at lower interest rates during the periods. Interest income for both periods was not significant. The increase in net other expense in the first six months of fiscal 2010 was attributable to foreign currency transaction losses, primarily in euro-based transactions. The decrease in fair value of preferred stock warrant liability was due to the change in fair value of our preferred stock warrants from October 1, 2009 to March 31, 2010.
Fiscal years 2009 and 2008
Revenue
| Fiscal year ended September 30, | |||||||||||||||||||
| 2008 | 2009 | ||||||||||||||||||
| (dollars in thousands) | Amount | Percent of revenue | Amount | Percent of revenue | Change | Percent change | |||||||||||||
Revenue | |||||||||||||||||||
Product | $ | 48,225 | 30.9 | % | $ | 86,120 | 72.3 | % | $ | 37,895 | 78.6 | % | |||||||
Service | 5,370 | 3.5 | 16,290 | 13.7 | 10,920 | 203.4 | |||||||||||||
Ratable product and service | 102,303 | 65.6 | 16,660 | 14.0 | (85,643 | ) | (83.7 | ) | |||||||||||
Total revenue | $ | 155,898 | 100.0 | % | $ | 119,070 | 100.0 | % | $ | (36,828 | ) | (23.6 | )% | ||||||
Revenue by segment | |||||||||||||||||||
Ethernet | $ | — | — | $ | 34,367 | 28.9 | % | $ | 34,367 | n/a | |||||||||
Transport | 155,898 | 100.0 | 84,703 | 71.1 | (71,195 | ) | (45.7 | )% | |||||||||||
Total revenue | $ | 155,898 | 100.0 | % | $ | 119,070 | 100.0 | % | $ | (36,828 | ) | (23.6 | )% | ||||||
Total revenue decreased $36.8 million, or 23.6%, in fiscal 2009. Product revenue increased $37.9 million, or 78.6%, in fiscal 2009 due to $26.7 million of incremental Ethernet product
72
Table of Contents
revenue in the last six months of fiscal 2009 from our acquisition of Legacy Force10, and an increase of $11.2 million in transport product revenue in fiscal 2009 compared to fiscal 2008. Due to our establishment of VSOE as of April 1, 2008, we recognized certain transport product revenue for only six months in fiscal 2008 compared to 12 months in fiscal 2009. Transport product revenue decreased on a quarterly basis from $21.3 million in the third quarter of fiscal 2008, to $13.8 million in the fourth quarter of fiscal 2009 due to reduced volume of orders across all product lines, but particularly our Traverse and Traverse Edge, and wireless aggregation products. There were no significant changes to our average selling prices between periods.
Service revenue increased $10.9 million, or 203.4%, due to $4.1 million of incremental Ethernet service revenue in the last six months of fiscal 2009 from our acquisition of Legacy Force10, and an increase of $6.8 million in transport service revenue due to our establishment of VSOE as of April 1, 2008 and therefore recognizing only six months of service revenue in fiscal 2008 as compared to 12 months in fiscal 2009.
Ratable product and service revenue decreased $85.6 million, or 83.7%, due to the termination of the implied PCS element in the majority of our sales arrangements effective December 1, 2007. Such services were either terminated immediately, in which case any previously deferred revenue were recognized immediately as ratable product and service revenue, or we entered into a contractual arrangement with the customer, in which we adjusted the amortization period on a prospective basis to match the new contractual period.
Cost of goods sold and gross margin
| Fiscal year ended September 30, | |||||||||||||||
| (dollars in thousands) | 2008 | 2009 | Change | Percent change | |||||||||||
Cost of goods sold | |||||||||||||||
Product | $ | 28,072 | $ | 66,012 | $ | 37,940 | 135.2 | % | |||||||
Service | 2,440 | 8,213 | 5,773 | 236.6 | |||||||||||
Ratable product and service | 56,977 | 8,079 | (48,898 | ) | (85.8 | ) | |||||||||
Total cost of goods sold | $ | 87,489 | $ | 82,304 | $ | (5,185 | ) | (5.9 | )% | ||||||
Gross margin | |||||||||||||||
Product | 41.8 | % | 23.3 | % | (18.5 | )% | |||||||||
Service | 54.6 | 49.6 | (5.0 | ) | |||||||||||
Ratable product and service | 44.3 | 51.5 | (7.2 | ) | |||||||||||
Total gross margin | 43.9 | % | 30.9 | % | (13.0 | )% | |||||||||
Cost of goods sold by segment | |||||||||||||||
Ethernet | $ | — | $ | 24,806 | $ | 24,806 | n/a | ||||||||
Transport | 87,489 | 57,498 | (29,991 | ) | (34.3 | )% | |||||||||
Total cost of goods sold | $ | 87,489 | $ | 82,304 | $ | (5,185 | ) | (5.9 | )% | ||||||
Gross margin by segment | |||||||||||||||
Ethernet | — | % | 27.8 | % | n/a | ||||||||||
Transport | 43.9 | 32.1 | (11.8 | )% | |||||||||||
Total gross margin | 43.9 | % | 30.9 | % | (13.0 | )% | |||||||||
73
Table of Contents
Subsequent to our acquisition of Legacy Force10, sales of Ethernet products had a positive effect on gross margins, as our standard gross margins on Ethernet products are higher than on transport products. Despite this positive impact, total gross margin decreased 13.0 percentage points in fiscal 2009 compared to fiscal 2008. This decrease was primarily due to (1) $8.3 million of incremental product cost of goods sold due to a purchase accounting adjustment for the stepped-up fair value of inventory acquired in our acquisition of Legacy Force10, which reduced product gross margin by approximately 9.7 percentage points, (2) a $6.8 million excess inventory write-off primarily related to our wireless aggregation products taken in fiscal 2009 which reduced product gross margin by approximately 7.8 percentage points, and (3) a $4.2 million impact of a purchase accounting adjustment related to our acquisition of Legacy Force10 that required deferred service revenue to be recorded at fair value at the date of acquisition. This resulted in a reduction of service gross margin by approximately 10.2 percentage points as such services were delivered.
Operating expenses
| Fiscal year ended September 30, | ||||||||||||||||||
| 2008 | 2009 | |||||||||||||||||
| (dollars in thousands) | Amount | Percent of revenue | Amount | Percent of revenue | Change | Percent change | ||||||||||||
Operating expenses | ||||||||||||||||||
Research and development | $ | 23,611 | 15.2 | % | $ | 34,137 | 28.7 | % | $ | 10,526 | 44.6 | % | ||||||
Sales and marketing | 27,265 | 17.5 | 36,010 | 30.2 | 8,745 | 32.1 | ||||||||||||
General and administrative | 9,427 | 6.0 | 12,871 | 10.8 | 3,444 | 36.5 | ||||||||||||
In-process research and development and amortization of intangible assets | 3,119 | 2.0 | 7,459 | 6.3 | 4,340 | 139.1 | ||||||||||||
Total operating expenses | $ | 63,422 | 40.7 | % | $ | 90,477 | 76.0 | % | $ | 27,055 | 42.7 | % | ||||||
Research and development expense
Research and development expense increased $10.5 million, or 44.6%, in fiscal 2009 primarily due to an increase of $8.7 million in cash-based personnel costs as a result of increased headcount primarily from the acquisition of Legacy Force10, an increase of $2.0 million in depreciation expense primarily due to assets acquired in the acquisition of Legacy Force10 and an increase of $1.2 million for rent and occupancy-related expenses. These increases were partially offset by a $1.4 million decrease in outside services, consultants and temporary employee expenses as we focused on cost containment and performing such tasks with internal resources.
Sales and marketing expense
Sales and marketing expense increased $8.7 million, or 32.1%, in fiscal 2009 primarily due to increased cash-based personnel costs of $7.3 million as a result of increased headcount primarily from the acquisition of Legacy Force10, an increase of $2.2 million in sales commission expense due to an increase in commissionable sales and a change in our commission payment structure and an increase in severance costs of $0.8 million as we realigned our domestic international sales territories and thus reduced headcount. These increases were offset by a $1.9 million decrease in occupancy and other allocated costs as we increased headcount in our service and support areas in fiscal 2009, which costs were allocated to cost of goods sold.
74
Table of Contents
General and administrative expense
General and administrative expense increased $3.4 million, or 36.5%, in fiscal 2009 primarily due to an increase of $3.0 million in cash-based personnel costs as a result of increased headcount primarily from the acquisition of Legacy Force10, an increase of $1.2 million in professional services expense due to the increased size and complexity of our business, partially offset by a $0.4 million decrease in stock-based compensation expense and a $0.3 million decrease in hiring and temporary employee costs as we focused on cost containment and utilizing internal resources.
In-process research and development and amortization of intangible assets
In-process research and development and amortization of intangible assets consists of the write-off of purchased in-process research and development related to development projects that had not yet reached technological feasibility and have no alternative future use and the amortization of acquired intangible assets with defined useful lives. In fiscal 2009, this amount consisted of purchased in-process research and development of $6.5 million related to our acquisition of Legacy Force10, and amortization of intangible assets acquired from Legacy Force10 and Carrier Access of $1.0 million. In fiscal 2008, this amount consisted of purchased in-process research and development of $2.6 million and amortization of intangible assets of $0.5 million, both related to our acquisition of Carrier Access.
Interest income, interest expense and other income (expense), net
| Fiscal year ended September 30, | |||||||||||||||
| (dollars in thousands) | 2008 | 2009 | Change | Percent change | |||||||||||
Interest income | $ | 910 | $ | 80 | $ | (830 | ) | (91.2 | )% | ||||||
Interest expense | (397 | ) | (664 | ) | (267 | ) | 67.3 | ||||||||
Other income (expense), net | 31 | (336 | ) | (367 | ) | * | |||||||||
| * | Not meaningful. |
Interest income decreased $0.8 million in fiscal 2009 due to a decline in interest rates and a change in mix of investments. Interest expense increased $0.3 million in fiscal 2009 due to higher average borrowings at higher interest rates during the year. The increase in other expense is primarily attributable to a loss taken on the extinguishment of a debt instrument during the year.
Fiscal years 2008 and 2007
Revenue
| Fiscal year ended September 30, | ||||||||||||||||||
| 2007 | 2008 | |||||||||||||||||
| (dollars in thousands) | Amount | Percent of revenue | Amount | Percent of revenue | Change | Percent change | ||||||||||||
Revenue | ||||||||||||||||||
Product | $ | — | — | % | $ | 48,225 | 30.9 | % | $ | 48,225 | n/a | |||||||
Service | — | — | 5,370 | 3.5 | 5,370 | n/a | ||||||||||||
Ratable product and service | 31,562 | 100.0 | 102,303 | 65.6 | 70,741 | 224.1 | % | |||||||||||
Total revenue | $ | 31,562 | 100.0 | % | $ | 155,898 | 100.0 | % | $ | 124,336 | 393.9 | % | ||||||
75
Table of Contents
All of our revenue in fiscal 2007 and fiscal 2008 was derived from transport and access products. Total revenue increased $124.3 million, or 393.9%, in fiscal 2008 driven primarily by our termination of the implied PCS element in the majority of our sales arrangements for transport products effective December 1, 2007, and our establishment of VSOE for PCS and certain other elements as of April 1, 2008. In fiscal 2007, the entire fee from all arrangements was deferred until all elements except for PCS were delivered and all other revenue recognition criteria were met, and then amortized ratably over the longer of the remaining contractual service period or 48 months, the estimated product life, from the date of initial shipment. There were no significant changes to our average selling prices between periods.
The increase in product and service revenue in fiscal 2008 was due to the establishment of VSOE for PCS as of April 1, 2008. For new multiple-element arrangements that included PCS or other undelivered elements for which VSOE had been established, we allocated and deferred revenue to the undelivered elements, primarily services, using VSOE, with the residual fees allocated to product. We recognized product revenue upon delivery, and recognized service revenue over the contractual support period.
Ratable product and service revenue increased $70.7 million, or 224.1%, in fiscal 2008. Upon termination of the implied PCS element in the majority of our sales arrangements effective December 1, 2007, such services were either terminated immediately, in which case any previously deferred revenue was recognized immediately as ratable product and service revenue, or we entered into a contractual arrangement with the customer, in which case we adjusted the amortization period on a prospective basis to match the new contractual period.
Cost of goods sold and gross margin
| Fiscal year ended September 30, | |||||||||||||||
| (dollars in thousands) | 2007 | 2008 | Change | Percent change | |||||||||||
Cost of goods sold | |||||||||||||||
Product | $ | — | $ | 28,072 | $ | 28,072 | n/a | ||||||||
Service | — | 2,440 | 2,440 | n/a | |||||||||||
Ratable product and service | 19,507 | 56,977 | 37,470 | 192.1 | % | ||||||||||
Total cost of goods sold | $ | 19,507 | $ | 87,489 | $ | 67,982 | 348.5 | % | |||||||
Gross margin | |||||||||||||||
Product | — | % | 41.8 | % | n/a | ||||||||||
Service | — | 54.6 | n/a | ||||||||||||
Ratable product and service | 38.2 | 44.3 | 6.1 | % | |||||||||||
Total gross margin | 38.2 | % | 43.9 | % | 5.7 | % | |||||||||
Total gross margin increased 5.7 percentage points from fiscal 2007 to fiscal 2008, primarily due to higher gross margin associated with the wireless aggregation products we began selling in February 2008 after our acquisition of Carrier Access.
76
Table of Contents
Operating expenses
| Fiscal year ended September 30, | ||||||||||||||||||
| 2007 | 2008 | |||||||||||||||||
| (dollars in thousands) | Amount | Percent of revenue | Amount | Percent of revenue | Change | Percent change | ||||||||||||
Operating Expenses | ||||||||||||||||||
Research and development | $ | 13,443 | 42.6 | % | $ | 23,611 | 15.2 | % | $ | 10,168 | 75.6 | % | ||||||
Sales and marketing | 19,650 | 62.2 | 27,265 | 17.5 | 7,615 | 38.8 | ||||||||||||
General and administrative | 6,027 | 19.1 | 9,427 | 6.0 | 3,400 | 56.4 | ||||||||||||
In-process research and development and amortization of intangible assets | — | — | 3,119 | 2.0 | 3,119 | * | ||||||||||||
Total operating expenses | $ | 39,120 | 123.9 | % | $ | 63,422 | 40.7 | % | $ | 24,302 | 62.1 | % | ||||||
| * | Not meaningful. |
Research and development expense
Research and development expense increased by $10.2 million, or 75.6%, in fiscal 2008 primarily due to $5.7 million in higher cash-based personnel costs associated with increased headcount primarily due to our acquisition of Carrier Access, increased material and third party consulting and professional services costs of $2.0 million primarily related to the development of new product releases, increased facility related costs of $1.0 million, increased depreciation and maintenance contract expenses of $0.7 million, and increased travel expenses of $0.4 million, primarily due to our acquisition of Carrier Access.
Sales and marketing expense
Sales and marketing expense increased $7.6 million, or 38.8%, in fiscal 2008 primarily due to $3.4 million in higher cash-based personnel costs associated with increased headcount primarily due to our acquisition of Carrier Access, increased sales commissions of $2.8 million due to increased sales in 2008, increased travel-related expenses of $1.0 million due to our expanded sales force and increased promotional and other marketing expenses of $0.6 million.
General and administrative expense
General and administrative expense increased $3.4 million, or 56.4%, in fiscal 2008 primarily due to $2.5 million in higher cash-based personnel costs associated with increased headcount primarily due to our acquisition of Carrier Access and the implementation of an executive bonus plan in fiscal 2008, increased depreciation expense of $0.6 million due to increases in purchases of fixed assets and increased stock-based compensation expense of $0.4 million.
In-process research and development and amortization of intangible assets
In-process research and development and amortization of intangible assets in fiscal 2008 consisted of $2.6 million of purchased in-process research and development related to projects that had not yet reached technological feasibility and had no alternative future use as of the date of acquisition, and purchased intangibles amortization expense of $0.5 million, both related to our acquisition of Carrier Access.
77
Table of Contents
Interest income (expense), increase in fair value of preferred stock warrant liability, gain on extinguishment of preferred stock warrants and other income (expense)
| Fiscal year ended September 30, | |||||||||||||||
| (dollars in thousands) | 2007 | 2008 | Change | Percent change | |||||||||||
Interest income | $ | 778 | $ | 910 | $ | 132 | 17.0 | % | |||||||
Interest expense | (2,928 | ) | (397 | ) | 2,531 | (86.4 | ) | ||||||||
Increase in fair value of preferred stock warrant liability | (2,025 | ) | — | 2 ,025 | * | ||||||||||
Gain on extinguishment of preferred stock warrants | 1,802 | — | (1,802 | ) | * | ||||||||||
Other income | 5 | 31 | 26 | * | |||||||||||
| * | Not meaningful. |
The increase in interest income was due to interest earned on higher invested balances. The $2.5 million decrease in interest expense was primarily attributable to $1.9 million of debt discount related to the issuance of warrants and convertible notes, which were subsequently converted to preferred stock, and higher average borrowings at higher interest rates in fiscal 2007. The increase in fair value of preferred stock warrants was a result of a recapitalization of our equity structure during fiscal 2007. The warrants were subsequently extinguished and replaced with new warrants, resulting in a gain on extinguishment.
78
Table of Contents
Quarterly results of operations
The following tables set forth selected unaudited quarterly statements of operations data for the last five fiscal quarters, as well as the percentage that each line item represents of total revenue. The information below reflects the inclusion of the results of Legacy Force10 beginning with the quarter ended June 30, 2009. The information for each of these quarters has been prepared on the same basis as the audited annual financial statements included elsewhere in this prospectus and, in the opinion of management, includes all adjustments, which includes only normal recurring adjustments, necessary for the fair presentation of the results of operations for these periods. This data should be read in conjunction with our audited consolidated financial statements and related notes included elsewhere in this prospectus. These quarterly operating results are not necessarily indicative of our operating results for any future period.
| Quarter ended | ||||||||||||||||||||||||
| (in thousands) | Dec 31, 2008 | Mar 31, 2009 | June 30, 2009 | Sept 30, 2009 | Dec 31, 2009 | Mar 31, 2010 | ||||||||||||||||||
Consolidated statement of operations data: | ||||||||||||||||||||||||
Revenue | ||||||||||||||||||||||||
Product | $ | 14,985 | $ | 14,247 | $ | 30,262 | $ | 26,626 | $ | 32,128 | $ | 34,366 | ||||||||||||
Service | 3,368 | 3,245 | 4,423 | 5,254 | 5,821 | 7,406 | ||||||||||||||||||
Ratable product and service | 5,354 | 3,375 | 3,812 | 4,119 | 5,098 | 4,796 | ||||||||||||||||||
Total revenue | 23,707 | 20,867 | 38,497 | 35,999 | 43,047 | 46,568 | ||||||||||||||||||
Cost of goods sold | ||||||||||||||||||||||||
Product | 10,420 | 13,875 | 23,932 | 17,785 | 18,630 | 18,580 | ||||||||||||||||||
Service | 1,230 | 1,306 | 2,885 | 2,792 | 3,358 | 4,842 | ||||||||||||||||||
Ratable product and service | 2,944 | 1,767 | 1,712 | 1,656 | 1,812 | 2,110 | ||||||||||||||||||
Total cost of goods sold(1) | 14,594 | 16,948 | 28,529 | 22,233 | 23,800 | 25,532 | ||||||||||||||||||
Total gross profit | 9,113 | 3,919 | 9,968 | 13,766 | 19,247 | 21,036 | ||||||||||||||||||
Operating expenses | ||||||||||||||||||||||||
Research and development(1) | 5,954 | 5,741 | 11,396 | 11,046 | 9,653 | 10,028 | ||||||||||||||||||
Sales and marketing(1) | 6,069 | 5,089 | 12,902 | 11,950 | 11,376 | 11,466 | ||||||||||||||||||
General and administrative(1) | 2,038 | 2,308 | 4,974 | 3,551 | 4,243 | 3,851 | ||||||||||||||||||
Restructuring | — | — | — | — | 841 | 1,000 | ||||||||||||||||||
In-process research and development and amortization of intangible assets | 209 | 6,709 | 271 | 270 | 271 | 192 | ||||||||||||||||||
Total operating expenses | 14,270 | 19,847 | 29,543 | 26,817 | 26,384 | 26,537 | ||||||||||||||||||
Operating loss | (5,157 | ) | (15,928 | ) | (19,575 | ) | (13,051 | ) | (7,137 | ) | (5,501 | ) | ||||||||||||
Interest and other income (expense), net | (325 | ) | (71 | ) | (458 | ) | (66 | ) | (385 | ) | 5,769 | |||||||||||||
Income (loss) before income taxes | (5,482 | ) | (15,999 | ) | (20,033 | ) | (13,117 | ) | (7,522 | ) | 268 | |||||||||||||
Income tax benefit (provision) | 142 | 33 | (74 | ) | (60 | ) | (98 | ) | (20 | ) | ||||||||||||||
Net income (loss) | $ | (5,340 | ) | $ | (15,966 | ) | $ | (20,107 | ) | $ | (13,177 | ) | $ | (7,620 | ) | $ | 248 | |||||||
Other operational data: | ||||||||||||||||||||||||
Ethernet segment revenue | $ | — | $ | — | $ | 17,207 | $ | 17,160 | $ | 26,047 | $ | 22,454 | ||||||||||||
Transport segment revenue | 23,707 | 20,867 | 21,290 | 18,839 | 17,000 | 24,114 | ||||||||||||||||||
Change in total deferred revenue | (6,566 | ) | (2,027 | ) | 2,390 | 11,437 | 2,277 | (5,980 | ) | |||||||||||||||
Non-GAAP operating loss | (4,530 | ) | (8,881 | ) | (12,280 | ) | (9,497 | ) | (4,147 | ) | (2,381 | ) | ||||||||||||
Non-GAAP net loss | (4,713 | ) | (8,919 | ) | (12,812 | ) | (9,623 | ) | (4,475 | ) | (2,554 | ) | ||||||||||||
Ethernet segment gross margin | — | % | — | % | 18.2 | % | 37.5 | % | 50.2 | % | 47.0 | % | ||||||||||||
Transport segment gross margin | 38.4 | 18.8 | 32.1 | 38.9 | 36.3 | 43.5 | ||||||||||||||||||
79
Table of Contents
| (1) | Includes stock-based compensation expense as follows: |
| Quarter ended | ||||||||||||||||||
| (in thousands) | Dec 31, 2008 | Mar 31, 2009 | June 30, 2009 | Sept 30, 2009 | Dec 31, 2009 | Mar 31, 2010 | ||||||||||||
Cost of goods sold | $ | 15 | $ | 8 | $ | 7 | $ | 8 | $ | 8 | $ | 1 | ||||||
Research and development | 69 | 50 | 45 | 49 | 51 | 122 | ||||||||||||
Sales and marketing | 85 | 31 | 22 | 38 | 31 | 111 | ||||||||||||
General and administrative | 53 | 53 | 45 | 44 | 99 | 133 | ||||||||||||
Total stock-based compensation | $ | 222 | $ | 142 | $ | 119 | $ | 139 | $ | 189 | $ | 367 | ||||||
| Quarter ended | ||||||||||||||||||
| (as a percentage of revenue) | Dec 31, 2008 | Mar 31, 2009 | June 30, 2009 | Sept 30, 2009 | Dec 31, 2009 | Mar 31, 2010 | ||||||||||||
Revenue | ||||||||||||||||||
Product | 63.2 | % | 68.3 | % | 78.6 | % | 74.0 | % | 74.6 | % | 73.8 | % | ||||||
Service | 14.2 | 15.5 | 11.5 | 14.6 | 13.5 | 15.9 | ||||||||||||
Ratable product and service | 22.6 | 16.2 | 9.9 | 11.4 | 11.8 | 10.3 | ||||||||||||
Total revenue | 100.0 | 100.0 | 100.0 | 100.0 | 100.0 | 100.0 | ||||||||||||
Total cost of goods sold | 61.6 | 81.2 | 74.1 | 61.8 | 55.3 | 54.8 | ||||||||||||
Total gross profit | 38.4 | 18.8 | 25.9 | 38.2 | 44.7 | 45.2 | ||||||||||||
Operating expenses | ||||||||||||||||||
Research and development | 25.1 | 27.5 | 29.6 | 30.7 | 22.4 | 21.5 | ||||||||||||
Sales and marketing | 25.6 | 24.4 | 33.5 | 33.2 | 26.4 | 24.6 | ||||||||||||
General and administrative | 8.6 | 11.1 | 12.9 | 9.9 | 9.9 | 8.3 | ||||||||||||
Restructuring | — | — | — | — | 2.0 | 2.1 | ||||||||||||
In-process research and development and amortization of intangible assets | 0.9 | 32.1 | 0.7 | 0.7 | 0.6 | 0.4 | ||||||||||||
Total operating expenses | 60.2 | 95.1 | 76.7 | 74.5 | 61.3 | 57.0 | ||||||||||||
Operating loss | (21.8 | ) | (76.3 | ) | (50.8 | ) | (36.3 | ) | (16.6 | ) | (11.8 | ) | ||||||
Interest and other income (expense), net | (1.4 | ) | (0.3 | ) | (1.2 | ) | (0.1 | ) | (0.9 | ) | 12.4 | |||||||
Income (loss) before income taxes | (23.1 | ) | (76.7 | ) | (52.0 | ) | (36.4 | ) | (17.5 | ) | 0.6 | |||||||
Income tax benefit (provision) | 0.6 | 0.2 | (0.2 | ) | (0.2 | ) | (0.2 | ) | 0.0 | |||||||||
Net income (loss) | (22.5 | )% | (76.5 | )% | (52.2 | )% | (36.6 | )% | (17.7 | )% | 0.5 | % | ||||||
Impact of Legacy Force10 acquisition, product mix and quarterly revenue trends
Our quarterly results reflect the impact of our acquisition of Legacy Force10 on March 31, 2009. Results for the first two quarters of fiscal 2009 include only revenue from the sale of our transport products and services, while the results for the third and fourth quarter also include those of Legacy Force10 and incremental total revenue of $17.2 million in each quarter from the sale of Ethernet products and services. In general, our product revenue during the four quarters of fiscal 2009 was negatively affected by reduced economic activity and customer demand for our products in the metro network, wireless aggregation network and converged business access network markets. Increased revenue from our Ethernet products in the first two quarters of fiscal 2010 positively impacted total revenue in those quarters compared to the last two quarters of fiscal 2009. In the second quarter of fiscal 2010, Ethernet segment revenue declined 13.8% sequentially from the first quarter of fiscal 2010 due in part to delayed purchasing decisions by our customers relating to a defect in the power supply subsystem included in the line cards of our
80
Table of Contents
ExaScale product. In the same period, our Transport segment revenue increased 41.8% sequentially from the first quarter of 2010 due to the recognition of approximately $7.2 million of previously deferred product and service revenue as we satisfied the remaining deliverables under contracts with certain customers during the quarter ended March 31, 2010. Similarly, our gross margin and operating expenses have been affected by these historical trends because expenses are relatively fixed in the near-term. On a quarterly basis, we have usually generated the majority of our product revenue in the final month of each quarter and a significant amount in the last two weeks of a quarter. We believe this is due to customer purchasing patterns typical in our industry.
Quarterly gross margin trend
Our gross margin has fluctuated on a quarterly basis primarily due to the following factors: (1) in the second quarter of fiscal 2009, we wrote off $5.8 million of excess inventory related primarily to our wireless aggregation products; and (2) in the third and fourth quarters of fiscal 2009 and the first and second quarters of fiscal 2010, we incurred $6.0 million, $2.3 million, $1.4 million and $1.2 million of incremental cost of goods sold due to a purchase accounting adjustment for the stepped-up fair value of inventory acquired in our acquisition of Legacy Force10. Our gross margin was negatively impacted in the third and fourth quarters of fiscal 2009 and the first and second quarters of fiscal 2010 by $2.3 million, $1.8 million, $1.5 million and $0.7 million as a result of purchase accounting adjustments related to our acquisition of Legacy Force10 that required deferred service revenue at the date of acquisition to be recorded at fair value. In addition, our service gross margin was negatively impacted by approximately $1.2 million of incremental service cost of goods sold in the quarter ended March 31, 2010 related to warranty repair costs for a defect in the power supply subsystem included in the line cards of our ExaScale product.
Non-GAAP financial results
We believe that non-GAAP operating loss and non-GAAP net loss are helpful financial measures for an investor determining whether to invest in our common stock. In computing these measures, we exclude certain expenses included in operating loss and net loss under GAAP. See “—Key metrics” for a discussion of the adjustments in computing these non-GAAP financial measures.
These non-GAAP financial measures may not provide information that is directly comparable to that provided by other companies in our industry, as other companies in our industry may calculate such financial measures differently, particularly as they relate to nonrecurring, unusual items. Our non-GAAP financial measures are not measurements of financial performance under GAAP, and should not be considered as alternatives to operating income (loss) or net income (loss) or as indications of operating performance or any other measure of performance derived in accordance with GAAP.
81
Table of Contents
The following table reflects the reconciliation of non-GAAP operating income (loss) and non-GAAP net income (loss) to GAAP operating income (loss) and GAAP net income (loss).
| Quarter ended, | ||||||||||||||||||||||||
| (in thousands) | Dec 31, 2008 | Mar 31, 2009 | June 30, 2009 | Sept 30, 2009 | Dec 31, 2009 | Mar 31, 2010 | ||||||||||||||||||
GAAP operating loss | $ | (5,157 | ) | $ | (15,928 | ) | $ | (19,575 | ) | $ | (13,051 | ) | $ | (7,137 | ) | $ | (5,501 | ) | ||||||
Non-GAAP adjustments | ||||||||||||||||||||||||
Add: Amortization of intangible assets included in costs of goods sold | 196 | 196 | 927 | 807 | 317 | 317 | ||||||||||||||||||
Add: Inventory purchase accounting adjustments | — | — | 5,978 | 2,338 | 1,372 | 1,244 | ||||||||||||||||||
Add: Restructuring | — | — | — | — | 841 | 1,000 | ||||||||||||||||||
Add: In-process research and development and amortization of intangible assets included in operating expenses | 209 | 6,709 | 271 | 270 | 271 | 192 | ||||||||||||||||||
Add: Employee stock-based compensation | 222 | 142 | 119 | 139 | 189 | 367 | ||||||||||||||||||
Non-GAAP operating loss | $ | (4,530 | ) | $ | (8,881 | ) | $ | (12,280 | ) | $ | (9,497 | ) | $ | (4,147 | ) | $ | (2,381 | ) | ||||||
GAAP net loss | $ | (5,340 | ) | $ | (15,966 | ) | $ | (20,107 | ) | $ | (13,177 | ) | $ | (7,620 | ) | $ | 248 | |||||||
Non-GAAP adjustments | ||||||||||||||||||||||||
Add: Amortization of intangible assets included in cost of goods sold | 196 | 196 | 927 | 807 | 317 | 317 | ||||||||||||||||||
Add: Inventory purchase accounting adjustment | — | — | 5,978 | 2,338 | 1,372 | 1,244 | ||||||||||||||||||
Add: Restructuring | — | — | — | — | 841 | 1,000 | ||||||||||||||||||
Add: In-process research and development and amortization of intangible assets included in operating expenses | 209 | 6,709 | 271 | 270 | 271 | 192 | ||||||||||||||||||
Add: Employee stock-based compensation | 222 | 142 | 119 | 139 | 189 | 367 | ||||||||||||||||||
Add: Change in fair value of preferred stock warrant liability | — | — | — | — | 155 | (5,922 | ) | |||||||||||||||||
Non-GAAP net loss | $ | (4,713 | ) | $ | (8,919 | ) | $ | (12,812 | ) | $ | (9,623 | ) | $ | (4,475 | ) | $ | (2,554 | ) | ||||||
82
Table of Contents
Liquidity and capital resources
Information related to cash flows for the six months ended March 31, 2010 has been adjusted to reflect the restatement described in note 16 “Restatement” in the notes to our unaudited consolidated interim financial statements appearing elsewhere in this prospectus.
| As of September 30, | As of March 31, | ||||||||||||||
| (in thousands) | 2007 | 2008 | 2009 | 2009 | 2010 | ||||||||||
Cash, cash equivalents and short-term investments | $ | 40,067 | $ | 50,572 | $ | 67,165 | $ | 40,462 | $ | 55,157 | |||||
| Fiscal year ended September 30, | Six months ended March 31, | |||||||||||||||||||
| (in thousands) | 2007 | 2008 | 2009 | 2009 | 2010 | |||||||||||||||
Cash used in operating activities | $ | (22,254 | ) | $ | (14,466 | ) | $ | (26,466 | ) | $ | (16,397 | ) | $ | (7,981 | ) | |||||
Cash provided by (used in) investing activities | (18,564 | ) | (10,668 | ) | 7,711 | 8,909 | (17,812 | ) | ||||||||||||
Cash provided by (used in) financing activities | 55,893 | 49,611 | 37,341 | (1,628 | ) | (2,004 | ) | |||||||||||||
Net increase (decrease) in cash and cash equivalents | $ | 15,075 | $ | 24,477 | $ | 18,586 | $ | (9,116 | ) | $ | (27,797 | ) | ||||||||
Since inception, we have financed our operations primarily through private sales of equity securities and lending arrangements with Silicon Valley Bank. Under the lending arrangements with Silicon Valley Bank, we are subject to certain financial and non-financial covenants. Under the financial covenants related to earnings and liquidity levels, we are required to maintain a monthly minimum quick ratio defined as consolidated unrestricted cash and cash equivalents maintained in accounts with Silicon Valley Bank, plus net billed accounts receivable, plus aggregate value of investments with maturities of fewer than 12 months divided by the aggregate of all obligations under the agreement, plus accounts payable. We are also required to maintain minimum pro forma income thresholds as defined in the agreement. We were in compliance with all covenants for all periods presented, except that we did not meet one non-financial covenant related to the delivery of audited financial statements to the lender within 120 days after September 30, 2009. Subsequent to September 30, 2009, the lender extended this deadline to March 31, 2010. We are currently in compliance with all of the covenants under our loan and security agreement with Silicon Valley Bank. Over the past three years, we have completed various significant transactions affecting our stockholders’ equity. In certain of these transactions the liquidation preferences of our convertible preferred stock has been significantly reduced, which enabled us to attract new investors and to complete the acquisition of Legacy Force10. Through these transactions we have recorded significant non-cash deemed dividends (contributions) in the years ended September 30, 2007, 2008 and 2009.
At March 31, 2010, our cash, cash equivalents and short-term investments of $55.2 million were held for working capital purposes and were invested primarily in money market funds, commercial paper, certificates of deposit, U.S. government and agency securities and corporate bonds. We do not enter into investments for trading or speculative purposes. We believe our existing cash, cash equivalents and short-term investments will be sufficient to meet our anticipated cash needs for at least the next twelve months. Our future capital requirements will depend on many factors
83
Table of Contents
including our potential acquisitions or investments, growth rate, the timing and extent of spending to support development efforts, the expansion of sales and marketing activities, the introduction of new and enhanced products and services offerings and the continuing market acceptance of our products. In the event that additional financing is required from outside sources, we may not be able to raise it on terms acceptable to us or at all. If we are unable to raise additional capital when desired, our business, operating results and financial condition would be adversely affected.
Operating activities
For the first six months of fiscal 2010, operating activities used $8.0 million in cash as a result of our net loss of $7.4 million, adjusted by non-cash items such as depreciation and amortization of $5.1 million and a decrease in the fair value of a preferred stock warrant liability of $5.8 million. The primary working capital source of cash was a $4.2 million decrease in accounts receivable due to improved cash collections during the period.
For the first six months of fiscal 2009, operating activities used $16.4 million in cash as a result of our net loss of $21.3 million and a $3.0 million decrease in deferred revenue, net of deferred product costs, due to a reduction in ratable product and service revenue. The primary working capital sources of cash were a $1.1 million decrease in accounts receivable due to improved cash collections during the period and a $1.3 million decrease in inventories due to the timing of shipments during the period.
In fiscal 2009, operating activities used $26.5 million in cash as a result of our net loss of $54.6 million, adjusted by non-cash items such as depreciation and amortization of $9.0 million and purchased in-process research and development of $6.5 million. Working capital sources of cash were related to a $16.5 million increase in inventories primarily attributable to inventory acquired in our acquisition of Legacy Force10 and a $5.2 million increase in deferred revenue, which was attributable to increased sales of PCS.
In fiscal 2008, operating activities used $14.5 million in cash primarily as a result of a $24.1 million decrease in deferred revenue, net of deferred products costs, due to our elimination of implied PCS and our subsequent recognition of previously deferred amount as revenue and cost of goods sold. Working capital sources of cash were our net income of $5.4 million and an increase in accounts payable of $4.2 million primarily attributable to the timing of vendor payments.
In fiscal 2007, operating activities used $22.3 million in cash as a result of our net loss of $29.5 million, partially offset by a $9.3 million increase in deferred revenue, net of deferred product costs, due to an increase in shipments for which we had not yet established VSOE, or arrangements with implied PCS terms.
Investing activities
The $17.8 million of cash used in investing activities in the first six months of fiscal 2010 consisted of $15.9 million in purchases of short-term investments and $1.9 million of purchases of fixed assets.
The $8.9 million of cash provided by investing activities in the first six months of fiscal 2009 primarily consisted of $8.7 million related to the acquisition of Legacy Force10, net of cash and $1.0 million of net sales of short-term securities. We used cash of $0.8 million for purchases of fixed assets, net of proceeds from assets we disposed.
84
Table of Contents
The $7.7 million of cash provided from investing activities in fiscal 2009 was due primarily to $8.7 million of assets, net of cash, acquired from Legacy Force10 and $2.0 million in net purchases of short-term investments. We used cash of $3.0 million for the purchase of fixed assets, net of proceeds from assets we disposed.
The $10.7 million of cash used in investing activities in fiscal 2008 was due primarily to the acquisition of net assets less cash acquired of $26.4 million from Carrier Access, partially offset by net proceeds of $14.2 million from the sale of short-term securities, and proceeds of $1.5 million from the disposal of fixed assets, net of assets acquired.
The $18.6 million of cash used in investing activities in fiscal 2007 consisted of $15.9 million in purchases of short-term investments and $2.8 million of purchases of fixed assets.
Financing activities
The $2.0 million of cash used in financing activities in the first six months of fiscal 2010 was due to a net decrease of $1.4 million in borrowings under our debt agreements with our bank, payments of $0.9 million to various service providers in preparation for our IPO, and proceeds of $0.3 million from the exercise of our common stock.
Our financing activities for the first six months of fiscal 2009 resulted in net cash used of $1.6 million related to net borrowing activity under our debt agreements with our bank.
The $37.3 million of cash provided by financing activities in fiscal 2009 was due primarily to proceeds of $27.5 million, net of repurchases, from the sale of preferred stock and preferred stock warrants, and a net increase of $9.9 million in borrowings under our debt agreements with our bank.
The $49.6 million of cash provided by financing activities in fiscal 2008 was due primarily to proceeds of $42.6 million from the sale of preferred stock, preferred stock warrants and common stock, and a net increase of $7.0 million in borrowings under our debt agreements with our bank.
The $55.9 million of cash provided by financing activities in fiscal 2007 was due primarily to proceeds of $48.4 million from the sale of preferred stock and preferred stock warrants, and a net increase of $3.1 million in borrowings under our debt agreements with our bank, and proceeds from the issuance of convertible notes of $4.4 million.
Contractual obligations and commitments
The following summarizes our contractual obligations as of September 30, 2009:
| Payments due by period | |||||||||||||||
| (in thousands) | Total | Less than 1 year | 1-3 years | 3-5 years | More than 5 years | ||||||||||
Operating leases(1) | $ | 10,848 | $ | 4,761 | $ | 4,907 | $ | 754 | $ | 426 | |||||
Purchase commitments(2) | 18,477 | 18,477 | — | — | — | ||||||||||
Repayment of borrowings(3) | 28,145 | 24,117 | 4,028 | — | — | ||||||||||
Total | $ | 57,470 | $ | 47,355 | $ | 8,935 | $ | 754 | $ | 426 | |||||
| (1) | Consists of contractual obligations from non-cancelable office space under operating lease. |
| (2) | Consists of minimum purchase commitments with independent contract manufacturers. Our purchase commitments increased to $29.3 million as of March 31, 2010 as a result of increased product demand. |
| (3) | Consists of amounts due under bank loans and capital lease arrangements. |
85
Table of Contents
Off-balance sheet arrangements
We did not have during the periods presented, and we do not currently have, any off-balance sheet arrangements, as defined under SEC rules, such as relationships with unconsolidated entities or financial partnerships, which are often referred to as structured finance or special purpose entities, established for the purpose of facilitating financing transactions that are not required to be reflected on our balance sheet.
Quantitative and qualitative disclosures about market risk
Interest rate fluctuation risk
The primary objectives of our investment activities are to preserve principal, provide liquidity and maximize income without significantly increasing risk. Some of the securities we invest in are subject to market risk. This means that a change in prevailing interest rates may cause the principal amount of the investment to fluctuate. To minimize this risk, we maintain our portfolio of cash, cash equivalents and short-term investments in a variety of securities, primarily money market funds, commercial paper and corporate bonds. The risk associated with fluctuating interest rates is limited to our investment portfolio. A 10% decrease in interest rates in fiscal 2007, 2008 and 2009 and the first six months of 2010 would have resulted in a decrease in our interest income of less than $100,000 in each of the periods. As of March 31, 2010, our cash, cash equivalents and short-term investments were invested in money market funds, commercial paper, certificates of deposit, U.S. government and agency securities and corporate bonds.
Foreign currency exchange risk
Our sales contracts are primarily denominated in U.S. dollars and therefore substantially all of our revenue is not subject to foreign currency exchange risk. However, a substantial portion of our operating expenses are incurred outside the United States and are denominated in foreign currencies and are subject to fluctuations due to changes in foreign currency exchange rates, particularly changes in the Indian rupee and the euro. Additionally, fluctuations in foreign currency exchange rates may cause us to recognize transaction gains and losses in our statement of operations. To date, we have not used any foreign exchange forward contracts or similar instruments to attempt to mitigate our exposure in foreign currency exchange rate fluctuation.
Inflation risk
Our monetary assets, consisting primarily of cash, cash equivalents and short-term investments, are not affected significantly by inflation because they are short-term. We believe the impact of inflation on replacement costs of equipment, furniture and leasehold improvements will not materially affect our operations. The rate of inflation, however, affects our cost of goods sold and expenses, such as those for employee compensation, which may not be readily recoverable in the price of products and services offered by us.
Recent accounting pronouncements
See note 1, “The Company and significant accounting policies” in the notes to our consolidated financial statements for a description of recent accounting pronouncements, including the respective dates of adoption or expected adoption and effects on our consolidated financial position, results of operations and cash flows.
86
Table of Contents
Overview
We provide high performance networking solutions for data center and other network deployments. Our solutions include switches and routers that deliver the high density, performance, resiliency and reliability that our customers demand in a cost-effective manner.
Our broad portfolio of Ethernet products helps our customers deploy a seamless, high-capacity, scalable network fabric extending from the server and storage edge to the network core and into the cloud. Our Ethernet products are deployed in data center, high performance enterprise and service provider networks, utilizing 1 GbE and 10 GbE technologies. Our E-Series and C-Series products are also designed to support future customer deployments of 40 and 100 GbE technologies. Our products combine the features of our modular FTOS software and our scalable system architecture to forward or route network traffic at the maximum throughput capacity of each port. This is referred to as “non-blocking line-rate” throughput. This enables maximum network capacity utilization, by minimizing performance bottlenecks, even under heavy traffic conditions, and reduces the number of network systems required to handle the same aggregate network traffic. Our solutions use less power, generate less heat and therefore require less cooling power than competing systems. As a result, our solutions allow customers to reduce capital expenditures and operating costs and support “green” initiatives in data centers.
We complement our family of Ethernet products with multi-service transport and access products targeted at service providers. These products support the delivery of a wide range of legacy telecommunication services to metro networks, which span metropolitan areas or large campuses, and to access networks, which are located between end users and service provider central offices. These products also support Ethernet services to enable the transition from legacy telecommunications networks to packet-optimized Ethernet-based networks. Our family of multi-service transport and access products includes the Traverse and TraverseEdge products for metro networks, the MASTERseries and Axxius products for wireless aggregation networks, which transport voice and data traffic between cell sites and regional switching offices, and the Adit product for converged business access networks, which deliver integrated, managed voice and data access services to small- and medium-sized business customers.
In fiscal 2009, our products were shipped to more than 1,100 end customers in 63 countries worldwide that have some of the most demanding performance environments, including Fortune 100 companies, Internet portals, global carriers, leading research laboratories and government organizations. We sell our products and services through our direct sales force, resellers, distributors and system integrators. For the three months ended March 31, 2010 we generated revenue of $46.6 million and had net income of $0.2 million, and for the 12 months ended March 31, 2010 we generated revenue of $164.1 million and had a net loss of $40.7 million.
Legacy Force10 acquisition
In March 2009, we acquired Legacy Force10. With this acquisition, we added Ethernet products targeted at data center, high performance enterprise and service provider customers and increased our global locations and channel partner base. As a result, we increased the size and scope of our operations and our target markets.
87
Table of Contents
Industry overview
High performance networking equipment primarily consists of switches and routers that enable network connectivity and transport data, voice, video and other multimedia content. Switches and routers are predominantly used to interconnect public and private networks and to connect devices, such as computers, servers, storage, IP phones and other access points, to a network. In addition, switches and routers are designed to enhance the intelligence, reliability, scalability, and security in data transmission and application delivery over a network.
Growth in IP traffic and need for greater bandwidth drives the networking industry
The proliferation of rich media content, network-connected devices, and on-demand software applications is driving disruptive change throughout the networking industry, resulting in tremendous growth in network traffic and the need for more resilient and scalable IP-based networks in organizations.
| • | Demand for rich media content. With the growing popularity of IP television, streaming web content, user-generated music, photo and video clips, online gaming and social networking, video conferencing and high definition content, network traffic is increasingly becoming bandwidth-intensive, and in many cases, must be delivered on-demand or in real-time. |
| • | Proliferation of Internet-connected devices. The proliferation of Internet-connected devices, such as personal computers, mobile devices and online gaming, is significantly contributing to the growth in IP traffic. IDC, an independent market research firm, projects that the number of devices that access the Internet at least once per month will be over 2.7 billion by 2013.(1) |
| • | Adoption of on-demand software applications. Increasingly, software applications are being delivered over the Internet, creating additional bandwidth requirements for IP networks. These applications include software-as-a-service, or SaaS, cloud computing, social networking, and peer-to-peer services. |
According to IDC, U.S. consumer Internet-generated IP traffic is expected to increase from 13,947 Terabytes, or TB, per month in 2008 to 36,038 TB per month in 2013, representing a 21% CAGR.(2) As the demand for rich media content and on-demand software applications continues to grow, and as the number of network connected devices increases, IP traffic has become increasingly volatile and unpredictable in nature, requiring higher capacity and bandwidth management in the network.
Due to its cost-effectiveness, scalability and increasing reliability, Ethernet has emerged as the leading technology for building IP-based networks to address the increasing bandwidth demands for a wide variety of network traffic both internal and external to organizations. As the fastest available standard for Ethernet technology, 10 GbE is emerging as the Ethernet technology of choice to satisfy increasing bandwidth demands. The Dell’Oro Group, an independent market research firm, estimates that the worldwide 10 GbE network equipment market will grow from $2.8 billion in 2009 to $8.5 billion in 2014, representing a 25% CAGR.(3)
High performance networking equipment in the data center
The pervasiveness and increasing complexity of computing, combined with the growth in IP traffic, driven by the demand for anytime and anywhere access to applications and network
| (1) | Source: IDC,Worldwide Digital Marketplace Model and Forecast,November 2009. |
| (2) | Source: IDC,U.S. Consumer Internet Traffic 2009-2013 Forecast, Doc #217920, April 2009. |
| (3) | Source: The Dell’Oro Group,Ethernet Forecast Tables, February 2010. |
88
Table of Contents
content, has made high performance IP-based networks essential for organizations. High performance networking equipment is especially important for data centers, which are increasingly being used to centralize computing and storage resources. Organizations that utilize data centers as a core part of their operations require cost-effective networking solutions that provide high density, performance, resiliency and reliability, as network downtime often results in lost revenue and increased costs. As organizations initially build-out or continue to upgrade their networks to high performance IP-based networks, several trends have developed that further exacerbate the challenges to cost-effectively deploy these high performance networking solutions:
| • | Data center consolidation. Organizations are consolidating small and medium-sized distributed data centers into larger, centralized data centers in order to reduce management and operational costs. Consolidated data centers are less complex and less costly to manage, operate, backup, and secure than multiple, dispersed smaller data centers. With more servers and storage devices connected in the data center, hundreds or thousands of gigabits of data are transmitted over the network simultaneously, creating the need for higher capacity networks. |
| • | Increasing adoption of virtualization and cloud computing technologies. Virtualization builds on the data center consolidation trend, taking advantage of larger pools of servers to increase compute and storage asset utilization. In a cloud computing environment, applications and content are shared and delivered over the network using resources that might be located in a single data center, distributed across a number of data centers, or spread throughout the entire network. Available high-capacity bandwidth and network uptime are critical, as bottlenecks in the network can diminish performance, disrupt application and content delivery, and degrade the overall user experience. |
| • | Increasing focus on managing operating costs. With the consolidation and increased complexity of data centers, power and cooling needs are an increasing concern, as more equipment requires more power, which in turn can generate more heat, requiring more power to cool. In a high performance data center, power and cooling costs constitute a substantial part of the operational budget. Power consumption can be minimized by increasing the networking device density, reducing its size or footprint, and designing networks to be energy efficient. |
These trends are driving customers to evaluate new data center architectures for initial deployments and are accelerating upgrade and replacement cycles within existing data center deployments. According to IDC, worldwide data center Ethernet switching revenue is expected to grow from $3.1 billion in 2009 to $4.3 billion in 2013, representing a 9% CAGR.(1)
Additional needs for high performance networking equipment
High performance networking equipment is often essential to medium and large sized organizations in data intensive vertical markets, which predominately use data center resources for internal operations, and large service providers, which rely on data center resources to deliver their core service offerings to their external customers.
| • | Enterprises. Enterprises rely on high performance networking equipment to connect devices across the enterprise, support the transfer of large and often media-rich content, and to enable access to their data center. As more enterprises centralize their data center operations, reliable |
| (1) | Source: IDC, Worldwide Datacenter Network 2009-2013 Forecast, Doc #220397, October 2009. |
89
Table of Contents
access to enterprise applications and network content across their local, metro and wide area networks has become an essential part of running their businesses. As rich media content, such as video streaming applications, network connected devices, and on-demand software application usage continues to increase, enterprises are challenged to manage the increasingly volatile traffic patterns and bandwidth requirements across their enterprise networks. |
| • | Service providers. Service providers include regional, national, and international wireline, wireless and cable operators. They are increasingly challenged by the complexity of managing the ever-changing mix of traffic on their networks using legacy infrastructure. Additionally, service providers need to reduce the cost of providing revenue generating services such as video conferencing and virtual private networking. To address these challenges, service providers are incrementally migrating their existing networks to Ethernet-based technologies to cost-effectively deliver data, voice, and video services to their subscribers. |
Challenges of cost-effectively meeting high performance networking demands
The growth in IP traffic within data centers and across both enterprise and service provider networks has made it increasingly difficult for these network operators to address bandwidth demands utilizing traditional solutions. Traditional approaches are often limited by low density per system or suffer from oversubscription, where the aggregate port capacity significantly exceeds usable bandwidth to process IP traffic in real time. These limitations require additional hardware and associated interconnections, increasing the cost of the system. Cumulative power inefficiencies resulting from the additional hardware further increase operating costs. In order to address these limitations, next-generation data center networking architectures must continue to address the following challenges:
| • | Density. Solutions need to provide high port density in order to reduce the cost of networking and the physical space required to support current and future bandwidth needs. |
| • | High performance. Solutions need to be architected to efficiently accommodate high-throughput and volatile traffic patterns that, if blocked, can create congestion, resulting in degraded network and application performance. |
| • | Resiliency and reliability. Solutions need to be resilient and reliable as networks have become essential for most organizations. Without failure isolation and reliable recovery mechanisms, a large number of users can experience interruptions and delays, which can have significant adverse financial and business impacts. |
| • | Ease of use. Solutions need to be easily deployed and managed in heterogeneous network environments. Products that support standards-based technologies can help to reduce the challenges associated with managing and provisioning equipment from multiple vendors. |
| • | Cost-effectiveness. Solutions need to address the challenges described above while minimizing both capital expenditures and operating costs. |
90
Table of Contents
Our solutions
We provide high performance networking solutions for data center and other network deployments. Our solutions include switches and routers that deliver the high density, performance, resiliency and reliability that our customers demand in a cost-effective manner. Our solutions offer the following key benefits to our customers:
| • | High density architecture. We believe our solutions offer the highest port density per rack inch in the industry, which enables our products to handle the same aggregate traffic using fewer ports. We determined this by analyzing publicly-disclosed performance specifications of competing products. Our Ethernet products offered up to 26.7 ports per rack inch, which is the total number of 10GbE ports divided by the maximum chassis height, while products offered by major competitors offer fewer, in some cases, less than half as many, ports per rack-inch. With high port density, our products can process more traffic per card, leaving more chassis space available to accommodate future capacity expansion. This enables our customers to cost- effectively deploy more compact, high performance and scalable networks. Additionally, our 40 GbE- and 100 GbE-ready solutions are designed to help our customers make seamless transitions to emerging Ethernet standards. |
| • | High performance architecture. Our solutions are able to perform at non-blocking line-rate throughput, in order to minimize network congestion and meet latency requirements for real-time data and application delivery. Our solutions can also maintain performance even under heavy load or abnormal network conditions by rapidly processing network changes and determining the best way to forward or route traffic. We test our products under simulated heavy and abnormal network conditions both internally and through an independent third party testing firm to verify these capabilities. |
| • | Resiliency and reliability. Our solutions can meet the requirements of the most complex and demanding network environments. Our system architecture combines the modular design of our FTOS software with the fully-distributed and multiprocessor architecture of our switching and routing products. The combination of both modular software and no “single point of failure” hardware design helps to reduce the impact of component or process failures by isolating errors, which in turn minimizes network disruptions. We test our products internally and through an independent third party testing firm to verify these capabilities. |
| • | Ease of use. Our standards-based solutions can be easily deployed and managed in heterogeneous network environments. Our FTOS software uses industry-standard commands and management interfaces to enable seamless interoperability and deployment with minimal staff retraining. In addition, we use the same source code base for substantially all of our switches and routers, which simplifies management. |
| • | Low total cost of ownership. Our high-density solutions help our customers reduce the physical footprint required to handle the same aggregate network traffic and reduce the total number of devices needed to build the same network. Our solutions also use less power, generate less heat and therefore require less cooling power than competing systems. For example, based on published specifications, a competing product uses 183 watts per 10G port, compared to our ExaScale E1200i, which uses only 36 watts per 10G port. As a result, our systems enable customers to reduce capital expenditures and operating costs and support “green” initiatives in data centers. |
91
Table of Contents
Our strategy
Our goal is to become the industry’s leading supplier of high performance networking solutions. Key elements of our strategy include:
| • | Maintain and extend our technological advantages. We intend to continue to invest in high-capacity, compact, power-efficient and resilient system architectures as well as standards-based convergence, virtualization, automation and provisioning technologies. We believe that our software technology is a key competitive differentiator and we intend to continue to extend and enhance our software. We are investing in management and provisioning new technology to assist our customers in streamlining the complex environments that its customers must maintain as they increasingly leverage virtualization technology. We plan to continue to contribute to and implement key advancements in Ethernet and IP technology standards, including the emerging 40 GbE and 100 GbE standards, to ensure our solutions deliver leading-edge performance and are interoperable. |
| • | Extend our position as a leading data center networking provider. We intend to enhance our position as a leader and innovator in the data center market. We believe that the demonstrated benefits of our networking solutions are particularly suited to address the requirements of data center customers. Through our direct sales organization, channel partners, professional services offerings and increased marketing activities, we intend to aggressively pursue data center opportunities. |
| • | Leverage our position as a leading data center networking provider in adjacent markets. We believe that the demonstrated benefits of our solution in demanding data center environments will enable us to penetrate adjacent opportunities in other areas of our customers’ networks while providing significant performance and cost benefits. We intend to focus on adjacent markets where our technology can be leveraged for other applications, and to continue to sell new solutions into our installed base. We also intend to seek to leverage our position in the legacy networks of our service provider customer base to migrate them to next-generation carrier Ethernet solutions. |
| • | Leverage and grow our channel partners and global presence. We intend to further augment our sales efforts in the United States and internationally with additional resellers, distributors and system integrators. We intend to select new channel partners based on their geographic presence, expertise in high performance networking and customer relationships. |
| • | Pursue opportunistic acquisitions. Historically, we have used acquisitions to grow our customer base and expand our technology and service capabilities. We intend to opportunistically pursue acquisition opportunities that have complementary technologies and services and that can accelerate the growth of our business. |
Our technology
Our Ethernet, transport and access products utilize the following key technologies to deliver high levels of performance, resiliency and reliability.
Ethernet products
System architecture. To enable high-speed processing of data and to provide resiliency and reliability, our system architecture separates protocol processing from packet forwarding. This ensures that protocol processing and packet forwarding do not compete for the same computing
92
Table of Contents
resources, maximizing efficiency while keeping each function isolated and protected. Our Route Processor Module, or RPM, is a key component of our chassis-based Ethernet products. It has distinct modules for performing switching, routing and management functions within the same RPM, which provides resiliency, security and high performance switching and routing within the same system. Our RPM also has built-in mechanisms to recognize and deny access to malicious traffic intended to damage the system. This design permits customers to access, manage or troubleshoot the system in the event of switching and routing module failures.
The backplane. Our backplane is a key element of our system architecture that provides the internal interconnection between all active elements such as the RPMs, line cards and switching fabrics. Our scalable backplane has ample reserve transmission capacity to accommodate future higher performance switch fabric implementation as well as the future introduction of line cards with higher port density, such as 40 GbE or 100 GbE interfaces. Compared to optical backplanes or active copper backplanes, our passive backplane eliminates costly electrical-optical-electrical conversions and is designed to have no single point of failure, offering a reliable, cost-effective system design.
FTOS modular software. Our FTOS software features a modular design with separate programs running in protected memory space on an independent operating system. Unlike monolithic operating system designs, which are prone to system-wide failure due to the absence of process isolation, our modular approach is based on a customized Unix-like kernel. FTOS is designed to provide increased resiliency and security by localizing single process failures without disrupting other processes.
FTOS has the ability to manage complex network-sharing, or peering, relationships with its routing functionality and forwarding tasks with its switching functionality. Our FTOS software supports a wide range of switching and Internet routing protocols, including BGP4, IS-IS, OSPF, RIPv2, IGMP, PIM, as well as all major switching protocols including STP, MSTP, RSTP, 802.1Q VLAN Tagging and 802.1ad Link Aggregation. As a result, our Ethernet products can be deployed in critical, high-traffic points in the core, aggregation points and access segments of Ethernet networks. FTOS is also designed to interoperate seamlessly with other standards-based operating systems, enabling our Ethernet products to be rapidly deployed in heterogeneous network environments.
Power efficiency. Low power consumption has been a key design goal throughout the development of our Ethernet products. We have minimized power consumption in our products through power distribution and management design, efficient ASIC design, high system port density and integrated hardware functionality. As a result, our products are designed to have much lower power consumption than competitive products, resulting in lower operational costs for our end customers.
Transport and access products
Our transport and access products are optimized for addressing diverse types of service providers’ network requirements, including the delivery of new revenue-generating voice and data services. The transport and access products leverage integrated, multi-service architectures that enable wireline and wireless carriers to migrate their networks incrementally while increasing network efficiency and capacity and lowering network operating costs.
Our transport and access technology portfolio provides a set of design features that simplify and facilitate the migration of service provider networks from a legacy telecommunications infrastructure to a packet-optimized, Ethernet-based infrastructure. We leverage flexible hardware designs that allow the seamless integration of new services and technologies as network and customer requirements evolve. In addition, our architecture integrates a variety of traffic and bandwidth management capabilities, ranging from transport and grooming to
93
Table of Contents
switching and cross-connecting. Our transport and access products support the addition of new services and functions with hot-swappable modules, which enables a longer product deployment lifecycle.
Our products
Ethernet products
Our Ethernet products consist of our E-Series and C-Series families of chassis-based switches and routers, as well as our S-Series family of fixed-configuration switches.
The following illustration depicts our Ethernet products:
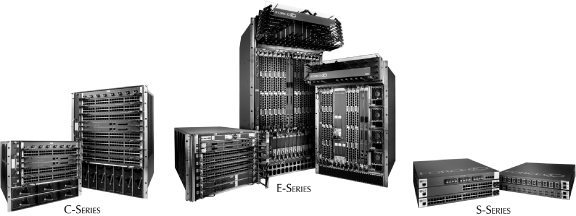
| Product family | Area of deployment, product type | Configuration options | Maximum performance | |||
E-Series
| •Large network core or high-capacity aggregation
•Core chassis-based | •Up to 140 line rate or 560 total 10 GbE ports
•Up to 1,260 line rate | •2.1 billion packets per second and 125 Gigabits per second, or Gbps, total capacity per line card slot | |||
C-Series | •Network core or medium capacity aggregation
•Mid range chassis- | •Up to 64 10 GbE ports
•Up to 384 1 GbE | •952 million packets per second, or Mpps, and 96 Gbps total capacity per line card slot | |||
S-Series | •Network edge aggregation or access | •Up to 48 10/100/1000 megabits per second, or Mbps, ports and 4 10 GbE uplinks in a 1 rack unit, or RU, form factor | •131 Mpps | |||
| •Fixed-configuration switches | •Up to 24 10 GbE ports in a 1 RU form factor | •360 Mpps | ||||
94
Table of Contents
E-Series family of switches and routers
With three chassis models, our E-Series supports a wide variety of line cards and port densities to provide a scalable solution for customers with changing network capacity needs. Based on our packet forwarding technology, high density and FTOS software, the E-Series provides predictable performance, scalability and resiliency.
The E-Series maintains full line-rate throughput even when all features, including security filters, prioritization, and queuing, are enabled. In addition, the separation of data forwarding and processing enables the E-Series to perform rapid calculations and converge on the best route to forward traffic in dynamic environments while maintaining line-rate performance. The RPM for the E-Series product family extends performance of functions within the platform architecture by providing distinct CPUs for switching, routing and management. This additional processing power helps ensure the E-Series switches and routers can maintain predictable performance under peak network load conditions. The E-Series is available with full redundancy of all key components, including the switching fabric, RPM, power supplies and cooling system, which ensures there is no single point of failure.
The E-Series is typically deployed in the data center core, aggregation layer or at the end of a row of racks containing server resources in large data centers.
C-Series family of 1 GbE and 10 GbE resilient switches and routers
Based on our FTOS software, the C-Series provides predictable performance and a high degree of scalability and resiliency. With two chassis, our C-Series can flexibly respond to the bandwidth and capacity needs of our customers.
The C-Series delivers full line-rate throughput even when all features, including security filters, prioritization, and queuing, are enabled. In addition, the separation of data forwarding and processing enables the C-Series to rapidly converge on the best route to forward traffic in dynamic environments while maintaining line-rate performance. In addition to benefiting from our FTOS software, the C-Series is available with full redundancy of all key components, including the switching fabric, RPM, power supplies and cooling system, to help ensure there is no single point of failure.
The C-Series is typically deployed in the core or aggregation layers of midsized data centers or end or row for larger data centers. The C-Series is also deployed to connect to storage or compute devices.
S-Series family of 1 GbE and 10 GbE access switches
Our S-Series access switches are designed to deliver to the network edge the resiliency and reliability typically found in the network core. By aggregating traffic and directing it to the E-Series or C-Series, the S-Series provides our customers with a resilient end-to-end data center solution. The S-Series currently includes the S25, the S50, the S60 (currently undergoing beta testing with customers) and the S2410.
The 1 RU S25, the S50 and the S60 are fixed configuration systems with 24 or 48 ports of 1 GbE respectively, and two open slots, which can accommodate up to two 2-port 10 GbE line cards. Up to eight systems can be linked in a single stack, which can then be managed, secured and supported as a single device, reducing operational expenses.
95
Table of Contents
The 1 RU S2410 is a fixed configuration system with 24 line rate ports of 10 GbE. The S-Series S2410 uses a different operating system that delivers robust switching features optimized for server aggregation.
The S-Series products are typically deployed at the top of an equipment rack, aggregating servers in that rack, and subsequently the means for connecting the rack to the aggregation or core switches.
Transport and access products
We offer a broad selection of transport and access products, which include the Traverse and TraverseEdge product families, the MASTERseries and Axxius products, and the Adit product.
The following illustration depicts our principal transport and access products:
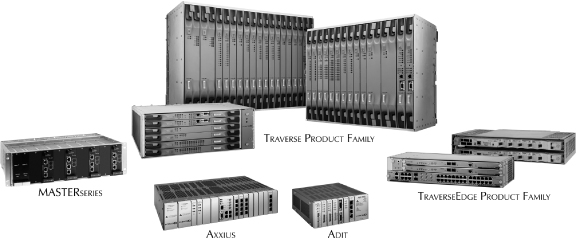
| Product class | Product family and typical deployment | Services supported | ||
Transport | Traverse and TraverseEdge: Multi-service transport in metro and inter-office optical networks | •Ethernet over SONET/SDH •SONET/SDH •Next-generation digital cross-connect system •SONET to SDH gateway | ||
Access | MASTERseries and Axxius: wireless aggregation networks | •TDM-based backhaul •Pseudowire/Ethernet-based aggregation •TDM and ATM to IP and Pseudowire inter-working •A.bis optimization | ||
| Adit: Converged voice and data access for small and mid-sized businesses | •VoIP trunking or line termination gateway •IP/IP-VPN access router and firewall •Traditional multi-T1 channel bank | |||
96
Table of Contents
Transport products
Our Traverse and TraverseEdge product lines deliver versatility, reliability and performance to multi-service transport networks. The scalable Traverse platform provides aggregation, switching and transport for a wide range of services and applications from a single carrier-grade chassis. The compact TraverseEdge products are designed to complement the Traverse platform at the multi-service edge. The Traverse platform is optimized for metro networks and high-capacity aggregation sites such as central offices, co-location facilities and service hubs, while the TraverseEdge platforms are ideally deployed in access settings, such as equipment cabinets, multi-tenant units, cell sites and on customer premises.
The Traverse platform’s distributed switching architecture and modular design reduce costs and enable reduced time-to-market for new services. The Traverse platform can meet resiliency standards for telecommunications networks and can be deployed in linear, ring and mesh topologies to deliver Metro Ethernet Forum—compliant Ethernet and telecommunications services.
The flexibility of the Traverse and TraverseEdge products enable carriers to increase bandwidth capacity, packet-optimize their transport networks, and deliver both new Ethernet and legacy services more rapidly and efficiently. The modular and multi-service design of the Traverse platform reduces operating costs by lowering space and power requirements, and simplifying network management. The multi-service design of the TraverseEdge products, leveraged in combination with the Traverse platform, supports carriers’ need to efficiently deliver new Ethernet services as well as legacy voice and private line services.
Access products
Our access products include our MASTERseries, Axxius and Adit products. Our MASTERseries and Axxius products are compact, modular platforms designed for use in transporting and managing voice and data traffic between wireless carriers’ cell sites and their regional switching offices. The MASTERseries and Axxius are designed to enable migration from legacy 2G/2.5G to IP-based 3G services. Our Adit product provides a versatile converged services access gateway optimized for a wide range of access applications with service providers and small to medium businesses, including hosted business VoIP services.
Deployment case studies
The following are examples of how our networking solutions have been deployed in various customer environments:
Data center. A leading online multiplayer gaming portal needed a reliable, high-speed network infrastructure that could scale from thousands to tens of thousands of players. Initially, the company implemented a network model that isolated each game title within a distinct cluster of servers. As game titles grew and more players sought to enter the existing games, this proved to be an unsustainable model. The portal then made a strategic decision to move from distinct networks to a single consolidated network. The portal deployed our TeraScale E300. The unique three CPU architecture of our TeraScale E-Series, coupled with advanced modular software, enables the TeraScale E-Series to provide high density, line-rate 10 GbE switching as well as the rapid routing updates that the portal needs to provide a reliable gaming experience on its network.
High performance enterprise. A global biomedical research institute needed to provide researchers throughout the facility with a high performance network to support data acquisition and analysis of data from instruments generating as much as one terabyte of data per day. The
97
Table of Contents
institute deployed the C-Series family of switches and routers to reside at the core and the S-Series family of access switches to reside at the service edge of its campus. It also deployed these products in its data center networks. These deployments were made in order to meet its bandwidth and reliability needs cost-effectively. For its space-constrained wiring closets with close proximity to users, the customer leveraged our S-Series access switches to also give network managers flexibility in terms of aggregating capacity where needed.
Service provider. A leading provider of fiber-optic based network services throughout the eastern and central United States required a scalable, multi-service regional optical transport network to inter-connect local telecommunications central offices, carrier hotels, data centers, office parks and other high-traffic locations. In addition to providing scalable transport for traditional telecommunications services, advanced Ethernet capabilities were required to support the delivery of new packet-based wireless aggregation services. The company selected a combination of our Traverse multi-service transport platform and the C-Series C300 to meet these challenges. The versatile, carrier-grade design of the Traverse platform coupled with the powerful switching architecture and high port density of the C-Series, provided their network with the resiliency and features they needed at a cost-effective price point for current and future capacity needs.
Manufacturing and supply chain
While we design our products and develop our software in-house, we subcontract the manufacturing of our products to third-party manufacturers who purchase components from our approved list of suppliers, build products according to our specifications, install our software and conduct the functionality testing that we have developed. Currently, we have arrangements for the manufacturing of our products with Flextronics to manufacture our Ethernet products and AsteelFlash to manufacture our transport and access products. This outsourcing activity extends from prototypes to full production and includes activities such as material procurement, final assembly and test. We design, specify and monitor the tests that are required to meet internal and external quality standards.
These arrangements provide us with the following benefits:
| • | we operate without dedicating significant space, direct labor and capital equipment to manufacturing operations; |
| • | we reduce the working capital required for funding inventory; and |
| • | we can adjust manufacturing volumes quickly to meet changes in demand. |
Although there are multiple sources for most of the component parts of our products, some components are currently sourced from single or, in some cases, limited sources. For example, various types of central processors, network processors, and ASICs are sourced from various component manufacturers, including Broadcom Corporation, International Business Machines Corporation, or IBM, and Texas Instruments, which presently are sole sources for these particular components. We typically do not have written agreements with any of these component manufacturers to guarantee the supply of the key components used in our products. We regularly monitor the supply of components and the availability of alternative sources. We provide forecasts to our manufacturers so they can source the key components in advance of their anticipated use, with the objective of maintaining an adequate supply of these key components. In addition, we maintain a small inventory of key components that we believe are most critical to the manufacturing process.
98
Table of Contents
Sales and marketing
We market and sell our products through our direct sales force and channel partners. Our indirect sales channel, comprised of resellers, distributors and system integrators, is supported by a dedicated sales force with broad experience in selling high performance network infrastructure equipment through distribution partners.
Direct sales. Our direct sales force in North America is divided into Western, Central, North Eastern and South Eastern regional operations. Our direct sales efforts are focused on large, consolidated data center, high performance enterprise and service provider opportunities. The direct sales account managers cover the market on an assigned geographic basis and work as a team with systems engineers assigned to particular accounts. We complement our direct sales force with a team of internal sales personnel for lead generation and back office-support.
Channel partners. We augment our direct sales efforts with resellers, distributors and system integrators in the United States and internationally. We select our channel partners based upon their geographic presence and expertise in high performance networking and customer relationships. These resellers provide first and, sometimes, second level support services required by our customers. In fiscal 2009, we shipped to more than 175 of our channel partners, and no single channel partner accounted for 10% or more of our total revenue.
Marketing. Our marketing activities include product marketing and management as well as sales support programs. Marketing utilizes a variety of vehicles, including advertising, our website, trade shows, direct marketing and public relations, to build our brand, increase customer awareness, generate leads and communicate our product advantages. We also use our marketing programs to support the sale of our products through new channels and to enter new markets. Our internal marketing team focuses on increasing brand awareness, communicating product advantages and generating qualified leads for our sales force and channel partners.
End customers
We sell our products directly and through channel partners to end customers, typically mid- to large-size data centers, service providers and enterprises, and across a broad range of industries including financial services, government, healthcare and pharmaceutical, higher education, portals, industrial, research laboratories, technology and telecommunications. During fiscal 2009, our products were shipped to more than 1,100 end customers worldwide, including Fortune 100 companies, global carriers, leading research laboratories and Internet portals, representing some of the most demanding performance environments.
No end-customer accounted for more than 10% of our total revenue in fiscal 2009.
Customer service and support
We offer a combination of online, telephone and on-site technical assistance services 24 hours a day, seven days a week. We also offer professional services for network analysis, design and implementation, network management and training. In addition, we maintain a product and applications knowledge base available on our website. We also train our resellers and distributors in the delivery of support services.
Our customer service and support organization provides front line assistance and is the problem resolution interface for our channel partners and end users. Based on the severity of the problem and the impact to the customer’s network, there are strict escalation guidelines to ensure that the appropriate technical resources and management attention are deployed in a timeframe commensurate with problem priority.
99
Table of Contents
Our flexible support services include basic hardware and software maintenance, extended software maintenance, domestic next business day replacement for parts and four-hour replacement of parts. We deliver these services directly to major end customers and through our resellers and international distributors. We maintain technical assistance centers and spare parts depots in North America and the Asia-Pacific, Europe, Middle East and Africa regions.
Research and development
We believe our future success depends on our ability to develop new products, features and applications that address the rapidly changing technology needs of our industry. Our engineering staff is responsible for the design, development, quality, documentation and release of our products. We have engineering groups located in the United States and India. Research and development expenses were $19.7 million, $34.1 million, $23.6 million and $13.4 million in the first six months of fiscal 2010 and in fiscal 2009, 2008 and 2007, respectively.
Intellectual property
Our success and ability to compete are substantially dependent upon our intellectual property. We rely on patent, trademark and copyright law, trade secret protection and confidentiality or license agreements with our employees, customers, channel partners and others to protect our intellectual property rights. As of June 7, 2010, we had 76 patents issued in the United States, which expire between 2015 and 2027, and had 84 patent applications in the United States. We also have 5 foreign patents issued in Taiwan, which expire in 2013, and we have 7 patent applications in foreign countries based on our issued patents and patent applications in the United States. In addition, we have a number of non-exclusive licenses from third-party hardware and software vendors that allow us to resell certain hardware products and incorporate their software in our products.
The steps we have taken to protect our intellectual property rights may not be adequate. Third-parties may infringe or misappropriate our intellectual property rights and may challenge our issued patents. In addition, other parties may independently develop similar or competing technologies designed around any patents that may be issued to us. We intend to enforce our intellectual property rights vigorously, and from time to time, we may initiate claims against third-parties that we believe are infringing our intellectual property rights if we are unable to resolve matters satisfactorily through negotiation. If we fail to protect our intellectual property rights adequately, our competitors could offer similar products, potentially significantly harming our competitive position and decreasing our revenue.
Competition
The market for our products is highly competitive, rapidly evolving and subject to changing technology, customer needs and new product introductions. Cisco Systems, Inc. currently maintains a dominant position in our markets, offers products and services that compete directly with ours, and is able to adopt aggressive pricing policies and leverage its customer base and extensive product portfolio to gain market share. Other principal competitors for our Ethernet products include Brocade Communications Systems, Inc., Extreme Networks, Inc., Hewlett-Packard Company (which recently completed the acquisition of 3Com Corporation, another competitor), Huawei Technologies Co., Ltd. and Juniper Networks, Inc. Other principal competitors for our transport and access products include ADTRAN, Inc., Alcatel-Lucent SA, Fujitsu Limited, Huawei Technologies Co., Ltd. and Tellabs, Inc. We could also face competition from new market entrants, whether from new ventures or from established companies moving into the market.
100
Table of Contents
Many of these competitors are substantially larger and have greater financial, technical, research and development, sales and marketing, manufacturing, distribution, services capabilities and other resources.
We currently compete principally on the basis of:
| • | product features and enhancements; |
| • | total cost of ownership; |
| • | technical support and service; |
| • | compliance with industry standards; |
| • | product interoperability in customer networks; |
| • | breadth of product lines; and |
| • | sales and distribution capability. |
We believe we compete favorably with respect to these factors.
Employees
As of April 30, 2010, we employed 592 people, including 310 in research and development and operations, 209 in sales and marketing and customer support and 73 in a general and administrative capacity. None of our employees is represented by a labor union or is a party to a collective bargaining agreement. We have not experienced any work stoppages, and we consider our relations with our employees to be good.
Facilities
Our principal locations, their purposes and the expiration dates for leases on facilities at those locations are shown in the table below.
| Location | Purpose | Approximate square feet | Lease expiration date | |||
San Jose, California | Corporate headquarters | 96,710 | December 2012 | |||
Petaluma, California | Operations, administrative and research and development | 31,010 | November 2010 | |||
Chennai, India | Research and development and customer support | 33,500 | June 2010 | |||
Our Ethernet and Transport segments utilize each of these facilities.
We also have smaller sales and research offices worldwide. The San Jose lease may be renewed for an additional five-year term. We also have renewal options for our Petaluma, California and Chennai, India facilities.
We believe our current facilities will be adequate or that additional space will be available on commercially reasonable terms for the foreseeable future.
Legal proceedings
We are not a party to any material legal proceedings. From time to time, we may be subject to legal proceedings and claims in the ordinary course of business.
101
Table of Contents
Executive officers and directors
The following table sets forth the names, ages and positions of our executive officers and directors as of June 7, 2010:
| Name | Age | Position | ||
Henry Wasik | 54 | President, Chief Executive Officer and Director | ||
James Hanley | 48 | President, Field Operations | ||
William Zerella | 53 | Chief Financial Officer | ||
Ebrahim Abbasi | 55 | Executive Vice President, Corporate Business Development and Technology | ||
Leah Maher | 49 | Vice President and General Counsel | ||
Mary Cole | 51 | Vice President of Human Resources | ||
Howard A. Bain III(1) | 64 | Director | ||
B.J. Cassin(2) | 76 | Director | ||
Keith G. Daubenspeck | 47 | Director | ||
Dixon R. Doll, Ph.D.(2)(3) | 67 | Chairman of the Board of Directors | ||
C. Richard Kramlich(1)(3) | 74 | Director | ||
Steven M. Krausz(1) | 55 | Director | ||
Paul S. Madera(2) | 53 | Director | ||
| (1) | Member of the audit committee. |
| (2) | Member of the compensation committee. |
| (3) | Member of the nominating and corporate governance committee. |
Set forth below is biographical information, including the experiences, qualifications, attributes or skills that caused us to determine that each of the members of our board of directors should serve as a director.
Henry Wasik has served as our president and our chief executive officer since November 2004 and as a director since December 2004. Prior to joining us, he served as a senior vice president of the fixed communications group for Alcatel-Lucent SA, a provider of solutions and services ranging from backbone networks to user terminals for operators, service providers, enterprises and consumers, where he served from October 1999 to April 2004. At Alcatel-Lucent SA, Mr. Wasik was responsible for all aspects of the global business operations of multiple product lines related to the fixed communications group. Mr. Wasik holds a bachelor of science degree in electrical engineering from the University of Bridgeport and a master of industrial management degree from the Georgia Institute of Technology.
James Hanley has served as our president, field operations since our acquisition of Legacy Force10 in April 2009. From November 2008 to March 2009, Mr. Hanley served as president and chief executive officer of Legacy Force10, and he served as senior vice president of worldwide sales for
102
Table of Contents
Legacy Force10 from September 2007 to October 2008. Before joining Legacy Force10, from August 2006 to September 2007, Mr. Hanley was senior vice president of worldwide field operations at NeoScale Systems, Inc., a provider of enterprise-class security solutions for data storage. Prior to NeoScale Systems, Inc., he managed the worldwide channel at CA Inc., a developer and marketer of information technology management software, as senior vice president of worldwide partner sales from May 2005 to July 2006. Earlier, Mr. Hanley held executive roles in sales, field operations and channel development at EMC Corporation, a provider of information infrastructure systems, software and services, including senior leadership positions in London and Hong Kong. Mr. Hanley holds a bachelor of arts degree in economics with a minor in accounting from Claremont McKenna College. In 1997, the SEC filed a civil action against Mr. Hanley in connection with his service as vice president of operations for Pinnacle Micro, Inc. The SEC alleged that Mr. Hanley engaged in certain improper accounting practices. Mr. Hanley did not admit or deny the allegations, but he consented to the entry of a final judgment that permanently enjoins him from violating Section 13(b)(5) and Rules 13b2-1 and 13b2-2 of the Securities and Exchange Act of 1934, as amended, and that required him to pay a $25,000 civil penalty. None of the SEC allegations involved our company.
William Zerellahas served as our chief financial officer since July 2006. Prior to joining us, Mr. Zerella served as chief financial officer at Infinera Corporation, a manufacturer of high-capacity optical transmission equipment for the service provider market from December 2004 to June 2006. Prior to Infinera, Mr. Zerella has held various other senior level financial and business management positions at companies including GTECH Corporation and Deloitte & Touche LLP. Mr. Zerella holds a bachelor of science degree in accounting from the New York Institute of Technology and a master of business administration degree from the Leonard N. Stern School of Business at New York University.
Ebrahim Abbasi has served as executive vice president of corporate business development since December 2009, adding responsibility for engineering since March 2010, operations since April 2010 and the chief technology office since May 2010. Prior to joining us, Mr. Abbasi was senior vice president of operations at the packet networks division of Ericsson, Inc., a global provider of telecommunications equipment and related services to mobile and fixed network operators, since January 2007. In this role, Mr. Abbasi was responsible for the packet networks division’s operations, information technology, customer service and corporate services. Mr. Abbasi joined Ericsson as a result of Ericsson’s acquisition of Redback Networks, Inc., a provider of subscriber management systems enabling internet service providers to provide broadband solutions, where Mr. Abbasi served as senior vice president operations and customer service since October 2001. Mr. Abbasi received bachelor of science and master of science degrees in electrical engineering from the University of Tehran.
Leah Maher has served as our vice president and general counsel since August 2007. Before joining us she served as executive vice president and general counsel at SpectraLink Corporation, a designer, manufacturer, and seller of workplace wireless telephone systems, from September 2004 to May 2007. At SpectraLink, Ms. Maher was responsible for corporate governance and compliance, contracts, litigation, merger and acquisition activities and integration and the intellectual property portfolio. Ms. Maher holds a bachelor of arts degree in economics and government from Colby College and a juris doctorate degree from the University of Akron School of Law.
Mary B. Cole has served as our vice president of human resources since we acquired Legacy Force10. Ms. Cole joined Legacy Force10 in November 2006 as a senior director of human
103
Table of Contents
resources and was promoted to vice president of human resources in November 2008. Prior to joining Legacy Force10, Ms. Cole had been a consultant to Legacy Force10 from November 2005 to November 2006. Ms. Cole held several human-resources related senior management roles at Juniper Networks, Inc., a provider of high-service network solutions, from August 2000 to October 2005. Ms. Cole holds a bachelor of science degree in community health education and gerontology from California State University, Chico.
Howard A. Bain IIIhas served on our board of directors since September 2007. Since 2004, Mr. Bain has been an independent consultant in all aspects of corporate finance. Mr. Bain held chief financial officer positions at several public companies including Portal Software, Inc. from 2001 to 2004, Vicinity Corporation in 2000, Informix Corporation from 1999 to 2000 and Symantec Corporation from 1991 to 1999. Mr. Bain also serves as a member of the board of directors of Nanometrics Incorporated and Learning Tree International, Inc. Mr. Bain holds a bachelor of science degree in business from California Polytechnic University. Mr. Bain is an experienced financial leader with the skills necessary to lead our audit committee. His service as chief financial officer at several public companies has provided him with extensive financial and accounting experience, particularly in the areas of accounting principles, financial reporting rules and regulations, as well as in evaluating financial results and generally overseeing the financial reporting process at a public company.
B.J. Cassinhas served on our board of directors since November 1999. Mr. Cassin has been a private venture capitalist since 1980. Previously, Mr. Cassin co-founded Xidex Corporation, a manufacturer of data storage media in 1969. Mr. Cassin is chairman of the board of directors of Cerus Corporation. Mr. Cassin holds a bachelor of arts degree in economics from Holy Cross College. Mr. Cassin has been a financial founder in many companies that have gone on to become public companies or that were later acquired by public companies. Mr. Cassin provides our board of directors with valuable insight on capital raising and strategic planning matters.
Keith G. Daubenspeckhas served on our board of directors since April 2009. Mr. Daubenspeck is the chairman and co-founder of Advanced Equities Financial Corp., a holding company which owns Advanced Equities, Inc., or AEI, a venture capital investment bank, and First Allied Securities, Inc., an independent broker/dealer. He has served as chairman of Advanced Equities Financial Corp. since 2003 and has served as the head of Advanced Equities, Inc.’s venture capital investment banking activities since 1999. Mr. Daubenspeck also serves as a member of the board of directors of numerous private companies. Mr. Daubenspeck’s experience in the financial services industry and his diverse relationships within that industry provide our board of directors with a valuable asset and enable Mr. Daubenspeck to provide us with additional perspectives.
Dixon R. Doll, Ph.D. has served on our board of directors since April 2002 and as chairman since May 2009. Dr. Doll is the co-founder and a general partner of DCM, an early stage technology venture capital firm that manages $1.6 billion from offices in Menlo Park, California, Beijing, China and Tokyo, Japan. In the mid-1980’s, Dr. Doll co-founded the venture capital industry’s first fund focused exclusively on telecommunications opportunities. At DCM, he has led the firm’s investments in About.com (Acquired by The New York Times Co.), @Motion (Acquired by Openwave), Clearwire (Nasdaq: CLWR), Foundry Networks (Nasdaq: FDRY), Internap (Nasdaq: INAP), Ipivot (Acquired by Intel) and Neutral Tandem (Nasdaq: TNDM) among others. Dr. Doll also serves as chairman of the board of directors of Network Equipment Technologies, as a member of the board of directors of Neutral Tandem, Inc. and as a member of the board of directors of numerous private companies. In April 2005, he was elected to the Board of Directors of the National Venture Capital Association (NVCA) in Washington, D.C. Dr. Doll served as the NVCA
104
Table of Contents
Chairman for its 2008/2009 fiscal year. Additionally, he also serves on the Stanford Institute for Economic Policy Research Advisory Board and the Hoover Institution Board of Overseers at Stanford. He is also the Chairman of the San Francisco Asian Art Museum Board. Dr. Doll received his bachelor of science degree in electrical engineering (cum laude) from Kansas State University as well as master of science and doctorate degrees in electrical engineering from the University of Michigan, where he was a National Science Foundation scholar.
C. Richard Kramlich has served on our board of directors since April 2009. Mr. Kramlich is a co-founder of New Enterprise Associates, a venture capital firm, where he has served as a general partner since its formation in 1978. Mr. Kramlich also serves as a member of the board of directors of Zhone Technologies, Inc., SVB Financial Group, Sierra Monitor Corporation and as a member of the board of directors of numerous private companies. Mr. Kramlich holds a bachelor of science degree in history from Northwestern University and a master of business administration degree from Harvard University. With over 40 years of experience in the venture capital industry, providing guidance and counsel to a wide variety of technology companies, Mr. Kramlich provides an important perspective to our board of directors.
Steven M. Krausz has served as one of our directors since April 2009. Mr. Krausz is currently a managing member at U.S. Venture Partners, a venture capital firm, which he joined in 1985. Mr. Krausz also served on the board of directors of Verity, Inc., and he currently serves as a member of the board of directors of Occam Networks, Inc. and as a member of the board of directors of numerous private companies. Mr. Krausz holds a bachelor of science degree in electrical engineering and a master of business administration degree from Stanford University. Mr. Krausz has served as an advisor to many network vendors, customers, investors and start-up companies. His knowledge of our industry enables him to provide our board of directors with valuable insight and advice.
Paul S. Maderahas served on our board of directors since April 2009. Mr. Madera is a co-founder of Meritech Capital Partners, a leading late stage venture capital firm, in 1999 and currently focuses on the storage, semiconductor, networking and digital consumer sectors. Mr. Madera has served as a member of the board of directors for numerous private companies. Mr. Madera holds a bachelor of science degree from the United States Air Force Academy and a master of business administration degree from Stanford University. Mr. Madera has been directly involved with numerous start-up companies in the storage, semiconductor, networking and digital consumer sectors, and his experiences enable him to provide our board with important strategic counsel and guidance.
Board composition
Our board currently consists of eight members. Each director is elected at a meeting of stockholders and serves until our next annual meeting or until his successor is duly elected and qualified or until his earlier death, resignation or removal. Effective upon completion of this offering, our certificate of incorporation will provide that any vacancy on our board, except for a vacancy created by the removal of a director without cause, shall be filled by a person selected by a majority of the remaining directors then in office, or by a sole remaining director, unless the board of directors determines that the particular vacancy will be filled by the vote of the stockholders.
Effective upon the completion of this offering, our board of directors will be divided into three classes of directors who will serve in staggered three-year terms, as follows:
| • | our Class I directors will be Messrs. Cassin and Kramlich; |
105
Table of Contents
| • | our Class II directors will be Dr. Doll and Messrs. Krausz and Daubenspeck; and |
| • | our Class III directors will be Messrs. Bain, Wasik and Madera. |
Effective upon completion of this offering, our certificate of incorporation will provide that the authorized number of directors may be changed only by resolution of the board of directors. Any additional directorships resulting from an increase in the number of directors will be distributed among the three classes with three-year terms so that, as nearly as possible, each class will consist of one-third of the directors. At each annual meeting of stockholders, the successors to directors whose terms then expire will be elected to serve from the time of election and qualification until the third annual meeting following election. As a result, only one class of directors will be elected at each annual meeting of our stockholders, with the other classes continuing for the remainder of their respective three-year terms. The division of our board of directors into these three classes may delay or prevent a change of our management or a change in control. See “Description of capital stock—Anti-takeover provisions—Charter and bylaw provisions.”
Our board of directors determined that each of the members other than Mr. Wasik and Mr. Daubenspeck are “independent directors” as defined under the rules of the New York Stock Exchange, constituting a majority of independent directors of our board of directors as required by the rules of the New York Stock Exchange. Mr. Wasik is not independent because he is an employee, and Mr. Daubenspeck is not independent because of placement agent and advisory service fees we paid to entities affiliated with AEI in fiscal 2007, 2008 and 2009, as described further under “Certain relationships and related party transactions.”
Board committees
Our board of directors has an audit committee, compensation committee and nominating and corporate governance committee, each of which has the composition and responsibilities described below. Members serve on these committees until their respective resignations or until otherwise determined by our board of directors. Our board of directors may from time to time establish other committees.
Audit committee
Our audit committee oversees our corporate accounting and financial reporting process. Among other matters, the audit committee:
| • | evaluates the qualifications, independence and performance of our independent registered public accounting firm; |
| • | determines the engagement of our independent registered public accounting firm and reviews and approves the scope of the annual audit and the audit fee; |
| • | discusses with management and our independent registered public accounting firm the results of the annual audit and the review of our quarterly financial statements; |
| • | approves the retention of our independent registered public accounting firm to perform any proposed permissible non-audit services; |
| • | monitors the rotation of partners of our independent registered public accounting firm on our engagement team as required by law; |
| • | reviews our critical accounting policies and estimates; and |
| • | annually reviews the audit committee charter and the committee’s performance. |
106
Table of Contents
Our audit committee consists of Mr. Bain, who is the chair of the committee and Messrs. Kramlich and Krausz. Each of these individuals meets the requirements for financial literacy under the applicable rules of the New York Stock Exchange and SEC, and each of Messrs. Bain, Kramlich and Krausz is an independent director as defined under the applicable regulations of the SEC and under the applicable rules of the New York Stock Exchange. Our board of directors has determined that Mr. Bain is an audit committee financial expert as defined under the applicable rules of the SEC and therefore has the financial expertise required under the applicable requirements of the New York Stock Exchange. The audit committee operates under a written charter that satisfies the applicable standards of the SEC and the New York Stock Exchange.
Compensation committee
Our compensation committee reviews and recommends policy relating to compensation and benefits of our officers and employees. The compensation committee reviews and approves corporate goals and objectives relevant to compensation of our chief executive officer and other executive officers, evaluates the performance of these officers in light of those goals and objectives and sets the compensation of these officers based on such evaluations. The compensation committee also administers the issuance of stock options and other awards under our equity incentive plans. The compensation committee will review and evaluate, at least annually, the performance of the compensation committee and its members, including compliance of the compensation committee with its charter. Our compensation committee consists of Mr. Cassin, who is the chair of the committee, Dr. Doll and Mr. Madera. Each of Dr. Doll and Messrs. Cassin and Madera is an independent director as defined under the applicable requirements of the New York Stock Exchange, is a nonemployee director as defined by Rule 16b-3 promulgated under the Exchange Act and is an outside director as defined pursuant to Section 162(m) of the Internal Revenue Code.
Nominating and corporate governance committee
Our nominating and corporate governance committee makes recommendations to our board of directors regarding candidates for directorships and the size and composition of the board of directors and its committees. In addition, the nominating and corporate governance committee oversees our corporate governance guidelines and reporting and makes recommendations to the board of directors concerning governance matters. Our nominating and corporate governance committee consists of Mr. Kramlich, who is the chair of the committee, and Dr. Doll. Each of Mr. Kramlich and Dr. Doll is an independent director as defined under the applicable rules of the New York Stock Exchange.
Compensation committee interlocks and insider participation
During fiscal 2009, our compensation committee consisted of Mr. Cassin, Dr. Doll and since May 2009, Mr. Madera. None of the members of the compensation committee was at any time during the fiscal year an officer or employee of our company or any of its subsidiaries, none have ever served as an officer or employee of our company or any of its subsidiaries and none have had any relationships with our company of the type required to be disclosed under Item 404 of Regulation S-K. None of our executive officers has served as a member of the board of directors, or as a member of the compensation or similar committee, of any entity that has one or more executive officers who served on our board of directors or compensation committee during our 2009 fiscal year.
107
Table of Contents
Director compensation
The following table provides information for the fiscal year ended September 30, 2009 regarding all plan and non-plan compensation awarded to, earned by or paid to, each person who served as a director for some portion or all of fiscal 2009. Directors who also serve as our employees, such as our chief executive officer, do not receive additional compensation for their service on the board.
| Name | Fees earned or paid in cash | Option awards (1)(2)(3) | Total | ||||||
Howard A. Bain III | $ | 42,000 | $ | 2,475 | $ | 44,475 | |||
All other non-employee directors | — | — | — | ||||||
| (1) | The amounts in this column represent the fair value of the awards on the date of grant, computed in accordance with ASC 718. See note 6 to the notes to our consolidated financial statements for a discussion of our assumptions in determining the ASC 718 values of our option awards. |
| (2) | On August 14, 2009, in connection with his service as a member of our board of directors and our audit committee, we granted to Mr. Bain an option to purchase 18,000 shares of our common stock, with an exercise price equal to $0.06 per share, which shares vested as to 1/4 of the shares on April 1, 2010 and will vest as to 1/16 of the shares after each successive month following that date. Additionally, on September 16, 2009, we granted to Mr. Bain an option to purchase 58,000 shares of our common stock, with an exercise price equal to $0.06 per share, which shares vest as to 1/4 of the shares on September 16, 2010 and as to 1/16 of the shares after each successive month after that date. The vesting of each option and the underlying shares would accelerate in full upon a change in control. The options were early exercisable, and Mr. Bain exercised each of the options in full on September 29, 2009. Each of the options had a ten-year term and would terminate three months following the date Mr. Bain ceased to be one of our directors, or 12 months afterwards if termination was due to death or disability. |
| (3) | As of September 30, 2009, Mr. Bain held 76,000 shares of our common stock, all of which were unvested and subject to a lapsing right of repurchase in our favor upon Mr. Bain’s cessation of service. As of September 30, 2009 none of our other non-employee directors held options to purchase our stock. |
In November 2009, our board of directors, after consultation with our independent compensation consultant, approved a grant of an option to purchase 60,000 shares of our common stock to each non-employee director who had not previously received an equity grant, which directors were Messrs. Cassin, Daubenspeck, Kramlich, Krausz and Madera and Dr. Doll. The options were granted under our 2007 equity incentive plan, effective as of December 24, 2009, at an exercise price of $1.11 per share, which represents the fair market value of our common stock at that date as determined by our board of directors. The options are early exercisable and vest monthly over two years. The vesting of the options and the underlying shares would accelerate in full upon a change in control. With the exception of Mr. Bain, our non-employee directors do not receive cash compensation for their service on our board of directors or committees of the board of directors, and we have not adopted a policy for making equity grants to our non-employee directors.
Following the completion of this offering, we intend to adopt a policy for compensating our non-employee directors with a combination of cash and equity.
108
Table of Contents
Compensation discussion and analysis
The following discussion describes and analyzes our executive compensation program as it applies to our named executive officers. Our executive compensation program is designed to compensate executives based on our short-term and long-term performance and on the individual performance of the executive. To that end, our executive compensation program has four primary components—base salary, performance-based cash bonuses, long-term equity incentive awards and retention incentive benefits. We also provide our executive officers with other benefits that in most cases are available generally to all salaried employees.
General. The various elements comprising our executive officer compensation program are designed to achieve the following objectives:
| • | provide competitive total compensation packages that attract, reward and retain exceptional executive-level talent; |
| • | establish a direct and meaningful link between business financial results, individual and team performance and rewards; and |
| • | provide strong incentives to promote our growth, create stockholder value and reward superior performance. |
Although our compensation committee reviews total compensation of our executive officers, we do not believe that significant compensation derived from one component of compensation should negate or reduce compensation from other components. The compensation committee determines the appropriate level for each compensation component based in part, but not exclusively, on competitive analysis, its view of internal equity and consistency and other considerations it deems relevant. Some of these considerations include the scope of responsibility of the executive officer, the value of existing equity awards held by the executive officer, our performance against our strategic plan, the executive officer’s performance against his or her objectives, the recommendations of our chief executive officer and other members of management, and comparative equity ownership data of executive officers in equivalent positions at our peer group companies.
We have not adopted any formal or informal policies or guidelines for allocating compensation between long-term and currently paid out compensation and between cash and non-cash compensation. Our current intent is to perform at least annually a review of our executive officers’ overall compensation packages to determine whether they meet our compensation objectives. The compensation committee most recently reviewed our executive compensation in December 2009.
Comparative framework. The compensation committee retained Compensia, an independent compensation consultant, to assist us in determining our compensation packages. There is no other relationship between Compensia and the company. The nature and scope of services rendered by Compensia in fiscal 2009 was:
| • | to assist in identifying members of our peer group for comparison purposes; |
| • | to help determine compensation levels at our peer group companies; |
| • | to provide advice regarding compensation best practices and market trends; |
109
Table of Contents
| • | to assist with the redesign of any compensation program, as needed; |
| • | to prepare for and attend selected management or compensation committee meetings; and |
| • | to provide advice throughout the year. |
In determining our peer group companies, the compensation committee and Compensia selected companies that they believed are comparable to us with respect to industry segment, revenue level, product similarity and market conditions, and the following companies were selected as our peer group:
Acme Packet, Inc. | Extreme Networks, Inc. | Silicon Graphics International | ||
Airvana, Inc. | Harmonic Inc. | SonicWALL, Inc. | ||
Aruba Networks, Inc. | NetScout Systems, Inc. | Sonus Networks, Inc. | ||
BigBand Networks, Inc. | Opnext, Inc. | Starent Networks Corp. | ||
Blue Coat Systems, Inc. | Riverbed Technology, Inc. | |||
Digi International Inc. | ShoreTel, Inc. | |||
Information on compensation practices at members of our peer group was collected from publicly-available information contained in peer group company SEC filings. Compensia also reviewed survey information of pre-IPO companies and public companies, including a Radford high-technology executive compensation survey of public companies with revenue of between $50 to $200 million and $200 to $500 million. Compensia presented us with combined compensation information on these companies and our peer group companies, which we consider our “market.” This data is used as one factor in the review and determination of our executive compensation.
Approval of executive compensation. The compensation committee determines the amount of compensation for our executive officers, including the named executive officers. In the past, the compensation committee would recommend the form and amount of compensation for our executive officers to our board of directors for approval.
110
Table of Contents
Elements of compensation. Our named executive officers are compensated through the following elements, each designed to achieve one or more of our overall compensation objectives:
| Compensation element | How determined | Objective | ||
Base salary | •Market data, scope of executive’s responsibilities and experience. | •Attract and retain experienced executives. | ||
Performance-based cash bonuses | •Based on achieving corporate objectives. | •Motivate executives to achieve company objectives. | ||
•Executive bonus amount is adjusted based on individual performance during the bonus period. | •Tie a substantial portion of executive compensation to achieving company objectives and individual performance. | |||
Long-term equity incentive awards | •Market data, scope of executive’s responsibility and value of existing equity awards. | •Attract and retain experienced executives. Enable executives to benefit from long-term growth in our stock price. | ||
•Align interests of executives with stockholders. | ||||
Retention incentive benefits | •Market data, scope of executive’s responsibility and value of existing long-term equity incentive awards. | •Provide consistent severance benefits to our executive officers and retain executive talent.
•Align interests of executives with stockholders. | ||
•Encourage retention of key executive team members through a change of control event. | ||||
Base salary. The base salaries of Messrs. Wasik and Zerella, Bruce Miller, our former chief technology officer, and Ms. Maher for fiscal 2009 were $390,000, $350,000, $240,000 and $240,000, respectively. These amounts were unchanged from salaries in fiscal 2008. The salaries reflect our compensation committee’s view of the appropriate compensation levels of our named executive officers and remain unchanged for fiscal 2010. As noted above, during fiscal 2009 our compensation committee did not engage in benchmarking as that term is commonly used. Rather, the compensation committee took into account the factors discussed above in determining executive pay levels. For reference, the base salaries for our named executive officers are generally near the median of the public companies in our market, although there is variation across the named executives based on the compensation committee’s application of the factors discussed above to each of our named executive officers. Mr. Hanley joined us on April 1, 2009 in connection with our acquisition of Legacy Force10. Mr. Hanley’s base salary of $240,000 was negotiated with him in connection with his joining our company. Mr. Hanley’s base salary is also near the median of the public companies in our market.
111
Table of Contents
Performance-based cash bonuses. We utilize cash bonuses to reward the achievement of company objectives and to recognize individual performance. Messrs. Wasik, Zerella and Miller and Ms. Maher were eligible to receive cash bonuses pursuant to a performance-based cash bonus plan adopted by our compensation committee in July 2009 for fiscal 2009. Our compensation committee postponed adopting a performance-based cash bonus plan earlier in fiscal 2009 as we negotiated and consummated our acquisition of Legacy Force10 and integrated the two companies. The bonuses were based upon the attainment of company performance objectives established by the compensation committee for fiscal 2009 and each executive’s individual performance.
The performance objectives consisted of: pre-defined ranges of net cash balance, consisting of cash and cash equivalents less the current portion of our indebtedness owed to Silicon Valley Bank and less the net effect of certain equity sales and repurchases during the period; adjusted EBITDA, which represents EBITDA, further adjusted to eliminate non-cash stock compensation expense, non-cash inventory adjustment expense under purchase accounting and restructuring and integration expenses; and non-financial goals.
The non-financial goals related to our integration of Legacy Force10 following the acquisition, and these goals were chosen to provide our executive officers with incentives to successfully integrate Legacy Force10 into our business. The non-financial goals consisted of: implementing a common forecasting and CRM system, fully integrating our sales teams into one system; cross training our sales account directors and sales engineers on our existing and Legacy Force10 products to promote synergies; creating $1.0 million of incremental synergistic revenue; combining our commodity management groups and completing negotiations on top ten commodities; transferring Carrier Access and wireless products; developing a new logistics model for data center products; standardizing business processes; automating business processes and completing business process analysis; and solution design and data conversion for our CRM system. The bonus for each executive was equal to the product of (a) a percentage determined by the compensation committee, based on the extent to which all three performance objectives were achieved, multiplied by (b) a dollar amount equal to 50%, or 75% in the case of our chief executive officer, of each named executive officer’s annual base salary. Each named executive officer’s individual performance was evaluated by the compensation committee and his or her bonus amount was adjusted accordingly.
112
Table of Contents
Our chief executive officer provided the compensation committee with an assessment of each of the other named executive officer’s performance during the fiscal year. The maximum cash award any named executive officer could receive was 180% of his or her target bonus, taking into account each named executive officer’s individual performance multiplier. The actual percentage was determined by weighting the different goals, with EBITDA and net cash balance each being weighted at 33.3% for fiscal 2009, and with each element under the non-financial goals being weighted at 5.6%. The board of directors then determined the percentage of each goal earned in order to determine the percentage of bonus earned. For fiscal 2009, the bonus earned calculation was as follows:
| Metric weighting | Percentage of metric earned | Percentage of bonus earned | |||||||
EBITDA | 33.3 | % | 150.0 | % | 50.0 | % | |||
Net cash | 33.3 | 150.0 | 50.0 | ||||||
Non-financial | |||||||||
Sales base goal 1 | 5.6 | 100.0 | 5.6 | ||||||
Sales base goal 2 | 5.6 | 100.0 | 5.6 | ||||||
Sales stretch goal | 5.6 | 0.0 | 0.0 | ||||||
Operations base goal 1 | 5.6 | 100.0 | 5.6 | ||||||
Operations base goal 2 | 5.6 | 100.0 | 5.6 | ||||||
Operations stretch goal | 5.6 | 100.0 | 5.6 | ||||||
Information technology base goal 1 | 5.6 | 100.0 | 5.6 | ||||||
Information technology base goal 2 | 5.6 | 100.0 | 5.6 | ||||||
Information technology stretch goal | 5.6 | 100.0 | 5.6 | ||||||
Total percentage of bonus earned | 144.4 | % | |||||||
The compensation committee considered the chosen metrics to be the best indicators of financial success and stockholder value creation. We do not have a formal policy regarding adjustment or recovery of awards or payments if the relevant performance measures upon which they are based are restated or otherwise adjusted in a manner that would reduce the size of the award or payment.
For the 2009 fiscal year, the compensation committee set performance targets for annual cash bonuses at the following percentages of the base salaries for Messrs. Wasik, Zerella and Miller and Ms. Maher:
| Name | Percent of base salary (performance-based cash bonuses) | ||||||||
| Threshold(1) | Target | Maximum above target | |||||||
Henry Wasik | 62.5 | % | 75.0 | % | 112.5 | % | |||
William Zerella | 41.7 | 50.0 | 75.0 | ||||||
Bruce Miller | 41.7 | 50.0 | 75.0 | ||||||
Leah Maher | 41.7 | 50.0 | 75.0 | ||||||
| (1) | To ensure that an adequate level of performance was achieved before an executive earned a performance-based cash bonus, the threshold for payout of the financial elements of the incentive award was 87.5% of the target and for the non-financial elements was 75% of the target. |
113
Table of Contents
Our compensation committee decided on the threshold, target and maximum above-target percentages of base salary in order to provide our executives with performance-based cash compensation that was competitive with our peers and individually tailored based on the experience level of each executive officer. The final percentages were paid out based on the individual executive officer’s performance in helping the company to meet its goals and objectives for the fiscal year.
Fiscal 2009 objective achievement versus adjusted EBITDA and net cash balance targets for Messrs. Wasik, Zerella, and Miller and Ms. Maher were as follows:
Bonus objective (dollars in millions) | Threshold | Target | Maximum | Achievement | ||||||||||||
Adjusted EBITDA | $ | (10.4 | ) | $ | (9.2 | ) | $ | (8.0 | ) | $ | (4.4 | ) | ||||
Net cash balance | 17.0 | 17.0 | 18.1 | 34.8 | ||||||||||||
Mr. Wasik’s target bonus was 75% of his salary, or $293,000, Mr. Zerella’s target bonus was 50% of his salary, or $175,000, Mr. Miller and Ms. Maher’s target bonuses were 50% of salary, or $120,000. Since objective achievement versus target was 144.4%, each target bonus was multiplied by 144.4%, and then a performance multiplier of 1.20 was applied to each bonus based on a subjective assessment of each executive’s individual performance during the year. The compensation committee determined the performance multiplier for the chief executive officer. The compensation committee delegated authority to the chief executive officer to determine the performance multiplier for the other executive officers.
This resulted in total performance-based cash bonuses for Messrs. Wasik, Zerella, and Miller and Ms. Maher of $507,867, $303,333, $208,000 and $208,000, respectively. The following are some of the factors Mr. Wasik considered in determining performance multipliers for Messrs. Zerella and Miller and Ms. Maher, but these factors were not dispositive and were considered among other factors. Mr. Wasik considered Mr. Zerella’s oversight of our private placement of Series B preferred stock; accomplishment of key information technology integration objectives; focused effort on cost containment; management of our net cash position versus plan; and creation of a company-wide operational dashboard for use upon the integration of our information technology systems. For Mr. Miller’s performance multiplier, Mr. Wasik considered Mr. Miller’s execution of key corporate programs; management of engineering group budgets; organizational consolidation and efficiency improvements; completion of fiscal 2010 engineering project prioritization and budgeting processes; publishing a one year product roadmap; publishing a three year product direction document; and hiring of key engineering department personnel. Mr. Wasik considered Ms. Maher’s efforts in our integration of Legacy Force10; oversight of executive leadership tasks, including monitoring achievement of those tasks; implementation of revised executive level retention incentive agreements; coordination of initial public offering related matters; and successful reorganization of subsidiaries and branch offices. In determining Mr. Wasik’s performance multiplier, our compensation committee considered Mr. Wasik’s skill in successfully negotiating and completing our acquisition of Legacy Force10, as well as the efficient integration of the two companies.
Mr. Hanley did not participate in the performance-based cash bonus plan, rather he received a cash bonus in the form of sales commissions under our sales compensation plan for fiscal 2009. Mr. Hanley earned sales commissions of $181,045 in fiscal 2009. His sales commissions were earned based upon our achievement of worldwide sales quotas based on non-GAAP revenue. We do not disclose our specific sales quotas since such disclosure would result in competitive harm to
114
Table of Contents
us. We established the worldwide sales quotas under Mr. Hanley’s sales compensation plan for fiscal 2009 at an amount we believed would be reasonably possible to achieve, thus making it reasonably possible for Mr. Hanley to earn his target commission. Exceeding the target sales quotas would be progressively more difficult, making it more difficult for Mr. Hanley to earn higher commissions.
In addition, in January 2010, our compensation committee awarded Ms. Maher a discretionary $45,000 cash bonus for superior performance in fiscal 2009. This bonus was not pursuant to the performance-based cash bonus plan described above. The compensation committee did not conduct any benchmarking or other competitive compensation analysis to determine the size of or whether to pay the bonus, rather it determined that Ms. Maher had not been appropriately rewarded for her exceptional performance during the year (particularly related to our integration of Legacy Force10, oversight of executive leadership tasks, implementation of revised executive level retention incentive agreements, coordination of matters related to this offering, and successful reorganization of subsidiaries and branch offices) and that $45,000 was an appropriate amount to recognize her efforts. In February 2010, our compensation committee approved corporate housing expense reimbursements for Mr. Zerella pursuant to the terms of his employment agreement. For fiscal 2009, Mr. Zerella received $20,048 for the cost of his corporate housing, $8,019 as a net tax equalization payment, $5,346 as a gross-up payment to cover the taxes on his net tax equalization payment and $5,000 to cover his tax return and review fees.
Long-term equity incentive awards. We utilize long-term equity incentive awards in the form of options to purchase our common stock to ensure that our executive officers have a continuing stake in our long-term success. Because our named executive officers are awarded stock options with an exercise price equal to the fair market value of our common stock on the date of grant, these options will have value to our executive officers only if the market price of our common stock increases after the date of grant. Typically, stock options for newly-hired executives vest over 48 months with 1/4 of the shares vesting on the first anniversary of the date of hire, and the remainder vesting in equal installments over the next 36 months. The stock options we granted to executive officers under our 2007 equity incentive plan may be exercised by the recipient at any time; however, any shares purchased are subject to a lapsing right of repurchase in our favor. This repurchase right lapses on the same schedule as the vesting of the option.
Authority to grant stock options to executive officers has been delegated to our compensation committee. In determining the size of stock option grants to executive officers, our compensation committee considers comparative equity ownership data of executive officers in equivalent positions at our peer group companies, the scope of responsibility of the executive officer, the value of existing equity awards held by the executive officer, our performance against our strategic plan, the executive officer’s performance against his or her objectives and the recommendations of our chief executive officer and other members of management.
On August 14, 2009, we completed our stock option exchange, which was designed to cancel out-of-the-money stock options in exchange for the issuance of new stock options with lower exercise prices and a revised vesting schedule. Most of our employees and consultants holding out of the money stock options were eligible to participate in the stock option exchange. The exercise price for the new stock options was $0.06 per share, which was determined to be the fair market value of our common stock on the date of grant, August 14, 2009. We did not use a set exchange ratio, but instead we granted new options based on the optionee’s level of responsibility and merit, as determined by the optionee’s direct supervisor, or in the case of our chief executive officer, as determined by our board of directors. The vesting period for the new
115
Table of Contents
stock options varied between two to four years based upon prior years of service, except with respect to a grant to a non-employee director, and commenced on April 1, 2009, the day after our acquisition of Legacy Force10 was completed. We believed that re-starting the vesting for new stock options granted under the stock option exchange would provide us with significant value by enhancing our ability to offer long-term employee retention benefits. We proposed the stock option exchange because of our belief that re-purposing already issued stock options with a lower exercise price and resetting the relative ownership of stock options and vesting terms, would more cost-effectively provide retention and economic incentives to our employees in comparison to simply issuing incremental equity awards or paying additional cash compensation. We also believed that as we integrated Legacy Force10, it was the appropriate time to reset equity ownership to reflect current and future employee contributions to our business. The stock option exchange enabled us to leverage our out-of-the-money stock options for the purposes for which they were originally intended, namely, to motivate and retain employees.
Messrs. Wasik, Zerella and Miller and Ms. Maher participated in our stock option exchange, each exchanging all of the option awards he or she held in exchange for the following stock option awards:
| Name | Number of shares subject to new option | |
Henry Wasik | 1,178,800 | |
William Zerella | 707,280 | |
Bruce Miller | 294,720 | |
Leah Maher | 147,360 | |
Mr. Hanley was not eligible to participate in our stock option exchange program since he did not hold any of our stock options. However, we made initial equity grants to new employees joining us after our acquisition of Legacy Force10, and in connection with these grants, Mr. Hanley received an option to purchase 707,280 shares of our common stock with an exercise price of $0.06. The size of Mr. Hanley’s initial equity award was negotiated with him in connection with his joining our company at the time of our acquisition of Legacy Force10. Mr. Hanley negotiated an equity award based on the number of shares underlying the option to be awarded to our chief executive officer at the time of the initial option grants awarded to employees of the combined company.
Retention incentive benefits. On December 4, 2009, our compensation committee, after consultation with Compensia, approved forms of retention incentive agreements for our executive officers, including the named executive officers. The retention incentive agreements provide our executive officers with specified termination benefits and replace any existing severance agreements with those executive officers. The retention incentive agreements were adopted in an effort to establish consistency in our executive severance practices, to encourage retention of our executive talent, to ensure that our severance practices are consistent with severance practices at our peers and consistent with best practices, to align the interests of our executive officers with our stockholders, to reduce distractions associated with potential transactions or terminations of employment and to motivate our executive officers to drive business success independent of the possible occurrence of any change of control transaction. The benefits provided under the retention incentive agreements for each of our named executive officers are described below under “—Potential payments upon termination or change of control.”
116
Table of Contents
In July 2004, we adopted an acquisition bonus plan as an additional employee retention tool. Pursuant to the terms of the plan, if we are acquired in a transaction with aggregate sale proceeds of at least $80 million, then at least ten percent of the sale proceeds would be distributed as cash bonus payments to the holders of our acquisition bonus plan units. The bonus payout for each individual will depend on the number of units held. Our named executive officers currently hold 267,900 units, which represents 26.8% of the one million units outstanding. For more information on the units held by our named executive officers, please see the grants of plan based awards table below. The acquisition bonus plan will terminate upon the completion of this offering and all grants made under the plan will be cancelled.
Other benefits. Executive officers are eligible to participate in all of our employee benefit plans, such as medical, dental, vision, group life, disability, and accidental death and dismemberment insurance and our 401(k) plan, in each case on the same basis as other employees, subject to applicable law. We also provide vacation and other paid holidays to all employees, including our executive officers.
Accounting and tax implications. We account for equity compensation paid to our employees under ASC 718, which requires us to estimate and record an expense over the service period of the award. Our cash compensation is recorded as an expense at the time the obligation is accrued.
After completion of this offering, as a publicly-held company we will not be permitted a federal income tax deduction for compensation paid to certain executive officers to the extent that compensation exceeds $1.0 million per covered officer in any year. The limitation applies only to compensation that is not performance based. Non-performance based compensation paid to our executive officers for fiscal 2009 did not exceed the $1.0 million limit per officer and the compensation committee does not anticipate that the non-performance based compensation to be paid to executive officers for the 2010 fiscal year will be in excess of the deductible limit.
The compensation committee believes that in establishing the cash and equity incentive compensation programs for the company’s executive officers, the potential deductibility of the compensation payable under those programs should be only one of a number of relevant factors taken into consideration, and not the sole governing factor. For that reason the compensation committee may deem it appropriate to provide one or more executive officers with the opportunity to earn incentive compensation, whether through cash incentive award programs tied to the company’s financial performance or equity incentive grants tied to the executive officer’s continued service, which may be in excess of the amount deductible by reason of Section 162(m) or other provisions of the Internal Revenue Code. The compensation committee believes it is important to maintain cash and equity incentive compensation at the requisite level to attract and retain the executive officers essential to the company’s financial success, even if all or part of that compensation may not be deductible by reason of the Section 162(m) limitation.
Also, the compensation committee takes into account whether components of our compensation will be adversely impacted by the penalty tax associated with Section 409A of the Internal Revenue Code, and aims to structure the elements of compensation to be compliant with or exempt from Section 409A to avoid such potential adverse tax consequences.
117
Table of Contents
2009 summary compensation table
The following table provides information for the fiscal year ended September 30, 2009 regarding the compensation of our principal executive officer, principal financial officer, and each of our three other most highly compensated persons serving as executive officers as of September 30, 2009.
| Name and principal position | Salary | Bonus | Option awards(1) | Non-equity incentive plan compensation(2) | All other compensation | Total | |||||||||||||
Henry Wasik President and Chief Executive Officer | $ | 390,000 | $ | — | $ | 38,559 | $ | 507,867 | $ | 2,704,757 | (3) | $ | 3,641,183 | ||||||
William Zerella Chief Financial Officer | 350,000 | — | 23,135 | 303,333 | 38,413 | (3) | 714,881 | ||||||||||||
James Hanley President, Field Operations | 120,000 | — | 23,135 | 181,045 | 3,236,000 | (3) | 3,560,180 | ||||||||||||
Bruce Miller(4) Former Chief Technology Officer | 240,000 | — | 9,903 | 208,000 | 539,333 | (3) | 997,236 | ||||||||||||
Leah Maher Vice President and General Counsel | 240,000 | 45,000 | 4,820 | 208,000 | 539,333 | (3) | 1,037,153 | ||||||||||||
| (1) | The amounts in this column represent the fair value of the awards on the date of grant, and the incremental fair value of the awards as of the repricing or modification date, computed in accordance with ASC 718. See note 6 to the notes to our consolidated financial statements for a discussion of our assumptions in determining the ASC 718 values of our option awards. |
| (2) | With the exception of the amount for Mr. Hanley, the amounts in this column represent total performance-based cash bonuses earned during fiscal 2009. These bonuses were based on our performance and the individual’s performance against specified objectives as further described under “Executive compensation—Compensation discussion and analysis—Performance-based cash bonuses.” Mr. Hanley received this amount for sales commissions earned in fiscal 2009. |
| (3) | The amount for Mr. Zerella includes $20,048 for the cost of his corporate housing, $8,019 as a net tax equalization payment, $5,346 as a gross-up payment to cover the taxes on his net tax equalization payment and $5,000 to cover his tax return and review fees. These payments were made to Mr. Zerella pursuant to the terms of his employment agreement and were approved by our compensation committee in February 2010. The amounts in this column for our other named executive officers represent target payouts under our acquisition bonus plan for acquisition bonus plan units granted during fiscal 2009 and assume we are acquired in a transaction with proceeds that would result in an acquisition bonus plan pool value of $53.9 million, which was calculated based on our October 1, 2009 valuation. During fiscal 2009, we granted our named executive officers the following number of acquisition bonus plan units: Mr. Wasik (50,150 units); Mr. Hanley (60,000 units); Mr. Miller (10,000 units) and Ms. Maher (10,000 units). The acquisition bonus plan will terminate upon completion of the offering. See note 6 to the “Grants of plan-based awards for year ended September 30, 2009” table for a further description of the calculation of payments under this plan. |
| (4) | Mr. Miller ceased employment with us on May 3, 2010. |
In October 2009, Mr. Wasik was granted two performance-based stock option grants subject to performance criteria based on our financial performance for our second half of fiscal 2009 and subject to performance criteria based on our financial performance in our first quarter of fiscal 2010. Our compensation committee granted these options to Mr. Wasik as a bonus for our 2009 financial performance, including for exceeding the performance-based metrics related to the first award, which consisted of achievement of second half of fiscal 2009 revenue of $89.0 million and net cash balance of $27.0 million. The performance criteria for the second award was achievement of positive EBITDA in the first quarter of fiscal 2010, using the same definition of EBITDA as we used for our performance-based cash bonuses awarded to our executive officers, which is further described under “Executive compensation—Compensation discussion and analysis—Performance-based cash bonuses.” Since the performance criteria for the options have been met, the options now vest quarterly on or after January 1, 2011 as to 1/16 of the total number of shares subject to the options on February 15, May 15, August 15 and November 15 of
118
Table of Contents
each year. The unvested options are not exercisable before they vest and shall be forfeited on December 31 of the calendar year in which they vest if not exercised on or prior to such time. The options have an exercise price of $0.06 per share, with 490,450 shares underlying the first option, and 245,225 shares underlying the second option. The options were originally granted for 692,400 shares and 346,200 shares, respectively, vesting in equal monthly installments over 48 months from October 2009; however, in February 2010, the compensation committee determined to cancel the portions of the options to acquire shares that were currently vested and that would otherwise vest in 2010, and Mr. Wasik agreed to forfeit the cancelled shares.
Grants of plan-based awards for year ended September 30, 2009
The following table provides information regarding grants of plan-based awards to each of our named executive officers during fiscal 2009.
| Estimated future payouts under non-equity incentive plan awards | |||||||||||||||||||||
| Name | Grant date | Threshold | Target | Maximum | All other option awards: number of securities underlying options(1) | Exercise or base price of option awards (per share)(2) | Grant date fair value of stock and option awards(3) | ||||||||||||||
Henry Wasik | 8/14/09 | $ | — | $ | — | $ | — | 1,178,800 | (4) | $ | 0.06 | $ | 38,559 | ||||||||
| 243,750 | 293,000 | (5) | 526,500 | — | — | — | |||||||||||||||
| — | 2,704,757 | (6) | — | — | — | — | |||||||||||||||
William Zerella | 8/14/09 | — | — | — | 707,280 | (4) | 0.06 | 23,135 | |||||||||||||
| 145,950 | 175,000 | (5) | 315,000 | — | — | — | |||||||||||||||
James Hanley | 8/14/09 | — | — | — | 707,280 | (4) | 0.06 | 23,135 | |||||||||||||
| — | 3,236,000 | (6) | — | — | — | — | |||||||||||||||
Bruce Miller | 8/14/09 | — | — | — | 294,720 | (7) | 0.06 | 9,903 | |||||||||||||
| 100,080 | 120,000 | (5) | 216,000 | — | — | — | |||||||||||||||
| — | 539,333 | (6) | — | — | — | — | |||||||||||||||
Leah Maher | 8/14/09 | — | — | — | 147,360 | (8) | 0.06 | 4,820 | |||||||||||||
| 100,080 | 120,000 | (5) | 216,000 | — | — | — | |||||||||||||||
| — | 539,333 | (6) | — | — | — | — | |||||||||||||||
| (1) | Each option grant was made pursuant to our 2007 equity incentive plan, is immediately exercisable in full and expires ten years from the date of grant. |
| (2) | Represents the fair market value of a share of our common stock on the date of grant, as determined by our board of directors. |
| (3) | The amounts in this column represent the fair value of awards on the date of grant, and the incremental fair value of the awards as of the repricing or modification date, computed in accordance with ASC 718. See note 6 to the notes to our consolidated financial statements for a discussion of our assumptions in determining the ASC 718 values of our option awards. |
| (4) | The options granted to Messrs. Wasik, Zerella and Hanley were immediately exercisable in full and vested as to 1/4 of the shares underlying the option on April 1, 2010 and will vest as to 1/24 of the underlying shares monthly thereafter. |
| (5) | Represents target performance-based cash bonuses established for fiscal 2009. For a description of these bonuses, see “—Compensation discussion and analysis—Performance-based cash bonuses.” Mr. Hanley has a sales commission plan, rather than a performance-based cash bonus plan. The actual amounts earned by the named executive officers are disclosed in the summary compensation table under the column titled “Non-equity incentive plan compensation.” |
| (6) | Represents target possible payouts under our acquisition bonus plan for acquisition bonus plan units granted during fiscal 2009. The dollar amounts listed in this column reflect the target payout amounts assuming we are acquired in a transaction with proceeds that would result in an acquisition bonus plan pool value of $53.9 million, which was calculated based on our October 1, 2009 valuation. There would be no payout if we were acquired for $80 million or less and there is no maximum payout amount. The target possible payout amount also assumes 100% vesting of the acquisition bonus plan units held by our named executive officers. As of September 30, 2009, our named executive officers held the following number of acquisition bonus plan units: Mr. Wasik (140,150 units); Mr. Zerella (50,000 units); Mr. Hanley (60,000 units); Mr. Miller (10,000 units) and Ms. Maher (10,000 units). Mr. Miller forfeited his acquisition bonus plan units when his employment with us ceased |
119
Table of Contents
on May 3, 2010. These acquisition bonus plan units vest 1/2 upon the closing of an acquisition of our company, with the remaining units vesting six months from the closing or with vesting accelerating in full if the named executive officer is terminated without cause or resigns for good reason within six months of the closing. Ms. Maher will receive full acceleration of vesting on her acquisition bonus plan units and Mr. Wasik will receive full acceleration of 50,150 of his units, if he or she is terminated without cause or resigns for good reason within 90 days before we are acquired. Messrs. Zerella and Hanley will receive full acceleration of vesting for their acquisition bonus plan units, and Mr. Wasik will receive full acceleration of 90,000 of his units, if he is terminated without cause or resigns for good reason at any time before we are acquired. The acquisition bonus plan will terminate upon the completion of this offering and all grants made under the plan will be cancelled. |
| (7) | The option granted to Mr. Miller was immediately exercisable in full and vested as to 1/4 of the shares underlying the option on April 1, 2010 and vested as to 1/40 of the underlying shares monthly thereafter. |
| (8) | The option granted to Ms. Maher was immediately exercisable in full and vested as to 1/4 of the shares underlying the option on April 1, 2010 and will vest as to 1/32 of the underlying shares monthly thereafter. |
Outstanding equity awards at September 30, 2009
The following table presents certain information concerning outstanding equity awards held by each of our named executive officers as of September 30, 2009.
| Option awards | |||||||||
| Name | Number of securities underlying unexercised options exercisable(1) | Equity incentive plan awards: number of securities underlying unexercised unearned options(2) | Option exercise price(3) | Option expiration date | |||||
Henry Wasik | 1,178,800 | 1,178,800 | $ | 0.06 | 8/13/2019 | ||||
William Zerella | 707,280 | 707,280 | 0.06 | 8/13/2019 | |||||
James Hanley | 707,280 | 707,280 | 0.06 | 8/13/2019 | |||||
Bruce Miller | 294,720 | 294,720 | 0.06 | 8/13/2019 | |||||
Leah Maher | 147,360 | 147,360 | 0.06 | 8/13/2019 | |||||
| (1) | Represents options to purchase shares of our common stock granted to each of our named executive officers under our 2007 equity incentive plan on August 14, 2009. The grants to Messrs. Wasik, Zerella and Miller and Ms. Maher were made pursuant to our stock option exchange program, which is further described above under “—Compensation discussion and analysis—Long-term equity incentive awards.” Each of the options granted to our named executive officers on August 14, 2009 was immediately exercisable in full. |
| (2) | The options granted to Messrs. Wasik, Zerella and Hanley vested as to 1/4 of the shares underlying the option on April 1, 2010 and will vest as to 1/24 of the underlying shares monthly thereafter. The option granted to Mr. Miller vested as to 1/4 of the shares underlying the option on April 1, 2010 and vested as to 1/40 of the underlying shares monthly thereafter, and the option granted to Ms. Maher vested as to 1/4 of the shares underlying the option on April 1, 2010 and will vest as to 1/32 of the underlying shares monthly thereafter. |
| (3) | Represents the fair market value of a share of our common stock on the date of grant, as determined by our board of directors. |
Option exercises and stock vested during fiscal 2009
None of our named executive officers exercised stock options or held shares of our stock that vested during fiscal 2009.
Potential payments upon termination or change of control
We have retention incentive agreements that require specific payments and benefits to be provided to our named executive officers in the event of termination of employment. The description and table that follow describe the payments and benefits that may be owed by us to each of our named executive officers upon the named executive officer’s termination under certain circumstances.
120
Table of Contents
The retention incentive agreements with each of our named executive officers generally provide that, if we terminate the named executive officer’s employment other than for Cause (as defined below), for death or disability or if the named executive officer terminates his or her employment for Good Reason (as defined below):
| • | we must pay the named executive officer any base salary and accrued vacation earned but not paid or used through the date of the named executive officer’s termination; |
| • | the vesting of all of the named executive officer’s outstanding equity awards will cease on the date of the named executive officer’s termination and all or a portion of the named executive officer’s unvested equity awards will accelerate, as specified in the named executive officer’s retention incentive agreement described below; and |
| • | the named executive officer may receive a lump sum severance payment and continued coverage under our benefit plans for a specified period of time. |
In the event any payment to one of our named executive officers under his or her retention incentive agreement pursuant to termination in connection with a Change of Control (as defined below) is subject to the excise tax imposed by Section 4999 of the Internal Revenue Code (as a result of a payment being classified as a parachute payment under Section 280G of the Internal Revenue Code), the named executive officer will be entitled to receive such payment as would entitle him or her to receive the greatest after tax benefit of either the full payment or a lesser payment which would result in no portion of such severance benefits being subject to excise tax.
For the purpose of these retention incentive agreements:
“Change of Control” means the occurrence of any of the following events:
| • | the consummation of a merger or consolidation of our company, other than a merger or consolidation which would result in the voting securities of our company outstanding immediately prior to the consummation of such merger or consolidation continuing to represent more than 50% of the total voting power represented by the voting securities of our company or of such surviving entity or its parent that are outstanding immediately after such merger or consolidation; |
| • | the sale or other disposition of all or substantially all of our assets; or |
| • | any “person” (as such term is used in Sections 13(d) and 14(d) of the Securities Exchange Act of 1934, or the Exchange Act) becoming the “beneficial owner” (as defined in Rule 13d-3 under the Exchange Act), directly or indirectly, of securities of our company representing 50% or more of the total voting power represented by all our then outstanding voting securities. |
“Cause” means any of the following: the named executive officer’s conviction of or plea of nolo contendere to a felony or a crime involving moral turpitude; an act by the named executive officer which constitutes gross misconduct in the performance of his or her employment obligations and duties; the named executive officer’s act of fraud against us or any of our affiliates; the named executive officer’s theft or misappropriation of our property (including without limitation intellectual property) of material value of us or our affiliates; material breach by the named executive officer of any confidentiality agreement with, or duties of confidentiality to, us or any of our affiliates that involves the named executive officer’s wrongful disclosure of our material confidential or proprietary information (including without limitation trade secrets or other intellectual property) of us or of any of our affiliates; and named executive officer’s
121
Table of Contents
continued material violation of named executive officer’s employment obligations and duties to us (other than due to the named executive officer’s death or disability) after we have delivered to the named executive officer a written notice of such violation that describes the basis for our belief that such violation has occurred and the named executive officer has not substantially cured such violation within 30 calendar days after we give such written notice.
“Good Reason” means: the named executive officer’s resignation or other voluntary termination by the named executive officer of his or her employment with us with an effective date that is not later than 60 days following the occurrence of a Good Reason Event (as defined below) after written notice of such Good Reason Event(s) by the named executive officer which the company has failed to cure within 30 days of receiving notice.
“Good Reason Event” means any of the following events without the named executive officer’s express written consent:
| • | a material reduction of the named executive officer’s duties, position or responsibilities relative to his or her duties, position or responsibilities in effect immediately prior to the reduction, unless the named executive officer is provided with comparable duties, position and responsibilities. A reduction in duties, position or responsibilities solely by virtue of our being acquired and made part of a larger entity shall not constitute a Good Reason Event, except that for Mr. Wasik it will be considered a Good Reason Event if Mr. Wasik is not made the chief executive officer of the acquiring corporation; |
| • | the reduction of the named executive officer’s then current annual base salary or annual target bonus, in either case by 10% or more (other than in connection with a general decrease in the base salary or annual target incentive compensation of similarly situated employees); or |
| • | the relocation of the named executive officer’s principal work location to a facility or a location that is more than 50 miles from the named executive officer’s then-current principal work location and increases the named executive officer’s commute by more than 25 miles from his or her prior principal work location. |
Severance terms for Mr. Wasik
Not in connection with a change of control. In the event that Mr. Wasik is terminated other than for Cause, death or disability, and the termination is not in connection with a Change of Control, then, after the execution and non-revocation of a general release of claims in favor of us, which will not include any release of claims with respect to which Mr. Wasik is entitled to indemnification from us, Mr. Wasik will be entitled to receive the following:
| • | a lump sum severance payment equal to 12 months of his base salary in effect immediately prior to his termination; |
| • | coverage for a period of 12 months for himself and his eligible dependents under COBRA; and |
| • | 1/2 of his unvested equity awards will immediately vest and become exercisable. |
In the event that Mr. Wasik is terminated for death or disability, 1/2 of his unvested equity awards will immediately vest and become exercisable.
In connection with a change of control. In the event that Mr. Wasik is terminated other than for Cause, death or disability, or if he terminates his employment for Good Reason, and the termination is within a two-month period before or a 12-month period after a Change of
122
Table of Contents
Control, then, after the execution and non-revocation of a general release of claims in favor of us, which will not include any release of claims with respect to which Mr. Wasik is entitled to indemnification from us, Mr. Wasik will be entitled to receive the following:
| • | a lump sum severance payment equal to 18 months of his base salary in effect immediately prior to his termination; |
| • | coverage for a period of 12 months for himself and his eligible dependents under COBRA; and |
| • | all of his unvested equity awards will immediately vest and become exercisable in full. |
Severance terms for Mr. Hanley
Not in connection with a change of control. In the event that Mr. Hanley is terminated other than for Cause, death or disability, and the termination is not in connection with a Change of Control, then, after the execution and non-revocation of a general release of claims in favor of us, which will not include any release of claims with respect to which Mr. Hanley is entitled to indemnification from us, Mr. Hanley will be entitled to receive the following:
| • | a lump sum severance payment equal to 12 months of his base salary in effect immediately prior to his termination; and |
| • | coverage for a period of six months for himself and his eligible dependents under COBRA. |
In connection with a change of control. In the event that Mr. Hanley is terminated other than for Cause, death or disability, or if he terminates his employment for Good Reason, and the termination is within a two-month period before or a 12-month period after a Change of Control, then, after the execution and non-revocation of a general release of claims in favor of us, which will not include any release of claims with respect to which Mr. Hanley is entitled to indemnification from us, Mr. Hanley will be entitled to receive the following:
| • | a lump sum severance payment equal to 12 months of his base salary in effect immediately prior to his termination; |
| • | coverage for a period of six months for himself and his eligible dependents under COBRA; and |
| • | 1/2 of his unvested equity awards will immediately vest and become exercisable. |
Severance terms for Messrs. Zerella and Miller and Ms. Maher
Not in connection with a change of control. Pursuant to the retention incentive agreements, in the event that we terminate the employment of Messrs. Zerella or Miller or Ms. Maher other than for Cause, death or disability, and the termination is not in connection with a Change of Control, then, after the execution and non-revocation of a general release of claims in favor of us, which will not include any release of claims with respect to which the named executive officer is entitled to indemnification from us, Messrs. Zerella or Miller or Ms. Maher will be entitled to receive the following:
| • | a lump sum severance payment equal to six months of his or her base salary in effect immediately prior to his or her termination; and |
| • | coverage for a period of six months for Messrs. Zerella or Miller or Ms. Maher and his or her eligible dependents under COBRA. |
Mr. Miller ceased employment with us on May 3, 2010, and will be entitled to receive these benefits. In the event that Messrs. Zerella or Miller or Ms. Maher is terminated for death or disability, 1/4 of the shares subject to his or her restricted stock held pursuant to early exercises of stock options granted on August 14, 2009 will immediately vest.
123
Table of Contents
In connection with a change of control. In the event that we terminate the employment of Messrs. Zerella or Miller or Ms. Maher other than for Cause, death or disability, or if Messrs. Zerella or Miller or Ms. Maher terminates his or her employment for Good Reason, and the termination is within a two-month period before or a 12-month period after a Change of Control, then, after the execution and non-revocation of a general release of claims in favor of us, which will not include any release of claims with respect to which the named executive officer is entitled to indemnification from us, Messrs. Zerella or Miller or Ms. Maher will be entitled to receive the following:
| • | a lump sum severance payment equal to six months of his or her base salary in effect immediately prior to his or her termination; |
| • | coverage for a period of six months for Messrs. Zerella or Miller or Ms. Maher and his or her eligible dependents under COBRA; and |
| • | 1/2 of his or her unvested equity awards will immediately vest and become exercisable. |
Fiscal 2009 potential payments upon termination or change of control
The following table shows the amounts each of our named executive officers would receive in the event of his or her termination following a Change of Control, or upon certain other events, assuming the termination took place on September 30, 2009, the last business day of our most recently completed fiscal year.
| Name | Benefits(1) | More than two months before | Within two months before change of control | |||||
Henry Wasik | Severance payment | $ | 390,000 | $ | 585,000 | |||
| Continuation of medical benefits | 19,298 | 19,298 | ||||||
| Equity acceleration(2) | ||||||||
William Zerella | Severance payment | 175,000 | 175,000 | |||||
| Continuation of medical benefits | 9,649 | 9,649 | ||||||
| Equity acceleration(2) | ||||||||
James Hanley | Severance payment | 240,000 | 240,000 | |||||
| Continuation of medical benefits | 9,649 | 9,649 | ||||||
| Equity acceleration(2) | ||||||||
Leah Maher | Severance payment | 120,000 | 120,000 | |||||
| Continuation of medical benefits | 3,126 | 3,126 | ||||||
| Equity acceleration(2) | ||||||||
| (1) | Payments under our acquisition bonus plan are not included in this table since the acquisition bonus plan will terminate upon the completion of this offering. For information on potential payments to our named executive officers under the acquisition bonus plan, see note 3 to the “Summary compensation table.” |
| (2) | Calculated based on the assumed IPO price of $ per share, which is the midpoint of the price range set forth on the cover page of this prospectus. |
124
Table of Contents
Employee benefit plans
2010 equity incentive plan
Background. Our 2010 equity incentive plan, or the 2010 plan, will serve as the successor equity compensation plan to our 2007 equity incentive plan. Our board of directors adopted our 2010 plan in March 2010 and our stockholders approved the 2010 plan in May 2010. Our 2010 plan will become effective on the date of our IPO and will terminate in , 2020. Our 2010 plan provides for the grant of incentive stock options, nonqualified stock options, restricted stock awards, stock appreciation rights, restricted stock units and stock bonuses.
Administration. Our 2010 plan will be administered by our compensation committee. As the plan administrator, the committee will determine which individuals are eligible to receive awards under our 2010 plan, the time or times when such awards are to be made, the number of shares subject to each such award, the status of any granted option as either an ISO or an NSO under United States federal tax laws, the vesting schedule applicable to an award and the maximum term for which any award is to remain outstanding (subject to the limits set forth in our 2010 plan). The committee will also determine the exercise price of options granted, the purchase price for rights to purchase restricted stock and, if applicable, restricted stock units, and the strike price for stock appreciation rights. Unless the committee provides otherwise, our 2010 plan does not allow for the transfer of awards and only the recipient of an award may exercise an award during his or her lifetime.
Share reserve. We have reserved shares of our common stock for issuance under our 2010 plan plus:
| • | all shares of our common stock reserved under our 2007 equity incentive plan that are not issued or subject to outstanding grants as of the completion of this offering; |
| • | any shares of our common stock issued under our 2007 equity incentive plan or 1999 stock plan that are forfeited or repurchased by us at the original purchase price; and |
| • | any shares issuable upon exercise of options granted under our 2007 equity incentive plan or 1999 stock plan that expire without having been exercised in full. |
Additionally, our 2010 plan provides for automatic increases in the number of shares available for issuance under it as follows:
| • | on January 1, 2011, the number of shares of our common stock available for issuance under our 2010 plan will be automatically increased by an amount equal to the product of 5% of the number of shares of our common stock issued and outstanding on December 31, 2010 multiplied by a fraction, the numerator of which is the number of days between the completion of this offering and December 31, 2010 and the denominator of which is 365; |
| • | on each January 1 from 2012 through 2020, the number of shares of our common stock available for issuance under our 2010 plan will be increased by 5% of the number of shares of our common stock issued and outstanding on the preceding December 31; or |
| • | a lesser number of shares of our common stock as determined by our board of directors. |
125
Table of Contents
Equity awards. Our 2010 plan permits us to grant the following types of awards:
Stock options. Our 2010 plan provides for the grant of ISOs to employees, and NSOs to employees, directors and consultants. Options may be granted with terms determined by the committee, provided that ISOs are subject to statutory limitations. The committee determines the exercise price for a stock option, within the terms and conditions of our 2010 plan and applicable law, provided that the exercise price of an ISO may not be less than 100% (or higher in the case of certain recipients of ISOs) of the fair market value of our common stock on the date of grant. ISOs exercisable for no more than shares may be granted over the life of our 2010 plan. Options granted under our 2010 plan will vest at the rate specified by the committee and such vesting schedule will be set forth in the stock option agreement to which such stock option grant relates. Generally, the committee determines the term of stock options granted under our 2010 plan, up to a term of ten years, except in the case of certain ISOs.
After termination of an optionee, he or she may exercise his or her vested option for the period of time stated in the stock option agreement to which such option relates, up to a maximum of five years from the date of termination. Generally, if termination is due to death or disability, the vested option will remain exercisable for 12 months. In all other cases, the vested option will generally remain exercisable for three months. However, an option may not be exercised later than its expiration date.
Notwithstanding the foregoing, if an optionee is terminated for cause (as defined in our 2010 plan), then the optionee’s options will expire on the optionee’s termination date or at such later time and on such conditions as determined by our compensation committee.
Restricted stock. A restricted stock award is an offer by us to sell shares of our common stock subject to restrictions that the committee may impose. These restrictions may be based on completion of a specified period of service with us or upon the completion of performance goals during a performance period. The price of a restricted stock award will be determined by the committee. Unless otherwise determined by the committee at the time of award, vesting ceases on the date the participant no longer provides services to us and unvested shares are forfeited to us or subject to repurchase by us.
Stock appreciation rights. Stock appreciation rights provide for a payment, or payments, in cash or shares of common stock, to the holder based upon the difference between the fair market value of our common stock on the date of exercise and the stated exercise price. Stock appreciation rights may vest based on time or achievement of performance conditions.
Restricted stock units. Restricted stock units represent the right to receive shares of our common stock at a specified date in the future, subject to forfeiture of such right due to termination of employment or failure to achieve specified performance conditions. If the restricted stock unit has not been forfeited, then on the date specified in the restricted stock unit agreement, we will deliver to the holder of the restricted stock unit whole shares of our common stock, cash or a combination of our common stock and cash.
Stock bonuses. Stock bonuses are granted as additional compensation for performance and therefore are not issued in exchange for cash.
Change in control. In the event of a liquidation, dissolution or corporate transaction (as defined in our 2010 plan), except for options granted to non-employee directors (which vest and become exercisable in full upon a change in control event (as defined in our 2010 plan)), outstanding awards may be assumed or replaced by any successor company. Outstanding awards that are not assumed or replaced by any successor company will expire on the consummation of
126
Table of Contents
the liquidation, dissolution or change in control transaction at such time and on such conditions as our board of directors determines (including, without limitation, full or partial vesting and exercisability of any or all outstanding awards issued under our 2010 plan).
Transferability of awards. Generally, a participant may not transfer an award other than by will or the laws of descent and distribution unless, in the case of awards other than ISOs, the committee permits the transfer of an award to certain authorized transferees (as set forth in our 2010 plan).
Eligibility. The individuals eligible to participate in our 2010 plan include our officers and other employees, our non-employee directors and any consultants.
Payment for purchase of shares of our common stock. Payment for shares of our common stock purchased pursuant to our 2010 plan may be made by any of the following methods (provided such method is permitted in the applicable award agreement to which such shares relate): (1) cash (including by check); (2) cancellation of indebtedness; (3) surrender of shares; (4) waiver of compensation due or accrued for services rendered; (5) through a “same day sale” program or through a “margin” commitment; or (6) by any other method approved by our board of directors.
Limit on Awards. Under our 2010 plan, during any calendar year, no person will be eligible to receive more than shares of our common stock, and in the case of new employees during their first fiscal year of employment with us, shares of our common stock.
Amendment and Termination. Our board of directors may amend or terminate our 2010 plan at any time, subject to stockholder approval where required. In addition, no amendment that is detrimental to a participant in our 2010 plan may be made to an outstanding award without the consent of the affected participant.
1999 stock plan
Our board of directors adopted and our stockholders approved our 1999 stock option plan in September 1999. As of March 31, 2010, options to purchase 1,450 shares of our common stock were outstanding under our 1999 stock plan. This plan terminated in March 2007, and no additional options may be granted under this plan. Following the closing of this offering, all shares of our common stock subject to options that have expired or otherwise terminated under our 1999 stock plan without having been exercised in full will become available for issuance under our 2010 plan. However, all stock options outstanding on the termination of the 1999 stock plan will continue to be governed by the terms and conditions of the 1999 stock plan. Options granted under the 1999 stock plan are subject to terms substantially similar to those described above with respect to options granted under the 2010 plan.
2007 equity incentive plan
Our board of directors adopted and our stockholders approved our 2007 equity incentive plan in January 2007. As of March 31, 2010, options to purchase 7,278,973 shares of our common stock were outstanding under our 2007 equity incentive plan. Following the closing of this offering, all shares of our common stock reserved but not ultimately issued or subject to options that have expired or otherwise terminated under our 2007 equity incentive plan without having been exercised in full will become available for issuance under our 2010 plan. We intend to grant all future equity awards under our 2010 plan upon and after the closing of this offering. However,
127
Table of Contents
all stock options outstanding upon the completion of this offering will continue to be governed by the terms and conditions of the 2007 equity incentive plan. Options granted under the 2007 equity incentive plan are subject to terms substantially similar to those described above with respect to options granted under the 2010 plan.
2010 employee stock purchase plan
Background. Our 2010 employee stock purchase plan is designed to enable eligible employees to periodically purchase shares of our common stock at a discount. Purchases are accomplished through participation in discrete offering periods. Our 2010 employee stock purchase plan is intended to qualify as an employee stock purchase plan under Section 423 of the Internal Revenue Code. Our board of directors adopted our 2010 employee stock purchase plan in , 2010 and our stockholders approved the plan in , 2010.
Share reserve. We have initially reserved shares of our common stock for issuance under our 2010 employee stock purchase plan. The number of shares reserved for issuance under our 2010 employee stock purchase plan will increase automatically on the first day of each January, starting with January 1, 2011, by the number of shares equal to % of our total outstanding shares as of the immediately preceding December 31st (rounded to the nearest whole share; provided, however, that, for the increase on January 1, 2011, such addition shall equal the product of % of our total outstanding shares as of December 31, 2010, multiplied by a fraction, the numerator of which is the number of days between the effective date of this registration statement and December 31, 2010 and the denominator of which is 365 (rounded to the nearest whole share)). Our board of directors may reduce the amount of the increase in any particular year. No more than shares of our common stock may be issued under our 2010 employee stock purchase plan and no other shares may be added to this plan without the approval of our stockholders.
Administration. Our compensation committee will administer our 2010 employee stock purchase plan. Employees who are 5% stockholders, or would become 5% stockholders as a result of their participation in our 2010 employee stock purchase plan, are ineligible to participate in our 2010 employee stock purchase plan. We may impose additional restrictions on eligibility as well. Under our 2010 employee stock purchase plan, eligible employees may acquire shares of our common stock by accumulating funds through payroll deductions. Our eligible employees may select a rate of payroll deduction between 1% and 15% of their cash compensation. We also have the right to amend or terminate our 2010 employee stock purchase plan, except that, subject to certain exceptions, no such action may adversely affect any outstanding rights to purchase stock under the plan. Our 2010 employee stock purchase plan will terminate on the tenth anniversary of the first offering date, unless it is terminated earlier by our board of directors.
Purchase rights. When an offering period commences, our employees who meet the eligibility requirements for participation in that offering period are automatically granted a non-transferable option to purchase shares in that offering period. Each offering period may run for no more than 19 months and consist of no more than three purchase periods. An employee’s participation automatically ends upon termination of employment for any reason.
No participant will have the right to purchase our shares at a rate which, when aggregated with purchase rights under all our employee stock purchase plans that are also outstanding in the same calendar year(s), have a fair market value of more than $ , determined as of the first day of the applicable offering period, for each calendar year in which such right is outstanding.
128
Table of Contents
The purchase price for shares of our common stock purchased under our 2010 employee stock purchase plan will be 85% of the lesser of the fair market value of our common stock on (1) the first trading day of the applicable offering period and (2) the last trading day of each purchase period in the applicable offering period.
Change in control. In the event of a change in control transaction, our 2010 employee stock purchase plan and any offering periods that commenced prior to the closing of the proposed transaction may terminate on the closing of the proposed transaction and the final purchase of shares will occur on that date, but our compensation committee may instead terminate any such offering period at a different date.
401(k) plan
We offer a 401(k) plan to all employees who meet specified eligibility requirements. Eligible employees may contribute up to 90% of their respective compensation subject to limitations established by the Internal Revenue Code. In February 2010, our board of directors approved our matching of employee contributions to the 401(k) plan up to one percent of an employee’s salary, with a maximum matching contribution of $1,000 per year.
Indemnification of directors and officers and limitation of liability
Our certificate of incorporation includes a provision that eliminates, to the fullest extent permitted by law, the personal liability of a director for monetary damages resulting from breach of his fiduciary duty as a director.
Our bylaws, as in effect upon completion of this offering, provide that:
| • | we are required to indemnify our directors and officers to the fullest extent permitted by the Delaware General Corporation Law, subject to very limited exceptions; |
| • | we may indemnify our other employees and agents as provided in indemnification contracts entered into between us and our employees and agents; |
| • | we are required to advance expenses, as incurred, to our directors and officers in connection with a legal proceeding to the fullest extent permitted by the Delaware General Corporation Law, subject to very limited exceptions; and |
| • | the rights conferred in the bylaws are not exclusive. |
In addition to the indemnification required in our certificate of incorporation and bylaws, we have entered into indemnity agreements with each of our current directors and officers. These agreements provide for the indemnification of our directors and officers for all reasonable expenses and liabilities incurred in connection with any action or proceeding brought against them by reason of the fact that they are or were our agents. We have also obtained directors’ and officers’ insurance to cover our directors, officers and some of our employees for liabilities, including liabilities under securities laws. We believe that these indemnification provisions and agreements and this insurance are necessary to attract and retain qualified directors and officers.
A stockholder’s investment may be adversely affected to the extent we pay the costs of settlement and damage awards against directors and officers as required by these indemnification provisions. At present, there is no pending litigation or proceeding involving any of our directors, officers or employees regarding which indemnification by us is sought, nor are we aware of any threatened litigation that may result in claims for indemnification.
129
Table of Contents
Certain relationships and related party transactions
The following is a summary of transactions since October 1, 2006 to which we were or are a party in which the amount involved exceeded or exceeds $120,000 and in which any of our directors, executive officers, holders of more than 5% of any class of our voting securities or any member of the immediate family of any of the foregoing persons, had or will have a direct or indirect material interest, other than compensation arrangements with directors and executive officers, which are described where required under “Executive compensation.”
Sales of our Series B-1 preferred stock
In the period from March 2007 through October 2007, we sold an aggregate of 7,126,587 shares of our Series B-1 preferred stock at $8.69 per share for an aggregate purchase price of approximately $61.9 million. Each share of Series B-1 preferred stock was converted into one share of our Series A preferred stock in the recapitalization effective March 31, 2009. The following table identifies (1) the number of shares of Series B-1 preferred stock (without giving effect to the 1-for-175 reverse stock split effected in March 2009 or the 40-for-1 forward stock split effected in October 2009) issued to current holders of more than 5% of our outstanding stock as a result of such holder’s investment in the Series B-1 preferred stock and (2) the shares of Series B-1 preferred stock issued to entities affiliated with certain of our directors. The terms of these purchases were the same as those made available to unaffiliated purchasers.
| Investor | Aggregate purchase price | Shares of Series B-1 preferred stock purchased | Percentage of total issued | |||||
Entities affiliated with AEI(1) | $ | 41,141,156 | 4,734,312 | 66.4 | % | |||
Entities affiliated with Dixon R. Doll(2) | 321,050 | 36,946 | 0.5 | |||||
Entities affiliated with B.J. Cassin(3) | 153,338 | 17,646 | 0.2 | |||||
| (1) | Entities affiliated with Advanced Equities, Inc., or AEI, collectively beneficially own more than 5% of our outstanding capital stock. Keith G. Daubenspeck, one of our directors, is a co-founder and the chairman of AEI. |
| (2) | DCM III, L.P., DCM III-A, L.P. and DCM Affiliates Fund III, L.P. purchased shares. Dixon R. Doll, Ph.D., one of our directors, is a managing member of DCM Investment Management III, LLC, the sole general partner of DCM III, L.P., DCM III-A, L.P. and DCM Affiliates Fund III, L.P. |
| (3) | The Cassin Family Trust U/D/T dated Jan. 31, 1996 purchased shares. B.J. Cassin, one of our directors, is the beneficial owner of shares held by the trust. |
See “Principal and selling stockholders” for additional information about the entities described above and elsewhere in this section.
We also paid a placement agent fee of approximately $2.9 million and issued warrants exercisable for 337,178 shares of Series B-1 preferred stock at an exercise price of $8.69 per share to AEI in connection with AEI’s placement agent services in the Series B-1 financing. These warrants were converted into warrants exercisable for 511,866 shares of Series C-1 preferred stock in February 2008, at an exercise price of $5.72 per share. As of March 31, 2010, these warrants were exercisable for 116,997 shares of Series A-1 preferred stock at an exercise price of $25.04 per share.
Sales of our Series C-1 preferred stock and issuance of Series C-1 preferred stock in exchange for Series B-1 preferred stock
In the period from February 2008 through September 2008, we sold an aggregate of 6,813,061 shares of our Series C-1 preferred stock at $5.72 per share for an aggregate purchase price of approximately $39.0 million. In connection with our Series C-1 financing, each share of Series B-1 preferred stock held by purchasers of a minimum number of shares of Series C-1 preferred stock
130
Table of Contents
was automatically exchanged for one share of Series C-1 preferred stock. Each share of Series C-1 preferred stock was converted into one share of our Series A preferred stock in the recapitalization effective March 31, 2009. The following table identifies (1) the number of shares of Series C-1 preferred stock (without giving effect to the 1-for-175 reverse stock split effected in March 2009 or the 40-for-1 forward stock split effected in October 2009) issued to current holders of more than 5% of our outstanding stock as a result of such holder’s new investment and Series B-1 preferred stock exchange and (2) the shares of Series C-1 preferred stock issued to entities affiliated with certain of our directors. The terms of these purchases were the same as those made available to unaffiliated purchasers.
| Investor | Aggregate purchase price | Shares of Series C-1 preferred stock purchased | Shares of Series C-1 preferred stock issued in exchange | Total Series C-1 preferred stock | Percentage of total issued | |||||||
Entities affiliated with AEI | $ | 16,747,837 | 2,925,745 | 7,187,107 | 10,112,852 | 59.8 | % | |||||
Entities affiliated with Dixon R. Doll | 64,210 | 11,217 | 56,085 | 67,302 | 0.4 | |||||||
Entities affiliated with B.J. Cassin | 30,668 | 5,357 | 26,787 | 32,144 | 0.2 | |||||||
We also paid a placement agent fee of approximately $2.5 million and issued warrants exercisable for 408,443 shares of Series C-1 preferred stock at an exercise price of $5.72 per share to AEI in connection with AEI’s placement agent services in the Series C-1 financing. As of March 31, 2010, these warrants were exercisable for 93,358 shares of Series A-1 preferred stock at an exercise price of $25.04 per share.
Issuance of Series A preferred stock and common stock in our acquisition of Legacy Force10
On March 31, 2009, we closed our acquisition of Legacy Force10 and issued an aggregate of 7,826,800 shares of our Series A preferred stock and 424,200 shares of common stock to the Legacy Force10 stockholders. The following table identifies (1) the number of shares of Series A preferred stock and common stock issued to current holders of more than 5% of our outstanding stock and (2) the shares of Series A preferred stock issued to entities affiliated with certain of our directors (giving effect to the 40-for-1 forward stock split effected in October 2009). None of our executive officers or directors was issued Series A preferred stock or common stock in the acquisition, although certain of our directors may currently be considered to beneficially own shares held by entities with which they are affiliated.
| Investor | Shares of Series A preferred stock | Percentage of total issued in acquisition | Shares of common stock | Percentage of total issued in acquisition | ||||||
Entities affiliated with AEI | 1,502,600 | 19.2 | % | 8,120 | 1.9 | % | ||||
Entities affiliated with NEA(1) | 1,363,480 | 17.4 | 143,840 | 33.9 | ||||||
Entities affiliated with Steven M. Krausz(2) | 248,760 | 3.2 | 52,760 | 12.4 | ||||||
Entities affiliated with Paul S. Madera(3) | 644,680 | 8.2 | — | — | ||||||
| (1) | Entities affiliated with New Enterprise Associates, L.P., or NEA, collectively beneficially own more than 5% of our outstanding capital stock. C. Richard Kramlich, one of our directors, is a general partner at NEA Partners 10, Limited Partnership, the sole general partner of New Enterprise Associates 10, L.P. |
| (2) | 2180 Associates Fund VI, L.P., U.S. Venture Partners VI, L.P., USVP Entrepreneur Partners VI, L.P. and USVP VI Affiliates Fund, L.P. received shares of Series A preferred stock and shares of common stock. Steven M. Krausz, one of our directors, is a managing member of Presidio Management Group VI, LLC, which is the general partner of each of 2180 Associates Fund VI, L.P., U.S. Venture Partners VI, L.P., USVP Entrepreneur Partners VI, L.P. and USVP VI Affiliates Fund, L.P. |
131
Table of Contents
| (3) | MCP Entrepreneur Partners II, L.P., Meritech Capital Affiliates II, L.P. and Meritech Capital Partners II, L.P. received shares of our Series A preferred stock. Paul S. Madera, one of our directors, is a managing member of Meritech Management Associates II, LLC, the managing member of Meritech Capital Associates II, LLC, which is the general partner of MCP Entrepreneur Partners II, L.P., Meritech Capital Affiliates II, L.P. and Meritech Capital Partners II, L.P. |
We also paid a fee of $1.5 million to AEI in connection with AEI’s advisory services in the merger.
Sales of our Series B preferred stock and issuance of Series A-1 preferred stock in exchange for Series A preferred stock
In June, July and August 2009, we sold an aggregate of 9,923,080 shares of our Series B preferred stock at $3.02 per share for an aggregate purchase price of approximately $30.0 million. In connection with our Series B financing, each share of Series A preferred stock and warrant exercisable for Series A preferred stock held by purchasers of Series B preferred stock was automatically exchanged for one share of Series A-1 preferred stock or a warrant exercisable for Series A-1 preferred stock. Each warrant exercisable for shares of Series A-1 preferred stock retains the same exercise price that applied to the original warrant. These exercise prices range from $3.02 to $44.27 per share. Each share of Series B preferred stock will convert automatically into one share of our common stock and each share of Series A-1 preferred stock will convert automatically into three shares of our common stock upon the completion of this offering. The following table identifies (1) the number of shares of Series B preferred stock purchased by, and Series A-1 preferred stock issued to, current holders of more than 5% of our outstanding stock and (2) the number of shares of Series B preferred stock purchased by, and Series A-1 preferred stock issued to entities affiliated with certain of our directors (giving effect to the 40-for-1 forward stock split effected in October 2009). None of our directors purchased Series B preferred stock, although certain of our directors may currently be considered to beneficially own shares held by entities with which they are affiliated. The terms of these purchases were the same as those made available to unaffiliated purchasers.
| Investor | Aggregate purchase price | Shares of Series B preferred stock | Percentage of total issued | Shares of Series A-1 preferred stock | Percentage of total issued | ||||||||
Entities affiliated with AEI | $ | 8,490,858 | 2,808,520 | 28.3 | % | 3,813,960 | 27.5 | % | |||||
Entities affiliated with NEA | 2,364,665 | 782,160 | 7.9 | 1,363,480 | 9.8 | ||||||||
Entities affiliated with Paul S. Madera | 1,118,119 | 369,840 | 3.7 | 644,680 | 4.6 | ||||||||
Entities affiliated with Dixon R. Doll | 753,515 | 249,240 | 2.5 | 434,520 | 3.1 | ||||||||
Entities affiliated with Steven M. Krausz | 431,478 | 142,720 | 1.4 | 248,760 | 1.8 | ||||||||
Entities affiliated with B.J. Cassin | 354,809 | 117,360 | 1.2 | 204,720 | 1.5 | ||||||||
We also paid a placement agent fee of approximately $1.2 million and issued warrants exercisable for 383,800 shares of Series B preferred stock at an exercise price of $3.02 per share to AEI in connection with AEI’s placement agent services in the Series B financing.
Investors’ rights agreement
In connection with our Series B preferred stock financing completed in June, July and August 2009, we entered into an amended and restated investors’ rights agreement with certain purchasers of our common stock and preferred stock, including entities affiliated with each of AEI, NEA, Paul S. Madera, Dixon R. Doll, Steven M. Krausz and B.J. Cassin. Pursuant to this agreement, we granted such stockholders certain registration rights with respect to certain
132
Table of Contents
shares of our common stock held or issuable upon conversion of the shares of preferred stock held by them. For a description of these registration rights, see “Description of capital stock—Registration rights.”
Retention incentive agreements
We have entered into agreements containing termination and change of control provisions, among others, with certain of our executive officers as described in the section entitled “Executive compensation—Potential payments upon termination or change of control” above.
Indemnification of directors and officers
Upon completion of this offering, our certificate of incorporation and bylaws will provide that we will indemnify each of our directors and officers to the fullest extent permitted by the Delaware General Corporation Law. Further, we have entered into indemnification agreements with each of our directors and officers. For further information, see the section entitled “Executive compensation—Limitation of liability and indemnification of directors and officers.”
Policies and procedures for related party transactions
As provided in the audit committee charter, the audit committee of our board of directors must review and approve in advance any related party transaction. All of our directors, officers and employees are required to report to the audit committee any related party transaction prior to entering into the transaction.
We believe that we have executed all of the transactions set forth under this section on terms no less favorable to us than we could have obtained from unaffiliated third parties. It is our intention to ensure that all future related party transactions between us and our officers, directors and principal stockholders and their affiliates, are approved by the audit committee of our board of directors, and are on terms no less favorable to us than those that we could obtain from unaffiliated third parties.
133
Table of Contents
Principal and selling stockholders
The following table sets forth information regarding beneficial ownership of our common stock as of March 31, 2010 and as adjusted to reflect the shares of common stock to be issued and sold in the offering, by:
| • | each person or group of affiliated persons known by us to be the beneficial owner of more than 5% of our common stock; |
| • | each of our named executive officers; |
| • | each of our directors; |
| • | all executive officers and directors as a group; and |
| • | each of the selling stockholders. |
Beneficial ownership is determined in accordance with the rules of the SEC and generally includes any shares over which a person exercises sole or shared voting or investment power. The information does not necessarily indicate beneficial ownership for any other purpose. Under these rules, the number of shares of common stock deemed outstanding includes shares issuable upon exercise of options and warrants held by the respective person or group which may be exercised or converted within 60 days after March 31, 2010. For purposes of calculating each person’s or group’s percentage ownership, stock options and warrants exercisable within 60 days after March 31, 2010 are included for that person or group but not the stock options or warrants of any other person or group.
Percentage of beneficial ownership prior to this offering is based on 56,289,880 shares outstanding as of March 31, 2010, assuming the conversion of all shares of our outstanding convertible preferred stock into an aggregate of 52,733,480 shares of our common stock as of March 31, 2010 and shares outstanding after completion of this offering.
Unless otherwise indicated and subject to applicable community property laws, to our knowledge, each stockholder named in the following table possesses sole voting and investment power over the shares listed. Unless otherwise noted below, the address of each person listed on the table is c/o Force10 Networks, Inc., 350 Holger Way, San Jose, California 95134.
134
Table of Contents
| Shares beneficially owned prior to the offering | Shares beneficially owned after the offering | ||||||||||
| Shares | Percentage | Number of shares offered | Shares | Percentage | |||||||
Named executive officers and directors: | |||||||||||
Henry Wasik(1) | 1,178,800 | 2.1 | % | ||||||||
William Zerella(2) | 707,280 | 1.3 | |||||||||
James Hanley(3) | 707,280 | 1.2 | |||||||||
Bruce Miller(4) | 502,440 | * | |||||||||
Leah Maher(5) | 147,360 | * | |||||||||
Howard A. Bain III(6) | 76,000 | * | |||||||||
B.J. Cassin(7) | 878,100 | 1.6 | |||||||||
Keith G. Daubenspeck(8) | 16,454,428 | 28.1 | |||||||||
Dixon R. Doll(9) | 1,800,076 | 3.2 | |||||||||
C. Richard Kramlich(10) | 5,612,623 | 9.9 | |||||||||
Steven M. Krausz(11) | 1,132,434 | 2.0 | |||||||||
Paul S. Madera(12) | 2,629,785 | 4.6 | |||||||||
All executive officers and directors as a group (14 people)(13) | 31,857,446 | 52.0 | |||||||||
5% Stockholders: | |||||||||||
Entities affiliated with AEI(14) | 16,394,428 | 28.1 | |||||||||
Entities affiliated with NEA(15) | 5,552,623 | 9.8 | |||||||||
Other selling stockholders: | |||||||||||
Bay Partners LS Fund, L.P.(16)(28) | 1,022,225 | 1.8 | |||||||||
Entities affiliated with Huitung Investments (BVI) Ltd.(17)(29) | 642,760 | 1.1 | |||||||||
Entities affiliated with Donald A. Lucas(18)(28) | 1,277,248 | 2.3 | |||||||||
Entities affiliated with Donald L. Lucas(19)(28) | 935,091 | 1.7 | |||||||||
Morgenthaler Partners VII, L.P.(20)(29) | 1,327,612 | 2.4 | |||||||||
Motorola, Inc.(21)(28) | 903,137 | 1.6 | |||||||||
National Technology Enterprises Company(22)(29) | 596,360 | 1.1 | |||||||||
Peierls, E. Jeffrey(23)(28) | 688,160 | 1.2 | |||||||||
Tudor Ventures II L.P.(24)(28) | 1,703,731 | 3.0 | |||||||||
Webley, John W.(25)(28) | 1,118,035 | 2.0 | |||||||||
Entities affiliated with Worldview Technology Partners(26)(29) | 1,093,713 | 1.9 | |||||||||
All other selling stockholders(27) | |||||||||||
| * | Represents beneficial ownership of less than 1%. |
| (1) | Includes 1,178,800 shares of common stock, all of which were unvested as of March 31, 2010 and subject to a lapsing right of repurchase in our favor. |
| (2) | Includes 707,280 shares of common stock, all of which were unvested as of March 31, 2010 and subject to a lapsing right of repurchase in our favor. |
| (3) | Includes 707,280 shares of common stock issuable upon exercise of options, all of which were unvested and are immediately exercisable within 60 days after March 31, 2010. |
135
Table of Contents
| (4) | Includes 294,720 shares of common stock, all of which were unvested as of March 31, 2010 and subject to a lapsing right of repurchase in our favor, and 207,720 shares of common stock issuable upon exercise of options exercisable within 60 days after March 31, 2010. Upon Mr. Miller’s departure from the Company on May 3, 2010, the Company exercised its right to repurchase the 213,672 shares of unvested stock and Mr. Miller’s unexercised option was cancelled in full. |
| (5) | Includes 147,360 shares of common stock, all of which were unvested as of March 31, 2010 and subject to a lapsing right of repurchase in our favor. |
| (6) | Includes 76,000 shares of common stock, all of which were unvested as of March 31, 2010 and subject to a lapsing right of repurchase in our favor. |
| (7) | Includes 84,480 shares of common stock and 10,864 shares issuable upon exercise of warrants beneficially owned by Cassin 1997 Charitable Trust UTA dated 1/28/97, 71,040 shares of common stock and 7,489 shares issuable upon exercise of warrants beneficially owned by the Cassin Educational Initiative Foundation, 55,000 shares of common stock and 10,821 shares issuable upon exercise of warrants beneficially owned by Cassin Family Partners, 445,960 shares of common stock and 49,789 shares issuable upon exercise of warrants beneficially owned by Brendan Joseph Cassin and Isabel B. Cassin, Trustees of the Cassin Family Trust U/D/T dated January 31, 1996 and 75,040 shares of common stock and 7,616 shares issuable upon exercise of warrants beneficially owned by Robert S. Cassin Charitable Trust UTA dated 2/20/97. Mr. Cassin disclaims beneficial ownership of these shares except to the extent of his pecuniary interest therein. Also includes 60,000 shares of common stock issuable upon exercise of options exercisable within 60 days after March 31, 2010. |
| (8) | Mr. Daubenspeck is a co-founder and the chairman of AEI. See footnote (14). Includes 60,000 shares of common stock issuable upon exercise of options exercisable within 60 days after March 31, 2010. |
| (9) | Includes 70,480 shares of common stock and 8,508 shares issuable upon exercise of warrants beneficially owned by DCM Affiliates Fund III, LP, or DCM Affiliates, 1,444,160 shares of common stock and 174,155 shares issuable upon exercise of warrants beneficially owned by DCM III, LP, or DCM III, 38,160 shares of common stock and 4,613 shares issuable upon exercise of warrants beneficially owned by DCM III-A, LP, or DCM III-A. DCM Investment Management III, LLC, or DCMIM is the general partner of DCM Affiliates, DCM III and DCM III-A, which we refer to collectively as the DCM Funds, and may be deemed to have indirect beneficial ownership of the shares and warrants owned by the DCM Funds. Dr. Doll is a managing member of DCMIM. Each of the DCM Funds is located at 2420 Sand Hill Road, Suite 200, Menlo Park, California 94025. The aforementioned indirect holder of the shares held by the DCM Funds disclaims beneficial ownership of the shares held by the DCM Funds except to the extent of its pecuniary interest therein. Also includes 60,000 shares of common stock, all of which were unvested and subject to a lapsing right of repurchase in our favor upon Dr. Doll’s cessation of service as of March 31, 2010. |
| (10) | Mr. Kramlich is a general partner of NEA. See footnote (15). Includes 60,000 shares of common stock issuable upon exercise of options exercisable within 60 days after March 31, 2010. |
| (11) | Includes 14,080 shares of common stock beneficially owned by 2180 Associates Fund VI, L.P., or 2180 Associates, 876,040 shares of common stock and 123,378 shares issuable upon exercise of warrants beneficially owned by U.S. Venture Partners VI, L.P., or USVP VI, 27,240 shares of common stock and 3,847 shares issuable upon exercise of warrants beneficially owned by USVP Entrepreneur Partners VI, L.P., or USVPE VI, and 24,400 shares of common stock and 3,449 shares issuable upon exercise of warrants beneficially owned by USVP VI Affiliates Funds, L.P., or USVP VI Affiliates. Presidio Management Group VI, LLC, or PMG VI, is the general partner of each of 2180 Associates, USVP VI, USVPE VI and USVP VI Affiliates, which we refer to collectively as the USVP Funds. Each of the USVP Funds is located at 2735 Sand Hill Road, Menlo Park, California 94025. The aforementioned holders of the shares held by the USVP Funds disclaim beneficial ownership of the shares held by the USVP Funds except to the extent of each of their pecuniary interests therein. Also includes 60,000 shares of common stock, all of which were unvested and subject to a lapsing right of repurchase in our favor upon Mr. Krausz’s cessation of service as of March 31, 2010. |
| (12) | Includes 17,000 shares of common stock and 1,967 shares issuable upon exercise of warrants beneficially owned by MCP Entrepreneur Partners II, L.P., or MCP, 57,320 shares of common stock and 6,621 shares issuable upon exercise of warrants beneficially owned by Meritech Capital Affiliates II, L.P., or Meritech Affiliates, 2,229,560 shares of common stock and 257,317 shares issuable upon exercise of warrants beneficially owned by Meritech Capital Partners II, L.P., or Meritech Partners. Meritech Capital Associates II, L.L.C., or MCA II, is the general partner of MCP, Meritech Affiliates and Meritech Partners, which we refer to collectively as the Meritech Funds, and may be deemed to have indirect beneficial ownership of the shares and warrants owned by the Meritech Funds. Meritech Management Associates II L.L.C., or MMA II, is a managing member of MCA II and may be deemed to have indirect beneficial ownership of the shares and warrants owned by the Meritech Funds. Paul Madera and Michael Gordon are managing members of MMA II. Each of the Meritech Funds is located at 245 Lytton Avenue, Suite 350, Palo Alto, California 94301. The aforementioned indirect holders of the shares held by the Meritech Funds disclaim beneficial ownership of the shares held by the Meritech Funds except to the extent of each of their pecuniary interests therein. Also includes 60,000 shares of common stock issuable upon exercise of options exercisable by Mr. Madera within 60 days after March 31, 2010. |
| (13) | Includes the items described in footnotes (1) through (12) above. Also includes 503,880 shares issuable upon exercise of options held by executive officers, all of which were unvested and exercisable within 60 days after March 31, 2010 and 29,400 shares of common stock held by executive officers, which were unvested as of March 31, 2010 and subject to a lapsing right of repurchase in our favor. |
136
Table of Contents
| (14) | AEI-affiliated entities beneficially own the following number of shares of common stock and shares issuable upon the exercise of warrants. |
| Entity | Common stock | Warrants | ||
Advanced Equities Force10 Investments I, LLC | 860,680 | — | ||
Advanced Equities Force10 Investments II, LLC | 3,081,360 | — | ||
Advanced Equities Late Stage Opportunities Fund I, LLC | 1,344,120 | 536,425 | ||
AEI F10 Investment I, LLC | 80,200 | — | ||
AEI F10 Investment II, LLC | 138,480 | — | ||
Advanced Equities Turin Investments I, LLC | 1,043,000 | — | ||
Advanced Equities Turin Investments II, LLC | 3,530,080 | — | ||
Advanced Equities Turin Investments III, LLC | 302,520 | — | ||
Advanced Equities Turin Investments IV, LLC | 982,600 | — | ||
Advanced Equities Venture Partners | 66,760 | — | ||
AEI 2006 Venture Investment III, LLC | 143,280 | — | ||
AEI 2006 Venture Investment IV, LLC | 126,680 | — | ||
AEI 2007 Venture Access Fund I, LLC | 137,840 | — | ||
AEI 2007 Venture Access Fund II, LLC | 140,200 | — | ||
AEI 2007 Venture Investments I, LLC | 868,680 | — | ||
AEI 2007 Venture Investments II, LLC | 305,800 | — | ||
AEI Silicon Valley Fund I, LLC | 1,103,520 | — | ||
Advanced Equities Investments VIII, LLC | 2,720 | — | ||
Advanced Equities Inc. | — | 383,800 | ||
Advanced Equities Financial Corp. | — | 1,215,684 | ||
| All of the above entities, which we collectively refer to as the AEI Funds, are controlled by managing members that are wholly-owned subsidiaries of Advanced Equities Financial Corp., or AEFC, which exercises voting and dispositive control over all of the AEI Funds. AEFC disclaims beneficial ownership of all of these shares except for the shares held by AEFC or AEI directly. All of the warrants held by the AEI Funds are pledged as collateral to AEFC’s primary commercial bank. Keith G. Daubenspeck is a co-founder and the chairman of AEFC and Mr. Daubenspeck may be deemed to exercise shared voting and investment power over the shares held by the AEI Funds. Mr. Daubenspeck disclaims beneficial ownership of these shares except to the extent of his pecuniary interest therein. The business address for AEFC and all of the AEI Funds is 311 S. Wacker Drive, Suite 1650, Chicago, Illinois 60606. |
| (15) | Includes 2,419,840 shares of common stock and 339,771 shares issuable upon the exercise of outstanding warrants beneficially owned by New Enterprise Associates 10, Limited Partnership, or NEA 10, 677,240 shares of common stock and 98,326 shares issuable upon the exercise of outstanding warrants beneficially owned by New Enterprise Associates 8A, Limited Partnership, or NEA 8A, 1,202,680 shares of common stock beneficially owned by New Enterprise Associates 9, Limited Partnership, or NEA 9, and 716,440 shares of common stock and 98,326 shares issuable upon the exercise of outstanding warrants beneficially owned by New Enterprise Associates VIII, Limited Partnership, or NEA VIII. NEA Partners 10, Limited Partnership, or NEA Partners 10, is the sole general partner of NEA 10 and NEA 8A. The individual general partners of NEA Partners 10 are M. James Barrett, Peter J. Barris, C. Richard Kramlich, Charles W. Newhall III, Mark W. Perry, Scott D. Sandell and Eugene A. Trainor III. NEA Partners 10 and the individual general partners of NEA Partners 10 may be deemed to have shared voting and dispositive power over, and be deemed indirect beneficial owners of, the shares directly held by NEA 10. NEA Partners 9, Limited Partnership, or NEA Partners 9, is the sole general partner of NEA 9. The general partners of NEA Partners 9 are Peter J. Barris, C. Richard Kramlich, John M. Nehra, Charles W. Newhall III and Mark W. Perry. NEA Partners 9 and the individual general partners of NEA Partners 9 may be deemed to have shared voting and dispositive power over, and be deemed indirect beneficial owners of, the shares directly held by NEA 9. NEA Partners VIII, Limited Partnership, or NEA Partners VIII, is the sole general partner of NEA VIII. The general partners of NEA Partners VIII are Peter J. Barris, C. Richard Kramlich, John M. Nehra, Charles W. Newhall III and Mark W. Perry. NEA Partners VIII and the individual general partners of NEA Partners VIII may be deemed to have shared voting and dispositive power over, and be deemed indirect beneficial owners of, the shares directly held by NEA VIII. The aforementioned indirect holders of the shares owned by NEA 10, NEA 8A, NEA 9 and NEA VIII, which we refer to collectively as the NEA Funds, disclaim beneficial ownership of such shares except to the extent of each of their actual pecuniary interests therein. Each of the NEA Funds is located at 1119 St. Paul Street, Baltimore, Maryland 21202. |
| (16) | Includes 872,400 shares of common stock and 149,825 shares issuable upon exercise of warrants. Bay Management Company 1999, LLC, or Bay Management, is the general partner of Bay Partners LS Fund, L.P., or Bay Partners. Bay Management is managed by Neal Dempsey and John Freidenrich who may be deemed to have voting and dispositive power over the shares held by Bay Partners. |
| (17) | Includes 464,120 shares of common stock held by Huitung Investments (BVI) Ltd., or Huitung, 89,320 shares of common stock held by Capital Venture Fund II Co., Ltd., or CVF, and 89,320 shares of common stock held by Shengtung Venture Capital Corp., or Shengtung. The following people may be deemed to have voting and dispositive power over the shares held by Huitung: Mr. Isamu Sakibara; Ms. Huang, Tsui-Hui; Mr. Huang, Cheng Wang; Mr. Koshiro Taniguschi; Mr. Chen, Chin Wei; Mr. Lu, Kun Sen; Mr. Kuo, Yang Fu and Mr. Tsou, Chun-Chen. The following people may be deemed to have voting and dispositive power over the shares held by Shengtung: Mr. Hwang, Min-Juh; Ms. Huang, Tsui-Hui; Mr. Koshiro Taniguschi; Ms. Wu, Chia-Ling; Mr. Kuo, Ming-Cheng; Mr Wu, Pi-Hsiang; Mr. Liu, Ming-Hsiung; Mr. Chen, Hermon; Mr. Yu, Cheng-Tsung and Mr. Huang, Chi Yuan. Huitung is an affiliate of a broker-dealer, M.J. Whitman LLC. Huitung and M.J. Whitman LLC are under common control of Third Avenue Holdings Delaware LLC, which indirectly owns more than 10% interest of both |
137
Table of Contents
Huitung and M.J. Whitman LLC. Shengtung is an affiliate of a broker-dealer, Daiwa Capital Markets America Inc., or Daiwa. Shengtung and Daiwa are under common control of Daiwa Securities Group, which indirectly owns more than 10% interest of both Shengtung and Daiwa. Huitung and Shengtung each acquired its shares as investments, purchased to be resold in the ordinary course of business, and at the time of purchase, had no agreements or understandings, directly or indirectly, with any person to distribute the shares. |
| (18) | Includes 666,000 shares of common stock and 120,294 shares issuable upon exercise of warrants held by RWI Ventures I, L.P., or RWI I, 130,640 shares of common stock and 25,314 shares issuable upon exercise of warrants held by RWI Group III, L.P., or RWI III, 208,360 shares of common stock held by Lucas Venture Group II, LLC, or LVG II, and 126,640 shares of common stock held by LVG I SPV, LLC, or LVG I. Donald A. Lucas may be deemed to have sole voting and dispositive power over the shares held by RWI I, RWI III, LVG II and LVG I. |
| (19) | Includes 330,040 shares of common stock and 56,496 shares issuable upon exercise of warrants held by Teton Capital Company, or TCC, 132,640 shares of common stock and 17,473 shares issuable upon exercise of warrants held by Donald L. Lucas & Lygia S. Lucas Trust Dtd 12/3/84, or DL&L Trust, 130,480 shares of common stock and 17,473 shares issuable upon exercise of warrants held by Philip Simon and Donald L. Lucas, Trustees of the Margaret Elizabeth Ellison Trust dtd 2/7/86, or MEET Trust, 87,040 shares of common stock and 11,648 shares issuable upon exercise of warrants held by Philip Simon and Donald L. Lucas, Trustees of the David Ferris Ellison Trust dtd 12/7/83, or DFE Trust, 87,600 shares of common stock and 10,898 shares issuable upon exercise of warrants held by the Lucas Brothers Foundation, or LBF, 27,560 shares of common stock and 3,038 shares issuable upon exercise of warrants held by Sand Hill Financial Company, or Sand Hill, and 21,560 shares of common stock and 1,145 shares issuable upon exercise of warrants held by Lucas, Donald L., SUCC TTEE, Donald L. Lucas Profit Sharing Trust dtd 1-1-84, or DL Trust. Donald L. Lucas may be deemed to have sole voting and dispositive power over the shares held by TCC, DL&L Trust, MEET Trust, DFE Trust LBF, Sand Hill and DL Trust. |
| (20) | Includes 1,221,480 shares of common stock and 106,132 shares issuable upon exercise of warrants held by Morgenthaler Partners VII, L.P., or Morgenthaler. Morgenthaler is managed by Morgenthaler Management Partners VII LLC, which is managed by Gary J. Morgenthaler, Theodore A. Laufik, Gary R. Little, Robert C. Bellas, John D. Lutsi, Robert D. Pavey and Peter G. Taft. Messrs. Morgenthaler, Laufik, Little, Bellas, Lutsi, Pavey and Taft each may be deemed to share voting and dispositive power over the shares held by Morgenthaler. |
| (21) | Includes 830,240 shares of common stock and 72,897 shares issuable upon exercise of warrants held by Motorola, Inc. |
| (22) | National Technology Enterprises Company, or NTE, is managed by Anas Meerza, with Farouk Bastaki as the Chairman and Alia Al Tameemi as Vice Chairman. Mr. Bastaki, Mr. Meerza and Mrs. Tameemi each may be deemed to have sole voting and investment power over the shares held by NTE. |
| (23) | Includes 519,880 shares of common stock held by The Peierls Foundation Inc., or TPF, 66,920 shares of common stock held by E. Jeffrey Peierls, 48,960 shares of common stock held by U.D. Ethel F. Peierls Charitable Lead Trust, or EPC Trust, 26,200 shares of common stock held by U.D. J.N. Peierls for B.E. Peierls, or B.E. Peierls. and 26,200 shares of common stock held by U.D. J.N. Peierls for E.J. Peierls, or E.J. Peierls. E. Jeffrey Peierls may be deemed to have voting and dispositive power over the shares held by TPF, EP Trust, B.E. Peierls and E.J. Peierls. |
| (24) | Includes 1,360,560 shares of common stock and 343,171 shares issuable upon exercise of warrants. Tudor Investment Corporation, or TIC, acts as Manager to Tudor Ventures II L.P., or Tudor. As a result, TIC may be deemed to have voting and dispositive power over the shares held by Tudor, but TIC disclaims beneficial ownership over the shares held by Tudor. TIC and Tudor Group Holdings LLC (TGH) are considered affiliates as they are under common control. Paul Tudor Jones, II is the controlling shareholder of TIC and TGH and Co-Chairman and Chief Investment Officer of TIC and TGH. As a result, Mr. Jones may be deemed to have voting and dispositive power over shares beneficially owned by TIC. Mr. Jones disclaims such beneficial ownership. Tudor is the indirect owner of more than 10% of the equity interests of Montgomery & Co., LLC and Pipeline Trading Systems LLC, each of which is a member of the Financial Industry Regulatory Authority, or FINRA. Tudor acquired its shares as investments, purchased to be resold in the ordinary course of business, and at the time of purchase, had no agreements or understandings, directly or indirectly, with any person to distribute the shares. |
| (25) | Includes 617,040 shares of common stock and 170,503 shares issuable upon exercise of warrants held by John W. Webley, 217,960 shares of common stock and 3,116 shares issuable upon exercise of warrants held by JJW Investments, LP, or JJW, 78,040 shares of common stock and 10,455 shares issuable upon exercise of warrants held by Webley Family Trust, or WFT, 10,400 shares of common stock and 61 shares issuable upon exercise of warrants held by The Elizabeth A. Webley Irrevocable Trust Dtd October 30, 2001, or EAW Trust, 10,400 shares of common stock and 61 shares issuable upon exercise of warrants held by The John E.A. Webley Irrevocable Trust Dtd October 30, 2001, or the JEAW Trust. Mr. Webley may be deemed to have voting and dispositive power over shares beneficially owned by JJW, WFT, EAW Trust and JEAW Trust. Mr. Webley founded our company in 1999, he was formerly our chief executive officer and chairman of our board of directors, and he served as a member of our board of directors until March 2008. |
| (26) | Includes 663,680 shares of common stock and 148,288 shares issuable upon exercise of warrants held by Worldview Technology Partners IV, L.P., or WTP IV, 107,760 shares of common stock and 24,091 shares issuable upon exercise of warrants held by Worldview Technology International IV, L.P., or WTI IV, 4,840 shares of common stock and 1,094 shares issuable upon exercise of warrants held by Worldview Strategic Partners IV, L.P., or WSP IV, 110,080 shares of common stock held by Worldview Technology Partners III, L.P, or WTP III, 27,080 shares of common stock held by Worldview Technology International III, L.P., or WTI III, 2,320 shares of common stock held by Worldview Strategic Partners III, L.P., or WSP III and 4,480 shares of common stock held by Worldview III Carrier Fund, L.P., or WCF. James Wei, Mike Orsak and Susumu Tanaka are managing members of and have certain voting rights in Worldview Equity I, L.L.C., which is the General Partner of Worldview Capital IV, L.P., which is the General Partner of WSP IV, WTP IV, and WTI IV. Worldview Equity I, L.L.C. is also the General Partner of Worldview Capital III, L.P., which is the General Partner of WTP III, WTI III, WSP III and WCF. Messrs. Wei, Orsak and Tanaka may be deemed to have shared voting and dispositive power over the shares held by WTP IV, WTI IV, WSP IV, WTP III, WTI III, WSP III and WCF, but each disclaims beneficial ownership except to the extent of his pecuniary interest |
138
Table of Contents
therein. Tim Weingarten is a consultant at Worldview Technology Partners and was a General Partner at Worldview Technology Partners until April 2009. Mr. Weingarten also served as a member of our board of directors until March 2009. |
| (27) | Includes each other selling stockholder who in the aggregate beneficially owns less than 1.0% of our common stock. |
| (28) | This selling stockholder purchased shares of our Series B-1 preferred stock, purchased shares of our Series C-1 preferred stock, exchanged its shares of Series B-1 preferred stock for shares of our Series C-1 preferred stock in connection with our Series C-1 preferred stock financing, exchanged its shares of Series C-1 preferred stock for shares of our Series A preferred stock in connection with our recapitalization effective March 31, 2009, purchased shares of our Series B preferred stock, and exchanged its shares of Series A preferred stock for our Series A-1 preferred stock in connection with our Series B preferred stock financing. See “Certain relationships and related party transactions” for additional information about these transactions. |
| (29) | This selling stockholder received shares of our Series A preferred stock and/or common stock in connection with our acquisition of Legacy Force 10 on March 31, 2009, purchased shares of our Series B preferred stock, and exchanged its shares of Series A preferred stock for our Series A-1 preferred stock in connection with the Series B preferred stock financing. See “Certain relationships and related party transactions” for additional information about these transactions. |
139
Table of Contents
Upon consummation of this offering, our authorized capital stock will consist of 100,000,000 shares of common stock, $0.0001 par value per share, and 5,000,000 shares of preferred stock, $0.0001 par value per share. A description of the material terms and provisions of our certificate of incorporation and bylaws affecting the rights of holders of our capital stock is set forth below. The description is intended as a summary, and is qualified in its entirety by reference to the form of our restated certificate of incorporation and the form of our bylaws to be adopted prior to the completion of this offering filed with the registration statement of which this prospectus is a part.
As of March 31, 2010, and after giving effect to the automatic conversion of all shares of our outstanding convertible preferred stock into an aggregate of 52,733,480 shares of our common stock upon completion of this offering, there were outstanding:
| • | 56,289,880 shares of common stock held by 688 stockholders; |
| • | 7,280,423 shares of common stock issuable upon exercise of outstanding stock options; and |
| • | 5,924,152 shares of common stock issuable upon exercise of outstanding warrants. |
Common stock
Dividend rights. Subject to preferences that may apply to shares of preferred stock outstanding at the time, the holders of outstanding shares of our common stock are entitled to receive dividends out of funds legally available if our board of directors, in its discretion, determines to issue dividends and only then at the times and in the amounts that our board of directors may determine.
Voting rights. Each holder of common stock is entitled to one vote for each share of common stock held on all matters submitted to a vote of stockholders. Our certificate of incorporation does not provide for the right of stockholders to cumulate votes for the election of directors. Our certificate of incorporation establishes a classified board of directors, to be divided into three classes with staggered three-year terms. Only one class of directors will be elected at each annual meeting of our stockholders, with the other classes continuing for the remainder of their respective three-year terms.
No preemptive or similar rights. Our common stock is not entitled to preemptive rights and is not subject to conversion, redemption or sinking fund provisions.
Right to receive liquidation distributions. Upon our dissolution, liquidation or winding-up, the assets legally available for distribution to our stockholders are distributable ratably among the holders of our common stock, subject to prior satisfaction of all outstanding debt and liabilities and the preferential rights and payment of liquidation preferences, if any, on any outstanding shares of preferred stock.
Preferred stock
Upon the completion of this offering, each outstanding share of preferred stock will be converted into common stock.
140
Table of Contents
Following this offering, we will be authorized, subject to limitations prescribed by Delaware law, to issue preferred stock in one or more series, to establish from time to time the number of shares to be included in each series and to fix the designation, powers, preferences and rights of the shares of each series and any of its qualifications, limitations or restrictions. Our board of directors can also increase or decrease the number of shares of any series, but not below the number of shares of that series then outstanding, without any further vote or action by our stockholders. Our board of directors may authorize the issuance of preferred stock with voting or conversion rights that could adversely affect the voting power or other rights of the holders of the common stock. The issuance of preferred stock, while providing flexibility in connection with possible acquisitions and other corporate purposes, could, among other things, have the effect of delaying, deferring, discouraging or preventing a change in control of our company and may adversely affect the market price of our common stock and the voting and other rights of the holders of common stock. We have no current plan to issue any shares of preferred stock.
Options
As of March 31, 2010, we had outstanding options to purchase 7,280,423 shares of our common stock under our 1999 stock plan and our 2007 equity incentive plan.
Rights to purchase our common stock
As of March 31, 2010, certain former holders of our capital stock held rights to purchase up to 3,335 shares of our common stock at $0.27 per share, which rights will expire 210 days after the date of this prospectus.
Warrants
As of March 31, 2010, we had 5,924,152 shares of common stock issuable upon exercise of 260 outstanding warrants, with a weighted average exercise price of $8.96 per share, after giving effect to the automatic conversion of all shares of our outstanding convertible preferred stock into shares of our common stock. The exercise price of each warrant may be paid either in cash or by surrendering the right to receive shares of common stock having a value equal to the exercise price.
Registration rights
Following this offering, certain holders of shares of our common stock and common stock issued upon conversion of our convertible preferred stock and warrants will be entitled to rights with respect to the registration under the Securities Act of a total of 58,882,617 shares, as described below.
Demand registration rights. At any time after the one year anniversary of the completion of this offering, upon the request of holders of at least a majority of the shares having registration rights, we will be obligated to use our commercially reasonable efforts to register such shares, provided that the value of the registrable securities that the holders propose to sell in the offering is at least $10 million. We are required to file no more than two registration statements upon exercise of these demand registration rights. We may postpone the filing of a registration statement for up to 180 days if we determine that the filing would be seriously detrimental to us and our stockholders, and the underwriters of an underwritten offering will have the right to limit, due to marketing reasons, the number of shares registered by these holders on a pro rata basis subject to certain restrictions.
141
Table of Contents
Piggyback registration rights. If we register any of our securities for public sale, the stockholders with registration rights will have the right to include their shares in the registration statement. However, this right does not apply to a registration relating to any of our employee benefit plans or a corporate reorganization. The underwriters of any underwritten offering will have the right to limit, due to marketing reasons, the number of shares registered by these holders on a pro rata basis subject to certain restrictions.
Form S-3 registration rights. Following completion of this offering, the holders of the registrable securities may request in writing that we effect a registration on Form S-3 if the proposed aggregate offering price of the shares to be registered by the holders requesting registration, net of underwriting discounts and commissions, is at least $5 million. We are required to file no more than two registration statements on Form S-3 upon exercise of these rights per 12-month period. We may postpone the filing of a registration statement on Form S-3 for up to 180 days if we determine that the filing would be seriously detrimental to us and our stockholders. The underwriters of any underwritten offering will have the right to limit, due to marketing reasons, the number of shares registered by these holders on a pro rata basis subject to certain restrictions.
Registration expenses. We will pay all expenses incurred in connection with up to two registrations initiated under the demand registration rights, all registrations initiated under the piggyback registration rights and up to two registrations on Form S-3, all as described above and, in each case, except for fees and expenses of legal counsel for the holders of registrable securities, underwriting discounts, selling commissions and transfer taxes. However, subject to limited exceptions, we will not pay for any expenses of any demand registration if the request is subsequently withdrawn by the holders or if the net proceeds requirement of a demand registration is not met.
Expiration of registration rights. The registration rights described above will expire four years after this offering is completed. The registration rights will terminate earlier with respect to a particular stockholder to the extent the shares held by and issuable to such holder may be sold under Rule 144 of the Securities Act in any 90 day period.
Holders of substantially all of our shares with these registration rights have signed agreements with the underwriters or us prohibiting the exercise of their registration rights for 180 days, subject to a possible extension of up to 34 additional days beyond the end of such 180-day period, following the date of this prospectus. These agreements are described below under the section entitled “Underwriting.”
Anti-takeover provisions
Some of the provisions of Delaware law, our certificate of incorporation and our bylaws may have the effect of delaying, deferring, discouraging or preventing another person from acquiring control of our company.
Delaware law
We are subject to the provisions of Section 203 of the Delaware General Corporation Law regulating corporate takeovers. This section prevents some Delaware corporations from engaging, under some circumstances, in a business combination, which includes a merger or sale of at least 10% of the corporation’s assets with any interested stockholder, meaning a
142
Table of Contents
stockholder who, together with affiliates and associates, owns or, within three years prior to the determination of interested stockholder status, did own 15% or more of the corporation’s outstanding voting stock, unless:
| • | the transaction is approved by the board of directors prior to the time that the interested stockholder became an interested stockholder; |
| • | upon consummation of the transaction which resulted in the stockholder’s becoming an interested stockholder, the interested stockholder owned at least 85% of the voting stock of the corporation outstanding at the time the transaction commenced; or |
| • | at or subsequent to such time that the stockholder became an interested stockholder the business combination is approved by the board of directors and authorized at an annual or special meeting of stockholders by at least two-thirds of the outstanding voting stock which is not owned by the interested stockholder. |
A Delaware corporation may “opt out” of these provisions with an express provision in its original certificate of incorporation or an express provision in its certificate or incorporation or bylaws resulting from a stockholders’ amendment approved by at least a majority of the outstanding voting shares. We do not plan to “opt out” of these provisions. The statute could prohibit or delay mergers or other takeover or change in control attempts and, accordingly, may discourage attempts to acquire us.
Charter and bylaw provisions
Our certificate of incorporation or bylaws provide that:
| • | no action may be taken by our stockholders except at an annual or special meeting of our stockholders called in accordance with our bylaws and that our stockholders may not act by written consent; |
| • | our stockholders may not call special meetings of our stockholders or fill vacancies on our board of directors; |
| • | our board of directors is divided into three classes and the directors in each class will serve for a three-year term, with our stockholders electing one class each year; |
| • | our board of directors may designate the terms of and issue a new series of preferred stock with voting or other rights without stockholder approval; |
| • | the approval of holders of two-thirds of the shares entitled to vote at an election of directors will be required to adopt, amend or repeal our bylaws or amend or repeal the provisions of our bylaws or repeal the provisions of our certificate of incorporation regarding the fixing of the authorized number of directors, the election and removal of directors, the classification of our board of directors into three classes, indemnification of directors and the ability of stockholders to take action or call special meetings of stockholders; |
| • | a majority of the authorized number of directors will have the power to adopt, amend or repeal our bylaws without stockholder approval; |
| • | our stockholders may not cumulate votes in the election of directors; |
| • | directors can only be removed for cause by the holders of at least two-thirds of the shares entitled to vote at an election of directors; and |
143
Table of Contents
| • | we will indemnify directors and officers against losses that they may incur in investigations and legal proceedings resulting from their services to us, which may include services in connection with takeover defense measures. |
These provisions of our certificate of incorporation or bylaws may have the effect of delaying, deferring, discouraging or preventing another person or entity from acquiring control of us.
Listing
We are applying to list our common stock for trading on the New York Stock Exchange under the symbol “FCTN.”
Transfer agent and registrar
The transfer agent and registrar for our common stock is Computershare Trust Company, N.A.
144
Table of Contents
Shares eligible for future sale
Prior to this offering, there has not been any public market for our common stock, and we make no prediction as to the effect, if any, that market sales of shares of common stock or the availability of shares of common stock for sale will have on the market price of common stock prevailing from time to time. Nevertheless, sales of substantial amounts of common stock in the public market, or the perception that such sales could occur, could adversely affect the market price of common stock and could impair our future ability to raise capital through the sale of equity securities.
Upon the completion of this offering, we will have an aggregate of shares of common stock outstanding, assuming no exercise of the underwriters’ over-allotment option and no exercise of outstanding options, warrants or rights. Of the outstanding shares, all of the shares sold in this offering, plus any additional shares sold upon exercise of the underwriters’ over-allotment option, will be freely tradable, except that any shares purchased by “affiliates” (as that term is defined in Rule 144 under the Securities Act) may only be sold in compliance with the limitations described below. Taking into consideration the effect of the lock-up agreements described below and the provisions of Rule 144 and Rule 701 under the Securities Act, based on an assumed IPO date of July 31, 2010, the remaining shares of our common stock will be available for sale in the public market as follows:
| • | no shares will be eligible for sale on the date of this prospectus; |
| • | shares will be eligible for sale upon the expiration of the lock-up agreements described below; and |
| • | the remaining shares will be eligible for sale in the public market from time to time thereafter upon the lapse of our right of repurchase with respect to any unvested shares. |
Lock-up agreements
Our directors and executive officers and substantially all of our securityholders have entered into lock-up agreements with the underwriters that generally provide, subject to certain exceptions, that each of these persons or entities, for a period of 180 days after the date of this prospectus, may not, without the prior written consent of J.P. Morgan Securities Inc., Deutsche Bank Securities Inc. and Barclays Capital Inc., (1) offer, pledge, announce the intention to sell, sell, contract to sell, sell any option or contract to purchase, purchase any option or contract to sell, grant any option, right or warrant to purchase, or otherwise transfer or dispose of, directly or indirectly, any shares of our common stock or any securities convertible into or exercisable or exchangeable for common stock (including common stock or such other securities which may be deemed to be beneficially owned by such persons in accordance with the rules and regulations of the SEC and securities which may be issued upon exercise of a stock option or warrant); (2) enter into any swap or other agreement that transfers, in whole or in part, any of the economic consequences of ownership of our common stock or such other securities, whether any such transaction described in clause (1) or (2) above is to be settled by delivery of common stock or such other securities, in cash or otherwise or (3) make any demand for or exercise any right with respect to the registration of any shares of common stock or any security convertible into or exercisable or exchangeable for common stock (other than the exercise of incidental registration rights pursuant to the terms of outstanding agreements between such securityholder and us in connection with a registered public offering to which the underwriters’ representatives have consented), in each case other than the shares of common stock sold by the selling stockholders in this offering.
145
Table of Contents
Apart from the lock-up agreements described above, all directors, executive officers and securityholders are subject to lock-up obligations directly with us, including that: all holders of warrants and preferred stock are subject to the lock-up provisions in our amended and restated investors’ rights agreement; all recipients of awards under our equity incentive plans are subject to the lock-up provisions within those plans; and all securityholders are subject to the lock-up provisions within our certificate of incorporation.
The 180-day restricted periods described above are subject to extension such that, in the event that either (1) during the last 17 days of the 180-day restricted period, we issue an earnings release or material news or a material event or a material event relating to us occurs or (2) prior to the expiration of the 180-day restricted period, we announce that we will release earnings results during the 16-day period beginning on the last day of the 180-day period, the restrictions on offers, pledges, sales, agreements to sell or other dispositions of common stock or securities convertible into or exchangeable or exercisable for shares of our common stock described above will continue to apply until the expiration of the 18-day period beginning on the issuance of the earnings release.
Rule 144
In general, under Rule 144 as currently in effect, once we have been subject to public company reporting requirements for at least 90 days, a person who is not deemed to have been one of our affiliates for purposes of the Securities Act at any time during 90 days preceding a sale and who has beneficially owned the shares proposed to be sold for at least six months, including the holding period of any prior owner other than our affiliates, is entitled to sell such shares without complying with the manner of sale, volume limitation or notice provisions of Rule 144, subject to compliance with the public information requirements of Rule 144. If such a person has beneficially owned the shares proposed to be sold for at least one year, including the holding period of any prior owner other than our affiliates, then such person is entitled to sell such shares without complying with any of the requirements of Rule 144.
In general, under Rule 144, as currently in effect, our affiliates or persons selling shares on behalf of our affiliates are entitled to sell, upon expiration of the lock-up agreements described above, within any three-month period beginning 90 days after the date of this prospectus, a number of shares that does not exceed the greater of:
| • | 1% of the number of shares of common stock then outstanding, which will equal approximately shares immediately after this offering; or |
| • | the average weekly trading volume of the common stock during the four calendar weeks preceding the filing of a notice on Form 144 with respect to such sale. |
Sales under Rule 144 by our affiliates or persons selling shares on behalf of our affiliates are also subject to certain manner of sale provisions and notice requirements and to the availability of current public information about us.
Rule 701
Rule 701 generally allows a stockholder who purchased shares of our common stock pursuant to a written compensatory plan or contract and who is not deemed to have been an affiliate of our company during the immediately preceding 90 days to sell these shares in reliance upon Rule 144,
146
Table of Contents
but without being required to comply with the public information, holding period, volume limitation or notice provisions of Rule 144. Rule 701 also permits affiliates of our company to sell their Rule 701 shares under Rule 144 without complying with the holding period requirements of Rule 144. All holders of Rule 701 shares, however, are required to wait until 90 days after the date of this prospectus before selling such shares pursuant to Rule 701.
Stock options
We intend to file a registration statement on Form S-8 under the Securities Act covering all of the shares of our common stock subject to options outstanding or reserved for issuance under our stock plans and shares of our common stock issued upon the exercise of options by employees. We expect to file this registration statement as soon as practicable after this offering. However, the shares registered on Form S-8 will be subject to volume limitations, manner of sale, notice and public information requirements of Rule 144, in the case of our affiliates, and will not be eligible for resale until expiration of the lock-up agreements to which they are subject.
Registration rights
Upon completion of this offering, the holders of an aggregate of shares of our common stock, or their transferees, will be entitled to rights with respect to the registration of their shares under the Securities Act. Registration of these shares under the Securities Act would result in these shares becoming freely tradeable without restriction under the Securities Act immediately upon the effectiveness of such registration. For a further description of these rights, see the section entitled “Description of capital stock—Registration rights.”
147
Table of Contents
Material United States federal income tax
consequences to non-U.S. holders
The following is a summary of certain material U.S. federal income tax and estate tax consequences of the ownership and disposition of our common stock to non-U.S. holders, but does not purport to be a complete analysis of all the potential tax considerations relating thereto. This summary is based upon the provisions of the Internal Revenue Code, Treasury regulations promulgated thereunder, administrative rulings and judicial decisions, all as of the date hereof. These authorities may be changed at any time, possibly retroactively, or the Internal Revenue Service, the IRS, might interpret the existing authorities differently, so as to result in U.S. federal income or estate tax consequences different from those set forth below. As a result, we cannot assure you that the tax consequences described in this discussion will not be challenged by the IRS or will be sustained by a court if challenged by the IRS.
This summary does not address the tax considerations arising under the laws of any non-U.S., state or local jurisdiction or under U.S. federal gift and estate tax laws, except to the limited extent below. In addition, this discussion does not address tax considerations applicable to an investor’s particular circumstances or to investors that may be subject to special tax rules, including, without limitation:
| • | banks, insurance companies or other financial institutions; |
| • | regulated investment companies; |
| • | partnerships or arrangements treated as partnerships or other pass-through entities for U.S. federal tax purposes (or investors in such entities); |
| • | certain former citizens or long-term residents of the United States; |
| • | a “controlled foreign corporation” or “passive foreign investment company;” |
| • | a corporation that accumulates earnings to avoid U.S. federal income tax; |
| • | persons subject to the alternative minimum tax; |
| • | tax-exempt organizations; |
| • | dealers in securities or currencies; |
| • | traders in securities that elect to use a mark-to-market method of accounting for their securities holdings; |
| • | persons that own, or are deemed to own, more than five percent of our capital stock (except to the extent specifically set forth below); |
| • | certain former citizens or long term residents of the United States; |
| • | persons who hold our common stock as a position in a hedging transaction, “straddle,” “conversion transaction” or other risk reduction transaction; |
| • | persons who do not hold our common stock as a capital asset within the meaning of Section 1221 of the Internal Revenue Code (generally, for investment purposes); or |
| • | persons deemed to sell our common stock under the constructive sale provisions of the Internal Revenue Code. |
148
Table of Contents
In addition, if a partnership or entity classified as a partnership for U.S. federal income tax purposes holds our common stock, the tax treatment of a partner generally will depend on the status of the partner and upon the activities of the partnership. Accordingly, partnerships that hold our common stock, and partners in such partnerships, should consult their tax advisors.
You are urged to consult your tax advisor with respect to the application of the U.S. federal income tax laws to your particular situation, as well as any tax consequences of the purchase, ownership and disposition of our common stock arising under the U.S. federal estate or gift tax rules or under the laws of any state, local, non-U.S. or other taxing jurisdiction or under any applicable tax treaty.
Non-U.S. holder defined
For purposes of this discussion, you are a non-U.S. holder if you are any holder that is not:
| • | an individual citizen or resident of the United States; |
| • | a corporation or other entity taxable as a corporation created or organized in the United States or under the laws of the United States or any political subdivision thereof; |
| • | an estate whose income is subject to U.S. federal income tax regardless of its source; or |
| • | a trust (x) whose administration is subject to the primary supervision of a U.S. court and which has one or more U.S. persons who have the authority to control all substantial decisions of the trust or (y) which has made an valid election in effect under applicable United States Treasury regulations to be treated as a U.S. person. |
If you are a non-U.S. holder that is an individual, you may, in many cases, be deemed to be a resident alien, as opposed to a nonresident alien, by virtue of being present in the United States for at least 31 days in the calendar year and for an aggregate of at least 183 days during a three-year period ending in the current calendar year. For these purposes, all the days present in the current year, one-third of the days present in the immediately preceding year, and one-sixth of the days present in the second preceding year are counted. Resident aliens are subject to U.S. federal income tax as if they were U.S. citizens. Such an individual is urged to consult his or her own tax advisor regarding the U.S. federal income tax consequences of the sale, exchange or other disposition of our common stock. See “—Gain on disposition of common stock.”
Distributions
We have not made any distributions on our common stock, and we do not plan to make any distributions for the foreseeable future. However, if we do make distributions on our common stock, those payments will constitute dividends for U.S. tax purposes to the extent paid from our current or accumulated earnings and profits, as determined under U.S. federal income tax principles. To the extent those distributions exceed both our current and our accumulated earnings and profits, they will constitute a return of capital and will first reduce your basis in our common stock, but not below zero, and then will be treated as gain from the sale of stock.
Any dividend paid to you generally will be subject to U.S. withholding tax either at a rate of 30% of the gross amount of the dividend or such lower rate as may be specified by an applicable income tax treaty between the U.S. and your country of residence. In order to receive a reduced treaty rate, you must provide us or our paying agent with an IRS Form W-8BEN or other appropriate version of IRS Form W-8 certifying qualification for the reduced rate. You should
149
Table of Contents
consult your tax advisors regarding your entitlement to benefits under a relevant income tax treaty. If the holder holds the stock through a financial institution or other agent acting on the holder’s behalf, the holder will be required to provide appropriate documentation to the agent. The holder’s agent will then be required to provide certification to us or our paying agent, either directly or through other intermediaries.
Dividends received by you that are effectively connected with your conduct of a U.S. trade or business (and, if an income tax treaty between the United States and your country of residence applies, attributable to a permanent establishment maintained by you in the United States or, in the case of an individual, a fixed base maintained by you in the United States) are exempt from such withholding tax. In order to obtain this exemption, you must provide us with an IRS Form W-8ECI properly certifying such exemption. Such effectively connected dividends, although not subject to withholding tax, are taxed at the same graduated rates applicable to U.S. persons, net of certain deductions and credits, subject to any applicable tax treaty providing otherwise. In addition to the graduated tax described above, if you are a corporate non-U.S. holder, dividends you receive that are effectively connected with your conduct of a U.S. trade or business may also be subject to a branch profits tax at a rate of 30% or such lower rate as may be specified by an applicable income tax treaty between the U.S. and your country of residence. You should consult your tax advisor regarding your entitlement to benefits under a relevant income tax treaty.
If you are eligible for a reduced rate of withholding tax pursuant to a tax treaty, you may be able to obtain a refund or credit of any excess amounts currently withheld if you timely file an appropriate claim for refund with the IRS.
Gain on disposition of common stock
You generally will not be required to pay U.S. federal income tax on any gain realized upon the sale or other disposition of our common stock unless:
| • | the gain is effectively connected with your conduct by you of a U.S. trade or business (and, if an income tax treaty between the United States and your country of residence applies, the gain is attributable to a permanent establishment maintained by you in the United States or, in the case of an individual, a fixed base maintained by you in the United States); |
| • | you are an individual who is present in the United States for a period or periods aggregating 183 days or more during the calendar year in which the sale or disposition occurs and certain other conditions are met; or |
| • | our common stock constitutes a U.S. real property interest by reason of our status as a “U.S. real property holding corporation” for U.S. federal income tax purposes, or a USRPHC, at any time within the shorter of the five-year period preceding the disposition or your holding period for our common stock. |
In general, we would be a USRPHC if interests in United States real estate comprised at least half of our assets. We believe that we are not currently and will not become a USRPHC. However, because the determination of whether we are a USRPHC depends on the fair market value of our U.S. real property relative to the fair market value of our other business assets, there can be no assurance that we will not become a USRPHC in the future. Even if we become a USRPHC, however, as long as our common stock is regularly traded on an established securities market, such common stock will be treated as a U.S. real property interest only if you actually or constructively hold more than five percent of such regularly traded common stock at any time during the period described above.
150
Table of Contents
If you are a non-U.S. holder described in the first bullet above, you will generally be required to pay tax on the net gain derived from the sale (net of certain deductions or credits) under regular graduated U.S. federal income tax rates, and corporate non-U.S. holders described in the first bullet above may be subject to branch profits tax at a 30% rate or such lower rate as may be specified by an applicable income tax treaty. If you are an individual non-U.S. holder described in the second bullet above, you will be required to pay a flat 30% tax or such reduced rate as may be specified by an applicable income tax treaty on the gain derived from the sale, which tax may be offset by U.S. source capital losses (even though you are not considered a resident of the United States). You should consult any applicable income tax or other treaties between the United States and your country of residence that may provide for different rules.
Federal estate tax
The estates of nonresident alien individuals generally are subject to U.S. federal estate tax on property with a U.S. situs. Because we are a U.S. corporation, our common stock held (or treated as such) by an individual non-U.S. holder at the time of death will be included in such holder’s gross estate for U.S. federal estate tax purposes, unless an applicable estate tax treaty between the United States and such holder’s country of residence provides otherwise.
Backup withholding and information reporting
Generally, we must report annually to the IRS the amount of dividends paid to you, your name and address and the amount of tax withheld, if any. A similar report will be sent to you. Pursuant to applicable income tax treaties or other agreements, the IRS may make these reports available to tax authorities in your country of residence.
Payments of dividends or of proceeds on the disposition of stock made to you may be subject to additional information reporting and backup withholding at a current rate of 28% unless you establish an exemption, for example by properly certifying your non-U.S. status on a Form W-8BEN or another appropriate version of IRS Form W-8. Notwithstanding the foregoing, backup withholding and information reporting may apply if either we or our paying agent has actual knowledge, or reason to know, that you are a U.S. person. Additional rules relating to information reporting requirements and backup withholding with respect to the payment of proceeds from the disposition of shares of our common stock will apply as follows:
| • | If the proceeds are paid to or through the U.S. office of a broker (U.S. or non-U.S.), they generally will be subject to backup withholding and information reporting, unless you certify that you are not a U.S. person under penalties of perjury (usually on an IRS Form W-8BEN) or otherwise establish an exemption; |
| • | if the proceeds are paid to or through a non-U.S. office of a broker that is not a “U.S. person,” they will generally not be subject to backup withholding or information reporting; and |
| • | if the proceeds are paid to or through a non-U.S. office of a broker that is (1) a U.S. person, (2) a non-U.S. person 50% or more of whose gross income from certain periods is effectively connected with a U.S. trade or business or (3) a foreign partnership if at any time during its tax year (a) one or more of its partners are U.S. persons who, in the aggregate, hold more than 50% of the income or capital interests of the partnership or (b) the foreign partnership is engaged in a U.S. trade or business, they generally will be subject to information reporting (but not backup withholding), unless you certify that you are not a U.S. person under penalties of perjury (usually on an IRS Form W-8BEN) or otherwise establish an exemption. |
151
Table of Contents
Backup withholding is not an additional tax; rather, the U.S. income tax liability of persons subject to backup withholding will be reduced by the amount of tax withheld. If withholding results in an overpayment of taxes, a refund or credit may generally be obtained from the IRS, provided that the required information is furnished to the IRS in a timely manner.
Recently enacted legislation affecting taxation of our common stock held by or through foreign entities
Recently enacted legislation generally will impose a U.S. federal withholding tax of 30% on dividends and the gross proceeds of a disposition of our common stock paid after December 31, 2012 to a foreign financial institution unless such institution enters into an agreement with the U.S. government to withhold on certain payments and to collect and provide to the U.S. tax authorities substantial information regarding U.S. account holders of such institution (which includes certain equity and debt holders of such institution, as well as certain account holders that are foreign entities with U.S. owners). The legislation also will generally impose a U.S. federal withholding tax of 30% on dividends and the gross proceeds of a disposition of our common stock paid after December 31, 2012 to a non-financial foreign entity unless such entity provides the withholding agent with a certification identifying the direct and indirect U.S. owners of the entity. Under certain circumstances, a non-U.S. holder might be eligible for refunds or credits of such taxes. Prospective investors are encouraged to consult with their own tax advisors regarding the possible implications of this legislation on their investment in our common stock.
The preceding discussion of U.S. federal tax considerations is for general information only. It is not tax advice. Each prospective investor should consult the prospective investor’s own tax advisor regarding the particular U.S. federal, state and local and non-U.S. tax consequences of purchasing, holding and disposing of our common stock, including the consequences of any proposed change in applicable laws.
152
Table of Contents
We and the selling stockholders are offering the shares of common stock described in this prospectus through a number of underwriters. J.P. Morgan Securities Inc., Deutsche Bank Securities Inc. and Barclays Capital Inc. are acting as joint book-running managers of the offering and as representatives of the underwriters. We and the selling stockholders have entered into an underwriting agreement with the underwriters. Subject to the terms and conditions of the underwriting agreement, we and the selling stockholders have agreed to sell to the underwriters, and each underwriter has severally agreed to purchase, at the public offering price less the underwriting discounts and commissions set forth on the cover page of this prospectus, the number of shares of common stock listed next to its name in the following table:
| Name | Number of shares | |
J.P. Morgan Securities Inc. | ||
Deutsche Bank Securities Inc. | ||
Barclays Capital Inc. | ||
Robert W. Baird & Co. | ||
Cowen and Company, LLC | ||
RBC Capital Markets Corporation | ||
Pacific Crest Securities LLC | ||
Total | ||
The underwriters are offering the shares of common stock subject to their acceptance of the shares from us and the selling stockholders and subject to prior sale. The underwriters are obligated to take and pay for all of the shares of common stock offered by this prospectus if any such shares are taken. However, the underwriters are not required to take or pay for the shares covered by the underwriters’ option to purchase additional shares described below. The underwriting agreement also provides that if an underwriter defaults, the purchase commitments of nondefaulting underwriters may be increased or the offering may be terminated.
The underwriters propose to offer the common stock directly to the public at the IPO price set forth on the cover page of this prospectus and to certain dealers at that price less a concession not in excess of $ per share. Any such dealers may resell shares to certain other brokers or dealers at a discount of up to $ per share from the IPO price. After the IPO of the shares, the offering price and other selling terms may be changed by the underwriters. Sales of shares made outside of the United States may be made by affiliates of the underwriters. The underwriters have informed us that they do not intend sales to discretionary accounts to exceed 5% of the total number of shares of common stock offered by them. The underwriters have informed us that they do not intend to confirm sales to discretionary accounts without the prior specific written approval of the customer.
The underwriters have an option to buy up to additional shares of common stock from us to cover sales of shares by the underwriters which exceed the number of shares specified in the table above. The underwriters have 30 days from the date of this prospectus to exercise this over-allotment option. If any shares are purchased with this over-allotment option, the underwriters
153
Table of Contents
will purchase shares in approximately the same proportion as shown in the table above. If any additional shares of common stock are purchased, the underwriters will offer the additional shares on the same terms as those on which the shares are being offered.
The underwriting fee is equal to the public offering price per share of common stock less the amount paid by the underwriters to us and the selling stockholders per share of common stock. The underwriting discounts and commissions are $ per share. The following table shows the per share and total underwriting discounts and commissions that we and the selling stockholders are to pay to the underwriters in connection with this offering. These amounts are shown assuming both no exercise and full exercise of the underwriters’ option to purchase additional shares.
| Per share | Total | |||||||||||
| Without exercise of option to purchase additional shares | With exercise of option to purchase additional shares | Without exercise of option to purchase additional shares | With exercise of option to purchase additional shares | |||||||||
Underwriting discounts and commissions paid by us | $ | $ | $ | $ | ||||||||
Expenses payable by us | $ | $ | $ | $ | ||||||||
Underwriting discounts and commissions paid by the selling stockholders | $ |
| $ |
| $ | $ | ||||||
We estimate that the total expenses of this offering, including registration, filing and listing fees, printing fees and legal and accounting expenses, but excluding the underwriting discounts and commissions, will be approximately $ .
A prospectus in electronic format may be made available on the web sites maintained by one or more underwriters, or selling group members, if any, participating in the offering. The underwriters may agree to allocate a number of shares to underwriters and selling group members for sale to their online brokerage account holders. Internet distributions will be allocated by the representatives to underwriters and selling group members that may make Internet distributions on the same basis as other allocations.
We have agreed that we will not (i) offer, pledge, announce the intention to sell, sell, contract to sell, sell any option or contract to purchase, purchase any option or contract to sell, grant any option, right or warrant to purchase or otherwise transfer or dispose of, directly or indirectly, file with the SEC a registration statement relating to our common stock or any securities convertible into or exercisable or exchangeable for common stock or (ii) enter into any swap or other agreement that transfers, in whole or in part, any of the economic consequences of ownership of the common stock or such other securities, whether any such transaction described in clause (i) or (ii) above is to be settled by delivery of common stock or such other securities, in cash or otherwise, without the prior written consent of the representatives for the underwriters.
The following are some exceptions to the restrictions described in the preceding paragraph:
| • | the grants of stock awards under our stock-based compensation plans; |
| • | shares of common stock issued upon exercise or settlement of awards granted under our stock-based compensation plans; and |
| • | shares of common stock issuable upon exercise of outstanding warrants to purchase shares of our common stock. |
154
Table of Contents
Notwithstanding the foregoing, if (1) during the last 17 days of the 180-day restricted period, we issue an earnings release or material news or a material event relating to us occurs; or (2) prior to the expiration of the 180-day restricted period, we announce that we will release earnings results during the 16-day period beginning on the last day of the 180-day period, the restrictions described above shall continue to apply until the expiration of the 18-day period beginning on the issuance of the earnings release or the occurrence of the material news or material event.
Our directors and executive officers and substantially all of our stockholders have entered into lock-up agreements with the underwriters that generally provide that each of these persons or entities, for a period of 180 days after the date of this prospectus, may not, without the prior written consent of J.P. Morgan Securities Inc., Deutsche Bank Securities Inc. and Barclays Capital Inc., (1) offer, pledge, announce the intention to sell, sell, contract to sell, sell any option or contract to purchase, purchase any option or contract to sell, grant any option, right or warrant to purchase, or otherwise transfer or dispose of, directly or indirectly, any shares of our common stock or any securities convertible into or exercisable or exchangeable for common stock (including without limitation, common stock or such other securities which may be deemed to be beneficially owned by such persons in accordance with the rules and regulations of the SEC and securities which may be issued upon exercise of a stock option or warrant); (2) enter into any swap or other agreement that transfers, in whole or in part, any of the economic consequences of ownership of our common stock or such other securities, whether any such transaction described in clause (1) or (2) above is to be settled by delivery of common stock or such other securities, in cash or otherwise; or (3) make any demand for or exercise any right with respect to the registration of any shares of common stock or any security convertible into or exercisable or exchangeable for common stock (other than the exercise of incidental registration rights pursuant to the terms of outstanding agreements between such stockholder and us in connection with a registered public offering to which the underwriters’ representatives have consented), in each case other than the shares of common stock sold by the selling stockholders in this offering.
The following are some exceptions to the restrictions described in the preceding paragraph:
| • | the transfer of shares of common stock by bona fide gift or gifts; |
| • | the distribution of shares of common stock to partners, members or stockholders of our stockholders; and |
| • | entering into a written plan meeting the requirements of Rule 10b5-1 under the Exchange Act, provided that no sales of our securities will occur under such plan during the 180-day restrictive period or any extension thereof, and no public disclosure of any such action is required or voluntarily made by any person during the 180-day restrictive period or any extension thereof. |
Notwithstanding the foregoing, if (1) during the last 17 days of the 180-day restricted period, we issue an earnings release or material news or a material event relating to our company occurs; or (2) prior to the expiration of the 180-day restricted period, we announce that we will release earnings results during the 16-day period beginning on the last day of the 180-day period, the restrictions described above shall continue to apply until the expiration of the 18-day period beginning on the issuance of the earnings release or the occurrence of the material news or material event.
We and the selling stockholders have agreed to indemnify the underwriters against certain liabilities, including liabilities under the Securities Act of 1933.
155
Table of Contents
We are applying to list our common stock for trading on the New York Stock Exchange under the symbol “FCTN.”
In connection with this offering, the underwriters may engage in stabilizing transactions, which involves making bids for, purchasing and selling shares of common stock in the open market for the purpose of preventing or retarding a decline in the market price of the common stock while this offering is in progress. These stabilizing transactions may include making short sales of the common stock, which involves the sale by the underwriters of a greater number of shares of common stock than they are required to purchase in this offering, and purchasing shares of common stock on the open market to cover positions created by short sales. Short sales may be “covered” shorts, which are short positions in an amount not greater than the underwriters’ over-allotment option referred to above, or may be “naked” shorts, which are short positions in excess of that amount. The underwriters may close out any covered short position either by exercising their over-allotment option, in whole or in part, or by purchasing shares in the open market. In making this determination, the underwriters will consider, among other things, the price of shares available for purchase in the open market compared to the price at which the underwriters may purchase shares through the over-allotment option. A naked short position is more likely to be created if the underwriters are concerned that there may be downward pressure on the price of the common stock in the open market that could adversely affect investors who purchase in this offering. To the extent that the underwriters create a naked short position, they will purchase shares in the open market to cover the position.
The underwriters have advised us that, pursuant to Regulation M promulgated under the Securities Act, they may also engage in other activities that stabilize, maintain or otherwise affect the price of the common stock, including the imposition of penalty bids. This means that if the representatives of the underwriters purchase common stock in the open market in stabilizing transactions or to cover short sales, the representatives can require the underwriters that sold those shares as part of this offering to repay the underwriting discount received by them.
These activities may have the effect of raising or maintaining the market price of the common stock or preventing or retarding a decline in the market price of the common stock, and, as a result, the price of the common stock may be higher than the price that otherwise might exist in the open market. If the underwriters commence these activities, they may discontinue them at any time. The underwriters may carry out these transactions on the New York Stock Exchange, in the over-the-counter market or otherwise.
Prior to this offering, there has been no public market for our common stock. The IPO price will be determined by negotiations among us, the selling stockholders and the representatives of the underwriters. In determining the IPO price, we, the selling stockholders and the representatives of the underwriters expect to consider a number of factors including:
| • | the information set forth in this prospectus and otherwise available to the representatives; |
| • | our prospects and the history and prospects for the industry in which we compete; |
| • | an assessment of our management; |
| • | our prospects for future earnings; |
| • | the general condition of the securities markets at the time of this offering; |
156
Table of Contents
| • | the recent market prices of, and demand for, publicly traded common stock of generally comparable companies; and |
| • | other factors deemed relevant by the underwriters and us. |
Neither we nor the underwriters can assure investors that an active trading market will develop for our common stock, or that the shares will trade in the public market at or above the IPO price.
Other than in the United States, no action has been taken by us or the underwriters that would permit a public offering of the securities offered by this prospectus in any jurisdiction where action for that purpose is required. The securities offered by this prospectus may not be offered or sold, directly or indirectly, nor may this prospectus or any other offering material or advertisements in connection with the offer and sale of any such securities be distributed or published in any jurisdiction, except under circumstances that will result in compliance with the applicable rules and regulations of that jurisdiction. Persons into whose possession this prospectus comes are advised to inform themselves about and to observe any restrictions relating to the offering and the distribution of this prospectus. This prospectus does not constitute an offer to sell or a solicitation of an offer to buy any securities offered by this prospectus in any jurisdiction in which such an offer or a solicitation is unlawful.
Our shares of common stock may not be offered or sold and will not be offered or sold to any persons in the United Kingdom other than persons whose ordinary activities involve them in acquiring, holding, managing or disposing of investments (as principal or as agent) for the purposes of their businesses and in compliance with all applicable provisions of the Financial Services and Markets Act 2000, or FSMA, with respect to anything done in relation to our common stock in, from or otherwise involving the United Kingdom.
In addition:
| • | an invitation or inducement to engage in investment activity (within the meaning of Section 21 of the FMSA) has only been communicated or caused to be communicated and will only be communicated or caused to be communicated in connection with the issue or sale of the shares of common stock in circumstances in which Section 21(1) of the FSMA does not apply to us; and |
| • | all applicable provisions of the FSMA have been complied with and will be complied with, with respect to anything done in relation to the shares of common stock in, from or otherwise involving the United Kingdom. |
In relation to each Member State of the European Economic Area which has implemented the Prospectus Directive, each, a Relevant Member State, from and including the date on which the European Union Prospectus Directive, or the EU Prospectus Directive, is implemented in that Relevant Member State, which we refer to as the Relevant Implementation Date, an offer of shares of common stock described in this prospectus may not be made to the public in that Relevant Member State prior to the publication of a prospectus in relation to the shares of common stock which has been approved by the competent authority in that Relevant Member State or, where appropriate, approved in another Relevant Member State and notified to the competent authority in that Relevant Member State, all in accordance with the EU Prospectus Directive, except that it may, with effect from and including the Relevant Implementation Date, make an offer of shares of common stock to the public in that Relevant Member State at any time:
| • | to legal entities which are authorized or regulated to operate in the financial markets or, if not so authorized or regulated, whose corporate purpose is solely to invest in securities; |
157
Table of Contents
| • | to any legal entity which has two or more of (1) an average of at least 250 employees during the last financial year; (2) a total balance sheet of more than€43,000,000 and (3) an annual net turnover of more than€50,000,000, as shown in its last annual or consolidated accounts; |
| • | to fewer than 100 natural or legal persons (other than qualified investors as defined in the EU Prospectus Directive) subject to obtaining the prior consent of the book-running managers for any such offer; or |
| • | in any other circumstances which do not require the publication by the Issuer of a prospectus pursuant to Article 3 of the EU Prospectus Directive. |
For the purposes of this provision, the expression an “offer of shares to the public” in relation to any shares of common stock in any Relevant Member State means the communication in any form and by any means of sufficient information on the terms of the offer and the shares of common stock to be offered so as to enable an investor to decide to purchase or subscribe for the shares of common stock, as the same may be varied in that Member State by any measure implementing the EU Prospectus Directive in that Member State and the expression EU Prospectus Directive means Directive 2003/71/EC and includes any relevant implementing measure in each Relevant Member State.
Certain of the underwriters and their affiliates have provided in the past to us and our affiliates and may provide from time to time in the future certain commercial banking, financial advisory, investment banking and other services for us and such affiliates in the ordinary course of their business, for which they have received and may continue to receive customary fees and commissions. In addition, from time to time, certain of the underwriters and their affiliates may effect transactions for their own account or the account of customers, and hold on behalf of themselves or their customers, long or short positions in our debt or equity securities or loans, and may do so in the future.
158
Table of Contents
The validity of the shares of common stock offered hereby will be passed upon for us by Fenwick & West LLP, Mountain View, California. Certain legal matters in connection with this offering will be passed upon for the underwriters by Wilson Sonsini Goodrich & Rosati, Professional Corporation, Palo Alto, California.
The consolidated financial statements of Force10 Networks, Inc. (formerly Turin Networks, Inc.) and subsidiaries as of September 30, 2008 and 2009 and for each of the three years in the period ended September 30, 2009 included in this prospectus have been audited by Deloitte & Touche LLP, an independent registered public accounting firm, as stated in their report appearing herein. Such financial statements have been so included in reliance upon the report of such firm given upon their authority as experts in accounting and auditing.
The consolidated financial statements of Force10 Networks, Inc. (Legacy Force10) and subsidiaries as of October 31, 2007 and 2008 and for each of the three years in the period ended October 31, 2008 included in this prospectus have been audited by Deloitte & Touche LLP, independent auditors, as stated in their report appearing herein (which report expresses an unqualified opinion and includes an explanatory paragraph relating to the uncertainty of Legacy Force10’s ability to continue as a going concern and an explanatory paragraph stating that Legacy Force10 was acquired on March 31, 2009). Such financial statements have been so included in reliance upon the report of such firm given upon their authority as experts in accounting and auditing.
The consolidated financial statements of Carrier Access and subsidiaries as of December 31, 2007 and for each of the years in the two years ended December 31, 2007 appearing in this prospectus and registration statement have been audited by Hein & Associates LLP, an independent registered public accounting firm, as stated in their report appearing elsewhere herein, and are included in reliance upon such report given on the authority of such firm as experts in accounting and auditing.
159
Table of Contents
Where you can find more information
We have filed with the SEC a registration statement on Form S-1 under the Securities Act with respect to the shares of common stock we are offering. The registration statement, including the attached exhibits and schedules, contains additional relevant information about us and our common stock. This prospectus does not contain all of the information set forth in the registration statement and the exhibits and schedules thereto. The rules and regulations of the SEC allow us to omit from this prospectus certain information included in the registration statement.
For further information about us and our common stock, you may inspect a copy of the registration statement and the exhibits and schedules to the registration statement without charge at the offices of the SEC at 100 F Street, N.E., Washington, D.C. 20549. You may obtain copies of all or any part of the registration statement from the Public Reference Section of the SEC, 100 F Street, N.E., Washington, D.C. 20549 upon the payment of the prescribed fees. You may obtain information on the operation of the Public Reference Room by calling the SEC at 1-800-SEC-0330. The SEC maintains a website at www.sec.gov that contains reports, proxy and information statements and other information regarding registrants like us that file electronically with the SEC. You can also inspect our registration statement on this website.
Upon completion of this offering, we will become subject to the reporting and information requirements of the Securities Exchange Act of 1934, as amended, and we will file reports, proxy statements and other information with the SEC.
160
Table of Contents
Index to consolidated financial statements
Force10 Networks, Inc. (formerly Turin Networks, Inc.) | ||
| F-2 | ||
| F-3 | ||
| F-4 | ||
F-6 | ||
| F-10 | ||
| F-12 | ||
Unaudited pro forma condensed combined financial statements | ||
Unaudited pro forma condensed combined statement of operations | F-56 | |
Notes to unaudited pro forma condensed combined financial statements | F-59 | |
Force10 Networks, Inc. (Legacy Force10) | ||
| F-63 | ||
| F-64 | ||
| F-65 | ||
Consolidated statements of stockholders’ equity and comprehensive loss | F-66 | |
| F-71 | ||
| F-72 | ||
Carrier Access Corporation | ||
| F-112 | ||
| F-113 | ||
| F-114 | ||
| F-115 | ||
Consolidated statements of stockholders’ equity and comprehensive income (loss) | F-116 | |
| F-117 | ||
F-1
Table of Contents
Report of independent registered public accounting firm
To the Board of Directors and Stockholders of
Force10 Networks, Inc.:
We have audited the accompanying consolidated balance sheets of Force10 Networks, Inc. (formerly known as Turin Networks, Inc.) and subsidiaries (the Company) as of September 30, 2008 and 2009, and the related consolidated statements of operations, redeemable convertible preferred stock, stockholders’ equity (deficit) and comprehensive income (loss), and cash flows for each of the three years in the period ended September 30, 2009. These financial statements are the responsibility of the Company’s management. Our responsibility is to express an opinion on these financial statements based on our audits.
We conducted our audits in accordance with the standards of the Public Company Accounting Oversight Board (United States). Those standards require that we plan and perform the audit to obtain reasonable assurance about whether the financial statements are free of material misstatement. The Company is not required to have, nor were we engaged to perform, an audit of its internal control over financial reporting. Our audits included consideration of internal control over financial reporting as a basis for designing audit procedures that are appropriate in the circumstances, but not for the purpose of expressing an opinion on the effectiveness of the Company’s internal control over financial reporting. Accordingly, we express no such opinion. An audit also includes examining, on a test basis, evidence supporting the amounts and disclosures in the financial statements, assessing the accounting principles used and significant estimates made by management, as well as evaluating the overall financial statement presentation. We believe that our audits provide a reasonable basis for our opinion.
In our opinion, such consolidated financial statements present fairly, in all material respects, the financial position of the Company as of September 30, 2008 and 2009, and the results of its operations and its cash flows for each of the three years in the period ended September 30, 2009, in conformity with accounting principles generally accepted in the United States of America.
/s/ Deloitte & Touche LLP
San Jose, California
March 1, 2010 (August 11, 2010 as to Notes 14 and 15)
F-2
Table of Contents
(Formerly Turin Networks, Inc.)
Consolidated balance sheets
| Actual | Pro forma | |||||||||||||||
| September 30, | March 31, | |||||||||||||||
| (in thousands, except share and per share amounts) | 2008 | 2009 | 2010 | 2010 | ||||||||||||
| (unaudited) | ||||||||||||||||
Assets | ||||||||||||||||
Current assets | ||||||||||||||||
Cash and cash equivalents | $ | 48,579 | $ | 67,165 | $ | 39,368 | $ | 39,368 | ||||||||
Short-term investments | 1,993 | — | 15,789 | 15,789 | ||||||||||||
Accounts receivable, net | 16,512 | 34,362 | 30,154 | 30,154 | ||||||||||||
Inventories | 15,122 | 22,300 | 26,033 | 26,033 | ||||||||||||
Current portion of deferred product costs | 4,733 | 6,454 | 3,412 | 3,412 | ||||||||||||
Prepaid expenses and other current assets | 4,376 | 7,676 | 7,254 | 7,254 | ||||||||||||
Total current assets | 91,315 | 137,957 | 122,010 | 122,010 | ||||||||||||
Deferred product cost—net of current portion | 14,915 | 12,102 | 10,067 | 10,067 | ||||||||||||
Property and equipment, net | 9,235 | 18,401 | 17,155 | 17,155 | ||||||||||||
Intangible assets, net | 4,769 | 17,684 | 16,586 | 16,586 | ||||||||||||
Goodwill | 5,755 | 21,203 | 21,099 | 21,099 | ||||||||||||
Other assets | 89 | 2,036 | 4,073 | 4,073 | ||||||||||||
Total | $ | 126,078 | $ | 209,383 | $ | 190,990 | $ | 190,990 | ||||||||
Liabilities and stockholders’ equity | ||||||||||||||||
Current liabilities | ||||||||||||||||
Accounts payable | $ | 13,124 | $ | 16,879 | $ | 18,288 | $ | 18,288 | ||||||||
Accrued compensation and related benefits | 3,605 | 7,860 | 5,859 | 5,859 | ||||||||||||
Accrued expenses and other current liabilities | 4,459 | 6,928 | 7,226 | 7,226 | ||||||||||||
Current portion of long-term debt and capital lease obligations | 1,847 | 24,117 | 24,427 | 24,427 | ||||||||||||
Current portion of deferred revenue | 28,691 | 34,263 | 34,447 | 34,447 | ||||||||||||
Preferred stock warrant liability | — | — | 16,021 | — | ||||||||||||
Total current liabilities | 51,726 | 90,047 | 106,268 | 90,247 | ||||||||||||
Noncurrent liabilities | ||||||||||||||||
Long-term debt and capital lease obligations—net of current portion | 16,441 | 4,028 | 2,361 | 2,361 | ||||||||||||
Deferred revenue—net of current portion | 9,162 | 17,586 | 13,698 | 13,698 | ||||||||||||
Other long-term liabilities | 467 | 6,015 | 5,546 | 5,546 | ||||||||||||
Total noncurrent liabilities | 26,070 | 27,629 | 21,605 | 21,605 | ||||||||||||
Total liabilities | 77,796 | 117,676 | 127,873 | 111,852 | ||||||||||||
Commitments and contingencies (note 11) | ||||||||||||||||
Stockholders’ equity | ||||||||||||||||
Convertible preferred stock—$0.0001 par value; 48,546,880 shares authorized at September 30, 2009; 34,266,682, 24,981,240 and 24,981,240 shares issued and outstanding at September 30, 2008, September 30, 2009 and March 31, 2010, respectively; no shares issued or outstanding pro forma (liquidation preference of $612,362 at September 30, 2009 and March 31, 2010) | 197,216 | 204,539 | 204,539 | — | ||||||||||||
Common stock—$0.0001 par value; 78,528,760 shares authorized at September 30, 2009; 435,975, 931,480 and 3,556,400 shares issued and outstanding at September 30, 2008, September 30, 2009 and March 31, 2010, respectively; 56,289,880 shares issued and outstanding pro forma | 3 | 3 | 3 | 56 | ||||||||||||
Additional paid-in capital | 36,281 | 39,015 | 20,028 | 240,535 | ||||||||||||
Accumulated other comprehensive income (loss) | 6 | — | (7 | ) | (7 | ) | ||||||||||
Accumulated deficit | (185,224 | ) | (151,850 | ) | (161,446 | ) | (161,446 | ) | ||||||||
Total stockholders’ equity | 48,282 | 91,707 | 63,117 | 79,138 | ||||||||||||
Total | $ | 126,078 | $ | 209,383 | $ | 190,990 | $ | 190,990 | ||||||||
See notes to consolidated financial statements.
F-3
Table of Contents
(Formerly Turin Networks, Inc.)
Consolidated statements of operations
| Years ended September 30, | Six months ended March 31, | |||||||||||||||||||
| (in thousands, except per share amounts) | 2007 | 2008 | 2009 | 2009 | 2010 | |||||||||||||||
| (unaudited) | ||||||||||||||||||||
Revenue | ||||||||||||||||||||
Product | $ | — | $ | 48,225 | $ | 86,120 | $ | 29,232 | $ | 66,494 | ||||||||||
Service | — | 5,370 | 16,290 | 6,613 | 13,227 | |||||||||||||||
Ratable product and service | 31,562 | 102,303 | 16,660 | 8,729 | 9,894 | |||||||||||||||
Total revenue | 31,562 | 155,898 | 119,070 | 44,574 | 89,615 | |||||||||||||||
Cost of goods sold | ||||||||||||||||||||
Product | — | 28,072 | 66,012 | 24,295 | 37,210 | |||||||||||||||
Service | — | 2,440 | 8,213 | 2,536 | 8,200 | |||||||||||||||
Ratable product and service | 19,507 | 56,977 | 8,079 | 4,711 | 3,922 | |||||||||||||||
Total cost of goods sold | 19,507 | 87,489 | 82,304 | 31,542 | 49,332 | |||||||||||||||
Gross profit | ||||||||||||||||||||
Product | — | 20,153 | 20,108 | 4,937 | 29,284 | |||||||||||||||
Service | — | 2,930 | 8,077 | 4,077 | 5,027 | |||||||||||||||
Ratable product and service | 12,055 | 45,326 | 8,581 | 4,018 | 5,972 | |||||||||||||||
Total gross profit | 12,055 | 68,409 | 36,766 | 13,032 | 40,283 | |||||||||||||||
Operating expenses | ||||||||||||||||||||
Research and development | 13,443 | 23,611 | 34,137 | 11,695 | 19,681 | |||||||||||||||
Sales and marketing | 19,650 | 27,265 | 36,010 | 11,158 | 22,842 | |||||||||||||||
General and administrative | 6,027 | 9,427 | 12,871 | 4,346 | 8,094 | |||||||||||||||
Restructuring | — | — | — | — | 1,841 | |||||||||||||||
In-process research and development and amortization of intangible assets | — | 3,119 | 7,459 | 6,918 | 463 | |||||||||||||||
Total operating expenses | 39,120 | 63,422 | 90,477 | 34,117 | 52,921 | |||||||||||||||
Operating income (loss) | (27,065 | ) | 4,987 | (53,711 | ) | (21,085 | ) | (12,638 | ) | |||||||||||
Interest and other income (expense) | ||||||||||||||||||||
Interest income | 778 | 910 | 80 | 51 | 30 | |||||||||||||||
Interest expense | (2,928 | ) | (397 | ) | (664 | ) | (445 | ) | (251 | ) | ||||||||||
(Increase) decrease in fair value of preferred stock warrant liability | (2,025 | ) | — | — | — | 5,767 | ||||||||||||||
Gain on extinguishment of preferred stock warrants | 1,802 | — | — | — | — | |||||||||||||||
Other income (expense), net | 5 | 31 | (336 | ) | (2 | ) | (162 | ) | ||||||||||||
Total interest and other income (expense), net | (2,368 | ) | 544 | (920 | ) | (396 | ) | 5,384 | ||||||||||||
Income (loss) before income taxes | (29,433 | ) | 5,531 | (54,631 | ) | (21,481 | ) | (7,254 | ) | |||||||||||
Income tax benefit (provision) | (22 | ) | (87 | ) | 41 | 175 | (118 | ) | ||||||||||||
Net income (loss) | (29,455 | ) | 5,444 | (54,590 | ) | (21,306 | ) | (7,372 | ) | |||||||||||
Deemed contributions (dividends) related to preferred stock transactions (note 5) | 71,100 | (4,972 | ) | 87,964 | 128,223 | — | ||||||||||||||
Net income (loss) attributable to common stockholders | $ | 41,645 | $ | 472 | $ | 33,374 | $ | 106,917 | $ | (7,372 | ) | |||||||||
F-4
Table of Contents
Force10 Networks, Inc.
(Formerly Turin Networks, Inc.)
Consolidated statements of operations—(continued)
| Years ended September 30, | Six months ended March 31, | |||||||||||||||||||
| (in thousands, except per share amounts) | 2007 | 2008 | 2009 | 2009 | 2010 | |||||||||||||||
| (unaudited) | ||||||||||||||||||||
Net income (loss) per share (note 7) | ||||||||||||||||||||
Basic | $ | 121.06 | $ | (12.88 | ) | $ | 52.15 | $ | 245.79 | $ | (8.54 | ) | ||||||||
Diluted | $ | (46.70 | ) | $ | (12.88 | ) | $ | (20.79 | ) | $ | (2.58 | ) | $ | (8.54 | ) | |||||
Weighted average shares outstanding | ||||||||||||||||||||
Basic | 344 | 386 | 640 | 435 | 863 | |||||||||||||||
Diluted | 1,030 | 386 | 4,563 | 8,268 | 863 | |||||||||||||||
Pro forma basic and diluted net loss per share (unaudited) | $ | (2.40 | ) | $ | (0.14 | ) | ||||||||||||||
Pro forma basic and diluted weighted average shares outstanding (unaudited) | 22,763 | 53,596 | ||||||||||||||||||
See notes to consolidated financial statements.
F-5
Table of Contents
(Formerly Turin Networks, Inc.)
Consolidated statements of redeemable convertible preferred stock,
stockholders’ equity (deficit) and comprehensive income (loss)
| (in thousands, except share data) | Redeemable convertible preferred stock | Convertible preferred stock | Common stock | Additional capital | Accumulated income | Accumulated deficit | Total equity (deficit) | ||||||||||||||||||||||||||||||
| Shares | Amount | Shares | Amount | Shares | Amount | ||||||||||||||||||||||||||||||||
Balance—October 1, 2006 | 54,902,911 | $ | 32,089 | 134,595,689 | $ | 139,475 | 344,145 | $ | 3 | $ | 15,642 | $ | — | $ | (227,341 | ) | $ | (72,221 | ) | ||||||||||||||||||
Components of comprehensive loss | |||||||||||||||||||||||||||||||||||||
Net loss | (29,455 | ) | (29,455 | ) | |||||||||||||||||||||||||||||||||
Unrealized gain on available-for-sale investments | 12 | 12 | |||||||||||||||||||||||||||||||||||
Comprehensive loss | (29,443 | ) | |||||||||||||||||||||||||||||||||||
Beneficial conversion feature on issuance of convertible notes | 989 | 989 | |||||||||||||||||||||||||||||||||||
Issuance of warrants to purchase Series B-1 convertible preferred stock in connection with debt financing | 43 | 43 | |||||||||||||||||||||||||||||||||||
Recapitalization of preferred stock (note 5) | (54,902,911 | ) | (32,089 | ) | (117,716,278 | ) | (39,011 | ) | 71,100 | 32,089 | |||||||||||||||||||||||||||
Issuance of warrants to purchase Series A-1 convertible preferred stock in connection with recapitalization | 13,864 | 13,864 | |||||||||||||||||||||||||||||||||||
Issuance of Series B-1 convertible preferred stock for cash and conversion of notes payable—net of cash issuance costs of $3,053 | 6,433,880 | 52,857 | 52,857 | ||||||||||||||||||||||||||||||||||
Issuance of warrants to purchase Series B-1 convertible preferred stock in exchange for services classified as issuance costs | (1,297 | ) | 1,297 | — | |||||||||||||||||||||||||||||||||
Exercise of common stock options | 3,721 | 16 | 16 | ||||||||||||||||||||||||||||||||||
Vesting of accrued early exercised stock options | 6 | 6 | |||||||||||||||||||||||||||||||||||
Repurchase of common stock | (583 | ) | (4 | ) | (4 | ) | |||||||||||||||||||||||||||||||
Employee stock-based compensation | 634 | 634 | |||||||||||||||||||||||||||||||||||
Issuance of common stock options in exchange for services | 10 | 10 | |||||||||||||||||||||||||||||||||||
Balance—September 30, 2007 | — | $ | — | 23,313,291 | $ | 152,024 | 347,283 | $ | 3 | $ | 32,497 | $ | 12 | $ | (185,696 | ) | $ | (1,160 | ) | ||||||||||||||||||
F-6
Table of Contents
Force10 Networks, Inc.
(Formerly Turin Networks, Inc.)
Consolidated statements of redeemable convertible preferred stock,
stockholders’ equity (deficit) and comprehensive income (loss)—(continued)
| (in thousands, except share data) | Convertible preferred stock | Common stock | Additional capital | Accumulated income | Accumulated deficit | Total (deficit) | ||||||||||||||||||||||
| Shares | Amount | Shares | Amount | |||||||||||||||||||||||||
Balance—September 30, 2007 | 23,313,291 | $ | 152,024 | 347,283 | $ | 3 | $ | 32,497 | $ | 12 | $ | (185,696 | ) | $ | (1,160 | ) | ||||||||||||
Components of comprehensive income | ||||||||||||||||||||||||||||
Net income | 5,444 | 5,444 | ||||||||||||||||||||||||||
Change in unrealized gain on available-for-sale investments | (6 | ) | (6 | ) | ||||||||||||||||||||||||
Comprehensive income | 5,438 | |||||||||||||||||||||||||||
Issuance of Series B-1 convertible preferred stock and warrants for cash—net of cash issuance costs of $389 | 692,707 | 5,631 | 5,631 | |||||||||||||||||||||||||
Issuance of warrants to purchase Series B-1 convertible preferred stock in exchange for services classified as issuance costs | (167 | ) | 167 | — | ||||||||||||||||||||||||
Exchange of Series B-1 convertible preferred stock and warrants into Series C-1 convertible preferred stock and warrants (note 5) | 3,447,623 | 4,400 | 572 | (4,972 | ) | — | ||||||||||||||||||||||
Issuance of Series C-1 convertible preferred stock and warrants for cash—net of cash issuance costs of $2,639 | 6,813,061 | 36,361 | 36,361 | |||||||||||||||||||||||||
Issuance of warrants to purchase Series C-1 convertible preferred stock in exchange for services classified as issuance costs | (1,033 | ) | 1,033 | — | ||||||||||||||||||||||||
Exercise of common stock options | 89,000 | 621 | 621 | |||||||||||||||||||||||||
Vesting of accrued early exercised stock options | 4 | 4 | ||||||||||||||||||||||||||
Repurchase of common stock | (308 | ) | (2 | ) | (2 | ) | ||||||||||||||||||||||
Employee stock-based compensation | 1,389 | 1,389 | ||||||||||||||||||||||||||
Balance—September 30, 2008 | 34,266,682 | $ | 197,216 | 435,975 | $ | 3 | $ | 36,281 | $ | 6 | $ | (185,224 | ) | $ | 48,282 | |||||||||||||
F-7
Table of Contents
Force10 Networks, Inc.
(Formerly Turin Networks, Inc.)
Consolidated statements of redeemable convertible preferred stock,
stockholders’ equity (deficit) and comprehensive income (loss)—(continued)
| (in thousands, except share data) | Convertible preferred stock | Common stock | Additional capital | Accumulated income | Accumulated deficit | Total (deficit) | |||||||||||||||||||||||||
| Shares | Amount | Shares | Amount | ||||||||||||||||||||||||||||
Balance—September 30, 2008 | 34,266,682 | $ | 197,216 | 435,975 | $ | 3 | $ | 36,281 | $ | 6 | $ | (185,224 | ) | $ | 48,282 | ||||||||||||||||
Components of comprehensive loss | |||||||||||||||||||||||||||||||
Net loss | (54,590 | ) | (54,590 | ) | |||||||||||||||||||||||||||
Change in unrealized gain on available-for-sale investments | (6 | ) | (6 | ) | |||||||||||||||||||||||||||
Comprehensive loss | (54,596 | ) | |||||||||||||||||||||||||||||
Exchange of Series A-1, B-1 and C-1 convertible preferred stock and warrants into Series A convertible preferred stock and warrants (note 5) | (26,434,282 | ) | (129,095 | ) | 872 | 128,223 | — | ||||||||||||||||||||||||
Repurchase of convertible preferred stock and common stock for cash (note 5) | (601,040 | ) | (5,235 | ) | (4,695 | ) | (445 | ) | 4,683 | (997 | ) | ||||||||||||||||||||
Issuance of common stock and Series A convertible preferred stock and warrants as consideration for the acquisition of Force10 Networks (note 3) | 7,826,800 | 68,095 | 424,200 | 955 | 69,050 | ||||||||||||||||||||||||||
Issuance of warrants to purchase Series A convertible preferred stock in exchange for services | 198 | 198 | |||||||||||||||||||||||||||||
Issuance of warrants to purchase Series A and B convertible preferred stock to a lender | 672 | 672 | |||||||||||||||||||||||||||||
Issuance of Series B convertible preferred stock for cash—net of cash issuance costs of $1,523 | 9,923,080 | 85,291 | (56,815 | ) | 28,476 | ||||||||||||||||||||||||||
Issuance of warrants to purchase Series B convertible preferred stock in exchange for services classified as issuance costs | (2,478 | ) | 2,478 | — | |||||||||||||||||||||||||||
Exchange of Series A convertible preferred stock and warrants for Series A-1 convertible preferred stock and warrants (note 5) | (9,255 | ) | (2,618 | ) | 11,873 | — | |||||||||||||||||||||||||
Exercise of common stock options | 76,000 | — | |||||||||||||||||||||||||||||
Employee stock-based compensation | 622 | 622 | |||||||||||||||||||||||||||||
Balance—September 30, 2009 | 24,981,240 | $ | 204,539 | 931,480 | $ | 3 | $ | 39,015 | $ | — | $ | (151,850 | ) | $ | 91,707 | ||||||||||||||||
F-8
Table of Contents
Force10 Networks, Inc.
(Formerly Turin Networks, Inc.)
Consolidated statements of redeemable convertible preferred stock,
stockholders’ equity (deficit) and comprehensive income (loss)—(continued)
| (in thousands, except share data) | Convertible preferred stock | Common stock | Additional capital | Accumulated income | Accumulated deficit | Total (deficit) | ||||||||||||||||||||||
| Shares | Amount | Shares | Amount | |||||||||||||||||||||||||
Balance—September 30, 2009 | 24,981,240 | $ | 204,539 | 931,480 | $ | 3 | $ | 39,015 | $ | — | $ | (151,850 | ) | $ | 91,707 | |||||||||||||
Components of comprehensive loss | ||||||||||||||||||||||||||||
Net loss* | (7,372 | ) | (7,372 | ) | ||||||||||||||||||||||||
Change in unrealized gain on available-for-sale investments* | (7 | ) | (7 | ) | ||||||||||||||||||||||||
Comprehensive loss* | (7,379 | ) | ||||||||||||||||||||||||||
Reclassification of preferred stock warrants to liabilities upon adoption of new accounting principle (note 5)* | (19,565 | ) | (2,224 | ) | (21,789 | ) | ||||||||||||||||||||||
Early exercise of common stock options* | 2,624,920 | — | ||||||||||||||||||||||||||
Vesting of accrued early exercised stock options* | 22 | 22 | ||||||||||||||||||||||||||
Employee stock-based compensation* | 556 | 556 | ||||||||||||||||||||||||||
Balance���March 31, 2010* | 24,981,240 | $ | 204,539 | 3,556,400 | $ | 3 | $ | 20,028 | $ | (7 | ) | $ | (161,446 | ) | $ | 63,117 | ||||||||||||
| * | Unaudited |
See notes to consolidated financial statements.
F-9
Table of Contents
(Formerly Turin Networks, Inc.)
Consolidated statements of cash flows
| Years ended September 30, | Six months ended March 31, | |||||||||||||||||||
| (in thousands) | 2007 | 2008 | 2009 | 2009 | 2010 | |||||||||||||||
| (As restated, see note 16) | ||||||||||||||||||||
| (unaudited) | ||||||||||||||||||||
Cash flows from operating activities | ||||||||||||||||||||
Net income (loss) | $ | (29,455 | ) | $ | 5,444 | $ | (54,590 | ) | $ | (21,306 | ) | $ | (7,372 | ) | ||||||
Adjustments to reconcile net income (loss) to net cash used in operating activities | ||||||||||||||||||||
Depreciation and amortization | 1,196 | 3,334 | 8,916 | 2,334 | 4,306 | |||||||||||||||
Loss on disposal of property and equipment | — | — | 52 | — | 768 | |||||||||||||||
In-process research and development | — | 2,567 | 6,500 | 6,500 | — | |||||||||||||||
Stock-based compensation | 644 | 1,389 | 622 | 364 | 556 | |||||||||||||||
Increase (decrease) in fair value of preferred stock warrant liability | 2,025 | — | — | — | (5,767 | ) | ||||||||||||||
Gain on early extinguishment of preferred stock warrants | (1,802 | ) | — | — | — | — | ||||||||||||||
Other noncash adjustments | (61 | ) | (198 | ) | 580 | — | — | |||||||||||||
Noncash interest expense on convertible notes | 2,037 | — | 326 | 326 | — | |||||||||||||||
Changes in operating assets and liabilities—net of assets acquired and liabilities assumed in business acquisitions | ||||||||||||||||||||
Accounts receivable | 1,819 | (3,922 | ) | (7,304 | ) | 1,135 | 4,209 | |||||||||||||
Inventories | (5,334 | ) | (469 | ) | 16,538 | 1,322 | (4,179 | ) | ||||||||||||
Deferred product costs | (7,375 | ) | 36,030 | 1,091 | 5,543 | 5,077 | ||||||||||||||
Prepaid expenses and other current assets | (375 | ) | (1,914 | ) | 171 | 1,551 | 490 | |||||||||||||
Other assets | (35 | ) | 290 | 293 | (619 | ) | 77 | |||||||||||||
Accounts payable | (2,493 | ) | 4,229 | 1,162 | (4,777 | ) | (102 | ) | ||||||||||||
Accrued compensation and related benefits | 398 | (712 | ) | (125 | ) | (220 | ) | (2,002 | ) | |||||||||||
Accrued expenses and other current liabilities | (294 | ) | (373 | ) | (6,042 | ) | 137 | 131 | ||||||||||||
Deferred revenue | 16,672 | (60,137 | ) | 5,234 | (8,592 | ) | (3,703 | ) | ||||||||||||
Other long-term liabilities | 179 | (24 | ) | 110 | (95 | ) | (470 | ) | ||||||||||||
Net cash used in operating activities | (22,254 | ) | (14,466 | ) | (26,466 | ) | (16,397 | ) | (7,981 | ) | ||||||||||
Cash flows from investing activities | ||||||||||||||||||||
Change in restricted cash | 78 | — | — | — | — | |||||||||||||||
Acquisition of businesses—net of cash acquired | — | (26,374 | ) | 8,733 | 8,733 | — | ||||||||||||||
Purchase of short-term investments | (15,892 | ) | (8,450 | ) | (1,995 | ) | (1,995 | ) | (15,865 | ) | ||||||||||
Proceeds from sale of short-term investments | — | 22,614 | 4,000 | 3,000 | — | |||||||||||||||
Acquisition of property and equipment | (2,750 | ) | (4,452 | ) | (3,460 | ) | (1,259 | ) | (1,947 | ) | ||||||||||
Proceeds from disposal of property and equipment | — | 5,994 | 433 | 430 | — | |||||||||||||||
Net cash provided by (used in) investing activities | (18,564 | ) | (10,668 | ) | 7,711 | 8,909 | (17,812 | ) | ||||||||||||
Cash flows from financing activities | ||||||||||||||||||||
Proceeds from issuance of convertible notes | 4,422 | — | — | — | — | |||||||||||||||
Proceeds from issuance of common stock—net of repurchases | 12 | 623 | — | — | — | |||||||||||||||
Proceeds from early exercise of common stock options | 6 | — | 5 | — | 294 | |||||||||||||||
Proceeds from borrowings | 31,564 | 51,091 | 79,422 | 35,465 | 44,483 | |||||||||||||||
Repayment of borrowings | (28,486 | ) | (44,095 | ) | (69,565 | ) | (37,054 | ) | (45,840 | ) | ||||||||||
Proceeds from issuance of preferred stock and warrants to purchase preferred stock | 48,375 | 41,992 | 28,476 | — | — | |||||||||||||||
Repurchase of preferred and common stock | — | — | (997 | ) | (39 | ) | — | |||||||||||||
Payment of costs related to initial public offering | — | — | — | — | (941 | ) | ||||||||||||||
Net cash provided by (used in) financing activities | 55,893 | 49,611 | 37,341 | (1,628 | ) | (2,004 | ) | |||||||||||||
Net increase (decrease) in cash and cash equivalents | 15,075 | 24,477 | 18,586 | (9,116 | ) | (27,797 | ) | |||||||||||||
Cash and cash equivalents—beginning of period | 9,027 | 24,102 | 48,579 | 48,579 | 67,165 | |||||||||||||||
Cash and cash equivalents—end of period | $ | 24,102 | $ | 48,579 | $ | 67,165 | $ | 39,463 | $ | 39,368 | ||||||||||
F-10
Table of Contents
Force10 Networks, Inc.
(Formerly Turin Networks, Inc.)
Consolidated statements of cash flows—(continued)
| Years ended September 30, | Six months ended March 31, | ||||||||||||||
| (in thousands) | 2007 | 2008 | 2009 | 2009 | 2010 | ||||||||||
| (As restated, see note 16) | |||||||||||||||
| (unaudited) | |||||||||||||||
Supplemental disclosure of cash flow information | |||||||||||||||
Cash paid for interest | $ | 875 | $ | 552 | $ | 331 | $ | 133 | $ | 237 | |||||
Cash paid for income taxes | — | 28 | 107 | 13 | 8 | ||||||||||
Noncash financing and investing activities | |||||||||||||||
Conversion of notes payable to Series B-1 convertible preferred stock | 4,482 | — | — | — | — | ||||||||||
Beneficial conversion feature on issuance of convertible notes | 989 | — | — | — | — | ||||||||||
Exchange of Series B-1 convertible preferred stock and warrants into Series C-1 convertible preferred stock and warrants | — | 4,972 | — | — | — | ||||||||||
Exchange of Series A convertible preferred stock and warrants into Series A-1 convertible preferred stock and warrants | — | — | 11,873 | — | — | ||||||||||
Recapitalization of preferred stock | 71,100 | — | 71,408 | 128,223 | — | ||||||||||
Issuance of warrants to purchase convertible preferred stock in connection with recapitalization | 13,864 | — | — | — | — | ||||||||||
Issuance of warrants to purchase convertible preferred stock in connection with debt financing | 43 | — | — | — | — | ||||||||||
Reclassification of warrants from stockholders’ equity to warrant liability | — | — | — | — | 21,789 | ||||||||||
Issuance of warrants to purchase convertible preferred stock in exchange for services classified as issuance costs | 1,297 | 1,200 | 2,478 | — | — | ||||||||||
Initial public offering costs not yet paid | — | — | — | — | 1,172 | ||||||||||
Assets acquired under capital lease | 299 | 267 | — | — | — | ||||||||||
See notes to consolidated financial statements.
F-11
Table of Contents
(Formerly Turin Networks, Inc.)
Notes to consolidated financial statements
1. The Company and significant accounting policies
Force10 Networks, Inc. (the Company) was incorporated on September 27, 1999 in the State of Delaware under the name Turin Networks, Inc. (Turin). As discussed in note 3, on March 31, 2009 Turin acquired 100% of the outstanding capital stock of Force10 Networks, Inc. (Legacy Force10) Subsequent to the acquisition, Turin changed its legal name to Force10 Networks, Inc.
The Company provides high performance networking solutions for data center and other network deployments.
References to 2007, 2008 or 2009 mean the fiscal year ended September 30, 2007, 2008 or 2009, as applicable.
Principles of consolidation
The consolidated financial statements include the accounts of the Company and its wholly owned subsidiaries. All intercompany transactions and balances have been eliminated.
Unaudited interim financial information
The accompanying consolidated balance sheet as of March 31, 2010, the consolidated statements of operations and cash flows for the six months ended March 31, 2009 and March 31, 2010 and the consolidated statement of redeemable convertible preferred stock, stockholders’ equity (deficit) and comprehensive income (loss) for the six months ended March 31, 2010 are unaudited. The unaudited interim financial statements have been prepared on the same basis as the annual consolidated statements and, in the opinion of management, reflect all adjustments, which include only normal recurring adjustments, necessary to present fairly the Company’s financial position as of March 31, 2010 and results of operations and cash flows for the six months ended March 31, 2009 and March 31, 2010. The financial data and the other information disclosed in these notes to the consolidated financial statements related to the six-month periods are unaudited. The results of the six months ended March 31, 2010 are not necessarily indicative of the results to be expected for the fiscal year ending September 30, 2010 or for any other interim period or for any other future year.
Unaudited pro forma consolidated balance sheet
Upon the consummation of the initial public offering, or IPO, contemplated by the Company, all of the outstanding shares of convertible preferred stock will automatically convert into shares of common stock, assuming an IPO price of at least $4.53 per share. The March 31, 2010 unaudited pro forma consolidated balance sheet data has been prepared assuming the conversion of the convertible preferred stock outstanding into 52,733,480 shares of common stock and the reclassification of the preferred stock warrant liability to additional paid-in capital.
Certain significant risks and uncertainties
The Company is subject to certain risks and uncertainties that could have a material adverse effect on its future financial position or results of operations, such as the following: the effects of competition; the timing and mix of products sold; the Company’s ability to control costs, including third-party manufacturing; costs and availability of components; the Company’s ability
F-12
Table of Contents
to forecast manufacturing requirements; changes in technologies; changes in costs of components, manufacturing costs or lead times; its ability to maintain sufficient production volumes for its products with third-party manufacturers; dependence on sole source suppliers; the timing and success of new product introductions; costs related to the development of new products or the acquisition of technologies or businesses; general economic, industry and market conditions; the Company’s ability to increase sales of its Ethernet products; the purchasing and budgeting cycles of customers; geopolitical events; the availability of financing; the failure to protect intellectual property rights; the issuance of new accounting standards; challenges in doing business outside of the United States; and the Company’s ability to attract and retain personnel.
Use of estimates
The preparation of financial statements in conformity with accounting principles generally accepted in the United States of America (GAAP) requires management to make estimates and assumptions that affect the amounts reported in the consolidated financial statements and accompanying notes. Actual results could differ materially from those estimates. The Company’s significant accounting estimates include, among others, (i) the valuation of common and convertible preferred stock, stock-based awards and warrants, (ii) valuation of inventories, (iii) valuation of goodwill and long-lived assets, (iv) warranty liabilities, and (v) valuation of deferred tax assets. Management believes that the estimates and judgments upon which they rely are reasonable based upon information available to them at the time that these estimates and judgments are made. To the extent that there are differences between these estimates and actual results, the Company’s consolidated financial statements will be affected.
Foreign currency translation
The U.S. dollar is the functional currency of the Company’s foreign subsidiaries. Exchange gains and losses resulting from transactions denominated in currencies other than the U.S. dollar are included in the results of operations based on the prevailing exchange rate at the time of the transaction. Such gains or losses were not significant for any period presented.
Cash and cash equivalents
Cash and cash equivalents consist of cash in banks and liquid investments purchased with an original or remaining maturity of 90 days or less at the date of purchase.
Short-term investments
The Company classifies all short-term investments as available-for-sale securities. The fair value of short-term investments is based on quoted market prices. Realized gains or losses are determined using the specific-identification method and have not been significant for any period presented. Unrealized gains and losses are reported as a separate component of stockholders’ equity until realized. All of the Company’s short-term investments mature within one year.
Concentration of credit risk
Financial instruments that potentially subject the Company to concentration of credit risk consist primarily of cash and cash equivalents, short-term investments and accounts receivable. Risks associated with cash and cash equivalents and short-term investments are mitigated by banking with and purchasing short-term investments from creditworthy institutions.
F-13
Table of Contents
One customer accounted for 21% of total accounts receivable as of September 30, 2008, two customers each accounted for 10% of total accounts receivable as of September 30, 2009 and no customers accounted for over 10% of total accounts receivable as of March 31, 2010. No customer accounted for over 10% of total revenue for any period presented.
The Company’s primary exposure to credit risk arises from trade accounts receivable. The Company performs ongoing evaluations of its customers’ financial condition and generally does not require collateral or other credit enhancements. The Company records an allowance for doubtful accounts based on historical collection experience and management’s best estimate of future credit losses. Reserves for sales returns are established based upon estimated return rates.
The activity in the allowance for doubtful accounts was as follows:
| Years ended September 30, | Six months ended March 31, | ||||||||||||||||||
| (in thousands) | 2007 | 2008 | 2009 | 2009 | 2010 | ||||||||||||||
| (unaudited) | |||||||||||||||||||
Beginning balance | $ | — | $ | 135 | $ | 334 | $ | 334 | $ | 796 | |||||||||
Provisions | 159 | 334 | 567 | 38 | 96 | ||||||||||||||
Write-offs and adjustments | (24 | ) | (135 | ) | (105 | ) | — | (4 | ) | ||||||||||
Ending balance | $ | 135 | $ | 334 | $ | 796 | $ | 372 | $ | 888 | |||||||||
The activity in the reserve for sales returns was as follows:
| Years ended September 30, | Six months ended March 31, | |||||||||||||||||||
| (in thousands) | 2007 | 2008 | 2009 | 2009 | 2010 | |||||||||||||||
| (unaudited) | ||||||||||||||||||||
Beginning balance | $ | — | $ | — | $ | 201 | $ | 201 | $ | 796 | ||||||||||
Provisions | 32 | 592 | 1,350 | 433 | 134 | |||||||||||||||
Write-offs and adjustments | (32 | ) | (391 | ) | (755 | ) | (342 | ) | (541 | ) | ||||||||||
Ending balance | $ | — | $ | 201 | $ | 796 | $ | 292 | $ | 389 | ||||||||||
Fair value of financial instruments
Due to their short-term nature, the carrying amounts reported in the consolidated financial statements for cash and cash equivalents, accounts receivable, and accounts payable approximate their fair value. The Company’s long-term debt bears interest at a variable rate which approximates the interest rate at which the Company believes it could refinance the debt. Accordingly, based on Level 3 inputs (note 2), the carrying amount of long-term debt approximates its fair value. The Company’s preferred stock warrant liability is carried at fair value, determined using Level 3 inputs.
Inventories
Inventories consist of raw materials, work-in-process, and finished goods and are stated at the lower of actual cost (first-in, first-out method) or market. Cost includes direct materials, direct labor, and manufacturing overhead. The determination of market value involves numerous judgments, including estimated average selling prices based upon recent sales volumes, industry trends, existing customer orders, current contract price, future demand, pricing for the Company’s products and technological obsolescence of the Company’s products. Inventory that is
F-14
Table of Contents
obsolete, in excess of the Company’s forecasted demand or is anticipated to be sold at a loss is written down to its market value based on expected demand and selling prices.
Inventories consisted of the following:
| September 30, | March 31, 2010 | ||||||||
| (in thousands) | 2008 | 2009 | |||||||
| (unaudited) | |||||||||
Raw material | $ | 4,643 | $ | 5,418 | $ | 4,786 | |||
Work-in-progress | 680 | 322 | 300 | ||||||
Finished goods | 9,799 | 16,560 | 20,947 | ||||||
Total | $ | 15,122 | $ | 22,300 | $ | 26,033 | |||
Property and equipment
Property and equipment are stated at cost, less accumulated depreciation and amortization. Depreciation and amortization are calculated using the straight-line method over their estimated useful lives. Depreciation expense includes the amortization of assets acquired under capital leases. Leasehold improvements and assets recorded under capital leases are amortized over the shorter of the initial lease term or their estimated useful lives. Property and equipment consisted of the following:
| Useful life | September 30, | March 31, 2010 | ||||||||||||
| (dollars in thousands) | (years) | 2008 | 2009 | |||||||||||
| (unaudited) | ||||||||||||||
Computer equipment | 3 | $ | 2,981 | $ | 3,860 | $ | 4,121 | |||||||
Electronic test and other equipment | 3–7 | 9,960 | 21,414 | 20,597 | ||||||||||
Furniture and fixtures | 7 | 458 | 302 | 342 | ||||||||||
Leasehold improvements | Shorter of lease term or asset life | 846 | 898 | 871 | ||||||||||
Software | 1.5–3 | 5,945 | 8,729 | 10,267 | ||||||||||
| 20,190 | 35,203 | 36,198 | ||||||||||||
Less accumulated depreciation and amortization | (10,955 | ) | (16,802 | ) | (19,043 | ) | ||||||||
Total | $ | 9,235 | $ | 18,401 | $ | 17,155 | ||||||||
Depreciation and amortization expense during the years ended September 30, 2007, 2008 and 2009 was $1,196,000, $2,264,000 and $5,883,000. Depreciation and amortization expense for the six-months ended March 31, 2009 and 2010 was $1,525,000 and $2,995,000.
At September 30, 2008, property and equipment acquired under capital leases had a net book value of $224,000 (net of accumulated depreciation of $43,000). At September 30, 2009, property and equipment acquired under capital leases had a net book value of $170,000 (net of accumulated depreciation of $49,000). At March 31, 2010, there was no property and equipment under capital leases.
The Company accounts for software developed or obtained for internal use in accordance with Accounting Standards Codification (or ASC) 350-40-15 (formerly referred to as Statement of Position (SOP) No. 98-1,Accounting for the Cost of Computer Software Developed or Obtainedfor Internal Use). ASC 350-40-15 requires that entities capitalize certain costs related to internal
F-15
Table of Contents
use software once certain criteria have been met. During all periods presented, all capitalized internal use software was obtained from external sources.
Goodwill
Goodwill is recorded when the consideration paid for an acquisition exceeds the fair value of net tangible and intangible assets acquired. Goodwill is tested for impairment on an annual basis or more frequently if the Company believes indicators of impairment exist. The performance of the test involves a two-step process. The first step requires comparing the fair value of the reporting unit to its net book value, including goodwill. A potential impairment exists if the fair value of the reporting unit is lower than its net book value. The second step of the process is only performed if a potential impairment exists, and it involves comparing the aggregate fair value of the reporting unit’s net assets other than goodwill to the fair value of the reporting unit as a whole. Goodwill is considered impaired, and an impairment charge is recorded, if the excess of the fair value of the reporting unit over the fair value of the net assets is less than the carrying value of goodwill. Prior to March 31, 2009, the Company had one reporting unit, the fair value of which equaled the fair value of the Company as determined by management through a discounted cash flow and comparable company valuation analysis. The Company was not required to perform the second step of the impairment test in any period presented because the fair value of the reporting unit exceeded its net book value. During 2009, the Company changed the date of its annual impairment test from September 30th to February 28th . This change in accounting method, which was made to better allow the Company to meet its year-end reporting deadlines, was applied retrospectively, and resulted in no change to any prior periods presented.
Beginning March 31, 2009, following the acquisition of Legacy Force10 (as described in note 3), the Company identified two operating segments, Ethernet and Transport, which management also considers to be reporting units. On February 28, 2010, the Company conducted its annual goodwill impairment test for each reporting unit, and determined that the fair value of both of the Company’s reporting units were substantially in excess of their estimated carrying values, and therefore not impaired.
Other than additions to goodwill related to the acquisitions of Carrier Access Corporation (CAC) and Legacy Force10 (note 3) there have been no changes to goodwill in any periods presented. Approximately $1.1 million of goodwill related to the acquisition of CAC is deductible for tax purposes. The remaining goodwill is not deductible.
Intangible assets
Acquisition-related intangible assets are amortized on a straight-line basis over their estimated economic lives, as the Company believes this method most closely reflects the pattern in which the economic benefits of the assets will be consumed. The estimated useful lives and carrying value of acquired intangible assets are as follows:
| September 30, 2008 | |||||||||||
| (dollars in thousands) | Useful life (years) | Gross carrying value | Accumulated amortization | Net carrying amount | |||||||
Tradename (Carrier Access) | 2 | $ | 980 | $ | 324 | $ | 656 | ||||
Developed technology | 4 | 3,139 | 519 | 2,620 | |||||||
Customer relationships | 5 | 1,720 | 227 | 1,493 | |||||||
Total | $ | 5,839 | $ | 1,070 | $ | 4,769 | |||||
F-16
Table of Contents
| September 30, 2009 | |||||||||||
| (dollars in thousands) | Useful life (years) | Gross carrying value | Accumulated amortization | Net carrying amount | |||||||
Tradename (Force10 Networks) | Indefinite | $ | 10,500 | $ | — | $ | 10,500 | ||||
Tradename (Carrier Access) | 2 | 980 | 814 | 166 | |||||||
Developed technology | 4–6 | 6,039 | 1,545 | 4,494 | |||||||
Customer relationships | 5–6 | 3,220 | 696 | 2,524 | |||||||
Backlog | 0.5 | 1,100 | 1,100 | — | |||||||
Total | $ | 21,839 | $ | 4,155 | $ | 17,684 | |||||
| March 31, 2010 | |||||||||||
| (dollars in thousands) | Useful life (years) | Gross carrying value | Accumulated amortization | Net carrying amount | |||||||
| (unaudited) | |||||||||||
Tradename (Force10 Networks) | Indefinite | $ | 10,500 | $ | — | $ | 10,500 | ||||
Tradename (Carrier Access) | 2 | 980 | 980 | — | |||||||
Developed technology | 4–6 | 6,039 | 2,179 | 3,860 | |||||||
Customer relationships | 5–6 | 3,220 | 992 | 2,226 | |||||||
Backlog | 0.5 | 1,100 | 1,100 | — | |||||||
Total | $ | 21,839 | $ | 5,251 | $ | 16,586 | |||||
For the year ended September 30, 2007, 2008, and 2009, amortization expense for acquired intangible assets was zero, $1,070,000, and $3,085,000, respectively. For the six months ended March 31, 2009 and 2010, amortization expense for acquired intangible assets was $809,000 and $1,097,000, respectively.
The estimated future amortization of acquired intangible assets as of September 30, 2009 was as follows:
(dollars in thousands) Years ending September 30, | Amount | ||
2010 | $ | 2,028 | |
2011 | 1,862 | ||
2012 | 1,344 | ||
2013 | 850 | ||
2014 | 733 | ||
Thereafter | 367 | ||
Total | $ | 7,184 | |
The Company determined that the tradename intangible asset acquired in the acquisition of Legacy Force10 (see note 3) has an indefinite life. As such, it is not amortized but rather is tested for impairment annually, or more frequently if events or changes in circumstances indicate that the asset might be impaired. The impairment test, which will be performed on February 28th of each year, involves comparing the fair value of the intangible asset with its carrying amount. If the carrying amount exceeds the fair value of the intangible asset, an impairment loss is recognized in an amount equal to that excess. No impairment charges for indefinite life intangible assets have been recorded in any period presented.
F-17
Table of Contents
Impairment of long-lived assets
The Company periodically evaluates the carrying value of long-lived assets, including acquired intangible assets, to be held and used when indicators of impairment exist. The carrying value of a long-lived asset to be held and used is considered impaired when the estimated separately identifiable undiscounted cash flows expected to result from the use of the asset and its eventual disposition are less than the carrying value of the asset. In that event, a loss is recognized based on the amount by which the carrying value exceeds the fair value of the long-lived asset. Fair value is determined primarily using the estimated cash flows discounted at a rate commensurate with the risk involved. No impairment charges have been recorded in any of the periods presented.
Deferred offering costs
Deferred offering costs, consisting of legal, accounting and filing fees relating to the IPO, are capitalized. The deferred offering costs will be offset against the Company’s planned IPO proceeds upon the effectiveness of the offering. In the event the offering is terminated, the deferred offering costs will be expensed. Deferred offering costs of $2,113,000 are included in other assets on the Company’s consolidated balance sheet at March 31, 2010. There were no deferred offering costs at September 30, 2008 or 2009.
Revenue recognition
The Company derives revenue primarily from the sales of products, including hardware and software, and services, including post-contract customer support (PCS), installation and training. PCS typically includes unspecified software updates and upgrades on an if-and-when available basis and telephone and internet access to technical support personnel.
The majority of the Company’s products are integrated with software that is essential to the functionality of the hardware. Further, the Company provides unspecified software upgrades and PCS to customers for these products. As a result, the Company accounts for revenue from these products in accordance with ASC 985-605 (formerly referred to as SOP No. 97-2,Software Revenue Recognition) and all related interpretations. Revenue is recognized when persuasive evidence of an arrangement exists, delivery has occurred or services have been rendered, the price or fee is fixed or determinable, and collection is probable.
Certain of the Company’s access products are integrated with software that management does not consider to be essential to the functionality of the equipment. Accordingly, the Company accounts for revenue from sales of these products in accordance with Staff Accounting Bulletin No. 104, Revenue Recognition, and ASC 605-25-30 (formerly referred to as Emerging Issues Task Force (EITF) Issue No. 00-21,Revenue Arrangements with Multiple Deliverables). The Company recognizes revenue on sales of these products and services when persuasive evidence of an arrangement exists, delivery has occurred or services have been rendered, the price or fee is fixed or determinable, and collection is reasonably assured.
Evidence of an arrangement. Contracts and customer purchase orders are used to determine the existence of an arrangement.
Delivery.Delivery is considered to occur when title to the Company’s products and risk of loss has transferred to the customer, which typically occurs when products are delivered to a common carrier. Delivery of services occurs when performed. Some customer agreements commit the Company to provide future-specified software or hardware deliverables. Delivery is considered to have occurred only when all such deliverables have been provided to the customer.
F-18
Table of Contents
Fixed or determinable fee. The Company assesses whether the sales price is fixed or determinable at the time of sale based on payment terms and whether the sales price is subject to refund or adjustment. If the fee is not fixed or determinable, revenue is recognized as payments become due from the customer. Some of the Company’s customer agreements contain acceptance clauses that grant the customer the right to return or exchange products that do not conform to specifications. If there is insufficient historical evidence of customer acceptance, delivery is considered to have occurred when the conditions of acceptance have been met or the acceptance provisions lapse.
Collectibility.Collectibility is assessed based on the creditworthiness of the customer as determined by credit checks and the customer’s payment history to the Company. If collectibility is not considered probable, revenue is not recognized until the fee is collected.
Bundled arrangements and establishment of VSOE. Typically, the Company’s sales of Ethernet and transport products involve multiple elements, such as sales of products bundled with PCS. When a sale involves multiple elements, ASC 985-605 requires that the Company allocate the entire fee from the arrangement to each respective element based on its vendor-specific objective evidence (VSOE) of fair value and recognize revenue when each element’s revenue recognition criteria is met. Prior to April 1, 2008, the Company had not established VSOE of fair value for any of the elements in its multiple-element arrangements, thus the Company accounted for each of its sales arrangements as a single element. As of April 1, 2008, the Company determined that it had sufficient standalone sales of PCS and certain other elements at consistent prices in order to establish VSOE for these elements. Accordingly, for new multiple-element arrangements that include PCS or other undelivered elements for which VSOE has been established, the Company allocates and defers revenue related to the undelivered elements using VSOE, with the residual fees allocated to the delivered product. The Company recognizes product revenue upon delivery, assuming that all other criteria for revenue recognition have been met and that VSOE exists for all undelivered elements, and recognizes PCS revenue ratably over the contractual support period. Revenue from all bundled transactions entered into prior to the establishment of VSOE on April 1, 2008, and those entered into subsequently but for which VSOE of services has not been established, is included in ratable product and services revenue in the accompanying consolidated statements of operations.
For sales arrangements occurring in certain regions and with certain specific customers, the Company has not established VSOE of fair value for PCS and certain other elements. Accordingly, the Company accounts for each of these sales arrangements as a single element. The entire fee from each arrangement is deferred until all elements except for PCS are delivered and all other criteria of ASC 985-605 are met, and then amortized ratably over the contractual service period, generally ranging between 12 and 36 months from date of initial shipment. This revenue is included in ratable product and services revenue in the accompanying consolidated statements of operations.
The establishment of VSOE for PCS and certain other elements on April 1, 2008 did not have any impact on the accounting for sales made prior to that date. Any revenue and costs deferred for prior sales continue to be amortized over the contractual service period.
Implied PCS. Historically, the Company had provided software upgrades and technical support services to substantially all of its customer base, sometimes in excess of the customers’ contractual entitlements. This practice created an implied PCS arrangement, for which the Company did not have VSOE. Therefore, the length of the PCS period was considered to be the longer of (a) the
F-19
Table of Contents
contractual term, or (b) the period over which the implied PCS was expected to be provided, which, in the absence of specific historical experience, was considered to be the life of the product itself. Based upon management’s review of technical innovations, competitive obsolescence, and the relationship between software and hardware development cycles, among other factors, the Company determined that the life cycle of the product is approximately four years. Accordingly, the entire fee from each arrangement was deferred until all elements except for PCS were delivered and all other criteria of ASC 985-605 were met, and then amortized ratably over the longer of the remaining service period or 48 months, from the date of initial shipment.
On December 1, 2007, the Company terminated the implied customer support element in the majority of its sales arrangements by no longer providing customer support to customers who are not entitled to receive such services. For some customers, such services were terminated immediately, in which case any previously deferred revenue and direct costs were recognized immediately. For other customers, the implied PCS arrangement was replaced with a contractual arrangement, upon the expiration of which the customer would be required to pay for PCS. In these instances, the Company did not immediately recognize any previously deferred revenue or direct costs, but rather adjusted the amortization thereof on a prospective basis to match the new contractual period.
Channel partner arrangements. The Company complements its direct sales and marketing efforts by using reseller, distributor and system integrator channels to extend its market reach. Resellers and system integrators generally place orders with the Company after first receiving firm orders from an end customer. Sales to certain resellers and system integrators are on business terms that are similar to sales arrangements with direct customers, and revenue recognition begins upon sell-in of product to the reseller. With respect to sales to resellers or distributors with rights of return, when adequate sales and returns history does not exist to allow management to make a reasonable estimate of future returns, revenue is recognized upon sale by the reseller or distributor to the end customer. Otherwise, revenue is recognized upon the sale to the reseller or distributor, and reserves for estimated returns are recorded.
Shipping charges. Shipping charges billed to customers are included in revenue and the related shipping costs are included in cost of goods sold.
Deferred product costs
When the Company’s products have been delivered, but the product revenue associated with the arrangement has been deferred as a result of not meeting the revenue recognition criteria in ASC 985-605 or SAB 104, the Company also defers the direct and incremental costs (primarily product costs) associated with the sale, and amortizes those costs over the same period as the associated revenue is recognized. Deferred costs related to sales for which all revenues will be recognized within one year are classified as current assets, whereas all deferred costs related to sales for which revenues will be recognized over a period longer than one year are classified as noncurrent assets, with no portion classified as current assets.
Product warranty
The Company generally provides a warranty on its products for a period of one to two years for hardware and up to one year for software, however it may be longer for certain customers. Prior to April 1, 2008, VSOE had not been established for any of the elements in the Company’s sales arrangements that included PCS. The Company accounted for these sales arrangements as a
F-20
Table of Contents
single element and recognized the entire arrangement fee and related direct costs ratably over the contractual or implied service period. Accordingly, the Company charged warranty costs to cost of goods sold as incurred for such arrangements prior to April 1, 2008. Estimated warranty costs were provided for at the time of product shipment for certain access products. For customer arrangements entered into after April 1, 2008, the Company generally provides for estimated warranty cost at the time of sale; however, for arrangements in which hardware warranty is included in PCS, no provision for estimated warranty costs is recorded. The determination of such provisions requires the Company to make estimates of product return rates and expected costs to repair or replace the products under warranty. If actual return rates and/or repair and replacement costs differ significantly from these estimates, adjustments to recognize additional cost of sales may be required in future periods. Components of the obligation for warranty costs consisted of the following:
| Years ended September 30, | Six months ended March 31, | |||||||||||||||
| (in thousands) | 2008 | 2009 | 2009 | 2010 | ||||||||||||
| (unaudited) | ||||||||||||||||
Beginning balance | $ | — | $ | 2,006 | $ | 2,006 | $ | 1,438 | ||||||||
Warranty liabilities assumed in acquisition | 1,760 | 95 | 95 | — | ||||||||||||
Additions related to current period sales | 759 | 617 | 331 | 498 | ||||||||||||
Adjustments to prior period accruals | — | (452 | ) | — | — | |||||||||||
Warranty costs incurred | (513 | ) | (828 | ) | (252 | ) | (497 | ) | ||||||||
Ending balance | $ | 2,006 | $ | 1,438 | $ | 2,180 | $ | 1,439 | ||||||||
Research and development costs
Research and development costs are charged to expense as incurred, and consist of personnel costs, system prototype and certification-related expenses, depreciation of capital equipment and facility-related expenses. Development costs incurred subsequent to the establishment of technological feasibility related to software developed by the Company are capitalized and amortized over their estimated useful lives. Based upon the Company’s software development process, technological feasibility is established upon completion of a working model. Costs incurred between completion of the working model and the point at which the software is ready for general release have been insignificant. Therefore, all software development costs have been charged to research and development expense for all periods presented.
Stock-based compensation
Effective October 1, 2006, the Company adopted the fair value recognition provisions of ASC 718-10 (formerly referred to as Financial Accounting Standards Board (FASB) Statement No. 123 (revised 2004),Share-Based Payment) using the prospective transition method. Under the prospective transition method, employee stock-based compensation expense for the years ended September 30, 2007, 2008 and 2009 includes compensation expense only for stock-based awards granted or modified by the Company after September 30, 2006, based on the grant-date fair value. The fair value of each employee stock option is estimated on the date of grant using the Black-Scholes valuation model. The Company recognizes compensation costs for all employee stock-based compensation awards that are expected to vest on a straight-line basis over the requisite service period of the awards, which is generally the option’s vesting period. These amounts are reduced by an estimated forfeiture rate. Forfeitures are required to be estimated at the time of grant and revised, if necessary, in subsequent periods if actual forfeitures differ from
F-21
Table of Contents
those estimates. Prior to the adoption of ASC 718-10 on October 1, 2006, the Company recognized an expense in the statement of operations only for options with intrinsic value at the date of grant. As all options granted to employees prior to October 1, 2006 were granted with an exercise price at least equal to the fair value of the underlying stock, no compensation cost was recorded. Accordingly, employee stock-based compensation expense in all periods presented relates solely to options granted or modified subsequent to September 30, 2006.
Employee stock-based compensation expense is classified in the accompanying consolidated statements of operations as follows:
| Years ended September 30, | Six months ended March 31, | ||||||||||||||
| (in thousands) | 2007 | 2008 | 2009 | 2009 | 2010 | ||||||||||
| (unaudited) | |||||||||||||||
Cost of goods sold | $ | 44 | $ | 95 | $ | 38 | $ | 23 | $ | 9 | |||||
Research and development | 150 | 322 | 212 | 118 | 173 | ||||||||||
Sales and marketing | 215 | 335 | 177 | 116 | 142 | ||||||||||
General and administrative | 225 | 637 | 195 | 107 | 232 | ||||||||||
Total | $ | 634 | $ | 1,389 | $ | 622 | $ | 364 | $ | 556 | |||||
Preferred stock warrants
Freestanding warrants and other similar instruments for shares that are contingently redeemable were accounted for in accordance with ASC 480-10 (formerly referred to as FASB Staff Position No. 150-5,Issuer’s Accounting under FASB Statement No. 150 for Freestanding Warrants and Other Similar Instruments on Shares That Are Redeemable). Under ASC 480-10, freestanding warrants to purchase the Company’s Series F redeemable convertible preferred stock were classified as liabilities prior to March 2007. As part of the recapitalization in March 2007 (see note 5), these warrants were exchanged for warrants to purchase Series A-1 convertible preferred stock. Since Series A-1 convertible preferred stock was not redeemable, the associated warrants are classified as stockholders’ equity. Upon the extinguishment of the warrants, the $1,802,000 difference between the fair value of the extinguished Series F warrants and the fair value of the Series A-1 warrants was recorded in the accompanying statement of operations as a gain on extinguishment of preferred stock warrants. The fair value of both the Series F warrants and the Series A-1 warrants was calculated using the Black-Scholes option valuation model with the following assumptions: contractual term of 7.4 years, volatility of 69%, risk-free interest rate of 4.5% and no expected dividends.
On October 1, 2009 the Company adopted the provisions of ASC 815-40-15, formerly referred to as EITF Issue No. 07-5, Determining Whether an Instrument (or an Embedded Feature) Is Indexed to an Entity’s Own Stock.The adoption of ASC 815 required the Company to change its accounting for preferred stock warrants (see note 5).
Stock splits
In connection with the 2007 Recapitalization (see note 5), the Company completed a 1-for-20 reverse split of its common stock. In March 2009, the Company completed a 1-for-175 reverse split of its common stock, and in October 2009, the Company completed a 40-for-1 forward split of its common stock and its Series A, A-1, and B convertible preferred stock. All information related to these classes of stock, any options or warrants to purchase such stock, and conversion rates of convertible preferred stock, have been adjusted to give effect to these stock splits for all periods presented.
F-22
Table of Contents
Income taxes
The Company accounts for income taxes using the asset and liability method. Deferred income taxes are recognized by applying enacted statutory tax rates applicable to future years to differences between the financial statement carrying amounts of existing assets and liabilities and their respective tax bases and operating loss and tax credit carry-forwards. The effect on deferred tax assets and liabilities of a change in tax rates is recognized in the statement of operations in the period that includes the enactment date. The measurement of deferred tax assets is reduced, if necessary, by a valuation allowance for any tax benefit of which future realization is uncertain.
On October 1, 2007, the Company adopted ASC 740-10 (formerly referred to as FASB Interpretation No. 48,Accounting for Uncertainty in Income Taxes—an interpretation of FASB Statement No. 109). ASC 740-10 requires that the tax effects of a position be recognized only if it is “more likely than not” to be sustained based solely on its technical merits as of the reporting date. The Company considers many factors when evaluating and estimating its tax positions and tax benefits, which may require periodic adjustments and which may not accurately anticipate actual outcomes.
With the adoption of ASC 740-10, companies are required to adjust their financial statements to reflect only those tax positions that are more likely than not to be sustained. Any necessary adjustment would be recorded directly to retained earnings and reported as a change in accounting principle as of the date of adoption. ASC 740-10 prescribes a comprehensive model for the financial statement recognition, measurement, presentation and disclosure of uncertain tax positions taken or expected to be taken in income tax returns. The adoption of ASC 740-10 did not have a material impact on the Company’s consolidated financial statements.
Comprehensive income (loss)
Comprehensive income (loss) is comprised of two components: net income (loss) and other comprehensive income (loss). Other comprehensive income (loss) refers to revenue, expenses, gains and losses that under GAAP are recorded as an element of stockholders’ equity, but are excluded from net income (loss). The statement of comprehensive income (loss) for the years ended September 30, 2007, 2008 and 2009 and the six months ended March 31, 2010 has been included within the consolidated statements of redeemable convertible preferred stock, stockholders’ equity (deficit) and comprehensive income (loss). Accumulated other comprehensive income in the accompanying consolidated balance sheets consists solely of the unrealized gain (loss) on short-term investments.
Reclassifications
Certain reclassifications have been made to prior year financial statements to conform to the current year presentation. These reclassifications did not have any impact on the previously reported net income (loss) or total stockholders’ equity.
Recent accounting pronouncements
In December 2007, the FASB issued ASC 805 (formerly referred to as FASB Statement No. 141R,Business Combinations). ASC 805 establishes principles and requirements for how the acquirer of a business recognizes and measures in its financial statements the identifiable assets acquired, the liabilities assumed, and any non controlling interest in the acquiree. The statement also provides guidance for recognizing and measuring the goodwill acquired in the business combination and determines what information to disclose to enable users of the financial
F-23
Table of Contents
statements to evaluate the nature and financial effects of the business combination. ASC 805 applies to business combinations made by the Company for which the acquisition date is on or after October 1, 2009. The Company believes ASC 805 may have a material impact on its consolidated financial statements when effective, depending on the size and nature of any future business combinations that the Company may enter into.
In September 2009, the EITF reached a consensus on ASC 605-25 (formerly referred to as Issue 08-1,Revenue Arrangements with Multiple Deliverables). ASC 605-25 eliminates the criterion for objective and reliable evidence of fair value for the undelivered products or services. Instead, revenue arrangements with multiple deliverables should be divided into separate units of accounting if the deliverables meet both of the following criteria:
| • | The delivered items have value to the customer on a standalone basis; and |
| • | If the arrangement includes a general right of return relative to the delivered items, delivery or performance of the undelivered items is considered probable and substantially in the control of the vendor. |
The Issue eliminates the use of the residual method of allocation and requires, instead, that arrangement consideration be allocated, at the inception of the arrangement, to all deliverables based on their relative selling price (i.e., the relative selling price method). When applying the relative selling price method, a hierarchy is used for estimating the selling price for each of the deliverables, as follows:
| • | VSOE of the selling price; |
| • | Third-party evidence of the selling price – prices of the vendor’s or any competitor’s largely interchangeable products or services, in standalone sales to similarly situated customers; and |
| • | Best estimate of the selling price. |
In September 2009, the EITF also reached a consensus on ASC 985-605 (formerly referred to as Issue 09-3,Certain Revenue Arrangements That Include Software Elements). Entities that sell joint hardware and software products that meet the scope exception (i.e., essential functionality) will be required to follow the guidance in ASC 985-605. ASC 985-605 provides a list of items to consider when determining whether the software and non-software components function together to deliver a product’s essential functionality. ASC 605-25 and ASC 985-605 must be adopted for arrangements entered into beginning October 1, 2010 and may be early-adopted. While management expects the adoption of ASC 985-605 and ASC 605-25 to result in the accelerated recognition of product revenue for certain bundled arrangements, management has not yet completed its evaluation of the impact of adopting these standards.
In January 2010, the FASB issued ASU 2010-06,“Improving Disclosures about Fair Value Measurements,” which amends ASC 820,“Fair Value Measures and Disclosures.” ASU 2010-06 requires disclosure of significant transfers into and out of Level 1 and Level 2 of the fair value hierarchy and also requires more detailed disclosure about the activity within Level 3 of the fair value hierarchy. The changes to the ASC as a result of this update were effective on January 1, 2010 for the Company, except for requirements related to Level 3 disclosures, which are effective for annual and interim reporting periods for fiscal years beginning after December 15, 2010 (fiscal 2012 for the Company). The new disclosures related to Level 1 and Level 2 transfers were adopted by the Company on January 1, 2010 and did not have an impact on its consolidated financial statements.
F-24
Table of Contents
2. Short-term investments and fair value measurements
The following table summarizes the Company’s short-term investments in available-for-sale securities as of September 30, 2008 and March 31, 2010. The Company did not have any short-term investments as of September 30, 2009. All short-term investments have contractual maturities within one year of the respective balance sheet dates.
| (in thousands) | September 30, 2008 | |||||||||||
| Amortized cost | Unrealized gains | Unrealized losses | Estimated fair value | |||||||||
Available-for-sale securities: | ||||||||||||
U.S. Government and agency securities | $ | 1,987 | $ | 6 | $ | — | $ | 1,993 | ||||
| March 31, 2010 | ||||||||||||
| (unaudited) | ||||||||||||
| (in thousands) | Amortized cost | Unrealized gains | Unrealized losses | Estimated fair value | ||||||||
Available-for-sale securities | ||||||||||||
U.S. government and agency securities | $ | 5,302 | $ | — | $ | 5 | $ | 5,297 | ||||
Corporate debt securities | 4,096 | — | 2 | 4,094 | ||||||||
Certificates of deposit | 1,602 | — | 1,602 | |||||||||
Commercial paper | 4,796 | — | — | 4,796 | ||||||||
Total | $ | 15,796 | $ | — | $ | 7 | $ | 15,789 | ||||
Available-for-sale securities are reported at fair value with unrealized gains or losses included as a separate component of stockholders’ equity and in total comprehensive income (loss). Realized gains (losses) from the sale of available-for-sale securities have been insignificant in all periods presented.
Fair value accounting.The Company adopted ASC 820 (formerly referred to as FASB Statement No. 157,Fair Value Measurement) effective October 1, 2008. ASC 820 establishes a valuation hierarchy for disclosure of the inputs to fair value measurement. This hierarchy prioritizes the inputs into three broad levels as follows:
Level 1. Inputs are unadjusted quoted prices in active markets for identical assets or liabilities.
Level 2. Inputs are quoted prices for similar assets and liabilities in active markets or inputs that are observable for the assets or liabilities, either directly or indirectly through market corroboration, for substantially the full term of the financial instruments.
Level 3. Inputs are unobservable inputs based on our own assumptions used to measure assets and liabilities at fair value. The inputs require significant management judgment or estimation.
Most of the Company’s financial instruments are classified within Level 1 or Level 2 of the fair value hierarchy because they are valued using quoted market prices, broker or dealer quotations, or alternative pricing sources with reasonable levels of price transparency. The types of instruments valued based on quoted market prices in active markets include money market funds and U.S. Treasury securities. Such instruments are generally classified within Level 1 of the fair value hierarchy.
F-25
Table of Contents
The types of instruments valued based on other observable inputs include U.S. agency securities, commercial paper, U.S. corporate bonds and municipal obligations. The market inputs used to value these instruments generally consist of market yields, reported trades and broker/dealer quotes. Such instruments are generally classified within Level 2 of the fair value hierarchy.
The following table presents the fair value of the Company’s financial assets recorded at fair value as of September 30, 2008, September 30, 2009 and March 31, 2010 using the ASC 820 input categories:
| September 30, 2008 | September 30, 2009 | March 31, 2010 | ||||||||||||||||||||||
| (unaudited) | ||||||||||||||||||||||||
| (in thousands) | Aggregate fair value | Quoted for identical | Significant other observable inputs (Level 2) | Aggregate fair value | Quoted for | Aggregate fair value | Quoted prices in active markets for identical assets (Level 1) | Significant other observable inputs (Level 2) | ||||||||||||||||
U.S. government and agency securities | $ | 1,993 | $ | — | $ | 1,993 | $ | — | $ | — | $ | 5,297 | $ | — | $ | 5,297 | ||||||||
Corporate debt securities | — | — | — | — | — | 4,094 | — | 4,094 | ||||||||||||||||
Certificates of deposit | — | — | — | — | — | 1,602 | — | 1,602 | ||||||||||||||||
Commercial paper | — | — | — | — | — | 4,796 | — | 4,796 | ||||||||||||||||
Money market funds | 20,700 | 20,700 | — | 38,996 | 38,996 | 12,118 | 12,118 | — | ||||||||||||||||
Cash equivalents and available-for-sale securities | 22,693 | $ | 20,700 | $ | 1,993 | 38,996 | $ | 38,996 | 27,907 | $ | 12,118 | $ | 15,789 | |||||||||||
Cash | 27,879 | 28,169 | 27,250 | |||||||||||||||||||||
Total cash, cash equivalents and available-for-sale securities | $ | 50,572 | $ | 67,165 | $ | 55,157 | ||||||||||||||||||
Reported as: | ||||||||||||||||||||||||
Cash and cash equivalents | $ | 48,579 | $ | 67,165 | $ | 39,368 | ||||||||||||||||||
Short-term investments | 1,993 | — | 15,789 | |||||||||||||||||||||
Total cash, cash equivalents and available-for-sale investments | $ | 50,572 | $ | 67,165 | $ | 55,157 | ||||||||||||||||||
3. Business Acquisitions
Force10 Networks, Inc.
On March 31, 2009, the Company acquired 100% of the outstanding capital stock of Legacy Force10. As described in note 1, prior to the acquisition the Company’s legal name was Turin Networks, Inc. Subsequent to the acquisition of Legacy Force10, Turin changed its legal name to Force10 Networks, Inc. Total consideration was $72.2 million, comprised of 424,200 shares of the Company’s common stock, 7,826,800 shares of Series A convertible preferred stock, the value of the warrants described below and $3.1 million of direct acquisition costs. The value of the common and convertible preferred stock issued to Legacy Force10 stockholders in the acquisition was determined by management through a discounted cash flow and comparable company analysis. The Company did not assume any stock options or other stock-based awards in the acquisition; however, warrants to purchase 33,233,441 shares of Legacy Force10’s convertible preferred stock were converted into warrants to purchase 1,036,948 shares of the Company’s Series A convertible preferred stock, and warrants to purchase 369,349 shares of Legacy Force10’s common stock were converted into warrants to purchase 915 shares of the Company’s common stock. Legacy Force10, based in San Jose, California, developed and marketed network
F-26
Table of Contents
infrastructure equipment and services to data center and high performance enterprise customers. The Company acquired Legacy Force10 to provide complementary technology and product lines. Management believed that Legacy Force10’s technology, which focused on high capacity Ethernet switches and routers, would complement the Company’s offerings in the service provider market. These significant factors were the basis for the recognition of goodwill in the acquisition.
Immediately after the acquisition, the stockholders of Legacy Force10 and Turin each owned approximately 50% of the combined Company. Turin was deemed to be the acquirer for accounting purposes as Turin employees made up a majority of the members of management of the combined company, including the chief executive officer (CEO), and more members of Turin’s board of directors remained on the board of directors of the combined company.
The acquisition was accounted for using the purchase method of accounting. Accordingly, the results of Legacy Force10’s operations have been included in the consolidated financial statements from the date of acquisition. The allocation of purchase price to the acquired assets and liabilities was based on their estimated fair values on the acquisition date. The Company’s allocation of the purchase price is summarized below:
| (in thousands) | Amounts | |||
Cash | $ | 11,839 | ||
Other current assets | 37,749 | |||
Property and equipment | 11,794 | |||
Tradename | 10,500 | |||
Developed technology | 2,900 | |||
Customer relationships | 1,500 | |||
Backlog | 1,100 | |||
Other long-term assets | 2,278 | |||
Acquired in-process research and development | 6,500 | |||
Current liabilities | (21,180 | ) | ||
Noncurrent liabilities | (4,169 | ) | ||
Deferred tax liability | (4,000 | ) | ||
Goodwill (assigned to the Ethernet segment) | 15,344 | |||
Total purchase price allocation | $ | 72,155 | ||
At the date of acquisition, the Company immediately expensed $6,500,000, representing purchased in-process research and development related to development projects that had not yet reached technological feasibility and had, in management’s opinion, no alternative future use. The assigned value was determined by estimating the costs to develop the acquired in-process technologies into commercially viable products, estimating the net cash flows from such projects and discounting the net cash flows back to their present value. The key assumptions used in the valuation include, among others, the expected completion date of the in-process projects identified as of the acquisition date, the estimated costs to complete the projects, revenue contributions and expense projections assuming the resulting products have entered the market, and the discount rate based on the risks associated with the development life cycle of the in-process technology acquired. The discount rate used in the present value calculations was obtained from a weighted-average cost of capital analysis, adjusted upward to account for the inherent uncertainties surrounding the successful development of the in-process research and development, the expected profitability levels of such technologies, and the uncertainty of
F-27
Table of Contents
technological advances that could potentially impact the estimates. Projected net cash flows for the projects were based on estimates of revenue and operating profit (losses) related to the project. These projects are expected to be commercially viable in 2010 with $3,800,000 of estimated expenditures to complete.
Carrier Access Corporation
On February 8, 2008, the Company acquired 100% of the outstanding shares of CAC for total cash consideration of $95,357,000, including $92,333,000 in payments to CAC’s stockholders and $3,024,000 of direct acquisition costs. The Company did not assume any stock options or other stock-based awards in the acquisition. CAC, based in Boulder, Colorado, designed, manufactured and sold wireless aggregation and converged business access equipment to wireline and wireless carriers. The purpose for the acquisition was to expand the market in which the Company operates, extend the Company’s offered solutions to wireless and converged IP networks and enable the Company to offer more comprehensive solutions. These significant factors were the basis for the recognition of goodwill on the acquisition.
The acquisition was accounted for using the purchase method of accounting. Accordingly, the results of CAC’s operations have been included in the consolidated financial statements from the date of acquisition. The allocation of purchase price to the acquired assets and liabilities were based on their estimated fair values on the acquisition date. The Company’s allocation of the purchase price is summarized below:
| (in thousands) | Amount | |||
Cash | $ | 68,983 | ||
Other current assets | 11,649 | |||
Property and equipment | 9,644 | |||
Tradename | 980 | |||
Developed technology | 3,139 | |||
Customer relationships | 1,720 | |||
Acquired in-process research and development | 2,567 | |||
Current liabilities | (9,080 | ) | ||
Goodwill (assigned to the Transport segment) | 5,755 | |||
Total purchase price allocation | $ | 95,357 | ||
At the date of acquisition, the Company immediately expensed $2,567,000, representing purchased in-process research and development related to development projects that had not yet reached technological feasibility and had, in management’s opinion, no alternative future use. The assigned value was determined by estimating the costs to develop the acquired in-process technologies into commercially viable products, estimating the net cash flows from such projects and discounting the net cash flows back to their present value. The key assumptions used in the valuation include, among others, the expected completion date of the in-process projects identified as of the acquisition date, the estimated costs to complete the projects, revenue contributions and expense projections assuming the resulting products have entered the market, and the discount rate based on the risks associated with the development life cycle of the in-process technology acquired. The discount rate used in the present value calculations was obtained from a weighted-average cost of capital analysis, adjusted upward to account for the inherent uncertainties surrounding the successful development of the in-process research and development, the expected profitability levels of such technologies, and the uncertainty of
F-28
Table of Contents
technological advances that could potentially impact the estimates. Projected net cash flows for the projects were based on estimates of revenue and operating profit (losses) related to the project. These projects were completed in 2009.
Supplemental pro forma financial information
Unaudited supplemental pro forma financial information, prepared as though the acquisitions had been completed at the beginning of the fiscal year in which they were completed and the beginning of the immediately preceding fiscal year, is as follows:
| Years ended September 30, | Six months ended 2009(3) | |||||||||||||||
| (in thousands, except per share data) | 2007(1) | 2008(2) | 2009(3) | |||||||||||||
Revenue | $ | 67,737 | $ | 340,057 | $ | 199,223 | $ | 124,727 | ||||||||
Net loss | (78,298 | ) | (66,153 | ) | (76,291 | ) | (43,006 | ) | ||||||||
Net income (loss) attributable to common stockholders | (7,198 | ) | (71,125 | ) | 11,673 | (43,006 | ) | |||||||||
Net income (loss) per share | ||||||||||||||||
Basic | (20.92 | ) | (87.81 | ) | 13.70 | 99.20 | ||||||||||
Diluted | (20.92 | ) | (87.81 | ) | (24.41 | ) | (4.95 | ) | ||||||||
| (1) | assumes the acquisition of CAC on October 1, 2006 |
| (2) | assumes the acquisition of CAC and Legacy Force10 on October 1, 2007 |
| (3) | assumes the acquisition of Legacy Force10 on October 1, 2008 |
4. Long-term debt and capital lease obligations
Long-term debt and capital lease obligations consisted of the following:
| September 30, | March 31, 2010 | |||||||||||
| (in thousands) | 2008 | 2009 | ||||||||||
| (unaudited) | ||||||||||||
Revolving line of credit | $ | 13,619 | $ | 20,738 | $ | 21,094 | ||||||
Term loans | 4,445 | 7,361 | 5,694 | |||||||||
Capital lease obligations | 224 | 46 | — | |||||||||
| 18,288 | 28,145 | 26,788 | ||||||||||
Less current portion | (1,847 | ) | (24,117 | ) | (24,427 | ) | ||||||
Noncurrent portion | $ | 16,441 | $ | 4,028 | $ | 2,361 | ||||||
Borrowings outstanding at September 30, 2008 were made under an Amended and Restated Loan and Security Agreement (2008 Agreement) entered into in March 2008 with a financial institution. The 2008 Agreement, as amended, allowed for total borrowings of up to $15 million under a revolving line of credit (Revolver) and $5 million under a term loan. The Revolver bore interest at prime plus 0.5% to 0.75% depending on the Company’s cash balance, and the Term Loan bore interest at a floating rate of prime plus 1% with equal monthly principal payments, plus interest, over 36 months.
In June 2009, the Company entered into a Second Amended and Restated Loan and Security Agreement (2009 Agreement) with the same financial institution, which substantially modified the terms of the 2008 Agreement. This amendment has been treated as an extinguishment of
F-29
Table of Contents
debt under ASC 470-50 (formerly referred to as EITF 96-19Debtors Accounting for a Modification of Exchange of Debt Instruments) and as a result, the Company recorded a $382,000 loss on extinguishment of debt in other income (expense) in the accompanying statement of operations for the year ended September 30, 2009. The 2009 Agreement allows for total borrowings of up to $25 million under the Revolver and $5 million under each of the 2008 Term Loan and 2009 Term Loan (together referred to as the Term Loans). The Revolver bears interest at the greater of 5% and prime plus 1% to 2% depending on the Company’s cash balance. The 2008 Term Loan bears interest at prime plus 1%, and the 2009 Term Loan bears interest at the greater of 6% and prime plus 2%. At September 30, 2009, the prime rate was 3.25%, and accordingly the Revolver, the 2008 Term Loan and the 2009 Term Loan had effective interest rates of 5%, 4.25% and 6%, respectively. The Revolver matures in June 2012, and the Term Loans are repayable in monthly installments through May 2011 (2008 Term Loan) and June 2012 (2009 Term Loan).
These loans are secured by a first priority security interest in all of the Company’s assets either currently owned or subsequently acquired and are subject to the Company complying with financial covenants related to earnings and liquidity levels and certain non-financial covenants. The Company was in compliance with all covenants for all periods presented, except that the Company did not meet one non-financial covenant related to the delivery of audited financial statements to the lender within 120 days after September 30, 2009. Subsequent to September 30, 2009, the lender extended this deadline to March 31, 2010. As of September 30, 2009 and March 31, 2010, the Company recorded the outstanding balance under the Revolver as a current liability as the Company intended to repay the outstanding balance within 12 months.
Of the $25 million of borrowings available under the Revolver, $20 million is based on a percentage of eligible accounts receivable, and $5 million is not subject to such limits. At September 30, 2009, the Company had utilized all borrowings available under the Revolver, and subsequently repaid all such borrowings prior to December 31, 2009.
In June 2009, in connection with the loan modification described above, the Company issued warrants to purchase 49,600 shares of Series B convertible preferred stock. Upon their issuance, the warrants had an estimated fair value of $346,000, using the Black-Scholes option valuation model with the following assumptions: contractual life of 7 years, volatility of 57%, risk-free interest rate of 3.2%, and no expected dividends. The $346,000 fair value of the warrants was included in the loss on extinguishment of debt recorded in 2009.
Future principal repayments under all debt and capital lease arrangements at September 30, 2009 are as follows:
(dollars in thousands) Year ending September 30, | Amount | ||
2010 | $ | 24,117 | |
2011 | 2,778 | ||
2012 | 1,250 | ||
Total | $ | 28,145 | |
F-30
Table of Contents
5. Convertible preferred stock
A summary of the authorized, issued, and outstanding convertible preferred stock as of September 30, 2008 and 2009 is as follows:
| (dollars in thousands) | September 30, 2008 | |||||||||
| Series | Shares authorized | Shares issued and outstanding | Carrying value | Liquidation preference | ||||||
A-1 | 20,200,000 | 16,879,411 | $ | 100,464 | $ | 170,651 | ||||
B-1 | 9,062,141 | 472,055 | 3,597 | 4,102 | ||||||
C-1 | 18,056,324 | 16,915,216 | 93,155 | 96,828 | ||||||
Total | 47,318,465 | 34,266,682 | $ | 197,216 | $ | 271,581 | ||||
| September 30, 2009 | ||||||||||
| Series | Shares authorized | Shares issued and outstanding | Carrying value | Liquidation preference | ||||||
A | 18,211,960 | 1,182,040 | $ | 10,282 | $ | 41,005 | ||||
A-1 | 18,211,960 | 13,876,120 | 111,443 | 481,357 | ||||||
B | 12,122,960 | 9,923,080 | 82,814 | 90,000 | ||||||
Total | 48,546,880 | 24,981,240 | $ | 204,539 | $ | 612,362 | ||||
There were no changes to the issued and outstanding convertible preferred stock during the six months ended March 31, 2010. In October 2009, the Company amended its certificate of incorporation to authorize 31,702,920 shares of convertible preferred stock, consisting of 1,368,000, 18,211,960 and 12,122,960 shares of Series A, A-1 and B convertible preferred stock, respectively.
The holders of Series A, A-1 and B convertible preferred stock (collectively, the Preferred Stock) outstanding at September 30, 2009 and March 31, 2010 had various rights and preferences as follows:
Voting
Each share of Preferred Stock has voting rights equal to an equivalent number of shares of common stock into which it is convertible and votes together as one class with the common stock.
All directors of the Company’s board of directors are elected by the holders of the outstanding common stock and the Preferred Stock, voting together as a single class on an as-converted basis.
Liquidation
In the event of any liquidation, dissolution, or winding up of the Company, either voluntary or involuntary, distributions to the stockholders of the Company shall be made as stated below.
The holders of Series B convertible preferred stock shall be entitled to receive, prior and in preference to any distribution of any of the assets or surplus funds of the Company to the holders of any other class of stock, $9.07 per share plus all declared and unpaid dividends. If the assets or property to be distributed are insufficient to permit the payment to holders of the
F-31
Table of Contents
Series B convertible preferred stock of their full respective preferential amounts, then the entire assets and funds of the Company legally available for distribution shall be distributed ratably among the holders of Series B convertible preferred stock.
After payment has been made to the holders of the Series B convertible preferred stock of their full preferential amounts, the holders of Series A-1 convertible preferred stock shall be entitled to receive, prior and in preference to any distribution of any of the assets or surplus funds of the Company to the holders of Series A convertible preferred stock and common stock, $34.69 per share plus all declared and unpaid dividends. If the assets or property to be distributed after distribution to the holders of Series B convertible preferred stock are insufficient to permit the payment to holders of the Series A-1 convertible preferred stock of their full respective preferential amounts, then the entire remaining assets and funds legally available for distribution shall be distributed ratably among the holders of Series A-1 convertible preferred stock.
After payment has been made to the holders of the Series B and A-1 convertible preferred stock of their full respective preferential amounts, the holders of Series A convertible preferred stock shall be entitled to receive, prior and in preference to any distribution of any of the assets or surplus funds of the Company to the holders of the common stock, $34.69 per share plus all declared and unpaid dividends. If the remaining assets or property to be distributed are insufficient after distribution to the holders of Series B and A-1 convertible preferred stock to permit the payment to holders of the Series A convertible preferred stock of their full respective preferential amounts, then the entire remaining assets and funds of the Company legally available for distribution shall be distributed ratably among the holders of Series A convertible preferred stock.
After payment has been made to the holders of the Preferred Stock of their full respective preferential amounts, all remaining assets available for distribution, if any, shall be distributed ratably among the holders of the common stock.
Conversion
Each share of Preferred Stock is convertible into common stock at the option of the holder. The applicable conversion ratio is determined by dividing $3.02 for the Series B convertible preferred stock, $9.07 for the Series A-1 convertible preferred stock and $3.02 for the Series A convertible preferred stock by, in each case, a conversion price of $3.02 (adjusted for any stock split, reverse stock split, subdivision or combination of common stock). This conversion price is also subject to additional adjustments if the Company makes certain dilutive issuances of capital stock. At September 30, 2009, each share of Series A and Series B convertible preferred stock was convertible into one share of common stock, and each share of Series A-1 convertible preferred stock was convertible into three shares of common stock.
Each share of Preferred Stock shall automatically be converted into shares of common stock utilizing the then-effective conversion price upon (1) the closing of an initial public offering with a price per share of at least $4.53 (adjusted for any stock split, reverse stock split, subdivision or combination of common stock) and gross proceeds of at least $30 million, (2) in connection with a specific liquidation event, at the election of holders of at least 50% of the then-outstanding shares of each series of Preferred Stock, voting separately, or (3) other than in connection with a specific liquidation event, at the election of holders of greater than 50% of the then-outstanding shares of Preferred Stock, voting together as a single class on an as-converted basis.
F-32
Table of Contents
Dividends
Each holder of the outstanding shares of Series A, A-1 and B convertible preferred stock shall be entitled to receive noncumulative dividends, prior to and in preference to any dividends payable to the holders of common stock, if and when declared by the board of directors, at the rate of $0.18, $0.54 and $0.18 per share, respectively, as adjusted for subsequent stock splits, stock combinations and the like. After payment of any dividends on each series of Preferred Stock, any additional dividends or distributions shall be distributed among all holders of common stock and Preferred Stock in proportion to the number of shares of common stock that would be held by each holder on an as-converted basis. The Company has not declared dividends on any class of stock from inception through September 30, 2009.
Redemption
The Preferred Stock is not redeemable.
2009 preferred stock transactions
Recapitalization and issuance of Series A convertible preferred stock
On March 31, 2009, in contemplation of and immediately prior to the acquisition of Legacy Force10 (as described in note 3) the Company converted all of its then outstanding Series A-1, B-1 and C-1 convertible preferred stock, and all warrants to purchase such convertible preferred stock, into Series A convertible preferred stock, and warrants to purchase Series A convertible preferred stock, on a one-for-one basis (2009 Recapitalization). Immediately following this exchange, and immediately prior to the acquisition of Legacy Force10, the Company completed a 1-for-175 reverse split of the Series A convertible preferred stock. As discussed in note 1, in October 2009 the Company completed a 40-for-1 forward split of the Series A convertible preferred stock. As a result, and taking into account these stock splits, a total of 34,266,682 shares of Series A-1, B-1 and C-1 convertible preferred stock were converted into 7,829,160 shares of Series A convertible preferred stock. In addition, warrants to purchase a total of 4,081,484 shares of Series A-1, B-1 and C-1 convertible preferred stock were converted into warrants to purchase 932,814 shares of Series A convertible preferred stock.
The Company accounted for the 2009 Recapitalization in accordance with ASC 260-10-S99-2 (formerly referred to as EITF Topic D-42, The Effect on the Calculation of Earnings per Share for the Redemption or Induced Conversion of Preferred Stock). Under the provisions of ASC 260-10-S99-2, the Company recorded the $129,095,000 difference between the fair value of the newly issued Series A convertible preferred stock ($68,121,000) and the carrying value of the Series A-1, B-1 and C-1 convertible preferred stock immediately prior to the Recapitalization ($197,216,000) as a reduction to accumulated deficit. In addition, the Company recorded an increase to accumulated deficit of $872,000 related to the increase in the fair value of warrants as a result of the exchange. The fair value of the Series A-1, B-1, C-1 and A warrants was determined using the Black-Scholes option-pricing model with the following assumptions: remaining contractual term at the date of exchange 3.0-6.3 years, expected volatility of 46%-52%, risk-free interest rate of 1.2%-3.0% and no expected dividends.
In connection with the acquisition of Legacy Force10 (see note 3), the Company issued 7,826,800 shares of Series A convertible preferred stock to the Legacy Force10 stockholders.
F-33
Table of Contents
Issuance of Series B and A-1 convertible preferred stock
During the year ended September 30, 2009, the Company issued a total of 9,923,080 shares of Series B convertible preferred stock. In order to incentivize holders of Series A convertible preferred stock to participate in the Series B financing, holders of Series A convertible preferred stock who purchased a certain minimum amount of Series B convertible preferred stock were eligible to exchange their shares of Series A convertible preferred stock into shares of a new Series A-1 convertible preferred stock on a one-for-one basis, and to exchange warrants to purchase Series A convertible preferred stock into warrants to purchase Series A-1 convertible preferred stock on a one-for-one basis. As a result, a total of 13,876,120 shares of Series A convertible preferred stock were converted into Series A-1 convertible preferred stock, and warrants to purchase 1,751,094 shares of Series A convertible preferred stock were converted into warrants to purchase 1,751,094 shares of Series A-1 convertible preferred stock.
As consideration for the issuance of Series B convertible preferred stock the Company received gross cash proceeds of $30,000,000. Management determined that the issuance price of Series B convertible preferred stock was below its fair value. Accordingly, the Company recorded the Series B convertible preferred stock at its fair value of $86,815,000, and the $56,815,000 difference between its fair value and the proceeds from issuance was accounted for as a deemed dividend and charged to accumulated deficit.
The Company accounted for the exchange as a redemption of the Series A convertible preferred stock. Under the provisions of ASC 260-10-S99-2 the Company recorded the $9,255,000 difference between the fair value of the newly issued Series A-1 convertible preferred stock and the carrying value of the exchanged Series A convertible preferred stock immediately prior to the exchange as a reduction to accumulated deficit. In addition, the Company recorded a reduction to accumulated deficit of $2,618,000 related to the decrease in the fair value of preferred stock warrants as a result of the exchange. The fair value of the Series A and A-1 warrants was determined using the Black-Scholes option-pricing model with the following assumptions: remaining contractual term at the date of exchange 1.5-5.5 years, expected volatility of 50%-54%, risk-free interest rate of 1.6%-2.7% and no expected dividends.
Preferred stock repurchase
During the year ended September 30, 2009 the Company repurchased a total of 601,040 shares of Series A convertible preferred stock for total cash consideration of $997,000. The $4,683,000 excess of the carrying value of the repurchased shares over the purchase price has been recorded as a reduction of accumulated deficit in accordance with ASC 260-10-S99-2.
2008 preferred stock transactions
Issuance of Series B-1 convertible preferred stock
During the year ended September 30, 2008, the Company issued 692,707 shares of Series B-1 convertible preferred stock for gross cash proceeds of $6,020,000.
Issuance of Series C-1 convertible preferred stock
During the year ended September 30, 2008 the Company issued 6,813,061 shares of Series C-1 convertible preferred stock for gross cash proceeds of $39,000,000. To incentivize holders of Series B-1 convertible preferred stock to participate in the Series C-1 financing, the Company offered to convert those shares of Series B-1 convertible preferred stock and warrants to
F-34
Table of Contents
purchase Series B-1 convertible preferred stock held by the investors into shares of Series C-1 convertible preferred stock and warrants to purchase Series C-1 convertible preferred stock if the investor purchased at least a predefined number of shares of Series C-1 preferred stock for cash. Accordingly, 6,654,532 shares of B-1 convertible preferred stock and 337,178 warrants to purchase Series B-1 convertible preferred stock were exchanged for 10,102,153 shares of Series C-1 convertible preferred stock and 511,866 warrants to purchase Series C-1 convertible preferred stock, respectively.
The Company accounted for the exchange as a redemption of the Series B-1 convertible preferred stock. Under the provisions of ASC 260-10-S99-2, the Company recorded the $4,400,000 difference between the fair value of the newly issued Series C-1 convertible preferred stock and the carrying value of the exchanged Series B-1 convertible preferred stock immediately prior to the exchange as an increase to accumulated deficit. In addition, the Company recorded a $572,000 increase to accumulated deficit related to the excess of the fair value of warrants immediately before and after the exchange. The fair value of the Series B-1 and C-1 warrants was determined using the Black-Scholes option-pricing model with the following assumptions: remaining contractual term at the date of exchange - 5 years for C-1 warrants and 4 years for B-1 warrants; expected volatility of 46.40%, risk-free interest rate of 2.93% and no expected dividends.
2007 preferred stock transactions
2007 Recapitalization
At September 30, 2006, the Company had six classes of preferred stock outstanding - Series A through E convertible preferred stock and 54.9 million shares of Series F redeemable convertible preferred stock (the Original Preferred Stock), and certain warrants to purchase such Original Preferred Stock. All such securities were redeemed as part of a recapitalization described below.
In January 2007, in order to simplify the Company’s capital structure, induce prospective investors and facilitate the Series B-1 financing round, the Board of Directors of the Company adopted, and the stockholders approved, a resolution providing for the exchange in rights and conversion of all outstanding shares of Original Preferred Stock into approximately 16.9 million shares of Series A-1 convertible preferred stock in accordance with the conversion ratios as described below (the Recapitalization) to be effective as of the date that the Company issued at least $10,000,000 of Series B-1 convertible preferred stock. Accordingly, upon the first closing of Series B-1 convertible preferred stock in March 2007, each share of Series A, B, and D convertible preferred stock was converted into 0.05 shares of Series A-1 convertible preferred stock, each share of Series C convertible preferred stock was converted into 0.11157 shares of Series A-1 convertible preferred stock, each share of Series E convertible preferred stock was converted into 0.0625 shares of Series A-1 convertible preferred stock, and each share of Series F redeemable convertible preferred stock was converted into 0.166033 shares of Series A-1 convertible preferred stock.
The Recapitalization was effected through a redemption of the Original Preferred Stock and the issuance of Series A-1 convertible preferred stock. Accordingly, the Company accounted for the Recapitalization in accordance with ASC 260-10-S99-2 and recorded the $71,100,000 difference between the fair value of the newly issued Series A-1 convertible preferred stock ($100,464,000) and the carrying value of the Original Preferred Stock immediately prior to the Recapitalization ($171,564,000) as a reduction to accumulated deficit.
F-35
Table of Contents
Warrants to purchase preferred stock
A schedule of outstanding and exercisable warrants to purchase Preferred Stock as of September 30, 2009 is as follows:
| Series | Dates of issuance | Year of expiration | Exercise price | Shares subject to warrants outstanding | ||||
A | March 2009 | 2009–2015 | $19.50–164.50 | 184,566 | ||||
A-1 | June 2009–July 2009 | 2010–2015 | 3.02–29.96 | 1,751,094 | ||||
B | June 2009–August 2009 | 2014–2016 | 3.02 | 433,400 | ||||
Total | 2,369,060 | |||||||
In January and February 2007, the Company issued warrants to purchase a total of 1,121,333 shares of Series F preferred stock to lenders in connection with the issuance of convertible notes with a principal amount of $2,765,000. Upon their issuance, the Company estimated the fair value of the warrants to be $945,000. After allocating $945,000 of the proceeds to the warrants, the Company determined that the convertible notes included a beneficial conversion feature of $945,000, which has been recorded as additional paid-in capital. The total debt discount of $1,890,000 related to the fair value of the warrants and the beneficial conversion feature was charged to interest expense in March 2007 when the associated notes and accrued interest of $53,000 were converted into Series B-1 convertible preferred stock.
The Company adopted ASC 815-40-15 effective on October 1, 2009. Under the provisions of ASC 815, the Company determined that the warrants to purchase Preferred Stock should be classified as liabilities and recorded at their fair value at each balance sheet date, with the increase or decrease in fair value reported in other income (expense) in the consolidated statement of operations. On October 1, 2009 the Company reclassified the carrying value of its warrants to purchase Preferred Stock from additional paid-in capital to a current liability. The difference between the fair value of the warrants at October 1, 2009 and the amount previously recorded in stockholders’ equity was $2,224,000, which was recorded as a charge to accumulated deficit upon adoption. As of March 31, 2010, the fair value of the warrant liability was $16,021,000, and the decrease in value of $5,767,000 during the six months ended March 31, 2010 has been recorded in the accompanying statement of operations as a component of other income (expense).
The fair value of the Company’s Preferred Stock warrants was estimated using the following assumptions:
| October 1, 2009 | March 31, 2010 | |||
| (unaudited) | ||||
Expected volatility | 49.6–70.8% | 40.6–63.9% | ||
Expected dividends | — | — | ||
Expected term (in years) | 0.3–6.8 | 0.8–6.3 | ||
Risk-free interest rate | 0.5–2.7% | 0.3–3.0% | ||
F-36
Table of Contents
6. Common stock
1999 stock plan
In September 1999, the Company’s stockholders approved the 1999 Stock Option Plan (the 1999 Plan), which provided for the grant of short-term and long-term incentive and other stock awards.
2000 executive stock purchase plan
In January 2000, the Company adopted the 2000 Executive Stock Purchase Plan (the 2000 Plan). The 2000 Plan provided for the sale or grant of common stock to executive officers of the Company to promote the success of the Company’s business.
2007 equity incentive plan
In connection with the 2007 Recapitalization, the board of directors adopted a resolution to terminate the 1999 Plan and the 2000 Plan (the Original Plans) with respect to new issuances and replace them with the 2007 Equity Incentive Plan (the 2007 Plan). As of September 30, 2009, a total of 9,724,040 shares of common stock were reserved for issuance under the 2007 Plan. In November 2009, the board of directors approved an increase of 1,200,000 shares under the 2007 Plan to a total of 10,924,040 shares, and in February 2010, the board of directors approved an increase of 5,282,928 shares under the 2007 Plan to a total of 16,206,968 shares.
Options granted under the various plans are generally granted with an exercise price equal to the fair value of the Company’s common stock on the grant date, are exercisable for ten years, and vest as to 1/4th of the award on the first anniversary of the grant, and 1/48th of the award for each of the next 36 months. Certain options are exercisable immediately subject to repurchase by the Company at the original exercise price. This repurchase right lapses in accordance with the vesting schedule of the original option. At September 30, 2009 and March 31, 2010, a total of 76,000 and 2,680,920 shares of common stock, respectively, were subject to repurchase by the Company.
2010 equity incentive plan
In March 2010, the board of directors approved the adoption of the 2010 Equity Incentive Plan, the 2010 Plan, to be effective upon the effective date of the Company’s IPO. The 2010 Plan will serve as the successor equity compensation plan to the 2007 Plan. The number of shares of common stock reserved under the 2010 Plan will be the sum of: 1) all shares of common stock reserved under the 2007 Plan that are not issued or subject to outstanding grants as of the completion of the IPO; 2) any shares of the Company’s common stock issued under the 2007 Plan or the 1999 Plan that are forfeited or repurchased by the Company at the original purchase price; and 3) any shares issuable upon exercise of options granted under the 2007 Plan or the 1999 Plan that expire without having been exercised in full. Additionally, the 2010 Plan provides for automatic increases in the number of shares available for issuance under it as follows: 1) on January 1, 2011, the number of shares of common stock available for issuance under the 2010 Plan will be automatically increased by an amount equal to the product of 5% of the number of shares of common stock issued and outstanding on December 31, 2010 multiplied by a fraction, the numerator of which is the number of days between the completion of the IPO and December 31, 2010 and the denominator of which is 365; 2) on each January 1 from 2012 through 2020, the number of shares of common stock available for issuance under the 2010 Plan will be increased by 5% of the number of shares of common stock issued and outstanding on the preceding December 31; or 3) a lesser number of shares of common stock as determined by the board of directors.
F-37
Table of Contents
A summary of activity under all plans is as follows:
Number of shares | Weighted- average exercise price | Weighted- average remaining contractual life (years) | Aggregate intrinsic value | ||||||||
Balance—October 1, 2006 | 471,324 | $ | 7.92 | ||||||||
Granted (weighted-average fair value of $4.68) | 672,523 | 7.70 | |||||||||
Exercised(1) | (3,721 | ) | 7.00 | ||||||||
Canceled | (84,826 | ) | 11.59 | ||||||||
Balance—September 30, 2007 (341,111 shares were vested at a weighted-average exercise price of $7.48) | 1,055,300 | 7.13 | |||||||||
Granted (weighted-average fair value of $2.01) | 1,058,965 | 6.48 | |||||||||
Exercised(1) | (89,000 | ) | 6.96 | ||||||||
Canceled | (474,489 | ) | 7.74 | ||||||||
Balance—September 30, 2008 (753,219 shares were vested at a weighted-average exercise price of $7.00) | 1,550,776 | 6.78 | |||||||||
Granted (weighted-average fair value of $0.04) | 8,385,817 | 0.07 | |||||||||
Exercised(1) | (76,000 | ) | 0.06 | ||||||||
Canceled | (1,733,982 | ) | 5.92 | ||||||||
Balance—September 30, 2009 | 8,126,611 | 0.09 | 9.9 | $ | 4,093,000 | ||||||
Granted (weighted-average fair value of $1.13)(2) | 2,528,670 | 0.94 | |||||||||
Exercised(1)(2) | (2,624,920 | ) | 0.11 | ||||||||
Canceled(2) | (749,938 | ) | 0.24 | ||||||||
Balance—March 31, 2010(2) | 7,280,423 | 0.36 | 9.5 | 25,153,000 | |||||||
Shares subject to options vested and expected to vest—September 30, 2009 | 5,892,219 | 0.09 | 9.9 | 2,966,000 | |||||||
Shares subject to options vested—September 30, 2009 | 18,310 | 6.72 | 2.8 | — | |||||||
Shares subject to options vested and expected to vest—March 31, 2010(2) | 9,454,348 | 0.28 | 9.2 | 33,424,000 | |||||||
Shares subject to options vested—March 31, 2010(2) | 46,071 | 1.85 | 9.1 | 108,000 | |||||||
| (1) | The aggregate intrinsic value of options exercised was insignificant for all periods presented except for the six months ended March 31, 2010 when the intrinsic value of options exercised was $1,456,000. |
| (2) | unaudited |
In July 2009, the Company announced that its board of directors approved a voluntary stock option exchange program (the Stock Option Exchange) for certain holders of options to purchase the Company’s common stock. The Stock Option Exchange offered to replace outstanding options granted to holders of stock options under the 2007 Equity Incentive Plan and 1999 Stock Plan. The offer commenced on July 15, 2009 and expired on August 12, 2009.
Under the terms of this offer, previously granted options were exchanged for new replacement options to purchase shares of the Company’s common stock at an exercise price per share equal to the fair value of the Company’s common stock on the date of grant. The number and terms of the replacement options were determined solely based on the Company’s management assessment, and do not correlate to the number and terms of the previously tendered options.
On August 14, 2009, the board of directors approved and ratified the grant for the replacement options, and, in accordance with the terms of the Stock Option Exchange, the Company cancelled outstanding options to purchase 1,053,640 shares of common stock and issued new options to
F-38
Table of Contents
purchase 4,468,120 shares of common stock at an exercise price of $0.06 per share. In accordance with the guidance in ASC 718-10 regarding the modification of stock-based awards, the Company determined that the fair value of the awards immediately after modification was $147,000 greater than their fair value immediately prior to modification. For those awards that were vested at the date of modification, the Company recognized an immediate compensation expense related to the incremental value. For awards that had not vested at the date of modification, the Company is recognizing the incremental compensation expense, along with the remaining unamortized expense related to the original awards, over the remaining service period.
In general, the shares underlying the options issued in the Stock Option Exchange and any option issued thereafter will only become exercisable to the extent they are vested upon the earlier of (i) two years after the date of grant, (ii) the Company’s IPO of its securities or (iii) immediately prior to a change of control that causes all options to accelerate and become immediately exercisable under the terms of the 2007 Plan. Following one of these exercise events, any unvested shares underlying these options will become exercisable as they vest.
In May 2008, the board of directors adopted a resolution to cancel 320,516 stock options granted between February 6, 2008 and March 31, 2008 and replace them with an equal number of options identical in all respects except that the exercise price was reduced from $7.88 per share to $5.03 per share. In accordance with the guidance in ASC 718-10 regarding modification of stock-based awards, the Company determined that the fair value of the awards immediately after modification was $182,000 greater than their fair value immediately prior to modification. For those awards that were vested at the date of modification, the Company recognized an immediate compensation expense related to the incremental value. For awards that had not vested at the date of modification, the Company is recognizing the incremental compensation expense, along with the remaining unamortized expense related to the original awards, over the remaining service period.
During 2008, the Company adopted an Executive Bonus Program under which certain executives were entitled to receive cash bonuses and fully vested stock options if certain performance criteria were met during the period from February 2008 through September 2008. As the performance period was completed on September 30, 2008, the Company only recognized expense for those options that vested. The Company ultimately granted fully vested options to purchase a total of 163,118 shares of common stock under the 2007 Plan. The estimated fair value of these options at the date of grant was $283,000, which was recorded as stock-based compensation in 2008. No performance-based options were granted in the year ended September 30, 2009.
In January 2008, the Company signed a Retention Bonus Agreement (the Agreement) with its CEO. Under the Agreement, the CEO agreed to modify 73,143 fully vested stock options held by him, such that these options became unvested and will vest ratably over 24 months from the date of the Agreement. In addition, the CEO was paid a $910,000 cash bonus, which is forfeitable in the event the CEO is terminated for cause or voluntarily terminates his employment with the Company. This obligation lapses ratably over 24 months, and expired in January 2010. The Company accounted for this agreement as the modification of stock options and a prepaid bonus. The difference in fair value of the stock options immediately before and after the modification was insignificant. The $910,000 bonus was recorded in prepaid expenses and other current assets, and is being amortized to general and administrative expense ratably over
F-39
Table of Contents
24 months. During 2008 and 2009, a total of $366,000 and $455,000 of expense was recognized in relation to this Agreement. The options granted under this Agreement were cancelled in connection with the Stock Option Exchange.
Options outstanding and vested as of September 30, 2009 were as follows:
| Options outstanding | ||||||
| Exercise prices | Number of shares subject to options outstanding | Weighted- average remaining contractual life (in years) | Number of shares subject to options vested | |||
$0.06 | 8,097,280 | 9.9 | — | |||
5.03 | 14,078 | 7.6 | 6,473 | |||
7.00 | 3,488 | 3.3 | 3,251 | |||
7.88 | 9,330 | 5.4 | 7,094 | |||
8.01 | 2,435 | 5.6 | 1,492 | |||
Total | 8,126,611 | 18,310 | ||||
Options outstanding and vested as of March 31, 2010 were as follows:
| Options outstanding | Number of shares subject to options vested | |||||
| Exercise prices | Number of shares subject to options outstanding | Weighted- average remaining contractual life (in years) | ||||
| (unaudited) | ||||||
$0.06 | 5,901,835 | 9.40 | — | |||
1.11 | 1,098,520 | 9.73 | 40,000 | |||
2.36 | 53,200 | 9.79 | — | |||
3.51 | 9,400 | 9.86 | — | |||
3.81 | 208,950 | 9.99 | — | |||
5.03 | 3,626 | 6.64 | 2,123 | |||
7.00 | 1,450 | 3.85 | 1,366 | |||
7.87 | 1,956 | 5.73 | 1,882 | |||
8.01 | 1,486 | 7.35 | 700 | |||
Total | 7,280,423 | 46,071 | ||||
Stock-based compensation
Valuation method. The Company estimates the fair value of stock options granted using the Black-Scholes valuation model.
Expected term. The expected term of options represents the period that the Company’s stock-based awards are expected to be outstanding. As the Company does not have sufficient historical experience for determining the expected term of the stock option awards granted, the expected term has been estimated using the simplified method available under ASC 718-10 (formerly referred to as Staff Accounting Bulletin 107). For those options for which the simplified method is not appropriate, the expected term is based on management’s best estimate.
F-40
Table of Contents
Expected volatility. As the Company is privately held, there is no observable market for the Company’s common stock. Accordingly, expected volatility has been estimated based on the volatilities of similar publicly traded companies.
Risk-free interest rate. The Company bases the risk-free interest rate on the implied yield available on the U.S. Treasury zero-coupon issues with a remaining term equivalent to the expected term of the option.
Expected dividends. The expected dividend assumption is based on the Company’s current expectations about its anticipated dividend policy.
Expected forfeitures. Management estimates expected forfeitures and stock-based compensation expense is recognized only for those equity awards expected to vest.
The fair value of the Company’s stock-based awards to employees was estimated using the following weighted-average assumptions:
| Year ended September 30 | Six months ended March 31, 2010 | ||||||||||
| 2007 | 2008 | 2009 | |||||||||
| (unaudited) | |||||||||||
Expected volatility | 60.5 | % | 52.4 | % | 50.7 | % | 50.2% | ||||
Expected dividends | — | — | — | — | |||||||
Expected term (in years) | 6.0 | 6.0 | 6.1 | 6.3 | |||||||
Risk-free interest rate | 4.6 | % | 3.2 | % | 2.9 | % | 2.9% | ||||
As of September 30, 2009 and March 31, 2010, the total compensation cost related to unvested awards not yet recognized is approximately $2.1 million and $3.7 million, which are both expected to be recognized over a weighted-average period of approximately 2.3 years.
The following table summarizes all stock option grants for the period from January 1, 2009 to March 31, 2010:
| Grant date | Shares subject to options granted | Common stock fair value per share at grant for financial reporting purposes | Exercise price per share | Intrinsic value per share | ||||||||
August 14, 2009 | 8,281,080 | $ | 0.06 | $ | 0.06 | $ | — | |||||
September 16, 2009 | 98,600 | 0.06 | 0.06 | — | ||||||||
October 18, 2009(2) | 1,038,600 | 0.57 | (1) | 0.06 | 0.51 | |||||||
December 24, 2009(2) | 1,218,520 | 2.15 | (1) | 1.11 | 1.04 | |||||||
January 15, 2010(2) | 53,200 | $ | 3.23 | $ | 2.36 | $ | 0.87 | |||||
February 9, 2010(2) | 9,400 | $ | 3.51 | $ | 3.51 | — | ||||||
March 26, 2010(2) | 208,950 | $ | 3.81 | $ | 3.81 | — | ||||||
| (1) | At the time of these grants, the Company’s board of directors determined that the fair value of the Company’s common stock was $0.06 per share as of October 18, 2009, $1.11 per share as of December 24, 2009 and $2.36 as of January 15, 2010. Subsequent to these grants, the Company obtained valuations of its common and preferred stock as of October 1, 2009 and December 31, 2009 for the purposes of adopting ASC 815-40-15. These valuations indicated a fair value of common stock of $0.57 as of October 1, 2009, $2.15 as of December 31, 2009 and $3.23 as of January 15, 2010 which, for financial reporting purposes, the Company has determined to be more precise estimates of the fair value of its common stock at these grant dates. As such, the Company has recorded additional expense in the statement of operations related to these options due to the difference between the exercise price and the reassessed grant date fair value. |
| (2) | Unaudited. |
The fair value of the Company’s common stock at the date of each option grant is determined by the Company’s board of directors. For all of the options listed above, the board of directors’ intent was to grant the options with exercise prices at least equal to the fair value of the
F-41
Table of Contents
Company’s common stock at the date of grant. Given the absence of an active market for the Company’s common stock, the board of directors engaged a third party appraisal firm to assist in performing contemporaneous valuations of the Company’s common stock as of August 7, 2009 and November 29, 2009. The August 7, 2009 valuation was considered in setting the exercise price of options granted on August 14, 2009, September 16, 2009 and October 18, 2009; the November 29, 2009 valuation was considered in setting the exercise price of options granted on December 24, 2009 and January 15, 2010; the February 3, 2010 valuation was considered in setting the exercise price of options granted on February 9, 2010; and the March 16, 2010 valuation was considered in setting the exercise price of options granted on March 26, 2010.
In February 2010, in connection with the Company’s adoption of ASC 815-40-15, the Company engaged a third party appraisal firm to assist in performing retrospective valuations of the Company’s preferred and common stock as of October 1, 2009 and December 31, 2009, which indicated a fair value of common stock of $0.57 as of October 1, 2009, $2.15 as of December 31, 2009 and $3.23 as of January 15, 2010. As discussed above, for financial reporting purposes the retrospective October 1, 2009 valuation was used as a basis for determining the fair value of options granted on October 18, 2009, and the retrospective December 31, 2009 valuation was used as a basis for determining the fair value of options granted on December 24, 2009 and January 15, 2010.
On June 3, 2010, the Company granted options to purchase 3,121,041 shares of common stock under the 2007 Plan at an exercise price of $2.89 per share, which the board of directors determined to be the fair value of the Company’s common stock on June 3, 2010.
Warrants to purchase common stock
A schedule of outstanding and exercisable common stock warrants at September 30, 2009 and March 31, 2010 (unaudited), is as follows:
| Date of issuance | Term | Exercise price | Shares | ||||
December 2002 | 10 years | $ | 64.75 | 47,995 | |||
January 2003 | 10 years | 64.75 | 5,141 | ||||
Total | 53,136 | ||||||
Shares reserved for future issuance
A schedule of shares of common stock reserved for future issuance is as follows:
| September 30, 2009 | March 31, 2010 | |||
| (unaudited) | ||||
Convertible preferred stock | 52,733,480 | 52,733,480 | ||
Convertible preferred stock warrants | 5,871,473 | 5,871,016 | ||
Common stock warrants | 53,136 | 53,136 | ||
Options outstanding | 8,126,611 | 7,280,423 | ||
Options available for future grant | 2,724,917 | 6,227,075 | ||
Total | 69,509,617 | 72,165,130 | ||
F-42
Table of Contents
7. Net income (loss) per share
Basic and diluted net income (loss) per share is presented in conformity with the two-class method required for participating securities. Under the two-class method, basic net income (loss) per share is computed by dividing the net income (loss) attributable to common stockholders by the weighted-average number of common shares outstanding during the period. Net income (loss) attributable to common stockholders is determined by allocating undistributed earnings between holders of common and convertible preferred stock, based on the contractual dividend rights of the holders of convertible and preferred stock including those dividends payable on convertible preferred stock prior and in preference to the holders of common stock. Diluted net income (loss) per share assumes, on a weighted average basis, the conversion of the convertible preferred stock, if dilutive, and includes the dilutive effect, if any, of stock options and warrants using the treasury stock method. The following table presents the calculation of basic and diluted net income (loss) per share.
| Years ended September 30, | Six months ended March 31, | |||||||||||||||||||
| (in thousands, except per share data) | 2007 | 2008 | 2009 | 2009 | 2010 | |||||||||||||||
| (unaudited) | ||||||||||||||||||||
Numerator | ||||||||||||||||||||
Basic | ||||||||||||||||||||
Net income (loss) | $ | (29,455 | ) | $ | 5,444 | $ | (54,590 | ) | $ | (21,306 | ) | $ | (7,372 | ) | ||||||
Deemed contributions (dividends) related to preferred stock transactions | 71,100 | (4,972 | ) | 87,964 | 128,223 | — | ||||||||||||||
Undistributed earnings allocated to convertible preferred stock | — | (5,444 | ) | — | — | — | ||||||||||||||
Net income (loss) attributable to common stockholders for purposes of calculating basic income (loss) per share | $ | 41,645 | $ | (4,972 | ) | $ | 33,374 | $ | 106,917 | $ | (7,372 | ) | ||||||||
Diluted | ||||||||||||||||||||
Net income (loss) attributable to common stockholders | $ | 41,645 | $ | (4,972 | ) | $ | 33,374 | $ | 106,917 | $ | (7,372 | ) | ||||||||
Dilutive impact of deemed contributions related to preferred stock transactions | (89,748 | ) | — | (128,223 | ) | (128,223 | ) | — | ||||||||||||
Net income (loss) attributable to common stockholders for purposes of calculating diluted income (loss) per share | $ | (48,103 | ) | $ | (4,972 | ) | $ | (94,849 | ) | $ | (21,306 | ) | $ | (7,372 | ) | |||||
Denominator | ||||||||||||||||||||
Basic shares | ||||||||||||||||||||
Weighted-average shares used to compute basic net income (loss) per share | 344 | 386 | 640 | 435 | 863 | |||||||||||||||
Diluted shares | ||||||||||||||||||||
Weighted-average shares used to compute basic net income (loss) per share | 344 | 386 | 640 | 435 | 863 | |||||||||||||||
Effect of potentially dilutive securities: | ||||||||||||||||||||
Employee stock options | 3 | — | 7 | 1 | — | |||||||||||||||
Convertible preferred stock | 683 | — | 3,916 | 7,832 | — | |||||||||||||||
Weighted-average shares used to compute diluted net income (loss) per share | 1,030 | 386 | 4,563 | 8,268 | 863 | |||||||||||||||
Net income (loss) per share | ||||||||||||||||||||
Basic | $ | 121.06 | $ | (12.88 | ) | $ | 52.15 | $ | 245.79 | $ | (8.54 | ) | ||||||||
Diluted | $ | (46.70 | ) | $ | (12.88 | ) | $ | (20.79 | ) | $ | (2.58 | ) | $ | (8.54 | ) | |||||
F-43
Table of Contents
The following potentially dilutive securities outstanding at the end of each period were excluded from the computation of diluted net income (loss) per common share for the periods presented as their effect would have been antidilutive:
| Years ended September 30, | Six months ended March 31, | |||||||||
| (in thousands) | 2007 | 2008 | 2009 | 2009 | 2010 | |||||
| (unaudited) | ||||||||||
Options | 1,052 | 1,551 | 8,120 | 1,315 | 7,280 | |||||
Warrants to purchase common stock | 57 | 57 | 53 | 57 | 53 | |||||
Warrants to purchase preferred stock | 3,390 | 4,015 | 2,369 | 226 | 2,369 | |||||
Convertible preferred stock | 23,313 | 34,267 | 24,981 | 15,656 | 24,981 | |||||
Unaudited pro forma net loss per share
Pro forma basic and diluted net loss per share have been computed to give effect to the conversion into common stock of the Preferred Stock as shown in the table below:
| (in thousands, except per share data) | Year ended September 30, 2009 | Six months ended 2010 | ||||||
| (unaudited) | ||||||||
Numerator | ||||||||
Net loss | $ | (54,590 | ) | $ | (7,372 | ) | ||
Denominator | ||||||||
Weighted-average common shares outstanding | 640 | 863 | ||||||
Pro forma adjustment to reflect assumed conversion of Preferred Stock to occur upon consummation of the Company’s expected IPO | 22,123 | 52,733 | ||||||
Weighted average shares used to compute basic and diluted pro forma net loss per share | 22,763 | 53,596 | ||||||
Pro forma basic and diluted net loss per share | $ | (2.40 | ) | $ | (0.14 | ) | ||
8. Retirement savings plan
The Company maintains a plan that qualifies as a deferred salary arrangement under Section 401(k) of the Internal Revenue Code (the 401(k) Plan). Employees may contribute a portion of their compensation on a tax-deferred basis to the plan. Company contributions to the plan are at the discretion of the Company’s board of directors. Since inception, the Company has not made any contributions to the 401(k) Plan.
9. Income taxes
The components of income (loss) before income taxes are as follows:
| Years ended September 30, | |||||||||||
| (in thousands) | 2007 | 2008 | 2009 | ||||||||
United States | $ | (30,246 | ) | $ | 5,420 | $ | (50,022 | ) | |||
Foreign | 813 | 111 | (4,609 | ) | |||||||
Total income (loss) before income taxes | $ | (29,433 | ) | $ | 5,531 | $ | (54,631 | ) | |||
F-44
Table of Contents
The components of the provision (benefit) for income taxes are as follows:
| Years ended September 30, | ||||||||||
| (in thousands) | 2007 | 2008 | 2009 | |||||||
Current | ||||||||||
Federal | $ | — | $ | — | $ | (304 | ) | |||
State | 20 | 10 | 68 | |||||||
Foreign | 2 | 77 | 220 | |||||||
| 22 | 87 | (16 | ) | |||||||
Deferred | ||||||||||
Foreign | — | — | (25 | ) | ||||||
| — | — | (25 | ) | |||||||
Total income tax provision (benefit) | $ | 22 | $ | 87 | $ | (41 | ) | |||
The provision (benefit) for income taxes differs from the amount computed by applying the statutory federal income tax rate as follows:
| Years ended September 30, | ||||||||||||
| (in thousands) | 2007 | 2008 | 2009 | |||||||||
U.S. federal taxes (benefit) at statutory rate | $ | (10,007 | ) | $ | 1,924 | $ | (18,575 | ) | ||||
State tax expense | 13 | 165 | 45 | |||||||||
Foreign tax rate differential | 2 | (6 | ) | (87 | ) | |||||||
Credits | (861 | ) | (400 | ) | (676 | ) | ||||||
Net operating losses and credits not benefitted (benefitted) | 9,941 | (1,777 | ) | 16,887 | ||||||||
Non-deductible stock-based compensation expenses | 129 | 141 | 176 | |||||||||
In-process research and development | — | — | 2,210 | |||||||||
Other | 805 | 40 | (21 | ) | ||||||||
Total | $ | 22 | $ | 87 | $ | (41 | ) | |||||
The tax effect of temporary differences that give rise to significant portions of the deferred tax assets as of each of the years ended are presented below:
| September 30, | ||||||||
| (in thousands) | 2008 | 2009 | ||||||
Deferred tax assets | ||||||||
Net operating loss carryforwards | $ | 106,126 | �� | $ | 266,822 | |||
Accruals and reserves | 10,830 | 19,871 | ||||||
Deferred revenue | 6,793 | 12,503 | ||||||
Depreciation and amortization | 102 | 1,369 | ||||||
Other | 1,924 | 1,342 | ||||||
Tax credits | 9,381 | 25,904 | ||||||
| 135,156 | 327,811 | |||||||
Deferred tax liabilities—indefinite life intangible asset (note 3) | — | (4,000 | ) | |||||
Gross deferred tax assets | 135,156 | 323,811 | ||||||
Valuation allowance | (135,156 | ) | (327,695 | ) | ||||
Net deferred tax liabilities | $ | — | $ | (3,884 | ) | |||
F-45
Table of Contents
Net deferred tax liabilities are classified in the accompanying balance sheets as follows:
| September 30, | |||||||
| (in thousands) | 2008 | 2009 | |||||
Other assets | $ | — | $ | 116 | |||
Other long-term liabilities | — | (4,000 | ) | ||||
Total | $ | — | $ | (3,884 | ) | ||
In assessing the realizability of deferred tax assets, the Company considered whether it is more likely than not that some portion or all of its deferred tax assets will be realized. The ultimate realization of deferred tax assets is dependent upon the generation of future taxable income during the periods in which those temporary differences become deductible. Due to the uncertainty surrounding the Company’s ability to realize such deferred tax assets, a full valuation allowance has been established, except with respect to a foreign deferred tax asset of $116,000 at September 30, 2009 related to tax credits in a certain foreign subsidiary, which is included in other non-current assets. The valuation allowance increased by approximately $12.5 million, $34.1 million and $192.5 million during the years ended September 30, 2007, 2008 and 2009, respectively.
At September 30, 2009, the Company had federal and state net operating loss carryforwards available to reduce future taxable income of approximately $742.7 million and $491.7 million, respectively. Both the federal and state net operating loss carryforwards, if not utilized, will begin to expire in 2010.
Internal Revenue Code Section 382 imposes significant restrictions on the utilization of net operating loss carryforwards and experimental tax credits in the event of a change in ownership. While management believes that it is probable that the Company’s ability to utilize its net operating loss carryforwards may be significantly limited due to past ownership changes, the Company has not completed an analysis to determine the amount of such limitation, if any.
At September 30, 2009, the Company had approximately $21.0 million and $22.0 million, of federal and California research tax credits, respectively. The federal credits begin to expire in 2020, while the California research credits do not expire.
U.S. income taxes and foreign withholding taxes associated with the repatriation of foreign subsidiaries’ earnings were not provided. The Company intends to reinvest foreign subsidiaries’ earnings indefinitely. If these earnings were distributed to the U.S. in the form of dividends or otherwise, or if the shares of the relevant foreign subsidiaries were sold or otherwise transferred, the Company would be subject to additional U.S. income taxes (subject to an adjustment for foreign tax credits) and foreign withholding taxes. The amount of unrecognized deferred income tax liability related to these earnings is not considered significant.
On October 1, 2007 the Company adopted the provisions of ASC 740-10 (formerly known as FIN No. 48,Accounting for Uncertainty in Income Taxes). As of the date of adoption, the Company recorded a $4.5 million reduction to deferred tax assets for unrecognized tax benefits, all of which was offset by a full valuation allowance and therefore did not result in any adjustment to the beginning balance of retained earnings.
The Company recognizes accrued interest and penalties related to unrecognized tax benefits in income tax expense, of which the total amount recorded to date has not been significant.
F-46
Table of Contents
The aggregate changes in the balance of gross unrecognized tax benefits are as follows:
| Years ended September 30, | ||||||
| (in thousands) | 2008 | 2009 | ||||
Beginning balance | $ | 4,504 | $ | 4,967 | ||
Acquired from Legacy Force10 (note 3) | — | 9,697 | ||||
Increases related to current year tax positions | 463 | 408 | ||||
Ending balance | $ | 4,967 | $ | 15,072 | ||
Substantially all of the unrecognized tax benefits at September 30, 2009 would, if recognized, reduce the Company’s annual effective tax rate. The Company currently has a full valuation allowance against its U.S. gross deferred tax asset which would impact the timing of the effective tax rate benefit should any of these uncertain tax positions be favorably settled in the future. Management does not expect the Company’s unrecognized tax benefits to change significantly over the next 12 months.
The Company files tax returns in the U.S. federal jurisdiction, California and various state and foreign tax jurisdictions in which it has a subsidiary or branch operation. The federal returns beginning with fiscal year 2006 remain subject to examination by the Internal Revenue Service. The California returns beginning with fiscal year 2005 remain subject to examination by the California Franchise Tax Board. Net operating loss and tax credit carryforward attributes may still be adjusted upon examination by tax authorities. The Company is not under examination in any material jurisdictions worldwide.
10. Related-party transactions
In December 2002, the Company entered into an agreement with a customer (Customer A) who is also a stockholder. As of September 30, 2009, this customer held 232,320 shares of Series A-1 convertible preferred stock, 133,280 shares of Series B convertible preferred stock, warrants to purchase 12,871 shares of Series A-1 convertible preferred stock, and warrants to purchase 34,285 shares of common stock. Revenue recognized from Customer A during the years ended September 30, 2007, 2008, and 2009 was $1,380,000, $5,989,000, and $1,045,000, respectively. Revenue recognized from Customer A in the six months ended March 31, 2010 was $326,000.
In July 2004, the Company entered into an agreement with another customer (Customer B) who is also a stockholder. As of September 30, 2009, this customer held 284,120 shares of Series A convertible preferred stock and warrants to purchase 86,548 shares of Series A convertible preferred stock. Revenue recognized from Customer B during the years ended September 30, 2007, 2008, and 2009 was $2,376,000, $5,739,000 and $5,689,000, respectively. Revenue recognized from Customer B during the six months ended March 31, 2010 was $1,532,000.
The accounts receivable, deferred revenue and deferred product cost related to these customers were as follows:
| Customer A | Customer B | |||||||||||||||||
| September 30, | March 31, 2010 | September 30, | March 31, 2010 | |||||||||||||||
| (in thousands) | 2008 | 2009 | 2008 | 2009 | ||||||||||||||
| (unaudited) | (unaudited) | |||||||||||||||||
Accounts receivable | $ | 241 | $ | 149 | $ | 90 | $ | 230 | $ | 160 | $ | 645 | ||||||
Deferred revenue | 274 | 50 | 145 | 4,753 | 1,142 | 1,040 | ||||||||||||
Deferred product costs | 4 | — | 7 | 2,371 | 443 | 466 | ||||||||||||
F-47
Table of Contents
During 2007, 2008 and 2009 the Company engaged Advanced Equity, Inc. (AEI) to assist in identifying potential investors for the Company’s Series B, B-1 and C-1 financing rounds. In exchange for these services, the Company paid AEI cash and issued warrants to purchase Series B, B-1 and C-1 convertible preferred stock, which has been accounted for as issuance costs of the respective preferred stock. In addition to identifying potential investors, AEI purchased shares of the Company’s convertible preferred stock for its own account. AEI also has a representative on the Company’s board of directors. Amounts paid to AEI during the years ended September 30, 2007, 2008 and 2009, and the six months ended March 31, 2010, and shares and warrants held by AEI at September 30, 2007, 2008 and 2009, and March 31, 2010 were as follows:
| (dollars in thousands) | Years ended September 30, 2009 | Six months ended March 31, 2010 | ||||||||||
| 2007 | 2008 | 2009 | ||||||||||
| (unaudited) | ||||||||||||
Consideration for services: | ||||||||||||
Cash paid for services | $ | 2,486 | $ | 2,929 | $ | 1,160 | $ | — | ||||
Fair value of warrants issued | 1,297 | 1,200 | 2,478 | — | ||||||||
Shares of convertible preferred stock: | ||||||||||||
Series A-1 | — | — | 3,813,960 | 3,813,960 | ||||||||
Series B | — | — | 2,808,520 | 2,808,520 | ||||||||
Series B-1(1) | 4,041,605 | — | — | — | ||||||||
Series C-1(2) | — | 10,112,852 | — | — | ||||||||
Warrants to purchase convertible preferred stock: | ||||||||||||
Series A-1 | — | — | 584,038 | 584,038 | ||||||||
Series B | — | — | 383,800 | 383,800 | ||||||||
Series B-1(1) | 295,616 | — | — | — | ||||||||
Series C-1(2) | — | 920,309 | — | — | ||||||||
| (1) | Exchanged for shares of, and warrants to purchase, Series C-1 convertible preferred stock in 2008 (note 5) |
| (2) | Exchanged for shares of, and warrants to purchase, Series A convertible preferred stock in March 2009, which were then exchanged for shares of, and warrants to purchase, Series B convertible preferred stock in June and July 2009 (note 5) |
The fair value of warrants issued as consideration for services was determined using the Black-Scholes model with the following assumptions:
| Year ended September 30, | |||||||||
| 2007 | 2008 | 2009 | |||||||
Contractual term (years) | 5.0 | 5.0 | 5.0 | ||||||
Expected volatility | 51.9-55.8 | % | 46.2-47.5 | % | 49.3 | % | |||
Risk-free interest rate | 4.3-5.0 | % | 2.5-4.1 | % | 2.4-2.9 | % | |||
Expected dividends | — | — | — | ||||||
During all periods presented, the Company obtained cash management services from Silicon Valley Bank. In addition, the Company has obtained a revolving line of credit and term loans from Silicon Valley Bank. One of the members of the Company’s board of directors is also a member of the board of directors of SVB Financial Group, the holding company of Silicon Valley Bank. See note 4 for details related to the borrowing activities.
F-48
Table of Contents
11. Commitments and contingencies
Operating leases
The Company leases facilities under non-cancellable operating lease agreements, which expire through 2019. Future minimum lease payments under all non-cancellable operating leases as of September 30, 2009 were as follows:
| (dollars in thousands) | Amount | ||
2010 | $ | 4,761 | |
2011 | 2,873 | ||
2012 | 2,034 | ||
2013 | 664 | ||
2014 | 90 | ||
Thereafter | 426 | ||
Total minimum lease payments | $ | 10,848 | |
Rent expense during the years ended September 30, 2007, 2008, and 2009 was $1,037,000, $1,888,000 and $3,354,000, respectively. Rent expense during the six months ended March 31, 2009 and 2010 was $990,000 and $2,250,000, respectively.
Contract manufacturer commitments
The Company’s contract manufacturers procure components and build products based on the Company’s forecasts. These forecasts are based on estimates of future demand for the Company���s products, which are in turn based on historical trends and an analysis from the Company’s sales and marketing organizations, adjusted for overall market conditions. In order to reduce manufacturing lead times and plan for adequate component supply, the Company may issue purchase orders to some of its contract manufacturers which may not be cancellable. As of September 30, 2009 and March 31, 2010, the Company had approximately $18.5 million and $29.3 million, respectively, of non-cancellable open purchase orders with its contract manufacturers.
Guarantees
From time to time, the Company enters into certain types of contracts that contingently require it to indemnify various parties against claims from third parties. These contracts primarily relate to (i) certain real estate leases under which the Company may be required to indemnify property owners for environmental and other liabilities and other claims arising from the Company’s use of the applicable premises, (ii) certain agreements with the Company’s officers, directors, and employees, as well as the former officers and directors of Legacy Force10 and CAC pursuant to the respective merger agreements, under which the Company may be required to indemnify such persons for liabilities arising out of their employment relationship, (iii) contracts under which the Company may be required to indemnify customers against third-party claims that a Company product infringes a patent, copyright, or other intellectual property right, and (iv) procurement or license agreements under which the Company may be required to indemnify licensors or vendors for certain claims that may be brought against them arising from the Company’s acts or omissions with respect to the supplied products or technology.
Generally, a maximum obligation under these contracts is not explicitly stated. Because the obligated amounts associated with these types of agreements are not explicitly stated, the overall maximum amount of the obligation cannot be reasonably estimated. Historically, the
F-49
Table of Contents
Company has not been required to make payments under these obligations, and therefore no liability or expense has been recorded for these obligations in the accompanying consolidated financial statements.
Acquisition bonus plan
In July 2004, the Company’s board of directors approved the Acquisition Bonus Plan (the Bonus Plan) for certain employees and management of the Company. The Bonus Plan, as amended, provides that in the event of the sale or merger of the Company where the proceeds from sale or merger is at least $80,000,000, at least 10% of the proceeds payable other than as future earn-out payments will constitute a bonus pool, to be paid out to certain current and former employees and management subject to certain vesting conditions. No amounts have been accrued for any potential payments under the Bonus Plan, as management does not believe that the sale of the Company, which will trigger bonus payments, is probable.
Contingencies
From time to time, the Company may become involved in litigation. Management is not currently aware of any matters that will, if adversely determined, have a material adverse effect on the financial position, results of operations, or cash flows of the Company. Litigation is subject to inherent uncertainties, and were an unfavorable outcome to occur, it could have a material adverse impact on the Company’s financial position and results of operations for the period in which such outcome occurred. Legal fees associated with commitments or contingencies are expensed as incurred.
12. Segment information
ASC 280 (formerly referred to as SFAS No. 131,Disclosures about Segments of an Enterprise and Related Information), establishes standards for reporting information about operating segments. Operating segments are defined as components of an enterprise about which separate financial information is available that is evaluated regularly by the chief operating decision maker (CODM), or decision making group, in deciding how to allocate resources and in assessing performance. The Company’s CODM is its CEO.
Through March 31, 2009, the Company operated solely in the Transport segment. Following the acquisition of Legacy Force10 on March 31, 2009 (see note 3), the Company operates in two operating segments, Ethernet and Transport.
The CODM regularly receives information related to revenue, cost of goods sold, and gross margin for each operating segment, and uses this information to assess performance and make resource allocation decisions. All other financial information, including operating expenses and assets, is prepared and reviewed by the CODM on a consolidated basis.
Assets are not a measure used to assess the performance of the Company by the CODM, therefore the Company does not report assets by segment internally or in its financial statements.
F-50
Table of Contents
The following is a summary of revenue and gross margin by reporting segment:
| Year ended September 30, 2009 | ||||||||||||||||||
| Ethernet | Transport | Total | ||||||||||||||||
| (dollars in thousands) | Amount | Percent of total revenue | Amount | Percent of total revenue | Amount | Percent of total revenue | ||||||||||||
Revenue | ||||||||||||||||||
Product | $ | 26,650 | 22.4 | % | $ | 59,470 | 49.9 | % | $ | 86,120 | 72.3 | % | ||||||
Service | 4,138 | 3.5 | 12,152 | 10.2 | 16,290 | 13.7 | ||||||||||||
Ratable product and service | 3,579 | 3.0 | 13,081 | 11.0 | 16,660 | 14.0 | ||||||||||||
Total | $ | 34,367 | 28.9 | % | $ | 84,703 | 71.1 | % | $ | 119,070 | 100.0 | % | ||||||
| Gross margin | ||||||||||||||||||
| (dollars in thousands) | Ethernet | Transport | Total | |||||||||||||||
| Amount | Percentage | Amount | Percentage | Amount | Percentage | |||||||||||||
Gross margin | ||||||||||||||||||
Product | $ | 6,368 | 23.9 | % | $ | 13,740 | 23.1 | % | $ | 20,108 | 23.3 | % | ||||||
Service | 499 | 12.1 | 7,578 | 62.4 | 8,077 | 49.6 | ||||||||||||
Ratable product and service | 2,694 | 75.3 | 5,887 | 45.0 | 8,581 | 51.5 | ||||||||||||
Total | $ | 9,561 | 27.8 | $ | 27,205 | 32.1 | $ | 36,766 | 30.9 | |||||||||
| Six months ended March 31, 2010 (unaudited) | ||||||||||||||||||
| Ethernet | Transport | Total | ||||||||||||||||
| (dollars in thousands) | Amount | Percent of total revenue | Amount | Percent of total revenue | Amount | Percent of total revenue | ||||||||||||
Revenue | ||||||||||||||||||
Product | $ | 35,559 | 39.7 | % | $ | 30,935 | 34.5 | % | $ | 66,494 | 74.2 | % | ||||||
Service | 6,441 | 7.2 | 6,786 | 7.6 | 13,227 | 14.8 | ||||||||||||
Ratable product and service | 6,501 | 7.3 | 3,393 | 3.8 | 9,894 | 11.0 | ||||||||||||
| $ | 48,501 | 54.1 | % | $ | 41,114 | 45.9 | % | $ | 89,615 | 100.0 | % | |||||||
| Six months ended March 31, 2010 (unaudited) | ||||||||||||||||||
| Ethernet | Transport | Total | ||||||||||||||||
| (dollars in thousands) | Amount | Percentage | Amount | Percentage | Amount | Percentage | ||||||||||||
Gross margin | ||||||||||||||||||
Product | $ | 18,376 | 51.7 | % | $ | 10,908 | 35.3 | % | $ | 29,284 | 44.0 | % | ||||||
Service | 425 | 6.6 | 4,602 | 67.8 | 5,027 | 38.0 | ||||||||||||
Ratable product and service | 4,817 | 74.1 | 1,155 | 34.0 | 5,972 | 60.4 | ||||||||||||
| $ | 23,618 | 48.7 | $ | 16,665 | 40.5 | $ | 40,283 | 45.0 | ||||||||||
F-51
Table of Contents
Revenue by geographic region is based on the shipping address of the customer. Long-lived assets consist primarily of net property and equipment and are attributed to the geographic region in which they are located. The following tables set forth revenue and long-lived assets by geographic region:
| Year ended September 30, | Six months ended March 31, | |||||||||||||||||||
| (dollars in thousands) | 2007 | 2008 | 2009 | 2009 | 2010 | |||||||||||||||
| (unaudited) | ||||||||||||||||||||
Revenue | ||||||||||||||||||||
United States | $ | 23,784 | $ | 123,307 | $ | 93,768 | $ | 36,842 | $ | 70,251 | ||||||||||
Americas excluding United States | 2,161 | 11,472 | 3,417 | 1,715 | 3,251 | |||||||||||||||
Europe, Middle East and Africa | 3,776 | 13,519 | 12,022 | 3,585 | 11,920 | |||||||||||||||
Asia Pacific | 1,841 | 7,600 | 9,863 | 2,432 | 4,193 | |||||||||||||||
Total | $ | 31,562 | $ | 155,898 | $ | 119,070 | $ | 44,574 | $ | 89,615 | ||||||||||
United States | 75.4 | % | 79.1 | % | 78.8 | % | 82.7 | % | 78.4 | % | ||||||||||
Americas excluding United States | 6.8 | 7.3 | 2.8 | 3.8 | 3.6 | |||||||||||||||
Europe, Middle East and Africa | 12.0 | 8.7 | 10.1 | 8.0 | 13.3 | |||||||||||||||
Asia Pacific | 5.8 | 4.9 | 8.3 | 5.5 | 4.7 | |||||||||||||||
Total | 100.0 | % | 100.0 | % | 100.0 | % | 100.0 | % | 100.0 | % | ||||||||||
| As of September 30, | As of March 31, 2010 | ||||||||
| (in thousands) | 2008 | 2009 | |||||||
| (unaudited) | |||||||||
| Long-lived Assets | |||||||||
United States | $ | 8,039 | $ | 16,315 | $ | 16,997 | |||
Europe, Middle East and Africa | — | 198 | 55 | ||||||
Asia Pacific | 1,196 | 1,888 | 103 | ||||||
Total | $ | 9,235 | $ | 18,401 | $ | 17,155 | |||
13. Restructuring
In October 2009, the Company announced its plan to close its research and development center in Shanghai, China, and in March 2010, the Company vacated an office facility in Boulder, Colorado. In connection with these facility closures, during the six months ended March 31, 2010 the Company recorded a total expense of $1,841,000 for the Transport segment, which was comprised of $1,095,000 for severance and lease termination and other charges, and $746,000 for asset impairment. As of March 31, 2010, the remaining unpaid restructuring liability was $296,000, and is expected to be paid in the next twelve months.
The following table shows the restructuring activity related to severance and lease termination expense for the six months ended March 31, 2010:
| (in thousands) | Total | Severance | Lease termination and other charges | ||||||||
Balance—October 1, 2009 | $ | — | $ | — | $ | — | |||||
Restructuring charges | 1,095 | 850 | 245 | ||||||||
Cash payments | (799 | ) | (799 | ) | — | ||||||
Balance—March 31, 2010 | $ | 296 | $ | 51 | $ | 245 | |||||
F-52
Table of Contents
14. Subsequent event
In preparing its audited consolidated financial statements for the year ended September 30, 2009, the Company has evaluated, for potential recognition and disclosure, events and transactions that have occurred subsequent to September 30, 2009 through the date of the original issuance of these annual financial statements on March 1, 2010 and has updated this evaluation through the date of reissuance on August 11, 2010.
In preparing its unaudited consolidated interim financial statements for the six months ended March 31, 2010, the Company has evaluated, for potential recognition and disclosure, events and transactions that have occurred subsequent to March 31, 2010 through the date of original issuance of these unaudited interim financial statements on June 8, 2010 and has updated this evaluation through the date of reissuance on August 11, 2010.
15. Correction of stockholders’ deficit
Subsequent to the issuance of the Company’s consolidated financial statements for the year ended September 30, 2009, management of the Company determined that the balance of total stockholders’ deficit as of October 1, 2006, appearing in the consolidated statement of stockholders’ equity (deficit) and comprehensive loss, was incorrect. Specifically, this balance improperly included $32.1 million of redeemable convertible preferred stock, which should not have been considered a component of stockholders’ deficit. Accordingly, total stockholders’ deficit as of October 1, 2006, previously reported as $40.1 million, has been increased by $32.1 million to $72.2 million. A corresponding reduction in stockholders’ deficit of $32.1 million has been recorded in the caption “Recapitalization of preferred stock” appearing in the consolidated statement of redeemable convertible preferred stock, stockholders’ equity (deficit) and comprehensive income (loss) for the year ended September 30, 2007. These corrections did not impact total stockholders’ equity as of September 30, 2007, 2008 or 2009, nor did they have any impact on the consolidated balance sheets, statements of operations or statements of cash flows included herein. The foregoing corrections are not considered material by the Company.
F-53
Table of Contents
16. Restatement
Subsequent to the issuance of the unaudited consolidated interim financial statements as of and for the six months ended March 31, 2010, management determined that the unaudited consolidated interim statement of cash flows for the six months ended March 31, 2010 should be restated to present cash outflows for payments of costs related to its initial public offering as a financing activity rather than as an operating activity and to correct the cash flow classification of the related accounts payable. The effect of the restatement for the six months ended March 31, 2010 is as follows:
| As Previously Reported | Adjustment | As Restated | ||||||||||
Condensed consolidated statement of cash flows | ||||||||||||
Cash flows from operating activities | ||||||||||||
Change in operating assets and liabilities | ||||||||||||
Other assets | $ | (2,036 | ) | $ | 2,113 | $ | 77 | |||||
Accounts payable | 1,070 | (1,172 | ) | (102 | ) | |||||||
Net cash used in operating activities | (8,922 | ) | 941 | (7,981 | ) | |||||||
Cash flows from financing activities | ||||||||||||
Payment of costs related to initial public offering | — | (941 | ) | (941 | ) | |||||||
Net cash used in financing activities | (1,063 | ) | (941 | ) | (2,004 | ) | ||||||
Noncash financing and investing activities | ||||||||||||
Initial public offering costs not yet paid | — | 1,172 | 1,172 | |||||||||
The restatement had no impact on the Company’s previously reported condensed consolidated balance sheet, statement of operations or statement of redeemable convertible preferred stock, stockholders equity (deficit) and comprehensive income (loss).
******
F-54
Table of Contents
Unaudited pro forma condensed combined financial statements
The following unaudited pro forma condensed combined statements of operations for the year ended September 30, 2009, the three months ended December 31, 2008 and the three months ended March 31, 2009 are presented as if our acquisition of Legacy Force10 had been completed on October 1, 2008, the first day of our fiscal year. The pro forma condensed combined statement of operations for the year ended September 30, 2009 combines our historical consolidated statement of operations for the year ended September 30, 2009 (which includes the results of operations of Legacy Force10 for the period from March 31, 2009 to September 30, 2009), and the unaudited historical statement of operations of Legacy Force10 for the period from August 1, 2008 to January 31, 2009, after giving effect to the assumptions and adjustments described in the accompanying notes. The unaudited pro forma condensed combined statements of operations for the three months ended December 31, 2008 combines our results of operations for the three months ended December 31, 2008 and the results of operations of Legacy Force10 for the three months ended October 31, 2008. The unaudited pro forma condensed combined statements of operations for the three months ended March 31, 2009 combines our results of operations for the three months ended March 31, 2009 and the results of operations of Legacy Force10 for the three months ended January 31, 2009.
No pro forma condensed combined balance sheet is presented, as the balance sheet of Legacy Force10 is included in our consolidated balance sheet at September 30, 2009. There were no significant or unusual transactions included in the results of operations of Legacy Force10 for the period from February 1, 2009 to March 31, 2009.
The unaudited pro forma condensed combined statements of operations are presented solely for informational purposes and are not necessarily indicative of the combined results of operations that might have been achieved had the transaction been completed as of the date indicated, nor is it necessarily indicative of the future results of the combined company.
The unaudited pro forma condensed combined consolidated statements of operations have been derived from our historical financial statements and those of Legacy Force10, which were prepared in accordance with U.S. generally accepted accounting principles. The unaudited pro forma condensed combined consolidated statements of operations should be read together with the accompanying notes to the unaudited pro forma condensed combined statements of operations, our audited financial statements for the years ended September 30, 2007, 2008 and 2009 included elsewhere in this prospectus, and the audited financial statements of Legacy Force10 for the years ended October 31, 2006, 2007 and 2008 included elsewhere in this prospectus.
F-55
Table of Contents
Unaudited pro forma condensed combined statement of operations
for the year ended September 30, 2009
| (in thousands, except per share amounts) | Force10 for the year ended 2009(1) | Legacy Force10 six months ended | Pro forma adjustments | Pro forma combined | ||||||||||||||
| (see note 3) | ||||||||||||||||||
Revenue | ||||||||||||||||||
Product | $ | 86,120 | $ | 61,592 | $ | (34,707 | ) | a | $ | 113,005 | ||||||||
Service | 16,290 | 11,461 | (5,353 | ) | a | 22,398 | ||||||||||||
Ratable product and service | 16,660 | 7,100 | 40,060 | a | 63,820 | |||||||||||||
Total revenue | 119,070 | 80,153 | — | a | 199,223 | |||||||||||||
Cost of goods sold | ||||||||||||||||||
Product | 66,012 | 36,125 | (17,518 | ) | a | 84,861 | ||||||||||||
| 242 | b | |||||||||||||||||
Service | 8,213 | 4,776 | 166 | a | 13,155 | |||||||||||||
Ratable product and service | 8,079 | 3,356 | 17,352 | a | 28,787 | |||||||||||||
Total cost of goods sold | 82,304 | 44,257 | 242 | 126,803 | ||||||||||||||
Gross profit | ||||||||||||||||||
Product | 20,108 | 25,467 | (17,431 | ) | 28,144 | |||||||||||||
Service | 8,077 | 6,685 | (5,519 | ) | 9,243 | |||||||||||||
Ratable product and service | 8,581 | 3,744 | 22,708 | 35,033 | ||||||||||||||
Total gross profit | 36,766 | 35,896 | (242 | ) | 72,420 | |||||||||||||
Operating expenses | ||||||||||||||||||
Research and development | 34,137 | 18,112 | — | 52,249 | ||||||||||||||
Sales and marketing | 36,010 | 25,775 | — | 61,785 | ||||||||||||||
General and administrative | 12,871 | 10,046 | — | 22,917 | ||||||||||||||
Restructuring | — | 3,119 | — | 3,119 | ||||||||||||||
In-process research and development and amortization of intangible assets | 7,459 | — | 125 | b | 7,584 | |||||||||||||
Total operating expenses | 90,477 | 57,052 | 125 | 147,654 | ||||||||||||||
Operating loss | (53,711 | ) | (21,156 | ) | (367 | ) | (75,234 | ) | ||||||||||
Interest and other income (expense), net | (920 | ) | 72 | — | (848 | ) | ||||||||||||
Loss before income taxes | (54,631 | ) | (21,084 | ) | (367 | ) | (76,082 | ) | ||||||||||
Income tax benefit (provision) | 41 | (250 | ) | (209 | ) | |||||||||||||
Net loss | $ | (54,590 | ) | $ | (21,334 | ) | $ | (367 | ) | $ | (76,291 | ) | ||||||
Basic net income per share | $ | 52.15 | $ | 13.70 | ||||||||||||||
Diluted net loss per share | $ | (20.79 | ) | $ | (24.41 | ) | ||||||||||||
Shares used in computing basic net income per share | 640 | 212 | c | 852 | ||||||||||||||
Shares used in computing diluted net loss per share | 4,563 | 212 | c | 4,775 | ||||||||||||||
| (1) | Includes the results of operations of Legacy Force10 for the period from March 31, 2009 to September 30, 2009. |
See notes to unaudited pro forma condensed combined financial statements
F-56
Table of Contents
Unaudited pro forma condensed combined statement of operations
for the three months ended December 31, 2008
| (in thousands, except per share amounts) | Force10 three months ended | Legacy Force10 ended | Pro forma adjustments | Pro forma combined | ||||||||||||||
| (see note 3) | ||||||||||||||||||
Revenue | ||||||||||||||||||
Product | $ | 14,985 | $ | 36,485 | $ | (18,073 | ) | a | $ | 33,397 | ||||||||
Service | 3,368 | 5,276 | (2,087 | ) | a | 6,557 | ||||||||||||
Ratable product and service | 5,354 | 3,579 | 20,160 | a | 29,093 | |||||||||||||
Total revenue | 23,707 | 45,340 | — | 69,047 | ||||||||||||||
Cost of goods sold | ||||||||||||||||||
Product | 10,420 | 21,374 | (8,996 | ) | a | 22,919 | ||||||||||||
| 121 | b | |||||||||||||||||
Service | 1,230 | 2,501 | 87 | a | 3,818 | |||||||||||||
Ratable product and service | 2,944 | 1,713 | 8,909 | a | 13,566 | |||||||||||||
Total cost of goods sold | 14,594 | 25,588 | 121 | 40,303 | ||||||||||||||
Gross profit | ||||||||||||||||||
Product | 4,565 | 15,111 | (9,198 | ) | 10,478 | |||||||||||||
Service | 2,138 | 2,775 | (2,174 | ) | 2,739 | |||||||||||||
Ratable product and service | 2,410 | 1,866 | 11,251 | 15,527 | ||||||||||||||
Total gross profit | 9,113 | 19,752 | (121 | ) | 28,744 | |||||||||||||
Operating expenses | ||||||||||||||||||
Research and development | 5,954 | 9,044 | — | 14,998 | ||||||||||||||
Sales and marketing | 6,069 | 13,637 | — | 19,706 | ||||||||||||||
General and administrative | 2,038 | 4,679 | — | 6,717 | ||||||||||||||
Restructuring | — | 55 | — | 55 | ||||||||||||||
In-process research and development and amortization of intangible assets | 209 | — | 62 | b | 271 | |||||||||||||
Total operating expenses | 14,270 | 27,415 | 62 | 41,747 | ||||||||||||||
Operating loss | (5,157 | ) | (7,663 | ) | (183 | ) | (13,003 | ) | ||||||||||
Interest and other income (expense), net | (325 | ) | 53 | — | (272 | ) | ||||||||||||
Loss before income taxes | (5,482 | ) | (7,610 | ) | (183 | ) | (13,275 | ) | ||||||||||
Income tax benefit (provision) | 142 | (113 | ) | — | 29 | |||||||||||||
Net loss | $ | (5,340 | ) | $ | (7,723 | ) | $ | (183 | ) | $ | (13,246 | ) | ||||||
Basic and diluted net loss per share | $ | (12.28 | ) | $ | (15.42 | ) | ||||||||||||
Shares used in computing basic and diluted net loss per share | 435 | 424 | c | 859 | ||||||||||||||
See notes to unaudited pro forma condensed combined financial statements
F-57
Table of Contents
Unaudited pro forma condensed combined statement of operations
for the three months ended March 31, 2009
| (in thousands, except per share amounts) | Force10 three months ended March 31, 2009 | Legacy Force10 three months ended January 31, 2009 | Pro forma adjustments | Pro forma combined | ||||||||||||||
| (see note 3) | ||||||||||||||||||
Revenue | ||||||||||||||||||
Product | $ | 14,247 | $ | 25,107 | $ | (16,634 | ) | a | $ | 22,720 | ||||||||
Service | 3,245 | 6,185 | (3,266 | ) | a | 6,164 | ||||||||||||
Ratable product and service | 3,375 | 3,521 | 19,900 | a | 26,796 | |||||||||||||
Total revenue | 20,867 | 34,813 | — | 55,680 | ||||||||||||||
Cost of goods sold | ||||||||||||||||||
Product | 13,875 | 14,751 | (8,522 | ) | a | 20,225 | ||||||||||||
| 121 | b | |||||||||||||||||
Service | 1,306 | 2,275 | 79 | a | 3,660 | |||||||||||||
Ratable product and service | 1,767 | 1,643 | 8,443 | a | 11,853 | |||||||||||||
Total cost of goods sold | 16,948 | 18,669 | 121 | 35,738 | ||||||||||||||
Gross profit | ||||||||||||||||||
Product | 372 | 10,356 | (8,233 | ) | 2,495 | |||||||||||||
Service | 1,939 | 3,910 | (3,345 | ) | 2,504 | |||||||||||||
Ratable product and service | 1,608 | 1,878 | 11,457 | 14,943 | ||||||||||||||
Total gross profit | 3,919 | 16,144 | (121 | ) | 19,942 | |||||||||||||
Operating expenses | ||||||||||||||||||
Research and development | 5,741 | 9,068 | — | 14,809 | ||||||||||||||
Sales and marketing | 5,089 | 12,138 | — | 17,227 | ||||||||||||||
General and administrative | 2,308 | 5,367 | — | 7,675 | ||||||||||||||
Restructuring | 3,064 | — | 3,064 | |||||||||||||||
In-process research and development and amortization of intangible assets | 6,709 | — | 62 | b | 6,771 | |||||||||||||
Total operating expenses | 19,847 | 29,637 | 62 | 49,546 | ||||||||||||||
Operating loss | (15,928 | ) | (13,493 | ) | (183 | ) | (29,604 | ) | ||||||||||
Interest and other income (expense), net | (71 | ) | 19 | — | (52 | ) | ||||||||||||
Loss before income taxes | (15,999 | ) | (13,474 | ) | (183 | ) | (29,656 | ) | ||||||||||
Income tax benefit (provision) | 33 | (137 | ) | (104 | ) | |||||||||||||
Net loss | $ | (15,966 | ) | $ | (13,611 | ) | $ | (183 | ) | $ | (29,760 | ) | ||||||
Basic net income per share | $ | 258.06 | $ | 114.63 | ||||||||||||||
Diluted net loss per share | $ | (1.93 | ) | $ | (3.42 | ) | ||||||||||||
Shares used in computing basic net income per share | 435 | 424 | c | 859 | ||||||||||||||
Shares used in computing diluted net loss per share | 8,269 | 424 | c | 8,693 | ||||||||||||||
See notes to unaudited pro forma condensed combined financial statements
F-58
Table of Contents
Notes to unaudited pro forma condensed combined financial statements
1. Basis of pro forma presentation
The unaudited pro forma condensed combined statements of operations for the year ended September 30, 2009, the three months ended December 31, 2008 and the three months ended March 31, 2009, are based on our historical financial statements and those of Legacy Force10 after giving effect to our acquisition of Legacy Force10 (the Acquisition) as if it had occurred on October 1, 2008 and the assumptions and adjustments described in the accompanying notes.
The pro forma information is presented solely for informational purposes and is not necessarily indicative of the combined results of operations or financial position that might have been achieved for the periods or dates indicated, nor is it necessarily indicative of the future results of the combined company.
2. Purchase price allocation
On March 31, 2009, we acquired 100% of the outstanding capital stock of Legacy Force10. Subsequent to the acquisition of Legacy Force10, we changed our legal name to Force10 Networks, Inc. Total consideration was $72.2 million, comprised of 424,200 shares of our common stock, 7,826,800 shares of our Series A convertible preferred stock, the fair value of the warrants described below and $3.1 million of direct acquisition costs. The value of the common and convertible preferred stock issued to Legacy Force10 stockholders in the Acquisition was determined by management through a discounted cash flow and comparable company analysis. We did not assume any stock options or other stock-based awards in the Acquisition; however, warrants to purchase 33,233,441 shares of Legacy Force10’s convertible preferred stock were converted into warrants to purchase 1,036,948 shares of our Series A convertible preferred stock, and warrants to purchase 369,349 shares of Legacy Force10’s common stock were converted into warrants to purchase 915 shares of our common stock. Legacy Force10, based in San Jose, California, developed and marketed network infrastructure equipment and services to data center and high performance enterprise customers. We acquired Legacy Force10 to provide complementary technology and product lines. Management believed that Legacy Force10’s technology, which focuses on high capacity Ethernet switches and routers which would complement our offerings in the service provider market. These significant factors were the basis for the recognition of goodwill on the Acquisition.
F-59
Table of Contents
Immediately after the Acquisition, our stockholders and those of Legacy Force10 each owned approximately 50% of the combined company. We were deemed to be the acquirer for accounting purposes as our employees made up a majority of the members of management of the combined company, including the chief executive officer, and more members of our board of directors remained on the board of directors of the combined company. The Acquisition was accounted for using the purchase method of accounting. Accordingly, the results of Legacy Force10’s operations have been included in our consolidated financial statements from the date of Acquisition. The allocation of purchase price to the acquired assets and liabilities was based on their estimated fair values on the Acquisition date. The allocation of the purchase price is summarized below:
| (in thousands) | Amount | |||
Cash | $ | 11,839 | ||
Other current assets | 37,749 | |||
Property and equipment | 11,794 | |||
Tradename | 10,500 | |||
Developed technology | 2,900 | |||
Customer relationships | 1,500 | |||
Backlog | 1,100 | |||
Other long-term assets | 2,278 | |||
Acquired in-process research and development | 6,500 | |||
Current liabilities | (21,180 | ) | ||
Deferred tax liability | (4,000 | ) | ||
Noncurrent liabilities | (4,169 | ) | ||
Goodwill | 15,344 | |||
Total purchase price allocation | $ | 72,155 | ||
Identifiable intangible assets. Acquired intangible assets include tradename, developed technology, customer relationships and backlog. Fair values of these intangible assets were determined based on the income approach and multi-period excess earnings method. Developed technology and customer relationships are amortized over useful lives of six years, and backlog is amortized over a useful life of six months. Amortization is recorded on a straight-line basis, as management believes this method most closely reflects the pattern in which the economic benefits of the assets will be consumed.
We determined that the tradename intangible asset acquired in the Acquisition has an indefinite life. As such, it is not amortized but rather is tested for impairment annually, or more frequently if events or changes in circumstances indicate that the asset might be impaired. The impairment test involves comparing the fair value of the intangible asset with its carrying amount. If the carrying amount exceeds the fair value of the intangible asset, an impairment loss is recognized in an amount equal to that excess.
Acquired in-process research and development.At the date of the Acquisition, we immediately expensed $6,500,000, representing purchased in-process research and development related to development projects that had not yet reached technological feasibility and had, in management’s opinion, no alternative future use. The assigned value was determined by estimating the costs to develop the acquired in-process technologies into commercially viable products, estimating the net cash flows from such projects and discounting the net cash flows back to their present value.
F-60
Table of Contents
Goodwill.Goodwill represents the excess of the purchase price over the fair value of the underlying net tangible and intangible assets. In accordance with ASC Topic 350,Intangibles-Goodwill and Other, goodwill will not be amortized, but instead will be tested for impairment at least annually and whenever events or circumstances have occurred that may indicate a possible impairment. In the event we determine that the value of goodwill has become impaired, we will incur an accounting charge for the amount of the impairment during the period in which the determination is made.
3. Preliminary pro forma and acquisition accounting adjustments
The pro forma adjustments for the year ended September 30, 2009 and the three months ended December 31, 2008 and March 31, 2009 were as follows:
(a) Conform Legacy Force10 revenue and cost of goods sold presentation to our disclosures;
(b) Record amortization of acquired intangible assets assuming the Acquisition had occurred on October 1, 2008;
(c) Reflects only the common stock issued in the Acquisition and excludes the preferred stock issued in the Acquisition because it has an anti-dilutive effect.
Due to our historical net losses, no income tax benefit has been recorded in our historical financial statements. Accordingly, the income tax effect of the above adjustments would be insignificant.
No pro forma adjustments have been made related to in-process research and development, amortization of backlog, or amortization of the increase in fair value of inventories as these amounts are non-recurring and are expected to be included in our statement of operations for the next 12 months. Further, no pro forma adjustment to interest income or expense has been reflected, as the incremental interest had the direct acquisition costs of $3.1 million been incurred on October 1, 2008 would be insignificant.
The pro forma information is presented solely for informational purposes and is not necessarily indicative of the combined results of operations or financial position that might have been achieved for the periods or dates indicated, nor is it necessarily indicative of our future results.
F-61
Table of Contents
4. Pro forma combined net income (loss) per share
The following table sets forth the computation of shares used in deriving the pro forma combined basic and diluted net income (loss) per share:
| (in thousands) | Weighted average shares | |||
Year ended September 30, 2009 | ||||
| Basic | Diluted | |||
Actual weighted average shares | 640 | 4,563 | ||
Common shares issued in the Acquisition weighted for the period from October 1, 2008 to March 31, 2009 | 212 | 212 | ||
Pro forma combined | 852 | 4,775 | ||
| Weighted average shares | ||||
| Three months ended December 31, 2008 | ||||
Actual weighted average shares (basic and diluted) | 435 | |||
Common shares issued in the Acquisition | 424 | |||
Pro forma combined (basic and diluted) | 859 | |||
| Weighted average shares | ||||
Three months ended March 31, 2009 | ||||
| Basic | Diluted | |||
Actual weighted average shares | 435 | 8,269 | ||
Common shares issued in the Acquisition | 424 | 424 | ||
Pro forma combined | 859 | 8,693 | ||
F-62
Table of Contents
To the Stockholders and Board of Directors of
Force10 Networks, Inc. (Legacy Force10)
We have audited the accompanying consolidated balance sheets of Force10 Networks, Inc. and subsidiaries (collectively, the Company) (referred to as “Force10 Networks, Inc. (Legacy Force 10)”—see note 1) as of October 31, 2007 and 2008, and the related consolidated statements of operations, stockholders’ equity and comprehensive loss, and cash flows for each of the three years in the period ended October 31, 2008. These financial statements are the responsibility of the Company’s management. Our responsibility is to express an opinion on these consolidated financial statements based on our audits.
We conducted our audits in accordance with auditing standards generally accepted in the United States. Those standards require that we plan and perform the audit to obtain reasonable assurance about whether the financial statements are free of material misstatement. An audit includes consideration of internal control over financial reporting as a basis for designing audit procedures that are appropriate in the circumstances, but not for the purpose of expressing an opinion on the effectiveness of the Company’s internal control over financial reporting. Accordingly, we express no such opinion. An audit also includes examining, on a test basis, evidence supporting the amounts and disclosures in the financial statements, assessing the accounting principles used and significant estimates made by management, as well as evaluating the overall financial statement presentation. We believe that our audits provide a reasonable basis for our opinion.
In our opinion, such consolidated financial statements present fairly, in all material respects, the financial position of the Company at October 31, 2007 and 2008, and the results of its operations and its cash flows for each of the three years in the period ended October 31, 2008, in conformity with accounting principles generally accepted in the United States of America.
As discussed in notes 1 and 16 to the consolidated financial statements, the Company was acquired on March 31, 2009.
The accompanying consolidated financial statements for the year ended October 31, 2008 has been prepared assuming that the Company will continue as a going concern. As discussed in note 1 to the consolidated financial statements, the Company’s recurring losses from operations raise substantial doubt about its ability to continue as a going concern. Management’s plans concerning these matters are also discussed in note 1 to the consolidated financial statements. The consolidated financial statements do not include any adjustments that might result from the outcome of this uncertainty.
/s/ Deloitte & Touche LLP
San Jose, California
February 27, 2009 (March 31, 2009 as to the second paragraph of note 1 and as to the “Merger agreement” section of note 16)
F-63
Table of Contents
Force10 Networks, Inc. (Legacy Force10)
Consolidated balance sheets
| As of October 31, | As of January 31, | |||||||||||
| (in thousands, except per share data) | 2007 | 2008 | 2009 | |||||||||
| (unaudited) | ||||||||||||
Assets | ||||||||||||
Current assets | ||||||||||||
Cash and cash equivalents | $ | 60,041 | $ | 40,097 | $ | 22,977 | ||||||
Trade accounts receivable (net of allowances of $976, $679, and $579 at October 31, 2007, October 31, 2008 and January 31, 2009, respectively) | 27,873 | 22,508 | 15,588 | |||||||||
Other accounts receivable | 2,023 | 771 | 559 | |||||||||
Inventories | 23,891 | 12,739 | 14,029 | |||||||||
Deferred cost of goods sold, current | — | 4,421 | 2,128 | |||||||||
Prepaid expenses and other current assets | 3,241 | 2,112 | 2,404 | |||||||||
Total current assets | 117,069 | 82,648 | 57,685 | |||||||||
Property and equipment, net | 10,002 | 10,385 | 9,543 | |||||||||
Deferred cost of revenues | 37,385 | 23,941 | 18,883 | |||||||||
Restricted cash | — | — | 1,600 | |||||||||
Other assets | 932 | 1,145 | 695 | |||||||||
Total assets | $ | 165,388 | $ | 118,119 | $ | 88,406 | ||||||
Liabilities and stockholders’ equity (deficit) | ||||||||||||
Current liabilities | ||||||||||||
Accounts payable | $ | 7,828 | $ | 5,018 | $ | 4,566 | ||||||
Accrued compensation and related benefits | 7,315 | 6,514 | 5,293 | |||||||||
Bank loans | 5,420 | 5,420 | — | |||||||||
Other current liabilities | 11,870 | 8,253 | 10,120 | |||||||||
Deferred revenues | 52,563 | 44,877 | 37,957 | |||||||||
Total current liabilities | 84,996 | 70,082 | 57,936 | |||||||||
Other long-term liabilities | 12,834 | 14,562 | 14,893 | |||||||||
Deferred revenues, non-current | 32,263 | 25,069 | 20,609 | |||||||||
Total liabilities | 130,093 | 109,713 | 93,438 | |||||||||
Commitments and contingencies (note 5) | ||||||||||||
Stockholders’ equity (deficit) | ||||||||||||
Convertible preferred stock and additional paid-in capital, $0.0001 par value; 345,000 shares authorized; 305,748 issued and outstanding | 450,648 | 450,648 | 450,648 | |||||||||
Common stock and additional paid-in capital, $0.0001 par value; 680,000 shares authorized; 28,810, 44,893, and 44,893 shares issued at October 31, 2007, October 31, 2008 and January 31, 2009, respectively; 21,740, 37,823, and 37,823 shares outstanding at October 31, 2007, October 31, 2008 and January 31, 2009, respectively | 150,550 | 169,716 | 171,980 | |||||||||
Warrants | 23,391 | 18,029 | 16,873 | |||||||||
Treasury stock, 7,070 common shares at October 31, 2007, October 31, 2008, and January 31, 2009, at cost | (8 | ) | (8 | ) | (8 | ) | ||||||
Accumulated deficit | (589,286 | ) | (629,979 | ) | (644,525 | ) | ||||||
Total stockholders’ equity (deficit) | 35,295 | 8,406 | (5,032 | ) | ||||||||
Total liabilities and stockholders’ equity (deficit) | $ | 165,388 | $ | 118,119 | $ | 88,406 | ||||||
See notes to consolidated financial statements
F-64
Table of Contents
Force10 Networks, Inc. (Legacy Force10)
Consolidated statements of operations
| Year ended October 31, | Three months ended January 31, | |||||||||||||||||||
| (in thousands) | 2006 | 2007 | 2008 | 2008 | 2009 | |||||||||||||||
| (unaudited) | ||||||||||||||||||||
Revenues | ||||||||||||||||||||
Product | $ | — | $ | — | $ | 142,742 | $ | 29,513 | $ | 25,107 | ||||||||||
Service and maintenance | — | — | 19,606 | 4,120 | 6,185 | |||||||||||||||
Ratable product, service and maintenance (note 1) | 50,369 | 196,741 | 10,682 | 1,810 | 3,521 | |||||||||||||||
Total revenues | 50,369 | 196,741 | 173,030 | 35,443 | 34,813 | |||||||||||||||
Cost of revenues | ||||||||||||||||||||
Product | — | — | 76,038 | 14,892 | 14,751 | |||||||||||||||
Service and maintenance | — | — | 10,205 | 2,258 | 2,275 | |||||||||||||||
Ratable product, service and maintenance | 38,000 | 110,559 | 5,213 | 980 | 1,643 | |||||||||||||||
Total cost of revenues | 38,000 | 110,559 | 91,456 | 18,130 | 18,669 | |||||||||||||||
Gross profit | 12,369 | 86,182 | 81,574 | 17,313 | 16,144 | |||||||||||||||
Operating expenses | ||||||||||||||||||||
Research and development | 33,799 | 39,682 | 41,683 | 10,797 | 9,068 | |||||||||||||||
Sales and marketing | 34,815 | 41,148 | 55,669 | 13,138 | 12,138 | |||||||||||||||
General and administrative | 11,430 | 21,283 | 21,542 | 7,075 | 5,367 | |||||||||||||||
Restructuring charges | 5,882 | 832 | 281 | 96 | 3,064 | |||||||||||||||
Impairment of goodwill | — | 1,170 | — | — | — | |||||||||||||||
Gain from insurance proceeds, net | — | (1,971 | ) | (217 | ) | (217 | ) | — | ||||||||||||
Total operating expenses | 85,926 | 102,144 | 118,958 | 30,889 | 29,637 | |||||||||||||||
Loss from operations | (73,557 | ) | (15,962 | ) | (37,384 | ) | (13,576 | ) | (13,493 | ) | ||||||||||
Interest income | 580 | 2,967 | 1,496 | 625 | 18 | |||||||||||||||
Interest expense | (2,533 | ) | (2,340 | ) | (525 | ) | (166 | ) | (75 | ) | ||||||||||
Other income (loss), net | (48 | ) | (10 | ) | (168 | ) | (20 | ) | 76 | |||||||||||
Loss before income taxes | (75,558 | ) | (15,345 | ) | (36,581 | ) | (13,137 | ) | (13,474 | ) | ||||||||||
Provision for income taxes | 168 | 397 | 286 | 24 | 137 | |||||||||||||||
Net loss | (75,726 | ) | (15,742 | ) | (36,867 | ) | (13,161 | ) | (13,611 | ) | ||||||||||
Cumulative preferred dividends | 3,742 | 3,742 | 3,743 | 936 | 935 | |||||||||||||||
Deemed dividends on preferred stock | 70 | 4,029 | 83 | — | — | |||||||||||||||
Loss attributable to common stockholders | $ | (79,538 | ) | $ | (23,513 | ) | $ | (40,693 | ) | $ | (14,097 | ) | $ | (14,546 | ) | |||||
See notes to consolidated financial statements
F-65
Table of Contents
Force10 Networks, Inc. (Legacy Force10)
Consolidated statements of stockholders’ equity (deficit) and comprehensive loss
| Convertible preferred stock and additional paid-in capital | Common stock and additional paid-in capital | Treasury stock | Warrants | Deferred stock-based compensation | Accumulated other comprehensive loss | Accumulated deficit | Total (deficit) | |||||||||||||||||||||||||||||
| (in thousands) | Shares | Amount | Shares | Amount | Shares | Amount | ||||||||||||||||||||||||||||||
Balances, November 1, 2005 | 174,604 | $ | 336,335 | 28,308 | $ | 130,679 | (6,464 | ) | $ | (8 | ) | $ | 7,770 | $ | (2 | ) | $ | (3 | ) | $ | (486,235 | ) | $ | (11,464 | ) | |||||||||||
Comprehensive loss: | ||||||||||||||||||||||||||||||||||||
Net loss | (75,726 | ) | (75,726 | ) | ||||||||||||||||||||||||||||||||
Change in unrealized loss on available for sale short-term investments | 3 | 3 | ||||||||||||||||||||||||||||||||||
Total comprehensive loss | (75,723 | ) | ||||||||||||||||||||||||||||||||||
Issuance of Series F convertible preferred stock and warrants, net of issuance costs of $1,918 | 33,048 | 32,089 | 728 | 32,817 | ||||||||||||||||||||||||||||||||
Issuance of Series E convertible preferred stock warrants | 205 | 205 | ||||||||||||||||||||||||||||||||||
Extension of term of Series A and B convertible preferred stock warrants | 57 | 57 | ||||||||||||||||||||||||||||||||||
Series E convertible preferred stock warrants issued for services | 5 | 5 | ||||||||||||||||||||||||||||||||||
Series F convertible preferred stock warrants issued in connection with bank loan | 220 | 220 | ||||||||||||||||||||||||||||||||||
F-66
Table of Contents
Force10 Networks, Inc. (Legacy Force10)
Consolidated statements of stockholders’ equity (deficit) and comprehensive loss—(continued)
| Convertible preferred stock and additional paid-in capital | Common stock and additional paid-in capital | Treasury stock | Warrants | Deferred stock-based compensation | Accumulated other comprehensive loss | Accumulated deficit | Total (deficit) | |||||||||||||||||||||||||||||
| (in thousands) | Shares | Amount | Shares | Amount | Shares | Amount | ||||||||||||||||||||||||||||||
Repurchase and cancellation of common stock | (13 | ) | (6 | ) | (6 | ) | ||||||||||||||||||||||||||||||
Exercise of stock options | 377 | 163 | 163 | |||||||||||||||||||||||||||||||||
Exercise of common stock warrants | 47 | 24 | 24 | |||||||||||||||||||||||||||||||||
Stock-based compensation | 7,128 | 7,128 | ||||||||||||||||||||||||||||||||||
Amortization of deferred stock-based compensation | 2 | 2 | ||||||||||||||||||||||||||||||||||
Stock options issued in connection with acquisition of MetaNetworks | 302 | 302 | ||||||||||||||||||||||||||||||||||
Collection of stockholder note receivable | 8 | 8 | ||||||||||||||||||||||||||||||||||
Deemed dividend | 70 | (70 | ) | |||||||||||||||||||||||||||||||||
Series E cumulative preferred stock dividend | (3,742 | ) | (3,742 | ) | ||||||||||||||||||||||||||||||||
Balances, October 31, 2006 | 207,652 | $ | 368,424 | 28,719 | $ | 138,368 | (6,464 | ) | $ | (8 | ) | $ | 8,985 | $ | — | $ | — | $ | (565,773 | ) | $ | (50,004 | ) | |||||||||||||
F-67
Table of Contents
Force10 Networks, Inc. (Legacy Force10)
Consolidated statements of stockholders’ equity (deficit) and comprehensive loss—(continued)
| Convertible preferred stock and additional paid-in capital | Common stock and additional paid-in capital | Treasury stock | Warrants | Deferred stock-based compensation | Accumulated other comprehensive loss | Accumulated deficit | Total (deficit) | ||||||||||||||||||||||||||||||
| (in thousands) | Shares | Amount | Shares | Amount | Shares | Amount | |||||||||||||||||||||||||||||||
Balances, October 31, 2006 | 207,652 | $ | 368,424 | 28,719 | $ | 138,368 | (6,464 | ) | $ | (8 | ) | $ | 8,985 | $ | — | $ | — | $ | (565,773 | ) | $ | (50,004 | ) | ||||||||||||||
Net loss and comprehensive loss | (15,742 | ) | (15,742 | ) | |||||||||||||||||||||||||||||||||
Issuance of Series F convertible preferred stock and warrants, net of issuance costs of $7,303 | 98,096 | 93,638 | 2,959 | 96,597 | |||||||||||||||||||||||||||||||||
Issuance of Series E convertible preferred stock warrants | (11,414 | ) | 11,414 | ||||||||||||||||||||||||||||||||||
Extension of term of Series A and B convertible preferred stock warrants | 11 | 11 | |||||||||||||||||||||||||||||||||||
Issuance of Series F convertible preferred stock warrants in connection with loan amendments | 22 | 22 | |||||||||||||||||||||||||||||||||||
Repurchase of common stock | (5 | ) | (2 | ) | (606 | ) | (2 | ) | |||||||||||||||||||||||||||||
Exercise of stock options | 96 | 31 | 31 | ||||||||||||||||||||||||||||||||||
Stock-based compensation | 8,116 | 8,116 | |||||||||||||||||||||||||||||||||||
Collection of stockholder note receivable | 8 | 8 | |||||||||||||||||||||||||||||||||||
Deemed dividend | 4,029 | (4,029 | ) | ||||||||||||||||||||||||||||||||||
Series E cumulative preferred stock dividend | (3,742 | ) | (3,742 | ) | |||||||||||||||||||||||||||||||||
Balances, October 31, 2007 | 305,748 | 450,648 | 28,810 | 150,550 | (7,070 | ) | (8 | ) | 23,391 | (589,286 | ) | 35,295 | |||||||||||||||||||||||||
F-68
Table of Contents
Force10 Networks, Inc. (Legacy Force10)
Consolidated statements of stockholders’ equity (deficit) and comprehensive loss—(continued)
| Convertible preferred stock and additional paid-in capital | Common stock and additional paid-in capital | Treasury stock | Warrants | Deferred stock-based compensation | Accumulated other comprehensive loss | Accumulated deficit | Total (deficit) | ||||||||||||||||||||||||||||
| (in thousands) | Shares | Amount | Shares | Amount | Shares | Amount | |||||||||||||||||||||||||||||
Balances, October 31, 2007 | 305,748 | 450,648 | 28,810 | 150,550 | (7,070 | ) | (8 | ) | 23,391 | — | — | (589,286 | ) | 35,295 | |||||||||||||||||||||
Net loss and comprehensive loss | (36,867 | ) | (36,867 | ) | |||||||||||||||||||||||||||||||
Exercise of stock options | 9,183 | 3,956 | 3,956 | ||||||||||||||||||||||||||||||||
Exercise of common stock warrants for cash | 5,962 | 4,626 | (1,645 | ) | 2,981 | ||||||||||||||||||||||||||||||
Cashless exercise of common stock warrants | 938 | 872 | (872 | ) | |||||||||||||||||||||||||||||||
Extension of term of Series A, B and B-1 preferred stock warrants | 1 | (1 | ) | ||||||||||||||||||||||||||||||||
Series C and D preferred stock warrants issued as deemed dividend | 82 | (82 | ) | ||||||||||||||||||||||||||||||||
Expiration of warrants | 2,928 | (2,928 | ) | ||||||||||||||||||||||||||||||||
Stock-based compensation | 6,784 | 6,784 | |||||||||||||||||||||||||||||||||
Series E cumulative preferred stock dividend | (3,743 | ) | (3,743 | ) | |||||||||||||||||||||||||||||||
Balances, October 31, 2008 | 305,748 | $ | 450,648 | 44,893 | $ | 169,716 | (7,070 | ) | $ | (8 | ) | $ | 18,029 | $ | — | $ | — | $ | (629,979 | ) | $ | 8,406 | |||||||||||||
F-69
Table of Contents
Force10 Networks, Inc. (Legacy Force10)
Consolidated statements of stockholders’ equity (deficit) and comprehensive loss—(continued)
| Convertible preferred stock | Common stock and additional paid-in capital | Treasury stock | Warrants | Accumulated other comprehensive loss | Accumulated deficit | Total (deficit) | ||||||||||||||||||||||||||
| (in thousands) | Shares | Amount | Shares | Amount | Shares | Amount | ||||||||||||||||||||||||||
Balances, October 31, 2008 | 305,748 | $ | 450,648 | 44,893 | $ | 169,716 | (7,070 | ) | $ | (8 | ) | $ | 18,029 | $ | — | $ | (629,979 | ) | $ | 8,406 | ||||||||||||
Net loss and comprehensive loss* | (13,611 | ) | (13,611 | ) | ||||||||||||||||||||||||||||
Cashless exercise of common stock warrants* | 1,156 | (1,156 | ) | |||||||||||||||||||||||||||||
Stock-based compensation* | 1,108 | 1,108 | ||||||||||||||||||||||||||||||
Series E cumulative preferred stock dividend* | (935 | ) | (935 | ) | ||||||||||||||||||||||||||||
Balances, January 31, 2009* | 305,748 | $ | 450,648 | 44,893 | $ | 171,980 | (7,070 | ) | (8 | ) | $ | 16,873 | $ | — | $ | (644,525 | ) | $ | (5,032 | ) | ||||||||||||
| * | Unaudited |
F-70
Table of Contents
Force10 Networks, Inc. (Legacy Force10)
Consolidated statements of cash flows
| Year ended October 31, | Three months ended January 31 | |||||||||||||||||||
| (in thousands) | 2006 | 2007 | 2008 | 2008 | 2009 | |||||||||||||||
| (unaudited) | ||||||||||||||||||||
Cash flows from operating activities: | ||||||||||||||||||||
Net loss | $ | (75,726 | ) | $ | (15,742 | ) | $ | (36,867 | ) | $ | (13,161 | ) | $ | (13,611 | ) | |||||
Reconciliation of net loss to net cash used in operating activities | ||||||||||||||||||||
Depreciation and amortization | 2,314 | 3,062 | 4,179 | 919 | 1,158 | |||||||||||||||
Stock-based compensation expense | 6,959 | 8,255 | 6,955 | 2,372 | 1,125 | |||||||||||||||
Amortization of warrants issued for services | 66 | 243 | 2 | 1 | — | |||||||||||||||
Equity issued for services | 5 | — | — | — | — | |||||||||||||||
Provision for (recovery of) accounts receivable allowance for bad debt | 1,565 | (589 | ) | 41 | 12 | 5 | ||||||||||||||
Write down of inventory | 1,364 | 3,445 | 6,186 | 480 | 1,501 | |||||||||||||||
Provision for restructuring charges | 5,882 | 832 | 316 | 132 | 3,064 | |||||||||||||||
Loss on disposal of property and equipment | 717 | 411 | 12 | — | 2 | |||||||||||||||
Impairment of intangible assets | — | 2,435 | — | — | �� | — | ||||||||||||||
Gain on insurance claims related to property and equipment | — | (2,103 | ) | (132 | ) | (132 | ) | — | ||||||||||||
Deferred tax provision | — | — | (91 | ) | (48 | ) | — | |||||||||||||
Changes in operating assets and liabilities | ||||||||||||||||||||
Trade accounts receivable | (8,723 | ) | (2,132 | ) | 5,324 | 2,080 | 6,915 | |||||||||||||
Other accounts receivable | 3,684 | 401 | 1,252 | (234 | ) | 211 | ||||||||||||||
Inventories | (7,674 | ) | (8,872 | ) | 5,221 | 3,049 | (3,488 | ) | ||||||||||||
Deferred cost of revenues | (21,855 | ) | 36,275 | 9,014 | (3,680 | ) | 7,313 | |||||||||||||
Prepaid expenses, other current assets and other assets | (330 | ) | (1,676 | ) | 1,004 | 187 | 159 | |||||||||||||
Accounts payable | (4,658 | ) | 179 | (2,538 | ) | 3,335 | (305 | ) | ||||||||||||
Accrued expenses and other liabilities | (693 | ) | 2,123 | (6,725 | ) | (2,864 | ) | (2,303 | ) | |||||||||||
Deferred revenues | 59,310 | (65,763 | ) | (14,880 | ) | 5,210 | (11,379 | ) | ||||||||||||
Net cash used in operating activities | (37,793 | ) | (39,216 | ) | (21,726 | ) | (2,342 | ) | (9,633 | ) | ||||||||||
Cash flows from investing activities | ||||||||||||||||||||
Proceeds from sales and maturities of short-term investments | 3,675 | — | — | — | — | |||||||||||||||
Purchases of short-term investments | (642 | ) | — | — | — | — | ||||||||||||||
Purchases of property and equipment | (4,060 | ) | (10,271 | ) | (5,127 | ) | (1,491 | ) | (467 | ) | ||||||||||
Proceeds from insurance claims relating to property and equipment | — | 3,748 | 132 | 132 | — | |||||||||||||||
Increase (decrease) in restricted cash | (1,606 | ) | 3,184 | — | — | (1,600 | ) | |||||||||||||
Cash paid for acquisition, net of cash acquired | (1,896 | ) | — | — | — | — | ||||||||||||||
Payment of earn-out related to MetaNetworks acquisition | — | (452 | ) | (160 | ) | (160 | ) | — | ||||||||||||
Net cash used in investing activities | (4,529 | ) | (3,791 | ) | (5,155 | ) | (1,519 | ) | (2,067 | ) | ||||||||||
Cash flows from financing activities | ||||||||||||||||||||
Proceeds from issuance of common stock | 189 | 29 | 6,937 | 3,849 | — | |||||||||||||||
Proceeds from issuance of convertible preferred stock | 32,817 | 96,597 | — | — | — | |||||||||||||||
Borrowings under credit facility | 16,020 | 5,000 | — | — | — | |||||||||||||||
Repayments under credit facility | (4,821 | ) | (28,699 | ) | — | — | (5,420 | ) | ||||||||||||
Principal payments under capital leases | (58 | ) | — | — | — | — | ||||||||||||||
Net cash provided by (used in) financing activities | 44,147 | 72,927 | 6,937 | 3,849 | (5,420 | ) | ||||||||||||||
Net increase (decrease) in cash and cash equivalents | 1,825 | 29,920 | (19,944 | ) | (12 | ) | (17,120 | ) | ||||||||||||
Cash and cash equivalents | ||||||||||||||||||||
Beginning of period | 28,296 | 30,121 | 60,041 | 60,041 | 40,097 | |||||||||||||||
End of period | $ | 30,121 | $ | 60,041 | $ | 40,097 | $ | 60,029 | $ | 22,977 | ||||||||||
See notes to consolidated financial statements
F-71
Table of Contents
Force10 Networks, Inc. (Legacy Force10)
Notes to consolidated financial statements
1. Organization and significant accounting policies
Organization
Force10 Networks, Inc. (the Company) was incorporated in May 1999 as nCore Networks, Inc. in the State of Delaware and subsequently changed its name to Force10 Networks, Inc. in September 1999.
On March 31, 2009, Turin Networks, Inc. (Turin) acquired 100% of the outstanding capital stock of the Company. Subsequent to the acquisition, Turin changed its name to Force10 Networks, Inc., which is the name formerly used by the Company. The Company is referred to in the accompanying financial statement headings as “Force10 Networks, Inc. (Legacy Force10)” to distinguish it from Turin.
The Company develops and markets network infrastructure equipment and services. Customers of the Company include leading media companies, financial institutions, manufacturing organizations, search engines and portals, Web 2.0 companies, service providers, internet exchanges and global research networks. Sales and marketing activities are conducted through a variety of sales channels, including a direct sales organization and resellers. In January 2002, the Company completed its first shipment of product. The Company has offices in North America, Europe, and the Asia Pacific region and its fiscal year ends on October 31.
Principles of consolidation
The accompanying consolidated financial statements include the accounts of the Company and its subsidiaries, all of which are wholly-owned. All intercompany balances and transactions have been eliminated.
Unaudited interim financial information
The accompanying consolidated balance sheet as of January 31, 2009, the consolidated statements of operations and of cash flows for the three months ended January 31, 2008 and 2009 and the consolidated statement of stockholders’ equity (deficit) and comprehensive loss for the three months ended January 31, 2009 are unaudited. The unaudited interim financial statements have been prepared on the same basis as the annual consolidated financial statements and, in the opinion of management, reflect all adjustments, which include only normal recurring adjustments, necessary to present fairly the Company’s financial position and results of operations and cash flows for the three months ended January 31, 2008 and 2009. The financial data and other information disclosed in these notes to the consolidated financial statements related to the three-month periods are unaudited. The results for the three months ended January 31, 2009 are not necessarily indicative of the results to be expected for the year ending October 31, 2009 or for any other interim period or for any other future year.
Management’s plans regarding going concern
The Company incurred a net loss attributable to common stockholders of $23.5 million and $40.7 million in fiscal years 2007 and 2008, respectively, and used cash in its operating activities of $39.2 million and $21.7 million for the fiscal years 2007 and 2008, respectively. At October 31, 2008, cash and cash equivalents totaled approximately $40.1 million and working capital was approximately $12.6 million. The Company’s bank line of credit expired on January 29, 2009 at
F-72
Table of Contents
which time the Company was required to pay the outstanding balance of $5 million plus a $0.4 million loan fee. Historically, the Company has obtained its funding through equity transactions, bank borrowings and capital lease arrangements. The Company currently has no arrangements with respect to, or sources of, additional financing at this time and must therefore fund its losses from existing cash balances.
The conditions described above raise substantial doubt about the Company’s ability to continue as a going concern. To continue operations, management has adopted certain cost reduction measures to reduce operating expenses which included a plan for a reduction in work force that started in January 2009. In addition, the Company entered into a merger agreement on December 31, 2008, as discussed in note 16, under which it will become a wholly-owned subsidiary of Turin.
While the Company is aggressively pursuing opportunities and corrective actions, there can be no assurance that the current efforts to constrain expenses or the planned merger will be successful in the Company’s efforts to generate sufficient cash from operations over the next 12 months. The accompanying consolidated financial statements have been prepared assuming that the Company will continue as a going concern which assumes continuing operations and the realization of assets and liabilities in the ordinary course of business and therefore, does not include any adjustments that may result from the outcome of this uncertainty.
Use of estimates in the preparation of financial statements
The preparation of the consolidated financial statements in conformity with accounting principles generally accepted in the United States of America requires management to make estimates and assumptions that affect the reported amounts of assets and liabilities, the disclosure of contingent assets and liabilities at the date of the financial statements, and the reported amounts of revenues and expenses during the reporting period. The Company bases its estimates on historical experience and various assumptions about the future that are believed to be reasonable based on available information at the time the Company prepares its financial information. Actual results could differ significantly from the estimates made by management. Changes in estimates are recorded in the period in which they become known. Significant estimates and assumptions include, but are not limited to, the determination of deferred revenues and deferred cost of revenues, the fair value of equity awards issued, excess and obsolete inventory, sales return allowances, restructuring charges, non-cancelable purchase obligations and contingent state sales tax liabilities.
Fair value of financial instruments
The Company has evaluated the estimated fair value of financial instruments using available market information and management estimates. The use of different market assumptions or estimation methodologies could have a significant effect on the estimated fair value amounts. The fair value of the Company’s cash, cash equivalents, accounts receivable and other current and non-current liabilities approximate their carrying amounts due to the relatively short maturity of these items. The carrying value of debt instruments approximates their fair values based on information obtained from market sources and management estimates.
Cash equivalents
The Company considers all highly liquid investments such as treasury bills, commercial paper, certificates of deposit and money market instruments with maturities of 90 days or less at the time of acquisition to be cash equivalents. Cash equivalents primarily consist of amounts held in interest bearing money market accounts that were readily convertible to cash.
F-73
Table of Contents
The Company invests its excess cash with high credit quality financial institutions. The Company reviews its investments in debt securities for potential impairment on a regular basis. As part of the evaluation process, the Company considers the credit ratings of these securities and its intent and ability to hold the investment for a period of time sufficient to allow for any anticipated improvement of the investee financial condition. The Company will record an impairment loss on investments for any other-than-temporary decline in fair value of these debt securities below their cost basis.
Trade accounts receivable
Trade accounts receivable are recorded at the invoiced amount and do not bear interest. The allowance for doubtful accounts is the Company’s best estimate of the amount of probable credit losses in the Company’s existing accounts receivable. The Company specifically analyzes historical bad debts, the aging of the accounts receivable, customer concentrations and credit worthiness, potential disagreements with customers and current economic trends to evaluate the allowance for doubtful accounts. The Company reviews its allowance for doubtful accounts quarterly. Past due balances are reviewed individually for collectibility. Account balances are charged off against the allowance after all means of collection have been exhausted and the potential for recovery is considered remote.
Inventories
Inventories are stated at the lower of cost (first-in, first-out) or market. Cost includes the purchase price of parts, assembly and overhead costs.
The Company writes down inventory when conditions exist that suggest that inventory may be in excess of anticipated demand or is obsolete based upon assumptions about future demand for products and market conditions. At the point an excess and obsolescence write-down is recorded, a new, lower-cost basis for that inventory is established, and subsequent changes in facts and circumstances do not result in the restoration of or an increase in that newly established cost basis. Inventory write-downs are reflected as cost of revenues in the consolidated statements of operations. In addition, the Company records a liability for firm non-cancelable and unconditional purchase commitments with contract manufacturers for quantities in excess of the Company’s future demand forecasts consistent with its allowance for inventory.
Deferred cost of revenues
When the Company’s products have been delivered, but the product revenue associated with the arrangement has been deferred as a result of not meeting the applicable revenue recognition criteria in Statement of Position (SOP) No. 97-2,Software Revenue Recognition(SOP 97-2), and all related amendments and interpretations, the Company defers the related inventory costs for the delivered items and recognizes such costs in the same period as the associated revenue.
Property and equipment
Property and equipment is stated at cost. Depreciation is computed once assets are placed into service, using the straight-line method over their estimated useful lives as follows:
Manufacturing and lab equipment | 3-4 years | |
Computers, furniture and office equipment | 3-5 years | |
Software | 3 years | |
Leasehold improvements | 6-10 years | |
F-74
Table of Contents
Leasehold improvements are amortized over the shorter of the lease term or the estimated useful life of the assets. The cost of asset retirement obligations is included in leasehold improvements and is amortized over their estimated useful lives.
Expenditures for maintenance and repairs are expensed as incurred, whereas major betterments are capitalized as additions to property and equipment.
Impairment of long-lived assets
The Company reviews its long-lived assets for impairment whenever events or changes in circumstances indicate that the carrying amount of an asset may no longer be recoverable. When these events occur, the Company measures impairment by comparing the carrying value of the long-lived assets to the estimated undiscounted future cash flows expected to result from the use of the assets and their eventual disposition. If the sum of the expected undiscounted cash flow is less than the carrying amount of the assets, the Company recognizes an impairment loss based on the fair value of the assets.
Restricted cash
Restricted cash consists of interest bearing deposit accounts held as collateral for an outstanding letter of credit (LC) issued to the Company’s landlord of its corporate headquarters. The letter of credit is subject to renewal annually until the lease expires. The LC will be reduced annually to no less than $0.5 million by July 1, 2009 or if and when the Company completes an IPO for not less than $150.0 million and which expires on December 31, 2012.
Revenue recognition
The Company’s revenues are derived primarily from two sources: (1) product revenue, which includes sales of networking equipment and licensing of related software products and (2) services revenue, which includes customer support, consulting and training services.
The Company’s products are integrated with software that is more than incidental to the functionality of its equipment. Additionally, the Company provides technical support and unspecified upgrades and enhancements related to its integrated software through its customer support contracts. Accordingly, the Company accounts for revenue in accordance with SOP 97-2,Software Revenue Recognition, and all related interpretations. The Company recognizes revenue when persuasive evidence of an arrangement exists, delivery has occurred, the fee is fixed or determinable, and collectibility is probable. The Company evaluates each of these criteria as follows:
Evidence of an arrangement. Contracts and/or customer purchase orders are used to determine the existence of an arrangement.
Delivery . Delivery is considered to occur when title to the Company’s products and risk of loss has transferred to the customer, which typically occurs when products are delivered to a common carrier. Delivery of services occurs when performed.
Fixed or determinable fee. The Company assesses whether fees are fixed or determinable at the time of sale. Fees are considered fixed or determinable if they are not subject to refund or adjustment. The Company’s standard payment terms may vary based on the country in which the agreement is executed and the credit standing of the individual customer. If the arrangement fee is not fixed or determinable, revenue is recognized as amounts become due and payable. In instances where acceptance of the product and/or services is specified by the customer, revenue is deferred until all acceptance criteria have been met.
F-75
Table of Contents
Collection is deemed probable. Collection is deemed probable if the Company expects that the customer will be able to pay amounts under the arrangement as payments become due. The Company assesses collectibility based on the customer’s current credit worthiness and past payment history. If the Company determines that collection is not probable, revenue is deferred until payment is received.
The Company’s sales arrangements typically involve multiple elements, such as hardware and software products, contractual customer support agreements and, occasionally, training and/or consulting services. Its contractual support agreements provide a range of services, including access to unspecified software upgrades and enhancements, telephone and internet access to technical support and hardware repair or replacement. Prior to October 31, 2007, its sales arrangements also included an implied customer support element that existed because the Company had provided certain of these services to customers without necessarily validating customers’ entitlement to receive such services under written support agreements.
When a sale involves multiple elements, SOP 97-2 specifies that if sufficient vendor-specific objective evidence of fair value (VSOE) does not exist to separately account for the various elements of the arrangement, all revenue should be deferred until the earlier of the point at which (i) such VSOE does exist or (ii) all elements have been delivered. However, when the only undelivered elements are services that are not essential to the functionality of the Company’s products, such as training and customer support, the Company recognizes revenue ratably over the longest period during which the services are expected to be performed, beginning when products have been delivered and all services have commenced.
VSOE is established based on the price charged when the same element is sold separately. Prior to October 31, 2007, VSOE had not been established for any of the elements in the Company’s multiple-element arrangements. Accordingly, the Company accounted for each of its sales arrangements as a single element. The entire arrangement fee and related cost of goods sold was recognized ratably over the longest estimated service period during which delivery occurred and classified on the Statements of Operations as ratable product and related support and services revenue and ratable cost of product and related support and services, respectively. The service period associated with contractual customer support agreements is usually a one year contractual period. However, in most cases prior to October 31, 2007, the longest undelivered service period was associated with the Company’s implied customer support element, which was based on a three-year estimated economic product life.
On October 31, 2007, the Company (i) terminated the implied customer support element in its sales arrangements by no longer providing customer support services to customers who are not entitled to receive such services and (ii) established VSOE for certain contractual customer support agreements, by reference to the price paid for support when sold separately. The determination as to when an implied customer support element has been terminated and when VSOE has been established is a matter of judgment. The effect of this determination was to increase fiscal year 2007 revenues and cost of revenues by $115.3 million and $55.4 million, respectively, to reflect a one-time, “cumulative catch-up” of revenues and cost of revenues which had previously been deferred.
For multiple-element arrangements with deferred balances on October 31, 2007 that included contractual support agreements for which VSOE has been established, the Company applied the residual method of accounting as set forth in AICPA Statement of Position No. 98-9,Modification of SOP 97-2, Software Revenue Recognition, With Respect to Certain Transactions. For those arrangements, the Company continued to defer revenue equivalent to VSOE of any remaining
F-76
Table of Contents
undelivered contractual support obligations, which the Company recognizes ratably as services revenue over the remaining contractual service period. Any deferred revenue in excess of VSOE of the remaining undelivered contractual support period, and all associated deferred cost, were recognized in operating results on October 31, 2007.
For multiple-element arrangements with deferred balances on October 31, 2007 that included contractual support agreements for which VSOE has not yet been established, the Company reduced the estimated service period over which the entire arrangement fee and associated cost of revenues should be recognized ratably, (i.e. from a three-year implied customer support period to the actual contractual service period, which is usually one year). For those arrangements, the Company continued to defer revenue for the entire arrangement fee and associated cost of revenues proportionate to any remaining undelivered contractual support period, which is recognized ratably over the remaining contractual service period. The remaining fees and cost of revenues associated with the delivered product and service elements were recognized in operating results on October 31, 2007.
For new multiple-element arrangements, effective beginning November 1, 2007, that include contractual support agreements for which VSOE has been established, the Company allocates and defers revenue associated with undelivered contractual support agreements using VSOE, with the residual fees allocated to product. The Company recognizes product revenue and product cost of revenues upon delivery, assuming that all other criteria for revenue recognition have been met, and recognizes service revenue ratably over the contractual support period.
Some of the Company’s customers receive support services that are similar in nature to its standard support offerings; however, VSOE has not been established as required by SOP 97-2 because of an insufficient number of consistently priced support contracts when sold separately to those customers. In those circumstances, SOP 97-2 requires the Company to recognize revenue for the total arrangement ratably over the longest undelivered service period, which is usually over the contractual support period. However, the Company allocates the ratable revenue that is recognized between product and services revenue for classification and presentation purposes on its Statements of Operations because it believes such presentation facilitates a better understanding of the sources of its revenue. Ratable revenue recognized associated with the delivery of contractual support services is classified as services revenue using VSOE that exists for the Company’s other customer classes and the residual ratable revenue recognized is classified as product revenue. The Company believes this methodology produces a reasonable approximation of fair value for delivered contractual support services due to (i) similarities in the nature of the support services provided to all customer classes, (ii) similarities in support delivery personnel, systems and processes, and (iii) the fact that fees charged for support are a relatively minor percent of the customer’s total cost of owning the Company’s hardware. When such an allocation is not possible, the Company classifies the ratable revenue recognized as ratable product and related support and services revenue on its Statement of Operations.
The Company complements its direct sales and marketing efforts by using reseller and distributor channels to extend its market reach. The Company’s sales arrangements do not allow channel partners to stock inventory. The Company’s sales arrangements are on business terms that are similar to sales arrangements with its direct customers, and revenue recognition begins upon sell-in of product to its channel partners.
Shipping charges billed to customers are included in net revenues and the related shipping costs are included in cost of product revenues.
F-77
Table of Contents
Sales returns and allowances
The Company typically does not offer contractual rights of return to its customers, including its channel partners. The Company occasionally accepts non-contractual returns for customer satisfaction or other business reasons. The Company provides an allowance for estimated customer returns in accordance with SFAS No. 48,Revenue Recognition When Right of Return Exists. The provision is based on the Company’s actual historical and estimated future returns and is recorded as a reduction of revenues and cost of revenues. The balance of the reserve for sales returns and allowances was $1.0 million, and $0.6 million as of October 31, 2007, and 2008 respectively.
Product warranties
The Company generally warrants its products against certain manufacturing and other defects. The warranty period is typically twelve months from the date of shipment to the end-user customer or reseller for hardware and ninety days for software.
Prior to October 31, 2007, VSOE had not been established for any of the elements in the Company’s sales arrangements, including customer support. The Company accounted for it sales arrangements as a single element and recognized the entire arrangement fee and related cost of revenues ratably over the estimated service delivery period. Accordingly, the Company accounted for costs to provide customer support and service warranties as incurred and no warranty reserve was recorded during that period. On October 31, 2007, the Company (i) terminated the implied customer support element in its sales arrangements and (ii) established VSOE for certain contractual customer support agreements. As a result, in addition to recognizing previously deferred revenue and cost of revenues as discussed above in “Revenue Recognition,” the Company established a $0.1 million warranty reserve as of October 31, 2007 for estimated costs to fulfill any warranty obligations not provided for under contractual customer support agreements included in those sales arrangements. The Company incurred warranty costs of $2.1 million, $3.3 million, and $2.4 million in fiscal years 2006, 2007 and 2008, respectively, and $0.5 million and $0.5 million for the three months ended January 31, 2008 and 2009, respectively. The warranty reserve at October 31, 2008 and January 31, 2009 was $0.1 million and $0.1 million, respectively.
Research and development
The Company expenses research and development expenses of new products, other than software, and enhancements to existing products as incurred. The Company devotes substantial resources to the continued development of additional functionality for existing products and the development of new products. The Company intends to continue to invest significantly in research and development efforts. Costs for the development of new software products and enhancements to existing products are expensed as incurred until technological feasibility has been established, at which time any additional development costs would be capitalized in accordance with SFAS No. 86,“Accounting for Costs of Computer Software To Be Sold, Leased, or Otherwise Marketed.” To date, the Company’s software has been available for general release shortly after the establishment of technological feasibility, which the Company defines as a working prototype and, accordingly, capitalizable costs have not been significant.
Stock-based compensation
The Company elected to adopt the provisions of SFAS No. 123R (revised 2004),Share-Based Payment (SFAS 123R) effective in its fiscal year 2002. The provisions of SFAS 123R require a company to measure the cost of employee services based on the grant date fair value of the
F-78
Table of Contents
award. That cost is recognized in the statement of operations over the employee requisite service period. SFAS 123R also amends SFAS No. 95,Statement of Cash Flows,to require that excess tax benefits, as defined, realized from the exercise of stock options be reported as a financing cash inflow rather than as a reduction of taxes paid in cash flow from operations. In connection with adopting SFAS 123R, the Company elected to adopt the prospective application method provided by SFAS 123R, and accordingly financial statements presented herein reflect results of the fair value method of recognition of stock-based compensation. See Note 9 for further information regarding stock-based compensation expense and the assumptions used in estimating that expense.
Prior to the adoption of SFAS 123R, the Company measured stock-based compensation expense for its employees using the intrinsic value method under Accounting Principles Board Opinion No. 25,Accounting for Stock Issued to Employees (APB 25), and related interpretations. In addition, as required by Emerging Issues Task Force Consensus No. 96-18,“Accounting for Equity Instruments that are Issued to Other than Employees for Acquiring, or in Conjunction with Selling Goods or Services,”the Company records options granted to non-employees at the fair value of the consideration received or the fair value of the equity instruments issued, as estimated using the Black-Scholes option-pricing model, which is adjusted at each reporting date based on the then fair value of the option until fully vested. The related compensation expense is recognized as the options vest over the performance period.
Advertising expenses
All advertising costs are expensed as incurred. Advertising costs totaled $0.6 million, $0.8 million, and $0.5 million for fiscal years 2006, 2007, and 2008, respectively.
Foreign currency translation
The functional currency of the Company’s foreign subsidiaries is the U.S. dollar. For those subsidiaries whose books and records are not maintained in the functional currency, all monetary assets and liabilities are remeasured at the current exchange rate at the end of each period reported, nonmonetary assets and liabilities are remeasured at historical exchange rates and revenues and expenses are remeasured at average exchange rates in effect during the period. Transaction gains and losses, which are included in other income (expense), net in the accompanying consolidated statements of operations were not significant for any period presented.
Concentrations of risk
Financial instruments, which potentially subject the Company to concentrations of credit risk, consist primarily of cash and cash equivalents and accounts receivable. Cash and cash equivalents are held primarily with one financial institution and consist primarily of money market funds and cash in bank accounts. The Company sells its products and services mainly to large organizations in diversified industries worldwide. The Company performs ongoing credit evaluations of its customers’ financial condition and generally does not require its customers to provide collateral or other security to support accounts receivable.
F-79
Table of Contents
A limited number of customers have accounted for a large part of the Company’s revenues and accounts receivable. The following table provides details of net revenues to individual customers who accounted for 10% or greater of the Company’s net revenues based on the name of the bill-to customer:
| Year ended October 31, | Three months ended January 31, | ||||||||||||||
| 2006 | 2007 | 2008 | 2008 | 2009 | |||||||||||
| (unaudited) | |||||||||||||||
Customer A | 15 | % | 23 | % | 31 | % | 34 | % | 22 | % | |||||
Customer B | 20 | 10 | 2 | 2 | 6 | ||||||||||
Customer C | 3 | 3 | 4 | 4 | 17 | ||||||||||
At October 31, 2007 accounts receivable from Customer A accounted for 49% of net accounts receivable. At October 31, 2008 accounts receivable from Customer B accounted for 22% of net accounts receivable. At January 31, 2009 accounts receivable from Customer C, D and E accounted for 19%, 19% and 18% of net accounts receivable, respectively.
The Company has outsourced its manufacturing capabilities to third parties and relies on those suppliers to order components, build, configure and test systems and subassemblies, and ship products to meet customers’ delivery requirements in a timely manner. Failure to ship product on time or failure to meet the Company’s quality standards would result in delays to customers, customer dissatisfaction or cancellation of customer orders.
Certain components of the Company’s products are purchased from sole sources of supply. If the Company were unable to obtain these components at prices reasonable to the Company, the Company would experience delays in redesigning the product to function with a component from an alternative supplier. In addition, the Company relies on one manufacturer for the assembly of the majority of the Company’s products. The Company might experience delays if the Company were to shift production to an alternative manufacturer.
Income taxes
Income taxes are accounted for under the asset and liability method. Under this method, deferred tax assets and liabilities are recognized for the estimated future tax consequences attributable to differences between the financial statement carrying amounts of existing assets and liabilities and their respective tax bases, and operating losses and tax credit carryforwards. Deferred tax assets and liabilities are measured using enacted tax rates in effect for the year in which those temporary differences are expected to be recovered or settled. The effect of a change in tax rates on deferred tax assets and liabilities is recognized in the consolidated statements of operations in the period that includes the enactment date. A valuation allowance is recorded to reduce the carrying amounts of deferred tax assets if it is more likely than not that such assets will not be realized.
On November 1, 2007, the Company adopted Financial Accounting Standard Board (FASB) Financial Interpretation No. 48,Accounting for Uncertainty in Income Taxes-an interpretation of FASB Statement No. 109 (FIN 48), which prescribes a recognition threshold that a tax position is required to meet before being recognized in the financial statements and provides guidance on derecognition, measurement, classification, interest and penalties, disclosure, and transition issues. See note 11 for additional information, including the effects of adoption on the Company’s consolidated financial statements.
F-80
Table of Contents
Recent accounting pronouncements
In September 2006, the FASB issued SFAS No. 157,Fair Value Measurement, (SFAS 157) and related FASB staff positions, which provides guidance for using fair value to measure assets and liabilities. In addition, SFAS 157 also provides guidance for expanded information about the extent to which companies measure assets and liabilities at fair value, the information used to measure fair value and the effect of fair value measurements on earnings. SFAS 157 applies whenever other standards require (or permit) assets or liabilities to be measured at fair value, but does not expand the use of fair value in any new circumstances. SFAS 157 is effective for fiscal years beginning after November 15, 2007 for financial assets and liabilities, as well as for any other assets and liabilities that are carried at fair value on a recurring basis, and should be applied prospectively. Subsequently, the FASB provided for a one-year deferral of the provisions of SFAS 157 for non-financial assets and liabilities that are recognized or disclosed at fair value in the consolidated financial statements on a non-recurring basis. SFAS 157 is effective for the Company’s financial assets and liabilities beginning November 1, 2008. The Company is in the process of determining the effect the adoption of SFAS 157 will have on its consolidated financial statements.
In February 2007, the FASB issued SFAS No. 159,The Fair Value Option for Financial Assets and Financial Liabilities, Including an Amendment of FASB Statement No. 115(SFAS 159). SFAS 159 allows entities to measure many financial instruments and certain other assets and liabilities at fair value on an instrument-by-instrument basis (the fair value option). The provisions of SFAS 159 are effective for the Company beginning November 1, 2008. The Company is in the process of determining the effect, if any, the adoption of SFAS 159 will have on its consolidated financial statements.
In December 2007, the FASB issued SFAS No. 141R,Business Combinations(SFAS 141R). SFAS 141R establishes principles and requirements for how the acquirer of a business recognizes and measures in its financial statements the identifiable assets acquired, the liabilities assumed, and any noncontrolling interest in the acquiree. The statement also provides guidance for recognizing and measuring the goodwill acquired in the business combination and determines what information to disclose to enable users of the financial statement to evaluate the nature and financial effects of the business combination. SFAS 141R is effective for financial statements issued for fiscal years beginning after December 15, 2008. Accordingly, any business combinations the Company engages in will be recorded and disclosed following existing GAAP until November 1, 2009. The Company expects SFAS No. 141R will have an impact on its consolidated financial statements when effective, but the nature and magnitude of the specific effects will depend upon the nature, terms and size of the acquisitions the Company consummates after the effective date.
In March 2008, the FASB issued SFAS No. 161 (SFAS 161),Disclosures about Derivative Instruments and Hedging Activities. SFAS No. 161 requires companies with derivative instruments to disclose information that should enable financial statement users to understand how and why a company uses derivative instruments, how derivative instruments and related hedged items are accounted for under FASB Statement No. 133,Accounting for Derivative Instruments and Hedging Activities, and how derivative instruments and related hedged items affect a company’s financial position, financial performance and cash flows. SFAS 161 is effective for financial statements issued for fiscal years beginning after November 15, 2008. The Company is in the process of determining the effect the adoption of SFAS 161 will have on its consolidated financial statements.
F-81
Table of Contents
2. Balance sheet components
Cash and cash equivalents:
| As of October 31, | ||||||
| (in thousands) | 2007 | 2008 | ||||
Cash and cash equivalents: | ||||||
Cash | $ | 10,206 | $ | 12,739 | ||
Certificates of deposit | 40 | 40 | ||||
Money market funds | 49,795 | 27,318 | ||||
Total cash and cash equivalents | $ | 60,041 | $ | 40,097 | ||
Inventories:
| As of October 31, | As of January 31, 2009 | ||||||||
| (in thousands) | 2007 | 2008 | |||||||
| (unaudited) | |||||||||
Raw materials | $ | 4,616 | $ | 1,883 | $ | 1,934 | |||
Finished goods | 19,275 | 10,856 | 12,095 | ||||||
Total inventories | $ | 23,891 | $ | 12,739 | $ | 14,029 | |||
Deferred revenues and cost of goods sold:
| As of October 31, | As of January 31, 2009 | ||||||||
| (in thousands) | 2007 | 2008 | |||||||
| (unaudited) | |||||||||
Deferred revenues: | |||||||||
Deferred product revenues | $ | — | $ | 34,764 | $ | 24,653 | |||
Deferred services revenues | — | 17,997 | 18,648 | ||||||
Deferred ratable product and related support and services | 84,826 | 17,185 | 15,265 | ||||||
Total deferred revenues | $ | 84,826 | $ | 69,946 | $ | 58,566 | |||
Reported as: | |||||||||
Deferred revenues, current | $ | 52,563 | $ | 44,877 | $ | 37,957 | |||
Deferred revenues, non-current | 32,263 | 25,069 | 20,609 | ||||||
Total deferred revenues | $ | 84,826 | $ | 69,946 | $ | 58,566 | |||
Deferred cost of revenues: | |||||||||
Deferred cost of revenues, current | $ | — | $ | 4,421 | $ | 2,128 | |||
Deferred cost of revenues, non-current | 37,385 | 23,941 | 18,883 | ||||||
Total deferred revenues | $ | 37,385 | $ | 28,362 | $ | 21,011 | |||
F-82
Table of Contents
Property and equipment, net:
| As of October 31, | As of January 31, 2009 | |||||||||||
| (in thousands) | 2007 | 2008 | ||||||||||
| (unaudited) | ||||||||||||
Manufacturing and lab equipment | $ | 14,431 | $ | 17,389 | $ | 17,643 | ||||||
Computers, furniture and office equipment | 3,765 | 4,532 | 4,531 | |||||||||
Software | 4,107 | 4,608 | 4,488 | |||||||||
Leasehold improvements | 1,549 | 1,646 | 1,660 | |||||||||
Total | 23,852 | 28,175 | 28,322 | |||||||||
Accumulated depreciation and amortization | (13,850 | ) | (17,790 | ) | (18,779 | ) | ||||||
Property and equipment, net | $ | 10,002 | $ | 10,385 | $ | 9,543 | ||||||
The Company accounts for contractual obligations for restoration and refurbishment costs of leased properties in accordance with SFAS No. 143,Accounting for Asset Retirement Obligations(SFAS 143). SFAS 143 requires entities to capitalize the cost of the liability to long-lived assets and record the fair value of a liability for an asset retirement obligation when it is incurred. Long-lived assets are depreciated over the useful life of the related asset.
The estimated asset retirement obligation liability is accreted over time to its present value each period, and upon settlement of the liability, the Company may incur a gain or loss. Accretion expense associated with the asset retirement obligation was $26 thousand, $27 thousand, and $17 thousand in fiscal years 2006, 2007, and 2008, respectively. As of October 31, 2006, 2007, and 2008, the balance of the asset retirement obligation was $0.4 million, $0.3 million, and $0.3 million, respectively. There were no assets restricted for settlement of asset retirement obligation at October 31, 2006, 2007, and 2008.
In May 2007, the Company experienced damage to certain equipment with a net book value of $1.6 million from the malfunction of the building’s fire protection system. Accordingly, the Company wrote off the related equipment. In addition, the Company incurred costs of $0.2 million for related repairs and other incremental expenses. In fiscal year 2007, the Company received insurance proceeds totaling $3.8 million as reimbursement of the replacement cost of the damaged equipment and incremental expenses, and the proceeds were recorded as an offset to the related charges. Accordingly, a net gain from insurance proceeds of $2.0 million was recorded in loss from operations in the consolidated statements of operations for fiscal year 2007. In fiscal year 2008, additional insurance proceeds of $0.2 million were received and recorded as a gain in that period.
During fiscal year 2007, the Company recorded $0.4 million as losses on disposal of fixed assets, excluding charges associated with restructuring activities and the insured loss discussed above. See note 12 for additional information regarding restructuring charges.
Depreciation and amortization expense related to property and equipment was $2.0 million, $2.7 million, and $4.2 million for fiscal years 2006, 2007, and 2008, respectively.
F-83
Table of Contents
Other current liabilities:
| As of October 31, | As of January 31, 2009 | ||||||||
| (in thousands) | 2007 | 2008 | |||||||
| (unaudited) | |||||||||
Sales and other taxes | $ | 1,642 | $ | 1,571 | $ | 1,853 | |||
Restructuring charges | 2,136 | 1,834 | 3,590 | ||||||
Non-cancelable purchase commitment | 1,387 | 1,803 | 1,086 | ||||||
Other | 6,705 | 3,045 | 3,591 | ||||||
Total | $ | 11,870 | $ | 8,253 | $ | 10,120 | |||
Other long-term liabilities:
| As of October 31, | As of January 31, | ||||||||
| (in thousands) | 2007 | 2008 | 2009 | ||||||
| (unaudited) | |||||||||
Restructuring charges | $ | 2,136 | $ | 454 | $ | — | |||
Asset retirement obligations | 297 | 318 | 324 | ||||||
Deferred rent | 2,330 | 1,976 | 1,820 | ||||||
Dividends payable on preferred stock | 8,071 | 11,814 | 12,749 | ||||||
Total | $ | 12,834 | $ | 14,562 | $ | 14,893 | |||
3. Supplemental cash flow information
| Year ended October 31, | Three months ended January 31, | ||||||||||||||
| (in thousands) | 2006 | 2007 | 2008 | 2008 | 2009 | ||||||||||
| (unaudited) | |||||||||||||||
Cash paid during the year for | |||||||||||||||
Interest | $ | 2,004 | $ | 1,231 | $ | 377 | $ | 109 | $ | 63 | |||||
Income taxes | 187 | 255 | 363 | 110 | 45 | ||||||||||
Supplemental disclosure of non-cash investing and financing activities: | |||||||||||||||
Issuance of preferred stock warrants | 1,153 | 14,395 | 82 | — | — | ||||||||||
Issuance of common stock options in connection with acquisition of MetaNetworks | 302 | — | — | — | — | ||||||||||
Extension of preferred stock warrants | — | — | 1 | — | — | ||||||||||
Cashless exercise of warrants | — | — | 872 | 523 | — | ||||||||||
Accrued earn-out related to MetaNetworks acquisition | 260 | 160 | — | — | — | ||||||||||
Cumulative preferred dividends accrued during the period | 3,742 | 3,742 | 3,743 | 936 | 936 | ||||||||||
Deemed dividend on preferred stock | 70 | 4,029 | — | — | — | ||||||||||
Unrealized loss on available for sale short-term investments | 3 | — | — | — | — | ||||||||||
Purchase of property and equipment included in accounts payable and accrued liabilities at period end | 790 | 735 | 182 | 460 | 32 | ||||||||||
F-84
Table of Contents
4. Bank loans
During fiscal years 2005 and 2006, the Company entered into a loan agreement and several related amendments (the Amended Loan Agreement) with a United States commercial bank that provided the borrowing capacity under a secured revolving line of credit of $20.0 million, a Term Loan of $7.5 million, a Term Loan B of $5.0 million, and a Term Loan C of $10.0 million. The secured revolving line of credit is limited to a borrowing base computed primarily based on the value of the Company’s accounts receivables. Borrowings under the Amended Loan Agreement are secured by substantially all of the assets of the Company, including the Company’s intellectual property. In consideration for various amendments to the Amended Loan Agreement, the Company agreed to a $0.4 million success fee payable upon completion of an IPO or termination of the Amended Loan Agreement.
As additional consideration for the various amendments, the Company issued warrants to purchase 291,542 shares of Series F convertible preferred stock and 95,389 shares of Series E convertible preferred stock. The fair value of the warrants at the date of issuance was determined to be $0.2 million. See note 8 for additional information. The fair value of the warrants was amortized to interest expense over the term of the loan.
In fiscal year 2007, the Company repaid the remaining principal balance of all the term loans with proceeds from the issuance of Series F convertible stock and borrowed $5.0 million under the secured revolving line of credit, which remained outstanding as of October 31, 2007 and 2008.
The loan agreements, as amended, include certain covenants, including requirements to maintain unrestricted cash and cash equivalent balances, net of outstanding advances, of $22.5 million, which amount was amended in December 2008 to be $15.0 million. Borrowings under the secured line of credit bear interest at 1% above the prime interest rate, which was 4% at October 31, 2008. The Amended Loan Agreement expired on January 29, 2009, at which time the Company paid all outstanding borrowings and the success fee in full.
Commitment and success fees were capitalized as deferred financing costs and amortized over the term of the related debt using the straight-line method. Amortization of deferred financing costs of $0.4 million for each of fiscal years 2006, 2007 and 2008 was charged to interest expense. The deferred financing costs were fully amortized as of October 31, 2008. Interest expense related to the line of credit for fiscal years 2006, 2007 and 2008 was $2.1 million, $1.1 million and $0.3 million, respectively.
F-85
Table of Contents
5. Commitments and contingencies
Lease obligations
The Company has entered into various non-cancelable operating lease agreements for certain of its facilities throughout the world that expire between fiscal years 2009 and 2013. Future minimum lease payments under operating leases include facility lease agreements and rent of unoccupied facilities included in the Company’s restructuring accrual. See note 12 for disclosure of restructuring activities. The following table summarizes the Company’s operating lease obligations as of October 31, 2008:
(dollars in thousands) Years ending October 31, | Operating lease obligations | ||
2009 | $ | 4,306 | |
2010 | 2,624 | ||
2011 | 1,799 | ||
2012 | 1,799 | ||
2013 | 300 | ||
Future minimum lease payments | $ | 10,828 | |
Certain of the Company’s facility leases include rent escalation clauses and free rent provisions. The Company recognizes rent expense on a straight-line basis over the term of the lease and has accrued for rent expense incurred but not paid. Rent expense was approximately $2.5 million, $2.3 million, and $2.6 million for fiscal years 2006, 2007, and 2008, respectively. Sublease income was not significant in any period.
The lease agreement on the Company’s corporate headquarters requires the Company to maintain a letter of credit issued to the landlord of the facility. The letter of credit is subject to renewal annually until the lease expires. At October 31, 2008, the Company had a letter of credit of $1.6 million related to such lease that was collateralized with the letters of credit sublimit under the terms of Company’s loan agreement described in note 4. The letter of credit, which expires on December 31, 2012, will be reduced annually to no less than $0.5 million by July 1, 2010 or if and when the Company completes an IPO for not less than $150.0 million. In January 2009, the loan agreement expired and the Company collateralized the letter of credit with a $1.6 million certificate of deposit, which cash is restricted for use in operations.
Purchase commitments
The Company purchases product components from a variety of suppliers and outsources the production of its hardware to third-party contract manufacturers. During the normal course of business, in order to manage manufacturing lead times to meet product forecast and to help ensure adequate component supply, the Company has entered into agreements with its contract manufacturers and other component suppliers to procure inventory. The Company had $13.2 million in non-cancelable purchase commitments with its suppliers and manufacturers as of October 31, 2008. In addition, the Company recorded a liability for firm non-cancelable and unconditional purchase commitments with contract manufacturers for quantities in excess of the Company’s future demand forecasts. As of October 31, 2006, 2007, and 2008, such liability amounted to $0.2 million, $1.4 million, and $1.8 million, respectively. This amount was $1.1 million as of January 31, 2009. These amounts are included in other current liabilities in the consolidated balance sheets.
F-86
Table of Contents
The Company recorded receivables from its contract manufacturers for certain components purchased by the Company that were not directly sourced by the Company’s contractor manufacturers. Receivables from contract manufacturers amounted to $1.2 million, $0.7 million, and $0.6 million as of October 31, 2006, 2007, and 2008, respectively. These amounts were recorded as other accounts receivable in the consolidated balance sheets.
In addition to commitments with contract manufacturers and component suppliers, the Company has open purchase orders and contractual obligations associated with its ordinary course of doing business for which the Company has not received goods or services. The Company had $1.2 million in purchase commitments as of October 31, 2008.
Guarantees and indemnifications
FASB Interpretation No. 45,Guarantor’s Accounting and Disclosure Requirements for Guarantees, Including Indirect Guarantees of Indebtedness of Others (FIN 45), requires certain guarantees to be recorded at fair value and to disclose significant guarantees even when the likelihood of making any payments under guarantee is remote.
The Company indemnifies its directors, officers or key employees for certain events or occurrences, subject to certain limits, while the director, officer or key employee is or was serving at the Company’s request in such capacity. The maximum amount of potential future indemnification is unlimited, however, the Company has a director and officer insurance policy that limits its exposure and enables it to recover a portion of any future amounts paid. The Company is unable to reasonably estimate the maximum amount that could be payable under these arrangements since these obligations are not capped but are conditional to the unique facts and circumstances involved. Accordingly, the Company has not accrued any liabilities related to such agreements in its consolidated financial statements as of October 31, 2006, 2007, and 2008.
In the normal course of business, the Company indemnifies certain parties, including customers, certain business partners, vendors and lessors with regards to certain matters. Indemnification provisions include holding certain parties harmless against losses arising from intellectual property infringement, breach of contracts and other claims made against these parties. These indemnification provisions generally limit the scope of the available remedies consistent with customary commercial practices. Historically, payments made by the Company under these agreements have not been significant to the Company’s operating results, financial position, or cash flows.
In addition, the Company has agreed, under certain circumstances, to indemnify certain of the Company’s preferred stockholders and hold them harmless against any expenses, damages or any other amounts that a stockholder incurs as a result of any claims made against the stockholder in connection with any threatened, pending or other proceeding arising out of, or relating to claims that may be made in connection with a public offering of the Company���s stock.
Legal proceedings
The Company is currently a party to various legal proceedings, claims, disputes and litigation arising in the ordinary course of business. The Company has not currently determined that a loss from such matters is probable and, accordingly, no provision for any loss that ultimately occurs has been recorded in the accompanying consolidated financial statements. However, because of the nature and inherent uncertainties of litigation, should the outcome of these actions be unfavorable, the Company’s business, financial condition, results of operations or cash flows could be materially and adversely affected.
F-87
Table of Contents
Sales tax audit
In April 2007, the State of California Board of Equalization (BOE) initiated an audit of the Company’s sales/use tax returns for the calendar years 2003 through 2005, and as a result, the Company recorded a reserve of $0.6 million for estimated tax liabilities, including penalties and interest, which was included in other current accrued liabilities in the consolidated condensed balance sheets as of October 31, 2007. In July 2008, the BOE concluded its audit, the results of which reflect the BOE’s acceptance of the majority of the Company’s tax positions and refund claims submitted. The BOE issued a final tax and interest assessment of $40 thousand and $12 thousand, respectively, net of all refunds claimed and declined to assess penalties on the taxes due. The Company has accepted the audit findings and has notified the BOE that no appeals will be made at this time. As a result, in fiscal year 2008 the Company recorded a reduction to the related reserves of $0.5 million to reflect the settlement of this audit.
6. Convertible preferred stock
Under the Company’s Certificate of Incorporation, as amended, the Company, at October 31, 2008, is authorized to issue 345,000,000 shares of convertible preferred stock, which have been designated as Series A Convertible Preferred Stock (Series A), Series B Convertible Preferred Stock (Series B), Series B-1 Convertible Preferred Stock (Series B-1), Series B-2 Convertible Preferred Stock (Series B-2), Series C Convertible Preferred Stock (Series C), Series D Convertible Preferred Stock (Series D), Series E Convertible Preferred Stock (Series E), and Series F Convertible Preferred Stock (Series F). Convertible preferred stock consists of the following:
(in thousands, except price per share amounts) | As of October 31, 2007 and 2008 | |||||||||||||||
| Series | Period issued | Price per share | Preferred stock | Shares authorized | Shares outstanding | Liquidation value | ||||||||||
Series A | September 1999 | $ | 0.625 | $ | 11,459 | 18,544 | 18,384 | $ | 5,745 | |||||||
Series B | April 2000— August 2000 | 9.260 | 50,928 | 956 | 161 | 747 | ||||||||||
Series B-1 | May 2001— May 2002 | 6.080 | 83,901 | 14,000 | 13,842 | 42,080 | ||||||||||
Series B-2 | December 2002— November 2003 | 9.260 | — | 5,500 | 5,344 | 24,743 | ||||||||||
Series C | December 2002— December 2003 | 1.718 | 67,726 | 41,000 | 39,761 | 34,155 | ||||||||||
Series D | April 2004— June 2004 | 1.718 | 73,614 | 44,000 | 43,649 | 182,460 | ||||||||||
Series E | August 2005— September 2005 | 0.862 | 45,008 | 81,000 | 53,463 | 65,438 | ||||||||||
Series F | August 2006— March 2007 | 1.029 | 125,727 | 140,000 | 131,144 | 134,947 | ||||||||||
Total | $ | 458,363 | 345,000 | 305,748 | $ | 490,315 | ||||||||||
Adjustments | ||||||||||||||||
Fair value of Series B-2 issued as deemed dividend | $ | 8,754 | ||||||||||||||
Less: allocations for fair value of common stock warrants issued to Series C preferred stockholders | (5,055 | ) | ||||||||||||||
Less: allocations for fair value of Series E warrants issued to Series E preferred stockholders | (11,414 | ) | ||||||||||||||
Total preferred stock at October 31, 2007, and 2008 | $ | 450,648 | ||||||||||||||
F-88
Table of Contents
Between December 2002 and November 2003, the Company issued Series C to certain holders of Series B. As an incentive for the holders of Series B to participate in the Series C offering, the Company issued Series B-2 in exchange for the Series B held by these holders. The Company did not receive any cash proceeds for the issuance of Series B-2. Immediately after the closing of the Series C offering, the original conversion price of Series B-2 of $1.718 was lower than the conversion price of Series B of $8.642. Accordingly, the Company recorded a deemed dividend of $8.8 million in fiscal year 2003 that represented the Series B-2 fair market value in excess of the Series B fair market value on the date of issuance. The amount was recorded against additional paid-in capital and recognized immediately as the Series B-2 preferred stock is convertible at any time.
The significant rights and obligations of the Company’s convertible preferred stock are as follows:
Liquidation preference
In the event of any liquidation, dissolution or winding up of the Company, either voluntary or involuntary, the Company’s assets will be distributed in the following preference order. A liquidation, dissolution, or winding up of the Company shall include the acquisition of the Company by another entity by means of a transaction or series of related transactions including without limitation any reorganization, merger or consolidation that results in the transfer of 50% or more of the outstanding voting power of the Company or the sale of all or substantially all assets of the Company.
First preference. The holders of Series F will be entitled to receive $1.029 and any accrued and unpaid dividends for each outstanding share of Series F (as adjusted for any stock splits, stock dividends, combinations, subdivisions or recapitalizations with respect to such stock). If the Company has insufficient assets available for the full distribution to the holders of Series F as described above then the distribution of assets would be distributed on a pro-rata basis to the holders of the Series F stock.
Second preference. Upon completion of the distribution to the Series F stockholders, the holders of Series E will be entitled to receive $1.224 and any accrued and unpaid dividends for each outstanding share of Series E stock (as adjusted for any stock splits, stock dividends, combinations, subdivisions or recapitalizations with respect to such stock). If the Company has insufficient assets available for distribution to satisfy this second preference, then the remaining assets and funds available for distribution would be distributed on a pro-rata basis to the holders of the Series E stock.
Third preference. Upon completion of the distributions to the Series E and Series F stockholders, the holders of Series D will be entitled to receive $1.718 and any accrued and unpaid dividends for each outstanding share of Series D stock (as adjusted for any stock splits, stock dividends, combinations, subdivisions or recapitalizations with respect to such stock). If the Company has insufficient assets available for distribution to satisfy this third preference, then the remaining assets and funds available for distribution would be distributed on a pro-rata basis to the holders of the Series D stock.
Fourth preference. Upon completion of the distributions to the Series D, Series E and Series F stockholders, the holders of Series A will be entitled to receive $0.313 and any accrued and unpaid dividends for each outstanding share of Series A stock, the holders of Series B will be entitled to receive $4.630 and any accrued and unpaid dividends for each outstanding share of
F-89
Table of Contents
Series B stock, the holders of Series B-1 will be entitled to receive $3.04 and any accrued and unpaid dividends for each outstanding share of Series B-1 stock, the holders of Series B-2 will be entitled to receive $4.630 and any accrued and unpaid dividends for each outstanding share of Series B-2, the holders of Series C will be entitled to receive $0.859 and any accrued and unpaid dividends for each outstanding share of Series C, the holders of Series D will be entitled to receive $2.462 and any accrued and unpaid dividends for each outstanding share of Series D stock, each of the above as adjusted for any stock splits, stock dividends, combinations, subdivisions or recapitalizations with respect to such series of stock. If the Company has insufficient assets available for distribution to satisfy this fourth preference, then the remaining assets and funds available for distribution would be distributed on a pro-rata basis among the holders of Series A, Series B, Series B-1, Series B-2, Series C and Series D stock in proportion to the full preferential amount each such holder is otherwise entitled to receive.
Upon completion of the distributions required by the first, second, third and fourth preferences above, all of the remaining assets of the Company available for distribution will be distributed on a pro rata basis among the holders of Series A, Series B, Series B-1, Series B-2, Series C, Series D and common stock (assuming full conversion of all such preferred stock into common stock), up to a participation cap of $0.625 per share for Series A holders, $9.26 per share for Series B holders, $6.08 per share for Series B-1 holders, $9.26 per share for Series B-2 holders, $2.577 per share for Series C holders and $5.154 per share for Series D holders (including in each case any amounts paid pursuant to the third and fourth preferences above). Any remaining assets after the participation cap is reached would be distributed to the common stockholders.
Dividends
Holders of Series A, Series B, Series B-1, Series B-2, Series C, Series D and Series F are entitled to receive non-cumulative dividends at the per annum amount of $0.05, $0.74, $0.49, $0.74, $0.14, $0.14 and $0.08 per share, respectively, when, as and if declared by the Board of Directors. No dividends on preferred stock have been declared by the Board of Directors in any period.
Holders of Series E are entitled to receive cumulative dividends from the date of issuance of such shares at a per annum amount of $0.07 per share. For fiscal years 2006, 2007 and 2008, the Company recorded $3.7 million of dividends payable for Series E. Any unpaid dividends prior to a qualified public offering shall be paid, to the extent assets are available, either in cash or in common stock, as determined by the holders of a majority of the then outstanding Series E. Total cumulative unpaid dividends were $8.0 million and $11.8 million as of October 31, 2007 and 2008, respectively, and are included in other long-term liabilities in the consolidated balance sheets.
F-90
Table of Contents
Conversion
Each share of preferred stock is convertible at any time, at the option of the holder, into the number of fully paid and nonassessable shares of common stock that results from dividing the applicable original issue price per share by the applicable conversion price per share at the time of conversion. The following table summarizes the original issue price per share and the adjusted conversion price per share for each series of preferred stock as of October 31, 2008:
| Type of preferred stock | Original conversion price | Adjusted conversion price | ||||
Series A | $ | 0.625 | $ | 0.625 | ||
Series B | 9.260 | 4.039 | ||||
Series B-1 | 6.080 | 1.718 | ||||
Series B-2 | 9.260 | 1.718 | ||||
Series C | 1.718 | 1.718 | ||||
Series D | 1.718 | 0.792 | ||||
Series E | 0.862 | 0.862 | ||||
Series F | 1.029 | 0.966 | ||||
The original conversion price per share is subject to reduction upon the occurrence of certain triggering events as discussed in the anti-dilution provision section below.
Each share of preferred stock shall automatically convert into common stock at the conversion price at the time in effect, immediately upon the earlier of (1) sale of the Company’s common stock in a firm commitment underwritten public offering with aggregate gross offering price to the public of more than $40.0 million or (2) the date specified by written consent or agreement of (a) the holders of a majority of the then outstanding shares of preferred stock (voting together as a single class and on an as converted basis), (b) under certain circumstances, holders of at least 75% of the then outstanding Series D and (c) under certain circumstances, the holders of at least a majority of the then outstanding Series F.
Anti-dilution provisions
Certain holders of convertible preferred stock have anti-dilution protection rights. In fiscal year 2004, the applicable conversion price per share of Series B was reduced to $5.712 as a result of the Series C and Series D offerings and the Company recorded a deemed dividend of $48 thousand. In fiscal year 2005, the applicable conversion price per share of Series D was reduced to $0.792 as a result of the Series E offering and the Company recorded a deemed dividend of $22.3 million. In fiscal year 2006, the conversion price per share of Series B was further reduced to $4.708 as a result of the Series F offering and the Company recorded a deemed dividend of $0.1 million. In March 2007, the applicable conversion price per share of Series B was further reduced to $4.039 as a result of the Series F offering and the Company recorded a deemed dividend of $0.1 million. In fiscal year 2007, the conversion price per share of Series F was reduced to $0.966 as a result of the issuance of Series E warrants in March 2007 and the anti-dilution protection rights held by the holders of Series F. As a result, the Company recorded a deemed dividend of $4.0 million in fiscal year 2007. The deemed dividends were recorded as an immediate charge to additional paid-in capital and were valued using management’s estimated fair market value of common stock price at the date of issuance of preferred stock and the number of additional shares of common stock to be issued upon conversion of preferred stock per the revised conversion ratio as compared to the original conversion ratio.
F-91
Table of Contents
Voting rights
Shares of Series A, Series B, Series B-1, Series B-2, Series C, Series D, Series E and Series F have voting rights equal to the number of shares of common stock into which they are convertible and, except as set forth below, are generally voted together as one class with the common stock.
The holders of Series A are entitled to elect two members of the Board of Directors at each annual meeting or special election of directors. The holders of Series C are entitled to elect one member of the Board of Directors at each annual meeting or special election of directors. The holders of Series D are entitled to elect one member of the Board of Directors at each annual meeting or special election of directors. The holders of common stock (voting as a separate class) are entitled to elect two members of the Board of Directors at each annual meeting or special election of directors. Any remaining members of the Board of Directors are elected by the holders of common stock and preferred stock voting as a single class and on an as-converted basis.
Protective provisions
The Company must obtain the approval of the holders of a majority of the preferred stock (with the Series A, Series B, Series B-1, Series B-2, Series C, Series D, Series E and Series F voting together as a single class and on an as-converted basis) before taking a number of actions, including consummating a liquidation or dissolution of the Company, selling substantially all assets of the Company, changing the size of the board of directors, authorizing or issuing any other stock in the future with senior or pari passu rights, changing the rights, preferences or privileges of preferred stock and declaring or paying any dividends.
The Company must obtain the approval of the holders of at least 75% of the Series D before authorizing or issuing any other stock in the future that is senior to or on parity with the Series D, or amending or waiving any provisions in the Certificate of Incorporation, as amended, relating to the rights, preferences or privileges of the Series D.
7. Common stock
As of October 31, 2008, common stock reserved for future issuance was as follows:
| (in thousands) | Number of shares | |
| Common stock reserved for issuance | ||
1999 Stock Plan | ||
Outstanding stock options | 36,088 | |
Reserved for future option grants | 34,473 | |
2007 Long-Term Equity Plan | ||
Outstanding stock options | 6,292 | |
Reserved for future option grants | 7,208 | |
2007 Option Exchange Plan | ||
Outstanding stock options | 69,375 | |
Reserved for future option grants | 11,833 | |
Total common stock reserved for stock options | 165,269 | |
Warrants to purchase convertible preferred stock (as converted) | 34,999 | |
Warrants to purchase common stock | 4,588 | |
F-92
Table of Contents
| (in thousands) | Number of shares | |
| Common stock reserved for issuance | ||
Convertible preferred stock (as converted) | ||
Series A | 18,384 | |
Series B | 370 | |
Series B-1 | 48,987 | |
Series B-2 | 28,805 | |
Series C | 39,761 | |
Series D | 94,730 | |
Series E | 53,463 | |
Series F | 139,760 | |
Total convertible preferred stock | 424,260 | |
Total common stock reserved for future issuances | 629,116 | |
In 1999, the Company sold 12,800,000 shares of common stock to its founders at a per share price of $0.000025 with vesting terms of four years. Shares sold to founders were subject to repurchase by the Company until fully vested. As of October 31, 2006, 2007, and 2008, the Company had repurchased and held as treasury stock 4,044,246 shares of common stock from the founders and the remaining 8,755,754 shares of common stock were outstanding and fully vested.
The Company’s 1999 Stock Plan permits the exercise of unvested options if so granted by the Company’s board of directors, and certain common stock option holders have the right to exercise unvested options, subject to repurchase rights held by the Company in the event of a voluntary or involuntary termination of employment of the stockholder. As of October 31, 2006, 2007, and 2008, there were 17,667 shares, 6,667 shares, and 1,667 shares of common stock, respectively, subject to repurchase by the Company at the original exercise price of the common stock.
8. Warrants
A summary of shares subject to warrants outstanding and related activity is presented below:
(in thousands, except price and term | Common stock warrants | Series A preferred stock warrants | Series B preferred stock warrants | Series B-1 preferred stock warrants | Series C preferred stock warrants | Series D preferred stock warrants | Series E preferred stock warrants | Series F preferred stock warrants | Total | ||||||||||||||||||||||
Outstanding as of November 1, 2005 | 19,466 | 160 | 118 | 123 | 241 | 349 | — | — | 20,457 | ||||||||||||||||||||||
Granted | — | — | — | — | — | — | 711 | 1,263 | 1,974 | ||||||||||||||||||||||
Exercised | (47 | ) | — | — | — | — | — | — | — | (47 | ) | ||||||||||||||||||||
Expired | — | — | (40 | ) | — | — | — | — | — | (40 | ) | ||||||||||||||||||||
Outstanding as of October 31, 2006 | 19,419 | 160 | 78 | 123 | 241 | 349 | 711 | 1,263 | 22,344 | ||||||||||||||||||||||
Granted | — | — | — | — | — | — | 26,827 | 4,084 | 30,911 | ||||||||||||||||||||||
Outstanding as of October 31, 2007 | 19,419 | 160 | 78 | 123 | 241 | 349 | 27,538 | 5,347 | 53,255 | ||||||||||||||||||||||
Granted | — | — | — | — | 231 | 349 | — | — | 580 | ||||||||||||||||||||||
Exercised | (8,663 | ) | — | — | — | — | — | — | — | (8,663 | ) | ||||||||||||||||||||
Expired | (6,168 | ) | — | — | — | (241 | ) | (349 | ) | — | — | (6,758 | ) | ||||||||||||||||||
Outstanding as of October 31, 2008 | 4,588 | 160 | 78 | 123 | 231 | 349 | 27,538 | 5,347 | 38,414 | ||||||||||||||||||||||
Weighted average exercise price | $ | 0.500 | $ | 0.625 | $ | 9.260 | $ | 6.080 | $ | 1.718 | $ | 1.718 | $ | 0.862 | $ | 1.029 | |||||||||||||||
Weighted average remaining contractual term in years | 0.09 | 0.92 | 0.92 | 0.92 | 0.54 | 0.54 | 3.36 | 5.07 | |||||||||||||||||||||||
F-93
Table of Contents
Warrants to investors
Between December 2002 and December 2003, the Company completed a private placement to issue 39,761,309 shares of Series C at $1.718 per share for $67.7 million, net of issuance costs of $0.6 million. Investors in the Company’s Series C offering also received warrants to purchase common stock. In fiscal year 2003, the Company issued warrants to purchase 14,033,557 shares of common stock at an exercise price of $0.50 per share. In fiscal year 2004, the Company issued warrants to purchase 4,510,550 shares of common stock at an exercise price of $0.50 per share. The relative fair value of the warrants was determined to be $3.9 million and $1.2 million for fiscal years 2003 and 2004, respectively. Such amounts were recorded as a reduction to net proceeds from the Series C offering.
In March 2007, the Company issued warrants to purchase 26,731,170 shares of Series E at an exercise price of $0.862 per share to holders of Series E pursuant to a provision of a Series E stock agreement. The fair value of the warrants was determined to be $11.4 million and was recorded as an issuance cost for the Series E offering.
In September 2008, the Company issued warrants to purchase 230,843 and 349,243 shares of Series C and D, respectively, at an exercise price of $1.718 per share to certain preferred stockholders whose warrants had expired in May 2008. The fair value of the warrants was determined to be $82 thousand and was recorded as a deemed dividend.
Warrants for service
In December 2003, the Company issued warrants to purchase 10,000 shares of Series C at an exercise price of $1.718 per share to third parties in connection with recruiting services. The fair value of the warrants was determined to be $11 thousand and was charged to general and administrative expense in the fiscal year 2004.
In November 2005, the Company issued a warrant to purchase 15,000 shares of Series E at an exercise price of $0.862 per share to a third party in connection with recruiting service provided in fiscal 2004. The fair value of the warrants was determined to be $5 thousand and was charged to sales and marketing expenses in the fiscal year 2004.
Warrants for equity financing
In May 2004, the Company issued a warrant to purchase 138,506 shares of common stock at an exercise price of $0.50 per share to an affiliate of a preferred stockholder who assisted with the private placement of Series D. The fair value of the warrants was determined to be $41 thousand and was recorded as an issuance cost for the Series D offering.
In May 2004, the Company issued a warrant to purchase 230,843 shares of Series C at an exercise price of $1.718 per share to an affiliate of a preferred stockholder who assisted with the private placement funding of Series D. The fair value of the warrant was determined to be $0.2 million and was recorded as an issuance cost for the Series D offering.
In May 2004, the Company issued a warrant to purchase 349,243 shares of Series D at an exercise price of $1.718 per share to an affiliate of a preferred stockholder who assisted with the private placement of Series D. The fair value of the warrant was determined to be $0.4 million and was recorded as an issuance cost for the Series D offering.
In November 2005, the Company issued a warrant to purchase 696,056 shares of Series E at an exercise price of $0.862 per share to an affiliate of a preferred stockholder who assisted with the
F-94
Table of Contents
private placement of Series E. The fair value of the warrant was determined to be $0.2 million and was recorded as an issuance cost for the Series E offering.
In August and September 2006, the Company issued warrants to purchase 971,328 shares of Series F at an exercise price of $1.029 per share to an affiliate of a preferred stockholder who assisted with the private placement of Series F. The fair value of the warrant was determined to be $0.7 million and was recorded as an issuance cost for the Series F offering.
From November 2006 through March 2007, the Company issued warrants to purchase 4,083,713 shares of Series F at an exercise price of $1.029 per share to an affiliate of a preferred stockholder who assisted with the private placement of Series F. The fair value of the warrants was determined to be $3.0 million and was recorded as an issuance cost for the Series F offering.
Warrants for debt financing
As of October 31, 2008, a warrant to purchase 160,000 shares of Series A at an exercise price of $0.625 per share remained outstanding. The warrant was issued in October 1999 in connection with an equipment lease agreement. The warrants expired in November 2005 and the lease agreement expired in December 2006. The fair value of the warrants of $0.1 million was amortized to interest expense over the term of the loan. In November 2005, September 2006, September 2007 and September 2008, the Company extended the expiration date of the warrants to September 2006, September 2007, September 2008 and September 2009, respectively. The Company recorded charges totaling $69 thousand as a result of the amendments.
As of October 31, 2008, warrants to purchase 77,755 shares of Series B at an exercise price of $9.26 per share remained outstanding. The warrants were issued in August 2001 in connection with the equipment lease agreement. The warrants expired in August 2006 and the lease agreement expired in December 2006. The fair value of the warrants of $0.5 million was amortized to interest expense over the term of the loan. In September 2006, September 2007 and September 2008, the Company amended the warrant agreement to extend the expiration date to September 2007, September 2008 and September 2009, respectively. The charges the Company recorded as a result of the extensions were not significant.
As of October 31, 2008, warrants to purchase 123,355 shares of Series B-1 at an exercise price of $6.08 per share remained outstanding. The warrants were issued in September 2001 in connection with the equipment lease agreement. The warrants expired in September 2008 and the lease agreement expired in December 2006. The fair value of the warrants of $0.6 million was amortized to interest expense over the term of the loans. In September 2008, the Company amended the warrant agreement to extend the expiration date to September 2009. The charges the Company recorded as a result of the extensions were not significant.
In November 2006, the Company issued a warrant to purchase 95,389 shares of Series E at an exercise price of $0.862 per share, which expires in November 2013, in connection with an amendment to its bank loan agreements. See Note 4 for detail related to the loan agreement. The fair value of the warrant was determined to be $0.1 million and was recorded as a deferred financing charge to be amortized as interest expense over the term of the loans.
In June 2006, the Company issued warrants to purchase 291,542 shares of Series F at an exercise price of $1.029 per share, which expire in June 2013, in connection with bank loans. See Note 4 for detail related to the loan arrangement. The fair value of the warrant was determined to be $0.2 million and was recorded as a deferred financing charge to be amortized as interest expense over the term of the loans.
F-95
Table of Contents
In October 2003, warrants to purchase 783,302 shares of common stock at an exercise price of $0.01 per share were issued in connection with the equipment lease agreement. The fair value of the warrants of $0.3 million was amortized to interest expense over the term of the loan. In October 2008, the warrant holders completed a cashless exercise of such warrants and were issued 764,651 shares of common stock, based on the Company’s deemed fair value of $0.42 per share on the date of exercise. The common stock was considered to have a value of $0.01 per share for financial reporting purposes, which, had such value be used in determining the number of net shares to issued, would have resulted in no shares of common stock being issued upon exercise. The fair value of the common shares for financial statement reporting purposes is approximately $8 thousand and is not considered to be significant.
In addition to the transaction discussed above, in fiscal 2008 several shareholders of the Company completed a cashless exercise of a total of 1,917,663 common stock warrants, having an exercise price of $0.50 per warrant, and were issued 174,333 shares of common stock valued at $0.55.
In fiscal 2008, the Company issued 5,961,781 shares of common stock upon the exercise of warrants in exchange for cash proceeds of $3.0 million.
The following table summarizes assumptions used to estimate the fair value of the warrants using the Black-Scholes model:
| Type of warrant | Contractual term | Volatility | Risk-free rate | Dividend rate | ||||
| (in years) | ||||||||
Common Stock | 5 | 80-110% | 2.87-3.83% | 0.00% | ||||
Series A | 6 | 50 | 6.08 | 0.00 | ||||
Series B | 6 | 80 | 6.00 | 0.00 | ||||
Series B-1 | 7 | 80 | 4.51 | 0.00 | ||||
Series C | 0.7-4 | 65-86 | 1.03-3.45 | 0.00 | ||||
Series D | 0.7-4 | 65-80 | 1.03-3.45 | 0.00 | ||||
Series E | 4-7 | 56-73 | 4.34-4.52 | 8.12 | ||||
Series F | 7 | 65-75 | 4.45-5.04 | 0.00 | ||||
9. Stock-based compensation
Stock incentive plans
Stock incentive plan program description
As of October 31, 2008, the Company maintained three stock incentive plans: the 1999 Stock Plan (the 1999 Plan), 2007 Long-Term Equity Plan (the 2007 Plan) and the 2007 Option Exchange Plan (the Exchange Plan). Share-based awards are long-term retention programs that are intended to attract, retain, and provide incentives for employees, officers and directors, and to align stockholder and employee interests. The Company’s stock incentive plans are summarized as follows:
1999 Stock plan
In September 1999, the Company adopted the 1999 Plan. The 1999 Plan is available to all employees of the Company. Only employees are eligible for the grant of incentive stock options. Exercise prices must not be less than 100% of the fair market value for incentive stock options
F-96
Table of Contents
and not less than 85% of the fair market value on the date of grant for nonstatutory stock options on the date of grant. These options generally vest over four years and expire ten years from the date of grant. For holders of 10% or more of the total combined voting power of all classes of the Company’s stock, options may not be granted at less than 110% of the fair market value on the date of grant, and, in cases of an incentive stock option grant, the option term may not exceed five years. At the discretion of the board of directors, options granted under the 1999 Plan can be immediately exercised, but all shares purchased upon exercise of options are subject to repurchase by the Company until vested. Since inception through October 31, 2008, the Company authorized 95,250,652 shares of common stock for issuance under the 1999 Plan.
2007 Long-Term Equity Plan
In April 2007, the Company adopted the 2007 Plan. The 2007 Plan provides both for the direct award or sale of shares and for the grant of options to purchase shares. Under the 2007 Plan, the Company may grant options to purchase shares of its common stock to employees, directors, and consultants at prices not less than the fair market value on the date of grant. These options generally vest over four years, but may be subject to additional vesting conditions as determined by the board of directors, as was the case with performance-based options granted under the 2007 Plan as described below. Options granted under the 2007 Plan expire no later than ten years from the date of grant. For holders of 10% or more of the total combined voting power of all classes of the Company’s stock, incentive stock options may not be granted at less than 110% of the fair market value on the date of grant, and the option term may not exceed five years. The Company authorized 13,500,000 shares of common stock for issuance under the 2007 Plan.
2007 Option Exchange Plan
In April 2007, the Company adopted the Exchange Plan. The Exchange Plan provides both for the direct award or sale of shares and for the grant of options to purchase shares. Under the Exchange Plan, the Company may grant options to purchase shares of its common stock to employees, directors, and consultants at prices not less than the fair market value on the date of grant. These options vest under terms determined by the board of directors, but at no less than 20% per year over a five year period. Options granted under the Exchange Plan generally expire eight years from the date of grant. For holders of 10% or more of the total combined voting power of all classes of the Company’s stock, incentive stock options may not be granted at less than 110% of the fair market value on the date of grant, and, in case of an incentive stock option grant, the option term may not exceed five years. In May 2007, 78,318,084 options were granted under the Exchange Plan in connection with the repricing of options discussed in further detail below. The Company authorized 81,500,000 shares of common stock for issuance under the Exchange Plan.
F-97
Table of Contents
The following table summarizes the Company’s stock option plans:
| (in thousands, except price and term amounts) | Shares available | Shares subject to options | Weighted- average exercise price | Weighted average remaining contractual term (years) | Aggregate intrinsic value | |||||||||
Outstanding as of November 1, 2005 | 8,002 | 65,905 | $ | 0.46 | ||||||||||
Additional shares reserved | 6,000 | — | ||||||||||||
Granted | (15,033 | ) | 15,033 | 0.86 | ||||||||||
Exercised | — | (377 | ) | 0.43 | $ | 104 | ||||||||
Canceled | 5,259 | (5,259 | ) | 0.48 | ||||||||||
Repurchased | 13 | — | ||||||||||||
Outstanding as of October 31, 2006 | 4,241 | 75,302 | 0.54 | |||||||||||
Additional shares reserved | 95,000 | |||||||||||||
Granted | (107,474 | ) | 107,474 | 0.47 | ||||||||||
Exercised | — | (96 | ) | 0.33 | 32 | |||||||||
Canceled | 56,375 | (56,375 | ) | 0.64 | ||||||||||
Repurchased | 5 | — | ||||||||||||
Outstanding as of October 31, 2007 | 48,147 | 126,305 | 0.44 | |||||||||||
Granted | (12,149 | ) | 12,149 | 0.42 | ||||||||||
Exercised | — | (9,183 | ) | 0.43 | 733 | |||||||||
Canceled | 17,516 | (17,516 | ) | 0.47 | ||||||||||
Outstanding as of October 31, 2008 | 53,514 | 111,755 | 0.43 | 5.13 | — | |||||||||
Vested and expected to vest in the future as of October 31, 2008 | 85,017 | 0.43 | 4.84 | — | ||||||||||
Exercisable as of October 31, 2008 | 71,130 | 0.42 | 4.58 | — | ||||||||||
Outstanding as of October 31, 2008 | 53,514 | 111,755 | 0.43 | 5.13 | — | |||||||||
Granted* | (14,877 | ) | 14,877 | 0.01 | ||||||||||
Exercised* | 0 | 0 | — | |||||||||||
Canceled* | 7,357 | (7,357 | ) | 0.41 | ||||||||||
Outstanding as of January 31, 2009* | 45,994 | 119,275 | 0.38 | |||||||||||
| * | unaudited |
Aggregate intrinsic value was calculated as the difference between the exercise price of the stock options and the fair market value of the underlying common stock at the date of exercise or as of the balance sheet date.
F-98
Table of Contents
The following table summarizes information about options outstanding as of October 31, 2008:
| (in thousands, except price and term amounts) | Shares subject to options outstanding | Options vested and exercisable | ||||||||||
| Exercise price | Number outstanding | Weighted average remaining contractual life (years) | Weighted average exercise price | Number of | Weighted average exercise price | |||||||
$0.06 | 26 | 0.4 | $ | 0.06 | 26 | $ | 0.06 | |||||
0.32 | 18,913 | 4.4 | 0.32 | 18,617 | 0.32 | |||||||
0.33 | 722 | 5.2 | 0.33 | 605 | 0.33 | |||||||
0.42 | 10,530 | 7.2 | 0.42 | 1,813 | 0.42 | |||||||
0.46 | 81,440 | 5.0 | 0.46 | 49,945 | 0.46 | |||||||
0.50 | 50 | 4.9 | 0.50 | 50 | 0.50 | |||||||
0.79 | 25 | 7.2 | 0.79 | 25 | 0.79 | |||||||
0.95 | 30 | 7.9 | 0.95 | 30 | 0.95 | |||||||
1.25 | 19 | 3.8 | 1.25 | 19 | 1.25 | |||||||
Total | 111,755 | 5.1 | 0.43 | 71,130 | 0.42 | |||||||
Valuation of stock-based awards
The Company elected to adopt the provisions of SFAS No. 123R effective in fiscal year 2002. The Company uses the Black-Scholes model, single-option approach to determine the fair value of stock options. Compensation expense for all expected-to-vest stock-based awards is recognized using the straight-line attribution method provided that the amount of compensation cost recognized at any date is no less than the portion of the grant-date value of the award that is vested at that date. The determination of the fair value of stock-based payment awards on the date of grant using the option-pricing model is affected by the volatilities of a peer group of companies based on industry, stage of life cycle, size and financial leverage, actual and projected employee stock option exercise behaviors, risk-free interest rate and expected dividends.
The Company’s expected volatility is derived from a blend of historical and implied volatilities of several comparable companies within the technology sector. Each company’s historical and implied volatility is weighted and combined to produce a single volatility factor used by the Company. The Company’s expected term is based on exercise patterns of several comparable companies within the technology sector with similar options. Risk-free interest rate is based on the yield available on U.S. Treasury zero-coupon issues with remaining terms similar to the expected term on the stock options. The Company does not anticipate paying any cash dividends on common stock in the foreseeable future and therefore the Company uses an expected dividend yield of zero in the option-pricing model. The following table summarizes assumptions used in the calculation of fair value of stock options granted in each of the respective periods:
| Year ended October 31, | |||||||||
| 2006 | 2007 | 2008 | |||||||
Expected stock volatility | 61.6-70.2% | 49.6-58.5% | 53.7% | ||||||
Weighted-average volatility | 65.4 | 52.3 | 53.7 | ||||||
Expected dividends | 0.0 | 0.0 | 0.0 | ||||||
Risk-free rate | 4.2-4.9 | 4.1-5.8 | 3.1 | ||||||
Expected term (in years) | 5.5 | 4.8- 5.8 | 4.6 | ||||||
Weighted-average grant date fair value | $ | 0.44 | $ | 0.23 | $ | 0.20 | |||
F-99
Table of Contents
The total fair value of options that vested during fiscal years 2006, 2007, and 2008 was $6.3 million, $8.8 million, and $6.9 million, respectively. As of October 31, 2008, there was $4.2 million of unrecognized stock-based compensation cost, adjusted for estimated forfeitures, related to non-vested stock options, which is expected to be recognized over 2.4 years on a weighted average basis.
Stock-based compensation expense:
The following table summarizes the effects of stock-based compensation related to stock-based awards to employees and non-employees, including transactions discussed below, on the Company’s consolidated balance sheets and statements of operations (in thousands):
| Year ended October 31, | Three months ended January 31, | ||||||||||||||||||
| 2006 | 2007 | 2008 | 2008 | 2009 | |||||||||||||||
| (unaudited) | |||||||||||||||||||
Stock-based compensation effects in loss before income taxes | |||||||||||||||||||
Cost of goods sold | $ | 378 | $ | 922 | $ | 724 | $ | 196 | $ | 126 | |||||||||
Research and development | 2,597 | 3,133 | 2,142 | 683 | 365 | ||||||||||||||
Sales and marketing | 1,355 | 2,134 | 1,953 | 939 | 335 | ||||||||||||||
General and administrative | 2,629 | 2,066 | 2,136 | 554 | 299 | ||||||||||||||
| 6,959 | 8,255 | 6,955 | 2,372 | 1,125 | |||||||||||||||
Amounts capitalized as inventory, net | 42 | 115 | (161 | ) | (134 | ) | 21 | ||||||||||||
Amounts capitalized as deferred cost of revenues, net | 129 | (254 | ) | (10 | ) | 107 | (38 | ) | |||||||||||
| 171 | (139 | ) | (171 | ) | (27 | ) | (17 | ) | |||||||||||
Total stock-based compensation(1)(2) | $ | 7,130 | $ | 8,116 | $ | 6,784 | $ | 2,345 | $ | 1,108 | |||||||||
| (1) | Share-based compensation expense of $0.3 million related to the acquisition of MetaNetworks in fiscal year 2006 is disclosed in note 2 and is not included in the above table. |
| (2) | No income tax benefit for stock-based compensation arrangements was recognized for fiscal years 2006, 2007, and 2008. |
Stock-based compensation capitalized in assets in the consolidated balance sheets consisted of the following:
| As of October 31, | As of January 31, | |||||||||||
| (in thousands) | 2007 | 2008 | 2008 | 2009 | ||||||||
| (unaudited) | ||||||||||||
Inventory | $ | 193 | $ | 32 | $ | 59 | $ | 53 | ||||
Deferred cost of revenues | 102 | 91 | 209 | 53 | ||||||||
Total | $ | 295 | $ | 123 | $ | 268 | $ | 106 | ||||
Repricing and exchange of stock options
In May 2007, the Company’s board of directors approved the exchange of certain stock options. The exchange offer provided for the cancellation of outstanding stock options with an exercise price greater than $0.46 per share, which was determined by the Company’s board of directors to be the fair market value of the Company’s common stock on the date of the repricing, in
F-100
Table of Contents
exchange for (1) a one-for-one grant of a new option with the same vesting start date and schedule as the existing option but which will be first exercisable on October 31, 2007 and (2) a grant of a new option to vest 1/48th per month starting April 25, 2007 and to be first exercisable on October 31, 2007. The options granted under the exchange program have a term of eight years. This exchange applied to all eligible outstanding options under the 1999 Plan as elected by the Company’s active employees. As a result, 29,038,694 vested options and 13,487,340 unvested options having weighted average original exercise prices of $0.625 and $0.793, respectively, were cancelled under the 1999 Plan and a total of 78,318,084 new grants were issued at an exercise price of $0.46 per share under the Exchange Plan to replace the cancelled options. The Company accounted for the repricing and cancellation transactions as a modification in accordance with SFAS No. 123R and recorded any incremental fair value related to vested awards as compensation expense on the date of modification. The weighted average fair value of new stock option grants was $0.24 per share. In accordance with SFAS No. 123R, the Company will record the incremental fair value related to the unvested awards, together with unamortized stock-based compensation expense associated with the unvested awards, over the remaining requisite service period of the option holders. In connection with the repricing, the Company recorded stock-based compensation expense of $0.5 million in fiscal 2007.
SEC Rule 701 modifications of stock option terms for former employees
The Company has determined that offers and sales of securities transacted in reliance on Rule 701 under the Securities Act of 1933 have exceeded the initial $5.0 million sales limitation. As a result, the Company was required to meet certain disclosure obligations. Until the Company can meet these disclosure obligations, the Company cannot offer or sell securities in reliance on Rule 701. As a result, in December 2006, the board of directors authorized the extension of the post-termination exercise period in which stock options may be exercised for employees who have left or who are leaving the Company’s employment. This authorized extension was retrospectively applied to former employees’ stock options beginning on July 28, 2006. In fiscal year 2007, the Company offered to extend the exercise period of options to purchase 202,790 and 4,154,838 shares of common stock to March 15, 2007 and December 31, 2007, respectively. As a result of the modifications of stock options, the Company recorded stock-based compensation of $0.6 million based on the incremental fair value of the stock options on the date of the modification.
In fiscal year 2008, the Company offered to extend the exercise period of options to purchase 6,876,113 shares of common stock to July 31, 2008 and options to purchase 5,387,356 shares of common stock to June 3, 2008, and accordingly recorded stock-based compensation of $1.2 million based on the incremental fair value of the stock options on the date of the modification.
Modifications of stock option terms for former officers
In December 2006, in connection with a termination agreement with another former officer, the Company accelerated the vesting of options to purchase 487,275 shares of common stock at exercise prices ranging from $0.32 and $0.50 per share and extended the exercise period of options to purchase 2,824,100 shares of common stock to December 31, 2007. As a result of the modification of stock options, the Company recorded a stock-based compensation charge of $0.3 million based on the fair value of the Company’s common stock on the date of the modification. In fiscal 2008, the exercise period of these options was further extended to June 3, 2008 in connection with the modification of option terms related to SEC Rule 701 restrictions.
F-101
Table of Contents
In May 2007, in connection with termination agreements with another former officer, the Company accelerated the vesting of options to purchase 472,671 shares of common stock at exercise prices ranging from $0.32 and $0.50 per share and extended the exercise period of options to purchase 2,307,989 shares of common stock to June 30, 2008. As of result of the modification of stock options, the Company recorded a stock-based compensation charge of $0.1 million based on the fair value of the Company’s common stock on the date of the modification.
Performance-based options
Effective May 15, 2007, the Company granted new awards of 8,750,000 performance-based non-statutory common stock options (performance options) to certain of its executive officers. The exercise price of the options is $0.46 per share. The performance options will vest only if certain specific milestones set by the board of directors are achieved and requires that the officer remain an employee of the Company through the vesting date. Upon achievement of the performance milestones, the options will vest monthly over a period of three years. The vesting of the performance options are subject to acceleration upon certain events as specified in the option agreements and expire eight years from the date of grant. Effective October 31, 2007, 7,050,000 of the performance options were cancelled due to failure to achieve certain of the milestones. However, it was determined that it was probable that one of the performance milestones would be achieved. Therefore, it was estimated that all of the remaining 1,700,000 performance options would ultimately vest. For performance options, compensation expense is recorded when the achievement of performance milestones is considered probable, at which time the fair value of the grant is amortized over the vesting period, net of estimated forfeitures. Accordingly, the Company recognized compensation expense of $0.1 million in both of fiscal years 2007 and 2008 related to those performance options it determined were probable of vesting.
Notes receivable from issuance of common stock
During fiscal year 2000 and 2001, the Company issued notes receivable from officers and other employees who early exercised stock options. The full recourse notes receivables bear interest ranging from 4.77% to 6.62% and are partially secured by the underlying shares of common stock. Principal and accrued interest amounts are due the earlier of five years from the anniversary of the notes or upon termination.
In April 2007, with board of directors’ approval, the Company offered current employees with outstanding loans the option to return to the Company all shares pledged to the loans. The fair market value of the 606,000 pledged shares of common stock was determined to be $0.3 million and was applied to reduce the amount due on the loans. The remaining outstanding loan balances, including accrued interest, totaling $0.7 million were forgiven by the Company in exchange for employees’ continuing employment for one year. The Company reimbursed employees for the payroll tax liability due on the forgiveness of the loans in the amount of $0.6 million in fiscal year 2007. The payroll tax expense was amortized over the one year employment commitments.
During fiscal year 2008, notes receivable from former employees became uncollectible and the 309,416 underlying pledged shares were released to the respective former employees. Accordingly, charges for the principal balance and accrued interest totaling $0.4 million were charged to stock-based compensation.
F-102
Table of Contents
As of October 31, 2006, 2007, and 2008, notes receivable totaling $1.3 million, $0.5 million and $0.3 million, respectively, as well as accrued interest of $0.6 million, $0.3 million and $0.2 million, respectively, remain outstanding and were secured by 1,174,416, 547,791, and 208,000 shares of common stock, respectively.
10. Employee benefit plan
The Company sponsors a qualified 401(k) defined contribution plan covering all eligible employees. Participants may contribute up to 75% of their annual compensation to the plan as determined by the Company, limited to a maximum annual amount set by the Internal Revenue Service. The Company may make a basic discretionary matching contribution on behalf of each participant in an amount equal to the percentage declared for the contribution period, if any, by a board of directors resolution. There were no employer contributions under this plan for fiscal years 2006, 2007, and 2008.
11. Income taxes
The provision for income taxes consists of the following:
| (in thousands) | Year ended October 31, | |||||||||
| 2006 | 2007 | 2008 | ||||||||
Current | ||||||||||
Federal | $ | — | $ | — | $ | — | ||||
State | 16 | 12 | 9 | |||||||
Foreign | 152 | 385 | 368 | |||||||
Total current | 168 | 397 | 377 | |||||||
Deferred | ||||||||||
Foreign | — | — | (91 | ) | ||||||
Total deferred | — | — | (91 | ) | ||||||
Provision for income taxes | $ | 168 | $ | 397 | $ | 286 | ||||
Loss before income taxes consists of the following:
| (in thousands) | Year ended October 31, | |||||||||||
| 2006 | 2007 | 2008 | ||||||||||
Domestic | $ | (74,092 | ) | $ | (13,302 | ) | $ | (25,518 | ) | |||
Foreign, net | (1,466 | ) | (2,043 | ) | (11,063 | ) | ||||||
Total | $ | (75,558 | ) | $ | (15,345 | ) | $ | (36,581 | ) | |||
The following table represents a reconciliation of the statutory federal income tax rate and the effective tax rate as a percentage of loss before income taxes:
| Year ended October 31, | |||||||||
| 2006 | 2007 | 2008 | |||||||
Tax at statutory rate | (35.00 | )% | (35.00 | )% | (35.00 | )% | |||
State income taxes, net of federal effect | 0.02 | 0.08 | 0.02 | ||||||
Nondeductible expenses | 0.13 | 0.88 | 0.53 | ||||||
Stock-based compensation | 3.22 | 10.27 | 2.50 | ||||||
Effect of differences in foreign tax rates | (0.07 | ) | 0.35 | 7.71 | |||||
Losses not benefited | 31.92 | 26.01 | 25.02 | ||||||
Total | 0.22 | % | 2.59 | % | 0.78 | % | |||
F-103
Table of Contents
Deferred income taxes reflect the tax effects of temporary differences between the carrying amount of assets and liabilities for financial reporting purposes and the amounts used for income tax purposes, as well as net operating loss and tax credit carryforwards. A valuation allowance has been established to fully reserve these deferred tax assets due to the uncertainty regarding their realization in the future.
The significant components of the deferred tax assets and liabilities are as follows:
| As of October 31, | ||||||||
| (in thousands) | 2007 | 2008 | ||||||
Deferred tax assets | ||||||||
Timing differences not currently deductible | $ | 12,303 | $ | 10,392 | ||||
Deferred revenue | 18,976 | 16,634 | ||||||
Depreciation and amortization | 3,290 | 1,272 | ||||||
Net operating loss and tax credit carryovers (federal and state) | 149,086 | 164,612 | ||||||
Costs capitalized for state tax purposes | 2,299 | 1,496 | ||||||
Net deferred tax assets before valuation allowance | 185,954 | 194,406 | ||||||
Valuation allowance | (185,954 | ) | (194,315 | ) | ||||
Net deferred tax asset | $ | — | $ | 91 | ||||
The valuation allowance increased by $8.4 million in fiscal year 2008, providing a full valuation allowance against all U.S. federal and state deferred tax assets. A $91 thousand deferred tax asset is recognized at October 31, 2008, representing the portion of the India minimum tax that will be creditable against India regular tax once the Software Technology Park of India (STPI) holiday expires in March 2010.
The Company makes an assessment of both positive and negative evidence when measuring the need for a valuation allowance. Losses in prior periods represent sufficient negative evidence that realization of any amount of deferred tax asset is uncertain. This valuation allowance will be evaluated periodically and can be reversed partially or totally if business results improve sufficiently to support realization of the deferred tax asset.
On November 1, 2007, the Company adopted FIN 48. The cumulative unrecognized tax benefit determined under FIN 48 is equal to the cumulative unrecognized tax benefit as calculated under SFAS No. 5,Accounting for Contingencies(SFAS 5). Therefore, the adoption of FIN 48 had no impact on the Company’s retained earnings.
During fiscal year 2008, the Company made adjustments to the balance of unrecognized tax benefits as follows:
| (in thousands) | Amount | |||
Balance at November 1, 2007 | $ | 7,129 | ||
Additions related to current year tax positions | 2,279 | |||
Reductions for tax positions of prior years | (3 | ) | ||
Balance at October 31, 2008 | $ | 9,405 | ||
As of October 31, 2008, the Company had an unrecognized tax benefit of approximately $9.4 million, of which it currently does not expect any material changes to unrecognized tax positions within the next twelve months. If the Company is eventually able to recognize the
F-104
Table of Contents
benefit from these uncertain positions, $7.9 million of the unrecognized benefit would reduce its effective tax rate. The Company currently has a full valuation allowance against its domestic net deferred tax asset which would impact the timing of the effective tax rate benefit should any of these uncertain tax positions be favorably be settled in the future.
The Company recognizes accrued interest and penalties related to unrecognized tax benefits in income tax expense, of which the total amount recorded to date has not been significant. Upon adoption of FIN 48, the Company made no adjustments to the amount of accrued interest or penalties booked under SFAS 5. As of October 31, 2008, the Company had accrued interest and penalties related to uncertain tax positions of approximately $24 thousand.
As of October 31, 2008, the Company’s federal and state net operating loss carryforwards for income tax purposes were approximately $392.2 million and $240.4 million, respectively. The federal net operating losses, if not utilized, will begin to expire in fiscal year 2019, and the state net operating loss carryforwards will begin to expire in fiscal year 2009. The extent to which the loss carryforwards can be used to offset future taxable income may be substantially limited, depending on the extent of ownership changes within any three-year period as provided in the Tax Reform Act of 1986 and the California Conformity Act of 1987.
As of October 31, 2008, the Company’s federal and state tax credit carryforwards for income tax purposes were approximately $11.6 million and $15.4 million, respectively. The federal tax credits, if not utilized, will begin to expire in fiscal year 2019. The state tax research and development credits of $13.6 million can be carried forward indefinitely. The state manufacturer’s investment credits of $1.8 million, if not utilized, will begin to expire in fiscal year 2009.
In June 2005, the Company incorporated its India subsidiary, which immediately applied for and received an STPI ruling exempting the India operations from corporate income tax effective the date of incorporation (June 2005) through March 2010, the date the holiday legislation is set to expire. In April 2007, India signed into law a minimum tax regime that impacted the Company in spite of its STPI holiday. A portion of the India minimum tax is creditable against India regular tax once the STPI holiday expires. This portion, amounting to $91 thousand, has been recorded as a deferred tax asset without a valuation allowance.
U.S. income taxes and foreign withholding taxes associated with any future repatriation of foreign subsidiaries’ earnings have not been recorded. The Company intends to reinvest foreign subsidiaries’ earnings indefinitely. If these earnings were distributed to the U.S. in the form of dividends or otherwise, or if the shares of the relevant foreign subsidiaries were sold or otherwise transferred, the Company would be subject to additional U.S. income taxes (subject to an adjustment for foreign tax credits) and foreign withholding taxes. The amount of unrecognized deferred income tax liability related to these earnings is not considered significant.
The Company is subject to taxation in the U.S. and various states and foreign jurisdictions. For income tax returns of the Company before the fiscal year ended October 31, 2004, the Company is no longer subject to U.S. federal or state tax examination by tax authorities, although loss and tax credit carryforward attributes that were generated prior to October 31, 2004 may still be adjusted upon examination by tax authorities if they either have been or will be utilized. All foreign jurisdictions’ tax returns are still subject to examination by local tax authorities. The Company is not currently under examination in any jurisdiction worldwide.
F-105
Table of Contents
12. Restructuring charges
In July 2006 the Company relocated its executive offices to accommodate the organization’s resource requirements. In connection with this event, the Company recorded estimated expenses of $4.8 million for lease terminations and $0.7 million in leasehold improvement and asset retirement write-offs associated with the building. In accordance with SFAS No. 146,Accounting for Costs Associated with Exit or Disposal Activities (SFAS 146), lease termination costs are estimated and accrued when the property is vacated. The Company makes periodic reassessments, as necessary, of the estimates made at the time the original decisions were made, including estimating fair value of future lease payments, evaluating real estate market conditions for expected vacancy periods and sub-lease rents.
The following is a summary of restructuring activities:
| (in thousands) | Lease and facility obligations | |||
Balance as of November 1, 2005 | $ | 4,147 | ||
Provision | 5,882 | |||
Payments | (2,523 | ) | ||
Balance as of October 31, 2006 | 7,506 | |||
Provision | 832 | |||
Payments | (4,066 | ) | ||
| �� | ||||
Balance as of October 31, 2007 | 4,272 | |||
Provision | 300 | |||
Payments | (2,284 | ) | ||
Balance as of October 31, 2008 | $ | 2,288 | ||
The following is a summary of restructuring activities during the three months ended January 31, 2009 (unaudited):
| (in thousands) | Lease and facility obligations | |||
Balance as of November 1, 2008 | $ | 2,288 | ||
Provision | 3,064 | |||
Payments | (1,762 | ) | ||
Balance as of January 31, 2009 | $ | 3,590 | ||
13. Impairment of goodwill and purchased intangible assets
On November 15, 2005, the Company acquired the outstanding common stock of MetaNetworks, Inc. (Meta), a provider of line-rate 10 gigabit intrusion detection and prevention technology. The total purchase price, including acquisition related expenses and fair value of stock options issued to Meta employees, amounted to approximately $3.0 million, after adjustments.
In connection with the Meta acquisition in November 2005, the Company recorded goodwill and intangible assets of $1.2 million and $1.9 million, respectively, after adjustments for contingent consideration (earn-out) payments.
F-106
Table of Contents
The purchase price was allocated based upon the fair value of assets acquired and liabilities assumed. The Company recognized intangible assets acquired from the Meta acquisition as assets apart from goodwill because they arose either from contractual rights, other legal rights or they were separable from the acquired entity and could be sold or licensed separately. Intangible assets consisted of developed technology, customer backlog and non-competition agreements valued using the income approach. These intangible assets were identified through interviews with Meta management and analysis of financial information provided by Meta. To value developed technology, customer backlog and non-compete agreements, the Company considered the projected revenues and expenses that could be generated over the estimated useful life of the technologies or contracts. Goodwill represents the excess of the purchase price over the fair value of net tangible and intangible assets acquired and is not deductible for tax purposes. Contributing to the goodwill that resulted from the acquisition was that it provided an opportunity for the Company to extend its product offerings to include intrusion prevention.
Intangible assets related to developed technology, non-competition agreements and customer backlog were amortized over seventy-two, sixty-six and three months, respectively. Amortization charged to cost of revenues was $0.3 million for fiscal year 2007.
During fiscal year 2007, the Company determined that its intangible assets related to the Meta acquisition had been impaired. It estimated the fair value of the reporting unit using the income, or discounted cash flow, method that was then allocated to the assets and liabilities of the related reporting unit. Accordingly, it recorded a charge for impairment of goodwill and intangible assets of $2.4 million, of which $1.2 million related to developed technology and was charged to cost of revenues and $1.2 million related to goodwill and was included in impairment of goodwill in the consolidated statements of operations.
14. Related party transactions
Silicon Valley Bank
During fiscal years 2006, 2007, and 2008, the Company obtained cash management services from Silicon Valley Bank. In addition, the Company has obtained a secured line of credit and various loans from Silicon Valley Bank. One of the members of the Company’s board of directors is also a member of the board of directors of SVB Financial Group, the holding company of Silicon Valley Bank. The Company currently utilizes Silicon Valley Bank for cash management loan services. See Note 4 for details related to the borrowing activities.
Sanmina
As part of the normal course of business, the Company sold product and services to Sanmina-SCI Corporation (Sanmina), a former contract manufacturer to the Company and Series B and C preferred stockholder. Net revenues recorded from the sale of products and services to Sanmina amounted to $2.7 million, and $0.1 million for fiscal years 2007, and 2008, respectively.
Hitachi
As part of normal course of business, the Company sold product and services to Hitachi Cable Ltd (Hitachi), a telecommunications company and Series C preferred stockholder. Net revenues recorded from the sale of products and services to Hitachi amounted to $3.6 million, and $0.8 million for the fiscal years 2007, and 2008, respectively.
F-107
Table of Contents
CommVerge
As part of the normal course of business, the Company sold product and services to CommVerge Solutions (CommVerge), a provider of network solutions. Affiliates of preferred stockholders who own more than 5% of the Company’s voting capital stock, also own more than a 5% interest in CommVerge. Net revenues recorded from the sale of products and services to CommVerge amounted to $3.6 million, and $3.6 million in the fiscal years 2007 and 2008, respectively. Accounts receivable due from CommVerge amounted to $1.6 million, and $0.5 million as of October 31, 2007, and 2008, respectively.
NextHop
In fiscal year 2008, the Company purchased a software license from NextHop Technologies, Inc. (NextHop), a provider of Wi-Fi mobility solutions and networking protocol software. Affiliates of preferred stockholders who own more than 5% of the Company’s voting capital stock also own more than a 5% interest in NextHop. The license fee amounted to $0.5 million.
15. Segment information
SFAS No. 131,Disclosures About Segments of an Enterprise and Related Information(SFAS 131), establishes standards for reporting information about operating segments in annual financial statements and requires selected information of segments to be presented in financial reports issued to stockholders. Operating segments are defined as components of an enterprise about which separate financial information is available and is evaluated regularly by the chief operating decision maker, or decision making group, in determining how to allocate resources and assess performance. The Company’s chief operating decision maker, as defined under SFAS 131, is the chief executive officer. The Company views its operations and manages its business as one operating segment. For geographical reporting, revenues are attributed to the geographic location based on the customer’s bill-to location. Long-lived assets consist of property and equipment and are attributed to the geographic location in which they are located.
Net revenues by region
The following presents net revenues by geographic area:
| Year ended October 31, | Three months ended January 31, | ||||||||||||||
| (in thousands) | 2006 | 2007 | 2008 | 2008 | 2009 | ||||||||||
| (unaudited) | |||||||||||||||
United States | $ | 39,552 | $ | 157,828 | $ | 128,788 | $ | 26,488 | $ | 26,091 | |||||
North America excluding United States | 680 | 8,399 | 4,723 | 1,004 | 274 | ||||||||||
Europe, Middle East and Africa | 3,920 | 15,582 | 21,560 | 4,920 | 3,578 | ||||||||||
Asia Pacific | 6,217 | 14,932 | 17,959 | 3,031 | 4,870 | ||||||||||
Total | $ | 50,369 | $ | 196,741 | $ | 173,030 | $ | 35,443 | $ | 34,813 | |||||
F-108
Table of Contents
Property and equipment
The following presents property and equipment by geographic area:
| As of October 31, | January 31, 2009 | ||||||||
| (in thousands) | 2007 | 2008 | |||||||
| (unaudited) | |||||||||
Property and equipment, net | |||||||||
United States | $ | 9,569 | $ | 9,930 | $ | 9,125 | |||
Rest of the world | 433 | 455 | 418 | ||||||
Total | $ | 10,002 | $ | 10,385 | $ | 9,543 | |||
16. Subsequent events
Merger agreement
On December 31, 2008, the Company entered an Agreement and Plan of Reorganization (the Merger Agreement), with Turin, a privately-owned corporation that designs and manufactures telecommunications equipment for wireless and wireline carriers to provide voice, video and data services to their customers. Pursuant to the Merger Agreement, a wholly owned subsidiary of Turin will be merged with and into the Company. As described below, Company stockholders will be entitled to receive (i) shares of Turin common stock, (ii) shares of Turin preferred stock and/or (iii) cash and rights described below in exchange for any fractional shares of Company stock.
Pursuant to the Merger Agreement, as amended on March 18, 2009, (i) the holders of Force10’s Series F, Series E and Series D preferred stock will receive in the aggregate approximately 195,729 shares of Turin Series A preferred stock (Turin Series A), which will represent approximately fifty percent (50%) of the outstanding Turin Series A stock of the combined entity and approximately forty-seven and one-half percent (47.5%) of the outstanding capital stock of the combined entity, and (ii) holders of the Company’s Series C, Series B-2, Series B-1, Series B, Series A preferred stock and common stock will receive in the aggregate approximately 10,787 shares of Turin common stock, which will represent approximately fifty percent (50%) of the outstanding common stock of the combined entity and approximately two and one-half percent (2.5%) of the outstanding capital stock of the combined entity. No fractional shares of Turin preferred or common stock will be issued in connection with the merger, but in lieu thereof each holder of Company preferred or common stock who would otherwise be entitled to receive a fraction of a share of Turin preferred or common stock, as the case may be, will receive from Turin an amount of cash equal to the then fair market value of the Turin preferred or common stock, as applicable, and, in each case, as determined by the board of directors of Turin multiplied by the fraction of a share of such Company preferred and/or common stock to which such holder would otherwise be entitled. Each holder of Company preferred or common stock receiving such cash in lieu of fractional shares but not receiving any whole shares of Turin preferred or common stock shall receive a right to acquire a fraction of a share of Turin common stock equal to the share fraction such holder would otherwise be entitled at a price per share equal to the Turin common stock fair market value, on such other terms and subject to the conditions set forth in the related rights agreement. Each such right will (i) be exercisable (A) if, within two years following the effective date of the merger Turin consummates a firm commitment underwritten public offering pursuant to an effective registration statement under the Securities Act covering the sale of Turin common stock for the account of Turin and shall
F-109
Table of Contents
remain exercisable for the earlier of a seven-month period thereafter or the occurrence of a change of control event; or (B) immediately prior to a change of control event; (ii) entitle the holder thereof to acquire a fraction of a share of Turin common stock equal to the fraction of such Turin Series A stock or Turin common stock to which such holder would otherwise be entitled (the Fraction); (iii) have an exercise price equal to the then fair market value of Turin common stock as determined by the board of directors of Turin multiplied by the fraction; and (iv) can only be exercised using a cashless exercise mechanism.
Warrants for the Company’s capital stock that, pursuant to their respect terms and conditions, survive the merger will be assumed by Turin and become warrants to acquire Turin capital stock. Upon the effective date of the merger, all of the Company’s stock incentive plans will be terminated. At such time, all outstanding Company options will accelerate and become exercisable, and each outstanding Company stock option, whether vested or unvested and whether exercisable or unexercisable, will be terminated and cancelled.
The merger is subject to certain closing conditions, including approval by 70% of the holders of record of Company preferred stock and at least a majority of the holders of record of Company common stock, clearance under the Hart-Scott-Rodino Antitrust Improvements Act of 1976, clearance by the California Commissioner of Corporations to issue the shares of Turin Series A stock and Turin common stock issuable in connection with the merger, and certain other customary closing conditions.
The Merger Agreement may be terminated prior to the effective date upon the occurrence of certain events, including but not limited to: (i) by either party, if the net working capital of the other party is less than a predetermined threshold agreed to by the parties, as set forth in the Merger Agreement; (ii) by Turin, should less than 75% of Company engineers specifically identified in the Merger Agreement remain continuously employed by Company on February 27, 2009; and (iii) by either party if the closing of the merger has not occurred by May 31, 2009.
As of the Agreement Date, holders of Company Series E preferred stock had rights to receive, under certain circumstances, approximately $12,749,000 of accrued but unpaid dividends. In connection with the merger, and as a condition to close, the Company must obtain an acknowledgement and consent that holders of Company Series E preferred stock will waive their right to any accumulated dividends on such shares. Such acknowledgement and consent require the affirmative vote of at least seventy-five percent (75%) of the outstanding shares of Company Series E preferred stock.
The merger was consummated on March 31, 2009.
Advisory services agreement
As the result of introductory and advisory services, Advanced Equities, Inc. (AEI), a holder of both Company preferred stock and Turin preferred stock, received payments of $1,000,000 from each of the Company and Turin in connection with the execution of the Merger Agreement which was included in operating expenses for the three months ended January 31, 2009. AEI will be entitled to receive an additional payment of $500,000 from each of the Company and Turin at the effective date of the merger which will be included in operating expenses on that date.
Reduction in force
On January 5, 2009, the Company announced that it has implemented cost reduction measures in order to reduce operating expenses and eliminated certain positions throughout the
F-110
Table of Contents
organization. As a result, the Company accrued $3 million for headcount reductions which are included in the restructuring costs for the three months ended January 31, 2009.
Option grant to CEO
On November 4, 2008, the Company’s board of directors approved the promotion of the vice president of sales to the position of chief executive officer (CEO) to replace the former CEO who had previously announced his resignation from the Company. In connection with the promotion, on December 4, 2008, the board of directors granted options to the CEO of the Company to purchase 9,992,246 shares of the Company’s common stock, which represented approximately 1.5% of the Company’s fully diluted shares as of that date, at an exercise price per share of $.01 per share. The options vest as follows, 12.5% of the options will vest after six months of continuous service measured from November 4, 2008, and the balance will vest in equal monthly installments over the next 42 months of continuous service.
F-111
Table of Contents
Report of Independent Registered Public Accounting Firm
The Board of Directors and Stockholders
Carrier Access Corporation
We have audited the accompanying consolidated balance sheet of Carrier Access Corporation and subsidiaries (the Company) as of December 31, 2007, and the related consolidated statements of operations, stockholders’ equity and comprehensive income (loss), and cash flows for each of the years in the two year period ended December 31, 2007. These consolidated financial statements are the responsibility of the Company’s management. Our responsibility is to express an opinion on these consolidated financial statements based on our audits.
We conducted our audits in accordance with the standards of the Public Company Accounting Oversight Board (United States). Those standards require that we plan and perform the audit to obtain reasonable assurance about whether the financial statements are free of material misstatement. An audit includes examining, on a test basis, evidence supporting the amounts and disclosures in the financial statements. An audit also includes assessing the accounting principles used and significant estimates made by management, as well as evaluating the overall financial statement presentation. We believe that our audits provided a reasonable basis for our opinion.
In our opinion, the consolidated financial statements referred to above present fairly, in all material respects, the financial position of Carrier Access Corporation and subsidiaries as of December 31, 2007, and the results of their operations and their cash flows for each of the years in the two year period ended December 31, 2007, in conformity with U.S. generally accepted accounting principles.
As disclosed in Note 15, on February 8, 2008, the stockholders approved the sale of the Company to Turin Networks, Inc.
/s/ HEIN & ASSOCIATES LLP
Denver, Colorado
February 8, 2008
F-112
Table of Contents
Consolidated balance sheet
| (in thousands, except per share data) | December 31, 2007 | |||
Assets | ||||
Current assets | ||||
Cash and cash equivalents | $ | 36,681 | ||
Investments in marketable securities | 37,840 | |||
Accounts receivable, net of allowance for doubtful accounts of $285 in 2007 | 5,224 | |||
Deferred income taxes | 43 | |||
Inventory, net | 6,804 | |||
Prepaid expenses and other | 2,447 | |||
Assets held for sale, net | 6,081 | |||
Total current assets | 95,120 | |||
Property and equipment, net of accumulated depreciation and amortization of $19,391 in 2007 | 2,681 | |||
Goodwill | 7,614 | |||
Intangible assets, net of accumulated amortization of $5,117 in 2007 | 2,777 | |||
Total assets | $ | 108,192 | ||
Liabilities and stockholders’ equity | ||||
Current liabilities | ||||
Accounts payable | $ | 6,132 | ||
Accrued compensation payable | 4,045 | |||
Accrued expenses and other liabilities | 2,052 | |||
Deferred revenue | 181 | |||
Total current liabilities | 12,410 | |||
Deferred income taxes | 43 | |||
Total liabilities | 12,453 | |||
Commitments and contingencies (Note 14) | ||||
Stockholders’ Equity | ||||
Preferred stock, $0.001 par value, 5,000 shares authorized and no shares issued or outstanding at December 31, 2007 | — | |||
Common stock, $0.001 par value, 60,000 shares authorized, 34,725 shares issued and outstanding at December 31, 2007 | 35 | |||
Additional paid-in capital | 192,007 | |||
Accumulated deficit | (96,379 | ) | ||
Accumulated other comprehensive income (loss) | 76 | |||
Total stockholders’ equity | 95,739 | |||
Total liabilities and stockholders’ equity | $ | 108,192 | ||
See notes to consolidated financial statements.
F-113
Table of Contents
Consolidated statements of operations
| (in thousands, except per share data) | Fiscal year ended December 31, | |||||||
| 2007 | 2006 | |||||||
Revenue, net of allowances for sales returns | $ | 32,003 | $ | 75,416 | ||||
Cost of sales | 30,506 | 43,524 | ||||||
Gross profit | 1,497 | 31,892 | ||||||
Operating expenses | ||||||||
Research and development | 20,219 | 26,814 | ||||||
Sales and marketing | 14,258 | 14,807 | ||||||
General and administrative | 11,509 | 9,767 | ||||||
Bad debt expense (recoveries) | 64 | (124 | ) | |||||
Insurance recoveries, net and restructuring charges | (151 | ) | (484 | ) | ||||
Intangible asset amortization | 1,229 | 1,228 | ||||||
Total operating expenses | 47,128 | 52,008 | ||||||
Loss from operations | (45,631 | ) | (20,116 | ) | ||||
Interest and other income, net | 4,447 | 5,264 | ||||||
Loss from continuing operations before income taxes | (41,184 | ) | (14,852 | ) | ||||
Income tax expense (benefit) | 47 | (16 | ) | |||||
Loss from continuing operations | $ | (41,231 | ) | $ | (14,836 | ) | ||
Loss from discontinued operations | (13,770 | ) | — | |||||
Net loss | $ | (55,001 | ) | $ | (14,836 | ) | ||
Earnings per share: | ||||||||
Loss per share from continuing operations | ||||||||
Basic and diluted | $ | (1.20 | ) | $ | (0.44 | ) | ||
Loss per share from discontinued operations | ||||||||
Basic and diluted | $ | (0.40 | ) | $ | — | |||
Net Loss | ||||||||
Basic and diluted | $ | (1.60 | ) | $ | (0.44 | ) | ||
Weighted average common shares | ||||||||
Basic and diluted | 34,474 | 33,940 | ||||||
See notes to consolidated financial statements.
F-114
Table of Contents
Consolidated statements of cash flows
| (in thousands) | Fiscal year ended December 31, | |||||||
| 2007 | 2006 | |||||||
Cash flows from operating activities | ||||||||
Net loss | $ | (55,001 | ) | $ | (14,836 | ) | ||
Adjustments to reconcile net loss to net cash provided by (used in) operating activities | ||||||||
Depreciation and amortization expense | 4,480 | 3,523 | ||||||
Provisions for doubtful accounts | 159 | 133 | ||||||
Provisions for inventory obsolescence | 8,941 | 2,592 | ||||||
Stock-based compensation | 3,449 | 2,501 | ||||||
Loss on sale or disposal of assets | 35 | 16 | ||||||
Asset write downs from discontinued operations | 8,416 | — | ||||||
Impairment loss from assets held for sale | 150 | — | ||||||
Changes in operating assets and liabilities: | ||||||||
Accounts receivable | 1,770 | 3,589 | ||||||
Inventory | 1,192 | 3,701 | ||||||
Prepaid expenses and other | (838 | ) | (8,080 | ) | ||||
Accounts payable | (1,287 | ) | 1,356 | |||||
Accrued compensation payable | (49 | ) | 677 | |||||
Accrued restructuring | (117 | ) | (125 | ) | ||||
Other liabilities | (2 | ) | 7,276 | |||||
Net cash provided by (used in) operating activities | (28,702 | ) | 2,323 | |||||
Cash flows from investing activities | ||||||||
Purchase of equipment and real property | (902 | ) | (1,553 | ) | ||||
Proceeds from the sale of property | 81 | 9 | ||||||
Purchases of marketable securities available for sale | (60,416 | ) | (36,743 | ) | ||||
Sales of marketable securities available for sale | 55,848 | 57,563 | ||||||
Acquisitions of subsidiaries, net of cash acquired | (7,871 | ) | (321 | ) | ||||
Net cash provided by (used in) investing activities | (13,260 | ) | 18,955 | |||||
Cash flows from financing activities | ||||||||
Proceeds from exercise of stock options | 674 | 1,389 | ||||||
Repurchases of company common shares | — | — | ||||||
Net cash provided by (used in) financing activities | 674 | 1,389 | ||||||
Net increase in cash and cash equivalents | (41,288 | ) | 22,667 | |||||
Effect of exchange rate changes on cash and cash equivalents | 21 | 2 | ||||||
Cash and cash equivalents at beginning of year | 77,948 | 55,279 | ||||||
Cash and cash equivalents at end of year | $ | 36,681 | $ | 77,948 | ||||
Supplemental disclosure of cash flow information and investing and financing activities | ||||||||
Cash paid for income taxes | $ | 8 | $ | 8 | ||||
See notes to consolidated financial statements.
F-115
Table of Contents
Consolidated statements of stockholders’ equity and comprehensive income (loss)
For the years ended December 31, 2007 and 2006
| (in thousands, except share data) | Common stock | Additional capital | Retained (deficit) | Accumulated Income (loss) | Total equity | |||||||||||||||
| Shares | Amount | |||||||||||||||||||
Balances at January 1, 2006 | 33,783 | $ | 34 | $ | 183,995 | $ | (26,542 | ) | $ | (362 | ) | $ | 157,125 | |||||||
Net loss | — | — | — | (14,836 | ) | — | (14,836 | ) | ||||||||||||
Change in unrealized gains and losses on investments, net of tax | — | — | — | — | 250 | 250 | ||||||||||||||
Cumulative translation adjustment | — | — | — | — | 2 | 2 | ||||||||||||||
Comprehensive loss | (14,584 | ) | ||||||||||||||||||
Stock based compensation expense | — | — | 2,501 | — | — | 2,501 | ||||||||||||||
Exercise of stock options | 525 | — | 1,389 | — | — | 1,389 | ||||||||||||||
Balances at December 31, 2006 | 34,308 | 34 | 187,885 | (41,378 | ) | $ | (110 | ) | 146,431 | |||||||||||
Net loss | — | — | — | (55,001 | ) | — | (55,001 | ) | ||||||||||||
Change in unrealized gains and losses on investments, net of tax | — | — | — | — | 128 | 128 | ||||||||||||||
Cumulative translation adjustment | — | — | — | — | 58 | 58 | ||||||||||||||
Comprehensive loss | (54,815 | ) | ||||||||||||||||||
Stock based compensation expense | — | — | 3,449 | — | — | 3,449 | ||||||||||||||
Exercise of stock options and restricted stock units | 417 | 1 | 673 | — | — | 674 | ||||||||||||||
Balances at December 31, 2007 | 34,725 | $ | 35 | $ | 192,007 | $ | (96,379 | ) | $ | 76 | $ | 95,739 | ||||||||
See notes to consolidated financial statements.
F-116
Table of Contents
Notes to consolidated financial statements
(in thousands, except per share amounts, unless otherwise stated)
1. Nature of business and summary of significant accounting policies
Business operations (see Note 15 regarding merger)
Carrier Access Corporation (the Company) designs, manufactures and sells broadband access equipment to wireline and wireless carriers. The products are used to upgrade capacity and provide enhanced services to wireline and wireless communications networks. The products also enable our customers to offer enhanced voice and data services, delivered over multiple technologies, which historically have been offered on separate networks, on a single converged network. The Company designs products to enable our customers to deploy new revenue-generating voice and data services, while lowering their capital expenditures and ongoing operating costs. The Company operates in one business segment and substantially all of its sales and operations are domestic.
Principles of accounting and consolidation
These consolidated financial statements have been prepared in accordance with generally accepted accounting principles accepted in the United States of America. The consolidated financial statements include the accounts of the Company and its wholly owned domestic and foreign subsidiaries. All significant intercompany balances and transactions have been eliminated.
Use of estimates
The preparation of consolidated financial statements in conformity with accounting standards generally accepted in the United States of America requires management to make estimates and assumptions that affect the amounts reported in the Company’s consolidated financial statements and the accompanying notes. Estimates are used when accounting and reporting certain amounts, including revenue recognition, allowances for uncollectible accounts receivable, inventory obsolescence, asset fair value, product warranty, depreciation, amortization, impairments, stock based compensation, income tax valuation allowances and contingencies. Actual results could differ from those estimates.
Cash and cash equivalents
Cash and cash equivalents include cash balances with banks and all highly-liquid investments with original or remaining maturities of 90 days or less at the time of purchase.
Investments
The Company’s investments include U.S., state and municipal government obligations and domestic public corporate debt securities. Investments are classified as short-term or long-term based on nature of these securities and the availability of these securities to meet current operating needs. All of these investments are held in the name of the Company at a limited number of financial institutions.
As of December 31, 2007, all of the Company’s investments were marketable securities classified as available for sale and are reported at their fair values based upon quoted market prices as of the reporting date. If these investments are sold at a loss or experience a decline in value that is
F-117
Table of Contents
not temporary, the loss is recognized in the statement of operations for that period. Unrealized gains or losses that are considered temporary in nature are recorded as a separate component of cumulative other comprehensive income (loss) in stockholders’ equity, net of the related tax effect. Subsequent recoveries in the fair value, if any, are not recognized in the statement of operations, but as a component of accumulated other comprehensive income (loss). The specific identification method is used to determine the cost of securities disposed of, with realized gains and losses recorded in interest income, net.
Concentration of credit risk
Financial instruments that subject the Company to concentrations of credit risk are primarily cash, cash equivalents, accounts receivable and investments in marketable securities. All cash, cash equivalents and marketable securities are maintained with financial institutions that management believes are creditworthy. At times, cash balances held at financial institutions were in excess of Federal Deposit Insurance Corporation insurance limits. Accounts receivable are typically unsecured and are concentrated in the telecommunications industry.
Allowance for doubtful accounts
The Company establishes allowances for doubtful accounts for estimated losses resulting from the inability of the Company’s customers to make required payments. The decision to extend credit to a customer is a judgment we make on whether we can reasonably expect to collect from our customers, including such factors as customer credit-worthiness, past history with the customer, current customer industry trends and changes in customer payment terms. We make these assessments before we extend credit and at regular intervals thereafter. If these factors do not indicate reasonable assurance of collection, revenue, if any is deferred until collection does become reasonably assured, which is generally when the cash is received. The Company establishes and maintains a provision for uncollectible accounts receivable based on management’s review of the aging of the receivable balances, our ongoing assessments of our customers’ current ability to pay, and current industry and market conditions for our customers. Delinquent customer accounts are written-off after management has determined the likelihood of collection is not probable.
Fair value of financial instruments
Reported values of cash and cash equivalents, accounts receivable, accounts payable, and other accrued liabilities approximate fair value due to their short maturities. Estimated fair values of short-term and long-term investments are based on quoted market prices for the same or similar instruments.
Inventories
Inventories are reported at the lower of cost or market. Cost is based on standard costs that approximate average purchase costs. Market is determined based on net realizable value. The cost of finished goods and work-in-process includes material, labor, certain warehousing and other allocable manufacturing overhead costs. The Company establishes reserves on inventories when judgments about future demand and market conditions indicate net realizable value is less than cost, or when the related technology is considered obsolete or if the inventory cannot be used in the manufacture of other products.
F-118
Table of Contents
Property and equipment
Property, equipment and leasehold improvements are recorded at cost and are depreciated using the straight-line method over their estimated useful lives ranging from three to twenty-five years, or the lease term for leasehold improvements. Depreciation expense for these assets was $1.9 million and $1.6 million for the years ended December 31, 2007 and 2006, respectively. Repairs and maintenance costs are expensed as incurred.
Capitalized software
The Company expenses all internal-use software costs incurred in the preliminary project stage and capitalizes purchased internal-use software within property and equipment. Capitalized software costs are amortized on a straight-line basis over the estimated useful lives of the software, which is generally three years. Software amortization expense was $800,000 and $700,000 for the years ended December 31, 2007 and 2006, respectively.
Goodwill and other intangibles
Goodwill is the excess of the purchase price of an acquired business over the fair value of the identifiable assets acquired and liabilities assumed. The Company does not have any indefinite-lived intangible assets, other than goodwill. Other intangible assets consist of acquired customer-related intangibles and developed product technology. Customer-related intangibles and developed product technology intangibles are amortized over their estimated useful lives of seven and five years, respectively.
The Company has one reporting unit and therefore annual impairment tests for goodwill are performed at the consolidated level. Goodwill is reviewed no less than annually for impairment, or whenever events occur or circumstances change that would indicate it is more likely than not an impairment has occurred. Circumstances that could trigger an impairment test include a significant adverse change in the business climate or legal factors, an adverse action or assessment by a regulator, unanticipated competition, the loss of key personnel, a change in reportable segments and results of testing for recoverability of a significant asset group within a reporting unit, among others. The assessment of goodwill impairment is a two step process. First, the fair value of the reporting unit is estimated. This estimate of fair value is based on the best available information as of the assessment date, and may be determined on the basis of analyses of the market capitalization of the Company, comparable company market valuations, and expected future cash flows. Expectations about future cash flows can be affected by changes in industry or market conditions, and the rate and extent of that anticipated synergies or cost savings are realized with newly acquired businesses. If the estimate of fair value of the reporting unit is less than the carrying amount, then a second step is performed to determine the amount of impairment that should be recorded. In the second step, the implied fair value of the reporting unit’s goodwill is determined through allocation of the reporting unit’s fair value to all of its assets and liabilities other than goodwill, including any unrecognized intangible assets, in a manner similar to a purchase price allocation. The resulting implied fair value of goodwill is compared to the carrying amount of goodwill and an impairment charge is recorded for the difference if the implied goodwill is less.
Intangible assets with definite useful lives are amortized over such useful lives, which range from five to seven years, and are subject to tests for impairment whenever events or changes in circumstances indicate that impairment may exist. There was no impairment recorded in the fiscal year ended December 31, 2006.
F-119
Table of Contents
Impairments were recorded for goodwill and other intangible assets related to the EdgeFlex product line in 2007 totaling $4.7 million.
Accounting for impairment of long lived assets
The Company assesses the need to record impairment losses on long-lived assets with finite lives when events or changes in circumstances indicate that the carrying amount of the assets may not be recoverable. Impairment losses are recognized when the future estimated undiscounted cash flows expected from the use of the asset are less than the asset’s carrying value, with the amount of loss measured at fair value based upon discounted estimated cash flows. An asset that is classified as held for sale is recorded at the lower of its carrying amount or fair value less cost to sell.
In December 2007, the Company recorded a $150,000 impairment loss related to the value of the land and building located at 5395 Pearl Parkway, see Note 7—Property and Equipment, net and the land and building were classified as held for sale. There were no impairments of long-lived assets during the fiscal year ended December 31, 2006.
Revenue recognition
The Company’s products are generally sold as part of a contract or distribution agreement. The terms of the contract or distribution agreement, together with binding purchase orders or other binding documentation taken as a whole, determine the appropriate revenue recognition method.
The Company recognizes revenue according to SEC Staff Accounting Bulletin 104 “Revenue Recognition”, which amended and was preceded by Staff Accounting Bulletin 101, “Revenue Recognition in Financial Statements”, Statement of Financial Accounting Standard No. 48, “Revenue Recognition When Right of Return Exists”, and FASB Emerging Issues Task Force Issue No. 00-21 “Revenue Arrangements with Multiple Deliverables” (EITF 00-21). Under these guidelines, the Company recognizes revenue from transactions where persuasive evidence of an arrangement exists, delivery has occurred or the services have been provided, the price is fixed and determinable, payment is not contingent on performance of installation or service obligations, and collectibility is reasonably assured. For our products, delivery is considered to occur upon shipment or delivery as defined in our shipping terms, provided that risk of loss, and if necessary title, has transferred to the customer. For arrangements that include customer acceptance terms, revenue is recognized upon the customer’s acceptance of the product or service, which occurs upon the earlier of receipt of a written customer acceptance or expiration of the acceptance period. The Company’s products include both hardware and embedded software. To date, the software embedded in our products has not been considered more than incidental to the product and does not represent a separate unit of accounting as defined in the American Institute of Certified Public Accountants Statement of Position 97-2 “Software Revenue Recognition.” The Company continues to closely review its contracts and distribution agreements to ensure application of the appropriate revenue recognition method.
For contracts or agreements involving delivery of more than one element of product or service, the Company applies the guidelines in EITF 00-21. Each deliverable is evaluated to determine whether it is a separate unit of accounting. A separate unit of accounting exists where the delivered item has value to the customer on a stand-alone basis, there is objective and reliable evidence of fair value for any undelivered items, and in cases where the contract or agreement provides a general right of return relative to the delivered item, delivery or performance of the
F-120
Table of Contents
undelivered items is considered probable and is substantially under the Company’s control. Provided fair value exists for all units of accounting, revenue is allocated to each element based on relative fair values. If fair value exists only for the undelivered elements but not the delivered elements, revenue is allocated to the delivered elements by subtracting the fair value of the undelivered elements from the total amount due from the customer. Revenue for each element, or unit of accounting, is recognized under the applicable revenue recognition guidance. Fair value for individual elements is determined based on either the stand-alone selling prices for these elements when sold separately, or on prices of similar, substantially interchangeable elements sold to similar customers. Accordingly, the Company considers that selling prices are appropriate indicators of fair value.
The Company makes certain sales through multiple distribution channels, primarily resellers or distributors. Reasonable assurance of collectibility is assessed based on a number of factors, including past transaction history and the creditworthiness of the customer. If reasonable assurance of collectibility is not met, or if payment is contingent upon resale of the Company’s products, and reliable reporting from our resellers or distributors exists, revenue is recognized when the reseller or distributor sells the product to their customer. If reliable reporting from the reseller or distributor is not available, revenue recognition is deferred until cash is received.
Certain customers have the contractual right to return a limited amount of products during a limited post sale period after shipment as part of a “stock rotation”. Generally, under the Company’s stock rotation program, three times per year, eligible customers may return on average 15% of unsold inventories purchased within the prior four-month period, in exchange for an equivalent dollar value of new products. The Company also provides “price protection” to certain customers. Under the price protection program, generally if the Company reduces prices, eligible customers are entitled to receive a credit for the difference between the price paid and the new, lower price for on-hand inventory purchased within the 60 days prior to the effective date of the price decrease. The Company applies the guidance of Statement of Financial Accounting Standards No. 48, “Revenue Recognition When Right of Return Exists”, and the guidance in applicable portions of SAB Topic 13 “Revenue Recognition” and reduces revenue by the amount of estimated returns due to stock rotation based upon historical experience. In the event the Company reduces prices and the price reduction results in amounts due to eligible customers, we record the amounts due by reducing revenues and record a corresponding liability.
Revenue from installation and training services is deferred and recognized over the period the services are performed. Revenue from maintenance services is deferred and recognized on a straight-line basis over the terms of the maintenance agreements.
Shipping and handling fees and costs
Amounts billed to customers related to shipping and handling costs represent revenues earned and are reported in net revenues. Costs incurred by the Company for shipping and handling, are reported in cost of sales.
Advertising costs
The Company engages in a number of marketing activities, including advertising in selected trade publications, industry trade shows and co-operative advertising with several of its distributors and original equipment manufacturer partners. All advertising costs are expensed as incurred. The costs for co-operative advertising are accrued and expensed as the related revenues are recognized.
F-121
Table of Contents
Research and development expenditures
We expend significant resources on product development, including software that is embedded in our products. Statement of Financial Accounting Standard No. 86, “Accounting for the Costs of Computer Software to be Leased, Sold or Otherwise Marketed” specifies the accounting for the costs of computer software to be sold, leased, or otherwise marketed as a separate product or as part of a product or process. Software development costs incurred prior to the establishment of technological feasibility are included in research and development and expensed as incurred. To date, the period between the time that technological feasibility occurs and the general availability of the software embedded in our products has been short, and software development costs incurred after technological feasibility that would otherwise qualify for capitalization have been immaterial. Accordingly, the Company has not capitalized any software development costs. All other research and development costs are charged to operations as incurred. The Company’s research and development expense includes direct labor, benefits, material and facilities costs, depreciation and other allocable indirect overhead costs.
We have entered into funded software development arrangements where we perform software development to enable the embedded software in certain of our products to integrate seamlessly within our customer product offerings. These arrangements are accounted for following the guidelines of Statement of Financial Accounting Standard No. 68, “Research and Development Arrangements”. Funds are earned as we attain contractual milestones and credited against related research and development expense. Total amounts credited against research and development expenses were $0 and $952,000 for the years ended December 31, 2007 and 2006, respectively. In 2007 these products became part of our regular product offering therefore the funded arrangements were recognized as part of revenue. Total amount recognized as revenue in 2007 was $475,000.
Foreign currency translation
The foreign currency denominated assets and liabilities of our foreign subsidiary, which operates primarily in a local functional currency environment, are translated to U.S. dollars at exchange rates in effect as of the balance sheet date. Income and expenses are translated at average exchange rates. The resulting translation adjustments are reported as a separate component of other comprehensive income.
Income taxes
The Company provides for income taxes using the liability method in accordance with Statement of Financial Accounting Standard No. 109“Accounting for Income Taxes” (FAS 109). We recognize the amount of income taxes payable or refundable for the year as well as deferred tax assets and liabilities. Deferred tax assets and liabilities are determined based on the difference between the financial statement and tax basis of assets and liabilities using enacted tax rates in effect for the year that the differences are expected to effect current taxable income. Valuation allowances are recorded to reduce the amount of deferred tax assets when, based upon available objective evidence including historical taxable income, the expected reversal of temporary differences, and projections of future taxable income, management cannot conclude it is more likely than not that some or all of the deferred tax assets will be realized.
Earnings per share
Basic earnings per share from continuing operations is computed by dividing income or loss from continuing operations by the weighted average number of common shares outstanding during
F-122
Table of Contents
the period. Diluted earnings per share from continuing operations reflects the additional dilution from potential issuances of common stock, such as stock issuable pursuant to the exercise of stock options outstanding and shares of common stock subject to repurchase. The treasury stock method is used to compute the dilutive effect of options and similar instruments. Potentially dilutive shares, including shares of common stock that are subject to repurchase, are excluded from the computation of fully-diluted earnings per share from continuing operations when their effect is anti-dilutive. A reconciliation of net loss and weighted average shares used in computing amounts for basic and diluted loss per share from continuing operations is presented below.
| 2007 | 2006 | |||||||
Basic earnings from continuing operations per share computation | ||||||||
Net loss from continuing operations | $ | (41,231 | ) | $ | (14,836 | ) | ||
Weighted average shares outstanding—basic | 34,474 | 33,940 | ||||||
Basic loss from continuing operations per share | $ | (1.20 | ) | $ | (0.44 | ) | ||
Diluted earnings from continuing operations per share computation | ||||||||
Net loss from continuing operations | $ | (41,231 | ) | $ | (14,836 | ) | ||
Weighted average shares | ||||||||
Average shares outstanding—basic | 34,474 | 33,940 | ||||||
Net shares assumed issued through exercises of stock options | — | — | ||||||
Average shares outstanding—diluted | 34,474 | 33,940 | ||||||
Diluted loss from continuing operations per share | $ | (1.20 | ) | $ | (0.44 | ) | ||
As a result of the Company’s net losses for the years ended December 31, 2007 and 2006, all potentially dilutive securities were anti-dilutive and therefore have been excluded from the computation of diluted loss per share. The weighted average number of restricted stock units and “in-the-money” option shares excluded from computation of diluted net loss per share because their effect is anti-dilutive totaled 916,955 and 2,282,246 for 2007 and 2006, respectively.
Stock-based compensation
On January 1, 2006, the Company adopted Statement of Financial Accounting Standard No. 123 (revised 2004), “Share-Based Payment” (SFAS 123(R)). SFAS 123(R) requires the measurement and recognition of compensation expense for all share-based payment awards made to employees and directors, including stock options, based on estimated fair values. In addition, the Securities and Exchange Commission (SEC) issued Staff Accounting Bulletin No. 107“Share-Based Payment” (SAB 107), which provides supplemental SFAS 123(R) application guidance based on the views of the SEC. The Company adopted the provisions of SAB 107 in its adoption of SFAS 123(R). SFAS 123(R) superseded the Company’s previous accounting under Accounting Principles Board Opinion No. 25, “Accounting for Stock Issued to Employees” (APB 25) and related Interpretations, as permitted by Statement of Financial Accounting Standards No. 123, “Accounting for Stock-Based Compensation” (SFAS 123).
The Company adopted SFAS 123(R) using the modified prospective transition method, which required prospective application of the accounting standard as of January 1, 2006, the first day of the Company’s fiscal year. The Company’s consolidated financial statements for the fiscal years 2007 and 2006 include stock-based compensation expense in accordance with SFAS 123(R). Under the modified prospective transition method, compensation cost recognized during fiscal years
F-123
Table of Contents
2007 and 2006 includes: (a) compensation cost for all share-based payments granted prior to, but not yet vested as of January 1, 2006, based on the grant date fair value estimated in accordance with the original provisions of SFAS No. 123, and (b) compensation cost for all share-based payments granted beginning January 1, 2006, based on the grant date fair value estimated in accordance with the provisions of SFAS 123(R). Prior to January 1, 2006, share-based employee compensation expense was not recognized in the Company’s consolidated financial statements because the exercise prices of all awarded stock option grants were either equal to or greater than the market value of the underlying common stock on the grant date (other than for certain option modifications and options granted with exercise prices below the fair market value at the grant date). Stock-based compensation related to non-employees and modifications of options granted were accounted for based on the fair value of the related stock or options in accordance with SFAS 123 and its interpretations.
As permitted by SFAS 123, the Company reported pro-forma disclosures presenting results and earnings per share as if the Company had used the fair value recognition provisions of SFAS 123 in the Notes to the Consolidated Financial Statements. SFAS 123(R) requires an estimate of pre-vesting forfeitures at the time of grant, with subsequent revisions as actual vesting becomes known, so that expense recognized reflects an estimate of the fair value of stock option awards that will ultimately vest. As a result, stock-based compensation expense recognized in the Consolidated Statement of Operations for 2007 and 2006 have been reduced by expected forfeitures.
See Note 11—Income Taxes for additional details regarding the impacts of the Company’s stock based compensation plan on the Company’s consolidated financial statements.
Warranty costs
The Company provides for the estimated costs of product warranties at the time revenue for the products is recognized. The specific terms and conditions of the warranties vary depending on the specific product sold and the terms of the customer purchase agreements. In the case of hardware our warranties generally start from the delivery date and continue for up to five years. Software products generally are under warranty for 90 days from the date of shipment. Our warranty liability for our software is to provide “patches” and “bug” fixes that are offered as part of and covered by our standard product warranty. The Company accrues for warranty obligations based on historical experience and estimates of future warranty costs. Charges and accruals to the warranty liability, which is reported as a component of “Other accrued liabilities” in our consolidated balance sheets, during the periods presented, are as follows:
| (in thousands) | Fiscal year ended December 31, | |||||||
| 2007 | 2006 | |||||||
Product warranty liability beginning balance | $ | 1,534 | $ | 709 | ||||
Add: current year accruals | 1,430 | 2,379 | ||||||
Deduct: current year charges | (1,410 | ) | (1,554 | ) | ||||
Product warranty liability ending balance | $ | 1,554 | $ | 1,534 | ||||
Comprehensive income (loss)
The Company’s comprehensive income (loss) consists of net income (loss), and unrealized gains or losses on certain securities, including reclassification adjustments, and cumulative translation gains and losses from translating the financial statements of its Chinese subsidiary. The Company had no other sources of comprehensive income (loss) for the years ended 2007 and 2006.
F-124
Table of Contents
Insurance recovery, mediation settlement and restructuring costs
The Company maintains director’s and officer’s insurance coverage. During the years ended December 31, 2007 and 2006, the Company received $932,000 and $484,000, respectively, from its insurance carrier representing reimbursement of certain legal fees under its insurance policy. The Company recognizes such insurance recoveries in operations when received.
Restructuring costs, which include employee termination benefits, contract termination costs, asset impairments and other restructuring costs are recorded at estimated fair value. The amounts for restructuring costs are estimated based upon certain key estimates, including the timing of employees leaving the company, the terms that may be negotiated to exit contractual obligations, and the realizable value of certain assets to be disposed of, among others.
The Company entered into a restructuring plan effective December, 2002 designed to improve future operating performance and position the Company for earnings growth in future periods, consistent with anticipated revenues. Included in this plan were employee termination costs, facility closures or downsizing, and disposal of excess or unused assets. In connection with the restructuring, the Company accrued $2.0 million in December, 2002.
At December 31, 2007 and 2006, the accrued liability associated with the restructuring plan, which is reported as part of “Other accrued liabilities” in our consolidated balance sheets, consisted of the following (in thousands):
Beginning reserve balance | Restructuring charges | Payments | Ending reserve balance | ||||||||||
2007 | $ | 117 | $ | 781 | $ | (898 | ) | $ | — | ||||
2006 | 242 | — | (125 | ) | 117 | ||||||||
2. Recently issued accounting pronouncements
FASB interpretation No. 48, “Accounting for Uncertainty in Income Taxes”
Financial Accounting Standards Board Interpretation No. 48 (FIN 48) , “Accounting for Uncertainty in Income Taxes—an interpretation of FASB Statement No. 109,” specifies how tax benefits for uncertain tax positions are to be recognized, measured, and derecognized in financial statements; requires certain disclosures of uncertain tax matters; specifies how reserves for uncertain tax positions should be classified on the balance sheet; and provides transition and interim-period guidance, among other provisions. FIN 48 is effective for fiscal years beginning after December 15, 2006. As a result, we adopted this pronouncement in the first quarter of 2007. This interpretation did not have a material impact on our financial statements during 2007.
Emerging Issues Task Force Issue 06-3, “How Taxes Collected from Customers and Remitted to Governmental Authorities Should be presented in the Income Statement”
Emerging Issues Task Force Issue 06-3 (EITF 06-3), “How Taxes Collected from Customers and Remitted to Governmental Authorities should be Presented in the Income Statement (That is, Gross versus Net Presentation).” The scope of EITF 06-3 includes any tax assessed by a governmental authority that is directly imposed on a revenue-producing activity between a seller and a customer, and may include, but is not limited to, sales, use, value added, and some excise taxes. EITF 06-3 concluded that the presentation of taxes within its scope on either a gross (included in revenue and cost) or net (excluded from revenues) basis is an accounting policy decision subject to appropriate disclosure. EITF 06-3 is effective for reporting periods beginning
F-125
Table of Contents
after December 15, 2006. As a result, we adopted this standard in the first quarter of 2007. This pronouncement did not have a material effect on our financial statements. We present the items within the scope of EITF 06-3 on a net basis (excluded from revenues).
Emerging Issues Task Force Issue 07-3, “Accounting for Nonrefundable Advance Payments for Goods or Services Received for Use in Future Research and Development Activities”
Emerging Issues Task Force Issue 07-3 (EITF 07-3), “Accounting for Nonrefundable Advance Payments for Goods or Services Received for Use in Future Research and Development Activities.” The scope of EITF 07-3 is limited to nonrefundable advance payments for goods or services to be used or rendered in future research and development activities pursuant to an executory contractual arrangement. EITF 07-3 concluded that nonrefundable advance payments for goods or services to be used or rendered in future research and development activities should be deferred and capitalized. Such amounts should be recognized as an expense as the related goods are delivered or the related services are performed. EITF 07-3 is effective for reporting periods beginning after December 15, 2007. We are currently evaluating the potential impact of EITF 07-3 on our financial statements.
Statement of Financial Accounting Standard No. 141 (revised 2007), “Business Combinations”
In December 2007, the Financial Accounting Standards Board (FASB) issued SFAS No. 141 (revised 2007),Business Combinations (“SFAS 141(R)”). SFAS 141(R) establishes principles and requirements for how an acquirer recognizes and measures in its financial statements the identifiable assets acquired, the liabilities assumed, any noncontrolling interest in the acquiree and the goodwill acquired. SFAS 141(R) also establishes disclosure requirements to enable the evaluation of the nature and financial effects of the business combination. SFAS 141(R) is effective for fiscal years beginning after December 15, 2008, and will be adopted by us in the first quarter of fiscal 2009. We are currently evaluating the potential impact, if any, of the adoption of SFAS 141(R) on our consolidated results of operations and financial condition.
Statement of Financial Accounting Standard No. 157, “Fair Value Measurements”
Statement of Financial Accounting Standard No. 157 (SFAS 157),“Fair Value Measurements”, defines fair value, establishes a framework for measuring fair value, and expands disclosures about fair value measurements. SFAS 157 applies under other accounting pronouncements that require or permit fair value measurements. “Fair value” is defined as a market-based exchange price, or the price that would be received to sell the asset or paid to transfer the liability. SFAS 157 is effective for fiscal years beginning after November 15, 2007. We are currently evaluating the potential impact of SFAS 157 on our financial statements.
Statement of Financial Accounting Standard No. 159, “Fair Value Option for Financial Assets and Liabilities”
Statement of Financial Accounting Standards No. 159 (SFAS 159), “The Fair Value Option for Financial Assets and Financial Liabilities—Including an Amendment of FASB Statement No. 115” which is effective for fiscal years beginning after November 15, 2007. This statement permits an entity to choose to measure many financial instruments and certain other items at fair value at specified election dates. Subsequent unrealized gains and losses on items for which the fair value option has been elected will be reported in earnings. We are currently evaluating the potential impact of SFAS 159 on our financial statements.
F-126
Table of Contents
Statement of Financial Accounting Standard No. 160, “Noncontrolling Interests in Consolidated Financial Statements and amendment of Accounting Research Bulletin No. 51”
In December 2007, the FASB issued SFAS No. 160,Noncontrolling Interests in Consolidated Financial Statements—and amendment of Accounting Research Bulletin No. 51(SFAS 160). SFAS 160 establishes accounting and reporting standards for ownership interests in subsidiaries held by parties other than the parent, the amount of consolidated net income attributable to the parent and to the noncontrolling interest, changes in a parent’s ownership interest, and the valuation of retained noncontrolling equity investments when a subsidiary is deconsolidated. SFAS 160 also establishes disclosure requirements that clearly identify and distinguish between the interests of the parent and the interests of the noncontrolling owners. SFAS 160 is effective for fiscal years beginning after December 15, 2008, and will be adopted by us in the first quarter of fiscal 2009. We are currently evaluating the potential impact, if any, of the adoption of SFAS 160 on our consolidated results of operations and financial condition.
3. Discontinued operations
On December 19, 2007, the Company approved the discontinuation of the EdgeFlex product line. The EdgeFlex product line was acquired in 2007 (see note 5). As a result of this decision, the Company recorded a charge of approximately $8.5 million. The charge consisted of an impairment of intangible assets acquired in connection with the March 2007 acquisition of IP networking product assets from Mangrove Systems, Inc. ($4.7 million), a charge for inventory impairment associated with the EdgeFlex product line ($3.3 million), fixed assets likely to be disposed of at less than their book value ($300,000), and severance and other costs ($200,000).
Summary results of discontinued operations were as follows:
| (In thousands) | December 31, 2007 | |||
Net sales | $ | 244 | ||
Cost of sales | 765 | |||
Gross loss | (521 | ) | ||
Research and development | 4,141 | |||
Intangible asset amortization | 615 | |||
Loss on divestiture of operations | 8,493 | |||
Net loss on discontinued operations | $ | (13,770 | ) | |
4. Investments
The Company has investments in marketable securities, all of which were classified as available for sale at December 31, 2007 as follows (in thousands):
| Balances as of December 31, 2007 | Cost | Unrealized gains | Unrealized losses | Fair value | |||||||||
U.S. government securities | $ | 11,068 | $ | 13 | $ | (2 | ) | $ | 11,079 | ||||
State and local governments | 3,900 | — | — | 3,900 | |||||||||
Corporate debt securities | 22,860 | 11 | (10 | ) | 22,861 | ||||||||
Total Investments | $ | 37,828 | $ | 24 | $ | (12 | ) | $ | 37,840 | ||||
F-127
Table of Contents
The following table summarizes the fair value and gross unrealized losses on our investments in marketable securities with unrealized losses, aggregated by the type of investment instrument and length of time that the individual securities have been in a continuous unrealized loss position as of December 31, 2007 (in thousands):
| Less than 12 months | 12 months or greater | Total | |||||||||||||||||||
| Balances as of December 31, 2007 | Fair value | Gross unrealized | Fair value | Gross unrealized | Fair value | Gross unrealized | |||||||||||||||
U.S. Government securities | $ | 1,993 | $ | (1 | ) | $ | 1,500 | $ | — | $ | 3,493 | $ | (1 | ) | |||||||
Corporate debt securities | 4,553 | (7 | ) | 2,000 | (2 | ) | 6,553 | (9 | ) | ||||||||||||
Total investments | $ | 6,546 | $ | (8 | ) | $ | 3,500 | $ | (2 | ) | $ | 10,046 | $ | (10 | ) | ||||||
The Company’s investments include U.S., state and municipal government obligations and domestic public corporate debt securities. Investments are classified as short-term or long-term based on the nature of these securities and the availability of these securities to meet current operating requirements. All of these investments are held in the name of the Company at a limited number of financial institutions.
As of December 31, 2007, all of the Company’s investments were marketable securities classified as short term, available for sale securities, and are reported at their fair values based upon quoted market prices as of the reporting date. If these investments are sold at a loss or experience a decline in value that is not temporary, the loss is recognized in the statement of operations for that period. Unrealized gains or losses that are considered temporary in nature are recorded as a separate component of cumulative other comprehensive income (loss) in stockholders’ equity, net of the related tax effect. Subsequent recoveries in the fair value, if any, are not recognized in the statement of operations, but as a component of accumulated other comprehensive income (loss). The specific identification method is used to determine the cost of securities disposed of, with realized gains and losses recorded in interest income, net. During 2007 and 2006, the Company did not incur significant realized gains or losses on disposals of marketable securities. The unrealized loss balances on U.S. government and corporate debt securities resulted primarily from interest rate increases. Because the Company has the ability and intent to hold these securities until a recovery of fair value, which may be at maturity, the Company does not consider these securities to be other than temporarily impaired at December 31, 2007.
The Company’s investment policy limits the concentration of its investments in any single instrument to a maximum of $3 million or 10%, whichever is less, other than U.S. government or agencies securities, which do not have limitations. All of the Company’s securities must be readily marketable and have high quality debt ratings from either Moody’s or Standard & Poors. Investments may not have maturities in excess of three years, and the average portfolio maturity is maintained at one year or less. The weighted average portfolio days to maturity for marketable securities available for sale was approximately 122 days at December 31, 2007. The Company is in compliance with its investment policy at December 31, 2007.
F-128
Table of Contents
5. Business combinations
White Rock Shanghai, Ltd.
On October 24, 2006, the Company purchased all of the outstanding common stock of White Rock Shanghai, Ltd. (subsequently renamed Carrier Access Shanghai, Ltd.), a wholly-owned foreign enterprise located near Shanghai, in the People’s Republic of China, for $460,000. The results of Carrier Access Shanghai, Ltd.’s (Carrier Shanghai) operations have been included in the Company’s Consolidated Financial Statements since the acquisition date. Carrier Shanghai conducts testing of certain of the Company’s products for performance to specifications under an intercompany service agreement, and has no significant assets beyond those required to perform product testing, no other customers or other operations. The purchase was made to expand our international presence, capabilities, and to reduce certain research and development related costs. The estimated fair value of the net assets purchased, net of cash acquired, which consisted primarily of computer equipment, was approximately $321,000, and did not include significant intangible assets or goodwill.
Mangrove Systems, Inc.
On March 2, 2007, the Company completed its acquisition of substantially all of the assets of Mangrove Systems, Inc. (Mangrove) pursuant to the terms of an Asset Purchase Agreement of the same date. Mangrove products included the Piranha 100 and 600, which were rebranded as the Carrier Access EdgeFLEX(TM) 100 and 600, respectively. The acquired assets primarily consisted of optically-fed IP transport integration products which complemented the Company’s portfolio of IP service convergence solutions at both access and optical edge locations.
Pursuant to the Asset Purchase Agreement, Mangrove creditors received $6.7 million in cash at closing and were eligible to receive a maximum of $1.2 million for outstanding liabilities assumed by the Company. Approximately $700,000 of the closing cash was placed into escrow to be held as security for losses incurred by the Company in the event of certain breaches of the representations and warranties covered in the Asset Purchase Agreement. Acquisition-related transaction costs include legal fees and other third party costs directly related to the acquisition. The total purchase price of $8.1 million was comprised of:
| (in thousands) | Amount | ||
Cash paid | $ | 6,700 | |
Liabilities assumed | 1,200 | ||
Acquisition-related transaction costs | 178 | ||
Total consideration | $ | 8,078 | |
F-129
Table of Contents
The acquisition was accounted for using the purchase method of accounting and, accordingly, the purchase price was allocated to the net tangible and intangible assets acquired based on preliminary fair values on the acquisition date. The Company engaged an independent third party valuation firm to assist with an appraisal of certain acquired assets. The Company allocated the purchase price as follows:
| (in thousands) | Amount | ||
Inventories | $ | 2,120 | |
Other assets | 77 | ||
Property and equipment | 533 | ||
Goodwill | 1,108 | ||
Other intangible assets | |||
Developed product technology | 2,320 | ||
Customer relationships | 1,920 | ||
Total consideration | $ | 8,078 | |
On December 19, 2007, the Company approved the discontinuation of the EdgeFlex product line. See Note 3—Discontinued Operations for additional information.
6. Inventories
Inventories are valued at the lower of cost or market, with cost computed using standard costs that approximate average purchase costs. Consideration is given to obsolescence, excessive levels, deterioration and other factors in evaluating net realizable value. Inventories as of December 31 consist of the following (in thousands):
| (in thousands) | 2007 | |||
Raw materials | $ | 17,610 | ||
Work-in-process | 17 | |||
Finished goods | 3,419 | |||
Reserve for obsolescence | (14,242 | ) | ||
| $ | 6,804 | |||
7. Property and equipment, net
Property and equipment, net as of December 31 consisted of the following (dollars in thousands):
| Estimated useful life | 2007 | |||||
Computer equipment and software | 3 to 5 years | $ | 7,055 | |||
Real property | 25 years | — | ||||
Equipment, furniture, fixtures and other | 3 to 7 years | 14,664 | ||||
Leasehold improvements | Shorter of lease or 7 years | 352 | ||||
| 22,071 | ||||||
Less accumulated depreciation and amortization | (19,390 | ) | ||||
| $ | 2,681 | |||||
F-130
Table of Contents
On January 16, 2008, the Company entered into an agreement to sell the Company’s principal offices located at 5395 Pearl Street, Boulder, Colorado for approximately $6.25 million, less transaction costs. The transaction has a scheduled closing of March 20, 2008. In addition to an initial $100,000 deposit, the agreement requires the buyer to make an earnest money deposit of $900,000 if the buyer does not otherwise terminate the agreement as permitted by its terms on or before February 14, 2008, after which date the obligation to make the additional deposit becomes irrevocable. The agreement requires the Company to lease back approximately 30,000 square feet of the property with a lease expiration date of August 15, 2008. In December 2007, the Company recorded an impairment loss of $150,000 related to the fair value of the building and classified the land, building and related leasehold improvements (“Real property”) as assets held for sale. The amount classified as held for sale as of December 31, 2007 was $6.1 million.
8. Goodwill and intangibles
In connection with the discontinuance of the Edgeflex product line, goodwill and other intangible assets with a net book value at December 31, 2007 of $4.7 million were determined to be impaired. See Note 3—Discontinued Operations.
The following table presents details of the Company’s intangible assets as of December 31:
| 2007 | ||||||||||||
| (dollars in thousands) | Useful life (years) | Gross value | Accumulated amortization | Net value | ||||||||
Customer relationships | 7 | $ | 5,100 | $ | (2,975 | ) | $ | 2,125 | ||||
Developed technology | 5 | 2,500 | (2,041 | ) | 459 | |||||||
Trademarks and patents | 17 | 294 | (101 | ) | 193 | |||||||
Total | $ | 7,894 | $ | (5,117 | ) | $ | 2,777 | |||||
Amortization expense was $1.2 million for each of the years ended December 31, 2007 and 2006, respectively. The estimated future amortization expense for intangible assets as of December 31, 2007 is as follows (in thousands):
| Year ending December 31, | Amount | ||
2008 | $ | 1,204 | |
2009 | 745 | ||
2010 | 685 | ||
2011 | 17 | ||
2012 | 17 | ||
Thereafter | 109 | ||
Total | $ | 2,777 | |
Upon the acquisition of Paragon, the Company recorded approximately $6.7 million of goodwill. The total goodwill amount was determined using the residual method under Statement of Financial Accounting Standard No. 141“Business Combinations” (“FAS 141”) and Statement of Financial Accounting Standard No. 142 “Goodwill and Other Intangible Assets”(“FAS 142”). In the fourth quarter of 2004, we finalized our purchase price accounting and recorded an additional $840,000 of goodwill related to a preacquisition tax contingency.
In the third quarters of 2007 and 2006, the Company completed its annual goodwill impairment test as required by FAS 142. Our assessment of goodwill impairment was conducted by estimating
F-131
Table of Contents
and comparing the fair value of our reporting unit, as defined in FAS 142, to the reporting unit carrying value as of that date. Based on the results of this impairment test, the Company determined that its goodwill asset was not impaired during 2007 or 2006, with the exception of EdgeFlex, which was included in discontinued operations. The Company plans to conduct annual impairment tests in the third quarter of each year, unless impairment indicators exist at an earlier date each year.
9. Stockholders’ equity
Stock repurchase program
On April 11, 2005, the Company’s Board of Directors authorized a stock repurchase plan, authorizing an aggregate repurchase of up to 5,000,000 shares of our common stock. We first began purchasing shares of our common stock under the plan in November 2005, and as of December 31, 2005, we had purchased 1.0 million shares at an average purchase price of $4.81 per share, for an aggregate purchase price of $4.8 million. The repurchased shares have been retired and are classified as authorized and unissued shares. The Company did not repurchase any shares during the years ended December 31, 2007 or 2006. The remaining authorized number of shares that may be repurchased is 4 million, until terminated by the Board of Directors. In accordance with Accounting Principles Board Opinion No. 6, “Status of Accounting Research Bulletins”, the Company allocated the excess of the repurchase price over the par value of shares repurchased for retirement as a reduction to additional paid-in capital.
Other changes
Issuance of common stock, and the associated tax benefit (if any) related to stock options exercised by employees, are recorded as an increase to common stock and additional paid-in capital.
Stock-based compensation expense under FAS 123(R) is charged to additional paid-in capital as incurred. The difference between actual tax deductions available to the Company and estimated tax deductions recorded upon the issuance of employee stock options is credited to additional paid-in capital when recognized. The Company did not recognize any tax effects related to employee stock option exercises during the years ended December 31, 2007 or 2006. See Note 11, “Income Taxes” for additional information.
10. Stock based compensation
The Company’s 1998 Stock Incentive Plan (the “Plan”) provides for five separate components. The Discretionary Option Grant Program, administered by the Compensation Committee appointed by the Company’s Board of Directors, provides for the grant of incentive and non-qualified options to purchase Common Stock to employees, consultants or directors. The Stock Issuance Program, administered by the Compensation Committee, provides for the issuance of Common Stock to employees, consultants or directors directly through the purchase of the shares at the fair market value of the shares at the date of issuance, or as a bonus tied to the performance of services. The Salaried Investment Option Grant Program, if activated, allows executive officers and other highly compensated employees selected by the Compensation Committee to apply a portion of their base salary towards the acquisition of special below-market stock option grants. The Automatic Option Grant Program provides for automatic option grants at periodic intervals to eligible non-employee Board members to purchase shares of Common Stock at a price equal to
F-132
Table of Contents
their fair market value on the grant date. The Director Fee Option Program, if activated for one or more calendar years, allows non-employee Board members to apply a portion of their annual retainer fee to the acquisition of special below-market option grants. All stock options outstanding have been granted under the Discretionary Option Grant Program and the Automatic Option Grant Program. The Company has not activated any of the other programs permitted by the Plan.
The Plan currently authorizes the grant of options to purchase up to 10,342,014 shares of authorized common stock. On the first trading day of each year, the lesser of two and one-half percent (2.5%) of the shares of Common Stock outstanding as of the last trading day of the preceding calendar year, or an additional 562,500 shares, are made available for grant under the Plan. Expired options are returned to the Plan as they expire and are made available for grant. Incentive stock options have a ten-year term and non-qualified stock options generally have a five-year term. A majority of the stock options vest 25% on the first anniversary date of the grant and 6.25% each quarter thereafter, with the remaining stock options vesting quarterly from the grant date. As of December 31, 2007, all outstanding options were non-qualified stock options. The Compensation Committee of the Board of Directors has discretion to use a different vesting schedule and has done so from time to time. Since the inception of the 1998 Plan, the Company has granted stock options to virtually all employees, and the majority has been granted to non-executive employees.
Stock-based compensation expense recognized under SFAS 123(R) in the Company’s Consolidated Statement of Operations for the years ended December 31, 2007 and 2006 was $3.4 million and $2.5 million, respectively, representing $0.10 and $0.07 basic and diluted loss per share. The Company did not recognize a tax benefit from share-based compensation expense because the Company considers it is more likely than not that the related deferred tax assets, which have been reduced by a full valuation allowance, will not be realized.
The following table summarizes stock-based compensation expense recorded under SFAS 123(R) for the years ended December 31, 2007 and 2006 and its allocation within the Consolidated Statement of Operations (in thousands, except per share data):
| December 31, | ||||||
| 2007 | 2006 | |||||
Cost of sales | $ | 148 | $ | 139 | ||
Research and development | 782 | 723 | ||||
Sales and marketing | 894 | 762 | ||||
General and administrative | 1,625 | 877 | ||||
Stock-based compensation expense included in operating expenses | 3,301 | 2,362 | ||||
Total stock-based compensation expense | 3,449 | 2,501 | ||||
Tax benefit | — | — | ||||
Total stock-based compensation expense, net of tax | $ | 3,449 | $ | 2,501 | ||
Effect of SFAS 123(R) on basic and diluted loss per share | $ | 0.10 | $ | 0.07 | ||
F-133
Table of Contents
The weighted average per share fair value of stock options granted during the years ending December 31, 2007 and 2006, and the assumptions used to estimate fair value as of the grant date using the Black-Scholes option pricing model were as follows:
| December 31, | ||||||
| Years ended | 2007 | 2006 | ||||
Volatility | 87 | % | 96 | % | ||
Expected option term | 4 1/2 years | 4 1/2 years | ||||
Risk free interest rate | 4.6 | % | 4.7 | % | ||
Expected dividend yield | 0 | % | 0 | % | ||
Weighted average fair value per share | $2.72 | $3.67 | ||||
The following table summarizes stock option activity under the Plan:
| Number of shares | Weighted average exercise price | Weighted average remaining contractual term | Aggregate intrinsic value | ||||||||
Outstanding as of January 1, 2006 | 3,215,872 | $ | 5.48 | ||||||||
Granted | 1,237,500 | 6.39 | |||||||||
Exercised | (525,298 | ) | 2.65 | ||||||||
Canceled or forfeited | (788,043 | ) | 5.48 | ||||||||
Outstanding as of December 31, 2006 | 3,140,031 | 6.32 | |||||||||
Granted | 1,067,250 | 5.06 | |||||||||
Exercised | (399,545 | ) | 1.69 | ||||||||
Canceled or forfeited | (1,061,706 | ) | 6.46 | ||||||||
Outstanding as of December 31, 2007 | 2,746,030 | 6.45 | 3.47 | $ | 43,000 | ||||||
Exercisable as of December 31, 2007 | 1,173,038 | 7.79 | 2.95 | 43,000 | |||||||
The aggregate intrinsic value in the table above represents the total pretax intrinsic value, based on the Company’s closing stock price of $2.40 at December 31, 2007, which would have been received by option holders had all option holders exercised their options that were in-the-money as of that date. The total number of in-the-money options exercisable as of December 31, 2007 was approximately 40,000. The aggregate intrinsic value of awards exercised during the year ended December 31, 2007 was $1.3 million.
The following table summarizes significant ranges for options outstanding and currently exercisable as of December 31, 2007:
| Stock options outstanding | Stock options exercisable | |||||||||||
| Range of exercise prices | Number of options outstanding | Weighted- (in years) | Weighted- average exercise price per share | Number of options exercisable | Weighted- average exercise price per share | |||||||
$ 0.77 – 4.38 | 439,362 | 4.20 | $ | 3.86 | 243,781 | $ | 3.59 | |||||
4.42 – 4.62 | 448,500 | 3.02 | 4.58 | 137,500 | 4.61 | |||||||
4.67 – 5.70 | 409,156 | 3.67 | 5.25 | 74,466 | 5.05 | |||||||
5.75 – 6.23 | 809,500 | 3.90 | 6.05 | 148,562 | 6.18 | |||||||
6.32 – 10.35 | 474,512 | 2.93 | 8.78 | 411,854 | 8.99 | |||||||
10.68 – 37.00 | 165,000 | 1.57 | 16.58 | 156,875 | 16.80 | |||||||
| 2,746,030 | 3.46 | 6.45 | 1,173,038 | 7.79 | ||||||||
F-134
Table of Contents
As of December 31, 2007, the total unrecorded deferred stock-based compensation balance for unvested options, net of expected forfeitures, was $1.8 million, which is expected to be amortized over a weighted-average period of 1.3 years.
In April 2007, the Company issued a grant of 25,000 Restricted Stock Units (“RSUs”) pursuant to the Stock Issuance Program under the Plan. RSUs represent a promise to deliver shares of common stock to a recipient at a future date if certain vesting conditions are met. Vesting in this RSU award was contingent upon achieving certain performance targets. For the year ended December 31, 2007, 17,000 RSUs from this grant vested and common shares were issued, the remainder of this award was forfeited. The Company recorded compensation expense related to this award totaling approximately $79,000.
During the year ended December 31, 2007, the Company issued grants of 915,000 RSUs to certain employees pursuant to the Stock Issuance Program under the Plan, 400,000 of which are performance based and 515,000 of which are time based. The performance based RSUs are earned upon achievement of certain revenue and non-GAAP operating income targets. These performance based RSUs generally vest in two equal annual installments, with 50% vesting on the first anniversary of the grant date and an additional 50% vesting on the second anniversary of the grant date, assuming achievement of the performance targets. The time based RSUs vest in either two or three equal annual installments from the date of grant. Vesting for both performance based and time based grants is accelerated in the event of a change in control. The Company recorded compensation expense related to these RSU awards totaling approximately $939,000 for the year ended December 31, 2007. This expense is included in the total stock-based compensation expense that was recorded by the Company.
Restricted stock unit activity for the year ended December 31, 2007 is summarized as follows:
| Number of RSUs | Weighted average grant- | |||||
RSUs outstanding at January 1, 2007 | — | $ | — | |||
Granted | 940,000 | 4.85 | ||||
Vested | (17,000 | ) | 4.65 | |||
Forfeited | (133,000 | ) | 4.92 | |||
RSUs outstanding at December 31, 2007 | 790,000 | 4.84 | ||||
Total estimated unrecognized compensation cost from unvested RSUs, net of expected forfeitures, as of December 31, 2007 was approximately $2.0 million, which is expected to be recognized over a weighted average period of approximately 1.2 years.
Modifications of stock options granted
On December 27, 2005, the Company’s Board of Directors approved acceleration of vesting for all unvested stock options, excluding options held by executive officers and directors, with an exercise price per share greater than $7.05. As a result, options previously awarded to current employees for the purchase of 359,335 shares of the Company’s common stock vested immediately. The accelerated options have exercise prices ranging from $7.06 to $15.40. The weighted average exercise price of these options is $10.73.
F-135
Table of Contents
The decision to accelerate the vesting of these options, which the Board of Directors believed was in the best interest of Carrier Access shareholders and employees, was made primarily to reduce non-cash compensation expense that would have been recorded in the Company’s income statement in future periods upon the adoption of SFAS 123(R) beginning January 1, 2006. In addition, because these options have exercise prices well in excess of current market values, the Company believes that they are not achieving their original objectives of incentive compensation and retention. The Company estimates that as a result of these accelerations, the pre-tax stock-based compensation expense it would otherwise have been required to record in connection with the accelerated options was reduced by approximately $1.1 million.
On August 26, 2005, the Company’s Board of Directors approved a modification to the expiration date of certain vested options held by certain former employees under the 1988 Stock Incentive Plan due to an extended “blackout” period. Under the terms of the modifications, former employees were granted an additional three-month period in which to exercise vested options adjusted by the number of days prior to May 5, 2005, if any, that the employee could have exercised the options. In accordance with Financial Accounting Standards Board Interpretation No. 44, “Accounting for Certain Transactions Involving Stock-Based Compensation, an interpretation of APB Opinion No. 25”, the Company recognized compensation expense of approximately $77,000 for the year ended December 31, 2005 in connection with this modification.
11. Income taxes
Income tax expense (benefit) for the years ended December 31 consists of the following:
| (in thousands) | 2007 | 2006 | |||||
U.S. taxes | |||||||
Current | $ | 47 | $ | (16 | ) | ||
Deferred | — | — | |||||
U.S. Income tax expense (benefit) | $ | 47 | $ | (16 | ) | ||
Foreign taxes | |||||||
Current | $ | — | $ | — | |||
Deferred | — | — | |||||
Foreign Income tax expense (benefit) | — | — | |||||
Total Income tax expense (benefit) | $ | 47 | $ | (16 | ) | ||
A reconciliation of expected income tax expense (benefit) calculated by applying the statutory Federal tax rate to actual income tax expense (benefit) for the years ended December 31 is as follows:
| (in thousands) | 2007 | 2006 | ||||||
Reconciliation of statutory income tax expense (benefit) to actual | ||||||||
Expected income tax expense (benefit) | $ | (19,250 | ) | $ | (5,198 | ) | ||
State income taxes, net of federal taxes | (1,770 | ) | (228 | ) | ||||
Change in estimated effective state tax rate | 3,648 | 6 | ||||||
Change in valuation allowance | 17,211 | 5,292 | ||||||
Exercise of non-qualified stock options) | — | — | ||||||
Other, net | 208 | 112 | ||||||
Actual income tax expense (benefit) | $ | 47 | $ | (16 | ) | |||
F-136
Table of Contents
The tax effects of significant temporary differences that result in deferred tax assets and liabilities at December 31 are as follows:
| (in thousands) | 2007 | |||
Deferred tax assets | ||||
Allowance for doubtful accounts and returns | $ | 209 | ||
Inventory reserves | 5,506 | |||
Compensation accruals | 246 | |||
Goodwill | 1,565 | |||
Net operating loss carry forwards | 35,623 | |||
Research and experimentation credit | 1,972 | |||
Stock-based compensation | 2,054 | |||
Unearned income | — | |||
Other | 1,502 | |||
Discontinued operations | 3,172 | |||
Gross deferred tax assets | 51,849 | |||
Less: Valuation allowance | (51,475 | ) | ||
Total deferred income tax assets | 374 | |||
Deferred tax liabilities | ||||
Paragon identifiable intangibles | (987 | ) | ||
Other | 613 | |||
Total deferred income tax liabilities | (374 | ) | ||
Net deferred income tax assets | $ | — | ||
The components of deferred tax assets and liabilities at December 31 are as follows:
| (in thousands) | 2007 | |||
Current assets | $ | 43 | ||
Current liabilities | — | |||
Net current deferred tax assets (liabilities) | 43 | |||
Non-current assets | 331 | |||
Non-current liabilities | (374 | ) | ||
Net non-current deferred tax assets (liabilities) | $ | (43 | ) | |
As of December 31, 2007, the Company has available tax net operating loss carry forwards and tax credit carry forwards of approximately $99.1 million and $2.0 million, respectively. The net operating loss carry forwards began to expire in 2007. The tax credit carry forwards begin to expire in 2012. A portion of the future utilization of the Company’s net operating loss carry forwards associated with the Paragon acquisition in 2003, amounting to approximately $11.8 million, is limited because the acquisition resulted in an ownership change.
The Company has approximately $120.1 million of available net operating loss carry forwards for state tax purposes, which may be carried forward to offset future state taxable income, subject to state legislative restrictions which vary among the States.
F-137
Table of Contents
The Company recorded a valuation allowances of $51.5 million as of December 31, 2007, to fully reserve deferred tax assets as the realization criteria have not been met. In the future, should management conclude that these deferred tax assets are, at least in part, realizable, the valuation allowance will be reduced to the extent of such realization and recognized as a deferred income tax benefit in the statement of operations, except as noted herein. The valuation allowance at December 31, 2007 includes a reserve established at the time of the Paragon acquisition related to net deferred tax assets acquired of approximately $6.9 million. Should the Company conclude the valuation allowance with respect to these acquired net deferred tax assets is no longer necessary, the amount will be recorded as a decrease in the carrying amount of acquired goodwill. Also included in the valuation allowance is a $12.5 million reserve for the federal tax benefit resulting from certain exercises of employee non-qualified stock options. To the extent the valuation allowance related to these stock based compensation benefits is no longer considered necessary, an adjustment will be recorded directly to additional paid in capital.
In July 2006, the Financial Accounting Standards Board issued FIN 48, which clarifies the accounting and disclosure for uncertainty in tax positions, as defined. FIN 48 seeks to reduce the diversity in practice associated with certain aspects of the recognition and measurement related to accounting for income taxes. The Company is subject to the provisions of FIN 48 as of January 1, 2007, and has analyzed filing positions in all of the federal and state jurisdictions where it is required to file income tax returns, as well as all open tax years in these jurisdictions. The Company has identified its federal tax return and its Colorado tax return as “major” tax jurisdictions, as defined. The periods subject to examination for the Company’s federal tax returns are tax years 2004 through 2006. The periods subject to examination for the Company’s state tax returns are years 2003 through 2006. The Company believes that its income tax filing positions and deductions will be sustained on audit and does not anticipate any adjustments that will result in a material adverse effect on the Company’s financial condition, results of operations, or cash flow. Therefore, no reserves for uncertain income tax positions have been recorded pursuant to FIN 48. In addition, the Company did not record a cumulative effect adjustment related to the adoption of FIN 48.
12. Significant customers, suppliers and concentration of credit risk
The following table discloses significant customers from whom the Company recognized revenue that comprised 10% or more of the Company’s net revenues in each of the years ended December 31:
| (in thousands) | 2007 | 2006 | ||||
Company | ||||||
A | $ | 5,099 | $ | 27,021 | ||
B | 2,960 | 8,013 | ||||
Although the Company generally uses standard parts and components for its products, many key components are purchased from sole or single source vendors for which alternative sources may not currently be available. The identification and utilization of new suppliers for such items could adversely impact the Company’s future operating results.
The Company is exposed to potential concentrations of credit risk from its accounts receivable with its various customers and receivables are concentrated among customers in the telecommunications industry. To reduce this risk, the Company has a policy of assessing the
F-138
Table of Contents
creditworthiness of its customers and monitors the aging of its accounts receivable for potential uncollectible accounts. An allowance is recorded for estimated losses from write-offs of uncollectible accounts. Bad debt recoveries were $91,000 and $375,000 in 2007 and 2006, respectively.
13. Employee benefit plan
The Company has a defined contribution employee benefit plan (the 401(k) Plan) under Section 401(k) of the Internal Revenue Code that is available to all employees who meet the 401(k) Plan’s eligibility requirements. Employees may contribute up to the maximum limits allowed by the Internal Revenue Code. Effective January 1, 2006, the Company reinstated an employer matching contribution to the 401(k) Plan that provides for matching 50% of an employee’s pre-tax contributions, up to the lesser of $2,000 or 6% of each participating employee’s annual salary. Company employer matching contributions were $411,000 and $322,000 during the years ended December 31, 2007 and 2006, respectively.
14. Commitments and contingencies
Guarantees
We provide indemnifications of varying scope and size to certain customers against claims of intellectual property infringement made by third parties arising from the use of our products. The Company has agreed to hold the other parties harmless against losses arising from a breach of representations or covenants, or out of intellectual property infringement or other such claims made against certain parties. We evaluate estimated losses for such indemnifications under Statement of Financial Accounting Standard No. 5, “Accounting for Contingencies”, as interpreted by FASB Interpretation 45, “Guarantor’s Accounting and Disclosure Requirements for Guarantees, Including Indirect Guarantees of Indebtedness of Others”. We consider such factors as the degree of probability of an unfavorable outcome and the ability to make a reasonable estimate of loss. It is not possible to determine the maximum potential amount under these indemnification agreements due to the limited history of prior indemnification claims and the unique facts and circumstances involved in each particular agreement. To date, we have not encountered material costs as a result of such obligations, and have not accrued any liabilities related to such indemnifications in our consolidated financial statements.
Officer and director indemnification
As permitted or required under Delaware law and to the maximum extent allowable under that law, the Company has certain obligations to indemnify its current and former officers and directors for certain events or occurrences while the officer or director is, or was serving, at the Company’s request in such capacity. These indemnification obligations are valid as long as the officer or director acted in good faith and in a manner the person reasonably believed to be in or not opposed to the bests interests of the Company, and, with respect to any criminal action or proceeding, had no reasonable cause to believe his or her conduct was unlawful. The maximum potential amount of future payments the Company could be required to make under these indemnification obligations is unlimited; however, the Company has a director and officer insurance policy that mitigates the Company’s exposure and enables the Company to recover a portion of any future amounts paid. As a result of the Company’s insurance policy coverage, the Company believes the estimated fair value of these indemnification obligations is minimal.
F-139
Table of Contents
Other indemnifications
As is customary in the Company’s industry, as provided for in local law in the U.S. and other jurisdictions, the Company’s standard contracts provide remedies to its customers, such as defense, settlement or payment of judgment for intellectual property claims related to the use of our products. From time to time, the Company provides standard indemnification to our customers against combinations of loss, expense or liability arising from various trigger events related to the sale and use of our products and services.
Litigation
In November of 2003, the Company acquired Paragon. In connection with the acquisition, the Company assumed liabilities for value-added taxes and employee payroll taxes that may be payable to certain foreign taxing authorities. The estimated fair value of value-added taxes, employee payroll taxes and associated interest and penalties assumed was estimated to be approximately $840,000. Estimated employee payroll taxes, value-added taxes, and interest and penalties on unremitted balances incurred after the acquisition dates have been accrued and expensed. The total amount of the contingent liability as of December 31, 2007 including taxes was approximately $1.59 million. It is reasonably possible that the Company’s estimates will differ from the amounts ultimately paid to settle this liability. Adjustments to the Company’s estimates or to what is ultimately paid to taxing authorities in future periods will be included in earnings of the period in which the adjustment is determined.
On February 8, 2008, the Company received a Complaint and Summons, filed by General Datacomm, Inc., alleging breach of contract and requesting specific performance and unspecified damages. General Datacomm asserts the right to require the Company to escrow source materials related to the EdgeFlex product line and to obtain a license to manufacture and support the product line. The Company denies the allegations made by General Datacomm, and intends to vigorously defend its position.
Class action and derivative lawsuits
Beginning on June 3, 2005, three purported shareholder class action lawsuits were filed in the United States District Court for the District of Colorado against Carrier Access and certain of its officers and directors. The cases, captionedCroker v. Carrier Access Corporation, et al., Case No. 05-cv-1011-LTB;Chisman v. Carrier Access Corporation, et al., Case No. 05-cv-1078-REB, andSved v. Carrier Access Corporation, et al., Case No. 05-cv-1280-EWN, have been consolidated and a consolidated amended complaint was filed January 17, 2006. The action is purportedly brought on behalf of those who purchased Carrier Access publicly traded securities between October 21, 2003 and May 20, 2005. Plaintiffs allege that defendants made false and misleading statements, purport to assert claims for violations of the federal securities laws, and seek unspecified compensatory damages and other relief. The complaint is primarily based upon allegations of wrongdoing in connection with the Company’s announcement of its intention to restate previously issued financial statements for the years ended December 31, 2003 and 2004 and certain interim periods in each of the years ended December 31, 2003 and 2004. On July 18, 2006, the Court denied defendants’ motions to dismiss the consolidated complaint. No trial date has been set for this matter. On October 30, 2007, plaintiffs filed a stipulation of settlement and an unopposed motion for preliminary approval of settlement. The Court granted an Order preliminarily approving settlement and scheduled a settlement hearing for January 25, 2008. At the settlement hearing, the Court granted final approval of settlement and dismissed the case with prejudice.
F-140
Table of Contents
Beginning on June 13, 2005, three purported shareholder derivative lawsuits were filed in the United States District Court for the District of Colorado, against various Carrier Access officers and directors and naming Carrier Access as a nominal defendant. The cases are captionedKenney v. Koenig, et al., Case No. 05-cv-1074-PSF,Chaitman v. Koenig, et al., Case No. 05-cv-1095-LTB andWest Coast Management and Capital, LLC v. Koenig[sic],et al., Case No. 05-cv-1134-RPM. The complaints include claims for breach of fiduciary duty, abuse of control, waste of corporate assets, mismanagement and unjust enrichment; seek compensatory damages, disgorgement, and other relief; and are based on essentially the same allegations as the class actions described in the preceding paragraph. These actions were consolidated in August 2005 and a consolidated amended complaint was filed in September 2005. The Company and the Individual Defendants filed motions to dismiss the complaint on October 12, 2005. On March 30, 2006, the District Court granted the Company’s Motion to Dismiss without prejudice.
In addition, on September 28, 2005, a purported shareholder derivative action was filed in Boulder County District Court. That action, captionedNovak v. Barnett, et al., Case No. 05-cv-02124, was removed to federal court on October 24, 2005 and consolidated with the previously consolidated federal derivative actions, described above. On September 12, 2005, another purported shareholder derivative action, captionedDietz v. Barnett, et al., Case No. 05-cv-000843, was filed in Boulder County District Court. The allegations of theDietzcomplaint are similar to the allegations in the previously consolidated federal shareholder derivative actions. Following the granting of the Company’s Motion to Dismiss in the consolidated federal shareholder derivative lawsuits referenced above, plaintiffs inDietz v. Koenig, et. al.filed a Notice of Dismissal of Action Pursuant to C.R.C.P. 41(a)(1)(A) on April 6, 2006, which was granted by the respective court on April 11, 2006.
On March 7, 2007, a shareholder derivative lawsuit was filed in the United States District Court for the District of Colorado purportedly on behalf of Carrier Access against various current and former Company officers and directors. The case is captionedWest Coast Management and Capital, LLC v. Koenig, et al. Case No. 1:07CV00459. In this case, plaintiff made a demand on the Carrier Access Board to take action against the individual defendants based on the same allegations raised in the previous derivative suit filed by this plaintiff and dismissed by the District of Colorado on March 30, 2006. Carrier Access and the Individual Defendants filed motions to dismiss plaintiff’s Complaint on May 21, 2007 for failure to plead improper demand refusal and for failure to state a claim upon which relief could be granted. Plaintiff filed oppositions to these motions on June 14, 2007 and reply briefs were filed on July 2, 2007. On July 16, 2007, plaintiff and defendants filed a letter of settlement with the Court. A Stipulation and Agreement of Compromise, Settlement, and Release was filed on July 30, 2007. Plaintiff filed a motion for preliminary approval of the settlement on August 9, 2007, and the Court granted an Order preliminarily approving the settlement on November 8, 2007. A settlement hearing for final approval was held on January 28, 2008. The Court did not rule on the validity of the settlement and scheduled an evidentiary hearing for March 24, 2008.
Additionally, on May 16, 2007, plaintiff James Kenney filed another shareholder derivative lawsuit in Boulder County Court purportedly on behalf of Carrier Access and against various current and former Company offices and directors. This case is captionedKenney v. Koenig, et al., Case No. 2007-cv-423. The allegations in this case are nearly identical to those filed in the federal derivative lawsuit by plaintiff West Coast Management on March 7, 2007. Defendants moved to dismiss plaintiff Kenney’s Complaint for failure to plead improper demand refusal and for failure to start a claim on June 5, 2007. Rather than oppose defendants motions to dismiss, plaintiff
F-141
Table of Contents
amended his Complaint on July 17, 2007. Defendants moved to dismiss the Amended Complaint on August 2, 2007. Plaintiff did not file opposition papers to these motions until December 14, 2007. Defendants filed reply papers a week later on December 21, 2007. These motions are currently under submission with the Court.
On January 8, 2008, plaintiff Kenney filed an objection to the proposed settlement of the West Coast derivative litigation. The Company filed a response in opposition to Kenney’s objection on January 16, 2008. That same day, plaintiff West Coast Management filed a motion for final approval of the settlement and a response in opposition to Kenney’s objection. As set forth above, the Court did not rule on the validity of the settlement at the January 28, 2008 hearing. An evidentiary hearing is now scheduled for March 24, 2008.
There are other claims and legal proceedings pending that have arisen in the ordinary course of business. The Company intends to vigorously defend its position in these claims and, based on the currently available information, does not believe that the ultimate outcomes of these unresolved matters, individually and in the aggregate, are likely to have a materially adverse effect on the Company’s financial position, results of operations or liquidity. However, litigation is subject to inherent uncertainties, and our view of these matters may change in the future. Were an unfavorable outcome to occur, it could have a material adverse impact on the Company’s financial position, results of operations and liquidity for the period in which such outcome occurred.
Operating leases
The Company leases certain office, manufacturing and warehouse space under various non-cancelable operating leases that expire during 2008. The Company is contractually obligated under certain of its lease agreements to pay certain operating expenses during the term of the leases, such as maintenance, taxes and insurance. The Company records rent expense under non-cancelable operating leases, including the effect of any future rent escalations or rent holiday periods, on a straight-line basis over the term of the lease. Any difference between actual payments and recorded rent expense is reported within accrued liabilities. Rent expense for the years ended December 31, 2007 and 2006, totaled $1.1 million and $700,000, respectively.
Purchase commitments with contract manufacturers and suppliers
The Company purchases components from a variety of suppliers and uses contract manufacturers to provide manufacturing services for its products. During the normal course of business, in order to manage manufacturing lead times and help ensure adequate component supplies, the Company enters into agreements with contract manufacturers and suppliers that either allows them to procure inventory based upon demand as defined by the Company or based on established parameters defining the Company’s requirements. Subject to certain limitations, the agreements allow the Company to cancel, reschedule or otherwise adjust the Company’s inventory requirements in response to business needs prior to placement of firm orders. Consequently, at any given time, only a portion of the Company’s total purchase commitments arising from these agreements represent firm non-cancelable and unconditional purchase commitments. As of December 31, 2007, the Company had placed non-cancelable purchase orders for approximately $1.5 million of inventory, supplies and services from certain of its vendors for delivery in 2008. These orders are generally placed up to four months in advance based on the lead-time of the inventory.
F-142
Table of Contents
15. Subsequent events
Merger with Turin Networks, Inc.
On February 8, 2008, Carrier Access’ stockholders approved the sale of the Company to Turin Networks, Inc. (Turin) for $92.7 million. Each issued and outstanding share of common stock of Carrier Access will receive $2.60. In-the-money options to purchase common stock of Carrier Access vested and option-holders will receive $2.60 per share, less the exercise price of the option and applicable taxes. Each outstanding restricted stock unit of Carrier Access also vested and holders will receive $2.60 per share, less applicable taxes. Turin, is a global provider of metro transport and switching solutions for wireline, wireless, MSO and private networks. Turin is headquartered in Petaluma, California with R&D facilities in Petaluma, Dallas and Boston, and sales offices throughout the world.
F-143
Table of Contents

Table of Contents
shares
Force10 Networks, Inc.
Common stock
Prospectus
| J.P. Morgan | Deutsche Bank Securities | Barclays Capital | ||
| Baird | Cowen and Company | RBC Capital Markets | ||
| Pacific Crest Securities | ||||
, 2010
Until , 2010, all dealers that buy, sell or trade in our common stock, whether or not participating in this offering, may be required to deliver a prospectus. This is in addition to the dealers’ obligation to deliver a prospectus when acting as underwriters and with respect to their unsold allotments or subscriptions.
Table of Contents
Part II
Information not required in the prospectus
Item 13. Other expenses of issuance and distribution.
The following table sets forth the costs and expenses, other than underwriting discounts and commissions, to be paid by the Registrant in connection with the sale of the shares of common stock being registered hereby. All amounts are estimates except for the SEC registration fee and the FINRA filing fee.
| Amount paid or to be paid | |||
SEC registration fee | $ | 10,250 | |
FINRA filing fee | 14,875 | ||
Printing and engraving | * | ||
Legal fees and expenses | * | ||
Accounting fees and expenses | * | ||
Directors and officers liability insurance | * | ||
Blue sky fees and expenses | * | ||
Transfer agent and registrar fees and expenses | * | ||
Miscellaneous | * | ||
Total | $ | * | |
| * | To be filed by amendment. |
Item 14. Indemnification of directors and officers.
We are incorporated under the laws of the State of Delaware. Section 145 of the Delaware General Corporation Law authorizes a court to award, or a corporation’s board of directors to grant, indemnity to directors and officers under certain circumstances and subject to certain limitations. The terms of Section 145 of the Delaware General Corporation Law are sufficiently broad to permit indemnification under certain circumstances for liabilities, including reimbursement of expenses incurred, arising under the Securities Act of 1933.
As permitted by the Delaware General Corporation Law, the Registrant’s certificate of incorporation includes a provision that eliminates, to the fullest extent permitted by law, the personal liability of a director for monetary damages resulting from breach of his fiduciary duty as a director.
As permitted by the Delaware General Corporation Law, the Registrant’s bylaws provide that:
| • | the Registrant is required to indemnify its directors and officers to the fullest extent permitted by the Delaware General Corporation Law, subject to certain very limited exceptions; |
| • | the Registrant may indemnify its other employees and agents as provided in indemnification contracts entered into between the Registrant and its our employees and agents; |
| • | the Registrant is required to advance expenses, as incurred, to its directors and officers in connection with a legal proceeding to the fullest extent permitted by the Delaware General Corporation Law, subject to certain very limited exceptions; and |
| • | the rights conferred in the bylaws are not exclusive. |
II-1
Table of Contents
In addition, the Registrant will enter into indemnity agreements with each of its current directors and officers prior to the completion of this offering. These agreements will provide for the indemnification of directors and officers for all reasonable expenses and liabilities incurred in connection with any action or proceeding brought against them by reason of the fact that they are or were agents of the Registrant.
The Registrant currently carries liability insurance for its directors and officers.
The Underwriting Agreement filed as Exhibit 1.1 to this Registration Statement provides for indemnification by the underwriters of the Registrant and its directors and officers for certain liabilities under the Securities Act of 1933, or otherwise.
Item 15. Recent sales of unregistered securities.
Since March 2007, the Registrant has issued and sold the following unregistered securities:
(1) From March 1, 2007 to July 31, 2010, the Registrant has issued 2,790,648 shares of its common stock to a total of 15 employees, directors, consultants and other service providers upon exercise of options granted by the Registrant under its equity incentive plans, with exercise prices ranging from $0.06 to $7.00 per share. These securities were issued in reliance on Rule 701 promulgated under Section 3(b) of the Securities Act or Rule 506 of Regulation D promulgated under the Securities Act and/or Section 4(2) of the Securities Act.
(2) From March 2007 through October 2007, the Registrant sold an aggregate of 7,126,587 shares of its Series B-1 preferred stock to 77 accredited investors at $8.69 per share for an aggregate purchase price of approximately $62 million (without giving effect to the 1-for-175 reverse stock split effected in March 2009 and the 40-for-1 forward stock split effected in October 2009). Approximately $4.5 million of this aggregate purchase price was paid by the conversion of principal and accrued interest under convertible promissory notes issued by Registrant in January 2007. Each share of Series B-1 preferred stock was converted into one share of Series A preferred stock in the recapitalization effective March 31, 2009. The Registrant also issued warrants exercisable for 337,178 shares of Series B-1 preferred stock to Advanced Equities, Inc., or AEI, in connection with AEI’s placement agent services in this transaction. These warrants were converted into warrants exercisable for 511,866 shares of Series C-1 preferred stock in February 2008, and are now exercisable for 116,997 shares of its Series A-1 preferred stock. These securities were issued in reliance on Rule 506 of Regulation D promulgated under the Securities Act and/or Section 4(2) of the Securities Act.
(3) From February 2008 through September 2008, the Registrant sold an aggregate of 6,813,061 shares of its Series C-1 preferred stock to 58 accredited investors at a purchase price of $5.72 per share for an aggregate purchase price of approximately $39 million (without giving effect to the 1-for-175 reverse stock split effected in March 2009 and the 40-for-1 forward stock split effected in October 2009). In connection with this sale, each share of Series B-1 preferred stock held by purchasers of Series C-1 preferred stock was automatically exchanged for one share of Series C-1 preferred stock. Each share of Series C-1 preferred stock was converted into one share of Series A preferred stock in the recapitalization effective March 31, 2009. The Registrant issued warrants exercisable for 408,443 shares of Series C-1 preferred stock to AEI in connection with AEI’s placement agent services in the Series C-1 financing. These warrants are now exercisable for 93,358 shares of Series A-1 preferred stock. These securities were issued in reliance on Rule 506 of Regulation D promulgated under the Securities Act and/or Section 4(2) of the Securities Act.
II-2
Table of Contents
(4) On March 31, 2009, the Registrant closed its acquisition of Legacy Force10. In connection with the merger, the Registrant issued an aggregate of 7,826,800 shares of its Series A preferred stock to 116 accredited investors valued at $6.38 per share for an aggregate value of approximately $50 million and 424,200 shares of common stock to 224 former Legacy Force10 stockholders valued at $0.27 per share for an aggregate value of $115,913. These securities were issued in reliance on Section 3(a)(10) of the Securities Act when the terms and conditions of the issuance and exchange were approved by the California Department of Corporations after a hearing upon the fairness of such terms and conditions.
(5) From June 2009 through August 2009, the Registrant sold an aggregate of 9,923,080 shares of its Series B preferred stock to 219 accredited investors at a purchase price of $3.02 per share for an aggregate purchase price of approximately $30 million and issued 13,876,120 shares of its Series A-1 preferred stock to 216 accredited investors who purchased Series B preferred stock, or the Series B Investors, and who held shares of Series A preferred stock. The shares of Series A-1 preferred stock were issued in a one-for-one exchange for a corresponding number of shares of the Registrant’s Series A preferred stock held by the Series B Investors. The Registrant also issued warrants exercisable for 1,751,094 shares of Series A-1 preferred stock, in exchange for warrants exercisable for the same number of shares of Series A preferred stock held by those investors. The warrants issued in the exchange had exercise prices ranging from $3.02 per share to $44.27 per share, the same exercise price as the exchanged warrants. These securities were issued in reliance on Rule 506 of Regulation D promulgated under the Securities Act and/or Section 4(2) of the Securities Act.
(6) On August 14, 2009, the Registrant issued options to purchase 4,468,120 shares of common stock under the 2007 Equity Incentive Plan at an exercise price of $0.06 per share to 191 employees and consultants in exchange for the cancellation of then outstanding options to purchase 1,053,640 shares of common stock. These securities were exchanged by the Registrant with its existing security holders exclusively where no commission or other remuneration was paid or given directly or indirectly for soliciting such exchange and were issued under a written compensatory benefit plan established by the Registrant for the participation of its employees, directors, officers, consultants and advisors. Accordingly, these securities were issued in reliance on Rule 701 promulgated under the Securities Act and/or Section 3(a)(9) of the Securities Act.
No underwriters were involved in the foregoing sales of securities. With respect to the issuances of the securities described above, which were deemed to be exempt from registration under the Securities Act in reliance on Section 4(2) of the Securities Act or Rule 506 of Regulation D promulgated under the Securities Act, the recipients of securities in each such transaction represented that they were “accredited investors” and as to their intention to acquire the securities for investment only and not with a view to or for sale in connection with any distribution thereof and appropriate legends were affixed to the stock certificates and option agreements issued in such transactions. All recipients had adequate access, through their relationships with the Registrant, to information about the Registrant. With respect to the issuances exempt from registration under the Securities Act in reliance on Rule 701 promulgated under the Securities Act, all sales of common stock made pursuant to the Registrant’s equity incentive plans or any non-plan stock option, including pursuant to exercise of stock options, were made in reliance on Rule 701 under the Securities Act and/or Section 4(2) of the Securities Act.
II-3
Table of Contents
Item 16. Exhibits and financial statement schedules.
(a) Exhibits.
| Exhibit number | Exhibit title | |
| 1.1* | Form of Underwriting Agreement. | |
| 2.1† | Agreement and Plan of Reorganization entered into as of December 31, 2008, as amended March 18, 2009, by and among Turin Networks, Inc., Titan1 Acquisition Corp., a wholly-owned subsidiary of Turin Networks, Inc. and Force10 Networks, Inc. | |
| 2.2† | Agreement and Plan of Merger among Turin Networks, Inc., RF Acquisition Corp. and Carrier Access Corporation dated December 15, 2007. | |
| 3.1† | Amended and Restated Certificate of Incorporation of Force10 Networks, Inc. | |
| 3.2† | Form of Amended and Restated Certificate of Incorporation of Force10 Networks, Inc., to be filed with the Delaware Secretary of State after completion of this offering. | |
| 3.3† | Amended and Restated Bylaws of Force10 Networks, Inc. | |
| 3.4† | Form of Restated Bylaws of Force10 Networks, Inc., to be effective upon the completion of this offering. | |
| 4.1* | Specimen Common Stock Certificate of Force10 Networks, Inc. | |
| 4.2† | Amended and Restated Investors’ Rights Agreement, dated June 18, 2009, between Force10 Networks, Inc. and certain security holders of Force10 Networks, Inc. named therein. | |
| 5.1* | Opinion of Fenwick & West, LLP. | |
| 10.1† | Form of Indemnification Agreement entered into between the Registrant and each of its directors and officers. | |
| 10.2† | 2007 Equity Incentive Plan and forms of agreement thereunder. | |
| 10.3† | 1999 Stock Plan and forms of agreement thereunder. | |
| 10.4† | 2010 Equity Incentive Plan and forms of agreement thereunder to be in effect upon the completion of this offering. | |
| 10.5† | 2010 Employee Stock Purchase Plan to be in effect upon the completion of this offering. | |
| 10.6† | Lease Agreement, dated April 4, 2006, between the Registrant and CarrAmerica Holger Way LLC. | |
| 10.7† | Redwood Business Park Full Service Lease, dated October 4, 1999, as amended August 22, 2000 and December 14, 2004, between the Registrant and Redwood Business Park I, LLC. | |
| 10.8† | Lease Agreement, dated June 20, 2007, between the Registrant and M/s.Kalyani Constructions Pvt Ltd. | |
| 10.9† | Form of Retention Incentive Agreement between the Registrant and each of its executive officers. | |
| 10.10† | Second Amended and Restated Loan and Security Agreement, dated as of June 26, 2009, between the Registrant and Silicon Valley Bank. | |
II-4
Table of Contents
| Exhibit number | Exhibit title | |
| 10.11† | Form of Warrant to Purchase Common Stock of Registrant. | |
| 10.12† | Form of Warrant to Purchase Series A Preferred Stock of Registrant issued to Silicon Valley Bank. | |
| 10.13† | Form of Warrant to Purchase Series A Preferred Stock of Registrant (originally exercisable for shares of Series F Preferred Stock of Registrant prior to the acquisition of Legacy Force10). | |
| 10.14† | Form of Warrant to Purchase Series A Preferred Stock of Registrant (originally exercisable for shares of Series E Preferred Stock of Legacy Force10). | |
| 10.15† | Form of Warrant to Purchase Series A Preferred Stock of Registrant (originally exercisable for shares of Series A-1 Preferred Stock of Registrant prior to the acquisition of Legacy Force10). | |
| 10.16† | Form of Warrant to Purchase Series A-1 Preferred Stock of Registrant. | |
| 10.17† | Form of Warrant to Purchase Series B Preferred Stock of Registrant issued to Advanced Equities, Inc. | |
| 10.18† | Warrant to Purchase Series B Preferred Stock of Registrant issued to Silicon Valley Bank. | |
| 21.1† | List of subsidiaries of the Registrant. | |
| 23.1 | Consent of Independent Registered Public Accounting Firm. | |
| 23.2 | Consent of Independent Auditors. | |
| 23.3 | Consent of Hein & Associates LLP, Independent Registered Public Accounting Firm. | |
| 23.4* | Consent of Fenwick & West, LLP (included in Exhibit 5.1). | |
| 24.1† | Power of Attorney. | |
| * | To be filed by amendment. |
| † | Previously filed. |
(b) Financial statement schedules.
Financial statement schedules have been omitted, as the information required to be set forth therein is included in the Consolidated Financial Statements or Notes thereto.
Item 17. Undertakings.
The undersigned registrant hereby undertakes to provide to the underwriters at the closing specified in the underwriting agreement certificates in such denominations and registered in such names as required by the underwriters to permit prompt delivery to each purchaser.
Insofar as indemnification for liabilities arising under the Securities Act of 1933 may be permitted to directors, officers and controlling persons of the Registrant pursuant to the foregoing provisions, or otherwise, the Registrant has been advised that in the opinion of the Securities and Exchange Commission such indemnification is against public policy as expressed in the Act and is, therefore, unenforceable. In the event that a claim for indemnification against such liabilities (other than the payment by the Registrant of expenses incurred or paid by a director, officer or
II-5
Table of Contents
controlling person of the Registrant in the successful defense of any action, suit or proceeding) is asserted by such director, officer or controlling person in connection with the securities being registered, the Registrant will, unless in the opinion of its counsel the matter has been settled by controlling precedent, submit to a court of appropriate jurisdiction the question whether such indemnification by it is against public policy as expressed in the Act and will be governed by the final adjudication of such issue.
The undersigned registrant hereby undertakes that:
(1) For purposes of determining any liability under the Securities Act of 1933, the information omitted from the form of prospectus filed as part of this registration statement in reliance upon Rule 430A and contained in a form of prospectus filed by the Registrant pursuant to Rule 424(b)(1) or (4) or 497(h) under the Securities Act shall be deemed to be part of this registration statement as of the time it was declared effective.
(2) For the purpose of determining any liability under the Securities Act of 1933, each post effective amendment that contains a form of prospectus shall be deemed to be a new registration statement relating to the securities offered therein, and the offering of such securities at that time shall be deemed to be the initial bona fide offering thereof.
II-6
Table of Contents
Signatures
Pursuant to the requirements of the Securities Act of 1933, the Registrant has duly caused this registration statement to be signed on its behalf by the undersigned, thereunto duly authorized, in the City of San Jose, State of California, on August 11, 2010.
| Force10 Networks, Inc. | ||
By: | /S/ HENRY WASIK | |
| Henry Wasik, President and Chief Executive Officer | ||
Pursuant to the requirements of the Securities Act of 1933, this registration statement has been signed by the following persons in the capacities indicated below:
| Signature | Title | Date | ||
/S/ HENRY WASIK Henry Wasik | President, Chief Executive Officer (Principal Executive Officer) and Director | August 11, 2010 | ||
/S/ WILLIAM ZERELLA William Zerella | Chief Financial Officer and Treasurer (Principal Financial and Accounting Officer) | August 11, 2010 | ||
* Howard A. Bain III | Director | August 11, 2010 | ||
* B.J. Cassin | Director | August 11, 2010 | ||
* Keith G. Daubenspeck | Director | August 11, 2010 | ||
* Dixon R. Doll, Ph.D. | Chairman of the Board of Directors | August 11, 2010 | ||
* C. Richard Kramlich | Director | August 11, 2010 | ||
* Steven M. Krausz | Director | August 11, 2010 | ||
* Paul S. Madera | Director | August 11, 2010 | ||
*By | /S/ WILLIAM ZERELLA William Zerella | Attorney-in-fact | August 11, 2010 | |||
II-7
Table of Contents
Exhibit index
| Exhibit number | Exhibit title | |
| 1.1* | Form of Underwriting Agreement. | |
| 2.1† | Agreement and Plan of Reorganization entered into as of December 31, 2008, as amended March 18, 2009, by and among Turin Networks, Inc., Titan1 Acquisition Corp., a wholly-owned subsidiary of Turin Networks, Inc. and Force10 Networks, Inc. | |
| 2.2† | Agreement and Plan of Merger among Turin Networks, Inc., RF Acquisition Corp. and Carrier Access Corporation dated December 15, 2007. | |
| 3.1† | Amended and Restated Certificate of Incorporation of Force10 Networks, Inc. | |
| 3.2† | Form of Amended and Restated Certificate of Incorporation of Force10 Networks, Inc., to be filed with the Delaware Secretary of State after completion of this offering. | |
| 3.3† | Amended and Restated Bylaws of Force10 Networks, Inc. | |
| 3.4† | Form of Restated Bylaws of Force10 Networks, Inc., to be effective upon the completion of this offering. | |
| 4.1* | Specimen Common Stock Certificate of Force10 Networks, Inc. | |
| 4.2† | Amended and Restated Investors’ Rights Agreement, dated June 18, 2009, between Force10 Networks, Inc. and certain security holders of Force10 Networks, Inc. named therein. | |
| 5.1* | Opinion of Fenwick & West, LLP. | |
| 10.1† | Form of Indemnification Agreement entered into between the Registrant and each of its directors and officers. | |
| 10.2† | 2007 Equity Incentive Plan and forms of agreement thereunder. | |
| 10.3† | 1999 Stock Plan and forms of agreement thereunder. | |
| 10.4† | 2010 Equity Incentive Plan and forms of agreement thereunder to be in effect upon the completion of this offering. | |
| 10.5† | 2010 Employee Stock Purchase Plan to be in effect upon the completion of this offering. | |
| 10.6† | Lease Agreement, dated April 4, 2006, between the Registrant and CarrAmerica Holger Way LLC. | |
| 10.7† | Redwood Business Park Full Service Lease, dated October 4, 1999, as amended August 22, 2000 and December 14, 2004, between the Registrant and Redwood Business Park I, LLC. | |
| 10.8† | Lease Agreement, dated June 20, 2007, between the Registrant and M/s.Kalyani Constructions Pvt Ltd. | |
| 10.9† | Form of Retention Incentive Agreement between the Registrant and each of its executive officers. | |
| 10.10† | Second Amended and Restated Loan and Security Agreement, dated as of June 26, 2009, between the Registrant and Silicon Valley Bank. | |
| 10.11† | Form of Warrant to Purchase Common Stock of Registrant. | |
| 10.12† | Form of Warrant to Purchase Series A Preferred Stock of Registrant issued to Silicon Valley Bank. | |
Table of Contents
| Exhibit number | Exhibit title | |
| 10.13† | Form of Warrant to Purchase Series A Preferred Stock of Registrant (originally exercisable for shares of Series F Preferred Stock of Registrant prior to the acquisition of Legacy Force10). | |
| 10.14† | Form of Warrant to Purchase Series A Preferred Stock of Registrant (originally exercisable for shares of Series E Preferred Stock of Legacy Force10). | |
| 10.15† | Form of Warrant to Purchase Series A Preferred Stock of Registrant (originally exercisable for shares of Series A-1 Preferred Stock of Registrant prior to the acquisition of Legacy Force10). | |
| 10.16† | Form of Warrant to Purchase Series A-1 Preferred Stock of Registrant. | |
| 10.17† | Form of Warrant to Purchase Series B Preferred Stock of Registrant issued to Advanced Equities, Inc. | |
| 10.18† | Warrant to Purchase Series B Preferred Stock of Registrant issued to Silicon Valley Bank. | |
| 21.1† | List of subsidiaries of the Registrant. | |
| 23.1 | Consent of Independent Registered Public Accounting Firm. | |
| 23.2 | Consent of Independent Auditors. | |
| 23.3 | Consent of Hein & Associates LLP, Independent Registered Public Accounting Firm. | |
| 23.4* | Consent of Fenwick & West, LLP (included in Exhibit 5.1). | |
| 24.1† | Power of Attorney. | |
| * | To be filed by amendment. |
| † | Previously filed. |