UNITED STATES
SECURITIES AND EXCHANGE COMMISSION
Washington, D.C. 20549
FORM N-CSR
CERTIFIED SHAREHOLDER REPORT OF REGISTERED MANAGEMENT INVESTMENT COMPANIES
Investment Company Act file number 811-09607
Fairholme Funds, Inc.
(Exact name of registrant as specified in charter)
5966 South Dixie Highway, Suite 300
South Miami, FL 33143
(Address of principal executive offices) (Zip code)
Bruce R. Berkowitz
5966 South Dixie Highway, Suite 300
South Miami, FL 33143
(Name and address of agent for service)
Registrant’s telephone number, including area code: 1-866-202-2263
Date of fiscal year end: November 30
Date of reporting period: May 31, 2024
Form N-CSR is to be used by management investment companies to file reports with the Commission not later than 10 days after the transmission to stockholders of any report that is required to be transmitted to stockholders under Rule 30e-1 under the Investment Company Act of 1940 (17 CFR 270.30e-1). The Commission may use the information provided on Form N-CSR in its regulatory, disclosure review, inspection, and policymaking roles.
A registrant is required to disclose the information specified by Form N-CSR, and the Commission will make this information public. A registrant is not required to respond to the collection of information contained in Form N-CSR unless the Form displays a currently valid Office of Management and Budget (“OMB”) control number. Please direct comments concerning the accuracy of the information collection burden estimate and any suggestions for reducing the burden to Secretary, Securities and Exchange Commission, 100 F Street, NE, Washington, DC 20549-1090. The OMB has reviewed this collection of information under the clearance requirements of 44 U.S.C. § 3507.
Item 1. Reports to Stockholders.
| a) | The Reports to Shareholders of each Fund are attached herewith. |
Semi-Annual Shareholder Report: May 31, 2024
The Fairholme Fund
Ticker: FAIRX

This semi-annual shareholder report contains important information about The Fairholme Fund (the "Fund") for the period of December 1, 2023 to May 31, 2024. You can find additional information about the Fund at www.fairholmefunds.com/prospectus. You can also request this information by contacting us at (866) 202-2263.
What were the Fund's costs for the last six months?
(based on a hypothetical $10,000 investment)
| Costs of a $10,000 investment | Costs paid as percentage of a $10,000 investment | |
|---|---|---|
| The Fairholme Fund | $42 | 0.80% |
How did the Fund perform during the last six months?
For the 6 months ended May 31, 2024, the Fund returned 10.05% compared to 16.36% for the S&P 500.
The Fund maintains a focused portfolio of investments in a limited number of issuers and does not seek to diversify its investments. At May 31, 2024, the Fund held a substantial portion of its assets in shares of The St. Joe Company. The Fund’s underperformance during the period was tied to a significant extent to the performance of the shares of The St. Joe Company, which reflects increased recurring corporate earning and a higher interest rate environment.
Total Return Based on $10,000 Investment
The graph shows the performance of a hypothetical $10,000 investment over the 10-year period ended May 31, 2024.
The Fund's past performance is not a good predictor of the Fund's future performance.
The graph and table do not reflect the deduction of taxes that a shareholder would pay on Fund distributions or redemption of Fund shares.
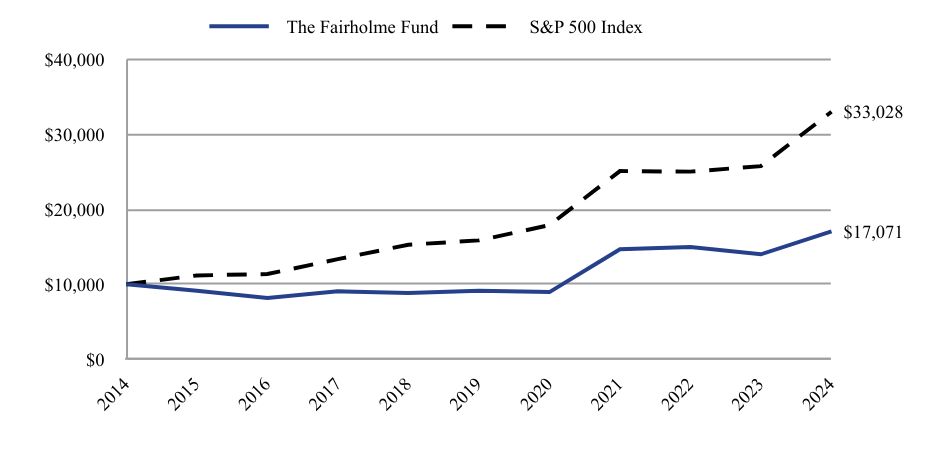
| The Fairholme Fund | S&P 500 Index | |
|---|---|---|
| 2014 | $10,000 | $10,000 |
| 2015 | $9,140 | $11,181 |
| 2016 | $8,168 | $11,372 |
| 2017 | $9,059 | $13,359 |
| 2018 | $8,849 | $15,281 |
| 2019 | $9,141 | $15,859 |
| 2020 | $8,963 | $17,895 |
| 2021 | $14,681 | $25,109 |
| 2022 | $14,973 | $25,034 |
| 2023 | $14,006 | $25,766 |
| 2024 | $17,071 | $33,028 |
Average Annual Total Returns (as of May 31, 2024)
| 1 Year | 5 years | 10 years | |
|---|---|---|---|
| The Fairholme Fund | 21.88% | 13.31% | 5.49% |
| S&P 500 Index | 28.19% | 15.80% | 12.69% |
Fund Statistics
| Net Assets | $1,320,333,394 |
| # of Portfolio Holdings | 12 |
| Portfolio Turnover Rate | 1.51% |
What are the Fund's Holdings?
The following table and graphs show the Fund's holdings as of May 31, 2024. Figures are expressed as percentages of the Fund's net assets.
Top Holdings
| The St. Joe Co. | 78.3% |
| Enterprise Products Partners LP | 6.4% |
| Imperial Metals Corp. | 0.7% |
| Berkshire Hathaway Inc. | 0.7% |
| Federal National Mortgage Association | 0.1% |
Sector Weightings
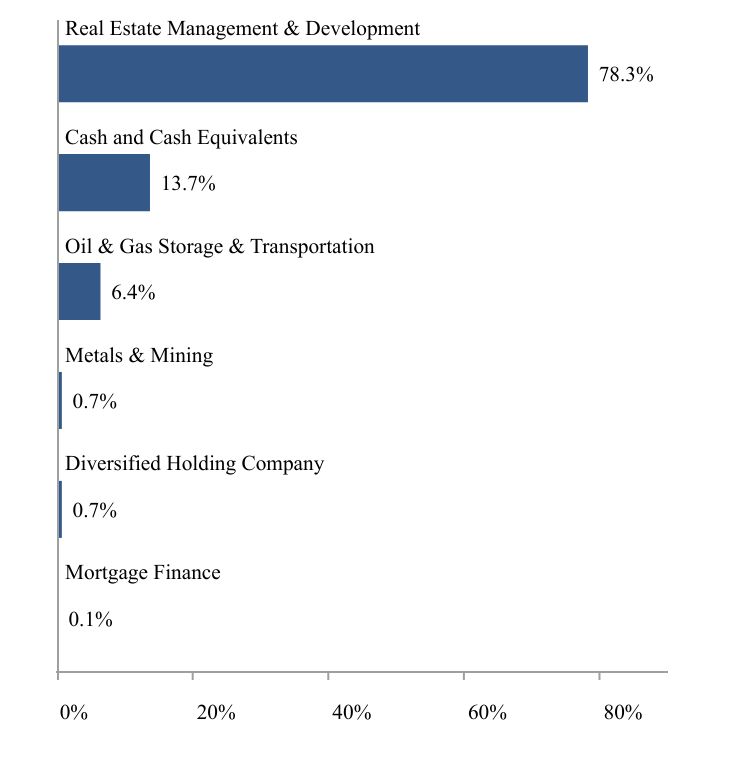
| Value | Value |
|---|---|
| Mortgage Finance | 0.1% |
| Diversified Holding Company | 0.7% |
| Metals & Mining | 0.7% |
| Oil & Gas Storage & Transportation | 6.4% |
| Cash and Cash Equivalents | 13.7% |
| Real Estate Management & Development | 78.3% |
Asset Weightings
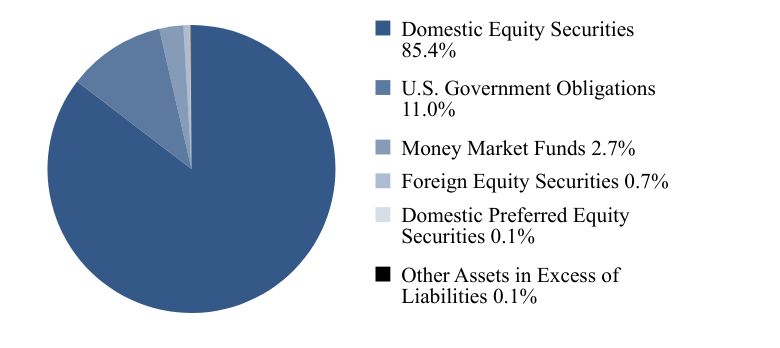
| Value | Value |
|---|---|
| Domestic Equity Securities | 85.4% |
| U.S. Government Obligations | 11.0% |
| Money Market Funds | 2.7% |
| Foreign Equity Securities | 0.7% |
| Domestic Preferred Equity Securities | 0.1% |
| Other Assets in Excess of Liabilities | 0.1% |
Where can I find additional information about the Fund?
Scan the QR code below or visit www.fairholmefunds.com/prospectus for additional information about the Fund, including the Fund's prospectus, financial information, portfolio holdings and proxy voting information.

Fairholme Funds, Inc.
P.O. Box 534443
Pittsburgh, PA 15253-4443
(866) 202-2263
Shares of the Fund are distributed by Foreside Funds Distributors LLC.

Semi-Annual Shareholder Report: May 31, 2024
The Fairholme Fund
Ticker: FAIRX
Semi-Annual Shareholder Report: May 31, 2024
The Fairholme Focused Income Fund
Ticker: FOCIX

This semi-annual shareholder report contains important information about The Fairholme Focused Income Fund (the "Fund") for the period of December 1, 2023 to May 31, 2024. You can find additional information about the Fund at www.fairholmefunds.com/prospectus. You can also request this information by contacting us at (866) 202-2263.
What were the Fund's costs for the last six months?
(based on a hypothetical $10,000 investment)
| Costs of a $10,000 investment | Costs paid as percentage of a $10,000 investment | |
|---|---|---|
| The Fairholme Focused Income Fund | $41 | 0.80% |
How did the Fund perform during the last six months?
For the 6 months ended May 31, 2024, the Fund returned 6.98% compared to 2.12% for the Bloomberg U.S. Aggregate Bond Index.
The Fund maintains a focused portfolio of investments in a limited number of issuers and does not seek to diversify its investments, which exposes the Fund to the risk of unanticipated industry conditions and risks particular to a single company or the securities of a single company within its portfolio. The Fund’s outperformance during the period was largely driven by portfolio holdings in the oil and gas storage and transportation sector and U.S. Treasury Bills. The continued global demand for natural gas along, with high yields in the Fund's largest holdings, contributed to the performance.
Total Return Based on $10,000 Investment
The graph shows the performance of a hypothetical $10,000 investment over the 10-year period ended May 31, 2024.
The Fund's past performance is not a good predictor of the Fund's future performance.
The graph and table do not reflect the deduction of taxes that a shareholder would pay on Fund distributions or redemption of Fund shares.
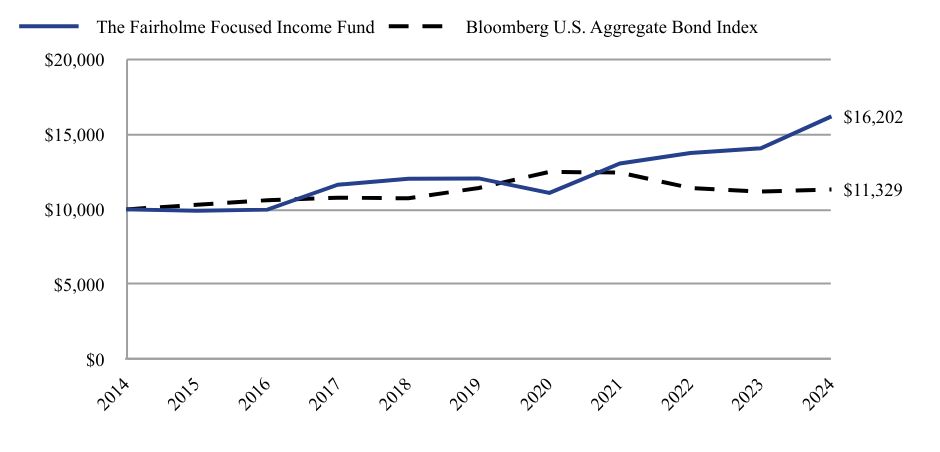
| The Fairholme Focused Income Fund | Bloomberg U.S. Aggregate Bond Index | |
|---|---|---|
| 2014 | $10,000 | $10,000 |
| 2015 | $9,905 | $10,303 |
| 2016 | $9,981 | $10,612 |
| 2017 | $11,644 | $10,779 |
| 2018 | $12,037 | $10,739 |
| 2019 | $12,066 | $11,426 |
| 2020 | $11,099 | $12,502 |
| 2021 | $13,063 | $12,452 |
| 2022 | $13,762 | $11,428 |
| 2023 | $14,075 | $11,183 |
| 2024 | $16,202 | $11,329 |
Average Annual Total Returns (as of May 31, 2024)
| 1 Year | 5 years | 10 years | |
|---|---|---|---|
| The Fairholme Focused Income Fund | 15.11% | 6.07% | 4.94% |
| Bloomberg U.S. Aggregate Bond Index | 1.31% | - 0.17% | 1.26% |
Fund Statistics
| Net Assets | $211,685,692 |
| # of Portfolio Holdings | 12 |
| Portfolio Turnover Rate | 37.46% |
What are the Fund's Holdings?
The following table and graphs show the Fund's holdings as of May 31, 2024. Figures are expressed as percentages of the Fund's net assets.
Top Holdings
| Enterprise Products Partners LP | 27.4% |
| Bank OZK | 7.2% |
| Berkshire Hathaway Inc. | 5.2% |
| W. R. Berkley Corp. | 3.6% |
| Federal Home Loan Mortgage Corp. | 1.0% |
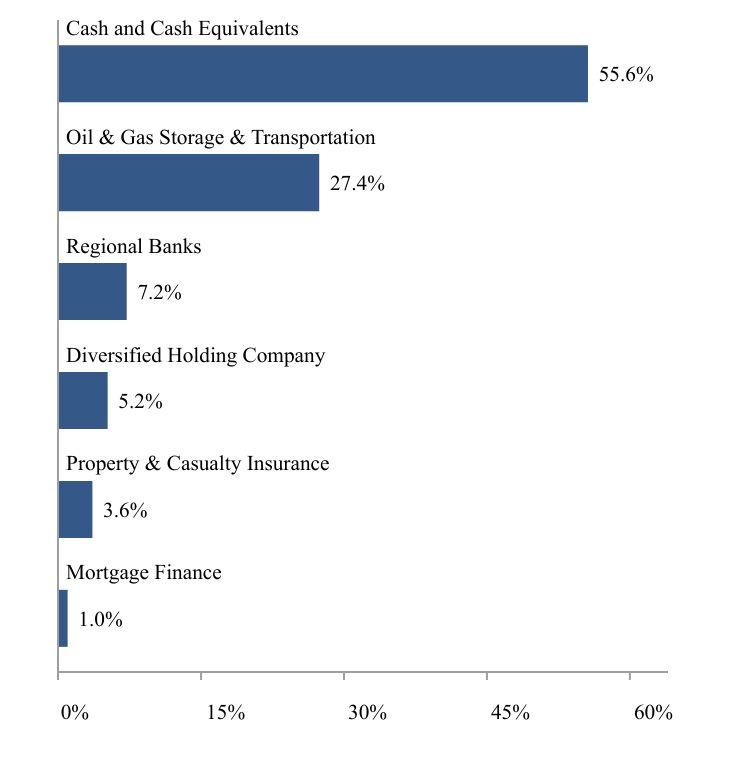
Sector Weightings
| Value | Value |
|---|---|
| Mortgage Finance | 1.0% |
| Property & Casualty Insurance | 3.6% |
| Diversified Holding Company | 5.2% |
| Regional Banks | 7.2% |
| Oil & Gas Storage & Transportation | 27.4% |
| Cash and Cash Equivalents | 55.6% |
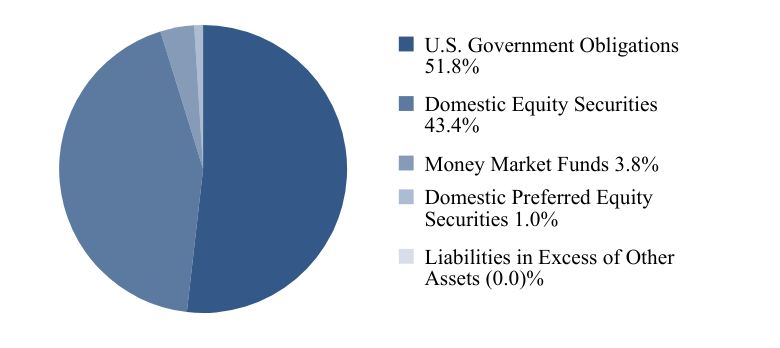
Asset Weightings
| Value | Value |
|---|---|
| U.S. Government Obligations | 51.8% |
| Domestic Equity Securities | 43.4% |
| Money Market Funds | 3.8% |
| Domestic Preferred Equity Securities | 1.0% |
| Liabilities in Excess of Other Assets | (0.0)% |
Where can I find additional information about the Fund?
Scan the QR code below or visit www.fairholmefunds.com/prospectus for additional information about the Fund, including the Fund's prospectus, financial information, portfolio holdings and proxy voting information.

Fairholme Funds, Inc.
P.O. Box 534443
Pittsburgh, PA 15253-4443
(866) 202-2263
Shares of the Fund are distributed by Foreside Funds Distributors LLC.

Semi-Annual Shareholder Report: May 31, 2024
The Fairholme Focused Income Fund
Ticker: FOCIX
| b) | Not applicable |
Item 2. Code of Ethics.
Not applicable.
Item 3. Audit Committee Financial Expert.
Not Applicable.
Item 4. Principal Accountant Fees and Services.
Not applicable.
Item 5. Audit Committee of Listed Registrants.
Not applicable.
Item 6. Investments.
| (a) | Schedule of Investments in securities of unaffiliated issuers as of the close of the reporting period is included as part of the semi-annual financial statements referenced under Item 7(a) of this form. |
| (b) | Not applicable. |
Item 7. Financial Statements and Financial Highlights for Open-End Management Investment Companies.
| (a) | An open-end management investment company registered on Form N-1A [17 CFR 239.15A and 17 CFR 274.11A] must file its most recent annual or semi-annual financial statements required, and for the periods specified, by Regulation S-X. |
| (b) | An open-end management investment company registered on Form N-1A [17 CFR 239.15A and 17 CFR 274.11A] must file the information required by Item 13 of Form N-1A. |
THE FAIRHOLME FUND
SCHEDULE OF INVESTMENTS
May 31, 2024 (Unaudited)
| Shares | Value | |||||||
DOMESTIC EQUITY SECURITIES — 85.4% | ||||||||
DIVERSIFIED HOLDING COMPANY — 0.7% | ||||||||
| 23,400 | Berkshire Hathaway Inc., Class B(a) | $ | 9,696,960 | |||||
|
| |||||||
OIL & GAS STORAGE & TRANSPORTATION — 6.4% | ||||||||
| 2,953,100 | Enterprise Products Partners LP | 84,163,350 | ||||||
|
| |||||||
REAL ESTATE MANAGEMENT & DEVELOPMENT — 78.3% |
| |||||||
| 18,254,624 | The St. Joe Co.(b) | 1,033,211,718 | ||||||
|
| |||||||
| | TOTAL DOMESTIC EQUITY SECURITIES | 1,127,072,028 | ||||||
|
| |||||||
FOREIGN EQUITY SECURITIES — 0.7% | ||||||||
CANADA — 0.7% | ||||||||
METALS & MINING — 0.7% | ||||||||
| 5,715,413 | Imperial Metals Corp.(a) | 9,938,390 | ||||||
|
| |||||||
| | TOTAL FOREIGN EQUITY SECURITIES | 9,938,390 | ||||||
|
| |||||||
DOMESTIC PREFERRED EQUITY SECURITIES — 0.1% | ||||||||
MORTGAGE FINANCE — 0.1% | ||||||||
| 170,000 | Federal National Mortgage Association | 1,154,300 | ||||||
|
| |||||||
| | TOTAL DOMESTIC PREFERRED EQUITY | 1,154,300 | ||||||
|
| |||||||
| Principal | Value | |||||||
U.S. GOVERNMENT OBLIGATIONS — 11.0% | ||||||||
U.S. Treasury Bills | ||||||||
| $ 20,000,000 | 5.296%, 06/04/2024(c) | $ | 19,997,086 | |||||
| 20,000,000 | 5.273%, 06/06/2024(c) | 19,991,255 | ||||||
| 25,000,000 | 5.278%, 06/13/2024(c) | 24,963,437 | ||||||
| 30,000,000 | 5.274%, 06/20/2024(c) | 29,925,413 | ||||||
| 30,000,000 | 5.283%, 06/25/2024(c) | 29,903,415 | ||||||
| 20,000,000 | 5.282%, 06/27/2024(c) | 19,929,873 | ||||||
|
| |||||||
| | TOTAL U.S. GOVERNMENT OBLIGATIONS | 144,710,479 | ||||||
|
| |||||||
| Shares | ||||||||
MONEY MARKET FUNDS — 2.7% |
| |||||||
| 36,251,824 | Fidelity Investments Money Market Treasury Portfolio - Class I, 5.19%(d) | 36,251,824 | ||||||
|
| |||||||
| | TOTAL MONEY MARKET FUNDS | 36,251,824 | ||||||
|
| |||||||
| | TOTAL INVESTMENTS — 99.9% | 1,319,127,021 | ||||||
OTHER ASSETS IN EXCESS OF LIABILITIES — 0.1% | 1,206,373 | |||||||
|
| |||||||
NET ASSETS — 100.0% | $ | 1,320,333,394 | ||||||
|
| |||||||
| (a) | Non-income producing security. |
| (b) | Affiliated Company. See Note 7. |
| (c) | Rates shown are the effective yields based on the purchase price. The calculation assumes the security is held to maturity. |
| (d) | Annualized based on the 1-day yield as of May 31, 2024. |
The accompanying notes are an integral part of the financial statements.
3
THE FAIRHOLME FUND
STATEMENT OF ASSETS & LIABILITIES
May 31, 2024 (unaudited)
Assets | ||||
Investments, at Fair Value: | ||||
Unaffiliated Issuers (Cost – $293,335,895) | $ | 285,915,303 | ||
Affiliated Issuers (Cost – $457,873,002) | 1,033,211,718 | |||
Dividends and Interest Receivable | 2,445,430 | |||
Receivable for Capital Shares Sold | 8,137 | |||
|
|
| ||
Total Assets | 1,321,580,588 | |||
|
|
| ||
Liabilities | ||||
Accrued Management Fees | 911,678 | |||
Payable for Capital Shares Redeemed | 335,516 | |||
|
|
| ||
Total Liabilities | 1,247,194 | |||
|
|
| ||
NET ASSETS | $ | 1,320,333,394 | ||
|
|
| ||
Net Assets consist of: | ||||
Paid-In Capital | $ | 1,535,673,856 | ||
Total Accumulated Losses | (215,340,462 | ) | ||
|
|
| ||
NET ASSETS | $ | 1,320,333,394 | ||
|
|
| ||
Shares of Common Stock Outstanding* ($0.0001 par value) | 37,737,980 | |||
|
|
| ||
Net Asset Value, Offering and Redemption Price Per Share | $ | 34.99 | ||
|
|
| ||
* 700,000,000 shares authorized in total.
The accompanying notes are an integral part of the financial statements.
4
THE FAIRHOLME FUND
STATEMENT OF OPERATIONS (Unaudited)
| For the Six Months Ended May 31, 2024 | ||||||||
Investment Income | ||||||||
Interest — Unaffiliated Issuers | $ | 3,819,866 | ||||||
Dividends — Unaffiliated Issuers | 1,950 | |||||||
Dividends — Affiliated Issuers | 4,573,542 | |||||||
|
|
| ||||||
Total Investment Income | 8,395,358 | |||||||
|
|
| ||||||
Expenses | ||||||||
Management Fees | 6,650,271 | |||||||
|
|
| ||||||
Total Expenses | 6,650,271 | |||||||
|
|
| ||||||
Less: Voluntary Reduction of Management Fees | (1,330,054 | ) | ||||||
|
|
| ||||||
Net Expenses | 5,320,217 | |||||||
|
|
| ||||||
Net Investment Income | 3,075,141 | |||||||
|
|
| ||||||
Realized and Unrealized Gain (Loss) on Investments and Foreign Currency Related Transactions | ||||||||
Net Realized Gain (Loss) on: | ||||||||
Investments - Unaffiliated Issuers | (9,051,128 | ) | ||||||
Investments - Affiliated Issuers | 27,487,902 | |||||||
Foreign Currency Related Transactions | 39 | |||||||
Net Change in Unrealized Appreciation (Depreciation) on Investments and Foreign Currency Related Translations: | ||||||||
Unaffiliated Investments | 29,342,103 | |||||||
Affiliated Investments | 74,042,705 | |||||||
|
|
| ||||||
Net Realized and Unrealized Gain (Loss) on Investments and Foreign Currency Related Transactions | 121,821,621 | |||||||
|
|
| ||||||
NET INCREASE IN NET ASSETS FROM OPERATIONS | $ | 124,896,762 | ||||||
|
|
| ||||||
The accompanying notes are an integral part of the financial statements.
5
THE FAIRHOLME FUND
STATEMENTS OF CHANGES IN NET ASSETS
| For the Six Months Ended May 31, 2024 (Unaudited) | For the Fiscal Year Ended November 30, 2023 | |||||||||||||||||||
CHANGES IN NET ASSETS | ||||||||||||||||||||
From Operations | ||||||||||||||||||||
Net Investment Income | $ | 3,075,141 | $ | 5,590,513 | ||||||||||||||||
Net Realized Gain on Investments and Foreign Currency Related Transactions | 18,436,813 | 29,306,559 | ||||||||||||||||||
Net Change in Unrealized Appreciation (Depreciation) on Investments and Foreign Currency Related Translations | 103,384,808 | 262,128,442 | ||||||||||||||||||
|
|
|
|
|
| |||||||||||||||
Net Increase in Net Assets from Operations | 124,896,762 | 297,025,514 | ||||||||||||||||||
|
|
|
|
|
| |||||||||||||||
From Dividends and Distributions to Shareholders | ||||||||||||||||||||
Net Decrease in Net Assets from Dividends and Distributions | (5,746,264 | ) | — | |||||||||||||||||
|
|
|
|
|
| |||||||||||||||
From Capital Share Transactions | ||||||||||||||||||||
Proceeds from Sale of Shares | 5,491,982 | 15,958,758 | ||||||||||||||||||
Shares Issued in Reinvestment of Dividends and Distributions | 3,488,667 | — | ||||||||||||||||||
Cost of Shares Redeemed | (59,208,354 | ) | (119,212,979 | ) | ||||||||||||||||
Redemption Fees | 24,504 | 50,800 | ||||||||||||||||||
|
|
|
|
|
| |||||||||||||||
Net Decrease in Net Assets from Shareholder Activity | (50,203,201 | ) | (103,203,421 | ) | ||||||||||||||||
|
|
|
|
|
| |||||||||||||||
NET ASSETS | ||||||||||||||||||||
Net Increase in Net Assets | 68,947,297 | 193,822,093 | ||||||||||||||||||
Net Assets at Beginning of Period | 1,251,386,097 | 1,057,564,004 | ||||||||||||||||||
|
|
|
|
|
| |||||||||||||||
Net Assets at End of Period | $ | 1,320,333,394 | $ | 1,251,386,097 | ||||||||||||||||
|
|
|
|
|
| |||||||||||||||
SHARES TRANSACTIONS | ||||||||||||||||||||
Issued | 159,783 | 522,979 | ||||||||||||||||||
Reinvested | 101,121 | — | ||||||||||||||||||
Redeemed | (1,710,433 | ) | (4,057,644 | ) | ||||||||||||||||
|
|
|
|
|
| |||||||||||||||
Net Decrease in Shares | (1,449,529 | ) | (3,534,665 | ) | ||||||||||||||||
Shares Outstanding at Beginning of Period | 39,187,509 | 42,722,174 | ||||||||||||||||||
|
|
|
|
|
| |||||||||||||||
Shares Outstanding at End of Period | 37,737,980 | 39,187,509 | ||||||||||||||||||
|
|
|
|
|
| |||||||||||||||
The accompanying notes are an integral part of the financial statements.
6
THE FAIRHOLME FUND
FINANCIAL HIGHLIGHTS
For the Six Months Ended May 31, 2024 (Unaudited) | For the Fiscal Year Ended November 30, | |||||||||||||||||||||||
2023 | 2022 | 2021 | 2020 | 2019 | ||||||||||||||||||||
PER SHARE OPERATING PERFORMANCE | ||||||||||||||||||||||||
NET ASSET VALUE, BEGINNING OF PERIOD | $31.93 | $24.75 | $29.29 | $25.35 | $19.19 | $16.05 | ||||||||||||||||||
|
|
|
|
|
|
|
|
|
|
|
| |||||||||||||
Investment Operations | ||||||||||||||||||||||||
Net Investment Income (Loss)(1) | 0.08 | 0.14 | 0.02 | (0.07 | ) | (0.08 | ) | 0.16 | ||||||||||||||||
Net Realized and Unrealized Gain (Loss) on Investments | 3.13 | 7.04 | (4.56 | ) | 4.01 | 6.41 | 3.32 | |||||||||||||||||
|
|
|
|
|
|
|
|
|
|
|
| |||||||||||||
Total from Investment Operations | 3.21 | 7.18 | (4.54 | ) | 3.94 | 6.33 | 3.48 | |||||||||||||||||
|
|
|
|
|
|
|
|
|
|
|
| |||||||||||||
Dividends and Distributions | ||||||||||||||||||||||||
From Net Investment Income | (0.15 | ) | — | — | — | (0.17 | ) | (0.34 | ) | |||||||||||||||
|
|
|
|
|
|
|
|
|
|
|
| |||||||||||||
Total Dividends and Distributions | (0.15 | ) | — | — | — | (0.17 | ) | (0.34 | ) | |||||||||||||||
|
|
|
|
|
|
|
|
|
|
|
| |||||||||||||
Redemption Fees(1) | 0.00 | (2) | 0.00 | (2) | 0.00 | (2) | 0.00 | (2) | 0.00 | (2) | 0.00 | (2) | ||||||||||||
|
|
|
|
|
|
|
|
|
|
|
| |||||||||||||
NET ASSET VALUE, END OF PERIOD | $34.99 | $31.93 | $24.75 | $29.29 | $25.35 | $19.19 | ||||||||||||||||||
|
|
|
|
|
|
|
|
|
|
|
| |||||||||||||
TOTAL RETURN | 10.05 | %(3) | 29.01 | % | (15.50 | )% | 15.54 | % | 33.19 | % | 22.20 | % | ||||||||||||
Ratio/Supplemental Data | ||||||||||||||||||||||||
Net Assets, End of Period (in 000’s) | $1,320,333 | $1,251,386 | $1,057,564 | $1,348,318 | $1,269,211 | $1,056,541 | ||||||||||||||||||
Ratio of Gross Expenses to Average Net Assets | 1.00 | %(4) | 1.00 | % | 1.00 | % | 1.00 | % | 1.01 | %(5) | 1.00 | %(6) | ||||||||||||
Ratio of Net Expenses to Average Net Assets | 0.80 | %(4)(7) | 0.80 | %(7) | 0.80 | %(7) | 0.80 | %(7) | 0.81 | %(5)(7) | 0.80 | %(6)(7) | ||||||||||||
Ratio of Net Investment Income (Loss) to Average Net Assets | 0.46 | %(4) | 0.47 | % | 0.06 | % | (0.25 | )% | (0.41 | )% | 0.86 | % | ||||||||||||
Portfolio Turnover Rate | 1.51 | %(3) | 2.72 | % | 2.54 | % | 8.84 | % | 8.18 | % | 8.05 | % | ||||||||||||
| (1) | Based on average shares outstanding. |
| (2) | Redemption fees represent less than $0.01. |
| (3) | Not annualized. |
| (4) | Annualized. |
| (5) | 0.01% is attributable to legal expenses incurred outside of the 1.00% management fee. |
| (6) | Less than 0.01% is attributable to legal expenses incurred outside of the 1.00% management fee. |
| (7) | Effective January 1, 2018, the Manager has agreed to waive, on a voluntary basis, a portion of the management fee of the Fund to the extent necessary to limit the management fee paid to the Manager by the Fund to an annual rate of 0.80% of the Fund’s daily average net asset value. |
The accompanying notes are an integral part of the financial statements.
7
THE FAIRHOLME FUND
NOTES TO FINANCIAL STATEMENTS
May 31, 2024 (unaudited)
Note 1. Organization
Fairholme Funds, Inc. (the “Company”), a Maryland corporation, is registered under the Investment Company Act of 1940, as amended (the “1940 Act”), as an open-end management investment company. The Company’s Articles of Incorporation permit the Board of Directors of the Company (the “Board” or the “Directors”) to issue 1,100,000,000 shares of common stock at $.0001 par value. 700,000,000 shares have been allocated to The Fairholme Fund (the “Fund”). The Fund is a non-diversified fund. The Fund may have a greater percentage of its assets invested in particular securities than a diversified fund, exposing the Fund to the risk of unanticipated industry conditions as well as risks specific to a single company or the securities of a single company. The Fund has different objectives, capitalizations, and considerations that may or may not lead to differing compositions of issuers, securities within an issuer, and cash levels within the Fund. The Board has the power to designate one or more separate and distinct series and/or classes of shares of common stock and to classify or reclassify any unissued shares with respect to such series.
The Fund’s investment objective is to provide long-term growth of capital. Under normal circumstances, the Fund seeks to achieve its investment objective by investing in a focused portfolio of equity and fixed-income securities. The proportion of the Fund’s assets invested in each type of asset class will vary from time to time based upon Fairholme Capital Management, L.L.C.’s (the “Manager”) assessment of general market and economic conditions and other factors. The Fund may invest in, and may shift frequently among, the asset classes and market sectors. The equity securities in which the Fund may invest include common and preferred stock (including convertible preferred stock), interests in publicly traded partnerships, business trust shares, interests in real estate investment trusts, rights and warrants to subscribe for the purchase of equity securities, and depository receipts. The Fund may invest in equity securities without regard to the jurisdictions in which the issuers of the securities are organized or situated and without regard to the market capitalizations or sectors of such issuers. The fixed-income securities in which the Fund may invest include U.S. corporate debt securities, non-U.S. corporate debt securities, bank debt (including bank loans and participations), U.S. government and agency debt securities (including U.S. Treasury bills), short-term debt obligations of foreign governments, and foreign money market instruments. Except for its investments in short-term debt obligations of foreign governments, the Fund may invest in fixed-income securities regardless of maturity or the rating of the issuer of the security. The Fund may also invest in “special situations” to achieve its objective. “Special situation” investments may include equity securities or fixed-income securities, such as corporate debt, which may be in a distressed position as a result of economic or company specific developments. Although the Fund normally holds a focused portfolio of equity and fixed-income securities, the Fund is not required to be fully invested in such securities and may maintain a significant portion of its total assets in cash and securities generally considered to be cash equivalents. The Manager serves as investment adviser to the Fund.
There is no guarantee that the Fund will meet its objective.
Note 2. Significant Accounting Policies
As an investment company, the Fund follows the investment company accounting and reporting guidance, which is part of U.S. generally accepted accounting principles (“U.S. GAAP”). The Fund’s investments are reported at fair value as defined by U.S. GAAP. The Fund calculates its net asset value as soon as practicable following the close of regular trading on the New York Stock Exchange (currently 4:00 p.m. Eastern Time) on each day the New York Stock Exchange is open.
A description of the valuation techniques applied to the Fund’s securities follows:
Security Valuation:
Securities for which market quotations are readily available are valued at market value, and other securities are valued at “fair value” as determined in accordance with policies and procedures approved by the Board. Pursuant to Rule 2a-5 under the 1940 Act, the Board has designated the Manager as valuation designee to perform fair value determinations relating to the Fund’s portfolio investments, subject to the Board’s oversight.
The Manager may determine the fair valuation of a security when market quotations are not readily available, when securities are determined to be illiquid or restricted, or when in the judgment of the Manager the prices or values available do not represent the fair value of the investment. Factors which may cause the Manager to make such a judgment include the following: (a)
8
THE FAIRHOLME FUND
NOTES TO FINANCIAL STATEMENTS (continued)
May 31, 2024 (unaudited)
only a bid price or an asked price is available; (b) the spread between bid and ask prices is substantial; (c) the liquidity of the securities; (d) the frequency of sales; (e) the thinness of the market; (f) the size of reported trades; (g) actions of the investment’s markets, such as the suspension or limitation of trading; and (h) local market closures. The circumstances of fair valued securities are frequently monitored to determine if fair valuation measures continue to apply.
Equity securities (common and preferred stocks): Securities traded on a national securities exchange or reported on the NASDAQ national market are generally valued at the official closing price, or at the last reported sale price on the exchange or market on which the securities are traded, as of the close of business on the day the securities are being valued or, lacking any sales, at the last available bid price.
Fixed-income securities (U.S. government obligations, corporate bonds, convertible bonds, and asset backed securities): Fixed-income securities are valued at prices supplied by an independent pricing source or by pricing service providers based on broker or dealer supplied valuations or matrix pricing.
Open-end mutual fund: Investments in open-end mutual funds, including money market funds, are valued at their closing net asset value each business day.
Short-term securities: Investments in securities with remaining maturities of less than sixty days are valued at prices supplied by an independent pricing source or by one of the Fund’s pricing agents based on broker or dealer supplied valuations or matrix pricing.
The Fund uses third-party pricing services, which are approved by the Manager, to provide prices for some of the Fund’s securities. The Fund also uses other independent market trade data sources, as well as broker quotes provided by market makers.
U.S. GAAP defines fair value as the price that the Fund would receive to sell an asset or pay to transfer a liability in an orderly transaction between market participants at the measurement date. U.S. GAAP establishes the following fair value hierarchy that categorizes the inputs used to measure fair value:
| • Level 1 — | quoted prices in active markets for identical securities; |
| • Level 2 — | other significant observable inputs (including quoted prices for similar securities, quoted prices in inactive markets for identical securities, interest rates, prepayment speeds, credit risk, etc.); and |
| • Level 3 — | significant unobservable inputs (including the Manager’s assumptions in determining the fair value of investments). |
9
THE FAIRHOLME FUND
NOTES TO FINANCIAL STATEMENTS (continued)
May 31, 2024 (unaudited)
The inputs or methodology used for valuing investments are not necessarily an indication of the level of risk associated with investing in those investments. The summary of the Fund’s investments by inputs used to value the Fund’s investments as of May 31, 2024, is as follows:
| Valuation Inputs | ||||||||||||||||||||||||||||
| Level 2 - Other | Level 3 - | |||||||||||||||||||||||||||
| Significant | Significant | Total | ||||||||||||||||||||||||||
| Level 1 - | Observable | Unobservable | Fair Value | |||||||||||||||||||||||||
| Quoted Prices | Inputs | Inputs | at 05/31/24 | |||||||||||||||||||||||||
ASSETS: | ||||||||||||||||||||||||||||
INVESTMENTS (Fair Value): | ||||||||||||||||||||||||||||
Domestic Equity Securities* | $ | 1,127,072,028 | $ | — | $ | — | $ | 1,127,072,028 | ||||||||||||||||||||
Foreign Equity Securities* | 9,938,390 | — | — | 9,938,390 | ||||||||||||||||||||||||
Domestic Preferred Equity Securities* | 1,154,300 | — | — | 1,154,300 | ||||||||||||||||||||||||
U.S. Government Obligations | — | 144,710,479 | — | 144,710,479 | ||||||||||||||||||||||||
Money Market Funds | 36,251,824 | — | — | 36,251,824 | ||||||||||||||||||||||||
|
|
|
|
|
|
|
| |||||||||||||||||||||
TOTAL INVESTMENTS | $ | 1,174,416,542 | $ | 144,710,479 | $ | — | $ | 1,319,127,021 | ||||||||||||||||||||
|
|
|
|
|
|
|
| |||||||||||||||||||||
| * | Industry classification for these categories are detailed in the Schedule of Investments. |
There were no Level 3 investments at May 31, 2024 or November 30, 2023.
Dividends and Distributions: The Fund records dividends and distributions to its shareholders on the ex-dividend date. The Fund intends to distribute substantially all of its net investment income (if any) as dividends to its shareholders on an annual basis in December. The Fund intends to distribute any net long-term capital gains and any net short-term capital gains at least once a year. If the total dividends and distributions made in any tax year exceed net investment income and accumulated realized capital gains, a portion of the total distribution may be treated as a tax return of capital.
Foreign Currency Translation: The books and records of the Fund are maintained in U.S. dollars. Foreign currency amounts are translated into U.S. dollars on the following basis: (i) fair value of investment securities, assets, and liabilities at the current rate of exchange; and (ii) purchases and sales of investment securities, income, and expenses at the relevant rates of exchange prevailing on the respective dates of such transactions. The Fund does not isolate that portion of gains and losses on investment securities which is due to changes in the foreign exchange rates from that which is due to changes in the market prices of such securities.
Estimates: The preparation of financial statements in conformity with U.S. GAAP requires the Fund to make estimates and assumptions that affect the reported amounts of assets and liabilities and disclosure of contingent assets and liabilities at the date of the financial statements and the reported amounts of increases and decreases in net assets from operations during the reported period. Actual results could differ from those estimates.
Redemption Fee: The Fund assesses a 2% fee on the proceeds of the Fund shares that are redeemed or exchanged within 60 days of their purchase. The redemption fee is paid to the Fund as applicable, for the benefit of remaining shareholders and is recorded as paid-in capital. The redemption fees retained by the Fund during the six months ended May 31, 2024 and November 30, 2023, amounted to $24,504 and $50,800, respectively.
Other: The Fund accounts for security transactions on the trade date for financial statement purposes. The specific identification method is used for determining realized gains or losses for financial statements and income tax purposes. Dividend income is recorded on the ex-dividend date net of foreign taxes withheld where recovery is uncertain and interest income is recorded on an accrual basis. Discounts and premiums on securities purchased are amortized over the life of the respective securities using the effective yield method. Securities denominated in currencies other than U.S. dollars are subject to changes in value due to fluctuation in exchange rates. The Fund may invest in countries that require governmental approval for the repatriation of investment income, capital, or the proceeds of sales of securities by foreign investors. In addition, if there is deterioration in a
10
THE FAIRHOLME FUND
NOTES TO FINANCIAL STATEMENTS (continued)
May 31, 2024 (unaudited)
country’s balance of payments or for other reasons, a country may impose temporary restrictions on foreign capital remittances abroad.
The Fund paid commissions and other brokerage fees during the period.
Note 3. Related Party Transactions
The Manager is a Delaware limited liability company and is registered with the SEC as an investment adviser. The Manager’s principal business is to provide investment management and advisory services to individuals, corporations, and other institutions throughout the world. Pursuant to an Investment Management Agreement, the Fund pays a management fee to the Manager for its provision of investment advisory and operating services to the Fund. Subject to applicable waivers or limitations, the management fee is paid at an annual rate equal to 1.00% of the daily average net assets of the Fund. Effective January 1, 2018, the Manager has agreed to waive, on a voluntary basis, a portion of the management fees of the Fund to the extent necessary to limit the management fee of the Fund to the annual rate of 0.80% of the Fund’s daily average net asset value (“Undertaking”). This Undertaking may be terminated by the Manager upon 60 days’ written notice to the Fund. The Manager is responsible pursuant to the Investment Management Agreement for paying the Fund’s expenses for the following services: transfer agency, fund accounting, fund administration, custody, legal, audit, compliance, directors’ fees, call center, fulfillment, travel, insurance, rent, printing, postage and other office supplies. The Manager is not responsible for paying for the following costs and expenses of the Fund: commissions, brokerage fees, issue and transfer taxes, and other costs chargeable to the Fund in connection with securities transactions or in connection with securities owned by the Fund, taxes, interest, acquired fund fees and related expenses, expenses in connection with litigation by or against the Fund, and any other extraordinary expenses.
The Manager earned, after the voluntary reduction of the management fees, $5,320,217 from the Fund for its services during the six months ended May 31, 2024.
Bruce Berkowitz is the Chief Investment Officer of the Manager and Chairman of the Fund’s Board. As of May 31, 2024, Mr. Berkowitz and his affiliates owned an aggregate 13,309,401 shares of the Fund.
A Director and Officers of the Fund are also Officers of the Manager or its affiliates.
Note 4. Investments
For the six months ended May 31, 2024, aggregated purchases and sales of investment securities other than short-term investments and U.S. government obligations were as follows:
| Purchases | Sales | |||||||||
| $ | 17,810,694 | $ | 100,494,030 | |||||||
Note 5. Tax Matters
Federal Income Taxes: The Fund intends to qualify each year as a “regulated investment company” under Subchapter M of the Internal Revenue Code of 1986, as amended. By so qualifying, the Fund will not be subject to federal income taxes to the extent that it distributes all of its net investment income and any realized capital gains.
11
THE FAIRHOLME FUND
NOTES TO FINANCIAL STATEMENTS (continued)
May 31, 2024 (unaudited)
For U.S. federal income tax purposes, the cost of securities owned, gross unrealized appreciation, gross unrealized depreciation, and net unrealized appreciation/(depreciation) of investments at May 31, 2024, were as follows:
| Gross | Gross | Net Unrealized | ||||
| Unrealized | Unrealized | Appreciation/ | ||||
| Cost | Appreciation | Depreciation | (Depreciation) | |||
| $752,616,742 | $601,605,672 | $(35,095,393) | $566,510,279 | |||
The difference between book basis and tax basis net unrealized appreciation is attributable to the tax deferral of losses on wash sales, capitalized cost and basis adjustments on investments in partnerships.
The Fund’s tax basis capital gains are determined only at the end of each fiscal year. Therefore the components of distributable earnings will be included in the Annual Report for the fiscal year ended November 30, 2024.
The Fund is permitted to carry forward for an unlimited period capital losses incurred to reduce future required distributions of net capital gains to shareholders. Capital losses that are carried forward will retain their character as either short-term or long-term capital losses. As of November 30, 2023, net short-term and long-term capital loss carryforwards were as follows:
Long-term capital loss carryforward | $ | 803,367,062 | ||
|
|
| ||
Total | $ | 803,367,062 | ||
|
|
| ||
The Manager has analyzed the Fund’s tax positions taken on tax returns for all open tax years (current and prior three tax years) and has concluded that there are no uncertain tax positions that require recognition of a tax liability. The Fund’s federal and state income and federal excise tax returns for tax years for which the applicable statutes of limitations have not expired (the current year and prior three years) are subject to examination by the Internal Revenue Service and state departments of revenue. Additionally, the Fund is not aware of any tax position for which it is reasonably possible that the total amounts of unrecognized tax benefits will change materially in the next twelve months.
Note 6. Dividends and Distributions to Shareholders
Ordinary income and capital gain distributions are determined in accordance with federal income tax regulations, which may differ from U.S. GAAP.
The tax character of dividends and distributions paid by The Fairholme Fund were as follows:
| For the | ||||||||
| For the | Fiscal Year | |||||||
| Six Months | Ended | |||||||
| Ended | November 30, | |||||||
| May 31, 2024 | 2023 | |||||||
Dividends and Distributions paid from: | ||||||||
Ordinary Income | $ | 5,746,264 | $ | — | ||||
|
|
|
| |||||
Note 7. Transactions in Shares of Affiliates
Portfolio companies in which the Fund owns 5% or more of the outstanding voting securities of the issuer are considered affiliates of the Fund. The aggregate fair value of all securities of affiliates held by the Fund as of May 31, 2024 amounted to $1,033,211,718, representing approximately 78.25% of the Fund’s net assets.
12
THE FAIRHOLME FUND
NOTES TO FINANCIAL STATEMENTS (continued)
May 31, 2024 (unaudited)
Transactions in the Fund during the six months ended May 31, 2024, in which the issuer of the security was an affiliate are as follows:
| November 30, | ||||||||||||||||||||||||||||||||
| 2023 | Gross Additions | Gross Deductions | May 31, 2024 | |||||||||||||||||||||||||||||
| Change in | ||||||||||||||||||||||||||||||||
| Realized | Unrealized | |||||||||||||||||||||||||||||||
| Shares/ | Shares/ | Shares/ | Shares/ | Gain | Investment | Appreciation/ | ||||||||||||||||||||||||||
| Par Value | Par Value | Par Value | Par Value | Fair Value | (Loss) | Income | Depreciation | |||||||||||||||||||||||||
The St. Joe Co. | 19,394,724 | — | 1,140,100 | 18,254,624 | $ | 1,033,211,718 | $ | 27,487,902 | $ | 4,573,542 | $ 74,042,705 | |||||||||||||||||||||
|
|
|
|
|
|
|
| |||||||||||||||||||||||||
Total | $ | 1,033,211,718 | $ | 27,487,902 | $ | 4,573,542 | $ 74,042,705 | |||||||||||||||||||||||||
|
|
|
|
|
|
|
| |||||||||||||||||||||||||
Note 8. Indemnifications
Under the Company’s organizational documents, its Officers and Directors are indemnified against certain liabilities arising out of the performance of their duties to the Fund. In the normal course of business the Company or the Fund enters into contracts that contain a variety of representations and customary indemnifications. the Fund’s maximum exposure under these arrangements is unknown as this would involve future claims that may be made against the Fund that have not yet occurred. However, based on its experience to date, the Fund expects the risk of loss to be remote.
Note 9. Subsequent Events
Management has evaluated the impact on the Fund of all subsequent events occurring through the date the financial statements were issued and has determined that there were no subsequent events requiring recognition or disclosure in the financial statements.
13
THE FAIRHOLME FOCUSED INCOME FUND
SCHEDULE OF INVESTMENTS
May 31, 2024 (Unaudited)
| Shares | Value | |||||||
DOMESTIC EQUITY | ||||||||
DIVERSIFIED HOLDING COMPANY — 5.2% | ||||||||
| 26,400 | Berkshire Hathaway Inc., Class B(a) | $ | 10,940,160 | |||||
|
|
| ||||||
OIL & GAS STORAGE & TRANSPORTATION — 27.4% | ||||||||
| 2,038,000 | Enterprise Products Partners LP | 58,083,000 | ||||||
|
|
| ||||||
PROPERTY & CASUALTY INSURANCE — 3.6% | ||||||||
| 93,300 | W. R. Berkley Corp. | 7,560,099 | ||||||
|
|
| ||||||
REGIONAL BANKS — 7.2% | ||||||||
| 363,500 | Bank OZK | 15,223,380 | ||||||
|
|
| ||||||
| | TOTAL DOMESTIC EQUITY SECURITIES | 91,806,639 | ||||||
|
|
| ||||||
DOMESTIC PREFERRED EQUITY SECURITIES — 1.0% | ||||||||
MORTGAGE FINANCE — 1.0% | ||||||||
| 298,800 | Federal Home Loan Mortgage Corp. 5.100%, Series H(a) | 2,073,672 | ||||||
|
|
| ||||||
| | TOTAL DOMESTIC PREFERRED EQUITY | 2,073,672 | ||||||
|
|
| ||||||
| Principal | ||||||||
U.S. GOVERNMENT OBLIGATIONS — 51.8% | ||||||||
U.S. Treasury Bills | ||||||||
| $ | 20,000,000 | 5.296%, 06/04/2024(b) | 19,997,086 | |||||
| 20,000,000 | 5.273%, 06/06/2024(b) | 19,991,255 | ||||||
| 15,000,000 | 5.278%, 06/13/2024(b) | 14,978,063 | ||||||
| 20,000,000 | 5.274%, 06/20/2024(b) | 19,950,275 | ||||||
| 20,000,000 | 5.283%, 06/25/2024(b) | 19,935,610 | ||||||
| 15,000,000 | 5.282%, 06/27/2024(b) | 14,947,405 | ||||||
|
|
| ||||||
| | TOTAL U.S. GOVERNMENT OBLIGATIONS | 109,799,694 | ||||||
|
|
| ||||||
Shares | Value | |||
MONEY MARKET FUNDS — 3.8% | ||||
8,106,650 | Fidelity Investments Money Market Treasury Portfolio - Class I, 5.19%(c) | $ 8,106,650 | ||
| ||||
TOTAL MONEY MARKET FUNDS | 8,106,650 | |||
| ||||
TOTAL INVESTMENTS — 100.0% | 211,786,655 | |||
LIABILITIES IN EXCESS OF OTHER ASSETS — (0.0)% | (100,963) | |||
| ||||
NET ASSETS — 100.0% | $ 211,685,692 | |||
| ||||
The accompanying notes are an integral part of the financial statements.
3
THE FAIRHOLME FOCUSED INCOME FUND
SCHEDULE OF INVESTMENTS (continued)
May 31, 2024 (Unaudited)
| (a) | Non-income producing security. |
| (b) | Rates shown are the effective yields based on the purchase price. The calculation assumes the security is held to maturity. |
| (c) | Annualized based on the 1-day yield as of May 31, 2024. |
The accompanying notes are an integral part of the financial statements.
4
THE FAIRHOLME FOCUSED INCOME FUND
STATEMENT OF ASSETS & LIABILITIES
May 31, 2024 (Unaudited)
Assets | ||||
Investments, at Fair Value (Cost — $192,457,750) | $ | 211,786,655 | ||
Dividends and Interest Receivable | 44,152 | |||
|
|
| ||
Total Assets | 211,830,807 | |||
|
|
| ||
Liabilities | ||||
Accrued Management Fees | 145,070 | |||
Payable for Capital Shares Redeemed | 45 | |||
|
|
| ||
Total Liabilities | 145,115 | |||
|
|
| ||
NET ASSETS | $ | 211,685,692 | ||
|
|
| ||
Net Assets consist of: | ||||
Paid-In Capital | $ | 202,192,863 | ||
Total Accumulated Gains | 9,492,829 | |||
|
|
| ||
NET ASSETS | $ | 211,685,692 | ||
|
|
| ||
Shares of Common Stock Outstanding* ($0.0001 par value) | 16,349,570 | |||
|
|
| ||
Net Asset Value, Offering and Redemption Price Per Share | $ | 12.95 | ||
|
|
| ||
* 200,000,000 shares authorized in total.
The accompanying notes are an integral part of the financial statements.
5
THE FAIRHOLME FOCUSED INCOME FUND
STATEMENT OF OPERATIONS (unaudited)
| For the Six Months Ended May 31, 2024 | ||||||||
Investment Income | ||||||||
Interest | $ | 3,460,943 | ||||||
Dividends | 201,383 | |||||||
|
|
| ||||||
Total Investment Income | 3,662,326 | |||||||
|
|
| ||||||
Expenses | ||||||||
Management Fees | 1,058,765 | |||||||
|
|
| ||||||
Total Expenses | 1,058,765 | |||||||
|
|
| ||||||
Less: Voluntary Reduction of Management Fees | (211,753 | ) | ||||||
|
|
| ||||||
Net Expenses | 847,012 | |||||||
|
|
| ||||||
Net Investment Income | 2,815,314 | |||||||
|
|
| ||||||
Realized and Unrealized Gain (Loss) on Investments and Foreign Currency Related Transactions | ||||||||
Net Realized Gain on: | ||||||||
Investments | 4,835,262 | |||||||
Foreign Currency Related Transactions | 230 | |||||||
Net Change in Unrealized Appreciation (Depreciation) on: | ||||||||
Investments | 6,569,284 | |||||||
Foreign Currency Related Transactions | (2 | ) | ||||||
|
|
| ||||||
Net Realized and Unrealized Gain (Loss) on Investments and Foreign Currency Related Transactions | 11,404,774 | |||||||
|
|
| ||||||
NET INCREASE IN NET ASSETS FROM OPERATIONS | $ | 14,220,088 | ||||||
|
|
| ||||||
The accompanying notes are an integral part of the financial statements.
6
THE FAIRHOLME FOCUSED INCOME FUND
STATEMENTS OF CHANGES IN NET ASSETS
| For the Six Months Ended May 31, 2024 (Unaudited) | For the Fiscal Year Ended November 30, 2023 | |||||||||||||||||||
CHANGES IN NET ASSETS | ||||||||||||||||||||
From Operations | ||||||||||||||||||||
Net Investment Income | $ | 2,815,314 | $ | 4,052,960 | ||||||||||||||||
Net Realized Gain on Investments and Foreign Currency Related Transactions | 4,835,492 | 8,756,008 | ||||||||||||||||||
Net Change in Unrealized Appreciation (Depreciation)on Investments and Foreign Currency Related Translations | 6,569,282 | 2,860,991 | ||||||||||||||||||
|
|
|
|
|
| |||||||||||||||
Net Increase in Net Assets from Operations | 14,220,088 | 15,669,959 | ||||||||||||||||||
|
|
|
|
|
| |||||||||||||||
From Dividends and Distributions to Shareholders | ||||||||||||||||||||
Net Decrease in Net Assets from Dividends and Distributions | (3,882,577 | ) | (4,539,140 | ) | ||||||||||||||||
|
|
|
|
|
| |||||||||||||||
From Capital Share Transactions | ||||||||||||||||||||
Proceeds from Sale of Shares | 7,601,237 | 53,766,263 | ||||||||||||||||||
Shares Issued in Reinvestment of Dividends and Distributions | 1,743,824 | 2,007,900 | ||||||||||||||||||
Cost of Shares Redeemed | (16,730,972 | ) | (28,717,725 | ) | ||||||||||||||||
|
|
|
|
|
| |||||||||||||||
Net Increase (Decrease) in Net Assets from Shareholder Activity | (7,385,911 | ) | 27,056,438 | |||||||||||||||||
|
|
|
|
|
| |||||||||||||||
NET ASSETS | ||||||||||||||||||||
Net Increase in Net Assets | 2,951,600 | 38,187,257 | ||||||||||||||||||
Net Assets at Beginning of Period | 208,734,092 | 170,546,835 | ||||||||||||||||||
|
|
|
|
|
| |||||||||||||||
Net Assets at End of Period | $ | 211,685,692 | $ | 208,734,092 | ||||||||||||||||
|
|
|
|
|
| |||||||||||||||
SHARES TRANSACTIONS | ||||||||||||||||||||
Issued | 601,645 | 4,523,429 | ||||||||||||||||||
Reinvested | 139,020 | 170,946 | ||||||||||||||||||
Redeemed | (1,318,134 | ) | (2,449,069 | ) | ||||||||||||||||
|
|
|
|
|
| |||||||||||||||
Net Increase (Decrease) in Shares | (577,469 | ) | 2,245,306 | |||||||||||||||||
Shares Outstanding at Beginning of Period | 16,927,039 | 14,681,733 | ||||||||||||||||||
|
|
|
|
|
| |||||||||||||||
Shares Outstanding at End of Period | 16,349,570 | 16,927,039 | ||||||||||||||||||
|
|
|
|
|
| |||||||||||||||
The accompanying notes are an integral part of the financial statements.
7
THE FAIRHOLME FOCUSED INCOME FUND
FINANCIAL HIGHLIGHTS
| For the Six Months Ended May 31, 2024 (Unaudited) | For the Fiscal Year Ended November 30, | |||||||||||||||||||||||
2023 | 2022 | 2021 | 2020 | 2019 | ||||||||||||||||||||
PER SHARE OPERATING PERFORMANCE | ||||||||||||||||||||||||
NET ASSET VALUE, BEGINNING OF PERIOD | $12.33 | $11.62 | $10.62 | $10.31 | $10.23 | $9.88 | ||||||||||||||||||
|
|
|
|
|
|
|
|
|
|
|
| |||||||||||||
Investment Operations | ||||||||||||||||||||||||
Net Investment Income(1) | 0.17 | 0.26 | 0.10 | 0.13 | 0.07 | 0.30 | ||||||||||||||||||
Net Realized and Unrealized Gain on Investments | 0.68 | 0.74 | 1.08 | 0.30 | 0.11 | (2) | 0.34 | |||||||||||||||||
|
|
|
|
|
|
|
|
|
|
|
| |||||||||||||
Total from Investment Operations | 0.85 | 1.00 | 1.18 | 0.43 | 0.18 | 0.64 | ||||||||||||||||||
|
|
|
|
|
|
|
|
|
|
|
| |||||||||||||
Dividends and Distributions | ||||||||||||||||||||||||
From Net Investment Income | (0.23 | ) | (0.29 | ) | (0.18 | ) | (0.12 | ) | (0.10 | ) | (0.29 | ) | ||||||||||||
|
|
|
|
|
|
|
|
|
|
|
| |||||||||||||
Total Dividends and Distributions | (0.23 | ) | (0.29 | ) | (0.18 | ) | (0.12 | ) | (0.10 | ) | (0.29 | ) | ||||||||||||
|
|
|
|
|
|
|
|
|
|
|
| |||||||||||||
NET ASSET VALUE, END OF PERIOD | $12.95 | $12.33 | $11.62 | $10.62 | $10.31 | $10.23 | ||||||||||||||||||
|
|
|
|
|
|
|
|
|
|
|
| |||||||||||||
TOTAL RETURN | 6.98 | %(3) | 8.80 | % | 11.30 | % | 4.16 | % | 1.78 | % | 6.49 | % | ||||||||||||
Ratio/Supplemental Data | ||||||||||||||||||||||||
Net Assets, End of Period (in 000’s) | $211,686 | $208,734 | $170,547 | $118,887 | $107,109 | $179,351 | ||||||||||||||||||
Ratio of Gross Expenses to Average Net Assets | 1.00 | %(4) | 1.00 | % | 1.00 | % | 1.00 | % | 1.02 | %(5) | 1.02 | %(5) | ||||||||||||
Ratio of Net Expenses to Average Net Assets | 0.80 | %(4)(6) | 0.80 | %(6) | 0.80 | %(6) | 0.80 | %(6) | 0.82 | %(5)(6) | 0.82 | %(5)(6) | ||||||||||||
Ratio of Net Investment Income to Average Net Assets | 2.66 | %(4) | 2.20 | % | 0.89 | % | 1.20 | % | 0.74 | % | 2.94 | % | ||||||||||||
Portfolio Turnover Rate | 37.46 | %(3) | 53.48 | % | 46.25 | % | 118.05 | % | 100.67 | % | 16.70 | % | ||||||||||||
| (1) | Based on average shares outstanding. |
| (2) | The amount shown for a share outstanding does not correspond with the aggregate net gain (loss) on investments for the period due to the timing of sales and redemptions of shares in relation to fluctuating market values of the investments of the Fund. |
| (3) | Not annualized. |
| (4) | Annualized. |
| (5) | 0.02% is attributable to legal expenses incurred outside the management fee. |
| (6) | Effective January 1, 2018, the Manager has agreed to waive, on a voluntary basis, a portion of the management fee of the Fund to the extent necessary to limit the management fee paid to the Manager by the Fund to an annual rate of 0.80% of the Fund’s daily average net asset value. |
The accompanying notes are an integral part of the financial statements.
8
THE FAIRHOLME FOCUSED INCOME FUND
NOTES TO FINANCIAL STATEMENTS
May 31, 2024 (unaudited)
Note 1. Organization
Fairholme Funds, Inc. (the “Company”), a Maryland corporation, is registered under the Investment Company Act of 1940, as amended (the “1940 Act”), as an open-end management investment company. The Company’s Articles of Incorporation permit the Board of Directors of the Company (the “Board” or the “Directors”) to issue 1,100,000,000 shares of common stock at $.0001 par value. 200,000,000 shares have been allocated to The Fairholme Focused Income Fund (the “Fund”). The Fund is a non-diversified fund. The Fund may have a greater percentage of its assets invested in particular securities than a diversified fund, exposing the Fund to the risk of unanticipated industry conditions as well as risks specific to a single company or the securities of a single company. The Fund has different objectives, capitalizations, and considerations that may or may not lead to differing compositions of issuers, securities within an issuer, and cash levels within the Fund. The Board has the power to designate one or more separate and distinct series and/or classes of shares of common stock and to classify or reclassify any unissued shares with respect to such series.
The Fund’s investment objective is to seek current income. Under normal circumstances, the Fund seeks to achieve its investment objective by investing in a focused portfolio of cash distributing securities. To maintain maximum flexibility, the securities in which the Fund may invest include corporate bonds and other corporate debt securities of issuers in the U.S. and foreign countries, bank debt (including bank loans and loan participations), government and agency debt securities of the U.S. and foreign countries (including U.S. Treasury bills), convertible bonds and other convertible securities, and equity securities, including preferred and common stock of issuers in the U.S. and foreign countries, interests in publicly traded partnerships, and interests in real estate investment trusts. Although the Fund normally holds a focused portfolio of securities, the Fund is not required to be fully invested in such securities and may maintain a significant portion of its total assets in cash and securities generally considered to be cash equivalents. Fairholme Capital Management, L.L.C. (the “Manager”) serves as investment adviser to the Fund.
There is no guarantee that the Fund will meet its objective.
Note 2. Significant Accounting Policies
As an investment company, the Fund follows the investment company accounting and reporting guidance, which is part of U.S. generally accepted accounting principles (“U.S. GAAP”). The Fund’s investments are reported at fair value as defined by U.S. GAAP. The Fund calculates its net asset value as soon as practicable following the close of regular trading on the New York Stock Exchange (currently 4:00 p.m. Eastern Time) on each day the New York Stock Exchange is open.
A description of the valuation techniques applied to the Fund’s securities follows:
Security Valuation:
Securities for which market quotations are readily available are valued at market value, and other securities are valued at “fair value” as determined in accordance with policies and procedures approved by the Board. Pursuant to Rule 2a-5 under the 1940 Act, the Board has designated the Manager as valuation designee to perform fair value determinations relating to the Fund’s portfolio investments, subject to the Board’s oversight.
The Manager may determine the fair valuation of a security when market quotations are not readily available, when securities are determined to be illiquid or restricted, or when in the judgment of the Manager the prices or values available do not represent the fair value of the investment. Factors which may cause the Manager to make such a judgment include the following: (a) only a bid price or an asked price is available; (b) the spread between bid and ask prices is substantial; (c) the liquidity of the securities; (d) the frequency of sales; (e) the thinness of the market; (f) the size of reported trades; (g) actions of the investment’s markets, such as the suspension or limitation of trading; and (h) local market closures. The circumstances of fair valued securities are frequently monitored to determine if fair valuation measures continue to apply.
Equity securities (common and preferred stocks): Securities traded on a national securities exchange or reported on the NASDAQ national market are generally valued at the official closing price, or at the last reported sale price on the exchange or market on which the securities are traded, as of the close of business on the day the securities are being valued or, lacking any sales, at the last available bid price.
9
THE FAIRHOLME FOCUSED INCOME FUND
NOTES TO FINANCIAL STATEMENTS (continued)
May 31, 2024 (unaudited)
Fixed-income securities (U.S. government obligations, corporate bonds, convertible bonds, and asset backed securities): Fixed-income securities are valued at prices supplied by an independent pricing source or by pricing service providers based on broker or dealer supplied valuations or matrix pricing.
Open-end mutual fund: Investments in open-end mutual funds, including money market funds, are valued at their closing net asset value each business day.
Short-term securities: Investments in securities with remaining maturities of less than sixty days are valued at prices supplied by an independent pricing source or by one of the Fund’s pricing agents based on broker or dealer supplied valuations or matrix pricing.
The Fund uses third-party pricing services, which are approved by the Manager, to provide prices for some of the Fund’s securities. The Fund also uses other independent market trade data sources, as well as broker quotes provided by market makers.
U.S. GAAP defines fair value as the price that the Fund would receive to sell an asset or pay to transfer a liability in an orderly transaction between market participants at the measurement date. U.S. GAAP establishes the following fair value hierarchy that categorizes the inputs used to measure fair value:
| • Level 1 — | quoted prices in active markets for identical securities; |
| • Level 2 — | other significant observable inputs (including quoted prices for similar securities, quoted prices in inactive markets for identical securities, interest rates, prepayment speeds, credit risk, etc.); and |
| • Level 3 — | significant unobservable inputs (including the Manager’s assumptions in determining the fair value of investments). |
The inputs or methodology used for valuing investments are not necessarily an indication of the level of risk associated with investing in those investments. The summary of the Fund’s investments by inputs used to value the Fund’s investments as of May 31, 2024, is as follows:
| Valuation Inputs | ||||||||||||||||||||||||||||
| Level 2 - Other | Level 3 - | |||||||||||||||||||||||||||
| Significant | Significant | Total | ||||||||||||||||||||||||||
| Level 1 - | Observable | Unobservable | Fair Value | |||||||||||||||||||||||||
| Quoted Prices | Inputs | Inputs | at 05/31/24 | |||||||||||||||||||||||||
ASSETS: | ||||||||||||||||||||||||||||
INVESTMENTS (Fair Value): | ||||||||||||||||||||||||||||
Domestic Equity Securities* | $ | 91,806,639 | $ | — | $ | — | $ | 91,806,639 | ||||||||||||||||||||
Domestic Preferred Equity Securities* | 2,073,672 | — | — | 2,073,672 | ||||||||||||||||||||||||
U.S. Government Obligations | — | 109,799,694 | — | 109,799,694 | ||||||||||||||||||||||||
Money Market Funds | 8,106,650 | — | — | 8,106,650 | ||||||||||||||||||||||||
|
|
|
|
|
|
|
| |||||||||||||||||||||
TOTAL INVESTMENTS | $ | 101,986,961 | $ | 109,799,694 | $ | — | $ | 211,786,655 | ||||||||||||||||||||
|
|
|
|
|
|
|
| |||||||||||||||||||||
| * | Industry classification for these categories are detailed in the Schedule of Investments. |
There were no Level 3 investments at May 31, 2024 or November 30, 2023.
Dividends and Distributions: The Fund records dividends and distributions to its shareholders on the ex-dividend date. The Fund intends to declare and pay net investment income distributions, if any, quarterly in March, June, September, and December. The Fund intends to distribute any net long-term capital gains and any net short-term capital gains at least once a year. If the total dividends and distributions made in any tax year exceed net investment income and accumulated realized capital gains, a portion of the total distribution may be treated as a tax return of capital.
10
THE FAIRHOLME FOCUSED INCOME FUND
NOTES TO FINANCIAL STATEMENTS (continued)
May 31, 2024 (unaudited)
Foreign Currency Translation: The books and records of the Fund are maintained in U.S. dollars. Foreign currency amounts are translated into U.S. dollars on the following basis: (i) fair value of investment securities, assets, and liabilities at the current rate of exchange; and (ii) purchases and sales of investment securities, income, and expenses at the relevant rates of exchange prevailing on the respective dates of such transactions. The Fund does not isolate that portion of gains and losses on investment securities which is due to changes in the foreign exchange rates from that which is due to changes in the market prices of such securities.
Estimates: The preparation of financial statements in conformity with U.S. GAAP requires the Fund to make estimates and assumptions that affect the reported amounts of assets and liabilities and disclosure of contingent assets and liabilities at the date of the financial statements and the reported amounts of increases and decreases in net assets from operations during the reported period. Actual results could differ from those estimates.
Other: The Fund accounts for security transactions on the trade date for financial statement purposes. The specific identification method is used for determining gains or losses for financial statements and income tax purposes. Dividend income is recorded on the ex-dividend date net of foreign taxes withheld where recovery is uncertain and interest income is recorded on an accrual basis. Discounts and premiums on securities purchased are amortized over the life of the respective securities using the effective yield method. Securities denominated in currencies other than U.S. dollars are subject to changes in value due to fluctuation in exchange rates. The Fund may invest in countries that require governmental approval for the repatriation of investment income, capital, or the proceeds of sales of securities by foreign investors. In addition, if there is deterioration in a country’s balance of payments or for other reasons, a country may impose temporary restrictions on foreign capital remittances abroad.
The Fund paid commissions and other brokerage fees during the period.
Note 3. Related Party Transactions
The Manager is a Delaware limited liability company and is registered with the SEC as an investment adviser. The Manager’s principal business is to provide investment management and advisory services to individuals, corporations, and other institutions throughout the world. Pursuant to an Investment Management Agreement, the Fund pays a management fee to the Manager for its provision of investment advisory and operating services to the Fund. Subject to applicable waivers or limitations, the management fee is paid at an annual rate equal to 1.00% of the daily average net assets of the Fund. Effective January 1, 2018, the Manager has agreed to waive, on a voluntary basis, a portion of the management fees of the Fund to the extent necessary to limit the management fee of the Fund to the annual rate of 0.80% of the Fund’s daily average net asset value (“Undertaking”). This Undertaking may be terminated by the Manager upon 60 days’ written notice to the Fund. The Manager is responsible pursuant to the Investment Management Agreement for paying the Fund’s expenses for the following services: transfer agency, fund accounting, fund administration, custody, legal, audit, compliance, directors’ fees, call center, fulfillment, travel, insurance, rent, printing, postage and other office supplies. The Manager is not responsible for paying for the following costs and expenses of the Fund: commissions, brokerage fees, issue and transfer taxes, and other costs chargeable to the Fund in connection with securities transactions or in connection with securities owned by the Fund, taxes, interest, acquired fund fees and related expenses, expenses in connection with litigation by or against the Fund, and any other extraordinary expenses.
The Manager earned, after the voluntary reduction of the management fees, $847,012 from the Fund for its services during the six months ended May 31, 2024.
Bruce Berkowitz is the Chief Investment Officer of the Manager and Chairman of the Fund’s Board of Directors. As of May 31, 2024, Mr. Berkowitz and his affiliates owned an aggregate 5,596,059 shares of the Fund.
A Director and Officers of the Fund are also Officers of the Manager or its affiliates.
11
THE FAIRHOLME FOCUSED INCOME FUND
NOTES TO FINANCIAL STATEMENTS (continued)
May 31, 2024 (unaudited)
Note 4. Investments
For the six months ended May 31, 2024, aggregated purchases and sales of investment securities other than short-term investments and U.S. government obligations were as follows:
| Purchases | Sales | |||||||||
| $ | 38,960,279 | $ | 30,925,881 | |||||||
Note 5. Tax Matters
Federal Income Taxes: The Fund intends to qualify each year as a “regulated investment company” under Subchapter M of the Internal Revenue Code of 1986, as amended. By so qualifying, the Fund will not be subject to federal income taxes to the extent that it distributes all of its net investment income and any realized capital gains.
For U.S. federal income tax purposes, the cost of securities owned, gross unrealized appreciation, gross unrealized depreciation, and net unrealized appreciation/(depreciation) of investments at May 31, 2024, were as follows:
| Net Unrealized | ||||||
| Gross Unrealized | Gross Unrealized | Appreciation | ||||
| Cost | Appreciation | Depreciation | /(Depreciation) | |||
| $ 192,457,750 | $ 19,328,905 | $ – | $ 19,328,905 | |||
The difference between book basis and tax basis net unrealized appreciation is attributable to capitalized cost and basis adjustments on investments in partnerships.
The Fund’s tax basis capital gains are determined only at the end of each fiscal year. Therefore the components of distributable earnings will be included in the Annual Report for the fiscal year ended November 30, 2024.
The Fund is permitted to carry forward for an unlimited period capital losses incurred to reduce future required distributions of net capital gains to shareholders. Capital losses that are carried forward will retain their character as either short-term or long-term capital losses. As of November 30, 2023, net short-term and long-term capital loss carryforwards were as follows:
Long-term capital loss carryforward | $15,592,192 | |||
|
| |||
Total | $15,592,192 | |||
|
|
The Manager has analyzed the Fund’s tax positions taken on tax returns for all open tax years (current and prior three tax years) and has concluded that there are no uncertain tax positions that require recognition of a tax liability. The Fund’s federal and state income and federal excise tax returns for tax years for which the applicable statutes of limitations have not expired (the current year and prior three years) are subject to examination by the Internal Revenue Service and state departments of revenue. Additionally, the Fund is not aware of any tax position for which it is reasonably possible that the total amounts of unrecognized tax benefits will change materially in the next twelve months.
Note 6. Dividends and Distributions to Shareholders
Ordinary income and capital gain distributions are determined in accordance with federal income tax regulations, which may differ from U.S. GAAP.
12
THE FAIRHOLME FOCUSED INCOME FUND
NOTES TO FINANCIAL STATEMENTS (continued)
May 31, 2024 (unaudited)
The tax character of dividends and distributions paid by the Fund were as follows:
| For the | ||||||||
| For the | Fiscal Year | |||||||
| Six Months | Ended | |||||||
| Ended | November 30, | |||||||
| May 31, 2024 | 2023 | |||||||
Dividends and Distributions paid from: | ||||||||
Ordinary Income | $ | 3,882,577 | $ | 4,539,140 | ||||
|
|
|
| |||||
Note 7. Indemnifications
Under the Company’s organizational documents, its Officers and Directors are indemnified against certain liabilities arising out of the performance of their duties to the Fund. In the normal course of business the Company or the Fund enter into contracts that contain a variety of representations and customary indemnifications. The Fund’s maximum exposure under these arrangements is unknown as this would involve future claims that may be made against the Fund that have not yet occurred. However, based on its experience to date, the Fund expects the risk of loss to be remote.
Note 8. Subsequent Events
Management has evaluated the impact on the Fund of all subsequent events occurring through the date the financial statements were issued and has determined that there were no subsequent events requiring recognition or disclosure in the financial statements.
13
| Item 8. | Changes in and Disagreements with Accountants for Open-End Management Investment Companies. |
Not applicable.
| Item 9. | Proxy Disclosures for Open-End Management Investment Companies. |
Not applicable.
| Item 10. | Remuneration Paid to Directors, Officers, and Others of Open-End Management Investment Companies. |
Disclosed in the Fund’s financial statements.
| Item 11. | Statement Regarding Basis for Approval of Investment Advisory Contract. |
Not applicable.
| Item 12. | Disclosure of Proxy Voting Policies and Procedures for Closed-End Management Investment Companies. |
Not applicable.
| Item 13. | Portfolio Managers of Closed-End Management Investment Companies. |
Not applicable.
| Item 14. | Purchases of Equity Securities by Closed-End Management Investment Company and Affiliated Purchasers. |
Not applicable.
| Item 15. | Submission of Matters to a Vote of Security Holders. |
There have been no material changes to the procedures by which shareholders may recommend nominees to the registrant’s board of trustees, where those changes were implemented after the registrant last provided disclosure in response to the requirements of Item 407(c)(2)(iv) of Regulation S-K (17 CFR 229.407) (as required by Item 22(b)(15) of Schedule 14A (17 CFR 240.14a-101)), or this Item.
| Item 16. | Controls and Procedures. |
| (a) | The registrant’s principal executive and principal financial officers, or persons performing similar functions, have concluded that the registrant’s disclosure controls and procedures (as defined in Rule 30a-3(c) under the Investment Company Act of 1940, as amended (the “1940 Act”) (17 CFR 270.30a-3(c))) are effective, as of a date within 90 days of the filing date of this report, that includes the disclosure required by this paragraph, based on the evaluation of these controls and procedures required by Rule 30a-3(b) under the 1940 Act (17CFR 270.30a-3(b)) and Rules 13a-15(b) or 15d-15(b) under the Securities Exchange Act of 1934, as amended (17 CFR 240.13a-15(b) or 240.15d-15(b)). |
| (b) | There were no changes in the registrant’s internal control over financial reporting (as defined in Rule 30a-3(d) under the 1940 Act (17 CFR 270.30a-3(d))) that occurred during the period covered by this report that have materially affected, or are reasonably likely to materially affect, the registrant’s internal control over financial reporting. |
| Item 17. | Disclosure of Securities Lending Activities for Closed-End Management Investment Companies. |
Not applicable.
| Item 18. | Recovery of Erroneously Awarded Compensation. |
Not Applicable.
| Item 19. | Exhibits. |
| (a)(1) | Not applicable. | |
| (a)(2) | Not applicable. | |
| (a)(3) | Certifications pursuant to Rule 30a-2(a) under the 1940 Act and Section 302 of the Sarbanes-Oxley Act of 2002 are attached hereto. | |
| (a)(3)(1) | Not applicable. | |
| (a)(3)(2) | Not applicable. | |
| (b) | Certifications pursuant to Rule 30a-2(b) under the 1940 Act and Section 906 of the Sarbanes-Oxley Act of 2002 are attached hereto. | |
SIGNATURES
Pursuant to the requirements of the Securities Exchange Act of 1934 and the Investment Company Act of 1940, the registrant has duly caused this report to be signed on its behalf by the undersigned, thereunto duly authorized.
(Registrant) Fairholme Funds, Inc. | ||
By (Signature and Title)* | /s/ Bruce R. Berkowitz | |
Bruce R. Berkowitz, President | ||
(principal executive officer) | ||
Date August 6, 2024 | ||
Pursuant to the requirements of the Securities Exchange Act of 1934 and the Investment Company Act of 1940, this report has been signed below by the following persons on behalf of the registrant and in the capacities and on the dates indicated.
By (Signature and Title)* | /s/ Bruce R. Berkowitz | |
Bruce R. Berkowitz, President | ||
(principal executive officer) | ||
Date August 6, 2024 | ||
By (Signature and Title)* | /s/ Wayne Kellner | |
Wayne Kellner, Treasurer | ||
(principal financial officer) | ||
Date August 6, 2024 | ||
* Print the name and title of each signing officer under his or her signature.