Table of Contents
UNITED STATES
SECURITIES AND EXCHANGE COMMISSION
Washington, D.C. 20549
Form 10-K
(Mark One)
x | ANNUAL REPORT PURSUANT TO SECTION 13 OR 15(d) OF THE SECURITIES EXCHANGE ACT OF 1934 |
For the Fiscal Year Ended December 31, 2011
OR
o | TRANSITION REPORT PURSUANT TO SECTION 13 OR 15(d) OF THE SECURITIES EXCHANGE ACT OF 1934 |
For the transition period from to .
Commission file number: 001-35062
Epocrates, Inc.
(Exact name of registrant as specified in its charter)
Delaware | | 94-3326769 |
(State or other jurisdiction of
incorporation or organization) | | (I.R.S. Employer
Identification No.) |
1100 Park Place, Suite 300
San Mateo, California 94403
(Address of principal executive offices, including zip code)
(650) 227-1700
(Registrant’s telephone number, including area code)
Securities registered pursuant to Section 12(b) of the Act:
Title of Each Class | | Name of Each Exchange on Which Registered |
Common Stock, par value $0.001 per share | | The NASDAQ Stock Market LLC |
Securities registered pursuant to Section 12(g) of the Act: None
Indicate by check mark if the registrant is a well-known seasoned issuer, as defined in Rule 405 of the Securities Act. Yes o No x
Indicate by check mark if the registrant is not required to file reports pursuant to Section 13 or Section 15(d) of the Act. Yes o No x
Indicate by check mark whether the registrant (1) has filed all reports required to be filed by Section 13 or 15(d) of the Securities Exchange Act of 1934 during the preceding 12 months (or for such shorter period that the registrant was required to file such reports), and (2) has been subject to such filing requirements for the past 90 days. Yes x No o
Indicate by check mark whether the registrant has submitted electronically and posted on its corporate Web site, if any, every Interactive Data File required to be submitted and posted pursuant to Rule 405 of Regulation S-T during the preceding 12 months (or for such shorter period that the registrant was required to submit and post such files). Yes x No o
Indicate by check mark if disclosure of delinquent filers pursuant to Item 405 of Regulation S-K is not contained herein and will not be contained, to the best of registrant’s knowledge, in definitive proxy or information statements incorporated by reference in Part III of this Form 10-K or any amendment to this Form 10-K. o
Indicate by check mark whether the registrant is a large accelerated filer, an accelerated filer, a non-accelerated filer, or a smaller reporting company. See the definitions of “large accelerated filer,” “accelerated filer” and “smaller reporting company” in Rule 12b-2 of the Exchange Act. (Check one):
Large accelerated filer o | | Accelerated filer o |
| | |
Non-accelerated filer x | | Smaller reporting company o |
(Do not check if a smaller reporting company) | | |
Indicate by check mark whether the registrant is a shell company (as defined in Rule 12b-2 of the Exchange Act). Yes o No x
The approximate aggregate market value of voting stock held by non-affiliates of the registrant, based upon the last sale price of the registrant’s common stock on the last business day of the registrant’s most recently completed second fiscal quarter, June 30, 2011 (based upon the closing sale price of the registrant’s common stock listed as reported on the NASDAQ Global Select Market), was approximately $335,213,000. This calculation excludes approximately 5,248,000 shares held by directors, executive officers and by each person or investor affiliated with a member of the Board of Directors as of June 30, 2011. Exclusion of these shares does not constitute a determination that each such person is an affiliate of the registrant.
The number of shares of common stock outstanding as of February 29, 2012 was 24,573,455.
Table of Contents
EPOCRATES, INC.
FOR THE FISCAL YEAR ENDED DECEMBER 31, 2011
TABLE OF CONTENTS
2
Table of Contents
PART I
SPECIAL NOTE REGARDING FORWARD-LOOKING STATEMENTS
This report contains forward-looking statements. All statements other than statements of historical facts, including statements regarding our future financial condition, business strategy and plans and objectives of management for future operations, are forward-looking statements. Terminology such as “believe,” “may,” “might,” “objective,” “estimate,” “continue,” “anticipate,” “intend,” “should,” “plan,” “expect,” “predict,” “potential,” or the negative of these terms or other similar expressions is intended to identify forward-looking statements. We have based these forward-looking statements largely on our current expectations and projections about future events and financial trends that we believe may affect our financial condition, results of operations, business strategy and financial needs. These forward-looking statements are subject to a number of risks, uncertainties and assumptions described under the section titled “Risk Factors” and elsewhere in this report.
The events and circumstances reflected in the forward-looking statements may not be achieved or occur and actual results may differ materially from those contained in any forward-looking statements. Although we believe that the expectations reflected in the forward-looking statements are reasonable, we cannot guarantee future results, levels of activity, performance or achievements. Moreover, neither we nor any other person assume responsibility for the accuracy and completeness of the forward-looking statements. You should not place undue reliance on any forward-looking statements.
Except as required by law, we undertake no obligation to update publicly any forward-looking statements for any reason to conform these statements to actual results or to changes in our expectations. We qualify all of our forward-looking statements by these cautionary statements.
Item 1. Business
Overview
Epocrates is a leading physician platform for essential clinical content, practice tools and health industry engagement at the point of care. Our user network consists of well over one million healthcare professionals; including approximately 340,000, or more than 50% of, U.S. physicians. Epocrates’ portfolio features top-ranked medical apps, including the industry’s #1 used mobile drug reference, which provides convenient, point-of-care access to information such as dosing, drug interactions, pricing and insurance coverage for thousands of brand, generic and over-the-counter drugs. The features available through our unique physician platform are referenced multiple times per day and help healthcare professionals make more informed prescribing decisions, improve workflow and enhance patient safety. We offer our products on major U.S. mobile platforms including Apple iOS, Android and BlackBerry.
We generate approximately 80% of our revenue from providing healthcare companies with interactive services to communicate with our network of users (60%) and by leveraging our network of healthcare professionals for market research services (20%). Our user network is one of our most valuable assets and we strive to strengthen this network by increasing physician engagement and by introducing additional tools to support healthcare professionals at the point of care. We also generate revenues from the sale of our subscription products to healthcare professionals, which accounts for the remaining 20% of our revenues.
In July 2011, we entered a controlled release of the Epocrates electronic health record, or “EHR,” mobile and web-based EHR offering focused on the solo and small group practices sector. We did not generate any material revenues from our EHR offering in 2011. On February 24, 2012, the Board of Directors of Epocrates approved the discontinuation of further development of Epocrates’ EHR product. The Board of Directors made this determination in order to focus Epocrates’ efforts on its core business, Subscriptions and Interactive Services, and due to the future uncertainty and ongoing investment required for the EHR product. Epocrates will explore strategic alternatives for the EHR product. In connection with this decision, Epocrates recorded an impairment charge of approximately $8.5 million in its fourth fiscal quarter of 2011, which represents the write-down of the carrying value of the goodwill, intangible and other long-lived assets related to the EHR product to their estimated fair value of zero. This charge is recorded in Impairment of Long-lived Assets and Goodwill in our consolidated statements of operations for the year ended December 31, 2011.
3
Table of Contents
Reportable Segments
Subscriptions and Interactive Services
Subscriptions revenue
The majority of healthcare professionals in our network use our free products and services and do not purchase any of our premium subscriptions. Premium subscriptions are available to our mobile physician platform and our online drug and clinical reference product, and site licenses or codes may be purchased for access to either our mobile or online products. We also sell subscriptions to nearly 65 education, learning and clinical applications, which we own as a result of our acquisition of Modality, Inc. in late 2010, for the Apple iOS platform. This channel’s revenues are not significant to our consolidated total revenues, net. Approximately 20% of our revenue is derived from premium subscriptions.
Epocrates mobile physician platform
Our proprietary drug content included in our drug reference tool provides convenient access to information healthcare professionals need at the point of care, such as dosing, drug interactions, pricing and insurance coverage for thousands of brands, generic and over-the-counter drugs. Physicians trust Epocrates for accurate and timely content.
In October 2011, we launched a redesign of our drug reference tool to create a new platform that provides healthcare professionals with improved, faster access to our trusted drug content, as well as additional tools. In addition to access to our proprietary drug reference tool with dosing, drug interactions, pricing and insurance coverage for thousands of brand, generic and over-the-counter drugs, physicians now have better access and increased awareness of other resources from Epocrates and its partners. The Epocrates physician platform condenses all available and relevant medical information on one dashboard which may be customized according to each user’s unique needs. Our new platform should raise awareness of our interactive services such as EssentialPoints, Contact Manufacturer and Mobile Sample Closet. We have also built an app directory that resides on the Epocrates platform and provides healthcare professionals with convenient, centralized access to a portfolio of reference, education and clinical apps. Our new platform serves as a channel for Epocrates to partner on development and distribution of apps.
Epocrates online drug and clinical reference products
We offer online drug and clinical reference tools for free or through a premium subscription. The free online product includes the same drug and formulary information found in the free mobile product. It also includes complimentary access to disease content developed in conjunction with the BMJ Group, publishers of the British Medical Journal, as well as patient education handouts available in English and Spanish.
Our online premium product includes the items mentioned above, as well as an alternative medicine database, hundreds of medical equations, clinical criteria and unit/dose converters. The online premium version may be purchased by individuals on the Epocrates website or by groups through our institutional sales team.
Interactive Services
We generate approximately 80% of our total revenues, net by working with third parties to engage with our clinician network. Specifically, providing an effective channel for pharmaceutical companies to communicate with their target audience in a cost-effective manner generates 60% of revenue, and an additional 20% is generated through market research services with our extensive physician network. To date, our interactive services clients have included all of the top 20 global pharmaceutical companies by sales and hundreds of individual pharmaceutical brands. Our interactive services include:
DocAlert clinical messaging. DocAlerts are short, clinically relevant messages that deliver news and alerts including product approvals, clinical study results, practice management information, industry guidelines and formulary status changes to our users. The majority of these DocAlert messages are not sponsored. The balance of DocAlert messages are sponsored by our clients and are marked as such. These messages serve as a vehicle for our clients to communicate key scientific and medical information to clinicians as a way to keep them informed. Depending on the alert, clinicians may have the option to view additional information on their mobile devices, save the messages for future reference, forward the message to a colleague or request additional information via e-mail.
Virtual Representative Services. Our fully-integrated mobile promotional programs supplement and replicate the traditional sales model with services typically provided during representative interactions – such as drug detailing, sampling and patient literature delivery, which we provide through Epocrates’ Mobile Sample Closet – as well as the ability to contact drug manufacturers at the point of care. Through Epocrates’ Essential Points, our pharmaceutical clients may sponsor activities on relevant topics which Epocrates communicates via two to seven minute overviews on physicians’ mobile devices. Our pharmaceutical clients also leverage the Epocrates’ App Network, a service which provides our clients with development, distribution (or a combination of these two offerings) or sponsorship of apps which are offered to targeted groups of physicians in our network.
4
Table of Contents
Epocrates market research. We recruit healthcare professionals based on occupation, specialty, years in practice, practice setting and geography to participate in market research activities such as online surveys, Q&A sessions and one-on-one interviews. Customers contract with us and pay a fee to us for access to a targeted group of our users whom they wish to survey. We pay a portion of this fee to the survey participants as an incentive for them to participate. Numerous market research firms have used our services to recruit healthcare professionals for market research surveys on behalf of the healthcare and financial services industries.
Formulary hosting. Our clients contract with us to host their formulary and make it available to our users for a one to three year period. Healthcare professionals have the option to download plan formulary lists by geographic area or patient demographic at no cost. We work with large national health insurance, regional and Medicaid plans, and we collaborate with the Centers for Medicare and Medicaid Services, or “CMS,” to offer formulary information for all Medicare Part D plans. For each plan, we integrate co-pay levels, quantity limits and prior authorization requirements into our core drug reference products and display lower-cost and generic alternatives so physicians may select a less expensive treatment, reducing costs to patients and health plans.
Mobile resource centers. This educational service allows healthcare professionals to stay current on clinical developments for a variety of diseases, conditions and topics. Typically sponsored by a pharmaceutical company for a year at a time, each resource center is developed in conjunction with a key opinion leader for that specific disease or condition. The content is updated on a regular basis and includes information such as news abstracts, conference highlights and commentary on medical advances in the field.
Electronic Health Records
In July 2011, we entered a controlled release of the Epocrates EHR mobile and web-based EHR offering, with the intent to offer a full product in 2012. Our EHR solution was designed to meet the distinct needs of primary care practices with 10 or fewer physicians and position users to qualify for subsidies under the Health Information Technology for Economic and Clinical Health Act, passed as part of the American Recovery and Reinvestment Act of 2009. Our solution is a secure, mobile and web-based Software-as-a-Service system featuring core capabilities including patient encounter notes, electronic lab integration, ePrescribing and Epocrates’ market-leading drug content. The market for EHR products is competitive, crowded and we have limited experience in that market. In 2011, the EHR segment did not generate a significant amount of revenue.
As indicated in the Overview section above, on February 24, 2012, the Board of Directors of Epocrates approved the discontinuation of further development of Epocrates’ EHR product. In connection with this decision, Epocrates recorded an impairment charge of approximately $8.5 million in its fourth quarter of 2011, which represents the write-down of the carrying value of the goodwill, intangible and other long-lived assets related to the EHR product to their estimated fair value of zero. This charge is recorded in Impairment of Long-lived Assets and Goodwill in our consolidated statements of operations for the year ended December 31, 2011.
Financial Information About Segments
Segment information for the years ended December 31, 2011, 2010 and 2009 is reported in Note 16 – Segment Information.
Intellectual Property
We rely upon a combination of trade secret, copyright, trademark and patent laws, license agreements, confidentiality procedures, employee and client non-disclosure agreements to protect the intellectual property used in our business. We currently have six issued patents, which expire between 2020 and 2023, and three pending patent applications.
We use trademarks, trade names and service marks for our drug and clinical reference products and interactive services, including DocAlert®, Epocrates®, Epocrates Honors®, Epocrates ID®, Epocrates Lab™, Epocrates MedTools®, Epocrates Rx®, Epocrates Rx Pro®, Epocrates Dx®, Epocrates QuickSurvey®, Epocrates QuickRecruit®, Epocrates MedInsight®, EssentialPoints® and MedCafe®. We also use other registered and unregistered trademarks and service marks for our various services. In addition to our trademark registrations and applications, we have registered the domain names that either are or may be relevant to conducting our business, including http://www.epocrates.com. We also rely on a variety of intellectual property rights that we license from third parties, including various software and healthcare content used in our services.
5
Table of Contents
Backlog
Our backlog consists of firm purchase orders by customers for delivery as well as deferred revenue recorded on the balance sheet. As of December 31, 2011, backlog was approximately $79.0 million, compared to approximately $86.0 million as of December 31, 2010. A majority of our unfilled orders will be recognized as revenue in the 2012 fiscal year. Backlog on any particular date, while indicative of short-term revenue performance, is not necessarily a reliable indicator of medium or long-term revenue performance.
Competition
The markets in which we participate are competitive and dynamic, subject to developments in technology and the healthcare industry. Our management team includes experienced healthcare, pharmaceutical and information technology industry executives. We benefit from their operational experience, thorough understanding of the marketplace and extensive relationships with pharmaceutical companies and other existing and potential clients.
Drug and clinical reference tools. Healthcare professionals use mobile, online and print media to reference clinical information. All of these media compete for the attention of healthcare professionals on the basis of providing access to relevant and reliable clinical information as well as the compatibility on mobile platforms. Our mobile and online drug and clinical reference tools primarily compete with Medscape, a division of WebMD Health Corp. and UpToDate Inc., a division of Wolters Kluwer Health.
We compete primarily on the ability to reach and communicate with healthcare professionals. The Epocrates brand is recognized and endorsed among healthcare professionals as a trusted and accurate source of drug and clinical information. Our brand has enabled us to build a large and active network of users, which enhances our ability to market our interactive services. Our network of healthcare professionals has grown primarily through word-of-mouth marketing; the breadth and loyalty of our user network are not easily replicated. Management continuously monitors the strength of our brand through market research.
Our proprietary drug content is developed and continually updated by a team of physicians and pharmacists who work to ensure accuracy and relevance. To develop our drug content, our team researches and reviews primary literature, specialty society recommendations, evidence-based medicine, clinical guidelines and manufacturer labeling. We believe the quality, relevance and ease of use of our content drive our ability to attract and retain users.
Our mobile products are not dependent on continuous access to the Internet, and therefore are fast and accessible to our users. Our infrastructure is designed to seamlessly control and deploy robust and customized content to a large number of users, allowing for simple and efficient downloads and updates of our clinical information. These attributes continue to be significant advantages in supporting our network.
Interactive services. Our interactive services business competes with traditional sales and marketing methods, including sales representatives, for promotional spend by pharmaceutical companies. It also competes with companies marketing pharmaceutical company products, programs and services to healthcare professionals. These competitors include Medscape and Physicians Interactive.
Our interactive services enable pharmaceutical companies to achieve returns on their marketing investments, increase the reach and frequency of interactions with prescribing physicians on new, niche and established brands, and more effectively support underserved geographic markets. We compete on the basis of several factors, including the breadth and depth of our services, our reputation, the relevance and reliability of our content and our extensive physician user network.
Epocrates market research. Our market research business competes with firms such as Medefield America and All Global. Both of these firms recruit physicians to participate in surveys, often by phone, fax, e-mail or traditional mail. It also competes with market research companies that have assembled their own panels of healthcare professionals. Epocrates competes in this space by leveraging its extensive and loyal physician member network whose users are more likely to be responsive to a company and brand they know and trust. Additionally, in January 2012, Epocrates announced a partnership with M3 Inc. to create the world’s largest verified physician and healthcare provider panel. By combining their high-quality, opted-in physician panels, the companies can now offer a global market research sampling solution.
Electronic health records. During 2011, we competed with companies selling EHR solutions to solo and small group physician practices, including eClinicalWorks and Allscripts. We competed in this space through brand recognition and by leveraging our extensive physician user network and developing a solution tailored specifically for use in solo and small group practices. We did not have a strong competitive position in the EHR market in 2011, which contributed to our decision to discontinue the development of our EHR offering in 2011.
6
Table of Contents
Research and Development
Our expenditures for research and development were $22.8, $19.7 and $14.7 million for the years ended December 31, 2011, 2010 and 2009, respectively, of which $1.7 million, $4.0 million and zero related to EHR. Additionally, we capitalized $6.5 million and $0.7 million of costs related to EHR in 2011 and 2010. In the fourth quarter of 2011, we recorded a charge of approximately $6.7 million to write off the carrying value of capitalized software related to the EHR reporting unit down to its estimated fair value of zero.
User Privacy and Trust
We have internal policies and practices relating to, among other things, content standards and user privacy, designed to foster relationships with our users. In addition, we are a licensee of the TRUSTe Privacy Program. TRUSTe is an independent, non-profit organization whose goal is to build users’ trust and confidence in the Internet. We have also provided certification to the U.S. Department of Commerce to qualify for the safe harbor exception to the European Union Data Protection Directive established for U.S. based corporations. Our privacy policy informs website users and visitors of the information we collect about them and about their use of our services. We also explain the choices available as to how their personal information is used and how we protect that information. Additionally, we comply with the Payment Card Industry Data Security Standard, a set of requirements designed to ensure that all companies that process, store or transmit credit card information maintain a secure environment.
Government Regulation
Most of our revenue is derived directly from the healthcare industry, and from pharmaceutical companies in particular. The healthcare industry is highly regulated and is subject to changing political, regulatory and other influences. These factors affect the purchasing practices and operations of healthcare organizations, as well as the behavior and attitudes of our users. Recently, healthcare reform has been enacted at the federal level, and there have been enforcement initiatives targeting the healthcare industry’s promotional practices, as well as proposals to increase the regulation of pharmaceutical companies. We expect federal and state legislatures and agencies to continue to consider programs to reform or revise aspects of the U.S. healthcare system and the approval and promotion of pharmaceuticals. These programs may contain proposals to increase governmental involvement in healthcare or otherwise change the environment in which healthcare industry participants operate. Healthcare industry participants may respond by reducing their spending or postponing decisions, including purchasing our products and services.
Laws and regulations have also been adopted, and may be adopted in the future, that address Internet-related issues, including mobile and online content, privacy, online marketing, unsolicited commercial e-mail, taxation, pricing and quality of services. Many laws are complex and their application to specific services may not be clear. In particular, many existing laws and regulations, when enacted, do not anticipate the clinical information and interactive services that we provide. However, these laws and regulations may nonetheless be applied to our services. Refer to “Item 1A. Risk Factors,” and particularly the risk factors entitled “Healthcare and consumer protection regulations and legislation create risks and challenges with respect to our compliance efforts and our business strategies” and “We face potential liability related to the privacy and security of personal information we collect from healthcare professionals through our products and interactive services,” for specific information regarding how certain governmental regulations pertain to us.
Long-lived Assets and Revenues
All of our long-lived assets are located within the U.S. Our revenue is derived primarily from clients in the healthcare industry (pharmaceutical companies, managed care companies and market research firms) within the U.S. Revenue from clients outside the U.S. is not material for the years ended December 31, 2011, 2010 or 2009, and no single customer accounted for more than 10% of net revenue for the same periods. For the years ended December 31, 2011, 2010 and 2009, interactive services revenue accounted for $90.8 million, $79.3 million and $74.7 million of our revenues, respectively, and subscription revenues accounted for $22.5 million, $24.7 million and $19.0 million of our revenues, respectively.
The timing of our revenue has been affected by seasonal factors, primarily as a result of the annual budget approval process of many of our customers in the pharmaceutical industry. As a result, our contract bookings and revenue have historically been highest in the fourth quarter of each calendar year and we expect this trend to continue.
7
Table of Contents
Employees
As of December 31, 2011, we had approximately 360 employees. None of our employees is covered by a collective bargaining agreement.
Executive Officers of the Registrant
Our current executive officers and their respective ages and positions are:
Name | | Age | | Position |
Peter C. Brandt | | 54 | | Interim President and Chief Executive Officer |
Patrick D. Spangler | | 56 | | Chief Financial Officer |
Matthew A. Kaminer | | 38 | | General Counsel and Secretary |
David B. Burlington | | 48 | | Chief Operations Officer |
Heather A. Gervais | | 41 | | Senior Vice President, Commercial Operations |
Adam E. Budish | | 51 | | Senior Vice President, Sales |
Peter C. Brandt has served on our Board since February 2011, and has served as our Interim President and Chief Executive Officer since November 16, 2011. Since September 2009, Mr. Brandt has been serving on the boards of directors for various healthcare companies. From April 2008 to August 2009, Mr. Brandt served as President and CEO of Noven Pharmaceuticals, Inc., a specialty pharmaceutical company, where he was responsible for the overall management of the company. From May 2007 to April 2008, Mr. Brandt served as a consultant for various healthcare companies. From January 2006 to May 2007, Mr. Brandt served as President of U.S. Pharmaceutical Operations of Pfizer, Inc., a biomedical and pharmaceutical company, and as President of Latin American Pharmaceutical Operations and Senior Vice President of Global Pharmaceuticals overseeing Finance, Information Technology, Planning and Business Development departments, as well as the Pfizer Health Solutions department from January 2004 to December 2005. Mr. Brandt holds a B.A. from the University of Connecticut and an M.B.A. from Columbia University. Mr. Brandt previously served on the Board of Directors of Noven Pharmaceuticals, Inc. and currently serves as a director of Rexahn Pharmaceuticals, Inc. and Auxilium Pharmaceuticals, Inc. The Nominating Committee believes that Mr. Brandt’s extensive experience in the pharmaceutical industry and financial matters makes him a valuable member of the Board. Mr. Brandt was identified by a recruiter and elected to the Board to fill a vacancy created by the resignation of a member of the Board and, prior to his appointment as Interim President and CEO, to serve as a member of our Audit Committee.
Patrick D. Spangler has served as our CFO since September 2010. From May 2010 to September 2010, Mr. Spangler served as Operating Partner at Three Fields Capital, a private equity and venture capital firm, where he was responsible for evaluating the merits of investment opportunities and functioned as operating partner. From June 2009 to April 2010, Mr. Spangler served as CFO for High Jump Software Inc., a supply chain management software company. From April 2005 to January 2009, Mr. Spangler served as Senior Vice President and CFO for ev3 Inc., a medical device company, and as its Treasurer from April 2005 to February 2008, where he was responsible for various finance functions, including corporate planning, tax, treasury operations, corporate development, risk management and audit. From June 1997 to January 2005, Mr. Spangler served as Executive Vice President, CFO and Assistant Secretary for Empi, Inc., a company specializing in rehabilitative medical devices. From January 2005 to March 2005, Mr. Spangler served as a consultant to Empi, Inc. Mr. Spangler holds a B.S. from the University of Minnesota, an M.B.A. from the University of Chicago and an M.B.T. from the University of Minnesota. Mr. Spangler serves on the Board of Directors of Urologix, Inc.
Matthew A. Kaminer has served as our General Counsel and Secretary since June 2011. From March 2010 until June 2011, Mr. Kaminer served as General Counsel for MediMedia USA, Inc., a company that provides specialty healthcare communications, publishing and medical education, where he was responsible for various legal functions. From May 2004 through December 2009, Mr. Kaminer served as Assistant General Counsel and Chief Privacy Officer at WebMD Health Corp., where he was responsible for various legal affairs. Mr. Kaminer earned his Juris Doctor from George Washington University and his Bachelor of Science in Computer Science from Pennsylvania State University.
David B. Burlington has served as our Chief Operations Officer since October 2010. From August 2005 to August 2010, Mr. Burlington served as Group Vice President, Applications and Technology for Taleo Corporation, a talent management software company where he was responsible for various business development and operational functions, including
8
Table of Contents
administration of strategic relationships and product development, strategy and management. From March 2001 to July 2005, Mr. Burlington served as Senior Vice President of Product Development for Comergent Technologies, Inc., an e-business software company. Mr. Burlington holds a B.S. from Santa Clara University.
Heather A. Gervais has served as our Senior Vice President of Commercial Operations since November 2011. Ms. Gervais joined Epocrates in September 2010 as the Vice President of Client Services. Prior to her employment at Epocrates, Ms. Gervais served as Vice President, Group Director at Digitas Health from March 2010 to August 2010, where she was responsible for healthcare marketing. From July 2008 to March 2010, Ms. Gervais ran her own consulting firm, Gervais & Associates. Ms. Gervais also held several management positions at Cadient Group, an interactive marketing agency, from 2002 through June 2008, including the position of Vice President of Operations. Throughout her career, she has held positions in interactive marketing, IT consulting and healthcare finance, and has over 15 years of extensive management experience developing and re-engineering business processes, developing and managing multi-disciplinary teams, creating strategic business partnerships and optimizing financial results. Ms. Gervais holds a B.S. in Finance and Marketing from LaSalle University and a B.S. in Computer Information Systems from Florida Atlantic University.
Adam E. Budish has served as our Senior Vice President of Sales since November 2011. Mr. Budish was previously Senior Vice President of Sales at Medimedia Health, a division of MediMedia USA, Inc., where he led non-personal promotion sales to pharmaceutical companies from April 2010 to November 2011. Prior to joining MediMedia, Mr. Budish was Executive Vice President for dLife, where he led sales of disease management ‘lite’ programs to health plans and institutions from March 2009 to April 2010. Prior to joining dLife, Mr. Budish was Head of Sales/Pre-Sales for Cigna Health Solutions, where he led sales in Disease Management, EAP, Behavioral Health and Lifestyle Management programs to employers from March 2008 to March 2009. Mr. Budish also held various management positions at WebMD Health Services, Inc., from 2001 through March 2008, including the position of Vice President of Strategic Accounts, where he and his team successfully orchestrated sale, implementation and account management for payer accounts. Mr. Budish also led the Reuters Health Information business, where he developed and managed a very profitable electronic wholesale and retail subscription-based business for distribution of news and information to healthcare professionals, consumers and business people. Mr. Budish holds an MBA from the Pennsylvania University Wharton School of Business, a Juris Doctor from George Washington University and a B.A. from University of Virginia.
Available Information
Epocrates, Inc. was originally incorporated in California in August 1998 as nCircle Communications, Inc. In September 1999, we changed our name to ePocrates, Inc. and in May 2006, we reincorporated in Delaware as Epocrates, Inc.
Epocrates files annual reports on Form 10-K, quarterly reports on Form 10-Q, current reports on Form 8-K, proxy and information statements and amendments to reports filed or furnished pursuant to Sections 13(a), 14 and 15(d) of the Securities Exchange Act of 1934, as amended. The public may read and copy these materials at the Securities and Exchange Commission (“SEC”)’s Public Reference Room at 100 F Street, NE, Washington, DC 20549. The public may obtain information on the operation of the Public Reference Room by calling the SEC at 1-800-SEC-0330. The SEC also maintains a website at http://www.sec.gov that contains reports, proxy and information statements and other information regarding Epocrates and other companies that file materials with the SEC electronically. Copies of Epocrates’ annual reports on Form 10-K, Forms 10-Q and Forms 8-K, may be obtained, free of charge, on the company’s website at http://investor.epocrates.com/financials.cfm, by contacting ir@epocrates.com or by calling 650-227-1700, extension 3.
Item 1A. Risk Factors
Investing in our common stock involves a high degree of risk. You should carefully consider the risks described below and the other information in this report on Form 10-K. If any of such risks actually occur, our business, operating results or financial condition could be adversely affected. In those cases, the trading price of our common stock could decline and you may lose all or part of your investment.
9
Table of Contents
Risks Related to Our Business and Industry
If we are unable to retain our existing users and attract new users, especially physician users, our revenue will decline and our business will suffer.
A necessary condition to our long-term success is our ability to retain our existing users and attract new users, especially physician users in specialties of interest to our healthcare clients, to our interactive services and drug and clinical reference tools. If we are unable to do so, our revenue could decline materially.
Most of our users use only our free drug reference product and may stop using the products at any time without loss. Most of the paid subscriptions to our premium drug and clinical reference products have a term of one year and our users have no obligation to renew their subscriptions when such subscriptions expire. Under certain circumstances, our users may cancel their subscriptions prior to expiration.
Factors that may affect the retention rate of our existing users and the rate at which we attract new users for our drug and clinical reference tools include:
· our ability to provide current, relevant and reliable healthcare content, drug and clinical reference tools, formulary hosting and other services that meet the needs of healthcare professionals, including physicians;
· our ability to provide reliable applications and to enhance the functionality, availability, performance and features of our existing and future services to meet the evolving requirements and expectations of our existing and future users;
· deterioration of our reputation and brand for any reason, including user concerns with our privacy practices or our relationships with the healthcare industry; and
· the ability of the developers of mobile operating systems and mobile devices with which our products are compatible to remain competitive in the marketplace and to be adopted into medical practice and practice workflow.
In addition, the availability, price, performance and functionality of competing products and services, including mobile, Web-based and traditional products and services offered by competitors or through online resources and searches may affect our retention rate and the rate at which we attract new users for our drug and clinical reference tools. The availability of download sites such as the Apple App Store SM that offer numerous free or low-priced competing products at one location has also reduced the demand for our paid subscription products. We expect the use of such sites to expand, reducing the number of paying users for our drug and clinical reference tools as a percentage of total users.
In addition to the loss of subscription revenue, our inability to attract or retain users, especially physician users, may cause an even more significant decline in revenue from our interactive services. Revenue from such services is tied directly to our ability to maintain a large user network of healthcare professionals that is attractive to our industry clients.
If we have an insufficient number of users, especially physician users, with desired characteristics for some of our interactive services or those users do not update their mobile devices with sufficient frequency, we may become unable to timely fulfill the demand for some of our interactive services from healthcare companies.
Our ability to meet the demand for delivering clinical messages, formularies and other sponsored content to users’ mobile devices is dependent upon our having a sufficient number of users, especially physician users, with desired characteristics, such as specialty and prescribing habits, updating their mobile devices through our servers with sufficient frequency during the period for delivery of the service. In addition, we have established business rules and structured our technology to limit the number of DocAlert messages and the mix of sponsored and non-sponsored messages delivered during any single update by a user in order to promote the quality of the user’s experience with the clinical messaging service. It is possible that an insufficient number of users will update during a given service period for our interactive services, or that demand for promotional clinical messaging sponsorship will exceed the available supply for all or a subset of our users. In either of these events, our healthcare clients could become dissatisfied with our service. As a result, we may be unable to grow our interactive services revenue beyond the bounds of our business rules and technology structure, and changes to such business rules or technology structure could cause our users’ satisfaction with and response to our interactive services to decrease, which could make such changes ineffective in addressing such inability to grow these revenues.
If the response of our users, especially physician users, to our interactive services decreases, the value of these services will be reduced and our revenue will decline.
In the past, we have obtained a positive response from our users to our interactive services, including offers to participate in market research studies, sponsored clinical messaging and other forms of communication. If, however, our users, particularly physician users, become less responsive to receiving communications or participating in such services, or elect not to use new services that we may offer, the value of these interactive services will likely decline. This could cause our revenue to remain flat or to decline.
10
Table of Contents
If we are unable to continue to provide current, relevant and reliable drug and clinical reference tools and services, we will be unable to retain and attract users to our services and our revenue may decline.
Use of our clinical information and interactive services is based upon our ability to make available current, relevant and reliable drug and clinical reference tools, formulary hosting and other services that meet the needs of our users. Our ability to do so depends on our ability to:
· hire and retain qualified physician and pharmacist editors and authors;
· license accurate and relevant content from third parties;
· contract with health plans and insurers to host formulary information; and
· monitor and respond to changes in user interest in specific topics.
For several of the clinical references included in our Epocrates® Essentials and Epocrates® Essentials Deluxe products, we are particularly dependent on third-party content providers. For example, we license Stedman’s Medical Dictionary 28th Edition and information regarding ICD-9 and CPT® codes from third parties.
We cannot assure you that we will be able to continue to develop or acquire needed content at a reasonable cost, that there will not be errors or omissions in our developed or licensed content, or that our competitors will not obtain exclusive access to or develop content that healthcare professionals consider superior to ours. If any of these risks materialize for any reason, the value of the content and services that we offer would diminish. As a result, we may be unable to attract and retain users.
If we are unable to maintain credibility of our brand, our business and financial condition could suffer.
The credibility of our brand is dependent in large part on the medical community’s continued perception of us as independent from our healthcare industry clients, particularly pharmaceutical companies. If healthcare professionals believe that we are too closely associated with such clients as a result of the revenue we receive from their purchase or sponsorship of our interactive services, the credibility of our brand will diminish. Although we take precautions to remain independent from our healthcare industry clients, including separating the development of our application content from our commercial dealings with such clients and clearly labeling the source and responsibility of sponsored messages, programs and activities, we cannot assure you that the medical community will view our content as sufficiently unbiased. If the credibility of our brand is damaged, it will be difficult, expensive and time-consuming to restore the quality of our brand with healthcare professionals and our business could suffer.
We are dependent upon our senior executive management and other highly specialized personnel and the loss or failure to identify, hire, motivate and retain additional highly specialized personnel could negatively impact our ability to grow our business.
Our success and the execution of our growth strategy depend largely on the continued service of our senior executive management team. We have recently had significant turnover in our senior executive management team. In the last year, we have had four members of the senior executive management team leave the company and be replaced by members of our current management team. Although these executives have joined us with a significant amount of professional experience, our future success could be hindered by their limited exposure to our business. Moreover, the loss of key members of our management team could have a negative impact on our ability to manage and grow our business effectively. We cannot assure you that in such an event we would be able to replace any member of our management team in a timely manner, or at all, on acceptable terms. In addition, our search for a chief executive officer may cause uncertainty regarding the future of our business, impact employee hiring and retention, increase the volatility in our stock price and adversely impact our revenue, operating results and financial condition.
Our future success and the execution of our growth strategy also depend largely on our continuing ability to identify, hire, develop, motivate and retain highly specialized personnel, including software engineers, clinician authors and other technical, sales and marketing personnel. Our competitors, employers in other industries, healthcare providers, academic institutions and governmental entities and organizations also often seek persons with similar qualifications. We cannot assure you that we will be able to hire or retain a sufficient number of qualified personnel to meet our requirements, or that we will be able to do so at salary and benefit costs that are acceptable to us.
11
Table of Contents
If we are unable to adopt new technologies and offer our products and services on new and existing mobile platforms, we will be unable to retain and attract users to our services and our revenue may decline.
To keep pace with technological developments, satisfy increasingly sophisticated client requirements and sustain market acceptance, we will need to continue to deploy new tools and features for our clinical information and interactive services and develop new offerings with enhanced performance and functionality at competitive prices. Accordingly, we will need to properly identify user needs, anticipate technological advances and potentially offer our products and services on new and existing mobile platforms.
The development and application of new technologies involve time, substantial costs and risks. Our inability, for technological or other reasons, to enhance, develop and introduce services in a timely manner, or at all, in response to changing market conditions or client requirements could result in our services losing market acceptance, and therefore adversely affect our operating results. The new technologies may be significant and expensive, and we cannot assure you that we will be able to implement them quickly and efficiently, or at all. Failure to do so could inhibit our ability to attract or retain users, which may cause our revenue to decline.
Our software applications and systems may contain defects or errors which could negatively affect our reputation and impair our ability to retain and attract users to our applications and clients purchasing our services.
While we test our applications and systems for defects and errors prior to release, defects or errors have been identified from time to time by our internal team and by our users and clients after release. Any defects or errors that affect the quality or reliability of our products and services or that cause interruptions to the availability of our services could result in:
· lost or delayed market acceptance and sales of our applications and services;
· loss of users and clients;
· inability to attract new users and clients;
· product liability or breach of contract suits against us;
· diversion of development resources;
· injury to our brand and reputation; and
· increased maintenance and warranty costs.
While our subscription and interactive services agreements typically contain limitations of liability and disclaimers that purport to limit our liability for damages related to defects in our software or content, such limitations and disclaimers may not be enforced by a court or other tribunal or otherwise effectively protect us from related claims. We maintain liability insurance coverage, including coverage for errors and omissions. However, it is possible that claims could exceed the amount of our applicable insurance coverage, if any, or that this coverage may not continue to be available on acceptable terms or in sufficient amounts. Even if these claims do not result in liability to us, investigating and defending against them could be expensive and time consuming and could divert management’s attention away from our operations. In addition, negative publicity caused by these events may delay or hinder market acceptance of our services, including unrelated services.
The healthcare information market is highly competitive and we face significant competition for our drug and clinical reference tools and interactive services.
The markets in which we participate are competitive, dynamic and subject to developments in technology and the healthcare industry. Currently, we compete with other companies for users of the types of drug and clinical reference tools that we offer and for budget dollars from our pharmaceutical, managed care and market research clients.
We compete within a broad industry of healthcare content providers for the attention of healthcare professionals who can choose to use mobile, online or print media to reference clinical information. Companies providing clinical content include Medscape, a division of WebMD, LLC, and UpToDate, Inc, a division of Wolters Kluwer Health. Competition from each of these sources of clinical reference content may lead to a reduction in the retention of our existing users and the rate at which we attract new users for our clinical information.
12
Table of Contents
Our primary competition for the promotional spend available from our clients in the area of interactive services is from companies, including WebMD, that help pharmaceutical companies market their products, programs and services to healthcare professionals.
Our market research business competes with numerous companies which recruit physicians to participate in surveys, often by phone, fax, email or surface mail, as well as the recruitment arms of market research companies that have assembled their own survey panels of healthcare professionals. To the extent competing channels are available to access healthcare professionals, including physicians, the value of our interactive services to our clients is reduced.
Many of our competitors have greater financial, technical, product development, marketing and other resources than we do. They may also be better able to develop and deploy new products and services or to take advantage of new technologies than we are. Our inability, for technological or other reasons, to enhance, develop and introduce services in a timely manner, or at all, in response to changing market conditions, technology or client requirements could result in our services losing market acceptance, and therefore adversely affect our operating results. New technologies may be significant and expensive, and we cannot assure you that we will be able to implement them quickly and efficiently, or at all. We cannot assure you that we will be able to compete successfully against these organizations or any alliances they have formed or may form.
Moreover, the competitive market in which we participate may require us to reduce the prices of our services or the rates we charge our clients. If our competitors offer discounts on certain applications or services, we may be required to reduce prices or offer our products on terms less favorable to us to compete successfully. A reduction in the prices of our services would reduce our margins. Some of our competitors may offer bundled products for promotional purposes or as a long-term pricing strategy. These practices could, over time, limit the prices that we can charge for our services. If we cannot offset price reductions with a corresponding increase in sales volume, our operating results would be adversely affected.
We have determined to explore strategic alternatives for our EHR business, and we will receive a negative return on investment whether or not we are able to sell it.
We have determined to explore strategic alternatives for the EHR business, which could include a joint venture, partnership, a sale of the business, or transitioning out of the business. We have expended a tremendous amount of time, effort and expense in developing this business, and we may not be able to enter into a joint venture or partnership with respect to this business or sell this business.
We are not compatible with all mobile platforms.
Our mobile clinical information is not compatible with all mobile platforms. While we offer online services, the majority of our users and our interactive services are on mobile devices. We depend on the continuing compatibility of our clinical information and services with mobile operating systems and mobile devices and with evolving industry standards and protocols to run our mobile clinical information.
In addition, we are dependent on the ability of the developers of mobile platforms with which our drug and clinical reference tools are compatible to remain competitive in the medical community and the general marketplace. To remain competitive, developers of such mobile platforms may need to timely enhance their products, develop new operating systems or devices or take other actions which are outside of our control. If a mobile platform that is incompatible with our products achieves widespread use and acceptance in the medical community, or if Internet resources or other non-mobile device resources become more attractive than what is offered for mobile platforms, we may be unable to retain or attract users to our products. In particular, our mobile products are not compatible with Symbian-based devices.
We may not sustain our revenue growth, and we may not be able to manage future growth effectively.
We have experienced significant revenue growth in a short period of time. Our revenue increased 21% to $113.3 million for the year ended December 31, 2011 from $93.7 million for the year ended December 31, 2009. You should not rely on our revenue growth, gross margins or operating results for any prior quarter or annual period as an indication of our future operating performance. If we are unable to maintain adequate revenue growth in absolute dollars, we may not sustain our recent profitability and our share price could decline.
13
Table of Contents
Our future operating results depend to a large extent on our ability to successfully manage our anticipated expansion and growth. To manage our growth successfully, among other things, we must effectively:
· | add additional sales and marketing personnel in various locations; |
| |
· | control expenses; |
| |
· | maintain and enhance our information technology support for enterprise resource planning, accounting and design engineering by adapting and expanding our systems and tool capabilities; |
| |
· | recruit, hire, train and manage additional qualified people; and |
| |
· | manage operations in multiple locations and time zones. |
We are increasing our investment in research and development, sales and marketing, general and administrative and other functions to grow our business. We are likely to recognize the costs associated with these increased investments earlier than some of the anticipated benefits and the return on these investments, if any, may be lower, may develop more slowly than we expect, or may not materialize.
If we are unable to manage our growth effectively, we may not be able to take advantage of market opportunities or develop new products or enhancements to existing products and we may fail to satisfy client requirements, maintain product quality, execute our business plan, or respond to competitive pressures, which could result in lower revenue and profitability and a decline in our share price.
Our operating results have fluctuated and are likely to continue to fluctuate, which might make our quarterly results difficult to predict and could cause our stock price to decline or exhibit volatility.
Our operating results have fluctuated, and are likely to continue to fluctuate as a result of a variety of factors, many of which are outside of our control. As a result, comparing our operating results on a period-to-period basis may not be meaningful and you should not rely on our past results as an indication of future performance. Each of the following factors, among others, could cause our operating results to fluctuate from quarter to quarter:
· | demand for and market acceptance of our services; |
| |
· | factors relating to pharmaceutical company budget cycles and other factors that may affect the timing of promotional campaigns for specific products or demand for our services by our clients; |
| |
· | changes in pharmaceutical company demand as a result of delays or changes in product approvals, changes in marketing strategies, modifications of client budgets and similar matters; |
| |
· | the length of sales cycles and fulfillment periods of our services to pharmaceutical companies and other segments of the healthcare industry; |
| |
· | expansion of marketing and support operations; |
| |
· | the timing of new product introductions and product enhancements by us or our competitors; and |
| |
· | the cost of being a public company. |
The majority of our clinical information subscriptions have terms of one year and our contracts with our other healthcare industry clients for our interactive services typically range from one to three years. We cannot assure you that our current users and other clients will continue to participate in our existing programs beyond the terms of their existing contracts or that they will enter into any additional contracts for new programs that we offer.
In addition, the time between the date of the signing of the contract with a client for a program, the actual fulfillment of the services under such contract and the revenue recognition associated with such revenues may be lengthy, especially for larger contracts with multiple deliverables, and may be subject to delays over which we have little or no control, including those that result from the client’s need for internal approvals. Other factors that could affect the timing of our interactive services revenue include:
14
Table of Contents
· | variations in the marketing budgets allocated for the types of services we offer; |
| |
· | the timing of federal Food and Drug Administration, or “FDA,” approval for new pharmaceutical products or for new approved uses for existing products; |
| |
· | regulatory concerns related to the marketing of pharmaceutical products; and |
| |
· | factors that may affect the timing of promotional campaigns for specific products. |
Because we recognize revenue from our drug and clinical reference tool subscriptions and certain of our interactive services over the term or at the end of the service period, a significant downturn in our business may not be reflected immediately in our operating results, which may make it more difficult to evaluate our prospects.
We recognize revenue from subscription agreements monthly over the terms of these agreements, which are typically one year. In most cases, we recognize revenue from our interactive services over the terms of these agreements or upon delivery of each service element. As a result, a significant portion of the revenue we report in each quarter is generated from subscription and service agreements entered into during prior periods. Consequently, a decline in new or renewed subscriptions or service agreements in any one quarter may not materially affect our financial performance in that quarter but will negatively affect our revenue in future quarters. In addition, we may be unable to adjust our costs, many of which are fixed, in response to reduced revenue. Accordingly, the effect of significant declines in sales and market acceptance of our services may not be reflected in our short-term results of operations, which would make our reported results less indicative of our future prospects.
Developments in the healthcare industry could negatively affect our business.
Most of our revenue is derived from the healthcare industry and could be reduced by changes affecting healthcare spending. General reductions in expenditures by healthcare companies could result from, among other things:
· | government regulation or private initiatives that affect the manner in which healthcare providers interact with patients, pharmaceutical companies, payors or other healthcare industry participants, including changes in pricing or means of delivery of healthcare products and services; |
| |
· | consolidation of healthcare companies; |
| |
· | reductions in governmental funding for healthcare; and |
| |
· | adverse changes in business or economic conditions affecting healthcare payors or providers, the pharmaceutical industry or other healthcare companies. |
We are particularly dependent upon pharmaceutical companies for our interactive services revenue. Our business will be harmed if business or economic conditions or government regulations result in the reduction of purchases by such clients, the non-renewal of our agreements with such clients, or the need to materially revise our offerings.
Even if general expenditures by healthcare companies remain the same or increase, developments in the healthcare industry may result in reduced spending in some or all of the specific segments of the market we serve or are planning to serve. For example, purchase of our services could be affected by:
· | a decrease in the number of, or the market exclusivity available to, new drugs coming to market; |
| |
· | decreases in marketing expenditures by pharmaceutical companies as a result of governmental regulation or private initiatives that discourage or prohibit advertising or sponsorship activities by pharmaceutical companies; |
| |
· | state or federal legislation requiring the disclosure of, or otherwise regulating, honorarium payments to physicians for participation in market research activities; and |
| |
· | changes in the design of health insurance plans. |
In addition, our clients’ expectations regarding pending or potential industry developments may also affect their budgeting processes and spending plans with respect to services of the types we provide.
15
Table of Contents
The healthcare industry has changed significantly in recent years and we expect that significant changes will continue to occur. However, the timing and impact of developments in the healthcare industry are difficult to predict. We cannot assure you that the markets for our services will continue to exist at current levels or that we will have adequate technical, financial and marketing resources to react to changes in those markets.
We may be subject to claims brought against us as a result of the services we provide.
Healthcare professionals access information, including information regarding particular medical conditions and the use of particular medications, through our drug and clinical reference tools, interactive services and our EHR product. If our content, or content we obtain from third parties, contains inaccuracies, or we introduce inaccuracies in the process of implementing third party content, it is possible that patients, physicians, consumers, the providers of the third party content or others may sue us if they are harmed as a result of such inaccuracies. We have editorial procedures in place to provide quality control of the information that we publish or provide. However, we cannot assure you that our editorial and other quality control procedures will be sufficient to ensure that there are no errors or omissions in particular content and we have had content errors in the past. Although our agreements for the performance of our services contain terms and conditions, including disclaimers of liability, that are intended to reduce or eliminate our liability, the law governing the validity and enforceability of online agreements and other electronic transactions is evolving. We could be subject to claims by users or third parties that our online agreements are unenforceable. A finding by a court that these agreements are invalid and that we are subject to liability could harm our business and financial condition and require costly changes to our business.
In addition, third parties may assert claims against us alleging infringement of copyrights, trademark rights, or other proprietary rights, or alleging unfair competition or violations of privacy rights. We could also be subject to claims for indemnification resulting from infringement claims made against our clients and third-party service providers for third-party products and content that are incorporated into our clinical information if they are found to infringe the intellectual property rights of others, which could increase our defense costs and potential damages. Any of these events could be expensive and time consuming to resolve or defend, may require us to change our business practices and could have a negative effect on our business, operating results and financial condition.
We could be required to spend significant amounts of time and money to defend ourselves against any such claims. Although we may be indemnified against such costs, the indemnifying party may be unable to fulfill its obligations. If any of these claims were to prevail, we could be forced to pay damages, comply with injunctions, or stop distributing our products and services while we re-engineer them or seek licenses to necessary technology, which might not be available on reasonable terms, or at all. Even if potential claims do not result in liability to us, investigating and defending against these claims could be expensive and time consuming and could divert management’s attention away from our operations. We maintain general liability insurance coverage, including coverage for errors and omissions, however this coverage may not be sufficient to cover one or more large claims against us or otherwise continue to be available on acceptable terms. Further, the insurer could disclaim coverage as to any future claim. In addition, our business is based on establishing the reputation of our services as trustworthy and reliable sources of clinical information. Allegations of impropriety or inaccuracy, even if unfounded, could therefore harm our reputation and business.
Healthcare and consumer protection regulations and legislation create risks and challenges with respect to our compliance efforts and our business strategies.
The healthcare industry is highly regulated and is subject to changing political, legislative, regulatory and other influences. Existing and new laws and regulations affecting the healthcare industry could create unexpected liabilities for us, cause us to incur additional costs and restrict our operations. Many healthcare laws are complex and their application to specific products and services may not be clear, particularly as we develop and release new and more sophisticated products and services. In particular, many existing healthcare laws and regulations, when enacted, did not contemplate the clinical information and interactive services that we provide. However, these laws and regulations may nonetheless be applied to our services. We are also subject to various federal and state consumer protection laws. Our failure to accurately anticipate the application of these laws and regulations, or other failure to comply with them, could create liability for us, result in adverse publicity and negatively affect our businesses. Some of the risks we face from healthcare and consumer protection regulations are as follows:
Regulation of drug and medical device advertising and promotion. We provide services involving promotion of prescription and over-the-counter drugs and medical devices. Any increase in regulation of these areas by the FDA, the Federal Trade Commission, or FTC, or other governmental bodies at the federal, state or local level, could make it more difficult for us to contract for certain of our interactive services. Physician groups and others have criticized the FDA’s current policies and have called for restrictions on advertising of prescription drugs and for increased FDA enforcement. In response, the FDA has
16
Table of Contents
conducted hearings and sought public comment regarding its regulation of information concerning drugs on the Internet and the relationships between pharmaceutical companies and those disseminating information on drugs. We cannot predict what actions the FDA or industry participants may take in response to these criticisms. It is also possible that new laws would be enacted that impose restrictions on such marketing and advertising. Our interactive services revenues could be materially reduced by additional restrictions on the marketing or advertising of prescription drugs and medical devices, whether imposed by law or regulation or by policies adopted by industry members.
If the FDA, the FTC or another governmental body finds that any information available on our website or distributed by us violates FDA, FTC or other laws or regulations, they may take regulatory or judicial action against us or the advertiser or sponsor of that information. State attorneys general may also take similar action based on their state’s consumer protection statutes or other new or existing laws.
Anti-kickback laws. Healthcare anti-kickback laws prohibit any person or entity from offering, paying, soliciting or receiving anything of value, directly or indirectly, for the referral of patients covered by federal healthcare programs or the leasing, purchasing, ordering or arranging for or recommending the lease, purchase or order of any item, good, facility or service covered by these programs. Many states also have similar anti-kickback laws that are not necessarily limited to items or services for which payment is made by a federal healthcare program. These laws may restrict how we and some of our clients market products to healthcare providers. The laws in this area are broadly written and it is often difficult to determine precisely how the laws will be applied in specific circumstances. Penalties for violating the federal anti-kickback laws include imprisonment, fines and exclusion from participating, directly or indirectly, in federal healthcare programs. Any determination by a state or federal regulatory agency that any of our practices violate any of these laws could subject us to civil or criminal penalties and require us to change or terminate some portions of our operations. Even an unsuccessful challenge by regulatory authorities of our practices could result in negative publicity and it could be costly for us to respond.
Legislation relating to payments to physicians. Recent legislation enacted or pending in several states and enacted at the federal level as part of the Patient Protection and Affordable Care Act and the Healthcare and Education Reconciliation Act of 2010 mandates public disclosure of, or otherwise regulates or limits the providing of, certain gifts and payments by pharmaceutical companies to physicians. These state laws may be interpreted to cover honorarium payments made to physicians for participation in market research activities sponsored by pharmaceutical companies. Because we currently provide market research services involving participants from our user network, the increased adoption and enforcement of these laws and the application of any public disclosure requirements or other limitations may have a negative impact on the ability of pharmaceutical companies to sponsor these activities or the willingness of physicians to participate in the market research. To date, we have not experienced a significant reduction in our market research services business as a result of these laws in the few jurisdictions in which they have been enacted and become effective. However, we cannot predict how pharmaceutical companies or physicians will respond if such legislation becomes more widespread or becomes effective at the federal level. A significant decline in the sponsorship of our market research services by pharmaceutical companies or the agencies that represent such companies, or a significant decline in physicians’ willingness to participate in such studies could negatively impact our operating results.
Medical professional regulation. The practice of most healthcare professions requires licensing under applicable state law. In addition, the laws in some states prohibit business entities from practicing medicine. We do not believe that we engage in the practice of medicine and we have attempted to structure our services, strategic relationships and other operations to avoid violating these state licensing and professional practice laws. We employ and contract with physicians who provide only medical information to users, some of whom may be consumers, and we do not intend to provide medical care or advice. Any determination that we are a healthcare provider and acted improperly as a healthcare provider may result in liability to us.
Anti-spam regulation. We may also be required to comply with current or future anti-spam legislation by limiting or modifying some of our interactive services, such as our clinical messaging, which may result in a reduction in our revenue. One such law, the Controlling the Assault of Non-Solicited Pornography and Marketing Act of 2003, or “CAN-SPAM,” became effective in the United States on January 1, 2004. CAN-SPAM imposes complex and often burdensome requirements in connection with the sending of commercial e-mail. CAN-SPAM or similar laws may impose burdens on our user communication practices and on certain of our services, which in turn could harm our ability to attract new clients and increase revenues.
Privacy and other consumer protection regulation. The Children’s Online Privacy Protection Act, or “COPPA,” applies to operators of commercial websites and online services directed to U.S. children under the age of 13 that collect personal information from children and operators of general audience sites with actual knowledge that they are collecting information from U.S. children under the age of 13. Our sites are not directed at children and we employ a kick-out procedure whereby anyone identifying themselves as being under the age of 13 during the registration process is not allowed to register to obtain our clinical information or participate in our services. COPPA, however, is a relatively new law, can be applied broadly and is subject to interpretation by courts and other governmental authorities. The failure to accurately anticipate the application or interpretation of this law could create liability for us, result in adverse publicity and negatively affect our business.
17
Table of Contents
The FTC and many state attorneys general are applying federal and state consumer protection laws to require that the online collection, use and dissemination of data, and the presentation of website or other electronic content, comply with certain standards for notice, choice, security and access. Courts may also adopt these developing standards. A number of states, including California, have enacted laws or are considering the enactment of laws governing the release of credit card or other personal information received from consumers. In many cases, the specific limitations imposed by these standards are subject to interpretation by courts and other governmental authorities. A determination by a state or federal agency or court that any of our practices do not meet these standards could result in liability and adversely affect our business. New interpretations of these standards could also require us to incur additional costs and restrict our business operations.
In addition, several foreign governments have regulations dealing with the collection and use of personal information obtained from their citizens. Those governments may attempt to apply such laws extraterritorially or through treaties or other arrangements with U.S. governmental entities. We might unintentionally violate such laws, such laws may be modified and new laws may be enacted in the future which may increase the chance that we violate them unintentionally. Any such developments, or developments stemming from enactment or modification of other laws, or the failure to accurately anticipate the application or interpretation of these laws could create liability to us, result in adverse publicity and negatively affect our business.
We rely on Internet service providers, co-location data center providers, other third parties and our own systems for key aspects of the process of providing and updating content to our users and performing services for our clients, and any failure or interruption in the services provided by these third parties or our own systems could harm our business.
Our users expect to be able to update our applications and access our services 24 hours per day, seven days per week, without interruption. However, we have experienced and expect that we will in the future experience interruptions and delays in services and availability from time to time. We rely on internal systems, as well as third party vendors, including a co-location service provider and Internet service providers, to provide our online services.
We have computing and communications hardware operations located at our facilities in San Mateo, California, and in a co-location service administered by AT&T, Inc. in Redwood City, California. In the event of a catastrophic event at one of these sites, we may experience an extended period of system unavailability which could negatively impact our relationship with users and adversely affect our brand and our business. In particular, both of our co-location facilities are located in the same seismically active location in the San Francisco Bay Area.
Any disruption in the network access or co-location services provided by these third party providers or any failure of or by these third party providers or our own systems to handle current or higher volume of use could significantly harm our business. We exercise little control over these third party vendors, which increases our vulnerability to problems with services they provide.
Any errors, failures, interruptions or delays experienced in connection with these third party technologies and interactive services or our own systems could negatively impact our relationships with users and clients, adversely affect our brand and our business and potentially expose us to liability to third parties. Although we maintain insurance for our business, the coverage under our policies generally only covers losses due to our negligence, and therefore may not be adequate to compensate us for all losses that may occur. In addition, we cannot provide assurance that we will continue to be able to obtain adequate insurance coverage at an acceptable cost.
If the systems we use to provide our services experience security breaches or are otherwise perceived to be insecure, our business could suffer.
We retain and transmit confidential information in the processing centers and other facilities we use to provide online services. It is critical that such facilities and infrastructure remain secure and be perceived by the marketplace as secure. A security breach could damage our reputation or result in liability. We may be required to expend significant capital and other resources to protect against security breaches and hackers or to alleviate problems caused by breaches. Despite the implementation of security measures, this infrastructure or other systems that we interface with, including the Internet and related systems, may be vulnerable to physical break-ins, hackers, improper employee or contractor access, computer viruses, programming errors, attacks by third parties or similar disruptive problems. Any compromise of our security, whether as a result of our own systems or the systems that they interface with, could reduce demand for our services and could subject us to legal claims from our clients and users, including claims for breach of contract or breach of warranty, or regulatory enforcement actions against us by the government.
18
Table of Contents
We may not be successful in protecting our intellectual property and proprietary rights.
Our success depends to a significant degree on our proprietary technology and ability to establish, maintain and enforce our intellectual property rights. We rely on a combination of copyright, trademark, trade secret, patent and other intellectual property laws and confidentiality procedures to protect our proprietary rights. Despite these measures, any of our intellectual property rights could, however, be challenged, invalidated, circumvented or misappropriated, or such intellectual property rights may not be sufficient to permit us to take advantage of current market trends or otherwise to provide competitive advantages, which could result in redesign efforts, discontinuance of certain product offerings or other competitive harm. Further, the laws of certain countries do not protect proprietary rights to the same extent as the laws of the United States. Therefore, in certain jurisdictions, we may be unable to protect our proprietary technology adequately against unauthorized third party copying or use, which could adversely affect our competitive position.
Our pending patent and trademark registration applications may not be allowed, and our competitors or other third parties may challenge the validity or scope of our patents or trademark registrations. If the patents or trademark registrations we seek do not issue, or if other problems arise with our intellectual property, our competitiveness could be significantly impaired and our business, operations and prospects may suffer. There can also be no assurance that any of our issued patents or registered trademarks, or any patents and trademarks that may issue in the future, will adequately protect our intellectual property, or that such patents and trademarks will not be challenged by our competitors or other third parties or found by a judicial authority to be invalid or unenforceable.
We enter into confidentiality and invention assignment agreements with our employees and consultants and with the parties with whom we have strategic relationships and business alliances, and our agreements with subscribers limit their use of the software and content provided to them. These agreements may be breached and we may not have adequate remedies for any such breach. Further, no assurance can be given that these agreements will be effective in preventing the unauthorized access to, or use of, our clinical and other proprietary information or the reverse engineering of our technology. In any event, these agreements do not prevent our competitors from independently developing technology or authoring clinical information that is substantially equivalent or superior to our technology or the information we distribute.
Litigation may be necessary in the future to enforce our intellectual property rights and to protect our trade secrets. Litigation could result in substantial costs and diversion of management resources and can put our patents at risk of being invalidated or interpreted narrowly. The occurrence of any of these events may seriously harm our business.
We may be subject to claims by third parties that we are infringing their intellectual property, we may be prevented from selling certain services and we may incur significant expenses in resolving these claims.
Much of our business relies on technology and content developed or licensed by third parties. We also expect to seek to license technology and content from third parties for future products and services. We may not be able to obtain or continue to obtain licenses, content and technologies from these third parties on commercially reasonable terms or at all. Our inability to retain our current third party licenses or obtain third party licenses required to develop new products or product enhancements could require that we change our product and design plans, any of which could harm or delay our ability to sell our products and adversely affect our business.
We may receive claims of intellectual property infringement from third parties or otherwise become aware of relevant patents or other intellectual property rights of third parties that may lead to disputes and litigation. Any claims made against us regarding patents or other intellectual property rights could be expensive and time consuming to resolve or defend and could have a negative effect on our business. We expect that software application developers will increasingly be subject to infringement claims as the number of products and competitors grows and the functionality of products in different industry segments overlaps. Our competitors or other third parties may challenge the validity or scope of our intellectual property rights. Third parties may also claim that the technology that we acquire or license from other third parties infringes their intellectual property rights and we may not be indemnified for such claims.
We may also be required to indemnify our clients and third-party service providers for third-party products and content that are incorporated into our clinical information if they are found to infringe the intellectual property rights of others. Although many of our third-party service providers are obligated to indemnify us if their products infringe the rights of others, such indemnification may not be effective or adequate to protect us or the indemnifying party may be unable to uphold its contractual obligations.
19
Table of Contents
Litigation could be costly for us to defend, distract management’s attention and resources, have a negative effect on our operating results and financial condition or require us to devote additional research and development resources to change our products or to obtain licenses to any intellectual property we may be found to infringe. Claims of intellectual property infringement might require us to redesign affected products, delay affected product offerings, enter into costly settlement or license agreements or pay costly damage awards or face a temporary or permanent injunction prohibiting us from marketing, selling or distributing the affected products. If we cannot or do not license the infringed technology on reasonable terms or at all, or substitute similar technology from another source, our revenue and earnings could be adversely impacted. There can be no assurance that any such litigation can be avoided or successfully concluded.
Our use of “open source” software could adversely affect our ability to sell our products and subject us to possible litigation.
A significant portion of the products or technologies licensed, developed and/or distributed by us incorporate so-called “open source” software and we may incorporate open source software into other products in the future. Such open source software is generally licensed by its authors or other third parties under open source licenses. Some open source licenses contain requirements that we disclose source code for modifications we make to the open source software and that we license such modifications to third parties at no cost. In some circumstances, distribution of our software in connection with open source software could require that we disclose and license some or all of our proprietary code in that software as well as distribute our products that use particular open source software at no cost to the user. We monitor our use of open source software in an effort to avoid uses in a manner that would require us to disclose or grant licenses under our proprietary source code, however, there can be no assurance that such efforts will be successful. Open source license terms are often ambiguous and such use could inadvertently occur. There is little legal precedent governing the interpretation of many of the terms of certain of these licenses, and the potential impact of these terms on our business may result in unanticipated obligations regarding our products and technologies. Companies that incorporate open source software into their products have, in the past, faced claims seeking enforcement of open source license provisions and claims asserting ownership of open source software incorporated into their product. If an author or other third party that distributes such open source software were to allege that we had not complied with the conditions of an open source license, we could incur significant legal costs defending ourselves against such allegations. In the event such claims were successful, we could be subject to significant damages or be enjoined from the distribution of our products. In addition, if we combine our proprietary software with open source software in certain ways, under some open source licenses we could be required to release the source code of our proprietary software, which could substantially help our competitors develop products that are similar to or better than ours and otherwise adversely affect our business.
We face potential liability related to the privacy and security of personal information we collect from healthcare professionals through our products and interactive services.
Online user privacy is a major concern in both the United States and abroad. The European Union, or “EU,” adopted the Data Protection Directive, or “DPD,” imposing strict regulations and establishing a series of requirements regarding the collection and use of personally identifiable information online. The DPD provides for specific regulations requiring all non-EU countries doing business with EU member states to provide adequate data privacy protection when receiving personal data from any of the EU member states. Similarly, Canada’s Personal Information and Protection of Electronic Documents Act provides Canadian residents with privacy protections in regard to transactions with businesses and organizations in the private sector and sets out ground rules for how private sector organizations may collect, use or disclose personal information in the course of commercial activities. We have privacy policies posted with our services that we believe comply with applicable laws requiring notice to users about our information collection, use and disclosure practices. However, whether and how existing local and international privacy and consumer protection laws in various jurisdictions apply to the Internet and other online technologies is still uncertain and may take years to resolve. United States and international privacy laws and regulations, if drafted or interpreted broadly, could be deemed to apply to the technology we use, and could restrict our information collection methods or decrease the amount and utility of the information that we would be permitted to collect. Any legislation or regulation in the area of privacy of personal information could affect the way we operate our online services and could harm our business. The costs of compliance with, and the other burdens imposed by, these and other laws or regulatory actions may prevent us from selling our products or increase the costs associated with selling our products, and may affect our ability to invest in or jointly develop products in the United States and in foreign jurisdictions. Further, we cannot assure you that the privacy policies and other statements on our applications or our practices will be found sufficient to protect us from liability or adverse publicity relating to the privacy and security of personal information. In the conduct of our market research activities outside the United States, we rely upon a third party to identify and recruit respondents for the market research and to comply with the applicable privacy laws in each jurisdiction in which it operates. If this third party failed to comply with such laws, it could affect its ability to continue to support our business or negatively affect our reputation.
The Privacy Standards under HIPAA establish a set of basic national privacy standards for the protection of individually identifiable health information by health plans, healthcare clearinghouses, healthcare providers and their business associates. With our entry into the EHR market, we have become subject to HIPAA and other similar state and federal laws governing the collection, dissemination, use, access to and confidentiality of patient-identifiable information, and will remain so for so long as we remain in the EHR market.
20
Table of Contents
Some users of our products and services are located outside of the United States, we recruit for market research internationally and we may in the future establish international operations and, as a result, face diverse risks related to engaging in international business.
Although the substantial majority of our users are located in the United States, we currently have users in numerous other countries. We are, or may become, subject to the risks of conducting business internationally, including:
· | unexpected changes in regulatory requirements, taxes, trade laws, tariffs, export quotas, custom duties or other trade restrictions; |
| |
· | exposure to a broader, more diverse set of regulations; |
| |
· | more stringent regulations relating to data privacy and the unauthorized use of, or access to, commercial and personal information, particularly in Europe and Canada; |
| |
· | changes in a specific country’s or region’s political or economic conditions; |
| |
· | unfavorable currency exchange rates; |
| |
· | exposure to competitors who are more familiar with local markets; |
| |
· | limited or unfavorable intellectual property protection; and |
| |
· | restrictions on repatriation of earnings. |
In addition, in the future, we may expand geographically through product development and strategic alliances. However, our products and services may not be accepted in international markets and any potential international operations involve a variety of risks. We have limited experience in marketing, selling and supporting our services abroad. In addition, while Symbian is the most widely used mobile operating system in Europe, our clinical information and interactive services are not compatible with Symbian based devices. If we invest substantial time and resources to expand our international operations and are unable to do so successfully and in a timely manner, our business and operating results will suffer.
If we acquire or invest in other companies, assets or technologies and we are not able to effectively integrate them with our business, or we do not realize the anticipated financial and strategic goals for any of these transactions, our financial performance may be impaired.
If appropriate opportunities present themselves, we may consider acquiring or making investments in companies, assets or technologies that we believe to be strategic, such as our recent acquisition of Modality, Inc. We do not have significant experience in acquisitions and investments in other companies, and our acquisition of Modality exposes us, and if we acquire or invest in additional companies, assets or technologies, we will be further exposed, to a number of risks, including:
· | we may find that the acquired company, asset or technology does not further our business strategy, that we overpaid for the company, asset or technology or that the economic conditions underlying our acquisition decision have changed; |
| |
· | we may have difficulty integrating the assets, technologies, operations or personnel of an acquired company, or retaining the key personnel of the acquired company; |
| |
· | our ongoing business and management’s attention may be disrupted or diverted by transition or integration issues and the complexity of managing geographically or culturally diverse enterprises; |
| |
· | we may encounter difficulty entering and competing in new product or geographic markets, and we may face increased competition, including price competition or intellectual property litigation; and |
| |
· | we may experience significant problems or liabilities associated with product quality, technology and legal contingencies relating to the acquired business or technology, such as intellectual property or employment matters. |
21
Table of Contents
In addition, from time to time we may enter into negotiations for acquisitions or investments that are not ultimately consummated. These negotiations could result in significant diversion of management time, as well as substantial out-of-pocket costs. If we were to proceed with one or more significant acquisitions or investments in which the consideration included cash, we could be required to use a substantial portion of our available cash, including the proceeds of this offering. To the extent we issue shares of capital stock or other rights to purchase capital stock, including options and warrants, existing stockholders might be diluted and earnings per share amounts might decrease. In addition, acquisitions and investments may result in the incurrence of debt, large one-time write-offs, such as of acquired in-process research and development costs, and restructuring charges.
We intend to expand our operations and increase our expenditures in an effort to grow our business. If we are not able to manage this growth and expansion, or if our business does not grow as we expect, our operating results may suffer.
We significantly expanded our operations in 2010 and 2011. From December 31, 2009 to December 31, 2011, we increased the number of our employees by over 30%, from approximately 270 to approximately 360. We anticipate that further expansion of our infrastructure and headcount will be required to achieve planned expansion of our product offerings, projected increases in our user network and anticipated growth in the number of product deployments. Our rapid growth has placed, and will continue to place, a significant strain on our administrative and operational infrastructure. Our ability to manage our operations and growth will require us to continue to refine our operational, financial and management controls, human resource policies and reporting systems and procedures. Further, we intend to grow our business by developing new product and service offerings and pursuing new clients. If we fail to timely or efficiently expand operational and financial systems in connection with such growth or if we fail to implement or maintain effective internal controls and procedures, resulting operating inefficiencies could increase costs and expenses more than we planned and might cause us to lose the ability to take advantage of market opportunities, enhance existing products, develop new products, satisfy client requirements, respond to competitive pressures or otherwise execute our business plan. Additionally, if we increase our operating expenses in anticipation of the growth of our business and such growth does not meet our expectations, our financial results likely would be negatively impacted.
Business interruptions due to natural disasters and other events could adversely affect our business.
Our operations can be subject to natural disasters and other events beyond our control, such as earthquakes, fires, power failures, telecommunication losses, terrorist attacks and acts of war. For example, the majority of our operations are based in Northern California near major earthquake faults that are considered seismically active. Such events, whether natural or manmade, could cause severe destruction or interruption to our operations, and as a result, our business could suffer serious harm.
Although we carry business interruption insurance, it only covers some, but not all, of these potential events, and even for those events that are covered, it may not be sufficient to compensate us fully for losses or damages that may occur as a result of such events, including, for example, loss of market share and diminution of our brand, reputation and client loyalty.
Risks related to ownership of our common stock
As our common stock has only recently become publicly traded, we expect that the price of our common stock may fluctuate substantially.
Our common stock has only been publicly traded since our initial public offering on February 2, 2011. The trading price of our common stock has fluctuated significantly since then. For example, between February 2, 2011 and December 31, 2011, the closing trading price of our common stock was very volatile, ranging between $7.74 and $26.51 per share. The market price for our common stock will be affected by a number of factors, including:
· quarterly variations in our operating results, or the operating results of our competitors;
· the timing of revenue recognition;
· the volume and timing of orders from our clients and users;
· the announcement of new products or service enhancements by us or our competitors;
· announcements related to litigation;
· changes in earnings estimates, investors’ perceptions, recommendations by securities analysts or our failure to achieve analysts’ earnings estimates;
22
Table of Contents
· the depth and liquidity of the market for our common stock;
· changing legal or regulatory requirements;
· developments in our industry or the medical or pharmaceutical industries generally; and
· general market conditions and other factors unrelated to our operating performance or the operating performance of our competitors.
In addition, the stock market has experienced substantial price and volume volatility that is often seemingly unrelated to the operating performance of particular companies. These broad market fluctuations may cause the trading price of our common stock to decline. In the past, securities class action litigation has often been brought against a company after a period of volatility in the market price of its common stock. We may become involved in this type of litigation in the future. Any securities litigation claims brought against us could result in substantial expense and the diversion of our management’s attention from our business.
Securities analysts may not initiate coverage of our common stock or may issue negative reports, and this may have a negative impact on the market price of our common stock.
Securities analysts may elect not to provide research coverage of our common stock. If securities analysts do not cover our common stock, the lack of research coverage may adversely affect the market price of our common stock. In addition, the trading market for our common stock may be affected in part by the research and reports that industry or financial analysts do publish about us or our business. If one or more of the analysts who elect to cover us downgrades our stock, our stock price may decline. If one or more of these analysts ceases coverage of us, we could lose visibility in the market, which in turn could cause our stock price to decline. It may be difficult for companies such as ours, with smaller market capitalizations, to attract independent financial analysts that will cover our common stock. This could have a negative effect on the market price of our stock.
Our directors, officers and principal stockholders have significant voting power and may take actions that may not be in the best interests of our other stockholders.
As of January 31, 2012, our officers, directors and principal stockholders each holding more than 5% of our common stock collectively controlled approximately 68.0% of our outstanding common stock. As a result, these stockholders, if they act together, will be able to control our management and affairs and most matters requiring stockholder approval, including the election of directors and approval of significant corporate transactions. This concentration of ownership may have the effect of delaying or preventing a change of control and might adversely affect the market price of our common stock. This concentration of ownership may not be in the best interests of our other stockholders.
Anti-takeover provisions in our amended and restated certificate of incorporation and amended and restated bylaws, and Delaware law, contain provisions that could discourage a takeover.
In addition to the effect that the concentration of ownership by our officers, directors and significant stockholders may have, our amended and restated certificate of incorporation and our amended and restated bylaws which became effective upon completion of our initial public offering on February 7, 2011 contain provisions that may enable our management to resist a change of control. These provisions may discourage, delay or prevent a change in our ownership or a change in our management. In addition, these provisions could limit the price that investors would be willing to pay in the future for shares of our common stock. Such provisions, to be set forth in our amended and restated certificate of incorporation or amended and restated bylaws that became effective upon the completion of our initial public offering on February 7, 2011, include:
· our Board of Directors will be authorized, without prior stockholder approval, to create and issue preferred stock, commonly referred to as “blank check” preferred stock, with rights senior to those of common stock;
· advance notice will be required of stockholders to nominate candidates to serve on our Board of Directors or to propose matters that can be acted upon at stockholder meetings;
· stockholder action by written consent will be prohibited;
23
Table of Contents
· special meetings of the stockholders will be permitted to be called only by a majority of our Board of Directors, the chairman of our Board of Directors or our Chief Executive Officer;
· stockholders will not be permitted to cumulate their votes for the election of directors;
· newly created directorships resulting from an increase in the authorized number of directors or vacancies on our Board of Directors will be filled only by majority vote of the remaining directors, even though less than a quorum is then in office;
· our Board of Directors will be expressly authorized to modify, alter or repeal our amended and restated bylaws; and
· stockholders will be permitted to amend our amended and restated bylaws only upon receiving at least two-thirds of the votes entitled to be cast by holders of all outstanding shares then entitled to vote generally in the election of directors, voting together as a single class.
We are also subject to the provisions of Section 203 of the Delaware General Corporation Law, which may prohibit certain business combinations with stockholders owning 15% or more of our outstanding voting stock. These and other provisions in our amended and restated certificate of incorporation, our amended and restated bylaws and Delaware law could make it more difficult for stockholders or potential acquirors to obtain control of our Board of Directors or initiate actions that are opposed by our then-current Board of Directors, including delaying or impeding a merger, tender offer or proxy contest involving us. Any delay or prevention of a change of control transaction or changes in our Board of Directors could cause the market price of our common stock to decline.
Item 1B. Unresolved Staff Comments
None.
Item 2. Properties
We have offices located in San Mateo, California, Ewing, New Jersey and Durham, North Carolina. Our San Mateo office consists of approximately 59,000 square feet of office space pursuant to a lease that is set to expire on December 31, 2014. Our Ewing, New Jersey office consists of approximately 20,000 square feet of office space pursuant to a lease that is set to expire on March 31, 2014. Our Durham, North Carolina office consists of approximately 8,000 square feet of office space pursuant to a lease that is set to expire on December 31, 2014.
Item 3. Legal Proceedings
On February 25, 2011, we received a letter from the SEC informing us that the SEC was conducting an investigation and attaching a subpoena for certain information and documents related to our expert network services, including our relationship with Hudson Street Services, a Goldman, Sachs & Co. business. On January 5, 2012, we received a letter from the SEC notifying us that the SEC has terminated its inquiry regarding Epocrates’ expert network services and that no enforcement action has been recommended.
Item 4. Mine Safety Disclosures
Not applicable.
24
Table of Contents
PART II
Item 5. Market for Registrant’s Common Equity, Related Stockholder Matters and Issuer Purchases of Equity Securities
As of December 31, 2011, there were 105 stockholders of record of our common stock. Our common stock has been traded on the NASDAQ Global Market under the symbol “EPOC” since February 2, 2011. Prior to this date, there was no public market for our common stock. The table below sets forth the high and low closing sales prices for our common stock as reported on the NASDAQ Global Select Market during the periods indicated.
| | High | | Low | |
| | | | | |
Year Ended December 31, 2011: | | | | | |
1st Quarter | | $ | 26.51 | | $ | 19.25 | |
2nd Quarter | | 24.28 | | 15.92 | |
3rd Quarter | | 19.40 | | 8.54 | |
4th Quarter | | 8.96 | | 7.74 | |
| | | | | | | |
We have never declared or paid, and do not anticipate declaring or paying, any cash dividends on our common stock. Any future determination as to the declaration and payment of dividends, if any, will be at the discretion of our Board of Directors and will depend on then existing conditions, including our financial condition, operating results, contractual restrictions, capital requirements, business prospects and other factors our Board of Directors may deem relevant at that point in time.
COMPARISON OF 11 MONTH CUMULATIVE TOTAL RETURN*
Among Epocrates, Inc., the Russell MicroCap Index and the RDG MicroCap Biotechnology Index
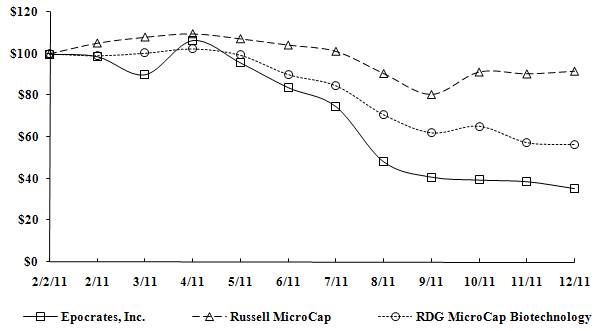
*$100 invested on 2/2/11 in stock or 1/31/11 in index, including reinvestment of dividends.
Fiscal year ending December 31.
Item 6. Selected Financial Data
The following selected consolidated financial data should be read together with “Risk Factors,” “Management’s Discussion and Analysis of Financial Condition and Results of Operations” and the consolidated financial statements and accompanying notes appearing elsewhere in this report. The selected consolidated financial data in this section is not intended to replace our consolidated financial statements and the accompanying notes. The results of the acquired businesses have been included in our consolidated financial statements since their respective dates of acquisition. Our historical results are not necessarily indicative of our future results.
We derived the consolidated statements of operations data for the fiscal years ended December 31, 2011, 2010 and 2009 and the consolidated balance sheets data as of December 31, 2011 and 2010 from our audited consolidated financial statements appearing elsewhere in this report. The consolidated statements of operations data for the years ended December 31, 2008 and 2007 and the consolidated balance sheets data as of December 31, 2009, 2008 and 2007 are derived from our audited consolidated financial statements, which are not included in this report.
25
Table of Contents
| | December 31, | |
| | 2011 | | 2010 | | 2009 | | 2008 | | 2007 | |
| | (in thousands except per share information) | |
| | | | | | | | | | | |
Total revenues, net | | $ | 113,346 | | $ | 103,988 | | $ | 93,654 | | $ | 83,345 | | $ | 65,611 | |
Net (loss) income | | (3,573 | ) | 3,803 | | 7,659 | | 7,434 | | 25,739 | |
Net (loss) income per common share - basic | | (0.17 | ) | 0.01 | | 0.22 | | 0.21 | | 1.18 | |
Net (loss) income per common share - diluted | | (0.17 | ) | 0.01 | | 0.20 | | 0.19 | | 1.06 | |
| | | | | | | | | | | |
Total assets | | $ | 152,224 | | $ | 127,216 | | $ | 125,465 | | $ | 116,359 | | $ | 135,565 | |
Deferred revenue | | 54,517 | | 54,896 | | 62,308 | | 58,439 | | 58,250 | |
Financing liability (1) | | — | | — | | 20,314 | | 20,314 | | 20,314 | |
Other long-term obligations | | 1,893 | | 16,929 | | 2,642 | | 1,577 | | 694 | |
Mandatorily redeemable convertible preferred stock (2) | | — | | 73,342 | | 70,502 | | 67,662 | | 64,822 | |
(1) Represents a financing liability incurred in connection with the build-out of our San Mateo facility. Please refer to Note 8 of our audited financial statements.
(2) Mandatorily redeemable convertible preferred stock includes $29.3 million of cumulative dividends to be paid in cash from the proceeds of our initial public offering as of December 31, 2010.
Other Financial Data
Adjusted EBITDA is an unaudited number and represents net income before income and expenses unrelated to core business activities, such as interest income, other income (expense), net and (benefit from) provision for income taxes; non-recurring income and expenses, such as gain on settlement and change in fair value of contingent consideration, gain on sale-leaseback of building, impairment of intangible and long-lived assets related to EHR, loss on impairment related to EHR business and other expenses (including legal expenses, facilities exit costs, employee severance charges, current period depreciation and amortization expense related to assets assigned to the EHR business and a refund of rent); and non-cash charges, such as depreciation and amortization expense (including intangible assets) related to core business and stock-based compensation.
Adjusted EBITDA is not a measure of operating performance or liquidity calculated in accordance with U.S. generally accepted accounting principles, or “GAAP,” and should be viewed as a supplement to, and not a substitute for, our results of operations presented on a GAAP basis. Adjusted EBITDA does not purport to represent cash flow provided by, or used in, operating activities as defined by GAAP. Our statements of cash flows present our cash flow activity in accordance with GAAP. Furthermore, adjusted EBITDA is not necessarily comparable to similarly-titled measures reported by other companies.
We believe adjusted EBITDA is used by and is useful to investors and other users of our financial statements in evaluating our operating performance because it provides them with an additional tool to compare business performance across companies and across periods. We believe that:
· EBITDA is widely used by investors to measure a company’s operating performance without regard to such items as interest income or expense, taxes, depreciation and amortization, which can vary substantially from company to company depending upon accounting methods and book value of assets, capital structure and the method by which assets were acquired; and
· investors commonly adjust EBITDA information to eliminate the effect of stock-based compensation expenses and other charges, which can vary widely from company to company and impair comparability.
Our management uses adjusted EBITDA:
· as a measure of operating performance to assist in comparing performance from period to period on a consistent basis;
· as a measure for planning and forecasting overall expectations and for evaluating actual results against such expectations;
26
Table of Contents
· in communications with the Board of Directors, stockholders, analysts and investors concerning our financial performance; and
· as a significant performance measurement included in our bonus plan.
The table below sets forth a reconciliation of net (loss) income to adjusted EBITDA (in thousands):
| | Years Ended December 31, | |
| | 2011 | | 2010 | | 2009 | | 2008 | | 2007 | |
| | (in thousands) | |
| | (unaudited) | |
| | | | | | | | | | | |
Net (loss) income, as reported under U.S. GAAP | | $ | (3,573 | ) | $ | 3,803 | | $ | 7,659 | | $ | 7,434 | | $ | 25,739 | |
Add: (Income) expenses unrelated to core business activities | | | | | | | | | | | |
Interest income | | (75 | ) | (93 | ) | (127 | ) | (1,180 | ) | (1,714 | ) |
Other (income) expense, net | | (183 | ) | — | | 73 | | (545 | ) | 233 | |
(Benefit from) provision for income taxes | | (2,198 | ) | 5,187 | | 6,788 | | 6,510 | | (21,126 | ) |
Add: Non-recurring and non-cash expenses (income) | | | | | | | | | | | |
| | | | | | | | | | | |
Non-recurring (income) expense | | | | | | | | | | | |
Gain on settlement and change in fair value of contingent consideration (1) | | (8,145 | ) | (1,034 | ) | — | | — | | — | |
Gain on sale-leaseback of building | | — | | (1,689 | ) | — | | — | | — | |
Impairment of intangible and long-lived assets related to EHR | | 7,281 | | — | | — | | — | | — | |
Loss on impairment related to EHR business | | 1,220 | | — | | — | | — | | — | |
Other expenses (2) | | 3,484 | | 701 | | — | | — | | — | |
| | | | | | | | | | | |
Non-cash expenses | | | | | | | | | | | |
Depreciation and amortization expense (including intangible assets) related to core business | | 8,065 | | 4,395 | | 2,889 | | 2,645 | | 1,906 | |
Stock-based compensation | | 7,342 | | 6,356 | | 4,534 | | 3,620 | | 3,187 | |
Adjusted EBITDA | | $ | 13,218 | | $ | 17,626 | | $ | 21,816 | | $ | 18,484 | | $ | 8,225 | |
(1) For the year ended December 31, 2011, includes a gain of $449 from the write-down of the contingent consideration liability related to an earn-out agreement recognized in the fourth quarter of 2011 for Caretools, Inc. and a $6.4 million gain recognized in the second quarter of 2011 associated with the settlement of the contingent consideration liability with the sellers of MedCafe, Inc., a company we acquired in 2010.
(2) For the year ended December 31, 2011, includes legal expenses of $1,033, facilities exit costs of $618, employee severance charges of $986, current period depreciation and amortization expense of $673 related to assets assigned to the EHR business and $174 relating to a refund of rent. For the year ended December 31, 2010, includes employee severance charges of $694 and amortization expense of $7 related to intangible assets assigned to the EHR business.
Note: prior period amounts have been revised to conform to the current period presentation.
Item 7. Management’s Discussion and Analysis of Financial Condition and Results of Operations
You should read the following discussion of our financial condition and results of operations in conjunction with the consolidated financial statements and the notes thereto included elsewhere in this report. The following discussion contains forward-looking statements that reflect our plans, estimates and beliefs. Our actual results could differ materially from those discussed in the forward-looking statements. Factors that could cause or contribute to these differences include those discussed below and elsewhere in this report, particularly in the sections titled “Special Note Regarding Forward-Looking Statements” and “Risk Factors.”
Business Overview
Epocrates is a leading physician platform for essential clinical content, practice tools and health industry engagement at the point of care. Our user network consists of well over one million healthcare professionals; including approximately 340,000, or more than 50% of, U.S. physicians. Epocrates’ portfolio features top-ranked medical apps, including the industry’s #1 used mobile drug reference, which provides convenient, point-of-care access to information such as dosing, drug interactions, pricing and insurance coverage for thousands of brand, generic and over-the-counter drugs. The features available through our unique physician platform are referenced multiple times per day and help healthcare professionals make more informed prescribing decisions, improve workflow and enhance patient safety. We offer our products on major U.S. mobile platforms including Apple, Android and Blackberry.
27
Table of Contents
Recent Developments
In April 2011, we announced the recent launch of our new mobile drug sampling service, Epocrates® Mobile Sample Closet. This new service provides pharmaceutical companies with the ability to provide custom sample offers to U.S. physicians who are members of Epocrates’ network via their mobile devices. In addition to drug samples, sponsoring companies may provide physicians with access to patient starter kits, vouchers and educational materials.
In July 2011, we entered a controlled release of the Epocrates EHR mobile and web-based EHR offering, with the intent to introduce the second phase of the product in 2012. Our EHR solution was designed to meet the distinct needs of primary care practices with 10 or fewer physicians and includes an intuitive user interface, affordable cost structure and a comprehensive support and service program. Our EHR solution is a secure, web-based Software-as-a-Service, or “SaaS,” system featuring core capabilities including patient encounter notes, electronic lab integration, ePrescribing and Epocrates’ market-leading drug content. We did not generate any material revenues from our EHR offering in 2011.
In October 2011, we launched a redesign of our drug reference tool to create a new platform that provides healthcare professionals with improved, faster access to our trusted drug content. It now also serves as a way to surface rich medical content tailored for the user. Our new platform should raise awareness of our interactive services such as EssentialPoints, Contact Manufacturer and Mobile Sample Closet. We have also built an app directory that resides on the Epocrates platform and provides healthcare professionals with convenient, centralized access to a portfolio of reference, education and clinical apps. Our new platform serves as a channel for Epocrates to partner on the development and distribution of apps.
On February 3, 2012, we announced that we had satisfied the federal government’s “meaningful use” criteria by earning complete Electronic Health Record, or “EHR,” ambulatory certification for Epocrates EHR v2. The designation officially deems the EHR software capable of enabling providers to qualify for funding under the American Recovery and Reinvestment Act, or “ARRA.” Also in February, we entered a release of our iPad EHR application and previewed the application at the 2012 Healthcare Information and Management Systems Society, or “HIMSS,” conference in Las Vegas. Designed to support and document patient encounters with the ease of templates, gesture-based motions and quick navigation, the application provided an elegant and intuitive user experience.
Despite achieving the meaningful use certification on February 3, 2012, management determined in early 2012 that the forecasted revenues from and the projected subscribers for the EHR product had not materialized and that the costs to develop, continue to enhance and support the EHR product had a significant adverse effect on our operating margin in 2011 and would likely continue to have such an adverse effect for the foreseeable future. On February 24, 2012, the Board of Directors of Epocrates approved the discontinuation of further development of Epocrates’ EHR product. The Board of Directors made this determination in order to focus Epocrates’ efforts on its core business, Subscriptions and Interactive Services, and due to the future uncertainty and ongoing investment required for the EHR product. Epocrates will explore strategic alternatives for the EHR product. In connection with this decision, Epocrates recorded an impairment charge of approximately $8.5 million in its fourth fiscal quarter of 2011, which represents the write-down of the carrying value of the goodwill, intangible and other long-lived assets related to the EHR product to their estimated fair value of zero. This charge is recorded in Impairment of Long-lived Assets and Goodwill in our consolidated statements of operations for the year ended December 31, 2011.
Financial Operations Overview
We generate revenue by providing healthcare companies with interactive services to communicate with our network of users, through the sale of subscriptions to our premium drug and clinical reference tools to healthcare professionals and, in 2011, through our recently released EHR solution. For the year ended December 31, 2011, we recorded total net revenues of $113.3 million, a 9% increase from the year ended December 31, 2010. For the year ended December 31, 2010, we recorded total net revenues of $104.0 million, an 11% increase from the year ended December 31, 2009.
Our users pay for one year of our premium subscriptions upfront. This amount is deferred and recognized ratably over the term of the subscription. Typically, interactive services clients are billed a portion of the contracted fee upon signing of the contract with the balance billed upon one or more future milestones. The amounts collected are deferred and recognized as services are delivered. Deferred revenue at December 31, 2011 was $54.5 million versus $54.9 million at December 31, 2010. Our total backlog was $79.2 million at December 31, 2011 compared to $86.4 million at December 31, 2010. The decline in backlog in 2011 is attributable to weaker than expected bookings in the second, third and fourth quarters of 2011. While this booking shortfall had little revenue impact in 2011, it will have a considerable impact on 2012 revenue.
28
Table of Contents
To date we have not experienced significant price pressure from competitors other than for our market research services. Competition is high among market research firms, and price has become a major driver in a client’s decision about which vendor to use. We have attempted to limit reductions in price because we believe our sizable network of healthcare professionals contributes significantly to a superior result for our clients. This price pressure has caused revenue from market research services to remain essentially unchanged since 2008.
Currently, our customer base is located almost entirely within the United States. No single customer accounted for more than 10% of our net revenue during the years ended December 31, 2011, 2010 and 2009. One customer accounted for 15% and 11% of the net accounts receivable as of December 31, 2011 and 2009, respectively. No single customer accounted for more than 10% of the net accounts receivable as of December 31, 2010.
We have invested significant development and marketing resources during the years ended December 31, 2011 and 2010 to develop and deliver new products. Specifically, we recorded $12.6 million and $8.0 million in operating expenses related to the EHR product during the years ended December 31, 2011 and 2010, respectively. This investment of resources has caused operating margins to decrease significantly in 2011 and 2010. As mentioned above, our Board of Directors approved the discontinuation of further development of our EHR offering, and our operating results include an impairment charge of approximately $8.5 million in the fourth quarter of 2011, representing the write-down of the carrying value of the long-lived assets and goodwill related to the EHR product to an estimated fair value of zero.
Total cash, cash equivalents and short-term investments at December 31, 2011 were $85.2 million, an increase of $30.5 million compared to December 31, 2010; however, this was primarily as a result of our initial public offering of our common stock in the first quarter of 2011.
Critical Accounting Policies and Estimates
Our management’s discussion and analysis of financial condition and results of operations is based upon our consolidated financial statements and notes to the consolidated financial statements, which were prepared in accordance with GAAP. The preparation of the financial statements requires us to make estimates and assumptions that affect the amounts reported in the financial statements and accompanying notes. We evaluate our estimates on an ongoing basis, including those related to revenue recognition and deferred revenue, stock-based compensation, impairment of goodwill and intangible assets and the valuation of deferred tax assets. We base our estimates and judgments on our historical experience, knowledge of factors affecting our business and our belief as to what could occur in the future considering available information and assumptions that are believed to be reasonable under the circumstances.
The accounting estimates we use in the preparation of our financial statements will change as new events occur, more experience is acquired, additional information is obtained and our operating environment changes. Changes in estimates are made when circumstances warrant. Such changes in estimates and refinements in estimation methodologies are reflected in our reported results of operations and, if material, the effects of changes in estimates are disclosed in the notes to our consolidated financial statements. By their nature, these estimates and judgments are subject to an inherent degree of uncertainty and actual results could differ materially from the amounts reported based on these estimates.
While our significant accounting policies are more fully described in Note 2 – Summary of Significant Accounting Policies, we believe the following reflect our critical accounting policies and our more significant judgments and estimates used in the preparation of our financial statements.
Revenue recognition and deferred revenue
Revenue is recognized only when:
· there is persuasive evidence that an arrangement exists in the form of a written contract, amendments to that contract, or purchase orders from a third party;
· delivery has occurred or services have been rendered;
· the price is fixed or determinable after evaluating the risk of concession; and
· collectability is probable and/or reasonably assured based on customer creditworthiness and past history of collection.
29
Table of Contents
Determining whether and when some of these criteria have been satisfied often involves judgments that can have a significant impact on the timing and amount of revenue we report. For example, our assessment of the likelihood of collection is a critical element in determining the timing of revenue recognition. If we do not believe that collection is probable and/or reasonably assured, revenue is deferred until cash is received.
Subscriptions are recognized as revenue ratably over the term of the subscription as services are delivered. Billings for subscriptions occur in advance of services being performed; therefore, these amounts are recorded as deferred revenue when billed. A license code allows a holder to redeem the code for a subscription. Typically, license codes must be redeemed within six months to one year of issuance. When a license code is redeemed for a mobile subscription, revenue is recognized ratably over the term of the subscription. If a license code expires before it is redeemed, revenue is recognized upon expiration.
We often enter into multiple element arrangements that contain various combinations of services from the above described subscriptions and interactive services. Typically, interactive services clients are billed a portion of the contracted fee upon signing of the contract with the balance billed upon one or more future milestones. Because billings for sponsored content occur in advance of services being performed, these amounts are recorded as deferred revenue when billed. Revenue is recognized over the contracted term as delivery occurs. Each element typically has a delivery period of one year, but the various elements may or may not be delivered concurrently.
In October 2009, the FASB amended the accounting guidance for multiple deliverable revenue arrangements to:
· provide updated guidance on whether multiple deliverables exist, how the deliverables in an arrangement should be separated and how the consideration should be allocated;
· require an entity to allocate revenue in an arrangement using best evidence of selling price, or “BESP,” if a vendor does not have vendor specific objective evidence, or “VSOE,” of fair value or third party evidence, “TPE,” of fair value; and
· eliminate the use of the residual method and require an entity to allocate revenue using the relative selling price method.
We adopted this guidance early for all contracts signed or materially modified on or after January 1, 2009, as we believe that the new guidance will better align revenue recognition with the delivery of services. Under the new guidance, if we cannot establish VSOE of fair value, we then determine if we can establish TPE of fair value. TPE is determined based on competitor prices for similar deliverables when sold separately. Our services differ significantly from those of our peers and our offerings contain a significant level of customization and differentiation such that the comparable pricing of products with similar functionality cannot generally be obtained. Furthermore, we are unable to reliably determine what similar competitor products’ selling prices are on a stand-alone basis. Therefore, we are typically not able to determine TPE.
If both VSOE and TPE do not exist, we then use BESP to establish fair value and to allocate total consideration to each element in the arrangement and consideration related to each element is then recognized as each element is delivered. Any discount or premium inherent in the arrangement is allocated to each element in the arrangement based on the relative fair value of each element.
The objective of BESP is to determine the price at which we would transact a sale if the product or service were sold on a stand-alone basis. We determine BESP for a product or service by considering multiple factors including an analysis of recent stand-alone sales of that product, market conditions, competitive landscape, internal costs, gross margin objectives and pricing practices. As these factors are mostly subjective, the determination of BESP requires significant judgment. If we had chosen different values for BESP, our revenue and deferred revenue could have been materially different.
We have established a hierarchy to determine BESP. First, we consider recent stand-alone sales of each product. If the quantity of stand-alone sales is not substantive, we calculate BESP as a percentage discount off of the approved selling price as established by our pricing committee. This discount is calculated as the average discount in recent deals where the product was bundled with other products. If there are not a substantive number of deals where the product was bundled with other products, we use the approved selling price as established by our pricing committee until we have sufficient history of transactions to compute BESP using either the stand-alone or bundled methodology discussed above.
We regularly review VSOE, TPE and BESP and maintain internal controls over the establishment and updates of these estimates. There was no material effect during the year ended December 31, 2011 nor do we currently expect a material effect in the near term from changes in VSOE, TPE or BESP.
30
Table of Contents
Stock-based compensation
The following table summarizes stock-based compensation charges for the years ended December 31, 2011, 2010 and 2009 (in thousands):
| | Years Ended December 31, | |
| | 2011 | | 2010 | | 2009 | |
| | | | | | | |
Stock-based compensation expense | | $ | 7,805 | | $ | 5,962 | | $ | 4,760 | |
Amortization of deferred stock-based compensation | | — | | — | | 14 | |
Stock-based compensation associated with outstanding repriced options | | (463 | ) | 394 | | (240 | ) |
Total stock-based compensation | | $ | 7,342 | | $ | 6,356 | | $ | 4,534 | |
For stock options and restricted stock units, or RSUs, granted on or after January 1, 2006, stock-based compensation is measured at grant date based on the fair value of the award and is expensed on a straight-line basis over the requisite service period. For options granted prior to January 1, 2006, we continue to recognize compensation expense on the remaining unvested awards under the intrinsic value method unless such grants are materially modified.
We considered the fair value of our common stock and the exercise price of the grant as variables in the Black-Scholes option pricing model to determine stock-based compensation. This model requires the input of assumptions on each grant date, some of which are highly subjective, including the expected term of the option, expected stock price volatility and expected forfeitures.
We determined the expected term of our options based upon historical exercises, post-vesting cancellations and the contractual term of the option. We concluded that it was not practicable to use our share price as the sole basis for calculating volatility due to the fact that our securities have been publicly traded for less than one year. Therefore, we based expected volatility on a combination of Epocrates volatility and the historical volatility of a peer group of publicly traded entities for the same expected term of our options with a heavier weighting being given to the peer group. We intend to continue to consistently apply this process using the same or similar entities and more fully weight the Epocrates volatility in the calculation as a sufficient amount of historical information regarding the volatility of our own share price becomes available, or unless circumstances change such that the identified entities are no longer similar to us. In this latter case, more suitable entities whose share prices are publicly available would be utilized in the calculation. We based the risk-free rate for the expected term of the option on the U.S. Treasury Constant Maturity Rate as of the grant date. We determined the forfeiture rate based upon our historical experience with pre-vesting option cancellations. If we had made different assumptions and estimates than those described above, the amount of our recognized and to be recognized stock-based compensation expense, net loss and net loss per share amounts could have been materially different.
Certain employees have received grants for which the ultimate number of shares that will be subject to vesting is dependent upon the achievement of certain financial targets for the year. Such determination is not made until the grant’s vesting determination date, which is the date our audited financial statements are available. The grant is initially recorded for that number of shares that is most likely to be subject to vesting based on available financial forecasts as of the date of grant. This amount is adjusted on a quarterly basis as new financial forecasts become available. Stock-based compensation expense for these grants is recorded over the requisite service period, generally four years. Such options generally vest ratably for 36 months from the vesting determination date.
Impairment of Goodwill and Intangible Assets
Significant judgments are required in assessing impairment of goodwill and intangible assets, including indentifying reporting units, assigning assets and liabilities to reporting units and determining the fair value of each reporting unit, which includes estimating future cash flows, determining appropriate discount and growth rates and other assumptions. Changes in these estimates and assumptions could materially affect the determination of fair value, whether an impairment exists and, if so, the amount of that impairment. Circumstances that could affect the valuation of goodwill and intangible assets include, among other things, a significant change in our business climate and buying habits of our customers along with increased costs to provide systems and technologies required to support the technology.
Goodwill. Goodwill is currently our only indefinite-lived intangible asset. Goodwill is tested for impairment at the reporting unit level at least annually on December 31 of each calendar year or more often if events or changes in circumstances indicate the carrying value may not be recoverable. We have identified two reporting units, “Subscriptions and Interactive Services” and
31
Table of Contents
“Electronic Health Records” and we have assigned a portion of goodwill to each of our two reporting units. Based on our analysis in 2011, we recorded an impairment charge of $1.1 million in the fourth quarter of 2011 to write down the carrying value of the goodwill associated with the EHR reporting unit to its estimated fair value of zero. We have determined that a 10% change in the probability of the possible strategic alternatives would not change the amount of the impairment. As of December 31, 2011, we had $18.0 million of goodwill, all of which is assigned to the Subscriptions and Interactive Services reporting unit. We have determined that a 10% change in the future undiscounted cash flows as of the date of our most recent goodwill impairment test would not have changed the outcome of the test for the Subscriptions and Interactive Services reporting unit. No goodwill impairment was recorded during the year ended December 31, 2010.
Intangible Assets. Intangible assets consist of purchased intellectual property acquired in transactions that were accounted for as business combinations under GAAP and are measured at fair value at the date of acquisition. We amortize all intangible assets on a straight-line basis over their expected lives. We evaluate our intangible assets for impairment by assessing the recoverability of these assets whenever adverse events or changes in circumstances or business climate indicate that expected undiscounted future cash flows related to such intangible assets may not be sufficient to support the net book value of such assets. An impairment charge is recognized in the period of identification to the extent that the carrying amount of an asset exceeds the fair value of such asset. Based on our analysis, we recorded an impairment charge of $0.5 million in the fourth quarter of 2011 to write down the carrying value of the intangible assets associated with the EHR reporting unit to their estimated fair value of zero. As of December 31, 2011, we had $6.8 million of intangible assets, net. No impairment was recorded in fiscal year 2010.
Valuation of deferred tax assets
A valuation allowance of approximately $0.7 million has been recorded at December 31, 2011 to offset specific state deferred tax assets, as we believe that it is not more likely than not that such deferred tax assets will be realized.
At December 31, 2011, we had federal and state tax net operating loss carryforwards before the valuation allowance and before the excess tax benefit of $2.4 million and $16.0 million, respectively. The federal and state net operating losses will begin to expire in 2019 and 2014, respectively. At December 31, 2011, we had federal and state research tax credit carryforwards of $0.9 million and $1.3 million, respectively. The federal research credit carryforward begins to expire in 2028. The state research credit carryforwards do not expire. At December 31, 2011, we had federal alternative minimum tax, or “AMT,” credit carryforwards of $0.7 million. The federal AMT credits carryforwards do not expire. The future utilization of our net operating loss and research and development credit carryforwards to offset future taxable income may be subject to an annual limitation as a result of ownership changes.
Based on our forecasts, we believe that we will more likely than not be able to utilize our U.S. federal net operating losses and research and development credits; as such, no valuation allowance is necessary. With regard to our state net operating losses, we have established a valuation allowance on specific state net operating losses for which we believe that we will not more likely than not be able to utilize. During the year, we evaluated our California research and development credits carried forward. Based on our projected California income, we believe that we will not more likely that not be able to utilize our existing research and development credits and, as such, a valuation allowance has been recorded against the California research and development credits.
32
Table of Contents
Results of Operations
The following table sets forth our statements of operations data based on the amounts and percentage relationship of the items listed to net revenue for each period presented (dollars in thousands):
| | Years Ended December 31, | |
| | 2011 | | 2010 | | 2009 | |
| | Amount | | % Revenue | | Amount | | % Revenue | | Amount | | % Revenue | |
| | | | | | | | | | | | | |
Total revenues, net | | $ | 113,346 | | 100.0 | % | $ | 103,988 | | 100.0 | % | $ | 93,654 | | 100.0 | % |
Total cost of revenues | | 41,711 | | 36.8 | % | 31,730 | | 30.5 | % | 29,452 | | 31.4 | % |
Gross profit | | 71,635 | | 63.2 | % | 72,258 | | 69.5 | % | 64,202 | | 68.6 | % |
| | | | | | | | | | | | | |
Operating expenses: | | | | | | | | | | | | | |
Sales and marketing | | 31,193 | | 27.5 | % | 30,424 | | 29.3 | % | 22,704 | | 24.2 | % |
Research and development | | 22,797 | | 20.1 | % | 19,717 | | 19.0 | % | 14,663 | | 15.7 | % |
General and administrative | | 22,700 | | 20.0 | % | 15,729 | | 15.1 | % | 11,587 | | 12.4 | % |
Facilities exit costs | | 618 | | 0.5 | % | — | | 0.0 | % | — | | 0.0 | % |
Gain on settlement and change in fair value of contingent consideration | | (8,145 | ) | (7.2 | )% | (1,034 | ) | (1.0 | )% | — | | 0.0 | % |
Impairment of long-lived assets and goodwill | | 8,501 | | 7.5 | % | — | | 0.0 | % | — | | 0.0 | % |
Total operating expenses | | 77,664 | | 68.5 | % | 64,836 | | 62.3 | % | 48,954 | | 52.3 | % |
| | | | | | | | | | | | | |
(Loss) income from operations | | (6,029 | ) | (5.3 | )% | 7,422 | | 7.1 | % | 15,248 | | 16.3 | % |
| | | | | | | | | | | | | |
Interest income | | 75 | | 0.1 | % | 93 | | 0.1 | % | 127 | | 0.1 | % |
Interest expense | | — | | 0.0 | % | (214 | ) | (0.2 | )% | (855 | ) | (0.9 | )% |
Other income (expense), net | | 183 | | 0.2 | % | — | | 0.0 | % | (73 | ) | (0.1 | )% |
Gain on sale-leaseback of building | | — | | 0.0 | % | 1,689 | | 1.6 | % | — | | 0.0 | % |
(Loss) income before income taxes | | (5,771 | ) | (5.1 | )% | 8,990 | | 8.6 | % | 14,447 | | 15.4 | % |
| | | | | | | | | | | | | |
Benefit from (provision for) income taxes | | 2,198 | | 1.9 | % | (5,187 | ) | (5.0 | )% | (6,788 | ) | (7.2 | )% |
| | | | | | | | | | | | | |
Net (loss) income | | $ | (3,573 | ) | (3.2 | )% | $ | 3,803 | | 3.7 | % | $ | 7,659 | | 8.2 | % |
Revenues
We generate revenue by providing healthcare companies with interactive services to communicate with our network of users, through the sale of subscriptions to our premium drug and clinical reference tools to healthcare professionals and, in July 2011, we also began recognizing revenue for our EHR solution. Revenues from our Subscriptions and Interactive Services were as follows:
| | Years ended December 31, | |
| | 2011 | | 2010 | | 2009 | |
| | | | | | | |
Subscriptions | | $ | 22,520 | | $ | 24,683 | | $ | 19,001 | |
Interactive Services | | 90,826 | | 79,305 | | 74,653 | |
| | $ | 113,346 | | $ | 103,988 | | $ | 93,654 | |
Subscriptions. Subscriptions revenue decreased $2.2 million for the year ended December 31, 2011, primarily due to a substantial decline in the number of license code expirations. Subscriptions revenue increased $5.7 million for the year ended December 31, 2010, of which $4.8 million was due to a large number of license code expirations during the year, and the remainder was due to an increase in paid subscriptions from iPhone users. List prices for our subscription products did not change during 2011 or 2010.
The majority of healthcare professionals in our network use our free products; users who paid for a subscription averaged approximately 10% of total active users for the years ended December 31, 2011, 2010 and 2009. We expect revenues from subscriptions to our premium products to decrease as a percentage of total revenue in the future as we expand our interactive services offerings to our pharmaceutical clients.
Interactive Services. Revenues from our Interactive Services business increased $11.5 million in 2011 compared to 2010 due to a $7.1 million increase in DocAlert clinical messaging services and a $6.2 million increase in revenue from virtual representative services, which were partially offset by a $2.9 million decrease in revenue from formulary hosting services. In 2010, Interactive Services revenue increased $4.7 million from 2009 due to $2.2 million of new virtual representative services which were launched in the first quarter of 2010, with the remainder due to growth revenue from mobile resource centers and clinical messaging. Historically, our interactive services revenues, and particularly our clinical messaging revenues, have grown at a much faster rate than subscriptions and we expect this trend to continue.
33
Table of Contents
Maintaining our large user network of U.S. physicians is important because it is a key driver of long-term interactive services revenue growth. The number of U.S. physician users as of December 31, 2011 increased to approximately 340,000, or 8%, from approximately 314,000 as of December 31, 2010. The number of U.S. physician users as of December 31, 2010 increased approximately 14% from approximately 275,000 as of December 31, 2009. This high growth rate was due to rapid iPhone adoption by our user network, and, to a lesser extent, Android adoption. We expect our user network to continue to increase, but at a lower rate.
Cost of revenues
Cost of revenues consists of the costs related to providing services to customers, which include salaries and related personnel expenses, stock-based compensation, service support costs, payments to participants for market research surveys we conduct, third-party royalties and allocated overhead. Third-party royalties consist of fees paid to branded content owners for the use of their intellectual property in our premium drug and reference products. Allocated overhead represents expenses such as rent, occupancy charges and information technology costs that we allocate to all departments based on headcount. Depreciation and amortization expense is also allocated to cost of revenues.
The following is a breakdown of cost of revenue related to subscriptions and interactive services for the years ended December 31, 2011, 2010 and 2009 (in thousands):
| | Years ended December 31, | |
| | 2011 | | 2010 | | 2009 | |
| | | | | | | |
Subscriptions | | $ | 8,360 | | $ | 6,516 | | $ | 6,558 | |
Interactive Services | | 33,351 | | 25,214 | | 22,894 | |
| | $ | 41,711 | | $ | 31,730 | | $ | 29,452 | |
Cost of subscriptions revenue. Cost of subscriptions revenue increased $1.8 million in the year ended December 31, 2011 primarily due to increases of $1.0 million in third-party royalties related to our subscriptions revenue, $0.6 million in the amortization of capitalized software and $0.3 million in consulting. For the year ended December 31, 2010, the change in cost of subscriptions revenue from December 31, 2009 was not significant.
Cost of subscriptions revenue as a percentage of subscriptions revenue was 37%, 26% and 35% in 2011, 2010 and 2009, respectively. We expect that the cost of subscriptions revenue will continue to increase in absolute dollars.
Cost of interactive services revenue. Cost of interactive services revenue increased $8.1 million in the year ended December 31, 2011 due to increases of $4.2 million in amortization of intangible assets and capitalized software primarily due to a full year of amortization of intangible assets acquired as a result of the MedCafe Inc. and Modality, Inc. acquisitions in 2010 and amortization of certain intangible assets which began upon entering a controlled release of the Company’s EHR solution and $3.0 million in consulting and employee compensation due to increases in outsourced services and in regular and temporary employee headcount. Cost of interactive services revenue increased $2.3 million in 2010 compared to 2009, primarily due to $1.3 million in amortization of intangible assets and $0.5 million in outside consulting services.
Cost of interactive services revenue as a percentage of interactive services revenue was 37%, 32% and 31% in 2011, 2010 and 2009, respectively. We expect that the cost of interactive services revenue will continue to increase in absolute dollars.
Sales and marketing expense
Sales and marketing expense consists primarily of salaries and related personnel expenses, sales commissions, stock-based compensation, trade show expenses, promotional expenses, public relations expenses and allocated overhead.
Sales and marketing expense increased $0.8 million, or 3%, in 2011 compared to 2010, primarily due to an increase of $1.3 million in salary and other personnel costs to support the entrance of a controlled release of our EHR offering offset by a decrease of $0.5 million in consulting costs. Sales and marketing expense increased $7.7 million, or 34%, in 2010 compared to 2009 primarily due to increased salary and other personnel costs related to additional headcount to support corporate marketing efforts of $4.1 million; increased salary, consulting and other costs to support the entrance of a controlled release of our EHR product of $3.1 million and increased stock-based compensation of $0.5 million.
34
Table of Contents
Sales and marketing expense as a percentage of total revenues, net for the years ended December 31, 2011, 2010 and 2009 was 28%, 29% and 24%, respectively. We expect sales and marketing expense to continue to increase in absolute dollars.
Research and development expense
Research and development expense consists primarily of salaries and related personnel expenses, stock-based compensation, allocated overhead, consultant fees and expenses related to the design, development, testing and enhancements of our services.
Research and development expense increased $3.1 million, or 16%, in 2011 compared to 2010 primarily due to a $4.3 million increase in salaries and related personnel expenses due to a 23% increase in research and development. This increase was partially offset by a $0.8 million decrease in stock option expense due to a lower stock price in 2011. In 2010, research and development expense increased $5.1 million, or 35%, compared to 2009. This increase was primarily due to increased salary, consulting and other costs to support the development of our EHR product of $4.0 million and an increase in stock-based compensation of $0.6 million.
Research and development expense related to EHR was $1.7 million, $4.0 million and zero for the years ended December 31, 2011, 2010 and 2009. Additionally, we capitalized $6.5 million and $0.7 million of costs related to EHR in 2011 and 2010.
Research and development expense as a percentage of total revenues, net for 2011, 2010 and 2009 was 20%, 19% and 16%, respectively. We expect research and development expense to increase in absolute dollars as we continue to develop new services.
General and administrative expense
General and administrative expense consists primarily of salaries and related personnel expenses, stock-based compensation, consulting, audit fees, legal fees, allocated overhead and other general corporate expenses.
General and administrative expense increased $7.0 million, or 44%, in 2011 compared to 2010, primarily due to increases of $2.2 million in stock-based compensation expense due to the modification of certain options, $1.9 million in employee salary and other personnel costs, $1.8 million in professional services due to increased legal fees related to the SEC investigation discussed under Item 3 of this Annual Report on Form 10-K and $0.4 million in recruiting costs. General and administrative expense increased $4.1 million, or 36%, in 2010 compared to 2009. This increase was primarily due to increased salary and other personnel expenses of $1.9 million, an increase in stock-based compensation of $0.6 million and increased recruiting costs of $0.6 million. General and administrative expense as a percentage of total net revenue in 2011, 2010 and 2009 was 20%, 15% and 12%, respectively.
Facilities exit costs
In the first quarter of 2011, we vacated our East Windsor, New Jersey office and relocated to Ewing, New Jersey. The non-cancellable lease we had entered into for our East Windsor office holds us liable for monthly lease payments until the expiration of the lease at the end of 2012. The liability, recorded at fair value, is based on the present value of the remaining lease rentals and is reduced for the estimated sublease rentals that could be reasonably obtained for the property. In 2011, we recorded a charge of approximately $0.6 million in 2011 relating to facilities exit costs.
Gain on settlement and change in fair value of contingent consideration
We acquired certain intangible assets of Caretools, Inc., in June 2009 and of MedCafe Inc., in February 2010. These acquisitions were accounted for as business combinations under GAAP.
Caretools, Inc. In connection with the acquisition of Caretools, Inc. on June 23, 2009, we recorded contingent consideration of $1.3 million on the acquisition date. This contingent consideration was based on an estimate of revenues to be generated from sales of products developed incorporating Caretools’ technology. In 2010, we recorded contingent consideration expense of $0.9 million related to revaluing the contingent consideration liability for Caretools to its fair value as of December 31, 2010. The change in the fair value of the contingent consideration was due to changes in discount periods as well as new estimates of revenue expected to be generated using Caretools technology. At December 31, 2010, the fair value of this contingent consideration was $2.2 million.
35
Table of Contents
As a result of our decision to pursue strategic alternatives for the EHR business, we recorded an impairment charge to write down the carrying value of the contingent consideration liability associated with the EHR business to an estimated fair value of zero during the fourth quarter of 2011. The change in the fair value of the contingent consideration was due primarily to revised estimates of revenues to be derived from the acquired technologies of Caretools, Inc. As of December 31, 2011, the fair value of the contingent consideration liability was zero due to the discontinuation of the EHR business.
MedCafe Inc. In connection with the acquisition of MedCafe on February 1, 2010, we recorded contingent consideration of $14.8 million on the acquisition date. This contingent consideration was based on an estimate of revenues to be generated from sales of products developed incorporating MedCafe technology. In 2010, we recorded a reduction to contingent consideration expense of $1.9 million to revalue the contingent consideration liability for MedCafe to its fair value as of December 31, 2010. The change in the fair value of the contingent consideration was due to changes in discount periods as well as new estimates of revenue expected to be generated using MedCafe technology. We did not make any contingent payments to the sellers in 2010. As of December 31, 2010, the fair value of this contingent consideration was $12.8 million.
In 2011, we recorded a decrease in the contingent consideration liability resulting in a gain of approximately $5.9 million for the year ended December 31, 2011. The change in the fair value of the contingent consideration was due primarily to an agreement with the sellers in the second quarter of 2011 to settle the liability for $6.4 million. As of December 31, 2011, the fair value of this contingent consideration liability was zero.
Impairment of Long-lived Assets and Goodwill
During July 2011, we began to compete in the EHR market by entering a controlled release of the Epocrates EHR mobile and web-based EHR offering, with the intent to offer a full product in 2012. For the year ended December 31, 2011, we had not generated significant revenues and had not met our forecasts for subscribers or revenues from our EHR product. On February 24, 2012, the Board of Directors of Epocrates approved the discontinuation of further development of Epocrates’ EHR product. In connection with this decision, Epocrates recorded an impairment charge of approximately $8.5 million in its fourth quarter of 2011, which represents the write-down of the carrying value of the goodwill, intangible and other long-lived assets related to the EHR product to their estimated fair value of zero.
Segment Earnings from Operations
| | Subscriptions and | | Electronic | | | |
Year ended December 31, 2011 | | Interactive Services | | Health Records | | Total | |
Net revenue | | $ | 113,321 | | $ | 25 | | $ | 113,346 | |
Segment income (loss) from operations | | $ | 38,229 | | $ | (14,084 | ) | $ | 24,145 | |
Unallocated items: | | | | | | | |
Stock-based compensation | | | | | | (7,342 | ) |
Other unallocated corporate costs | | | | | | (22,832 | ) |
Loss from operations | | | | | | (6,029 | ) |
Interest income | | | | | | 75 | |
Other income | | | | | | 183 | |
Loss before income taxes | | | | | | $ | (5,771 | ) |
| | Subscriptions and | | Electronic | | | |
Year ended December 31, 2010 | | Interactive Services | | Health Records | | Total | |
Net revenue | | $ | 103,988 | | $ | — | | $ | 103,988 | |
Segment income (loss) from operations | | $ | 42,413 | | $ | (8,021 | ) | $ | 34,392 | |
Unallocated items: | | | | | | | |
Stock-based compensation | | | | | | (6,356 | ) |
Other unallocated corporate costs | | | | | | (20,614 | ) |
Income from operations | | | | | | 7,422 | |
Interest income | | | | | | 93 | |
Interest expense | | | | | | (214 | ) |
Gain on sale-leaseback of building | | | | | | 1,689 | |
Income before income taxes | | | | | | $ | 8,990 | |
The segment income (loss) from operations figures reported above represent income (loss) from operations before stock-based compensation, general and administrative expenses and certain marketing and research and development expenses.
36
Table of Contents
We were organized as one operating segment in 2009, and therefore, no separate segment information is presented for the year ended December 31, 2009.
Interest income
Interest income in 2011 was relatively consistent with interest income in 2010 and 2009. The continued decline in prevailing interest rates during 2011 and 2010 resulted in a slight decrease in interest income during 2011 and 2010.
Interest expense
We incurred no interest expense in 2011 compared to $0.2 million and $0.9 million in 2010 and 2009, respectively. Interest expense in 2010 and 2009 relates to rent payments on our San Mateo facility which was capitalized. Interest expense decreased during the year ended December 31, 2010 due to a sale-leaseback of our San Mateo facility.
Other income (expense), net
We had approximately $0.2 million of other income in 2011 due to a refund of property taxes from the landlord of our San Mateo facility. We did not have other income (expense), net in 2010, and other income (expense), net was not significant in 2009.
Gain on sale-leaseback of building
In 2010, we completed the sale-leaseback of our corporate headquarters, which resulted in a gain of $1.7 million. Previously, we capitalized the fair value of the unfinished portion of the building of $17.6 million with a corresponding credit to financing liability. In 2010, under the terms of the modified lease, we began accounting for the building lease as an operating lease. In connection with the sale-leaseback of the building, we wrote off the remaining asset value of the building, related accumulated depreciation and the financing liability.
Benefit from (provision for) income taxes
Our projected long-term combined federal and state tax rate is approximately 36%. We received an income tax benefit of approximately $2.2 million in 2011 compared to a provision for income taxes of approximately $5.2 million in 2010. Our effective tax rate for 2011 was 38% compared to 58% for 2010.
During the year ended December 31, 2010, we had a provision for income taxes of approximately $5.2 million, which resulted in an effective tax rate of 57%. The effective rate for 2010 was higher than our statutory tax rate due to the need to provide for income tax on $3.1 million of stock-based compensation related to incentive stock options, or ISOs. GAAP does not allow us to record a benefit on ISOs unless and until there is a disqualifying disposition of the stock. This increased our effective tax rate by approximately 12%. In addition, California amended its tax law effective 2011 to allow companies to elect to use sales as the sole factor in determining California apportionment. We elected this method, and therefore, the amount of income subject to tax in California was reduced. As a result, our deferred tax assets in California were written down which increased our effective tax rate by approximately 8%.
During the year ended December 31, 2011, we received an income tax benefit of $2.2 million, which resulted in an effective tax rate of 38%. The effective tax rate for 2011 was higher than our statutory tax rate due to an increase in the generation of federal and California research and development credits of $0.5 million and $0.3 million, respectively. This increased our effective tax rate by approximately 14%. The income tax benefit was partially offset by tax expense of approximately $0.5 million related to the establishment of a valuation allowance against our California research and development credits. This decreased our effective income tax rate by approximately 9%.
We incurred a provision for income taxes of $5.2 million in 2010 compared to a provision for income taxes of $6.8 million in 2009. Our effective tax rate for 2010 was 58% compared to 47% for 2009. This rate is driven primarily by pre-tax book income which was lower in 2010 compared to 2009 coupled with the fact that we must still provide for income tax on approximately $3.1 million of stock-based compensation related to incentive stock options, or ISOs. GAAP does not allow us to record a benefit on incentive stock options unless and until there is a disqualifying disposition of the stock. This increased our effective tax rate by approximately 12%. In addition, California amended its tax law effective 2011 lowering the amount of income that is subject to tax in California for certain California corporations. As a result, our deferred tax assets in California had to be written down which drove up the overall effective rate. This increased our effective tax rate by approximately 8%.
37
Table of Contents
Quarterly Results of Operations
The following table sets forth selected unaudited quarterly statements of operations data for the eight quarters ending March 31, 2010 through December 31, 2011. The information for each of these quarters has been prepared on the same basis as our audited financial statements and, in the opinion of management, includes all adjustments necessary for a fair statement of the results of operations for such periods. This data should be read in conjunction with the financial statements and related notes.
| | Three Months Ended | |
| | March 31, | | June 30, | | September 30, | | December 31, | |
| | 2011 | | 2011 | | 2011 | | 2011 | |
| | (in thousands, except per share information) | |
| | | | | | | | | |
Total revenues, net | | $ | 29,177 | | $ | 27,860 | | $ | 26,602 | | $ | 29,707 | |
Gross profit | | 19,787 | | 18,092 | | 15,741 | | 18,015 | |
Gain on settlement and change in fair value of contingent consideration (1) | | 301 | | (6,375 | ) | (1,622 | ) | (449 | ) |
Impairment of long-lived assets and goodwill | | — | | — | | — | | 8,501 | |
Gain on sale-leaseback of building | | — | | — | | — | | — | |
Net (loss) income | | (1,125 | ) | 3,393 | | 686 | | (6,527 | ) |
Net (loss) income per common share - basic (2) | | (0.08 | ) | 0.14 | | 0.03 | | (0.27 | ) |
Net (loss) income per common share - diluted (2) | | (0.08 | ) | 0.13 | | 0.03 | | (0.27 | ) |
| | | | | | | | | | | | | |
| | Three Months Ended | |
| | March 31, | | June 30, | | September 30, | | December 31, | |
| | 2010 | | 2010 | | 2010 | | 2010 | |
| | (in thousands, except per share information) | |
| | | | | | | | | |
Total revenues, net | | $ | 24,336 | | $ | 25,277 | | $ | 24,090 | | $ | 30,285 | |
Gross profit | | 17,084 | | 17,541 | | 15,748 | | 21,885 | |
Gain on settlement and change in fair value of contingent consideration | | 1,214 | | (569 | ) | 240 | | (1,919 | ) |
Impairment of long-lived assets and goodwill | | — | | — | | — | | — | |
Gain on sale-leaseback of building | | — | | 1,689 | | — | | — | |
Net (loss) income | | 26 | | 762 | | 336 | | 2,679 | |
Net (loss) income per common share - basic (2) | | (0.12 | ) | (0.02 | ) | (0.07 | ) | 0.10 | |
Net (loss) income per common share - diluted (2) | | (0.12 | ) | (0.02 | ) | (0.07 | ) | 0.09 | |
| | | | | | | | | | | | | |
(1) | For the three months ended June 30, 2011, includes a $6.4 million gain relating to the settlement of the contingent consideration liability with the sellers of MedCafe, Inc., a company that Epocrates acquired in 2010. For the three months ended December 31, 2011, includes a gain of $0.4 million from the write-down of the contingent consideration liability related to an earn-out agreement recognized in the fourth quarter of 2011 for Caretools. |
| |
(2) | Net (loss) income per share for the four quarters of each fiscal year may not sum to the total for the fiscal year because of the different number of shares outstanding during each period. |
Our revenue is generally highest in the fourth quarter of each calendar year, primarily as a result of the annual budget approval processes of many of our customers in the pharmaceutical industry, and we expect this trend to continue. We may also experience fluctuations in our quarterly results, due to factors including, but not limited to, the timing of revenue recognition, our ability to retain and attract new customers and the general economic and regulatory environment in the U.S. Due to these factors, we believe that quarter-to-quarter comparisons of operating results are not meaningful and should not be relied upon as an indication of future performance.
Liquidity and Capital Resources
We expect cash generated by operations to be our primary source of liquidity and that we will continue to generate positive cash flows from operations in 2012. We believe that existing cash, cash equivalents and short-term investments, together with any cash generated from operations will be sufficient to meet our normal operating requirements including any capital expenditures and possible strategic acquisitions for at least the next 12 months.
38
Table of Contents
Operating activities
In 2011, we generated a net loss of $3.6 million primarily due to the $8.5 million impairment charge related to our EHR business, which was recorded in the fourth quarter of 2011. Cash provided by operating activities of approximately $8.8 million in 2011 was almost entirely due to depreciation and amortization expense of $8.7 million which was offset by changes in operating accounts.
Cash provided by operating activities was approximately $9.1 million in 2010, which was primarily attributable to net income of $3.8 million plus stock-based compensation of $6.3 million and depreciation and amortization of $4.4 million, and a decrease in deferred tax assets of $4.5 million, partially offset by a decrease in deferred revenue of $7.5 million.
Cash provided by operating activities was $17.0 million in 2009, which was primarily attributable to net income of $7.7 million plus employee stock-based compensation expense of $4.5 million and depreciation and amortization of $2.9 million.
Investing activities
The primary objectives of our investment activities are to preserve principal and maintain liquidity while at the same time maximizing yields without significantly increasing risk. Our policy is to invest only in fixed income instruments denominated and payable in U.S. dollars. Our investment policy allows investment in obligations of the U.S. government and its agencies, money market instruments, commercial paper, certificates of deposit, bankers’ acceptances, corporate bonds of U.S. companies, municipal securities and asset-backed securities. We do not invest in auction rate securities, futures contracts, or hedging instruments. Securities of a single issuer valued at cost at the time of purchase should not exceed 5% of the market value of the portfolio or $1.0 million, whichever is greater, but securities issued by the U.S. Treasury and U.S. government agencies are specifically exempted from these restrictions. Issue size should normally be greater than $50 million for corporate bonds. No single position in any issue should equal more than 10% of that issue. The final maturity of each security within the portfolio should not exceed 24 months.
The following table summarizes our investments in cash, cash equivalents and short-term investments as of December 31, 2011, 2010 and 2009 (in thousands):
| | As of December 31, | |
| | 2011 | | 2010 | | 2009 | |
| | | | | | | |
Cash | | $ | 65,016 | | $ | 10,676 | | $ | 12,140 | |
Cash equivalents | | 10,310 | | 25,311 | | 48,755 | |
Short-term investments | | 9,897 | | 18,697 | | 4,424 | |
Total cash, cash equivalents and short-term investments | | $ | 85,223 | | $ | 54,684 | | $ | 65,319 | |
| | | | | | | |
Unrealized loss on available-for-sale securities | | $ | (2 | ) | $ | — | | $ | (2 | ) |
Our primary use of cash from investing activities is for capital expenditures, which was $10.1 million, $4.7 million and $2.6 million in 2011, 2010 and 2009, and for business acquisitions, which was $14.7 million in 2010. Other cash provided by (used in) investing activities was due to purchases, sales and maturities of short-term investments.
Financing activities
Cash provided by financing activities of $31.5 million in 2011 was due to proceeds of $64.2 million from the issuance of common stock in the initial public offering and proceeds of $3.5 million from the exercise of employee stock options, partially offset by the payment of accrued dividends on Series B mandatorily redeemable convertible preferred stock of $29.6 million and the settlement and payment of contingent consideration of $6.9 million. In February 2011, we issued 4.4 million shares at a price of $16.00 per share in an initial public offering, net of underwriting discounts, commissions and other costs totaling $7.9 million, of which $2.0 million had been capitalized in 2010.
Cash used in financing activities of $0.5 million in 2010 was due to repurchases of our stock from certain employees, former employees and former directors totaling $3.5 million, partially offset by proceeds from the exercise of employee stock options of $2.7 million. During 2010, certain individuals, including former employees and former directors, entered into binding agreements to sell common stock held by them to three accredited investors. During 2010, we exercised our right of first refusal for 0.4 million shares of common stock at contracted prices ranging from $6.42 to $11.43 for an aggregate purchase price of $3.5 million.
39
Table of Contents
Cash used in financing activities in 2009 was $6.9 million and was due to repurchases of our stock from employees and former employees totaling $7.9 million, partially offset by proceeds from the exercise of employee stock options of $0.9 million. On June 1, 2009, we repurchased 0.5 million shares of common stock from existing employees for an aggregate $5.8 million pursuant to a tender offer. Also, during the fourth quarter of 2009, certain former employees entered into binding agreements to sell common stock held by them to one of various accredited investors. In certain instances, we elected to exercise our right of first refusal by purchasing the shares from these individuals at contracted prices ranging from $8.27 to $9.54 per share. We exercised our right of first refusal to repurchase 0.2 million shares of common stock for an aggregate purchase price of $2.1 million.
We believe that our available cash resources and anticipated future cash flow from operations will provide sufficient cash resources to meet our contractual obligations and our anticipated working capital and capital expenditure requirements for at least the next 12 months. However, prior to such time, we may seek to sell additional equity or debt securities or obtain a credit facility. The sale of additional equity or convertible securities may result in additional dilution to our stockholders. If we raise additional funds through the issuance of debt securities, these securities could have rights senior to those of our common stock and could contain covenants that could restrict our operations. Any required additional capital may not be available on reasonable terms, if at all.
Our future liquidity and capital requirements will depend upon numerous factors, including retention of customers at current volume and revenue levels, our existing and new application and service offerings, competing technological and market developments and potential future acquisitions. In addition, our ability to generate cash flow is subject to numerous factors beyond our control, including general economic, regulatory and other matters affecting our customers and us.
Contractual Obligations
The following table summarizes our contractual obligations as of December 31, 2011 and the years in which these obligations are due (in thousands):
| | Total | | Less than 1
Year | | 1 - 3 Years | | 3 - 5 Years | | More than
5 Years | |
| | | | | | | | | | | |
Operating leases (1) | | $ | 7,364 | | $ | 2,861 | | $ | 4,503 | | $ | — | | $ | — | |
Minimum royalty and contract license fees (2) | | 8,530 | | 4,571 | | 3,959 | | — | | — | |
Engineering and content development (3) | | 1,200 | | 600 | | 600 | | — | | — | |
Uncertain tax positions (4) | | 1,126 | | — | | — | | — | | 1,126 | |
Total | | $ | 18,220 | | $ | 8,032 | | $ | 9,062 | | $ | — | | $ | 1,126 | |
(1) Relates to our facilities in California, New Jersey and North Carolina.
(2) Relates to medical information licensed from third parties for use in our subscription services.
(3) Relates to a contract with a consulting firm to provide product development and content development work.
(4) Represents uncertain tax positions for which we could not make a reasonable estimate of the amount or the exact period of related future payments.
Off-Balance Sheet Arrangements
We do not have any relationships with unconsolidated entities or financial partnerships, such as entities often referred to as structured finance or special purpose entities. We do not have any outstanding derivative financial instruments, off-balance sheet guarantees, interest rate swap transactions or foreign currency forward contracts.
Indemnification
We enter into standard indemnification agreements in the ordinary course of business. Pursuant to the agreements, each party may indemnify, defend and hold the other party harmless with respect to such claim, suit or proceeding brought against it by a third party alleging that the indemnifying party’s intellectual property infringes upon the intellectual property of the third party, or results from a breach of the indemnifying party’s representations and warranties or covenants, or that results from any acts of negligence or willful misconduct. The term of these indemnification agreements is generally perpetual any time after execution
40
Table of Contents
of the agreement. The maximum potential amount of future payments we could be required to make under these indemnification agreements is unlimited. Historically, we have not been obligated to make significant payments for these obligations and no liabilities have been recorded for these obligations on the balance sheet as of December 31, 2011 or 2010.
We also indemnify our officers and directors for certain events or occurrences, subject to certain limits, while the officer is or was serving at our request in such capacity. The maximum amount of potential future indemnification is unlimited; however, we have a Director and Officer Insurance Policy that limits its exposure and enables us to recover a portion of any future amounts paid. Historically, we have not been obligated to make any payments for these obligations and no liabilities have been recorded for these obligations on the balance sheet as of December 31, 2010 or 2011.
Sarbanes-Oxley Compliance and Corporate Governance
As a public company, we are subject to the reporting requirements of the Sarbanes-Oxley Act of 2002. In particular, we must perform system and process evaluation and testing of our internal control over financial reporting to allow management to report on the effectiveness of our internal control over financial reporting, as required by Section 404 of the Sarbanes-Oxley Act, beginning with this annual report on Form 10-K for the fiscal year ending December 31, 2011, and potentially our independent registered public accounting firm beginning with our annual report on Form 10-K for the fiscal year ending December 31, 2012. In order to maintain and improve the effectiveness of disclosure controls and procedures and internal control over financial reporting, significant resources and management oversight will be required. We also must comply with all corporate governance requirements of The NASDAQ Global Market.
Recently Adopted and Recently Issued Accounting Guidance
See “Note 2 – Summary of Significant Accounting Policies” to the consolidated financial statements included in this report, regarding the impact of certain recent accounting pronouncements on our consolidated financial statements.
Item 7A. Quantitative and Qualitative Disclosures About Market Risk
Interest Rate Risk
The primary objectives of our investment activities are to preserve principal and maintain liquidity while at the same time maximizing yields without significantly increasing risk. To achieve these objectives, we invest in money market funds and high quality debt securities. Our investments in debt securities are subject to interest rate risk. To minimize the exposure due to an adverse shift in interest rates, we invest in short-term securities and maintain an average portfolio duration of less than one year.
Unrestricted cash, cash equivalents and short-term investments are held for working capital purposes and acquisition financing. We do not enter into investments for trading or speculative purposes. While our portfolio of available-for-sale marketable securities create an exposure to interest rate risk, we believe that we do not have material exposure to changes in the fair value as a result of changes in interest rates due to the short-term nature of our investments. Declines in interest rates may reduce future investment income. However, a hypothetical decline of one percentage point in the interest rate on our investments would not have a material effect on our consolidated financial condition or results of operations.
Item 8. Financial Statements and Supplementary Data
Supplementary Data
The information regarding our quarterly financial results required by this item is incorporated by reference here from “Item 7. Management’s Discussion and Analysis of Financial Condition and Results of Operations — Quarterly Results of Operations.”
41
Table of Contents
Report of Independent Registered Public Accounting Firm
To the Board of Directors and Stockholders
of Epocrates, Inc.:
In our opinion, the consolidated financial statements listed in the index appearing under Item 15(a)(1) present fairly, in all material respects, the financial position of Epocrates, Inc. and its subsidiaries at December 31, 2011 and December 31, 2010, and the results of their operations and their cash flows for each of the three years in the period ended December 31, 2011 in conformity with accounting principles generally accepted in the United States of America. In addition, in our opinion, the financial statement schedule listed in the index appearing under Item 15(a)(2) presents fairly, in all material respects, the information set forth therein when read in conjunction with the related consolidated financial statements. These financial statements and financial statement schedule are the responsibility of the Company’s management. Our responsibility is to express an opinion on these financial statements and on the financial statement schedule based on our audits. We conducted our audits of these statements in accordance with the standards of the Public Company Accounting Oversight Board (United States). Those standards require that we plan and perform the audit to obtain reasonable assurance about whether the financial statements are free of material misstatement. An audit includes examining, on a test basis, evidence supporting the amounts and disclosures in the financial statements, assessing the accounting principles used and significant estimates made by management, and evaluating the overall financial statement presentation. We believe that our audits provide a reasonable basis for our opinion.
/s/ PRICEWATERHOUSECOOPERS LLP | |
| |
San Jose, California | |
March 19, 2012 | |
42
Table of Contents
EPOCRATES, INC.
CONSOLIDATED BALANCE SHEETS
(in thousands, except per share data)
| | December 31, | |
| | 2011 | | 2010 | |
| | | | | |
Assets | | | | | |
| | | | | |
Current assets | | | | | |
Cash and cash equivalents | | $ | 75,326 | | $ | 35,987 | |
Short-term investments | | 9,897 | | 18,697 | |
Accounts receivable, net of allowance for doubtful accounts of $85 and $141, respectively | | 22,748 | | 21,101 | |
Deferred tax asset | | 7,390 | | 4,971 | |
Prepaid expenses and other current assets | | 3,218 | | 3,548 | |
Total current assets | | 118,579 | | 84,304 | |
| | | | | |
Property and equipment, net | | 7,283 | | 8,757 | |
Deferred tax asset, long-term | | 1,280 | | 779 | |
Goodwill | | 17,959 | | 19,079 | |
Other intangible assets, net | | 6,771 | | 11,438 | |
Other assets | | 352 | | 2,859 | |
Total assets | | $ | 152,224 | | $ | 127,216 | |
| | | | | |
Liabilities, Mandatorily Redeemable Convertible Preferred Stock and Stockholders’ Equity (Deficit) | | | | | |
| | | | | |
Current liabilities | | | | | |
Accounts payable | | $ | 3,282 | | $ | 3,635 | |
Deferred revenue | | 46,429 | | 46,164 | |
Other accrued liabilities | | 9,600 | | 9,251 | |
Total current liabilities | | 59,311 | | 59,050 | |
| | | | | |
Deferred revenue, less current portion | | 8,088 | | 8,732 | |
Contingent consideration | | — | | 15,016 | |
Other liabilities | | 1,893 | | 1,913 | |
Total liabilities | | 69,292 | | 84,711 | |
| | | | | |
Commitments and contingencies (Note 10) | | | | | |
| | | | | |
Mandatorily redeemable convertible preferred stock $0.001 par value; 15,304 shares authorized; 0 and 13,142 shares issued and outstanding at December 31, 2011 and 2010, respectively; liquidation preference of $0 and $73,373 at December 31, 2011 and 2010, respectively | | — | | 73,342 | |
| | | | | |
Stockholders’ equity (deficit) | | | | | |
Preferred stock: $0.01 par value; 10,000 and 0 shares authorized; no shares issued and outstanding at December 31, 2011 and 2010 | | — | | — | |
Common stock: $0.001 par value; 100,000 and 30,129 shares authorized; 24,370 and 7,802 shares issued and outstanding at December 31, 2011 and 2010, respectively | | 24 | | 8 | |
Additional paid-in-capital | | 129,238 | | 11,911 | |
Accumulated other comprehensive loss | | (2 | ) | (1 | ) |
Accumulated deficit | | (46,328 | ) | (42,755 | ) |
Total stockholders’ equity (deficit) | | 82,932 | | (30,837 | ) |
Total liabilities, mandatorily redeemable convertible preferred stock, and stockholders’ equity (deficit) | | $ | 152,224 | | $ | 127,216 | |
The accompanying notes are an integral part of these financial statements.
43
Table of Contents
EPOCRATES, INC.
CONSOLIDATED STATEMENTS OF OPERATIONS
(in thousands, except per share data)
| | Years Ended December 31, | |
| | 2011 | | 2010 | | 2009 | |
| | | | | | | |
Subscription revenues | | $ | 22,520 | | $ | 24,683 | | $ | 19,001 | |
Interactive services revenues | | 90,826 | | 79,305 | | 74,653 | |
Total revenues, net | | 113,346 | | 103,988 | | 93,654 | |
| | | | | | | |
Cost of subscription revenues | | 8,360 | | 6,516 | | 6,558 | |
Cost of interactive services revenues | | 33,351 | | 25,214 | | 22,894 | |
Total cost of revenues (1) | | 41,711 | | 31,730 | | 29,452 | |
| | | | | | | |
Gross profit | | 71,635 | | 72,258 | | 64,202 | |
| | | | | | | |
Operating expenses (1): | | | | | | | |
Sales and marketing | | 31,193 | | 30,424 | | 22,704 | |
Research and development | | 22,797 | | 19,717 | | 14,663 | |
General and administrative | | 22,700 | | 15,729 | | 11,587 | |
Facilities exit costs | | 618 | | — | | — | |
Gain on settlement and change in fair value of contingent consideration | | (8,145 | ) | (1,034 | ) | — | |
Impairment of long-lived assets and goodwill | | 8,501 | | — | | — | |
Total operating expenses | | 77,664 | | 64,836 | | 48,954 | |
| | | | | | | |
(Loss) income from operations | | (6,029 | ) | 7,422 | | 15,248 | |
| | | | | | | |
Interest income | | 75 | | 93 | | 127 | |
Interest expense | | — | | (214 | ) | (855 | ) |
Other income (expense), net | | 183 | | — | | (73 | ) |
Gain on sale-leaseback of building | | — | | 1,689 | | — | |
| | | | | | | |
(Loss) income before income taxes | | (5,771 | ) | 8,990 | | 14,447 | |
| | | | | | | |
Benefit from (provision for) income taxes | | 2,198 | | (5,187 | ) | (6,788 | ) |
| | | | | | | |
Net (loss) income | | $ | (3,573 | ) | $ | 3,803 | | $ | 7,659 | |
| | | | | | | |
Net (loss) income available to common stockholders - basic | | $ | (3,867 | ) | $ | 113 | | $ | 1,703 | |
Net (loss) income available to common stockholders - diluted | | $ | (3,867 | ) | $ | 126 | | $ | 1,908 | |
| | | | | | | |
Net (loss) income per common share - basic | | $ | (0.17 | ) | $ | 0.01 | | $ | 0.22 | |
Net (loss) income per common share - diluted | | $ | (0.17 | ) | $ | 0.01 | | $ | 0.20 | |
| | | | | | | |
Weighted average common shares outstanding - basic | | 22,297 | | 7,558 | | 7,758 | |
Weighted average common shares outstanding - diluted | | 22,297 | | 9,145 | | 9,491 | |
(1) Includes stock-based compensation of the following amounts: | | | | | | | |
| | | | | | | |
Cost of revenues | | $ | 183 | | $ | 272 | | $ | 213 | |
Sales and marketing | | 1,361 | | 1,741 | | 1,221 | |
Research and development | | 730 | | 1,512 | | 899 | |
General and administrative | | 5,068 | | 2,831 | | 2,201 | |
| | | | | | | | | | |
The accompanying notes are an integral part of these financial statements.
44
Table of Contents
EPOCRATES, INC.
CONSOLIDATED STATEMENTS OF CHANGES IN MANDATORILY REDEEMABLE CONVERTIBLE PREFERRED STOCK AND STOCKHOLDERS’ EQUITY (DEFICIT) AND COMPREHENSIVE INCOME (LOSS)
(in thousands)
| | Mandatorily | | | | | | | | | | | | Accumulated | | | | | | | |
| | Redeemable Convertible | | | | | | | | Additional | | Deferred | | Other | | | | Total | | | |
| | Preferred Stock | | Common Stock | | Treasury | | Paid-In | | Stock-Based | | Comprehensive | | Accumulated | | Stockholders’ | | Comprehensive | |
| | Shares | | Amount | | Shares | | Amount | | Stock | | Capital | | Compensation | | Income (Loss) | | Deficit | | Equity (Deficit) | | Income (Loss) | |
Balance at January 1, 2009 | | 13,142 | | $ | 67,662 | | 7,937 | | $ | 8 | | $ | — | | $ | 4,027 | | $ | (14 | ) | $ | — | | $ | (44,088 | ) | $ | (40,067 | ) | | |
Issuance of common stock upon exercise of stock options | | — | | — | | 294 | | — | | — | | 941 | | — | | — | | — | | 941 | | | |
Issuance of common stock upon release of RSUs | | — | | — | | 13 | | — | | — | | — | | — | | — | | — | | — | | | |
Stock-based compensation expense | | — | | — | | — | | — | | — | | 4,760 | | — | | — | | — | | 4,760 | | | |
Amortization of deferred stock-based compensation | | — | | — | | — | | — | | — | | (240 | ) | — | | — | | — | | (240 | ) | | |
Adjustment to deferred stock-based compensation for terminations | | — | | — | | — | | — | | — | | — | | 14 | | — | | — | | 14 | | | |
Unrealized loss on available-for-sale securities | | — | | — | | — | | — | | — | | — | | — | | (1 | ) | — | | (1 | ) | (1 | ) |
Purchase of treasury stock | | — | | — | | — | | — | | (7,928 | ) | — | | — | | — | | — | | (7,928 | ) | | |
Retirement of treasury stock | | — | | — | | (735 | ) | — | | 7,928 | | (395 | ) | — | | — | | (7,533 | ) | — | | | |
Accrued dividend on Series B mandatorily redeemable convertible preferred stock | | — | | 2,840 | | — | | — | | — | | (2,840 | ) | — | | — | | — | | (2,840 | ) | | |
Excess tax benefit from stock-based compensation awards | | — | | — | | — | | — | | — | | 38 | | — | | — | | — | | 38 | | | |
Net income | | — | | — | | — | | — | | — | | — | | — | | — | | 7,659 | | 7,659 | | 7,659 | |
Comprehensive income | | — | | — | | — | | — | | — | | — | | — | | — | | — | | | | $ | 7,658 | |
Balance at December 31, 2009 | | 13,142 | | $ | 70,502 | | 7,509 | | $ | 8 | | $ | — | | $ | 6,291 | | $ | — | | $ | (1 | ) | $ | (43,962 | ) | $ | (37,664 | ) | | |
Issuance of common stock upon exercise of stock options | | — | | — | | 663 | | — | | — | | 2,680 | | — | | — | | — | | 2,680 | | | |
Stock-based compensation expense | | — | | — | | — | | — | | — | | 5,962 | | — | | — | | — | | 5,962 | | | |
Stock compensation associated with outstanding repriced options | | — | | — | | — | | — | | — | | 394 | | — | | — | | — | | 394 | | | |
Purchase of treasury stock | | — | | — | | (120 | ) | — | | (3,491 | ) | — | | — | | — | | — | | (3,491 | ) | | |
Retirement of treasury stock | | — | | — | | (250 | ) | — | | 3,491 | | (895 | ) | — | | — | | (2,596 | ) | — | | | |
Accrued dividend on Series B mandatorily redeemable convertible preferred stock | | — | | 2,840 | | — | | — | | — | | (2,840 | ) | — | | — | | — | | (2,840 | ) | | |
Excess tax benefit from stock-based compensation awards | | — | | — | | — | | — | | — | | 319 | | — | | — | | — | | 319 | | | |
Net income | | — | | — | | — | | — | | — | | — | | — | | — | | 3,803 | | 3,803 | | 3,803 | |
Comprehensive income | | — | | — | | — | | — | | — | | — | | — | | — | | — | | — | | $ | 3,803 | |
Balance at December 31, 2010 | | 13,142 | | $ | 73,342 | | 7,802 | | $ | 8 | | $ | — | | $ | 11,911 | | $ | — | | $ | (1 | ) | $ | (42,755 | ) | $ | (30,837 | ) | | |
Issuance of common stock in an initial public offering (“IPO”), net of discounts and issuance costs | | — | | — | | 4,378 | | 4 | | — | | 62,159 | | — | | — | | — | | 62,163 | | | |
Accrued dividend on Series B mandatorily redeemable convertible preferred stock | | — | | 255 | | — | | — | | — | | (255 | ) | — | | — | | — | | (255 | ) | | |
Payment of accrued dividends on Series B mandatorily redeemable convertible preferred stock | | — | | (29,586 | ) | — | | — | | — | | — | | — | | — | | — | | — | | | |
Conversion of mandatorily redeemable convertible preferred stock to common stock in conjunction with the IPO | | (13,142 | ) | (44,011 | ) | 11,089 | | 11 | | — | | 44,000 | | — | | — | | — | | 44,011 | | | |
Conversion of preferred stock warrant to common stock warrant | | — | | — | | — | | — | | — | | 140 | | — | | — | | — | | 140 | | | |
Issuance of common stock upon exercise of stock options | | — | | — | | 1,084 | | 1 | | — | | 3,483 | | — | | — | | — | | 3,484 | | | |
Issuance of common stock upon release of RSUs | | — | | — | | 17 | | — | | — | | — | | — | | — | | — | | — | | | |
Stock-based compensation expense | | — | | — | | — | | — | | — | | 7,935 | | — | | — | | — | | 7,935 | | | |
Stock compensation associated with outstanding repriced options | | — | | — | | — | | — | | — | | (463 | ) | — | | — | | — | | (463 | ) | | |
Unrealized loss on available-for-sale securities | | — | | — | | — | | — | | — | | — | | — | | (1 | ) | — | | (1 | ) | (1 | ) |
Excess tax benefit from stock-based compensation awards | | — | | — | | — | | — | | — | | 328 | | — | | — | | — | | 328 | | | |
Net loss | | — | | — | | — | | — | | — | | — | | — | | — | | (3,573 | ) | (3,573 | ) | (3,573 | ) |
Comprehensive loss | | — | | — | | — | | — | | — | | — | | — | | — | | — | | — | | $ | (3,574 | ) |
Balance at December 31, 2011 | | — | | $ | — | | 24,370 | | $ | 24 | | $ | — | | $ | 129,238 | | $ | — | | $ | (2 | ) | $ | (46,328 | ) | $ | 82,932 | | | |
The accompanying notes are an integral part of these financial statements.
45
Table of Contents
EPOCRATES, INC.
CONSOLIDATED STATEMENTS OF CASH FLOWS
(in thousands)
| | Years Ended December 31, | |
| | 2011 | | 2010 | | 2009 | |
| | | | | | | |
Cash flows from operating activities: | | | | | | | |
Net (loss) income | | $ | (3,573 | ) | $ | 3,803 | | $ | 7,659 | |
Adjustments to reconcile net (loss) income to net cash provided by operating activities: | | | | | | | |
Stock-based compensation | | 7,342 | | 6,356 | | 4,534 | |
Depreciation and amortization | | 4,557 | | 3,083 | | 2,889 | |
Amortization of intangible assets | | 4,181 | | 1,319 | | — | |
Allowance for doubtful accounts and sales returns reserve | | (56 | ) | 119 | | (5 | ) |
Loss on write-off of property and equipment | | 187 | | — | | — | |
Facilities exit costs | | 618 | | — | | — | |
Impairment of long-lived assets and goodwill | | 8,501 | | — | | — | |
Change in carrying value of preferred stock liability | | — | | 33 | | (16 | ) |
Excess tax benefit from stock-based compensation awards | | (328 | ) | (319 | ) | (38 | ) |
Gain on settlement and change in fair value of contingent consideration | | (8,145 | ) | (1,034 | ) | — | |
Gain on sale-leaseback of building | | — | | (1,689 | ) | — | |
Changes in assets and liabilities, net of effect of acquisitions: | | | | | | | |
Accounts receivable | | (1,591 | ) | (3,911 | ) | (4,978 | ) |
Deferred tax asset, current and non-current | | (2,920 | ) | 4,495 | | 5,841 | |
Prepaid expenses and other assets | | 797 | | (1,165 | ) | (1,447 | ) |
Accounts payable | | 27 | | 1,210 | | (523 | ) |
Deferred revenue | | (379 | ) | (7,464 | ) | 3,869 | |
Other accrued liabilities and other payables | | (399 | ) | 4,276 | | (767 | ) |
Net cash provided by operating activities | | 8,819 | | 9,112 | | 17,018 | |
| | | | | | | |
Cash flows from investing activities: | | | | | | | |
Capital expenditures | | (10,064 | ) | (4,657 | ) | (2,613 | ) |
Business acquisitions | | — | | (14,600 | ) | (400 | ) |
Purchase of short-term investments | | (24,849 | ) | (27,793 | ) | (4,426 | ) |
Sale of short-term investments | | 8,590 | | 1,797 | | — | |
Decrease in restricted cash | | 500 | | — | | — | |
Maturity of short-term investments | | 24,800 | | 11,725 | | — | |
Net cash used in investing activities | | (1,023 | ) | (33,528 | ) | (7,439 | ) |
| | | | | | | |
Cash flows from financing activities: | | | | | | | |
Proceeds from issuance of common stock in an initial public offering | | 64,188 | | — | | — | |
Payment of accrued dividends on Series B mandatorily redeemable convertible preferred stock | | (29,586 | ) | — | | — | |
Payment and settlement of contingent consideration | | (6,871 | ) | — | | — | |
Acquisition of common stock | | — | | (3,491 | ) | (7,928 | ) |
Excess tax benefit from stock-based compensation awards | | 328 | | 319 | | 38 | |
Proceeds from exercise of common stock options | | 3,484 | | 2,680 | | 941 | |
Net cash provided by (used in) financing activities | | 31,543 | | (492 | ) | (6,949 | ) |
| | | | | | | |
Net increase (decrease) in cash and cash equivalents | | 39,339 | | (24,908 | ) | 2,630 | |
Cash and cash equivalents at beginning of period | | 35,987 | | 60,895 | | 58,265 | |
Cash and cash equivalents at end of period | | $ | 75,326 | | $ | 35,987 | | $ | 60,895 | |
| | | | | | | |
Supplemental Disclosures: | | | | | | | |
Cash paid for income taxes | | $ | 691 | | $ | — | | $ | 2,444 | |
Cash refunded for income taxes | | (293 | ) | (969 | ) | — | |
Cash paid for interest | | — | | 214 | | 855 | |
| | | | | | | |
Non-Cash Investing and Financing Activities: | | | | | | | |
Retirement of treasury stock | | — | | 2,596 | | 7,533 | |
Unrealized gain (loss) on available-for-sale securities, net of tax effect | | (1 | ) | — | | (1 | ) |
Dividend accrued on Series B mandatorily redeemable convertible preferred stock | | 255 | | 2,840 | | 2,840 | |
Accrued purchase of property and equipment and other assets | | 62 | | (843 | ) | — | |
Contingent consideration recorded in connection with business acquisitions | | — | | 14,750 | | 1,300 | |
Conversion of mandatorily redeemable convertible preferred stock into common shares | | 44,011 | | — | | — | |
Reclass of common stock issuance costs from prepaid expenses to additional paid-in-capital | | 2,025 | | — | | — | |
The accompanying notes are an integral part of these financial statements.
46
Table of Contents
EPOCRATES, INC.
NOTES TO CONSOLIDATED FINANCIAL STATEMENTS
1. Background
Epocrates, Inc. (the “Company” or “Epocrates”) was incorporated in California in August 1998 as nCircle Communications, Inc. In September 1999, the Company changed its name to ePocrates, Inc. and in May 2006, the Company reincorporated in Delaware and changed its name to Epocrates, Inc.
The Company is a leading provider of subscriptions for mobile drug reference tools and electronic health records to healthcare professionals and interactive services to the healthcare industry. Most commonly used on mobile devices at the point of care, the Company’s products help healthcare professionals make more informed prescribing decisions, enhance patient safety and improve practice productivity. Through the Company’s interactive services, it provides the healthcare industry, primarily pharmaceutical companies, access to its user network to deliver targeted information and conduct market research in a cost-effective manner.
Initial Public Offering (“IPO”)
On February 1, 2011, the Company’s registration statement on Form S-1 (File No. 333-168176) was declared effective for its initial public offering (“IPO”) pursuant to which it registered the offering and sale of 5,360,000 shares of common stock at a public offering price of $16.00 per share and an aggregate offering price of $85.8 million, of which 3,574,285 shares were sold by the Company for an aggregate offering price of $57.2 million, and 1,785,715 shares were sold by the selling stockholders for an aggregate offering price of $28.6 million. On February 3, 2011, the overallotment option of 804,000 shares was exercised at a price of $16.00 per share for an aggregate of $12.9 million, all of which were sold by the Company, and the offering was completed with all of the shares subject to the registration statement having been sold.
As a result of the Company’s IPO and the exercise of the overallotment option on February 3, 2011, both of which closed on February 7, 2011, the Company received net proceeds of approximately $62.2 million, after underwriting discounts and commissions of $4.9 million. In addition, the Company incurred other costs associated with its IPO of approximately $3.0 million. From these proceeds, aggregate cumulative dividends to the holders of Epocrates’ Series B preferred stock were paid in full, in the amount of approximately $29.6 million. Upon the consummation of the IPO, the outstanding shares of the Company’s preferred stock were converted into an aggregate of 11,089,201 shares of common stock.
After the completion of the IPO on February 7, 2011, the Company amended its certificate of incorporation and increased its authorized number of shares of common stock to 100,000,000 and reduced the authorized number of shares of preferred stock to 10,000,000. The Company also established the par value of each share of common and preferred stock to be $0.001 per share.
Common Stock Split
An Amended and Restated Certificate of Incorporation for a 1-for-0.786 reverse split approved by the Company’s Board of Directors on November 18, 2010 was filed with the Delaware Secretary of State on January 28, 2011 and was effected upon the closing of the IPO. All information related to common stock, stock options, restricted stock units and earnings per share, as well as all references to preferred stock or preferred stock warrants as converted into common stock, has been retroactively adjusted to give effect to the reverse split.
2. Summary of Significant Accounting Policies
Accounting Estimates
The preparation of financial statements in conformity with generally accepted accounting principles (“GAAP”) in the United States requires management to make certain estimates and assumptions that affect the amounts reported in the financial statements and accompanying notes. The Company is subject to uncertainties such as the impact of future events, economic and political factors and changes in the Company’s business environment; therefore, actual results could differ from these estimates. Accordingly, the accounting estimates used in the preparation of the Company’s financial statements will change as new events occur, as more experience is acquired, as additional information is obtained and as the Company’s operating environment changes. Changes in estimates are made when circumstances warrant. Such changes in estimates and refinements
47
Table of Contents
in estimation methodologies are reflected in reported results of operations and if material, the effects of changes in estimates are disclosed in the notes to the financial statements. Significant estimates and assumptions by management affect revenue recognition, the allowance for doubtful accounts, the subscription cancellations reserve, the carrying value of long-lived assets and goodwill, the depreciation and amortization period of long-lived assets, the provision for income taxes and related deferred tax accounts, the sales tax accrual, the build-out of the Company’s San Mateo facility, accounting for business combinations, stock-based compensation and the fair value of the Company’s common stock and fair value of contingent consideration.
Cash and Cash Equivalents
The Company considers all highly liquid investments with an original or remaining maturity from the Company’s date of purchase of 90 days or less to be cash equivalents. Cash and cash equivalents were $75.3 million and $36.0 million as of December 31, 2011 and 2010, respectively.
Restricted Cash
As of December 31, 2011, the Company had no restricted cash. As of December 31, 2010 restricted cash totaled $0.5 million related to an agreement with the Company’s merchant card provider. This balance is recorded within other assets on the balance sheet.
Short-Term Investments
The Company has classified its short-term investments as available-for-sale securities. Epocrates may sell these securities at any time for use in current operations or other purposes, including as consideration for acquisitions and strategic investments. These securities are reported at fair value with any changes in market value reported as a part of comprehensive income.
Fair Value of Financial Instruments
The Company’s financial instruments, including cash and cash equivalents, accounts receivable and accounts payable, are carried at cost, which approximates fair value because of the short-term nature of those instruments. The carrying value of the common stock warrant liability, which converted from a preferred stock warrant liability in 2011, (see Note 11 – Mandatorily Redeemable Convertible Preferred Stock) and contingent consideration (see Note 6 – Acquisitions) represents fair value. Based on borrowing rates available to the Company for loans with similar terms, the carrying value of borrowings, including the financing liability (see Note 8 – Financing Liability), approximate fair value.
The Company measures and reports certain financial assets at fair value on a recurring basis, including its investments in money market funds and available-for-sale securities. The fair value hierarchy prioritizes the inputs into three broad levels:
Level 1 – Inputs are unadjusted quoted prices in active markets for identical assets or liabilities.
Level 2 – Inputs are quoted prices for similar assets and liabilities in active markets or inputs that are observable for the asset or liability, either directly or indirectly through market corroboration, for substantially the full term of the financial instrument.
Level 3 – Inputs are unobservable inputs based on the Company’s assumptions.
Concentration of Credit Risk
Financial instruments that potentially subject the Company to credit risk consist principally of cash, cash equivalents, short-term investments and accounts receivable.
The Company limits its concentration of risk in cash equivalents and short-term investments by diversifying its investments among a variety of industries and issuers and by limiting the average maturity to less than one year. The primary goals of the Company’s investment policy are, in order of priority, preservation of principal, liquidity and current income. The Company’s professional portfolio managers adhere to this investment policy as approved by the Company’s Board of Directors.
The Company’s investment policy is to invest only in fixed income instruments denominated and payable in U.S. dollars. Investment in obligations of the U.S. government and its agencies, money market instruments, commercial paper, certificates of deposit, bankers’ acceptances, corporate bonds of U.S. companies, municipal securities and asset backed securities are allowed. The Company does not invest in auction rate securities, futures contracts, or hedging instruments. Securities of a single issuer
48
Table of Contents
valued at cost at the time of purchase, should not exceed 5% of the market value of the portfolio or $1 million, whichever is greater, but securities issued by the U.S. Treasury and U.S. government agencies are specifically exempted from these restrictions. Issue size should normally be greater than $50 million for corporate bonds. No single position in any issue will equal more than 10% of that issue. The final maturity of each security within the portfolio shall not exceed 24 months.
The Company’s revenue is derived primarily from clients in the healthcare industry (pharmaceutical companies, managed care companies and market research firms) within the United States. For the years ended December 31, 2011, 2010, and 2009, no single customer accounted for more than 10% of total revenues, net. One customer accounted for 15% and no single customer accounted for more than 10% of the net accounts receivable as of December 31, 2011 and 2010, respectively.
Allowance for Doubtful Accounts
The allowance for doubtful accounts reflects the Company’s best estimate of probable losses inherent in the Company’s receivables portfolio determined on the basis of historical experience, specific allowances for known troubled accounts and other currently available evidence. Historically, the Company has not experienced significant credit losses from its accounts receivable. The Company performs a regular review of its customers’ payment histories and associated credit risks and it does not require collateral from its customers.
Property and Equipment
Property and equipment, including equipment under capital leases, are stated at historical cost less accumulated depreciation and amortization. Depreciation and amortization expense is computed using the straight-line method over the estimated useful lives of the related assets. The useful lives of the property and equipment are as follows:
Computer equipment | | 36 months |
Office equipment, furniture and fixtures | | 36 – 44 months |
Software | | 36 months |
Leasehold improvements | | Shorter of useful life or lease term |
Upon retirement or sale, the cost and related accumulated depreciation are removed from the balance sheet and the resulting gain or loss is reflected in operations. Major additions and improvements are capitalized while repairs and maintenance that do not extend the life of the asset are charged to operations as incurred. Depreciation and amortization expense is allocated to both cost of revenues and operating expenses.
Software Development Costs
Software development costs incurred in conjunction with product development are charged to research and development expense until technological feasibility is established. Thereafter, until the product is released for sale, software development costs are capitalized and reported at the lower of unamortized cost or net realizable value of the related product. The Company does not consider a product in development to have passed the technological feasibility milestone until the Company has completed a model of the product that contains essentially all the functionality and features of the final product and has tested the model to ensure that it works as expected. Prior to 2011, the Company had not incurred significant costs between the establishment of technological feasibility and the release of a product for sale. Thus, the Company had historically expensed all software development costs as incurred. During the year ended December 31, 2011, the Company capitalized software development costs of approximately $5.1 million relating to the Electronic Health Record (“EHR”) solution.
The Company entered a controlled release of its EHR product in July 2011 and commenced amortization of the capitalized software development costs. Amortization of capitalized software development costs was $0.3 million during the year ended December 31, 2011. The market for EHR products has been competitive and the Company did not generate significant revenues from its EHR product during the year ended December 31, 2011. On February 24, 2012, the Board of Directors of Epocrates approved the discontinuation of further development of Epocrates’ EHR product. In connection with this decision, the Company recorded an impairment charge of $4.8 million associated with the EHR capitalized software development costs; this charge is recorded in Impairment of Long-lived assets and Goodwill in the Company’s consolidated statements of operations.
49
Table of Contents
Internal Use Software and Website Development Costs
With regard to software developed for internal use and website development costs, the Company expenses all costs incurred that relate to planning and post-implementation phases of development. Costs incurred in the development phase are capitalized and amortized over the product’s estimated useful life which is generally three years. During the years ended December 31, 2011 and 2010, the Company capitalized $2.4 million and $2.6 million of software development costs related to software for internal use, respectively. Internal software development costs are generally amortized on a straight-line basis over three years beginning with the date the software is placed into service. Amortization of software developed for internal use was $2.0 million, $1.7 million and $1.4 million for the years ended December 31, 2011, 2010 and 2009, respectively. Amortization of internal use software is reflected in cost of revenue. Costs associated with minor enhancement and maintenance of the Company’s website are expensed as incurred.
As discussed above, the Company plans to discontinue further development of the EHR business, and therefore re-evaluated all EHR assets for potential impairment. The EHR business had $1.9 million of net capitalized software for internal use as of December 31, 2011. The Company determined that all EHR assets that could not be redeployed should be written down from their carrying values to an estimated fair value of zero. The Company recorded a $1.9 million impairment charge for the year ended December 31, 2011 related to capitalized software for internal use. This charge is recorded within Impairment of Long-lived Assets and Goodwill in the Company’s consolidated statements of operations.
Goodwill
Goodwill is tested for impairment at the reporting unit level on an annual basis and whenever events or changes in circumstances indicate the carrying value may not be recoverable. Application of the goodwill impairment test requires judgment, including the identification of reporting units, assigning assets and liabilities to reporting units, assigning goodwill to reporting units and determining the fair value of each reporting unit. Significant judgments required to estimate the fair value of reporting units include estimating future cash flows and determining appropriate discount and growth rates and other assumptions. Changes in these estimates and assumptions could materially affect the determination of fair value for each reporting unit which could trigger impairment.
For the subscriptions and interactive services reporting unit, the Company performed its annual impairment tests in December 2011 and 2010 and determined that the undiscounted cash flow from the long-range forecast exceeded the carrying amount of goodwill in both years, and therefore, no impairment was indicated. The Company has determined that a 10% change in the future undiscounted cash flows as of the date of its most recent goodwill impairment test would not have changed the outcome of the test for the subscriptions and interactive services reporting unit.
The EHR reporting unit included goodwill of $1.1 million that was recorded in conjunction with the acquisition of Caretools, Inc. In conducting the annual impairment test for 2011, the Company took into account that it had only recently entered a controlled release of its EHR product and that its revenue and subscriber estimates had not materialized. Based on the factors outlined above, the Company compared the fair value of the goodwill assigned to the EHR reporting unit against its carrying value. As a result of this analysis, the Company determined that the carrying value of the EHR goodwill exceeded its fair value at December 31, 2011 and recorded an impairment charge of $1.1 million to write down the carrying value of the goodwill associated with the EHR business to an estimated fair value of zero. The impairment charge is recorded in Impairment of Long-lived Assets and Goodwill in the Company’s consolidated statements of operations.
Impairment of Long-lived Assets
The Company evaluates long-lived assets for potential impairment whenever adverse events or changes in circumstances or business climate indicate that expected undiscounted future cash flows related to such long-lived assets may not be sufficient to support the net book value of such assets. An impairment charge exists when the carrying value of a long-lived asset exceeds its fair value. An impairment loss is recognized only if the carrying value of a long-lived asset is not recoverable and exceeds its fair value. The carrying value of a long-lived asset is not recoverable if it exceeds the sum of the undiscounted cash flows expected to result from the use and eventual disposition of the asset. There were no such impairment losses during the years ended December 31, 2010 or 2009.
As discussed earlier, the Company determined that revenue and subscriber estimates for its EHR offering had not materialized and has discontinued further development of the EHR product and business. There is no assurance that the Company will be able to sell its EHR assets. Therefore, the carrying value of these assets was written down to an estimated fair value of zero.
50
Table of Contents
Freestanding Preferred Stock Warrants
Freestanding warrants that are related to the Company’s Convertible Preferred Stock were classified as liabilities on the Company’s balance sheet through the year ended December 31, 2010. The warrants were subject to reassessment at each balance sheet date, and any change in fair value was recognized as a component of other income (expense), net. The Company adjusted the liability for changes in fair value until the completion of its IPO which closed on February 7, 2011, at which time all preferred stock warrants were converted into warrants to purchase common stock, and accordingly, the liability was reclassified to stockholders’ equity (deficit).
Revenue Recognition
Stand-Alone Sales of Premium Subscriptions Services. The majority of healthcare professionals in the Company’s network uses its free products and do not purchase any of the Company’s premium subscriptions. The Company generates revenue from the sale of premium subscription products. Subscription options include:
· a subscription to one of three premium mobile products the Company offers that a user downloads to their mobile device;
· a subscription to the Company’s premium online product or site licenses for access via the Internet on a desktop or laptop; and
· license codes that can be redeemed for such mobile or online premium products.
Mobile subscription services and license codes contain elements of software code that reside on a mobile device and are essential to the functionality of the service being provided. For these services, revenue is recognized only when:
· there is persuasive evidence that an arrangement exists, in the form of a written contract, amendments to that contract, or purchase orders from a third party;
· delivery has occurred or services have been rendered;
· the price is fixed or determinable after evaluating the risk of concession; and
· collectability is probable based on customer creditworthiness and past history of collection.
Online products and site licenses do not contain any software elements that are essential to the services being provided. For these services, revenue is recognized using the same criteria as above, however collectability only need be reasonably assured. When collectability is not reasonably assured, revenue is deferred until collection.
Subscriptions are recognized as revenue ratably over the term of the subscription as services are delivered. Billings for subscriptions typically occur in advance of services being performed; therefore these amounts are recorded as deferred revenue when billed. A license code allows a holder to redeem the code for a subscription. Typically, license codes must be redeemed within six to twelve months of issuance. When a license code is redeemed for a premium mobile product, revenue is recognized ratably over the term of the subscription. If a license code expires before it is redeemed, revenue is recognized upon expiration.
Extended payment terms beyond standard terms may cause a deferral of revenue until such amounts become due. Allowances are established for uncollectible amounts and potential returns based on historical experience.
If a paid user is unsatisfied for any reason during the first 30 days of the subscription and wishes to cancel the subscription, the Company provides a refund. The Company records a reserve based on estimated future cancellations using historical data. To date, such returns reserve has not been material and has been within management’s expectations.
51
Table of Contents
Stand-Alone Sales of Interactive Services. The Company also generates revenue by providing healthcare companies with interactive services through targeted access to its user network through interactive services. These services include DocAlert clinical messaging services, virtual representative services, Epocrates market research services, formulary hosting services and mobile resource centers.
Interactive services do not contain any software elements that are essential to the services being provided; therefore, revenue is recognized when:
· there is persuasive evidence that an arrangement exists, in the form of a written contract, amendments to that contract, or purchase orders from a third party;
· delivery has occurred or services have been rendered;
· the price is fixed or determinable after evaluating the risk of concession; and
· collectability is reasonably assured based on customer creditworthiness and past history of collection.
DocAlert Clinical Messaging Services. DocAlert messages are short clinical alerts delivered to the Company’s users when they connect with the Company’s databases to receive updated content. Most of these DocAlert messages are not sponsored and include useful information for recipients such as new clinical studies, practice management information and industry guidelines. The balance of DocAlert messages are sponsored by the Company’s clients. Messages are targeted to all or a subset of physicians to increase the value and relevance to recipients. Clients contract with the Company to publish an agreed upon number of DocAlert messages over the contract period, typically one year. Each sponsored message is available to users for four weeks. Typically, clients are billed a portion of the contracted fee upon signing of the contract with the balance billed upon one or more future milestones. Because billings for clinical messaging services typically occur in advance of services being performed, these amounts are recorded as deferred revenue when billed. The messages to be delivered can be either asymmetrical, that is each message is delivered to a different target group of users, or symmetrical, that is each message is delivered to the same target group of users. As discussed in detail under multiple element arrangements below, for contracts signed or materially modified on or after January 1, 2009, the Company allocates consideration to each message based on the Company’s best estimate of sales price (“BESP”), and recognizes revenue ratably over the delivery period of each message. As it relates to contracts signed prior to January 1, 2009, the Company has not established vendor objective evidence (“VOE”) of fair value for DocAlert messages. Therefore, for those contracts signed prior to January 1, 2009, revenue in asymmetrical arrangements is recognized over the delivery period of the last contracted message, or if the Company’s client does not provide all such messages to the Company, upon expiration of the contract. Revenue for symmetrical agreements is recognized ratably over the delivery period of each symmetrical message because despite not being able to demonstrate VOE of fair value for each individual message, each message is of equal value to the client because the target audience for each message is the same.
Virtual Representative Services. The Company’s mobile promotional programs are designed to supplement and replicate the traditional sales model with services typically provided during representative interactions – product detailing, drug sample delivery, patient literature delivery and drug coverage updates. The Company’s pharmaceutical clients contract with the Company to make one or more of these services available to its users for a period of time, usually one year. Typically, clients are billed a portion of the contracted fee upon signing of the contract with the balance billed upon one or more future milestones. Because billings for virtual representative services typically occur in advance of services being performed, these amounts are recorded as deferred revenue when billed. Revenue is recognized ratably over the contracted term.
Epocrates Honors Market Research Services. The Company recruits healthcare professionals to participate in market research activities. Concurrently, this service offers market research specialists, marketers and investors the opportunity to survey their target audience. Typically, a customer will pay the Company a fee for access to a targeted group of its users whom they wish to survey. The Company pays a portion of this fee to the survey participants as an honoraria. Upon completion of the survey, which typically runs for about a month, the Company will bill the customer the entire amount due. The Company has concluded that it acts as the primary obligor. Accordingly, the Company recognizes the entire fee paid by its customers as revenue upon confirmation of completion of the survey, and the compensation paid by the Company to survey participants is recorded as a cost of revenue when earned by the participant.
Formulary Hosting Services. Healthcare professionals have the option to download health plan formulary lists for their geographic area or patient demographic at no cost. Clients, usually health insurance providers, contract with the Company to make their formulary available to the Company’s user base, typically for a one to three year period. Clients are typically billed
52
Table of Contents
up front on a quarterly or an annual basis. Because billings for formulary services typically occur in advance of services being performed, these amounts are recorded as deferred revenue when billed. Revenue is recognized ratably over the term of the contract.
Mobile Resource Centers. This educational service allows healthcare professionals to stay current on clinical developments for a variety of disease conditions and topics. Sponsored by a pharmaceutical company, each resource center is developed in conjunction with a key opinion leader for that specific disease or condition. Clients, usually pharmaceutical companies, contract with the Company to host a mobile resource center and make it available to its users for a one-year period. Clients are typically billed half of the contracted fee upon signing the contract with the balance being billed 90 days after the contract is signed. Because billings for sponsored content typically occur in advance of services being performed, these amounts are recorded as deferred revenue when billed. Revenue is recognized ratably over the contracted term.
Commission and royalty costs associated with products sold are expensed as incurred.
Multiple Element Arrangements Signed On or After January 1, 2009. The Company often enters into arrangements that contain various combinations of services from the above described subscriptions and interactive services. The customer is typically charged a fee for the entire group of services to be provided. Clients are typically billed half of the contracted fee upon signing the contract with the balance being billed 90 days after the contract is signed. Each element typically has a delivery period of one year, but the various elements may or may not be delivered concurrently.
In October 2009, the Financial Accounting Standards Board (“FASB”) amended the accounting standards for multiple deliverable revenue arrangements to:
· provide updated guidance on whether multiple deliverables exist, how the deliverables in an arrangement should be separated and how the consideration should be allocated;
· require an entity to allocate revenue in an arrangement using BESP if a vendor does not have vendor specific objective evidence (“VSOE”) of fair value or third party evidence (“TPE”) of fair value; and
· eliminate the use of the residual method and require an entity to allocate revenue using the relative selling price method. The Company elected to early adopt this accounting guidance as of January 1, 2009.
The new guidance does not change the units of accounting for the Company’s revenue transactions. However, prior to adopting this new guidance, revenue for some delivered items was often deferred until certain other deliverables completed their delivery. Under the new guidance, if the Company cannot establish VSOE of fair value, the Company should then determine if it can establish TPE of fair value. TPE is determined based on competitor prices for similar deliverables when sold separately. The Company’s services differ significantly from that of its peers and its offerings contain a significant level of customization and differentiation such that the comparable pricing of products with similar functionality cannot be obtained. Furthermore, the Company is unable to reliably determine what similar competitor products’ selling prices are on a stand-alone basis. Therefore, the Company is typically not able to determine TPE.
If both VSOE and TPE do not exist, the Company then uses BESP to establish fair value and to allocate total consideration to each element in the arrangement and consideration related to each element is then recognized ratably over the delivery period of each element. Any discount or premium inherent in the arrangement is allocated to each element in the arrangement based on the relative fair value of each element.
The objective of BESP is to determine the price at which the Company would transact a sale if the product or service were sold on a stand-alone basis. The Company determines BESP for a product or service by considering multiple factors including an analysis of recent stand-alone sales of that product, market conditions, competitive landscape, internal costs, gross margin objectives and pricing practices. As these factors are mostly subjective, the determination of BESP requires significant judgment. If the Company had chosen different values for BESP, the Company’s revenue and deferred revenue could have been materially different.
The Company has established a hierarchy to determine BESP. First, the Company considers recent stand-alone sales of each product. If the quantity of stand-alone sales is not substantive, the Company calculates BESP as a percentage discount off of the approved selling price as established by the Company’s pricing committee. This discount is calculated as the average discount in recent deals where the product was bundled with other products. If there are not a substantive number of deals where the product was bundled with other products, the Company uses the approved selling price as established by the Company’s pricing
53
Table of Contents
committee until the Company has sufficient history of transactions to compute BESP using either the stand-alone or bundled methodology discussed above.
Net revenue as reported and net revenue that would have been reported during the year ended December 31, 2009, had the Company not adopted the new guidance (pro forma basis) is shown in the following table (in thousands):
| | As Reported | | Pro Forma Basis | |
Total revenues, net | | $ | 93,654 | | $ | 91,595 | |
| | | | | | | |
Multiple Element Arrangements Signed Prior to January 1, 2009. For contracts that were signed prior to January 1, 2009 that were not materially modified after January 1, 2009, the Company used and continues to use the prior revenue recognition guidance. Under this guidance, if VSOE or VOE of fair value exists for the last undelivered element, the Company applies the residual method whereby only the fair value of the undelivered element is deferred and the remaining residual fee is recognized when delivered. If VSOE or VOE of fair value does not exist for the last undelivered element, the entire fee is recognized over the period of delivery of the last undelivered element.
VSOE of fair value has been established for subscriptions to the Company’s mobile premium products and license codes and represents the price charged when that element is sold separately. VOE of fair value for online premium product subscriptions, site licenses and interactive services is also established based on the price paid when such services are sold separately. To date, VOE of fair value for online premium product subscriptions or site licenses has not been established nor has VOE of fair value been established for interactive services due to the wide variability in the pricing of most interactive services.
Stock-Based Compensation
For options granted on or after January 1, 2006, stock-based compensation is measured at grant date based on the fair value of the award and is expensed on a straight-line basis over the requisite service period. For options granted prior to January 1, 2006, the Company will continue to recognize compensation expense on the remaining unvested awards under the intrinsic value method unless such grants are materially modified.
The Company will only recognize a tax benefit from stock-based awards in additional paid-in capital if an incremental tax benefit is realized after all other tax attributes currently available to the Company have been utilized. In addition, the Company has elected to account for the indirect effects of stock-based awards on other tax attributes, such as the research tax credit, through its statement of operations.
Equity instruments issued to non-employees are recorded at their fair value on the measurement date. The measurement of stock-based compensation is subject to periodic adjustment as the underlying equity instruments vest. The fair value of options granted to consultants is expensed over the vesting period.
Research and Development
Research and development costs are expensed as incurred, except for certain internal use software development costs, which may be capitalized as noted above. Research and development costs include salaries, stock-based compensation expense, benefits and other operating costs such as outside services, supplies and allocated overhead costs.
Advertising
Advertising costs are expensed as incurred and included in sales and marketing expense in the accompanying statements of operations. Advertising expense totaled $0.9 million, $0.7 million and $0.5 million for the years ended December 31, 2011, 2010 and 2009, respectively.
Income Taxes
The Company accounts for income taxes under the liability method. Under this method, deferred tax assets and liabilities are determined based on differences between the financial statement and tax basis of assets and liabilities and net operating loss and credit carryforwards using enacted tax rates in effect for the year in which the differences are expected to reverse. Valuation allowances are established when necessary to reduce deferred tax assets to the amounts expected to be realized.
54
Table of Contents
Sales Taxes
When sales and other taxes are billed, such amounts are recorded as accounts receivable with a corresponding increase to sales tax payable, respectively. The balances are then removed from the balance sheet as cash is collected from the customer and as remitted to the tax authority.
Net (Loss) Income Per Share
Basic (loss) income per share is computed by dividing net (loss) income available to common stockholders by the sum of the weighted average number of common shares outstanding during the period, net of shares subject to repurchase. Net (loss) income available to common stockholders is calculated using the two class method as net (loss) income less the preferred stock dividend for the period less the amount of net (loss) income (if any) allocated to preferred based on weighted preferred stock outstanding during the period relative to total stock outstanding during the period.
Diluted (loss) income per share gives effect to all dilutive potential common shares outstanding during the period. The computation of diluted income per share does not assume conversion, exercise, or contingent exercise of securities that would have an anti-dilutive effect on earnings. The dilutive effect of outstanding stock options, warrants and restricted stock units (“RSUs”) is computed using the treasury stock method.
The following table sets forth the computation of basic and diluted net (loss) income per common share for the years ended December 31, 2011, 2010 and 2009 (in thousands, except per share data):
| | Years Ended December 31, | |
| | 2011 | | 2010 | | 2009 | |
| | | | | | | |
Numerator: | | | | | | | |
Net (loss) income | | $ | (3,573 | ) | $ | 3,803 | | $ | 7,659 | |
Less: Accrued dividend on Series B mandatorily redeemable convertible preferred stock plus an 8% non-cumulative dividend on Series A and Series C mandatorily redeemable convertible preferred stock | | 294 | | 3,523 | | 3,523 | |
Less: Allocation of net income to participating preferred shares | | — | | 167 | | 2,433 | |
Numerator for basic calculation | | (3,867 | ) | 113 | | 1,703 | |
| | | | | | | |
Undistributed earnings re-allocated to common stockholders | | — | | 13 | | 205 | |
| | | | | | | |
Numerator for diluted calculation | | $ | (3,867 | ) | $ | 126 | | $ | 1,908 | |
| | | | | | | |
Denominator: | | | | | | | |
Denominator for basic calculation, weighted average number of common shares outstanding | | 22,297 | | 7,558 | | 7,758 | |
Dilutive effect of stock options, restricted stock units and warrants using the treasury stock method | | — | | 1,587 | | 1,733 | |
Denominator for diluted calculation | | 22,297 | | 9,145 | | 9,491 | |
| | | | | | | |
Net (loss) income per share | | | | | | | |
Basic net (loss) income per common share | | $ | (0.17 | ) | $ | 0.01 | | $ | 0.22 | |
Diluted net (loss) income per common share | | $ | (0.17 | ) | $ | 0.01 | | $ | 0.20 | |
Diluted (loss) income per share would give effect to the dilutive impact of common stock equivalents which consists of convertible preferred stock and stock options and warrants (using the treasury stock method). Dilutive securities have been excluded from the diluted loss per share computations as such securities have an anti-dilutive effect on net (loss) income per share.
For the years ended December 31, 2011, 2010 and 2009, the following securities were not included in the calculation of fully diluted shares outstanding as the effect would have been anti-dilutive (in thousands):
55
Table of Contents
| | Years Ended December 31, | |
| | 2011 | | 2010 | | 2009 | |
| | | | | | | |
Series B preferred stock warrants | | 11 | | 18 | | 18 | |
Outstanding unexercised options and restricted stock units | | 3,034 | | 3,138 | | 2,081 | |
Mandatorily redeemable convertible preferred stock | | 972 | | 13,142 | | 13,142 | |
Total outstanding | | 4,017 | | 16,298 | | 15,241 | |
Comprehensive (Loss) Income
Comprehensive (loss) income consists of two components: net (loss) income and other comprehensive (loss) income. Other comprehensive (loss) income refers to losses or gains that, under GAAP, are recorded as elements of stockholders’ equity (deficit) but are excluded from net (loss) income. The Company’s other comprehensive (loss) income consists of unrealized (losses) gains on available-for-sale securities. Comprehensive (loss) income as of December 31, 2011, 2010 and 2009 consists of the following components, net of related tax effects (in thousands):
| | Years Ended December 31, | |
| | 2011 | | 2010 | | 2009 | |
| | | | | | | |
Net (loss) income | | $ | (3,573 | ) | $ | 3,803 | | $ | 7,659 | |
Change in unrealized (loss) gain on available-for-sale securities, net of tax effect | | (1 | ) | — | | (1 | ) |
Comprehensive (loss) income | | $ | (3,574 | ) | $ | 3,803 | | $ | 7,658 | |
Recently Adopted and Recently Issued Accounting Guidance
In January 2010, the FASB issued revised guidance that expands the disclosure requirements for fair value measurements. New disclosure required under the revised guidance includes information about significant transfers in and out of Level 1 and Level 2 and the reason for such transfers, and inclusion of purchases, sales, issuances and settlements information for Level 3 measurements in the rollforward of activity on a gross basis. This guidance was effective for fiscal years beginning after December 15, 2009. The Company adopted this guidance in the first quarter of 2010. The guidance for the rollforward of activities on a gross basis for Level 3 is effective for fiscal years beginning after December 15, 2010. The Company adopted this guidance in the first quarter of 2011. The adoption did not impact the Company’s results of operations or financial position.
In December 2010, the FASB issued updated accounting guidance related to the calculation of the carrying amount of a reporting unit when performing the first step of a goodwill impairment test. More specifically, this update will require an entity to use an equity premise when performing the first step of a goodwill impairment test, and if a reporting unit has a zero or negative carrying amount, the entity must assess and consider qualitative factors and whether it is more likely than not that a goodwill impairment exists. The new accounting guidance is effective for public entities, for impairment tests performed during entities’ fiscal years (and interim periods within those years) that begin after December 15, 2010. Early adoption is not permitted. The adoption of this guidance did not have any impact on the Company’s results of operations or financial position.
In December 2010, the FASB issued updated accounting guidance to clarify that pro forma disclosures should be presented as if a business combination occurred at the beginning of the prior annual period for purposes of preparing both the current reporting period and the prior reporting period pro forma financial information. These disclosures should be accompanied by a narrative description about the nature and amount of material, non-recurring pro forma adjustments. The new accounting guidance is effective for business combinations consummated in periods beginning after December 15, 2010 and should be applied prospectively as of the date of adoption. Early adoption is permitted. The adoption of this guidance did not have any impact on the Company’s consolidated financial statements as there were no acquisitions completed in 2011.
In May 2011, the FASB issued new accounting guidance that amends some fair value measurement principles and disclosure requirements. The new guidance states that the concepts of highest and best use and valuation premise are only relevant when measuring the fair value of non-financial assets and prohibits the grouping of financial instruments for purposes of determining their fair values when the unit of account is specified in other guidance. Early application is not permitted for public companies. The Company will adopt this guidance upon its effective date for periods beginning after December 15, 2011 and does not anticipate that this adoption will have a significant impact on the Company’s financial position or results of operations.
In June 2011, the FASB issued new disclosure guidance related to the presentation of the Statement of Comprehensive Income. This guidance eliminates the current option to report other comprehensive income and its components in the statement of changes in equity. In December 2011, the FASB issued revised accounting guidance, which deferred the guidance relating to
56
Table of Contents
the presentation of reclassification adjustments. All other requirements of the previously issued guidance were not affected by the issuance of this revised guidance. The Company will adopt this guidance upon its effective date for periods ending on or after December 15, 2011, and does not anticipate that this adoption will have any impact on the Company’s financial position or results of operations.
In September 2011, the FASB issued new accounting guidance intended to simplify goodwill impairment testing. Entities will be allowed to perform a qualitative assessment on goodwill impairment to determine whether a quantitative assessment is necessary. This guidance is effective for the Company’s interim and annual periods beginning January 1, 2012. Early adoption of the standard is permitted. The Company will adopt this standard for the annual period beginning January 1, 2012. The adoption of this guidance is not expected to have a material effect on the Company’s consolidated financial statements.
3. Fair Value Measurements
Fair value is defined as the price that would be received to sell an asset or paid to transfer a liability (the “exit price”) in an orderly transaction between market participants at the measurement date. A three level hierarchy is applied to prioritize the inputs to valuation techniques used to measure fair value. The hierarchy gives the highest priority to unadjusted quoted prices in active markets for identical assets and liabilities (Level 1 measurements) and the lowest priority to unobservable inputs (Level 3 measurements).
The fair value hierarchy prioritizes the inputs into three broad levels:
Level 1 – Inputs are unadjusted quoted prices in active markets for identical assets or liabilities.
Level 2 – Inputs are quoted prices for similar assets and liabilities in active markets or inputs that are observable for the asset or liability, either directly or indirectly through market corroboration, for substantially the full term of the financial instrument.
Level 3 – Inputs are unobservable inputs based on the Company’s assumptions.
The following tables represent the Company’s financial assets and liabilities measured at fair value on a recurring basis as of December 31, 2011 and 2010 and the basis of that measurement (in thousands):
| | Total | | | | | | | |
As of December 31, 2011 | | Fair Value | | Level 1 | | Level 2 | | Level 3 | |
ASSETS | | | | | | | | | |
Cash equivalents | | $ | 10,310 | | $ | 10,035 | | $ | 275 | | $ | — | |
Short-term investments (See Note 4) | | | | | | | | | |
Obligations of U.S. government agencies | | 6,219 | | — | | 6,219 | | — | |
Obligations of U.S. corporations | | 2,630 | | — | | 2,630 | | — | |
Obligations of Non-U.S. corporations | | 1,048 | | — | | 1,048 | | — | |
Total short-term investments | | 9,897 | | — | | 9,897 | | — | |
| | | | | | | | | |
TOTAL FINANCIAL ASSETS | | $ | 20,207 | | $ | 10,035 | | $ | 10,172 | | $ | — | |
| | Total | | | | | | | |
As of December 31, 2010 | | Fair Value | | Level 1 | | Level 2 | | Level 3 | |
ASSETS | | | | | | | | | |
Cash equivalents | | $ | 25,311 | | $ | 24,177 | | $ | 1,134 | | $ | — | |
Short-term investments (See Note 4) | | | | | | | | | |
Obligations of U.S. government agencies | | 10,029 | | — | | 10,029 | | — | |
Obligations of U.S. corporations | | 3,354 | | — | | 3,354 | | — | |
Obligations of Non-U.S. corporations | | 2,114 | | — | | 2,114 | | — | |
Bank certificates of deposit | | 3,200 | | — | | 3,200 | | — | |
Total short-term investments | | 18,697 | | — | | 18,697 | | — | |
| | | | | | | | | |
TOTAL FINANCIAL ASSETS | | $ | 44,008 | | $ | 24,177 | | $ | 19,831 | | $ | — | |
| | | | | | | | | |
LIABILITIES | | | | | | | | | |
Acquisition-related contingent consideration (See Note 6) | | $ | 15,016 | | $ | — | | $ | — | | $ | 15,016 | |
Preferred stock warrant | | 140 | | — | | — | | 140 | |
| | | | | | | | | |
TOTAL FINANCIAL LIABILITIES | | $ | 15,156 | | $ | — | | $ | — | | $ | 15,156 | |
57
Table of Contents
The Company’s financial instruments, including cash and cash equivalents, accounts receivable and accounts payable, are carried at cost, which approximates fair value due to the short-term nature of those instruments. The carrying value of the preferred stock warrant liability (see Note 11 – Mandatorily Redeemable Convertible Preferred Stock) and contingent consideration (see Note 6 – Acquisitions) represents fair value.
During the year ended December 31, 2011, there were no material transfers between Level 1 and Level 2 fair value instruments. There were no transfers of instruments to Level 3, and the only instruments transferred out of Level 3 in 2011 were the preferred stock warrants which were settled. The following table presents a reconciliation of the recurring Level 3 measurements on a gross basis at December 31, 2011 (in thousands):
| | Fair Value Measurements Using | |
| | Significant Unobservable Inputs | |
| | (Level 3) | |
| | Acquisition-Related | | | |
| | Contingent | | Preferred | |
| | Consideration | | Stock Warrant | |
| | | | | |
Balance at January 1, 2011 | | $ | 15,016 | | $ | 140 | |
Settlements | | (6,871 | ) | (140 | ) |
Total gains included in earnings | | (8,145 | ) | — | |
Balance at December 31, 2011 | | $ | — | | $ | — | |
4. Short-Term Investments
Marketable securities are classified as available-for-sale. These securities are reported at fair value with any changes in market value reported as a part of comprehensive income. Premiums (discounts) are amortized (accreted) to interest income over the life of the investment. Marketable securities are classified as short-term investments if the remaining maturity from the date of purchase is in excess of 90 days. Investments with contractual maturities of more than one year are included in current short-term investments since the Company intends to convert them into cash as necessary to meet liquidity needs.
The Company determines the fair value amounts by using available market information. As of December 31, 2011 and 2010, the average portfolio duration was less than six months and the contractual maturity of any single investment did not exceed 12 months.
All short-term investments, except for the money market funds, as of December 31, 2011 and 2010 are considered Level 2 investments under the GAAP fair value hierarchy because the fair value inputs are quoted prices for similar assets and liabilities in active markets or inputs that are observable for the asset or liability, either directly or indirectly through market corroboration, for substantially the full term of the financial instrument.
As of December 31, 2011 and 2010, unrealized gains and losses on available-for-sale securities can be summarized as follows (in thousands):
| | | | Gross | | Gross | | | |
| | Amortized | | Unrealized | | Unrealized | | | |
| | Cost | | Gains | | Losses | | Fair Value | |
Cash, Cash Equivalents and Available-for-Sale Securities | | | | | | | | | |
Obligations of U.S. government agencies | | $ | 6,494 | | $ | 1 | | $ | (1 | ) | $ | 6,494 | |
Obligations of U.S. corporations | | 2,633 | | — | | (3 | ) | 2,630 | |
Obligations of Non-U.S. corporations | | 1,048 | | — | | — | | 1,048 | |
Money market funds | | 10,035 | | — | | — | | 10,035 | |
Cash | | 65,016 | | — | | — | | 65,016 | |
| | $ | 85,226 | | $ | 1 | | $ | (4 | ) | $ | 85,223 | |
| | | | | | | | | |
Amounts included in cash and cash equivalents | | $ | 75,326 | | $ | — | | $ | — | | $ | 75,326 | |
Amounts included in short-term investments | | 9,900 | | 1 | | (4 | ) | 9,897 | |
| | $ | 85,226 | | $ | 1 | | $ | (4 | ) | $ | 85,223 | |
58
Table of Contents
| | | | Gross | | Gross | | | |
| | Amortized | | Unrealized | | Unrealized | | | |
| | Cost | | Gains | | Losses | | Fair Value | |
Cash, Cash Equivalents and Available-for-Sale Securities | | | | | | | | | |
Obligations of U.S. government agencies | | $ | 10,562 | | $ | 2 | | $ | (2 | ) | $ | 10,562 | |
Obligations of U.S. corporations | | 3,955 | | 2 | | (2 | ) | 3,955 | |
Obligations of Non-U.S. corporations | | 2,114 | | — | | — | | 2,114 | |
Bank certificates of deposit | | 3,200 | | — | | — | | 3,200 | |
Money market funds | | 24,177 | | — | | — | | 24,177 | |
Cash | | 10,676 | | — | | — | | 10,676 | |
| | $ | 54,684 | | $ | 4 | | $ | (4 | ) | $ | 54,684 | |
| | | | | | | | | |
Amounts included in cash and cash equivalents | | $ | 35,987 | | $ | — | | $ | — | | $ | 35,987 | |
Amounts included in short-term investments | | 18,697 | | 4 | | (4 | ) | 18,697 | |
| | $ | 54,684 | | $ | 4 | | $ | (4 | ) | $ | 54,684 | |
As of December 31, 2011 and 2010, the Company’s cash equivalents were primarily in the form of money market funds, and the Company had no significant unrealized gains or losses on any of these investments. Money market funds included in cash equivalents as of December 31, 2011 and 2010 are considered Level 1 investments under the GAAP fair value hierarchy because fair value inputs are unadjusted quoted prices in active markets for identical assets or liabilities. The remaining portion of cash equivalents is comprised of obligations of U.S. government agencies, which are considered Level 2 investments under the GAAP fair value hierarchy. Cash equivalents were $10.3 million and $25.3 million as of December 31, 2011 and 2010, respectively.
5. Balance Sheet Components
The components of property and equipment, net as of December 31, 2011 and 2010 (in thousands) are as follows:
| | December 31, | |
| | 2011 | | 2010 | |
| | | | | |
Computer equipment and purchased software | | $ | 9,955 | | $ | 8,366 | |
Software developed for internal use | | 8,947 | | 9,240 | |
Furniture and fixtures | | 3,131 | | 2,330 | |
Leasehold improvements | | 2,112 | | 2,285 | |
| | 24,145 | | 22,221 | |
Less: Accumulated depreciation and amortization | | (16,862 | ) | (13,464 | ) |
| | $ | 7,283 | | $ | 8,757 | |
Depreciation and amortization expense for the years ended December 31, 2011, 2010 and 2009 was $4.6 million, $3.1 million and $2.9 million, respectively.
The components of other accrued liabilities as of December 31, 2011 and 2010 (in thousands) are as follows:
| | December 31, | |
| | 2011 | | 2010 | |
| | | | | |
Accrued employee compensation | | $ | 3,021 | | $ | 4,400 | |
Accrued market research honoraria | | 1,476 | | 1,166 | |
Accrued royalties payable | | 1,273 | | 1,063 | |
Other accrued expenses | | 3,830 | | 2,622 | |
| | $ | 9,600 | | $ | 9,251 | |
59
Table of Contents
6. Acquisitions
Acquisition of Modality, Inc. On November 12, 2010, the Company acquired 100% of the outstanding stock of Modality, Inc., in exchange for $13.8 million in cash. The Company acquired Modality for its current applications for the Apple iPod touch and Apple iPhone as well as its existing processes in place to develop additional applications.
Acquisition of MedCafe, Inc. On February 1, 2010, the Company acquired certain intangible assets of MedCafe, Inc., or MedCafe, a Delaware corporation, in exchange for $0.9 million in cash. The Company acquired MedCafe to allow it to expand the information it provides its users. In addition, the seller had the potential to earn additional amounts (“contingent consideration”) based on the operating results of the MedCafe product line. The Company recorded $14.8 million in earn-out consideration on the acquisition date based on its estimate of the operating results of the MedCafe product line through March 2014. The contingent consideration liability is re-measured using Level 3 inputs and carried at its fair value, with changes in fair value recorded in operating expenses.
In April 2011, the Company paid approximately $0.5 million towards the first installment of the earn-out consideration. In June 2011, the Company entered into an agreement with the sellers of MedCafe to settle the earn-out consideration liability for a lump sum payment of $6.4 million. The settlement of the liability resulted in a gain of approximately $6.4 million in the second quarter of 2011, which has been recorded under Gain on settlement and change in fair value of contingent consideration in the Company’s consolidated statements of operations.
The following table summarizes the purchase price allocations in connection with acquisitions completed in 2010 (in thousands):
| | Modality, Inc. | | MedCafe, Inc. | |
| | | | | |
Net liabilities acquired | | $ | (789 | ) | $ | — | |
Technology | | 5,500 | | 5,760 | |
Customer relationships | | — | | 30 | |
Trademark and trade name | | — | | 40 | |
Non-compete agreement | | 700 | | 150 | |
Goodwill | | 8,339 | | 9,620 | |
| | $ | 13,750 | | $ | 15,600 | |
The following table presents selected financial data assuming the acquisitions in 2010 had occurred on January 1, 2010 (in thousands, except per share data):
| | Years Ended December 31, | |
| | 2010 | | 2009 | |
Total revenues, net | | $ | 105,661 | | $ | 95,588 | |
Net income | | $ | 2,269 | | $ | 4,999 | |
Net (loss) income per common share - basic | | $ | (0.17 | ) | $ | 0.06 | |
Net (loss) income per common share - diluted | | $ | (0.17 | ) | $ | 0.06 | |
Contingent consideration of Caretools, Inc. — The Company acquired Caretools, Inc., or Caretools, for its technology, which was intended to be used in the development of Epocrates’ EHR offering. In connection with the acquisition of Caretools on June 23, 2009, the Company recorded contingent consideration of $1.3 million on the acquisition date. This contingent consideration was calculated based on an estimate of royalty on revenues generated from sales of product developed incorporating Caretools’ technology. As of December 31, 2011 and 2010, the fair value of this contingent consideration was zero and $2.2 million, respectively.
The Company calculated the fair value of the liability during the year ended December 31, 2011 using Level 3 inputs and recorded a decrease in the contingent consideration liability of approximately $1.7 million, primarily due to changes in the discount periods and estimates of revenues to be derived from the acquired technologies of Caretools. On February 24, 2012, the Board of Directors of Epocrates approved the discontinuation of further development of Epocrates’ EHR product. In connection with this decision, Epocrates recorded a gain of $0.5 million to write down carrying value of the contingent consideration liability to an estimated fair value of zero. This gain has been recorded in Gain on settlement and change in fair value of contingent consideration in the Company’s consolidated statements of operations for the year ended December 31, 2011.
60
Table of Contents
7. Goodwill and Intangible Assets
Goodwill
Changes in the carrying value of goodwill were as follows (in thousands):
| | Caretools | | MedCafe | | Modality | | Total | |
| | | | | | | | | |
Balance at January 1, 2009 | | $ | — | | $ | — | | $ | — | | $ | — | |
Additions | | 1,120 | | — | | | | 1,120 | |
Balance at December 31, 2009 | | $ | 1,120 | | $ | — | | $ | — | | $ | 1,120 | |
Additions | | — | | 9,620 | | 8,339 | | 17,959 | |
Balance at December 31, 2010 | | $ | 1,120 | | $ | 9,620 | | $ | 8,339 | | $ | 19,079 | |
Additions | | — | | — | | — | | — | |
Impairment | | (1,120 | ) | — | | — | | (1,120 | ) |
Balance at December 31, 2011 | | $ | — | | $ | 9,620 | | $ | 8,339 | | $ | 17,959 | |
Acquired Intangible Assets
Intangible assets excluding goodwill consisted of the following (in thousands):
| | December 31, 2011 | | December 31, 2010 | |
| | Gross | | | | | | Net | | Gross | | | | Net | |
| | Carrying | | Accumulated | | | | Carrying | | Carrying | | Accumulated | | Carrying | |
| | Amount | | Amortization | | Impairment | | Amount | | Amount | | Amortization | | Amount | |
| | | | | | | | | | | | | | | |
Technology | | $ | 11,780 | | $ | 5,015 | | $ | 448 | | $ | 6,317 | | $ | 11,780 | | $ | 1,189 | | $ | 10,591 | |
Customer relationships | | 60 | | 34 | | 26 | | — | | 60 | | 15 | | 45 | |
Trademarks and trade name | | 50 | | 31 | | 9 | | 10 | | 50 | | 10 | | 40 | |
Non-compete agreement | | 870 | | 423 | | 3 | | 444 | | 870 | | 108 | | 762 | |
| | $ | 12,760 | | $ | 5,503 | | $ | 486 | | $ | 6,771 | | $ | 12,760 | | $ | 1,322 | | $ | 11,438 | |
Amortization of intangible assets was $4.2 million, $1.3 million, and $3,333 for the years ended December 31, 2011, 2010 and 2009, respectively. Amortization of the acquired intangible assets is reflected in cost of revenues. Amortization for the years ending December 31, 2012 and 2013 is expected to be approximately $4.0 million and $2.8 million, respectively.
8. Financing Liability
In April 2007, the Company began a build-out of existing office space which would become the Company’s San Mateo facility. From April 2007 through September 2007, the Company incurred $4.0 million in construction costs. Per the terms of the lease with the sublandlord of the property, the sublandlord would reimburse up to $2.7 million of these construction costs.
When the Company signed the lease, the construction of the space it would lease was unfinished. There was no HVAC, no plumbing or electricity, no networking capability, and no internal walls or offices. As such, the space was not capable of being occupied by any lessee. The Company concluded that under GAAP, it should be considered the owner of the construction project for two reasons:
· Under the lease agreement, the Company was responsible to pay for any cost overruns to make the building ready for occupancy. Per GAAP, if a lessee’s guarantee exceeds 90% of the total project costs it should be considered the owner of the project. A lessee’s unlimited obligation to cover costs over a certain amount would result in its maximum guarantee to be in excess of 90% of the total project costs. Under GAAP, the probability of the lessee having to make such payments should not be considered in performing the maximum guarantee test.
· Per GAAP, regardless of the 90% test discussed above, a lessee should be considered the owner of a construction project if the lessee is responsible for paying directly any cost of the project other than normal tenant improvements. Normal tenant improvements exclude costs of structural elements of the project and any equipment that would be a necessary improvement for any lessee. Under the lease agreement, the Company was responsible for direct payment to the contractor for completing the construction of the leased space.
Therefore, the Company capitalized the fair value of the unfinished portion of the building that it occupies of $17.6 million with a corresponding credit to financing liability pursuant to the financing method under GAAP. The fair value was determined as of May 2007 using an average of the sales comparison and income approaches. In addition, the Company has capitalized $4.0 million in construction costs to complete the space. Each major construction element has been capitalized and is being depreciated over its useful life. The reimbursement from the sublandlord of $2.7 million has also been recorded as a financing liability as of December 31, 2007. The total amount recorded as a financing liability was $20.3 million.
61
Table of Contents
Subsequent to the completion of construction, the Company did not qualify for sale-leaseback accounting under GAAP because of a provision in the lease which constituted continuing involvement. There was a requirement to issue the sublandlord a letter of credit in lieu of a cash security deposit. The Company’s bank required it to maintain a restricted deposit at least equal to the amount of the letter of credit. Under GAAP providing collateral on behalf of the buyer-lessor, including a collateralized letter of credit, constitutes continuing involvement, if earlier. Further, a financial institution’s right of offset against any amounts on deposit against a letter of credit constitutes collateral. Therefore, the Company expected the building to remain on its books until the earlier of the end of the lease or until the Company no longer has continuing involvement. Interest expense on the financing obligation is recorded over the term of the obligation.
Because the Company is considered the owner of the building for accounting purposes, the building is being depreciated on a straight-line basis over its useful life which the Company determined to be 40 years. The Company determined that certain improvements including plumbing, electrical, wiring, concrete, structural steel, carpentry, ceiling, fire sprinklers and heating and air conditioning have a weighted average life of 29 years.
In April 2010, the Company modified the terms of the building lease. Under the terms of the modified lease, the letter of credit was replaced with a cash security deposit. This provision allowed the Company to qualify for sale-leaseback accounting and to begin accounting for the lease as an operating lease. In connection with the sale-leaseback of the building the Company wrote off the remaining asset value of the building, related accumulated depreciation and the financing liability. As a result, the Company recorded a gain on sale-leaseback of $1.7 million.
9. Income Taxes
The Company’s effective tax expense differs from the expense computed using statutory tax rates for the years ended December 31, 2011, 2010 and 2009 as follows (in thousands):
| | Years Ended December 31, | |
| | 2011 | | 2010 | | 2009 | |
| | | | | | | |
Tax computed at the federal statutory rate | | $ | (1,962 | ) | $ | 3,147 | | $ | 5,056 | |
State tax, federally effected | | (123 | ) | 744 | | 884 | |
Stock compensation | | 21 | | 1,080 | | 718 | |
Tax credits | | (780 | ) | (408 | ) | (381 | ) |
State rate adjustment | | 15 | | 763 | | 325 | |
Permanent differences | | 79 | | (139 | ) | 186 | |
Valuation allowance | | 509 | | — | | — | |
Other | | 43 | | — | | — | |
Income tax (benefit) provision | | $ | (2,198 | ) | $ | 5,187 | | $ | 6,788 | |
The (benefit from) provision for income taxes for the years ended December 31, 2011, 2010 and 2009, are as follows (in thousands):
| | Years Ended December 31, | |
| | 2011 | | 2010 | | 2009 | |
| | | | | | | |
Current tax expense: | | | | | | | |
Federal | | $ | 568 | | $ | 1,353 | | $ | 254 | |
State | | 152 | | 76 | | 695 | |
| | 720 | | 1,429 | | 949 | |
| | | | | | | |
Deferred tax expense: | | | | | | | |
Federal | | (2,838 | ) | 2,050 | | 4,690 | |
State | | (80 | ) | 1,708 | | 1,149 | |
| | (2,918 | ) | 3,758 | | 5,839 | |
| | | | | | | |
Income tax (benefit) provision | | $ | (2,198 | ) | $ | 5,187 | | $ | 6,788 | |
62
Table of Contents
Significant components of the Company’s deferred tax assets and liabilities from federal and state income taxes as of December 31, 2011 and 2010 are as follows (in thousands):
| | December 31, | |
| | 2011 | | 2010 | |
Deferred tax assets: | | | | | |
Net operating losses | | $ | 1,300 | | $ | 1,841 | |
Tax credits | | 911 | | 355 | |
Deferred revenue | | 7,021 | | 4,486 | |
Stock compensation | | 3,718 | | 1,983 | |
Accrued expenses | | 1,388 | | 1,380 | |
Total deferred tax assets | | 14,338 | | 10,045 | |
Valuation allowance | | (668 | ) | (159 | ) |
| | 13,670 | | 9,886 | |
Fixed assets | | (2,126 | ) | (2,282 | ) |
Intangible assets | | (2,875 | ) | (1,854 | ) |
Net deferred tax assets | | $ | 8,669 | | $ | 5,750 | |
The Company recorded increases in the valuation allowance of approximately $0.5 million and $0.2 million as of December 31, 2011 and 2010, respectively. The increase in the valuation allowance in 2011 was recorded against state deferred tax assets related to certain research and development credits for which the Company has determined it is more likely than not that such deferred tax assets will not be realized in the future.
At December 31, 2011, the Company had federal and state tax net operating loss carryforwards before the valuation allowance and before the excess tax benefit of $2.4 million and $16.0 million, respectively. Of these amounts, $0.7 million and $3.0 million is associated with windfall tax benefits and will be recorded as additional paid-in capital when realized. The federal and state net operating losses will begin to expire in 2019 and 2014, respectively. At December 31, 2011, the Company had federal and state research tax credit carryforwards of $0.9 million and $1.3 million, respectively. Of these amounts, $0.2 million and zero is associated with windfall tax benefits and will be recorded as additional paid-in capital when realized. The federal research credit carryforward begins to expire in 2028. The state research credit carryforwards do not expire. At December 31, 2011, the Company had federal alternative minimum tax (“AMT”) credit carryforwards of $0.7 million which is associated with windfall tax benefits and will be recorded as additional paid-in capital when realized. The federal AMT credit carryforwards do not expire.
As of December 31, 2011, the Company had reserves and excess tax benefits totaling $1.5 million which have been reflected as a reduction to the Company’s gross tax credits of $2.4 million.
As of December 31, 2011, the Company has deferred the recognition of its excess tax benefit from stock option exercises of $1.3 million until it is actually realized.
At December 31, 2011, the Company’s unrecognized tax benefit totaled $1.1 million, of which $0.9 million, if recognized, would affect the Company’s effective income tax rate. The Company will recognize interest and penalties related to unrecognized tax benefits as a component of income tax expense.
63
Table of Contents
The rollforward of gross unrecognized tax benefits is as follows (in thousands):
Balance as of January 1, 2009 | | $ | 533 | |
Additions based on tax positions related to the current year | | 103 | |
Additions for tax positions of prior years | | 32 | |
Reductions for tax positions of prior years | | — | |
Settlements | | — | |
Balance as of December 31, 2009 | | 668 | |
Additions based on tax positions related to the current year | | 142 | |
Additions for tax positions of prior years | | — | |
Additions related to Modality acquisition | | 83 | |
Reductions for tax positions of prior years | | (2 | ) |
Settlements | | — | |
Balance as of December 31, 2010 | | 891 | |
Additions based on tax positions related to the current year | | 236 | |
Additions for tax positions of prior years | | — | |
Reductions for tax positions of prior years | | (1 | ) |
Settlements | | — | |
Balance as of December 31, 2011 | | $ | 1,126 | |
As of December 31, 2011, the amount of interest and penalties associated with the unrecognized tax benefits were insignificant. The Company does not expect any significant increases or decreases to its unrecognized tax benefits within the next 12 months.
The Company is subject to federal and state income tax in the jurisdictions in which the Company operates. The tax years that remain subject to examination are 2008 through 2011 for federal income taxes and 2007 through 2011 for state income taxes. However, to the extent allowed by law, the tax authorities may have the right to examine prior periods where net operating losses or tax credits were generated and carried forward, and make adjustments up to the amount of the net operating losses or credit carryforward amount.
The Company completed an examination of its 2007 and 2008 California state tax returns during December 2010 with no adjustment. The Company is not currently under examination in any other jurisdiction.
10. Commitments and Contingencies
Operating Leases
The Company leases two office spaces in New Jersey; one in San Mateo, California; and one in Durham, North Carolina under non-cancellable operating leases which expire in December 2012, March 2014, December 2014 and December 2014, respectively. Rent expense for the years ended December 31, 2011, 2010 and 2009 was $2.5 million, $2.0 million and $0.5 million, respectively. Future minimum lease payments under these leases as of December 31, 2011 are as follows (in thousands):
| | Operating | |
Years Ending December 31, | | Leases | |
| | | |
2012 | | $ | 2,861 | |
2013 | | 2,565 | |
2014 | | 1,938 | |
| | $ | 7,364 | |
Minimum Royalty and Content License Fee Commitments
The Company’s royalty and license fee expenses consist of fees that the Company pays to branded content owners for the use of their intellectual property. Royalty and license fee expenses are expensed as incurred.
The Company’s contracts with some licensors include minimum guaranteed royalty payments, which are payable regardless of the ultimate sales of subscriptions. Because significant performance remains with the content owner, including the obligation on the part of the content owner to keep its content accurate and up to date, the Company records royalty payments as a liability when incurred, rather than upon execution of the agreement.
64
Table of Contents
Typically, the terms of the Company’s royalty agreements call for the Company to pay the content owner either a percentage of sales of subscription products that use such content or are based upon the number of users to subscription products that use such content. However, certain royalty agreements require payment to content owners only after funds are received from the Company’s customers. Payments are due within 30-45 days of the designated royalty period, which is typically either three or six months. Royalty agreements require the Company to report subscription sales data and as well as data regarding the number of users for subscription products that use such data. Royalty agreements may initially be signed for multi-year terms, typically two to four years, but revert to automatically renewable one-year agreements after the initial contract term expires.
Actual royalty expense under such royalty agreements was $4.2 million, $3.2 million and $3.2 million for the years ended December 31, 2011, 2010 and 2009, respectively. Future minimum payments under various royalty and license fee agreements with vendors as of December 31, 2011 are as follows (in thousands):
| | Royalty and | |
| | Content License | |
Years Ending December 31, | | Fee Commitments | |
| | | |
2012 | | $ | 4,571 | |
2013 | | 2,642 | |
2014 | | 1,317 | |
| | $ | 8,530 | |
Other Commitments
The Company has contracted with a consulting firm to provide product development and content development work. The Company is committed to pay $50,000 per month through December 2013 under this arrangement.
Subscription Cancellation Reserve
If a paid user is unsatisfied for any reason during the first 30 days of the subscription and wishes to cancel the subscription, the Company will provide a full refund. Refunds made by the Company under this obligation have not been material during all periods presented and have been within management’s expectations. The Company maintains a reserve for estimated future returns based on historical data. The provision for estimated future returns is included in other accrued liabilities.
Legal Matters
On February 25, 2011, the Company received a letter from the SEC informing it that the SEC was conducting an investigation and attaching a subpoena for certain information and documents related to the Company’s expert network services, including its relationship with Hudson Street Services, a Goldman, Sachs & Co. business. On January 5, 2012, Epocrates, Inc. received a letter from the SEC notifying the Company that the SEC had terminated its inquiry regarding Epocrates’ expert network services and that no enforcement action has been recommended.
From time to time, the Company may be involved in lawsuits, claims, investigations and proceedings, consisting of intellectual property, commercial, employment and other matters, which arise in the ordinary course of business. In accordance with GAAP, the Company records a liability when it is both probable that a liability has been incurred and the amount of the loss can be reasonably estimated. These provisions are reviewed at least quarterly and adjusted to reflect the impact of negotiations, settlements, ruling, advice of legal counsel and other information and events pertaining to a particular case. Litigation is inherently unpredictable. If any unfavorable ruling were to occur in any specific period or if a loss becomes probable and estimable, there exists the possibility of a material adverse impact on the Company’s results of operations, balance sheet or cash flows.
Indemnification
The Company enters into standard indemnification agreements in the ordinary course of business. Pursuant to the agreements, each party may indemnify, defend and hold the other party harmless with respect to such claim, suit or proceeding brought against it by a third party alleging that the indemnifying party’s intellectual property infringes upon the intellectual property of the third party, or results from a breach of the indemnifying party’s representations and warranties or covenants, or that results from any acts of negligence or willful misconduct. The term of these indemnification agreements is generally perpetual any time after execution of the agreement. The maximum potential amount of future payments the Company could be required to
65
Table of Contents
make under these indemnification agreements is unlimited. Historically, the Company has not been obligated to make significant payments for these obligations and no liabilities have been recorded for these obligations on the balance sheet as of December 31, 2011 or 2010.
The Company also indemnifies its officers and directors for certain events or occurrences, subject to certain limits, while the officer is or was serving at the Company’s request in such capacity. The maximum amount of potential future indemnification is unlimited; however, the Company has a Director and Officer Insurance Policy that limits its exposure and enables the Company to recover a portion of any future amounts paid. Historically, the Company has not been obligated to make any payments for these obligations and no liabilities have been recorded for these obligations on the balance sheet as of December 31, 2011 or 2010.
Other Contingencies
The Company is subject to claims and assessments from time to time in the ordinary course of business. The Company’s management does not believe that any such matters, individually or in the aggregate, will have a material adverse effect on the Company’s financial position, results of operations or cash flows.
11. Mandatorily Redeemable Convertible Preferred Stock
On February 1, 2011, the Company’s registration statement on Form S-1 for its IPO was declared effective by the SEC and on February 7, 2011, the Company closed its IPO. As a result of the IPO, the Company’s mandatorily redeemable convertible preferred stock was automatically converted into common stock.
The following table summarizes information related to the Company’s mandatorily redeemable convertible preferred stock prior to conversion into common stock (in thousands, except par value):
| | | | | | | | | | Proceeds | |
| | | | | | | | | | Net of | |
| | | | Shares | | Shares | | Liquidation | | Issuance | |
Series | | Par Value | | Authorized | | Outstanding | | Preference | | Costs | |
| | | | | | | | | | | |
A | | $ | 0.001 | | 5,050 | | 4,195 | | $ | 4,195 | | $ | 4,150 | |
B | | 0.001 | | 6,250 | | 6,217 | | 64,830 | | 35,455 | |
C | | 0.001 | | 4,004 | | 2,730 | | 4,348 | | 4,302 | |
| | | | 15,304 | | 13,142 | | $ | 73,373 | | $ | 43,907 | |
| | | | | | | | | | | | | | |
The Series A and C mandatorily redeemable convertible preferred stock converted on a 1:0.786 basis into common stock while the Series B mandatorily redeemable convertible preferred stock converted on a 1:0.908 basis.
Dividends
Holders of Series B Stock are entitled to receive dividends, in preference to the holders of Series A Stock, Series C Stock and common stock, at the simple rate of 8% of the original issue price of $5.71 on each outstanding share of Series B Stock. The dividends are cumulative and shall be payable, in cash or stock, as determined by the Board of Directors, only upon any consolidation or merger of the Company in which in excess of 50% of the Company’s voting power is transferred; the sale, lease or other disposition of all or substantially all of the assets of the Company; upon the automatic conversion in connection with either an initial public offering or the requisite vote of the outstanding preferred stock; or upon the first redemption date. The Company accrued dividends related to Series B Stock of $2.8 million for the year ended December 31, 2010 and $0.3 million for the three month period ended March 31, 2011. From the proceeds of the IPO, aggregate cumulative dividends of $29.6 million were paid in full to the holders of the Company’s Series B preferred stock.
Convertible Preferred Stock Warrants
In June 2000, the Company had issued a warrant to purchase 18,214 shares of Series B stock at $5.71 per share. Outstanding warrants were classified as liabilities, which were adjusted to fair value at each reporting period until the earlier of their exercise or expiration or the completion of a liquidation event, including the completion of an IPO. The Company recorded a decrease to general and administrative expense of $15,549 for the year ended December 31, 2009 and an increase to general and administrative expense of $32,752 for the year ended December 31, 2010, to reflect a change in the fair value of these
66
Table of Contents
outstanding warrants. Upon the consummation of the IPO in February 2011, the preferred stock warrant was automatically converted to a warrant to purchase shares of common stock in accordance with the terms of the warrant agreement and the warrant was reclassified to stockholders’ equity.
12. Common Stock
As of December 31, 2011 and 2010, the Company was authorized to issue 100 million and 30.1 million shares of $0.001 par value common stock, respectively. Reserved shares of common stock were as follows (in thousands):
| | December 31, | |
| | 2011 | | 2010 | |
| | | | | |
Warrants | | 17 | | 17 | |
Options | | 4,684 | | 7,403 | |
Restricted stock units | | 137 | | 168 | |
Mandatorily redeemable convertible preferred stock | | — | | 11,089 | |
Total outstanding | | 4,838 | | 18,677 | |
Repurchase of Common Stock
During the year ended December 31, 2010, certain individuals, including current employees, former employees, and former directors, entered into binding agreements to sell common stock held by them to one of various accredited investors. During the year ended December 31, 2010, the Company exercised its right of first refusal for an additional 0.4 million shares at contracted prices ranging from $6.42 to $11.43 for an aggregate purchase price of $3.5 million. The shares repurchased were subsequently retired. In connection with the retirement of these shares, $2.6 million, representing the difference between the repurchase price and the average original issuance price of the retired shares was recorded to accumulated deficit.
Common Stock Warrants
Upon the consummation of the IPO in February 2011, the preferred stock warrant was automatically converted to a warrant to purchase shares of common stock in accordance with the terms of the warrant agreement and the warrant was reclassified to stockholders’ equity. At December 31, 2011, there were 16,540 common stock warrants outstanding at an exercise price of $6.29.
13. Equity Award Plans
In August 1999, the Company’s Board of Directors adopted and the stockholders approved, the 1999 Stock Option Plan (“1999 Plan”). In May 2009, the Board of Directors adopted and the stockholders approved, an amendment and restatement of the 1999 Plan, the 2008 Equity Incentive Plan (“2008 Plan”). In July 2010, the Company’s Board of Directors adopted the 2010 Equity Incentive Plan (“2010 Plan” and collectively, the “Plans”). The 2010 Plan was most recently amended by the Board of Directors on December 22, 2010 and was approved by the Company’s stockholders on January 5, 2011. The 2010 Plan became effective upon the completion of the IPO. Awards granted after May 2009 but before the adoption of the 2010 Plan continue to be governed by the 2008 Plan. All outstanding stock awards granted prior to May 2009 continue to be governed by the terms of the Company’s 1999 Plan.
The Plans provide for the grant of incentive stock options under the federal tax laws and non-statutory stock options. Only employees may receive incentive stock options, but non-statutory stock options may be granted to employees, non-employee directors and consultants. The exercise price of incentive stock options may not be less than 100% of the fair market value of the Company’s common stock on the date of grant. The exercise price of non-statutory stock options may not be less than 85% of the fair market value of the Company’s common stock on the date of grant. Shares subject to options under the Plans generally vest in a series of installments over an optionee’s period of service, generally four years. The 2008 Plan provides for the grant of restricted stock units to employees.
The term of options granted under the Plans may not exceed ten years. Unless the terms of an optionee’s stock option agreement provide otherwise, if an optionee’s service relationship with the Company, or any of its affiliates, ceases for any reason other than disability or death, the optionee may exercise the vested portion of any options for three months after the date of such termination. If an optionee’s service relationship with the Company, or any of its affiliates, ceases due to disability or death (or
67
Table of Contents
an optionee dies within a certain period following cessation of service), the optionee or a beneficiary may exercise any vested options for a period of 12 months in the event of disability and 18 months in the event of death. In no event, however, may an option be exercised beyond the expiration of its term.
As of December 31, 2011, the Company had reserved approximately 6.5 million shares of common stock for issuance under the Plans.
A summary of activity under the Plans for the years ended December 31, 2009, 2010, and 2011 is as follows (in thousands, except weighted average exercise price):
| | Options Outstanding | | | | | |
| | | | Weighted | | Weighted | | | |
| | Number | | Average | | Average | | Aggregate | |
| | of | | Exercise | | Contractual | | Intrinsic | |
| | Options | | Price | | Term (Years) | | Value | |
| | | | | | | | | |
Balances, January 1, 2009 | | 4,210 | | $ | 5.85 | | 6.96 | | $ | 31,211 | |
| | | | | | | | | |
Granted | | 2,319 | | 11.28 | | | | | |
Forfeited, cancelled or expired | | (318 | ) | 10.83 | | | | | |
Exercised | | (293 | ) | 3.21 | | | | | |
Balances, December 31, 2009 | | 5,918 | | $ | 7.89 | | 7.26 | | $ | 18,790 | |
| | | | | | | | | |
Options vested and expected to vest at December 31, 2009 | | 5,718 | | $ | 7.77 | | 7.18 | | $ | 18,762 | |
| | | | | | | | | |
Options exercisable at December 31, 2009 | | 3,017 | | $ | 4.97 | | 5.39 | | $ | 17,205 | |
| | | | | | | | | |
Granted | | 1,629 | | $ | 13.39 | | | | | |
Forfeited, cancelled or expired | | (636 | ) | 10.73 | | | | | |
Exercised | | (664 | ) | 4.04 | | | | | |
Balances, December 31, 2010 | | 6,247 | | $ | 9.44 | | 7.23 | | $ | 28,424 | |
| | | | | | | | | |
Options vested and expected to vest at December 31, 2010 | | 5,957 | | $ | 9.27 | | 7.12 | | $ | 28,141 | |
| | | | | | | | | |
Options exercisable at December 31, 2010 | | 3,348 | | $ | 6.82 | | 5.67 | | $ | 24,007 | |
| | | | | | | | | |
Granted | | 527 | | $ | 15.08 | | | | | |
Forfeited, cancelled or expired | | (1,006 | ) | 12.53 | | | | | |
Exercised | | (1,084 | ) | 3.22 | | | | | |
| | | | | | | | | |
Balances, December 31, 2011 | | 4,684 | | $ | 10.85 | | 5.32 | | $ | 4,318 | |
| | | | | | | | | |
Options vested and expected to vest at December 31, 2011 | | 4,524 | | $ | 10.73 | | 5.19 | | $ | 4,318 | |
| | | | | | | | | |
Options exercisable at December 31, 2011 | | 3,328 | | $ | 9.83 | | 3.95 | | $ | 4,317 | |
The intrinsic value of options exercised during the years ended December 31, 2011, 2010 and 2009 was $9.2 million, $7.9 million and $3.5 million, respectively. The weighted average grant date fair value of options granted for the years ended December 31, 2011, 2010 and 2009 was $6.96, $5.96 and $5.11, respectively.
68
Table of Contents
The following table summarizes information about stock options outstanding as of December 31, 2011 (in thousands, except weighted average exercise price):
| | Options Outstanding | | Options Vested | |
| | | | Weighted | | | | | | | |
| | | | Average | | Weighted | | | | Weighted | |
| | | | Remaining | | Average | | | | Average | |
Exercise | | Number | | Contractual | | Exercise | | Number | | Exercise | |
Price | | Outstanding | | Life (Years) | | Price | | Exercisable | | Price | |
| | | | | | | | | | | |
$0.20-$5.50 | | 818 | | 2.89 | | $ | 2.77 | | 818 | | $ | 2.77 | |
$5.80-$10.17 | | 924 | | 6.04 | | $ | 9.31 | | 603 | | $ | 9.28 | |
$10.81-$12.11 | | 902 | | 2.27 | | $ | 12.08 | | 836 | | $ | 12.10 | |
$13.17-$13.26 | | 590 | | 4.48 | | $ | 13.24 | | 553 | | $ | 13.24 | |
$13.36-$13.99 | | 1,193 | | 8.26 | | $ | 13.62 | | 453 | | $ | 13.51 | |
$16.00-$22.97 | | 257 | | 9.40 | | $ | 19.40 | | 65 | | $ | 19.88 | |
| | 4,684 | | 5.32 | | $ | 10.85 | | 3,328 | | $ | 9.83 | |
Restricted Stock Units
The Company grants RSUs to its employees under the 2008 Plan. The value of RSUs granted is determined using the fair value of the Company’s common stock on the date of grant. RSUs typically vest in monthly installments over a period of three to four years, but are released only after all RSUs have been vested on a date of the employee’s choosing. Compensation expense is recorded ratably on a straight-line basis over the requisite service period. The following table summarizes all RSU activity for the years ended December 31, 2009, 2010, and 2011 (in thousands except weighted average grant date fair value):
| | | | Weighted | | | |
| | | | Average | | | |
| | Number of | | Remaining | | | |
| | RSUs | | Contractual | | Aggregate | |
| | Outstanding | | Life (in years) | | Intrinsic Value | |
| | | | | | | |
Balances at January 1, 2009 | | — | | | | | |
Granted | | 100 | | | | | |
Forfeited or canceled | | (38 | ) | | | | |
Released | | (13 | ) | | | | |
| | | | | | | | |
Balances at December 31, 2009 | | 49 | | 2.49 | | $ | 506 | |
| | | | | | | |
RSUs vested and expected to vest at December 31, 2009 | | 41 | | 2.21 | | $ | 416 | |
| | | | | | | |
Awarded | | 149 | | | | | |
Forfeited or canceled | | (30 | ) | | | | |
| | | | | | | |
Balances at December 31, 2010 | | 168 | | 2.67 | | $ | 2,346 | |
| | | | | | | |
RSUs vested and expected to vest at December 31, 2010 | | 119 | | 2.65 | | $ | 1,663 | |
| | | | | | | |
Awarded | | 20 | | | | | |
Released | | (17 | ) | | | | |
Forfeited or canceled | | (34 | ) | | | | |
| | | | | | | |
Balances at December 31, 2011 | | 137 | | 1.74 | | $ | 1,072 | |
| | | | | | | |
RSUs vested and expected to vest at December 31, 2011 | | 122 | | 1.70 | | $ | 798 | |
The fair value of option and RSU grants that vested during the years ended December 31, 2011, 2010 and 2009 was $6.5 million, $5.8 million and $3.9 million, respectively.
69
Table of Contents
14. Stock-Based Compensation
The following table summarizes all stock-based compensation charges for the years ended December 31, 2011, 2010 and 2009 (in thousands):
| | Years Ended December 31, | |
| | 2011 | | 2010 | | 2009 | |
| | | | | | | |
Stock-based compensation expense | | $ | 7,805 | | $ | 5,962 | | $ | 4,760 | |
Amortization of deferred stock-based compensation | | — | | — | | 14 | |
Stock-based compensation associated with outstanding repriced options | | (463 | ) | 394 | | (240 | ) |
Total stock-based compensation | | $ | 7,342 | | $ | 6,356 | | $ | 4,534 | |
Included in the stock-based compensation expense is a charge of approximately $1.5 million for the year ended December 31, 2011 relating to modification of the vesting or exercise terms of the stock options held by certain directors who have resigned from the Board of Directors and certain employees who have resigned from the Company.
For stock options and restricted stock units granted on or after January 1, 2006, stock-based compensation cost is measured at grant date based on the fair value of the award and is expensed over the requisite service period. For grants prior to the January 1, 2006, the Company continues to recognize compensation expense on the remaining unvested awards under the intrinsic value method.
The Company uses the Black-Scholes option pricing model to estimate the fair value of options and restricted stock units. This model requires the input of highly subjective assumptions including the expected term of the option, expected stock price volatility and expected forfeitures. The Company used the following assumptions:
| | Years Ended December 31, | |
| | 2011 | | 2010 | |
| | | | | |
Dividend yield | | — | | — | |
Expected volatility | | 50%-60% | | 51%-52% | |
Risk-free interest rate | | 0.9%-2.1% | | 1.2%-2.3% | |
Expected life of options (in years) | | 4.75-5.0 | | 4.5-4.75 | |
Weighted average grant date fair value | | $6.96 | | $5.96 | |
The assumptions above are based on multiple factors, including historical exercise patterns of relatively homogeneous groups with respect to exercise and post-vesting termination behaviors, expected future exercising patterns for these same homogeneous groups and the volatility of similar public companies in terms of type of business, industry, stage of life cycle, size and geographical market. The risk-free interest rate for the expected term of the option is based on the U.S. Treasury Constant Maturity Rate as of the date of grant.
Cash proceeds from the exercise of stock options were $3.5 million, $2.7 million and $0.9 million for the years ended December 31, 2011, 2010 and 2009, respectively.
Compensation expense is recognized ratably over the requisite service period. At December 31, 2011, there was $6.7 million of unrecognized compensation cost related to options and $0.9 million of unrecognized compensation cost related to RSUs, which is expected to be recognized over a weighted average period of 3.0 years and 2.6 years, respectively.
For options that are exercised after they are vested and for RSUs that are released, the Company’s policy is to issue new shares immediately upon exercise or release. The issuance of these new shares is from the Company’s pool of common stock reserved for future issuance as approved by the Company’s stockholders. As of December 31, 2011, the Company had reserved 6.5 million shares of common stock for issuance under the Plans.
70
Table of Contents
Stock-Based Compensation Associated With Outstanding Repriced Options
In November 2003, the Company’s Board of Directors approved a stock option repricing program. Under this program, eligible employees could elect to exchange certain outstanding stock options with an exercise price greater than or equal to $1.00 for a new option to purchase the same number of shares of common stock. As of the cancellation date, the Company had accepted 0.7 million shares for exchange and 0.7 million stock options were granted six months and one day after they were exchanged for an average exercise price of $0.32.
Because of the subsequent reassessment of the fair market value of the common stock, the options repriced became subject to variable accounting, which requires all such vested options repriced be marked to market until such options are cancelled, expire, or are exercised. For the year ended December 31, 2011, the Company recorded a decrease to expense of $0.5 million related to these repriced options. The Company recorded an increase to expense related to these repriced options of $0.4 million during the year ended December 31, 2010. The impact of the change in fair value related to repricing during the year ended December 31, 2009 was a reduction to expense of $0.2 million.
15. Employee Benefit Plans
The Company sponsors a 401(k) defined contribution plan covering all employees. The Board of Directors determines contributions made by the Company annually. The Company made no contributions under this plan for the years ended December 31, 2011, 2010 and 2009.
16. Segment Information
Historically, the Company was organized as one segment. Beginning in 2010, the Company organized its operations into two operating segments: Subscriptions and Interactive Services, and Electronic Health Records. Both segments market their services to clients in the healthcare, pharmaceutical and insurance industries primarily located within the United States. All of the Company’s long-lived assets are located in the United States.
The Company presents its segment information along the same lines that its Chief Operating Decision Maker (“CODM”) reviews the Company’s operating results in assessing performance and allocating resources. The Company does not allocate certain expenses to its segments, such as stock-based compensation and certain general and administrative, marketing and research and development expenses that benefit both segments. These costs are reported as other unallocated corporate costs in the tables below. The Company’s CODM does not review asset information on a segment basis, and therefore, no such information is presented.
To date, the Company has not generated significant revenue from its EHR offering. In early 2012, management determined that the forecasted revenues from and the projected subscribers for the EHR had not materialized and that the costs to develop, continue to enhance and support the EHR offering had a significant adverse effect on its operating margin in 2011. On February 24, 2012, the Board of Directors of Epocrates approved the discontinuation of further development of Epocrates’ EHR. Epocrates will explore strategic alternatives for the EHR, but has only just begun to identify the potential market and options for the EHR, and therefore, the Company’s EHR assets and results at December 31, 2011 are considered held and used in accordance with U.S. GAAP. In connection with this decision, Epocrates recorded an impairment charge of approximately $8.5 million in its fourth quarter of 2011, which represents the write-down of the carrying value of the goodwill, intangible and other long-lived assets related to the EHR product to their estimated fair value of zero. This charge is recorded in Impairment of Long-lived Assets and Goodwill in its consolidated statements of operations for the year ended December 31, 2011.
Once the criteria for reporting assets as held for sale under GAAP are met, the Company will begin reporting the EHR business as a discontinued operation in its consolidated financial statements. The Company expects that it will begin reporting EHR as a discontinued operation in its first quarter of 2012 Form 10-Q.
71
Table of Contents
The following tables summarize the Company’s operating results by reportable segment for the years ended December 31, 2011 and 2010 (in thousands):
| | Subscriptions and | | Electronic | | | |
Year ended December 31, 2011 | | Interactive Services | | Health Records | | Total | |
Net revenue | | $ | 113,321 | | $ | 25 | | $ | 113,346 | |
Segment income (loss) from operations | | $ | 38,229 | | $ | (14,084 | ) | $ | 24,145 | |
Unallocated items: | | | | | | | |
Stock-based compensation | | | | | | (7,342 | ) |
Other unallocated corporate costs | | | | | | (22,832 | ) |
Loss from operations | | | | | | (6,029 | ) |
Interest income | | | | | | 75 | |
Other income | | | | | | 183 | |
Loss before income taxes | | | | | | $ | (5,771 | ) |
| | Subscriptions and | | Electronic | | | |
Year ended December 31, 2010 | | Interactive Services | | Health Records | | Total | |
Net revenue | | $ | 103,988 | | $ | — | | $ | 103,988 | |
Segment income (loss) from operations | | $ | 42,413 | | $ | (8,021 | ) | $ | 34,392 | |
Unallocated items: | | | | | | | |
Stock-based compensation | | | | | | (6,356 | ) |
Other unallocated corporate costs | | | | | | (20,614 | ) |
Income from operations | | | | | | 7,422 | |
Interest income | | | | | | 93 | |
Interest expense | | | | | | (214 | ) |
Gain on sale-leaseback of building | | | | | | 1,689 | |
Income before income taxes | | | | | | $ | 8,990 | |
The segment income (loss) from operations figures reported above represent income (loss) from operations before stock-based compensation, general and administrative expenses and certain marketing and research and development expenses.
17. Related Party Transactions
The Company recorded revenue from three advertising agencies whose parent company’s chief executive officer is a member of the Epocrates Board of Directors. The Company recorded revenue from these entities of $5.1 million, $0.3 million and $1.5 million for the years ended December 31, 2011, 2010 and 2009, respectively. There were accounts receivable from this entity of approximately $1.0 million and zero as of December 31, 2011 and 2010, respectively.
The Company recorded revenue from an affiliate of an investment banking firm whose representative is a former member of the Epocrates Board of Directors. The Company recorded revenue from this entity of approximately $0.1 million, $0.2 million and $0.1 million for the years ended December 31, 2011, 2010 and 2009, respectively. There were no accounts receivable from this entity as of December 31, 2011 and 2010. The Company also paid fees for customer referrals to this firm for the years ended December 31, 2011, 2010 and 2009; these fees were immaterial. There were no accounts payable and an insignificant amount of accounts payable to this entity as of December 31, 2011 and 2010, respectively.
The Company recorded revenue from a pharmaceutical company who has a director who is also a member of the Company’s Board of Directors. The Company recorded revenue from this company of $0.2 million for each of the years ended December 31, 2011, 2010 and 2009, respectively. There was an insignificant amount of accounts receivable for this entity as of December 31, 2011 and 2010, respectively.
18. Subsequent Event
On February 24, 2012, the Board of Directors of Epocrates approved the discontinuation of further development of Epocrates’ EHR product. The Board of Directors made this determination in order to focus Epocrates’ efforts on its core business, Subscriptions and Interactive Services, and due to the future uncertainty and ongoing investment required for the EHR product to remain competitive. Epocrates will explore strategic alternatives for the EHR product. In connection with this decision, Epocrates recorded an impairment charge of approximately $8.5 million in its fourth quarter of 2011, which represents the write-down of the carrying value of the long-lived assets and goodwill related to the EHR product fair value, which was determined to be zero. This charge is recorded in Impairment of Long-lived Assets and Goodwill in the Company’s consolidated statements of operations for the year ended December 31, 2011.
72
Table of Contents
Item 9. Changes In and Disagreements with Accountants on Accounting and Financial Disclosure
None.
Item 9A. Controls and Procedures
Our management, with the participation of our Interim Chief Executive Officer and our Chief Financial Officer, evaluated the effectiveness of our disclosure controls and procedures as of December 31, 2011. The term “disclosure controls and procedures,” as defined in Rules 13a-15(e) and 15d-15(e) under the Securities Exchange Act of 1934, as amended (the “Exchange Act”), means controls and other procedures of a company that are designed to ensure that information required to be disclosed by a company in the reports that it files or submits under the Exchange Act is recorded, processed, summarized and reported, within the time periods specified in the SEC’s rules and forms. Disclosure controls and procedures include, without limitation, controls and procedures designed to ensure that information required to be disclosed by a company in the reports that it files or submits under the Exchange Act is accumulated and communicated to the company’s management, including its principal executive and principal financial officers, as appropriate to allow timely decisions regarding required disclosure. Management recognizes that any controls and procedures, no matter how well designed and operated, can provide only reasonable assurance of achieving their objectives and management necessarily applies its judgment in evaluating the cost-benefit relationship of possible controls and procedures. Based on the evaluation of our disclosure controls and procedures as of December 31, 2011, our Interim Chief Executive Officer and Chief Financial Officer concluded that, as of such date, our disclosure controls and procedures were effective at the reasonable assurance level.
Management’s Report on Internal Control Over Financial Reporting
Our management is responsible for establishing and maintaining adequate internal control over financial reporting as defined in Rules 13a-15(f) and 15d-15(f) under the Exchange Act. Our internal control over financial reporting is designed to provide reasonable assurance regarding the reliability of financial reporting and the preparation of consolidated financial statements for external purposes in accordance with generally accepted accounting principles. Our internal control over financial reporting includes those policies and procedures that:
(i) pertain to the maintenance of records that, in reasonable detail, accurately and fairly reflect the transactions and dispositions of its assets,
(ii) provide reasonable assurance that transactions are recorded as necessary to permit preparation of consolidated financial statements in accordance with generally accepted accounting principles, and that receipts and expenditures are being made only in accordance with authorizations of our management and directors, and
(iii) provide reasonable assurance regarding prevention or timely detection of any unauthorized acquisition, use or disposition of our assets that could have a material effect on the consolidated financial statements.
Because of its inherent limitations, internal control over financial reporting may not prevent or detect misstatements. Also, projections of any evaluation of internal control effectiveness to future periods are subject to the risk that controls may become inadequate because of changes in conditions, or that the degree of compliance with the policies or procedures may deteriorate.
Our management has assessed the effectiveness of the internal control over financial reporting as of December 31, 2011. In making this assessment, our management used the criteria set forth by the Committee of Sponsoring Organizations of the Treadway Commission (“COSO”) in Internal Control — Integrated Framework. Based on this evaluation, our management has concluded that our internal control over financial reporting was effective as of December 31, 2011.
PricewaterhouseCoopers LLP, the independent registered public accounting firm that audited our financial statements included in this report, has not issued an attestation report on the effectiveness of our internal control over financial reporting as of December 31, 2011 because we are a non-accelerated filer.
73
Table of Contents
Changes in Internal Control over Financial Reporting
There was no change in our internal control over financial reporting identified in connection with the evaluation required by Rule 13a-15(d) and 15d-15(d) of the Exchange Act that occurred during the fourth quarter ended December 31, 2011 that has materially affected, or is reasonably likely to materially affect, our internal control over financial reporting.
Item 9B. Other Information
None.
PART III
Item 10. Directors, Executive Officers and Corporate Governance
Board of Directors
The Board of Directors (“the Board”) currently has seven members. The following are our directors’ names and ages as of March 1, 2012:
Name | | Age | | Position |
Peter C. Brandt | | 54 | | Interim President and Chief Executive Officer (“CEO”); Director |
| | | | |
Patrick S. Jones | | 67 | | Chairman of the Board |
| | | | |
Philippe O. Chambon, M.D., Ph.D. | | 53 | | Director |
| | | | |
Gary G. Greenfield | | 57 | | Director |
| | | | |
Thomas L. Harrison | | 64 | | Director |
| | | | |
Erick N. Tseng | | 32 | | Director |
| | | | |
Mark A. Wan | | 46 | | Director |
Peter C. Brandt has served on our Board since February 2011, and has served as our Interim President and Chief Executive Officer since November 16, 2011. Since September 2009, Mr. Brandt has been serving on the Boards of Directors for various healthcare companies. From April 2008 to August 2009, Mr. Brandt served as President and CEO of Noven Pharmaceuticals, Inc., a specialty pharmaceutical company, where he was responsible for the overall management of the company. From May 2007 to April 2008, Mr. Brandt served as a consultant for various healthcare companies. From January 2006 to May 2007, Mr. Brandt served as President of U.S. Pharmaceutical Operations of Pfizer, Inc., a biomedical and pharmaceutical company, and as President of Latin American Pharmaceutical Operations and Senior Vice President of Global Pharmaceuticals overseeing Finance, Information Technology, Planning and Business Development departments, as well as the Pfizer Health Solutions department from January 2004 to December 2005. Mr. Brandt holds a B.A. from the University of Connecticut and an M.B.A. from Columbia University. Mr. Brandt previously served on the Board of Directors of Noven Pharmaceuticals, Inc. and currently serves as a director of Rexahn Pharmaceuticals, Inc. and Auxilium Pharmaceuticals, Inc. The Nominating Committee believes that Mr. Brandt’s extensive experience in the pharmaceutical industry and financial matters makes him a valuable member of the Board. Mr. Brandt was identified by a recruiter and elected to the Board to fill a vacancy created by the resignation of a member of the Board and, prior to his appointment as Interim President and CEO, to serve as a member of our Audit Committee.
Patrick S. Jones has served on our Board since October 2005. Mr. Jones has been a private investor since March 2001. From June 1998 to March 2001, Mr. Jones was the Senior Vice President and Chief Financial Officer (“CFO”) of Gemplus International S.A., a manufacturer of smart cards for banking, retail, security and telecommunications. From 1992 to May 1998, Mr. Jones was Vice President, Finance and Corporate Controller for Intel Corporation. Mr. Jones holds a B.A. from the University of Illinois and an M.B.A. from St. Louis University. Mr. Jones also serves as Chairman of the Board of Lattice Semiconductor, Inc. and serves as a director of Fluidigm, Inc., Openwave Systems Inc. and several private companies. Mr. Jones previously served as a director for Novell. The Nominating Committee believes that Mr. Jones’ extensive financial management and corporate governance expertise make him a valuable member of the Board. Mr. Jones was identified by a recruiter and was elected to the Board in an effort to expand the size of the Board and provide additional experience and skills to the Board as it existed at that time.
74
Table of Contents
Philippe O. Chambon, M.D., Ph.D. has served on our Board since August 2000. Since July 2005, Dr. Chambon has served as a Managing Director of New Leaf Venture Partners, LLC, a venture capital firm spun off from Sprout Group, the venture capital affiliate of Credit Suisse. Dr. Chambon joined Sprout Group in May 1995 and became a General Partner in January 1997. From May 1993 to April 1995, Dr. Chambon served as Manager in the healthcare practice of The Boston Consulting Group, a consulting firm. From September 1987 to April 1993, Dr. Chambon served as Executive Director of New Product Management for Sandoz Pharmaceutical, Inc., a pharmaceutical company. Dr. Chambon holds an M.D. and a Ph.D. from the University of Paris and an M.B.A. from Columbia University. Dr. Chambon also serves as a director NxStage Medical, Inc. and several private biotechnology companies. Dr. Chambon previously served as a director of Auxilium Pharmaceuticals, Inc. from 2003 to 2011 and of Pharsight Corporation from 1993 until 2007. The Nominating Committee believes that Dr. Chambon’s leadership, corporate governance, strategic, capital market and small company build-up experience within the healthcare technology sector make him a valuable member of the Board. Dr. Chambon joined our Board at the request of, and in connection with the investment in our stock by, entities affiliated with Sprout Group.
Gary G. Greenfield has served on our Board since August 2011. Mr. Greenfield is currently the Chairman and CEO of Avid Technology, Inc., a world leader in designing and pioneering content creation, media production and broadcast solutions. Mr. Greenfield has served as CEO of various divisions of Avid since 2007. Prior to Avid, Mr. Greenfield served as CEO at GXS, Inc., a provider of business-to-business integration, synchronization and collaboration solutions, from December 2003 to December 2007. During the same period, he also served as an Operating Partner with Francisco Partners, a technology-focused private equity firm. Prior to that, Mr. Greenfield served as CEO at Peregrine Systems, Inc., where he grew businesses both organically and through acquisition and served diverse customers ranging from small businesses to the Fortune 500. Mr. Greenfield also serves as a director of Vocus, Inc. and previously served as a director of Novell, Inc. Mr. Greenfield holds a Bachelor of Science from the U.S. Naval Academy, a Master of Science Administration from George Washington University and an M.B.A. from Harvard Business School. The Nominating Committee believes that Mr. Greenfield’s proven leadership in high technology and media, as well as his significant operational experience, makes him a valuable member of the Board.
Thomas L. Harrison has served on our Board since January 2002. Since May 1998, Mr. Harrison has served as Chairman and CEO of the Diversified Agency Services, Inc., a division of Omnicom Group, Inc., an advertising and marketing company. Mr. Harrison holds an honorary doctorate and an M.S. from West Virginia University. Mr. Harrison also serves as a director of Morgans Hotel Group. The Nominating Committee believes that Mr. Harrison’s communications and marketing experience, as well as his independence and familiarity with the pharmaceutical industry, make him a valuable member of the Board. Mr. Harrison was referred by one of our employees to our CEO, who in turn recommended him to become a member of the Board.
Erick N. Tseng has served on our Board since August 2011. Since May 2010, Mr. Tseng has served as the Head of Mobile Products for Facebook, Inc., a social media company. From August 2006 to May 2010, Mr. Tseng was the Lead Product Manager for Android at Google, where he was responsible for the development and launch of Android, Google’s open-source mobile operating system. Prior to joining Google, Mr. Tseng was an Associate at McKinsey & Company. He has also held various engineering and product management positions at Microsoft and Yahoo. Mr. Tseng currently serves as a Board Adviser at HealthTap, Inc., where he advises on product management and mobile issues. Mr. Tseng holds a B.S. and Master’s degree in Computer Science & Electrical Engineering from Massachusetts Institute of Technology and an M.B.A. from the Stanford Graduate School of Business. The Nominating Committee believes that Mr. Tseng’s proven track record of mobile innovation and expertise in user engagement makes him a valuable member of the Board.
Mark A. Wan has served on our Board since September 1999. Mr. Wan co-founded Three Arch Partners, a venture capital firm, in 1993. Mr. Wan holds a B.S. in engineering and a B.A. in economics from Yale University and an M.B.A. from the Stanford Graduate School of Business. Mr. Wan also serves as a director of AcelRx Pharmaceuticals, Inc., Biosensors International Group, Ltd. and several private medical companies. The Nominating Committee believes that Mr. Wan’s experience in the financial markets and his extensive knowledge of Epocrates, having been a director since 1999, position him to bring historical knowledge and continuity to the Board. Mr. Wan joined our Board at the request of, and in connection with the investment in our stock by, entities affiliated with Three Arch Partners.
75
Table of Contents
Executive Officers of the Registrant
Information regarding our executive officers is disclosed under the heading “Executive Officers of the Registrant” in Item 1. Business.
Information Regarding the Audit Committee
Our Audit Committee is composed of Messrs. Greenfield and Jones, each of whom is a non-employee member of our Board. Mr. Jones is the Chairman of the Audit Committee. The Board has determined that Mr. Jones is an “audit committee financial expert” as defined under the Securities and Exchange Commission (“SEC”) rules and regulations. As a result of Mr. Brandt’s appointment as Interim President and Chief Executive Officer and department from the Audit Committee, we are not in compliance with the Audit Committee composition requirements of NASDAQ Listing Rule 5605(c)(2)(A). We are relying on the exemption afforded by NASDAQ Listing Rule 506(c)(4)(B). We believe that the composition of our Audit Committee meets the requirements for independence and financial sophistication under the current requirements of the NASDAQ listing standards (with the exception cited above) and SEC rules and regulations. In addition, our Audit Committee has the specific responsibilities and authority necessary to comply with the current requirements of the NASDAQ listing standards and SEC rules and regulations. We intend to comply with future requirements to the extent they become applicable to us.
Epocrates is currently not in compliance with NASDAQ audit requirements set forth in Listing Rule 5605. That rule requires at least three independent Board members to serve on the Audit Committee. In order to not be delisted from NASDAQ, we must cure this deficiency on or before May 14, 2012, six months from when Mr. Brandt became the Interim President and CEO and stepped down from the Audit Committee.
Stockholder Recommendations for Nominations of Directors
At this time, the Corporate Governance and Nominating Committee does not have a policy with regard to the consideration of director candidates recommended by stockholders. The Corporate Governance and Nominating Committee believes that it is in the best position to identify, review, evaluate and select qualified candidates for Board membership based upon the comprehensive criteria for Board membership approved by the Board.
Code of Business Conduct and Ethics
Epocrates has adopted a Code of Business Conduct and Ethics that applies to all officers, directors and employees. The Code of Business Conduct and Ethics is available on Epocrates’ website at: http://investor.epocrates.com/governance.cfm. If Epocrates makes any substantive amendments to the Code of Business Conduct and Ethics or grants any waiver from a provision of the Code to any executive officer or director, Epocrates will promptly disclose the nature of the amendment or waiver on its website.
Section 16(a) Beneficial Ownership Reporting Compliance
Section 16(a) of the Exchange Act requires Epocrates’ directors and executive officers, and persons who own more than ten percent of a registered class of Epocrates’ equity securities, to file with the SEC initial reports of ownership and reports of changes in ownership of common stock and other equity securities of Epocrates. Officers, directors and greater-than-ten percent stockholders are required by SEC regulation to furnish Epocrates with copies of all Section 16(a) forms they file.
To Epocrates’ knowledge, based solely on a review of the copies of such reports furnished to Epocrates, during the fiscal year ended December 31, 2011, all Section 16(a) filing requirements applicable to its officers, directors and greater-than-ten percent beneficial owners were complied with, except for one late Form 4 filing for Matthew A. Kaminer.
Item 11. Executive Compensation
EXECUTIVE COMPENSATION AND RELATED INFORMATION
COMPENSATION DISCUSSION AND ANALYSIS
In April 2011, we held a stockholder advisory vote on the compensation of our named executive officers (“NEOs”). Our stockholders overwhelmingly approved, on an advisory basis, the compensation of our NEOs, with over 98% of stockholder votes cast in favor of our “Say on Pay” resolution. In evaluating our compensation practices during fiscal year 2011, we were mindful of the strong support our stockholders expressed for our philosophy of linking compensation to our operating and organizational objectives and the enhancement of stockholder value. As a result, our Compensation Committee retained our general approach to executive compensation, and continued to apply the same general principles and philosophy as in the prior fiscal year in determining executive compensation. Our Compensation Committee will continue to consider stockholder concerns and feedback in the future.
76
Table of Contents
Introduction
This Compensation Discussion and Analysis provides information regarding our compensation programs and policies for the NEOs:
Name | | Title |
| | |
Peter C. Brandt | | Interim President and Chief Executive Officer (“CEO”) |
| | |
Patrick D. Spangler | | Chief Financial Officer (“CFO”) |
| | |
Matthew A. Kaminer | | General Counsel and Secretary |
| | |
David B. Burlington | | Chief Operations Officer |
| | |
Heather A. Gervais | | Senior Vice President, Commercial Operations |
| | |
Rosemary A. Crane | | Former President and CEO |
| | |
Joseph B. Kleine | | Former Chief Commercial Officer |
Compensation philosophy and objectives
We believe that compensation of our NEOs should:
· provide a means for us to attract, retain and reward high-quality executives who will contribute to the long-term success of Epocrates;
· inspire our executive officers to achieve our business objectives;
· encourage our executive officers to work as a team; and
· align the financial interests of the executive officers with those of the stockholders.
To achieve these objectives, we generally use a mix of compensation elements, including base salary, annual cash incentives, time-based stock options and restricted stock units, performance-based stock options, employee benefits and limited perquisites and severance and change-of-control benefits.
While the Compensation Committee (or the Board, as applicable) reviews the total compensation package for each of our executive officers in connection with the decisions it makes each year regarding each individual element of compensation, the amount of each element of compensation awarded is also assessed independent of the amount of any other one element awarded. In determining the amount and form of these compensation elements, we may consider a number of factors, including the following:
· compensation levels paid by companies in our peer group, with a particular focus on having the cash and equity compensation at between the 50th and 75th percentile of that of similarly-situated officers employed by those peer companies, as we believe this approach helps us to compete in hiring and retaining the best possible talent while at the same time maintaining a reasonable and responsible cost structure;
· corporate and/or individual performance, as we believe this encourages our executives to focus on achieving our business objectives;
· the need to motivate executives to address particular business challenges that are unique to any given year;
· internal pay equity of the compensation paid to one NEO as compared to another, as we believe this contributes to retention and a spirit of teamwork among our executives while recognizing that compensation opportunities should increase based on increased levels of responsibility as between executive officers;
· the potential dilutive effect on our stockholders generally from equity awards;
· broader economic conditions, in order to ensure that our pay strategies are effective yet responsible; and
77
Table of Contents
· individual negotiations with executives, particularly in connection with their initial compensation package, as these executives may be leaving meaningful compensation opportunities at their prior employer in order to come work for us, as well as upon their departures, as we recognize the benefit to our stockholders of seamless transitions.
Role of the Compensation Committee in setting executive compensation
Our Compensation Committee is generally responsible for:
· determining, reviewing, modifying and approving the compensation and other terms of employment of our executive officers;
· reviewing and approving corporate performance goals and objectives relevant to such compensation and compensation of senior management;
· administering our equity and cash-based incentive plans and recommending to the Board the adoption, amendment and termination of such plans;
· establishing policies with respect to equity compensation arrangements; and
· reviewing and approving the terms of any employment agreements, severance arrangements, change-of-control protections and any other compensatory arrangements for our executive officers.
However, the Compensation Committee may, at its discretion and in accordance with the philosophy of making all information available to the Board, present executive compensation matters to the entire Board for its review and approval. In addition, our Compensation Committee’s authority in respect of CEO compensation is limited to recommending compensation to the Board for its approval.
As part of its deliberations, in any given year, the Compensation Committee may review and consider materials such as company financial reports and projections, operational data, tax and accounting information, projection of the total compensation that may become payable to executives in various hypothetical scenarios, executive stock ownership information, analyses of historical executive compensation levels and current company-wide compensation levels and the recommendations of the CEO and the Compensation Committee’s independent compensation consultant.
Role of our management
Our Human Resources, Finance and Legal Departments work with our CEO and the Compensation Committee’s compensation consultant to design and develop compensation programs applicable to NEOs and other senior management, to recommend changes to existing compensation programs, to recommend financial and other performance targets to be achieved under those programs, to prepare analyses of financial data, peer comparisons and other Compensation Committee briefing materials and ultimately, to implement the decisions of the Compensation Committee. Members of our Human Resources, Finance and Legal Departments attend Compensation Committee meetings and provide background on materials presented to the Compensation Committee. Members of these departments and our CEO also meet separately with the Compensation Committee’s consultant to convey information on proposals that management may make to the Compensation Committee, as well as to allow the consultants to collect information about Epocrates to develop their own proposals.
For executives other than the CEO, the Compensation Committee solicits and considers the performance evaluations and compensation recommendations submitted to the Compensation Committee by the CEO. In the case of the CEO, the Compensation Committee facilitates the evaluation of his or her performance, assisted by the Chairman of the Board, and determines whether to recommend to the Board any adjustments to the CEO’s compensation.
Role of our compensation consultant
In connection with making its recommendations for executive compensation for 2011, Epocrates continued its engagement with Towers Watson to act as our compensation consultant with respect to executive and Board compensation matters. The Compensation Committee directed Towers Watson to provide its analysis of whether our existing compensation strategy and practices were consistent with our compensation objectives and to assist the Compensation Committee in modifying our compensation program for executive officers in order to better achieve our objectives. As part of its duties, Towers Watson provided only the following services:
78
Table of Contents
· reviewed and provided recommendations on composition of the peer groups;
· provided compensation data for employees at our peer group companies as well as from published surveys;
· conducted a review of the compensation arrangements for all of our executive officers, including providing advice on the design and structure of our annual management bonus plan;
· conducted a review of our equity compensation program (including an analysis of equity mix, aggregate share usage and target grant levels);
· conducted a review of Board member compensation, and provided market data and summaries to the Nominating Committee and Compensation Committee regarding Board pay structure; and
· updated the Compensation Committee on emerging trends/best practices in the area of executive compensation.
During 2011, the Compensation Committee met from time to time with Towers Watson with management present and in separate meetings, including executive sessions during committee meetings. Our General Counsel, CFO and members of our Human Resources department worked with Towers Watson as directed by the Compensation Committee to provide any information Towers Watson required in order to provide its services.
Benchmarking of compensation
Source of data. As with many companies, our Compensation Committee (or our Board, as applicable) generally discussed compensation levels in the context of the experiences and individual knowledge of each Board member as well as against comparable market data for our peer group. In addition, the Compensation Committee (and the Board, as applicable) considered several peer company data sources in determining the annual compensation for our executive officers, including the Radford High-Tech Industry Executive and Benchmark Surveys, the Bay Area 150 Tech Survey and public filings by companies selected as part of our peer group.
Peer group composition. In February 2010, Towers Watson worked with the Compensation Committee and executive management to propose a group of peer companies for the Compensation Committee’s use in evaluating 2010 compensation. At that time, the Compensation Committee approved the following companies, based on the recommendations of Towers Watson, as our peer group of companies for purposes of evaluating 2010 compensation and making pay decisions:
Amicas | | Medassets | | Quality Systems |
athenahealth | | Medidata Solutions | | Transcend Services |
Computer Programs and Systems | | Mediware Information Systems | | Vital Images |
Health Grades | | Merge Healthcare | | WebMD Health |
Healthstream | | Phase Forward | | |
Icad | | QuadraMed | | |
These companies were chosen because they were generally similar to us in terms of industry (healthcare technology), revenue (generally one-half to two times our size with any outliers being close to industry peers), growth trajectory (as represented by revenue, margin and cash flow), geographic location (Silicon Valley) and/or competition for the same group of executive talent.
Between February 2010 and August 2011, our peer group decreased due to acquisitions. In August 2011, Towers Watson worked with the Compensation Committee and executive management to evaluate the remaining peer group and recommend additions to it. At that time, the Compensation Committee approved the following companies, based on the recommendations of Towers Watson, as our peer group of companies for purposes of evaluating compensation and making pay decisions:
Computer Programs and Systems | | Mediware Information Systems | | Transcend Services |
Healthstream | | Merge Healthcare | | WebMD Health |
Icad | | Omnicell | | |
Medassets | | PDI | | |
Medidata Solutions | | Quality Systems | | |
We added PDI and Omnicell to the remaining members of our original peer group, based on the following considerations: market capitalization, industry, profitability and growth, complexity, product/service diversity and geographic scope.
79
Table of Contents
Compensation positioning and compensation allocations. In general, the Compensation Committee, in line with our philosophy, aimed to provide for base salaries at the 50th percentile and target total cash and equity compensation at the 75th percentile of the compensation paid to similarly-situated executive officers employed by the peer group companies for target level performance.
The Compensation Committee also reviewed typical ownership percentages of similarly-situated public and pre-IPO companies for executive officers individually and in total for the company. In trying to achieve this positioning, the Compensation Committee did not have a rigid pre-set allocation of compensation as between the various elements of compensation in our executive compensation program, but generally assessed the various compensation elements as follows:
· annual cash compensation targeted at the 50th to 75th percentile for our public company peer group companies; and
· target equity compensation at the 50th to 75th percentile (to the extent doing so did not cause unreasonable dilution) for public and pre-IPO companies that approximate our size and stage of life.
In determining equity compensation, the Compensation Committee considered the total equity ownership of each individual relative to comparable positions in peer companies and the extent to which the individual’s equity had vested. New grants were made, taking into consideration the individual’s ownership levels as well as the estimated Black-Scholes value based on the fair market value of our stock around the time the committee met. Since incentive cash and equity awards have both upside opportunities and downside risks, the target percentages set at the beginning of a fiscal year may not equal the compensation actually earned under these awards.
Our Compensation Committee believes targeting total cash and equity compensation at the 75th percentile for our peer group is necessary in order to achieve the primary objectives, described above, of our executive compensation program. However, as noted above under “Compensation philosophy and objectives,” benchmarking is just a reference point. Other factors, such as economic conditions, performance, internal pay equity and individual negotiations, play an important role with respect to the compensation offered to any executive in any given year. We believe this approach helps us to compete in hiring and retaining the best possible talent while at the same time maintaining a reasonable and responsible cost structure.
Reasons for providing, and manner of structuring, the key compensation elements in 2011
Elements of compensation. The table below outlines which factors were material to the decisions of the Compensation Committee when determining compensation for our NEOs in 2011 and the reasons such element of compensation is provided.
Compensation element | | Material factors considered in 2011 in
determining amount | | Objective |
| | | | |
Base salary | | · Board members’ experience and knowledge · Broader market conditions · Individual performance and demonstration of successful contributions and results · Public company market data | | · Attract and retain experienced executives · Compensation for performing expectations of the role |
80
Table of Contents
Compensation element | | Material factors considered in 2011 in
determining amount | | Objective |
| | | | |
Annual performance-based cash bonuses | | · Board members’ experience and knowledge · Achievement of corporate objectives, particularly in light of broader market conditions · Internal pay equity; contribution by level (for targets as percent of salary) · Corporate performance against pre-established financial goals | | · Attract and retain exceptional talent · Motivate executives to achieve company objectives while working as a team · Link corporate performance with compensation paid · Provide incentives to promote our growth and create stockholder value, thereby aligning the financial interests of the executive officers with those of the stockholders |
| | | | |
Time-based stock options and restricted stock units | | · Board members’ experience and knowledge · Internal pay equity · The potential dilutive effect on our stockholders · Comparable market data for peer companies · Potential gain and unvested holdings | | · Attract and retain exceptional talent · Link corporate performance with compensation paid · Provide incentives to promote our growth and create stockholder value, thereby aligning the financial interests of the executive officers with those of the stockholders |
| | | | |
Performance-based option awards | | · Board members’ experience and knowledge · Achievement of corporate objectives, particularly in light of broader market conditions · Internal pay equity · The potential dilutive effect on our stockholders · Comparable market data for peer companies · Potential gain and unvested holdings | | · Attract and retain exceptional talent · Motivate executives to achieve company objectives while working as a team · Provide incentives to promote our growth and create stockholder value, thereby aligning the financial interests of the executive officers with those of the stockholders |
| | | | |
Employee benefits and limited perquisites | | · Board members’ experience and knowledge · Internal pay equity · Individual negotiations with executives | | · Attract and retain exceptional talent · Encourage officers to work as a team |
81
Table of Contents
Compensation element | | Material factors considered in 2011 in
determining amount | | Objective |
| | | | |
Severance and change in control benefits | | · Board members’ experience and knowledge · Internal pay equity · Individual negotiations with executives | | · Attract and retain exceptional talent · Motivate executives to achieve company objectives which may in any given year include completion of a strategic transaction · Align the financial interests of the executive officers with those of the stockholders – that is, the completion of a desired transaction without regard to executive’s own compensation/job security |
The Compensation Committee believes that incentive compensation opportunity, in the form of both cash and equity awards, should make up a larger portion of each NEO’s target total compensation as the executive’s level of responsibility increases. For example, the target levels of cash and equity incentives for our CEO are generally greater than the target incentive compensation opportunities afforded to our other NEOs. This approach to internal pay equity reflects the Compensation Committee’s recognition of the relative importance of each executive officer’s contributions to the success of Epocrates. By increasing the portion of total target compensation that is performance-based with increasing levels of responsibility, we believe our compensation program provides appropriate levels of incentive for our executive officers to perform their duties to the best of their abilities.
Base salary. Each of our NEOs has entered into an at-will employment agreement or offer letter with us that provides for their initial base salary. Our Compensation Committee generally reviews base salaries in the first quarter of the fiscal year.
In preparation for becoming a publicly-traded company, Towers Watson provided information to our Compensation Committee on base salaries at peer companies. The Compensation Committee considered this data as well as input and the performance evaluations by the then CEO for her direct reports, and the CEO performance evaluation presented by the Chairman of the Board, and recommended that base pay for the executive officers, other than our then CEO, remain unchanged from 2010 as follows:
Name | | 2011 Base
Salary | | 2010 Base
Salary | | %
Change | |
Patrick D. Spangler | | $ | 300,000 | | $ | 300,000 | | — | % |
David B. Burlington | | $ | 270,000 | | $ | 270,000 | | — | % |
Rosemary A. Crane | | $ | 380,000 | | $ | 350,000 | | 8.6 | % |
Joseph B. Kleine | | $ | 280,000 | | $ | 280,000 | | — | % |
The Compensation Committee believed that these salary levels were appropriate in matching the desire to have each of our executive officers be positioned at the appropriate market level that is reflective of their skills, contributions and performance against comparable public peer roles. With respect to Mr. Kaminer, who became our General Counsel and Secretary in June 2011, the Compensation Committee reviewed information provided by Towers Watson regarding base salaries at peer companies and, based on this information, approved his base salary of $250,000 per year. In December 2011, our Board of Directors approved a base salary of $305,000 per year for Mr. Brandt, our Interim President and Chief Executive Officer. The amount of Mr. Brandt’s base salary was designed such that his base salary plus the value of the restricted stock unit award granted to Mr. Brandt in December 2011 would be approximately equal to Ms. Crane’s salary at the time of her departure and her target bonus for 2011. Because Ms. Gervais became an executive officer in late 2011, and her salary was not modified in connection with her becoming an executive officer, the Compensation Committee was not involved in setting her compensation level for 2011.
82
Table of Contents
Annual cash bonuses. We have an annual management bonus plan under which cash bonuses may be earned by our executive officers and other members of management based on company performance. The employment agreements or offer letters of each of our NEOs generally set forth their initial target bonus levels. Our Compensation Committee generally reviews target bonus levels each fall in anticipation of the coming year. In the first quarter of 2011, Towers Watson presented comparable market data to our Compensation Committee on target bonus levels at peer companies, company financial status and market conditions generally. After considering this information, the Compensation Committee set the target bonus levels for our then-employed NEOs as noted below. Subsequently, in connection with hiring Mr. Kaminer, the Compensation Committee established his target bonus based on reference to peer company data, internal pay equity, the criticality of his role to our company and reflection on current market conditions. Mr. Brandt is not entitled to a pre-specified target bonus. At the time the Compensation Committee set the target bonus levels, Ms. Gervais was not one of our executive officers.
Name | | 2011
Target
Bonus % | | 2010
Target
Bonus % | | Change
(absolute) | | Market
Position
(percentile) | |
Peter C. Brandt | | — | | — | | — | | — | |
Patrick D. Spangler | | 60% | | 60% | | — | | 75th | |
Matthew A. Kaminer | | 40% | | — | | — | | 50th | |
David B. Burlington | | 60% | | 60% | | — | | 60th | |
Rosemary A. Crane | | 75% | | 70% | | 5% | | 60th | |
Joseph B. Kleine | | 70% | | 70% | | — | | 75th | |
The Compensation Committee felt that these target bonus levels (including positioning against the public peer companies and differentiation among officers reflecting their impact to the organization) were appropriate given:
· The belief that the incentive opportunity should make up a larger portion of a NEO’s target total compensation as the executive’s level of responsibility increases; and
· The belief that these levels were internally fair and financially responsible, yet still provided appropriate motivation to executives to achieve our growth objectives.
The actual bonus amounts earned under our management bonus program in any year depend on the achievement of our corporate objectives. The corporate objectives for the bonus program are based on the broader company business plan that is approved each spring by the Compensation Committee. For 2011, the Compensation Committee selected the following three key business metrics from our general business plan:
· sales bookings, meaning total dollar amount of business contracted during the year;
· revenue, measured as GAAP revenue calculated in accordance with our revenue recognition policies in effect at the time; and
· adjusted EBITDA, measured as GAAP net income before income and expenses unrelated to core business activities, such as interest income, other income (expense), net and (benefit from) provision for income taxes; non-recurring income and expenses, such as gain on settlement and change in fair value of contingent consideration, gain on sale-leaseback of building, impairment of intangible and long-lived assets related to EHR, loss on impairment related to EHR business and other expenses (including legal expenses, facilities exit costs, employee severance charges, current period depreciation and amortization expense related to assets assigned to the EHR business and a refund of rent); and non-cash charges, such as depreciation and amortization expense (including intangible assets) related to core business and stock-based compensation.
83
Table of Contents
In order to earn any bonus under the program, we have to achieve the following threshold levels of each metric:
· 95% of our business plan for sales bookings;
· 98% of our business plan for revenue; and
· 97% of our business plan for adjusted EBITDA.
If any one threshold level was missed, no bonus would be earned. If all three threshold levels are achieved, then the actual bonus was calculated based on actual achievement, and the bonus payout for each metric could vary from 0% to 150% of the target bonus amount for that metric based on the actual over- or under-achievement of that metric according to the parameters in the following tables (Note: the maximum payout for the Performance Options is 125%):
Bookings (40% of overall bonus target)
% Attainment | | <95 | % | 95 | % | 100 | % | 108 | % | 115 | % |
Bonus % Payout | | 0 | % | 80 | % | 100 | % | 125 | % | 150 | % |
Revenue (20% of overall bonus target)
% Attainment | | <98 | % | 98 | % | 100 | % | 102 | % | 104 | % |
Bonus % Payout | | 0 | % | 80 | % | 100 | % | 125 | % | 150 | % |
EBITDA (30% of overall bonus target)
% Attainment | | <97 | % | 97 | % | 100 | % | 106 | % | 111 | % |
Bonus % Payout | | 0 | % | 80 | % | 100 | % | 125 | % | 150 | % |
A fourth goal, attaining a certain degree of new product development and level of acquisition revenue, as determined by an internal metric (otherwise known as the freshness index), is worth 10% of the bonus.
For all of our executive officers, 100% of the cash bonus was based on achievement of these financial metrics.
On February 15, 2012, our Compensation Committee determined that the performance goals were not achieved and thus paid no performance bonuses with respect to 2011. At that same meeting, our Compensation Committee elected to grant discretionary bonuses to our employees, including our executive officers as follows:
NEO | | Discretionary Cash Bonus
Payment | |
Peter C. Brandt | | $ | — | |
Patrick D. Spangler | | $ | 87,030 | |
Matthew A. Kaminer | | $ | 25,758 | |
David B. Burlington | | $ | 81,000 | |
Heather A. Gervais | | $ | 45,100 | |
Equity compensation. Our equity incentive program is intended to reward longer-term performance and to help align the interests of our executive officers with those of our stockholders. We believe that if our executive officers own shares of our common stock with values that are significant to them, they will have an incentive to act to maximize longer-term stockholder value instead of short-term gain. To support this philosophy, our equity program emphasizes stock options, and for the executive team, performance stock options that are tied to the achievement of our growth and financial goals. Our grants have traditionally had four year vesting requirements, which in 2010 the Compensation Committee increased to five years to further incent our leadership team to focus on longer-term Company value. Finally, we believe that equity compensation is an integral component of our efforts to attract exceptional executives, senior management and employees.
We currently grant both stock options and occasionally restricted stock units that vest based on time served, as well as performance-based stock options and occasionally performance-based restricted stock units under which performance against corporate metrics in a given year determines the number of shares that may then begin vesting over a subsequent time-based
84
Table of Contents
vesting period. These performance-based equity units are the primary equity award for our NEOs. In determining the mix of awards, the Compensation Committee considers the importance of focusing executives on achieving key metrics from our business plan, the mix of equity awards at our peer companies, the potentially dilutive impact of stock awards, the fair market value of our common stock (and therefore the potential for gains under options as opposed to full value awards in the coming years), current holdings of our executives and the tax consequences to Epocrates and the recipients.
As with cash incentive opportunities, in determining the target equity opportunity for each NEO, the Compensation Committee believes that the incentive opportunity should make up a larger portion of a NEO’s target total compensation as the executive’s level of responsibility increases. For example, the target levels of equity incentives for our CEO are generally greater than the target incentive compensation opportunities afforded to our other NEOs. This approach to internal pay equity reflects the Compensation Committee’s recognition of the relative importance of each executive officer’s contributions to the success of Epocrates. By increasing the portion of total target compensation that is performance-based with increasing levels of responsibility, we believe our compensation program provides appropriate levels of incentive for our executive officers to perform their duties to the best of their abilities.
Aggregate awards in 2011. The following table lists the number and types of awards which each NEO was eligible to receive upon achievement of performance goals under the terms of the 2011 bonus plan. Because Ms. Gervais was not an executive officer at the time the 2011 bonus plan was approved, she was not provided the opportunity to receive performance options for 2011.
| | Estimated��Future Payouts Under
Equity Incentive Plan Awards (1) | | Market
Position for 2011 Performance
Option Opportunity | |
Name | | Threshold (#) | | Target (#) | | Maximum (#) | | (percentile) | |
Peter C. Brandt | | — | | — | | — | | — | |
Patrick D. Spangler | | 27,034 | | 32,968 | | 41,210 | | 60th | |
Matthew A. Kaminer | | — | | — | | — | | — | |
David B. Burlington | | 19,310 | | 23,549 | | 29,436 | | <50th | |
Rosemary A. Crane | | 64,366 | | 78,495 | | 98,119 | | 75th | |
Joseph B. Kleine | | 19,310 | | 23,549 | | 29,436 | | 75th | |
(1) Represents all awards granted under our 2011 executive bonus plan in 2011, which were determined based on performance in 2011. This table shows the awards that were possible at the maximum level of performance. The maximum number of options was granted; however, in February 2012, the Compensation Committee determined that the number of options actually earned is zero for all such awards based on achievement of 2011 corporate goals.
With respect to the performance-based option opportunity, and as further described in the paragraphs below, the Compensation Committee felt that these award levels and differentiation among executive officers were appropriate for several reasons, including:
· The need to attract and retain exceptional talent in a competitive locale for critical executive roles;
· The belief that the incentive opportunity should make up a larger portion of a NEO’s target total compensation as the executive’s level of responsibility increases;
· The overall contribution provided based on tenure with Epocrates and the level of unvested/potential gains;
· Comparable levels of awards for similar positions;
· The desire to be internally consistent by providing each new hire executive officer with an initial option grant that was comparable to grants held by continuing executives; and
· The belief that these levels were internally fair and financially responsible and yet still provided appropriate motivation to executives to achieve our objectives in light of their respective existing aggregate equity holdings.
85
Table of Contents
With the exception of Mr. Brandt, Mr. Kaminer and Ms. Gervais, each of the senior executive team employed during our annual grant cycle were eligible to receive performance-based options. In connection with his offer of employment, Mr. Brandt received time-based stock options and restricted stock units. Also a new hire in the latter part of the fiscal year, Mr. Kaminer received time-based stock option grants so that his overall potential ownership of Epocrates was in line with similar executives, and to ensure his interests were aligned with stockholders.
In addition, in March 2011, the Compensation Committee determined the level of performance goal achievement for the performance-based options granted in 2010. Based on that level of achievement, Ms. Crane’s performance-based restricted stock unit granted under the 2010 bonus plan was determined to cover 35,024 shares, and Mr. Kleine’s performance-based option granted under the 2010 bonus plan was determined to cover 70,048 shares. Each of these performance-based awards was then subject to a three-year time-based vesting schedule, commencing January 1, 2011.
Time-based awards. Because we grant stock options with an exercise price equal to the value of our common stock on the date of grant, these options will have value to our executive officers only if the market price of our common stock increases after the date of grant and through the date of vesting. Historically, stock options granted to our executive officers at hiring vest over 48 months with 25% of the shares vesting on the first anniversary of the vesting commencement date and the remainder vesting monthly over the next 36 months. In 2010, the Compensation Committee increased the vesting period to five years, or 60 months, with initial option grants vesting 20% on the first anniversary of the vesting commencement date and the remainder vesting monthly over 48 months and with on-going option grants vesting monthly over 60 months. These time-based option grants further incent our leadership team to focus on longer-term Company value. We granted time-based stock options that vest over a five-year period to Mr. Kaminer, based on this schedule. In connection with his employment, we granted to Mr. Brandt time-based stock options and time-based restricted stock units that each vest monthly over six months.
Performance-based awards. In order to provide an additional incentive to management to achieve our business objectives while working as a team, and to further align the interests of management with our stockholders, in March 2011, our Compensation Committee approved performance-based stock option opportunities to certain of our NEOs in March 2011. These performance-based option opportunities have largely replaced time-based options for our NEOs, other than grants of time-based options to new hire executives and periodic on-going option grants. After considering information from Towers Watson regarding equity compensation levels at peer companies without benchmarking to a specific level, company financial status and market conditions generally and comparable levels of overall equity holdings at similar stage companies, the Compensation Committee again determined a target number of such options based upon achievement of our goals at 100% performance, with a maximum opportunity up to 125%.
The actual amount of shares that can be earned under the performance-based stock option program in any year depends on the achievement of our corporate objectives. The corporate objectives for the program are based on the broader Company business plan that is approved each spring by our Compensation Committee. For 2011, the Compensation Committee selected the same three key business metrics as under our cash bonus plan with the same weighting, thresholds and maximums. The Compensation Committee felt it was appropriate to use the same metrics as under the cash-based plan because these metrics can be meaningfully influenced by management’s actions and both directly and indirectly reflect Company growth and stockholder value creation.
The number of shares that could be earned for each metric could vary from 0% to 125% of the target amount for that metric based on the actual over- or under-achievement of that metric according to the same parameters that applied to the performance cash bonus in the tables above.
As set forth above, on February 15, 2012, our Compensation Committee determined that the threshold performance goals for 2011 were not achieved and thus none of the shares subject to the performance-based options granted in 2011 vested. Pursuant to the bonus plan, the shares set aside for potential grant under our performance-based options that failed to be earned remain available for future grant under the 2010 Equity Incentive Plan. On January 20, 2012, the Compensation Committee granted time-based stock options as follows: Mr. Spangler and Mr. Burlington each received 60,000 options, Mr. Kaminer received 50,000 options and Ms. Gervais received 16,000 options. These options vest monthly over five years, as described above.
Accelerated vesting. Under the terms of our stock plans and certain executives’ employment agreements and offer letters, the vesting of equity awards may be accelerated in the event of certain material corporate transactions, as well as in the event of certain involuntary terminations of employment following certain material corporate transactions. We believe these accelerated vesting provisions are appropriate in light of the collective knowledge and experiences of our Board members on compensating individuals in the positions held by similarly-situated executive officers at other companies (without reference to any specific peer group or any specific benchmark level of compensation), and therefore allow us to attract and retain high quality executives. In the case of accelerated vesting upon a change-of-control, the accelerated vesting allows our executives to focus on closing a transaction that may be in the best interests of our stockholders even though it may otherwise result in a termination of their employment and therefore a forfeiture of their equity awards.
86
Table of Contents
Severance and change of control benefits
Each of our NEOs, with the exception of Ms. Gervais, is entitled to severance and/or change-of-control benefits, the terms of which are described in detail below under “Executive Employment and Severance Agreements.” With respect to change-of-control benefits, we provide severance compensation if an executive officer is terminated in connection with or subsequent to a change-of-control transaction to further promote the ability of our executive officers to act in the best interests of our stockholders even though they could be terminated following such a transaction. Change-of-control vesting acceleration benefits are structured on a “double-trigger” basis, meaning that the executive officer must experience a constructive termination or a termination without cause in connection with a change-of-control in order for the benefits to become due, which is directly tied to our goal of eliminating, or at least reducing, any reluctance of our NEOs to diligently consider and pursue a potential change-of-control transaction notwithstanding the risk to their own job positions. We also believe that the other severance benefits are appropriate, particularly with respect to a termination by us without cause since, in that scenario, we and the executive have a mutually-agreed-upon severance package that is in place prior to any termination event which provides us with more flexibility to make a change in executive management if such a change is in our stockholders’ best interests. We believe that these severance and changes-of-control benefits are an essential element in our executive compensation packages and assist us in recruiting and retaining talented individuals. The severance and changes-in-control benefits do not influence and are not influenced by other elements of compensation, as these benefits serve different objectives than the other elements of compensation.
Other benefits
We have a 401(k) plan in which substantially all of our employees are entitled to participate. Employees contribute their own funds through salary deductions, on a pre-tax basis. Contributions may be made up to plan limits, subject to government limitations. The plan permits us to make matching contributions if we choose; however, to date we have not made any matching contributions. We provide health care, dental and vision benefits to all full-time employees, including our executive officers. We also have a flexible benefits healthcare plan and a flexible benefits childcare plan under which employees can set aside pre-tax funds to pay for qualified health care expenses and qualified dependent care expenses not reimbursed by insurance. These benefits are available to all employees, subject to applicable laws.
Employee benefits & limited perquisites. Each of our NEOs is eligible to participate in our package of broad-based employee benefit programs, on the same terms and conditions as other employees, including health, dental and vision insurance, medical and dependent care flexible spending accounts, basic life insurance, short- and long-term disability insurance, accidental death and dismemberment insurance and a 401(k) retirement plan. The 401(k) plan permits us to make matching contributions if we choose; however, to date we have not made any matching contributions. We believe these benefits are consistent with benefits provided by other companies based on the experiences and individual knowledge of the members of the Board regarding compensation of similarly-situated executives at other companies (without reliance on third-party surveys of compensation paid to such executives at any specific companies or benchmarking to any specified level of compensation paid by any specific companies) and help us to attract and retain high quality executives.
Equity compensation policies
We encourage our executive officers to hold a significant equity interest in Epocrates. To that end, we adopted equity ownership guidelines that are based on the value of outstanding vested awards (with vested stock options being valued based on the “spread” method) as follows:
· CEO: Four times annual Base Salary;
· CFO: Three times annual Base Salary; and
· Other senior executive officers: Two times annual Base Salary.
In addition, during 2011, we adopted an equity award grant timing policy. We have a policy that prohibits our executive officers, directors and other members of management from engaging in short sales, transactions in put or call options, hedging transactions or other inherently speculative transactions with respect to the Epocrates stock.
87
Table of Contents
Compensation recovery policies
The Compensation Committee has not determined whether it would attempt to recover bonuses from our executive officers if the performance objectives that led to the bonus determination were to be restated, or found not to have been met to the extent originally believed by the Compensation Committee. However, as a public company subject to the provisions of Section 304 of the Sarbanes-Oxley Act of 2002, if we are required as a result of misconduct to restate our financial results due to our material non-compliance with any financial reporting requirements under the federal securities laws, our CEO and CFO may be legally required to reimburse us for any bonus or other incentive-based or equity-based compensation they receive.
Accounting considerations
We account for equity compensation paid to our employees under Financial Accounting Standards Board (“FASB”) Accounting Standards Codification (“ASC”) 718, which requires us to estimate and record an expense over the service period of the award. Our cash compensation is recorded as an expense at the time the obligation is accrued. The accounting impact of our compensation programs is just one of many factors that are considered in determining the size and structure of our programs.
Tax considerations
Subject to certain rules that exempt pre-existing arrangements approved prior to this offering, as a publicly-held company we are not permitted a federal income tax deduction for compensation paid to certain executive officers to the extent that compensation exceeds $1.0 million per covered executive officer in any year. The limitation applies only to compensation that is not performance-based. Non-performance-based compensation paid to our executive officers for 2011 did not exceed the $1.0 million limit for any executive officer and the Compensation Committee does not anticipate that the non-performance-based compensation to be paid to any executive officer for 2012 will be in excess of the deductible limit.
The Compensation Committee believes that in establishing the cash and equity incentive compensation programs for our executive officers, the potential deductibility of the compensation payable under those programs should be only one of a number of relevant factors taken into consideration, and not the sole governing factor. For that reason, the Compensation Committee may deem it appropriate to provide one or more executive officers with the opportunity to earn incentive compensation, whether through cash incentive award programs tied to our financial performance or equity incentive grants tied to the executive officer’s continued service, which may be in excess of the amount deductible by reason of Section 162(m) or other provisions of the Internal Revenue Code. The Compensation Committee believes it is important to maintain this flexibility in determining cash and equity incentive compensation in order to attract and retain high caliber executive officer candidates, even if all or part of that compensation may not be deductible by reason of the Section 162(m) limitation.
Also, the Compensation Committee takes into account whether components of our compensation program may be subject to the penalty tax associated with Section 409A of the Internal Revenue Code and aims to structure the elements of compensation to be compliant with or exempt from Section 409A to avoid such potential adverse tax consequences.
Risk analysis of our compensation plans
The Compensation Committee has reviewed our compensation policies as generally applicable to our employees and believes that our policies do not encourage excessive and unnecessary risk-taking, and that the level of risk that they do encourage is not reasonably likely to have a material adverse effect on us. The Compensation Committee performed an assessment of our compensation programs and policies, with a focus on incentive compensation programs (including our annual bonus program and our equity compensation program). The Compensation Committee reviewed the compensatory objectives and key provisions (including performance goals) of those programs and considered the potential for a participant to engage in risk-taking behavior to earn awards under those programs, as well as the risk mitigation features associated with those programs. Following such assessment, the Compensation Committee believes that the design of our compensation policies and programs encourage our employees to remain focused on both our short- and long-term goals. For example, while our cash bonus plans measure performance on an annual basis, our equity awards typically vest over a number of years, which the Compensation Committee believes encourages our employees to focus on sustained stock price appreciation, thus limiting the potential value of excessive risk-taking.
88
Table of Contents
Compensation Committee Report (1)
The Compensation Committee has reviewed and discussed with management the Compensation Discussion and Analysis contained in this Annual Report on Form 10-K. Based on this review and discussion, the Compensation Committee has recommended to the Board that the Compensation Discussion and Analysis be included in Epocrates’ Annual Report on Form 10-K for the fiscal year ended December 31, 2011 and in Epocrates’ Proxy Statement.
Dr. Philippe O. Chambon
Mr. Thomas L. Harrison
(1) This Section is not “soliciting material,” is not deemed “filed” with the SEC and is not to be incorporated by reference in any filing of Epocrates under the Securities Act of 1933, as amended, or the Securities Exchange Act of 1934, as amended, whether made before or after the date hereof and irrespective of any general incorporation language in that filing.
Compensation Committee Interlocks and Insider Participation
During the last fiscal year, none of the members of our Compensation Committee was one of our officers or employees. None of our executive officers serves, or has served in the past year, as a member of the Board or Compensation Committee of any entity that has one or more executive officers who have served on our Board or Compensation Committee. Our Board noted that Mr. Harrison did not derive any direct or indirect material benefit from the agreements between Epocrates and certain subsidiaries of Diversified Agency Services, Inc. (“DAS”), where Mr. Harrison serves as the CEO, as described in greater detail below. Our Board believes that such agreements are in Epocrates’ best interest and on terms no less favorable than could be obtained from other third parties.
We have entered into various agreements with Cline Davis & Mann, Inc. and, beginning in 2009, with SSCG Media Group, a division of Cline Davis & Mann, whereby we provided various marketing, educational, media and creative services through our DocAlert channel. Cline Davis & Mann is a subsidiary of DAS. We recorded no revenue from Cline Davis & Mann for the year ended December 31, 2011 and recorded revenue from SSCG Media Group of approximately $4.9 million for the same period. As of December 31, 2011, there were approximately $1.0 million in accounts receivable from this customer.
We provided services to Porter Novelli, also a DAS subsidiary. In connection with these services, we recorded revenue from Porter Novelli of approximately $0.2 million for the year ended December 31, 2011. At December 31, 2011, there was an insignificant amount of accounts receivable from this customer.
Mr. Harrison does not have a direct or indirect material interest in these transactions and these transactions are immaterial to DAS.
89
Table of Contents
Compensation of Executive Officers
Summary Compensation Table
The following table shows for the fiscal year ended December 31, 2011, and, with respect to certain individuals, fiscal years ended December 31, 2010 and 2009, compensation awarded to or paid to, or earned by, Epocrates’ CEO, CFO and its three other most highly compensated executive officers at December 31, 2011, and two former executive officers who departed from Epocrates during 2011 (the “NEOs”).
Name and
principal position | | Year | | Salary
($) | | Bonus
($) | | Stock
awards
($)(1) | | Option
awards
($)(1) | | Non-equity
incentive
plan
compensation
($) | | All other
compensation
($) | | Total
($) | |
| | | | | | | | | | | | | | | | | |
Peter C. Brandt, Interim President and CEO (2) | | 2011 | | 38,126 | | — | | 180,000 | | 909,948 | | — | | 58,486 | (3) | 1,186,560 | |
Patrick D. Spangler, CFO (4) | | 2011 | | 300,000 | | 87,030 | (5) | — | | — | | — | | 1,032 | (6) | 388,062 | |
| | 2010 | | 73,864 | | — | | — | | 1,767,333 | | 53,093 | (7) | 65 | (6) | 1,894,355 | |
Matthew A. Kaminer,
General Counsel and Secretary | | 2011 | | 128,788 | | 25,758 | (5) | — | | 410,905 | | — | | 177 | (8) | 565,628 | |
David B. Burlington, Chief Operations Officer (9) | | 2011 | | 270,000 | | 81,000 | (5) | — | | — | | — | | 360 | (6) | 351,360 | |
| | 2010 | | 36,818 | | — | | — | | 1,606,399 | | 26,465 | (7) | 45 | (6) | 1,669,727 | |
Heather A. Gervais, Senior Vice President, Commercial Operations | | 2011 | | 205,000 | | 47,100 | (10) | — | | — | | — | | 1,266 | (11) | 253,366 | |
Rosemary A. Crane, Former President and CEO | | 2011 | | 333,940 | | — | | — | | — | | — | | 836,186 | (12) | 1,170,126 | |
| | 2010 | | 350,000 | | — | | 467,923 | | — | | 293,510 | (7) | 60,552 | (13) | 1,171,985 | |
| | 2009 | | 340,000 | | — | | — | | 4,238,756 | | 102,000 | (14) | 55,529 | (15) | 4,736,285 | |
Joseph B. Kleine, Former Chief Commercial Officer | | 2011 | | 256,667 | | — | | — | | — | | — | | 23,993 | (16) | 280,660 | |
| | 2010 | | 272,120 | | 40,000 | (17) | — | | 418,693 | | 234,808 | (7) | 360 | (6) | 965,981 | |
| | 2009 | | 218,693 | | 40,000 | | — | | 752,340 | | 215,034 | (18) | 137,380 | (19) | 1,363,447 | |
(1) Amounts shown in this column do not reflect dollar amounts actually received by our NEOs. Instead, these amounts reflect the aggregate grant date fair value of each stock option granted computed in accordance with the provisions of FASB ASC Topic 718. As required by SEC rules, the amounts shown for performance-based grants exclude the impact of estimated forfeitures related to service-based vesting conditions. Assumptions used in the calculation of these amounts are included in Note 14 to our audited financial statements for the fiscal year ended December 31, 2011 included in this Annual Report on Form 10-K. Our NEOs will only realize compensation to the extent the trading price of our common stock is greater than the exercise price of such stock options.
(2) Mr. Brandt’s employment with us commenced in November 2011. With respect to restricted stock and stock options granted to Mr. Brandt, the awards vest monthly over six months for so long as Mr. Brandt is serving as our Interim President and Chief Executive Officer.
90
Table of Contents
(3) | Represents $48,625 for services rendered as a non-employee member of the Board of Directors and Audit Committee, and as Chair of the Compensation Committee, $9,792 of reimbursement for personal travel and $69 for costs related to group term life insurance premiums. |
| |
(4) | Mr. Spangler’s employment with us commenced in September 2010. |
| |
(5) | Represents discretionary bonus to be paid in 2012 for performance in 2011. These bonuses were approved by our Compensation Committee on February 15, 2012. |
| |
(6) | Represents costs related to group term life insurance premiums. |
| |
(7) | Represents cash bonuses paid in 2011 for performance in 2010 pursuant to our 2010 Cash Bonus Plan. Cash bonuses pursuant to our 2010 Cash Bonus Plan were approved by our Compensation Committee on March 24, 2011. |
| |
(8) | Represents $72 of costs related to group term life insurance premiums and $105 of amounts paid for gym reimbursement. |
| |
(9) | Mr. Burlington’s employment with us commenced in October 2010. |
| |
(10) | Represents $2,000 of cash referral bonus paid to Ms. Gervais in 2010 and $45,100 of discretionary bonus to be paid in 2012 for performance in 2011. This bonus was approved by our Compensation Committee on February 15, 2012. |
| |
(11) | Represents $66 for costs related to group term life insurance premiums and $1,200 for amounts paid for opting out of Epocrates’ medical insurance benefit plan. |
| |
(12) | Represents $529 for costs related to group term life insurance premiums, $20,000 for Ms. Crane’s living allowance, $146,061 of severance benefits and $669,596 related to the acceleration of vesting and extension of time to exercise shares. For a description of Ms. Crane’s living allowance, see the section entitled “Executive Employment and Severance Agreements.” |
| |
(13) | Represents $552 for costs related to group term life insurance premiums and $60,000 for Ms. Crane’s living allowance. |
| |
(14) | Represents cash bonus paid in 2010 for performance in 2009 pursuant to our 2009 Cash Bonus Plan. |
| |
(15) | Represents $529 for costs related to group term life insurance premiums and $55,000 for Ms. Crane’s living allowance. |
| |
(16) | Represents $330 of costs related to group term life insurance premiums, $330 of amounts paid for gym reimbursement and $23,333 of severance benefits. |
| |
(17) | Represents a cash bonus associated with Mr. Kleine’s promotion. |
| |
(18) | Represents a cash payment of $39,240 made in 2010 for performance in 2009 pursuant to our 2009 Cash Bonus Plan and a cash payment of $175,794 made for performance in 2009 pursuant to our commission plan. |
| |
(19) | Represents $303 for costs related to group term life insurance premiums and $137,077 paid to Mr. Kleine in connection with a tender offer completed in 2009. |
91
Table of Contents
2011 Plan-Based and Other Awards
The following table sets forth certain information regarding plan-based and other awards to our NEOs during the year ended December 31, 2011.
| | | | Estimated Future Payouts
Under Non-Equity
Incentive Plan Awards | | Estimated Future Payouts
Under Equity Incentive Plan
Awards (1) | | All Other
Stock
Awards:
Number of
Shares of | | All Other
Option
Awards:
Number of
Securities | | Exercise
or Base
Price of
Option | | Grant
Date Fair
Value of Stock and
Option | |
| | Grant | | Threshold | | Target | | Maximum | | Threshold | | Target | | Maximum | | Stock | | Underlying | | Awards | | Awards | |
Name | | Date | | ($) | | ($) | | ($) | | (#) | | (#) | | (#) | | or Units (#) | | Options (#) | | ($/Share) | | ($) | |
Peter C. Brandt | | 12/7/11 | | — | | — | | — | | — | | — | | — | | 20,595 | (2) | 150,000 | (2) | 8.74 | | 832,320 | |
Matthew S. Kaminer | | 6/27/11 | | 42,261 | | 51,538 | | 77,308 | | — | | — | | — | | — | | 50,000 | (3) | 17.95 | | 410,905 | |
Patrick D. Spangler | | 3/24/11 | | 147,600 | | 180,000 | | 270,000 | | 27,034 | | 32,968 | | 41,210 | | — | | — | | — | | — | |
David B. Burlington | | 3/24/11 | | 132,840 | | 162,000 | | 243,000 | | 19,310 | | 23,549 | | 29,436 | | — | | — | | — | | — | |
Heather A. Gervais | | — | | — | | — | | — | | — | | — | | — | | — | | — | | — | | — | |
Rosemary A. Crane | | 3/24/11 | | 233,700 | | 285,000 | | 427,500 | | 64,366 | | 78,495 | | 98,119 | | — | | — | | — | | — | |
Joseph B. Kleine | | 3/24/11 | | 160,720 | | 196,000 | | 294,000 | | 19,310 | | 23,549 | | 29,436 | | — | | — | | — | | — | |
(1) | Represents all awards granted under our 2011 executive bonus plan in 2011, which were determined based on performance in 2011. This table shows the awards that are possible at the threshold, target and maximum levels of performance. The maximum number of options was granted, but the number of options actually earned is subject to reduction based on achievement of 2011 corporate goals. Once determined, the shares subject to the option or restricted stock unit will vest in 36 equal monthly installments, subject in each case to the recipient’s continued service. In February 2012, the Compensation Committee determined that the number of options actually earned is zero for all such awards based on achievement of 2011 corporate goals. |
| |
(2) | The stock options and awards were granted under our 2010 Equity Incentive Plan. The shares subject to each stock option vest over 6 equal monthly installments, for so long as Mr. Brandt is serving as our Interim President and Chief Executive Officer. |
| |
(3) | The stock options were granted under our 2010 Equity Incentive Plan. The shares subject to this stock option vest as to 20% of the shares subject to the option after one year, with the remaining shares subject to the stock option vesting on an equal monthly basis over the following 48 months, subject in each case to recipient’s continued service. |
92
Table of Contents
2011 Outstanding Equity Awards at Fiscal Year-End
The following table sets forth certain information regarding outstanding equity awards for our NEOs as of December 31, 2011:
| | Option awards | | Stock awards | |
Name | | Number of
securities
underlying
unexercised
options
(#)
exercisable (1) | | Number of
securities
underlying
unexercised
options
(#)
unexercisable | | Equity
Incentive
Plan
Awards:
Number of
Securities Underlying
Unexercised
Unearned
Options (#) | | Option
exercise
price ($) | | Option
expiration
date | | Number
of
shares or
units of
stock that
have not
vested
(#) | | Market
value
of shares or
units of
stock
that
have not
vested
($) | |
| | | | | | | | | | | | | | | |
Peter C. Brandt | | 16,375 | | 3,275 | (2) | — | | 16.00 | | 1/31/21 | | — | | — | |
| | 7,860 | | 3,930 | (2) | — | | 21.98 | | 5/05/21 | | — | | — | |
| | 25,000 | | 125,000 | (3) | — | | 8.74 | | 12/06/21 | | 17,163 | (4) | 166,309 | (5) |
| | | | | | | | | | | | | | | |
Patrick D. Spangler | | 70,406 | | 231,334 | (6) | — | | 13.36 | | 10/27/20 | | — | | — | |
| | — | | — | | 41,210 | (7) | 22.97 | | 3/24/21 | | — | | — | |
| | | | | | | | | | | | | | | |
Matthew A. Kaminer | | — | | 50,000 | (6) | — | | 17.95 | | 6/26/21 | | — | | — | |
| | | | | | | | | | | | | | | |
David B. Burlington | | 55,356 | | 200,138 | (6) | — | | 13.99 | | 12/21/20 | | — | | — | |
| | — | | — | | 29,436 | (7) | 22.97 | | 3/24/21 | | — | | — | |
| | | | | | | | | | | | | | | |
Heather A. Gervais | | 2,947 | | 8,843 | (6) | — | | 13.36 | | 10/27/20 | | — | | — | |
| | | | | | | | | | | | | | | |
Rosemary A. Crane | | 31,440 | | — | | — | | 13.26 | | 11/15/12 | (8) | — | | — | |
| | 657,726 | | — | | — | | 12.11 | | 11/15/12 | (8) | — | | — | |
| | 43,799 | | — | | — | | 12.11 | | 11/15/12 | (8) | — | | — | |
| | | | | | | | | | | | | | | |
Joseph B. Kleine | | 7,860 | | — | | — | | 4.29 | | 1/25/16 | | — | | — | |
| | 15,719 | | — | | — | | 5.95 | | 7/17/16 | | — | | — | |
| | 6,288 | | — | | — | | 5.50 | | 4/29/17 | | — | | — | |
| | 47,159 | | — | | — | | 13.17 | | 11/05/17 | | — | | — | |
| | 27,386 | | — | | — | | 13.26 | | 1/30/18 | | — | | — | |
| | 81,875 | | — | | — | | 10.17 | | 12/16/19 | | — | | — | |
| | 19,457 | | — | | — | | 13.36 | | 8/24/20 | | — | | — | |
(1) | Fully vested. |
| |
(2) | The shares subject to this stock option vest in equal monthly installments over 12 months, subject in each case to the recipient’s continued service. |
| |
(3) | The shares subject to this stock option vest in equal monthly installments over six months, subject to the recipient’s continued service as interim CEO. |
| |
(4) | The shares subject to this restricted stock award vest in equal monthly installments over six months, subject to the recipient’s continued service as interim CEO. |
| |
(5) | The value is determined based on the closing price of our stock on 1/31/12 of $9.69 per share multiplied by the number of shares that have not vested, without taking into account any taxes that may be payable in connection with the transaction. |
93
Table of Contents
(6) | The shares subject to this stock option vest as to 20% of the shares subject to the option after one year, with the remaining shares subject to the stock option vesting on an equal monthly basis over the following 48 months, subject in each case to recipient’s continued service. |
| |
(7) | Represents shares subject to outstanding and unearned options granted pursuant to our 2011 bonus plan. |
| |
(8) | Pursuant to the Severance Agreement entered into with Ms. Crane on December 9, 2011, the vested portion of any unexercised stock options held by Ms. Crane will remain exercisable for a period of one year from November 16, 2011, which was the date of her termination. |
2011 OPTION EXERCISES AND STOCK VESTED
The following table sets forth certain information regarding option awards exercised and restricted stock units vested by our NEOs during 2011.
| | Option Awards | | Restricted Stock Units | |
Name | | Number of shares
acquired on exercise | | Value realized
on exercise (1) | | Number of
shares vested | | Value realized
on vesting (2) | |
| | | | | | | | | |
Peter C. Brandt | | — | | — | | 3,432 | | $ | 28,314 | |
| | | | | | | | | |
Patrick D. Spangler | | — | | — | | — | | — | |
| | | | | | | | | |
Matthew A. Kaminer | | — | | — | | — | | — | |
| | | | | | | | | |
David B. Burlington | | — | | — | | — | | — | |
| | | | | | | | | |
Heather A. Gervais | | — | | — | | — | | — | |
| | | | | | | | | |
Rosemary A. Crane | | — | | — | | 10,215 | | $ | 79,064 | |
| | | | | | | | | |
Joseph B. Kleine | | 49,762 | | $ | 422,479 | | — | | — | |
| | | | | | | | | | | |
(1) | The value realized on exercise is determined based on the price sold multiplied by the number of shares that were exercised and subtracting the exercise price, without taking into account any taxes that may be payable in connection with the transaction. |
| |
(2) | The value realized upon vesting is determined by multiplying the number of restricted stock units by the market value of the underlying shares on the vesting date. |
Pension Benefits
Our NEOs did not participate in, or otherwise receive any benefits under, any pension or retirement plan sponsored by us during 2011.
Non-qualified Deferred Compensation
We do not currently maintain non-qualified defined contribution plans or other deferred compensation plans.
Executive Employment and Severance Agreements
Peter C. Brandt. In December 2011, we entered into an offer letter with Peter C. Brandt, our Interim President and Chief Executive Officer. The offer letter provides for a monthly base salary of $25,417. Pursuant to the offer letter, Mr. Brandt was granted a restricted stock unit award covering 20,595 shares of common stock and an option to purchase 150,000 shares of our common stock, each pursuant to our 2010 Equity Incentive Plan. Mr. Brandt’s stock option has a per share exercise price of $8.74, the fair market value of our common stock on the date of grant, as determined by our Board. The restricted stock and the stock options vest monthly over six months for so long as Mr. Brandt is serving as our Interim President and Chief Executive Officer. The offer letter specifies that Mr. Brandt’s employment is at-will.
94
Table of Contents
Patrick D. Spangler. In January 2011, we entered into an amended and restated offer letter with Patrick D. Spangler, our Chief Financial Officer. The amended and restated offer letter was amended in June 2011. The amended and restated offer letter, as amended, provides for an initial annualized base salary of $300,000 plus a target bonus of 60% of his base salary under our bonus plan based upon successful completion of the objectives set forth in the plan, as determined by our Board. Pursuant to the amended and restated offer letter, as amended, Mr. Spangler was granted an option to purchase 150,870 shares of our common stock under our 2008 Equity Incentive Plan, with a per share exercise price of $13.36, the fair market value of our common stock on the date of grant, as determined by our Board. This stock option vests as to 20% of the shares on the first annual anniversary of the vesting commencement date and the remainder will vest monthly thereafter over four years, such that on the fifth anniversary of the vesting commencement date of the stock option, the shares shall be fully vested. In addition, Mr. Spangler was granted an additional option to purchase 150,870 shares of our common stock under our 2008 Equity Incentive Plan, with a per share exercise price of $13.36, the fair market value of our common stock on the date of grant, as determined by our Board. This stock option will vest as to 20% of the shares on the first annual anniversary of the vesting commencement date and the remainder will vest monthly thereafter over four years, such that on the fifth anniversary of the vesting commencement date of the stock option, the shares shall be fully vested. The amended and restated offer letter, as amended, specifies that Mr. Spangler’s employment is at-will.
Pursuant to the amended and restated offer letter, as amended, if Mr. Spangler’s employment is terminated without cause, subject to his general release of all known and unknown claims, Mr. Spangler shall be entitled to receive severance pay equal to nine months of his base salary in effect as of the termination date (less required deductions and withholdings) to be paid in the form of salary continuation on our standard payroll dates following such termination, and if he timely elects continued group health insurance coverage through COBRA, we will be obligated to pay his COBRA premiums necessary to continue his group health insurance coverage at the same level as in effect as of the termination date for nine months after his termination or until he becomes eligible for group health insurance coverage through a new employer, whichever occurs first.
The amended and restated offer letter, as amended, further provides, in the event that, within twelve months after a change-of-control of Epocrates, Mr. Spangler’s employment is terminated without cause or if Mr. Spangler resigns for good reason, subject to his general release of all known and unknown claims, Mr. Spangler shall be entitled to receive severance pay equal to nine months of his base salary in effect as of the termination date (less required deductions and withholdings) to be paid in the form of salary continuation on our standard payroll dates following such termination, and if he timely elects continued group health insurance coverage through COBRA, we will be obligated to pay his COBRA premiums necessary to continue his group health insurance coverage at the same level as in effect as of the termination date for nine months after his termination or until he becomes eligible for group health insurance coverage through a new employer, whichever occurs first. In addition, except as described above, in connection with such termination of employment, the vesting of Mr. Spangler’s stock options shall accelerate in full.
Matthew A. Kaminer. In June 2011, we entered into an offer letter with Matthew A. Kaminer, our General Counsel and Secretary. The offer letter provides for an initial annualized base salary of $250,000 plus a target bonus of 40% of his base salary under our bonus plan based upon successful completion of the objectives set forth in the plan, as determined by our Board. Pursuant to the offer letter, Mr. Kaminer was granted an option to purchase 50,000 shares of our common stock under our 2010 Equity Incentive Plan, with a per share exercise price of $17.95, the fair market value of our common stock on the date of grant, as determined by our Board. This stock option vests as to 20% of the shares on the first annual anniversary of the vesting commencement date and the remainder will vest monthly thereafter over four years, such that on the fifth anniversary of the vesting commencement date of the stock option, the shares shall be fully vested. The offer letter specifies that Mr. Kaminer’s employment is at-will.
Pursuant to the offer letter, if Mr. Kaminer’s employment is terminated without cause, subject to his general release of all known and unknown claims, Mr. Kaminer shall be entitled to receive severance pay equal to six months of his base salary in effect as of the termination date (less required deductions and withholdings) to be paid in the form of salary continuation on our standard payroll dates following such termination, and if he timely elects continued group health insurance coverage through COBRA, we will be obligated to pay his COBRA premiums necessary to continue his group health insurance coverage at the same level as in effect as of the termination date for six months after his termination or until he becomes eligible for group health insurance coverage through a new employer, whichever occurs first.
The offer letter further provides, in the event that, within twelve months after a change-of-control of Epocrates, Mr. Kaminer’s employment is terminated without cause or if Mr. Kaminer resigns for good reason, subject to his general release of all known and unknown claims, Mr. Kaminer shall be entitled to receive severance pay equal to nine months of his base salary in effect as of the termination date (less required deductions and withholdings) to be paid in the form of salary continuation on our standard
95
Table of Contents
payroll dates following such termination, and if he timely elects continued group health insurance coverage through COBRA, we will be obligated to pay his COBRA premiums necessary to continue his group health insurance coverage at the same level as in effect as of the termination date for nine months after his termination or until he becomes eligible for group health insurance coverage through a new employer, whichever occurs first. In addition, in connection with such termination of employment, the vesting of Mr. Kaminer’s stock options shall accelerate in full.
David B. Burlington. In October 2010, we entered into an offer letter with David B. Burlington, our Chief Operations Officer. The offer letter provides for an initial annualized base salary of $270,000 plus a target bonus of 60% of his base salary under our bonus plan based upon successful completion of the objectives set forth in the plan, as determined by our Board. Pursuant to the offer letter, Mr. Burlington was granted an option to purchase 255,494 shares of our common stock under our 2008 Equity Incentive Plan, with a per share exercise price of $13.99, the fair market value of our common stock on the date of grant, as determined by our Board. This stock option vests as to 20% of the shares on the first annual anniversary of the vesting commencement date and the remainder will vest monthly thereafter over four years, such that on the fifth anniversary of the vesting commencement date of the stock option, the shares shall be fully vested. The offer letter specifies that Mr. Burlington’s employment is at-will.
Pursuant to the offer letter, if Mr. Burlington’s employment is terminated without cause, subject to his general release of all known and unknown claims, Mr. Burlington shall be entitled to receive severance pay equal to six months of his base salary in effect as of the termination date (less required deductions and withholdings) to be paid in the form of salary continuation on our standard payroll dates following such termination, and if he timely elects continued group health insurance coverage through COBRA, we will be obligated to pay his COBRA premiums necessary to continue his group health insurance coverage at the same level as in effect as of the termination date for six months after his termination or until he becomes eligible for group health insurance coverage through a new employer, whichever occurs first.
The offer letter further provides, in the event that, within twelve months after a change-of-control of Epocrates, Mr. Burlington’s employment is terminated without cause or if Mr. Burlington resigns for good reason, subject to his general release of all known and unknown claims, Mr. Burlington shall be entitled to receive severance pay equal to nine months of his base salary in effect as of the termination date (less required deductions and withholdings) to be paid in the form of salary continuation on our standard payroll dates following such termination, and if he timely elects continued group health insurance coverage through COBRA, we will be obligated to pay his COBRA premiums necessary to continue his group health insurance coverage at the same level as in effect as of the termination date for nine months after his termination or until he becomes eligible for group health insurance coverage through a new employer, whichever occurs first. In addition, in connection with such termination of employment, the vesting of Mr. Burlington’s stock options shall accelerate in full.
Heather A. Gervais. Ms. Gervais has served as our Senior Vice President of Commercial Operations since November 2011. Ms. Gervais joined Epocrates in September 2010 as the Vice President of Client Services. Ms. Gervais’ current base salary is $240,000. She participates in our annual bonus plan and her target bonus upon her promotion in 2011 was 40%.
Rosemary A. Crane. Ms. Crane served as our Chief Executive Officer from February 2009 until November 16, 2011. Pursuant to her offer letter dated February 25, 2009, as amended in April 2011, Ms. Crane is receiving: (i) continuation of her base salary of $380,000 per year, as severance, until November 16, 2012; (ii) COBRA premiums necessary to continue her group health insurance coverage at the same level as in effect as of the termination date for up to twelve months (or earlier, if she becomes eligible for comparable coverage) from November 16, 2011; and (iii) the acceleration of vesting of 183,883 options to purchase our common stock at $12.11 per share. In December 2011, we and Ms. Crane entered into a severance agreement providing for the terms of her severance, including, in addition to the severance benefits she is entitled to under her offer letter, that: (i) Ms. Crane would receive an additional severance payment of $100,000; and (ii) Ms. Crane would be allowed to exercise the vested portion of any unexercised options held by her for a period of one year from her date of termination.
Joseph B. Kleine. Mr. Kleine served as our Chief Commercial Officer from February 2010 until November 30, 2011. On November 8, 2011, we entered into a separation and release agreement with Mr. Kleine. Under the separation and release agreement, Mr. Kleine will receive: (i) continuation of his base salary payable over a six-month period commencing December 1, 2011 for a total of $140,000; and (ii) COBRA premiums necessary to continue his group health insurance coverage at the same level as in effect as of the termination date for up to six months (or earlier, if he becomes eligible for comparable coverage) from December 1, 2011. The separation and release agreement contains confidentiality obligations that survive indefinitely and non-solicitation and non-competition obligations that end on May 30, 2012. The severance payments and other post-employment benefits due to Mr. Kleine under the separation and release agreement are subject to Mr. Kleine’s continued compliance with these covenants.
96
Table of Contents
Potential Payments Upon Termination of Employment
The following table estimates the potential payments and benefits payable upon employment termination for each NEO as if his or her employment had been terminated on December 31, 2011, the last business day of our prior fiscal year.
| | No Change-of-Control (1) | | Change-of-Control | |
| | Termination without Cause (2) ($) | | Termination without Cause or for
Good Reason (3) ($) | |
Name | | Base
salary | | COBRA
premiums | | Vesting acceleration(4) | | Base
salary | | COBRA
premiums | | Vesting
acceleration(4) | |
Peter C. Brandt | | — | | — | | — | | — | | — | | 133,871 | |
| | | | | | | | | | | | | |
Patrick D. Spangler | | 225,000 | (5) | 16,713 | (6) | — | | 225,000 | (5) | 16,713 | (6) | — | |
| | | | | | | | | | | | | |
Matthew A. Kaminer | | 125,000 | (7) | 11,142 | (8) | — | | 187,500 | (5) | 16,713 | (6) | — | |
| | | | | | | | | | | | | |
David B. Burlington | | 135,000 | (7) | 3,144 | (9) | — | | 202,500 | (5) | 4,716 | (10) | — | |
| | | | | | | | | | | | | |
Heather A. Gervais | | — | | — | | — | | — | | — | | — | |
| | | | | | | | | | | | | |
Rosemary A. Crane | | 380,000 | (11) | 17,637 | (11) | 193,510 | (11) | — | | — | | — | |
| | | | | | | | | | | | | |
Joseph B. Kleine | | 140,000 | (12) | 8,995 | (12) | — | | — | | — | | — | |
(1) | A “change-of-control” generally means the consummation of any transaction by Epocrates whereby fifty percent (50%) or more of the voting stock of Epocrates changes ownership pursuant to that transaction. |
| |
(2) | “Cause” is generally defined as the NEO’s: |
| |
· | embezzlement, misappropriation of corporate funds, or other material acts of dishonesty; |
| |
· | conviction, plea of guilty, or nolo contendere to any felony (not involving the operation of a motor vehicle), or of any misdemeanor involving moral turpitude; |
| |
· | engagement in any activity that such NEO knows or should know could materially harm the business or reputation of Epocrates, provided that such activity is not undertaken in a good faith belief that such action was in the best interest of Epocrates; |
| |
· | material violation of any statutory, contractual, or common law duty or obligation owed to Epocrates, including, without limitation, a material breach of any confidentiality obligation and the duty of loyalty which causes demonstrable injury to Epocrates; or |
| |
· | repeated failure, in the reasonable judgment of Epocrates, to substantially perform his or her assigned duties or responsibilities after written notice from Epocrates describing the failure(s) in reasonable detail and such NEO’s failure to cure such failure (s) within thirty (30) days of receiving such written notice, provided that written notice only must be provided if the failure (s) are capable of cure. |
| |
(3) | “Good Reason” is generally defined as the following actions taken without the consent of the NEO following the consummation of a change-of-control of Epocrates that terminates such NEO’s employment (in each case where the NEO has provided written notice within 30 days of the action, such action is not remedied by Epocrates within 30 days following such notice, and such termination occurs within ninety (90) days following the initial existence of one or more of the conditions that constitute Good Reason): |
97
Table of Contents
· | a relocation of the NEO’s assigned office which results in an increase in his or her one-way commuting distance by more than thirty-five (35) miles; |
| |
· | a material decrease in the then current base salary of the NEO (except for salary decreases generally applicable to Epocrates’ other executive employees); or |
| |
· | a material reduction in the scope of the NEO’s duties or responsibilities in effect immediately prior to the change-of-control of Epocrates. |
| |
(4) | The value of vesting acceleration is calculated based on the closing price of our common stock on December 31, 2011 with respect to unvested option shares or unvested awards subject to acceleration minus the exercise price of the unvested option shares. |
| |
(5) | Represents continuation of base salary for a period of nine months. |
| |
(6) | Represents payment of nine months of continued COBRA premiums for medical, dental and vision coverage, calculated at $1,856.99 per month for the 12-month period ended December 31, 2011, including a 2% administrative fee. |
| |
(7) | Represents continuation of base salary for a period of six months. |
| |
(8) | Represents payment of six months of continued COBRA premiums for medical, dental and vision coverage, calculated at $1,856.99 per month for the 12-month period ended December 31, 2011, including a 2% administrative fee. |
| |
(9) | Represents payment of six months of continued COBRA premiums for medical, dental and vision coverage, calculated at $524.01 per month for the 12-month period ended December 31, 2011, including a 2% administrative fee. |
| |
(10) | Represents payment of nine months of continued COBRA premiums for medical, dental and vision coverage, calculated at $524.01 per month for the 12-month period ended December 31, 2011, including a 2% administrative fee. |
| |
(11) | Represents actual amount for Ms. Crane, as she did not have an employment agreement at December 31, 2011. |
| |
(12) | Represents actual amount for Mr. Kleine, as he did not have an employment agreement at December 31, 2011. |
Non-Employee Director Compensation
Cash Compensation Arrangements
Effective October 2009, each non-employee director, other than the Chairperson of the Board, was entitled to an annual retainer of $10,000 per year, payable quarterly. The Chairperson of the Board was entitled to an annual retainer of $15,000 per year, payable quarterly. In addition, all members of our Board were reimbursed for travel, lodging and other reasonable expenses incurred in attending Board or committee meetings.
Following the completion of our initial public offering in February 2011, we pay each of our non-employee directors as applicable:
· $30,000 per year for service as a Board member, payable quarterly;
· $25,000 per year for service as Chairperson of the Board, payable quarterly;
· $20,000 per year for service as Chairperson of the Audit Committee, payable quarterly;
· $15,000 per year for service as Chairperson of the Compensation Committee, payable quarterly;
98
Table of Contents
· $10,000 per year for service as Chairperson of the Corporate Governance and Nominating Committee, payable quarterly;
· $1,000 for each Board meeting attended in person;
· $500 for each Board meeting attended telephonically or by videoconference;
· $12,000 per year for service on the Audit Committee, payable quarterly; and
· $7,000 per year for service on the Compensation Committee and Corporate Governance and Nominating Committee, payable quarterly.
In lieu of the cash compensation set forth above, each non-employee director may elect to receive an option to purchase our common stock exercisable for a number of shares equal to the total cash compensation divided by the fair market value of our common stock on the date of grant.
All members of our Board will continue to be reimbursed for certain expenses in connection with attendance at Board and committee meetings.
2011 Director Compensation
The following table provides compensation information for all of our non-employee directors during 2011, with the exception of Mr. Brandt, who ceased to be a non-employee director upon his appointment as Interim President and Chief Executive Officer. Mr. Brandt’s compensation as a non-employee director is included in the tables in the sections titled “Summary Compensation Table,” “2011 Grants of Plan-Based Awards,” “2011 Outstanding Equity Awards at Fiscal Year-End,” and “2011 Option Exercises and Stock Vested” as set forth in this Annual Report on Form 10-K:
Name | | Fees earned or
paid in cash ($) | | Option awards
($)(1)(2)(3) | | Total ($) | |
| | | | | | | |
Philippe O. Chambon | | 46,750 | | 118,644 | | 165,394 | |
| | | | | | | |
Thomas L. Harrison | | 38,583 | | 118,644 | | 157,227 | |
| | | | | | | |
Gary G. Greenfield | | 11,500 | | 140,633 | | 152,133 | |
| | | | | | | |
Patrick S. Jones | | 81,167 | | 118,644 | | 199,811 | |
| | | | | | | |
Erick N. Tseng | | 10,000 | | 94,477 | | 104,477 | |
| | | | | | | |
Mark A. Wan | | 38,500 | | 118,644 | | 157,144 | |
(1) | Amounts shown in this column do not reflect dollar amounts actually received by our directors. Instead, these amounts reflect the aggregate grant date fair value of each stock option granted in the fiscal year ended December 31, 2011 computed in accordance with the provisions of ASC 718. Assumptions used in the calculation of these amounts are included in Note 14 to our audited financial statements for the fiscal year ended December 31, 2011 included in this Annual Report on Form 10-K. Only one option was granted to each non-employee director in 2011, and the grant date fair value of each option is set forth in the table. Our directors will only realize compensation to the extent the trading price of our common stock is greater than the exercise price of such stock options. |
| |
(2) | As of December 31, 2011, the aggregate number of shares subject to outstanding option awards held by each of the directors listed in the table above was as follows: Dr. Chambon, 43,230 shares; Mr. Harrison, 175,539 shares; Mr. Greenfield, 19,650 shares; Mr. Jones, 120,519 shares; Mr. Tseng, 19,650 shares; and Mr. Wan, 43,230 shares. |
| |
(3) | 1/12th of the shares subject to each option award vest monthly over one year, subject in each case to the recipient’s continued service as a director. |
Upon election to the Board, each non-employee director shall be granted an option to purchase 19,650 shares of our common stock. Thereafter, each non-employee director shall be entitled to an annual grant of an option to purchase 11,790 shares of our common stock. Each of these options will have an exercise price equal to the fair market value of our common stock on the date of grant and will vest monthly over 12 months such that the entire option shall be fully vested after one year.
99
Table of Contents
Item 12. Security Ownership of Certain Beneficial Owners and Management and Related Stockholder Matters
SECURITY OWNERSHIP OF
CERTAIN BENEFICIAL OWNERS AND MANAGEMENT
The following table sets forth certain information regarding the ownership of Epocrates’ common stock as of January 31, 2012 by: (i) each director; (ii) each of the executive officers named in the Summary Compensation Table; (iii) all executive officers and directors of Epocrates as a group; and (iv) all those known by Epocrates to be beneficial owners of more than five percent of its common stock.
Name of Beneficial Owner | | Shares of
common stock
beneficially
owned (1) | | Shares Issuable
Pursuant to Options
Exercisable Within
60 Days of
January 31, 2012 | | Percent of
Total (1) | |
Entities affiliated with The Goldman Sachs Group, Inc. (2) | | 2,786,856 | | — | | 11.4 | % |
| | | | | | | |
Entities affiliated with Credit Suisse AG/(3) | | 2,661,033 | | — | | 10.9 | % |
| | | | | | | |
Entities affiliated with InterWest Partners VII, L.P.(4) | | 2,003,651 | | 31,440 | | 8.2 | % |
| | | | | | | |
Entities affiliated with Draper Fisher Jurvetson Fund V, L.P.(5) | | 2,192,163 | | — | | 9.0 | % |
| | | | | | | |
Three Arch Partners II, L.P.(6) | | 1,655,329 | | — | | 6.8 | % |
| | | | | | | |
BlackRock, Inc.(7) | | 1,405,549 | | — | | 5.8 | % |
| | | | | | | |
FMR LLC (8) | | 2,220,810 | | — | | 9.1 | % |
| | | | | | | |
Peter C. Brandt | | 196,647 | | 137,322 | | * | |
| | | | | | | |
Adam E. Budish | | — | | — | | — | |
| | | | | | | |
David B. Burlington | | 70,131 | | 70,131 | | * | |
| | | | | | | |
Rosemary A. Crane | | 743,180 | | 732,965 | | 3.0 | % |
| | | | | | | |
Heather A. Gervais | | 4,070 | | 4,070 | | * | |
| | | | | | | |
Matthew A. Kaminer | | 6,666 | | 1,666 | | * | |
| | | | | | | |
Joseph B. Kleine | | 253,506 | | 201,333 | | 1.0 | % |
| | | | | | | |
Patrick D. Spangler | | 87,493 | | 87,493 | | * | |
| | | | | | | |
Philippe O. Chambon, M.D., Ph.D.(9) | | 2,686,417 | | 42,247 | | 11.0 | % |
| | | | | | | |
Gary G. Greenfield | | 11,462 | | 11,462 | | * | |
| | | | | | | |
Thomas L. Harrison | | 115,606 | | 115,606 | | * | |
| | | | | | | |
Patrick S. Jones | | 119,536 | | 119,536 | | * | |
| | | | | | | |
Erick N. Tseng | | 11,462 | | 11,462 | | * | |
| | | | | | | |
Mark A. Wan(6) | | 1,697,576 | | 42,247 | | 6.9 | % |
| | | | | | | |
All directors and executive officers as a group (14 persons) | | 6,003,752 | | 1,577,540 | | 23.1 | % |
* Less than one percent.
(1) | Based upon information supplied by officers, directors and principal stockholders. Unless otherwise indicated in the footnotes to this table and subject to community property laws where applicable, Epocrates believes that each of the |
100
Table of Contents
| stockholders named in this table has sole voting and investment power with respect to the shares indicated as beneficially owned. Beneficial ownership includes shares of common stock issuable pursuant to options exercisable within 60 days of January 31, 2012. Applicable percentages are based on 24,418,653 shares outstanding on January 31, 2012, adjusted as required by rules promulgated by the SEC. |
| |
(2) | Goldman, Sachs & Co. also reports beneficial ownership of these shares. Each of these Goldman Sachs entities has shared voting and investment power with respect to these shares. These Goldman Sachs entities disclaim beneficial ownership of the securities beneficially owned by (i) any client accounts with respect to which the Goldman Sachs reporting units or their employees have voting or investment discretion or both, or with respect to which there are limits on their voting or investment authority or both and (ii) certain investment entities of which the Goldman Sachs reporting units act as the general partner, managing general partner or other manager, to the extent interests in such entities are held by persons other than the Goldman Sachs reporting units. The address for The Goldman Sachs Group, Inc. and Goldman, Sachs & Co. is 200 West Street, 7th Floor, New York, New York 10282. The beneficial ownership of these securities is based on a Schedule 13G filed by these entities on February 14, 2012 reporting beneficial ownership as of December 31, 2011, and therefore does not reflect any changes in beneficial ownership that may have occurred between that date and January 31, 2012. |
| |
(3) | The shares are held by direct and indirect subsidiaries of Credit Suisse AG. The address of the principal business and office of Credit Suisse AG is Uetlibergstrasse 231, P.O. Box 900, CH 8070 Zurich, Switzerland. The ultimate parent company of Credit Suisse AG is Credit Suisse Group AG, and its business address is Paradeplatz 8, P.O. Box 1, CH 8070 Zurich, Switzerland. Credit Suisse AG and Credit Suisse Group AG disclaim beneficial ownership of shares beneficially owned by their direct and indirect subsidiaries, including by the Sprout Funds (as defined below). Of the shares referred to above, 2,434,175 shares are held by Sprout Capital IX, L.P., or Sprout IX, 158,773 shares are held by DLJ ESC II, L.P., or ESC II, 33,340 shares are held by DLJ Capital Corporation, or DLJCC, and 17,882 shares are held by Sprout Entrepreneurs’ Fund, L.P., or Sprout Entrepreneurs, collectively, the Sprout Funds. The remainder of the shares is traded by proprietary desks of Credit Suisse that are not under the control of the Sprout Funds. Sprout IX, Sprout Entrepreneurs and ESC II make investments for long-term appreciation. DLJCC acts as a venture capital partnership management company. DLJCC is the general partner of Sprout Entrepreneurs and is the managing general partner of Sprout IX, and, as such is responsible for its day-to-day management. DLJCC makes all of the investment decisions on behalf of Sprout IX and Sprout Entrepreneurs. DLJ Associates IX, L.P., or Associates IX, is a general partner of Sprout IX and in accordance with the terms of the relevant partnership agreement, does not participate in investment decisions made on behalf of Sprout IX. DLJ Capital Associates IX, Inc. is the managing general partner of Associates IX. Dr. Chambon, one of our directors, is a limited partner of Associates IX. DLJ LBO Plans Management Corporation, or DLJLBO, is the general partner of ESC II, and, as such, is responsible for its day-to-day management. DLJLBO makes all of the investment decisions on behalf of ESC II. Dr. Chambon, in his capacity as a member of the investment committees of DLJCC and DLJLBO, may be deemed to beneficially own the shares of the Sprout Funds. Dr. Chambon disclaims beneficial ownership of the shares held by the Sprout Funds, except to the extent of his pecuniary interest therein. See footnote 9 below. The address for the Sprout Funds is 11 Madison Avenue, 13th Floor, New York, New York 10010. |
| |
(4) | Includes 1,885,124 shares held by InterWest Partners VII, L.P. and 87,087 shares held by InterWest Investors VII, L.P., collectively, the InterWest Funds. InterWest Management Partners VII, LLC is the general partner of the InterWest Funds and thereby has sole voting and investment control over the shares owned by the InterWest Funds. Dr. Gilbert H. Kliman, Harvey B. Cash, Philip T. Gianos, W. Scott Hedrick, W. Stephen Holmes, Thomas L. Rosch and Arnold L. Oronsky are managing directors of InterWest Management Partners VII, LLC and have shared voting and investment control over the shares owned by the InterWest Funds. The managing directors and members of InterWest Management Partners VII, LLC disclaim beneficial ownership of the shares owned by the InterWest Funds, except to the extent of their respective pecuniary interest therein. Also includes options to purchase 31,440 shares issuable pursuant to options exercisable within 60 days of January 31, 2012 granted to Dr. Kliman, one of our former directors. The address for each of these entities is 2710 Sand Hill Road, Second Floor, Menlo Park, California 94025. |
| |
(5) | Includes 1,819,017 shares held by Draper Fisher Jurvetson Fund V, L.P. and 147,486 shares held by Draper Fisher Jurvetson Partners V, LLC., collectively, the DFJ funds, each of which has shared voting and investment power with respect to the shares they own. Draper Fisher Jurvetson Management Co. V, LLC is the general partner of Draper Fisher Jurvetson Fund V, L.P. and thereby has shared voting and investment control over the shares owned by Draper Fisher Jurvetson Fund V, L.P. Timothy C. Draper, John H.N. Fisher and Stephen T. Jurvetson are the managing directors of Draper Fisher Jurvetson Management Co. V, LLC and managing members of Draper Fisher Jurvetson Partners V, LLC. They share voting and investment control over the shares owned by the DFJ Funds. The managing directors and managing members disclaim beneficial ownership of the shares owned by the DFJ Funds except to the |
101
Table of Contents
| extent of their respective pecuniary interest therein. Also includes 225,660 shares owned by The Timothy Cook Draper 2010 Annuity Trust over which Mr. Draper has sole voting and investment power. The address for all of these entities is 2882 Sand Hill Road, Suite 150, Menlo Park, California 94025. |
| |
(6) | Represents shares held by Three Arch Partners II, L.P., or Three Arch, over which Three Arch has sole voting and investment power. Three Arch Management II, L.L.C., or TAM II, is the general partner of Three Arch, and thereby has sole voting and investment control over the shares owned by the Three Arch. Mr. Wan, one of our directors, and Wilfred E. Jaeger, are managing members of TAM II and have shared voting and investment control over the shares owned by Three Arch. Mr. Wan disclaims beneficial ownership of the shares held by Three Arch except to the extent of his pecuniary interest therein. The address for each of these entities is 3200 Alpine Road, Portola Valley, California 94028. In addition to the shares beneficially owned by Mr. Wan by virtue of the shares owned by Three Arch, Mr. Wan has beneficial ownership of 42,247 shares subject to stock options exercisable within 60 days of January 31, 2012 granted to Mr. Wan. |
| |
(7) | The address for BlackRock Inc. is 40 East 52nd Street, New York, New York 10022. The beneficial ownership of these securities is based on a Schedule 13G filed by BlackRock Inc. on February 8, 2012 reporting beneficial ownership as of December 31, 2011, and therefore does not reflect any changes in beneficial ownership that may have occurred between that date and January 31, 2012. |
| |
(8) | Fidelity Management & Research Company (“Fidelity”), is a wholly-owned subsidiary of FMR LLC, is an investment advisor and beneficially owns these shares by virtue of having sole investment power over these shares. Edward C. Johnson 3d, the Chairman of FMR, LLC, and FMR LLC, through its control of Fidelity, also beneficially own these shares. Members of the family of Mr. Johnson are the predominant owners, directly or through trusts, of Series B voting common shares of FMR LLC, representing 49% of the voting power of FMR LLC. Neither FMR LLC nor Mr. Johnson has the sole power to vote or direct the voting of the shares owned directly by the Fidelity Funds, which power resides with the Funds’ Boards of Trustees. The address for FMR LLC, Mr. Johnson and Fidelity is 82 Devonshire Street, Boston, Massachusetts 02109. The beneficial ownership of these securities is based on a Schedule 13G filed by these entities on February 14, 2012 reporting beneficial ownership as of December 31, 2011, and therefore does not reflect any changes in beneficial ownership that may have occurred between that date and January 31, 2012. |
| |
(9) | Includes 42,247 shares issuable pursuant to options exercisable within 60 days of January 31, 2012. Also includes 2,644,170 shares held by the Sprout Funds. See footnote 3 above. Dr. Chambon disclaims beneficial ownership of the shares held by the Sprout Funds, except to the extent of his pecuniary interest therein. The address for Dr. Chambon is 11 Madison Avenue, 13th Floor, New York, New York 10010. |
EQUITY COMPENSATION PLAN INFORMATION
The following table provides information as of December 31, 2011, with respect to shares of our common stock that may be issued upon the exercise of stock options and other rights under our existing equity compensation plans, which consists of our 1999 Stock Option Plan, our 2008 Equity Incentive Plan and our 2010 Equity Incentive Plan:
Plan Category | | Number of securities
to be issued upon
exercise of options,
warrants and rights
(a) | | Weighted average
exercise price of
outstanding options
warrants and rights
(b) | | Number of available
securities remaining
for future issuance under
equity compensation plans
(excluding securities
reflected in column (a))
(c) | |
Equity compensation plans approved by stockholders(1) | | 6,470,382 | | $ | 10.54 | | 1,649,264 | (2) |
| | | | | | | | |
(1) | Consists of three plans: our 1999 Stock Option Plan, our 2008 Equity Incentive Plan and our 2010 Equity Incentive Plan. |
| |
(2) | The number of shares reserved for issuance under our 2010 Equity Incentive Plan will automatically increase on January 1st each year, starting on January 1, 2012 and continuing through January 1, 2014, by the lesser of (a) four percent (4%) of the total number of shares of our common stock outstanding on the last day of the preceding calendar year, (b) 1,965,000 shares of our common stock or (c) a number determined by our Board that is less than (a) or (b). |
102
Table of Contents
Item 13. Certain Relationships and Related Transactions, and Director Independence
Certain Relationships and Related Transactions
In addition to the executive and director compensation arrangements, including the employment, termination of employment and change-of-control arrangements discussed above under “Executive Compensation and Related Information,” the following is a description of transactions since January 1, 2011 (unless otherwise specified) to which we have been a party, in which the amount involved in the transaction exceeds or will exceed $120,000 and in which any of our directors, executive officers or beneficial holders of more than 5% of our capital stock, or any immediate family member of, or person sharing the household with any of these individuals, had or will have a direct or indirect material interest.
Employment agreements
We have entered into employment agreements with certain of our executive officers. For more information regarding these agreements, see the section above entitled “Executive Employment and Severance Agreements.”
Director and officer indemnification
Our Amended and Restated Certificate of Incorporation contains provisions limiting the liability of directors. In addition, we have entered into agreements to indemnify our directors and executive officers to the fullest extent permitted under Delaware Law.
Other agreements
In 2009, we entered into various agreements with Cline Davis & Mann, Inc. and SSCG Media Group, a division of Cline Davis & Mann, whereby we provided various marketing, educational, media and creative services through our DocAlert channel. Cline Davis & Mann is a subsidiary of DAS, where Mr. Harrison, a member of our Board, serves as the Chief Executive Officer (“CEO”). For the year ended December 31, 2011, we recorded no revenue from Cline Davis & Mann and recorded approximately $4.9 million of revenue from SSCG Media Group, respectively. Mr. Harrison does not have a direct or indirect material interest in these transactions and these transactions are immaterial to DAS.
In 2010, we provided services to Porter Novelli, also a DAS subsidiary. In connection with these services, we recorded revenue from Porter Novelli of approximately $0.2 million for the year ended December 31, 2011. Mr. Harrison does not have a direct or indirect material interest in this transaction and this transaction is immaterial to DAS.
Review, approval or ratification of transactions with related parties
Pursuant to our written Code of Business Conduct and Ethics, executive officers and directors are not permitted to enter into any transactions with Epocrates without the approval of either our Audit Committee, pursuant to the provisions set forth in the Audit Committee Charter, or our Board. In approving or rejecting such proposed transactions, the Audit Committee or Board, as applicable, shall consider the relevant facts and circumstances available and deemed relevant to the Audit Committee or Board, as applicable, including but not limited to the risks, costs, benefits to Epocrates, the terms of the transactions, the availability of other sources for comparable services or products and, if applicable, the impact on a director’s independence. Our Audit Committee and/or Board shall approve only those transactions that, in light of known circumstances, are in, or are not inconsistent with, our best interests, as our Audit Committee or Board determines in the good faith exercise of its discretion. We have designated a compliance officer to generally oversee compliance with the Code of Business Conduct and Ethics.
All of the transactions described above were entered into prior to the adoption of our Code of Business Conduct and Ethics. As each of the aforementioned were entered into in the ordinary course of business and were deemed not material to our business or operations, they were not formally approved or ratified by our Board or Audit Committee.
For a complete description of the agreements entered into with subsidiaries of DAS, of which Thomas L. Harrison, a member of our Compensation Committee and Board, is the CEO, please refer to the section above entitled “Compensation Committee Interlocks and Insider Participation.”
103
Table of Contents
Independence of the Board
As required under the NASDAQ Stock Market (“NASDAQ”) listing standards, a majority of the members of a listed company’s Board of Directors must qualify as “independent,” as affirmatively determined by the Board. The Board consults with Epocrates’ counsel to ensure that the Board’s determinations are consistent with relevant securities and other laws and regulations regarding the definition of “independent,” including those set forth in pertinent listing standards of the NASDAQ, as in effect from time to time.
Consistent with these considerations, after review of all relevant identified transactions or relationships between each director, or any of his or her family members, and Epocrates, its senior management and its independent auditors, the Board has affirmatively determined that the following six directors are independent directors within the meaning of the applicable NASDAQ listing standards: Dr. Chambon and Messrs. Jones, Greenfield, Harrison, Tseng and Wan. In making this determination, the Board found that none of the directors had a material or other disqualifying relationship with Epocrates. Mr. Brandt, Epocrates’ Interim President and CEO, is currently not an independent director by virtue of his employment with Epocrates.
Item 14. Principal Accountant Fees and Services
The following table represents aggregate fees billed to Epocrates for the fiscal years ended December 31, 2011 and 2010 by PricewaterhouseCoopers LLP, Epocrates’ principal accountant.
| | Fiscal Years Ended December 31, | |
| | 2011 | | 2010 | |
Audit Fees | | $ | 1,402,833 | | $ | 1,787,625 | |
Audit-Related Fees | | — | | — | |
Tax Fees (1) | | 5,000 | | 5,000 | |
All Other Fees (2) | | 1,800 | | 1,500 | |
Total Fees | | $ | 1,409,633 | | $ | 1,794,125 | |
(1) | Relates to tax compliance services provided. |
(2) | Relates to license fees for accounting research software. |
All fees described above were approved by the Audit Committee.
In connection with the audit of the 2011 financial statements, Epocrates entered into an engagement agreement with PricewaterhouseCoopers LLP which sets forth the terms by which PricewaterhouseCoopers LLP will perform audit services for Epocrates. That agreement is subject to alternative dispute resolution procedures and an exclusion of punitive damages.
Pre-Approval Policies and Procedures
The Audit Committee has adopted a policy and procedures for the pre-approval of audit and non-audit services rendered by Epocrates’ independent registered public accounting firm, PricewaterhouseCoopers LLP. The policy generally pre-approves specified services in the defined categories of audit services, audit-related services and tax services up to specified amounts. Pre-approval may also be given as part of the Audit Committee’s approval of the scope of the engagement of the independent auditor or on an individual, explicit, case-by-case basis before the independent auditor is engaged to provide each service. The pre-approval of services may be delegated to one or more of the Audit Committee members, but the decision must be reported to the full Audit Committee at its next scheduled meeting.
The Audit Committee has determined that the rendering of the services other than audit services by PricewaterhouseCoopers LLP is compatible while maintaining the principal accountant’s independence.
104
Table of Contents
PART IV
Item 15. Exhibits, Financial Statement Schedules
(a) We have filed the following documents as part of this Annual Report on Form 10-K:
2. Financial Statement Schedule
The following financial statement schedule is filed as part of this report:
All other schedules are omitted because they are not required or the required information is shown in the financial statements or notes thereto.
3. See the Exhibit Index which follows the signature page of this Annual Report on Form 10-K, which is incorporated here by reference.
105
Table of Contents
SIGNATURES
Pursuant to the requirements of Section 13 or 15(d) of the Securities Exchange Act of 1934, the Registrant has duly caused this report to be signed on its behalf by the undersigned, thereunto duly authorized.
Epocrates, Inc. | | | |
| | | |
| | | | |
By: | /s/ PETER C. BRANDT | | By: | /s/ PATRICK D. SPANGLER |
| PETER C. BRANDT, | | | PATRICK D. SPANGLER, |
| Interim President and Chief Executive Officer
(Principal Executive Officer) | | | Chief Financial Officer
(Principal Financial and Accounting Officer) |
Date: March 19, 2012
POWER OF ATTORNEY
KNOW ALL PERSONS BY THESE PRESENT, that each person whose signature appears below constitutes and appoints Peter C. Brandt and Patrick D. Spangler, and each or any one of them, his true and lawful attorney-in-fact and agent, with full power of substitution and resubstitution, for him and in his name, place and stead, in any and all capacities, to sign any and all amendments to this Report, and to file the same, with all exhibits thereto, and other documents in connection therewith, with the Securities and Exchange Commission, granting unto said attorneys-in-fact and agents, and each of them, full power and authority to do and perform each and every act and thing requisite and necessary to be done in connection therewith, as fully to all intents and purposes as he might or could do in person, hereby ratifying and confirming all that said attorneys-in-fact and agents, or any of them, or their or his substitutes or substitute, may lawfully do or cause to be done by virtue hereof.
Pursuant to the requirements of the Securities Exchange Act of 1934, this Report has been signed below by the following persons on behalf of the registrant and in the capacities and on the dates indicated.
Signatures | | Title | | Date |
| | | | |
/s/ PETER C. BRANDT | | Interim President and Chief Executive Officer
(Principal Executive Officer) | | March 19, 2012 |
PETER C. BRANDT | |
| | | | |
/s/ PATRICK D. SPANGLER | | Chief Financial Officer
(Principal Financial and Accounting Officer) | | March 19, 2012 |
PATRICK D. SPANGLER | |
| | | | |
/s/ PATRICK S. JONES | | Chairman of the Board | | March 19, 2012 |
PATRICK S. JONES | |
| | | | |
/s/ PHILIPPE O. CHAMBON | | Director | | March 19, 2012 |
PHILIPPE O. CHAMBON, M.D., PH.D. | |
| | | | |
/S/ GARY G. GREENFIELD | | Director | | March 19, 2012 |
GARY G. GREENFIELD | |
| | | | |
/s/ THOMAS L. HARRISON | | Director | | March 19, 2012 |
THOMAS L. HARRISON | |
| | | | |
/s/ ERICK N. TSENG | | Director | | March 19, 2012 |
ERICK N. TSENG | |
| | | | |
/s/ MARK A. WAN | | Director | | March 19, 2012 |
MARK A. WAN | |
106
Table of Contents
Schedule II: Valuation and Qualifying Accounts
Epocrates, Inc.
Valuation and Qualifying Accounts and Reserves
Years Ended December 31, 2011, 2010 and 2009
(in thousands)
| | | | Charged to | | | | | | | |
| | Beginning | | Costs and | | | | | | Ending | |
Description | | Balance | | Expenses | | Reversals | | Utilizations | | Balance | |
| | | | | | | | | | | |
Allowance for doubtful accounts: | | | | | | | | | | | |
2011 | | $ | 141 | | $ | 665 | | $ | — | | $ | (721 | ) | $ | 85 | |
2010 | | $ | 22 | | $ | 282 | | $ | — | | $ | (163 | ) | $ | 141 | |
2009 | | $ | 27 | | $ | 89 | | $ | — | | $ | (94 | ) | $ | 22 | |
| | | | | | | | | | | |
| | | | | | | | | | | |
Valuation allowance for deferred tax assets: | | | | | | | | | | | |
2011 | | $ | (159 | ) | $ | (509 | ) | $ | — | | $ | — | | $ | (668 | ) |
2010 | | $ | — | | $ | (159 | ) | $ | — | | $ | — | | $ | (159 | ) |
2009 | | $ | — | | $ | — | | $ | — | | $ | — | | $ | — | |
Note: Additions to the allowance for doubtful accounts are charged to expense.
107
Table of Contents
Exhibit Index
Exhibit
Number | | Description of Document |
| 3.1(1) | | Amended and Restated Certificate of Incorporation dated February 7, 2011. |
| 3.2(2) | | Amended and Restated Bylaws. |
| 4.1(3) | | Specimen common stock certificate. |
| 4.2(3) | | Form of Warrant to purchase Series B convertible preferred stock. |
| 10.1(3) | | Amended and Restated Investor Rights Agreement dated October 2, 2007. |
| 10.2(3) | | Form of Indemnity Agreement entered into between Registrant and each of its directors and officers. |
| 10.3(3)+ | | 1999 Stock Option Plan, as amended. |
| 10.4(3)+ | | Form of Stock Option Agreement under 1999 Stock Option Plan, as amended. |
| 10.5(3)+ | | Form of 2007 Performance-Based Option Grant Notice under 1999 Stock Option Plan, as amended. |
| 10.6(3)+ | | Form of 2008 Performance-Based Option Grant Notice under 1999 Stock Option Plan, as amended. |
| 10.7(3)+ | | 2008 Equity Incentive Plan, as amended. |
| 10.8(3)+ | | Form of Stock Option Agreement and Form of Option Grant Notice under 2008 Equity Incentive Plan. |
| 10.9(3)+ | | Form of 2009 Performance-Based Option Grant Notice under 2008 Equity Incentive Plan, as amended. |
| 10.10(3)+ | | 2010 Equity Incentive Plan, as amended. |
| 10.11(3)+ | | Form of Stock Option Agreement and Form of Option Grant Notice under 2010 Equity Incentive Plan. |
| 10.12(3) | | Sublease Agreement, dated December 3, 2006, by and between Oracle USA, Inc. and the Registrant, as amended on May 2, 2007 and April 29, 2010, and Consent to Sublease, by and among Bay Meadows Park Place Investors, LLC, Oracle USA and the Registrant, dated December 14, 2006. |
| 10.13(3) | | Sublease, dated as of September 30, 2010, by and between the Registrant and CA, Inc., and Consent, dated as of October 14, 2010, by and between Princeton South Development, L.L.C., the Registrant and CA, Inc. |
| 10.14(4)+ | | Offer Letter, dated June 8, 2011, by and between Registrant and Matthew A. Kaminer. |
| 10.15(3)+ | | Offer Letter, dated February 25, 2009, by and between Registrant and Rosemary A. Crane. |
| 10.16(5)+ | | Amendment No. 1 to Offer Letter dated February 25, 2009, by and between Registrant and Rosemary A. Crane, dated April 18, 2011. |
| 10.17+ | | Separation Agreement, dated December 9, 2011, by and between Registrant and Rosemary A. Crane. |
| 10.18(3)+ | | Offer Letter, dated January 26, 2001, by and between Registrant and Joseph B. Kleine, as amended February 5, 2010. |
| 10.19(3)+ | | Amended and Restated Director Compensation Policy, as amended. |
| 10.20+ | | Offer Letter, dated December 9, 2011, by and between Registrant and Peter C. Brandt. |
| 10.21+ | | Separation and Release Agreement, dated November 8, 2011, by and between the Registrant and Joseph B. Kleine. |
| 10.22(3)+ | | Amended and Restated Offer Letter, dated January 28, 2011, by and between the Registrant and Patrick D. Spangler. |
| 10.23(6)+ | | Amendment No. 1 to the Amended and Restated Offer Letter, dated January 28, 2011, by and between the Registrant and Patrick D. Spangler, dated June 29, 2011. |
| 10.24(3)+ | | Offer Letter, dated October 8, 2010, by and between the Registrant and David B. Burlington. |
| 10.25(3)+ | | Form of 2010 Performance-Based Option Grant Notice under 2008 Equity Incentive Plan, as amended. |
| 10.26(3)+ | | Form of Restricted Stock Unit Agreement and Form of Restricted Stock Unit Grant Notice under 2010 Equity Incentive Plan. |
| 10.27(3) | | Lease Agreement, dated June 9, 2006, by and between Windsor Limited Partnership of New Jersey and the Registrant, as amended November 21, 2007, and Confirmation of Commencement Date by and between Windsor Acquisitions, L.L.C. and the Registrant, dated January 11, 2008. |
| 10.28+ | | 2011 Executive Officers’ Compensation. |
| 23.1 | | Consent of PricewaterhouseCoopers LLP, Independent Registered Public Accounting Firm. |
| 24.1 | | Power of Attorney (reference is made to the signature page). |
| 31.1 | | Certification of Principal Executive Officer Pursuant to Rule 13a-14 of the Securities Exchange Act of 1934, As Adopted Pursuant to Section 302 of the Sarbanes-Oxley Act of 2002. |
| 31.2 | | Certification of Principal Financial Officer Pursuant to Rule 13a-14 of the Securities Exchange Act of 1934, As Adopted Pursuant to Section 302 of the Sarbanes-Oxley Act of 2002. |
| 32.1 | | Certification of Principal Executive Officer and Principal Financial Officer Pursuant to 18 U.S.C. Section 1350, As Adopted Pursuant to Section 906 of the Sarbanes-Oxley Act of 2002. |
108
Table of Contents
Exhibit
Number | | Description of Document |
| 101.INS | | XBRL Instance Document |
| 101.SCH | | XBRL Taxonomy Extension Schema Document |
| 101.CAL | | XBRL Taxonomy Extension Calculation Linkbase Document |
| 101.DEF | | XBRL Taxonomy Extension Definition Linkbase Document |
| 101.LAB | | XBRL Taxonomy Extension Label Linkbase Document |
| 101.PRE | | XBRL Taxonomy Extension Presentation Linkbase Document |
| + | Management contract or compensatory plan. |
| | |
| (1) | Filed as Exhibit 3.1 to our Annual Report on Form 10-K (Reg No. 001-35062) with the SEC on March 31, 2011, and incorporated herein by reference. |
| | |
| (2) | Filed as Exhibit 3.4 to our Registration Statement on Form S-1, as amended (Reg. No. 333-168176), and incorporated herein by reference. |
| | |
| (3) | Filed as the like-described exhibit to our Registration Statement on Form S-1, as amended (Reg. No. 333-168176), and incorporated herein by reference. |
| | |
| (4) | Filed as Exhibit 10.1 to our Quarterly Report on Form 10-Q (Reg No. 001-35062) with the SEC on August 12, 2011, and incorporated herein by reference. |
| | |
| (5) | Filed as Exhibit 10.2 to our Quarterly Report on Form 10-Q (Reg No. 001-35062) with the SEC on August 12, 2011, and incorporated herein by reference. |
| | |
| (6) | Filed as Exhibit 10.3 to our Quarterly Report on Form 10-Q (Reg No. 001-35062) with the SEC on August 12, 2011, and incorporated herein by reference. |
109