20201120 EPC investor day mate ...BOS Page 1 Edgewell Personal Care Q4 and Fiscal Year 2022 Earnings Supplemental Earnings Slides November 10, 2022
PAGE 2 Please note that in this presentation we may discuss events or results that have not yet occurred or been realized, commonly referred to as forward-looking statements. The Private Securities Litigation Reform Act of 1995 provides a safe harbor for forward- looking statements made by or on behalf of Edgewell Personal Care Company (“Edgewell”, “we” or “our Company”) or any of our businesses. Forward-looking statements generally can be identified by the use of words or phrases such as “believe,” “expect,” “expectation,” “anticipate,” “may,” “could,” “intend,” “belief,” “estimate,” “plan,” “target,” “predict,” “likely,” “will,” “should,” “forecast,” “outlook,” or other similar words or phrases. These statements are not based on historical facts, but instead reflect the Company's expectations, estimates or projections concerning future results or events, including, without limitation, the future earnings and performance of Edgewell or any of its businesses, and the integration of the Billie acquisition and expected benefits from this transaction, including growth opportunities and cost savings. Many factors outside our control could affect the realization of these estimates. These statements are not guarantees of performance and are inherently subject to known and unknown risks, uncertainties and assumptions that are difficult to predict and could cause the Company's actual results to differ materially from those indicated by those statements. The Company cannot assure you that any of its expectations, estimates or projections will be achieved. The forward-looking statements included in this document are only made as of the date of this document and the Company disclaims any obligation to publicly update any forward-looking statement to reflect subsequent events or circumstances, except as required by law. You should not place undue reliance on these statements. In addition, other risks and uncertainties not presently known to the Company or that it presently considers immaterial could significantly affect the accuracy of any such forward-looking statements. Risks and uncertainties include those detailed from time to time in the Company's publicly filed documents, including in Item 1A. Risk Factors of Part I of the Company's Annual Report on Form 10-K filed with the Securities and Exchange Commission (“SEC”) on November 19, 2021. Certain product information, competitive position data, peer data and market trends contained in this presentation have been prepared internally and have not been verified by any third party. Use of different methods for preparing, calculating or presenting such information may lead to different results and such differences may be material. In addition, certain industry and market data described in this presentation was obtained from industry and general publications and research, surveys and studies conducted by third parties. While the Company believes this information is reliable and appropriate, such information has not been verified by any independent source. You are cautioned not to place undue reliance on this information or data. Unless the context otherwise indicates or requires, all Edgewell product names, trade names, trademarks, service marks or logos used in this presentation are part of the Company’s intellectual property, although the “©” and “TM” trademark designations may have been omitted for convenience. All rights to such intellectual property are reserved. Forward-looking statements
PAGE 3 While the Company reports financial results in accordance with accounting principles generally accepted in the U.S. ("GAAP"), this discussion also includes non-GAAP measures. These non-GAAP measures are referred to as "adjusted" or "organic" and exclude items such as restructuring costs, acquisition and integration costs and non-standard items. This non-GAAP information is provided as a supplement to, not as a substitute for, or as superior to, measures of financial performance prepared in accordance with GAAP. The Company uses this non-GAAP information internally to make operating decisions and believes it is helpful to investors because it allows more meaningful period-to-period comparisons of ongoing operating results. The information can also be used to perform analysis and to better identify operating trends that may otherwise be masked or distorted by the types of items that are excluded. This non-GAAP information is a component in determining management's incentive compensation. Finally, the Company believes this information provides a higher degree of transparency. Non-GAAP financial measures These non-GAAP financial measures, however, have limitations as analytical tools, and should not be considered in isolation from, a substitute for, or superior to, the related financial information that the Company reports in accordance with GAAP. Furthermore, such non-GAAP measures may not be consistent with similar measures provided or used by other companies. Investors are encouraged to review the definitions and reconciliations of these non-GAAP financial measures to their most comparable GAAP financial measures included in the footnotes, and not to rely on any single financial measure to evaluate the Company’s businesses. The definitions, calculations and reconciliations of these non-GAAP measures to the most directly comparable financial measures calculated and presented in accordance with U.S. GAAP can be found in the Notes to Condensed Consolidated Financial Statements in the Company’s earnings release for the fourth quarter of the 2022 fiscal year which can be found on the Company’s Investor Relations website at http://ir.edgewell.com.

PAGE 4 Q4 and Fiscal Year Highlights ▪ Continued strong execution across markets delivered solid results, despite continued challenging operating environment ▪ Organic net sales grew just over 1% in the quarter, underpinned by approximately 3% growth due to price and promotions management. For the full year, posted 4% organic net sales growth for the second consecutive year ▪ Retail execution behind the Billie brand was strong (excluded from organic growth), with Billie now the number two brand in the category and reaching a 17% share at Walmart ▪ Adjusted earnings per share declined 22% in the quarter versus the prior year, largely driven by unfavorable currency translation and non-operational tax rate headwinds ▪ Initiated Outlook for Fiscal 2023 with growth in organic net sales and Adjusted EBITDA and Adjusted EPS on a constant currency basis
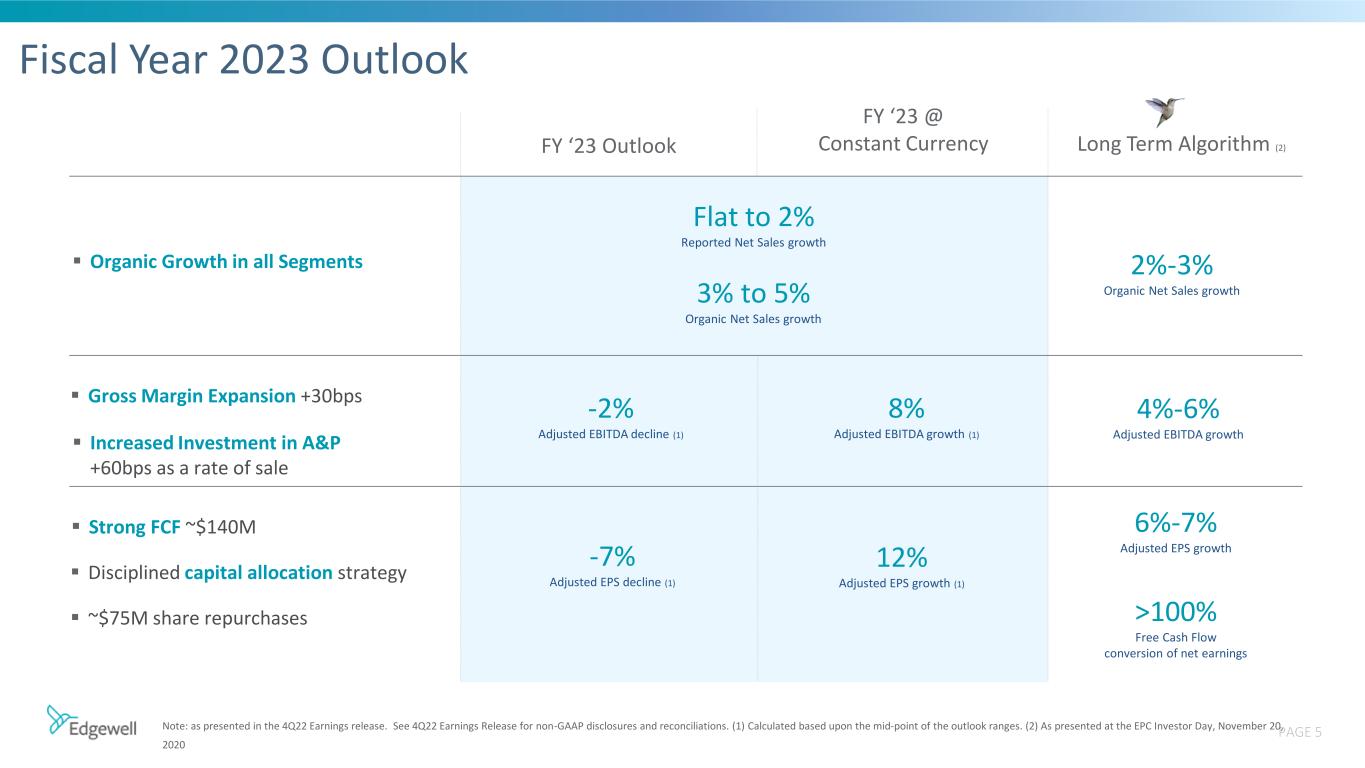
PAGE 5 Fiscal Year 2023 Outlook Note: as presented in the 4Q22 Earnings release. See 4Q22 Earnings Release for non-GAAP disclosures and reconciliations. (1) Calculated based upon the mid-point of the outlook ranges. (2) As presented at the EPC Investor Day, November 20, 2020 ▪ Strong FCF ~$140M ▪ Disciplined capital allocation strategy ▪ ~$75M share repurchases ▪ Organic Growth in all Segments ▪ Gross Margin Expansion +30bps ▪ Increased Investment in A&P +60bps as a rate of sale FY ‘23 Outlook FY ‘23 @ Constant Currency Long Term Algorithm (2) Flat to 2% Reported Net Sales growth 3% to 5% Organic Net Sales growth -2% Adjusted EBITDA decline (1) 8% Adjusted EBITDA growth (1) -7% Adjusted EPS decline (1) 12% Adjusted EPS growth (1) 2%-3% Organic Net Sales growth 4%-6% Adjusted EBITDA growth 6%-7% Adjusted EPS growth >100% Free Cash Flow conversion of net earnings
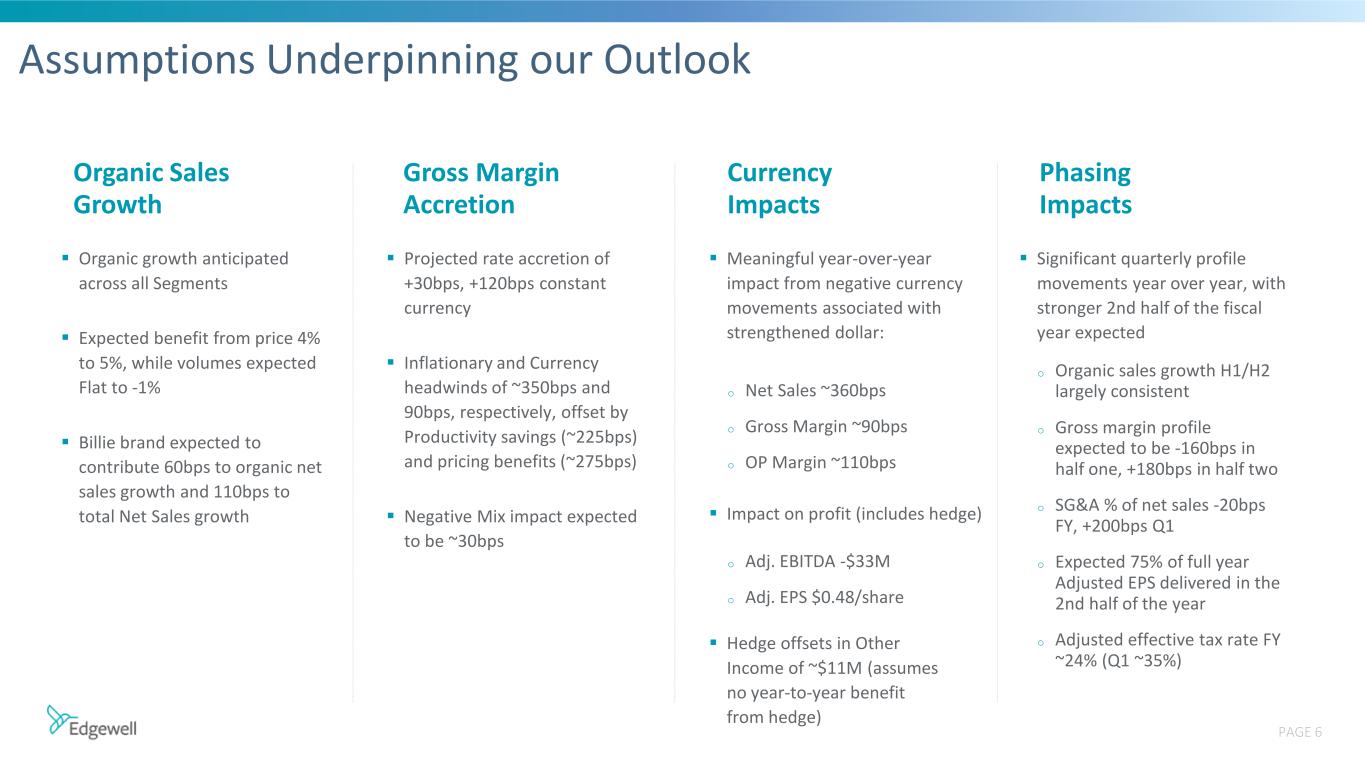
PAGE 6 Assumptions Underpinning our Outlook Gross Margin Accretion ▪ Organic growth anticipated across all Segments ▪ Expected benefit from price 4% to 5%, while volumes expected Flat to -1% ▪ Billie brand expected to contribute 60bps to organic net sales growth and 110bps to total Net Sales growth Organic Sales Growth ▪ Projected rate accretion of +30bps, +120bps constant currency ▪ Inflationary and Currency headwinds of ~350bps and 90bps, respectively, offset by Productivity savings (~225bps) and pricing benefits (~275bps) ▪ Negative Mix impact expected to be ~30bps Currency Impacts ▪ Meaningful year-over-year impact from negative currency movements associated with strengthened dollar: o Net Sales ~360bps o Gross Margin ~90bps o OP Margin ~110bps ▪ Impact on profit (includes hedge) o Adj. EBITDA -$33M o Adj. EPS $0.48/share ▪ Hedge offsets in Other Income of ~$11M (assumes no year-to-year benefit from hedge) Phasing Impacts ▪ Significant quarterly profile movements year over year, with stronger 2nd half of the fiscal year expected o Organic sales growth H1/H2 largely consistent o Gross margin profile expected to be -160bps in half one, +180bps in half two o SG&A % of net sales -20bps FY, +200bps Q1 o Expected 75% of full year Adjusted EPS delivered in the 2nd half of the year o Adjusted effective tax rate FY ~24% (Q1 ~35%)


