UNITED STATES
SECURITIES AND EXCHANGE COMMISSION
Washington, D.C. 20549
____________________________________
FORM 10-K
| | | | | |
| ☒ | ANNUAL REPORT PURSUANT TO SECTION 13 OR 15(d) OF THE SECURITIES EXCHANGE ACT OF 1934 |
For the fiscal year ended September 30, 2024
or
| | | | | |
| ☐ | TRANSITION REPORT PURSUANT TO SECTION 13 OR 15(d) OF THE SECURITIES EXCHANGE ACT OF 1934 |
For the transition period from _______________ to _______________
Commission File Number 001-15401
EDGEWELL PERSONAL CARE COMPANY
(Exact name of registrant as specified in its charter)
| | | | | | | | | | | | | | |
| Missouri | 43-1863181 |
| (State or other jurisdiction of incorporation or organization) | (I. R. S. Employer Identification No.) |
| | | |
| 6 Research Drive | (203) | 944-5500 |
| Shelton, | CT | 06484 | (Registrant’s telephone number, including area code) |
| (Address of principal executive offices and zip code) | |
Securities registered pursuant to Section 12(b) of the Act:
| | | | | | | | |
| Title of each class | Stock symbol | Name of each exchange on which registered |
| Common Stock, par value $0.01 per share | EPC | New York Stock Exchange |
Securities registered pursuant to Section 12(g) of the Act: None.
Indicate by check mark if the registrant is a well-known seasoned issuer, as defined in Rule 405 of the Securities Act. Yes ☒ No ☐
Indicate by check mark if the registrant is not required to file reports pursuant to Section 13 or 15(d) of the Act. Yes ☐ No ☒
Indicate by check mark whether the registrant (1) has filed all reports required to be filed by Section 13 or 15(d) of the Securities Exchange Act of 1934 during the preceding 12 months (or for such shorter period that the registrant was required to file such reports), and (2) has been subject to such filing requirements for the past 90 days. Yes ☒ No ☐
Indicate by check mark whether the registrant has submitted electronically and posted on its corporate Web site, if any, every Interactive Data File required to be submitted and posted pursuant to Rule 405 of Regulation S-T (§232.405 of this chapter) during the preceding 12 months (or for such shorter period that the registrant was required to submit and post such files). Yes ☒ No ☐
Indicate by check mark whether the registrant is a large accelerated filer, an accelerated filer, a non-accelerated filer, a smaller reporting company, or an emerging growth company. See the definitions of “large accelerated filer,” “accelerated filer,” “smaller reporting company,” and “emerging growth company” in Rule 12b-2 of the Exchange Act.
| | | | | | | | | | | | | | |
| Large accelerated filer | ☒ | | Accelerated filer | ☐ |
| | | | |
| Non-accelerated filer | ☐ | (Do not check if a smaller reporting company) | Smaller reporting company | ☐ |
| | | | |
| | | Emerging growth company | ☐ |
If an emerging growth company, indicate by check mark if the registrant has elected not to use the extended transition period for complying with any new or revised financial accounting standards provided pursuant to Section 13(a) of the Exchange Act. ☐
Indicate by check mark whether the registrant has filed a report on and attestation to its management’s assessment of the effectiveness of its internal control over financial reporting under Section 404(b) of the Sarbanes-Oxley Act (15 U.S.C. 7262(b)) by the registered public accounting firm that prepared or issued its audit report. ☒
If securities are registered pursuant to Section 12(b) of the Act, indicate by check mark whether the financial statements of the registrant included in the filing reflect the correction of an error to previously issued financial statements. ☐
Indicate by check mark whether any of those error corrections are restatements that required a recovery analysis of incentive-based compensation received by any of the registrant’s executive officers during the relevant recovery period pursuant to §240.10D-1(b). ☐
Indicate by check mark whether the registrant is a shell company (as defined in Rule 12b-2 of the Act). Yes ☐ No ☒
The aggregate market value of the voting and non-voting common equity held by non-affiliates of the registrant as of March 31, 2024, the last day of the registrant’s most recently completed second fiscal quarter, was $1,871,912,250.
The number of shares of the registrant’s common stock outstanding as of October 31, 2024 was 48,721,170.
DOCUMENTS INCORPORATED BY REFERENCE
Certain portions of the registrant’s definitive proxy statement for its 2024 annual meeting of shareholders, to be filed with the Securities and Exchange Commission within 120 days after September 30, 2024, are incorporated by reference into Part III of this report.
EDGEWELL PERSONAL CARE COMPANY
INDEX TO FORM 10-K
| | | | | | | | |
| PART I |
| | |
| Item 1. | Business. | |
| Item 1A. | Risk Factors. | |
| Item 1B. | Unresolved Staff Comments. | |
| Item 1C. | Cybersecurity. | |
| Item 2. | Properties. | |
| Item 3. | Legal Proceedings. | |
| Item 4. | Mine Safety Disclosures. | |
| | |
| PART II |
| Item 5. | Market for Registrant’s Common Equity, Related Stockholder Matters and Issuer Purchases of Equity Securities. | |
| Item 6. | [Reserved] | |
| Item 7. | Management’s Discussion and Analysis of Financial Condition and Results of Operations. | |
| Item 7A. | Quantitative and Qualitative Disclosures About Market Risk. | |
| Item 8. | Financial Statements and Supplementary Data. | |
| Item 9. | Changes in and Disagreements with Accountants on Accounting and Financial Disclosure. | |
| Item 9A. | Controls and Procedures. | |
| Item 9B. | Other Information. | |
| Item 9C. | Disclosure Regarding Foreign Jurisdictions that Prevent Inspections. | |
| | |
| PART III |
| Item 10. | Directors, Executive Officers and Corporate Governance. | |
| Item 11. | Executive Compensation. | |
| Item 12. | Security Ownership of Certain Beneficial Owners and Management and Related Stockholder Matters. | |
| Item 13. | Certain Relationships and Related Transactions, and Director Independence. | |
| Item 14. | Principal Accounting Fees and Services. | |
| | |
| Part IV |
| Item 15. | Exhibit and Financial Statement Schedules. | |
| Item 16. | Form 10-K Summary. | |
| | |
| Signatures | | |
| Exhibit Index | |
Presentation of Information
Unless the context requires otherwise, references to “Edgewell Personal Care Company,” “Edgewell,” “we,” “us,” “our” and “the Company” refer to Edgewell Personal Care Company, and its consolidated subsidiaries.
Trademarks and Trade Names
We own or have rights to use trademarks and trade names that we use in conjunction with the operation of our business, which appear throughout this Annual Report on Form 10-K. Solely for convenience, we only use the ™ or ® symbols the first time any trademark or trade name is mentioned. We may also refer to brand names, trademarks, service marks and trade names of other companies and organizations, and these brand names, trademarks, service marks and trade names are the property of their respective owners.
Industry and Market Data
Unless we indicate otherwise, we base the information concerning our industry contained or incorporated by reference herein on our general knowledge of and expectations concerning the industry. Our market position, market share and industry market size are based on our estimates using internal data and data from various industry analyses, our internal research and adjustments and assumptions that we believe to be reasonable. We have not independently verified data from industry analyses and cannot guarantee its accuracy or completeness. In addition, we believe that data regarding the industry, market size and our market position and market share within such industry provides general guidance but are inherently imprecise. Further, our estimates and assumptions involve risks and uncertainties and are subject to change based on various factors, including those discussed in the “Risk Factors” section of this document. These and other factors could cause results to differ materially from those expressed in the estimates and assumptions.
Retail sales for purposes of market size, market position and market share information are based on measured retail sales in United States dollars.
Forward-Looking Statements
This Annual Report on Form 10-K contains “forward-looking statements” within the meaning of Section 27A of the Securities Act of 1933 and Section 21E of the Securities Exchange Act of 1934. The Private Securities Litigation Reform Act of 1995 provides a safe harbor for forward-looking statements made by or on behalf of Edgewell Personal Care Company or any of our businesses. Forward-looking statements may appear throughout this report, including, without limitation, the following sections: Management’s Discussion and Analysis, Risk Factors, and the Notes to the Consolidated Financial Statements. Forward-looking statements generally can be identified by the use of words or phrases such as “believe,” “expect,” “expectation,” “anticipate,” “may,” “could,” “intend,” “estimate,” “plan,” “target,” “predict,” “likely,” “will,” “should,” “forecast,” “outlook,” “strategy,” or other similar words or phrases. These statements are not based on historical facts, but instead reflect our expectations, estimates or projections concerning future results or events, including, without limitation, the future earnings and performance of the Company or any of our businesses. Many factors outside our control could affect the realization of these estimates. These statements are not guarantees of performance and are inherently subject to known and unknown risks, uncertainties and assumptions that are difficult to predict and could cause our actual results to differ materially from those indicated by those statements. We cannot assure you that any of our expectations, estimates or projections will be achieved. The forward-looking statements included in this report are only made as of the date of this report, and we disclaim any obligation to publicly update any forward-looking statement to reflect subsequent events or circumstances, except as required by law. You should not place undue reliance on these statements. Factors that could cause fluctuations in our actual results include, but are not limited to, the following:
•our ability to compete in products and prices in an intensely competitive industry;
•the loss of any of our principal customers or changes in the policies of our principal customers;
•our inability to design and execute a successful omnichannel strategy;
•our ability to attract, retain and develop key personnel;
•fluctuations in the price and supply of raw materials and costs of labor, warehousing and transportation;
•the impact of seasonal volatility on our sales, financial performance, working capital requirements and cash flow;
•the ability to successfully manage global financial risks, including foreign currency fluctuations, currency exchange or pricing controls and localized volatility; our level of indebtedness and the various covenants related thereto, and to generate sufficient income and cash flow to allow the Company to effect the expected share repurchases and dividend payment;
•the ability to successfully integrate any new business acquisitions;
•our failure to maintain our brands’ reputation and successfully respond to changing consumer habits; and successfully respond to changing consumer habits;
• our access to capital markets and borrowing capacity;
•impairment of our goodwill and other intangible assets;
•the ability to successfully manage the financial, legal, reputational and operational risks associated with third-party relationships, such as our suppliers, contract manufacturers, distributors, contractors and external business partners;
•the ability to rely on and maintain key Company and third-party information and operational technology systems, networks and services and maintain the security and functionality of such systems, networks and services and the data contained therein;
•the ability to successfully achieve our environmental sustainability goals and priorities;
•the ability to successfully manage current and expanding regulatory and legal requirements and matters (including, without limitation, those laws and regulations involving product liability, product and packaging composition, manufacturing processes, intellectual property, labor and employment, antitrust, privacy, cybersecurity and data protection, artificial intelligence, tax, the environment, due diligence, risk oversight, accounting and financial reporting) and to resolve new and pending matters within current estimates;
•the ability to adequately protect our intellectual property rights;
•product quality and safety issues, including recalls and product liability; and
•losses or increased funding and expenses related to our pension plans.
In addition, other risks and uncertainties not presently known to us or that we presently consider immaterial could significantly affect the forward-looking statements. The list of factors above is illustrative, but not exhaustive. All forward-looking statements should be evaluated with the understanding of their inherent uncertainty. Additional risks and uncertainties include those detailed from time to time in our publicly filed documents, including in Item 1A. Risk Factors of Part I of this Annual Report on Form 10-K.
PART I
Item 1. Business.
Overview
Edgewell Personal Care Company, and its subsidiaries, is one of the world’s largest manufacturers and marketers of personal care products in the Wet Shave, Sun and Skin Care, and Feminine Care segments. With operations in approximately 20 countries, our products are widely available in more than 50 countries.
History and Development
We were incorporated in the State of Missouri on September 23, 1999 and, prior to April 2000, were a wholly-owned subsidiary of Ralston Purina Company. On April 1, 2000, all of the outstanding shares of our common stock were distributed to shareholders of Ralston Purina Company and we became an independent publicly-owned company. During the years that followed, we implemented a strategy of acquiring several personal care brands, which created the foundation for the company we are today.
In 2003, we completed the acquisition of the Schick-Wilkinson Sword business (“SWS”) from Pfizer, Inc., the second largest manufacturer and marketer of men’s and women’s wet shave products in the world at that time. Our portfolio of wet shave products includes: Hydro® and Quattro® men’s shaving systems; Hydro Silk®, Quattro for Women®, Intuition® and Silk Effects® Plus women’s shaving systems; and the Hydro, Quattro, Xtreme 3®, Slim Twin®, Slim Triple®, Skintimate and Extra3™ disposables. SWS has over 100 years of history in the shaving products industry with a reputation for high quality and innovation in shaving technology. SWS products are sold throughout the world.
In 2007, we acquired Playtex Products, Inc. (“Playtex”), a leading manufacturer and marketer of well-recognized brands such as Playtex® feminine care products, Wet Ones® pre-moistened wipes, and Banana Boat® and Hawaiian Tropic® sun care products, thereby expanding our branded consumer products portfolio.
In 2009, we completed the acquisition of the Edge® and Skintimate® shave preparation brands from S.C. Johnson & Son, Inc., adding market leading United States-based (“U.S.”) shave preparation brands to our existing wet shave product portfolio. In 2010, we completed the acquisition of American Safety Razor, LLC (“ASR”), a leading global manufacturer of private label and value wet shaving razors and blades and specialty blades.
Strengthening our company’s feminine care product portfolio, in 2013 we acquired the Stayfree® pad, Carefree® liner and o.b.® tampon feminine hygiene brands in the U.S., Canada and the Caribbean from Johnson & Johnson.
In 2015, we completed the separation of our Household Products business, which manufactures and markets batteries and portable lighting, into a separate publicly-owned company (the “Spin” or the “Separation”). We completed the tax-free Separation by distributing 100% of the outstanding shares of common stock of Energizer SpinCo, Inc. to our shareholders. The newly formed company assumed the name Energizer Holdings, Inc. (“New Energizer”) and began trading under the symbol “ENR” on the New York Stock Exchange (“NYSE”). Edgewell retained the Personal Care business and trades on the NYSE under the symbol “EPC.” Following the Separation, we do not beneficially own any shares of New Energizer. In connection with the Separation, we changed our name to Edgewell Personal Care Company on June 30, 2015.
In recent years, we have entered the men’s grooming and skin care markets through several acquisitions. On October 31, 2016, we completed the acquisition of Bulldog Skincare Holdings Limited (“Bulldog”), a men’s grooming and skincare company based in the United Kingdom (“U.K.”). On March 1, 2018, we completed the acquisition of Jack Black, L.L.C. (“Jack Black”), a men’s luxury skincare company based in the U.S. On September 2, 2020, we completed the acquisition of Cremo Holding Company, LLC (“Cremo”), a U.S.-based masstige men’s grooming brand. On November 29, 2021, we completed the acquisition of Billie, Inc. (“Billie”), a high-quality shaving and premium body care brand which strengthens our women’s Wet Shave and grooming product portfolio (the “Billie Acquisition”). These more recent acquisitions have created opportunities to expand our personal care portfolio into the growing, global grooming category and have allowed us to leverage our international geographic footprint.
Our Business Segments and Product Strategies
We manage our business in three operating segments: Wet Shave, Sun and Skin Care, and Feminine Care. Segment performance is evaluated based on segment operating profit, exclusive of general corporate expenses, share-based compensation costs, costs associated with restructuring initiatives and other items that are not representative of management’s view on how segment performance is evaluated. Information regarding the product portfolios of these segments is included within the following discussion. Financial information regarding each of our reportable segments, as well as other geographical information, is included in Item 7. Management’s Discussion and Analysis of Financial Condition and Results of Operations and in Note 20 of Notes to Consolidated Financial Statements included within Item 8. Financial Statements and Supplementary Data of this Annual Report on Form 10-K.
Wet Shave
Wet Shave products are sold under the Schick®, Wilkinson Sword®, Edge, Skintimate®, Billie®, Shave Guard and our custom brands group (formerly sold under our Shave Guard and Personna® brands). We manufacture and distribute Schick and Wilkinson Sword razor systems, composed of razor handles and refillable blades, and disposable shave products for men and women. While we market our wet shave products throughout the world, our primary markets are the U.S., Canada, Japan, Germany, France and the U.K. We believe we hold the number two global market share position in wet shaving. The category is highly competitive, with brands vying for consumer loyalty and retail shelf space.
Billie’s strong direct-to-consumer and digital capabilities have underpinned its strong growth, which positioned the brand well for its initial expansion into U.S. brick-and-mortar in 2022. The Billie brand complements and strengthens Edgewell’s position in the women’s shaving category, adding to our portfolio of strong brands such as Schick Intuition, Hydro Silk and Skintimate.
In the U.S., Canada and Japan, we sell market-leading shave preparation products, including shaving gels and creams under the Edge, Skintimate and Shave Guard brands.
We also manufacture, distribute and sell a complete line of private label and disposable razors, shaving systems and replacement blades. These private label wet shave products including emerging direct-to-consumer (“DTC”) brands, are sold primarily under a retailer’s store name or under our value brand names such as Edgewell Custom Brands.
Sun and Skin Care
Sun and Skin Care products are sold under the Banana Boat, Hawaiian Tropic, Bulldog®, Jack Black®, Cremo® and Wet Ones brand names. We market Sun Care products under the Banana Boat and Hawaiian Tropic brands and believe these brands, on a combined basis, hold a leading market share position in the U.S. Sun Care category. We largely compete across the full spectrum of Sun Care categories: general protection, sport, kids, baby, tanning and after sun. Outside of the U.S., we believe we are also the leading Sun Care manufacturer in Mexico with significant presence in Australia and Canada. We expect to continue to drive our worldwide Sun and Skin Care business through product innovation, increased distribution and geographic expansion.
We offer Wet Ones antibacterial hand wipes and other related products as the leader in the U.S. portable hand wipes category. We expect to utilize our position as market leader to further scale the business and use innovation to increase growth.
We have acquired a portfolio of men’s grooming skin care products that have grown under our direction. Our Bulldog skincare products are purpose-built for men and were created to work simply and efficiently while dealing with issues specific to men’s skin. Since acquiring Bulldog, we have expanded sales geographically and we continue to commit resources to further growth and distribution for the brand. We acquired the Jack Black brand and obtained a footprint in the luxury men’s skincare market and continue to use resources at our disposal to grow the Jack Black brand globally. Our Cremo products compete in the masstige category for men’s grooming and offer a complete line of “barber quality” beard, hair and skin care products.
Feminine Care
In Feminine Care, we market products under the Playtex, Stayfree, Carefree and o.b. brands. We offer tampons under the Playtex Gentle Glide® 360°®, Playtex Sport®, Playtex and o.b. brands. We also market pads and liners under the Stayfree and Carefree brands. We believe we are one of the top three manufacturers of feminine care products in North America, with unique, competitive product technologies and well-known brands that address complementary consumer needs. We expect to continue to invest in innovation in our feminine care brands.
Competition
The personal care product categories in which we compete are highly competitive, both in the U.S. and in most international markets, as large manufacturers with global operations and new entrants attempting to disrupt the market compete for consumer acceptance and increasingly limited retail shelf space. Competition is based upon several factors, including, but not limited to, brand quality and perception, product formulation and performance, customer service and price and promotion.
Wet Shave
The global shaving products category is comprised of wet shave blades and razors, electric shavers, and shaving gels and creams. With our established brands and product lines and global presence, we believe we compete effectively in this segment. Our principal competitors in the global wet shave business are: The Procter & Gamble Company, which owns the Gillette brand and is the leading company in the global wet shave segment; The Bic Group, which is expanding beyond its historical strength in the disposable segment; and Dorco, which competes primarily in the private label segment. We also compete with newer entrants to the Wet Shave market for both DTC and traditional retail shelf space including Harry's, Flamingos, Estrid, Athena Club, Perio (Barbasol and PureSilk brands), Beiersdorf (Nivea branded women’s wet shave product in Germany) and numerous other online start-ups.
Sun and Skin Care
The markets for sun and skin care are also highly competitive, characterized by the frequent introduction of new products accompanied by major advertising and promotional programs. Our competitors in these markets consist of a large number of domestic and foreign companies, including Bayer AG and Kenvue.
The Sun Care category is highly regulated and competitive, and increasingly interacts with and is impacted by trends in the skin category. With our balanced Sun Care portfolio, depth of product formulation and manufacturing expertise and global presence, we believe we compete effectively across markets. We intend to continue to compete by leveraging our formulation and manufacturing expertise, driving product innovation, building differentiated brand equity and focusing on in-store visibility.
The global men’s skin care market is expected to continue to grow, with increased demand for men’s personal care products. Our competitors in this market include large companies such as Kenvue, L’Oréal S.A., The Estee Lauder Companies, Inc. and Unilever, and numerous other smaller companies. We compete in the market by creating simple and effective skin care products with natural ingredients at multiple price points through our Bulldog and Cremo skin care products and in the luxury men’s skin care market with Jack Black.
Feminine Care
The markets for feminine care and other personal products are characterized by large manufacturers with global presence, as well as new market entrants, and is likewise very competitive, with a large number of domestic and foreign competitors, including The Procter & Gamble Company and Kimberly Clark Corp. With our acquisition of the Stayfree, Carefree and o.b. brands, we expanded our presence within the feminine care product category and became one of the top three manufacturers in North America. We compete by having a portfolio of well-known brands that address complementary consumer needs.
Sales and Distribution
Our products are marketed primarily through a direct sales force and supplemented by strategic exclusive and non-exclusive distributors and wholesalers. In the U.S., Japan, China, Australia and larger markets in Western Europe and Latin America, we have dedicated commercial organizations, reflecting the scale and importance of these businesses to our Company. In several countries where we do not have dedicated commercial organizations, we utilize third-party distributors and wholesalers. As a result of increased competition through the expansion of online markets, we have established e-commerce operations across several business lines, including global Schick.com websites providing men’s and women’s shaving products, Bulldog, Jack Black and Billie DTC sites, and an acceleration of e-commerce sales in China through our partnership with T-Mall. We distribute our products to consumers through numerous retail locations worldwide, including mass merchandisers and warehouse clubs, food, drug and convenience stores, and military stores, and both traditional and modern trade customers outside of the United States.
Although a large percentage of our sales are attributable to a relatively small number of retail customers, only Walmart Inc. and its subsidiaries (“Walmart”), as a group, account for more than 10% of our consolidated annual net sales. Walmart accounted for approximately 17.2% of our net sales in fiscal 2024. Purchases by Walmart included products from all of our segments. Target Corporation represented approximately 9.5% of net sales for our Sun and Skin Care segment and 9.8% for our Feminine Care segment, respectively.
Generally, orders are shipped within a month of their order date. Because of the short period of time between order and shipment dates, the dollar amount of current backlog is not material and is not considered to be a reliable indicator of future sales volume.
Government contracts do not represent a material portion of our net sales.
Seasonality
Customer orders for Sun Care products within our Sun and Skin Care segment are highly seasonal, which has historically resulted in higher sun care sales to retailers in the United States during the late winter through mid-summer months. Within our Wet Shave segment, sales of women’s products are moderately seasonal, with increased consumer demand in the spring and summer months. See “Our business is subject to seasonal volatility” in Item 1A. Risk Factors.
Sources and Availability of Raw Materials
The principal raw materials used in our products include steel, various plastic resins, plastic based components, textile fibers and non-woven fabrics, organic and inorganic chemicals, soap-based lubricants and plastic-pulp based packaging. These materials are sourced on a regional or global basis, as applicable, and are mostly available from multiple sources. Price and availability of our raw materials fluctuate over time. While we have confidence our supply assurance plans adequately support our current operational needs, we cannot predict the future with certainty. Both price and supply are subject to risk from global socio- and macroeconomic influences such as, but not limited to, force majeure, loss or impairment to key manufacturing sites, transportation, government regulation, currency or other unforeseen circumstances. In the past, we have largely avoided significant interruption in the availability of our input materials and believe that our extensive experience and global reach in procurement will continue to allow us to manage these risks effectively.
Patents, Technology and Trademarks
We own a number of U.S. and international trademarks, which we consider of substantial importance, and which are used individually or in conjunction with our other trademarks. These include, but are not limited to: Edgewell™, Schick, Schick Hydro, Schick Hydro Silk, Hydro Connect™, Wilkinson Sword, Intuition, Quattro, Xtreme 3, Billie, Protector™, Silk Effects, Slim Twin, Edge, Skintimate, Personna, Banana Boat, Hawaiian Tropic, Bulldog, Jack Black, Cremo, Gentle Glide, Sport, Sport Level Protection™, Wet Ones, Stayfree, Carefree and o.b. As a result of the Playtex acquisition, we also own royalty-free licenses in perpetuity to the Playtex trademark in the U.S. and in many international jurisdictions related to certain feminine hygiene and other products but excluding certain baby care and apparel-related products. We consider the protection of our trademarks to be important to our business.
Our ability to compete effectively in the Wet Shave, Sun and Skin Care, and Feminine Care personal care segments depends, in part, on our ability to maintain the proprietary nature of technology and manufacturing processes through a combination of patent and trade secret protection, non-disclosure agreements and licensing agreements. We own or license a considerable number of patents, patent applications and other technology from third parties, which we believe are important to our business. These relate primarily to shaving product improvements and additional features, feminine care hygiene products including digital and applicator tampons, pads and liners, sunscreen formulations and manufacturing processes.
As of September 30, 2024, we owned, either directly or beneficially, 301 unexpired U.S. patents, which have a range of expiration dates from October 2024 to February 2040, and we had 73 pending U.S. patent applications. We routinely prepare additional patent applications for filing in the U.S. and actively pursue foreign patent protection in various countries. As of September 30, 2024, we owned, either directly or beneficially, 1,220 foreign patents, having a range of expiration dates from October 2024 to August 2049, and we had 145 pending patent applications in foreign countries.
We rely on trademark, trade secret, patent and copyright laws to protect our intellectual property rights. We cannot be sure that these intellectual property rights will be effectively utilized or, if necessary, successfully asserted. There is a risk that we will not be able to obtain and perfect our own intellectual property rights, or, where appropriate, license intellectual property rights from others.
Governmental Regulation and Environmental Matters
We are subject to various federal, state, local and foreign laws and regulations by governmental agencies intended to protect the public health and environment, including those governing the manufacture, use, discharge and disposal of hazardous materials, labeling and notice requirements related to consumer exposure to certain chemicals, and requirements for the recycling of our products and their packaging. These agencies include, but are not limited to (i) the U.S. Food and Drug Administration (the “FDA”) and equivalent international agencies that regulate ingredients in consumer products; (ii) the U.S. Environmental Protection Agency (“EPA”) and equivalent international agencies that regulate our manufacturing facilities; and (iii) the Chemical Registration/Notification authorities that regulate chemicals that we use in, or transport to, the various countries in which we manufacture and/or market our products. We have seen an increase in registration and reporting requirements concerning the use of certain chemicals in a number of countries, such as the Registration, Evaluation, Authorization and Restriction of Chemicals (“REACH”) regulations in the European Union (the “E.U.”), which may impact our products.
Contamination has been identified at certain of our current and former facilities, as well as third-party waste disposal sites, and we are conducting investigation and remediation activities in relation to such properties. In connection with certain sites, we have received past notices from the EPA, state agencies and private parties seeking contribution that we have been identified as a potentially responsible party (“PRP”) under the Comprehensive Environmental Response, Compensation and Liability Act of 1980 (“CERCLA”) and, as a result, we may be required to share in the cost of cleanup with respect to a number of federal “Superfund” sites. In addition to potential costs to clean up our own properties, we may also be required to share in the cost of cleanup with respect to state-designated sites and certain international locations.
The amount of our ultimate liability in connection with those sites may depend on many factors, including the volume and toxicity of material contributed to the site, the number of other PRPs and their financial viability and the remediation methods and technology to be used. Total environmental capital expenditures and operating expenses from known environmental liabilities are not expected to have a material adverse effect on our total capital and operating expenditures, cash flows, earnings or competitive position. Current environmental spending estimates could be modified as a result of changes in our plans or our understanding of the underlying facts, changes in legal requirements, including any requirements related to global climate change or other factors.
The U.S. Toxic Substances Control Act of 1976 (“TSCA”) and similar laws in other jurisdictions are intended to ensure that chemicals do not pose unreasonable risks to human health or the environment. TSCA requires the EPA to maintain the TSCA registry listing chemicals manufactured or processed in the United States. Chemicals not listed on the TSCA registry cannot be imported into or sold in the U.S. until registered with the EPA. TSCA also sets forth specific reporting, recordkeeping and testing rules for chemicals, including requirements for the import and export of certain chemicals, as well as other restrictions relevant to our business. Pursuant to these laws, the EPA from time to time issues Significant New Use Rules, or SNURs, when it identifies new uses of chemicals that could pose risks to human health or the environment and also requires pre-manufacture notification of new chemical substances that do not appear on the TSCA registry. When we import chemicals into the U.S., we must ensure that chemicals appear on the TSCA registry prior to import, participate in the SNUR process when a chemical we import requires testing data and report to the EPA information relating to quantities, identities and uses of imported chemicals.
Many European countries, as well as the E.U., have been very active in adopting and enforcing environmental regulations. As such, it is possible that new regulations may increase the risk and expense of doing business in such countries.
REACH requires manufacturers and importers of chemical substances to register such substances with the European Chemicals Agency, (the “ECHA”), and enables European and national authorities to track such substances. Depending on the amount of chemical substances to be manufactured or imported, and the specific risks of each substance, REACH requires different sets of data to be included in the registration submitted to the ECHA. Registration of substances with the ECHA imposes significant recordkeeping requirements that can result in significant financial obligations for companies such as ours to import products into Europe. REACH is accompanied by legislation regulating the classification, labeling and packaging of chemical substances and mixtures.
We believe that our facilities and products are in substantial compliance with current applicable laws and regulations.
Sustainability
Edgewell’s Sustainable Care 2030 strategy provides a roadmap for delivering on our ambitions and guides us to be a successful and responsible business not just today, but for generations to come.
Unveiled in 2020, our Sustainable Care 2030 strategy includes clear targets across our brands, operations and supply chain, as well as our workforce and communities. These 2030 targets include (i) 100% renewable electricity use and carbon neutrality across our global operations; (ii) reducing use of virgin petroleum-based plastic content packaging and select products; (iii) using 100% recyclable, compostable or reusable plastic packaging; and (iv) pursuing zero waste to landfills across manufacturing facilities. We also regularly review our key sustainability priority areas to keep them relevant to our business
today and a changing sustainability landscape. Our priority areas are defined by where we believe we can have the greatest impact, as well as the areas that might most meaningfully impact our business.
We are making progress on our goals, including in priority areas such as sustainable products and packaging, ingredient stewardship, responsible sourcing, reducing waste, protecting the health and safety of our teammates, and embracing diversity, equity, and inclusion across the organization, among others. However, there is no guarantee that we will achieve all of our sustainability priorities on or before 2030 as our progress towards these priorities may be impacted by various factors beyond our control.
Sustainability related disclosures included in this Annual Report, our Proxy Statement and our sustainability reports are informed by standards and guidelines such as the Global Reporting Initiative (“GRI”) and the Task Force on Climate-related Financial Disclosures (“TCFD”). The materiality thresholds in those standards and guidelines may differ from the concept of materiality for purposes of the federal securities laws and disclosures required by the U.S. Securities and Exchange Commission’s (“SEC”) rules in this Annual Report on Form 10-K. Additional information related to our social and environmental sustainability matters can be found at www.edgewell.com/pages/sustainability. The information contained on, or that may be accessed through, our website, is not part of, and not incorporated into, this Annual Report on Form 10-K.
Human Capital
Employee Profile
At Edgewell, we are committed first and foremost to people: our employees, the consumers who use our products, the suppliers and retailers who partner with us, and the communities in which we operate. As of September 30, 2024, we had approximately 6,700 employees, with 2,100 based in the United States. Certain of our employees outside of the U.S. are represented by unions or works councils. We have cultivated a culture that is centered around our guiding purpose of Making Useful Things Joyful, supported by a set of values and behaviors that guide organizational actions and decisions.
We believe our foundational values of “People First,” “Move Forward,” “Listen Up and Speak Up” and “Own It Together” support a culture of celebration, agility, authenticity, inclusion and collaboration. This culture promotes trust and teamwork, which results in bold and aggressive goals, smart risks, and an environment where innovation and ideation thrive. We continue to reinforce these foundational values through several key initiatives such as our performance management process which incorporates a ‘360-degree Values Assessment’ that evaluates each employee’s performance not only on the results achieved, but on how they achieve them and an internal global recognition and service anniversary platform. As recognition of the progress we’ve made in living our foundational values, we have received notable recognition in the following ways:
•Recognized as one of America's Most Responsible Companies by Newsweek and Statista for the fifth year running. In 2024, we rose to #19 overall — and #3 in our industry.
•Ranked #2 out of 400 companies listed on Forbes America's Best Midsize Employers in 2024 — our first time being listed and a testament to our commitment to being a people-first employer.
•Recognized by USA Today and Statista among their list of America’s Climate Leaders in 2024.
•Recipient of the Environmental Protection Agency’s SmartWay Excellence Award as a true industry leader in freight and supply chain environmental performance and energy efficiency, one of only 18 shipper companies to receive the award in 2024.
Employee Wellbeing
The wellbeing of our people remains a primary focus, and we believe that the most productive people are those who are at their best, both physically and mentally. Our employees have access to many programs to support their wellbeing including onsite biometric screening; cancer screening; weight loss programs and education; mental and emotional health awareness and support through our global Employee Assistance Program; and work-life balance through flextime, remote and hybrid working arrangements, and parental leave, among others. Ensuring a positive, meaningful working experience for our employees that is reflective of our purpose and values is central to our business operations. We continually monitor employee retention rates and believe our progressive human resources policies, learning and development, talent management, workplace health and safety, wellbeing programs, and community engagement and support activities enable us to attract and retain key personnel. 2024 saw the launch of a “Be Well” Community of Expertise and a “Be Well” Global Wellbeing Resource Center with the goal of fostering a culture of well-being and caring by supporting employees’ physical, social, financial, and emotional fitness.
Safety
We believe that developing and maintaining a strong safety culture is one of the major keys to our continued success. Additionally, facilities have continued an existing machine safety program and assessment initiative, including completing any remaining assessments and implementing fixes for identified items. Finally, our manufacturing sites have revitalized their “Alive and Well” program and initiatives over the last year with some facilities rolling the program out to other levels in their organization.
Diversity, Equity and Inclusion
We remain committed to creating a work environment where every individual feels respected, connected, valued, and empowered. We recruit the best people for the job regardless of gender, race, ethnicity or other protected traits and it is our policy to comply fully with all domestic, foreign, and local laws relating to discrimination in the workplace. Our diversity, equity, and inclusion (“DEI”) principles are reflected in our values and behaviors, and we continually look for ways to support our global workforce our consumers and the communities we serve.
During 2024, we advanced our focus on DEI through many specific actions including:
•Our CEO continued his commitment through the CEO Action for Diversity & Inclusion™, a coalition uniting business leaders to advance DEI in the workplace through education, training, dialogue and action.
•Our Vice President, DEI is leading and advancing our global DEI strategy as well as supporting our Teammate Resource Groups who remain focused on influencing Edgewell’s inclusive culture for everyone.
•Continued with Mitigating Unconscious Bias training, which is delivered globally to our People Leaders, as well as providing opportunities for our teammates to receive mini lessons on issues that are important to them.
Overall, DEI is an important part of our Sustainable Care 2030 strategy and we will build upon the commitments to promote an open and inclusive culture where everyone is treated fairly and with respect so that we can attract and retain the best talent. Our commitment to DEI was recognized in the following ways in 2024:
•HR Best Practice Pioneer in South China by The American Chamber of Commerce’s Multinational HR Management Association.
•Named as one of America’s Best Employers for Women by Forbes Magazine.
•Named by Newsweek and Plant-A Insights Group's list of America's Greatest Workplaces for Diversity list as well as their America's Greatest Workplaces for Women.
•Named one of the UK's Best Workplaces in Manufacturing, Production & Transportation by Great Places to Work®.
Teammate Experience
We understand that to attract and retain great people, we must listen to and engage them regularly. Each year, we conduct an anonymous employee experience survey to gauge our progress and identify the areas in the employee experience where we excel and areas for improvement. Our overall positivity score has continued to increase year-over-year. Specifically, confidence in Edgewell’s future, a sense of belonging, and a belief that Edgewell provides opportunities to achieve a meaningful work-life balance all increased year over year.
In addition to global themes, our employee experience survey results identified diverse priorities at the functional, country, and team levels. Our goal is to support our People Managers in taking accountability for their results and to empower them to make changes at a local level to improve the employee experience.
Executive Officers
Set forth below are the names and ages as of September 30, 2024, and current positions of our executive officers.
| | | | | | | | |
| Name | Age | Title |
| Rod R. Little | 55 | Chief Executive Officer |
| Daniel J. Sullivan | 55 | Chief Financial Officer (until December 1, 2024), Chief Operating Officer and President Europe and Latin America |
| Paul R. Hibbert | 55 | Chief Supply Chain Officer |
| LaTanya Langley | 49 | Chief People Officer, Chief Legal Officer and Corporate Secretary |
| | |
| John M. Dunham | 46 | Chief Accounting Officer |
| Francesca Weissman | 49 | Chief Financial Officer (effective December 1, 2024) |
Set forth below is a brief description of the position and business experience of each of our executive officers.
Rod R. Little has served as President and Chief Executive Officer since March 1, 2019. Mr. Little previously served as our Chief Financial Officer beginning in March 2018. Prior to joining Edgewell, Mr. Little served as Chief Financial Officer of HSNi from January 2017 to December 2017, and as Executive Vice President and Chief Financial Officer of Elizabeth Arden, Inc. from April 2014 to November 2016. Prior to joining Elizabeth Arden, Mr. Little spent 17 years with Procter & Gamble where he held numerous positions of increasing responsibility in Procter & Gamble’s divisional and corporate finance organization, ultimately serving as the chief finance officer of their global salon professional division from 2009 until 2014. Mr. Little also served for five years in the United States Air Force prior to joining Procter & Gamble in 1997.
Daniel J. Sullivan has served as Chief Financial Officer (“CFO”) since April 1, 2019, and President, Europe and Latin America since October 1, 2022. Effective August 6, 2024, Mr. Sullivan was also appointed as Chief Operating Officer. Prior to joining Edgewell, Mr. Sullivan served as Executive Vice President and Chief Financial Officer of Party City Holdco Inc. Previously, Mr. Sullivan spent six years, from 2010 to 2016, with Ahold USA Inc., where he held positions of increasing responsibility within their control and finance divisions, ultimately serving as Executive Vice President and Chief Financial Officer from 2013 to 2016. Prior to that, Mr. Sullivan spent 13 years at Heineken N.V, most recently as the Chief Financial and Operating Officer of Heineken USA. Mr. Sullivan is a Certified Public Accountant.
Paul R. Hibbert has served as Chief Supply Chain Officer since June 1, 2020. Prior to his current role, Mr. Hibbert was Vice President Global Supply Chain & Operations from February 2018 through May 2020. Before joining Edgewell in 2018, Mr. Hibbert served as the Executive Vice President of Supply Chain for Safety-Kleen Systems, Inc. from 2015 through 2018, and he held various roles of increasing responsibility such as Senior Vice President Supply Chain at Central Garden and Pet Company, Supply Chain Consultant at Chemtura BioLab, Inc., and Supply Chain Vice President Home and Garden Division at Spectrum Brands, Inc.
LaTanya Langley has served as Chief Legal Officer and Corporate Secretary since February 28, 2022. Ms. Langley has also served as Chief People Officer since November 6, 2023 . Prior to joining Edgewell, Ms. Langley served as General Counsel, Corporate Secretary and Compliance Officer of Société Bic S.A (commonly known as BIC), a global manufacturer and distributor of consumer goods products. Prior to becoming General Counsel, Ms. Langley held positions of increasing responsibility within their legal function both in the United States and internationally. Ms. Langley served as General Counsel, BIC International, Group Supply Chain, Emerging Markets, Anti-Corruption Compliance Officer from 2019 to 2021, General Counsel, BIC International, Group Stationery, Anti-Corruption Compliance Officer, Latin America, Middle East, Africa from 2016 to 2019 and General Counsel, BIC International, Developing Markets, from 2015 to 2016. Prior to joining BIC, Ms. Langley served as Senior Counsel at Diageo plc from 2008 to 2015.
John M. Dunham has served as Chief Accounting Officer since March 18, 2024. Prior to joining Edgewell, Mr. Dunham was Senior Director and Assistant Corporate Controller for the Whirlpool Corporation, a publicly traded home appliances manufacturing company, a position he has held since March 2022. Prior to this position, Mr. Dunham served as Director, North America Region Controller from July 2020 to February 2022, Director, Global Accounting Policies and Procedures from August 2019 to June 2020, and Director, External Reporting and Benefits Accounting from August 2017 to February 2020. Prior to joining Whirlpool, Mr. Dunham spent 15 years with PricewaterhouseCoopers, where he held various senior roles. He is also a Certified Public Accountant.
Francesca Weissman will become Chief Financial Officer effective December 1, 2024, succeeding Mr. Sullivan in the role. Ms. Weissman has served as Senior Vice President, Finance and Business Strategy since 2019. Prior to joining Edgewell, Ms. Weissman served as Chief Financial Officer of Party City Retail, a subsidiary of Party City Holdco Inc., from March 2017 to 2019. Previously, Ms. Weissman spent six years, from 2011 to 2017, with Ahold USA Inc., where she held positions of increasing responsibility within their control and finance divisions, ultimately serving as Senior Vice President Strategy, Financial Planning and Analysis from 2014 to 2017. Prior to that, Ms. Weissman spent 12 years at Heineken N.V, most recently as Vice President Finance and Strategic Planning. Ms. Weissman began her career at Ernst & Young and is a Certified Public Accountant.
Our website address is www.edgewell.com. We are not including the information contained on our website as part of, or incorporating it by reference into, this filing. We make available to the public on our website, free of charge, our Annual Reports on Form 10-K, Quarterly Reports on Form 10-Q, Current Reports on Form 8-K and amendments to those reports filed or furnished pursuant to Section 13(a) or 15(d) of the Securities Exchange Act of 1934 as soon as reasonably practicable after such material is electronically filed with, or furnished to, the SEC. Accordingly, investors should monitor our website in addition to our SEC filings and public webcasts. These items are available at www.edgewell.com under Investors/News and Events.
Item 1A. Risk Factors.
The following risks and uncertainties could materially adversely affect our business, results of operations, financial condition and cash flows. We may amend or supplement the risk factors described below from time to time in other reports we file with the SEC.
Macroeconomic Conditions and Related Risk Factors
Changes in production costs, including raw material prices and tariffs, could erode our profit margins and negatively impact operating results.
Pricing and availability of raw materials, energy, shipping, labor and other services needed for our business can be volatile due to general economic conditions, including inflation, supplier capacity restraints, geopolitical developments, changes in supply and demand, natural disasters, energy costs, health epidemics or pandemics, labor shortages and turnover, production levels, currency fluctuations, governmental actions (including import and export requirements such as new or increased tariffs, sanctions, quotas or trade barriers), port congestions or delays, transport capacity restraints, cybersecurity incidents or other disruptions of key manufacturing sites, acts of terrorism and other factors beyond our control. There is no certainty that we will be able to offset future cost increases. This volatility can significantly affect our production costs and may, therefore, have a material adverse effect on our business, results of operations and financial condition.
If such cost pressures persist or exceed our estimates and we are not able to increase the prices of our products or achieve cost savings to offset such cost increases, our operating margins would be negatively impacted. In addition, even if we increase the prices of our products in response to increases in the cost of commodities or other cost increases, we may not be able to sustain such price increases. Sustained price increases may lead to declines in volume as competitors may not adjust their prices or customers may reduce consumption due to pay the higher prices, which could lead to sales and market share declines. Our projections may not accurately predict the potential negative volume impact of price increases, which could adversely affect our business, financial condition and results of operations.
We may not be able to attract, retain and develop key personnel.
Our future performance depends in significant part upon the continued service of our executive officers and other key personnel. The loss of the services of one or more of our executive officers or other key employees could have a material adverse effect on our business, prospects, financial condition and results of operations. Our success also depends on our continuing ability to attract, retain and develop highly qualified personnel. Competition for such personnel is intense, and there can be no assurance that we can retain and motivate our key employees or attract and retain other highly qualified personnel in the future.
Competition in our industries may hinder our ability to execute our business strategy, achieve profitability, or maintain relationships with existing customers.
The categories in which we operate are largely mature and highly competitive, both in the U.S. and globally, as a number of companies compete for consumer acceptance, limited retail shelf space and e-commerce opportunities. Because of the highly competitive environment in which we operate, as well as increasing omni-channel retailer concentration, our customers, frequently seek to obtain pricing concessions or better trade terms, resulting in either reduction of our gross margins or losses of distribution to lower cost competitors. Competition is based upon brand perceptions, product performance and innovation, customer service and price. Our ability to compete effectively may be affected by a number of factors, including:
•several of our competitors, including The Procter & Gamble Company, Unilever, Kenvue and others, may have substantially greater financial, marketing, research and development and other resources and greater market share in certain segments than we do, which could provide them with greater scale and negotiating leverage with retailers and suppliers;
•our competitors may have lower production, sales and distribution costs, and higher profit margins, which may enable them to offer aggressive retail discounts and other promotional incentives;
•our competitors may be able to obtain exclusive distribution rights at particular retailers or favorable in-store placement;
•our retailers could reduce inventories, shift to different products, or require us to lower our prices to retain shelf placement of our products; and
•we may lose market share to private label brands sold by retail chains, or to price brands sold by local and regional competitors, which, in each case, are typically sold at lower prices than our products.
Legal, Regulatory, Tax and Other Risks
Our business is subject to increasing global regulation, including product related regulations and environmental regulations, that may expose us to significant liabilities.
The manufacturing, packaging, labeling, storage, distribution, advertising and sale of our products are subject to extensive regulation. For example, a number of our products are regulated by health authorities both in the U.S. and in the E.U. (such as the U.S. FDA), and by consumer protection organizations (such as the U.S. Consumer Product Safety Commission). These regulatory frameworks focus on our ingredients as well as the safety and efficacy of our products. Similarly, the advertising and marketing of our products is regulated by agencies such as the U.S. Federal Trade Commission. All of these regulatory frameworks exist at the federal, state and local level in the U.S. as well as in foreign countries where we sell our products. New or more restrictive regulations or more restrictive interpretations of existing regulations are likely and could lead to additional compliance costs and could have an adverse impact on our business. Additionally, a finding that we are in violation of, or not in compliance with, applicable laws or regulations could subject us to material civil remedies, including fines, damages, injunctions or product recalls, or criminal sanctions. Even if a claim is unsuccessful, is not merited or is not fully pursued, the negative publicity surrounding such assertions could jeopardize our reputation and brand image and have a material adverse effect on our businesses, as well as require resources to rebuild our reputation.
We must comply with various environmental laws and regulations in the jurisdictions in which we operate, including those relating to the handling and disposal of solid and hazardous wastes and the remediation of contamination associated with the use and disposal of hazardous substances. A release of such substances due to an accident or intentional act could result in substantial liability to governmental authorities or to third parties. Pursuant to certain environmental laws, we could be subject to joint and several strict liability for contamination relating to our or our predecessors’ current or former properties or any of their respective third-party waste disposal sites. In addition to potentially significant investigation and remediation costs, any such contamination can give rise to claims from governmental authorities or other third parties for natural resource damage, personal injury, property damage or other liabilities. We have incurred, and will continue to incur, capital and operating expenses and other costs to comply with environmental laws and regulations, including remediation costs relating to our current and former properties and third-party waste disposal sites. As new laws and regulations are introduced, we could become subject to additional environmental liabilities in the future that could cause a material adverse effect on our results of operations or financial condition.
Our Company may be named a party to legal proceedings or may be subject to product liability or other claims that can result in significant expenses, fines, product recalls or withdrawals and reputational damage, which would affect our results of operations and financial condition. In the ordinary course of business, the Company and its subsidiaries are subject to numerous claims and lawsuits involving various issues such as patent disputes, current and historical product liability claims; claims that our product manufacturing, sales, and marketing practices violate various consumer protection laws both in the U.S. and internationally; and claims arising out of alleged defects in our products, including property damage, bodily injury or other adverse effects. While the Company believes it has substantial defenses in these matters, it is not feasible to predict the ultimate outcome of litigation. The Company could in the future be required to pay significant amounts as a result of settlements or judgments in these matters, including matters where the Company could be held jointly and severally liable among other defendants. In addition to the risk of monetary judgments not covered by insurance, product liability claims could result in negative publicity that could harm our products’ reputation and in certain cases require a product recall. Product recalls or product liability claims, and any subsequent remedial actions, could have a material adverse effect on our business, reputation, brand value, results of operations and financial condition.
Litigation, in general, and class action and multi-district litigation, in particular, can be expensive and disruptive. Some of these matters may include large numbers of plaintiffs, may involve parties seeking large or indeterminate amounts, including punitive or exemplary damages, and may remain unresolved for several years. Although we maintain product liability insurance, this insurance does not cover all types of claims, particularly claims other than those involving personal injury or property damage or claims that exceed the amount of insurance coverage. Further, we may not be able to maintain such insurance in sufficient amounts, on desirable terms, or at all, in the future.
Our business could be negatively impacted by corporate citizenship and sustainability matters.
There is increased focus from certain investors, customers, consumers, employees, and other stakeholders concerning corporate citizenship and sustainability matters. From time to time, we announce certain initiatives, including goals, regarding our focus areas, which include environmental matters, packaging, responsible sourcing, social investments and diversity, equity and inclusion. We could fail, or be perceived to have failed, in our achievement of such initiatives or goals, or we could fail in accurately reporting our progress on such initiatives and goals. Such failures could be due to changes in our business (e.g., shifts in business among distribution channels or acquisitions). Moreover, the standards by which citizenship and sustainability efforts and related matters are measured are evolving, and certain areas are subject to assumptions which could change over time. In addition, we could be criticized for the scope of such initiatives or goals or perceived as not acting responsibly in connection with these matters. Adverse incidents related to corporate citizenship or sustainability matters could impact the value of our brands, the cost of our operations, and our relationships with existing and future investors, which could have a material adverse effect on our business. In addition, in recent years, investor advocacy groups and certain institutional investors have placed increasing importance on sustainability. If, as a result of their assessment of our sustainability practices, certain investors are unsatisfied with our actions or progress, they may reconsider their investment in our Company. At the same time, there also exists “anti-ESG” sentiment among certain stakeholders and government institutions, and we may face scrutiny, reputational risk, product boycotts, lawsuits or market access restrictions from these parties regarding our sustainability initiatives.
Increasing focus on sustainability matters has resulted in, and is expected to continue to result in, evolving legal and regulatory requirements, including mandatory due diligence, disclosure and reporting requirements, as well as a variety of voluntary disclosure frameworks and standards. We have incurred, and are likely to continue to incur, increased costs complying with such standards and regulations, particularly given the lack of convergence among standards. In addition, our processes and controls may not always comply with evolving standards and regulations for identifying, measuring and reporting sustainability metrics; our interpretation of reporting standards and regulations may differ from those of others; and such standards and regulations may change over time, any of which could result in significant revisions to our goals or reported progress in achieving such goals. In addition, methodologies for reporting our data may be updated and previously reported data may be adjusted to reflect improvement in availability and quality of third-party data, changing assumptions, changes in the nature and scope of our operations (including from acquisitions and divestitures), and other changes in circumstances. Any failure or perceived failure, whether or not valid, to pursue or fulfill our sustainability goals and aspirations or to satisfy various sustainability reporting standards or regulatory requirements within the timelines we announce, or at all, could increase the risk of litigation or result in regulatory actions.
If we fail to adequately protect our intellectual property rights, competitors may manufacture and market similar products, which could adversely affect our market share and results of operations.
The vast majority of our total net sales are from products bearing proprietary trademarks and brand names. In addition, we own or license from third parties a considerable number of patents, patent applications and other technology. We rely on trademark, trade secret, patent and copyright laws to protect our intellectual property rights. There is a risk that we will not be able to obtain and perfect or maintain our own intellectual property rights or, where appropriate, license intellectual property rights necessary to support new product introductions. In addition, even if such rights are protected in the U.S., the laws of some other countries in which our products are or may be sold do not protect intellectual property rights to the same extent as the laws of the U.S. Our intellectual property rights could be invalidated, circumvented or challenged in the future, and we could incur significant costs in connection with legal actions relating to such rights. As patents expire, we could face increased competition or decreased royalties, either of which could negatively impact our operating results. If other parties infringe our intellectual property rights, they may dilute the value of our brands in the marketplace, which could diminish the value that consumers associate with our brands which may harm our sales.
Legislative changes in applicable tax laws, policies and regulations or unfavorable resolution of tax matters may result in additional tax liabilities, which could adversely impact our cash flows and results of operations.
Our businesses are subject to taxation in the U.S. and multiple foreign jurisdictions. The impact of any legislative tax law, policy or regulation changes by federal, state, local and foreign authorities may result in additional tax liabilities which could adversely impact our cash flows and results of operations. Significant estimation and judgment are required in determining our provisions for taxes in the U.S. and jurisdictions outside the U.S. In the ordinary course of our business, there are transactions and calculations in which the ultimate tax determination is uncertain. We are regularly under audit by tax authorities, and although we believe our tax positions are defensible and our tax provision estimates are reasonable, the final outcome of tax audits and related litigation could be materially different than that reflected in our income tax provisions and accruals. The unfavorable resolution of any audits or litigation could have an adverse impact on future operating results and our financial condition. More aggressive and assertive tax collection policies, particularly in jurisdictions outside the U.S., may
increase the costs of resolving tax issues and enhance the likelihood that we will have increased tax liabilities going forward. In addition, international tax reform remains a priority with the Organization for Economic Cooperation and Development’s Action Plan on Base Erosion & Profit Shifting and other proposed foreign jurisdictional tax law changes. Given the uncertainty of the possible changes and their potential interdependency, we are unable to determine the net consolidated impact of changes in global tax legislation, if any.
Information Technology and Systems
A failure of a key information technology system or a breach of our information security could adversely impact our ability to conduct business.
We rely extensively on information technology systems in order to conduct business, including some that are managed by third-party service providers. These systems include, but are not limited to, programs and processes relating to internal and external communications, ordering and managing materials from suppliers, converting materials to finished products, shipping products to customers, processing transactions, summarizing and reporting results of operations, and complying with regulatory, legal or tax requirements. These information technology systems could be damaged or cease to function properly due to the poor performance or failure of third-party service providers, catastrophic events, power outages, network outages, failed upgrades or other similar events. If our business continuity plans do not effectively resolve such issues on a timely basis, we may suffer interruptions in conducting our business which may adversely impact our operating results.
Periodically, we also need to upgrade our information technology systems or adopt new technologies. If such a new system or technology does not function properly or otherwise exposes us to increased cybersecurity breaches and failures, it could affect our ability to order materials, make and ship orders, and process payments in addition to other operational and information integrity and loss issues. Further, if the information technology systems, networks or service providers we rely upon fail to function properly or cause operational outages or aberrations, or if we or one of our third-party providers suffer significant unavailability of key operations, or inadvertent disclosure of, lack of integrity of, or loss of our sensitive business or stakeholder information, due to any number of causes, ranging from catastrophic events or power outages to improper data handling, security incidents or employee error or malfeasance, and our business continuity plans do not effectively address these failures on a timely basis, we may be exposed to reputational, competitive, operational, financial and business harm as well as litigation and regulatory action. The costs and operational consequences of responding to the above items and implementing remediation measures could be significant and could adversely impact our results.
An information security incident, including a cybersecurity breach, could have a negative impact to the Company’s business or reputation.
Our systems and networks, as well as those of our retailer customers, suppliers, service providers, and banks, may become the target of advanced cyber-attacks or information security breaches which will pose a risk to the security of our services, systems, networks and supply chain, as well as to the confidentiality, availability and integrity of data of our Company, employees, customers or consumers, and disrupt our operations or damage our facilities or those of third parties. As cybersecurity threats rapidly evolve in sophistication and become more prevalent globally, we are continually increasing our attention and efforts to these potential threats. We assess potential threats and vulnerabilities and make investments seeking to address them, including ongoing monitoring and updating of networks and systems, increasing specialized information security skills, deploying employee security training, and updating security policies for our Company and our third-party providers. However, because the techniques, tools and tactics used in cyber-attacks frequently change and may be difficult to detect for periods of time, we may face difficulties in anticipating and implementing adequate preventative measures or fully mitigating harms after such an attack. As a result, a cyber-attack could negatively impact our net sales and increase our operating and capital costs. In addition, our employees frequently access our suppliers’ and customers’ systems and we may be liable if our employees are the source of any breaches in these third-party systems. It could also damage our reputation with retailer customers and consumers and diminish the strength and reputation of our brands or require us to pay monetary penalties.
Business and Operational Risk Factors
Loss of any of our principal customers could significantly decrease our sales and profitability.
Walmart, together with its subsidiaries, is our largest customer, accounting for 17.2% of our net sales in fiscal 2024. Generally, sales to our top customers are made pursuant to purchase orders and we do not have supply agreements or guarantees of minimum purchases from them. As a result, these customers may decrease their level of purchases from us at any time. The loss or a substantial decrease in the volume of purchases by any of our top customers would harm our sales and profitability. Increasing customer concentration could result in reduced sales outlets for our products, as well as greater negotiating pressures and pricing requirements.
Changes in the policies of our customers and increasing dependence on an omnichannel strategy in developed markets may adversely affect our business.
In recent years, an omnichannel strategy in both in the U.S. and internationally has gained increasing importance. This trend has resulted in the increased size and influence of large, highly consolidated retail customers, including internet-based retailers, who may demand lower pricing, special packaging or impose other commercial requirements on us. These business demands may relate to inventory practices, logistics or other aspects of the customer-supplier relationship. Some of our high-volume customers have sought to obtain pricing and other concessions and better trade terms. To the extent we provide concessions or better trade terms to those customers, our margins are reduced. Further, if we are unable to effectively respond to the demands of our customers, these customers could reduce their purchases of our products and increase their purchases of products from competitors, which would harm our sales and profitability. In addition, reductions in inventory by our customers, including as a result of consolidations in the retail industry, or our customers managing their working capital requirements, could result in reduced orders for our products and adversely affect our results of operations for the financial periods affected by such reductions.
Protracted unfavorable market conditions have caused many of our customers to more critically analyze the number of brands they sell, which could lead to the retailer reducing or discontinuing certain of our product lines, particularly those products that were not number one or two in their category.
We face risks arising from our ongoing efforts to achieve cost savings.
In the normal course of business, we may initiate projects which change our manufacturing footprint or our operations in order to gain production and distribution efficiencies and reduce costs. The execution of cost savings initiatives may present a number of significant risks, including:
•actual or perceived disruption of service or reduction in service standards to customers;
•the failure to preserve adequate internal controls as we restructure our general and administrative functions, including our information technology and financial reporting infrastructure;
•the failure to preserve supplier relationships and distribution, sales and other important relationships and to resolve conflicts that may arise;
•loss of sales as we reduce or eliminate staffing on non-core product lines;
•diversion of management attention from ongoing business activities;
•the failure to maintain employee morale and retain key employees while implementing benefit changes and reductions in the workforce; and
•identification and implementation of potential synergies in our manufacturing footprint
Because of these and other factors, we cannot predict whether we will realize the anticipated benefits of these initiatives and, if we do not, our business and results of operations may be adversely affected.
We are subject to risks related to our international operations, including currency fluctuations, which could adversely affect our results of operations.
We conduct business on a global basis, with nearly 44% of our net sales in fiscal 2024 originating outside the U.S., and a significant portion of our production capacity and cash are located overseas. Consequently, we are subject to a number of risks associated with doing business in foreign countries, including:
•sourcing of raw materials from around the world;
•reliance on China to source, assemble, and transport materials and goods;
•delays in transportation of goods when shipping globally;
•economic conditions impact availability and capacity of key vendors;
•the possibility of expropriation, confiscatory taxation or price controls;
•the ability to repatriate foreign-based cash effectively for strategic needs in the U.S., as well as the heightened counterparty, internal control and country-specific risks associated with holding cash overseas;
•the effect of foreign income taxes, value-added taxes and withholding taxes, including the inability to recover amounts owed to us by a government authority without extended proceedings or at all;
•the effect of the U.S. tax treatment of foreign source income and losses, and other restrictions on the flow of capital between countries;
•adverse changes in local investment or exchange control regulations;
•restrictions on and taxation of international imports and exports;
•legal and regulatory constraints, including tariffs and other trade barriers;
•currency fluctuations, including the impact of hyper-inflationary conditions, particularly where exchange controls limit or eliminate our ability to convert from local currency;
•political or economic instability, government nationalization of business or industries, government corruption and civil unrest, including political or economic instability; and
•difficulty in enforcing contractual and intellectual property rights.
One or more of these factors could harm our international operations or investments and our operating results.
We are currently dependent on third party manufacturers to manufacture certain products for our business. Our business could suffer as a result of a third-party manufacturer’s inability to produce our products for us on time or to our specifications.
There is also a possibility that third-party manufacturers, which produce a portion of our products, could discontinue production with little or no advance notice, or experience financial problems or problems with product quality or timeliness of product delivery, resulting in manufacturing delays or disruptions, regulatory sanctions, product liability claims or consumer complaints. The inability of a third-party manufacturer to ship orders in a timely manner, in desirable quantities or to meet our safety, quality and social compliance standards or regulatory requirements could have a material adverse impact on our business. While certain of our relationships with these third parties are subject to minimum volume commitments, whereby the third-party manufacturer has committed to produce and we have committed to purchase a minimum quantity of product, we may nonetheless experience situations where such manufacturers are unable to fulfill their obligations under our agreements.
Our manufacturing facilities, supply channels or other business operations may be subject to disruption from events beyond our control and we may be unable to implement, maintain and ramp efficient and cost-effective manufacturing capabilities at current and any future manufacturing locations.
Operations of our manufacturing and packaging facilities worldwide, and of our corporate offices, and the methods we use to obtain supplies and to distribute our products, may be subject to disruption for a variety of reasons, including availability of raw materials, work stoppages, industrial accidents, disruptions in logistics, loss or impairment of key manufacturing sites, product quality or safety issues, licensing requirements and other regulatory issues, trade disputes between countries in which we have operations, and acts of war, terrorism, pandemics, fire, earthquake, hurricanes, flooding or other natural disasters. The supply of our raw materials may be similarly disrupted. If a major disruption were to occur, it could result in delays in shipments of products to customers or suspension of operations. We maintain business interruption insurance to potentially mitigate the impact of business interruption, but such coverage may not be sufficient to offset the financial or reputational impact of an interruption.
Likewise, we will need to implement, maintain and ramp efficient and cost-effective manufacturing capabilities at current and any future manufacturing locations. Failure to do so may impact our brands, business, prospects, financial condition and operating results.
Loss of reputation of our leading brands or failure of our marketing plans could have an adverse effect on our business.
We depend on the continuing reputation and success of our brands, particularly the Schick, Wilkinson Sword, Billie, Edge, Skintimate, Playtex, Wet Ones, Banana Boat, Hawaiian Tropic, Bulldog, Cremo, Jack Black, Stayfree, Carefree and o.b. brands.
Our operating results could be adversely affected if one of our leading brands suffers damage to its reputation due to real or perceived quality issues. Further, the success of our brands can suffer if our marketing plans or new product offerings do not improve or have a negative impact on our brands’ image or ability to attract and retain consumers. Additionally, if claims made in our marketing campaigns become subject to litigation alleging false advertising, it could damage one or several of our brands, cause us to alter our marketing plans in ways that may materially and adversely affect sales, or result in the imposition of significant damages against us. Further, a boycott or other campaign critical of us, through social media or otherwise, could negatively impact our brands’ reputation and, consequently, our products’ sales.
Our business is subject to seasonal volatility.
Customer orders for sun care products within our Sun and Skin Care segment are highly seasonal, which has historically resulted in higher sun care sales to retailers during the late winter through mid-summer months. Accordingly, our sales, financial performance, working capital requirements and cash flow may experience volatility during these periods. Further, purchases of our sun care products can be significantly impacted by unfavorable weather conditions during the summer period, and as a result we may suffer decreases in net sales if conditions are not favorable for use of our products, which could in turn have a material adverse effect on our financial condition, results of operation and cash flows. Within our Wet Shave segment, sales of women’s products are moderately seasonal, with increased consumer demand in the spring and summer months.
Our financial performance depends on our ability to anticipate and respond to consumer trends and changes in consumer preferences. New product introductions may not be as successful as we anticipate, which could have a material adverse effect on our business, prospects, results of operations, financial condition and/or cash flows.
We have a rigorous process for the continuous development and evaluation of new product concepts, led by executives in marketing, sales, research and development, product development, operations, legal and finance. However, consumer preference and spending patterns change rapidly and cannot be predicted with certainty. There can be no assurance that we will anticipate and respond to trends for consumer products effectively. Each new product launch, including those resulting from our product development process, carries risks, as well as the possibility of unexpected consequences, including:
•the acceptance of our new product launches and sales of such new products may not be as high as we anticipate;
•our marketing, promotional, advertising and/or pricing strategies for our new products may be less effective than planned and may fail to effectively reach the targeted consumer base or engender the desired consumption of the products by consumers;
•we may incur costs exceeding our expectations as a result of the continued development and launch of new products, including, for example, unanticipated levels of research and development costs, advertising, promotional and/or marketing expenses, sales return expenses or other costs related to launching new products;
•we may experience a decrease in sales of certain of our existing products as a result of newly-launched products, the impact of which could be exacerbated by shelf space limitations and/or any shelf space loss;
•our product pricing strategies for new product launches may not be accepted by customers and/or consumers, which may result in sales being less than we anticipate; and/or
•we may experience a decrease in sales of certain of our products as a result of counterfeit products and/or products sold outside of their intended territories.
Each of the risks referred to above could delay or impede our ability to achieve our sales objectives, which could have a material adverse effect on our business, prospects, results of operations, financial condition and/or cash flows.
Impairment of our goodwill and other intangible assets would result in a reduction in net income.
We have a material amount of goodwill, trademarks and other intangible assets, as well as other long-lived assets, which are periodically evaluated for impairment in accordance with current accounting standards. Declines in our profitability and estimated cash flows related to specific intangible assets, as well as potential changes in market valuations for similar assets and market discount rates, may result in an impairment charge, which could have an adverse impact on our operating results.
Our access to capital markets and borrowing capacity could be limited.
Our access to capital markets to raise funds through the sale of debt or equity securities is subject to various factors, including general economic and financial market conditions. A significant reduction in market liquidity and general economic conditions
could impact access to funding and increase associated borrowing costs, which could reduce our earnings and cash flows. Additionally, disruptions in financial markets could reduce our access to debt and equity capital markets, negatively affecting our ability to implement our business plan and strategy.
Our access to debt financing at competitive risk-based interest rates is partly a function of our credit ratings. The major credit rating agencies periodically evaluate our creditworthiness and have assigned us credit ratings. These ratings are based on a number of factors, which include our financial strength and financial policies as well as our strategies, operations and execution. A downgrade to our credit ratings could have a material impact on our business, including increasing our interest rates, limiting our access to public debt markets, limiting the institutions willing to provide us credit facilities, more restrictive credit arrangements and making any future credit facilities or credit facility amendments more costly and difficult to obtain.
We have a substantial level of indebtedness and are subject to various covenants relating to such indebtedness, which could limit our discretion to operate and grow our business.
As of September 30, 2024, our debt level was $1.3 billion. We may be required to dedicate a substantial portion of our cash to debt service, thereby reducing funds available to fund working capital, capital expenditures, acquisitions and investments and other general corporate purposes. Our failure to make scheduled interest payments or to repay or refinance the indebtedness at maturity or obtain additional financing as needed could have a material adverse effect on our business. Approximately $1.3 billion (98%) of our debt balance as of September 30, 2024, is borrowed at fixed interest rates ranging from 4.125% to 5.50% with maturity dates in 2028 and thereafter.
Additionally, certain of our debt instruments are subject to certain financial and other covenants, including debt ratio tests. We may be in breach of such covenants in the event of future declines in our operating cash flows or earnings performance, foreign currency movements or other events. In the event of such breach, our lenders may be entitled to accelerate the related debt as well as any other debt to which a cross-default provision applies, and we could be required to seek amendments or waivers under the debt instruments or to refinance the debt. There is no assurance that we would obtain such amendments or waivers or effect such refinancing, or that we would be able to do so on terms similar to those of our current debt instruments. The covenants and financial ratio requirements contained in our debt instruments could also:
•increase our vulnerability to general adverse economic and industry conditions;
•require a substantial portion of our cash flow from operations to make payments on our indebtedness;
•reduce the cash flow available or limit our ability to borrow additional funds, to pay dividends, to fund capital expenditures and other corporate purposes and to pursue our business strategies;
•limit our flexibility in planning for, or reacting to, changes in our business and the markets in which we operate; and
•place us at a competitive disadvantage relative to our competitors that have greater financial flexibility or limit, among other things, our ability to borrow additional funds as needed or take advantage of business opportunities as they arise.
Our Revolving Credit Facility (See Liquidity and Capital Resources for details) contains customary representations and warranties, and affirmative and negative covenants, including limitations on additional indebtedness, dividends, and other distributions, entry into new lines of business, use of loan proceeds, restrictions on liens on the assets of the Company and our subsidiaries, transactions with affiliates and dispositions. The breach of any of these covenants could result in a default under the Revolving Credit Facility, as defined below. In addition, the Revolving Credit Facility contains customary events of default that include, among others, non-payment of principal, interest or fees, violation of covenants, inaccuracy of representations and warranties, failure to make payment on, or defaults with respect to, certain other material indebtedness, bankruptcy and insolvency events, material judgments and change of control provisions. Upon the occurrence of an event of default, and after the expiration of any applicable grace period, payment of any outstanding loans under the Revolving Credit Facility could be accelerated and the lenders thereunder could foreclose on their security interests in the assets of the Company and certain of our subsidiaries.
We may not be able to effectively integrate acquired companies to achieve desired financial benefits.
We have completed a number of acquisitions, and we expect to continue making acquisitions if appropriate opportunities arise. Acquisitions could be a key use of our cash and a potential driver of future sales and profit growth. If we can complete future acquisitions, we may face challenges in consolidating functions and effectively integrating procedures, personnel, product lines, and operations in a timely and efficient manner. The integration process can be complex and time consuming, may be disruptive to our existing and acquired businesses and may cause an interruption of, or a loss of momentum in, the business. Even if we can successfully complete the integration of acquired businesses into our operations, there is no assurance that anticipated cost savings, synergies, or revenue enhancements will be realized within the expected time frame, or at all. Such acquisitions may result in potentially dilutive issuances of our equity securities, the incurrence of additional
debt, restructuring charges, impairment charges, contingent liabilities, amortization expenses related to intangible assets, and increased operating expenses, which could adversely affect our results of operations and financial condition.
We may experience losses or be subject to increased funding and expenses related to our pension plans.
The Company has several defined benefit pension plans covering employees in the U.S. and certain employees in other countries. The funding obligations for our pension plans are impacted by the performance of the financial markets, interest rates and governmental regulations. While the pension benefit earned to date by active participants under our legacy U.S. pension plan was frozen effective January 1, 2014, and retirement service benefits no longer accrue under this retirement program, and in 2023, under our Canadian defined benefit pension plan, we derecognized the assets and projected benefit obligation, our pension obligations are expected to remain significant. If the investment of plan assets does not provide the expected long-term returns, if interest rates or other assumptions change, or if governmental regulations change the timing or amounts of required contributions to the plans, we could be required to make additional pension contributions which may have an adverse impact on our liquidity, our ability to comply with debt covenants and may require recognition of increased expense within our financial statements.
Item 1B. Unresolved Staff Comments.
None.
Item 1C. Cybersecurity.
Risk Management and Strategy
We have a cybersecurity program to assess, identify, and manage risks from cybersecurity threats. This includes multiple tools and processes for assessing, identifying, and managing material risks from cybersecurity threats.
Our efforts are designed to maintain the confidentiality, integrity, and availability of our information and operational technology systems and the data stored on those systems. The program includes:
•Conduct periodic risk assessments to identify cybersecurity risks in our IT systems
•Monitor for external threats and manage incident response
•Engage third-party security providers for penetration testing and program reviews based on National Institute of Standards and Technology (“NIST”) standards
•Perform internal audit reviews of IT-related controls
•Assess cybersecurity risks of third-party vendors
•Train employees regularly, including phishing simulations
The cyber security program is continually adapting to the evolving threat landscape and technology developments.
A multi-functional enterprise cyber security and Infrastructure team reviews and assesses top cybersecurity risks. This assessment is shared with members of senior management, including the CFO and Senior Vice President (“SVP”), IT, and helps guide the Company's cybersecurity operational priorities and strategy. In addition, cybersecurity risks are integrated into the Company’s broader Enterprise Risk Management program and, when identified, are reported to relevant business and governance leaders within the Company for appropriate action.
To support the ongoing identification and management of cybersecurity issues, the Company provides information security employee training, conducts global and targeted phishing simulation campaigns and conducts tabletop exercises. The Company also deploys a combination of security tools and experts to help prevent, detect, contain, eradicate and recover from potential cybersecurity issues and cyber-attacks. Further, the Company engages third-party consultants and services for cyber threat intelligence, insights and assessments of its cybersecurity risk posture and governance.
The Company’s third-party intake process incorporates cybersecurity risk into the assessment of our third-party vendors when we engage a new vendor or experience a change in relationship with an existing vendor. Further, the Company’s cybersecurity team conducts reviews of its third-party vendors depending on the vendor’s risk profile as determined by its cybersecurity team.
As a global company, we manage a variety of cybersecurity threats and cannot wholly eliminate the risk of adverse impacts from such incidents. However, as of the date of this Form 10-K, we have not identified any cybersecurity threats that have materially affected or are reasonably likely to materially affect our business strategy, results of our operations or financial condition. For additional information on the risks from cybersecurity threats that we have faced in the past and expect to continue to face in the future, please refer to the “Risk Factors” in Part I, Item 1A of this Form 10-K.
Security Policy and Requirements
As part of our overall risk management program, we have adopted our Information Security Policy which details the overall risk-based framework and governance for the management and security of our information technology assets and information. The policy applies to everyone who accesses our data or information resources and all of our information systems and resources, including third parties we engage. Our program aligns with the NIST 2.0 cybersecurity framework.
Governance
Our Board of Directors are part of the Company’s Cyber Response Task Force and table top simulations. Additionally, the Board of Directors have delegated to the Audit Committee oversight responsibility of our risk management program, including cybersecurity, business continuity, IT operational resilience, and data privacy. The Audit Committee has specific responsibility for reviewing the status of the security of the Company’s electronic data processing information systems related to the Company’s people, assets and information systems. The Audit Committee receives regular updates from the SVP, IT, about information security and systems security programs and plans, including emerging trends and progress on overall enterprise cybersecurity programs and priorities. These updates occur at least two times a year, with interim updates as needed. Additionally, we have protocols by which certain cybersecurity incidents are reported promptly to the Chief Executive Officer, or the Audit Committee, as appropriate. A Cyber dashboard is also provided to the Board of Directors quarterly.
Management is responsible for implementing its strategic plans, including identifying, evaluating, managing and mitigating the risks inherent in them, such as cybersecurity risks.
Internal Cybersecurity Team
The Information Security organization reports into the SVP, IT and includes a dedicated team of centralized information security experts with extensive cybersecurity knowledge and experience to manage the cyber risk under the leadership of the Director of Information Security.
The team is responsible for the following:
•Implementing Enterprise-wide cybersecurity strategy
•Developing and enforcing Cybersecurity Policy
•Developing and enforcing Cybersecurity Standards
•Approving and reviewing Cybersecurity Architecture
•Developing and enforcing Cybersecurity Processes
•Developing and testing Cybersecurity Incident response
•Performing other Cybersecurity operational activities including but not limited to:
◦Vulnerability management strategy
◦Network security configurations
◦Risk Management and oversight of third parties
Incident Response
We have adopted a cybersecurity incident response plan that is designed to provide a framework across all functions for a coordinated identification and response to security incidents. The plan specifies the process for identifying, validating, classifying, documenting, and responding to cybersecurity events as well as determining whether reporting of an event is appropriate under regulatory standards. Internal reporting and escalation protocols are in place to ensure the involvement of the SVP, IT, other senior leaders, and the Audit Committee, as appropriate. Under the plan, we conduct tabletop exercises to test our preparedness and our incident response process, and we provide ongoing training.
Risk Factors
As a global company serving customers in multiple countries and territories, we routinely experience a wide variety of cybersecurity incidents. As of the date of this Form 10-K, we have not experienced a cybersecurity incident that has materially affected or is reasonably likely to materially affect our business strategy, results of operation or financial condition. Additional information on cybersecurity risks we face is discussed in Item 1A, "Risk Factors,” which should be read in conjunction with the information in this section.
Item 2. Properties.
As of September 30, 2024, we owned or leased 55 properties, 29 in the U.S. and 26 globally. Eleven of these properties are used as production plants consisting of 1.8 million square feet that is owned and 1.3 million square feet that is leased. Five of these plants are located in the U.S., and six are in other countries. Seven of these plants are used exclusively by our Wet Shave segment, one by our Feminine Care segment, two by our Sun and Skin Care segment and one is shared by our Wet Shave and Sun and Skin Care segments. We also have 15 warehouses consisting of 0.1 million square feet that is owned and 0.8 million square feet that is leased. We operate from 29 different offices throughout the world, totaling 0.6 million square feet, all of which are leased, and includes our corporate headquarters in Shelton, Connecticut. We believe all of our facilities are well-maintained and suitable for the operations conducted in them.
Item 3. Legal Proceedings.
We, and our subsidiaries, are subject to a number of legal proceedings in various jurisdictions arising out of our operations during the ordinary course of business. Many of these legal matters are in preliminary stages and involve complex issues of law and fact and may proceed for protracted periods of time. The amount of liability, if any, from these proceedings cannot be determined with certainty. We review our legal proceedings and claims, regulatory reviews and inspections on an ongoing basis and follow appropriate accounting guidance when making accrual and disclosure decisions. We establish accruals for those contingencies when the incurrence of a loss is probable and can be reasonably estimated, and disclose the amount accrued and the amount of a reasonably possible loss in excess of the amount accrued, if such disclosure is necessary for our financial statements to not be misleading. We do not record liabilities when the likelihood that the liability has been incurred is probable, but the amount cannot be reasonably estimated. Based upon present information, we believe that our liability, if any, arising from such pending legal proceedings, asserted legal claims and known potential legal claims, which are likely to be asserted, is not reasonably likely to be material to our financial position, results of operations or cash flows, taking into account established accruals for estimated liabilities.
See also the discussion captioned “Governmental Regulation and Environmental Matters” and “Legal, Regulatory, Tax and Other Risks” included within Item 1. Business of this Annual Report on Form 10-K.
Item 4. Mine Safety Disclosures.
Not applicable.
PART II
Item 5. Market for Registrant’s Common Equity, Related Stockholder Matters and Issuer Purchases of Equity Securities.
Market Information
Edgewell common stock is listed and traded on the New York Stock Exchange (“NYSE”) under the symbol “EPC.”
There were 4,388 shareholders of record of our common stock as of October 31, 2024.
Issuer Purchases of Equity Securities
In January 2018, our Board of Directors approved an authorization to repurchase up to 10.0 million shares of our common stock. This authorization replaced a prior share repurchase authorization from May 2015. The following table sets forth the purchases of our Company’s securities by our Company and any affiliated purchasers within the meaning of Rule 10b-18(a)(3) (17 CFR 240.10b-18(a)(3)) during the fourth quarter of fiscal 2024:
| | | | | | | | | | | | | | | | | | | | | | | | | | |
| Period | | Total Number of Shares Purchased (1) | | Average Price Paid per Share (2) | | Total Number of Shares Purchased as Part of Publicly Announced Plans or Programs | | Maximum Number that May Yet Be Purchased Under the Plans or Programs |
| July 1, 2024 to July 31, 2024 | | 85,658 | | | $ | 40.04 | | | 85,658 | | | 3,438,790 | |
| August 1, 2024 to August 31, 2024 | | 89,185 | | | $ | 38.56 | | | 89,185 | | | 3,349,605 | |
| September 1, 2024 to September 30, 2024 | | 309,512 | | | $ | 36.84 | | | 309,512 | | | 3,040,093 | |
(1)There were 3,751 shares purchased during the quarter related to the surrender of shares of common stock to our Company to satisfy tax withholding obligations in connection with the vesting of restricted stock equivalents.
(2)Includes $0.02 per share of brokerage fee commissions.
During fiscal 2024, we repurchased 1,570,584 shares of common stock under the share repurchase authorization from January 2018 for $58.5 million. Future share repurchases, if any, would be made in the open market, privately negotiated transactions or otherwise, in such amounts and at such times as we deem appropriate based upon prevailing market conditions, business needs and other factors.
During fiscal 2024, we repurchased 210,729 shares related to the surrender of shares of common stock to satisfy tax withholding obligations in connection with the vesting of restricted stock equivalent awards.
During the quarter ended September 30, 2024, our executive officers and directors had no equity trading arrangements nor were there any adoptions, terminations, or modifications to a Rule 10b5-1 equity trading plan or any non-Rule 10b5-1 equity trading arrangements as defined in Item 408 of Regulation S-K.
Performance Graph
The following graph compares the cumulative five-year total return provided to shareholders of the Company’s common stock relative to the cumulative total returns of the S&P Midcap 400 index and the S&P Household Products index. An investment of $100 (with reinvestment of all dividends and other distributions) is assumed to have been made in our common stock and in each of the indices on September 30, 2019 and its relative performance is tracked through September 30, 2024. These indices are included only for comparative purposes as required by SEC rules and do not necessarily reflect management’s opinion that such indices are an appropriate measure of the relative performance of our common stock. They are not intended to forecast possible future performance of our common stock, nor is our historical common stock price performance necessarily indicative of our future common stock price performance.
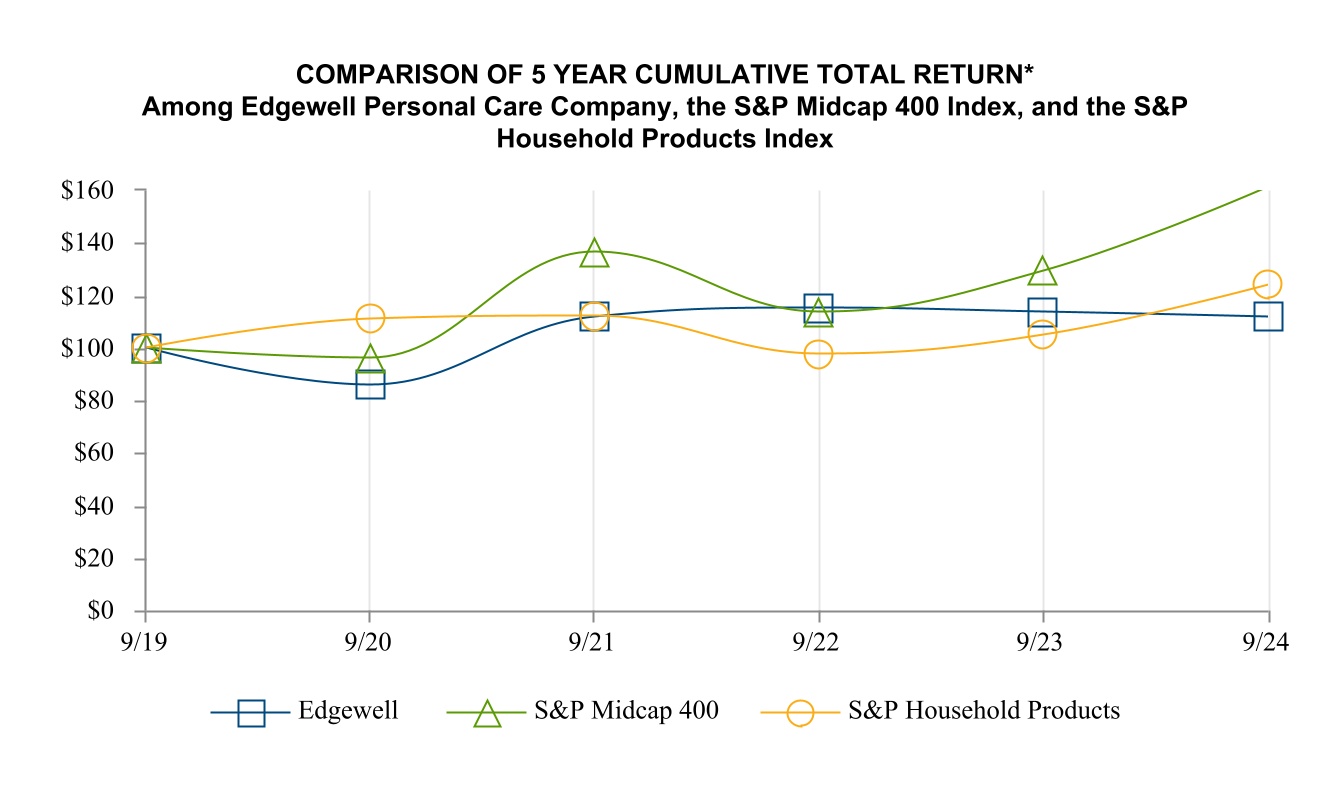
* $100 invested on September 30, 2018 in stock or index, with reinvestment of all dividends. Fiscal year ending September 30.
.
| | | | | | | | | | | | | | | | | | | | | | | | | | | | | | | | | | | | | | |
| | 9/19 | | 9/20 | | 9/21 | | 9/22 | | 9/23 | | 9/24 |
| Edgewell Personal Care Company | | $ | 100.00 | | | $ | 85.81 | | | $ | 111.73 | | | $ | 115.11 | | | $ | 113.76 | | | $ | 111.85 | |
| S&P Midcap 400 | | $ | 100.00 | | | $ | 96.17 | | | $ | 136.43 | | | $ | 113.85 | | | $ | 129.28 | | | $ | 161.30 | |
| S&P Household Products | | $ | 100.00 | | | $ | 110.93 | | | $ | 112.01 | | | $ | 97.79 | | | $ | 104.86 | | | $ | 124.10 | |
Item 6. [Reserved]
Item 7. Management’s Discussion and Analysis of Financial Condition and Results of Operations.
(in millions, except per share data)
The following discussion and analysis of our financial condition and results of operations should be read in conjunction with our Consolidated Financial Statements and the accompanying notes included in this Annual Report on Form 10-K. The following discussion may contain forward-looking statements that reflect our plans, estimates and beliefs and involve risks, uncertainties and assumptions. Our actual results could differ materially from those discussed in these forward-looking statements. Factors that could cause or contribute to these differences include those discussed in Item 1A. Risk Factors and “Forward-Looking Statements” included within this Annual Report on Form 10-K.
Non-GAAP Financial Measures
While we report financial results in accordance with GAAP, this discussion also includes non-GAAP measures. These non-GAAP measures are referred to as “adjusted” or “organic” and exclude items which are considered by the Company as unusual or non-recurring, and which may have a disproportionate positive or negative impact on the Company’s financial results in any particular period. Reconciliations of non-GAAP measures are included within this Management’s Discussion and Analysis of Financial Condition and Results of Operations.
This non-GAAP information is provided as a supplement to, not as a substitute for, or as superior to, measures of financial performance prepared in accordance with GAAP. We use this non-GAAP information internally to make operating decisions and believe it is helpful to investors because it allows more meaningful period-to-period comparisons of ongoing operating results. Given certain significant events, we view the use of non-GAAP measures that take into account the impact of these unique events as particularly valuable in understanding our underlying operational results and providing insights into future performance. The information can also be used to perform trend analysis and to better identify operating trends that may otherwise be masked or distorted by the types of items that are excluded. This non-GAAP information is also a component in determining management’s incentive compensation. Finally, we believe this information provides more transparency.
The following provides additional detail on our non-GAAP measures for the periods presented:
•We analyze net sales and segment profit on an organic basis to better measure the comparability of results between periods. Organic net sales and organic segment profit exclude the impact of changes in foreign currency translation.
•Segment profit will be impacted by fluctuations in translation and transactional foreign currency. The impact of currency was applied to segments using management’s best estimate.
•Additionally, we utilize “adjusted” non-GAAP measures, including adjusted gross margin, adjusted selling general and administrative (“SG&A”), adjusted operating income, adjusted effective tax rate, adjusted net earnings, and adjusted diluted net earnings per share internally to make operating decisions.
All comparisons are with the same period in the prior year, unless otherwise noted.
Executive Summary
The following is a summary of key results for fiscal 2024, 2023 and 2022. Net earnings and diluted earnings per share (“EPS”) for the time periods presented were impacted by certain costs or income, as described in the table below. The impact of these items on reported net earnings and EPS are provided as a reconciliation of net earnings and EPS to adjusted net earnings and adjusted diluted EPS, both of which are non-GAAP measures.
Fiscal 2024
•Net sales in fiscal 2024 increased $2.1, or 0.1%, to $2,253.7, including a $2.2, or 0.1%, unfavorable impact due to currency movements. Organic net sales increased $4.3, or 0.2%, as 7.3% growth in international markets, reflecting both increased volumes and price, was partially offset by a 3.8% decrease in North America organic net sales, primarily reflecting volume declines in Feminine Care, Wet Shave and Wet Ones, partially offset by organic growth across Sun Care and Grooming.
•Net earnings for fiscal 2024 decreased $16.1, or 14.0%, to $98.6. On an adjusted basis, net earnings for fiscal 2024 increased 13.8% to $153.0. Adjusted net earnings increased primarily due to higher gross margin.
•Diluted net earnings per share during fiscal 2024 was $1.97 compared to earnings of $2.21 in the prior fiscal year. On an adjusted basis, as illustrated in the table below, net earnings per diluted share during fiscal 2024 were $3.05 compared to $2.59 in the prior year.
| | | | | | | | | | | | | | | | | | | | | | | | | | | | | | | | | | | | | | | | | |
| Year Ended September 30, 2024 |
| Gross Profit | | SG&A | | Operating Income | | EBIT | | Income Taxes | | Net Earnings | | Diluted EPS |
| GAAP - Reported | $ | 955.7 | | | $ | 430.1 | | | $ | 199.3 | | | $ | 120.9 | | | $ | 22.3 | | | $ | 98.6 | | | $ | 1.97 | |
| Restructuring and repositioning expenses | — | | | 0.1 | | | 36.0 | | | 36.0 | | | 8.8 | | | 27.2 | | | 0.54 | |
| Acquisition and integration costs | 3.3 | | | 2.8 | | | 6.1 | | | 6.1 | | | 1.5 | | | 4.6 | | | 0.09 | |
| | | | | | | | | | | | | |
| Sun Care reformulation | — | | | — | | | 4.4 | | | 4.4 | | | 1.1 | | | 3.3 | | | 0.07 | |
| Wet Ones manufacturing plant fire | 12.2 | | | — | | | 12.2 | | | 12.2 | | | 3.0 | | | 9.2 | | | 0.18 | |
| Legal matters | — | | | 3.9 | | | 3.9 | | | 3.9 | | | 1.0 | | | 2.9 | | | 0.06 | |
| Loss on investment | — | | | — | | | — | | | 3.1 | | | — | | | 3.1 | | | 0.06 | |
| Other project costs | — | | | 5.3 | | | 5.3 | | | 5.3 | | | 1.2 | | | 4.1 | | | 0.08 | |
| Total Adjusted Non-GAAP | $ | 971.2 | | | $ | 418.0 | | | $ | 267.2 | | | $ | 191.9 | | | $ | 38.9 | | | $ | 153.0 | | | $ | 3.05 | |
| | | | | | | | | | | | | |
| GAAP as a percent of net sales | 42.4 | % | | 19.1 | % | | 8.8 | % | | GAAP effective tax rate | 18.5 | % | | |
| Adjusted as a percent of net sales | 43.1 | % | | 18.5 | % | | 11.9 | % | | Adjusted effective tax rate | 20.3 | % | | |
| | | | | | | | | | | | | | | | | | | | | | | | | | | | | | | | | | | | | | | | | |
| Year Ended September 30, 2023 |
| Gross Profit | | SG&A | | Operating Income | | EBIT | | Income Taxes | | Net Earnings | | Diluted EPS |
| GAAP - Reported | $ | 940.8 | | | $ | 409.6 | | | $ | 227.0 | | | $ | 147.7 | | | $ | 33.0 | | | $ | 114.7 | | | $ | 2.21 | |
| Restructuring and repositioning expenses | 0.2 | | | 0.3 | | | 17.1 | | | 17.1 | | | 4.4 | | | 12.7 | | | 0.24 | |
| Acquisition and integration costs | — | | | 7.5 | | | 7.5 | | | 7.5 | | | 1.8 | | | 5.7 | | | 0.11 | |
| SKU rationalization | (1.7) | | | — | | | (1.7) | | | (1.7) | | | (0.4) | | | (1.3) | | | (0.03) | |
Sun Care reformulation (1) | (1.4) | | | — | | | 1.9 | | | 1.9 | | | 0.5 | | | 1.4 | | | 0.03 | |
| Legal matters | — | | | (6.3) | | | (6.3) | | | (6.3) | | | (1.5) | | | (4.8) | | | (0.09) | |
| Pension settlement expense | — | | | — | | | — | | | 7.9 | | | 2.1 | | | 5.8 | | | 0.11 | |
| Other project costs | — | | | 0.4 | | | 0.4 | | | 0.4 | | | 0.1 | | | 0.3 | | | 0.01 | |
| Total Adjusted Non-GAAP | $ | 937.9 | | | $ | 407.7 | | | $ | 245.9 | | | $ | 174.5 | | | $ | 40.0 | | | $ | 134.5 | | | $ | 2.59 | |
| | | | | | | | | | | | | |
| GAAP as a percent of net sales | 41.8 | % | | 18.2 | % | | 10.1 | % | | GAAP effective tax rate | 22.3 | % | | |
| Adjusted as a percent of net sales | 41.7 | % | | 18.1 | % | | 10.9 | % | | Adjusted effective tax rate | 23.0 | % | | |
(1) Also includes pre-tax research and development (“R&D) costs of $3.3 related to the reformulation, recall, and destruction of certain Sun Care products
| | | | | | | | | | | | | | | | | | | | | | | | | | | | | | | | | | | | | | | | | |
| Year Ended September 30, 2022 |
| Gross Profit | | SG&A | | Operating Income | | EBIT | | Income Taxes | | Net Earnings | | Diluted EPS |
| GAAP — Reported | $ | 880.5 | | | $ | 389.1 | | | $ | 182.3 | | | $ | 124.1 | | | $ | 24.6 | | | $ | 99.5 | | | $ | 1.85 | |
| Restructuring and repositioning expenses | 0.1 | | | 0.8 | | | 16.2 | | | 16.2 | | | 4.2 | | | 12.0 | | | 0.23 | |
| Acquisition and integration costs | 0.8 | | | 9.1 | | | 9.9 | | | 9.9 | | | 1.3 | | | 8.6 | | | 0.16 | |
| SKU rationalization | 22.5 | | | — | | | 22.5 | | | 22.5 | | | 5.5 | | | 17.0 | | | 0.32 | |
| Sun Care reformulation | 3.5 | | | — | | | 4.6 | | | 4.6 | | | 1.2 | | | 3.4 | | | 0.06 | |
| Legal matters, net of income taxes | — | | | (7.5) | | | (7.5) | | | (7.5) | | | (1.8) | | | (5.7) | | | (0.11) | |
| Value-added tax settlement costs | — | | | 3.4 | | | 3.4 | | | 3.4 | | | 1.1 | | | 2.3 | | | 0.04 | |
| Pension settlement expense | — | | | — | | | — | | | 1.8 | | | 0.4 | | | 1.4 | | | 0.03 | |
| Total Adjusted Non-GAAP | $ | 907.4 | | | $ | 383.3 | | | $ | 231.4 | | | $ | 175.0 | | | $ | 36.5 | | | $ | 138.5 | | | $ | 2.58 | |
| | | | | | | | | | | | | |
| GAAP as a percent of net sales | 40.5 | % | | 17.9 | % | | 8.4 | % | | GAAP effective tax rate | 19.9 | % | | |
| Adjusted as a percent of net sales | 41.8 | % | | 17.6 | % | | 10.7 | % | | Adjusted effective tax rate | 20.9 | % | | |
For further discussion of these items refer to Note 20 of Notes to Consolidated Financial Statements.
Operating Results
The following table presents changes in net sales for fiscal 2024 and 2023 and provides a reconciliation of organic net sales to reported amounts.
Net Sales
| | | | | | | | | | | | | | | | | | | | | | | |
| Net Sales - Total Company | | | | | | | |
| For the Years Ended September 30, | | | | | | | |
| 2024 | | %Chg | | 2023 | | %Chg |
| Net sales - prior year | $ | 2,251.6 | | | | | $ | 2,171.7 | | | |
| Organic | 4.3 | | | 0.2 | % | | 94.0 | | | 4.3 | % |
| Impact of Billie acquisition, net | — | | | — | % | | 12.0 | | | 0.6 | % |
| Impact of currency | (2.2) | | | (0.1) | % | | (26.1) | | | (1.2) | % |
| Net sales - current year | $ | 2,253.7 | | | 0.1 | % | | $ | 2,251.6 | | | 3.7 | % |
For fiscal 2024, net sales were $2,253.7, an increase of $2.1, or 0.1%, including a $2.2, or 0.1%, unfavorable impact due to currency movements. Organic net sales increased $4.3, or 0.2%, as 7.3% growth in international markets, reflecting both increased volumes and price, was partially offset by a 3.8% decrease in North America organic net sales, primarily reflecting volume declines in Feminine Care, Wet Shave and Wet Ones, partially offset by organic growth across Sun Care and Grooming.
For further discussion regarding net sales, including a summary of reported versus organic changes, see “Segment Results.”
Gross Profit
Gross profit was $955.7 in fiscal 2024, as compared to $940.8 in fiscal 2023, an increase of $14.9, or 1.6%. Gross margin for fiscal 2024 was 42.4% of net sales compared to 41.8% in the prior year period. Adjusted gross margin increased 140-basis points, as productivity savings of approximately 280-basis points and favorable price of approximately 115-basis points, more than offset core inflation and transitory cost headwinds related to unfavorable absorption and heightened unit cost inflation trapped in inventory of approximately 185-basis points, and unfavorable mix of approximately 70-basis points.
Selling, General and Administrative Expense
SG&A was $430.1, or 19.1%, of net sales in fiscal 2024 compared to $409.6, or 18.2%, of net sales in the prior year period. Adjusted SG&A increased 40-basis points to 18.5% of net sales, primarily driven by higher people expenses, legal costs, and broker costs, partially offset by operational efficiency savings, lower bad debt expense and lower incentive compensation expense.
Advertising and Sales Promotion Expense
For fiscal 2024, Advertising and Sales Promotion Expense (“A&P”) was $232.0, up $2.9, or 1.3%, compared to fiscal 2023. A&P was 10.3% of net sales for fiscal 2024, compared with 10.2% in fiscal 2023. The increase in A&P was primarily due to incremental investment in Women’s grooming and Sun Care, partially offset by Wet Shave.
Research and Development Expense
Research and development expense (“R&D”) in fiscal 2024 was $58.4, a decrease of $0.1, or 0.2%, compared to $58.5 in the prior year. R&D remained flat at 2.6% of net sales.
Restructuring Charges
We incurred $36.0 in restructuring charges in fiscal 2024, consisting largely of severance, project implementation and other exit costs. This includes a $15.6 restructuring charge related to certain operational and organizational steps designed to streamline the Company’s operations and supply chain by consolidating its current Mexico operations in Obregon and Mexico City into a single facility in Aguascalientes, Mexico. We expect to incur restructuring charges of approximately $29 in fiscal 2025.
Interest Expense Associated with Debt
Interest expense associated with debt for fiscal 2024 was $76.5, a decrease of $2.0, or 2.5%, as compared to $78.5 in fiscal 2023. The decrease in interest expense was the result of a lower overall debt balance on the Company’s Revolving Credit Facility, partially offset by higher interest rates.
Other Expense (income), Net
Other expense (income), net was expense of $1.9 in fiscal 2024 compared to expense of $0.8 in fiscal 2023, which included currency hedge and remeasurement gains of $8.3 in fiscal 2024 compared to $12.7 in fiscal 2023. Current year expense reflects lower pension expense compared to the prior period, a loss on investment, and higher interest income. Prior year expense includes the loss on the settlement of the Canada defined benefit pension plan of $7.9.
Income Tax Provision
Income taxes, which include federal, state and foreign taxes, were 18.5% and 22.3% of Earnings before income taxes in fiscal 2024 and 2023, respectively. The fiscal 2024 effective tax rate reflects a favorable mix of earnings in lower tax rate jurisdictions and the impact of a change in the Company’s prior estimates. On an adjusted basis, the effective tax rate for fiscal 2024 was 20.3% compared to 23.0% in the prior year.
Our effective tax rate is highly sensitive to the mix of countries from which earnings or losses are derived. Declines in earnings in lower tax rate jurisdictions, earnings increases in higher tax rate jurisdictions, or repatriation of foreign earnings or operating losses in the future could increase future tax rates. Additionally, adjustments to prior year tax provision estimates could increase or decrease future tax provisions.
Segment Results
Segment performance is evaluated based on segment profit, excluding certain U.S. GAAP items that management does not believe are indicative of ongoing operating performance due to their unusual or non-recurring nature and which may have a disproportionate positive or negative impact on the Company’s financial results in any particular period. Financial items, such as interest income and expense, are managed on a global basis at the corporate level and therefore are excluded from segment profit. The exclusion of such charges from segment results reflects management’s view on how management monitors and evaluates segment operating performance, generates future operating plans and makes strategic decisions regarding the allocation of capital.
Our operating model includes some shared business functions across segments, including product warehousing and distribution, transaction processing functions and, in most cases, a combined sales force and management teams. We apply a fully allocated cost basis in which shared business functions are allocated between segments.
The following tables present changes in segment net sales and segment profit for fiscal 2024 and 2023, and also provides a reconciliation of organic segment net sales and organic segment profit to reported amounts. For a reconciliation of Segment profit to Earnings before income taxes, see Note 20 of Notes to Consolidated Financial Statements.
Wet Shave
| | | | | | | | | | | | | | | | | | | | | | | |
| Net Sales - Wet Shave | | | | | | | |
| For the Years Ended September 30, | | | | | | | |
| 2024 | | %Chg | | 2023 | | %Chg |
| Net sales - prior year | $ | 1,230.9 | | | | | $ | 1,242.5 | | | |
| Organic | 3.0 | | | 0.2 | % | | 0.6 | | | — | % |
| Impact of Billie acquisition, net | — | | | — | % | | 12.0 | | | 1.0 | % |
| Impact of currency | (4.6) | | | (0.3) | % | | (24.2) | | | (1.9) | % |
| Net sales - current year | $ | 1,229.3 | | | (0.1) | % | | $ | 1,230.9 | | | (0.9) | % |
Wet Shave net sales for fiscal 2024 were $1,229.3, a decrease of $1.6, or 0.1%, as compared to the prior year period, including $4.6, or 0.3%, unfavorable impact from currency. Organic net sales increased $3.0, or 0.2%, driven by a 7.3% increase in International organic sales, driven by both higher volumes and price. North America sales declined 7.2%, primarily due to lower volumes. North America sales were impacted by continued weak category and channel dynamics, particularly in the highly promotional drug channel, along with heightened competitive dynamics in Women’s shave, as well as significant declines in Shave Preps and Disposables.
| | | | | | | | | | | | | | | | | | | | | | | |
| Segment Profit - Wet Shave | | | | | | | |
| For the Years Ended September 30, | | | | | | | |
| 2024 | | %Chg | | 2023 | | |
| Segment profit - prior year | $ | 158.3 | | | | | $ | 174.5 | | | |
| Organic | 47.4 | | | 29.9 | % | | 9.3 | | | 5.3 | % |
| | | | | | | |
| Impact of currency | (1.8) | | | (1.1) | % | | (25.5) | | | (14.6) | % |
| Segment profit - current year | $ | 203.9 | | | 28.8 | % | | $ | 158.3 | | | (9.3) | % |
Wet Shave segment profit for fiscal 2024 was $203.9, an increase of $45.6, or 28.8%, and inclusive of a $1.8, or 1.1%, unfavorable impact from currency. Organic segment profit increased $47.4, or 29.9%, reflecting higher gross margin and lower marketing expense.
Sun and Skin Care
| | | | | | | | | | | | | | | | | | | | | | | |
| Net Sales - Sun and Skin Care | | | | | | | |
| For the Years Ended September 30, | | | | | | | |
| 2024 | | %Chg | | 2023 | | %Chg |
| Net sales - prior year | $ | 705.5 | | | | | $ | 638.5 | | | |
| Organic | 32.8 | | | 4.6 | % | | 68.1 | | | 10.7 | % |
| Impact of currency | 2.5 | | | 0.4 | % | | (1.1) | | | (0.2) | % |
| Net sales - current year | $ | 740.8 | | | 5.0 | % | | $ | 705.5 | | | 10.5 | % |
Sun and Skin Care net sales for fiscal 2024 were $740.8, an increase of $35.3, or 5.0%. Organic net sales increased $32.8, or 4.6%, driven by Sun Care growth of 9.1% in International markets and 6.1% in North America, as well as 5.5% growth in global Grooming. These increases were partially offset by lower sales in Wet Ones primarily due to unfavorable volume impact related to a fire at our Sidney, Ohio manufacturing plant.
| | | | | | | | | | | | | | | | | | | | | | | |
| Segment Profit - Sun and Skin Care | | | | | | | |
| For the Years Ended September 30, | | | | | | | |
| 2024 | | %Chg | | 2023 | | %Chg |
| Segment profit - prior year | $ | 137.4 | | | | | $ | 108.8 | | | |
| Organic | (7.3) | | | (5.3) | % | | 28.7 | | | 26.4 | % |
| Impact of currency | 1.2 | | | 0.9 | % | | (0.1) | | | (0.1) | % |
| Segment profit - current year | $ | 131.3 | | | (4.4) | % | | $ | 137.4 | | | 26.3 | % |
Sun and Skin Care segment profit for fiscal 2024 was $131.3, a decrease of $6.1, or 4.4%. Organic segment profit decreased $7.3, or 5.3%, primarily driven by higher SG&A and marketing expenses, partially offset by higher gross margins.
Feminine Care
| | | | | | | | | | | | | | | | | | | | | | | |
| Net Sales - Feminine Care | | | | | | | |
| For the Years Ended September 30, | | | | | | | |
| 2024 | | %Chg | | 2023 | | %Chg |
| Net sales - prior year | $ | 315.2 | | | | | $ | 290.7 | | | |
| Organic | (31.5) | | | (10.0) | % | | 25.3 | | | 8.7 | % |
| Impact of currency | (0.1) | | | — | % | | (0.8) | | | (0.3) | % |
| Net sales - current year | $ | 283.6 | | | (10.0) | % | | $ | 315.2 | | | 8.4 | % |
Feminine Care net sales for fiscal 2024 were $283.6, a decrease of $31.6, or 10.0%, primarily related to volume decline in Tampons and Pads.
| | | | | | | | | | | | | | | | | | | | | | | |
| Segment Profit - Feminine Care | | | | | | | |
| For the Years Ended September 30, | | | | | | | |
| 2024 | | %Chg | | 2023 | | %Chg |
| Segment profit - prior year | $ | 49.7 | | | | | $ | 31.5 | | | |
| Organic | (20.8) | | | (41.9) | % | | 19.2 | | | 61.0 | % |
| Impact of currency | (0.1) | | | (0.2) | % | | (1.0) | | | (3.2) | % |
| Segment profit - current year | $ | 28.8 | | | (42.1) | % | | $ | 49.7 | | | 57.8 | % |
Feminine Care segment profit for fiscal 2024 was $28.8, a decrease of $20.9, or 42.1%, mostly due to lower organic net sales and the resulting unfavorable impact on gross profit.
General Corporate and Other Expenses
| | | | | | | | | | | | | |
| Fiscal Year |
| 2024 | | 2023 | | |
| General corporate and other expenses | $ | (65.7) | | | $ | (68.7) | | | |
| Restructuring and repositioning expenses | (36.0) | | | (17.1) | | | |
| Acquisition and integration planning costs | (6.1) | | | (7.5) | | | |
| SKU rationalization | — | | | 1.7 | | | |
| Sun Care reformulation | (4.4) | | | (1.9) | | | |
| Wet Ones manufacturing plant fire | (12.2) | | | — | | | |
| Legal matters | (3.9) | | | 6.3 | | | |
| Loss on investment | (3.1) | | | — | | | |
| | | | | |
| Pension settlement expense | — | | | (7.9) | | | |
| Other project costs | (5.3) | | | (0.4) | | | |
| General corporate and other expenses | $ | (136.7) | | | $ | (95.5) | | | |
| % of net sales | (6.1) | % | | (4.2) | % | | |
During fiscal 2024, corporate expenses were $65.7, or 2.9%, of net sales, compared to $68.7, or 3.1%, of net sales in the prior year. The decrease in corporate expenses was primarily due to lower incentive compensation expense, partially offset by higher people expenses.
During fiscal 2024 and 2023, we incurred $36.0 and $17.1, respectively, in restructuring and repositioning expenses, consisting largely of severance, project implementation and other exit costs. This includes a $15.6 charge in fiscal 2024 related to certain operational and organizational steps designed to streamline the Company’s operations and supply chain by consolidating its current Mexico operations in Obregon and Mexico City into a single facility in Aguascalientes, Mexico. For further information, see Note 3 of Notes to Consolidated Financial Statements.
On December 1, 2023, a fire occurred at our Wet Ones manufacturing plant in Sidney, Ohio. There were no injuries reported and damage was limited to a single manufacturing process. As a consequence of the fire damage, there was a partial shutdown of the operations that manufacture Wet Ones raw materials. During fiscal 2024, we incurred $12.2 in incremental costs related to material charges, increased labor and absorption and other inefficiency costs as a result of the fire.
During fiscal 2024 we settled legal matters for certain class action advertising claims resulting in a charge of $3.9. During fiscal 2023 we settled a legal matter which resulted in a gain of $4.9 related to an intellectual property claim against a third party and also received a favorable court ruling regarding an international VAT matter which resulted in a gain of $2.2 from a release of the reserve previously established. For further information, see Note 19 of Notes to Consolidated Financial Statements.
During fiscal 2024, we recorded a charge of $3.1 for a loss on investment associated with an equity method investment and related note receivable as a result of a new contractual agreement.
During fiscal 2023, the Company released a reserve of $1.7 related to certain accrued expenses associated with the write-off of inventory for certain Wet Ones SKUs. This charge was included in Cost of products sold in the Consolidated Statements of Earnings and Comprehensive Income. Also, during fiscal 2023, the Company recorded a charge of $7.9 related to the wind-up of its Canadian defined benefit pension plan. For further information see Note 14 of Notes to Consolidated Financial Statements.
Liquidity and Capital Resources
At September 30, 2024, we had cash of $209.1, a significant portion of which was located outside the U.S. Given our extensive international operations, a significant portion of our cash is denominated in foreign currencies. Refer to Note 18 of Notes to Consolidated Financial Statements for a discussion of the primary currencies to which the Company is exposed. We manage our worldwide cash requirements by reviewing available funds among the many subsidiaries through which we conduct business and the cost effectiveness with which those funds can be accessed. We generally repatriate a portion of current year earnings from select non-U.S. subsidiaries only if the economic cost of the repatriation is not considered material.
Our cash is deposited with multiple counterparties which consist of major financial institutions. We consistently monitor positions with, and credit ratings of, counterparties both internally and by using outside ratings agencies.
Our total borrowings as of September 30, 2024 and 2023 were as follows:
| | | | | | | | | | | | | | | | | | | | |
| Interest Type | Currency | | September 30,
2024 | | September 30,
2023 |
| Long-term notes | fixed | USD | | $ | 1,250.0 | | | $ | 1,250.0 | |
| Revolver loans borrowed under credit facility | variable | USD | | 34.0 | | | 122.0 | |
| Short-term notes payable | variable | various | | 24.5 | | | 19.5 | |
| Total borrowings | | | | $ | 1,308.5 | | | $ | 1,391.5 | |
Our Revolver utilization is summarized below.
| | | | | | | | | | | |
| September 30,
2024 | | September 30,
2023 |
| Total Revolver Capacity | $ | 425.0 | | | $ | 425.0 | |
| Less: Revolver Borrowings | 34.0 | | | 122.0 | |
| Less: Outstanding Letters of Credit | 5.3 | | | 5.9 | |
| Revolver Balance Available | $ | 385.7 | | | $ | 297.1 | |
On April 2, 2024, (the “Restatement Date”), the Company and certain subsidiaries of the Company entered into a Restatement Agreement (the "Restatement Agreement") with Bank of America, N.A. as administrative agent and collateral agent ("BofA"), and the several lenders from time to time party thereto (together with BofA, the "Lenders"), which amended and restated the Company’s Credit Agreement, dated as of March 28, 2020 (as previously amended by that certain Amendment No. 1 to Credit Agreement, dated as of February 6, 2023, and as otherwise amended, amended and restated, supplemented or otherwise modified prior to the Restatement Date (the “Credit Facility”). All of the $425.0 of revolving facility commitments under the Credit Facility (the “Existing Revolving Facility Commitments”) were replaced with an equal amount of new revolving facility commitments (the “Replacement Revolving Facility Commitments”, collectively, with the Existing Revolving Facility Commitments, the “Revolving Credit Facility”) having substantially similar terms as the Existing Revolving Facility Commitments, except that the maturity date of the Replacement Revolving Facility Commitments will be the earlier of (i) April 2, 2029, and (ii) (a) March 2, 2028, if the aggregate outstanding amount of the Company’s 5.500% Senior Notes due 2028 is greater than $150.0 as of such date and (b) December 29, 2028, if the aggregate outstanding amount of the Company’s 4.125% Senior Notes due 2029 is greater than $150.0 of as such date, in each case, subject to certain exceptions. Refer to Note 13 of Notes to Consolidated Financial Statement for additional discussion.
On February 6, 2023, we amended our Revolving Credit Facility to transition from using the London Interbank Offered Rate (“LIBOR”) to the Secured Overnight Financing Rate (“SOFR”) as LIBOR is no longer available as of June 30, 2023.
On August 5, 2024, we entered into the Seventh Amendment to that certain Master Accounts Receivable Purchase Agreement between Edgewell Personal Care, LLC and MUFG Bank, LTD., (the “Accounts Receivable Facility”) which amended the pricing index used to determine the purchase price for subject receivables from the Bloomberg Short Term Bank Yield Index (“BSBY”) to Term Secured Overnight Financing Rate (“SOFR”). The applicable margin that is added to the SOFR pricing index specific for each obligor was unchanged. Except as noted above, all other material terms, conditions, obligations, covenants or agreements contained in the Accounts Receivable Facility are unmodified in all respects and continue in full force and effect.
Effective February 7, 2022, we increased the maximum receivables sold facility amount under the Sixth Amendment to the Accounts Receivable Facility to $180.0 from $150.0. Refer to Note 11 of Notes to the Consolidated Financial Statements for further discussion on the Accounts Receivable Facility.
On August 5, 2022, we entered into that certain Master Receivable Assignment Agreement between the Company’s wholly-owned subsidiary Schick Japan K.K. and Concerto Receivables Corporation (the “Purchaser”), Tokyo Branch, a subsidiary of MUFG Bank, LTD. (the "Japan Agreement"). The Japan Agreement allows us to assign third party accounts receivable to the
Purchaser and allows for the sale of up to ¥3,000 (approximately $20.0 using the exchange rate as of September 30, 2023) with limits set between individual customers. The terms of the agreement expire one year after the date of execution and will be renewed annually unless either party notifies of its intent not to renew. The assigned receivables will be discounted using the funding rate from the Tokyo Interbank Market plus 1.1%.
Historically, we have generated, and expect to continue to generate, favorable cash flows from operations. Our cash flows are affected by the seasonality of our Sun Care business, typically resulting in higher net sales and increased cash generated in the second and third quarter of each fiscal year. We believe our cash on hand, cash flows from operations and borrowing capacity under the Revolving Credit Facility will be sufficient to satisfy our future working capital requirements, interest payments, R&D activities, capital expenditures, and other financing requirements for at least the next 12 months. We will continue to monitor our cash flows, spending and liquidity needs.
Short-term financing needs primarily consist of working capital requirements and interest payments on our long-term debt. Long-term financing needs will depend largely on potential growth opportunities, including acquisition activity and repayment or refinancing of our long-term debt obligations. Our long-term liquidity may be influenced by our ability to borrow additional funds, renegotiate existing debt, and raise equity under terms that are favorable to us. We may, from time to time, seek to repurchase shares of our common stock. Such repurchases, if any, will depend on prevailing market conditions, our liquidity requirements, contractual restrictions and other factors.
In fiscal 2025, we expect our total capital expenditures to be in the range of $60 to $70 primarily on maintenance and productivity efforts across manufacturing facilities, new product development and information technology system enhancements. While we intend to fund these capital expenditures with cash generated from operations, we may also utilize our borrowing facilities.
During fiscal 2024, we did not make any contributions to our pension and post-retirement plans. Due to the election of certain terms of the American Rescue Plan Act, we were not required to make any cash contributions to our pension and postretirement plans in fiscal 2023. Pension contributions required beyond fiscal 2025 represent future pension payments to comply with local funding requirements in the U.S. only. The projected contributions for the U.S. pension plans total $6.5 in fiscal 2025, $7.0 in fiscal 2026, $5.0 in fiscal 2027, $4.5 in fiscal 2028, and $4.2 in fiscal 2029. Estimated contributions beyond fiscal 2029 are not determinable. The Company may also elect to make discretionary contributions.
Debt Covenants
The Revolving Credit Facility governing our outstanding debt at September 30, 2024 contains certain customary representations and warranties, financial covenants, covenants restricting our ability to take certain actions, affirmative covenants, and provisions relating to events of default. Under the terms of the Revolving Credit Facility, the ratio of our indebtedness to our earnings before interest, taxes, depreciation and amortization (“EBITDA”), as defined in the agreement and detailed below, cannot be greater than 4.0 to 1.0, however, there is an exception for acquisition activity. In addition, under the Revolving Credit Facility, the ratio of our EBITDA to total interest expense must exceed 3.0 to 1.0. If we fail to comply with these covenants or with other requirements of the Revolving Credit Facility, the lenders have the right to accelerate the maturity of the debt. Acceleration under one of our facilities would trigger cross-defaults on our other borrowings. Under the Revolving Credit Facility, EBITDA is defined as net earnings, as adjusted to add-back interest expense, income taxes, depreciation and amortization, all of which are determined in accordance with GAAP. In addition, the Revolving Credit Facility allows certain non-cash charges such as stock award amortization and asset write-offs including, but not limited to, impairment and accelerated depreciation, and operating expense reductions or synergies to be “added-back” in determining EBITDA for purposes of the indebtedness ratio. Total debt and interest expense are calculated in accordance with GAAP.
As of September 30, 2024, we were in compliance with the provisions and covenants associated with the Revolving Credit Facility.
Cash Flows
A summary of our cash flow from operating, investing and financing activities is provided in the following table:
| | | | | | | | | | | | | |
| Fiscal Year |
| 2024 | | 2023 | | |
| Net cash from (used by): | | | | | |
| Operating activities | $ | 231.0 | | | $ | 216.1 | | | |
| Investing activities | (62.4) | | | (50.5) | | | |
| Financing activities | (179.4) | | | (146.5) | | | |
| Effect of exchange rate changes on cash | 3.5 | | | 8.6 | | | |
| Net (decrease) increase in cash and cash equivalents | $ | (7.3) | | | $ | 27.7 | | | |
Operating Activities
Cash flow from operating activities was $231.0 in fiscal 2024, as compared to $216.1 in fiscal 2023. The increase in fiscal 2024 was driven by favorable changes in working capital, partially offset by decreased earnings.
Investing Activities
Cash flow used by investing activities was $62.4 in fiscal 2024 as compared to $50.5 in fiscal 2023. Capital expenditures were $56.5 during fiscal 2024, compared to $49.5 in the prior year period. The increase in cash used by investing activities is also due to an outflow of $6.5 for an investment in a business.
Financing Activities
Net cash used by financing activities was $179.4 in fiscal 2024 as compared to $146.5 in fiscal 2023. During fiscal 2024, we had net borrowings of $88.0 under the Revolving Credit Facility, compared to $33.0 in the prior year period. During fiscal 2024, we repurchased $58.5 of our common stock under our 2018 Board authorization to repurchase our common stock (the “Repurchase Plan”) compared to $75.2 in the prior year period. Dividend payments totaled $30.7 in fiscal 2024, compared to $31.5 in the prior year period. We had financing outflows for employee equity awards held for taxes totaling $7.3 in fiscal 2024, compared to $9.0 in the prior year period.
Dividends
The following is a summary of cash dividends paid and declared per share on the Company’s Common Stock during the year ended September 30, 2024
| | | | | | | | | | | | | | | | | | | | |
| Date Declared | | Record Date | | Payable Date | | Amount Per Share |
| August 1, 2023 | | September 7, 2023 | | October 4, 2023 | | $ | 0.15 | |
| November 2, 2023 | | December 6, 2023 | | January 4, 2024 | | $ | 0.15 | |
| February 1, 2024 | | March 7, 2024 | | April 4, 2024 | | $ | 0.15 | |
| May 8, 2024 | | June 6, 2024 | | July 9, 2024 | | $ | 0.15 | |
| August 6, 2024 | | September 4, 2024 | | October 3, 2024 | | $ | 0.15 | |
| | | | | | |
On October 31, 2024, the Board declared a quarterly cash dividend of $0.15 per common share for the fourth fiscal quarter of 2024. The dividend will be paid on January 8, 2025 to shareholders of record as the close of business on December 3, 2024.
Dividends declared during fiscal 2024 totaled $30.6. Payments made for dividends during fiscal 2024 totaled $30.7.
Inflation
Management recognizes that inflationary pressures may have an adverse effect on our company through higher material costs, labor and transportation costs, asset replacement costs and related depreciation, healthcare and other costs. We continued to navigate the challenging and uncertain inflationary environment and resultant cost pressure with a combination of productivity efforts to achieve efficiencies and lower costs to our Cost of products sold and SG&A expenses and increase focus on revenue management. We can provide no assurance that such mitigation will be available in the future.
Seasonality
Customer orders for sun care products within our Sun and Skin Care segment are highly seasonal. This has historically resulted in higher sun care sales to retailers during the late winter through mid-summer months. Within our Wet Shave segment, sales of women’s products are moderately seasonal, with increased consumer demand in the spring and summer months. See “Our business is subject to seasonal volatility” in Item 1A. Risk Factors.
Foreign Currency
Certain net sales and costs of our international operations are denominated in the local currency of the respective countries. As such, sales and profits from these subsidiaries may be impacted by fluctuations in the value of these local currencies relative to the U.S. dollar. We also have significant intercompany financing arrangements that may result in gains and losses in our results of operations. In an effort to mitigate the impact of currency exchange rate effects, we may hedge certain operational and intercompany transactions; however, our hedging strategies may not fully offset gains and losses recognized in our results of operations.
Commitments and Contingencies
Legal Proceedings
We are subject to a number of legal proceedings in various jurisdictions arising out of our operations during the ordinary course of business. Many of these legal matters are in preliminary stages and involve complex issues of law and fact and may proceed for protracted periods of time. The amount of liability, if any, from these proceedings cannot be determined with certainty. We review legal proceedings and claims, regulatory reviews and inspections and other legal proceedings on an ongoing basis and follows appropriate accounting guidance when making accrual and disclosure decisions. We establish accruals for those contingencies when the incurrence of a loss is probable and can be reasonably estimated and discloses the amount accrued and the amount of a reasonably possible loss in excess of the amount accrued if such disclosure is necessary for its financial statements to not be misleading. We do not record liabilities when the likelihood that the liability has been incurred is probable, but the amount cannot be reasonably estimated. Based upon present information, we believe that the Company’s liability, if any, arising from such pending legal proceedings, asserted legal claims, and known potential legal claims which are likely to be asserted, is not reasonably likely to be material to its financial position, results of operations or cash flows, when taking into account established accruals for estimated liabilities.
Refer to Note 19 in Notes to Consolidated Financial Statements for more information.
Contractual Obligations
We have significant contractual obligations to fulfill our business operations including the repayment of short- and long-term debt, periodic interest payments, minimum levels of pension funding, and other obligations including payments for various leases of real estate, vehicles, and equipment, and minimum fixed costs to be paid to third party logistics vendors. We are also party to various service and supply contracts that generally extend one to three months. These arrangements are primarily individual, short-term purchase orders for routine goods and services at market prices, which are part of our normal operations and are reflected in historical operating cash flow trends. These contracts can generally be canceled at our option at any time. We do not believe such arrangements will adversely affect our liquidity position. In addition, we have various commitments related to service and supply contracts that contain penalty provisions for early termination. Because of the short period between order and shipment date (generally less than one month) for most of our orders, the dollar amount of current backlog is not material and is not considered to be a reliable indicator of future sales volume. Generally, sales to our top customers are made pursuant to purchase orders and we do not have supply agreements or guarantees of minimum purchases from them. As a result, these customers may cancel their purchase orders or reschedule or decrease their level of purchases from us at any time. As of September 30, 2024, we do not believe such purchase arrangements or termination penalties will have a significant effect on our results of operations, financial position or liquidity position in the future.
Environmental Matters
Our operations, like those of other companies, are subject to various federal, state, local and foreign laws and regulations intended to protect public health and the environment. These regulations relate primarily to worker safety, air and water quality, underground fuel storage tanks, and waste handling and disposal. Accrued environmental costs at September 30, 2024 and 2023 were $7.9 and $9.3, respectively. It is difficult to quantify with reasonable certainty the cost of environmental matters, particularly remediation and future capital expenditures for environmental control equipment. Total environmental capital expenditures and operating expenses are not expected to have a material effect on our total capital and operating expenditures, consolidated earnings or competitive position. However, current environmental spending estimates could be modified as a result of changes in our plans or our understanding of underlying facts, changes in legal requirements, including any requirements related to global climate change, or other factors.
Critical Accounting Estimates
The methods, estimates and judgments we use in applying our most critical accounting policies have a significant impact on the results we report in our consolidated financial statements. Specific areas, among others, requiring the application of management’s estimates and judgment include assumptions pertaining to accruals for consumer and trade promotion programs, pension and postretirement benefit costs, future cash flows associated with impairment testing of goodwill and other long-lived assets, uncertain tax positions, the reinvestment of undistributed foreign earnings and tax valuation allowances. On an ongoing basis, we evaluate our estimates, but actual results could differ materially from those estimates.
Our most critical accounting estimates are revenue recognition, pension and other postretirement benefits, the valuation of long-lived assets (including property, plant and equipment), income taxes (including uncertain tax positions) and valuation related to goodwill and intangible assets. A summary of our significant accounting policies is contained in Note 2 of Notes to Consolidated Financial Statements. This listing is not intended to be a comprehensive list of all of our accounting policies.
Revenue Recognition
Our revenue is generated by the sales of finished products to customers. Those sales primarily contain a single performance obligation and revenue is recognized at a single point in time when that control of goods passes to the customer, which is predominantly on the date of receipt by the customer.
The Company allows for returns of products under limited circumstances. Customers are required to pay for the Sun Care product purchased during the season under the required terms. Under certain circumstances, we allow customers to return Sun Care products that have not been sold by the end of the Sun Care season, which is normal practice in the Sun Care industry. At the time of sale, we reduce net sales and cost of products sold for anticipated returns based upon an estimated return level. The timing of returns of Sun Care products can vary in different regions, based on climate and other factors. However, the majority of returns occur in the U.S. from September through January, following the summer Sun Care season. We estimate the level of Sun Care returns as the Sun Care season progresses, using a variety of inputs including historical experience, consumption trends during the Sun Care season, obsolescence factors including expiration dates and inventory positions at key retailers. We monitor shipment activity and inventory levels at key retailers during the season in an effort to more accurately estimate potential returns. This allows us to manage shipment activity to our customers, especially in the latter stages of the Sun Care season, to reduce the potential for returned product. The level of returns may fluctuate from our estimates due to several factors, including, but not limited to, weather conditions, customer inventory levels and competitive
activity. Based on our fiscal 2024 Sun Care shipments, each percentage point change in our returns rate would have impacted our reported net sales by $4.7 and our reported operating income by $4.8. At September 30, 2024 and 2023, our reserve on the Consolidated Balance Sheet for returns was $50.3 and $53.5, respectively.
We offer a variety of trade promotional programs, primarily to our retail customers, designed to promote sales of our products. Such programs require periodic payments and allowances based on estimated results of specific programs and are recorded as a reduction to net sales. We accrue, at the time of sale, the estimated total payments and allowances associated with each transaction. Additionally, we offer programs directly to consumers to promote the sale of our products. Promotions which reduce the ultimate consumer sale prices are recorded as a reduction of net sales at the time the promotional offer is made, generally using estimated redemption and participation levels. The actual amounts paid may be different from such estimates. These differences, which have historically not been significant, are recognized as a change in estimate in a subsequent period.
Pension Plans and Other Postretirement Benefits
The determination of our obligation and expense for pension and other postretirement benefits is dependent on certain assumptions developed by us and used by actuaries in calculating such amounts. Assumptions include, among others, the discount rate, the expected long-term rate of return on plan assets, and future salary increases, where applicable. Actual results that differ from assumptions made are recognized on the balance sheet and subsequently amortized to earnings over future periods. Significant differences in actual experience or significant changes in macroeconomic conditions resulting in changes to assumptions may materially affect pension and other post-retirement obligations. In determining the discount rate, we use the yield on high-quality bonds that coincide with the cash flows of our plans’ estimated payouts. For our U.S. plans, which represent our most significant obligations, we use the Mercer yield curve in determining the discount rates.
We utilize a spot discount rate approach to estimate service and interest components of net periodic benefit cost for our pension benefits. The spot discount rate approach applies the specific spot rates along the yield curve used in the determination of the benefit obligation to the relevant projected cash flows and is a more precise application of the yield curve spot rates used in the traditional single discount rate approach.
Of the assumptions listed above, changes in the expected long-term rate of return on plan assets and changes in the discount rate used in developing plan obligations will likely have the most significant impact on our annual earnings, prospectively. Based on plan assets at September 30, 2024, a one percentage point decrease or increase in expected asset returns would increase or decrease our pension expense by approximately $4.2. In addition, it may increase and accelerate the rate of required pension contributions in the future. Uncertainty related to economic markets and the availability of credit may produce changes in the yields on corporate bonds rated as high-quality. As a result, discount rates based on high-quality corporate bonds may increase or decrease, leading to lower or higher pension obligations, respectively. A one percentage point decrease in the discount rate would increase pension obligations by approximately $49.5 at September 30, 2024.
As allowed under GAAP, our U.S. qualified pension plan uses market related value, which recognizes market appreciation or depreciation in the portfolio over five years, thereby reducing the short-term impact of market fluctuations.
We have historically provided defined benefit pension plans to our eligible employees, former employees and retirees. We fund our pension plans in compliance with the Employee Retirement Income Security Act of 1974 or local funding requirements.
Further detail on our pension and other post-retirement benefit plans is included in Note 14 of Notes to Consolidated Financial Statements.
Valuation of Long-Lived Assets
We periodically evaluate our long-lived assets, including property, plant and equipment, goodwill, and intangible assets, for potential impairment indicators. Judgments regarding the existence of impairment indicators, including lower than expected cash flows from acquired businesses, are based on legal factors, market conditions and operational performance. Future events could cause us to conclude that impairment indicators exist. We estimate fair value using valuation techniques such as discounted cash flows. This requires management to make assumptions regarding future income, working capital, and discount rates, which would affect the impairment calculation.
Income Taxes
Our annual effective income tax rate is determined based on our income, statutory tax rates and the tax impacts of items treated differently for tax purposes than for financial reporting purposes. Tax law requires certain items to be included in the tax return at different times than the items reflected in our financial statements. Some of these differences are permanent,
such as expenses that are not deductible in our tax return, and some differences are temporary, reversing over time, such as depreciation expense. These temporary differences create deferred tax assets and liabilities.
Deferred tax assets generally represent the tax effect of items that can be used as a tax deduction or credit in future years for which we have already recorded the tax benefit in our income statement. Deferred tax liabilities generally represent tax expense recognized in our financial statements for which payment has been deferred, the tax effect of expenditures for which a deduction has already been taken in our tax return but has not yet been recognized in our financial statements, or assets recorded at estimated fair value in business combinations for which there was no corresponding tax basis adjustment.
We estimate income taxes and the effective income tax rate in each jurisdiction that we operate. This involves estimating taxable earnings, specific taxable and deductible items, the likelihood of generating sufficient future taxable income to utilize deferred tax assets, the portion of the income of foreign subsidiaries that is expected to be remitted to the U.S. and be taxable and possible exposures related to future tax audits. Deferred tax assets are evaluated on a subsidiary by subsidiary basis to ensure that the asset will be realized. Valuation allowances are established when the realization is not deemed to be more likely than not. Future performance is monitored, and when objectively measurable operating trends change, adjustments are made to the valuation allowances accordingly. To the extent the estimates described above change, adjustments to income taxes are made in the period in which the estimate is changed.
We operate in multiple jurisdictions with complex tax and regulatory environments, which are subject to differing interpretations by the taxpayer and the taxing authorities. At times, we may take positions that management believes are supportable, but are potentially subject to successful challenges by the appropriate taxing authority. We evaluate our tax positions and establish liabilities in accordance with guidance governing accounting for uncertainty in income taxes. We review these tax uncertainties in light of the changing facts and circumstances, such as the progress of tax audits, and adjust them accordingly.
Further detail on Income Taxes is included in Note 5 of Notes to Consolidated Financial Statements.
Goodwill and Intangible Asset Valuations
Certain business acquisitions have resulted in the recording of goodwill and trade names and brands which are not amortized. At September 30, 2024 and 2023 we had goodwill of $1,338.6 and $1,331.4, respectively. We have indefinite-lived trade names and brands with a carrying value of approximately $597.7 and $592.9 at September 30, 2024 and 2023, respectively. We perform our annual impairment assessment for goodwill and indefinite-lived intangible assets as of July 1st and more frequently if indicators of impairment exist. We consider qualitative factors to assess if it is more likely than not that the fair value for goodwill or indefinite-lived intangible assets is below the carrying amount. We may also elect to bypass the qualitative assessment and perform a quantitative assessment.
In conducting a qualitative assessment, the Company analyzes a variety of events and factors that may influence the fair value of the reporting unit or indefinite-lived intangible asset, including, but not limited to: the results of prior quantitative assessments performed; macroeconomic conditions, industry and market considerations, cost factors, overall financial performance, share price and other relevant factors. Significant judgment is used to evaluate the totality of these events and factors to make a determination of whether it is more likely than not that the fair value of the reporting unit or indefinite-lived intangible is less than its carrying value.
For our annual impairment assessment as of July 1, 2024, the Company elected to bypass the qualitative assessment and perform a quantitative assessment to evaluate certain goodwill reporting units and certain trade names and brands. The Company elected to perform a qualitative assessment on the other goodwill reporting units and indefinite-lived intangible assets noting no events that indicated that the fair value was less than the carrying value that would require a quantitative impairment assessment.
Goodwill
The Company elected to perform a qualitative assessment of goodwill impairment for the Sun Care reporting unit and a quantitative assessment for the Wet Shave, Skin Care and Fem Care reporting units.
In performing a quantitative assessment, we estimated the fair value of each reporting unit by using a weighted income and market approach.
The income approach uses the discounted cash flow method and incorporates each reporting unit’s projections of estimated operating results and future cash flows and a market participant discount rate based on a weighted-average cost of capital. The projections for future cash flows are based on the company’s annual business and long-term strategic plan to determine a five-year period of forecasted cash flows. The financial projections reflect management’s best estimate of economic and market conditions over the five-year projected period including forecasted revenue growth, EBITDA margin, tax rate, capital
expenditures, depreciation and amortization and changes in working capital requirements. Other assumptions include discount rate and terminal growth rate.
The market approach uses the guideline public company method to calculate the fair value of each reporting unit by applying earnings multiples to the operating performance of each reporting unit. The multiples are derived from comparable publicly traded companies with operating and investment characteristics similar to the reporting unit. The multiples are adjusted given the specific characteristics of the reporting unit including its position in the market relative to the guideline companies and applied to the reporting unit’s operating data to arrive at an indication of fair value.
We also corroborate the fair value through a market capitalization reconciliation to determine whether the implied control premium is reasonable based on recent market transactions and other qualitative considerations.
The key assumptions for the market and income approaches used to determine fair value of the reporting units are updated at least annually. Those assumptions and estimates include market multiples, determination of comparable publicly traded companies, discount rates, terminal growth rates, and future levels of revenue growth and EBITDA margins based upon our annual business and strategic plan. The assumptions used for the income approach include a weighted-average cost of capital of 11.0% and terminal growth rates of 2.50%.
Based on the results of our annual quantitative assessment performed as of July 1, 2024, the fair values of our Wet Shave, Skin Care and Feminine Care reporting units exceeded their respective carrying values by 29%, 29% and 21%, respectively.
If actual results are not consistent with management's estimates and assumptions, a material impairment charge of goodwill could occur, which would have a material adverse effect on our consolidated financial statements.
Indefinite-lived intangible assets
The Company elected to bypass the qualitative assessment and perform a quantitative assessment of the Schick and Bulldog trade names. We performed a qualitative test of impairment for all other indefinite-lived intangible assets.
In performing a quantitative assessment of these trade names, we estimate the fair value using the relief-from-royalty method which requires assumptions related to projected revenues from our annual and strategic plans; assumed royalty rates that could be payable if we did not own the trade name or brand; and a market participant discount rate based on a weighted-average cost of capital. If the estimated fair value of the indefinite-lived intangible asset is less than its carrying value, we would recognize an impairment loss.
The key assumptions used in our relief-from-royalty model included revenue growth rates, the discount rate, terminal growth rate and assumed royalty rate. Revenue growth assumptions are based on historical trends and management’s expectations for future growth by brand. The discount rates were based on a weighted-average cost of capital utilizing industry market data of similar publicly traded companies. Terminal growth rates are based on industry market data. We estimated royalty rates based on the operating profits of the brand. The assumptions used for the relief-from-royalty method include a weighted-average cost of capital of 11.25%, terminal growth rate ranging from 0.25% to 2.50% and royalty rates ranging from 2.0% to 5.0%.
Based on the results of our annual quantitative assessment performed as of July 1, 2024, the fair values of our Schick and Bulldog trade names exceeded their respective carrying values by 70% and 14%, respectively.
If actual results are not consistent with management's estimate and assumptions, a material impairment charge of our trade names and brands could occur, which could have a material adverse effect on our consolidated financial statements.
For further discussion, see Note 9 of the Notes to Consolidated Financial Statements.
Determining the fair value of a reporting unit and indefinite-lived intangible assets requires the use of significant judgment, estimates and assumptions. While we believe that the estimates and assumptions underlying the valuation methodologies are reasonable, these estimates and assumptions could have a significant impact on whether an impairment charge is recognized and the magnitude of the charge. The results of an impairment analysis are as of a point in time. There is no assurance that actual future earnings or cash flows of the reporting units will not decline significantly from these projections.
Recently Issued Accounting Standards
Refer to Note 2 of Notes to Consolidated Financial Statements for a discussion regarding recently issued accounting standards and their estimated impact on our financial statements.
Item 7A. Quantitative and Qualitative Disclosures About Market Risk.
($ in millions)
The market risk inherent in our financial instruments and positions represents the potential loss arising from adverse changes in currency rates, commodity prices, interest rates, and our stock price. The following risk management discussion and the estimated amounts generated from the sensitivity analysis are forward-looking statements of market risk, assuming certain adverse market conditions occur. Company policy allows derivatives to be used only for identifiable exposures and, therefore, we do not enter into hedges for trading purposes where the sole objective is to generate profits.
Currency Rate Exposure
A significant share of our sales is tied to currencies other than the U.S. dollar, our reporting currency. As such, a weakening of currencies relative to the U.S. dollar can have a negative impact to reported earnings. Conversely, strengthening of currencies relative to the U.S. dollar can improve reported results. The primary currencies to which we are exposed include the euro, the Japanese yen, the British pound, the Canadian dollar and the Australian dollar.
We do business in certain developing markets, which may be susceptible to greater volatility of inflation and currency exchange rates, as well as government pricing and import controls. While the activity is not considered material in relation to the consolidated company as a whole, there could be negative impacts to operating results in certain markets if inflationary pressures, exchange volatility and government controls negatively impact our ability to operate effectively and profitably.
Derivatives Designated as Cash Flow Hedging Relationships
At September 30, 2024, we maintained a cash flow hedging program related to foreign currency risk. These derivative instruments have a high correlation to the underlying exposure being hedged and have been deemed highly effective by the Company for accounting purposes in offsetting the associated risk.
We enter into forward currency contracts to hedge the cash flow uncertainty associated with currency fluctuations. These transactions are accounted for as cash flow hedges. We had unrealized pre-tax gains of $2.4 and $4.4 at September 30, 2024 and 2023, respectively, on these forward currency contracts accounted for as cash flow hedges included in Accumulated other comprehensive loss (“AOCI”). Assuming foreign exchange rates versus the U.S. dollar remain at September 30, 2024 levels over the next 12 months, the majority of the pre-tax gain included in AOCI at September 30, 2024 is expected to be included in Other expense (income), net. Contract maturities for these hedges extend into fiscal year 2026. There were 64 open foreign currency contracts at September 30, 2024 with a notional value of $106.5.
For further information on our derivatives designated as cash flow hedging relationships, see Note 18 of Notes to Consolidated Financial Statements.
Derivatives Not Designated as Cash Flow Hedging Relationships
Our foreign subsidiaries enter into internal and external transactions in the ordinary course of business that create non-functional currency balance sheet positions at the foreign subsidiary level. These exposures are generally the result of intercompany purchases, intercompany loans and, to a lesser extent, external purchases, and are revalued in the foreign subsidiary’s local currency at the end of each period. Changes in the value of the non-functional currency balance sheet positions in relation to the foreign subsidiary’s local currency result in an exchange gain or loss recorded in Other expense (income), net in the Consolidated Statements of Earnings and Comprehensive Income. The primary currency to which our foreign subsidiaries are exposed is the U.S. dollar.
To mitigate these balance sheet exposures, we enter into foreign currency derivative contracts, which are not designated as cash flow hedges for accounting purposes. Any gains or losses on these contracts are expected to be offset by exchange gains or losses on the underlying exposure; thus, they are not subject to significant market risk. The change in the estimated fair value of the foreign currency contracts resulted in gains of $0.4 and $3.0 for fiscal 2024 and 2023, respectively, which were recorded in Other expense (income), net in the Consolidated Statements of Earnings and Comprehensive Income. There was one open foreign currency derivative contract with a notional value of $9.0. which was not designated as a cash flow hedge at September 30, 2024.
For further information on our derivatives not designated as cash flow hedging relationships, see Note 18 of Notes to Consolidated Financial Statements.
Commodity Price Exposure
We use raw materials that are subject to price volatility. At times, we have used, and may in the future, use hedging instruments to reduce exposure to variability in cash flows associated with future purchases of certain materials and commodities. At September 30, 2024, there were no open derivative or hedging instruments for future purchases of raw materials or commodities.
Interest Rate Exposure
Our exposure to interest rate risk relates primarily to our variable-rate debt instruments, which currently bear interest based on LIBOR plus margin. As of September 30, 2024, our outstanding debt included $34.0 related to our Revolving Credit Facility and international, variable-rate note payable. Assuming a one percent increase in the applicable interest rates, annual interest expense would increase by approximately $0.3.
The remaining outstanding debt as of September 30, 2024 is fixed-rate debt. Changes in market interest rates generally affect the fair value of fixed-rate debt, but do not impact earnings or cash flows.
Item 8. Financial Statements and Supplementary Data.
INDEX TO FINANCIAL STATEMENTS
| | | | | |
| Consolidated Financial Statements | |
| Responsibility for Financial Statements | |
| Report of Independent Registered Public Accounting Firm | |
| Consolidated Statements of Earnings and Comprehensive Income for the fiscal years ended September 30, 2024, 2023 and 2022. | |
| Consolidated Balance Sheets as of September 30, 2024 and 2023. | |
| Consolidated Statements of Cash Flows for the fiscal years ended September 30, 2024, 2023 and 2022. | |
| Consolidated Statements of Changes in Shareholders’ Equity for the period from October 1, 2021 to September 30, 2024. | |
| Notes to Consolidated Financial Statements. | |
Responsibility for Financial Statements
The preparation and integrity of the financial statements of Edgewell Personal Care Company (the “Company”) are the responsibility of its management. These statements have been prepared in conformance with generally accepted accounting principles (“GAAP”) in the United States of America, and in the opinion of management, fairly present the Company’s financial position, results of operations and cash flows.
The Company maintains accounting and internal control systems, which it believes are adequate to provide reasonable assurance that assets are safeguarded against loss from unauthorized use or disposition and that financial records are reliable for preparing financial statements. The selection and training of qualified personnel, the establishment and communication of accounting and administrative policies and procedures, and a program of internal audits are important elements of these control systems.
The Board of Directors, through its Audit Committee consisting solely of non-management directors, meets periodically with management, internal audit and the independent auditors to discuss audit and financial reporting matters. To ensure independence, our auditor, PricewaterhouseCoopers LLP, has direct access to the Audit Committee.
Report of Independent Registered Public Accounting Firm
To the Board of Directors and Shareholders of Edgewell Personal Care Company
Opinions on the Financial Statements and Internal Control over Financial Reporting
We have audited the accompanying consolidated balance sheets of Edgewell Personal Care Company and its subsidiaries (the "Company") as of September 30, 2024 and 2023, and the related consolidated statements of earnings and comprehensive income, of changes in shareholders' equity and of cash flows for each of the three years in the period ended September 30, 2024, including the related notes and schedule of valuation and qualifying accounts for each of the three years in the period ended September 30, 2024 appearing under Item 15(2) (collectively referred to as the "consolidated financial statements"). We also have audited the Company's internal control over financial reporting as of September 30, 2024, based on criteria established in Internal Control - Integrated Framework (2013) issued by the Committee of Sponsoring Organizations of the Treadway Commission (COSO).
In our opinion, the consolidated financial statements referred to above present fairly, in all material respects, the financial position of the Company as of September 30, 2024, and 2023, and the results of its operations and its cash flows for each of the three years in the period ended September 30, 2024, in conformity with accounting principles generally accepted in the United States of America. Also in our opinion, the Company maintained, in all material respects, effective internal control over financial reporting as of September 30, 2024, based on criteria established in Internal Control - Integrated Framework (2013) issued by the COSO.
Basis for Opinions
The Company's management is responsible for these consolidated financial statements, for maintaining effective internal control over financial reporting, and for its assessment of the effectiveness of internal control over financial reporting, included in Management’s Report on Internal Control over Financial Reporting appearing under Item 9A. Our responsibility is to express opinions on the Company’s consolidated financial statements and on the Company's internal control over financial reporting based on our audits. We are a public accounting firm registered with the Public Company Accounting Oversight Board (United States) (PCAOB) and are required to be independent with respect to the Company in accordance with the U.S. federal securities laws and the applicable rules and regulations of the Securities and Exchange Commission and the PCAOB.
We conducted our audits in accordance with the standards of the PCAOB. Those standards require that we plan and perform the audits to obtain reasonable assurance about whether the consolidated financial statements are free of material misstatement, whether due to error or fraud, and whether effective internal control over financial reporting was maintained in all material respects.
Our audits of the consolidated financial statements included performing procedures to assess the risks of material misstatement of the consolidated financial statements, whether due to error or fraud, and performing procedures that respond to those risks. Such procedures included examining, on a test basis, evidence regarding the amounts and disclosures in the consolidated financial statements. Our audits also included evaluating the accounting principles used and significant estimates made by management, as well as evaluating the overall presentation of the consolidated financial statements. Our audit of internal control over financial reporting included obtaining an understanding of internal control over financial reporting, assessing the risk that a material weakness exists, and testing and evaluating the design and operating effectiveness of internal control based on the assessed risk. Our audits also included performing such other procedures as we considered necessary in the circumstances. We believe that our audits provide a reasonable basis for our opinions.
Definition and Limitations of Internal Control over Financial Reporting
A company’s internal control over financial reporting is a process designed to provide reasonable assurance regarding the reliability of financial reporting and the preparation of financial statements for external purposes in accordance with generally accepted accounting principles. A company’s internal control over financial reporting includes those policies and procedures that (i) pertain to the maintenance of records that, in reasonable detail, accurately and fairly reflect the transactions and dispositions of the assets of the company; (ii) provide reasonable assurance that transactions are recorded as necessary to permit preparation of financial statements in accordance with generally accepted accounting principles, and that receipts and expenditures of the company are being made only in accordance with authorizations of management and directors of the company; and (iii) provide reasonable assurance regarding prevention or timely detection of unauthorized acquisition, use, or disposition of the company’s assets that could have a material effect on the financial statements.
Because of its inherent limitations, internal control over financial reporting may not prevent or detect misstatements. Also, projections of any evaluation of effectiveness to future periods are subject to the risk that controls may become inadequate because of changes in conditions, or that the degree of compliance with the policies or procedures may deteriorate.
Critical Audit Matters
The critical audit matter communicated below is a matter arising from the current period audit of the consolidated financial statements that was communicated or required to be communicated to the audit committee and that (i) relates to accounts or disclosures that are material to the consolidated financial statements and (ii) involved our especially challenging, subjective, or complex judgments. The communication of critical audit matters does not alter in any way our opinion on the consolidated financial statements, taken as a whole, and we are not, by communicating the critical audit matter below, providing a separate opinion on the critical audit matter or on the accounts or disclosures to which it relates.
Goodwill Impairment Assessments – Skin Care and Feminine Care Reporting Units
As described in Notes 2 and 9 to the consolidated financial statements, the Company’s consolidated goodwill balance as of September 30, 2024 was $1,338.6 million, and the goodwill associated with the Sun and Skin Care and Feminine Care segments was $355.4 million and $206.2 million, respectively. Goodwill from the Skin Care reporting unit makes up a significant portion of the goodwill related to the Sun and Skin Care segment. Management performs their annual impairment assessment for goodwill as of July 1, or more frequently if indicators of impairment exist. The goodwill impairment test compares a reporting unit’s fair value to its carrying amount. When a quantitative test is performed, management estimates each reporting unit’s fair value using a weighted income approach and market approach. As disclosed by management, determining the fair value of a reporting unit requires the use of significant judgment, estimates and assumptions. The income approach uses the discounted cash flow method, and the key assumptions include discount rates, terminal growth rates, and future levels of revenue growth and EBITDA margins. The market approach uses the guideline public company method to calculate the fair value of each reporting unit by applying earnings multiples to the operating performance of each reporting unit, and the key assumptions include market multiples and determination of comparable publicly traded companies.
The principal considerations for our determination that performing procedures relating to the goodwill impairment assessment of the Skin Care and Feminine Care reporting units is a critical audit matter are (i) the significant judgment by management when developing the fair value estimate of the Skin Care and Feminine Care reporting units; (ii) a high degree of auditor judgment, subjectivity and effort in performing procedures and evaluating management’s significant assumptions related to revenue growth rates and discount rate used in the discounted cash flow method for the Skin Care reporting unit, and revenue growth rates, terminal growth rate, EBITDA margins, and discount rate used in the discounted cash flow method for the Feminine Care reporting unit; and (iii) the audit effort involved the use of professionals with specialized skill and knowledge.
Addressing the matter involved performing procedures and evaluating audit evidence in connection with forming our overall opinion on the consolidated financial statements. These procedures included testing the effectiveness of controls relating to management’s goodwill impairment assessments, including controls over the valuation of the Company’s reporting units. These procedures also included, among others (i) testing management’s process for developing the fair value estimate of the Skin Care and Feminine Care reporting units; (ii) evaluating the appropriateness of the discounted cash flow method used by management; (iii) testing the completeness and accuracy of underlying data used in the discounted cash flow method; and (iv) evaluating the reasonableness of the significant assumptions used by management related to revenue growth rates and discount rate for the Skin Care reporting unit, and revenue growth rates, terminal growth rate, EBITDA margins, and discount rate for the Feminine Care reporting unit. Evaluating management’s assumptions related to revenue growth rates for the Skin Care reporting unit and revenue growth rates and EBITDA margins for the Feminine Care reporting unit involved evaluating whether the assumptions used by management were reasonable considering (i) the current and past performance of the Skin Care and Feminine Care reporting units; (ii) the consistency with external relevant industry forecasts and macroeconomic conditions; (iii) management’s historical forecasting accuracy; (iv) management’s objectives and strategies; and (v) whether the assumptions were consistent with evidence obtained in other areas of the audit. Professionals with specialized skill and knowledge were used to assist in evaluating (i) the appropriateness of the Company’s discounted cash flow method and (ii) the reasonableness of the discount rate assumptions for the Skin Care and Feminine Care reporting units.
/s/ PricewaterhouseCoopers LLP
Stamford, Connecticut
November 14, 2024
We have served as the Company’s auditor since 1999.
EDGEWELL PERSONAL CARE COMPANY
CONSOLIDATED STATEMENTS OF EARNINGS AND COMPREHENSIVE INCOME
(in millions, except per share data)
| | | | | | | | | | | | | | | | | |
| Fiscal Year |
| 2024 | | 2023 | | 2022 |
| Net sales | $ | 2,253.7 | | | $ | 2,251.6 | | | $ | 2,171.7 | |
| Cost of products sold | 1,298.0 | | | 1,310.8 | | | 1,291.2 | |
| Gross profit | 955.7 | | | 940.8 | | | 880.5 | |
| | | | | |
| Selling, general and administrative expense | 430.1 | | | 409.6 | | | 389.1 | |
| Advertising and sales promotion expense | 232.0 | | | 229.1 | | | 238.3 | |
| Research and development expense | 58.4 | | | 58.5 | | | 55.5 | |
| Restructuring charges | 35.9 | | | 16.6 | | | 15.3 | |
| Operating income | 199.3 | | | 227.0 | | | 182.3 | |
| | | | | |
| Interest expense associated with debt | 76.5 | | | 78.5 | | | 71.4 | |
| Other expense (income), net | 1.9 | | | 0.8 | | | (13.2) | |
| Earnings before income taxes | 120.9 | | | 147.7 | | | 124.1 | |
| Income tax provision | 22.3 | | | 33.0 | | | 24.6 | |
| Net earnings | $ | 98.6 | | | $ | 114.7 | | | $ | 99.5 | |
| | | | | |
| Earnings per share (Note 6): | | | | | |
| Basic net earnings per share | $ | 1.98 | | | $ | 2.24 | | | $ | 1.87 | |
| Dilutive net earnings per share | $ | 1.97 | | | $ | 2.21 | | | $ | 1.85 | |
| | | | | |
| Weighted-average shares outstanding: | | | | | |
| Basic | 49.7 | | | 51.2 | | | 53.1 | |
| Diluted | 50.1 | | | 51.8 | | | 53.6 | |
| | | | | |
| Statements of Comprehensive Income: | | | | | |
| Net earnings | $ | 98.6 | | | $ | 114.7 | | | $ | 99.5 | |
| Other comprehensive income (loss), net of tax: | | | | | |
| Foreign currency translation adjustments | 18.6 | | | 44.3 | | | (89.4) | |
| Pension and postretirement activity, net of tax (benefit) provision of $(0.6) in 2024, $2.7 in 2023, and $5.2 in 2022 | 1.2 | | | 6.6 | | | 4.7 | |
| Deferred (loss) gain on hedging activity, net of tax (benefit) provision of $(2.2) in 2024, $(2.2) in 2023, and $2.5 in 2022 | (4.6) | | | (4.8) | | | 5.5 | |
| Total other comprehensive income (loss), net of tax | 15.2 | | | 46.1 | | | (79.2) | |
| Total comprehensive income | $ | 113.8 | | | $ | 160.8 | | | $ | 20.3 | |
See accompanying Notes to Consolidated Financial Statements.
EDGEWELL PERSONAL CARE COMPANY
CONSOLIDATED BALANCE SHEETS
(in millions, except share data)
| | | | | | | | | | | |
| September 30,
2024 | | September 30,
2023 |
| Assets | | | |
| Current assets | | | |
| Cash and cash equivalents | $ | 209.1 | | | $ | 216.4 | |
| Trade receivables, less allowance for doubtful accounts of $4.6 and $5.6 | 109.4 | | | 106.2 | |
| Inventories | 477.3 | | | 492.4 | |
| Other current assets | 140.2 | | | 147.4 | |
| Total current assets | 936.0 | | | 962.4 | |
| Property, plant and equipment, net | 349.1 | | | 337.9 | |
| Goodwill | 1,338.6 | | | 1,331.4 | |
| Other intangible assets, net | 948.5 | | | 973.8 | |
| Other assets | 158.7 | | | 135.2 | |
| Total assets | $ | 3,730.9 | | | $ | 3,740.7 | |
| | | |
| Liabilities and Shareholders’ Equity | | | |
| Current liabilities | | | |
| | | |
| Notes payable | $ | 24.5 | | | $ | 19.5 | |
| Accounts payable | 219.3 | | | 194.4 | |
| Other current liabilities | 319.8 | | | 309.5 | |
| Total current liabilities | 563.6 | | | 523.4 | |
| Long-term debt | 1,275.0 | | | 1,360.7 | |
| Deferred income tax liabilities | 133.2 | | | 136.4 | |
| Other liabilities | 175.0 | | | 179.7 | |
| Total liabilities | 2,146.8 | | | 2,200.2 | |
| Commitments and contingencies (Note 19) | | | |
| Shareholders’ equity | | | |
| Preferred shares, $0.01 par value, 10,000,000 authorized; none issued or outstanding | — | | | — | |
| Common shares, $0.01 par value, 300,000,000 authorized; 65,251,989 issued; 48,920,813 and 50,118,789 outstanding | 0.7 | | | 0.7 | |
| Additional paid-in capital | 1,586.0 | | | 1,593.8 | |
| Retained earnings | 1,090.1 | | | 1,022.1 | |
| Common shares in treasury at cost, 16,331,176 and 15,133,200 | (937.9) | | | (906.1) | |
| Accumulated other comprehensive loss | (154.8) | | | (170.0) | |
| Total shareholders’ equity | 1,584.1 | | | 1,540.5 | |
| Total liabilities and shareholders’ equity | $ | 3,730.9 | | | $ | 3,740.7 | |
See accompanying Notes to Consolidated Financial Statements.
EDGEWELL PERSONAL CARE COMPANY
CONSOLIDATED STATEMENTS OF CASH FLOWS
(in millions)
| | | | | | | | | | | | | | | | | |
| | Fiscal Year |
| | 2024 | | 2023 | | 2022 |
| Cash Flow from Operating Activities | | | | | |
| Net earnings | $ | 98.6 | | | $ | 114.7 | | | $ | 99.5 | |
| Adjustments to reconcile net earnings to net cash flow from operations: | | | | | |
| Depreciation and amortization | 88.0 | | | 91.4 | | | 89.9 | |
| Share-based compensation expense | 26.5 | | | 27.5 | | | 23.8 | |
| Deferred income taxes | (9.6) | | | (4.5) | | | (13.7) | |
| Deferred compensation payments | (2.1) | | | (4.9) | | | (7.3) | |
| Loss on sale of assets | 0.7 | | | 2.5 | | | 1.5 | |
| Defined benefit settlement loss | — | | | 7.9 | | | — | |
| | | | | |
| Other, net | (18.7) | | | (23.5) | | | (9.6) | |
| Changes in current assets and liabilities from operations, net of effects of acquisitions: | | | | | |
| Accounts receivable, net | (7.3) | | | 31.0 | | | (6.6) | |
| Inventories | 19.7 | | | (32.4) | | | (111.3) | |
| Other current assets | 4.7 | | | 20.8 | | | (11.5) | |
| Accounts payable | 17.0 | | | (30.2) | | | 29.3 | |
| Other current liabilities | 13.5 | | | 15.8 | | | 18.0 | |
| Net cash provided by operating activities | 231.0 | | | 216.1 | | | 102.0 | |
| | | | | |
| Cash Flow from Investing Activities | | | | | |
| Capital expenditures | (56.5) | | | (49.5) | | | (56.4) | |
| Acquisitions, net of cash acquired | — | | | — | | | (309.4) | |
| Proceeds from sale of Infant Care business | — | | | — | | | 5.0 | |
| | | | | |
| Collection of deferred purchase price from accounts receivable sold | 0.7 | | | 2.7 | | | 6.9 | |
| Other, net | (6.6) | | | (3.7) | | | (1.5) | |
| Net cash used by investing activities | (62.4) | | | (50.5) | | | (355.4) | |
EDGEWELL PERSONAL CARE COMPANY
CONSOLIDATED STATEMENTS OF CASH FLOWS (Continued)
(in millions)
| | | | | | | | | | | | | | | | | |
| Fiscal Year |
| 2024 | | 2023 | | 2022 |
| Cash Flow from Financing Activities | | | | | |
| Cash proceeds from debt with original maturities greater than 90 days | 813.0 | | | 841.0 | | | 707.0 | |
| Cash payments for debt with original maturities greater than 90 days | (901.0) | | | (874.0) | | | (552.0) | |
| | | | | |
| | | | | |
| Net proceeds from (payments for) debt with original maturities of 90 days or less | 4.2 | | | — | | | (3.9) | |
| | | | | |
| | | | | |
| Repurchase of shares | (58.5) | | | (75.2) | | | (125.3) | |
| Dividends paid to common shareholders | (30.7) | | | (31.5) | | | (32.6) | |
| Employee shares withheld for taxes | (7.3) | | | (9.0) | | | (10.7) | |
| Net financing inflow (outflow) from the Accounts Receivable Facility | 5.2 | | | 2.3 | | | (0.8) | |
| Other, net | (4.3) | | | (0.1) | | | 0.7 | |
| Net cash used by financing activities | (179.4) | | | (146.5) | | | (17.6) | |
| | | | | |
| Effect of exchange rate changes on cash | 3.5 | | | 8.6 | | | (19.5) | |
| | | | | |
| Net (decrease) increase in cash and cash equivalents | (7.3) | | | 27.7 | | | (290.5) | |
| Cash and cash equivalents, beginning of period | 216.4 | | | 188.7 | | | 479.2 | |
| Cash and cash equivalents, end of period | $ | 209.1 | | | $ | 216.4 | | | $ | 188.7 | |
| | | | | |
| Supplemental Disclosures of Cash Flow Information: | | | | | |
| Cash paid for interest, net | $ | 62.8 | | | $ | 74.3 | | | $ | 68.4 | |
| Cash paid for income taxes, net | 33.5 | | | 45.8 | | | 23.8 | |
See accompanying Notes to Consolidated Financial Statements.
EDGEWELL PERSONAL CARE COMPANY
CONSOLIDATED STATEMENTS OF CHANGES IN SHAREHOLDERS’ EQUITY
(in millions)
| | | | | | | | | | | | | | | | | | | | | | | | | | | | | | | | | | | | | | | | | | | | | | | |
| Common Shares | | Treasury Shares | | | | | | | | |
| Number | | Par Value | | Number | | Amount | | Additional Paid-In Capital | | Retained Earnings | | Accumulated Other Comprehensive Loss | | Total Shareholders’ Equity |
| | | | | | | | | | | | | | | |
| | | | | | | | | | | | | | | |
| | | | | | | | | | | | | | | |
| | | | | | | | | | | | | | | |
| | | | | | | | | | | | | | | |
| | | | | | | | | | | | | | | |
| | | | | | | | | | | | | | | |
| | | | | | | | | | | | | | | |
| | | | | | | | | | | | | | | |
| | | | | | | | | | | | | | | |
| | | | | | | | | | | | | | | |
| | | | | | | | | | | | | | | |
| | | | | | | | | | | | | | | |
| | | | | | | | | | | | | | | |
| Balance at October 1, 2021 | 65.2 | | | $ | 0.7 | | | (10.9) | | | $ | (776.3) | | | $ | 1,631.1 | | | $ | 872.2 | | | $ | (136.9) | | | $ | 1,590.8 | |
| Net earnings | — | | | — | | | — | | | — | | | — | | | 99.5 | | | — | | | 99.5 | |
| Dividends declared to common shareholders | — | | | — | | | — | | | — | | | — | | | (32.6) | | | — | | | (32.6) | |
| Foreign currency translation adjustments | — | | | — | | | — | | | — | | | — | | | — | | | (89.4) | | | (89.4) | |
| Pension and postretirement activity | — | | | — | | | — | | | — | | | — | | | — | | | 4.7 | | | 4.7 | |
| Deferred gain on hedging activity | — | | | — | | | — | | | — | | | — | | | — | | | 5.5 | | | 5.5 | |
| Repurchase of shares | — | | | — | | | (3.3) | | | (125.3) | | | — | | | — | | | — | | | (125.3) | |
| Activity under share plans | — | | | — | | | 0.5 | | | 40.7 | | | (26.8) | | | — | | | — | | | 13.9 | |
| Balance at September 30, 2022 | 65.2 | | | $ | 0.7 | | | (13.7) | | | $ | (860.9) | | | $ | 1,604.3 | | | $ | 939.1 | | | $ | (216.1) | | | $ | 1,467.1 | |
| Net earnings | — | | | — | | | — | | | — | | | — | | | 114.7 | | | — | | | 114.7 | |
| Dividends declared to common shareholders | — | | | — | | | — | | | — | | | — | | | (31.7) | | | — | | | (31.7) | |
| Foreign currency translation adjustments | — | | | — | | | — | | | — | | | — | | | — | | | 44.3 | | | 44.3 | |
| Pension and postretirement activity | — | | | — | | | — | | | — | | | — | | | — | | | 6.6 | | | 6.6 | |
| Deferred loss on hedging activity | — | | | — | | | — | | | — | | | — | | | — | | | (4.8) | | | (4.8) | |
| Repurchase of shares | — | | | — | | | (1.9) | | | (75.2) | | | — | | | — | | | — | | | (75.2) | |
| Activity under share plans | — | | | — | | | 0.6 | | | 30.0 | | | (10.5) | | | — | | | — | | | 19.5 | |
| Balance at September 30, 2023 | 65.2 | | | $ | 0.7 | | | (15.0) | | | $ | (906.1) | | | $ | 1,593.8 | | | $ | 1,022.1 | | | $ | (170.0) | | | $ | 1,540.5 | |
| Net earnings | — | | | — | | | — | | | — | | | — | | | 98.6 | | | — | | | 98.6 | |
| Dividends declared to common shareholders | — | | | — | | | — | | | — | | | — | | | (30.6) | | | — | | | (30.6) | |
| Foreign currency translation adjustments | — | | | — | | | — | | | — | | | — | | | — | | | 18.6 | | | 18.6 | |
| Pension and postretirement activity | — | | | — | | | — | | | — | | | — | | | — | | | 1.2 | | | 1.2 | |
| Deferred loss on hedging activity | — | | | — | | | — | | | — | | | — | | | — | | | (4.6) | | | (4.6) | |
| Repurchase of shares including excise tax | — | | | — | | | (1.6) | | | (59.3) | | | — | | | — | | | — | | | (59.3) | |
| Activity under share plans | — | | | — | | | 0.3 | | | 27.5 | | | (7.8) | | | — | | | — | | | 19.7 | |
| Balance at September 30, 2024 | 65.2 | | | $ | 0.7 | | | (16.3) | | | $ | (937.9) | | | $ | 1,586.0 | | | $ | 1,090.1 | | | $ | (154.8) | | | $ | 1,584.1 | |
See accompanying Notes to Consolidated Financial Statements.
EDGEWELL PERSONAL CARE COMPANY
NOTES TO CONSOLIDATED FINANCIAL STATEMENTS
(in millions, except per share data)
Note 1 - Background and Basis of Presentation
Background
Edgewell Personal Care Company and its subsidiaries (collectively, “Edgewell” or the “Company”) is one of the world’s largest manufacturers and marketers of personal care products in the wet shave, sun and skin care and feminine care categories. With operations in over 20 countries, the Company’s products are widely available in more than 50 countries.
The Company conducts its business in the following three segments:
•Wet Shave consists of products sold under the Schick®, Wilkinson Sword®, Edge, Skintimate®, Billie®, Shave Guard and our custom brands group (formerly sold under our Shave Guard and Personna® brands), as well as non-branded products. The Company’s wet shave products include razor handles and refillable blades, disposable shave products, and shaving gels and creams.
•Sun and Skin Care consists of Banana Boat® and Hawaiian Tropic® sun care products, Jack Black®, Bulldog® and Cremo® men’s and women’s grooming products, Billie women’s grooming products and Wet Ones® products.
•Feminine Care includes tampons, pads and liners sold under the Playtex Gentle Glide® and Sport®, Stayfree®, Carefree®, and o.b.® brands.
Basis of Presentation
The accompanying Consolidated Financial Statements include the accounts of the Company and its controlled subsidiaries and have been prepared in accordance with United States (“U.S.”) generally accepted accounting principles (“GAAP”) under the rules and regulations of the U.S. Securities and Exchange Commission (the “SEC”). The preparation of the Consolidated Financial Statements in conformity with GAAP requires management to make estimates and assumptions that affect the reported amount of assets and liabilities, disclosure of contingent assets and liabilities and the reported amounts of revenues and expenses. Actual results may differ materially from those estimates. All intercompany balances and transactions have been eliminated in consolidation and, in the opinion of management, all normal recurring adjustments considered necessary for a fair presentation have been included.
Certain immaterial prior year amounts have been reclassified to conform with the current year’s presentation.
Acquisition of Billie, Inc. On November 29, 2021 (“the Acquisition Date”), the Company completed the acquisition of Billie, Inc. (“Billie”) (the “Acquisition”), a leading U.S. based consumer brand company that offers a broad portfolio of personal care products for women. The results of Billie for the post-acquisition period are included within the Company’s results since the Acquisition Date. For more information on the Acquisition, see Note 3 of Notes to the Consolidated Financial Statements.
Note 2 - Summary of Significant Accounting Policies
Cash Equivalents
Cash equivalents are considered to be highly liquid investments with a maturity of three months or less when purchased. At September 30, 2024, the Company had $209.1 in available cash and cash equivalents, a significant portion of which was outside of the U.S. The Company has extensive operations outside of the U.S., including a significant manufacturing footprint. The Company manages its worldwide cash requirements by reviewing available funds among the many subsidiaries through which it conducts its business and the cost effectiveness with which those funds can be accessed. The repatriation of cash balances from certain of the Company’s subsidiaries could have adverse tax consequences or be subject to regulatory capital requirements; however, those balances are generally available without legal restrictions to fund ordinary business operations.
Cash Flow Presentation
The Consolidated Statements of Cash Flows are prepared using the indirect method, which reconciles Net earnings to Net cash from operating activities. The reconciliation adjustments include the removal of timing differences between the occurrence of operating receipts and payments and their recognition in Net earnings. The adjustments also remove cash flows arising from investing and financing activities, which are presented separately from operating activities. Cash flows from foreign currency transactions and operations are translated at an average exchange rate for the period. Cash flows from hedging activities are included in the same category as the items being hedged, which are primarily operating activities. Cash payments related to income taxes are classified as operating activities.
Trade Receivables
Trade receivables are stated at their net realizable value. The allowance for doubtful accounts reflects the Company’s best estimate of probable losses inherent in the trade receivables portfolio determined on the basis of historical experience, specific allowances for known troubled accounts and other currently available information. Bad debt expense is included in Selling, general and administrative expense (“SG&A”) in the Consolidated Statements of Earnings and Comprehensive Income. The Company has two accounts receivable factoring programs. For further discussion, see Note 11 of Notes to Consolidated Financial Statements.
Inventories
Inventories are valued at the lower of cost or market value, with cost generally determined using average cost or the first-in, first-out (“FIFO”) method.
Capitalized Software Costs
Capitalized software costs are included in Property, plant and equipment, net. These costs are amortized using the straight-line method over periods of related benefit ranging from three to seven years. Expenditures related to capitalized software are included within Capital expenditures in the Consolidated Statements of Cash Flows.
Property, Plant and Equipment, net
Property, plant and equipment, net (“PP&E”) is stated at historical cost. PP&E acquired as part of a business combination is recorded at estimated fair value. Expenditures for new facilities and expenditures that substantially increase the useful life of property, including interest during construction, are capitalized and reported as Capital expenditures in the accompanying Consolidated Statements of Cash Flows. Maintenance, repairs and minor renewals are expensed as incurred. When property is retired or otherwise disposed of, the related cost and accumulated depreciation are removed from the accounts and gains or losses on the disposition are reflected in Net earnings. Depreciation is generally provided on the straight-line basis by charges to earnings at rates based on estimated useful lives. Estimated useful lives range from two to 10 years for machinery and equipment and three to 30 years for buildings and building improvements.
Estimated useful lives are periodically reviewed and, when appropriate, changes are made and accounted for prospectively. When certain events or changes in operating conditions occur, asset lives may be adjusted and an impairment assessment may be performed on the recoverability of the carrying amounts.
Leases
The Company leases certain offices and manufacturing facilities, warehouses, employee vehicles and certain manufacturing related equipment. A lease is defined as a contract, or part of a contract, that conveys the right to control the use of identified PP&E over a contracted period in exchange for payment. The Company evaluates if an arrangement is a lease as of the effective date of the agreement. Certain leases include an option to either renew or terminate the lease. For purposes of calculating lease liabilities, these options are included within the lease term when it has become reasonably certain that the Company will exercise such options. Operating lease ROU assets and operating lease liabilities are recorded based on the present value of minimum payments over the lease term at the effective date of the lease. Any costs in excess of the minimum payments are expensed as incurred as variable lease cost.
Leases with an initial term of 12 months or less are not recorded on the Consolidated Balance Sheet. All recorded leases are classified as operating leases and lease expense is recognized on a straight-line basis over the lease term. The Company has elected as an accounting policy not to separate non-lease components from lease components and, instead, account for these components as a single lease component. For leases that do not provide an implicit rate, the Company uses its secured incremental borrowing rate, based on the information available for leases, including the lease term and interest rate environment in the country in which the lease exists, to calculate the present value of the future lease payments.
Business Combinations
The Company allocates the cost of an acquired business to the assets acquired and liabilities assumed based on their estimated fair values at the date of acquisition. The excess value of the cost of an acquired business over the estimated fair value of the assets acquired and liabilities assumed is recognized as goodwill. The valuation of the acquired assets and liabilities will impact the determination of future operating results.
The Company uses a variety of information sources to determine the value of acquired assets and liabilities, including: third-party appraisers for the values and lives of property, identifiable intangibles and inventories; actuaries for defined benefit retirement plans; and legal counsel or other experts to assess the obligations associated with legal, environmental or other claims.
Goodwill and Other Intangible Assets
We perform our annual impairment assessment for goodwill and indefinite-lived intangible assets as of July 1st and more frequently if indicators of impairment exist. We consider qualitative factors to assess if it is more likely than not that the fair value for goodwill or indefinite-lived intangible assets is below the carrying amount. We may also elect to bypass the qualitative assessment and perform a quantitative assessment.
In conducting a qualitative assessment, the Company analyzes a variety of events and factors that may influence the fair value of the reporting unit or indefinite-lived intangible asset, including, but not limited to: macroeconomic conditions, industry and market considerations, cost factors, overall financial performance, share price and other relevant factors
Goodwill
We have four reporting units for which we assess for impairment defined as Wet Shave, Sun Care, Skin Care and Feminine Care. We evaluate goodwill for impairment using either a qualitative or quantitative assessment.
When the qualitative assessment is not utilized and a quantitative test is performed, we estimate each reporting unit’s fair value using a weighted income approach and market approach. The income approach uses the reporting unit's projections of estimated operating results and cash flows that are discounted using a market participant discount rate based on a weighted-average cost of capital. The market approach uses market multiples of comparable companies.
The goodwill impairment test compares a reporting unit’s fair value to its carrying amount. If the fair value of the reporting unit exceeds its carrying amount, no impairment loss is measured. If the carrying amount of a reporting unit exceeds the reporting unit’s fair value, then a goodwill impairment loss is measured at the amount by which a reporting unit’s carrying amount exceeds its fair value, not to exceed the carrying amount of goodwill.
For further discussion, see Note 9 of Notes to Consolidated Financial Statements.
Other Intangible Assets
Our indefinite-lived intangible assets primarily consist of trade names. We evaluate these intangible assets for impairment using either a qualitative or quantitative assessment.
When a quantitative test is performed, we determine the fair value using one of two income approaches: (i) the multi-period excess earnings method or (ii) the relief-from-royalty method. These methods require assumptions regarding future revenue and operating margin growth, estimated returns on assets used in the operations (including net working capital, fixed assets and intangible assets), market participant discount rates based on a weighted-average cost of capital and assumed royalty rates if we did not own the trade name.
Other definite-life intangible assets, have a remaining weighted-average life of approximately eight years, are amortized on a straight-line basis over expected lives of three to 25 years. These intangible assets are assessed for impairment when impairment indicators are present.
For further discussion, see Note 9 of Notes to Consolidated Financial Statements.
Impairment of Long-Lived Assets
The Company reviews long-lived assets, other than goodwill and other intangible assets, for impairment when events or changes in business circumstances indicate that the remaining useful life may warrant revision or that the carrying amount of the long-lived asset may not be fully recoverable. The Company performs an undiscounted cash flow analysis to determine if impairment exists for an asset or asset group. If impairment is determined to exist, any related impairment loss is calculated based on estimated fair value. Impairment losses on assets to be disposed of, if any, are based on the estimated proceeds to be received, less cost of disposal.
Revenue Recognition
Principal Revenue Streams and Significant Judgments
Our principal revenue streams can be divided into: (i) sale of personal care products primarily through retailers in North America; (ii) sale of personal care products through a combination of retailers and distributors internationally; and (iii) production and sale of private brands products in North America and internationally that are made to customer specifications.
Performance Obligations
The Company’s revenue is generated from the sale of its products. Revenue is recognized when the customer obtains control of the goods, which occurs when the ability to use and obtain benefits from the goods are passed to the customer, most commonly upon the delivery of goods to the customer. Discounts are offered to customers for early payment and an estimate of discounts is recorded as a reduction of Net sales in the same period as the sale. The Company’s standard sales terms are final and returns or exchanges are not permitted with the exception of end-of-season returns for Sun Care products. Reserves are established and recorded in cases where the right of return exists for a particular sale.
The Company assesses the goods promised in its customers’ purchase orders and identifies a performance obligation to transfer goods (or a bundle of goods) that is distinct. To identify the performance obligations, the Company considers all the goods promised, whether explicitly stated or implied based on customary business practices. The Company’s purchase orders are short term in nature, lasting less than one year and contain a single delivery element. For a purchase order that has more than one performance obligation, the Company allocates the total consideration to each distinct performance obligation on a relative stand-alone selling price basis. The Company does not exclude variable consideration in determining the remaining value of performance obligations.
Significant Judgments
The Company records sales at the time that control of goods pass to the customer. The terms of these sales vary but the following conditions are applicable to all sales: (i) the sales arrangement is evidenced by purchase orders submitted by customers; (ii) the selling price is fixed or determinable; (iii) title to the product has transferred; (iv) there is an obligation to pay at a specified date without any additional conditions or actions required by the Company; and (v) collectability is reasonably assured. Simultaneously with the sale, the Company reduces Net sales and Cost of products sold and reserves amounts on its Consolidated Balance Sheet for anticipated returns based upon an estimated return level in accordance with GAAP. The Company also allows for returns of other products under limited circumstances. Customers are required to pay for the Sun Care product purchased during the season under the required terms. Under certain circumstances, the Company allows customers to return Sun Care products that have not been sold by the end of the Sun Care season, which is normal practice in the Sun Care industry. The timing of returns of Sun Care products can vary in different regions based on climate and other factors. However, the majority of returns occur in the U.S. from September through January following the summer Sun Care season. The Company estimates the level of Sun Care returns as the Sun Care season progresses using a variety of inputs, including historical experience, consumption trends during the Sun Care season, obsolescence factors including expiration dates and inventory positions at key retailers. The Company monitors shipment activity and inventory levels at key retailers during the Sun Care season in an effort to more accurately estimate potential returns. This allows the Company to manage shipment activity to its customers, especially in the latter stages of the Sun Care season, to reduce the potential for returned product. The Company also allows for returns of other products under limited circumstances. Non-Sun Care returns are evaluated each period based on communications with customers and other issues known as of period end. The Company had a reserve for returns of $50.3 and $53.5 at September 30, 2024 and 2023, respectively.
In addition, the Company offers a variety of programs, such as consumer coupons and rebate programs, primarily to its retail customers, designed to promote sales of its products. Such programs require periodic payments and allowances based on estimated results of specific programs and are recorded as a reduction to Net sales. The Company accrues, at the time of sale, the estimated total payments and allowances associated with each transaction. Additionally, the Company offers programs directly to consumers to promote the sale of its products. Promotions which reduce the ultimate consumer sale price are recorded as a reduction of Net sales at the time the promotional offer is made using estimated redemption and participation levels. Taxes the Company collects on behalf of governmental authorities, which are generally included in the price to the customer, are also recorded as a reduction of Net sales. The Company continually assesses the adequacy of accruals for customer and consumer promotional program costs not yet paid. To the extent total program payments differ from estimates, adjustments may be necessary. Historically, these adjustments have not been material.
Contract Balances
The timing of revenue recognition is based on completion of performance obligations through the transfer of goods. Standard payment terms with customers require payment after goods have been delivered and risk of ownership has transferred to the customer. The Company has contract liabilities as a result of advanced payments received from certain customers before goods have been delivered and all performance obligations have been completed. Contract liabilities were $1.1 and $0.6 at September 30, 2024 and 2023, respectively, and were classified within Other current liabilities on our Consolidated Balance Sheets. Substantially all of the amount deferred will be recognized within a year, with the significant majority to be captured within a quarter following deferral.
Trade receivables are stated at their net realizable value. The allowance for doubtful accounts reflects the Company’s best estimate of probable losses inherent in its trade receivables portfolio determined by historical experience, specific allowances for known troubled accounts, and other currently available information.
Advertising and Sales Promotion Costs
The Company advertises and promotes its products through national and regional media and expenses such activities as incurred. Advertising and sales promotion expense reported on the Consolidated Statements of Earnings and Comprehensive Income includes advertising costs of $127.1, $116.0 and $125.8 for fiscal 2024, 2023 and 2022, respectively.
Share-Based Payments
The Company grants restricted share equivalents (“RSE”), which generally vest over two to four years. The estimated fair value of each grant is estimated on the date of grant based on the current market price of the Company’s common shares. The original estimate of the grant date fair value is not subsequently revised unless the awards are modified. The Company has elected to recognize forfeiture of awards as they occur. A portion of the RSE awards provide for the issuance of common stock to certain managerial staff and executive management if the Company achieves specified performance targets. For Performance Restricted Share Equivalents (“PRSE”), the Company records estimated expense for performance-based grants based on target achievement of performance metrics for the three-year period for each respective program, unless evidence exists that achievement above or below target for the applicable performance metric is more likely to occur. For PRSE awards granted during fiscal 2024, 2023 and 2022, awards will vest by comparing the Company’s total shareholder return (“TSR”) during a certain three-year period to the respective TSRs of companies in a selected performance peer group. The expense recorded for these awards was recorded on a straight-line basis based on the grant date fair value using a Monte Carlo simulation.
Non-qualified stock options (“Share Options”) are granted at the market price on the grant date and generally vest ratably over three years. The Company calculates the fair value of total share-based compensation for Share Options using the Black-Scholes option pricing model, which utilizes certain assumptions and estimates that have a material impact on the total compensation cost recognized in the Consolidated Financial Statements, including the expected term, expected share price volatility, risk-free interest rate and expected dividends. The original estimate of the grant date fair value is not subsequently revised unless the awards are modified. The Company has elected to recognize forfeiture of awards as they occur.
Income Taxes
The Company’s annual effective income tax rate is determined based on its pre-tax income, statutory tax rates and the tax impacts of items treated differently for tax purposes than for financial reporting purposes. Tax law requires that certain items be included in its federal tax return at different times than the items are reflected in the financial statements. Some of these differences are permanent, such as expenses that are not deductible in the Company’s tax return, and some differences are temporary, reversing over time, such as depreciation expense. These temporary differences create deferred tax assets and liabilities.
Deferred tax assets generally represent the tax effect of items that can be used as a tax deduction or credit in future years for which the Company has already recorded the tax benefit in the Consolidated Statement of Earnings and Comprehensive
Income. Deferred tax liabilities generally represent tax expense recognized in the Company’s financial statements for which payment has been deferred, the tax effect of expenditures for which a deduction has already been taken in its tax return but has not yet been recognized in its financial statements or assets recorded at estimated fair value in business combinations for which there was no corresponding tax basis adjustment.
The Company estimates income taxes and the effective income tax rate in each jurisdiction that it operates. This involves estimating taxable earnings, specific taxable and deductible items, the likelihood of generating sufficient future taxable income to utilize deferred tax assets, the portion of the income of foreign subsidiaries that is expected to be remitted to the U.S. and be taxable and possible exposures related to future tax audits. Deferred tax assets are evaluated on a subsidiary by subsidiary basis to ensure that the asset will be realized. Valuation allowances are established when the realization is not deemed to be more likely than not. Future performance is monitored, and when objectively measurable operating trends change, adjustments are made to the valuation allowances accordingly. To the extent the estimates described above change, adjustments to income taxes are made in the period in which the estimate is changed.
The Company operates in multiple jurisdictions with complex tax and regulatory environments, which are subject to differing interpretations by the taxpayer and the taxing authorities. At times, the Company may take positions that management believes are supportable but are potentially subject to successful challenges by the appropriate taxing authority. The Company evaluates its tax positions and establishes liabilities in accordance with guidance governing accounting for uncertainty in income taxes. The Company reviews these tax uncertainties in light of changing facts and circumstances, such as the progress of tax audits, and adjusts them accordingly.
Estimated Fair Values of Financial Instruments
Certain financial instruments are required to be recorded at estimated fair value. Changes in assumptions or estimation methods could affect the fair value estimates; however, the Company does not believe any such changes would have a material impact on its financial condition, results of operations or cash flows. Other financial instruments including cash and cash equivalents and short-term borrowings, including notes payable, are recorded at cost, which approximates estimated fair value. The estimated fair values of long-term debt and financial instruments are disclosed in Note 18 of Notes to Consolidated Financial Statements.
Foreign Currency Translation
Financial statements of foreign operations where the local currency is the functional currency are translated using end-of-period exchange rates for assets and liabilities, and average exchange rates during the period for results of operations. Related translation adjustments are reported as a component within accumulated other comprehensive loss in the shareholders’ equity section of the Consolidated Balance Sheets, except as noted below.
Gains and losses resulting from foreign currency transactions are included in Net earnings. Foreign currency gains (losses) of $1.9, $1.7 and $(7.7) during fiscal 2024, 2023 and 2022, respectively, were included within Other expense (income), net in the Consolidated Statements of Earnings and Comprehensive Income. The Company uses foreign exchange (“FX”) instruments to reduce the risk of FX transactions as described below and in Note 18 of Notes to Consolidated Financial Statements.
Financial Instruments and Derivative Securities
The Company uses financial instruments, from time to time, in the management of foreign currency, interest rate, and other risks that are inherent to its business operations. Such instruments are not held or issued for trading purposes.
FX instruments, including forward currency contracts, are used primarily to reduce cash transaction exposures and, to a lesser extent, to manage other translation exposures. FX instruments are selected based on their risk reduction attributes, costs, and related market conditions. The Company has designated certain foreign currency contracts as cash flow hedges for accounting purposes as of September 30, 2024.
At September 30, 2024, the Company had $34.0 of variable rate debt outstanding. In the past the Company has used interest rate swaps to hedge the risk of variable rate debt. As of September 30, 2024, the Company did not have any outstanding interest rate swap agreements.
For further discussion, see Note 13 and Note 18 of Notes to Consolidated Financial Statements.
Recently Issued Accounting Pronouncements
In December 2023, the Financial Accounting Standards Board (“FASB”) issued Accounting Standards Update (“ASU”) No. 2023-09 Income Taxes (Topic 740): Improvements to Income Tax Disclosures to update income tax disclosure requirements primarily by requiring specific categories and greater disaggregation within the rate reconciliation and disaggregation of income taxes paid by jurisdiction. The amendments in the ASU also remove disclosures related to certain unrecognized tax benefits and deferred taxes. ASU 2023-09 is effective for fiscal years beginning after December 15, 2024. The amendments may be applied prospectively or retrospectively and early adoption is permitted. We are currently assessing the impact of the requirements on our consolidated financial statements and disclosures.
In November 2023, the FASB issued ASU No. 2023-07 Segment Reporting (Topic 280): Improvements to Reportable Segment Disclosures to expand reportable segment disclosure requirements, primarily through enhanced disclosures about significant segment expenses. The amendments in the ASU require that a public entity disclose, on an annual and interim basis, significant segment expenses that are regularly provided to an entity's chief operating decision maker (“CODM”), a description of other segment items by reportable segment, and any additional measures of a segment's profit or loss used by the CODM when deciding how to allocate resources. Annual disclosures are required for fiscal years beginning after December 15, 2023. Interim disclosures are required for periods within fiscal years beginning after December 15, 2024. Retrospective application is required for all prior periods presented and early adoption is permitted. We are currently assessing the impact of the requirements on our consolidated financial statements and disclosures.
No other new accounting pronouncement issued or effective during the fiscal year had, or is expected to have, a material impact on our Consolidated Financial Statements.
Recently Adopted Accounting Pronouncements
In September 2022, the FASB issued Accounting Standards Update 2022-04, "Liabilities - Supplier Finance Programs (Subtopic 405-50): Disclosure of Supplier Finance Program Obligations" which requires that a buyer in a supplier finance program disclose additional information about the program for financial statement users including a rollforward of those obligations. The Company adopted the standard as of October 1, 2023, except for amendments relating to the rollforward requirement, which is effective for fiscal years beginning after December 15, 2023.
The Company has agreements with its suppliers in the ordinary course of business for such supplier finance programs which facilitate participating suppliers’ ability to finance payment obligations of the Company with designated third-party financial institutions. The Company is not a party to the arrangements between the suppliers and the third-party financial institutions. The Company’s obligations to its suppliers, including amounts due and scheduled payment dates, are not impacted by suppliers’ decisions to finance amounts under these arrangements. The payment terms under the programs range from 60 to 120 days. As of September 30, 2024 and September 30, 2023, $16.9 and $21.8, respectively, were valid obligations under the various programs. The obligations are presented as Accounts payable on the Condensed Consolidated Balance Sheets.
Note 3 - Business Combinations
Billie Inc.
On November 29, 2021, the Company completed the Billie Acquisition for cash consideration of $309.4, net of cash acquired. As a result of the Acquisition, Billie became a wholly owned subsidiary of the Company. The Company accounted for the Acquisition utilizing the acquisition method of accounting, which requires assets and liabilities to be recognized based on estimates of their acquisition date fair values. The determination of the values of the acquired assets and assumed liabilities, including goodwill, other intangible assets and deferred taxes, requires significant judgement. The Company has calculated fair values of the assets and liabilities acquired from Billie, including goodwill, intangible assets and working capital. The Company completed the final fair value determination of the Acquisition in the fourth quarter of fiscal year 2022.
The Company used variations of the income approach in determining the fair value of intangible assets acquired in the Billie Acquisition. Specifically, we utilized the multi-period excess earnings method to determine the fair value of the definite lived customer relationships acquired and the relief from royalty method to determine the fair value of the definite lived trade name acquired. Our determination of the fair value of the intangible assets acquired involved the use of significant estimates and assumptions related to revenue growth rates, discount rates, customer attrition rates, and royalty rates. Edgewell believes that the fair value assigned to the assets acquired and liabilities assumed are based on reasonable assumptions and estimates that marketplace participants would use.
The following table provides the allocation of the purchase price related to the Billie Acquisition based upon the fair value of assets and liabilities assumed:
| | | | | |
| Current assets | $ | 17.0 | |
| Goodwill | 181.2 |
| Intangible assets | 136.0 |
| Other assets, including property, plant and equipment, net | 3.2 |
| Current liabilities | (6.9) | |
| Deferred tax liabilities | (21.1) | |
| $ | 309.4 | |
The acquired goodwill represented the value of expansion into new markets and channels of trade and is not deductible for tax purposes. The intangible assets acquired consisted primarily of the Billie trade name and customer relationships with a weighted average useful life of 19 years. All assets are included in the Company’s Wet Shave segment.
Billie contributed net sales and a loss before income taxes totaling $93.7 and $1.1, respectively, for the post-acquisition period ending September 30, 2022 in the Consolidated Statements of Earnings and Comprehensive Income. The loss before income taxes was driven primarily by amortization expense of acquired intangible assets.
The following acquisition and integration costs related to Billie were included in SG&A and Cost of products sold in the Consolidated Statements of Earnings and Comprehensive Income:
| | | | | | | | | | | | | | | | | |
| Fiscal Year |
| 2024 | | 2023 | | 2022 |
| SG&A | $ | 2.8 | | | $ | 7.5 | | | $ | 9.1 | |
| Cost of products sold | 3.3 | | | — | | | 0.8 | |
| Total acquisition and integration costs | $ | 6.1 | | | $ | 7.5 | | | $ | 9.9 | |
The following summarizes the Company's unaudited pro forma consolidated results of operations for the twelve months ended September 30, 2022, as though the Billie Acquisition occurred on October 1, 2021. The twelve months ended September 30, 2022 include results of Billie over the full period presented.
| | | | | | | | | | | | | |
| | | Twelve Months Ended September 30, |
| | | | | 2022 | | |
| Pro forma net sales | | | | | $ | 2,181.7 | | | |
| Pro forma net earnings | | | | | 104.9 | | |
The unaudited pro forma consolidated results of operations were adjusted by pre-tax amortization expense of $1.3 for the year ended September 30, 2022. Additionally, pro forma earnings for the twelve months ended September 30, 2022 exclude $9.9 of pre-tax acquisition costs, which were included in the pro forma earnings for the twelve months ended September 30, 2021. The pro forma earnings were also adjusted to reflect the capital structure as of the Acquisition Date, and all pro forma adjustments have been included with related tax effects. The unaudited pro forma consolidated results of operations are not necessarily indicative of the results obtained had the Billie Acquisition occurred on October 1, 2020, or of those results that may be obtained in the future. Amounts do not reflect any anticipated cost savings or cross-selling opportunities expected to result from the Billie Acquisition.
Note 4 - Restructuring Charges
Operating Model Redesign
In fiscal 2024, the Company continued to take actions to strengthen its operating model, simplify the organization and improve manufacturing and supply chain efficiency and productivity. As a result of these actions, the Company expects to incur restructuring and re-positioning charges of approximately $11 in fiscal 2025. To date the Company has incurred restructuring and related charges as follows:
| | | | | | | | | | | | | | | | | |
| Fiscal Year |
| 2024 | | 2023 | | 2022 |
| Severance and related benefit costs | $ | 10.2 | | | $ | 6.2 | | | $ | 5.6 | |
| Asset write-off and accelerated depreciation | 0.6 | | | 0.8 | | | 0.8 | |
| Consulting, project implementation and management, and other exit costs | 9.6 | | | 10.1 | | | 9.8 | |
Total restructuring and repositioning charges (1) (2) | $ | 20.4 | | | $ | 17.1 | | | $ | 16.2 | |
(1) Restructuring and repositioning charges of nil, $0.2 and nil are included within Cost of products sold for fiscal 2024, 2023 and 2022, respectively.
(2) Restructuring and repositioning charges of $0.1, $0.3 and $0.9 are included within SG&A for fiscal 2024, 2023 and 2022, respectively.
Consolidation of Mexico Facilities
In fiscal 2024, the Company announced certain operational and organizational steps designed to streamline the Company’s operations and supply chain by consolidating its current Mexico operations in Obregon and Mexico City into a single facility in Aguascalientes, Mexico. As a result of these actions, the Company is anticipating to incur restructuring and re-positioning charges of $18 in fiscal 2025 and is expected to be completed by the second quarter of fiscal 2026.
| | | | | | | | | |
| Fiscal Year |
| 2024 | | | | |
| Severance and related benefit costs | $ | 15.6 | | | | | |
| | | | | |
| | | | | |
Total restructuring and repositioning charges (1) | $ | 15.6 | | | | | |
(1) The Company does not include restructuring costs in the results of its reportable segments, however, these are related to the Wet Shave segment.
Restructuring Reserves
| | | | | | | | | | | | | | | | | |
| Operating Model Redesign | | Consolidation of Mexico Facilities | | Total |
| Severance and related benefit costs | | | | | |
| Balance at October 1, 2022 | $ | 1.7 | | | $ | — | | | $ | 1.7 | |
| Charge to income | 6.2 | | — | | | 6.2 |
| Cash payments | (4.0) | | | — | | | (4.0) | |
| | | | | |
| Balance at September 30, 2023 | 3.9 | | | — | | | 3.9 | |
| Charge to income | 10.8 | | | 15.6 | | | 26.4 | |
| Cash payments | (9.6) | | | — | | | (9.6) | |
| | | | | |
| Balance at September 30, 2024 | 5.1 | | | 15.6 | | | 20.7 | |
| | | | | |
| Asset write-off and accelerated depreciation | | | | | |
| Balance at October 1, 2022 | — | | | — | | | — | |
| Charge to income | 0.8 | | — | | | 0.8 |
| Non-cash utilization | (0.8) | | | — | | | (0.8) | |
| Balance at September 30, 2023 | — | | | — | | | — | |
| | | | | |
| | | | | |
| | | | | |
| | | | | |
| | | | | |
| Consulting, project implementation and management, and other exit costs | | | | | |
| Balance at October 1, 2022 | 0.8 | | | — | | | 0.8 | |
| Charge to income | 10.1 | | | — | | | 10.1 | |
| Cash payments | (10.2) | | | — | | | (10.2) | |
| | | | | |
| Balance at September 30, 2023 | 0.7 | | | — | | | 0.7 | |
| Charge to income | 9.6 | | | — | | | 9.6 | |
| Cash payments | (9.6) | | | — | | | (9.6) | |
| | | | | |
| Balance at September 30, 2024 | 0.7 | | | — | | | 0.7 | |
| | | | | |
| Total restructuring activities and related accrual | $ | 5.8 | | | $ | 15.6 | | | $ | 21.4 | |
Note 5 - Income Taxes
The provisions for income taxes from continuing operations consisted of the following: | | | | | | | | | | | | | | | | | |
| Fiscal Year |
| | 2024 | | 2023 | | 2022 |
| Currently payable: | | | | | |
| United States - Federal | $ | 6.3 | | | $ | 12.5 | | | $ | 12.4 | |
| State | 0.2 | | | 3.5 | | | 6.6 | |
| Foreign | 25.4 | | | 21.5 | | | 19.4 | |
| Total current | 31.9 | | | 37.5 | | | 38.4 | |
| Deferred: | | | | | |
| United States - Federal | (4.8) | | | (4.5) | | | (7.6) | |
| State | 1.5 | | | (0.6) | | | (0.6) | |
| Foreign | (6.3) | | | 0.6 | | | (5.6) | |
| Total deferred | (9.6) | | | (4.5) | | | (13.8) | |
| Income tax provision | $ | 22.3 | | | $ | 33.0 | | | $ | 24.6 | |
The source of pre-tax earnings was:
| | | | | | | | | | | | | | | | | |
| Fiscal Year |
| 2024 | | 2023 | | 2022 |
| United States | $ | (13.3) | | | $ | 37.6 | | | $ | 2.6 | |
| Foreign | 134.2 | | | 110.1 | | | 121.5 | |
| Pre-tax earnings | $ | 120.9 | | | $ | 147.7 | | | $ | 124.1 | |
A reconciliation of income taxes with the amounts computed at the statutory federal income tax rate follows: | | | | | | | | | | | | | | | | | | | | | | | | | | | | | | | | | | | |
| Fiscal Year |
| | 2024 | | 2023 | | 2022 |
| Computed tax at federal statutory rate | $ | 25.4 | | | 21.0 | % | | $ | 31.0 | | | 21.0 | % | | $ | 25.8 | | | 21.0 | % |
| State income taxes, net of federal tax benefit | 0.9 | | | 0.7 | | | 2.7 | | | 1.8 | | | 2.7 | | | 2.2 | |
Foreign tax less than the federal rate (1) | (9.1) | | | (7.6) | | | (1.0) | | | (0.7) | | | (11.7) | | | (9.5) | |
| Adjustments to prior years’ tax accruals | (4.3) | | | (3.5) | | | (6.1) | | | (4.2) | | | 1.6 | | | 1.3 | |
| Other taxes including repatriation of foreign earnings | 7.1 | | | 5.9 | | | 4.4 | | | 3.1 | | | 4.6 | | | 3.7 | |
| Compensation adjustments | 4.0 | | | 3.4 | | | 1.9 | | | 1.2 | | | 3.4 | | | 2.7 | |
| Other, net | 1.7 | | | 1.4 | | | (0.5) | | | (0.3) | | | 0.5 | | | 0.5 | |
| Uncertain tax positions | (3.4) | | | (2.8) | | | 0.6 | | | 0.4 | | | (2.3) | | | (2.0) | |
| Total | $ | 22.3 | | | 18.5 | % | | $ | 33.0 | | | 22.3 | % | | $ | 24.6 | | | 19.9 | % |
(1) Includes the impact of foreign valuation allowances.
The deferred tax assets and deferred tax liabilities recorded on the Consolidated Balance Sheet include current and noncurrent amounts and were as follows:
| | | | | | | | | | | |
| September 30, |
| | 2024 | | 2023 |
| Deferred tax liabilities: | | | |
| Depreciation and property differences | $ | (18.3) | | | $ | (20.8) | |
| Amortizable assets | (229.3) | | | (230.2) | |
| Lease liabilities | (23.1) | | | (15.2) | |
| Other tax liabilities | (7.3) | | | (4.3) | |
| Gross deferred tax liabilities | (278.0) | | | (270.5) | |
| Deferred tax assets: | | | |
| Accrued liabilities | 54.2 | | | 56.6 | |
| Deferred and share-based compensation | 14.4 | | | 14.9 | |
| Tax carryforwards and tax credits | 51.1 | | | 37.3 | |
| Postretirement benefits other than pensions | 1.3 | | | 1.0 | |
| Pension plans | 28.0 | | | 25.0 | |
| Inventory differences | 5.9 | | | 5.0 | |
| Lease right of use assets | 23.3 | | | 15.3 | |
| Deferred revenue | 4.2 | | | 7.0 | |
| Other tax assets | 9.4 | | | 8.0 | |
| Gross deferred tax assets | 191.8 | | | 170.1 | |
| Valuation allowance | (21.5) | | | (18.3) | |
| Net deferred tax liabilities | $ | (107.7) | | | $ | (118.7) | |
There were no material tax loss carryforwards that expired in fiscal 2024. Future expirations of tax loss carryforwards and tax credits, if not utilized, are not expected to be material from 2025 through 2041. The remaining tax loss carryforwards and credits have no expiration. The valuation allowance is primarily attributable to tax loss carryforwards, other carryforwards, and certain deferred tax assets impacted by the deconsolidation of the Company’s Venezuelan subsidiaries.
The Company generally repatriates a portion of current year earnings from select non-US subsidiaries only if the economic cost of the repatriation is not considered material. No provision is made for additional taxes on undistributed earnings of foreign affiliates that are intended and planned to be indefinitely invested in the affiliate. The Company intends to, and has plans to, reinvest these earnings indefinitely in its foreign subsidiaries to, amongst other things, fund local operations, fund pension and other post-retirement obligations, fund capital projects and to support foreign growth initiatives including potential acquisitions. As of September 30, 2024, $885.8 of foreign subsidiary earnings were considered indefinitely invested in those businesses. If the Company repatriated any of the earnings it could be subject to withholding tax and the impact of foreign currency movements. Accordingly, it is not practical to calculate a specific potential tax exposure. Applicable income and withholding taxes will be provided on these earnings in the periods in which they are no longer considered reinvested.
Unrecognized tax benefits activity is summarized below:
| | | | | | | | | | | | | | | | | |
| | 2024 | | 2023 | | 2022 |
| Unrecognized tax benefits, beginning of year | $ | 19.7 | | | $ | 19.4 | | | $ | 21.9 | |
| Additions based on current year tax positions and acquisitions | 2.1 | | | 1.9 | | | 2.1 | |
| | | | | |
| Settlements with taxing authorities and statute expirations | (5.2) | | | (1.6) | | | (4.6) | |
| Unrecognized tax benefits, end of year | $ | 16.6 | | | $ | 19.7 | | | $ | 19.4 | |
Included in the unrecognized tax benefits noted above was $15.7 of uncertain tax positions that would affect the Company’s effective tax rate, if recognized. The Company does not expect any material increases or decreases to its unrecognized tax benefits within 12 months of this reporting date. In the Consolidated Balance Sheets, unrecognized tax benefits are classified as Other liabilities (non-current) to the extent that payments are not anticipated within one year.
The Company classifies accrued interest and penalties related to unrecognized tax benefits in the income tax provision. The accrued interest and penalties are not included in the table above. The Company accrued $3.9 of interest, (net of the deferred
tax asset of $0.7) at September 30, 2024, and $4.4 of interest, (net of the deferred tax asset of $0.8) at September 30, 2023. Interest was computed on the difference between the tax position recognized in accordance with GAAP and the amount previously taken or expected to be taken in the Company’s tax returns.
The Company files income tax returns in the U.S. federal jurisdiction, various cities and states, and more than 30 foreign jurisdictions where the Company has operations. In general, U.S. federal income tax returns for tax years ended September 30, 2021 and after remain subject to examination by the Internal Revenue Service (the “IRS”). With few exceptions, the Company is no longer subject to state and local income tax examinations for years before September 30, 2014. The status of international income tax examinations varies by jurisdiction. At this time, the Company does not anticipate any material adjustments to its financial statements resulting from tax examinations currently in progress.
Note 6 - Earnings per Share
Basic earnings per share is based on the average number of common shares outstanding during the period. Diluted earnings per share is based on the average number of shares used for the basic earnings per share calculation, adjusted for the dilutive effect of share options, RSE, and PRSE awards.
The following is the reconciliation between the number of weighted-average shares used in the basic and diluted earnings per share calculation: | | | | | | | | | | | | | | | | | |
| Fiscal Year |
| | 2024 | | 2023 | | 2022 |
| | | | | |
| Basic weighted-average shares outstanding | 49.7 | | | 51.2 | | | 53.1 | |
| Effect of dilutive securities: | | | | | |
| Options, RSE and PRSE awards | 0.4 | | | 0.6 | | | 0.5 | |
| Total dilutive securities | 0.4 | | | 0.6 | | | 0.5 | |
| Diluted weighted-average shares outstanding | 50.1 | | | 51.8 | | | 53.6 | |
The following weighted-average common shares were excluded from the calculation of diluted net earnings per share because the effect of including these awards was antidilutive.
| | | | | | | | | | | | | | | | | |
| Fiscal Year |
| 2024 | | 2023 | | 2022 |
| Options, RSE and PRSE awards | 1.3 | | | 1.2 | | | 1.0 | |
Note 7 - Inventories
The following table summarizes our inventories at September 30, 2024 and 2023:
| | | | | | | | | | | |
| September 30,
2024 | | September 30,
2023 |
| Inventories | | | |
| Raw materials and supplies | $ | 82.6 | | | $ | 86.3 | |
| Work in process | 91.8 | | | 91.1 | |
| Finished products | 302.9 | | | 315.0 | |
| Total inventories | $ | 477.3 | | | $ | 492.4 | |
Note 8 - Property, Plant and Equipment
The following table summarizes our PP&E, net at September 30, 2024 and 2023:
| | | | | | | | | | | | | | |
| Estimated Useful Life | September 30,
2024 | | September 30,
2023 |
| PP&E | | | | |
| Land | n/a | $ | 18.9 | | | $ | 18.5 | |
| Buildings | 3 - 30 years | 147.9 | | | 142.6 | |
| Machinery and equipment | 2 - 10 years | 1,132.7 | | | 1,105.3 | |
| Capitalized software costs | 3 - 7 years | 62.5 | | | 60.2 | |
| Construction in progress | n/a | 62.0 | | | 38.5 | |
| Total gross property, plant and equipment | | 1,424.0 | | | 1,365.1 | |
| Accumulated depreciation | | (1,074.9) | | | (1,027.2) | |
| Total PP&E | | $ | 349.1 | | | $ | 337.9 | |
The components of depreciation expense for PP&E, net and amortization expense for capitalized software costs were as follows:
| | | | | | | | | | | | | | | | | |
| Fiscal Year |
| | 2024 | | 2023 | | 2022 |
| Depreciation expense | $ | 52.7 | | | $ | 55.6 | | | $ | 55.7 | |
| Amortization expense associated with capitalized software | 4.3 | | 5.0 | | 4.7 |
As of September 30, 2024, the Company had $5.8, included in accounts payable for the acquisition of PP&E, which is considered a non-cash investing activity in the Consolidated Statements of Cash Flows.
Note 9 - Goodwill and Intangible Assets
The following table sets forth goodwill by segment:
| | | | | | | | | | | | | | | | | | | | | | | |
| Wet
Shave | | Sun and Skin
Care | | Feminine
Care | | Total |
| | | | | | | |
| | | | | | | |
| | | | | | | |
| | | | | | | |
| | | | | | | |
| | | | | | | |
| | | | | | | |
| | | | | | | |
| Gross balance at October 1, 2022 | $ | 1,133.5 | | | $ | 354.5 | | | $ | 205.2 | | | $ | 1,693.2 | |
| Accumulated goodwill impairment | (369.0) | | | (2.0) | | | — | | | (371.0) | |
| Net balance at October 1, 2022 | $ | 764.5 | | | $ | 352.5 | | | $ | 205.2 | | | $ | 1,322.2 | |
| | | | | | | |
| Changes in the twelve months ended September 30, 2023 | | | | | | | |
| | | | | | | |
| Cumulative translation adjustment | 7.0 | | | 1.4 | | | 0.8 | | | $ | 9.2 | |
| | | | | | | |
| Gross balance at October 1, 2023 | $ | 1,140.5 | | | $ | 355.9 | | | $ | 206.0 | | | $ | 1,702.4 | |
| Accumulated goodwill impairment | (369.0) | | | (2.0) | | | — | | | (371.0) | |
| Net balance at October 1, 2023 | $ | 771.5 | | | $ | 353.9 | | | $ | 206.0 | | | $ | 1,331.4 | |
| | | | | | | |
| Changes in the twelve months ended September 30, 2024 | | | | | | | |
| Cumulative translation adjustment | 5.5 | | | 1.5 | | | 0.2 | | | 7.2 | |
| | | | | | | |
| Gross balance at September 30, 2024 | $ | 1,146.0 | | | $ | 357.4 | | | $ | 206.2 | | | $ | 1,709.6 | |
| Accumulated goodwill impairment | (369.0) | | | (2.0) | | | — | | | (371.0) | |
| Net balance at September 30, 2024 | $ | 777.0 | | | $ | 355.4 | | | $ | 206.2 | | | $ | 1,338.6 | |
The Company performed its annual goodwill impairment analysis as of July 1, 2024. The Company elected to perform a qualitative assessment of goodwill impairment for the Sun Care reporting unit and a quantitative assessment for the Wet Shave, Skin Care and Fem Care reporting units. Based on the results of the qualitative and quantitative assessments, we determined there were no impairments of our reporting units.
The Company also performed an impairment assessment in the fourth quarter of fiscal 2024 to determine if any significant events or changes in circumstances had occurred in our reporting units since the annual impairment testing date that would be considered a potential triggering event. The Company did not identify any triggering events that would indicate the existence of an impairment of the reporting units.
Total intangible assets were as follows:
| | | | | | | | | | | | | | | | | | | | | | | | | | | | | | | | | | | |
| September 30, 2024 | | September 30, 2023 |
| Gross
Carrying
Amount | | Accumulated
Amortization | | Net | | Gross
Carrying
Amount | | Accumulated
Amortization | | Net |
| Indefinite lived | | | | | | | | | | | |
| Trade names and brands | $ | 597.7 | | | $ | — | | | $ | 597.7 | | | $ | 592.9 | | | $ | — | | | $ | 592.9 | |
| | | | | | | | | | | |
| Definite lived | | | | | | | | | | | |
| Trade names and brands | $ | 339.8 | | | $ | (104.0) | | | $ | 235.8 | | | $ | 339.6 | | | $ | (88.1) | | | $ | 251.5 | |
| Technology and patents | 79.7 | | | (77.3) | | | 2.4 | | | 79.4 | | | (76.2) | | | 3.2 | |
| Customer related and other | 272.5 | | | (159.9) | | | 112.6 | | | 269.8 | | | (143.6) | | | 126.2 | |
| Amortizable intangible assets | $ | 692.0 | | | $ | (341.2) | | | $ | 350.8 | | | $ | 688.8 | | | $ | (307.9) | | | $ | 380.9 | |
| Total intangible assets | $ | 1,289.7 | | | $ | (341.2) | | | $ | 948.5 | | | $ | 1,281.7 | | | $ | (307.9) | | | $ | 973.8 | |
The Company’s annual indefinite-lived intangible assets impairment analysis was conducted on July 1, 2024. The Company elected to bypass the qualitative assessment and perform a quantitative assessment of the Schick and Bulldog trade names. We performed a qualitative test of impairment for all other indefinite-lived intangible assets. Based on the results of the quantitative and qualitative assessments, we determined there were no impairments of the carrying values of the indefinite-lived intangible assets.
The Company also performed an impairment assessment in the fourth quarter of fiscal 2024 to determine if any significant events or changes in circumstances had occurred in our indefinite-lived intangible assets since the annual impairment testing date that would be considered a potential triggering event. The Company did not identify any triggering events that would indicate the existence of an impairment of the indefinite-lived intangible assets.
Amortization expense for definite lived intangible assets was $31.1, $30.8 and $29.4 for fiscal 2024, 2023 and 2022, respectively.
Estimated amortization expense for amortizable intangible assets is as follows: | | | | | |
| | Estimated amortization expense |
| Fiscal 2025 | $ | 31.1 | |
| Fiscal 2026 | $ | 30.8 | |
| Fiscal 2027 | $ | 30.5 | |
| Fiscal 2028 | $ | 30.5 | |
| Fiscal 2029 | $ | 30.4 | |
| Thereafter | $ | 197.5 | |
Note 10 - Leases
A summary of the Company's lease information is as follows:
| | | | | | | | | | | | | | |
| | September 30,
2024 | | September 30,
2023 |
| Assets | Classification | | | |
| Right of use assets | Other assets | $ | 85.4 | | | $ | 68.5 | |
| | | | |
| Liabilities | | | | |
| Current lease liabilities | Other current liabilities | $ | 16.7 | | | $ | 14.0 | |
| Long-term lease liabilities | Other liabilities | 69.8 | | | 53.9 | |
| Total lease liabilities | | $ | 86.5 | | | $ | 67.9 | |
| | | | |
| Other information | | | | |
| Weighted-average remaining lease term (years) | | 8.1 | | 8.4 |
| Weighted-average incremental borrowing rate | | 8.8 | % | | 6.8 | % |
| | | | | | | | | | | | | | | | | |
| Fiscal Year |
| 2024 | | 2023 | | 2022 |
| Statement of Earnings | | | | | |
Lease cost (1) | $ | 18.0 | | | $ | 12.5 | | | $ | 13.5 | |
| | | | | |
| Other information | | | | | |
| Leased assets obtained in exchange for new lease liabilities | $ | 32.1 | | | $ | 25.9 | | | $ | 7.6 | |
| Cash paid for amounts included in the measurement of lease liabilities | $ | 17.5 | | | $ | 12.2 | | | $ | 13.5 | |
(1)Lease expense is included in Cost of products sold or SG&A expense based on the nature of the lease. Short-term lease expense and variable lease expense are excluded from this amount and are not material.
In connection with the consolidation of the Mexico facilities (See Note 4 of the Notes to Consolidated Financial Statements), the Company entered into a lease agreement pursuant to which it had agreed to lease a 593,816 square foot manufacturing facility in Aguascalientes, Mexico (the “Mexico Lease”). The Company recognized a right-of-use asset and lease liability of $31.6 as of September 30, 2024 which was determined to be the commencement date as defined under ASC 842, Leases. The Company elected the practical expedient which includes all lease costs as a lease component. Monthly payments included in the lease liability are $0.4 adjusted annually for the increase in CPI. The Company used a lease term of 182 months, of which the first two months are rent free, and an incremental borrowing rate of 11.64%. The Mexico Lease contains one five year lease extension option. The Company also has the option to enter into a subsequent 15-year lease agreement on substantially the same terms as the Mexico Lease (the “Subsequent Lease”), including an option to extend the term of the Subsequent Lease for an additional five years. The Subsequent Lease was determined not to be reasonably certain to be exercised as of September 30, 2024. As a result of the Mexico Lease, the Company remeasured the existing lease liability for its Obregon, Mexico facility as its lease option was no longer reasonably certain to be exercised which resulted in a reduction of the right-of-use asset and lease liability of $11.0.
The Company's future lease payments including reasonably assured renewal options under lease agreements are as follows:
| | | | | |
| Operating Leases |
| Fiscal 2025 | $ | 22.4 | |
| 2026 | 19.6 | |
| 2027 | 16.2 | |
| 2028 | 13.8 | |
| 2029 | 8.2 | |
| 2029 and thereafter | 48.7 | |
| Total future minimum lease commitments | 128.9 | |
| Less: Imputed Interest | (42.4) | |
| Present value of lease liabilities | $ | 86.5 | |
Note 11 - Accounts Receivable Facility
The Company participates in accounts receivable facility programs both in the United States and Japan. These receivable agreements are between the Company, MUFJ Bank, LTD., and the subsidiaries of both parties. Transfers under the accounts receivable repurchase agreements are accounted for as sales of receivables, resulting in the receivables being derecognized from the Consolidated Balance Sheet. The purchaser assumes the credit risk at the time of sale and has the right at any time to assign, transfer, or participate any of its rights under the purchased receivables to another bank or financial institution. The purchase and sale of receivables under these certain accounts receivable repurchase agreements is intended to be an absolute and irrevocable transfer without recourse by the purchaser to the Company for the creditworthiness of any obligor. The Company has considered its performance obligation to collect and service the receivables sold in the United States and Japan. The compensation received is considered acceptable servicing compensation and, as such, the Company does not recognize a servicing asset or liability.
On August 5, 2024, we entered into the Seventh Amendment to that certain Master Accounts Receivable Purchase Agreement between Edgewell Personal Care, LLC and MUFG Bank, LTD., (the “Accounts Receivable Facility”) which amended the pricing index used to determine the purchase price for subject receivables from the Bloomberg Short Term Bank Yield Index (“BSBY”) to Term Secured Overnight Financing Rate (“SOFR”). The applicable margin that is added to the SOFR pricing index specific for each obligor was unchanged. Except as noted above, all other material terms, conditions, obligations, covenants or agreements contained in the Accounts Receivable Facility are unmodified in all respects and continue in full force and effect.
Effective February 7, 2022, we increased the maximum receivables sold facility amount under the Sixth Amendment to Master Accounts Receivable Purchase Agreement to $180.0 from $150.0.
On August 5, 2022, we entered into that certain Master Receivable Assignment Agreement between the Company’s wholly-owned subsidiary Schick Japan K.K. and Concerto Receivables Corporation (the “Purchaser”), Tokyo Branch, a subsidiary of MUFG Bank, LTD. (the "Japan Agreement"). The Japan Agreement allows us to assign third party accounts receivable to the Purchaser and allows for the sale of up to ¥3,000 (approximately $20.0 using the exchange rate as of September 30, 2023) with limits set between individual customers. The terms of the agreement expire one year after the date of execution and will be renewed annually unless either party notifies of its intent not to renew. The assigned receivables will be discounted using the funding rate from the Tokyo Interbank Market plus 1.1%.
Accounts receivable sold under the Accounts Receivable Facility for the years ended September 30, 2024 and 2023 were $1,176.1 and $1,162.7, respectively. The trade receivables sold that remained outstanding under the Accounts Receivable Facility as of September 30, 2024 and 2023 were $88.6 and $82.1, respectively. The net proceeds received were included in both Cash provided by operating activities and Cash used by investing activities on the Condensed Consolidated Statements of Cash Flows. The difference between the carrying amount of the trade receivables sold and the sum of the cash received is recorded as a loss on sale of receivables in Other (income) expense, net in the Consolidated Statements of Earnings and Comprehensive Income. For the years ended September 30, 2024 and 2023, the loss on sale of trade receivables was $6.4 and $6.2, respectively.
Note 12 - Supplemental Balance Sheet
The following table summarizes our current assets and current and non-current liabilities at September 30, 2024 and 2023:
| | | | | | | | | | | |
| September 30,
2024 | | September 30,
2023 |
| Other Current Assets | | | |
| Prepaid expenses | $ | 76.4 | | | $ | 72.5 | |
| Value added tax receivables | 40.0 | | | 43.7 | |
| Income taxes receivable | 14.7 | | | 18.9 | |
| Other | 9.1 | | | 12.3 | |
| Total other current assets | $ | 140.2 | | | $ | 147.4 | |
| Other Current Liabilities | | | |
| Accrued advertising, sales promotion and allowances | 26.3 | | | 31.5 | |
| Accrued trade allowances | 28.7 | | | 29.8 | |
| Accrued salaries, vacations and incentive compensation | 78.6 | | | 65.4 | |
| Returns reserve | 50.3 | | | 53.5 | |
| Accrued interest | 24.7 | | | 25.0 | |
| Income taxes payable | 13.6 | | | 11.9 | |
| Other | 97.6 | | | 92.4 | |
| Total other current liabilities | $ | 319.8 | | | $ | 309.5 | |
| Other Liabilities | | | |
| Pensions and other retirement benefits | 45.6 | | | 58.2 | |
| Other non-current liabilities | 129.4 | | | 121.5 | |
| Total other liabilities | $ | 175.0 | | | $ | 179.7 | |
Note 13 - Debt
The detail of long-term debt was as follows:
| | | | | | | | | | | |
| September 30,
2024 | | September 30,
2023 |
Senior notes, fixed interest rate of 5.5%, due 2028 (1) | $ | 750.0 | | | $ | 750.0 | |
Senior notes, fixed interest rate of 4.1%, due 2029 (1) | 500.0 | | | 500.0 | |
| Revolving credit facility | 34.0 | | | 122.0 | |
| Total long-term debt, including current maturities | 1,284.0 | | | 1,372.0 | |
Less unamortized debt issuance costs and discount (1) | 9.0 | | | 11.3 | |
| Total long-term debt | $ | 1,275.0 | | | $ | 1,360.7 | |
(1)At September 30, 2024, the balance for the Senior Notes due 2028 and the Senior Notes due 2029 are reflected net of debt issuance costs of $5.4 and $3.6, respectively. At September 30, 2023, the balance for the Senior Notes due 2028 and the Senior Notes due 2029 are reflected net of debt issuance costs of $6.9 and $4.4, respectively.
At September 30, 2024 and 2023, the Company also had outstanding short-term notes payable with financial institutions with original maturities of less than 90 days of $24.5 and $19.5, respectively, with variable weighted-average interest rates of 3.8% and 3.9%, respectively. These notes were primarily outstanding international borrowings.
U.S. Revolving Credit Facility
On April 2, 2024 (the “Restatement Date”), the Company and certain subsidiaries of the Company entered into a Restatement Agreement (the "Restatement Agreement")we amended our with Bank of America, N.A. as administrative agent and collateral agent ("BofA"), and the several lenders from time to time party thereto (together with BofA, the "Lenders"), which amended and restated the Company’s Credit Agreement, dated as of March 28, 2020 (as previously amended by that certain Amendment No. 1 to Credit Agreement, dated as of February 6, 2023, and as otherwise amended, amended and restated, supplemented or otherwise modified prior to the Restatement Date (the “Credit Facility”).
Pursuant to the Restatement Agreement, all of the $425.0 of revolving facility commitments under the Credit Agreement (the “Existing Revolving Facility Commitments”) were replaced with an equal amount of new revolving facility commitments (the “Replacement Revolving Facility Commitments”, collectively, with the Existing Revolving Facility Commitments, the “Revolving Credit Facility”) having substantially similar terms as the Existing Revolving Facility Commitments, except that the maturity date of the Replacement Revolving Facility Commitments will be the earlier of (i) April 2, 2029, and (ii) (a) March 2, 2028, if the aggregate outstanding amount of the Company’s 5.500% Senior Notes due 2028 is greater than $150.0 as of such date and (b) December 29, 2028, if the aggregate outstanding amount of the Company’s 4.125% Senior Notes due 2029 is greater than $150.0 of as such date, in each case, subject to certain exceptions.
Debt Covenants
The U.S. revolving credit facility discussed above (“Revolving Credit Facility”) governing our outstanding debt at September 30, 2024 contains certain customary representations and warranties, financial covenants, covenants restricting the Company’s ability to take certain actions, affirmative covenants and provisions relating to events of default. Under the terms of the Revolving Credit Facility, the ratio of the Company’s indebtedness to earnings before interest, taxes, depreciation and amortization (“EBITDA”), as defined in the agreement and detailed below, cannot be greater than 4.0 to 1.0, however, there is an exception for acquisition activity. In addition, under the Revolving Credit Facility, the ratio of the Company’s EBITDA, as defined in the credit agreement, to total interest expense must exceed 3.0 to 1. Under the Revolving Credit Facility, EBITDA is defined as net earnings, as adjusted to add-back interest expense, income taxes, depreciation and amortization, all of which are determined in accordance with GAAP. In addition, the credit agreement allows certain non-cash charges such as stock award amortization and asset write-offs including, but not limited to, impairment and accelerated depreciation, and operating expense reductions or synergies to be “added-back” in determining EBITDA for purposes of the indebtedness ratio. Total debt and interest expense are calculated in accordance with GAAP. If the Company fails to comply with these covenants or with other requirements of the Revolving Credit Facility, the lenders may have the right to accelerate the maturity of the debt. Acceleration under the Revolving Credit Facility would trigger cross-defaults on its other borrowings.
As of September 30, 2024, the Company was in compliance with the provisions and covenants associated with the Revolving Credit Facility.
Debt Maturities
Aggregate maturities of long-term debt, including current maturities, at September 30, 2024 were as follows: $750.0 in 2028, and $534.0 in 2029.
Note 14 - Retirement Plans
Pensions and Postretirement Plans
The Company has several defined benefit pension plans covering employees in the U.S. and certain employees in other countries, which are included in the information below. The plans provide retirement benefits based on years of service and earnings. The Company also sponsors or participates in a number of other non-U.S. pension and postretirement arrangements, including various retirement and termination benefit plans, some of which are required by local law or coordinated with government-sponsored plans, which are not significant in the aggregate and, therefore, are not included in the information presented below.
The Company initiated the wind-up of its Canadian defined benefit pension plan (“Canada Plan”) in June 2021. On September 1, 2021, Edgewell Personal Care Canada ULC (“EPC Canada”) as administrator of the Canada Plan entered into a buy-in annuity purchase agreement (“Buy-in Agreement”) with Brookfield Annuity Company (“Brookfield Annuity”) for certain members of the Canada Plan. On January 25, 2023, the Company received approval by the Financial Services Regulatory Authority of Ontario to wind-up the Canada Plan. Upon regulatory approval of the Canada Plan, EPC Canada proceeded with purchasing annuities for the remaining Canada Plan participants and converting the Buy-in Agreement to a buy-out annuity purchase agreement (“Buy-out Agreement”), which was purchased and funded by the Canada Plan on March 31, 2023. The Company was relieved of its defined benefit pension obligation through its irrevocable commitment under the Buy-out Agreement. As of the settlement date, the Company remeasured its assets and its projected benefit obligation associated with the Canada Plan. Upon settlement, the Company derecognized the assets, projected benefit obligation and losses remaining in accumulated other comprehensive loss (“AOCI”) associated with the Canada Plan, which resulted in a loss on settlement of $7.9. The loss was recorded in Other expense (income), net in the Consolidated Statements of Earnings and Comprehensive Income for the fiscal year ended September 30, 2023.
The Company funds its pension plans in compliance with the Employee Retirement Income Security Act of 1974 (“ERISA”) or local funding requirements.
The following tables present the benefit obligation, plan assets, and funded status of the plans:
| | | | | | | | | | | | | | | | | | | | | | | |
| | As of September 30, |
| | Pension | | Postretirement |
| | 2024 | | 2023 | | 2024 | | 2023 |
| Change in projected benefit obligation | | | | | | | |
| Benefit obligation at beginning of year | $ | 404.9 | | | $ | 439.4 | | | $ | 3.9 | | | $ | 4.1 | |
| Service cost | 1.9 | | | 1.9 | | | — | | | — | |
| Interest cost | 21.1 | | | 20.6 | | | 0.2 | | | 0.2 | |
| Actuarial (loss) gain | 43.1 | | | (12.9) | | | 1.0 | | | (0.1) | |
| Benefits paid, net | (28.4) | | | (29.6) | | | (0.2) | | | (0.3) | |
| Plan settlements | — | | | (21.9) | | | — | | | — | |
| Expenses paid | — | | | — | | | — | | | — | |
| Foreign currency exchange rate changes | 5.8 | | | 7.4 | | | — | | | — | |
| Projected benefit obligation at end of year | 448.4 | | | 404.9 | | | 4.9 | | | 3.9 | |
| Change in plan assets | | | | | | | |
| Estimated fair value of plan assets at beginning of year | 363.9 | | | 398.2 | | | — | | | — | |
| Actual return on plan assets | 62.8 | | | 8.9 | | | — | | | — | |
| Company contributions | 7.9 | | | 0.9 | | | 0.2 | | | 0.3 | |
| Plan settlements | — | | | (21.9) | | | — | | | — | |
| Benefits paid | (28.4) | | | (29.6) | | | (0.2) | | | (0.3) | |
| Expenses paid | — | | | — | | | — | | | — | |
| Foreign currency exchange rate changes | 6.1 | | | 8.2 | | | — | | | — | |
| Divestiture | — | | | (0.8) | | | — | | | — | |
| Estimated fair value of plan assets at end of year | 412.3 | | | 363.9 | | | — | | | — | |
| Funded status at end of year | $ | (36.1) | | | $ | (41.0) | | | $ | (4.9) | | | $ | (3.9) | |
The following table presents the amounts recognized in the Consolidated Balance Sheets and Consolidated Statements of Changes in Shareholders’ Equity:
| | | | | | | | | | | | | | | | | | | | | | | |
| | As of September 30, |
| | Pension | | Postretirement |
| | 2024 | | 2023 | | 2024 | | 2023 |
| Amounts recognized in the Consolidated Balance Sheets | | | | | | | |
| Noncurrent assets | $ | 4.8 | | | $ | 13.5 | | | $ | — | | | $ | — | |
| Current liabilities | (0.9) | | | (1.0) | | | (0.3) | | | (0.2) | |
| Noncurrent liabilities | (40.0) | | | (53.5) | | | (4.6) | | | (3.7) | |
| Net amount recognized | $ | (36.1) | | | $ | (41.0) | | | $ | (4.9) | | | $ | (3.9) | |
| Amounts recognized in Accumulated other comprehensive loss | | | | | | | |
| Net loss (gain) | $ | 117.5 | | | $ | 119.3 | | | $ | (6.1) | | | $ | (7.3) | |
| Prior service credit | — | | | — | | | — | | | — | |
| Net amount recognized, pre-tax | $ | 117.5 | | | $ | 119.3 | | | $ | (6.1) | | | $ | (7.3) | |
Pre-tax changes recognized in Other comprehensive income for fiscal 2024 were as follows:
| | | | | | | | | | | |
| | Pension | | Post-
retirement |
| Changes in plan assets and benefit obligations recognized in Other comprehensive income | | | |
| Net (gain) loss arising during the year | $ | (0.1) | | | $ | 0.9 | |
| Effect of exchange rates | — | | | — | |
| Amounts recognized as a component of net periodic benefit cost | | | |
| | | |
| Amortization or settlement recognition of net (loss) gain | (1.8) | | | 0.3 | |
| Total recognized in Other comprehensive income | $ | (1.9) | | | $ | 1.2 | |
Pension contributions required in fiscal 2025 and beyond represent future pension payments to comply with local funding requirements in the U.S. only. The projected contributions for the U.S. pension plans total $6.5 in fiscal 2025, $7.0 in fiscal 2026, $5.0 in fiscal 2027, $4.5 in fiscal 2028, and $4.2 in fiscal 2029. Estimated contributions beyond fiscal 2029 are not determinable. The Company may also elect to make discretionary contributions.
The Company’s expected future benefit payments are as follows:
| | | | | | | | | | | |
| | Pension | | Post-
retirement |
| Fiscal 2025 | $ | 34.6 | | | $ | 0.2 | |
| Fiscal 2026 | 33.9 | | | 0.2 | |
| Fiscal 2027 | 33.7 | | | 0.2 | |
| Fiscal 2028 | 33.5 | | | 0.3 | |
| Fiscal 2029 | 31.8 | | | 0.3 | |
| Fiscal 2029 to 2032 | 147.2 | | | 1.5 | |
The accumulated benefit obligation for defined benefit pension plans was $439.0 and $398.1 at September 30, 2024 and 2023, respectively. The following table shows pension plans with an accumulated benefit obligation in excess of plan assets:
| | | | | | | | | | | |
| | As of September 30, |
| | 2024 | | 2023 |
| Projected benefit obligation | $ | 324.3 | | | $ | 309.1 | |
| Accumulated benefit obligation | 324.3 | | | 309.1 | |
| Estimated fair value of plan assets | 283.4 | | | 254.6 | |
Pension plan assets in the U.S. plan represent 69% of assets in all of the Company’s defined benefit pension plans. Investment policy for the U.S. plan includes a mandate to diversify assets and invest in a variety of asset classes to achieve that goal. The U.S. plan’s assets are currently invested in several funds representing most standard equity and debt security classes. The broad target allocations are: (a) equities, including U.S. and foreign: 44% and (b) debt securities, including U.S. bonds: 56%. Actual allocations at September 30, 2024 approximated these targets. The U.S. plan held no shares of Company common stock at September 30, 2024. Investment objectives are similar for non-U.S. pension arrangements, subject to local regulations.
The following table presents pension and post-retirement expense:
| | | | | | | | | | | | | | | | | | | | | | | | | | | | | | | | | | | |
| Fiscal Year |
| | Pension | | Postretirement |
| | 2024 | | 2023 | | 2022 | | 2024 | | 2023 | | 2022 |
| Service cost | $ | 1.9 | | | $ | 1.9 | | | $ | 3.8 | | | $ | — | | | $ | — | | | $ | — | |
| Interest cost | 21.1 | | | 20.6 | | | 10.2 | | | 0.2 | | | 0.2 | | | 0.2 | |
| Expected return on plan assets | (19.5) | | | (21.5) | | | (21.1) | | | — | | | — | | | — | |
| Recognized net actuarial loss (gain) | 1.8 | | | 1.7 | | | 6.4 | | | (0.3) | | | (0.3) | | | (0.3) | |
| Settlement loss recognized | — | | | 7.9 | | | 1.8 | | | — | | | — | | | — | |
| Net periodic benefit cost (credit) | 5.3 | | | 10.6 | | | 1.1 | | | (0.1) | | | (0.1) | | | (0.1) | |
The service cost component of the net periodic cost associated with the Company’s retirement plans is recorded to Cost of products sold and SG&A in the Consolidated Statements of Earnings and Comprehensive Income. The remaining net periodic cost is recorded to Other expense (income), net in the Consolidated Statements of Earnings and Comprehensive Income.
The Company utilized the spot discount rate approach, which applies the specific spot rates along the yield curve used in the determination of the benefit obligations to the relevant cash flows.
The following table presents assumptions, which reflect weighted-averages for the component plans, used in determining the above information:
| | | | | | | | | | | | | | | | | | | | | | | | | | | | | | | | | | | |
| | Fiscal Year |
| | Pension | | Postretirement |
| | 2024 | | 2023 | | 2022 | | 2024 | | 2023 | | 2022 |
| Plan obligations: | | | | | | | | | | | |
| Discount rate | 4.5 | % | | 5.5 | % | | 5.1 | % | | 4.7 | % | | 5.6 | % | | 5.1 | % |
| Compensation increase rate | 2.5 | % | | 2.5 | % | | 2.5 | % | | 4.0 | % | | 4.0 | % | | 4.0 | % |
| Net periodic benefit cost: | | | | | | | | | | | |
| Discount rate | 5.5 | % | | 5.1 | % | | 2.3 | % | | 5.6 | % | | 5.1 | % | | 3.5 | % |
| Expected long-term rate of return on plan assets | 4.8 | % | | 4.9 | % | | 4.2 | % | | N/A | | N/A | | N/A |
| Compensation increase rate | 2.5 | % | | 2.5 | % | | 2.5 | % | | 4.0 | % | | 4.0 | % | | 4.0 | % |
| Cash balance interest credit rate | 4.1 | % | | 4.2 | % | | 3.3 | % | | N/A | | N/A | | N/A |
The expected return on plan assets was determined based on historical and expected future returns of the various asset classes, using the target allocations described above.
The following table sets forth the estimated fair value of the Company’s pension assets segregated by level within the estimated fair value hierarchy. Refer to Note 18 of Notes to Consolidated Financial Statements for further discussion on the estimated fair value hierarchy and estimated fair value principles.
| | | | | | | | | | | | | | | | | |
| September 30, 2024 |
| Pension assets at estimated fair value | Level 1 | | Level 2 | | Total |
| Equity | | | | | |
| U.S. equity | $ | 26.9 | | | $ | — | | | $ | 26.9 | |
| International equity | 45.5 | | | — | | | 45.5 | |
| Debt | | | | | |
| U.S. government | — | | | — | | | — | |
| Other government | — | | | — | | | — | |
| Corporate | 83.4 | | | — | | | 83.4 | |
| Cash and cash equivalents | 4.8 | | | — | | | 4.8 | |
| Other | — | | | — | | | — | |
| Total, excluding investments valued at net asset value (“NAV”) | $ | 160.6 | | | $ | — | | | $ | 160.6 | |
| Investments valued at NAV | | | | | 251.7 | |
| Total | $ | 160.6 | | | $ | — | | | $ | 412.3 | |
| | | | | | | | | | | | | | | | | |
| September 30, 2023 |
| Pension assets at estimated fair value | Level 1 | | Level 2 | | Total |
| Equity | | | | | |
| U.S. equity | $ | 22.7 | | | $ | — | | | $ | 22.7 | |
| International equity | 54.4 | | | — | | | 54.4 | |
| Debt | | | | | |
| U.S. government | — | | | — | | | — | |
| Other government | — | | | — | | | — | |
| Corporate | 54.9 | | | — | | | 54.9 | |
| Cash and cash equivalents | 3.0 | | | — | | | 3.0 | |
| Other | — | | | — | | | — | |
| Total, excluding investments valued at NAV | $ | 135.0 | | | $ | — | | | $ | 135.0 | |
| Investments valued at NAV | | | | | 228.9 | |
| Total | $ | 135.0 | | | $ | — | | | $ | 363.9 | |
The following table sets forth the estimated fair value of the Company’s pension assets valued at NAV:
| | | | | | | | | | | |
| As of September 30, |
| 2024 | | 2023 |
| Pension assets valued at NAV estimated at fair value | | | |
| Equity | | | |
| U.S. equity | $ | 53.0 | | | $ | 48.9 | |
| International equity | 22.5 | | | 21.4 | |
| Debt | | | |
| U.S. government | 64.9 | | 158.6 | |
| Corporate | 111.3 | | | — | |
| Total investments valued at NAV | $ | 251.7 | | | $ | 228.9 | |
There were no Level 3 pension assets as of September 30, 2024 and 2023.
The Company had no post-retirement plan assets as of September 30, 2024 and 2023.
The Company’s investment objective for defined benefit retirement plan assets is to satisfy its current and future pension benefit obligations. The investment philosophy is to achieve this objective through diversification of the retirement plan assets with the goal of earning a suitable return with an appropriate level of risk while maintaining adequate liquidity to distribute benefit payments. The diversified asset allocation includes equity positions as well as fixed income investments. The increased volatility associated with equities is offset with higher expected returns, while long duration fixed income investments help dampen the volatility of the overall portfolio. Risk exposure is controlled by re-balancing the retirement plan assets back to target allocations, as needed. Investment firms managing retirement plan assets carry out investment policy within their stated guidelines. Investment performance is monitored against benchmark indices, which reflect the policy and target allocation of the retirement plan assets.
Defined Contribution Plan
The Company sponsors a defined contribution plan, which extends participation eligibility to the vast majority of U.S. employees. Effective January 1, 2014, the Company matches 100% of participants’ before-tax or Roth contributions up to 6% of eligible compensation. Amounts charged to expense during fiscal 2024, 2023, and 2022 were $11.3, $11.3, and $10.4, respectively, and are reflected in SG&A and Cost of products sold in the Consolidated Statements of Earnings and Comprehensive Income.
Note 15 - Share-Based Payments
As of September 30, 2024, the Company had three share-based compensation plans: the Second Amended and Restated 2018 Stock Incentive Plan (the “Second A&R 2018 Plan”), the Second Amended and Restated 2009 Incentive Stock Plan (the “2009 Plan”) and the 2000 Incentive Stock Plan (the “2000 Plan”). The 2000 Plan was superseded by the 2009 Plan, which was then superseded by the 2018 Stock Incentive Plan, which was then superseded by the Second Amended and Restated 2018 Stock Incentive Plan. New awards granted after January 2024 are issued under the Second A&R 2018 Plan. The Second A&R 2018 Plan provides for the award of performance restricted share equivalents (“PRSEs”), Restricted share equivalents (“RSEs”), or Share Options to purchase the Company’s common stock to directors, officers and employees of the Company. The maximum number of shares authorized for issuance under the 2018 Plan is 17.9, of which 3.4 were available for future awards as of September 30, 2024.
Share options are granted at the market price on the grant date and generally vest ratably over three years. These awards typically have a maximum term of ten years. PRSEs and RSEs may also be granted. Option shares and prices, and PRSEs and RSEs, are adjusted in conjunction with stock splits and other recapitalizations, including our 2015 separation from Energizer, so that the holder is in the same economic position before and after these equity transactions.
The Company uses the straight-line method of recognizing compensation cost. Total compensation costs charged against earnings before income taxes for the Company’s share-based compensation arrangements were $26.5, $27.5 and $23.9 for fiscal 2024, 2023 and 2022, respectively, and were recorded in SG&A. The total income tax benefit recognized for share-based compensation arrangements was $6.3, $6.6 and $5.7, for fiscal 2024, 2023 and 2022, respectively. Restricted stock issuance and shares issued for share option exercises under the Company’s share-based compensation programs are generally issued from treasury shares.
Share Options
The following table summarizes Share Option activity during fiscal 2024:
| | | | | | | | | | | | | | | | | | | | | | | |
| Shares | | Weighted-Average Exercise Price | | Weighted-Average Remaining Contractual Term
(in years) | | Aggregate Intrinsic Value |
| Outstanding as of October 1, 2023 | 1.2 | | | $ | 46.88 | | | | | |
| Granted | 0.1 | | | 34.22 | | | | | |
| Canceled and Expired | (0.2) | | | 86.72 | | | | | |
| Exercised | — | | | — | | | | | |
| Outstanding as of September 30, 2024 | 1.1 | | | $ | 42.93 | | | 6.1 | | $ | 1.2 | |
| | | | | | | |
| Vested and unvested expected to vest as of September 30, 2024 | 1.1 | | | $ | 42.93 | | | 6.1 | | $ | 1.2 | |
| Exercisable as of September 30, 2024 | 0.8 | | | $ | 45.22 | | | | | |
An immaterial number of share options were exercised in fiscal 2024, 2023 and 2022.
The Company estimates the grant-date fair value of share option awards using the Black-Scholes option pricing model. The expected volatility is determined based on historical volatility. The Company utilizes the simplified method in estimating the share option life as the Company does not have sufficient historical share option experience to estimate the share option life. During fiscal 2024 and 2023, the Company granted non-qualified share option awards to certain executives and employees of 0.1 and 0.1, respectively, with a grant-date fair value of $2.1 and $2.2, respectively. The following table presents the Company’s weighted average fair value per option and the assumptions utilized in the Black-Scholes option pricing model:
| | | | | | | | | | | |
| 2024 | | 2023 |
| Weighted-average fair value per share option | $ | 13.48 | | | $ | 15.22 | |
| Expected volatility | 41.0 | % | | 40.0 | % |
| Risk-free interest rate | 4.67 | % | | 3.85 | % |
| Expected share option life (in years) | 6.0 | | 6.0 |
| Dividend yield | 1.75 | % | | 1.51 | % |
As of September 30, 2024, there was an estimated $2.5 of total unrecognized compensation costs related to share option awards, which will be recognized over a weighted-average period of 0.7 years.
Restricted Share Equivalents
The following table summarizes RSE award activity during fiscal 2024:
| | | | | | | | | | | |
| Shares | | Weighted-Average
Grant Date Estimated Fair
Value |
| Non-vested at October 1, 2023 | 0.9 | | | $ | 39.74 | |
| Granted | 0.5 | | | 34.54 | |
| Vested | (0.4) | | | 38.55 | |
| Canceled | — | | | — | |
| Non-vested at September 30, 2024 | 1.0 | | | 37.62 | |
The estimated fair value of the award is determined using the closing share price of the Company’s common stock on the date of grant.
As of September 30, 2024, there was an estimated $22.5 of total unrecognized compensation costs related to RSEs, which will be recognized over a weighted-average period of 1.0 year. The weighted-average estimated fair value per RSE granted in fiscal
2024, 2023 and 2022 was $34.54, $40.17, and $42.49, respectively. The estimated fair value of RSEs vested in fiscal 2024, 2023 and 2022 was $15.6, $20.2, and $15.4, respectively.
Performance Restricted Share Equivalents
The following table summarizes PRSE award activity during fiscal 2024:
| | | | | | | | | | | |
| Shares | | Weighted-Average
Grant Date Estimated Fair
Value |
| Non-vested at October 1, 2023 | 0.4 | | | $ | 60.56 | |
| Granted | 0.2 | | | 45.96 | |
| Vested | (0.1) | | | 56.53 | |
| Canceled | — | | | — | |
| Non-vested at September 30, 2024 | 0.5 | | | 55.06 | |
As of September 30, 2024, there was an estimated $10.1 of total unrecognized compensation costs related to PRSEs, which will be recognized over a weighted-average period of 1.3 years. The weighted-average estimated fair value per PRSE granted in fiscal 2024, 2023 and 2022 was $45.96, $58.55, and $56.53, respectively. The estimated fair value of PRSEs vested in fiscal 2024 was $4.8.
For PRSE awards granted subsequent to fiscal 2021, awards will vest by comparing the Company’s TSR during a certain three year period to the respective TSRs of companies in a selected performance peer group. Based upon the Company’s ranking in its performance peer group, a recipient of the PRSE award may earn a total award ranging from 0% to 200% of the target award. The fair value of each PRSE was estimated on the grant date using a Monte Carlo simulation. The assumptions for PRSE awards during the years ended September 30, 2024 and 2023 are summarized in the following table.
| | | | | | | | | | | |
| 2024 | | 2023 |
| Expected term (in years) | 3.0 | | 3.0 |
| Expected stock price volatility | 31.8 | % | | 48.2 | % |
| Risk-free interest rate | 4.83 | % | | 4.14 | % |
| Fair value (per award granted) | 45.96 | | 58.55 |
Note 16 - Shareholders’ Equity
At September 30, 2024, there were 300.0 shares of the Company’s common stock authorized, of which 3.4 shares were reserved for outstanding awards under the 2018, 2009 and 2000 Plans. The Company’s Amended and Restated Articles of Incorporation authorize it to issue up to 10.0 shares of $0.01 par value preferred stock. As of September 30, 2024, there were no shares of preferred stock issued or outstanding.
Share Repurchases
During fiscal 2024, the Company repurchased 1.6 shares of common stock under the January 2018 Board share repurchase authorization for $58.5 and has 3.0 shares of its common stock available for repurchase in the future under the Board’s authorization. Future share repurchases, if any, would be made in the open market, privately negotiated transactions, or otherwise, in such amounts and at such times as we deem appropriate based upon prevailing market conditions, business needs, and other factors. Additionally, 0.2 shares were purchased related to the surrender of shares of common stock to satisfy tax withholding obligations in connection with the vesting of RSEs.
Since September 30, 2024, the Company repurchased 0.2 shares of common stock for $7.4 under the share repurchase Board authorization from January 2018 which allows the repurchase of up to 10.0 shares. There are 3.0 common shares remaining available to be purchased.
Dividends
The following is a summary of cash dividends paid and declared per share on the Company’s Common Stock during the year ended September 30, 2024:
| | | | | | | | | | | | | | | | | | | | |
| Date Declared | | Record Date | | Payable Date | | Amount Per Share |
| August 1, 2023 | | September 7, 2023 | | October 4, 2023 | | $ | 0.15 | |
| November 2, 2023 | | December 6, 2023 | | January 4, 2024 | | $ | 0.15 | |
| February 1, 2024 | | March 7, 2024 | | April 4, 2024 | | $ | 0.15 | |
| May 8, 2024 | | June 6, 2024 | | July 9, 2024 | | $ | 0.15 | |
| August 6, 2024 | | September 4, 2024 | | October 3, 2024 | | $ | 0.15 | |
| | | | | | |
On October 31, 2024, the Board declared a quarterly cash dividend of $0.15 per common share for the fourth fiscal quarter of 2024. The dividend will be paid on January 8, 2025 to shareholders of record as the close of business on December 3, 2024.
Dividends declared during fiscal 2024 totaled $30.6. Payments made for dividends during fiscal 2024 totaled $30.7.
Note 17 - Accumulated Other Comprehensive Loss
The following table presents the changes in accumulated other comprehensive loss (“AOCI”), net of tax, by component:
| | | | | | | | | | | | | | | | | | | | | | | |
| Foreign Currency Translation Adjustments | | Pension and Post-retirement Activity | | Hedging Activity | | Total |
| Balance at October 1, 2022 | $ | (131.2) | | | $ | (92.6) | | | $ | 7.7 | | | $ | (216.1) | |
OCI before reclassifications (1) | 44.3 | | | (0.3) | | | 0.7 | | | 44.7 | |
| Reclassifications to earnings | — | | | 6.9 | | | (5.5) | | | 1.4 | |
| Balance at September 30, 2023 | (86.9) | | | (86.0) | | | 2.9 | | | (170.0) | |
OCI before reclassifications (1) | 18.6 | | | 0.1 | | | (0.6) | | | 18.1 | |
| Reclassifications to earnings | — | | | 1.1 | | | (4.0) | | | (2.9) | |
| Balance at September 30, 2024 | $ | (68.3) | | | $ | (84.8) | | | $ | (1.7) | | | $ | (154.8) | |
(1)OCI is defined as other comprehensive income.
The following table presents the reclassifications out of AOCI:
| | | | | | | | | | | | | | | | | | | | |
| | Fiscal Year | | |
| Details of AOCI Components | | 2024 | | 2023 | | Affected Line Item in the Consolidated Statement of Earnings |
| Gain on cash flow hedges | | | | | | |
| Foreign exchange contracts | | $ | 5.9 | | | $ | 8.0 | | | Other expense (income), net |
| Income tax expense | | 1.9 | | | 2.5 | | | Income tax provision |
| | $ | 4.0 | | | $ | 5.5 | | | |
| | | | | | |
| Amortization of defined benefit pension and postretirement items | | | | | | |
| | | | | | |
Actuarial losses (1) | | (1.5) | | | (1.4) | | | Other expense (income), net |
Defined benefit settlement loss (1) | | — | | | (7.9) | | | Other expense (income), net |
| Income tax benefit | | (0.4) | | | (2.4) | | | Income tax provision |
| | $ | (1.1) | | | $ | (6.9) | | | |
| | | | | | |
| Total reclassifications for the period | | $ | 2.9 | | | $ | (1.4) | | | |
(1)These AOCI components are included in the computation of net periodic benefit cost. See Note 14 of Notes to Consolidated Financial Statements.
Note 18 - Financial Instruments and Risk Management
In the course of ordinary business, the Company enters into contractual arrangements (also referred to as derivatives) to reduce its exposure to foreign currency. The Company has master netting agreements with all of its counterparties that allow for the settlement of contracts in an asset position with contracts in a liability position in the event of default. The Company manages counterparty risk through the utilization of investment grade commercial banks, diversification of counterparties, and its counterparty netting arrangements. The section below outlines the types of derivatives that existed at September 30, 2024 and 2023, respectively, as well as the Company’s objectives and strategies for holding derivative instruments.
Foreign Currency Risk
A significant share of the Company’s sales is tied to currencies other than the U.S. dollar, the Company’s reporting currency. As such, a weakening of currencies relative to the U.S. dollar can have a negative impact to reported earnings. Conversely, strengthening of currencies relative to the U.S. dollar can improve reported results. The primary currencies to which the Company is exposed include the euro, the Japanese yen, the British pound, the Canadian dollar and the Australian dollar.
Additionally, the Company’s foreign subsidiaries enter into internal and external transactions that create non-functional currency balance sheet positions at the foreign subsidiary level. These exposures are generally the result of intercompany purchases, intercompany loans and, to a lesser extent, external purchases, and are revalued in the foreign subsidiary’s local currency at the end of each period. Changes in the value of the non-functional currency balance sheet positions in relation to the foreign subsidiary’s local currency results in an exchange gain or loss recorded in Other expense (income), net in the Consolidated Statements of Earnings and Comprehensive Income. The primary currency to which the Company’s foreign subsidiaries are exposed is the U.S. dollar.
Interest Rate Risk
The Company has interest rate risk with respect to interest expense on variable rate debt. At September 30, 2024, the Company had $34.0 of variable rate debt outstanding, which consisted primarily of outstanding borrowings under the Revolving Credit Facility in the U.S.
Other Risks
Customer Concentration. Financial instruments that potentially subject the Company to concentrations of credit risk primarily consist of accounts receivable. The Company generally does not require collateral from customers. The Company’s largest customer, Walmart Inc. and its affiliates (collectively, “Walmart”), accounted for approximately 17.2% of consolidated net sales in fiscal 2024. No other customer accounted for more than 10% of the Company’s consolidated net sales. Purchases by Walmart included products from all of the Company’s segments. Additionally, in fiscal 2024, Target Corporation represented approximately 9.5% of consolidated net sales for the Sun and Skin Care segment and 9.8% of consolidated net sales for the Feminine Care segment, respectively.
Product Concentration. Within the Wet Shave segment, the Company’s razor and blades represented 49.3%, 49.0% and 51.1% of consolidated net sales during fiscal 2024, 2023 and 2022, respectively, and within the Sun and Skin Care segment, sun care products represented 21.5%, 20.0%, and 18.5% of consolidated net sales during each of fiscal 2024, 2023 and 2022.
Cash Flow Hedges
At September 30, 2024, the Company maintained a cash flow hedging program related to foreign currency risk. These derivative instruments have a high correlation to the underlying exposure being hedged and have been deemed highly effective by the Company for accounting purposes in offsetting the associated risk.
The Company entered into a series of forward currency contracts to hedge cash flow uncertainty associated with currency fluctuations. These transactions are accounted for as cash flow hedges. The Company had unrealized pre-tax losses of $2.4 and gains of $4.4 at September 30, 2024 and 2023, respectively, on these forward currency contracts, that are accounted for as cash flow hedges included in AOCI. Assuming foreign exchange rates versus the U.S. dollar remain at September 30, 2024 levels over the next 12 months, the majority of the pre-tax loss included in AOCI at September 30, 2024 is expected to be included in Other expense (income), net in the Consolidated Statements of Earnings and Comprehensive Income. Contract maturities for these hedges extend into fiscal year 2026. At September 30, 2024, there were 64 open foreign currency contracts with a total notional value of $106.5.
Derivatives not Designated as Hedges
The Company has entered into foreign currency derivative contracts, which are not designated as cash flow hedges for accounting purposes to hedge balance sheet exposures and, thus, are not subject to significant market risk. The change in estimated fair value of the foreign currency contracts resulted in gains of $0.4, $3.0, and $8.2 for fiscal 2024, 2023, and 2022, respectively, which were recorded in Other expense (income), net in the Consolidated Statements of Earnings and Comprehensive Income. At September 30, 2024, there was one open foreign currency derivative contract not designated as a cash flow hedge with a total notional value of $9.0.
The following table provides estimated fair values of derivative instruments:
| | | | | | | | | | | |
| Fair Value of (Liability) Asset (1) |
| September 30, 2024 | | September 30, 2023 |
| Derivatives designated as cash flow hedging relationships: | | | |
| Foreign currency contracts | $ | (2.4) | | | $ | 4.4 | |
| Derivatives not designated as cash flow hedging relationships: | | | |
| Foreign currency contracts | $ | 0.1 | | | $ | 0.9 | |
(1)All derivative assets are presented in Other current assets or Other assets. All derivative liabilities are presented in Other current liabilities or Other liabilities.
The following table provides the amounts of gains and losses on derivative instruments:
| | | | | | | | | | | | | | | | | |
| Fiscal Year |
| 2024 | | 2023 | | 2022 |
| Derivatives designated as cash flow hedging relationships: | | | | | |
| Foreign currency contracts | | | | | |
(Loss) gain recognized in OCI (1) | $ | (0.8) | | | $ | 1.1 | | | $ | 19.2 | |
Gain reclassified from AOCI into income (effective portion) (1) (2) | 5.9 | | | 8.0 | | | 11.2 | |
| Derivatives not designated as cash flow hedging relationships: | | | | | |
| Foreign currency contracts | | | | | |
Gain recognized in income (2) | $ | 0.4 | | | $ | 3.0 | | | $ | 8.2 | |
(1)Each of these derivative instruments had a high correlation to the underlying exposure being hedged for the periods indicated and had been deemed highly effective in offsetting associated risk.
(2)Gain (loss) was recorded in Other expense (income), net.
The following table provides financial assets and liabilities for balance sheet offsetting:
| | | | | | | | | | | | | | | | | | | | | | | |
| As of September 30, 2024 | | As of September 30, 2023 |
| Assets (1) | | Liabilities (2) | | Assets (1) | | Liabilities (2) |
| Foreign currency contracts | | | | | | | |
| Gross amounts of recognized assets (liabilities) | $ | 0.1 | | | $ | (2.7) | | | $ | 6.1 | | | $ | (0.7) | |
| Gross amounts offset in the balance sheet | — | | | 0.3 | | | (0.2) | | | 0.4 | |
| Net amounts of assets (liabilities) presented in the balance sheet | $ | 0.1 | | | $ | (2.4) | | | $ | 5.9 | | | $ | (0.3) | |
(1)All derivative assets are presented in Other current assets or Other assets.
(2)All derivative liabilities are presented in Other current liabilities or Other liabilities.
Fair Value Hierarchy
Accounting guidance on fair value measurements for certain financial assets and liabilities requires that assets and liabilities carried at fair value be classified in one of the following three categories:
Level 1: Quoted market prices in active markets for identical assets or liabilities.
Level 2: Observable market based inputs or unobservable inputs that are corroborated by market data.
Level 3: Unobservable inputs reflecting the reporting entity’s own assumptions or external inputs from inactive markets.
Under the fair value accounting guidance hierarchy, an entity is required to maximize the use of quoted market prices and minimize the use of unobservable inputs. The following table sets forth the Company’s financial assets and liabilities, which are carried at fair value, that are measured on a recurring basis during the period, all of which are classified as Level 2 within the fair value hierarchy:
| | | | | | | | | | | |
| | As of September 30, |
| 2024 | | 2023 |
| (Liabilities) Assets at estimated fair value: | | | |
| Deferred compensation | $ | (21.1) | | | $ | (19.4) | |
| Derivatives - foreign currency contracts | (2.3) | | | 5.6 | |
| Net liabilities at estimated fair value | $ | (23.4) | | | $ | (13.8) | |
At September 30, 2024 and 2023, the Company had no Level 1 or Level 3 financial assets or liabilities, other than pension plan assets which contained certain assets classified as Level 1. Refer to Note 14 of Notes to Consolidated Financial Statements for the fair value hierarchy of the pension plan assets.
At September 30, 2024 and 2023, the fair market value of fixed rate long-term debt was $1,180.0 and $1,028.6, respectively, compared to its carrying value of $1,250.0 in each period. The estimated fair value of the fixed-rate long-term debt is estimated using yields obtained from independent pricing sources for similar types of borrowing arrangements. There was no variable rate debt excluding revolving credit facilities as of September 30, 2024. The estimated fair values of long-term debt, excluding the Revolving Credit Facility has been determined based on Level 2 inputs.
Due to the nature of cash and cash equivalents and short-term borrowings, including notes payable, carrying amounts on the balance sheets approximate fair value. Additionally, the carrying amount of the Revolving Credit Facility, which are classified as long-term debt on the balance sheet, approximate fair value due to the revolving nature of the balances. The estimated fair value of cash and cash equivalents, short-term borrowings and the Revolving Credit Facility have been determined based on Level 2 inputs.
As of September 30, 2024, the estimated fair value of foreign currency contracts is the amount that the Company would receive or pay to terminate the contracts, considering first the quoted market prices of comparable agreements or, in the absence of quoted market prices, factors such as interest rates, currency exchange rates and remaining maturities. The estimated fair value of the deferred compensation liability is determined based upon the quoted market prices of the investment options that are offered under the plan.
Note 19 - Commitments and Contingencies
Legal Proceedings
During the year ended September 30, 2024, the Company settled legal matters for certain class action advertising claims which resulted in a loss of $3.9. This was included in SG&A in the Consolidated Statements of Earnings and Comprehensive Income.
During the year ended September 30, 2023, the Company settled a legal matter which resulted in a gain of $4.9 related to an intellectual property claim against a third party. This was included in SG&A in the Consolidated Statements of Earnings and Comprehensive Income. The Company received payment for the intellectual property claim settlement in fiscal 2023.
Additionally, during the year ended September 30, 2023, the Company received a favorable court ruling regarding an international VAT matter, which the plaintiff has no ability to appeal. As the Company had previously recorded an accrual for this matter, based on its best estimate of the facts and circumstances at that time, the result of the favorable court ruling was a release of the reserve established which resulted in a gain of $2.2. This was included in SG&A in the Consolidated Statements of Earnings and Comprehensive Income.
During the year ended September 30, 2022, the Company settled certain legal matters which resulted in a gain of $7.5 related to intellectual property claims against a third party. This was included in SG&A in the Consolidated Statements of Earnings and Comprehensive Income. The Company received payment for the settlement in fiscal 2022.
The Company and its subsidiaries are subject to a number of legal proceedings in various jurisdictions arising out of its operations during the ordinary course of business. Many of these legal matters are in preliminary stages and involve complex issues of law and fact and may proceed for protracted periods of time. The amount of liability, if any, from these proceedings cannot be determined with certainty. The Company reviews its legal proceedings and claims, regulatory reviews and inspections and other legal proceedings on an ongoing basis and follows appropriate accounting guidance when making accrual and disclosure decisions. The Company establishes accruals for those contingencies when the incurrence of a loss is probable and can be reasonably estimated and discloses the amount accrued and the amount of a reasonably possible loss in excess of the amount accrued if such disclosure is necessary for its financial statements to not be misleading. The Company does not record liabilities when the likelihood that the liability has been incurred is probable, but the amount cannot be reasonably estimated. Based upon present information, the Company believes that its liability, if any, arising from such pending legal proceedings, asserted legal claims, and known potential legal claims which are likely to be asserted, is not reasonably likely to be material to its financial position, results of operations or cash flows, when taking into account established accruals for estimated liabilities.
Government Regulation and Environmental Matters
The operations of the Company are subject to various federal, state, local, and foreign laws and regulations intended to protect the public health and environment.
Contamination has been identified at certain of the Company’s current and former facilities, as well as third-party waste disposal sites, and the Company is conducting investigation and remediation activities in relation to such properties. In connection with certain sites, the Company has received notices from the U.S. Environmental Protection Agency, state agencies and private parties, that it has been identified as a potentially responsible party (“PRP”) under the Comprehensive Environmental Response, Compensation and Liability Act of 1980 (“CERCLA”), and may be required to share in the cost of cleanup with respect to a number of federal “Superfund” sites. The Company may also be required to share in the cost of cleanup with respect to state-designated sites, and certain international locations, as well as any of its own properties.
Accrued environmental costs at September 30, 2024 and 2023 were $7.9 and $9.3, respectively, and were recorded in Other Current Liabilities and Other Liabilities within the Consolidated Balance Sheets. The amount of the Company’s ultimate liability in connection with those sites may depend on many factors, including the volume and toxicity of material contributed to the site, the number of other PRPs and their financial viability, and the remediation methods and technology to be used. Total environmental capital expenditures and operating expenses are not expected to have a material effect on the Company’s total capital and operating expenditures, cash flows, earnings or competitive position. Current environmental spending estimates may be modified as a result of changes in the Company’s plans or its understanding of the underlying facts, changes in legal requirements, including any requirements related to global climate change, or other factors.
Many European countries, as well as the European Union, have been very active in adopting and enforcing environmental regulations. As such, it is possible that new regulations may increase the risk and expense of doing business in such countries.
Certain of the Company’s products are subject to regulation under the U.S. Federal Food, Drug and Cosmetic Act and are regulated by the U.S. Food and Drug Administration.
Note 20 - Segment and Geographical Data
Segment performance is evaluated based on segment profit, excluding certain U.S. GAAP items that management does not believe are indicative of ongoing operating performance due to their unusual or non-recurring nature and which may have a disproportionate positive or negative impact on the Company’s financial results in any particular period. Financial items, such as interest income and expense, are managed on a global basis at the corporate level and therefore are excluded from segment profit. The exclusion of such charges from segment results reflects management’s view on how management monitors and evaluates segment operating performance, generates future operating plans and makes strategic decisions regarding the allocation of capital. Refer to Note 1 of Notes to Consolidated Financial Statements, for further discussion.
The Company’s operating model includes some shared business functions across the segments, including product warehousing and distribution, transaction processing functions and, in most cases, a combined sales force and management teams. The Company applies a fully allocated cost basis, in which shared business functions are allocated among the segments. Such allocations are estimates and do not represent the costs of such services if performed on a stand-alone basis.
Segment net sales and profitability are presented below:
| | | | | | | | | | | | | | | | | |
| Fiscal Year |
| | 2024 | | 2023 | | 2022 |
| Net Sales | | | | | |
| Wet Shave | $ | 1,229.3 | | | $ | 1,230.9 | | | $ | 1,242.5 | |
| Sun and Skin Care | 740.8 | | | 705.5 | | | 638.5 | |
| Feminine Care | 283.6 | | | 315.2 | | | 290.7 | |
| | | | | |
| Total net sales | $ | 2,253.7 | | | $ | 2,251.6 | | | $ | 2,171.7 | |
| | | | | |
| Segment Profit | | | | | |
| Wet Shave | $ | 203.9 | | | $ | 158.3 | | | $ | 174.5 | |
| Sun and Skin Care | 131.3 | | | 137.4 | | | 108.8 | |
| Feminine Care | 28.8 | | | 49.7 | | | 31.5 | |
| | | | | |
| Total segment profit | 364.0 | | | 345.4 | | | 314.8 | |
| | | | | |
| General corporate and other expenses | (65.7) | | | (68.7) | | | (54.0) | |
Restructuring and repositioning expenses (1) | (36.0) | | | (17.1) | | | (16.2) | |
Acquisition and integration costs (2) | (6.1) | | | (7.5) | | | (9.9) | |
SKU rationalization (3) | — | | | 1.7 | | | (22.5) | |
Sun Care reformulation (4) | (4.4) | | | (1.9) | | | (4.6) | |
Wet Ones manufacturing plant fire (5) | (12.2) | | | — | | | — | |
Legal matters (6) | (3.9) | | | 6.3 | | | 7.5 | |
Loss on investment (7) | (3.1) | | | — | | | — | |
VAT settlement costs (8) | — | | | — | | | (3.4) | |
Pension settlement expense (9) | — | | | (7.9) | | | (1.8) | |
| | | | | |
Other project costs (10) | (5.3) | | | (0.4) | | | — | |
| Amortization of intangibles | (31.1) | | | (30.8) | | | (29.4) | |
| Interest and other expense, net | (75.3) | | | (71.4) | | | (56.4) | |
| Total earnings before income taxes | $ | 120.9 | | | $ | 147.7 | | | $ | 124.1 | |
| | | | | |
| Depreciation and amortization | | | | | |
| Wet Shave | $ | 35.9 | | | $ | 37.1 | | | $ | 36.4 | |
| Sun and Skin Care | 14.1 | | | 15.1 | | | 15.4 | |
| Feminine Care | 6.8 | | | 8.4 | | | 8.7 | |
| Total segment depreciation and amortization | 56.8 | | | 60.6 | | | 60.5 | |
| Corporate | 31.2 | | | 30.8 | | | 29.4 | |
| Total depreciation and amortization | $ | 88.0 | | | $ | 91.4 | | | $ | 89.9 | |
| | | | | | | | | | | | | | | | | |
| Fiscal Year |
| 2024 | | 2023 | | 2022 |
| Total Assets | | | | | |
| Wet Shave | $ | 724.5 | | | $ | 724.1 | | | |
| Sun and Skin Care | 314.4 | | | 316.1 | | | |
| Feminine Care | 176.2 | | | 163.2 | | | |
| Total segment assets | 1,215.1 | | | 1,203.4 | | | |
Corporate (11) | 228.7 | | | 232.1 | | | |
| Goodwill and other intangible assets, net | 2,287.1 | | | 2,305.2 | | | |
| Total assets | $ | 3,730.9 | | | $ | 3,740.7 | | | |
| | | | | |
| Capital Expenditures | | | | | |
| Wet Shave | $ | 33.3 | | | $ | 31.2 | | | $ | 36.1 | |
| Sun and Skin Care | 16.0 | | | 12.2 | | | 12.4 | |
| Feminine Care | 7.2 | | | 6.1 | | | 7.9 | |
| | | | | |
| Total capital expenditures | $ | 56.5 | | | $ | 49.5 | | | $ | 56.4 | |
(1)Includes Restructuring and repositioning expenses of nil, $0.2 and $0.1 included within COGS and $0.1, $0.3 and $0.8 within SG&A for fiscal 2024, 2023, and 2022, respectively, related to actions to strengthen our operating model.
(2)Includes COGS of $3.3, nil, and $0.8 for fiscal 2024, 2023, and 2022, respectively and SG&A of $2.8, $7.5, and $9.1 for fiscal 2024, 2023, and 2022, respectively, related to costs associated with the acquisition of Billie, Inc. on November 29, 2021.
(3)In fiscal 2022, we recorded a charge of $22.5 in COGS for the write-off of certain Wet Ones SKUs and related contract termination charges. In fiscal 2023, we released a reserve of $1.7 related to certain accrued expenses associated with the write-off of inventory related to these SKUs. Wet Ones products are included within the Sun and Skin Care segment.
(4)Includes pre-tax research and development (“R&D”) costs of $4.4, $3.3 and nil for fiscal 2024, 2023 and 2022 related to the reformulation, recall, and destruction of certain Sun Care products. In fiscal 2023, we released a reserve of $1.4 related to certain accrued expenses associated with the recall and destruction of certain Sun Care products, within COGS. In fiscal 2022, we recorded costs of $3.5 related to the reformulation, recall, and destruction of certain Sun Care products within COGS.
(5)On December 1, 2023, a fire occurred at our Wet Ones manufacturing plant in Sidney, Ohio. There were no injuries reported and damage was limited to a single manufacturing process. As a consequence of the fire damage, there was a partial shutdown of the operations that manufacture Wet Ones raw materials. In fiscal 2024, the Company incurred $12.2, in costs related to incremental material charges, labor and absorption as a result of the fire, within COGS.
(6)Includes pre-tax SG&A of $3.9 for fiscal 2024 for the settlement of certain legal matters. Includes pre-tax income in SG&A of $$6.3, net of other costs of $0.8, in fiscal 2023 related to the favorable resolution of legal matters.
(7)Includes pre-tax loss of $3.1 for fiscal 2024, on an equity method investment and a related note receivable as a result of a new contractual agreement.
(8)Includes pre-tax SG&A of $3.4 for the fiscal 2022 related to the estimated settlement of prior years’ value-added tax audits in Germany.
(9)Includes pre-tax Other expense (income), net of nil, $7.9 and $1.8 for fiscal 2023 and 2022, respectively related to related to the settlement of the Canada Plan.
(10)Includes pre-tax SG&A of $5.3 for fiscal 2024 related to certain corporate project costs. Includes pre-tax SG&A of $0.4 for fiscal 2023 related to the write off of assets associated with a prior year divestiture.
(11)Corporate assets include all cash and cash equivalents, financial instruments and deferred tax assets that are managed outside of operating segments.
The following table presents the Company’s net sales and long-lived assets by geographic area:
| | | | | | | | | | | | | | | | | |
| Fiscal Year |
| 2024 | | 2023 | | 2022 |
| Net Sales to Customers | | | | | |
| United States | $ | 1,261.8 | | | $ | 1,326.1 | | | $ | 1,306.5 | |
| International | 991.9 | | | 925.5 | | | 865.2 | |
| Total net sales | $ | 2,253.7 | | | $ | 2,251.6 | | | $ | 2,171.7 | |
| | | | | |
| Long-lived Assets | | | | | |
| United States | $ | 227.9 | | | $ | 221.6 | | | |
| Germany | 70.3 | | | 73.7 | | | |
| Other International | 81.7 | | | 75.7 | | | |
| Total long-lived assets excluding goodwill and other intangibles, net, and other assets | $ | 379.9 | | | $ | 371.0 | | | |
The Company’s international net sales are derived from customers in numerous countries, with no sales to any individual foreign country exceeding 10% of the Company’s total Net sales. For information on customer concentration and product concentration risk, see Note 18 of Notes to Consolidated Financial Statements.
Supplemental product information is presented below for net sales:
| | | | | | | | | | | | | | | | | |
| Fiscal Year |
| 2024 | | 2023 | | 2022 |
| Razors and blades | $ | 1,111.0 | | | $ | 1,103.6 | | | $ | 1,108.8 | |
| Sun care products | 483.6 | | | 450.7 | | | 401.8 | |
| Tampons, pads and liners | 283.6 | | | 315.2 | | | 290.7 | |
| Shaving gels and creams | 118.3 | | | 127.3 | | | 133.7 | |
| Grooming products | 182.9 | | | 172.5 | | | 158.7 | |
| Wipes and other skin care | 74.3 | | | 82.3 | | | 78.0 | |
| Total net sales | $ | 2,253.7 | | | $ | 2,251.6 | | | $ | 2,171.7 | |
Item 9. Changes in and Disagreements With Accountants on Accounting and Financial Disclosure.
None.
Item 9A. Controls and Procedures.
Evaluation of Disclosure Controls and Procedures
We maintain disclosure controls and procedures designed to ensure that information required to be disclosed in reports filed under the Securities Exchange Act of 1934, as amended (the “Exchange Act”), is recorded, processed, summarized and reported within the specified time periods, and that such information is accumulated and communicated to management, including our Chief Executive Officer (“CEO”) and Chief Financial Officer (“CFO”), as appropriate, to allow timely decisions regarding required disclosure.
Our management, with the participation of our CEO and CFO, evaluated the effectiveness of our disclosure controls and procedures (as defined in Rules 13a-15(e) and 15d-15(e) under the Exchange Act) as of September 30, 2024. Based on that evaluation, our CEO and CFO concluded that, as of that date, our disclosure controls and procedures were effective.
Management’s Report on Internal Control Over Financial Reporting
The management of the Company is responsible for establishing and maintaining adequate internal control over financial reporting, as defined under Exchange Act Rules 13a-15(f) and 15d-15(f). The Company’s internal control over financial reporting is a process designed to provide reasonable assurance regarding the reliability of financial reporting and the preparation of financial statements in accordance with generally accepted accounting principles (“GAAP”) for external purposes. The Company’s internal control over financial reporting includes those policies and procedures that: (i) pertain to the maintenance of records that, in reasonable detail, accurately and fairly reflect the transactions and dispositions of the assets of the Company; (ii) provide reasonable assurance that transactions are recorded as necessary to permit preparation of financial statements in accordance with GAAP, and that receipts and expenditures of the Company are being made only in accordance with authorizations of management and directors of the Company; and (iii) provide reasonable assurance regarding prevention or timely detection of unauthorized acquisition, use or disposition of the Company’s assets that could have a material effect on the financial statements. Internal control over financial reporting, because of its inherent limitations, may not prevent or detect misstatements. Also, projections of any evaluation of effectiveness to future periods are subject to the risk that controls may become inadequate because of changes in conditions, or that the degree of compliance with the policies or procedures may deteriorate. Management conducted an assessment of the effectiveness of the Company’s internal control over financial reporting based on the framework set forth in Internal Control - Integrated Framework (2013), issued by the Committee of Sponsoring Organizations of the Treadway Commission. Based on the Company’s assessment, management has concluded that internal control over financial reporting as of September 30, 2024 was effective.
The Company’s internal control over financial reporting as of September 30, 2024 has been audited by PricewaterhouseCoopers LLP, an independent registered public accounting firm, as stated in their report that appears herein.
Changes in Internal Control over Financial Reporting
There were no changes in our internal control over financial reporting during the quarter ended September 30, 2024 that have materially affected, or are likely to materially affect, our internal control over financial reporting.
Item 9B. Other Information.
None.
Item 9C. Disclosure Regarding Foreign Jurisdictions that Prevent Inspections.
Not applicable.
PART III
Item 10. Directors, Executive Officers and Corporate Governance.
Information regarding our directors will be included in our definitive proxy statement for our annual meeting of shareholders, which will be filed with the United States Securities and Exchange Commission (“SEC”) within 120 days after September 30, 2024.
Information regarding our executive officers is included in Item 1. Business of this Annual Report on Form 10-K.
We have adopted business practices and standards of conduct that are applicable to all employees, including our CEO and CFO. We have also adopted a code of business conduct applicable to our Board of Directors. The codes have been posted on the Investor section of our website at www.edgewell.com. In the event that an amendment to, or a waiver from, a provision of one of the codes of ethics occurs and it is determined that such amendment or waiver is subject to the disclosure provisions of Item 5.05 of Current Report on Form 8-K, we intend to satisfy such disclosure by posting such information on our website for at least a 12-month period.
Item 11. Executive Compensation.
Information regarding the compensation of our named executive officers and directors will be included in our definitive proxy statement for our annual meeting of shareholders, which will be filed with the SEC within 120 days after September 30, 2024.
Item 12. Security Ownership of Certain Beneficial Owners and Management and Related Stockholder Matters.
Information regarding individuals or groups that own more than five percent of our common shares, as well as information regarding the security ownership of our executive officers and directors, information relating to securities authorized for issuance under equity compensation plans and other shareholder matters will be included in our definitive proxy statement for our annual meeting of shareholders, which will be filed with the SEC within 120 days after September 30, 2024.
Item 13. Certain Relationships and Related Transactions, and Director Independence.
Information regarding transactions with related parties and director independence will be included in our definitive proxy statement for our annual meeting of shareholders, which will be filed with the SEC within 120 days after September 30, 2024.
Item 14. Principal Accounting Fees and Services.
Information regarding the services provided by and fees paid to PricewaterhouseCoopers LLP (PCAOB ID 238), our independent auditors, will be included in our definitive proxy statement for our annual meeting of shareholders, which will be filed with the SEC within 120 days after September 30, 2024.
PART IV
Item 15. Exhibits, Financial Statement Schedules.
Documents filed as part of this report:
1)Financial Statements. The following are included within Item 8. Financial Statements and Supplementary Data of this Annual Report on Form 10-K.
◦Report of Independent Registered Public Accounting Firm.
◦Consolidated Statements of Earnings and Comprehensive Income for the fiscal years ended September 30, 2024, 2023 and 2022.
◦Consolidated Balance Sheets as of September 30, 2024 and 2023.
◦Consolidated Statements of Cash Flows for the fiscal years ended September 30, 2024, 2023 and 2022.
◦Consolidated Statements of Changes in Shareholders’ Equity for the period from October 1, 2021 to September 30, 2024.
◦Notes to Consolidated Financial Statements.
2)Financial Statement Schedules.
Schedule II - Valuation and Qualifying Accounts
| | | | | | | | | | | | | | | | | | | | |
| | Fiscal Year |
| | 2024 | | 2023 | | 2022 |
| Allowance for Doubtful Accounts | | | | | | |
| Balance at beginning of year | | 5.6 | | | 3.9 | | | 6.9 | |
| Provision charged to expense, net of reversals | | (0.8) | | | 1.7 | | | (2.9) | |
| Write-offs, less recoveries, translation, other | | (0.2) | | | — | | | (0.3) | |
| Allowance for acquired receivables | | — | | | — | | | 0.2 | |
| Balance at end of year | | $ | 4.6 | | | $ | 5.6 | | | $ | 3.9 | |
| | | | | | |
| Income Tax Valuation Allowance | | | | | | |
| Balance at beginning of year | | 18.3 | | | 10.3 | | | 9.4 | |
| Provision charged to expense | | 4.6 | | | 6.0 | | | 0.7 | |
| Write-offs, less recoveries, translation, other | | (1.4) | | | 2.0 | | | 0.2 | |
| Balance at end of year | | $ | 21.5 | | | $ | 18.3 | | | $ | 10.3 | |
3)Exhibits. The exhibits are included in the Exhibit Index that appears at the end of this Annual Report on Form 10-K.
Item 16. Form 10-K Summary.
None.
SIGNATURES
Pursuant to the requirements of Section 13 or 15(d) of the Securities Exchange Act of 1934, the registrant has duly caused this report to be signed on its behalf by the undersigned, thereunto duly authorized.
| | | | | | | | | | | |
| EDGEWELL PERSONAL CARE COMPANY |
| | | |
| | By: | /s/ Rod R. Little | |
| | | Rod R. Little |
| | | President and Chief Executive Officer |
Date: November 14, 2024
Pursuant to the requirements of the Securities Exchange Act of 1934, this report has been signed below by the following persons on behalf of the registrant and in the capacities and as of the date indicated.
| | | | | |
| Signature | Title |
| /s/ Rod R. Little | |
Rod R. Little (principal executive officer) | President and Chief Executive Officer |
| |
| /s/ Daniel J. Sullivan | |
Daniel J. Sullivan (principal financial officer) | Chief Financial Officer and Chief Operating Officer |
| |
| /s/ John Dunham | |
John Dunham (principal accounting officer) | Chief Accounting Officer |
| |
| /s/ Robert Black | |
| Robert Black | Director |
| |
| /s/ George Corbin | |
| George Corbin | Director |
| |
| /s/ Carla C. Hendra | |
| Carla C. Hendra | Director |
| |
| /s/ John C. Hunter | |
| John C. Hunter | Director |
| |
| /s/ James C. Johnson | |
| James C. Johnson | Director |
| |
| /s/ Joseph D. O’Leary | |
| Joseph D. O’Leary | Director |
| |
| /s/ Rakesh Sachdev | |
| Rakesh Sachdev | Director |
| |
| /s/ Swan Sit | |
| Swan Sit | Director |
| |
| /s/ Stephanie Stahl | |
| Stephanie Stahl | Director |
| |
| /s/ Gary Waring | |
| Gary Waring | Director |
| |
| November 14, 2024 | |
EXHIBIT INDEX
| | | | | | | | |
| Exhibit Number | Exhibit | |
| 2.1**** | | |
| | |
| 2.2**** | | |
| | |
| 2.3**** | | |
| | |
| 2.4**** | | |
| | |
| 2.5**** | | |
| | |
| 2.6 | | |
| | |
| 2.7 | | |
| | |
| 3.1 | | |
| | |
| 3.2 | | |
| | |
| 3.3 | | |
| | |
| 4.1 | | |
| | | |
| 4.2 | | |
| | | |
| 4.3 | | |
| | | |
| 10.1 | Credit Agreement, dated June 1, 2015, by and among the Company, as borrower, JPMorgan Chase Bank, N.A., as administrative agent, and Bank of America, N.A., The Bank of Tokyo-Mitsubishi UFJ, Ltd., and Citibank, N.A., as co-syndication agents (incorporated by reference to Exhibit 10.1 to the Company’s Current Report on Form 8-K filed June 1, 2015). | |
| | | |
| 10.2 | Omnibus Amendment No. 1 dated as of September 25, 2015 to Credit Agreement and Subsidiary Guaranty by and among Edgewell Personal Care Company, as borrower, Edgewell Personal Care Brands, LLC, as new subsidiary borrower, certain other subsidiaries of Edgewell, as subsidiary guarantors, JPMorgan Chase Bank, N.A., as administrative agent, Bank of America, N.A., The Bank of Tokyo-Mitsubishi UFJ, Ltd., and Citibank, N.A., as co-syndication agents, and the various lenders who are a party thereto (incorporated by reference to Exhibit 10.1 to the Company's Current Report on Form 8-K filed September 29, 2015). | |
| | |
| 10.3 | Amendment No. 2 to Credit Agreement by and among Edgewell Personal Care Company, as borrower, Edgewell Personal Care Brands, LLC, as subsidiary borrower, certain other subsidiaries of Edgewell Personal Care Company, as subsidiary guarantors, JPMorgan Chase Bank, N.A., as administrative agent, and the various lenders who are a party thereto (incorporated by reference to Exhibit 10.1 to the Company's Current Report on Form 8-K filed April 29, 2016). | |
| | |
| 10.4 | Amendment No. 3 to Credit Agreement dated as of March 13, 2017, by and among Edgewell Personal Care Company, as borrower, Edgewell Personal Care Brands, LLC, as subsidiary borrower, certain other subsidiaries of Edgewell Personal Care Company, as subsidiary guarantors, JPMorgan Chase Bank, N.A., as administrative agent, Bank of America, N.A., as syndication agent, and the various lenders who are a party thereto (incorporated by reference to Exhibit 10.1 to the Company's Current Report on Form 8-K filed March 14, 2017). | |
| | |
| 10.5 | Increasing Lender Supplement dated as of March 13, 2017, by and among The Bank of Tokyo-Mitsubishi UFJ, Ltd., as increasing lender, Edgewell Personal Care Company, as borrower, and JPMorgan Chase Bank, N.A., as administrative agent (incorporated by reference to Exhibit 10.2 to the Company's Current Report on Form 8-K filed March 14, 2017). | |
| | | | | | | | |
| | |
| 10.6 | | |
| | | |
| 10.7 |
| |
| | |
| 10.8 | Master Accounts Receivable Purchase Agreement dated as of September 15, 2017 among Edgewell Personal Care, LLC, as the Seller, Edgewell Personal Care Company, as Guarantor, and The Bank of Tokyo-Mitsubishi UFJ, Ltd., New York Branch, as the Purchaser (incorporated by reference to Exhibit 10.1 to the Company's Current Report on Form 8-K filed September 19, 2017). | |
| | |
| 10.9 | | |
| | |
| 10.10 | | |
| | |
| 10.11 | Credit Agreement, dated as of March 28, 2020, by and among, inter alia, the Company, the subsidiaries of the Company from time to time parties thereto, the lenders from time to time parties thereto, MUFG, as syndication agent, TD as joint lead arranger and BofA, as administrative agent and collateral agent (incorporated by reference to Exhibit 10.1 to the Company’s Current Report on Form 8-K filed April 2, 2020). | |
| | |
| 10.12 | | |
| | |
| 10.13 | | |
| | |
| 10.14 | | |
| | |
| 10.15 | | |
| | | |
| 10.16 | | |
| | | |
| 10.17 | | |
| | | |
| 10.18*** | | |
| | |
| 10.19*** | | |
| | |
| 10.20*** | | |
| | |
| 10.21*** | | |
| | |
| | |
| 10.22*** | | |
| | |
| | |
| 10.23*** | | |
| | |
| 10.24*** | | |
| | |
| 10.25*** | | |
| | |
| 10.26*** | | |
| | |
| | | | | | | | |
| 10.27*** | | |
| | |
| 10.28*** | | |
| | |
| 10.29*** | | |
| | |
| 10.30*** | | |
| | |
| 10.31*** | | |
| | |
| 10.32*** | | |
| | |
| 10.33*** | | |
| | |
| 10.34*** | | |
| | |
| 10.35*** | | |
| | |
| 10.36*** | | |
| | |
| 10.37*** | | |
| | |
| 10.38*** | | |
| | | |
| 10.39*** | | |
| | |
| 10.40*** | | |
| | |
| 10.41*** | | |
| | |
| 10.42* | | |
| | |
| 10.43* | | |
| | |
| 21.1* | | |
| | |
| 23.1* | | |
| | | |
| 31.1* | | |
| | | |
| 31.2* | | |
| | | |
| 32.1** | | |
| | | |
| 32.2** | | |
| | | | | | | | |
| | |
| 101* | The following materials from the Edgewell Personal Care Company Annual Report on Form 10-K formatted in inline eXtensible Business Reporting Language (iXBRL): (i) the Consolidated Statements of Earnings and Comprehensive Income for the years ended September 30, 2022, 2023 and 2024, (ii) the Consolidated Balance Sheets at September 30, 2023 and 2024, (iii) the Consolidated Statements of Cash Flows for the years ended September 30, 2022, 2023 and 2024, (iv) Consolidated Statements of Changes in Shareholders’ Equity for the period from October 1, 2021 to September 30, 2024, and (v) Notes to Consolidated Financial Statements for the year ended September 30, 2024. | |
*Filed herewith.
**Furnished herewith.
***Denotes a management contract or compensatory plan or arrangement.
****The Company hereby undertakes to furnish supplementally a copy of any omitted schedule or exhibit to such agreement to the Securities and Exchange Commission upon request.