UNITED STATES
SECURITIES AND EXCHANGE COMMISSION
Washington, D.C. 20549
FORM N-CSR
CERTIFIED SHAREHOLDER REPORT OF REGISTERED
MANAGEMENT INVESTMENT COMPANIES
Investment Company Act file number | 811-09631 |
|
Cohen & Steers Institutional Realty Shares, Inc. |
(Exact name of registrant as specified in charter) |
|
280 Park Avenue, New York, NY | | 10017 |
(Address of principal executive offices) | | (Zip code) |
|
Tina M. Payne Cohen & Steers Capital Management, Inc. 280 Park Avenue New York, New York 10017 |
(Name and address of agent for service) |
|
Registrant’s telephone number, including area code: | (212) 832-3232 | |
|
Date of fiscal year end: | December 31 | |
|
Date of reporting period: | June 30, 2015 | |
| | | | | | | | |
Item 1. Reports to Stockholders.
COHEN & STEERS INSTITUTIONAL REALTY SHARES, INC.
To Our Shareholders:
We would like to share with you our report for the six months ended June 30, 2015. The net asset value (NAV) at that date was $43.79 per share.
The total returns, including income and change in NAV, for the Fund and its comparative benchmarks were:
| | Six Months Ended
June 30, 2015 | |
| Cohen & Steers Institutional Realty Shares | | | –4.99 | % | |
| FTSE NAREIT Equity REIT Indexa | | | –5.67 | % | |
| S&P 500 Indexa | | | 1.23 | % | |
The performance data quoted represent past performance. Past performance is no guarantee of future results. The investment return and the principal value of an investment will fluctuate and shares, if redeemed, may be worth more or less than their original cost. Current performance may be lower or higher than the performance data quoted. Current total returns of the Fund can be obtained by visiting our website at cohenandsteers.com. The Fund's returns assume the reinvestment of all dividends and distributions at NAV. Fund performance reflects fee waivers and/or expense reimbursements, without which the performance would have been lower. Index performance does not reflect the deduction of any fees, taxes or expenses. An investor cannot invest directly in an index. Performance figures for periods shorter than one year are not annualized.
Please note that distributions paid by the Fund to shareholders are subject to recharacterization for tax purposes and are taxable up to the amount of the Fund's investment company taxable income and net realized gains. Distributions in excess of the Fund's investment company taxable income and net realized gains are a return of capital distributed from the Fund's assets.
Market Review
Following a strong start to the year, U.S. real estate investment trusts (REITs) fell back in the second quarter to post negative returns for the six-month period. The group came under pressure amid a difficult combination of mixed economic signals and rising bond yields. Gross domestic product (GDP) contracted at an annualized rate of 0.2% in the first quarter, a sharp contrast with the previous quarter's 2.2% growth. However, other aspects of the U.S. economy were relatively healthy, including job growth, housing activity, bank lending, and consumer confidence and spending.
a The FTSE NAREIT Equity REIT Index contains all tax-qualified REITs except timber and infrastructure REITs with more than 50% of total assets in qualifying real estate assets other than mortgages secured by real property that also meet minimum size and liquidity criteria. The S&P 500 Index is an unmanaged index of 500 large-capitalization stocks that is frequently used as a general measure of U.S. stock market performance.
1
COHEN & STEERS INSTITUTIONAL REALTY SHARES, INC.
Sovereign bond yields moved higher in response to generally improving global economic conditions. Better economic data in Europe and Japan helped lift bond yields off record lows reached earlier in the year, and U.S. bond yields rose in tandem, but also in anticipation of a possible Federal Reserve interest-rate hike in 2015. Although rate concerns often weigh on REIT returns in the short term, over longer periods REIT performance has been positively associated with rising rates, both of which tend to be propelled by stronger economic growth.
Returns were negative for most property types, despite continued strong fundamentals for U.S. commercial real estate, as reflected in earnings that generally met high expectations. Health care property REITs (–11.7% total return) were among the poorest performers in the first half of the year. The sector underperformed due to its perceived bond-like characteristics in a period of rising yields, even as health care REITs have been transitioning to more economically sensitive business models over the years.
The shopping center and regional mall sectors (–8.1% and –6.2%, respectively) underperformed, even as tenants continued to exhibit strong interest in proven assets. Self storage companies (3.7%) were top performers, drawing support from strong earnings, with year-over-year rental growth running as high as 10%. Apartment landlords ( 0.8%) also outperformed with a gain, amid sustained household formation that has kept demand ahead of supply. Even apartments in markets vulnerable to lower oil prices, such as Houston, have so far shown a fair degree of resilience.
Despite heightened volatility, the REIT market continued to see mergers and acquisitions, including the sale of apartment owner Associated Estates to Brookfield Asset Management, and Blackstone's acquisition of shopping center REIT Excel Trust, both at double-digit premiums to the prevailing share prices. Also of note, Equinix, a data center REIT, announced a $3.6 billion takeover of the U.K.'s Telecity Group. In the office sector (–5.3%), SL Green Realty said that it would purchase a New York City tower for $2.6 billion, in one of New York's largest-ever property deals.
Fund Performance
The Fund had a negative total return for the period, although it outperformed its benchmark. Our overweight and stock selection in the apartment sector helped relative performance. In the hotel sector (–10.3% total return in the index), we had beneficial positions in certain out-of-index companies that performed well. Our underweight and stock selection in health care REITs also contributed to relative performance. Stock selection in the office sector detracted from performance, as it did in the shopping center sector.
Investment Outlook
We expect U.S. economic activity to accelerate after a slow start to the year, with GDP expanding nearly 2.5% in 2015. Continued employment and wage growth should support further strength in consumer confidence, in our view, and we expect to see a more-pronounced benefit from lower gasoline prices in the coming months. These potentially favorable demand trends should be met with continued low levels of new supply in most sectors.
2
COHEN & STEERS INSTITUTIONAL REALTY SHARES, INC.
Based on our view of a resumed expansion in the U.S. economy, we believe commercial real estate fundamentals will continue to strengthen, driving further increases in cash flows, net asset values and dividend distributions. This top-down perspective has led us to prefer cyclically sensitive short-lease sectors. However, our bottom-up analysis has also identified companies offering compelling relative value in traditionally noncyclical sectors. We believe that one area of potential opportunity at present is health care, where certain stocks are trading at discounts to underlying property values for the first time in years.
Sincerely,
| | | | | 
| | 
| |
| | | | | ROBERT H. STEERS | | JOSEPH M. HARVEY | |
| | | | | Chairman | | Portfolio Manager | |
| | | | | 
| | 
| |
| | | | | THOMAS N. BOHJALIAN | | JON CHEIGH | |
| | | | | Portfolio Manager | | Portfolio Manager | |

JASON A. YABLON
Portfolio Manager
3
COHEN & STEERS INSTITUTIONAL REALTY SHARES, INC.
The views and opinions in the preceding commentary are subject to change without notice and are as of the date of the report. There is no guarantee that any market forecast set forth in the commentary will be realized. This material represents an assessment of the market environment at a specific point in time, should not be relied upon as investment advice and is not intended to predict or depict performance of any investment.
Visit Cohen & Steers online at cohenandsteers.com
For more information about the Cohen & Steers family of mutual funds, visit cohenandsteers.com. Here you will find fund net asset values, fund fact sheets and portfolio highlights, as well as educational resources and timely market updates.
Our website also provides comprehensive information about Cohen & Steers, including our most recent press releases, profiles of our senior investment professionals and their investment approach to each asset class. The Cohen & Steers family of mutual funds invests in major real asset categories including real estate, infrastructure, commodities and natural resource equities, as well as preferred securities and other income solutions.
4
COHEN & STEERS INSTITUTIONAL REALTY SHARES, INC.
Performance Review (Unaudited)
Average Annual Total Returns—For Periods Ended June 30, 2015
| | 1 Year | | 5 Years | | 10 Years | | Since Inceptiona | |
Fund | | | 5.48 | % | | | 13.98 | % | | | 7.65 | % | | | 12.45 | % | |
The performance data quoted represent past performance. Past performance is no guarantee of future results. The investment return and principal value of an investment will fluctuate and shares, if redeemed, may be worth more or less than their original cost. Current performance may be lower or higher than the performance data quoted. Performance information current to the most recent month end can be obtained by visiting our website at cohenandsteers.com. Total return assumes the reinvestment of all dividend distributions, including returns of capital, if any, at NAV. The performance table does not reflect the deduction of taxes that a shareholder would pay on Fund distributions or the redemption of Fund shares. During the periods presented above, the investment manager waived fees and/or reimbursed expenses. Without this arrangement, performance would have been lower.
The annualized gross and net expense ratios, respectively, were 0.76% and 0.75% as disclosed in the May 1, 2015 prospectus. The investment manager has contractually agreed to waive its fee and/or reimburse the Fund so that the Fund's total annual operating expenses (excluding brokerage fees and commissions, taxes, and, upon approval of the Board, extraordinary expenses) never exceed 0.75% of the average daily net assets of the fund. This commitment will remain in place for the life of the Fund.
a Inception date of February 14, 2000.
5
COHEN & STEERS INSTITUTIONAL REALTY SHARES, INC.
Expense Example (Unaudited)
As a shareholder of the Fund, you incur two types of costs: (1) transaction costs and (2) ongoing costs including management fees and other Fund expenses. This example is intended to help you understand your ongoing costs (in dollars) of investing in the Fund and to compare these costs with the ongoing costs of investing in other mutual funds.
The example is based on an investment of $1,000 Invested at the beginning of the period and held for the entire period January 1, 2015—June 30, 2015.
Actual Expenses
The first line of the following table provides information about actual account values and expenses. You may use the information in this line, together with the amount you invested, to estimate the expenses that you paid over the period. Simply divide your account value by $1,000 (for example, an $8,600 account value divided by $1,000 = 8.6), then multiply the result by the number in the first line under the heading entitled "Expenses Paid During Period" to estimate the expenses you paid on your account during this period.
Hypothetical Example for Comparison Purposes
The second line of the following table provides information about hypothetical account values and hypothetical expenses based on the Fund's actual expense ratio and an assumed rate of return of 5% per year before expenses, which is not the Fund's actual return. The hypothetical account values and expenses may not be used to estimate the actual ending account balance or expenses you paid for the period. You may use this information to compare the ongoing cost of investing in the Fund and other funds. To do so, compare this 5% hypothetical example with the 5% hypothetical examples that appear in the shareholder reports of other funds.
Please note that the expenses shown in the table are meant to highlight your ongoing costs only and do not reflect any transaction costs. Therefore, the second line of the table is useful in comparing ongoing costs only, and will not help you determine the relative total costs of owning different funds. In addition, if these transactional costs were included, your costs would have been higher.
| | Beginning
Account Value
January 1, 2015 | | Ending
Account Value
June 30, 2015 | | Expenses Paid
During Perioda
January 1, 2015–
June 30, 2015 | |
Actual (–4.99% return) | | $ | 1,000.00 | | | $ | 950.10 | | | $ | 3.63 | | |
Hypothetical (5% annual return before
expenses) | | $ | 1,000.00 | | | $ | 1,021.08 | | | $ | 3.76 | | |
a Expenses are equal to the Fund's annualized net expense ratio of 0.75% multiplied by the average account value over the period, multiplied by 181/365 (to reflect the one-half year period).
6
COHEN & STEERS INSTITUTIONAL REALTY SHARES, INC.
June 30, 2015
Top Ten Holdings
(Unaudited)
| Security | | Value | | % of
Net
Assets | |
Simon Property Group | | $ | 284,787,113 | | | | 10.4 | | |
Equity Residential | | | 187,205,771 | | | | 6.8 | | |
Vornado Realty Trust | | | 165,349,264 | | | | 6.0 | | |
Health Care REIT | | | 153,024,352 | | | | 5.6 | | |
UDR | | | 151,067,413 | | | | 5.5 | | |
Public Storage | | | 148,922,286 | | | | 5.4 | | |
SL Green Realty Corp. | | | 135,670,633 | | | | 4.9 | | |
Host Hotels & Resorts | | | 115,822,330 | | | | 4.2 | | |
Equinix | | | 101,864,414 | | | | 3.7 | | |
DDR Corp. | | | 98,880,846 | | | | 3.6 | | |
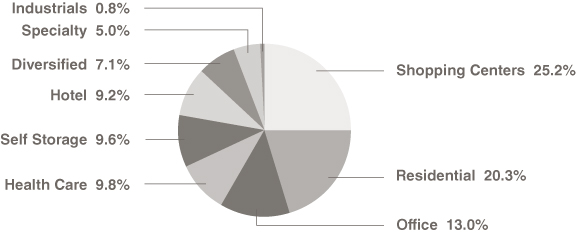
Sector Breakdown
(Based on Market Value)
(Unaudited)
7
COHEN & STEERS INSTITUTIONAL REALTY SHARES, INC.
SCHEDULE OF INVESTMENTS
June 30, 2015 (Unaudited)
| | | | | Number
of Shares | | Value | |
COMMON STOCK | |
REAL ESTATE | | 100.3% | | | | | | �� | | | |
DIVERSIFIED | | 7.1% | | | | | | | | | |
American Assets Trust | | | | | 735,904 | | | $ | 28,854,796 | | |
Vornado Realty Trust | | | | | 1,741,802 | | | | 165,349,264 | | |
| | | | | | | | 194,204,060 | | |
HEALTH CARE | | 9.9% | | | | | | | | | |
Health Care REIT | | | | | 2,331,622 | | | | 153,024,352 | | |
Healthcare Trust of America, Class A | | | | | 1,451,877 | | | | 34,772,454 | | |
Omega Healthcare Investors | | | | | 2,415,718 | | | | 82,931,599 | | |
| | | | | | | | 270,728,405 | | |
HOTEL | | 9.3% | | | | | | | | | |
Belmond Ltd., Class A (Bermuda)a | | | | | 1,119,885 | | | | 13,987,364 | | |
DiamondRock Hospitality Co. | | | | | 2,689,157 | | | | 34,448,101 | | |
Extended Stay America | | | | | 1,507,515 | | | | 28,296,056 | | |
Host Hotels & Resorts | | | | | 5,840,763 | | | | 115,822,330 | | |
La Quinta Holdingsa | | | | | 1,182,523 | | | | 27,020,651 | | |
Sunstone Hotel Investors | | | | | 2,294,759 | | | | 34,444,333 | | |
| | | | | | | | 254,018,835 | | |
INDUSTRIALS | | 2.0% | | | | | | | | | |
First Industrial Realty Trust | | | | | 1,156,202 | | | | 21,655,664 | | |
QTS Realty Trust, Class A | | | | | 945,205 | | | | 34,452,722 | | |
| | | | | | | | 56,108,386 | | |
OFFICE | | 13.1% | | | | | | | | | |
BioMed Realty Trust | | | | | 3,621,793 | | | | 70,045,476 | | |
Brandywine Realty Trust | | | | | 1,337,588 | | | | 17,763,169 | | |
Douglas Emmett | | | | | 1,519,399 | | | | 40,932,609 | | |
Empire State Realty Trust, Class A | | | | | 1,227,528 | | | | 20,941,628 | | |
Kilroy Realty Corp. | | | | | 525,773 | | | | 35,305,657 | | |
Liberty Property Trust | | | | | 1,148,246 | | | | 36,996,486 | | |
SL Green Realty Corp. | | | | | 1,234,604 | | | | 135,670,633 | | |
| | | | | | | | 357,655,658 | | |
See accompanying notes to financial statements.
8
COHEN & STEERS INSTITUTIONAL REALTY SHARES, INC.
SCHEDULE OF INVESTMENTS—(Continued)
June 30, 2015 (Unaudited)
| | | | | Number
of Shares | | Value | |
RESIDENTIAL | | 20.3% | | | | | | | | | |
APARTMENT | | 19.0% | | | | | | | | | |
American Homes 4 Rent, Class A | | | | | 2,709,434 | | | $ | 43,459,321 | | |
Apartment Investment & Management Co. | | | | | 1,857,481 | | | | 68,596,773 | | |
Education Realty Trust | | | | | 581,893 | | | | 18,248,165 | | |
Equity Residential | | | | | 2,667,889 | | | | 187,205,771 | | |
Home Properties | | | | | 322,185 | | | | 23,535,614 | | |
Monogram Residential Trust | | | | | 3,218,832 | | | | 29,033,865 | | |
UDR | | | | | 4,716,435 | | | | 151,067,413 | | |
| | | | | | | | 521,146,922 | | |
MANUFACTURED HOME | | 1.3% | | | | | | | | | |
Sun Communities | | | | | 586,336 | | | | 36,253,155 | | |
TOTAL RESIDENTIAL | | | | | | | 557,400,077 | | |
SELF STORAGE | | 9.6% | | | | | | | | | |
CubeSmart | | | | | 2,917,730 | | | | 67,574,627 | | |
Extra Space Storage | | | | | 269,185 | | | | 17,556,246 | | |
Public Storage | | | | | 807,736 | | | | 148,922,286 | | |
Sovran Self Storage | | | | | 330,434 | | | | 28,718,019 | | |
| | | | | | | | 262,771,178 | | |
SHOPPING CENTERS | | 25.3% | | | | | | | | | |
COMMUNITY CENTER | | 9.2% | | | | | | | | | |
DDR Corp. | | | | | 6,395,915 | | | | 98,880,846 | | |
Regency Centers Corp. | | | | | 1,183,274 | | | | 69,789,501 | | |
Retail Properties of America, Class A | | | | | 2,980,185 | | | | 41,513,977 | | |
Weingarten Realty Investors | | | | | 1,299,863 | | | | 42,492,521 | | |
| | | | | | | | 252,676,845 | | |
FREE STANDING | | 2.0% | | | | | | | | | |
Spirit Realty Capital | | | | | 5,586,223 | | | | 54,018,776 | | |
REGIONAL MALL | | 14.1% | | | | | | | | | |
Macerich Co. (The) | | | | | 918,288 | | | | 68,504,285 | | |
Pennsylvania REIT | | | | | 1,609,340 | | | | 34,343,316 | | |
Simon Property Group | | | | | 1,645,978 | | | | 284,787,113 | | |
| | | | | | | | 387,634,714 | | |
TOTAL SHOPPING CENTERS | | | | | | | 694,330,335 | | |
See accompanying notes to financial statements.
9
COHEN & STEERS INSTITUTIONAL REALTY SHARES, INC.
SCHEDULE OF INVESTMENTS—(Continued)
June 30, 2015 (Unaudited)
| | | | | Number
of Shares | | Value | |
SPECIALTY | | | 3.7% | | | | | | | | | | |
Equinix | | | | | 401,041 | | | $ | 101,864,414 | | |
TOTAL COMMON STOCK
(Identified cost—$2,244,196,477) | | | | | | | 2,749,081,348 | | |
SHORT-TERM INVESTMENTS | | | 0.1% | | | | | | | | | | |
MONEY MARKET FUNDS | |
State Street Institutional Treasury Money
Market Fund, 0.00%b | | | | | 1,700,000 | | | | 1,700,000 | | |
TOTAL SHORT-TERM INVESTMENTS
(Identified cost—$1,700,000) | | | | | | | 1,700,000 | | |
TOTAL INVESTMENTS (Identified cost—$2,245,896,477) | | | 100.4 | % | | | | | | | 2,750,781,348 | | |
LIABILITIES IN EXCESS OF OTHER ASSETS | | | (0.4 | ) | | | | | | | (9,939,275 | ) | |
NET ASSETS (Equivalent to $43.79 per share
based on 62,584,498 shares of common
stock outstanding) | | | 100.0 | % | | | | | | $ | 2,740,842,073 | | |
Glossary of Portfolio Abbreviations
REIT Real Estate Investment Trust
Note: Percentages indicated are based on the net assets of the Fund.
a Non-income producing security.
b Rate quoted represents the annualized seven-day yield of the Fund.
See accompanying notes to financial statements.
10
COHEN & STEERS INSTITUTIONAL REALTY SHARES, INC.
STATEMENT OF ASSETS AND LIABILITIES
June 30, 2015 (Unaudited)
ASSETS: | |
Investments in securities, at value (Identified cost—$2,245,896,477) | | $ | 2,750,781,348 | | |
Cash | | | 1,726,552 | | |
Receivable for: | |
Investment securities sold | | | 34,541,861 | | |
Dividends | | | 10,310,474 | | |
Fund shares sold | | | 5,943,001 | | |
Other assets | | | 14,948 | | |
Total Assets | | | 2,803,318,184 | | |
LIABILITIES: | |
Payable for: | |
Fund shares redeemed | | | 37,663,586 | | |
Dividends declared | | | 21,606,073 | | |
Investment management fees | | | 1,775,723 | | |
Investment securities purchased | | | 1,426,543 | | |
Directors' fees | | | 667 | | |
Other liabilities | | | 3,519 | | |
Total Liabilities | | | 62,476,111 | | |
NET ASSETS applicable to 62,584,498 shares of $0.001 par value of common stock
outstanding | | $ | 2,740,842,073 | | |
NET ASSET VALUE PER SHARE: | |
($2,740,842,073 ÷ 62,584,498 shares outstanding) | | $ | 43.79 | | |
NET ASSETS consist of: | |
Paid-in capital | | $ | 2,160,536,248 | | |
Dividends in excess of net investment income | | | (9,774,590 | ) | |
Accumulated undistributed net realized gain | | | 85,195,544 | | |
Net unrealized appreciation | | | 504,884,871 | | |
| | | $ | 2,740,842,073 | | |
See accompanying notes to financial statements.
11
COHEN & STEERS INSTITUTIONAL REALTY SHARES, INC.
STATEMENT OF OPERATIONS
For the Six Months Ended June 30, 2015 (Unaudited)
Investment Income: | |
Dividend income | | $ | 32,204,479 | | |
Expenses: | |
Investment management fees | | | 11,759,115 | | |
Directors' fees and expenses | | | 79,954 | | |
Registration and filing fees | | | 68,694 | | |
Line of credit fees | | | 8,894 | | |
Miscellaneous | | | 14,704 | | |
Total Expenses | | | 11,931,361 | | |
Reduction of Expenses (See Note 2) | | | (172,246 | ) | |
Net Expenses | | | 11,759,115 | | |
Net Investment Income | | | 20,445,364 | | |
Net Realized and Unrealized Gain (Loss): | |
Net realized gain on investments | | | 259,649,791 | | |
Net change in unrealized appreciation (depreciation) on investments | | | (427,876,839 | ) | |
Net realized and unrealized loss | | | (168,227,048 | ) | |
Net Decrease in Net Assets Resulting from Operations | | $ | (147,781,684 | ) | |
See accompanying notes to financial statements.
12
COHEN & STEERS INSTITUTIONAL REALTY SHARES, INC.
STATEMENT OF CHANGES IN NET ASSETS (Unaudited)
| | | For the
Six Months Ended
June 30, 2015 | | For the
Year Ended
December 31, 2014 | |
Change in Net Assets: | |
From Operations: | |
Net investment income | | $ | 20,445,364 | | | $ | 44,004,955 | | |
Net realized gain | | | 259,649,791 | | | | 208,223,981 | | |
Net change in unrealized appreciation
(depreciation) | | | (427,876,839 | ) | | | 489,149,997 | | |
Net increase (decrease) in net assets
resulting from operations | | | (147,781,684 | ) | | | 741,378,933 | | |
Dividends and Distributions to Shareholders from: | |
Net investment income | | | (36,335,902 | ) | | | (42,272,781 | ) | |
Net realized gain | | | (188,929,321 | ) | | | (132,056,333 | ) | |
Total dividends and distributions
to shareholders | | | (225,265,223 | ) | | | (174,329,114 | ) | |
Capital Stock Transactions: | |
Increase in net assets from Fund share
transactions | | | 18,358,323 | | | | 97,355,792 | | |
Total increase (decrease) in net assets | | | (354,688,584 | ) | | | 664,405,611 | | |
Net Assets: | |
Beginning of period | | | 3,095,530,657 | | | | 2,431,125,046 | | |
End of perioda | | $ | 2,740,842,073 | | | $ | 3,095,530,657 | | |
a Includes dividends in excess of net investment income and accumulated undistributed net investment income of $9,774,590 and $6,115,948, respectively.
See accompanying notes to financial statements.
13
COHEN & STEERS INSTITUTIONAL REALTY SHARES, INC.
FINANCIAL HIGHLIGHTS (Unaudited)
The following table includes selected data for a share outstanding throughout each period and other performance information derived from the financial statements. It should be read in conjunction with the financial statements and notes thereto.
| | | For the Six | | For the Year Ended December 31, | |
| | | Months Ended | | | |
Per Share Operating Performance: | | June 30, 2015 | | 2014 | | 2013 | | 2012 | | 2011 | | 2010 | |
Net asset value,
beginning of period | | $ | 50.06 | | | $ | 40.77 | | | $ | 42.08 | | | $ | 39.48 | | | $ | 37.99 | | | $ | 30.53 | | |
Income (loss) from investment
operations: | |
Net investment income | | | 0.33 | a,b | | | 0.72 | a,b | | | 0.71 | a | | | 0.58 | | | | 0.48 | b | | | 0.86 | | |
Net realized and
unrealized gain (loss) | | | (2.80 | ) | | | 11.44 | | | | 0.72 | | | | 5.59 | | | | 1.86 | | | | 7.47 | | |
Total from investment
operations | | | (2.47 | ) | | | 12.16 | | | | 1.43 | | | | 6.17 | | | | 2.34 | | | | 8.33 | | |
Less dividends and distributions
to shareholders from: | |
Net investment income | | | (0.60 | ) | | | (0.70 | ) | | | (0.72 | ) | | | (0.56 | ) | | | (0.45 | ) | | | (0.87 | ) | |
Net realized gain | | | (3.20 | ) | | | (2.17 | ) | | | (2.02 | ) | | | (3.01 | ) | | | (0.40 | ) | | | — | | |
Total dividends and
distributions to
shareholders | | | (3.80 | ) | | | (2.87 | ) | | | (2.74 | ) | | | (3.57 | ) | | | (0.85 | ) | | | (0.87 | ) | |
Net increase (decrease) in net
asset value | | | (6.27 | ) | | | 9.29 | | | | (1.31 | ) | | | 2.60 | | | | 1.49 | | | | 7.46 | | |
Net asset value, end of period | | $ | 43.79 | | | $ | 50.06 | | | $ | 40.77 | | | $ | 42.08 | | | $ | 39.48 | | | $ | 37.99 | | |
Total investment returnc | | | –4.99 | %d | | | 30.18 | % | | | 3.46 | % | | | 15.91 | % | | | 6.25 | % | | | 27.63 | % | |
See accompanying notes to financial statements.
14
COHEN & STEERS INSTITUTIONAL REALTY SHARES, INC.
FINANCIAL HIGHLIGHTS (Unaudited)—(Continued)
| | | For the Six | | For the Year Ended December 31, | |
| | | Months Ended | | | |
Ratios/Supplemental Data: | | June 30, 2015 | | 2014 | | 2013 | | 2012 | | 2011 | | 2010 | |
Net assets, end of period
(in millions) | | $ | 2,740.8 | | | $ | 3,095.5 | | | $ | 2,431.1 | | | $ | 2,325.1 | | | $ | 1,790.4 | | | $ | 1,407.5 | | |
Ratio of expenses to average
daily net assets (before
expense reduction) | | | 0.76 | %e | | | 0.76 | % | | | 0.77 | % | | | 0.77 | % | | | 0.77 | % | | | 0.77 | % | |
Ratio of expenses to average
daily net assets (net of
expense reduction) | | | 0.75 | %e | | | 0.75 | % | | | 0.75 | % | | | 0.75 | % | | | 0.75 | % | | | 0.75 | % | |
Ratio of net investment income
to average daily net assets
(before expense reduction) | | | 1.29 | %e | | | 1.54 | % | | | 1.59 | % | | | 1.41 | % | | | 1.19 | % | | | 1.33 | % | |
Ratio of net investment income to
average daily net assets (net of
expense reduction) | | | 1.30 | %e | | | 1.55 | % | | | 1.61 | % | | | 1.42 | % | | | 1.21 | % | | | 1.35 | % | |
Portfolio turnover rate | | | 34 | %d | | | 54 | % | | | 75 | % | | | 85 | % | | | 92 | % | | | 104 | % | |
a Calculation based on average shares outstanding.
b 12.9%, 13.4% and 17.0% of gross income was attributable to dividends paid by Simon Property Group for the six months ended June 30, 2015 and the years ended December 31, 2014 and December 31, 2011, respectively.
c Return assumes the reinvestment of all dividends and distributions at NAV.
d Not annualized.
e Annualized.
See accompanying notes to financial statements.
15
COHEN & STEERS INSTITUTIONAL REALTY SHARES, INC.
NOTES TO FINANCIAL STATEMENTS (Unaudited)
Note 1. Organization and Significant Accounting Policies
Cohen & Steers Institutional Realty Shares, Inc. (the Fund) was incorporated under the laws of the State of Maryland on October 13, 1999 and is registered under the Investment Company Act of 1940 (the 1940 Act), as a non-diversified, open-end management investment company. The Fund's investment objective is total return.
The following is a summary of significant accounting policies consistently followed by the Fund in the preparation of its financial statements. The Fund is an investment company and, accordingly, follows the investment company accounting and reporting guidance of the Financial Accounting Standards Board Accounting Standards Codification Topic 946—Investment Companies. The accounting policies of the Fund are in conformity with accounting principles generally accepted in the United States of America (GAAP). The preparation of the financial statements in accordance with GAAP requires management to make estimates and assumptions that affect the reported amounts of assets and liabilities at the date of the financial statements and the reported amounts of income and expenses during the reporting period. Actual results could differ from those estimates.
Portfolio Valuation: Investments in securities that are listed on the New York Stock Exchange (NYSE) are valued, except as indicated below, at the last sale price reflected at the close of the NYSE on the business day as of which such value is being determined. If there has been no sale on such day, the securities are valued at the mean of the closing bid and ask prices on such day or, if no ask price is available, at the bid price.
Securities not listed on the NYSE but listed on other domestic or foreign securities exchanges are valued in a similar manner. Securities traded on more than one securities exchange are valued at the last sale price reflected at the close of the exchange representing the principal market for such securities on the business day as of which such value is being determined.
Readily marketable securities traded in the over-the-counter market, including listed securities whose primary market is believed by Cohen & Steers Capital Management, Inc. (the investment manager) to be over-the-counter, are valued at the last sale price on the valuation date as reported by sources deemed appropriate by the Board of Directors to reflect their fair market value. If there has been no sale on such day, the securities are valued at the mean of the closing bid and ask prices on such day or, if no ask price is available, at the bid price.
Short-term debt securities with a maturity date of 60 days or less are valued at amortized cost, which approximates fair value. Investments in open-end mutual funds are valued at their closing net asset value.
The policies and procedures approved by the Fund's Board of Directors delegate authority to make fair value determinations to the investment manager, subject to the oversight of the Board of Directors. The investment manager has established a valuation committee (Valuation Committee) to administer, implement and oversee the fair valuation process according to the policies and procedures approved annually by the Board of Directors. Among other things, these procedures allow the Fund to utilize independent pricing services, quotations from securities and financial instrument dealers and other market sources to determine fair value.
16
COHEN & STEERS INSTITUTIONAL REALTY SHARES, INC.
NOTES TO FINANCIAL STATEMENTS (Unaudited)—(Continued)
Securities for which market prices are unavailable, or securities for which the investment manager determines that the bid and/or ask price or a counterparty valuation does not reflect market value, will be valued at fair value, as determined in good faith by the Valuation Committee, pursuant to procedures approved by the Fund's Board of Directors. Circumstances in which market prices may be unavailable include, but are not limited to, when trading in a security is suspended, the exchange on which the security is traded is subject to an unscheduled close or disruption or material events occur after the close of the exchange on which the security is principally traded. In these circumstances, the Fund determines fair value in a manner that fairly reflects the market value of the security on the valuation date based on consideration of any information or factors it deems appropriate. These may include, but are not limited to, recent transactions in comparable securities, information relating to the specific security and developments in the markets.
The Fund's use of fair value pricing may cause the net asset value of Fund shares to differ from the net asset value that would be calculated using market quotations. Fair value pricing involves subjective judgments and it is possible that the fair value determined for a security may be materially different than the value that could be realized upon the sale of that security.
Fair value is defined as the price that the Fund would expect to receive upon the sale of an investment or expect to pay to transfer a liability in an orderly transaction with an independent buyer in the principal market or, in the absence of a principal market, the most advantageous market for the investment or liability. The hierarchy of inputs that are used in determining the fair value of the Fund's investments is summarized below.
• Level 1—quoted prices in active markets for identical investments
• Level 2—other significant observable inputs (including quoted prices for similar investments, interest rates, credit risk, etc.)
• Level 3—significant unobservable inputs (including the Fund's own assumptions in determining the fair value of investments)
The inputs or methodology used for valuing securities are not necessarily an indication of the risk associated with investing in those securities.
For movements between the levels within the fair value hierarchy, the Fund has adopted a policy of recognizing the transfer at the end of the period in which the underlying event causing the movement occurred. Changes in valuation techniques may result in transfers into or out of an assigned level within the disclosure hierarchy. There were no transfers between Level 1 and Level 2 securities as of June 30, 2015.
17
COHEN & STEERS INSTITUTIONAL REALTY SHARES, INC.
NOTES TO FINANCIAL STATEMENTS (Unaudited)—(Continued)
The following is a summary of the inputs used as of June 30, 2015 in valuing the Fund's investments carried at value:
| | | Total | | Quoted Prices
In Active
Markets for
Identical
Investments
(Level 1) | | Other
Significant
Observable
Inputs
(Level 2) | | Significant
Unobservable
Inputs
(Level 3) | |
Common Stock | | $ | 2,749,081,348 | | | $ | 2,749,081,348 | | | $ | — | | | $ | — | | |
Short-Term Investments | | | 1,700,000 | | | | — | | | | 1,700,000 | | | | — | | |
Total Investmentsa | | $ | 2,750,781,348 | | | $ | 2,749,081,348 | | | $ | 1,700,000 | | | $ | — | | |
a Portfolio holdings are disclosed individually on the Schedule of Investments.
Security Transactions and Investment Income: Security transactions are recorded on trade date. Realized gains and losses on investments sold are recorded on the basis of identified cost. Interest income is recorded on the accrual basis. Discounts are accreted and premiums are amortized over the life of the respective securities. Dividend income is recorded on the ex-dividend date. Distributions from Real Estate Investment Trusts (REITs) are recorded as ordinary income, net realized capital gain or return of capital based on information reported by the REITs and management's estimates of such amounts based on historical information. These estimates are adjusted when the actual source of distributions is disclosed by the REITs and actual amounts may differ from the estimated amounts.
Dividends and Distributions to Shareholders: Dividends from net investment income and capital gain distributions are determined in accordance with U.S. federal income tax regulations, which may differ from GAAP. Dividends from net investment income, if any, are declared and paid quarterly. Net realized capital gains, unless offset by any available capital loss carryforward, are typically distributed to shareholders at least annually. Dividends and distributions to shareholders are recorded on the ex-dividend date and are automatically reinvested in full and fractional shares of the Fund based on the net asset value per share at the close of business on the payable date unless the shareholder has elected to have them paid in cash.
Dividends from net investment income are subject to recharacterization for tax purposes. Based upon the results of operations for the six months ended June 30, 2015, the investment manager considers it likely that a significant portion of the distributions will be reclassified to distributions from net realized gains upon the final determination of the Fund's taxable income after December 31, 2015, the Fund's fiscal year end.
Income Taxes: It is the policy of the Fund to continue to qualify as a regulated investment company, if such qualification is in the best interest of the shareholders, by complying with the requirements of Subchapter M of the Internal Revenue Code applicable to regulated investment companies, and by distributing substantially all of its taxable earnings to its shareholders. Also, in order to avoid the payment
18
COHEN & STEERS INSTITUTIONAL REALTY SHARES, INC.
NOTES TO FINANCIAL STATEMENTS (Unaudited)—(Continued)
of any federal excise taxes, the Fund will distribute substantially all of its net investment income and net realized gains on a calendar year basis. Accordingly, no provision for federal income or excise tax is necessary. Dividend and interest income from holdings in non-U.S. securities is recorded net of non-U.S. taxes paid. Management has analyzed the Fund's tax positions taken on federal and applicable state income tax returns as well as its tax positions in non-U.S. jurisdictions in which it trades for all open tax years and has concluded that as of June 30, 2015, no additional provisions for income tax are required in the Fund's financial statements. The Fund's tax positions for the tax years for which the applicable statutes of limitations have not expired are subject to examination by the Internal Revenue Service, state departments of revenue and by foreign tax authorities.
Note 2. Investment Management Fees and Other Transactions with Affiliates
Investment Management Fees: The investment manager serves as the Fund's investment manager pursuant to an investment management agreement (the investment management agreement). Under the terms of the investment management agreement, the investment manager provides the Fund with day-to-day investment decisions and generally manages the Fund's investments in accordance with the stated policies of the Fund, subject to the supervision of the Board of Directors.
For the services provided to the Fund, the investment manager receives a fee, accrued daily and paid monthly, at the annual rate of 0.75% of the average daily net assets of the Fund.
The investment manager is also responsible, under the investment management agreement, for the performance of certain administrative functions for the Fund. Additionally, the investment manager pays certain expenses of the Fund, including administrative and custody fees, transfer agent fees, professional fees, and reports to shareholders.
The investment manager has contractually agreed to waive its fee and/or reimburse the Fund so that the Fund's total annual operating expenses (excluding brokerage fees and commissions, taxes, and, upon approval of the Board, extraordinary expenses) never exceed 0.75% of the average daily net assets of the Fund. This commitment will remain in place for the life of the Fund. For the six months ended June 30, 2015, fees waived and/or expenses reimbursed totaled $172,246.
Directors' and Officers' Fees: Certain directors and officers of the Fund are also directors, officers, and/or employees of the investment manager. The Fund does not pay compensation to directors and officers affiliated with the investment manager.
19
COHEN & STEERS INSTITUTIONAL REALTY SHARES, INC.
NOTES TO FINANCIAL STATEMENTS (Unaudited)—(Continued)
Note 3. Purchases and Sales of Securities
Purchases and sales of securities, excluding short-term investments, for the six months ended June 30, 2015, totaled $1,044,610,215 and $1,139,115,708, respectively.
Note 4. Income Tax Information
As of June 30, 2015 the federal tax cost and net unrealized appreciation and depreciation in value of securities held were as follows:
Cost for federal income tax purposes | | $ | 2,245,896,477 | | |
Gross unrealized appreciation | | $ | 568,139,281 | | |
Gross unrealized depreciation | | | (63,254,410 | ) | |
Net unrealized appreciation | | $ | 504,884,871 | | |
Note 5. Capital Stock
The Fund is authorized to issue 100 million shares of capital stock, at a par value of $0.001 per share. The Board of Directors of the Fund may increase or decrease the aggregate number of shares of common stock that the Fund has authority to issue. Transactions in Fund shares were as follows:
| | | For the
Six Months Ended
June 30, 2015 | | For the
Year Ended
December 31, 2014 | |
| | Shares | | Amount | | Shares | | Amount | |
Sold | | | 6,198,876 | | | $ | 318,565,069 | | | | 12,809,654 | | | $ | 592,544,667 | | |
Issued as reinvestment
of dividends and
distributions | | | 4,549,199 | | | | 201,647,536 | | | | 3,152,086 | | | | 152,560,278 | | |
Redeemed | | | (10,000,517 | ) | | | (501,854,282 | ) | | | (12,155,218 | ) | | | (570,569,283 | ) | |
Redemption in-kinda | | | — | | | | — | | | | (1,600,246 | ) | | | (77,179,870 | ) | |
Net Increase | | | 747,558 | | | $ | 18,358,323 | | | | 2,206,276 | | | $ | 97,355,792 | | |
a Certain shareholders of the Fund were permitted to redeem shares in-kind. As a result, the Fund realized a net gain of $4,455,501 for financial reporting purposes.
Note 6. Borrowings
The Fund, in conjunction with other Cohen & Steers open-end funds, was a party to a $200,000,000 syndicated credit agreement (the credit agreement) with State Street Bank and Trust Company, as administrative agent and operations agent, and the lenders identified in the credit agreement (as
20
COHEN & STEERS INSTITUTIONAL REALTY SHARES, INC.
NOTES TO FINANCIAL STATEMENTS (Unaudited)—(Continued)
applicable), which expired January 23, 2015. The Fund paid a commitment fee of 0.10% per annum on its proportionate share of the unused portion of the credit agreement. On January 23, 2015, the credit agreement was renewed and expires January 22, 2016. Under the renewed credit agreement, the total commitment amount has been reduced to $50,000,000 and the Fund pays a commitment fee of 0.15% per annum on its proportionate share of the unused portion of the credit agreement.
During the six months ended June 30, 2015, the Fund did not borrow under the credit agreement.
Note 7. Other
In the normal course of business, the Fund enters into contracts that provide general indemnifications. The Fund's maximum exposure under these arrangements is dependent on claims that may be made against the Fund in the future and, therefore, cannot be estimated; however, based on experience, the risk of material loss from such claims is considered remote.
Note 8. Subsequent Events
Management has evaluated events and transactions occurring after June 30, 2015 through the date that the financial statements were issued, and has determined that no additional disclosure in the financial statements is required.
21
COHEN & STEERS INSTITUTIONAL REALTY SHARES, INC.
OTHER INFORMATION
A description of the policies and procedures that the Fund uses to determine how to vote proxies relating to portfolio securities is available (i) without charge, upon request, by calling 800-330-7348, (ii) on our website at cohenandsteers.com or (iii) on the Securities and Exchange Commission's (the SEC) website at http://www.sec.gov. In addition, the Fund's proxy voting record for the most recent 12-month period ended June 30 is available by August 31 of each year (i) without charge, upon request, by calling 800-330-7348 or (ii) on the SEC's website at http://www.sec.gov.
The Fund files its complete schedule of portfolio holdings with the SEC for the first and third quarters of each fiscal year on Form N-Q. The Fund's Forms N-Q are available (i) without charge, upon request, by calling 800-330-7348 or (ii) on the SEC's website at http://www.sec.gov. In addition, the Forms N-Q may be reviewed and copied at the SEC's Public Reference Room in Washington, DC. Information on the operation of the Public Reference Room may be obtained by calling 800-SEC-0330.
Please note that distributions paid by the Fund to shareholders are subject to recharacterization for tax purposes. The Fund may also pay distributions in excess of the Fund's net investment company taxable income and net realized gains and this excess would be a tax free return of capital distributed from the Fund's assets. The final tax treatment of all distributions is reported to shareholders on their 1099-DIV forms, which are mailed after the close of each calendar year.
APPROVAL OF INVESTMENT MANAGEMENT AGREEMENT
The Board of Directors of the Fund, including a majority of the directors who are not parties to the Fund's investment management agreement (the Management Agreement), or interested persons of any such party (Independent Directors), has the responsibility under the 1940 Act to approve the Fund's Management Agreement for its initial two year term and its continuation annually thereafter at a meeting of the Board of Directors called for the purpose of voting on the approval or continuation. At a telephonic meeting of the Board of Directors held on June 9, 2015 and at a meeting held in person on June 16, 2015, the Management Agreement was discussed and was unanimously continued for a term ending June 30, 2016 by the Fund's Board of Directors, including the Independent Directors. The Independent Directors were represented by independent counsel who assisted them in their deliberations during the meeting and executive session.
In considering whether to continue the Management Agreement, the Board of Directors reviewed materials provided by the Fund's investment manager (the Investment Manager) and Fund counsel which included, among other things, fee, expense and performance information compared to peer funds (Peer Funds) and performance comparisons to a larger category universe, prepared by an independent data provider; summary information prepared by the Investment Manager; and a memorandum outlining the legal duties of the Board of Directors. The Board of Directors also spoke directly with representatives of the independent data provider and met with investment management personnel. In addition, the Board of Directors considered information provided from time to time by the Investment Manager throughout the year at meetings of the Board of Directors, including presentations
22
COHEN & STEERS INSTITUTIONAL REALTY SHARES, INC.
by portfolio managers relating to the investment performance of the Fund and the investment strategies used in pursuing the Fund's objective. In particular, the Board of Directors considered the following:
(i) The nature, extent and quality of services to be provided by the Investment Manager: The Board of Directors reviewed the services that the Investment Manager provides to the Fund, including, but not limited to, making the day-to-day investment decisions for the Fund, and generally managing the Fund's investments in accordance with the stated policies of the Fund. The Board of Directors also discussed with officers and portfolio managers of the Fund the types of transactions that were being done on behalf of the Fund. Additionally, the Board of Directors took into account the services provided by the Investment Manager to its other funds, including those that have investment objectives and strategies similar to the Fund. The Board of Directors next considered the education, background and experience of the Investment Manager's personnel, noting particularly that the favorable history and reputation of the portfolio managers for the Fund has had, and would likely continue to have, a favorable impact on the Fund. The Board of Directors further noted the Investment Manager's ability to attract qualified and experienced personnel. The Board of Directors also considered the administrative services provided by the Investment Manager, including compliance and accounting services. After consideration of the above factors, among others, the Board of Directors concluded that the nature, extent and quality of services provided by the Investment Manager are adequate and appropriate.
(ii) Investment performance of the Fund and the Investment Manager: The Board of Directors considered the investment performance of the Fund compared to Peer Funds and compared to a relevant benchmark. The Board of Directors noted that the Fund outperformed its benchmark for the one- and ten-year periods ended March 31, 2015. The Board of Directors noted that the Fund underperformed its benchmark for the five-year period ended March 31, 2015. The Board of Directors noted that the Fund performed in line with its benchmark for the three-year period ended March 31, 2015. The Board of Directors noted that the Fund outperformed the medians of the Peer Funds for the three- and ten-year periods ended March 31, 2015, ranking in the first and second quintiles, respectively. The Board of Directors noted that the Fund outperformed the median of the Peer Funds for the one-year period, ranking in the second quintile. The Board of Directors noted that the Fund underperformed the median of the Peer Funds for the five-year period ended March 31, 2015, ranking in the fifth quintile. The Board of Directors engaged in discussions with the Investment Manager regarding the contributors to and detractors from the Fund's performance during the periods. The Board of Directors also considered supplemental information provided by the Investment Manager, including a narrative summary of various factors affecting performance and the Investment Manager's performance in managing other real estate funds. The Board of Directors determined that performance, in light of all considerations noted above, was satisfactory.
(iii) Cost of the services to be provided and profits to be realized by the Investment Manager from the relationship with the Fund: Next, the Board of Directors considered the management fees payable by the Fund as well as total expense ratios. As part of its analysis, the Board of Directors gave consideration to the fee and expense analyses provided by the independent data provider. The Board of Directors noted that the Fund's actual and contractual management fees were lower than the medians
23
COHEN & STEERS INSTITUTIONAL REALTY SHARES, INC.
of the Peer Funds, ranking in the second quintile for each. The Board of Directors further noted that the Fund's overall total expense ratio was lower than the median of the Peer Funds, ranking the Fund in the first quintile. The Board of Directors also considered the effect of the unitary fee charged by the Investment Manager, which limits total expenses of the Fund, has on the Fund's contractual and actual management fee rankings. In light of the considerations above, the Board of Directors concluded that the Fund's expense structure was satisfactory.
The Board of Directors also reviewed information regarding the profitability to the Investment Manager of its relationship with the Fund. The Board of Directors considered the level of the Investment Manager's profits and whether the profits were reasonable for the Investment Manager. The Board of Directors noted that the Investment Manager is currently waiving a portion of its fee and/or reimbursing expenses of the Fund. The Board of Directors took into consideration other benefits to be derived by the Investment Manager in connection with the Management Agreement, noting particularly the research and related services, within the meaning of Section 28(e) of the Securities Exchange Act of 1934, as amended, that the Investment Manager receives by allocating the Fund's brokerage transactions. The Board of Directors concluded that the profits realized by the Investment Manager from its relationship with the Fund were reasonable and consistent with the Investment Manager's fiduciary duties.
(iv) The extent to which economies of scale would be realized as the Fund grows and whether fee levels would reflect such economies of scale: The Board of Directors noted that the Investment Manager pays most of the regular operating costs of the Fund and reimburses the Fund for certain expenses to the extent that total expenses exceed the management fee rate. The Board of Directors determined that there were not at this time significant economies of scale that were not being shared with shareholders.
(v) Comparison of services to be rendered and fees to be paid to those under other investment management contracts, such as contracts of the same and other investment advisers or other clients: As discussed above in (iii), the Board of Directors compared the fees paid under the Management Agreement to those under other investment management contracts of other investment advisers managing Peer Funds. The Board of Directors also compared the services rendered, fees paid and profitability under the Management Agreement to those under the Investment Manager's other fund advisory agreements and advisory contracts with institutional and other clients with similar investment mandates. The Board of Directors also considered the entrepreneurial risk and financial exposure assumed by the Investment Manager in developing and managing the Fund that the Investment Manager does not have with institutional and other clients and other differences in the management of registered investment companies and institutional accounts. The Board of Directors determined that on a comparative basis the fees under the Management Agreement were reasonable in relation to the services provided.
No single factor was cited as determinative to the decision of the Board of Directors. Rather, after weighing all of the considerations and conclusions discussed above, the Board of Directors, including the Independent Directors, unanimously approved the continuation of the Management Agreement.
24
COHEN & STEERS INSTITUTIONAL REALTY SHARES, INC.
Cohen & Steers Privacy Policy
Facts | | What Does Cohen & Steers Do With Your Personal Information? | |
Why? | | Financial companies choose how they share your personal information. Federal law gives consumers the right to limit some but not all sharing. Federal law also requires us to tell you how we collect, share, and protect your personal information. Please read this notice carefully to understand what we do. | |
What? | | The types of personal information we collect and share depend on the product or service you have with us. This information can include:
• Social Security number and account balances
• Transaction history and account transactions
• Purchase history and wire transfer instructions | |
How? | | All financial companies need to share customers' personal information to run their everyday business. In the section below, we list the reasons financial companies can share their customers' personal information; the reasons Cohen & Steers chooses to share; and whether you can limit this sharing. | |
Reasons we can share your personal information | | Does Cohen & Steers
share? | | Can you limit this
sharing? | |
For our everyday business purposes—
such as to process your transactions, maintain your account(s), respond to court orders and legal investigations, or reports to credit bureaus | | Yes | | No | |
For our marketing purposes—
to offer our products and services to you | | Yes | | No | |
For joint marketing with other financial companies— | | No | | We don't share | |
For our affiliates' everyday business purposes—
information about your transactions and experiences | | No | | We don't share | |
For our affiliates' everyday business purposes—
information about your creditworthiness | | No | | We don't share | |
For our affiliates to market to you— | | No | | We don't share | |
For non-affiliates to market to you— | | No | | We don't share | |
Questions? Call 800-330-7348
25
COHEN & STEERS INSTITUTIONAL REALTY SHARES, INC.
Cohen & Steers Privacy Policy—(Continued)
Who we are | | | |
Who is providing this notice? | | Cohen & Steers Capital Management, Inc., Cohen & Steers Asia Limited, Cohen & Steers UK Limited, Cohen & Steers Securities, LLC, Cohen & Steers Private Funds and Cohen & Steers Open- and Closed-End Funds (collectively, Cohen & Steers). | |
What we do | | | |
How does Cohen & Steers protect my personal information? | | To protect your personal information from unauthorized access and use, we use security measures that comply with federal law. These measures include computer safeguards and secured files and buildings. We restrict access to your information to those employees who need it to perform their jobs, and also require companies that provide services on our behalf to protect your information. | |
How does Cohen & Steers collect my personal information? | | We collect your personal information, for example, when you:
• Open an account or buy securities from us
• Provide account information or give us your contact information
• Make deposits or withdrawals from your account
We also collect your personal information from other companies. | |
Why can't I limit all sharing? | | Federal law gives you the right to limit only:
• sharing for affiliates' everyday business purposes—information about your creditworthiness
• affiliates from using your information to market to you
• sharing for non-affiliates to market to you
State law and individual companies may give you additional rights to limit sharing. | |
Definitions | | | |
Affiliates | | Companies related by common ownership or control. They can be financial and nonfinancial companies.
• Cohen & Steers does not share with affiliates. | |
Non-affiliates | | Companies not related by common ownership or control. They can be financial and nonfinancial companies.
• Cohen & Steers does not share with non-affiliates. | |
Joint marketing | | A formal agreement between non-affiliated financial companies that together market financial products or services to you.
• Cohen & Steers does not jointly market. | |
26
COHEN & STEERS INSTITUTIONAL REALTY SHARES, INC.
Cohen & Steers Investment Solutions
COHEN & STEERS GLOBAL REALTY SHARES
• Designed for investors seeking total return, investing primarily in global real estate equity securities
• Symbols: CSFAX, CSFCX, CSSPX, GRSRX, CSFZX
COHEN & STEERS INSTITUTIONAL REALTY SHARES
• Designed for institutional investors seeking total return, investing primarily in U.S. real estate securities
• Symbol: CSRIX
COHEN & STEERS REAL ESTATE SECURITIES FUND
• Designed for investors seeking total return, investing primarily in U.S. real estate securities
• Symbols: CSEIX, CSCIX, CSDIX, CIRRX, CSZIX
COHEN & STEERS INTERNATIONAL REALTY FUND
• Designed for investors seeking total return, investing primarily in international real estate securities
• Symbols: IRFAX, IRFCX, IRFIX
COHEN & STEERS REALTY SHARES
• Designed for investors seeking total return, investing primarily in U.S. real estate securities
• Symbol: CSRSX
COHEN & STEERS
INSTITUTIONAL GLOBAL REALTY SHARES
• Designed for institutional investors seeking total return, investing primarily in global real estate securities
• Symbol: GRSIX
COHEN & STEERS GLOBAL INFRASTRUCTURE FUND
• Designed for investors seeking total return, investing primarily in global infrastructure securities
• Symbols: CSUAX, CSUCX, CSUIX, CSURX, CSUZX
COHEN & STEERS DIVIDEND VALUE FUND
• Designed for investors seeking long-term growth of income and capital appreciation, investing primarily in dividend paying common stocks and preferred stocks
• Symbols: DVFAX, DVFCX, DVFIX, DVFRX, DVFZX
COHEN & STEERS
PREFERRED SECURITIES AND INCOME FUND
• Designed for investors seeking total return (high current income and capital appreciation), investing primarily in preferred and debt securities
• Symbols: CPXAX, CPXCX, CPXIX, CPRRX, CPXZX
COHEN & STEERS REAL ASSETS FUND
• Designed for investors seeking total return and the maximization of real returns during inflationary environments by investing primarily in real assets
• Symbols: RAPAX, RAPCX, RAPIX, RAPRX, RAPZX
COHEN & STEERS
MLP & ENERGY OPPORTUNITY FUND
• Designed for investors seeking total return, investing primarily in midstream energy master limited partnership (MLP) units and related stocks
• Symbols: MLOAX, MLOCX, MLOIX, MLORX, MLOZX
COHEN & STEERS
ACTIVE COMMODITIES STRATEGY FUND
• Designed for investors seeking total return, investing primarily in a diversified portfolio of exchange-traded commodity future contracts and other commodity-related derivative instruments
• Symbols: CDFAX, CDFCX, CDFIX, CDFRX, CDFZX
Distributed by Cohen & Steers Securities, LLC.
COHEN & STEERS GLOBAL REALTY MAJORS ETF
• Designed for investors who seek a relatively low-cost passive approach for investing in a portfolio of real estate equity securities of companies in a specified index
• Symbol: GRI
Distributed by ALPS Distributors, Inc.
ISHARES COHEN & STEERS
REALTY MAJORS INDEX FUND
• Designed for investors who seek a relatively low-cost passive approach for investing in a portfolio of real estate equity securities of companies in a specified index
• Symbol: ICF
Distributed by SEI Investments Distribution Co.
Please consider the investment objectives, risks, charges and expenses of the fund carefully before investing. A summary prospectus and prospectus containing this and other information can be obtained by calling 800-330-7348 or by visiting cohenandsteers.com. Please read the summary prospectus and prospectus carefully before investing.
27
COHEN & STEERS INSTITUTIONAL REALTY SHARES, INC.
OFFICERS AND DIRECTORS
Robert H. Steers
Director and Chairman
Michael G. Clark
Director
Bonnie Cohen
Director
George Grossman
Director
Richard E. Kroon
Director
Richard J. Norman
Director
Frank K. Ross
Director
C. Edward Ward, Jr.
Director
Adam M. Derechin
President and Chief Executive Officer
Joseph M. Harvey
Vice President
Thomas N. Bohjalian
Vice President
Jon Cheigh
Vice President
Francis C. Poli
Secretary
James Giallanza
Treasurer and Chief Financial Officer
Lisa D. Phelan
Chief Compliance Officer
Heather Kaden
Deputy Chief Compliance Officer
Tina M. Payne
Assistant Secretary
Neil Bloom
Assistant Treasurer
KEY INFORMATION
Investment Manager
Cohen & Steers Capital Management, Inc.
280 Park Avenue
New York, NY 10017
(212) 832-3232
Co-administrator and Custodian
State Street Bank and Trust Company
One Lincoln Street
Boston, MA 02111
Transfer Agent
Boston Financial Data Services, Inc.
30 Dan Road
Canton, MA 02021
(800) 437-9912
Legal Counsel
Ropes & Gray LLP
1211 Avenue of the Americas
New York, NY 10036
Distributor
Cohen & Steers Securities, LLC
280 Park Avenue
New York, NY 10017
Nasdaq Symbol: CSRIX
Website: cohenandsteers.com
This report is authorized for delivery only to shareholders of Cohen & Steers Institutional Realty Shares, Inc. unless accompanied or preceded by the delivery of a currently effective prospectus setting forth details of the Fund. Performance data quoted represent past performance. Past performance is no guarantee of future results and your investment may be worth more or less at the time you sell your shares.
28
COHEN & STEERS
INSTITUTIONAL REALTY SHARES
280 PARK AVENUE
NEW YORK, NY 10017
eDelivery NOW AVAILABLE
Stop traditional mail delivery; receive your shareholder reports and prospectus online.
Sign up at cohenandsteers.com

Semiannual Report June 30, 2015
Cohen & Steers Institutional Realty Shares
Item 2. Code of Ethics.
Not applicable.
Item 3. Audit Committee Financial Expert.
Not applicable.
Item 4. Principal Accountant Fees and Services.
Not applicable.
Item 5. Audit Committee of Listed Registrants.
Not applicable.
Item 6. Schedule of Investments.
Included in Item 1 above.
Item 7. Disclosure of Proxy Voting Policies and Procedures for Closed-End Management Investment Companies.
Not applicable.
Item 8. Portfolio Managers of Closed-End Management Investment Companies.
Not applicable.
Item 9. Purchases of Equity Securities by Closed-End Management Investment Company and Affiliated Purchasers.
Not Applicable.
Item 10. Submission of Matters to a Vote of Security Holders.
None.
Item 11. Controls and Procedures.
(a) The registrant’s principal executive officer and principal financial officer have concluded, based upon their evaluation of the registrant’s disclosure controls and procedures as conducted within 90 days of the filing date of this report, that these disclosure controls and procedures provide reasonable assurance that material information required to be disclosed by the registrant in the report it files or submits on Form N-CSR is recorded, processed, summarized and reported within the time periods specified in the Securities and Exchange Commission’s rules and forms
and that such material information is accumulated and communicated to the registrant’s management, including its principal executive officer and principal financial officer, as appropriate, in order to allow timely decisions regarding required disclosure.
(b) There were no changes in the registrant’s internal control over financial reporting that occurred during the second fiscal quarter of the period covered by this report that have materially affected, or are reasonably likely to materially affect, the registrant’s internal control over financial reporting.
Item 12. Exhibits.
(a)(1) Not applicable.
(a)(2) Certifications of principal executive officer and principal financial officer as required by Rule 30a-2(a) under the Investment Company Act of 1940.
(a)(3) Not applicable.
(b) Certifications of principal executive officer and principal financial officer as required by Rule 30a- 2(b) under the Investment Company Act of 1940.
SIGNATURES
Pursuant to the requirements of the Securities Exchange Act of 1934 and the Investment Company Act of 1940, the registrant has duly caused this report to be signed on its behalf by the undersigned, thereunto duly authorized.
COHEN & STEERS INSTITUTIONAL REALTY SHARES, INC.
By: | /s/ Adam M. Derechin | |
| Name: | Adam M. Derechin | |
| Title: | President and Chief Executive Officer | |
| |
Date: September 3, 2015 | |
Pursuant to the requirements of the Securities Exchange Act of 1934 and the Investment Company Act of 1940, this report has been signed below by the following persons on behalf of the registrant and in the capacities and on the dates indicated.
By: | /s/ Adam M. Derechin | |
| Name: | Adam M. Derechin | |
| Title: | President and Chief Executive Officer | |
| | (Principal Executive Officer) | |
By: | /s/ James Giallanza | |
| Name: | James Giallanza | |
| Title: | Treasurer and Chief Financial Officer | |
| | (Principal Financial Officer) | |
| |
| |
Date: September 3, 2015 | |