UNITED STATES
SECURITIES AND EXCHANGE COMMISSION
Washington, D.C. 20549
FORMN-CSR
CERTIFIED SHAREHOLDER REPORT OF REGISTERED
MANAGEMENT INVESTMENT COMPANIES
Investment Company Act File Number: 811-09631
Cohen & Steers Institutional Realty Shares, Inc.
(Exact name of registrant as specified in charter)
280 Park Avenue, New York, NY 10017
(Address of principal executive offices) (Zip code)
Dana DeVivo
Cohen & Steers Capital Management, Inc.
280 Park Avenue
New York, New York 10017
(Name and address of agent for service)
Registrant’s telephone number, including area code: (212)832-3232
Date of fiscal year end: December 31
Date of reporting period: June 30, 2019
Item 1. Reports to Stockholders.
COHEN & STEERS INSTITUTIONAL REALTY SHARES, INC.
To Our Shareholders:
We would like to share with you our report for the six months ended June 30, 2019. The total returns for Cohen & Steers Institutional Realty Shares, Inc. (the Fund) and its comparative benchmarks were:
| | | | |
| | | Six Months Ended
June 30, 2019 | |
Cohen & Steers Institutional Realty Shares | | | 21.20 | % |
Linked Benchmarka | | | 18.41 | % |
S&P 500 Indexa | | | 18.54 | % |
The performance data quoted represent past performance. Past performance is no guarantee of future results. The investment return and the principal value of an investment will fluctuate and shares, if redeemed, may be worth more or less than their original cost. Current performance may be lower or higher than the performance data quoted. Current total returns of the Fund can be obtained by visiting our website at cohenandsteers.com. The Fund’s returns assume the reinvestment of all dividends and distributions at net asset value (NAV). Fund performance reflects fee waivers and/or expense reimbursements, without which the performance would have been lower. Index performance does not reflect the deduction of any fees, taxes or expenses. An investor cannot invest directly in an index. Performance figures for periods shorter than one year are not annualized.
Please note that distributions paid by the Fund to shareholders are subject to recharacterization for tax purposes and are taxable up to the amount of the Fund’s investment company taxable income and net realized gains. Distributions in excess of the Fund’s investment company taxable income and net realized gains are a return of capital distributed from the Fund’s assets.
Market Review
U.S. real estate stocks had a solid gain in the first half of 2019, with most sectors posting double-digit returns, following the downturn late in 2018. Stocks broadly benefited as the U.S. Federal Reserve and other central banks indicated they would pursue accommodative monetary policies amid slowing global economic growth and generally low inflation. Late in the period, signs of progress in U.S.-China trade negotiations contributed to investors’ willingness to take risk, driving equity markets higher. Meanwhile, real estate fundamentals remained healthy in most property types, with firm, lease-based demand and relatively limited new supply.
| a | The Linked Benchmark is represented by the performance of the FTSE Nareit Equity REITs Index through March 31, 2019 and the FTSE Nareit All Equity REITs Index thereafter. The FTSE Nareit Equity REITs Index contains all tax-qualified real estate investment trusts (REITs) except timber and infrastructure REITs with more than 50% of total assets in qualifying real estate assets other than mortgages secured by real property that also meet minimum size and liquidity criteria. The FTSE Nareit All Equity REITs Index contains all tax-qualified REITs with more than 50% of total assets in qualifying real estate assets other than mortgages secured by real property that also meet minimum size and liquidity criteria. The S&P 500 Index is an unmanaged index of 500 large-capitalization stocks that is frequently used as a general measure of U.S. stock market performance. |
1
COHEN & STEERS INSTITUTIONAL REALTY SHARES, INC.
Fund Performance
The Fund had a positive total return in the period and outperformed its linked benchmark.
Regional malls declined, the only sector in the linked benchmark to post a negative return in the period, hindered by ongoing store closings related to competition from e-commerce. Even owners of high-quality properties such as Simon Property Group struggled. The Fund’s significant underweight in malls helped its relative performance.
Infrastructure REITs, which in the Fund’s linked benchmark are mostly cell tower owners, had strong gains, benefiting from rapid growth in data usage and anticipated capital spending on 5G infrastructure. The Fund allocations to SBA Communications and American Tower contributed to performance. We had out-of-index positions in both companies in the first quarter of 2019 (benchmark was the FTSE Nareit Equity REITs Index), when they had sizable rallies. In the second quarter, performance was aided by an overweight in SBA Communications (included in the FTSE Nareit All Equity REITs Index), which continued to outperform.
Stock selection in the health care sector also helped performance, in part reflecting our decision not to invest in Senior Housing Properties Trust. Its shares fell sharply as the company cut its dividend by 60% due to the restructuring of the rental agreement with its largest senior housing operator.
Industrial REITs were top performers in the period, lifted in part by merger & acquisition activity that highlighted potential opportunities in these stocks. Private real estate firm Blackstone announced the purchase of $18.7 billion worth of assets from listed industrial company GLP at a premium to prevailing valuations in the sector. The Fund’s underweight in industrial companies as a group detracted from relative performance.
The apartment sector performed in line with the broader REIT market. Stock selection among apartment owners hindered the Fund’s relative return, due mostly to our overweight in UDR, Inc., a regionally diversified apartment landlord that advanced but underperformed. We continued to view the company as attractively valued.
Impact of Derivatives on Fund Performance
The Fund engaged in the buying and selling of single stock options with the intention of enhancing total returns and reducing overall volatility. These contracts did not have a material effect on the Fund’s total return for the six-month period ended June 30, 2019.
2
COHEN & STEERS INSTITUTIONAL REALTY SHARES, INC.
Sincerely,
| | |
| |

| | 
|
| |
THOMAS N. BOHJALIAN | | JON CHEIGH |
Portfolio Manager | | Portfolio Manager |

JASON A. YABLON
Portfolio Manager
The views and opinions in the preceding commentary are subject to change without notice and are as of the date of the report. There is no guarantee that any market forecast set forth in the commentary will be realized. This material represents an assessment of the market environment at a specific point in time, should not be relied upon as investment advice and is not intended to predict or depict performance of any investment.
Visit Cohen & Steers online at cohenandsteers.com
For more information about the Cohen & Steers family of mutual funds, visit cohenandsteers.com. Here you will find fund net asset values, fund fact sheets and portfolio highlights, as well as educational resources and timely market updates.
Our website also provides comprehensive information about Cohen & Steers, including our most recent press releases, profiles of our senior investment professionals and their investment approach to each asset class. The Cohen & Steers family of mutual funds specializes in liquid real assets, including real estate securities, listed infrastructure and natural resource equities, as well as preferred securities and other income solutions.
3
COHEN & STEERS INSTITUTIONAL REALTY SHARES, INC.
Performance Review (Unaudited)
Average Annual Total Returns—For Periods Ended June 30, 2019
| | | | | | | | | | | | | | |
| 1 Year | | | 5 Years | | | 10 Years | | | Since Inceptiona | |
| | 14.67 | % | | | 9.12 | % | | | 15.88 | % | | | 11.95 | % |
The performance data quoted represent past performance. Past performance is no guarantee of future results. The investment return and principal value of an investment will fluctuate and shares, if redeemed, may be worth more or less than their original cost. Current performance may be lower or higher than the performance data quoted. Performance information current to the most recent month end can be obtained by visiting our website at cohenandsteers.com. Total return assumes the reinvestment of all dividends and distributions at NAV. The performance table does not reflect the deduction of taxes that a shareholder would pay on Fund distributions or the redemption of Fund shares. During the periods presented above, the investment manager waived fees and/or reimbursed expenses. Without this arrangement, performance would have been lower.
The annualized gross and net expense ratios, respectively, were 0.76% and 0.75% as disclosed in the May 1, 2019 prospectus. The investment manager has contractually agreed to waive its fee and/or reimburse expenses so that the Fund’s total annual operating expenses (excluding brokerage fees and commissions, taxes and, upon approval of the Board of Directors, extraordinary expenses) never exceed 0.75% of the average daily net assets of the Fund. This commitment is currently expected to remain in place for the life of the Fund, can only be amended or terminated by agreement of the Fund’s Board of Directors and the investment manager and will terminate automatically in the event of termination of the investment management agreement between the investment manager and the Fund.
| a | Inception date of February 14, 2000. |
4
COHEN & STEERS INSTITUTIONAL REALTY SHARES, INC.
Expense Example (Unaudited)
As a shareholder of the Fund, you incur two types of costs: (1) transaction costs and (2) ongoing costs including investment management fees and other Fund expenses. This example is intended to help you understand your ongoing costs (in dollars) of investing in the Fund and to compare these costs with the ongoing costs of investing in other mutual funds.
The example is based on an investment of $1,000 invested at the beginning of the period and held for the entire period January 1, 2019—June 30, 2019.
Actual Expenses
The first line of the following table provides information about actual account values and expenses. You may use the information in this line, together with the amount you invested, to estimate the expenses that you paid over the period. Simply divide your account value by $1,000 (for example, an $8,600 account value divided by $1,000 = 8.6), then multiply the result by the number in the first line under the heading entitled “Expenses Paid During Period” to estimate the expenses you paid on your account during this period.
Hypothetical Example for Comparison Purposes
The second line of the following table provides information about hypothetical account values and hypothetical expenses based on the Fund’s actual expense ratio and an assumed rate of return of 5% per year before expenses, which is not the Fund’s actual return. The hypothetical account values and expenses may not be used to estimate the actual ending account balance or expenses you paid for the period. You may use this information to compare the ongoing cost of investing in the Fund and other funds. To do so, compare this 5% hypothetical example with the 5% hypothetical examples that appear in the shareholder reports of other funds.
Please note that the expenses shown in the table are meant to highlight your ongoing costs only and do not reflect any transaction costs. Therefore, the second line of the table is useful in comparing ongoing costs only, and will not help you determine the relative total costs of owning different funds. In addition, if these transactional costs were included, your costs would have been higher.
| | | | | | | | | | | | |
| | | Beginning
Account Value
January 1, 2019 | | | Ending
Account Value
June 30, 2019 | | | Expenses Paid
During Perioda
January 1, 2019—
June 30, 2019 | |
Actual (21.20% return) | | $ | 1,000.00 | | | $ | 1,212.00 | | | $ | 4.11 | |
Hypothetical (5% annual return before expenses) | | $ | 1,000.00 | | | $ | 1,021.08 | | | $ | 3.76 | |
| a | Expenses are equal to the Fund’s annualized net expense ratio of 0.75% multiplied by the average account value over the period, multiplied by 181/365 (to reflect theone-half year period). |
5
COHEN & STEERS INSTITUTIONAL REALTY SHARES, INC.
June 30, 2019
Top Ten Holdings
(Unaudited)
| | | | | | | | |
Security | | Value | | | % of
Net
Assets | |
| | |
American Tower Corp. | | $ | 252,063,543 | | | | 7.6 | |
Equinix, Inc. | | | 239,265,938 | | | | 7.2 | |
Welltower, Inc. | | | 211,038,040 | | | | 6.4 | |
UDR, Inc. | | | 190,167,731 | | | | 5.7 | |
SBA Communications Corp. | | | 183,538,241 | | | | 5.5 | |
Prologis, Inc. | | | 174,243,132 | | | | 5.3 | |
Public Storage | | | 171,944,688 | | | | 5.2 | |
Essex Property Trust, Inc. | | | 155,933,826 | | | | 4.7 | |
Extra Space Storage, Inc. | | | 147,526,639 | | | | 4.4 | |
VICI Properties, Inc. | | | 128,839,735 | | | | 3.9 | |
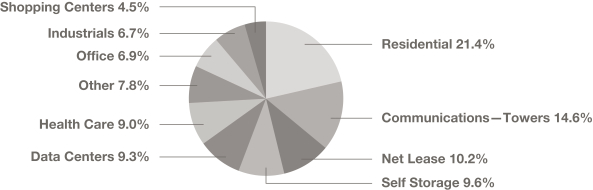
Sector Breakdown
(Based on Net Assets)
(Unaudited)
6
COHEN & STEERS INSTITUTIONAL REALTY SHARES, INC.
SCHEDULE OF INVESTMENTS
June 30, 2019 (Unaudited)
| | | | | | | | | | | | |
| | | | | | Shares | | | Value | |
| | | | | | | | | | | | |
COMMON STOCK | | | 98.8% | | | | | | | | | |
COMMUNICATIONS—TOWERS | | | 14.6% | | | | | | | | | |
American Tower Corp. | | | | 1,232,886 | | | $ | 252,063,543 | |
Crown Castle International Corp. | | | | 377,205 | | | | 49,168,672 | |
SBA Communications Corp.a | | | | 816,306 | | | | 183,538,241 | |
| | | | | | | | | | | | |
| | | | | | | | | | | 484,770,456 | |
| | | | | | | | | | | | |
REAL ESTATE | | | 84.2% | | | | | | | | | |
DATA CENTERS | | | 9.3% | | | | | | | | | |
CyrusOne, Inc. | | | | 1,208,606 | | | | 69,760,738 | |
Equinix, Inc. | | | | 474,461 | | | | 239,265,938 | |
| | | | | | | | | | | | |
| | | | | | | | | | | 309,026,676 | |
| | | | | | | | | | | | |
DIVERSIFIED | | | 1.4% | | | | | | | | | |
CBRE Group, Inc. Class Aa | | | | 881,463 | | | | 45,219,052 | |
| | | | | | | | | | | | |
HEALTH CARE | | | 9.0% | | | | | | | | | |
Sabra Health Care REIT, Inc. | | | | 4,478,649 | | | | 88,184,599 | |
Welltower, Inc. | | | | 2,588,471 | | | | 211,038,040 | |
| | | | | | | | | | | | |
| | | | | | | | | | | 299,222,639 | |
| | | | | | | | | | | | |
HOTEL | | | 3.8% | | | | | | | | | |
Park Hotels & Resorts, Inc. | | | | 2,573,927 | | | | 70,937,428 | |
Pebblebrook Hotel Trust | | | | 1,149,953 | | | | 32,405,676 | |
Red Rock Resorts, Inc. Class A | | | | 976,856 | | | | 20,982,867 | |
| | | | | | | | | | | | |
| | | | | | | | | | | 124,325,971 | |
| | | | | | | | | | | | |
INDUSTRIALS | | | 6.7% | | | | | | | | | |
Americold Realty Trust | | | | 913,942 | | | | 29,630,000 | |
Industrial Logistics Properties Trust | | | | 907,094 | | | | 18,885,697 | |
Prologis, Inc. | | | | 2,175,320 | | | | 174,243,132 | |
| | | | | | | | | | | | |
| | | | | | | | | | | 222,758,829 | |
| | | | | | | | | | | | |
NET LEASE | | | 10.2% | | | | | | | | | |
Agree Realty Corp. | | | | 642,256 | | | | 41,136,497 | |
Gaming and Leisure Properties, Inc. | | | | 555,958 | | | | 21,671,243 | |
Spirit Realty Capital, Inc. | | | | 991,191 | | | | 42,284,208 | |
VEREIT, Inc. | | | | 11,452,245 | | | | 103,184,727 | |
VICI Properties, Inc. | | | | 5,845,723 | | | | 128,839,735 | |
| | | | | | | | | | | | |
| | | | | | | | | | | 337,116,410 | |
| | | | | | | | | | | | |
See accompanying notes to financial statements.
7
COHEN & STEERS INSTITUTIONAL REALTY SHARES, INC.
SCHEDULE OF INVESTMENTS—(Continued)
June 30, 2019 (Unaudited)
| | | | | | | | | | | | |
| | | | | | Shares | | | Value | |
| | | | | | | | | | | | |
OFFICE | | | 6.9% | | | | | | | | | |
Boston Properties, Inc. | | | | 205,966 | | | $ | 26,569,614 | |
Douglas Emmett, Inc. | | | | 1,419,762 | | | | 56,563,318 | |
Hudson Pacific Properties, Inc. | | | | 2,408,254 | | | | 80,122,610 | |
Kilroy Realty Corp. | | | | 897,143 | | | | 66,218,125 | |
| | | | | | | | | | | | |
| | | | | | | | | | | 229,473,667 | |
| | | | | | | | | | | | |
RESIDENTIAL | | | 21.4% | | | | | | | | | |
APARTMENT | | | 12.8% | | | | | | | | | |
Apartment Investment & Management Co., Class A | | | | 629,979 | | | | 31,574,547 | |
Equity Residential | | | | 638,942 | | | | 48,508,477 | |
Essex Property Trust, Inc. | | | | 534,148 | | | | 155,933,826 | |
UDR, Inc. | | | | 4,236,305 | | | | 190,167,731 | |
| | | | | | | | | | | | |
| | | | | | | | | | | 426,184,581 | |
| | | | | | | | | | | | |
MANUFACTURED HOME | | | 3.5% | | | | | | | | | |
Equity LifeStyle Properties, Inc. | | | | 210,139 | | | | 25,498,266 | |
Sun Communities, Inc. | | | | 703,774 | | | | 90,216,789 | |
| | | | | | | | | | | | |
| | | | | | | | | | | 115,715,055 | |
| | | | | | | | | | | | |
SINGLE FAMILY | | | 5.1% | | | | | | | | | |
American Homes 4 Rent, Class A | | | | 2,371,319 | | | | 57,646,765 | |
Invitation Homes, Inc. | | | | 4,140,865 | | | | 110,685,322 | |
| | | | | | | | | | | | |
| | | | | | | | | | | 168,332,087 | |
| | | | | | | | | | | | |
TOTAL RESIDENTIAL | | | | | | | | 710,231,723 | |
| | | | | | | | | | | | |
SELF STORAGE | | | 9.6% | | | | | | | | | |
Extra Space Storage, Inc. | | | | 1,390,449 | | | | 147,526,639 | |
Public Storage | | | | 721,941 | | | | 171,944,688 | |
| | | | | | | | | | | | |
| | | | | | | | | | | 319,471,327 | |
| | | | | | | | | | | | |
SHOPPING CENTERS | | | 4.5% | | | | | | | | | |
COMMUNITY CENTER | | | 2.4% | | | | | | | | | |
SITE Centers Corp. | | | | 2,947,551 | | | | 39,025,575 | |
Urban Edge Properties | | | | 2,327,521 | | | | 40,335,939 | |
Weingarten Realty Investors | | | | 19,729 | | | | 540,969 | |
| | | | | | | | | | | | |
| | | | | | | | | | | 79,902,483 | |
| | | | | | | | | | | | |
See accompanying notes to financial statements.
8
COHEN & STEERS INSTITUTIONAL REALTY SHARES, INC.
SCHEDULE OF INVESTMENTS—(Continued)
June 30, 2019 (Unaudited)
| | | | | | | | | | | | |
| | | | | | Shares | | | Value | |
| | | | | | | | | | | | |
REGIONAL MALL | | | 2.1% | | | | | | | | | |
Macerich Co. (The) | | | | 1,339,853 | | | $ | 44,871,677 | |
Taubman Centers, Inc. | | | | 587,690 | | | | 23,995,383 | |
| | | | | | | | | | | | |
| | | | | | | | | | | 68,867,060 | |
| | | | | | | | | | | | |
TOTAL SHOPPING CENTERS | | | | | | | | 148,769,543 | |
| | | | | | | | | | | | |
SPECIALTY | | | 1.4% | | | | | | | | | |
Iron Mountain, Inc. | | | | 1,205,296 | | | | 37,725,765 | |
Lamar Advertising Co., Class A | | | | 94,773 | | | | 7,649,129 | |
| | | | | | | | | | | | |
| | | | | | | | | | | 45,374,894 | |
| | | | | | | | | | | | |
TOTAL REAL ESTATE | | | | | | | | 2,790,990,731 | |
| | | | | | | | | |
TOTAL COMMON STOCK
(Identified cost—$2,682,310,621) | | | | | | | | 3,275,761,187 | |
| | | | | | | | | | | | |
SHORT-TERM INVESTMENTS | | | 0.9% | | | | | | | | | |
MONEY MARKET FUNDS | | | | | | | | | | | | |
State Street Institutional Treasury Money Market Fund, Premier Class, 2.17%b | | | | 30,321,452 | | | | 30,321,452 | |
| | | | | | | | | | | | |
TOTAL SHORT-TERM INVESTMENTS
(Identified cost—$30,321,452) | | | | | | | | 30,321,452 | |
| | | | | | | | | | | | |
TOTAL INVESTMENTSIN SECURITIES
(Identified cost—$2,712,632,073) | | | 99.7% | | | | | | | | 3,306,082,639 | |
WRITTEN OPTION CONTRACTS | | | (0.0) | | | | | | | | (429,437 | ) |
OTHER ASSETSIN EXCESSOF LIABILITIES | | | 0.3 | | | | | | | | 11,004,662 | |
| | | | | | | | | | | | |
NET ASSETS (Equivalent to $44.92 per share based on 73,839,901 shares of common stock outstanding) | | | 100.0% | | | | | | | $ | 3,316,657,864 | |
| | | | | | | | | | | | |
See accompanying notes to financial statements.
9
COHEN & STEERS INSTITUTIONAL REALTY SHARES, INC.
SCHEDULE OF INVESTMENTS—(Continued)
June 30, 2019 (Unaudited)
Over-the-Counter Option Contracts
Written Options
| | | | | | | | | | | | | | | | | | | | | | | | | | |
| | | | | | | | |
| Description | | Counterparty | | Exercise
Price | | | Expiration
Date | | | Number of
Contracts | | | Notional
Amountc | | | Premiums
Received | | | Value | |
Call—American Tower Corp. | | Goldman Sachs International | | | $207.00 | | | | 7/19/19 | | | | (1,565 | ) | | | $(31,996,425 | ) | | | $(394,380 | ) | | | $(429,437 | ) |
| | | | | | | | | | | | | | | | | | | | | | | | | | |
Glossary of Portfolio Abbreviations
| | |
REIT | | Real Estate Investment Trust |
Note: Percentages indicated are based on the net assets of the Fund.
| a | Non-income producing security. |
| b | Rate quoted represents the annualizedseven-day yield. |
| c | Amount represents number of contracts multiplied by notional contract size multiplied by the underlying price. |
See accompanying notes to financial statements.
10
COHEN & STEERS INSTITUTIONAL REALTY SHARES, INC.
STATEMENT OF ASSETS AND LIABILITIES
June 30, 2019 (Unaudited)
| | | | |
ASSETS: | |
Investments in securities, at value (Identified cost—$2,712,632,073) | | $ | 3,306,082,639 | |
Cash collateral pledged forover-the-counter option contracts | | | 540,000 | |
Receivable for: | | | | |
Investment securities sold | | | 30,742,562 | |
Dividends | | | 12,375,046 | |
Fund shares sold | | | 6,900,133 | |
Other assets | | | 12,228 | |
| | | | |
Total Assets | | | 3,356,652,608 | |
| | | | |
LIABILITIES: | |
Written option contracts, at value (Premiums received—$394,380) | | | 429,437 | |
Payable for: | | | | |
Dividends and distributions declared | | | 19,491,730 | |
Fund shares redeemed | | | 14,578,492 | |
Investment securities purchased | | | 3,426,449 | |
Investment management fees | | | 2,065,796 | |
Directors’ fees | | | 1,263 | |
Other liabilities | | | 1,577 | |
| | | | |
Total Liabilities | | | 39,994,744 | |
| | | | |
NET ASSETS applicable to 73,839,901 shares of $0.001 par value of common stock outstanding | | $ | 3,316,657,864 | |
| | | | |
NET ASSET VALUE PER SHARE: | |
($3,316,657,864 ÷ 73,839,901 shares outstanding) | | $ | 44.92 | |
| | | | |
NET ASSETS consist of: | |
Paid-in capital | | $ | 2,714,110,442 | |
Total distributable earnings/(accumulated loss) | | | 602,547,422 | |
| | | | |
| | $ | 3,316,657,864 | |
| | | | |
See accompanying notes to financial statements.
11
COHEN & STEERS INSTITUTIONAL REALTY SHARES, INC.
STATEMENT OF OPERATIONS
For the Six Months Ended June 30, 2019 (Unaudited)
| | | | |
Investment Income: | |
Dividend income | | $ | 40,863,217 | |
| | | | |
Expenses: | |
Investment management fees | | | 11,774,121 | |
Directors’ fees and expenses | | | 75,371 | |
Registration and filing fees | | | 56,218 | |
Miscellaneous | | | 11,848 | |
| | | | |
Total Expenses | | | 11,917,558 | |
Reduction of Expenses (See Note 2) | | | (143,618 | ) |
| | | | |
Net Expenses | | | 11,773,940 | |
| | | | |
Net Investment Income (Loss) | | | 29,089,277 | |
| | | | |
Net Realized and Unrealized Gain (Loss): | |
Net realized gain (loss) on: | |
Investments in securities | | | 127,478,295 | |
Written option contracts | | | 287,049 | |
| | | | |
Net realized gain (loss) | | | 127,765,344 | |
| | | | |
Net change in unrealized appreciation (depreciation) on: | |
Investments in securities | | | 421,859,174 | |
Written option contracts | | | (35,057 | ) |
| | | | |
Net change in unrealized appreciation (depreciation) | | | 421,824,117 | |
| | | | |
Net Realized and Unrealized Gain (Loss) | | | 549,589,461 | |
| | | | |
Net Increase (Decrease) in Net Assets Resulting from Operations | | $ | 578,678,738 | |
| | | | |
See accompanying notes to financial statements.
12
COHEN & STEERS INSTITUTIONAL REALTY SHARES, INC.
STATEMENT OF CHANGES IN NET ASSETS (Unaudited)
| | | | | | | | |
| | | For the
Six Months Ended
June 30, 2019 | | | For the
Year Ended
December 31, 2018 | |
Change in Net Assets: | |
From Operations: | |
Net investment income (loss) | | $ | 29,089,277 | | | $ | 61,819,561 | |
Net realized gain (loss) | | | 127,765,344 | | | | 138,104,769 | |
Net change in unrealized appreciation (depreciation) | | | 421,824,117 | | | | (312,240,365 | ) |
| | | | | | | | |
Net increase (decrease) in net assets resulting from operations | | | 578,678,738 | | | | (112,316,035 | ) |
| | | | | | | | |
Distributions to Shareholders | | | (187,047,528 | ) | | | (166,537,254 | ) |
| | | | | | | | |
Capital Stock Transactions: | |
Increase (decrease) in net assets from Fund share transactions | | | 265,428,459 | | | | 150,538,693 | |
| | | | | | | | |
Total increase (decrease) in net assets | | | 657,059,669 | | | | (128,314,596 | ) |
Net Assets: | |
Beginning of period | | | 2,659,598,195 | | | | 2,787,912,791 | |
| | | | | | | | |
End of period | | $ | 3,316,657,864 | | | $ | 2,659,598,195 | |
| | | | | | | | |
See accompanying notes to financial statements.
13
COHEN & STEERS INSTITUTIONAL REALTY SHARES, INC.
FINANCIAL HIGHLIGHTS (Unaudited)
The following table includes selected data for a share outstanding throughout each period and other performance information derived from the financial statements. It should be read in conjunction with the financial statements and notes thereto.
| | | | | | | | | | | | | | | | | | | | | | | | |
| | | For the
Six Months Ended
June 30, 2019 | | | For the Year Ended December 31, | |
Per Share Operating Performance: | | 2018 | | | 2017 | | | 2016 | | | 2015 | | | 2014 | |
Net asset value, beginning of period | | | $39.25 | | | | $43.32 | | | | $43.18 | | | | $45.93 | | | | $50.06 | | | | $40.77 | |
| | | | | | | | | | | | | | | | | | | | | | | | |
Income (loss) from investment operations: | | | | | | | | | | | | | | | | | | | | | | | | |
| | | | | | |
Net investment income (loss)a | | | 0.41 | | | | 0.93 | | | | 0.79 | | | | 0.83 | | | | 0.72 | b | | | 0.72 | b |
Net realized and unrealized gain (loss) | | | 7.90 | | | | (2.51 | )c | | | 2.37 | | | | 1.87 | | | | 1.41 | | | | 11.44 | |
| | | | | | | | | | | | | | | | | | | | | | | | |
Total from investment operations | | | 8.31 | | | | (1.58 | ) | | | 3.16 | | | | 2.70 | | | | 2.13 | | | | 12.16 | |
| | | | | | | | | | | | | | | | | | | | | | | | |
Less dividends and distributions to shareholders from: | | | | | | | | | | | | | | | | | | | | | | | | |
| | | | | | |
Net investment income | | | (0.66 | ) | | | (0.75 | ) | | | (0.86 | ) | | | (0.82 | ) | | | (0.68 | ) | | | (0.70 | ) |
Net realized gain | | | (1.98 | ) | | | (1.74 | ) | | | (2.16 | ) | | | (4.63 | ) | | | (5.58 | ) | | | (2.17 | ) |
| | | | | | | | | | | | | | | | | | | | | | | | |
Total dividends and distributions to shareholders | | | (2.64 | ) | | | (2.49 | ) | | | (3.02 | ) | | | (5.45 | ) | | | (6.26 | ) | | | (2.87 | ) |
| | | | | | | | | | | | | | | | | | | | | | | | |
Net increase (decrease) in net asset value | | | 5.67 | | | | (4.07 | ) | | | 0.14 | | | | (2.75 | ) | | | (4.13 | ) | | | 9.29 | |
| | | | | | | | | | | | | | | | | | | | | | | | |
Net asset value, end of period | | | $44.92 | | | | $39.25 | | | | $43.32 | | | | $43.18 | | | | $45.93 | | | | $50.06 | |
| | | | | | | | | | | | | | | | | | | | | | | | |
| | | | | | |
| | | | | | | | | | | | | | | | | | | | | | | | | |
| |
Total returnd | | | 21.20 | %e | | | –4.01 | %c | | | 7.47 | % | | | 5.91 | % | | | 5.23 | % | | | 30.18 | % |
| | | | | | | | | | | | | | | | | | | | | | | | |
|
| | |
See accompanying notes to financial statements.
14
COHEN & STEERS INSTITUTIONAL REALTY SHARES, INC.
FINANCIAL HIGHLIGHTS (Unaudited)—(Continued)
| | | | | | | | | | | | | | | | | | | | | | | | |
| | | For the
Six Months Ended
June 30, 2019 | | | For the Year Ended December 31, | |
Ratios/Supplemental Data: | | 2018 | | | 2017 | | | 2016 | | | 2015 | | | 2014 | |
Net assets, end of period (in millions) | | | $3,316.7 | | | | $2,659.6 | | | | $2,787.9 | | | | $2,740.8 | | | | $2,931.5 | | | | $3,095.5 | |
| | | | | | | | | | | | | | | | | | | | | | | | |
Ratios to average daily net assets: | | | | | | | | | | | | | | | | | | | | | | | | |
| | | | | | |
Expenses (before expense reduction) | | | 0.76 | %f | | | 0.78 | %c | | | 0.77 | % | | | 0.76 | % | | | 0.76 | % | | | 0.76 | % |
| | | | | | | | | | | | | | | | | | | | | | | | |
Expenses (net of expense reduction) | | | 0.75 | %f | | | 0.77 | %c | | | 0.75 | % | | | 0.75 | % | | | 0.75 | % | | | 0.75 | % |
| | | | | | | | | | | | | | | | | | | | | | | | |
Net investment income (loss) (before expense reduction) | | | 1.84 | %f | | | 2.22 | % | | | 1.77 | % | | | 1.77 | % | | | 1.46 | % | | | 1.54 | % |
| | | | | | | | | | | | | | | | | | | | | | | | |
Net investment income (loss) (net of expense reduction) | | | 1.85 | %f | | | 2.23 | % | | | 1.79 | % | | | 1.78 | % | | | 1.47 | % | | | 1.55 | % |
| | | | | | | | | | | | | | | | | | | | | | | | |
Portfolio turnover rate | | | 43 | %e | | | 68 | % | | | 76 | % | | | 79 | % | | | 60 | % | | | 54 | % |
| | | | | | | | | | | | | | | | | | | | | | | | |
| a | Calculation based on average shares outstanding. |
| b | 13.2% and 13.4% of gross income was attributable to dividends paid by Simon Property Group for the years ended December 31, 2015 and December 31, 2014, respectively. |
| c | During the reporting period the Fund settled legal claims against two issuers of securities previously held by the Fund. As a result, the net realized and unrealized gain (loss) on investments per share includes proceeds received from the settlements. Without these proceeds the net realized and unrealized gain (loss) on investments per share would have been $(2.56). Additionally, the expense ratio includes extraordinary expenses related to the direct action. Without these expenses, the ratio of expenses to average daily net assets (before expense reduction and net of expense reduction) would have been 0.76% and 0.75%, respectively. Excluding the proceeds from and expenses relating to the settlements, the total return would have been-4.12%. |
| d | Return assumes the reinvestment of all dividends and distributions at net asset value. |
See accompanying notes to financial statements.
15
COHEN & STEERS INSTITUTIONAL REALTY SHARES, INC.
NOTES TO FINANCIAL STATEMENTS (Unaudited)
Note 1. Organization and Significant Accounting Policies
Cohen & Steers Institutional Realty Shares, Inc. (the Fund) was incorporated under the laws of the State of Maryland on October 13, 1999 and is registered under the Investment Company Act of 1940 (the 1940 Act) as anon-diversified,open-end management investment company. The Fund’s investment objective is total return.
The following is a summary of significant accounting policies consistently followed by the Fund in the preparation of its financial statements. The Fund is an investment company and, accordingly, follows the investment company accounting and reporting guidance of the Financial Accounting Standards Board Accounting Standards Codification (ASC) Topic 946—Investment Companies. The accounting policies of the Fund are in conformity with accounting principles generally accepted in the United States of America (GAAP). The preparation of the financial statements in accordance with GAAP requires management to make estimates and assumptions that affect the reported amounts of assets and liabilities at the date of the financial statements and the reported amounts of income and expenses during the reporting period. Actual results could differ from those estimates.
Portfolio Valuation:Investments in securities that are listed on the New York Stock Exchange (NYSE) are valued, except as indicated below, at the last sale price reflected at the close of the NYSE on the business day as of which such value is being determined. If there has been no sale on such day, the securities are valued at the mean of the closing bid and ask prices on such day or, if no ask price is available, at the bid price. Exchange-traded options are valued at their last sale price as of the close of options trading on applicable exchanges on the valuation date. In the absence of a last sale price on such day, options are valued at the average of the quoted bid and ask prices as of the close of business.Over-the-counter (OTC) options are valued based upon prices provided by a third-party pricing service or counterparty.
Securities not listed on the NYSE but listed on other domestic or foreign securities exchanges (including NASDAQ) are valued in a similar manner. Securities traded on more than one securities exchange are valued at the last sale price reflected at the close of the exchange representing the principal market for such securities on the business day as of which such value is being determined.
Readily marketable securities traded in the OTC market, including listed securities whose primary market is believed by Cohen & Steers Capital Management, Inc. (the investment manager) to be OTC, are valued on the basis of prices provided by a third-party pricing service or third-party broker-dealers when such prices are believed by the investment manager, pursuant to delegation by the Board of Directors, to reflect the fair value of such securities.
Short-term debt securities with a maturity date of 60 days or less are valued at amortized cost, which approximates fair value. Investments inopen-end mutual funds are valued at net asset value (NAV).
16
COHEN & STEERS INSTITUTIONAL REALTY SHARES, INC.
NOTES TO FINANCIAL STATEMENTS (Unaudited)—(Continued)
The policies and procedures approved by the Fund’s Board of Directors delegate authority to make fair value determinations to the investment manager, subject to the oversight of the Board of Directors. The investment manager has established a valuation committee (Valuation Committee) to administer, implement and oversee the fair valuation process according to the policies and procedures approved annually by the Board of Directors. Among other things, these procedures allow the Fund to utilize independent pricing services, quotations from securities and financial instrument dealers and other market sources to determine fair value.
Securities for which market prices are unavailable, or securities for which the investment manager determines that the bid and/or ask price or a counterparty valuation does not reflect market value, will be valued at fair value, as determined in good faith by the Valuation Committee, pursuant to procedures approved by the Fund’s Board of Directors. Circumstances in which market prices may be unavailable include, but are not limited to, when trading in a security is suspended, the exchange on which the security is traded is subject to an unscheduled close or disruption or material events occur after the close of the exchange on which the security is principally traded. In these circumstances, the Fund determines fair value in a manner that fairly reflects the market value of the security on the valuation date based on consideration of any information or factors it deems appropriate. These may include, but are not limited to, recent transactions in comparable securities, information relating to the specific security and developments in the markets.
The Fund’s use of fair value pricing may cause the NAV of Fund shares to differ from the NAV that would be calculated using market quotations. Fair value pricing involves subjective judgments and it is possible that the fair value determined for a security may be materially different than the value that could be realized upon the sale of that security.
Fair value is defined as the price that the Fund would expect to receive upon the sale of an investment or expect to pay to transfer a liability in an orderly transaction with an independent buyer in the principal market or, in the absence of a principal market, the most advantageous market for the investment or liability. The hierarchy of inputs that are used in determining the fair value of the Fund’s investments is summarized below.
| | • | | Level 1—quoted prices in active markets for identical investments |
| | • | | Level 2—other significant observable inputs (including quoted prices for similar investments, interest rates, credit risk, etc.) |
| | • | | Level 3—significant unobservable inputs (including the Fund’s own assumptions in determining the fair value of investments) |
The inputs or methodology used for valuing investments may or may not be an indication of the risk associated with those investments. Changes in valuation techniques may result in transfers into or out of an assigned level within the disclosure hierarchy.
17
COHEN & STEERS INSTITUTIONAL REALTY SHARES, INC.
NOTES TO FINANCIAL STATEMENTS (Unaudited)—(Continued)
The following is a summary of the inputs used as of June 30, 2019 in valuing the Fund’s investments carried at value:
| | | | | | | | | | | | | | | | |
| | | Total | | | Quoted Prices
in Active
Markets for
Identical
Investments
(Level 1) | | | Other
Significant
Observable
Inputs
(Level 2) | | | Significant
Unobservable
Inputs
(Level 3) | |
Common Stock | | $ | 3,275,761,187 | | | $ | 3,275,761,187 | | | $ | — | | | $ | — | |
Short-Term Investments | | | 30,321,452 | | | | — | | | | 30,321,452 | | | | — | |
| | | | | | | | | | | | | | | | |
Total Investments in Securitiesa | | $ | 3,306,082,639 | | | $ | 3,275,761,187 | | | $ | 30,321,452 | | | $ | — | |
| | | | | | | | | | | | | | | | |
Written Option Contracts | | $ | (429,437 | ) | | $ | — | | | $ | (429,437 | ) | | $ | — | |
| | | | | | | | | | | | | | | | |
Total Derivative Liabilitiesa | | $ | (429,437 | ) | | $ | — | | | $ | (429,437 | ) | | $ | — | |
| | | | | | | | | | | | | | | | |
| a | Portfolio holdings are disclosed individually on the Schedule of Investments. |
Security Transactions and Investment Income:Security transactions are recorded on trade date. Realized gains and losses on investments sold are recorded on the basis of identified cost. Interest income, which includes the amortization of premiums and accretion of discounts, is recorded on the accrual basis. Dividend income is recorded on theex-dividend date. Distributions from REITs are recorded as ordinary income, net realized capital gain or return of capital based on information reported by the REITs and management’s estimates of such amounts based on historical information. These estimates are adjusted when the actual source of distributions is disclosed by the REITs and actual amounts may differ from the estimated amounts.
Options:The Fund may purchase and write exchange-listed and OTC put or call options on securities, stock indices and other financial instruments for hedging purposes, to enhance portfolio returns and/or reduce overall volatility.
When the Fund writes (sells) an option, an amount equal to the premium received by the Fund is recorded on the Statement of Assets and Liabilities as a liability. The amount of the liability is subsequentlymarked-to-market to reflect the current market value of the option written. When an option expires, the Fund realizes a gain on the option to the extent of the premium received. Premiums received from writing options which are exercised or closed are added to or offset against the proceeds or amount paid on the transaction to determine the realized gain or loss. If a put option on a security is exercised, the premium reduces the cost basis of the security purchased by the Fund. If a call option is exercised, the premium is added to the proceeds of the security sold to determine the realized gain or loss. The Fund, as writer of an option, bears the market risk of an unfavorable change in the price of the underlying investment. Other risks include the possibility of an illiquid options market or the inability of the counterparties to fulfill their obligations under the contracts.
18
COHEN & STEERS INSTITUTIONAL REALTY SHARES, INC.
NOTES TO FINANCIAL STATEMENTS (Unaudited)—(Continued)
Put and call options purchased are accounted for in the same manner as portfolio securities. Premiums paid for purchasing options which expire are treated as realized losses. Premiums paid for purchasing options which are exercised or closed are added to the amounts paid or offset against the proceeds on the underlying investment transaction to determine the realized gain or loss when the underlying transaction is executed. The risk associated with purchasing an option is that the Fund pays a premium whether or not the option is exercised. Additionally, the Fund bears the risk of loss of the premium and change in market value should the counterparty not perform under the contract.
Dividends and Distributions to Shareholders:Dividends from net investment income and capital gain distributions are determined in accordance with U.S. federal income tax regulations, which may differ from GAAP. Dividends from net investment income, if any, are declared and paid quarterly. Net realized capital gains, unless offset by any available capital loss carryforward, are typically distributed to shareholders at least annually. Dividends and distributions to shareholders are recorded on theex-dividend date and are automatically reinvested in full and fractional shares of the Fund based on the NAV per share at the close of business on the payable date, unless the shareholder has elected to have them paid in cash.
Dividends from net investment income are subject to recharacterization for tax purposes. Based upon the results of operations for the six months ended June 30, 2019, the investment advisor considers it likely that a portion of the dividends will be reclassified to distributions from net realized gain and/or return of capital upon the final determination of the Fund’s taxable income after December 31, 2019, the Fund’s fiscal year end.
Income Taxes:It is the policy of the Fund to continue to qualify as a regulated investment company (RIC), if such qualification is in the best interest of the shareholders, by complying with the requirements of Subchapter M of the Internal Revenue Code applicable to RICs, and by distributing substantially all of its taxable earnings to its shareholders. Also, in order to avoid the payment of any federal excise taxes, the Fund will distribute substantially all of its net investment income and net realized gains on a calendar year basis. Accordingly, no provision for federal income or excise tax is necessary. Management has analyzed the Fund’s tax positions taken on federal and applicable state income tax returns as well as its tax positions innon-U.S. jurisdictions in which it trades for all open tax years and has concluded that as of June 30, 2019, no additional provisions for income tax are required in the Fund’s financial statements. The Fund’s tax positions for the tax years for which the applicable statutes of limitations have not expired are subject to examination by the Internal Revenue Service, state departments of revenue and by foreign tax authorities.
Note 2. Investment Management Fees and Other Transactions with Affiliates
Investment Management Fees:Cohen & Steers Capital Management, Inc. serves as the Fund’s investment manager pursuant to an investment management agreement (the investment management agreement). Under the terms of the investment management agreement, the investment manager provides the Fund withday-to-day investment decisions and generally manages the Fund’s investments in accordance with the stated policies of the Fund, subject to the supervision of the Board of Directors.
For the services provided to the Fund, the investment manager receives a fee, accrued daily and paid monthly, at the annual rate of 0.75% of the average daily net assets of the Fund.
19
COHEN & STEERS INSTITUTIONAL REALTY SHARES, INC.
NOTES TO FINANCIAL STATEMENTS (Unaudited)—(Continued)
The investment manager is also responsible, under the investment management agreement, for the performance of certain administrative functions for the Fund. Additionally, the investment manager pays certain expenses of the Fund, including, but not limited to, administrative and custody fees, transfer agent fees, professional fees, and reports to shareholders.
The investment manager has contractually agreed to waive its fee and/or reimburse the Fund so that the Fund’s total annual operating expenses (excluding brokerage fees and commissions, taxes, and, upon approval of the Board of Directors, extraordinary expenses) never exceed 0.75% of the average daily net assets of the Fund. This commitment is currently expected to remain in place for the life of the Fund, can only be amended or terminated by agreement of the Fund’s Board of Directors and the investment manager and will terminate automatically in the event of termination of the investment management agreement between the investment manager and the Fund. For the six months ended June 30, 2019, fees waived and/or expenses reimbursed totaled $143,618.
Directors’ and Officers’ Fees:Certain directors and officers of the Fund are also directors, officers, and/or employees of the investment manager. The Fund does not pay compensation to directors and officers affiliated with the investment manager.
Other:As of June 30, 2019, approximately 18% of the Fund’s outstanding shares were owned by shareholders investing either directly or indirectly through an account, platform or program sponsored by one financial institution. Investment and asset allocation decisions by either a direct shareholder or financial institution regarding the account, platform or program through which multiple shareholders invest may result in subscription and redemption decisions that have a significant impact on the assets, expenses and trading activities of the Fund. Such a decision may cause the Fund to sell assets at disadvantageous times or prices, and may negatively affect the Fund’s NAV and performance.
Note 3. Purchases and Sales of Securities
Purchases and sales of securities, excluding short-term investments, for the six months ended June 30, 2019, totaled $1,418,035,444 and $1,325,160,776, respectively.
Note 4. Derivative Investments
The following tables present the value of derivatives held at June 30, 2019 and the effect of derivatives held during the six months ended June 30, 2019, along with the respective location in the financial statements.
Statement of Assets and Liabilities
| | | | | | | | | | | | |
| | | Assets | | | Liabilities | |
Derivatives | | Location | | Fair Value | | | Location | | Fair Value | |
Equity Risk: | | | | | | | | | | | | |
Written Option Contracts—
Over-the-Counter | | — | | $ | — | | | Written option contracts | | $ | 429,437 | |
20
COHEN & STEERS INSTITUTIONAL REALTY SHARES, INC.
NOTES TO FINANCIAL STATEMENTS (Unaudited)—(Continued)
Statement of Operations
| | | | | | | | | | |
Derivatives | | Location | | Realized
Gain (Loss) | | | Change in
Unrealized
Appreciation
(Depreciation) | |
Equity Risk: | | | | | | | | | | |
Purchased Option Contractsa—
Over-the-Counter | | Net Realized and Unrealized Gain (Loss) | | $ | (438,977 | ) | | $ | — | |
Written Option Contracts—
Over-the-Counter | | Net Realized and Unrealized Gain (Loss) | | | 287,049 | | | | (35,057 | ) |
| a | Purchased options are included in net realized gain (loss) and change in unrealized appreciation (depreciation) on investments in securities. |
At June 30, 2019, the Fund’s derivative assets and liabilities (by type), which are subject to a master netting agreement, are as follows:
| | | | | | | | |
Derivative Financial Instruments | | Assets | | | Liabilities | |
Equity Risk: | | | | | | | | |
Written OptionContracts—Over-the-Counter | | $ | — | | | $ | 429,437 | |
The following table presents the Fund’s derivative liabilities by counterparty net of amounts available for offset under a master netting agreement and net of the related collateral pledged by the Fund, if any, as of June 30, 2019:
| | | | | | | | | | | | | | | | |
Counterparty | | Gross Amount
of Liabilities
Presented
in the Statement
of Assets and
Liabilities | | | Financial
Instruments
and Derivatives
Available
for Offset | | | Collateral
Pledgeda | | | Net Amount
of Derivative
Liabilitiesb | |
Goldman Sachs International | | $ | 429,437 | | | $ | — | | | $ | 429,437 | | | $ | — | |
| a | Collateral received or pledged is limited to the net derivative asset or net derivative liability amounts. Actual collateral amounts received or pledged may be higher than amounts above. |
| b | Net amount represents the net payable due to the counterparty in the event of default. |
21
COHEN & STEERS INSTITUTIONAL REALTY SHARES, INC.
NOTES TO FINANCIAL STATEMENTS (Unaudited)—(Continued)
The following summarizes the volume of the Fund’s option contracts activity for the six months ended June 30, 2019:
| | | | | | | | |
| | | Purchased Option
Contracts | | | Written Option
Contracts | |
Average Notional Amounta,b | | $ | 41,106,716 | | | $ | 44,361,703 | |
| a | Average notional amounts represent the average for all months in which the Fund had option contracts outstanding at month end. For the period, this represents one month for purchased options and four months for written options. |
| b | Notional amount is calculated using the number of contracts multiplied by notional contract size multiplied by the underlying price. |
Note 5. Income Tax Information
As of June 30, 2019, the federal tax cost and net unrealized appreciation (depreciation) in value of investments held were as follows:
| | | | |
Cost of investments in securities for federal income tax purposes | | $ | 2,712,632,073 | |
| | | | |
Gross unrealized appreciation on investments | | $ | 643,198,680 | |
Gross unrealized depreciation on investments | | | (49,783,171 | ) |
| | | | |
Net unrealized appreciation (depreciation) on investments | | $ | 593,415,509 | |
| | | | |
Note 6. Capital Stock
The Fund is authorized to issue 100 million shares of capital stock, at a par value of $0.001 per share. The Fund’s Board of Directors may increase or decrease the aggregate number of shares of common stock that the Fund has authority to issue. Transactions in Fund shares were as follows:
| | | | | | | | | | | | | | | | |
| | | For the
Six Months Ended
June 30, 2019 | | | For the
Year Ended
December 31, 2018 | |
| | | Shares | | | Amount | | | Shares | | | Amount | |
Sold | | | 9,360,803 | | | $ | 418,139,256 | | | | 19,074,565 | | | $ | 797,341,690 | |
Issued as reinvestment of dividends and distributions | | | 3,639,156 | | | | 163,803,383 | | | | 3,354,846 | | | | 143,310,382 | |
Redeemed | | | (6,924,270 | ) | | | (316,514,180 | ) | | | (19,028,484 | ) | | | (790,113,379 | ) |
| | | | | | | | | | | | | | | | |
Net increase (decrease) | | | 6,075,689 | | | $ | 265,428,459 | | | | 3,400,927 | | | $ | 150,538,693 | |
| | | | | | | | | | | | | | | | |
22
COHEN & STEERS INSTITUTIONAL REALTY SHARES, INC.
NOTES TO FINANCIAL STATEMENTS (Unaudited)—(Continued)
Note 7. Other Risks
Common Stock Risk:While common stocks have historically generated higher average returns than fixed-income securities over the long-term, common stocks have also experienced significantly more volatility in those returns, although under certain market conditions, fixed-income investments may have comparable or greater price volatility. The value of common stocks and other equity securities will fluctuate in response to developments concerning the company, political and regulatory circumstances, the stock market, and the economy. In the short term, stock prices can fluctuate dramatically in response to these developments. Different parts of the market and different types of equity securities can react differently to these developments. For example, stocks of large companies can react differently than stocks of smaller companies, and value stocks (stocks of companies that are undervalued by various measures and have potential for long-term capital appreciation), can react differently from growth stocks (stocks of companies with attractive cash flow returns on invested capital and earnings that are expected to grow). These developments can affect a single company, all companies within the same industry, economic sector or geographic region, or the stock market as a whole.
Real Estate Market Risk:Since the Fund concentrates its assets in companies engaged in the real estate industry, an investment in the Fund will be closely linked to the performance of the real estate markets. Risks of investing in real estate securities include falling property values due to increasing vacancies, declining rents resulting from economic, legal, tax, political or technological developments, lack of liquidity, limited diversification, and sensitivity to certain economic factors such as interest-rate changes and market recessions. Real estate company prices also may drop because of the failure of borrowers to pay their loans and poor management, and residential developers, in particular, could be negatively impacted by falling home prices, slower mortgage origination and rising construction costs. The risks of investing in REITs are similar to those associated with direct investments in real estate securities.
REIT Risk:In addition to the risks of securities linked to the real estate industry, REITs are subject to certain other risks related to their structure and focus. REITs are dependent upon management skills and generally may not be diversified. REITs are also subject to heavy cash flow dependency, defaults by borrowers and self-liquidation. In addition, REITs could possibly fail to (i) qualify for pass-through of income under applicable tax law, or (ii) maintain their exemptions from registration under the 1940 Act. The above factors may also adversely affect a borrower’s or a lessee’s ability to meet its obligations to the REIT. In the event of a default by a borrower or lessee, the REIT may experience delays in enforcing its rights as a mortgagee or lessor and may incur substantial costs associated with protecting its investments.
Small- andMedium-Sized Companies Risk:Real estate companies in the industry tend to be small- tomedium-sized companies in relation to the equity markets as a whole. There may be less trading in a smaller company’s stock, which means that buy and sell transactions in that stock could have a larger impact on the stock’s price than is the case with larger company stocks. Smaller companies also may have fewer lines of business so that changes in any one line of business may have a greater impact on a smaller company’s stock price than is the case for a larger company. Further, smaller company stocks may perform differently in different cycles than larger company stocks.
23
COHEN & STEERS INSTITUTIONAL REALTY SHARES, INC.
NOTES TO FINANCIAL STATEMENTS (Unaudited)—(Continued)
Accordingly, real estate company shares can, and at times will, perform differently than large company stocks.
Non-Diversification Risk:As a“non-diversified” investment company, the Fund can invest in fewer individual companies than a diversified investment company. As a result, the Fund is more susceptible to any single political, regulatory or economic occurrence and to the financial condition of individual issuers in which it invests. The Fund’s relative lack of diversity may subject investors to greater risk of loss than a fund that has a diversified portfolio.
Regulatory Risk:The U.S. government has proposed and adopted multiple regulations that could have a long-lasting impact on the Fund and on the mutual fund industry in general. The U.S. Securities and Exchange Commission’s (SEC) final rules and amendments that modernize reporting and disclosure and require the implementation of a Liquidity Risk Management Program, along with other potential upcoming regulations, could, among other things, restrict the Fund’s ability to engage in transactions, impact flows into the Fund and/or increase overall expenses of the Fund. In addition, the SEC, Congress, various exchanges and regulatory and self-regulatory authorities, both domestic and foreign, have undertaken reviews of the use of derivatives by registered investment companies, which could affect the nature and extent of instruments used by the Fund. While the full extent of all of these regulations is still unclear, these regulations and actions may adversely affect both the Fund and the instruments in which the Fund invests and its ability to execute its investment strategy. Similarly, regulatory developments in other countries may have an unpredictable and adverse impact on the Fund.
Large Shareholder Risk:The Fund may have one or more large shareholders or a group of shareholders investing in Fund shares indirectly through an account, platform or program sponsored by a financial institution. Investment and asset allocation decisions by such financial institutions regarding the account, platform or program through which multiple shareholders invest may result in subscription and redemption decisions that have a significant impact on the assets, expenses and trading activities of the Fund. Such a decision may cause the Fund to sell assets (or invest cash) at disadvantageous times or prices, increase or accelerate taxable gains or transaction costs and may negatively affect the Fund’s NAV, performance, or ability to satisfy redemptions in a timely manner.
This is not a complete list of the risks of investing in the Fund. For additional information concerning the risks of investing in the Fund, please consult the Fund’s prospectus.
Note 8. Other
In the normal course of business, the Fund enters into contracts that provide general indemnifications. The Fund’s maximum exposure under these arrangements is dependent on claims that may be made against the Fund in the future and, therefore, cannot be estimated; however, based on experience, the risk of material loss from such claims is considered remote.
Note 9. New Accounting Guidance
In August 2018, the Financial Accounting Standards Board (FASB) issued a new Accounting Standards Update (ASU)No. 2018-13,“Fair Value Measurement (Topic 820), Disclosure Framework
24
COHEN & STEERS INSTITUTIONAL REALTY SHARES, INC.
NOTES TO FINANCIAL STATEMENTS (Unaudited)—(Continued)
Changes to the Disclosure Requirements for Fair Value Measurement”. The amendments to ASU2018-13 are intended to improve the effectiveness of disclosures in the notes to financial statements through modifications to disclosure requirements on fair value measurements. ASU2018-13 is effective for fiscal years, and interim periods within those fiscal years, beginning after December 15, 2019, with early adoption permitted. The Fund has adopted the amended disclosures permissible under the update. The adoption had no effect on the Fund’s net assets or results of operations.
Note 10. Subsequent Events
Management has evaluated events and transactions occurring after June 30, 2019 through the date that the financial statements were issued, and has determined that no additional disclosure in the financial statements is required.
25
COHEN & STEERS INSTITUTIONAL REALTY SHARES, INC.
OTHER INFORMATION
A description of the policies and procedures that the Fund uses to determine how to vote proxies relating to portfolio securities is available (i) without charge, upon request, by calling 800-330-7348, (ii) on our website at cohenandsteers.com or (iii) on the SEC’s website at http://www.sec.gov. In addition, the Fund’s proxy voting record for the most recent 12-month period ended June 30 is available by August 31 of each year (i) without charge, upon request, by calling 800-330-7348 or (ii) on the SEC’s website at http://www.sec.gov.
Disclosures of the Fund’s complete holdings are required to be made monthly onForm N-PORT, with every third month made available to the public by the SEC 60 days after the end of the Fund’s fiscal quarter. Previously, the Fund filed its complete schedule of portfolio holdings with the SEC for the first and third quarters of each fiscal year onForm N-Q, which has now been rescinded. Both the Fund’sForm N-Q and Form N-PORT are available (i) without charge, upon request, by calling 800-330-7348 or (ii) on the SEC’s website at http://www.sec.gov.
Please note that distributions paid by the Fund to shareholders are subject to recharacterization for tax purposes and are taxable up to the amount of the Fund’s investment company taxable income and net realized gains. Distributions in excess of the Fund’s net investment company taxable income and realized gains are a return of capital distributed from the Fund’s assets. The final tax treatment of all distributions is reported to shareholders on their 1099-DIV forms, which are mailed after the close of each calendar year.
Benchmark Change
On December 4, 2018, the Fund’s Board of Directors approved a change to the Fund’s benchmark from the FTSE Nareit Equity REITs Index to the FTSE Nareit All Equity REITs Index, effective after the close of business on March 31, 2019.
APPROVAL OF INVESTMENT MANAGEMENT AGREEMENT
The Board of Directors of the Fund, including a majority of the directors who are not parties to the Fund’s investment management agreement (the Management Agreement), or interested persons of any such party (the Independent Directors), has the responsibility under the Investment Company Act of 1940 to approve the Fund’s Management Agreement for its initial two year term and its continuation annually thereafter at a meeting of the Board of Directors called for the purpose of voting on the approval or continuation. The Management Agreement was discussed at a meeting of the Independent Directors, in their capacity as the Contract Review Committee, held on June 4, 2019 and at meetings of the full Board of Directors held in person on March 19, 2019 and June 11, 2019. At the meeting of the full Board of Directors on June 11, 2019, the Management Agreement was unanimously continued for a term ending June 30, 2020 by the Fund’s Board of Directors, including the Independent Directors. The Independent Directors were represented by independent counsel who assisted them in their deliberations during the meetings and executive sessions.
In considering whether to continue the Management Agreement, the Board of Directors reviewed materials provided by an independent data provider, which included, among other items, fee, expense and performance information compared to peer funds (the Peer Funds) and performance comparisons to a larger category universe; summary information prepared by the Fund’s investment manager (the Investment Manager); and a memorandum from Fund counsel outlining the legal duties of the Board of
26
COHEN & STEERS INSTITUTIONAL REALTY SHARES, INC.
Directors. The Board of Directors also spoke directly with representatives of the independent data provider and met with investment management personnel. In addition, the Board of Directors considered information provided from time to time by the Investment Manager throughout the year at meetings of the Board of Directors, including presentations by portfolio managers relating to the investment performance of the Fund and the investment strategies used in pursuing the Fund’s objective. The Board also considered information provided in response to a request for information submitted by counsel to the Independent Directors, as well as information provided in response to a supplemental request. In particular, the Board of Directors considered the following:
(i) The nature, extent and quality of services to be provided by the Investment Manager:The Board of Directors reviewed the services that the Investment Manager provides to the Fund, including, but not limited to, making theday-to-day investment decisions for the Fund, placing orders for the investment and reinvestment of the Fund’s assets, furnishing information to the Board of Directors of the Fund regarding the Fund’s portfolio, providing individuals to serve as Fund officers, and generally managing the Fund’s investments in accordance with the stated policies of the Fund. The Board of Directors also discussed with officers and portfolio managers of the Fund the types of transactions that were being done on behalf of the Fund. Additionally, the Board of Directors took into account the services provided by the Investment Manager to its other funds and accounts, including those that have investment objectives and strategies similar to those of the Fund. The Board of Directors also considered the education, background and experience of the Investment Manager’s personnel, particularly noting the potential benefit that the portfolio managers’ work experience and favorable reputation can have on the Fund. The Board of Directors further noted the Investment Manager’s ability to attract qualified and experienced personnel. The Board of Directors also considered the administrative services provided by the Investment Manager, including compliance and accounting services. After consideration of the above factors, among others, the Board of Directors concluded that the nature, extent and quality of services provided by the Investment Manager are satisfactory and appropriate.
(ii) Investment performance of the Fund and the Investment Manager:The Board of Directors considered the investment performance of the Fund compared to Peer Funds and compared to a relevant benchmark. The Board of Directors noted that the Fund outperformed the Peer Funds’ medians for theone-, three-, five- andten-year periods ended March 31, 2019, ranking in the first, second, second, and second quintiles, respectively. The Board of Directors noted that the Fund slightly underperformed its benchmark for theone-year period ended March 31, 2019, and outperformed its benchmark for the three-, five- andten-year periods ended March 31, 2019. The Board of Directors engaged in discussions with the Investment Manager regarding the contributors to and detractors from the Fund’s performance during the periods. The Board of Directors also considered supplemental information provided by the Investment Manager, including a narrative summary of various factors affecting performance and the Investment Manager’s performance in managing other real estate funds. The Board of Directors determined that Fund performance, in light of all the considerations noted above, supported the continuation of the Management Agreement.
(iii) Cost of the services to be provided and profits to be realized by the Investment Manager from the relationship with the Fund:The Board of Directors considered the management fee paid by the Fund as well as the Fund’s total expense ratio. As part of its analysis, the Board of Directors gave consideration to the fee and expense analyses provided by the independent data provider. The Board of Directors noted that the Fund’s total expense ratio was lower than the Peer Funds’ median, ranking in
27
COHEN & STEERS INSTITUTIONAL REALTY SHARES, INC.
the second quintile. The Board of Directors noted that the Fund’s actual management fee represented the Peer Funds’ median, ranking in the third quintile. The Board of Directors also considered the effect the unitary fee charged by the Investment Manager, which limits total expenses of the Fund, has on the Fund’s actual management fee ranking. In light of the considerations above, the Board of Directors concluded that the Fund’s current expense structure was satisfactory.
The Board of Directors also reviewed information regarding the profitability to the Investment Manager of its relationship with the Fund. The Board of Directors considered the level of the Investment Manager’s profits and whether the profits were reasonable for the Investment Manager. The Board of Directors took into consideration other benefits to be derived by the Investment Manager in connection with the Management Agreement, noting particularly the research and related services, within the meaning of Section 28(e) of the Securities Exchange Act of 1934, that the Investment Manager receives by allocating the Fund’s brokerage transactions. The Board of Directors further considered that the Investment Manager continues to reinvest profits back in the business, including upgrading and/or implementing new trading, compliance and accounting systems, and by adding investment personnel to the portfolio management teams. The Board of Directors concluded that the profits realized by the Investment Manager from its relationship with the Fund were reasonable and consistent with the Investment Manager’s fiduciary duties.
(iv) The extent to which economies of scale would be realized as the Fund grows and whether fee levels would reflect such economies of scale:The Board of Directors noted that the Investment Manager pays most of the regular operating costs of the Fund and reimburses the Fund for certain expenses to the extent that total expenses exceed the management fee rate. The Board of Directors determined that there were not at this time significant economies of scale that were not being shared with shareholders. In considering economies of scale, the Board of Directors also noted, as discussed above in (iii), that the Investment Manager continues to reinvest profits back in the business.
(v) Comparison of services to be rendered and fees to be paid to those under other investment management contracts, such as contracts of the same and other investment advisors or other clients:As discussed above in (iii), the Board of Directors compared the fees paid under the Management Agreement to those under other investment management contracts of other investment advisors managing Peer Funds. The Board of Directors also compared the services rendered and fees paid under the Management Agreement to those under the Investment Manager’s other fund advisory agreements and advisory contracts with institutional and other clients with similar investment mandates, including additional information about the ranges of such fees provided in response to a supplemental request for information, noting that the Investment Manager provides more services to the Fund than it does for institutional or subadvised accounts. The Board of Directors also considered the entrepreneurial risk and financial exposure assumed by the Investment Manager in developing and managing the Fund that the Investment Manager does not have with institutional and other clients and other differences in the management of registered investment companies and institutional accounts. The Board of Directors determined that on a comparative basis the fees under the Management Agreement were reasonable in relation to the services provided.
No single factor was cited as determinative to the decision of the Board of Directors, and each Director may have assigned different weights to the various factors. Rather, after weighing all of the considerations and conclusions discussed above, the Board of Directors, including the Independent Directors, unanimously approved the continuation of the Management Agreement.
28
COHEN & STEERS INSTITUTIONAL REALTY SHARES, INC.
Cohen & Steers Privacy Policy
| | |
| | |
| Facts | | What Does Cohen & Steers Do With Your Personal Information? |
| |
| Why? | | Financial companies choose how they share your personal information. Federal law gives consumers the right to limit some but not all sharing. Federal law also requires us to tell you how we collect, share, and protect your personal information. Please read this notice carefully to understand what we do. |
| |
| What? | | The types of personal information we collect and share depend on the product or service you have with us. This information can include: • Social Security number and account balances • Transaction history and account transactions • Purchase history and wire transfer instructions |
| |
| How? | | All financial companies need to share customers’ personal information to run their everyday business. In the section below, we list the reasons financial companies can share their customers’ personal information; the reasons Cohen & Steers chooses to share; and whether you can limit this sharing. |
| | | | |
| Reasons we can share your personal information | | Does Cohen & Steers
share? | | Can you limit this
sharing? |
| | |
For our everyday business purposes— such as to process your transactions, maintain your account(s), respond to court orders and legal investigations, or reports to credit bureaus | | Yes | | No |
| | |
For our marketing purposes— to offer our products and services to you | | Yes | | No |
| | |
| For joint marketing with other financial companies— | | No | | We don’t share |
| | |
For our affiliates’ everyday business purposes— information about your transactions and experiences | | No | | We don’t share |
| | |
For our affiliates’ everyday business purposes— information about your creditworthiness | | No | | We don’t share |
| | |
| For our affiliates to market to you— | | No | | We don’t share |
| | |
| For non-affiliates to market to you— | | No | | We don’t share |
| | |
| | | | |
| | | |
| Questions? Call 800.330.7348 | | | | |
29
COHEN & STEERS INSTITUTIONAL REALTY SHARES, INC.
Cohen & Steers Privacy Policy—(Continued)
| | |
| | |
| Who we are | | |
| |
| Who is providing this notice? | | Cohen & Steers Capital Management, Inc., Cohen & Steers Asia Limited, Cohen & Steers Japan, LLC, Cohen & Steers UK Limited, Cohen & Steers Securities, LLC, Cohen & Steers Private Funds and Cohen & Steers Open and Closed-End Funds (collectively, Cohen & Steers). |
| |
| What we do | | |
| |
| How does Cohen & Steers protect my personal information? | | To protect your personal information from unauthorized access and use, we use security measures that comply with federal law. These measures include computer safeguards and secured files and buildings. We restrict access to your information to those employees who need it to perform their jobs, and also require companies that provide services on our behalf to protect your information. |
| |
| How does Cohen & Steers collect my personal information? | | We collect your personal information, for example, when you: • Open an account or buy securities from us • Provide account information or give us your contact information • Make deposits or withdrawals from your account We also collect your personal information from other companies. |
| |
| Why can’t I limit all sharing? | | Federal law gives you the right to limit only: • sharing for affiliates’ everyday business purposes—information about your creditworthiness • affiliates from using your information to market to you • sharing for non-affiliates to market to you State law and individual companies may give you additional rights to limit sharing. |
| |
| Definitions | | |
| |
| Affiliates | | Companies related by common ownership or control. They can be financial and nonfinancial companies. • Cohen & Steers does not share with affiliates. |
| |
| Non-affiliates | | Companies not related by common ownership or control. They can be financial and nonfinancial companies. • Cohen & Steers does not share with non-affiliates. |
| |
| Joint marketing | | A formal agreement between non-affiliated financial companies that together market financial products or services to you. • Cohen & Steers does not jointly market. |
30
COHEN & STEERS INSTITUTIONAL REALTY SHARES, INC.
Cohen & Steers Open-End Mutual Funds
COHEN & STEERS REALTY SHARES
| • | | Designed for investors seeking total return, investing primarily in U.S. real estate securities |
| • | | Symbols: CSJAX, CSJCX, CSJIX, CSRSX, CSJRX, CSJZX |
COHEN & STEERS REAL ESTATE SECURITIES FUND
| • | | Designed for investors seeking total return, investing primarily in U.S. real estate securities |
| • | | Symbols: CSEIX, CSCIX, CREFX, CSDIX, CIRRX, CSZIX |
COHEN & STEERS INSTITUTIONAL REALTY SHARES
| • | | Designed for institutional investors seeking total return, investing primarily in U.S. real estate securities |
COHEN & STEERS GLOBAL REALTY SHARES
| • | | Designed for investors seeking total return, investing primarily in global real estate equity securities |
| • | | Symbols: CSFAX, CSFCX, CSSPX, GRSRX, CSFZX |
COHEN & STEERS INTERNATIONAL REALTY FUND
| • | | Designed for investors seeking total return, investing primarily in international(non-U.S.) real estate securities |
| • | | Symbols: IRFAX, IRFCX, IRFIX, IRFRX, IRFZX |
COHEN & STEERS REAL ASSETS FUND
| • | | Designed for investors seeking total return and the maximization of real returns during inflationary environments by investing primarily in real assets |
| • | | Symbols: RAPAX, RAPCX, RAPIX, RAPRX, RAPZX |
COHEN & STEERS PREFERRED SECURITIESAND INCOME FUND
| • | | Designed for investors seeking total return (high current income and capital appreciation), investing primarily in preferred and debt securities issued by U.S. andnon-U.S. companies |
| • | | Symbols: CPXAX, CPXCX, CPXFX, CPXIX, CPRRX, CPXZX |
COHEN & STEERS LOW DURATION PREFERREDAND INCOME FUND
| • | | Designed for investors seeking high current income and capital preservation by investing inlow-duration preferred and other income securities issued by U.S. andnon-U.S. companies |
| • | | Symbols: LPXAX, LPXCX, LPXIX, LPXRX, LPXZX |
COHEN & STEERS MLP & ENERGY OPPORTUNITY FUND
| • | | Designed for investors seeking total return, investing primarily in midstream energy master limited partnership (MLP) units and related stocks |
| • | | Symbols: MLOAX, MLOCX, MLOIX, MLORX, MLOZX |
COHEN & STEERS GLOBAL INFRASTRUCTURE FUND
| • | | Designed for investors seeking total return, investing primarily in global infrastructure securities |
| • | | Symbols: CSUAX, CSUCX, CSUIX, CSURX, CSUZX |
COHEN & STEERS ALTERNATIVE INCOME FUND (FORMERLY COHEN & STEERS DIVIDEND VALUE FUND)
| • | | Designed for investors seeking high current income and capital appreciation, investing in equity, preferred and debt securities, focused on real assets and alternative income strategies |
| • | | Symbols: DVFAX, DVFCX, DVFIX, DVFRX, DVFZX |
Distributed by Cohen & Steers Securities, LLC.
Please consider the investment objectives, risks, charges and expenses of any Cohen & Steers U.S. registered open-end fund carefully before investing. A summary prospectus and prospectus containing this and other information can be obtained by calling 800-330-7348 or by visiting cohenandsteers.com. Please read the summary prospectus and prospectus carefully before investing.
31
COHEN & STEERS INSTITUTIONAL REALTY SHARES, INC.
OFFICERS AND DIRECTORS
Robert H. Steers
Director and Chairman
Joseph M. Harvey
Director and Vice President
Michael G. Clark
Director
George Grossman
Director
Dean A. Junkans
Director
Gerald J. Maginnis
Director
Jane F. Magpiong
Director
Daphne L. Richards
Director
C. Edward Ward, Jr.
Director
Adam M. Derechin
President and Chief Executive Officer
Thomas N. Bohjalian
Vice President
Jon Cheigh
Vice President
Jason Yablon
Vice President
Dana A. DeVivo
Secretary and Chief Legal Officer
James Giallanza
Chief Financial Officer
Albert Laskaj
Treasurer
Lisa D. Phelan
Chief Compliance Officer
KEY INFORMATION
Investment Manager
Cohen & Steers Capital Management, Inc
280 Park Avenue
New York, NY 10017
(212) 832-3232
Co-administrator and Custodian
State Street Bank and Trust Company
One Lincoln Street
Boston, MA 02111
Transfer Agent
DST Asset Manager Solutions, Inc.
P.O. Box 219953
Kansas City, MO 64121-9953
(800) 437-9912
Legal Counsel
Ropes & Gray LLP
1211 Avenue of the Americas
New York, NY 10036
Distributor
Cohen & Steers Securities, LLC
280 Park Avenue
New York, NY 10017
Website: cohenandsteers.com
This report is authorized for delivery only to shareholders of Cohen & Steers Institutional Realty Shares, Inc. unless accompanied or preceded by the delivery of a currently effective prospectus setting forth details of the Fund. Performance data quoted represent past performance. Past performance is no guarantee of future results and your investment may be worth more or less at the time you sell your shares.
32
eDelivery AVAILABLE
Stop traditional mail delivery;
receive your shareholder reports
and prospectus online.
Sign up at cohenandsteers.com

Cohen & Steers
Institutional
Realty Shares
Semiannual Report June 30, 2019
Beginning on January 1, 2021, as permitted by regulations adopted by the U.S. Securities and Exchange Commission, paper copies of the Fund’s annual and semi-annual shareholder reports will no longer be sent by mail, unless you specifically request paper copies of the reports. Instead, the reports will be made available on the Fund’s website at www.cohenandsteers.com, and you will be notified by mail each time a report is posted and provided with a website link to access the report.
If you have already elected to receive shareholder reports electronically, you will not be affected by this change and you need not take any action. You may elect to receive shareholder reports and other communications from a Fund electronically anytime by contacting your financial intermediary or, if you are a direct investor, by signing up at www.cohenandsteers.com.
Beginning on January 1, 2019, you may elect to receive all future reports in paper free of charge. If you invest through a financial intermediary, you can contact your financial intermediary or, if you are a direct investor, you can call (800) 330-7348 to let the Fund know you wish to continue receiving paper copies of your shareholder reports. Your election to receive reports in paper will apply to all Funds held in your account if you invest through your financial intermediary or all Funds held within the fund complex if you invest directly with the Fund.
CSRIXSAR
Item 2. Code of Ethics.
Not applicable.
Item 3. Audit Committee Financial Expert.
Not applicable.
Item 4. Principal Accountant Fees and Services.
Not applicable.
Item 5. Audit Committee of Listed Registrants.
Not applicable.
Item 6. Schedule of Investments.
Included in Item 1 above.
Item 7. Disclosure of Proxy Voting Policies and Procedures forClosed-End Management Investment Companies.
Not applicable.
Item 8. Portfolio Managers ofClosed-End Investment Companies.
Not applicable.
Item 9. Purchases of Equity Securities byClosed-End Management Investment Company and Affiliated Purchasers.
Not applicable.
Item 10. Submission of Matters to a Vote of Security Holders.
None.
Item 11. Controls and Procedures.
(a) The registrant’s principal executive officer and principal financial officer have concluded that the registrant’s disclosure controls and procedures are reasonably designed to ensure that information required to be disclosed by the registrant in this FormN-CSR was recorded, processed, summarized and reported within the time periods specified in the Securities and Exchange Commission’s rules and forms, based upon such officers’ evaluation of these controls and procedures as of a date within 90 days of the filing date of this report.
(b) There were no changes in the registrant’s internal control over financial reporting that occurred during the period covered by this report that have materially affected, or are reasonably likely to materially affect, the registrant’s internal control over financial reporting.
Item 12. Disclosure of Securities Lending Activities forClosed-End Management Investment Companies.
Not applicable.
Item 13. Exhibits.
(a)(1) Not applicable.
(a)(2)Certifications of principal executive officer and principal financial officer as required by Rule30a-2(a) under the Investment Company Act of 1940.
(a)(3) Not applicable.
(a)(4) Not applicable.
(b) Certifications of principal executive officer and principal financial officer as required by Rule30a- 2(b) under the Investment Company Act of 1940.
SIGNATURES
Pursuant to the requirements of the Securities Exchange Act of 1934 and the Investment Company Act of 1940, the registrant has duly caused this report to be signed on its behalf by the undersigned, thereunto duly authorized.
COHEN & STEERS INSTITUTIONAL REALTY SHARES, INC.
| | | | |
| | |
| | By: | | /s/ Adam M. Derechin |
| | | | Name: Adam M. Derechin Title: Principal Executive Officer (President and Chief Executive Officer) |
| | |
| | Date: | | August 30, 2019 |
Pursuant to the requirements of the Securities Exchange Act of 1934 and the Investment Company Act of 1940, this report has been signed below by the following persons on behalf of the registrant and in the capacities and on the dates indicated.
| | | | |
| | |
| | By: | | /s/ Adam M. Derechin |
| | | | Name: Adam M. Derechin Title: Principal Executive Officer �� (President and Chief Executive Officer) |
| | |
| | By: | | /s/ James Giallanza |
| | | | Name: James Giallanza Title: Principal Financial Officer (Chief Financial Officer) |
| |
| | Date: August 30, 2019 |