UNITED STATES
SECURITIES AND EXCHANGE COMMISSION
Washington, D.C. 20549
Form 10-K
| x | ANNUAL REPORT PURSUANT TO SECTION 13 OR 15(d) OF THE SECURITIES EXCHANGE ACT OF 1934 |
For the fiscal year ended December 31, 2007
or
| ¨ | TRANSITION REPORT PURSUANT TO SECTION 13 OR 15(d) OF THE SECURITIES EXCHANGE ACT OF 1934 |
For the transition period from to
Commission file number 001-15473
OpenTV Corp.
(Exact name of Registrant as specified in its charter)
| | |
| British Virgin Islands | | 98-0212376 |
(State or other jurisdiction of incorporation or organization) | | (I.R.S. Employer Identification No.) |
| |
275 Sacramento Street San Francisco, California | | 94111 |
| (Address of principal executive offices) | | (Zip Code) |
Registrant’s telephone number, including area code:
(415) 962-5000
Securities registered pursuant to Section 12(b) of the Act: None
Securities registered pursuant to Section 12(g) of the Act:
Class A ordinary shares, no par value
Indicate by check mark if the registrant is a well-known seasoned issuer, as defined in Rule 405 of the Securities Act. Yes ¨ No x
Indicate by check mark if the registrant is not required to file reports pursuant to Section 13 or Section 15(d). Yes ¨ No x
Indicate by check mark whether the registrant (1) has filed all reports required to be filed by Sections 13 or 15(d) of the Securities Exchange Act of 1934 during the preceding 12 months, and (2) has been subject to the filing requirements for at least the past 90 days. Yes x No ¨
Indicate by check mark if disclosure of delinquent filers pursuant to Rule 405 of Regulation S-K is not contained herein, and will not be contained, to the best of Registrant’s knowledge, in definitive proxy or information statements incorporated by reference in Part III of this Form 10-K or any amendment to this Form 10-K. x
Indicate by check mark whether the registrant is a large accelerated filer, an accelerated filer or a non-accelerated filer. See definition of “accelerated filer” in Rule 12b-2 of the Exchange Act.
Large accelerated filer ¨ Accelerated filer x Non-accelerated filer ¨
Indicate by check mark whether the registrant is a shell company (as defined in Rule 12b-2 of the Exchange Act). Yes ¨ No x
The aggregate market value of the Class A ordinary shares of the registrant held of record by non-affiliates of the registrant as of June 30, 2007, computed by reference to the last sales price of such Class A ordinary shares on The NASDAQ Global Market as of the close of trading on June 30, 2007, was approximately $215,558,458. For purposes of this calculation, the directors and executive officers of the registrant as of June 30, 2007 and the holders of record of 10% or more of any class of the registrant’s ordinary shares outstanding as of June 30, 2007 (excluding Cede & Co., nominee of the Depository Trust Company) are deemed to be affiliates of the registrant. Treasury shares are also excluded. The determination of affiliate status for this calculation is not necessarily a conclusive determination for other purposes.
As of January 31, 2008, the registrant had outstanding:
109,657,613 Class A ordinary shares; and
30,206,154 Class B ordinary shares.
DOCUMENTS INCORPORATED BY REFERENCE:
Portions of the registrant’s proxy statement for its 2008 Annual Meeting of Shareholders (Part III).
OPENTV CORP.
2007 ANNUAL REPORT ON FORM 10-K
OpenTV, the OpenTV logo and our product names are trademarks or registered trademarks of OpenTV Corp. or its subsidiaries in the United States and other countries. Other product names mentioned herein may be trademarks or registered trademarks of their respective owners.
This Annual Report on Form 10-K, including “Management’s Discussion and Analysis of Financial Condition and Results of Operations” in Item 7, contains forward-looking statements that involve risks and uncertainties, as well as assumptions, that, if they never materialize or prove incorrect, could cause the results of OpenTV Corp. and its consolidated subsidiaries to differ materially from those expressed or implied by such forward-looking statements. All statements, other than statements of historical fact, are statements that could be deemed forward-looking statements, including any: projections of revenue, gross margin, expenses, earnings or losses from operations; statements of the plans, strategies and objectives of management for future operations; statements concerning developments, performance or market conditions relating to products or services; statements regarding future economic conditions or performance; statements of expectation or belief; and statements of assumptions underlying any of the foregoing. You should not place undue reliance on these forward-looking statements, which speak only as of the date of this Annual Report on Form 10-K. All these forward-looking statements are based on information available to us at this time, and we assume no obligation to update any of these statements. Actual results could differ materially from those projected in these forward-looking statements as a result of many factors, including those identified in Item 1A “Risk Factors” and elsewhere. We urge you to review and consider the various disclosures made by us in this report, and those detailed from time to time in our filings with the Securities and Exchange Commission, that attempt to advise you of the risks and factors that may affect our future results.
PART I
Overview
We are one of the world’s leading providers of software solutions for the delivery of digital and interactive television. Our software enables cable, satellite, telecommunications, and digital terrestrial operators, which we refer to as “network operators,” to offer enhanced television experiences to their viewers. We sell our software solutions principally to network operators and manufacturers of digital set-top boxes and digital televisions. We also sell related software solutions to broadcasters, programmers and advertisers that enable them to offer interactive and enhanced television experiences. Historically, our software licensing arrangements have been made directly with the network operator or set-top box manufacturer, but in the future, we expect to supplement this business model by licensing our technology and services indirectly through other distribution arrangements with key partners, such as conditional access vendors. As of December 31, 2007, more than 45 network operators had deployed our software for middleware solutions and 10 network operators had deployed our software for advertising solutions, and collectively, our software has been shipped in more than 100 million digital devices worldwide.
Our software solutions enable our customers to differentiate their video service offerings from their competitors by delivering a flexible and manageable platform from which they can easily and efficiently launch new digital television and interactive services that help them to attract and retain viewers. Our software solutions also help enable viewer participation in the television experience through the use of commerce, information retrieval, entertainment, games and other applications delivered via television networks. By leveraging our international footprint, with the millions of set-top boxes in which our software has been deployed, we believe we are well-positioned to develop and offer compelling solutions for television, including support for personal video recorders, or PVR, and high definition, or HD, digital television, next-generation user interfaces, revenue-generating applications, advanced advertising solutions and other solutions designed to make our customers’ video service offerings more compelling and profitable.
With our middleware solutions, network operators are able to manage the creation and delivery of advanced digital television services to their subscribers across a variety of set-top boxes provided by multiple manufacturers and within numerous network infrastructures. Major set-top box manufacturers incorporate our software directly into hundreds of set-top box models, which allows our solutions to be easily activated by
3
network operators upon deployment. Our “core” technology platform for set-top boxes, which we refer to as “middleware,” permits network operators to maintain a consistent user experience for their subscribers irrespective of the set-top box or boxes that may be deployed within a subscriber’s home and the source of the video signal transmitted to that subscriber’s home, whether transmitted over cable, satellite, terrestrial, or IP (Internet protocol). Our middleware also allows our customers, including programmers and advertisers, to develop applications once, without the need to rewrite those applications for different hardware environments, and offers network operators the ability to effectively and efficiently manage their business and launch new services to their viewers. We continue to evolve our middleware by enhancing and adding new features. We have developed enhancements to our PVR solutions that retain interactive content for future playback simultaneously with the recorded broadcast. We have also developed PVR enhancements that will enable recording of high definition television and are developing solutions for distribution of protected content to other devices in the home network.
As part of our advertising solutions, we offer campaign management solutions that allow network operators to manage the traffic and billing of advertisements, provide targeted and addressable advertising capabilities and integrate measurement technologies that detail how viewers engage and interact with programs and advertisements. We have developed applications that enable viewers to engage in commerce transactions, retrieve information such as product brochures and news updates, and other interactive services. In addition, our OpenTV Participate solution enables network operators as well as broadcasters and programmers to establish and manage relationships with their viewers on a real-time basis as they interact with content across multiple devices, including television, mobile and the Internet, in order to record viewer preferences, voting and other desired metrics.
As part of our business, we also offer professional engineering and consulting services to help implement and coordinate the launch, integration and customization of the technologies and products that we provide. We can manage entire digital television launch projects, with complete end-to-end digital programming solutions, or simply provide assistance with discrete integration projects, development or training activities. We believe that our extensive experience in the digital television sector makes these services especially attractive to our customers as they seek to leverage our institutional knowledge and practical perspective.
We have invested significant resources in developing our software solutions and believe that our patent portfolio protects many of the key elements necessary to support digital interactive and enhanced television. We believe that we have established an industry-leading technology position and, as of December 31, 2007, had 116 patents issued in the United States, 563 patents issued outside of the United States, and 382 patent applications pending throughout the world.
We are incorporated in the British Virgin Islands. Kudelski SA, directly and indirectly through its subsidiaries, beneficially owns Class A and Class B ordinary shares of our company collectively representing an economic interest of approximately 31.4% and a voting interest of approximately 76.7% in our company, based on the number of our ordinary shares outstanding as of December 31, 2007.
Recent Events
In September 2007, we signed a letter of intent to sell Static 2358 Holdings Ltd., which operated our PlayJam games business. The transaction closed on December 31, 2007. In accordance with Financial Accounting Standards (SFAS) No. 144“Accounting for the Impairment or Disposal of Long Lived Assets” (SFAS 144), the business unit has been reclassified as a discontinued operation. Accordingly, the Consolidated Financial Statements included in this Annual Report on Form 10-K have been revised for all periods presented to reflect this business as a discontinued operation. Unless noted otherwise, discussions in this Annual Report on Form 10-K pertain only to continuing activities.
In February 2008, we received $14.3 million in cash from Liberty Media Corporation, or Liberty. This represents the remaining capital contribution due to us pursuant to an agreement we entered into with Liberty in
4
February 2006, which provided for us to receive a portion of any premium received by Liberty in any sale of its stake in OpenTV. In the aggregate, we received $19.7 million from Liberty in connection with the January 2007 stock sale transaction between Liberty and Kudelski SA, which represents 71.4% of the premium received by Liberty in that transaction.
In March 2008, our Board of Directors appointed Nigel (Ben) Bennett as our Chief Executive Officer. Mr. Bennett assumed this role after having served as Acting Chief Executive Officer and Chief Operating Officer since August 2007.
Our Operating Businesses
We manage our businesses geographically and in accordance with two primary operating segments. From a line-of-business standpoint, we manage our reporting units within the following two operating segments: Middleware Solutions and Advertising Solutions. From a geographic standpoint, we group customers within the following regions: Americas; Europe, Middle East and Africa (EMEA); and Asia Pacific. Financial information related to our operating segments and according to geographic area can be found in Note 18 to our Consolidated Financial Statements, which appear in Part IV of this Annual Report on Form 10-K.
Middleware Solutions
Our middleware solutions segment is composed of set-top box middleware and embedded browser technologies, as well as software components that are deployed at the network operator’s headend.
Our set-top box middleware and embedded browser software provide a common platform for network operators, set-top box manufacturers, manufacturers of other consumer electronics devices, programmers, content producers, advertisers, and interactive application developers to create, deliver, and manage advanced digital television services across the various digital television environments and network architectures. These technologies enable advanced digital television services to operate on cable, satellite, digital terrestrial, and telecommunications networks providing network operators the ability to cost effectively deploy consistent advanced digital television services across set-top boxes and through other products manufactured by a multitude of vendors.
Most of our revenues are currently derived from the licensing of our set-top box middleware and embedded browser technologies. We have historically realized these revenues through one-time royalty payments and ongoing support fees. We have also entered into subscription-based licensing arrangements with some of our network operator customers, pursuant to which we are paid a monthly fee for each set-top box that is deployed by the network operator for so long as that set-top box remains in use by the end-user. We expect to continue offering this licensing model in the future to our customers and expect to derive more of our revenues from subscriber-based fees. Historically, our software licensing arrangements have been made directly with the network operator or set-top box manufacturer, but in the future, we expect to supplement this business model by licensing our technology and services indirectly through other distribution arrangements with key partners, such as conditional access vendors.
As of December 31, 2007, our set-top box middleware and embedded browser technologies had been deployed by more than 45 network operators and collectively had been shipped in more than 100 million digital devices around the world.
In addition to the software we integrate on set-top boxes, we also offer software components that are deployed at the network operator’s headend, including OpenTV Streamer, Account, Notify and Automate. These headend solutions enable more effective integration of the set-top box software with the network operator’s infrastructure. Additionally, we offer development tools that permit broadcasters, programmers and developers to create, test, and deliver interactive content and applications.
5
Our set-top box middleware and embedded browser technologies consist of the following solutions:
OpenTV Core Middleware. This set-top box software technology for advanced digital television services is our primary offering. OpenTV Core supports a wide range of services, including electronic program guides, video-on-demand (VOD), PVR, customer care applications, and other interactive and enhanced applications. Our latest, fifth generation release of middleware is OpenTV Core2.
The following features and functions are supported by OpenTV Core:
| | • | | Support for Basic and Advanced Digital Set-top Boxes. OpenTV Core can operate with the relatively limited processing power and memory found in most mass-market digital set-top boxes currently deployed by network operators. OpenTV Core is also suitable for more advanced digital set-top boxes that contain increased processing power and memory. This permits us to offer technical solutions that address the limited capabilities of many set-top boxes that are currently deployed by various network operators while simultaneously offering a solution that will enable network operators to take advantage of more powerful set-top boxes in the future. |
| | • | | High Definition Content. OpenTV Core supports HD standards and graphics for external displays and peripherals, such as HDMI (High Definition Multimedia Interface) and HDCP (High-Bandwidth Digital Content Protection). |
| | • | | On-Demand Content. OpenTV Core supports a variety of on-demand services, including PVR and VOD, that enable media-rich user interfaces for browsing content that is requested on-demand by the user, either from a local hard drive or from the network operator’s headend, and includes the underlying protocols to establish sessions and control streams via easy-to-use navigational controls. |
| | • | | HTML Support. The HTML (HyperText Markup Language) browser integrated with OpenTV Core allows the utilization of HTML and JavaScript elements in the creation of user experiences for digital television as well as the ability to deliver existing web-based content to subscribers through a digital set-top box. |
| | • | | Connectivity. OpenTV Core provides solutions for broadcast or point-to-multipoint networks as well as high bandwidth, bi-directional, point-to-point networks. OpenTV Core includes modules that support common digital television-related communication protocols, such as DOCSIS (Data Over Cable Service Interface Specification) which provides a data return channel for cable modem set-top boxes enabling viewers to retrieve information from the Internet at broadband speed. |
| | • | | Localization. OpenTV Core supports text input and presentation of substantially all languages in common use, including double byte Asian languages, and allows for localization of interactive television services for different countries. |
| | • | | Measurement. OpenTV Core provides the support for network operators, programmers, and advertisers to collect information and data regarding viewer preferences, viewing habits, and other analytical information that helps assess the efficacy of programming and advertising. |
OpenTV PVR. OpenTV PVR enables network operators to deliver advanced personal video recording services to their subscribers, including the ability to record multiple broadcast or on-demand programs simultaneously and play back those programs via easy-to-use navigational controls such as pause, fast forward and rewind, on set-top boxes that contain internal hard drives. Our PVR solution also enables both series recording and the recording of an interactive TV broadcast that retains interactive content for future playback simultaneously with the recorded broadcast.
OpenTV Spyglass. OpenTV Spyglass (formerly called Device Mosaic) is a customizable, HTML browser designed specifically for information appliances other than personal computers and is deployed independently from OpenTV Core. OpenTV Spyglass supports key Internet standards and is optimized and designed for
6
advanced digital television services. A version of OpenTV Spyglass, known as the OpenTV Integrated Browser, has been developed for the Japanese consumer electronics market with support for Broadcast Markup Language, or BML. The OpenTV Integrated Browser was developed in partnership with Matsushita Electric Company, one of Japan’s largest consumer electronics companies, and has been shipped on more than 8 million Panasonic and JVC branded digital television sets within Japan since September 2003.
OpenTV Enterprise Solutions. OpenTV Enterprise Solutions are software components that are installed at a network operator’s broadcast facility, headend, or back office to enable the creation, management, and delivery of advanced digital television services to OpenTV-enabled set-top boxes and include products such as:
| | • | | OpenTV Streamer. OpenTV Streamer enables network operators to integrate applications and data with audio and video signals for reception on set-top boxes enabled with OpenTV Core. OpenTV Streamer relies on hardware architecture that is capable of interfacing with any standard digital broadcast system. |
| | • | | OpenTV Account. OpenTV Account enables electronic commerce features within interactive television applications and gives network operators the opportunity to develop commerce-related interactive television revenue streams. Key features of OpenTV Account include single sign-on management, electronic-receipt management, electronic wallet and address book management, and security. |
| | • | | OpenTV Notify. OpenTV Notify enables network operators to send broadcast notifications to individual or multiple set-top boxes allowing network operators to deliver convenient messaging, such as email, instant messaging, order confirmation and news alerts to their subscribers. |
| | • | | OpenTV Automate. OpenTV Automate provides content management, scheduling, and synchronization for interactive television applications, including enhanced television, interactive advertising and broadcast virtual channels. |
OpenTV Enhanced Content. We develop and offer interactive applications for programmers and network operators that deliver compelling interactive content. We have also worked in conjunction with several of our network operators to develop video-mosaic applications for sports, news and other content. In addition, we continue to work with programmers and broadcasters around the world to develop unique user experiences and interactive and enhanced applications to extend their brand and engage with viewers.
OpenTV Development Tools and Support for Third Party Application Developers. We encourage content developers to design and create applications on OpenTV-enabled networks by offering a series of application development tools and support tool sets that enable them to develop and market applications directly to network operators. The tools can be used alone or in combination with other third party tools to meet virtually any interactive television development need, such as creating virtual channels, building interactive advertisements, enhancing existing programs with interactive features, and testing interactive television content through a simulated broadcast environment.
Advertising Solutions
We provide software solutions that enable the sales and management of traditional linear advertising as well as solutions for the creation, integration and delivery of addressable and interactive advertising for digital television systems. In addition, we offer measurement technologies that enable our network operator customers to detail how viewers engage and interact with programs and advertisements.
Our advertising solutions are designed to provide our customers with an integrated solution to address key challenges in the advertising market. Technology advancements are changing the way viewers watch television. Technologies, such as PVR and VOD, allow viewers to time-shift and receive programming in an on-demand and commercial-free manner; those types of services have changed the television viewing experience and created new advertising opportunities. These advancements are expediting the need for advertising that is more relevant
7
to individual viewers and for advertising that more deeply engages viewers. Our advertising solutions offer network operators the ability to sell, manage, bill and deliver multiple advertisements across an operator’s network; to deliver advertisements with more relevance to viewers based on a variety of demographic and other information; and to enable television viewers to interact with advertisements including, for example, requesting brochures and finding local retail outlets. The market for these types of solutions is still developing, and there are many issues that will need to be resolved over time, including technical and privacy issues, before these solutions become extensively deployed.
Our advertising solutions currently consist of the following technologies and services:
| | • | | OpenTV Eclipse. OpenTV Eclipse is our advertising campaign management system, also known as sales and inventory management or traffic and billing, which manages distribution of advertising content across various media platforms and outlets, providing network operators the tools to schedule and monitor the display of advertising content on their networks and to bill the advertisers based upon such monitoring. Previously, we offered another campaign management system known as OpenTV AdVision, but in 2007, we commenced the end-of-life process for this product and announced that we would cease supporting this product. As a part of this process, we are encouraging our existing OpenTV AdVision customers to migrate to OpenTV Eclipse. Our campaign management solutions are currently deployed by 10 network operators in 15 of the top 25 United States cable television markets. Our campaign management solutions are not dependent on a network operator deploying OpenTV’s middleware solutions. |
| | • | | OpenTV Ad Producer. OpenTV Ad Producer is a template-based tool that allows a third party, such as an advertising agency, to create interactive advertising content by assembling graphic assets following a step-by-step process. OpenTV Ad Producer outputs Extensible Markup Language (XML) that can be easily interpreted by the OpenTV Ad Manager system. |
| | • | | OpenTV Ad Manager. OpenTV Ad Manager is a Windows-based software tool that enables network operators to use the XML file generated by the OpenTV Ad Producer in order to verify, authenticate and preview the application content, trans-code the content to binary code that each set-top box can interpret and schedule the application for broadcast. |
| | • | | OpenTV Inject. OpenTV Inject is a post-production video editing tool that enables producers to easily insert “triggers” into an analog or digital video stream. The trigger is detected by a set-top box when the video plays. An on-screen prompt is automatically displayed, alerting the viewer that additional interactive content is available. |
| | • | | OpenTV Participate. OpenTV Participate is a scalable platform that enables the creation and real-time management of mass participation events synchronized with live or pre-recorded television shows. It allows programmers to offer viewers competitions, quizzes, auctions, voting, and games using a variety of input devices, including mobile phone, personal computer and television. |
Professional Services and Support
To complement our various businesses, we provide a comprehensive suite of professional engineering and consulting services on a worldwide basis to network operators, set-top box manufacturers, and content and application developers in support of our product offerings. The services that we provide include business consulting, porting and integration, application customization and localization, launch management and technology training services. These services allow us to manage various advanced digital television and advertising projects, from discrete integration or development assignments to complete end-to-end digital programming solutions for network operators. Our services include maintenance and support for our products after they have been installed and commercially deployed by our network operators and set-top box manufacturers, including the provision of product updates. Services are generally provided on a paid engagement basis and are either executed on a time and materials or fixed price basis, except that maintenance and support is generally subject to an annual fee.
8
Customer and Industry Relationships
We have established significant relationships with many of the leading network operators, set-top box manufacturers, chipset manufacturers, programming networks, and conditional access providers around the world. Our customer and industry relationships include the following:
| | • | | Network Operators. Over 45 network operators around the world have launched our middleware platform, including Essel Group in India, Austar Entertainment Pty. Ltd. and FOXTEL in Australia, Bell ExpressVu and StarChoice in Canada, British Sky Broadcasting, or BSkyB, in the United Kingdom, Dong Fang Cable Network Co. Ltd., in China, EchoStar’s DISH Network in the United States, MultiChoice in Africa, TPS and Numericable in France, Sky Italia in Italy, UPC Broadband (UGC) in Europe, NET in Brazil and Digiturk in Turkey. The number of network operators that have deployed our software may change from year to year as network operators continue to consolidate or merge. |
| | • | | Set-Top Box Manufacturers. Our software has been ported by more than 40 manufacturers on hundreds of set-top box models, including models produced by Advanced Digital Broadcast, Amstrad, EchoStar, Matsushita Electric, Motorola, Pace Micro Technology, Sagem, Samsung, Cisco Systems (which acquired Scientific-Atlanta in 2006), Thomson, and UEC Technologies (Pty) Ltd. |
| | • | | Chipset Manufacturers. OpenTV middleware has been ported to most of the major chipset vendors for set-top boxes, including Broadcom, Conexant, NEC, and ST Microelectronics. OpenTV middleware has also been ported to the latest generation of chipsets supporting MPEG-4 AVC. |
| | • | | Conditional Access Providers. We have integrated our middleware with conditional access software provided by Conax, Irdeto, Motorola, Nagravision (which is controlled by Kudelski SA), NDS Group, Cisco Systems and Viaccess. |
| | • | | Programming Networks. We have worked with numerous programming networks including NBC Universal, Inc., American Broadcasting Company, Turner Broadcasting System, Discovery Communications, QVC Shopping Network, Playboy Enterprises and Showtime Networks to enhance programming content and advertising on their networks. |
BSkyB, directly and indirectly, accounted for approximately 16% of our revenues during 2007 in the form of set-top box royalties and licenses paid for by its manufacturers and for other direct services and support fees. Thomson accounted for approximately 13% of our revenues during 2007 in the form of royalties and licenses and other services, including shipments to BSkyB. UGC accounted for approximately 17% of our revenues during 2007 in the form of royalties and licenses and other services.
Sales and Marketing
We promote and sell the majority of our products and services through our direct sales organization to corporate enterprises, including network operators, programmers, advertisers and set-top box manufacturers. Historically, our software licensing arrangements have been made directly with the network operator or set-top box manufacturer, but in the future, we expect to supplement this business model by licensing our technology and services indirectly through other distribution arrangements with key partners, such as conditional access vendors. We have regional sales and marketing groups that are generally responsible for customers within their geographic areas: Americas; EMEA; and Asia Pacific.
Competition
The markets in which we compete are intensely competitive and rapidly changing. Current and potential competitors in one or more areas of our business include digital television technology companies and companies developing interactive television content and applications. The principal competitive factors in our industry include product functionality, speed of product integration, breadth of network and platform coverage, scalability, price, possession of adequate intellectual property rights, and sales and marketing efforts. The following is a competitive analysis of our business segments.
9
Middleware Solutions
Competitors offering middleware solutions include NDS Group, Microsoft Corporation, Osmosys S.A., IDWay SAS, which was acquired by Irdeto Access BV in July 2007, SeaChange International, and Cisco Systems, Inc., which acquired Scientific-Atlanta, Inc. in 2006. NDS Group historically provided conditional access and limited interactive application technologies to its customers. However, in 2003, NDS Group extended its interactive services offerings with its acquisition of MediaHighway from Thomson Multimedia and today offers a bundled solution, including a conditional access system and middleware, that competes with our middleware offering. We do not offer a bundled solution that includes a conditional access system, but recently, we have sought to enter into distribution arrangements with other conditional access vendors, in order to enable them to bundle our middleware offering with their conditional access systems. NDS Group is controlled by News Corporation. News Corporation also controls, directly and indirectly, or exerts significant influence over, several satellite network operators around the world, including BSkyB, Sky Italia, FOXTEL and Sky Network Television, which are satellite operators in the United Kingdom, Italy, Australia and New Zealand, respectively. While we continue to work with, and provide technology and services to, many affiliates of News Corporation, including BSkyB, Sky Italia, FOXTEL and Sky Network Television, News Corporation’s control of NDS Group, and any extension by NDS Group of its product offering, may significantly increase competitive pressures and affect the willingness of News Corporation affiliates to work with us or to obtain products or services from us. We cannot, therefore, be certain of the long-term implications of News Corporation’s control of NDS Group or the effects that such control may have upon our relationships and opportunities to work with the many satellite operators throughout the world that are controlled by News Corporation.
In April 2005, TVWorks, LLC, a joint venture between Comcast Corporation and Cox Communications, acquired substantially all of the North American assets of Liberate Technologies, which included technologies that compete with ours. It remains uncertain how TVWorks will develop and deploy those technologies, including whether TVWorks intends to sell those technologies and related products to other cable operators in competition with us.
Cisco Systems, through its acquisition of Scientific-Atlanta, develops and markets a product line known as PowerTV, which includes an operating system and middleware for advanced digital interactive cable television markets. Cisco is also a major manufacturer of set-top boxes, and many of our customers or potential customers may seek to deploy set-top boxes manufactured by Cisco. We historically competed with Scientific-Atlanta in certain market segments and expect that we will continue to do so in the future as it operates under Cisco’s control, particularly if Cisco seeks to more aggressively invest in and market the PowerTV line of business.
For several years, Microsoft Corporation has been working to create interactive television solutions. Microsoft has several deployments of its interactive television solution and, in particular, its IPTV solutions, and we expect that Microsoft may become a strong competitor in the market for advanced digital television solutions.
In the IPTV market, we expect to face competition from other middleware providers who have partnered with leading systems integrators and telecommunications equipment manufacturers to provide end-to-end IPTV solutions for cable, satellite, and telecommunications operators. Our competition includes Microsoft and Alcatel, who have entered into a joint development, integration, and marketing agreement to deliver IPTV solutions worldwide. Other competitive IPTV offerings that deliver middleware solutions include NDS and Siemens AG.
The primary competition for OpenTV PVR comes from other middleware vendors including Microsoft, NDS Group, Guideworks LLC, a joint venture between Comcast and Gemstar-TV Guide International, Osmosys, Digeo, and Motorola, which include PVR functionality either with their electronic program guide, or EPG, or as an additional feature. Other PVR technology providers targeting the integrated PVR space include set-top box manufacturers, such as Pioneer, Pace, Humax, UEC, Motorola, and Cisco, and dedicated PVR solution providers including TiVo and ReplayTV, which was acquired by DIRECTV Group, Inc. in December 2007.
10
Advertising Solutions
In the markets for our advertising solutions, our primary competition comes from Visible World Corporation, NDS Group, Invidi Corporation, Navic Networks, Harris Corporation and Tandberg Television. The market for addressable and interactive technology is still developing, and we expect additional competitors to appear as the market continues to develop. Visible World provides a suite of services enabling advertisers and agencies to develop and deliver content and advertising that can be geographically and demographically customized as well as dynamically updated based on business parameters, market trends and demands. Navic Networks provides technology that enables the delivery and placement of targeted interactive media. In the area of campaign management, Harris Corporation, which offers a competitive solution through its Novar division, represents our primary competitor for traditional traffic and billing solutions. As the need for more advanced solutions develops, we expect to see increased competition from other companies, such as WideOrbit, which currently provides a campaign management solution to the broadcasting industry.
Regulations
The telecommunications, media, broadcast, and cable television industries are subject to extensive regulation by governmental agencies around the world. These governmental agencies continue to oversee and adopt legislation and regulation over these industries, particularly in the areas of user privacy, consumer protection, the online distribution of content, and the characteristics and quality of online products and services, which may affect our business, the development of our products, the decisions by market participants to adopt our products and services or the acceptance of interactive television by the marketplace in general.
Intellectual Property and Research and Development
As of December 31, 2007, we had 116 patents issued in the United States, 563 patents issued outside of the United States, and 382 patent applications pending throughout the world. We believe that our patent portfolio protects many of the key elements necessary to support digital interactive and enhanced television. Our research and development expenses relating to continuing operations, determined in accordance with accounting principles generally accepted in the United States of America (GAAP) for the years ended December 31, 2007, 2006 and 2005 were $32.7 million, $30.7 million and $31.0 million, respectively.
Employees
As of December 31, 2007, we had 497 full-time employees, with 352 in our middleware solutions segment, 71 in our advertising solutions segment and 74 employed in corporate and administrative functions.
Available Information
Our Internet website is located at http://www.opentv.com, but the information contained on our website is not deemed to be incorporated herein. We make available free of charge on the investor relations page of our website this Annual Report on Form 10-K, quarterly reports on Form 10-Q, current reports on Form 8-K and amendments to those reports filed or furnished pursuant to Section 13(a) or 15(d) of the Securities Exchange Act of 1934, as soon as reasonably practicable after we electronically file such material with, or furnish it to, the Securities and Exchange Commission, or SEC.
The public may also read and copy any materials we file with the SEC at the SEC’s Public Reference Room at 100 F Street, N.E., Washington, D.C. 20549. The public may obtain information on the operation of the Public Reference Room by calling the SEC at 1-800-SEC-0330. The SEC also maintains an Internet website that contains reports, proxy and information statements, and other information regarding issuers that file electronically with the SEC. The SEC’s Internet site is located athttp://www.sec.gov, but the information contained on that website is not deemed to be incorporated herein.
11
Factors That May Affect Future Results
In addition to the other information contained in this 2007 Annual Report on Form 10-K, you should consider carefully the following factors in evaluating OpenTV and our business.
We have a history of net losses, and we may continue to experience net losses in the future.
We have incurred significant net losses since our inception. Our net losses for the years ended December 31, 2007, 2006 and 2005 were approximately $5.2 million, $10.8 million and $8.5 million, respectively. We expect to continue incurring significant research and development, sales and marketing and administrative expenses. It is, therefore, likely that we will continue to suffer net losses in the near term. We will need to generate significant revenue to achieve and maintain sustainable profitability. We cannot be certain that we will achieve, sustain or increase profitability in the future. Any failure to significantly increase revenue as we implement our product and distribution strategies would adversely affect our business, financial condition and operating results.
We have historically derived a significant percentage of our revenues from licensing our middleware to network operators. Our opportunities for future revenue growth with middleware are limited by the actual number of worldwide network operators and by technology decisions they make from time to time.
We have historically derived a significant percentage of our total revenues from royalties associated with the deployment of our middleware solutions and fees charged for services rendered in support of those deployments. Historically, the number of network operators worldwide has not grown significantly, and in fact, consolidation has resulted in fewer independent network operators in many countries. Over 45 network operators around the world have already deployed our middleware solutions. To the extent that we have already achieved deployments in those networks, the opportunities for future growth of our middleware solutions may be limited, typically by the subscriber growth of our customers and their schedule for upgrading the technology deployed in their networks. Although new markets are emerging from the conversion of analog to digital networks required in many countries and the growth of IPTV and digital terrestrial television networks, we may not be successful in marketing and selling our middleware to these new markets, in which case our revenue growth and results of operations will be negatively impacted.
Our capacity to generate future revenues associated with our middleware may also be limited due to a number of reasons, including:
| | • | | network operators that have selected our middleware may switch to another middleware platform for the provision of interactive services, reduce their pace of set-top box deployment or stop deploying set-top boxes enabled with our middleware, decrease or stop their use of our support services, or choose not to upgrade or add additional features to the version of our middleware running on their networks; |
| | • | | network operators that have not selected our middleware may choose another middleware platform for the provision of interactive services, which could include the selection of standards-based solutions such as the Multimedia Home Platform, or MHP, and tru2way, formerly known as the OpenCable Applications Platform, or OCAP; |
| | • | | third party distributors of our middleware solutions, such as set-top box manufacturers and conditional access vendors, may not be successful in marketing or selling our software as part of their bundled solutions or the prices at which they are able to sell their bundled solutions to network operators may experience downward pricing pressure, which in turn may impact the prices at which they are able to sell our middleware solutions; or |
| | • | | a meaningful opportunity to deploy our middleware in the markets that have not yet adopted interactive digital television on a large scale may never develop or may develop at a slower pace than expected. |
12
Any of these eventualities would have an adverse effect on our future revenues and results of operations.
We offer volume discounts to certain customers, which may, over time, depress our average pricing. While deployments of our software may continue to grow, those discounts, as they are triggered, may limit the rate of our royalty growth in the future.
In certain instances, we provide volume discounts to customers based on the number of copies of our software that they deploy. As a result, although we may experience continued growth in middleware deployments, the average price for each copy licensed to certain customers may decline over time, which could limit the growth of our royalty payments in the future. We experienced this effect in 2005, as our royalties and licenses revenues from Sky Italia declined by $3.3 million compared to 2004 because of volume discounts. We have historically provided various types of volume discounts to our customers and expect that we will continue to do so in the future. Unless we are able to offset anticipated discounts through a change in product mix, upgrades to our software or other methods that typically enable us to charge higher fees, we may experience slower royalty growth as discounting is triggered.
We expect a more significant portion of our revenue growth in the future to be derived from advertising solutions that we develop and market. If we are not successful in developing and marketing these advertising solutions, our future revenue growth may be limited.
We expect to accelerate the development of our suite of advertising solutions, including a significant upgrade to our campaign management product and more advanced targeted and addressable advertising solutions. These efforts will involve significant investment and time and attention of management. Historically, we have derived a relatively small percentage of our total revenue from these offerings, and the market for these offerings, particularly for targeted and addressable advertising and participation-based offerings, is still nascent and evolving. We cannot be certain that the demand for, or the market acceptance of, our advertising solutions will develop as we anticipate or that we will be able to market those solutions effectively. If network operators determine that our advertising solutions do not meet their business or operational expectations, they may choose a competitive solution. To the extent that network operators fail to renew or enter into new or expanded contracts with us for our advertising solutions, our revenue growth will be impacted negatively. Moreover, due to global economic conditions, network operators may slow down their deployment of new technologies, and such actions would also negatively impact our revenue growth. Accordingly, our ability to generate significant revenues from our advertising solutions in the future is uncertain.
Our future growth may be limited if we are unable to sell our middleware solutions to North American cable customers.
In February 2008, we announced that we had jointly decided with Time Warner Cable, or TWC, to put our middleware project with TWC on indefinite hold. That project commenced in 2006 with the goal of providing a common user interface and interactive services platform based on OpenTV’s middleware across certain low-end set-top boxes deployed by TWC in the United States. This project represented OpenTV’s only currently active project to deploy our middleware solution with a North American cable operator. In addition, in April 2005, TVWorks LLC (formerly known as Double C Technologies), a joint venture formed by Cox Communications and Comcast Corporation, acquired substantially all of the assets of the North American business of Liberate Technologies, a former competitor of ours. Historically, our middleware competed with the middleware software included within the assets sold to TVWorks. To date, while we have licensed certain of our advertising solutions to Comcast, and expect to pursue additional advertising opportunities with both Cox and Comcast, we have not licensed our middleware solutions to either of these companies. It also remains unclear whether TVWorks will attempt to license the competing technology to other North American cable operators. Based on our current understanding of the circumstances, we would not expect Cox or Comcast, in light of the assets that they acquired from Liberate, to license middleware or related solutions from us. As a result of both this and the TWC development, our opportunity to license our middleware solutions in the United States to cable operators, and in
13
particular TWC, Comcast and Cox, may be materially diminished, and if so, our future revenue growth may be adversely affected.
A significant percentage of our revenues is currently generated from network operators that are affiliated with News Corporation, which also controls NDS Group, one of our primary competitors in the middleware market. Over the long-term, this situation may make it more difficult for us to sell our products, technologies or services to these network operator affiliates, in which case our revenues may be negatively impacted.
News Corporation currently controls NDS Group, which competes with us in the middleware market. News Corporation also controls, directly or indirectly, or exerts significant influence over, a number of our customers, including BSkyB, Sky Italia, FOXTEL and Sky Network Television. For the year ended December 31, 2007, BSkyB, Sky Italia, FOXTEL and Sky Network Television, directly and indirectly through their set-top box manufacturers, accounted for 27%, in the aggregate, of our revenues. While we believe that our relationship with each of these customers is good, the long-term implications of News Corporation owning a technology company that directly competes with us in the market for middleware is difficult to assess. We may be at a disadvantage in selling our middleware to News Corporation affiliates over the long-term when in direct competition with NDS Group, and if we were to lose one or more of these customers, our revenues would be negatively impacted.
A significant percentage of our revenues is generated from a relatively small number of customers. The loss of one or more of these customers would severely and negatively impact our revenues.
Although our middleware solutions have been deployed by more than 45 network operators worldwide, a small number of large network operators account for a disproportionately large percentage of our revenues. For the year ended December 31, 2007, network operators over which News Corporation controls or exerts significant influence, including BSkyB, Sky Italia, FOXTEL and Sky Network Television, accounted for approximately 27% of our revenues in the aggregate. Liberty Global, which controls or exerts significant influence over UGC, Austar and Jupiter Telecommunications Co., Ltd. (JCOM), accounted for approximately 24% of our 2007 revenues in the aggregate. Finally, we generated approximately 8% of our revenues in 2007 from EchoStar. The loss of any of the foregoing individual network operators as customers would negatively impact our financial results and future prospects. In addition, if either News Corporation or Liberty Global decided to replace our middleware solution as part of a group-wide effort that encompassed all or a significant portion of their respective affiliated network operators, then the impact on our financial results and future prospects would be severe.
We may be unable in the future to raise additional capital required to support our operating activities.
We expect to be able to fund our capital requirements for at least the next twelve months by using existing cash balances and short-term and long-term marketable debt securities, if our assumptions about our revenues, expenses and cash commitments are generally accurate. Nevertheless, we have incurred to date and we expect that we will continue to incur in the near term significant expenses. As of February 15, 2008, we had over $96 million of cash, cash equivalents and marketable debt securities. While we continue to monitor our operating expenses and seek to bring them in line with our revenues, there can be no assurance that we will be successful in doing so or that we will be able to generate positive cash flow from operating activities in the future. If we are not successful in those endeavors, we might need to raise additional capital.
To the extent we are required to raise additional capital, we may not be able to do so at all or we may be able to do so only on unacceptable terms. If we cannot raise additional capital on acceptable terms, we may not be able to develop or enhance our products and services, take advantage of future opportunities or respond to competitive pressures or unanticipated requirements, any of which could have an adverse effect on our business, results of operations or future prospects.
14
The market for our products and services is subject to significant competition, which could adversely affect our business.
We face competition from a number of companies, including many that have significantly greater financial, technical and marketing resources and better recognized brand names than we do. Current and potential competitors in one or more aspects of our business include interactive technology companies, companies developing interactive television content and entertainment, and, in the professional services area, third party system integrators and internal information technology staffs at our network operator customers. Some of our customers or their affiliates offer products or services that compete with our products and services. For example, as we noted above, TVWorks, a joint venture between Cox and Comcast, acquired the North American assets of Liberate Technologies, which included its middleware business. If any of our competitors achieves significant market penetration or other success within the markets upon which we rely as a significant source of revenue, or in new markets that we may enter in the future, our ability to maintain market share and sustain our revenues may be materially and adversely affected.
The trend of consolidation among industry participants may adversely impact our business, results of operations and future prospects.
There has been a worldwide trend of consolidation in the cable, direct broadcast satellite and telecommunications industries. We believe this trend is likely to continue due to economic and competitive concerns. This trend has also expanded to include other companies involved in the interactive television industry. For example, in December 2007, Macrovision announced that it had reached agreement to acquire Gemstar-TV Guide International, a provider of electronic program guide technology. In July 2007, Irdeto Access BV, a provider of conditional access systems, acquired IDway SAS, a software company providing open software solutions for digital television consumer devices. In February 2006, Cisco Systems, Inc. acquired Scientific-Atlanta, the set-top box manufacturer, and in March 2007, ARRIS Group, Inc. announced a deal to acquire Tandberg Television. We expect additional consolidation to occur throughout the industry. While the full impact of this trend is uncertain at the present time, we will need to adapt to changing relationships with industry participants and address concerns that may arise relating to competition and conflicts of interest as companies consolidate. If we are unable to successfully manage these changing relationships and address competitive and conflict issues, we may lose existing customers and fail to secure new customers.
Unanticipated fluctuations in our quarterly operating results could affect our stock price.
We believe that quarter-to-quarter comparisons of our financial results are not necessarily meaningful indicators of our future operating results and should not be relied on as an indication of future performance. If our quarterly operating results fail to meet the expectations of analysts, the market price of our publicly-traded securities could be negatively affected. Our quarterly operating results have varied substantially in the past and they may vary substantially in the future depending upon a number of factors described below, including many that are beyond our control.
Our operating results may vary from quarter to quarter as a result of a number of factors, including:
| | • | | Changes in the rate of capital spending and the rollout of interactive television-related products and services by network operators; |
| | • | | The number, size and scope of network operators deploying OpenTV-enabled interactive services and the associated rollout to subscribers; |
| | • | | Changes in our operating expenses necessary to meet business and customer requirements; |
| | • | | Increased competition in general and any changes in our pricing policies that may result from increased competitive pressures; |
15
| | • | | Potential downturns in our customers’ businesses or in the domestic or international markets for our products and services; |
| | • | | Our ability to develop and market successfully our advertising solutions business; |
| | • | | Changes in technology, whether or not developed by us; |
| | • | | Our ability to develop and introduce on a timely basis new or enhanced versions of our products that can compete favorably in the marketplace; and |
| | • | | The timing of revenue recognition associated with major licensing and services agreements. |
Any of the factors listed above could cause significant variations in our earnings on a quarter-to-quarter basis. You should not rely on the results of prior periods as an indication of our future performance. Any decline in revenues or a greater than expected loss for any quarter could cause the market price of our publicly-traded securities to decline.
Our shares may be at risk for delisting from The NASDAQ Global Market. If our shares are delisted, our share price and your liquidity may be impacted.
Our Class A ordinary shares are currently listed on The NASDAQ Global Market. NASDAQ has requirements that a company must meet in order to remain listed on The NASDAQ Global Market. These requirements include maintaining a minimum closing bid price of $1.00 per share. Our closing bid price on December 31, 2007 was $1.32 per share. Although we currently meet all of the minimum continued listing requirements for The NASDAQ Global Market, should our share price decline, our ordinary shares could be subject to potential delisting from The NASDAQ Global Market.
If we fail to maintain the standards necessary to be quoted on NASDAQ and our shares are delisted, trading in our shares would be conducted on the OTC Bulletin Board as long as we continue to file reports required by the Securities and Exchange Commission. The OTC Bulletin Board is generally considered to be a less efficient market than NASDAQ, and our share price, as well as the liquidity of our ordinary shares, may be adversely impacted as a result.
We depend upon key personnel, including our senior executives and technical and engineering staff, to operate our business effectively, and we may be unable to attract or retain such personnel.
Our future success depends largely upon the continued service of our senior executive officers and other key management and technical personnel. In 2007, we twice experienced a change in our Chief Executive Officer, and there were additional changes among our senior executives. We also implemented a significant reorganization of our worldwide business operations, which resulted in the implementation of a new reporting structure. Organizational change can disrupt our operations and require significant management time and attention, which can place us at a competitive disadvantage in the fast moving markets in which we operate. In addition, we may need to increase our technical, consulting and support staff to support new customers and the expanding needs of our existing customers. We have, in the past, experienced difficulty in recruiting qualified personnel. If we are not successful in those efforts, our business may be adversely affected.
We continue to evaluate our business operations and may implement structural and other changes that affect the conduct of our worldwide business operations. As we continue to align our resources appropriately with our evolving business, we may face unintended consequences or suffer adverse effects on our operations or personnel.
We review our operations on an ongoing basis with a view towards improving our business performance. As a result of these business reviews, we may undertake changes to operations and personnel. From time to time, we also may initiate efforts to consolidate our operations, close and relocate various offices around the world and
16
divest non-strategic assets, such as the sale of our PlayJam unit that closed in December 2007. There is a risk that, as new business strategies and administrative processes are developed and implemented, the changes we adopt will be unduly disruptive or less effective than our old strategies and processes. This may adversely affect our business, results of operations and future prospects.
Interactive television remains an emerging business and it may not attract widespread market acceptance or demand.
Our success will depend upon, among other things, the broad acceptance of interactive television by industry participants, including network operators and manufacturers of televisions and set-top boxes, as well as by television programmers, viewers and advertisers. Because the market for interactive television remains an emerging market, the potential size of the market opportunity and the timing of its development are uncertain. The growth and future success of our business will depend in part upon our ability to penetrate new markets and convince network operators, television programmers, viewers and advertisers to adopt and maintain their use of our products and services.
Because much of our success and value lies in our ownership and use of our intellectual property, our failure to protect our intellectual property and develop new proprietary technology may negatively affect us.
Our ability to effectively conduct our business will be dependent in part upon the maintenance and protection of our intellectual property. We rely on patent, trademark, trade secret and copyright law, as well as confidentiality and licensing arrangements, to establish and protect our rights in and to our technology. We have typically entered into confidentiality or license agreements with our employees, consultants, customers, strategic partners and vendors in an effort to control access to, and distribution of, our software, related documentation and other proprietary information. Despite these precautions, it may be possible for a third party to copy, reverse engineer or otherwise obtain and use our software and other proprietary information without authorization.
Policing unauthorized use of our software and proprietary information is difficult and expensive. The steps we take may not prevent misappropriation of our intellectual property and the agreements we enter into may not be enforceable in some instances. In addition, effective patent, copyright, trademark and trade secret protection may be unavailable or limited in certain foreign countries or, alternatively, such protection may be difficult to enforce. Litigation may be necessary in the future to enforce or protect our intellectual property rights or to determine the validity and scope of our intellectual property rights and the proprietary rights of others. Any such litigation could cause us to incur substantial costs and diversion of resources, which in turn could adversely affect our business.
Intellectual property infringement claims may be asserted against us, which could disrupt our business.
We may be the subject of claims by third parties alleging that we infringe their intellectual property. The defense of any such claims could cause us to incur significant costs and could result in the diversion of resources with respect to the defense of any claims brought, which could adversely affect our financial condition and operating results. As a result of such infringement claims, a court could issue an injunction preventing us from distributing certain products, which could adversely affect our business. If any claims or actions are asserted against us, we may seek to obtain a license under a third party’s intellectual property rights in order to avoid any litigation. However, a license under such circumstances may not be available on commercially reasonable terms, if at all.
17
We grant certain indemnification rights to our customers when we license our software technologies. We may, therefore, become subject to third party infringement claims through those commercial arrangements. In addition, the damages to which we are subject may be increased by the use of our technologies in our customers’ products.
Many of our and our subsidiaries’ agreements with customers contain an indemnification obligation, which could be triggered in the event that a customer is named in an infringement suit involving their products or involving the customer’s products or services that incorporate or use our products. If it is determined that our products infringe any of the asserted claims in such a suit, we may be prevented from distributing certain of our products and we may incur significant indemnification liabilities, which may adversely affect our business, financial condition and operating results.
In addition, while damages claims in respect of an alleged infringement may, in many cases, be based upon a presumed royalty rate that the patent holder would have otherwise been entitled to, it is possible that our liability may increase as a result of the incorporation of our technology with our customer’s products or as a result of any finding of willful infringement. In some cases, potential damages against us could be based on the profits derived from a product that infringes through the use of our software even though we receive a relatively moderate economic benefit from the licensing arrangement.
The adoption of industry-wide standards for interactive television could adversely affect our ability to sell our products and services or place downward pressure on our pricing.
Ongoing efforts to establish industry-wide standards for interactive television software include a commitment by cable network operators in the United States to deploy a uniform platform for interactive television based on a jointly developed specification known as “tru2way” (or OCAP) and an initiative by European television industry participants to create a similar platform called MHP. We are a participant in both standards bodies and have agreed to license our intellectual property in connection with the implementation of tru2way and MHP. The establishment of these standards or other similar standards could adversely affect the pricing of our products and services, significantly reduce the value of our intellectual property and the competitive advantage our proprietary technology provides, cause us to incur substantial expenditures to adapt our products or services to respond to these developments, or otherwise hurt our business, particularly if our products require significant redevelopment in order to conform to the newly established standards.
The adoption of incompatible standards by our industry and rapid technological advances could render our products and services obsolete or non-competitive.
The migration of television from analog to digital transmission, the convergence of television, the Internet, communications and other media, and other emerging trends, such as the deployment of high definition television and multicasting, are creating a dynamic and unpredictable environment in which to operate. Our ability to anticipate trends and adapt to new technologies and evolving standards is critical to our success, and if we fail to do so in a cost-effective manner, then our future growth prospects will be diminished and our results of operations will be negatively impacted.
The deployment of new digital television applications, such as high definition television and multicasting multiple television programs through a single channel, may compete directly with our products and services for broadcast distribution capacity. To the extent that such capacity cannot accommodate all of the applications that a cable or direct broadcast satellite system operator wants to distribute, then there is a risk that other applications will be deployed to the exclusion of our content and applications. If this occurs, our results of operations could be adversely affected.
Any delay or failure on our part to respond quickly, cost-effectively and sufficiently to these developments could render our products and services obsolete or non-competitive and have an adverse effect on our business,
18
financial condition and operating results. In addition, we must stay abreast of cutting-edge technological developments and evolving service offerings to remain competitive and increase the utility of our services, and we must be able to incorporate new technologies into our products in order to address the increasingly complex and varied needs of our customer base. There can be no assurance that we will be able to do so successfully, and any failure to do so may adversely affect us.
Government regulations may adversely affect our business.
The telecommunications, media, broadcast and cable television industries are subject to extensive regulation by governmental agencies. These governmental agencies continue to oversee and adopt legislation and regulation over these industries, particularly in the areas of user privacy, consumer protection, the online distribution of content and the characteristics and quality of online products and services, which may affect our business, the development of our products, the decisions by market participants to adopt our products and services or the acceptance of interactive television by the marketplace in general. In particular, governmental laws or regulations restricting or burdening the exchange of personally identifiable information could delay the implementation of interactive services such as targeted and addressable advertising or create liability for us or any other manufacturer of software that facilitates information exchange. These governmental agencies may also seek to regulate interactive television directly. Future developments relating to any of these regulatory matters may adversely affect our business.
Changes to current accounting policies or in how such policies are interpreted or applied to our business could have a significant effect on our reported financial results or the way in which we conduct our business and could make it difficult for investors to assess properly our financial condition or operating results.
We prepare our financial statements in conformity with accounting principles generally accepted in the United States, which are subject to interpretation by the American Institute of Certified Public Accountants, the Public Company Accounting Oversight Board, the Securities and Exchange Commission and various other bodies formed to interpret and create appropriate accounting policies. A change in these policies or in how such policies are interpreted or applied to our business could have a significant effect on our reported results and may even retroactively affect previously reported transactions. Our accounting policies that recently have been or may in the future be affected by changes in the accounting rules are as follows:
| | • | | Accounting for share-based compensation; |
| | • | | Accounting for income taxes; and |
| | • | | Accounting for business combinations, related goodwill and other intangible assets. |
As a software company, our revenue recognition policy, in particular, is a key component of our results of operations and is based on complex rules that require us to make judgments and estimates. In applying our revenue recognition policy, we must determine which portions of our revenue are recognized currently and which portions must be deferred. As a result, we may receive cash from a customer, or bill that customer, but not be able to recognize the revenue associated with that cash, or billing, for some period of time under applicable accounting rules. This results in our recording the billing as “deferred revenue” on our balance sheet. There are also complex accounting rules associated with the treatment of internal contract costs, and whether those costs should be deferred or expensed as incurred. A determination whether to defer or expense certain costs may materially affect our financial presentation. Because different contracts may require different accounting treatment, it may be difficult for investors to properly assess our financial condition or operating results unless they carefully review all of our financial information, including our statement of operations, balance sheet and statement of cash flows.
In addition, in the first quarter of fiscal 2006, we adopted the provisions of SFAS No. 123 (revised 2004),“Share-Based Payment” (SFAS 123(R)) which requires the measurement of all share-based compensation to
19
employees, including grants of restricted stock and employee stock options, using a fair-value-based method and the recording of such expense in our consolidated statements of income. The adoption of SFAS 123(R) had a material effect on our reported financial results. It will continue to materially affect our reported financial results and, to the extent it affects our ability to adequately retain or attract our employees through the use of share-based compensation, our business operations may be adversely impacted.
Through the use of our technology we have the ability to collect personal and confidential information from set-top boxes. If we fail to protect this information from security breaches or misuse this information, then our operations could be disrupted and we could be subject to litigation and liability under privacy laws.
Through the technology that we license for use in set-top boxes, we have the ability, when requested by our customers, to collect and store personal information from users of our applications. We may also have access to that type of information as we deploy our interactive advertising platforms. Subject to applicable laws, and the agreement of our customers and consumers, we may seek to use such information to help develop addressable and targeted advertising businesses. Storage and use of such information is subject to laws and regulations and may also subject us to privacy claims relating to its use and dissemination. In addition, a third party might be able to breach our security measures and gain unauthorized access to our servers where such information is stored and misappropriate such information or cause interruptions to our business operations. We may be required to expend significant capital and other resources to monitor the laws applicable to privacy matters, to protect against security breaches or to deal with the consequences of any breach. A breach of privacy rights by us, network operators or others could expose us to liability. Any compromise of security or misuse of private information could materially and adversely affect our business, reputation, operating results and financial condition and expose us to costly litigation and regulatory action. Concerns over the security of personal information transmitted through our applications and the potential misuse of such information might also inhibit market acceptance of our applications, and if this occurs, our business and operating results will be adversely affected.
Our multinational operations expose us to special risks that could increase our expenses, adversely affect our operating results and require increased time and attention of management.
We derive a substantial portion of our revenue from customers located outside of the United States and have significant operations in a number of countries around the world. Our international operations are subject to special risks, including:
| | • | | differing legal and regulatory requirements and changes in those requirements; |
| | • | | potential loss of proprietary information due to piracy, misappropriation or weaker laws regarding intellectual property protection; |
| | • | | export and import restrictions, tariffs and other trade barriers; |
| | • | | the costs associated with the maintenance of multiple office facilities around the world; |
| | • | | currency fluctuations and devaluations; |
| | • | | difficulties in staffing and managing offices as a result of, among other things, distance, language and cultural differences; |
| | • | | longer payment cycles and problems in collecting accounts receivable; |
| | • | | political and economic instability; and |
| | • | | potentially adverse tax consequences. |
Any of these factors could have an adverse effect on our business, financial condition and operating results.
20
Our software products may contain errors, which could cause us to lose revenue and incur unexpected expenses.
Software development is an inherently complex process, which frequently results in products that contain errors, as well as defective features and functions. Moreover, our technology is integrated into other products and services deployed by our network operator customers. Accordingly, a defect, error or performance problem with our technology could cause the systems of our network operator customers to fail for a period of time or to be impaired in certain respects. Any such failure could subject us to damage claims and claims for indemnification by our customers and result in severe customer relations problems and harm to our reputation.
While our agreements with customers typically contain provisions designed to limit or exclude our exposure to potential liability claims in those circumstances, those provisions may not be effective, in all respects, under the laws of some jurisdictions. As a result, we could be required to pay substantial amounts of damages in settlement or upon the determination of any of these types of claims.
The interests of our majority owner may differ from yours and may result in OpenTV acting in a manner inconsistent with your general interests.
Kudelski SA beneficially owned Class A and Class B ordinary shares representing approximately 31.4% of the economic interest and 76.7% of the voting power of our ordinary shares outstanding as of December 31, 2007. As a result of its ownership of our ordinary shares, Kudelski has sufficient voting power, without the vote of any other shareholder, to determine the outcome of any action presented to a vote of our shareholders, including amendments of our amended and restated memorandum of association and articles of association for any purpose (which could include increasing or reducing our authorized capital or authorizing the issuance of additional shares). The interests of Kudelski, which owns or controls a variety of companies and technologies relating to digital television, may diverge from your interests, and Kudelski may be in a position, subject to general fiduciary obligations, to cause or require us to act in a way that is inconsistent with the general interests of the non-affiliated holders of our Class A ordinary shares.
Because we are controlled by Kudelski, we are exempt from certain listing requirements of The NASDAQ Global Market relating to corporate governance matters.
Over the past several years, the National Association of Securities Dealers has adopted certain listing requirements for The NASDAQ Global Market designed to enhance corporate governance standards of the companies who are listed thereon. As a result of Kudelski’s beneficial ownership of our Class A and Class B ordinary shares, we are not subject to some of these requirements, including the requirement that a majority of our board of directors be “independent” under the guidelines established by the National Association of Securities Dealers and certain requirements regarding the determination of our Chief Executive Officer’s compensation and our director nominees. While we do not believe that our exemption from those requirements affects the manner and method by which we manage and operate the company, investors should be aware that we are not subject to those provisions and may have no obligation to comply with those requirements in the future unless our ownership profile changes.
Because we are a British Virgin Islands company, you may not be able to enforce judgments against us that are obtained in United States courts.
We are incorporated under the laws of the British Virgin Islands. As a result, it may be difficult for investors to effect service of process upon us within the United States or to enforce against us judgments obtained in the United States courts, including judgments predicated upon the civil liability provisions of the federal securities laws of the United States.
We have been advised by British Virgin Islands counsel that judgments of United States courts predicated upon the civil liability provisions of the federal securities laws of the United States may be difficult to enforce in
21
British Virgin Islands courts and that there is doubt as to whether British Virgin Islands courts will enter judgments in original actions brought in British Virgin Islands courts predicated solely upon the civil liability provisions of the federal securities laws of the United States.
Because we are a British Virgin Islands company, your rights as a shareholder may be less clearly established as compared to the rights of shareholders of companies incorporated in other jurisdictions.
Our corporate affairs are governed by our amended and restated memorandum of association and articles of association and by the BVI Business Companies Act, 2004. Principles of law relating to such matters as the validity of corporate procedures, the fiduciary duties of management and the rights of our shareholders may differ from those that would apply if we were incorporated in the United States or another jurisdiction. The rights of shareholders under British Virgin Islands law are not as clearly established as are the rights of shareholders in many other jurisdictions. Thus, our shareholders may have more difficulty protecting their interests in the face of actions by our board of directors or our controlling shareholder than they would have as shareholders of a corporation incorporated in another jurisdiction.
Certain provisions contained in our charter documents could deter a change of control of us.
Certain provisions of our amended and restated memorandum of association and articles of association may discourage attempts by other companies to acquire or merge with us, which could reduce the market value of our Class A ordinary shares. For example, in February 2006, we amended and restated our memorandum of association to eliminate a restriction that previously prohibited us from issuing additional super voting Class B ordinary shares. The amended and restated memorandum of association also deleted provisions that previously caused each Class B ordinary share to automatically convert into a Class A ordinary share under certain circumstances, including upon the transfer of any Class B ordinary shares to a person who was not a shareholder, or an affiliate of a shareholder, prior to our initial public offering. The comparatively low voting rights of our Class A ordinary shares as compared to our Class B ordinary shares, all of which were beneficially owned by Kudelski as of December 31, 2007, as well as other provisions of our amended and restated memorandum of association and articles of association, may delay, deter or prevent other persons from attempting to acquire control of us.
| Item 1B. | Unresolved Staff Comments |
None.
Our corporate headquarters and principal executive offices are presently located at 275 Sacramento Street, San Francisco, California 94111, where we occupy 60,458 square feet of space under a lease that expires on January 31, 2010. In addition to our corporate headquarters, we have leased regional office space elsewhere in the United States, Europe, Asia and Australia.
Claims by Former Chief Executive Officer. In November 2007, we received a demand from attorneys for Alan A. Guggenheim, our former Chief Executive Officer, claiming that the company was withholding severance and certain other benefits due him under his employment agreement following termination of his employment in August 2007. We responded that we intended to provide Mr. Guggenheim with all pay and benefits due him under the employment agreement. Thereafter, in December 2007, we were notified by the Occupational Safety and Health Administration (OSHA) of the United States Department of Labor that we had been named in an administrative complaint filed by Mr. Guggenheim alleging violations of Section 806 of the Sarbanes-Oxley Act of 2002, 18 U.S.C. § 1514A. In the complaint, Mr. Guggenheim claims that the company terminated him for
22
reporting conduct that he alleged to be illegal or unethical and seeks money damages, fees and costs, reinstatement and any other available relief. We filed a written statement of position with OSHA denying all of Mr. Guggenheim’s allegations. OSHA has not yet determined whether it will conduct an investigation into this matter, and no substantive administrative proceedings have occurred to date. We intend to defend ourselves vigorously in any administrative proceedings and in any subsequent legal proceedings that may be filed by Mr. Guggenheim. We have established a reserve for the severance and other benefits we believe are due to Mr. Guggenheim under the terms of his employment agreement. That reserve is an estimate only and actual costs may be materially different.
Initial Public Offering Securities Litigation. In July 2001, the first of a series of putative securities class actions was filed in the United States District Court for the Southern District of New York against certain investment banks which acted as underwriters for our initial public offering, us and various of our officers and directors. In November 2001, a similar securities class action was filed in the United States District Court for the Southern District of New York against Wink Communications and two of its officers and directors and certain investment banks which acted as underwriters for Wink Communications’ initial public offering. We acquired Wink Communications in October 2002. The complaints allege undisclosed and improper practices concerning the allocation of initial public offering shares, in violation of the federal securities laws, and seek unspecified damages on behalf of persons who purchased OpenTV Class A ordinary shares during the period from November 23, 1999 through December 6, 2000 and Wink Communications’ common stock during the period from August 19, 1999 through December 6, 2000. Other actions have been filed making similar allegations regarding the initial public offerings of more than 300 other companies. All of these lawsuits have been coordinated for pretrial purposes as In re Initial Public Offering Securities Litigation , 21 MC 92 (SAS). Defendants in these cases filed an omnibus motion to dismiss on common pleading issues. All claims against our and Wink Communications’ officers and directors have been dismissed without prejudice in this litigation pursuant to the parties’ stipulation approved by the Court on October 9, 2002. On February 19, 2003, the Court denied in part and granted in part the omnibus motion to dismiss filed on behalf of defendants, including us and Wink Communications. The Court’s order dismissed all claims against us and Wink Communications except for a claim brought under Section 11 of the Securities Act of 1933.
In June 2004, a stipulation of settlement and release of claims against the issuer defendants, including us and Wink Communications, was submitted to the court for approval. On August 31, 2005, the court preliminarily approved the settlement. In December 2006, the appellate court overturned the certification of classes in the six test cases that were selected by the underwriter defendants and plaintiffs in the coordinated proceedings. Neither OpenTV nor Wink Communications is one of the test cases.
Because class certification was a condition of the settlement, it was unlikely that the settlement would receive final Court approval. On June 25, 2007, the Court entered an order terminating the proposed settlement based upon a stipulation among the parties to the settlement. Plaintiffs have filed amended master allegations and amended complaints in the six focus cases, which the defendants in those cases have moved to dismiss. Plaintiffs have also moved for class certification in the six test cases, which the defendants in those cases have opposed. It is uncertain whether there will be any revised or future settlement.
If a settlement does not occur, we believe that we have meritorious defenses to the claims asserted against us and will defend ourselves vigorously. No provision has been made in our consolidated financial statements for this matter. We are unable to predict the likelihood of an unfavorable outcome or estimate our potential liability, if any.
Broadcast Innovation Matter. On November 30, 2001, a suit was filed in the United States District Court for the District of Colorado by Broadcast Innovation, L.L.C., or BI, alleging that DIRECTV, Inc., EchoStar Communications Corporation, Hughes Electronics Corporation, Thomson Multimedia, Inc., Dotcast, Inc. and Pegasus Satellite Television, Inc. are infringing certain claims of United States patent no. 6,076,094, assigned to or licensed by BI. DIRECTV and certain other defendants settled with BI on July 17, 2003. We are unaware of
23
the specific terms of that settlement. Though we are not currently a defendant in the suit, BI may allege that certain of our products, possibly in combination with the products provided by some of the defendants, infringe BI’s patent. The agreement between OpenTV, Inc. and EchoStar includes indemnification obligations that may be triggered by the litigation. If liability is found against EchoStar in this matter, and if such a decision implicates our technology or products, EchoStar has notified OpenTV, Inc. of its expectation of indemnification, in which case our business performance, financial position, results of operations or cash flows may be adversely affected. Likewise, if OpenTV, Inc. were to be named as a defendant and it is determined that the products of OpenTV, Inc. infringe any of the asserted claims, and/or it is determined that OpenTV, Inc. is obligated to defend EchoStar in this matter, our business performance, financial position, results of operations or cash flows may be adversely affected. On November 7, 2003, BI filed suit against Charter Communications, Inc. and Comcast Corporation in United States District Court for the District of Colorado, alleging that Charter and Comcast also infringe the ‘094 patent. The agreements between Wink Communications and Charter Communications include indemnification obligations of Wink Communications that may be triggered by the litigation. While reserving all of our rights in respect of this matter, we have conditionally reimbursed Charter for certain reasonable legal expenses that it incurred in connection with this litigation. On August 4, 2004, the District Court found the ‘094 patent invalid. After various procedural matters, including interim appeals, in November 2005, the United States Court of Appeals for the Federal Circuit remanded the case back to the District Court for disposition. On March 8, 2006, the defendants filed a writ of certiorari in this matter with the Supreme Court of the United States to review the decision of the United States Court of Appeals for the Federal Circuit, which had overturned the District Court’s order for summary judgment in favor of the defendants. That writ of certiorari was denied. Charter filed a request with the United States Patent and Trademark Office on June 8, 2006 to re-examine the patent based on prior art references. On July 11, 2006, the District Court ordered a stay of the proceedings pending notice as to whether the re-examination request is accepted by the United States Patent and Trademark Office. On June 21, 2006, Charter filed a motion to stay the litigation pending completion of the Patent Office’s reexamination of the ‘094 patent. On July 11, 2006, the Court granted Charter’s motion and entered an order staying the case. On August 5, 2006, the United States Patent and Trademark Office ordered a re-examination of all of the patent’s claims. The case remains stayed. Based on the information available to us, we have established a reserve for costs and fees that may be incurred in connection with this matter. That reserve is an estimate only and actual costs may be materially different.
Other Matters. From time to time in the ordinary course of our business, we are also party to other legal proceedings or receive correspondence regarding potential or threatened legal proceedings. While we currently believe that the ultimate outcome of these other proceedings, individually and in the aggregate, will not have a material adverse effect on our financial position or overall trends in our results of operations, legal proceedings are subject to inherent uncertainties.
| Item 4. | Submission of Matters to a Vote of Security Holders |
None.
24
PART II
| Item 5. | Market for Registrant’s Common Equity, Related Shareholder Matters and Issuer Purchases of Equity Securities |
Market Information
Our Class A ordinary shares trade on The NASDAQ Global Market under the symbol “OPTV.” Our Class B ordinary shares are not publicly traded.
The following table lists the high and low sales prices for our Class A ordinary shares on The NASDAQ Global Market for the periods indicated.
| | | | | | |
| | | The NASDAQ
Global Market |
| | | Low | | High |
2006 | | | | | | |
First Quarter | | $ | 2.19 | | $ | 2.98 |
Second Quarter | | | 2.46 | | | 4.18 |
Third Quarter | | | 2.65 | | | 4.01 |
Fourth Quarter | | | 2.27 | | | 3.15 |
2007 | | | | | | |
First Quarter | | $ | 2.29 | | $ | 2.85 |
Second Quarter | | | 2.00 | | | 2.65 |
Third Quarter | | | 1.19 | | | 2.25 |
Fourth Quarter | | | 0.93 | | | 1.68 |
Holders
As of January 31, 2008, there were approximately 786 holders of record of our Class A ordinary shares and two holders of record of our Class B ordinary shares, both of whom are affiliated with Kudelski SA. Banks, brokers and other institutions hold many of our Class A ordinary shares on behalf of our shareholders.
Issuer Purchases of Equity Securities (1)
| | | | | | | | | |
Period | | Total Number
of Shares
Purchased | | Average
Price Paid
per Share | | Total Number of
Shares Purchased
as Part of Publicly
Announced Plans
or Programs | | Maximum Dollar
Value of Shares that
May Yet Be
Purchased Under
the Plans or
Programs |
December 2007 | | 1,200,000 | | $ | 1.09 | | — | | — |
| | | | | | | | | |
Total | | 1,200,000 | | | | | — | | — |
| | | | | | | | | |
| (1) | In December 2007, we issued restricted Class A ordinary shares to some employees in order to provide a retention incentive and to align the interests of such employees with the long-term goals of the company and its shareholders. These shares were issued under the terms of our 2005 Incentive Plan and are subject to restrictions on transfer or sale for up to four years. In order to offset the dilutive effect of this share grant, our board of directors authorized the repurchase of up to 1,200,000 Class A ordinary shares in open market transactions on The NASDAQ Global Market. We completed the repurchase of all such 1,200,000 Class A ordinary shares in December 2007 in accordance with the authority granted by our board. These repurchases were not made pursuant to a publicly announced plan or program. |
Dividends
We have never paid any cash dividends on our ordinary shares. We anticipate that any earnings in the foreseeable future will be retained to finance our business, and we have no current intention to pay cash
25
dividends on our ordinary shares. The payment of dividends is within the discretion of our board of directors and will be dependent upon, among other factors, our results of operations, financial condition, capital requirements, legal requirements and any restrictions imposed by financing arrangements.
Stock Performance Graph
The following performance graph and related information shall not be deemed “soliciting material” or “filed” with the SEC, nor shall such information be incorporated by reference into any further filings under the Securities Act of 1933 or the Securities Exchange Act of 1934, each as amended, except to the extent we specifically incorporate it by reference into such filing.
The graph below compares the cumulative total shareholder return on our Class A ordinary shares from December 31, 2002 through December 31, 2007, with the cumulative total return of The NASDAQ Composite Index and The NASDAQ Computer & Data Processing Index over the same period. These returns assume the investment of $100 in our Class A ordinary shares and in each of the other indices on December 31, 2002 and reinvestment of any dividends (of which we paid none during that period).
The comparisons in the graph below are based on historical data and are not intended to forecast the possible future performance of our ordinary shares.
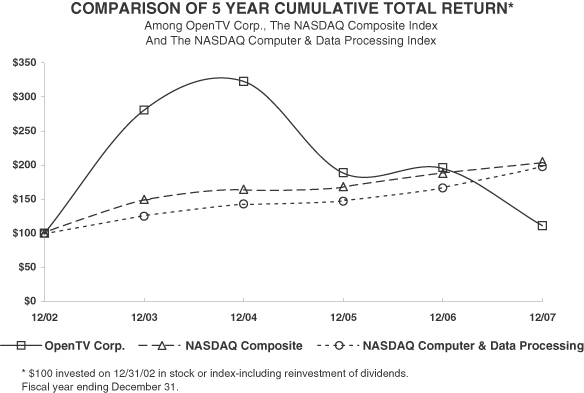
| | | | | | | | | | | | |
| | | 12/02 | | 12/03 | | 12/04 | | 12/05 | | 12/06 | | 12/07 |
OpenTV Corp. | | 100.00 | | 280.67 | | 322.69 | | 188.24 | | 194.96 | | 110.92 |
NASDAQ Composite (1) | | 100.00 | | 149.75 | | 164.64 | | 168.60 | | 187.83 | | 205.22 |
NASDAQ Computer & Data Processing | | 100.00 | | 124.95 | | 143.03 | | 147.06 | | 166.33 | | 197.68 |
| (1) | In prior years, we used the NASDAQ Stock Market (U.S. Index), which was discontinued in 2006. Accordingly, we now use the NASDAQ Composite Index as a replacement for the discontinued index. |
26
Recent Sales of Unregistered Securities
We did not sell any securities during the year ended December 31, 2007 that were not registered under the Securities Act of 1933, as amended.
| Item 6. | Selected Financial Data |
The selected consolidated financial data set forth below should be read in conjunction with Item 7. Management’s Discussion and Analysis of Financial Condition and Results of Operations, and the Consolidated Financial Statements and notes thereto, included elsewhere in this Annual Report on Form 10-K. Our historical results are not necessarily indicative of results to be expected for any future period.
| | | | | | | | | | | | | | | | | | | | |
| | | Year Ended December 31, | |
| | 2007 | | | 2006 | | | 2005 | | | 2004 | | | 2003 | |
| | | (In thousands, except per share amounts) | |
Results of operations: | | | | | | | | | | | | | | | | | | | | |
Revenues | | $ | 109,977 | | | $ | 95,210 | | | $ | 78,215 | | | $ | 66,101 | | | $ | 52,787 | |
Cost of revenues | | | 48,059 | | | | 40,996 | | | | 27,782 | | | | 30,433 | | | | 40,943 | |
| | | | | | | | | | | | | | | | | | | | |
Gross profit | | | 61,918 | | | | 54,214 | | | | 50,433 | | | | 35,668 | | | | 11,844 | |
Operating expenses (1) | | | 66,995 | | | | 64,435 | | | | 61,692 | | | | 58,918 | | | | 64,122 | |
| | | | | | | | | | | | | | | | | | | | |
Loss from operations | | $ | (5,077 | ) | | $ | (10,221 | ) | | $ | (11,259 | ) | | $ | (23,250 | ) | | $ | (52,278 | ) |
| | | | | | | | | | | | | | | | | | | | |
| | | | | |
Net loss from continuing operations (2) | | $ | (306 | ) | | $ | (9,657 | ) | | $ | (6,869 | ) | | $ | (20,665 | ) | | $ | (52,955 | ) |
Net loss from discontinued operations (3) | | | (4,855 | ) | | | (1,161 | ) | | | (1,604 | ) | | | (1,297 | ) | | | (1,139 | ) |
| | | | | | | | | | | | | | | | | | | | |
Net loss | | $ | (5,161 | ) | | $ | (10,818 | ) | | $ | (8,473 | ) | | $ | (21,962 | ) | | $ | (54,094 | ) |
| | | | | | | | | | | | | | | | | | | | |
Net loss per share from continuing operations, basic and diluted (2) | | $ | — | | | $ | (0.07 | ) | | $ | (0.06 | ) | | $ | (0.17 | ) | | $ | (0.56 | ) |
Net loss per share from discontinued operations, basic and diluted (3) | | | (0.04 | ) | | | (0.01 | ) | | | (0.01 | ) | | | (0.01 | ) | | | (0.01 | ) |
| | | | | | | | | | | | | | | | | | | | |
Net loss per share, basic and diluted | | $ | (0.04 | ) | | $ | (0.08 | ) | | $ | (0.07 | ) | | $ | (0.18 | ) | | $ | (0.57 | ) |
| | | | | | | | | | | | | | | | | | | | |
| (1) | 2007 included $267 for restructuring and impairment costs and $3,267 for share-based compensation. |
| | 2006 included $1,021 for restructuring and impairment costs, $747 for impairment of goodwill and $3,274 for share-based compensation. |
| | 2005 included $2,545 for restructuring and impairment costs. |
| | 2004 included $(4,600) for NASCAR amendment and $893 for restructuring and impairment costs. |
| | 2003 included $6,587 for restructuring and impairment costs and $1,497 for impairment of intangible assets. |
| (2) | 2007 included a gain of $1,739 for the sale of a cost investment. |
| | 2005 included a gain of $3,126 for the sale of a cost investment. |
| (3) | 2007 included $66 of restructuring and impairment costs, $3,626 for impairment of goodwill of discontinued operations, and $1,399 for loss on sale of subsidiary. |
| | 2006 included $303 for restructuring and impairment costs. |
| | | | | | | | | | | | | | | |
| | | As of December 31, |
| | 2007 | | 2006 | | 2005 | | 2004 | | 2003 |
| | | (In thousands) |
Financial position: | | | | | | | | | | | | | | | |
Cash, cash equivalents and marketable securities | | $ | 81,814 | | $ | 64,918 | | $ | 63,510 | | $ | 62,509 | | $ | 72,745 |
Working capital of continuing operations | | $ | 65,201 | | $ | 48,427 | | $ | 37,058 | | $ | 19,282 | | $ | 19,560 |
Total assets of discontinued operations | | $ | — | | $ | 6,673 | | $ | 8,480 | | $ | 8,914 | | $ | 9,839 |
Total assets | | $ | 220,055 | | $ | 220,764 | | $ | 202,065 | | $ | 192,411 | | $ | 219,555 |
Total shareholders’ equity | | $ | 170,479 | | $ | 167,831 | | $ | 152,512 | | $ | 145,175 | | $ | 156,983 |
27
| Item 7. | Management’s Discussion and Analysis of Financial Condition and Results of Operations |
The following discussion and analysis provides information concerning our financial condition and results of operations for the year ended December 31, 2007. This discussion should be read in conjunction with our Consolidated Financial Statements and the notes thereto. Segment information appearing below in this discussion and analysis, and in Note 18 of our Consolidated Financial Statements, is presented in accordance with SFAS No.131, “Disclosures about Segments of an Enterprise and Related Information,” (SFAS 131).
Overview of Our Business
We are one of the world’s leading providers of software solutions for the delivery of digital and interactive television. Our software enables cable, satellite, telecommunications, and digital terrestrial operators, which we refer to as “network operators,” to offer enhanced television experiences to their viewers.
The majority of our revenue typically comes from one-time royalty fees paid by network operators or manufacturers of set-top boxes, once a set-top box, which incorporates our software, has been shipped to, or activated by, the network operator. We also derive revenue from the licensing of related software and interactive content and applications associated with the delivery of digital and interactive television, as well as from licensing products that enable advanced advertising solutions. In addition, we receive professional services fees from consulting, systems integration and training engagements, fees for the maintenance and support of our products and fees from revenue sharing arrangements related to the use of our interactive content and applications.
Our revenue model may change over time. For example, we have signed subscription-based licensing agreements under which we receive monthly payments for each set-top box that includes our software that our customers deploy, for so long as those set-top boxes remain active. In addition, we expect in the future to supplement this business model by licensing our technology and services indirectly through distribution arrangements with key partners other than network operators and set-top box manufacturers, such as conditional access vendors.
Kudelski SA, directly and indirectly through its subsidiaries, beneficially owns Class A and Class B ordinary shares of our company collectively representing an economic interest of approximately 31.4% and a voting interest of approximately 76.7% in our company, based on the number of our ordinary shares outstanding as of December 31, 2007.
Recent Events
In September 2007, we signed a letter of intent to sell Static 2358 Holdings Ltd., which operated our PlayJam games business. The transaction closed on December 31, 2007. In accordance with SFAS 144, the business unit has been reclassified as a discontinued operation. Accordingly, the Consolidated Financial Statements included in this Annual Report on Form 10-K have been revised for all periods presented to reflect this business as a discontinued operation. Unless noted otherwise, discussions in this Annual Report on Form 10-K pertain only to continuing activities.
In February 2008, we received $14.3 million in cash from Liberty. This represents the remaining capital contribution due to us pursuant to an agreement we entered into with Liberty in February 2006, which provided for us to receive a portion of any premium received by Liberty in any sale of its stake in OpenTV. In the aggregate, we received $19.7 million from Liberty in connection with the January 2007 stock sale transaction between Liberty and Kudelski SA, which represents 71.4% of the premium received by Liberty in that transaction.
In March 2008, our Board of Directors appointed Nigel (Ben) Bennett as our Chief Executive Officer. Mr. Bennett assumed this role after having served as Acting Chief Executive Officer and Chief Operating Officer since August 2007.
28
Critical Accounting Policies and Estimates
Our discussion and analysis of our financial condition and results of operations is based upon our Consolidated Financial Statements, which have been prepared in accordance with GAAP. The preparation of these financial statements requires us to make estimates and judgments that affect the reported amounts of assets and liabilities at the date of the financial statements, and the reported amounts of revenues and expenses during the reporting period. In preparing these Consolidated Financial Statements, we made our best estimates and judgments, which are normally based on knowledge and experience with regard to past and current events and assumptions about future events, giving due consideration to materiality. Actual results could differ materially from these estimates under different assumptions or conditions.
We believe the following critical accounting polices and estimates have the greatest potential impact on our Consolidated Financial Statements: revenue recognition, valuation allowances (specifically the allowance for doubtful accounts and deferred tax assets), impairment of goodwill and long-lived assets, restructuring costs and share-based compensation. All of these accounting policies and estimates, together with their underlying assumptions, and their impact on our financial statements, have been discussed with our audit committee.
Revenue Recognition
We recognize revenue in accordance with GAAP as has been prescribed for the software industry, the principal policies of which are reflected in American Institute of Certified Public Accountants (AICPA) Statement of Position (SOP) 97-2, “Software Revenue Recognition” (SOP 97-2), SOP 81-1, “Accounting for Performance of Construction-Type and Certain Production-Type Contracts” (SOP 81-1) and Securities and Exchange Commission Staff Accounting Bulletin (SAB) No. 104, “Revenue Recognition” (SAB 104). Revenue recognition requirements in the software industry are very complex and are subject to change. Our revenue recognition policy is one of our critical accounting policies because revenue is a key component of our results of operations and is based on complex rules that require us to make judgments and estimates. The application of SOP 97-2 requires judgment about a number of matters, including whether a software arrangement includes multiple elements, and if so, whether vendor-specific objective evidence of fair value of the elements of the arrangement exists. In applying our revenue recognition policy, we must determine which portions of our revenue to recognize currently and which portions to defer and recognize in later periods. In some cases, we may, therefore, record the costs associated with a licensing transaction before we are able to recognize the revenue related to that license, even if we have actually invoiced the customer or received a cash payment from that customer. In other cases, we may accumulate costs in the same manner as inventory costs, and charge those costs to operations as the related revenue is recognized. In order to determine current and deferred revenue, we make judgments and estimates with regard to future deliverable products and services and the appropriate valuation for those products and services. Our judgments and estimates regarding future products and services could differ from actual events. Because the terms of our licensing arrangements may differ for various customers, including subscription-based or one-time royalty arrangements, we may apply different recognition policies to different customer contracts depending upon those particular terms.
For fixed bid contracts under the percentage of completion method, the extent of progress towards completion is measured based on actual costs incurred to total estimated costs. The actual results could differ from the percentage estimates by the time a project is complete.
The recognition of revenues is partly based on our assessment of the probability of collection of the resulting accounts receivable. As a result, the timing or amount of revenue recognized may have been different if other assessments of the probability of collection of accounts receivable had been made at the time the transactions were recorded in revenue.
29
Valuation Allowances
We maintain an allowance for doubtful accounts for estimated losses resulting from the inability of our customers to make required payments. If the financial condition of our customers were to deteriorate, resulting in an impairment of their ability to make payments, additional allowances may be required.
We record a valuation allowance to reduce our deferred tax assets to the amount that is more likely than not to be realized. We consider our potential future taxable income and ongoing prudent and feasible tax planning strategies in assessing the amount of our valuation allowance. Currently, we maintain a partial valuation allowance on deferred tax assets. Adjustments may be required in the future if our estimate of the realizable amount of deferred tax assets changes.
Impairment of Goodwill and Long-lived Assets
Our long-lived assets include goodwill, property and equipment, other assets and other intangible assets, which are reviewed for impairment whenever events or changes in circumstances indicate that the carrying amount of an asset may not be recoverable and in the case of goodwill, at least annually. In estimating the fair value of our reporting units and assessing the recoverability of our long-lived assets, we consider changes in economic conditions and make assumptions regarding estimated future cash flows and other factors. The most significant assumption impacting estimated future cash flows is revenue. Estimates of future cash flows are highly subjective judgments that can be significantly impacted by changes in global and local business and economic conditions, operating costs, competition and demographic trends. If our estimates or underlying assumptions change in the future, we may be required to record additional impairment charges.
Restructuring Costs
We continuously monitor our organizational structure and associated operating expenses. Depending upon events and circumstances, actions may be taken periodically to restructure the business. Restructuring activities may include terminating employees, abandoning excess office space and incurring other exit costs. Any resulting restructuring costs depend on numerous estimates made by us based on our knowledge of the activity being affected, the cost to exit existing commitments and fair value estimates. These estimates could differ from actual results. We monitor the initial estimates periodically and record an adjustment for any significant changes in estimates.
Share-Based Compensation
We use the Black-Scholes option pricing model to determine the fair value of stock options. The determination of the fair value of share-based payment awards on the date of grant using an option-pricing model is affected by our stock price as well as assumptions regarding a number of complex and subjective variables. These variables include our expected stock price volatility over the term of the awards, actual and projected employee stock option exercise behaviors, risk-free interest rate and expected dividends. While we believe that these assumptions are reasonable, there can be no assurance that actual experience may not differ materially from these assumptions. If factors change and we employ different assumptions for estimating share-based compensation expense in future periods or if we decide to use a different valuation model, the expense in future periods may differ significantly from what we have recorded in the current period and could materially affect our operating income, net income and net income per share.
The Black-Scholes option-pricing model was developed for use in estimating the fair value of traded options that have no vesting restrictions and are fully transferable, characteristics not present in our option grants. Existing valuation models, including the Black-Scholes and binomial lattice models, may not provide reliable measures of the fair values of our share-based compensation. Consequently, there is a risk that our estimates of the fair values of our share-based compensation awards on the grant dates may bear little resemblance to the actual values realized upon the exercise, expiration, early termination or forfeiture of those share-based payments
30
in the future. Certain share-based payments, such as employee stock options, may expire without any value having been realized by the employee, notwithstanding the fair values originally estimated on the grant date and reported in our financial statements. Alternatively, values may be realized from these instruments that are significantly higher than the fair values originally estimated on the grant date and reported in our financial statements. There is currently no widely accepted market-based mechanism or other practical application to verify the reliability and accuracy of the estimates stemming from these valuation models, nor is there a means to compare and adjust the estimates to actual values.
The guidance in SFAS 123(R) and SAB No. 107,“Interaction Between FASB Statement No. 123(R), and Certain SEC Rules and Regulations Regarding the Valuation of Share-based Payment Arrangement for Public Companies,” (SAB 107) is relatively new. The application of these principles may be subject to further interpretation and refinement over time. There are significant differences among valuation models, and there is a possibility that we will adopt different valuation models in the future. This may materially affect the fair value estimates of future share-based payments, which may result in a lack of consistency. It may also result in a lack of comparability with other companies that use different models, methods and assumptions.
See Note 14 of our Consolidated Financial Statements contained in Part IV of this Annual Report on Form 10-K for further information regarding the impact of SFAS 123(R) on our financial statements.
Recent Accounting Pronouncements
In September 2006, the Financial Accounting Standards Board (FASB) issued SFAS No. 157,“Fair Value Measures” (SFAS 157). SFAS 157 provides guidance for using fair value to measure assets and liabilities and applies whenever other standards require or permit assets or liabilities to be measured at fair value but does not expand the use of fair value in any new circumstances. SFAS 157 is effective for fiscal years beginning after November 15, 2007 and interim periods within those fiscal years. We do not expect SFAS 157 to have a material impact on our consolidated financial statements.
In February 2007, the FASB issued SFAS No. 159,“The Fair Value Option for Financial Assets and Financial Liabilities—Including an Amendment of FASB Statement No. 115” (SFAS 159). SFAS 159 provides the option to report certain financial assets and liabilities at fair value, with the intent to mitigate volatility in financial reporting that can occur when related assets and liabilities are recorded on different bases. SFAS 159 is effective for fiscal years beginning after November 15, 2007. We do not expect SFAS 159 to have a material impact on our consolidated financial statements.
In December, 2007, the FASB issued FASB Statement No. 141 (Revised 2007),“Business Combinations”(SFAS 141(R)). Under SFAS 141(R), an acquiring entity will be required to recognize all the assets acquired and liabilities assumed in a transaction at the acquisition-date fair value with limited exceptions. SFAS 141(R) will significantly change the accounting for business combinations. SFAS 141(R) also includes a substantial number of new disclosure requirements. SFAS 141(R) applies prospectively to business combinations for which the acquisition date is on or after the beginning of the first annual reporting period beginning on or after December 15, 2008. Earlier adoption is prohibited.We have not yet determined the impact, if any, the adoption of SFAS 141(R) will have on our consolidated financial statements.
Management’s Assessment of Internal Control Over Financial Reporting and Disclosure Controls
In connection with the preparation of our year-end financial statements, we have prepared a report, as required by the Sarbanes-Oxley Act of 2002, which evaluates our internal control over financial reporting as of December 31, 2007. That complete report, as well as our conclusions regarding the effectiveness of our disclosure controls and our remediation efforts, if any, are included under Item 9A of this Annual Report on Form 10-K, which investors should read in its entirety.
31
We are required to establish and maintain adequate internal control over financial reporting as defined in Rules 13a-15(f) under the Securities Exchange Act of 1934, as amended. Those controls are designed to provide reasonable assurance regarding the reliability of financial reporting and the preparation of financial statements for external purposes in accordance with GAAP. While those controls may be expected to provide reasonable assurances regarding the reliability of our financial reporting, we do not expect that such controls will prevent all errors and fraud. We monitor our controls and maintain those controls as dynamic systems that change (including improvements and corrections) as conditions warrant.
As we assessed our internal control over financial reporting, we sought to identify various deficiencies or weaknesses that we may have and, if any were identified, to correct those deficiencies or weaknesses as promptly as practicable. We are required to disclose any material weaknesses that we have identified. The Public Company Accounting Oversight Board, which was established under the Sarbanes-Oxley Act, defines a “material weakness” as a deficiency, or a combination of deficiencies, in internal control over financial reporting, such that there is a reasonable possibility that a material misstatement of the company’s annual or interim financial statements will not be prevented or detected on a timely basis.
We also maintain a system of disclosure controls that have been designed with the objective of ensuring that information required to be disclosed in the reports we file under the Securities Exchange Act of 1934, as amended, including this Annual Report on Form 10-K, is recorded, processed, summarized and reported within the time periods specified in the rules and forms of the SEC.
As more fully described in Item 9A of this Annual Report on Form 10-K, based on our assessment, we have concluded that our internal control over financial reporting and our system of disclosure controls were effective as of December 31, 2007 and 2006, respectively.
Years Ended December 31, 2007, 2006 and 2005
Revenues
We have entered into commercial arrangements involving both product licenses and service elements that are bundled together. Revenues from such bundled offerings under GAAP have been allocated to the“Royalties and licenses” and“Services and other” revenue line items based on the relative fair values of the product and service elements in each of the contracts. Our determination of the relative fair values of these elements is based on the relative amounts of the fees we charge our customers for the product licenses and service elements, as set forth in each of the applicable contracts.
Revenues for the year ended December 31, 2007 were $110.0 million, an increase of $14.8 million, or 16%, from $95.2 million in 2006. Revenues for the year ended December 31, 2006 were $95.2 million, an increase of $17.0 million, or 22%, from $78.2 million in 2005.
Revenues by line item were as follows (in millions, except percentages):
| | | | | | | | | | | | | | | | | | | | | |
| | | Year Ended December 31, | | Change | |
| | 2007 | | 2006 | | 2005 | | 2007 versus 2006 | | | 2006 versus 2005 | |
| | | | | | | | | $ | | % | | | $ | | % | |
Royalties and licenses | | $ | 73.7 | | $ | 65.9 | | $ | 55.1 | | $ | 7.8 | | 12 | % | | $ | 10.8 | | 20 | % |
Services and other | | | 36.3 | | | 29.3 | | | 23.1 | | | 7.0 | | 24 | % | | | 6.2 | | 27 | % |
| | | | | | | | | | | | | | | | | | | | | |
Total revenues | | $ | 110.0 | | $ | 95.2 | | $ | 78.2 | | $ | 14.8 | | 16 | % | | $ | 17.0 | | 22 | % |
| | | | | | | | | | | | | | | | | | | | | |
Royalties and licenses
We generally derive royalties from the sale of set-top boxes and other products that incorporate our software. Royalties are paid by either the network operator or the set-top box manufacturer depending upon our
32
payment arrangements with those customers. We recognize royalties upon receipt of royalty reports reflecting unit shipments or activation of our software by network operators or manufacturers. Royalty reports are generally received one quarter in arrears. For non-refundable prepaid royalties, we recognize revenues upon initial delivery of the software to our customers. We have historically realized revenues through one-time royalty payments and ongoing license fees. In the future, we expect to license our technology and services indirectly through distribution arrangements with key partners other than network operators and set-top box manufacturers, such as conditional access vendors, who will pay the applicable license and royalty fees directly to us. We have also entered into license agreements with network operators that will pay us under a subscription-based model, pursuant to which we are paid a monthly fee for each set-top box that is shipped or deployed by the network operator for so long as that box remains in use by the network operator.
Our royalties usually result from several different types of arrangements. In the case of our set-top box software, these may include: initial deployments by new customers, the activation of new subscribers by existing customers, the shipment of additional set-top boxes as replacements for older or defective set-top boxes or for purposes of simply upgrading existing set-top boxes, or sales of new products or services by the network operators that require new or updated set-top boxes. We have historically provided various types of prospective volume discounts on optional future deployments of our licensed middleware products, based on the volume of the customer’s previous deployments of the particular licensed products, and expect that we will continue to do so in the future. Unless we are able to offset anticipated discounts through a change in product mix, upgrades to our software or other methods which enable us to charge higher fees, we may experience slower royalty growth as discounting is triggered.
A significant portion of our revenues is dependent upon our customers’ subscriber base, the growth in their subscriber base, and the related quantities of set-top boxes deployed with our software. Specific royalty trends associated with set-top box deployments by our customers are difficult to discern in many cases, as we do not control or directly influence actual deployment schedules of our customers. However, our general experience in the past suggests that set-top box deployments by our customers tend to be stronger in the third and fourth quarters of the calendar year. Because we receive most of our royalty reports one quarter in arrears, our royalty revenues in the past have generally been higher in the first and fourth quarters of the calendar year.
We also derive fees from the licensing of other software products, such as OpenTV Streamer, OpenTV Eclipse and OpenTV Participate. These license fees can be in the form of one-time, upfront payments by our customers, the total of which can vary significantly from quarter to quarter, or, in the case of our advanced advertising products, can be in the form of a recurring license fee, the total of which is less likely to vary significantly from quarter to quarter.
Royalties and licenses revenues by region were as follows (in millions, except percentages):
| | | | | | | | | | | | | | | | | | | | | | | | | |
| | | Year Ended December 31, | | | Change | |
| | 2007 | | | 2006 | | | 2005 | | | 2007 versus 2006 | | | 2006 versus 2005 | |
| | | | | | | | | | | | $ | | | % | | | $ | | % | |
Europe, Middle East and Africa | | $ | 42.4 | | | $ | 32.3 | | | $ | 28.3 | | | $ | 10.1 | | | 31 | % | | $ | 4.0 | | 14 | % |
Americas | | | 18.3 | | | | 23.3 | | | | 20.6 | | | | (5.0 | ) | | (21 | )% | | | 2.7 | | 13 | % |
Asia Pacific | | | 13.0 | | | | 10.3 | | | | 6.2 | | | | 2.7 | | | 26 | % | | | 4.1 | | 66 | % |
| | | | | | | | | | | | | | | | | | | | | | | | | |
Total royalties and licenses revenues | | $ | 73.7 | | | $ | 65.9 | | | $ | 55.1 | | | $ | 7.8 | | | 12 | % | | $ | 10.8 | | 20 | % |
| | | | | | | | | | | | | | | | | | | | | | | | | |
As percentage of total revenues | | | 67 | % | | | 69 | % | | | 70 | % | | | | | | | | | | | | | |
2007 versus 2006.Royalties and licenses revenue for 2007 increased $7.8 million, or 12%, to $73.7 million.
| | • | | Europe, Middle East and Africa accounted for $42.4 million in royalties and licenses revenue in 2007, an increase of $10.1 million, or 31%, compared to 2006. |
During the fourth quarter of 2007, we amended some of the commercial and other terms of our license agreement with UGC and, in addition, delivered the final remaining licensed products, which resulted
33
in the recognition of $9.9 million in royalties and licenses revenue from UGC. This included $6.0 million of deferred revenue, which had been deferred since 2004 and was recognized as a result of the amendment and final delivery of all remaining licensed products during the fourth quarter of 2007. UGC revenues accounted for 13% of our total worldwide royalties and licenses revenue for 2007. BSkyB directly and indirectly, primarily through three of our customers who sell set-top boxes to BSkyB, accounted for $17.2 million, or 23%, of our total worldwide royalties and licenses revenue for 2007. BSkyB royalties and licenses revenue increased by $3.6 million compared to 2006 primarily as a result of increased shipments of our software, particularly our PVR software. We typically generate higher royalty rates from set-top boxes that include our PVR software, such as the set-top boxes shipped to BSkyB, and we expect the number of PVR shipments to increase as network operators seek to deploy more PVR functionality in the future. These increases were partially offset by a decrease in royalties and licenses revenue from other customers of $3.4 million, resulting from lower volumes of deployments by such customers.
| | • | | The Americas region accounted for $18.3 million in royalties and licenses revenue in 2007, a decrease of $5.0 million, or 21%, compared to 2006. |
EchoStar, including DISH Network and EchoStar Technologies Corporation, accounted for $7.7 million, or 10%, of our total worldwide royalties and licenses revenue for 2007. EchoStar royalties and licenses revenue declined $4.2 million as compared to 2006, due to reduced set-top box shipments and to a reduction in amortization of deferred royalties as compared to 2006. Our 2006 revenues had included the amortization of historic royalty payments we had received from EchoStar, which were being amortized over the original seven-year term of the applicable middleware license agreement. The middleware license agreement is currently renewable on an annual basis, and we now amortize revenues from EchoStar over the applicable one year renewal term. Royalties and licenses revenue from Bell ExpressVu in Canada declined $2.8 million as compared to 2006. This decrease was primarily due to an amendment to our license agreement with Bell ExpressVu entered into during the first quarter of 2007 that converted the pricing model from an upfront royalty to a recurring subscription fee per set-top box, payable over the term of the customer’s use of the set-top box incorporating our middleware. We expect the cumulative per set-top box subscription fees paid by Bell ExpressVu over the expected period of use of the set-top box to more than compensate for the relative difference between the amount of the prior upfront royalty and the recurring subscription fee. These reductions in royalties and licenses revenue were partially offset by increased royalties and licenses revenue from NET in Brazil of $1.8 million, as compared to 2006, reflecting increased deployments of our products, and an increase of $0.7 million from licenses to our OpenTV Eclipse product due to additional deployments by our customers. Royalties and licenses revenue from other customers in the region accounted for a net decrease of $0.5 million compared to 2006 due to lower deployments of our products.
| | • | | The Asia Pacific region accounted for $13.0 million in royalties and licenses revenue in 2007, an increase of $2.7 million, or 26%, compared to 2006. |
Royalties and licenses revenue from JCOM increased $1.3 million due to additional deployments of our video-on-demand products by JCOM beginning in the second quarter of 2007. Sales of our OpenTV Integrated Browser product increased $1.6 million in 2007, as compared to 2006, reflecting increased device sales by our customers. Increased royalty revenue from FOXTEL, for whom we first started recognizing revenues from middleware shipments during the second quarter of 2006, accounted for an increase of $1.5 million in 2007. These increases were partially offset by the one-time recognition of $1.2 million in license revenue from PartiTV during 2006, pursuant to a contract that was terminated in the third quarter of 2006. Royalties and licenses revenues from other customers accounted for a net decrease of $0.5 million due to fewer deployments.
34
2006 versus 2005.Royalties and licenses revenue for 2006 increased $10.8 million, or 20%, to $65.9 million.
| | • | | Europe, Middle East and Africa accounted for $32.3 million in royalties and licenses revenue in 2006, an increase of $4.0 million, or 14%, as compared to 2005. |
BSkyB directly and indirectly, primarily through three of our customers who sell set-top boxes to BSkyB, accounted for $13.6 million, or 21%, of our total worldwide royalties and licenses revenues for 2006. BSkyB royalties and licenses revenue increased by $4.6 million compared to 2006 primarily as a result of increased shipments of our software, particularly our PVR software. Royalties and licenses revenue from other customers represented a net decrease of $0.6 million compared to 2005, resulting from lower volumes of deployments by such customers.
| | • | | The Americas region accounted for $23.3 million in royalties and licenses revenue in 2006, an increase of $2.7 million, or 13%, as compared to 2005. |
EchoStar accounted for $11.9 million, or 18%, of our total worldwide royalties and licenses revenues for 2006. EchoStar royalties and licenses revenue declined $1.5 million, as compared to 2005, due to reduced set-top box shipments and a reduction in the rate of amortization of our EchoStar revenues. Royalties and licenses revenue from Bell ExpressVu increased $0.3 million, as compared to 2005, due to increased deployments. NET in Brazil, which was a new customer in 2006, accounted for an increase of $2.3 million in royalties and licenses revenue as compared to 2005. Royalties and licenses revenue from our OpenTV Eclipse product accounted for an increase of $3.3 million from 2005, as a result of our acquisition of substantially all of the campaign management assets of CAM Systems, L.L.C., which we refer to as CAMS, and its affiliates in September 2005. Other customers accounted for a net decrease of $1.7 million, resulting from lower volumes of deployments of our products by such customers.
| | • | | The Asia Pacific region accounted for $10.3 million in royalties and licenses revenues in 2006, an increase of $4.1 million, or 66%, as compared to 2005. |
We recorded a one-time license fee of $1.2 million from PartiTV in 2006 pursuant to a contract that was terminated in the third quarter of 2006. Sales of our OpenTV Integrated Browser product increased $0.6 million in 2006 compared to 2005, reflecting increased device sales by our customers. In addition, royalties and licenses revenue from other customers in the region accounted for a net increase of $2.3 million, resulting from higher volumes of deployments from such customers.
Services and other
Services and other revenues consist primarily of professional services, maintenance and support, training, service usage fees, revenue sharing arrangements, and programming fees. Professional services revenues are generally derived from deployment and integration consulting engagements for network operators, set-top box manufacturers, and system integrators. Service usage fees and revenue sharing arrangements were historically derived from our PlayMonteCarlo gaming channel, which was sold in the fourth quarter of 2006, and from revenue sharing arrangements for our advertising and other interactive services. We also derived programming fees in 2006 from our NASCAR service agreement, which was not renewed for the 2007 season, and from other programmers.
Maintenance, support and training revenues are generally realized as services are provided to network operators and set-top box manufacturers. A set-top box manufacturer’s decision to purchase maintenance and support from us depends largely on whether such manufacturer is actively shipping set-top boxes with our software or reasonably expects to do so in quantities large enough to justify payment of these amounts, which, in both cases, is dependent upon such manufacturer’s supply contracts with network operators and set-top box demand by the network operator.
35
Services and other revenues were as follows (in millions, except percentages):
| | | | | | | | | | | | | | | | | | | | | | | | |
| | | Year Ended December 31, | | | Change | |
| | | 2007 | | | 2006 | | | 2005 | | | 2007 versus 2006 | | | 2006 versus 2005 | |
| | | | | | | | | | | | $ | | % | | | $ | | % | |
Total services and other revenues | | $ | 36.3 | | | $ | 29.3 | | | $ | 23.1 | | | $ | 7.0 | | 24 | % | | $ | 6.2 | | 27 | % |
As percentage of total revenues | | | 33 | % | | | 31 | % | | | 30 | % | | | | | | | | | | | | |
2007 versus 2006.Services and other revenues for 2007 increased $7.0 million, or 24%, to $36.3 million.
Services and other revenues from UGC increased $7.9 million in 2007, of which $4.8 million represented amounts deferred since 2004 and recognized as a result of the contract amendment entered into between the parties and final delivery of all remaining licensed products during the fourth quarter of 2007. The remainder of the increase was generated from discrete professional services pertaining to 2007 activities and maintenance and support. Professional services revenue and maintenance and support revenues from JCOM increased $3.0 million from 2006 resulting from a new project that began during 2007. Professional services and maintenance and support revenues from FOXTEL increased $1.1 million from 2006 as a result of increased professional services work and a full year of maintenance and support revenues recognized in 2007. Maintenance and support revenues relating to our OpenTV Eclipse product increased $0.5 million as compared to 2006 due to increased deployments of that product. These increases were offset by a decrease of $1.1 million from other customers due to the substantial completion of certain discrete development and integration service engagements in 2006, a decrease of $1.9 million in NASCAR service revenue as our service agreement was not renewed for the 2007 season, a decrease of $2.5 million in PlayMonteCarlo revenue resulting from the sale of our PlayMonteCarlo betting and gaming channel in the fourth quarter of 2006.
2006 versus 2005.Services and other revenues for 2006 increased $6.2 million, or 27%, to $29.3 million.
During 2006, we realized increases of $4.2 million in services and other revenues from advanced advertising related services and support primarily related to products acquired through our CAMS acquisition; increases of $2.5 million in fees from middleware solutions development and integration service engagements; and increases of $1.0 million in maintenance and support fees from other middleware solutions customers. These increases were offset in 2006 by a decrease of $1.1 million resulting from increased competition and the fourth quarter sale of our PlayMonteCarlo betting and gaming channel in the United Kingdom, and a net decline of $0.4 million in services revenues from other customers.
Cost of Royalties and Licenses
Cost of royalties and licenses consists primarily of materials and shipping costs, revenue share costs, amortization of developed technology and patents, and patent-related legal costs. Cost of royalties and licenses was as follows (in millions, except percentages):
| | | | | | | | | | | | | | | | | | | | | | | | | |
| | | Year Ended December 31, | | | Change | |
| | | 2007 | | | 2006 | | | 2005 | | | 2007 versus 2006 | | | 2006 versus 2005 | |
| | | | | | | | | | | | $ | | | % | | | $ | | % | |
Cost of royalties and licenses | | $ | 5.1 | | | $ | 7.8 | | | $ | 6.4 | | | $ | (2.7 | ) | | (35 | )% | | $ | 1.4 | | 22 | % |
As percentage of total revenues | | | 5 | % | | | 8 | % | | | 8 | % | | | | | | | | | | | | | |
2007 versus 2006.Cost of royalties and licenses for 2007 decreased $2.7 million, or 35%, to $5.1 million. As a percentage of revenues, cost of royalties and licenses decreased to 5% in 2007 compared to 8% in 2006. The decreases were primarily due to a $2.2 million decrease in patent-related legal costs, which included a $1.5 million favorable litigation settlement received in the fourth quarter of 2007, and a $0.6 million decrease in the
36
amortization of developed technologies and patents reflecting the full amortization of some of our developed technologies and patents.
2006 versus 2005.Cost of royalties and licenses for 2006 increased $1.4 million, or 22%, to $7.8 million. As a percentage of revenues, cost of royalties and licenses remained unchanged at 8%. The increase was primarily a result of a full year’s amortization of $0.9 million for developed technology from our CAMS acquisition, and increased patent-related legal costs of $0.2 million.
Cost of Services and Other
Cost of services and other consists primarily of personnel and personnel-related support costs associated with maintenance and support, professional services engagements, consulting and subcontractor costs, third party material costs, depreciation, and network infrastructure and bandwidth costs of our interactive and betting channel, which was sold in the fourth quarter of 2006. Cost of services and other was as follows (in millions, except percentages):
| | | | | | | | | | | | | | | | | | | | | | | | |
| | | Year Ended December 31, | | | Change | |
| | | 2007 | | | 2006 | | | 2005 | | | 2007 versus 2006 | | | 2006 versus 2005 | |
| | | | | | | | | | | | $ | | % | | | $ | | % | |
Cost of services and other | | $ | 42.9 | | | $ | 33.2 | | | $ | 21.4 | | | $ | 9.7 | | 29 | % | | $ | 11.8 | | 55 | % |
As percentage of total revenues | | | 39 | % | | | 35 | % | | | 27 | % | | | | | | | | | | | | |
2007 versus 2006.Cost of services and other for 2007 increased $9.7 million, or 29%, to $42.9 million. As a percentage of revenues, cost of services and other increased to 39% in 2007 as compared to 35% in 2006. An increase in personnel and personnel-related support costs accounted for $4.6 million of the total increase, resulting from the need to increase staffing for new and ongoing projects in 2007. In addition, we experienced an increase of $6.1 million in consulting and subcontractor costs in 2007 associated with staffing professional service engagements. These increases were offset by a decrease of $1.2 million in network infrastructure and bandwidth costs in 2007, which reflected the sale of our PlayMonteCarlo gaming business in the fourth quarter of 2006 and the non-renewal of our NASCAR contract in 2007.
2006 versus 2005.Cost of services and other for 2006 increased $11.8 million, or 55%, to $33.2 million. As a percentage of revenues, cost of services and other increased to 35% in 2006 as compared to 27% in 2005. An increase in personnel and personnel-related support costs accounted for $11.5 million of the total increase, of which $9.5 million resulted from the need to increase staffing for new and ongoing projects and the re-assignment of staff from research and development projects to customer projects in 2006 and $2.0 million resulted from the full year impact of our acquisition of CAMS and its related headcount. We also incurred an additional $0.5 million of share-based compensation costs as a result of our adoption of SFAS 123(R) in 2006. In addition, we experienced an increase of $2.0 million in consulting and subcontractor costs associated with staffing professional services engagements. These increases were partially offset by a net decrease of $1.9 million in network infrastructure and bandwidth costs in 2006 associated with our PlayMonteCarlo channel.
Research and Development
Research and development expenses consist primarily of personnel and personnel-related support costs, consulting and subcontractor costs incurred for both new product development and enhancements to our existing software products and applications. Research and development remains important to our long-term growth strategy. We will continue to focus on the timely development of new and enhanced interactive television products for our customers, and we plan to continue investing at levels that are sufficient to develop our technologies and product offerings.
37
Research and development expenses were as follows (in millions, except percentages):
| | | | | | | | | | | | | | | | | | | | | | | | | |
| | | Year Ended December 31, | | | Change | |
| | | 2007 | | | 2006 | | | 2005 | | | 2007 versus 2006 | | | 2006 versus 2005 | |
| | | | | | | | | | | | $ | | % | | | $ | | | % | |
Research and development | | $ | 32.7 | | | $ | 30.7 | | | $ | 31.0 | | | $ | 2.0 | | 7 | % | | $ | (0.3 | ) | | (1 | )% |
As percentage of total revenues | | | 30 | % | | | 32 | % | | | 40 | % | | | | | | | | | | | | | |
2007 versus 2006.Research and development expenses for 2007 increased $2.0 million, or 7%, to $32.7 million. As a percentage of revenues, research and development expenses decreased to 30% in 2007 as compared to 32% in 2006. The increased expenses were primarily due to an increase of $1.4 million in personnel and personnel-related support costs associated with increased staffing, and an increase of $0.6 million in other costs.
2006 versus 2005.Research and development expenses for 2006 decreased $0.3 million, or 1%, to $30.7 million. As a percentage of revenues, research and development expenses decreased to 32% in 2006 as compared to 40% in 2005. The decrease was primarily due to a decrease of $0.6 million in personnel and personnel-related support costs as the result of the reassignment of staff from research and development to cost of services and other in 2006, and a decrease of $0.4 million in depreciation expense as a result of fully depreciating certain fixed assets, which offset an increase of $0.7 million for share-based compensation included as a result of our adoption of SFAS 123(R) in 2006.
Sales and Marketing
Sales and marketing expenses consist primarily of personnel and personnel-related support costs, consulting and subcontractor costs, and marketing-related expenses. Sales and marketing expenses were as follows (in millions, except percentages):
| | | | | | | | | | | | | | | | | | | | | | | | | |
| | | Year Ended December 31, | | | Change | |
| | | 2007 | | | 2006 | | | 2005 | | | 2007 versus 2006 | | | 2006 versus 2005 | |
| | | | | | | | | | | | $ | | | % | | | $ | | % | |
Sales and marketing | | $ | 10.8 | | | $ | 11.9 | | | $ | 11.0 | | | $ | (1.1 | ) | | (9 | )% | | $ | 0.9 | | 8 | % |
As percentage of total revenues | | | 10 | % | | | 13 | % | | | 14 | % | | | | | | | | | | | | | |
2007 versus 2006.Sales and marketing expenses for 2007 decreased $1.1 million, or 9%, to $10.8 million. As a percentage of revenues, sales and marketing expenses decreased to 10% in 2007 as compared to 13% in 2006. The decrease was primarily due to a decrease of $0.4 million in personnel and personnel-related support costs, and a decrease of $0.7 million in marketing costs.
2006 versus 2005.Sales and marketing expenses for 2006 increased $0.9 million, or 8%, to $11.9 million. As a percentage of revenues, sales and marketing expenses decreased to 13% in 2006 as compared to 14% in 2005. The increased expenses were primarily attributable to $0.5 million of share-based compensation costs included as a result of the adoption of SFAS 123(R) in 2006, and an increase of $0.8 million in marketing expenses. These increases were offset by a decrease of $0.3 million in personnel and personnel-related support costs.
38
General and Administrative
General and administrative expenses consist primarily of personnel and personnel-related support costs, including for our executives and our board of directors, fees for professional services, including legal and accounting fees, and provision for doubtful accounts. General and administrative expenses were as follows (in millions, except percentages):
| | | | | | | | | | | | | | | | | | | | | | | | |
| | | Year Ended December 31, | | | Change | |
| | | 2007 | | | 2006 | | | 2005 | | | 2007 versus 2006 | | | 2006 versus 2005 | |
| | | | | | | | | | | | $ | | % | | | $ | | % | |
General and administrative | | $ | 21.6 | | | $ | 18.0 | | | $ | 15.5 | | | $ | 3.6 | | 20 | % | | $ | 2.5 | | 16 | % |
As percentage of total revenues | | | 20 | % | | | 19 | % | | | 20 | % | | | | | | | | | | | | |
2007 versus 2006.General and administrative expenses for 2007 increased $3.6 million, or 20%, to $21.6 million. As a percentage of revenues, general and administrative expenses increased to 20% in 2007 as compared to 19% in 2006. The increase was primarily due to an increase of $2.4 million in personnel and personnel-related support costs, which included severance and other costs of $2.0 million for former senior executive officers. There was also an increase of $0.6 million in provisions for doubtful accounts, and an increase of $0.5 million related to administrative fees.
2006 versus 2005.General and administrative expenses for 2006 increased $2.5 million, or 16%, to $18.0 million. As a percentage of revenues, general and administrative expenses decreased to 19% in 2006 as compared to 20% in 2005. The increased expenses were primarily due to $1.6 million of share-based compensation costs included as a result of the adoption of SFAS 123(R) in 2006, and an increase of $2.4 million in professional fees for consulting and legal services and for work related to our audit and Sarbanes-Oxley compliance efforts. These increases were offset by a decrease of $1.2 million in personnel and personnel-related support costs.
Restructuring and Impairment Costs
Restructuring and impairment costs were as follows (in millions, except percentages):
| | | | | | | | | | | | | | | | | | | | | | | | | | |
| | | Year Ended December 31, | | | Change | |
| | | 2007 | | | 2006 | | | 2005 | | | 2007 versus 2006 | | | 2006 versus 2005 | |
| | | | | | | | | | | | $ | | | % | | | $ | | | % | |
Restructuring and impairment costs | | $ | 0.3 | | | $ | 1.0 | | | $ | 2.5 | | | $ | (0.7 | ) | | (70 | )% | | $ | (1.5 | ) | | (60 | )% |
As percentage of total revenues | | | — | % | | | 1 | % | | | 3 | % | | | | | | | | | | | | | | |
During the last three years we have undertaken several initiatives to reduce operating expenses around the world. As a result of these actions, eight employees were included in workforce reduction plans in 2007, five employees in 2006, and seven employees in 2005. Provision was also made for excess office space and the write-down of leasehold improvements and other property and equipment that were abandoned.
During 2007, we recorded restructuring charges of $0.3 million, which represented a fourth quarter workforce reduction in the United States and the United Kingdom.
During 2006, we recorded restructuring charges of $1.0 million, which included a fourth quarter restructuring provision of $0.1 million related to the workforce reduction of our PlayMonteCarlo operations in the United Kingdom, and of $0.9 million related to the plan to terminate three senior executives in our United States corporate headquarters.
During 2005, we recorded restructuring charges of $2.5 million, which included a first quarter restructuring and impairment provision of $0.4 million related to the closure of our Lexington, Massachusetts facility, a
39
second quarter restructuring provision of $1.7 million for excess office space in New York, and a third quarter restructuring provision of $0.4 million for a workforce reduction in the United States and Switzerland.
Amortization of Intangible Assets
Intangible assets are amortized on a straight-line basis over the estimated useful life of three to 13 years. As noted above, cost of royalties and licenses includes amounts relating to the amortization of developed technologies and patents. Amortization of intangible assets, excluding these developed technologies and patents, was as follows (in millions, except percentages):
| | | | | | | | | | | | | | | | | | | | | | | | | |
| | | Year Ended
December 31, | | | Change | |
| | | 2007 | | | 2006 | | | 2005 | | | 2007 versus 2006 | | | 2006 versus 2005 | |
| | | | | | | | | | | | $ | | | % | | | $ | | % | |
Amortization of intangible assets | | $ | 1.6 | | | $ | 2.1 | | | $ | 1.7 | | | $ | (0.5 | ) | | (24 | )% | | $ | 0.4 | | 24 | % |
As percentage of total revenues | | | 1 | % | | | 2 | % | | | 2 | % | | | | | | | | | | | | | |
2007 versus 2006.Amortization of intangible assets for 2007 decreased $0.5 million, or 24%, to $1.6 million. The decrease resulted from the expiration of the amortization period for certain intangible assets from our acquisition of Wink Communications, Inc. in the fourth quarter of 2002.
2006 versus 2005.Amortization of intangible assets for 2006 increased $0.4 million, or 24%, to $2.1 million. The increase resulted from the inclusion of certain intangible assets from our CAMS acquisition in the third quarter of 2005.
Impairment of goodwill
Impairment of goodwill was as follows (in millions, except percentages):
| | | | | | | | | | | | | | | | | | | | | | | | | |
| | | Year Ended December 31, | | | Change | |
| | | 2007 | | | 2006 | | | 2005 | | | 2007 versus 2006 | | | 2006 versus 2005 | |
| | | | | | | | | | | | $ | | | % | | | $ | | % | |
Impairment of goodwill | | $ | — | | | $ | 0.8 | | | $ | — | | | $ | (0.8 | ) | | (100 | )% | | $ | 0.8 | | 100 | % |
As percentage of total revenues | | | — | % | | | 1 | % | | | — | % | | | | | | | | | | | | | |
During the fourth quarter of 2006, we were informed by iN DEMAND that NASCAR would not be renewing their distribution arrangement with them, and that as a result, iN DEMAND would not be renewing our production agreement. As a result, we recorded an impairment charge of $0.8 million in our advertising solutions segment representing the entire goodwill balance for this reporting unit.
Interest Income
Interest income consists primarily of interest earned on our cash and cash equivalents, and marketable debt securities, net of interest expense. Interest income was as follows (in millions):
| | | | | | | | | | | | | | | | | | | | | |
| | | Year Ended December 31, | | Change | |
| | | 2007 | | 2006 | | 2005 | | 2007 versus 2006 | | | 2006 versus 2005 | |
| | | | | | | | | $ | | % | | | $ | | % | |
Interest income | | $ | 3.2 | | $ | 3.0 | | $ | 1.7 | | $ | 0.2 | | 7 | % | | $ | 1.3 | | 76 | % |
Interest income has increased year on year primarily due to the increased effective interest rates and increases in our investment portfolio and cash position.
40
Other Income and Expense Items
Other income and expense items consist primarily of gains or losses from foreign currency exchange, gains or losses on the disposal of capital assets, miscellaneous income, and other extraordinary items. The net of other income and expense items was as follows (in millions):
| | | | | | | | | | | | | | | | | | | | | | |
| | | Year Ended December 31, | | Change | |
| | | 2007 | | 2006 | | 2005 | | 2007 versus 2006 | | | 2006 versus 2005 | |
| | | | | | | | | $ | | % | | | $ | | | % | |
Other income | | $ | 2.8 | | $ | 0.4 | | $ | 3.8 | | $ | 2.4 | | 600 | % | | $ | (3.4 | ) | | (89 | )% |
For 2007, net other income primarily reflected a gain from the sale of a cost investment.
For 2005, net other income of $3.8 million included a gain of $3.1 million from the sale of a cost investment, and a gain of $0.5 million related to a contract amendment with Sun Microsystems for use of its Java technology in our products. That amendment reduced our payment obligation to Sun to an amount that was $0.5 million less than the amount we had previously accrued as a charge in 2004 in respect of that agreement.
Minority Interest
In November 2000, we established Spyglass Integration, Inc., a joint venture with Motorola. We recorded a gain with respect to Motorola’s share of losses in this venture. Minority interest was as follows (in millions):
| | | | | | | | | | | | | | | | | | | | | | |
| | | Year Ended December 31, | | Change | |
| | | 2007 | | 2006 | | 2005 | | 2007 versus 2006 | | | 2006 versus 2005 | |
| | | | | | | | | $ | | | % | | | $ | | % | |
Minority interest | | $ | — | | $ | 0.1 | | $ | 0.1 | | $ | (0.1 | ) | | (100 | )% | | $ | — | | — | % |
Minority interest recorded during 2007 was nominal.
Income Taxes
Effective January 1, 2007, we adopted the provisions of FASB Interpretation (FIN) No. 48,“Accounting for Uncertainty in Income Taxes”(FIN 48), which provisions included a two-step approach to recognizing, de-recognizing and measuring uncertain tax positions accounted for in accordance with SFAS No. 109,“Accounting for Income Taxes”(SFAS 109). As a result of the implementation of FIN 48, we recognized an increase of approximately $2.6 million in the liability for unrecognized tax benefits and a decrease in the related reserve of the same amount. No material adjustment to the balance of retained earnings as of January 1, 2007 was required. As of December 31, 2007, unrecognized tax benefits approximated $2.3 million, $2.0 million of which would affect the effective tax rate if recognized.
We estimate that we had net United States federal tax loss carryforwards of approximately $191 million at the end of 2007, although our ability to make use of those tax loss carryforwards may be limited under applicable tax regulations. The calculation of those tax loss carryforwards is a complex matter and may require a reassessment from time to time, which could result in changes to that estimate. For all periods presented, substantially all federal tax benefits related to our losses have been offset by an increase in the valuation allowance against the resulting deferred tax assets. Notwithstanding those federal tax loss carryforwards, we are subject to income taxes in certain state and foreign jurisdictions and we have foreign taxes withheld from certain royalty payments.
41
Income tax expense consists primarily of foreign taxes, state taxes, tax benefits or refunds, and changes to reserves for identified potential foreign tax exposures. Incomes taxes were as follows (in millions):
| | | | | | | | | | | | | | | | | | | | | | |
| | | Year Ended December 31, | | Change | |
| | | 2007 | | 2006 | | 2005 | | 2007 versus 2006 | | | 2006 versus 2005 | |
| | | | | | | | | $ | | | % | | | $ | | % | |
Income tax expense | | $ | 1.2 | | $ | 2.9 | | $ | 1.2 | | $ | (1.7 | ) | | (59 | )% | | $ | 1.7 | | 142 | % |
Our income tax expense was $1.2 million for 2007, primarily attributable to foreign and state taxes and offset by decreases to reserves for identified potential foreign tax exposures.
Our income tax expense was $2.9 million for 2006, primarily attributable to state taxes and increases to reserves for identified potential foreign tax exposures. This amount was net of a tax refund of $0.5 million obtained in Australia in 2006 and tax benefits of $0.7 million in 2006 attributable to a Swiss ruling on our intercompany cost-sharing agreement.
Our income tax expense of $1.2 million for 2005 was primarily attributable to foreign and state taxes of $1.4 million. These were offset by a benefit resulting from a reduction in our valuation allowance for Swiss deferred tax assets where management believed it was more likely than not that the benefit would be realized.
Discontinued Operations
In September 2007, we signed a letter of intent to sell Static 2358 Holdings Ltd., which operated our PlayJam games business. The transaction closed on December 31, 2007. In accordance with SFAS 144, the business unit has been reclassified as a discontinued operation.
As a result of reassessment of the carrying value of the long-lived assets of the discontinued operations in accordance with SFAS 144 and SFAS 142, during 2007, we recorded an impairment charge to goodwill of $3.6 million and a loss of $1.5 million. See Note 6 (Discontinued Operations) to the Consolidated Financial Statement for further information.
Business Segment Results
In August 2007, Ben Bennett was appointed Chief Operating Officer and Acting Chief Executive Officer and was subsequently appointed as Chief Executive Officer in March 2008. Accordingly, Mr. Bennett is our chief operating decision maker, or CODM. As part of the management change in August 2007, we reorganized our reporting units in an effort to provide management with better information for allocating the company’s resources and assessing performance in accordance with the new management team’s strategic focus. Our CODM currently assesses our results and financial performance and reviews our internal budgeting reports on the basis of two segments: middleware solutions and advertising solutions. We have prepared this segment analysis in accordance with SFAS 131, and accordingly, we have restated the segment information for all earlier periods presented in our Consolidated Financial Statements.
Middleware solutions includes set-top box middleware and embedded browser technologies, such as OpenTV Spyglass, as well as software components that are deployed at the network operator’s headend.
Advertising solutions have included our OpenTV Eclipse and Advision products, our PlayJam business, our NASCAR service and related technologies, our PlayMonteCarlo betting and gaming channel, and our OpenTV Participate product. Beginning in 2007, we no longer operate our NASCAR service or the PlayMonteCarlo betting and gaming channel. In September 2007, we signed a letter of intent to sell Static 2358 Holdings Ltd., which operated our PlayJam games business, and closed the transaction on December 31, 2007. In accordance with SFAS 144, the financial results of our PlayJam games business have been reclassified as a discontinued operation in our Consolidated Financial Statements for all periods presented.
42
Our management reviews and assesses the “contribution margin” of each of these segments, which is not a financial measure calculated in accordance with GAAP. We define contribution margin for these purposes as segment revenues less related, direct or indirect, allocable costs, including personnel and personnel-related support costs, communications, facilities, maintenance & support, consulting and subcontractor costs, travel, marketing and network infrastructure and bandwidth costs. There are significant judgments management makes with respect to the direct and indirect allocation of costs that may affect the calculation of contribution margins. While management believes these and other related judgments are reasonable and appropriate, others could assess such matters in ways different than our company’s management.
Contribution margin is a non-GAAP financial measure which excludes unallocated corporate support, interest, taxes, depreciation and amortization, amortization of intangible assets, share-based compensation, impairment of goodwill, impairment of intangibles, other income, minority interest, restructuring provisions, and unusual items such as contract amendments that mitigated potential loss positions. These exclusions reflect costs not considered directly allocable to individual business segments and result in a definition of contribution margin that does not take into account the substantial cost of doing business. Management believes that segment contribution margin is a helpful measure in evaluating the performance of our business segments. While our management may consider contribution margin to be an important measure of comparative operating performance, this measure should be considered in addition to, but not as a substitute for, loss from operations, net loss, cash flow and other measures of financial performance prepared in accordance with GAAP that are otherwise presented in our financial statements. In addition, our calculation of contribution margin may be different from the calculation used by other companies and, therefore, comparability may be affected.
Because these segments reflect the manner in which management reviews our business, they necessarily involve judgments that management believes are reasonable in light of the circumstances under which they are made. These judgments may change over time or may be modified to reflect new facts or circumstances. Segments may also be changed or modified to reflect technologies and applications that are newly created, or that change over time, or other business conditions that evolve, each of which may result in reassessing specific segments and the elements included within each of those segments. Recent events, including changes in senior management, may affect the manner in which we present segments in the future.
Middleware Solutions
Revenues and contribution margin of our middleware solutions segment were as follows (in millions, except percentages):
| | | | | | | | | | | | | | | | | | | | | | | | | |
| | | Year Ended December 31, | | | Change | |
| | | 2007 | | | 2006 | | | 2005 | | | 2007 versus 2006 | | | 2006 versus 2005 | |
| | | | | | | | | | | | $ | | % | | | $ | | | % | |
Royalties and licenses | | $ | 68.7 | | | $ | 60.7 | | | $ | 54.3 | | | $ | 8.0 | | 13 | % | | $ | 6.4 | | | 12 | % |
Services and other | | | 29.0 | | | | 18.2 | | | | 14.9 | | | | 10.8 | | 59 | % | | | 3.3 | | | 22 | % |
| | | | | | | | | | | | | | | | | | | | | | | | | |
Total middleware solutions | | $ | 97.7 | | | $ | 78.9 | | | $ | 69.2 | | | $ | 18.8 | | 24 | % | | $ | 9.7 | | | 14 | % |
| | | | | | | | | | | | | | | | | | | | | | | | | |
As percentage of total revenues | | | 89 | % | | | 83 | % | | | 88 | % | | | | | | | | | | | | | |
| | | | | | | |
Contribution margin—middleware solutions | | $ | 32.1 | | | $ | 27.7 | | | $ | 28.0 | | | $ | 4.4 | | 16 | % | | $ | (0.3 | ) | | (1 | )% |
| | | | | | | | | | | | | | | | | | | | | | | | | |
2007 versus 2006.Total revenues from the middleware solutions segment for 2007 increased $18.8 million, or 24%, to $97.7 million.
Royalties and licenses revenue from the middleware solutions account for the majority of our overall royalties and licenses. Royalties and licenses from set-top box shipments and other product sales accounted for 70% and 77% of segment revenues for the years ended December 31, 2007 and 2006, respectively. Royalties and
43
licenses from the middleware solutions for 2007 increased $8.0 million, or 13%, to $68.7 million. As described under“Royalties and licenses” in “Revenues” above, the increases were primarily due to the recognition of $9.9 million in royalties and licenses revenues from UGC, an increase of $1.8 million from NET in Brazil reflecting increased deployments of our products, an increase of $3.6 million in royalties and licenses revenues from BSkyB primarily from increased shipments of our software, particularly our PVR software, an increase of $1.3 million in royalties revenue from JCOM resulting from additional deployments of our video-on-demand products that began during the second quarter of 2007, and an increase of $1.5 million from FOXTEL, for whom we first started recognizing revenues from middleware shipments during the second quarter of 2006. These increases were offset by a decrease of $4.2 million in revenues from EchoStar due to reduced set-top box shipments and a reduction in amortization, a decrease of $2.8 million from Bell ExpressVu due to an amendment to our license agreement with Bell ExpressVu entered into during the first quarter of 2007 that converted the pricing model from an upfront royalty to a recurring subscription fee per set-top box, payable over the term of the customer’s use of the set-top box incorporating our middleware, and a net decrease of $3.1 million from other middleware customers.
Services and other revenues accounted for 30% and 23% of segment revenues in 2007 and 2006, respectively. Services and other revenues from the middleware solutions segment in 2007 increased $10.8 million, or 59%, to $29.0 million. As described under“Services and other” in “Revenues” above, the increase in 2007 was due to an increase of $7.9 million in professional services and maintenance and support revenues from UGC, an increase of $3.0 million from professional services and maintenance and support revenues from JCOM due to a new project that began during 2007, and an increase of $1.1 million in professional services and maintenance and support revenues from FOXTEL as a result of increased professional service work and reflecting a full year of maintenance and support revenue. The increases were offset by decreased services and other revenues from other customers of $1.2 million.
Middleware solutions costs consist primarily of personnel and personnel-related support costs and consulting and subcontractor costs associated with professional services engagements. Total contribution margin for the middleware solutions business for 2007 increased $4.4 million, or 16%, to $32.1 million, resulting from higher revenues and $1.5 million from a favorable litigation settlement as mentioned in“Cost of Royalties and Licenses”above, which were partially offset by other increased costs in the segment.
2006 versus 2005. Total revenues from the middleware solutions segment for 2006 increased $9.7 million, or 14%, to $78.9 million.
Royalties and licenses revenue accounted for 77% and 78% of segment revenues for the years ended December 31, 2006 and 2005, respectively. Royalties and licenses from the middleware solutions business for 2006 increased $6.4 million, or 12%, to $60.7 million. As described under“Royalties and licenses” in“Revenues” above, the increases were primarily due to an increase of $4.6 million in royalties and licenses revenues from BSkyB as a result of increased standard set-top box shipments and increased shipments of our PVR software, an increase of $2.3 million from NET in Brazil, which was a new customer in 2006, and a net increase of $1.0 million from other customers resulting from higher volumes of deployments by such customers. These increases were offset by a decrease of $1.5 million in revenues from EchoStar due to reduced set-top box shipments and to a reduction in amortization.
Services and other revenues accounted for 23% and 22% of segment revenues in 2006 and 2005, respectively. Services and other revenues from the middleware solutions segment in 2006 increased $3.3 million, or 22%, to $18.2 million. As described under“Services and other” in“Revenues” above, the increases were primarily due to an increase of $2.1 million in fees from development and integration service engagements involving our middleware solutions, and an increase of $1.2 million in maintenance and support fees from our middleware solutions customers.
Total contribution margin for the middleware solutions segment for 2006 decreased $0.3 million, or 1%, to $27.7 million resulting from increased personnel and personnel-related support costs, and consulting and
44
subcontractor costs, which exceeded the increased middleware solutions segment revenues due to a continued investment in this segment.
Advertising Solutions
Revenues and contribution margin of our advertising solutions segment were as follows (in millions, except percentages):
| | | | | | | | | | | | | | | | | | | | | | | | | |
| | | Year Ended December 31, | | | Change | |
| | | 2007 | | | 2006 | | | 2005 | | | 2007 versus 2006 | | | 2006 versus 2005 | |
| | | | | | | | | | | | $ | | | % | | | $ | | % | |
Royalties and licenses | | $ | 5.0 | | | $ | 5.2 | | | $ | 0.8 | | | $ | (0.2 | ) | | (4 | )% | | $ | 4.4 | | 550 | % |
Services and other | | | 7.3 | | | | 11.1 | | | | 8.2 | | | | (3.8 | ) | | (34 | )% | | | 2.9 | | 35 | % |
| | | | | | | | | | | | | | | | | | | | | | | | | |
Total advertising solutions revenues | | $ | 12.3 | | | $ | 16.3 | | | $ | 9.0 | | | $ | (4.0 | ) | | (25 | )% | | $ | 7.3 | | 81 | % |
| | | | | | | | | | | | | | | | | | | | | | | | | |
As percentage of total revenues | | | 11 | % | | | 17 | % | | | 12 | % | | | | | | | | | | | | | |
| | | | | | | |
Contribution margin—advertising solutions | | $ | (0.4 | ) | | $ | (1.4 | ) | | $ | (7.1 | ) | | $ | 1.0 | | | 71 | % | | $ | 5.7 | | 80 | % |
| | | | | | | | | | | | | | | | | | | | | | | | | |
2007 versus 2006.Total revenues from the advertising solutions segment for 2007 decreased $4.0 million, or 25%, to $12.3 million.
Royalties and licenses revenue from the advertising solutions segment for 2007 decreased $0.2 million, or 4%, to $5.0 million. As described under“Royalties and licenses” in “Revenues” above, the decrease was primarily due to the one-time recognition of $1.2 million in licensing revenue from PartiTV in 2006 pursuant to a contract that was terminated in the third quarter of 2006, which was partially offset by an increase of $0.7 million in revenues from additional deployments of our OpenTV Eclipse software product. Royalties and license revenue from other customers in the advertising solutions segment accounted for a net increase of $0.3 million.
Services and other revenues from the advertising solutions for 2007 decreased $3.8 million, or 34%, to $7.3 million. As described under“Services and other” in“Revenues” above, this was primarily due to a decrease of $1.9 million in NASCAR service revenue as our service agreement was not renewed for the 2007 season, and a decrease of $2.5 million in PlayMonteCarlo revenue resulting from the sale of our PlayMonteCarlo betting and gaming channel in the fourth quarter of 2006. This decrease was partially offset by an increase of $0.5 million in maintenance and support revenues associated with our OpenTV Eclipse product due to increased deployments. Services and other revenues from other customers in the advertising solutions segment accounted for a net increase of $0.1 million.
Total contribution margin for the advertising solutions segment for 2007 increased $1.0 million, or 71%, from 2006 to a loss of $0.4 million, primarily as a result of the sale in the fourth quarter of 2006 of our PlayMonteCarlo betting and gaming channel, which generated a negative contribution margin of $1.0 million in 2006.
2006 versus 2005.Total revenues from the advertising solutions segment for 2006 increased $7.3 million, or 81%, to $16.3 million.
Royalties and licenses from the advertising solutions segment for 2006 increased $4.4 million, or 550%, to $5.2 million. As described under“Royalties and licenses” in “Revenues” above, primarily due to an increase of $3.3 million from 2005, principally as a result of our acquisition of substantially all of the campaign management assets of CAMS and its affiliates in September 2005, and the one-time recognition of $1.2 million in licensing revenue from PartiTV for 2006 pursuant to a contract that was terminated in the third quarter of 2006. Royalties and licenses from other customers in the advertising solutions accounted for a net decrease of $0.1 million.
45
Services and other revenues from the advertising solutions segment for 2006 increased $2.9 million, or 35%, to $11.1 million. As described under“Services and other” in“Revenues” above, revenues from our OpenTV Eclipse product accounted for an increase of $3.8 million. The increase was partially offset by a decrease of $1.1 million resulting from increased competition and the fourth quarter 2006 sale of our PlayMonteCarlo betting and gaming channel in the United Kingdom. Services and other revenues from other customers accounted for a net increase of $0.2 million.
Total contribution loss for the advertising solutions segment improved in 2006 by $5.7 million, primarily as a result of increased revenues, including revenues net of related and directly allocable costs from our CAMS acquisition, and the reduction in infrastructure and bandwidth costs and lower revenue sharing costs associated with reduced revenues from our PlayMonteCarlo channel.
Reconciliation of Contribution Margin to Net Loss
Total contribution margin reconciled to net loss on a GAAP basis was as follows (in millions):
| | | | | | | | | | | | | | | | | | | | | | | | |
| | | Year Ended December 31, | | | Change | |
| | | 2007 | | | 2006 | | | 2005 | | | 2007 versus
2006 | | | 2006 versus
2005 | |
| | | | | | | | | | | | $ | | % | | | $ | | % | |
Total contribution margin | | $ | 31.7 | | | $ | 26.3 | | | $ | 20.9 | | | $ | 5.4 | | 21 | % | | $ | 5.4 | | 26 | % |
Unallocated corporate overhead | | | (23.4 | ) | | | (21.3 | ) | | | (20.2 | ) | | | | | | | | | | | | |
Restructuring and impairment costs | | | (0.3 | ) | | | (1.0 | ) | | | (2.5 | ) | | | | | | | | | | | | |
Depreciation and amortization | | | (3.8 | ) | | | (3.1 | ) | | | (3.5 | ) | | | | | | | | | | | | |
Amortization of intangible assets | | | (5.9 | ) | | | (7.0 | ) | | | (5.8 | ) | | | | | | | | | | | | |
Share-based and non-cash compensation | | | (3.4 | ) | | | (3.4 | ) | | | (0.2 | ) | | | | | | | | | | | | |
Interest income | | | 3.2 | | | | 3.0 | | | | 1.7 | | | | | | | | | | | | | |
Other income | | | 2.8 | | | | 0.4 | | | | 3.8 | | | | | | | | | | | | | |
Minority interest | | | — | | | | 0.1 | | | | 0.1 | | | | | | | | | | | | | |
Impairment of goodwill | | | — | | | | (0.8 | ) | | | — | | | | | | | | | | | | | |
| | | | | | | | | | | | | | | | | | | | | | | | |
Profit (loss) before income taxes | | | 0.9 | | | | (6.8 | ) | | | (5.7 | ) | | | | | | | | | | | | |
Income tax expense | | | 1.2 | | | | 2.9 | | | | 1.2 | | | | | | | | | | | | | |
| | | | | | | | | | | | | | | | | | | | | | | | |
Net loss from continuing operations | | | (0.3 | ) | | | (9.7 | ) | | | (6.9 | ) | | | | | | | | | | | | |
Net loss from discontinued operations | | | (4.9 | ) | | | (1.1 | ) | | | (1.6 | ) | | | | | | | | | | | | |
| | | | | | | | | | | | | | | | | | | | | | | | |
Net loss | | $ | (5.2 | ) | | $ | (10.8 | ) | | $ | (8.5 | ) | | | | | | | | | | | | |
| | | | | | | | | | | | | | | | | | | | | | | | |
Deferred Revenue
When we apply our revenue recognition policy, we must determine which portions of our revenue are recognized currently and which portions must be deferred, principally in terms of SOP 97-2, SOP 81-1 and SAB 104. In order to determine current and deferred revenue, we make judgments and estimates with regard to future product and services deliverables and the appropriate valuation for those deliverables.
We have entered into multiple-element arrangements for products and services with customers including most notably:
| | • | | Essel Group (which operates the DishTV network in India) |
| | • | | EchoStar’s DISH Network |
46
Portions of the amounts that we have invoiced to Essel Group, EchoStar, FOXTEL and Austar under those arrangements have been deferred and will be recognized as revenue over time in our middleware solutions segment. Portions of those amounts that we have invoiced to Comcast under our agreement with Comcast will be recognized as revenue over time in our advertising solutions segment. The arrangements with these customers include maintenance and support, for which vendor specific objective evidence, or VSOE, of fair value did not exist at the time the respective agreement was signed with each customer. In addition, several of these arrangements provide for the delivery of specified future products, for which such evidence of fair value also did not exist. All revenues under arrangements for which we are obligated to provide specified future products and for which we do not have VSOE, are initially deferred. Upon final delivery of all specified products under each arrangement, recognition will then depend on whether or not VSOE of fair value for maintenance and support exists. In instances where VSOE of fair value for maintenance and support still does not exist, we will generally recognize all revenues from the arrangement either over the remaining contractual period of support or over the remaining period during which maintenance and support is expected to be provided. In instances where VSOE of fair value for maintenance and support exists, we will generally recognize the maintenance and support revenues over the remaining period and all other deferred revenues upon the final delivery of the specified products.
As of December 31, 2007, we recorded $24.1 million in deferred revenue compared with $25.6 million at the end of 2006. Of that total deferred amount at December 31, 2007, $14.7 million, or 61%, was deferred as a result of the arrangements with Essel Group, EchoStar, FOXTEL, Innovative Systems, Austar, and Comcast described in the preceding paragraphs. The remaining $9.4 million, or 39%, of our deferred revenue as of December 31, 2007 was principally attributable to maintenance and support and professional services arrangements with other customers, which are typically short-term in nature.
Based on our current estimates of final delivery for all specified products, we expect the following recognition of the $14.7 million of deferred revenue at December 31, 2007 resulting from the six customers listed in the preceding paragraph (in millions):
| | | |
Year Ending December 31, | | Expected Recognition
of Deferred Revenue |
2008 | | $ | 7.6 |
2009 | | | 4.4 |
Thereafter | | | 2.7 |
| | | |
| | $ | 14.7 |
| | | |
In order to determine the expected recognition of deferred revenue set forth in the foregoing table, we make judgments and estimates regarding, among other things, future product and services deliverables, the appropriate valuation of those products and services and expected changes in customer requirements. These judgments and estimates could differ from actual events, particularly those that involve factors outside of our control. As a result, the actual revenue recognized from these arrangements, and the timing of that recognition may differ from the amounts identified in this table. While management believes that this information is a helpful measure in evaluating the company’s performance, investors should understand that unless, and until, the company is actually able to recognize these amounts as revenue in accordance with GAAP, there can be no assurance that the conditions to recognizing that revenue will be satisfied.
Liquidity and Capital Resources
We expect to be able to fund our operating and capital requirements for at least the next twelve months by using existing cash balances and short-term and long-term marketable debt securities, if our assumptions about our revenues, expenses and cash commitments are generally accurate. Because we cannot be certain that our assumptions about our business or the interactive television market in general will prove to be accurate, our funding requirements may differ from our current expectations.
47
Our primary source of cash from operations is royalty payments from customers. The primary uses of cash are personnel and personnel-related costs, subcontractor and consulting costs, facilities costs, and capital expenditures. In February 2008, we received an additional $14.3 million in cash from Liberty after the expiration of the indemnity period specified in the stock purchase agreement between Liberty and Kudelski.
The mix of cash and short-term and long-term investments may change in the future as we make decisions regarding the composition of our investment portfolio. We use professional investment management firms to manage a significant portion of our invested cash. The portfolio consists of highly liquid, high-quality investment grade securities of the United States government and agencies, corporate notes and bonds and certificates of deposit that predominantly have maturities of less than three years. All investments are made in accordance with our written investment policy, which has been approved by our board of directors.
The mix of cash and short-term and long-term securities was as follows, which may change in the future as we make decisions regarding the composition of our investment portfolio (in millions, except percentages):
| | | | | | | | | | | | | |
| | | December 31,
2007 | | December 31,
2006 | | Change | |
| | | | | | | $ | | | % | |
Cash and cash equivalents | | $ | 58.6 | | $ | 48.3 | | $ | 10.3 | | | 21 | % |
Short-term marketable debt securities | | | 20.4 | | | 8.7 | | | 11.7 | | | 134 | % |
Long-term marketable debt securities | | | 2.8 | | | 7.9 | | | (5.1 | ) | | (65 | )% |
| | | | | | | | | | | | | |
Total cash portfolio | | $ | 81.8 | | $ | 64.9 | | $ | 16.9 | | | 26 | % |
| | | | | | | | | | | | | |
| | | | | | | | | | | | | | | | | | | |
| | | Year Ended December 31, | | Change | |
| | 2007 | | | 2006 | | | 2005 | | 2007 versus 2006 | | | 2006 versus 2005 | |
| | | | | | | | | | | $ | | | $ | |
Cash provided by operating activities for continuing operations | | $ | 16.2 | | | $ | 3.9 | | | $ | 1.2 | | $ | 12.3 | | | $ | 2.7 | |
Cash provided by (used in) investing activities for continuing operations | | $ | (9.9 | ) | | $ | (3.9 | ) | | $ | 10.0 | | $ | (6.0 | ) | | $ | (13.9 | ) |
Cash provided by financing activities for continuing operations | | $ | 4.2 | | | $ | 2.4 | | | $ | 0.2 | | $ | 1.8 | | | $ | 2.2 | |
Cash provided by operating activities
2007 versus 2006.The increase of $12.3 million in net cash provided by operating activities for continuing operations during 2007 compared to 2006 was primarily attributable to a decrease of $7.4 million in net loss, net of non-cash items, and an increase of $6.2 million in cash collected from accounts receivable. The increase in net cash was partially offset by a $4.5 million decrease due to changes in deferred revenues. Other current assets and liabilities accounted for a net increase of $3.2 million.
2006 versus 2005.The increase of $2.7 million in net cash provided by operating activities for continuing operations during 2006 compared to 2005 was primarily attributable to a decrease of $4.7 million in net loss, net of non-cash items, which was partially offset by a $5.2 million change in accounts receivable. Other current assets and liabilities accounted for a net increase of $3.2 million.
Cash provided by (used in) investing activities
2007 versus 2006.The increase of $6.0 million in net cash used in investing activities for continuing operations during 2007 compared to 2006 was primarily due to net additional investments of $7.3 million in marketable debt securities. This increase was offset by a decrease of $1.3 million in capital expenditures.
48
2006 versus 2005. The negative change of $13.9 million in net cash provided by (used in) investing activities for continuing operations during 2006 compared to 2005 was primarily due to a net additional investment of $9.5 million in marketable debt securities and an increase of $1.8 million in capital expenditures. In addition, net cash provided by investing activities in 2005 included $7.1 million from the sale of a cost investment, which was offset by $4.2 million of cash proceeds used in our acquisition of CAMS and by a payment of $0.3 million for a private cost investment.
Cash provided by financing activities
2007 versus 2006.The increase of $1.8 million in net cash provided by financing activities during 2007 compared to 2006 was primarily due to the receipt of $5.4 million from Liberty pursuant to a February 2006 agreement between us and Liberty, which was partially offset by $1.3 million cash paid for the repurchase of our Class A ordinary shares in December 2007, $0.2 million cash paid for the repurchase of employee stock options, and a decrease of $2.1 million in proceeds from employee stock option exercises.
2006 versus 2005.The increase of $2.2 million in net cash provided by financing activities during 2006 compared to 2005 was due to an increase in proceeds received from employee stock option exercises.
Commitments and Contractual Obligations
Information as of December 31, 2007 concerning the amount and timing of required payments under our contractual obligations is summarized below (in millions):
| | | | | | | | | | | | | | | |
| | | Total | | Due in
2008 | | Due in 2009-
2010 | | Due in 2011-
2012 | | Due in 2013
or after |
Operating leases obligations | | $ | 10.2 | | $ | 4.7 | | $ | 4.8 | | $ | 0.7 | | $ | — |
Noncancellable purchase obligations | | | 0.5 | | | 0.5 | | | — | | | — | | | — |
| | | | | | | | | | | | | | | |
Total contractual obligations | | $ | 10.7 | | $ | 5.2 | | $ | 4.8 | | $ | 0.7 | | $ | — |
| | | | | | | | | | | | | | | |
We have the right to terminate, without penalty, one of our operating leases prior to its scheduled expiration. If we exercise this early termination right in 2009, our future minimum lease commitments would be reduced by an aggregate of $0.6 million over the current remaining life of that lease. We have not yet made any determination as to whether we intend to exercise such right. If we did exercise such right, while our commitments under this specific lease would be reduced, we might also be required to lease additional space to conduct our business and we cannot be certain, at this time, whether any such actions would possibly result in a net increase in our future minimum lease commitments.
In the ordinary course of business we enter into various arrangements with vendors and other business partners for marketing and other services. Future minimum purchase commitments under these arrangements as of December 31, 2007 were $0.5 million for the year ending December 31, 2008.
As of December 31, 2007, we had three standby letters of credit aggregating approximately $1.2 million, two of which were issued to landlords of our leased properties, and one of which was issued to a sublessee at our New York facility, which we had vacated in the second quarter of 2005. We pledged two certificates of deposit aggregating approximately $1.4 million, $0.3 million of which was included under short-term marketable debt securities, and $1.1 million of which was included under long-term marketable debt securities, as collateral in respect of these standby letters of credit.
Indemnification
In the normal course of our business, we provide indemnification to customers, subject to limitations, against claims of intellectual property infringement made by third parties arising from the use of our products.
49
Costs related to these indemnification provisions are sometimes difficult to estimate. While we have not historically experienced significant costs for these matters, there may be occasions in the ordinary course of our business where we assume litigation and other costs on behalf of our customers that could have an adverse effect on our financial position depending upon the outcome of any specific matter. We ordinarily seek to limit our liabilities in those arrangements in various respects, including monetarily, but the costs associated with any type of intellectual property indemnification arrangement continue to escalate in general, and especially in the technology sector.
As permitted under the laws of the British Virgin Islands, we have agreed to indemnify our officers and directors for certain events or occurrences while the officer or director is, or was, serving at our request in such capacity. The maximum potential amount of future payments we could be required to make under these indemnification agreements is unlimited; however, we have director and officer insurance coverage that mitigates our exposure and enables us to recover a portion of any future amounts paid. We believe the estimated fair value of these indemnification agreements in excess of applicable insurance coverage is not material.
| Item 7A. | Quantitative and Qualitative Disclosures About Market Risk |
We are exposed to financial market risks. This exposure relates to our holdings of fixed income investment securities and assets and liabilities denominated in foreign currencies.
Fixed Income Investment Risk
We own a fixed income investment portfolio with various holdings, types and maturities. These investments are generally classified as available-for-sale. Available-for-sale securities are recorded on the balance sheet at fair value with unrealized gains or losses, net of tax, included as a separate component of the balance sheet line item titled “accumulated other comprehensive income (loss).”
Most of these investments consist of a diversified portfolio of highly liquid United States dollar-denominated debt securities classified by maturity as cash equivalents, short-term investments or long-term investments. These debt securities are not leveraged and are held for purposes other than trading. Our investment policy limits the maximum maturity of securities in this portfolio to three years and weighted-average maturity to 15 months. Although we expect that market value fluctuations of our investments in short-term debt obligations will not be significant, a sharp rise in interest rates could have a material adverse effect on the value of securities with longer maturities in the portfolio. Alternatively, a sharp decline in interest rates could have a material positive effect on the value of securities with longer maturities in the portfolio. We do not currently hedge interest rate exposures.
Our investment policy limits investment concentration in any one issuer (other than with respect to United States treasury and agency securities) and also restricts this part of our portfolio to investment grade obligations based on the assessments of rating agencies. There have been instances in the past where the assessments of rating agencies have failed to anticipate significant defaults by issuers. It is possible that we could lose most or all of the value in an individual debt obligation as a result of a default. A loss through a default may have a material impact on our earnings even though our policy limits investments in the obligations of a single issuer to no more than five percent of the value of our portfolio.
The following table presents the hypothetical changes in fair values in our portfolio of investment securities with original maturities greater than 90 days as of December 31, 2007 using a model that assumes immediate sustained parallel changes in interest rates across the range of maturities (in thousands):
| | | | | | | | | | | | | | | |
| | | Fair Value as
of December 31,
2007 | | Valuation of
Securities if
Interest Rates
Decrease 1% | | Valuation of
Securities if
Interest Rates
Increase 1% | | Valuation of
Securities if
Interest Rates
Decrease 2% | | Valuation of
Securities if
Interest Rates
Increase 2% |
Marketable debt securities | | $ | 23,215 | | $ | 23,267 | | $ | 23,163 | | $ | 23,318 | | $ | 23,112 |
50
The modeling technique used in the above table estimates fair values based on changes in interest rates assuming static maturities. The fair value of individual securities in our investment portfolio is likely to be affected by other factors including changes in ratings, market perception of the financial strength of the issuers of such securities and the relative attractiveness of other investments. Accordingly, the fair value of our individual securities could also vary significantly in the future from the amounts indicated above.
Foreign Currency Exchange Rate Risk
We transact business in various foreign countries. We incur a substantial majority of our expenses, and earn most of our revenues, in United States dollars. Although a majority of our worldwide customers are invoiced and make payments in United States dollars, some of our customer contracts provide for payments to be remitted in local currency. As of December 31, 2007, we held approximately $18.5 million of various foreign currencies as a result of our worldwide operations.
We have a foreign currency exchange exposure management policy. The policy permits the use of foreign currency forward exchange contracts and foreign currency option contracts and the use of other hedging procedures in connection with hedging foreign currency exposures. The policy requires that the use of derivatives and other procedures qualify for hedge treatment under SFAS No. 133, “Accounting for Derivative Instruments and Hedging Activities.” During 2007, we did not use foreign currency forward exchange contracts, options in hedging foreign currency exposures, or other hedging procedures. However, we regularly assess our foreign currency exchange rate risk that results from our global operations, and we may in the future elect to make use of appropriate hedging strategies.
| Item 8. | Financial Statements and Supplementary Data |
The Consolidated Financial Statements and Supplementary Data required by this Item are set forth at the pages indicated in Item 15(a).
| Item 9. | Changes in and Disagreements with Accountants on Accounting and Financial Disclosure |
Not Applicable.
| Item 9A. | Controls and Procedures |
a. Disclosure Controls and Procedures
Our management carried out an evaluation as of December 31, 2007 under the supervision and with the participation of our Chief Executive Officer and Chief Financial Officer, and concluded that our disclosure controls and procedures (as defined in Rules 13a-15(f) under the Securities Exchange Act of 1934, as amended) were effective.
b. Management Report on Internal Control over Financial Reporting
Our management is responsible for establishing and maintaining adequate internal control over financial reporting, as defined in Rules 13a-15(f) under the Securities Exchange Act of 1934, as amended. Our management has assessed the effectiveness of our internal control over financial reporting as of December 31, 2007 based on criteria established in Internal Control—Integrated Framework issued by the Committee of Sponsoring Organizations of the Treadway Commission. As a result of this assessment, management concluded that, as of December 31, 2007, our internal control over financial reporting was effective in providing reasonable assurance regarding the reliability of financial reporting and the preparation of financial statements for external purposes in accordance with generally accepted accounting principles.
51
c. Limitations on Controls
Our management, including our Chief Executive Officer and Chief Financial Officer, does not expect that our disclosure controls and procedures or our internal controls will prevent all errors and all fraud. A control system, no matter how well conceived and operated, can provide only reasonable, not absolute, assurance that the objectives of the control system are met. Further, the design of a control system must reflect the fact that there are resource constraints and the benefits of controls must be considered relative to their costs. Because of the inherent limitations in all control systems, no evaluation of controls can provide absolute assurance that all control issues and instances of fraud, if any, within our company have been detected.
d. Significant Changes in Internal Control over Financial Reporting.
As has been previously disclosed in our Annual Report on Form 10-K for the year ended December 31, 2006, we determined and concluded that our internal control over financial reporting was effective.
There were no additional changes in our internal control over financial reporting implemented during the fourth quarter of fiscal 2007 that have materially affected, or are reasonably likely to materially affect, our internal control over financial reporting.
52
Report of Independent Registered Public Accounting Firm
The Board of Directors and Stockholders
OpenTV Corp.
We have audited OpenTV Corp. and subsidiaries’ (the “Company”) internal control over financial reporting as of December 31, 2007, based on the criteria established inInternal Control—Integrated Frameworkissued by the Committee of Sponsoring Organizations of the Treadway Commission (COSO). OpenTV Corp. and subsidiaries’ management is responsible for maintaining effective internal control over financial reporting and for its assessment of the effectiveness of internal control over financial reporting included in the accompanying Management Report on Internal Control over Financial Reporting. Our responsibility is to express an opinion on OpenTV Corp. and subsidiaries’ internal control over financial reporting based on our audit.
We conducted our audit in accordance with the standards of the Public Company Accounting Oversight Board (United States). Those standards require that we plan and perform the audit to obtain reasonable assurance about whether effective internal control over financial reporting was maintained in all material respects. Our audit included obtaining an understanding of internal control over financial reporting, assessing the risk that a material weakness exists, testing and evaluating the design and operating effectiveness of internal control based on the assessed risk, and performing such other procedures as we considered necessary in the circumstances. We believe that our audit provides a reasonable basis for our opinion.
A company’s internal control over financial reporting is a process designed to provide reasonable assurance regarding the reliability of financial reporting and the preparation of financial statements for external purposes in accordance with generally accepted accounting principles. A company’s internal control over financial reporting includes those policies and procedures that (1) pertain to the maintenance of records that, in reasonable detail, accurately and fairly reflect the transactions and dispositions of the assets of the company; (2) provide reasonable assurance that transactions are recorded as necessary to permit preparation of financial statements in accordance with generally accepted accounting principles, and that receipts and expenditures of the company are being made only in accordance with authorizations of management and directors of the company; and (3) provide reasonable assurance regarding prevention or timely detection of unauthorized acquisition, use, or disposition of the company’s assets that could have a material effect on the financial statements.
Because of its inherent limitations, internal control over financial reporting may not prevent or detect misstatements. Also, projections of any evaluation of effectiveness to future periods are subject to the risk that controls may become inadequate because of changes in conditions, or that the degree of compliance with the policies or procedures may deteriorate.
In our opinion, OpenTV Corp. and subsidiaries maintained, in all material respects, effective internal control over financial reporting as of December 31, 2007, based on criteria established inInternal Control—Integrated Frameworkissued by COSO.
We also have audited, in accordance with the standards of the Public Company Accounting Oversight Board (United States), the accompanying consolidated balance sheets of OpenTV Corp. and subsidiaries as of December 31, 2007 and 2006 and the related consolidated statements of operations, shareholders’ equity and comprehensive loss, and cash flows for each of the two years in the period ended December 31, 2007, and our report dated March 7, 2008 expressed an unqualified opinion thereon.
/s/ GRANT THORNTON LLP
San Francisco, California
March 7, 2008
53
| Item 9B. | Other information |
None.
PART III
| Item 10. | Directors, Executive Officers and Corporate Governance |
The information regarding our directors and executive officers required by this Item is incorporated by reference to the information set forth in the sections entitled “Information Concerning Our Current Directors and Executive Officers” and “Corporate Governance and Board Matters” in the definitive proxy statement for our 2008 annual meeting of shareholders to be filed with the SEC pursuant to Regulation 14A not later than 120 days after the end of the fiscal year covered by this Annual Report on Form 10-K (the “Proxy Statement”).
Information required by this Item with respect to compliance with Section 16(a) of the Securities Act of 1934 is incorporated by reference to the information set forth in the section entitled “Section 16(a) Beneficial Ownership Reporting Compliance” in the Proxy Statement.
| Item 11. | Executive Compensation |
The information required by this Item is incorporated by reference to the information set forth in the section entitled “Executive Compensation” in the Proxy Statement.
| Item 12. | Security Ownership of Certain Beneficial Owners and Management and Related Shareholder Matters |
The information required by this Item regarding security ownership of certain beneficial owners is incorporated by reference to the information set forth in the section entitled “Security Ownership of Certain Beneficial Owners and Management” in the Proxy Statement.
| Item 13. | Certain Relationships and Related Transactions, and Director Independence |
The information required by this Item is incorporated by reference to the information set forth in the sections entitled “Corporate Governance and Board Matters” and “Certain Relationships and Related Transactions” in the Proxy Statement.
| Item 14. | Principal Accounting Fees and Services |
The information required by this Item is incorporated by reference to the information set forth in the section entitled “Audit Fees and All Other Fees” in the Proxy Statement.
54
PART IV
| Item 15. | Exhibits, Financial Statement Schedules |
(a)(1) Financial Statements Included in Part II of this Report:
(2) Financial Statement Schedule
Schedule II—Valuation and Qualifying Accounts
55
(3) Exhibits
| | |
| |
| 2.1 | | Asset Purchase Agreement, dated as of September 7, 2005, by and among OpenTV Corp., OpenTV Advertising Holdings, Inc., CAM Systems, L.L.C., StarNet, L.P., StarNet Management, L.L.C., H. Chase Lenfest, H.F. Lenfest and HCL Family Holdings, L.P. (incorporated by reference to Exhibit 2.1 to the Current Report on Form 8-K of OpenTV Corp., as filed with the Securities and Exchange Commission on September 9, 2005). |
| |
| 3.1 | | Amended and Restated Memorandum of Association of OpenTV Corp. (incorporated by reference to Exhibit 3.1 to the Annual Report on Form 10-K of OpenTV Corp., as filed with the Securities and Exchange Commission on March 30, 2006). |
| |
| 3.2 | | Articles of Association of OpenTV Corp. (incorporated by reference to Exhibit 3.2 to the Annual Report on Form 10-K of OpenTV Corp., as filed with the Securities and Exchange Commission on March 15, 2007 (the “2006 10-K”)). |
| |
| 4.1 | | Specimen Certificate for Class A ordinary shares of OpenTV Corp. (incorporated by reference to Exhibit 4.1 of Amendment No. 1 (the “First F-1 Amendment”) to the F-1 Registration Statement, as filed with the Securities and Exchange Commission on November 10, 1999). |
| |
| 10.1 | | Form of Indemnification Agreement for directors and officers of OpenTV Corp. (incorporated by reference to Exhibit 10.1 to the Annual Report on Form 10-K of OpenTV Corp., as filed with the Securities and Exchange Commission on March 16, 2005 (the “2004 10-K”)). |
| |
| 10.2† | | OpenTV Corp.’s Amended and Restated 1999 Employee Stock Purchase Plan (incorporated by reference to Exhibit 4.2 to the Annual Report on Form 20-F of OpenTV Corp. for the year ended December 31, 2000 (the “2000 20-F”). |
| |
| 10.3† | | OpenTV Corp.’s Amended and Restated 1999 Share Option/Share Issuance Plan (incorporated by reference to Exhibit 10.3 of Amendment No. 3 (the “Third F-1 Amendment”) to the F-1 Registration Statement, as filed with the Securities and Exchange Commission on November 19, 1999). |
| |
| 10.4 | | Shareholder’s Agreement among OTV Holdings Limited, OpenTV Corp. and Sun TSI Subsidiary, Inc. dated October 23, 1999 (incorporated by reference to Exhibit 10.4 to the Third F-1 Amendment). |
| |
| 10.5 | | Trademark License Agreement between Sun Microsystems, Inc. and OpenTV, Inc. dated March 20, 1998 (incorporated by reference to Exhibit 10.5 to the Third F-1 Amendment). |
| |
| 10.6 | | Technology License and Distribution Agreement between Sun Microsystems, Inc. and OpenTV, Inc. dated March 20, 1998 (incorporated by reference to Exhibit 10.6 to the Third F-1 Amendment). |
| |
| 10.7 | | First Amendment to Technology License and Distribution Agreement between Sun Microsystems, Inc. and OpenTV, Inc. dated June 30, 1999 (incorporated by reference to Exhibit 10.7 to the Third F-1 Amendment). |
| |
| 10.8 | | Source Code License and Binary Distribution Agreement between Sun Microsystems, Inc. and OpenTV, Inc. effective July 1, 1996 (incorporated by reference to Exhibit 10.10 to the Third F-1 Amendment). |
| |
| 10.9 | | Source Code License and Binary Distribution Agreement between Sun Microsystems, Inc. and OpenTV, Inc. effective April 1, 1998 (incorporated by reference to Exhibit 10.9 to the Third F-1 Amendment). |
| |
| 10.10 | | OpenTV’s Amended and Restated 2000 Exchange Plan (incorporated by reference to Exhibit 10.1 to the Form 6-K of OpenTV Corp., as filed with the Securities and Exchange Commission on August 30, 2000). |
56
| | |
| |
| 10.11 | | Marketing Agreement dated as of January 22, 2001 by and between British Sky Broadcasting Limited and OpenTV, Inc. (incorporated by reference to Exhibit 4.22 to the 2000 20-F). |
| |
| 10.12 | | Second Amendment to Technology License and Distribution Agreement between Sun Microsystems, Inc. and OpenTV, Inc. dated December 20, 2000 (incorporated by reference to Exhibit 4.23 to the 2000 20-F). |
| |
| 10.13 | | Third Amendment to Technology License and Distribution Agreement between Sun Microsystems, Inc. and OpenTV, Inc. dated June 30, 2005 (incorporated by reference to Exhibit 10.33 to the 2006 10-K). |
| |
| 10.14† | | OpenTV’s 2001 Nonstatutory Stock Option Plan (incorporated by reference to Exhibit 4.1 to the Registration Statement on Form S-8 of OpenTV Corp. (File No. 333-74026), as filed with the Securities and Exchange Commission on November 27, 2001). |
| |
| 10.15 | | License Agreement for OpenTV Interactive Applications and Enterprise and Network Solutions, dated as of August 16, 2002 by and among OpenTV, Inc., MultiChoice Africa Limited and MIH Limited (incorporated by reference to Exhibit 10.31 to the Registration Statement on Form S-4 of OpenTV Corp. (File No. 333-102944), as filed with the Securities and Exchange Commission on February 4, 2003). |
| |
| 10.16† | | OpenTV Corp. 2003 Incentive Plan (incorporated by reference to Exhibit 10.32 to Amendment No. 1 to the Registration Statement on Form S-4 of OpenTV Corp. (File No. 333-102944), as filed with the Securities and Exchange Commission on April 25, 2003). |
| |
| 10.17† | | Form of Incentive Stock Option Agreement for OpenTV Corp. Amended and Restated 1999 Share Option/ Share Issuance Plan. (incorporated by reference to Exhibit 10.25 to the 2004 10-K). |
| |
| 10.18† | | Form of Nonstatutory Stock Option Agreement for OpenTV Corp. 2001 Nonstatutory Stock Option Plan (incorporated by reference to Exhibit 10.26 to the 2004 10-K). |
| |
| 10.19† | | Form of Incentive Stock Option Agreement for OpenTV Corp. 2003 Incentive Plan. (incorporated by reference to Exhibit 10.27 to the 2004 10-K). |
| |
| 10.20† | | OpenTV Corp. 2005 Incentive Plan (incorporated by reference to Annex A to the 2005 Proxy Statement on Schedule 14A of OpenTV Corp., as filed with the Securities and Exchange Commission on October 14, 2005). |
| |
| 10.21† | | Form of Incentive Stock Option Agreement for OpenTV Corp. 2005 Incentive Plan (incorporated by reference to Exhibit 4.3 to the Registration Statement on Form S-8 of OpenTV Corp., as filed with the Securities and Exchange Commission on December 21, 2005 (the “2005 S-8”)). |
| |
| 10.22† | | Form of Non-Qualified Stock Option Agreement for OpenTV Corp. 2005 Incentive Plan (incorporated by reference to Exhibit 4.4 to the 2005 S-8). |
| |
| 10.23† | | Form of Independent Director Stock Option Agreement for OpenTV Corp. 2005 Incentive Plan (incorporated by reference to Exhibit 4.5 to the 2005 S-8). |
| |
| 10.24† | | Form of Restricted Share Agreement for the 2007 Management Bonus and Equity Issuance Plan under the OpenTV Corp. 2005 Incentive Plan (incorporated by reference to Exhibit 4.6 to the Registration Statement on Form S-8 of OpenTV Corp., as filed with the Securities and Exchange Commission on August 27, 2007 (the “2007 S-8”)). |
| |
| 10.25† | | Form of Restricted Share Agreement for December 2007 restricted share grants under the OpenTV Corp. 2005 Incentive Plan (incorporated by reference to Exhibit 10.2 to the Current Report on Form 8-K of OpenTV Corp., as filed with the Securities and Exchange Commission on December 14, 2007). |
| |
| 10.26† | | Offer Letter to Shum Mukherjee dated May 27, 2005 (incorporated by reference to Exhibit 10.1 to the Current Report on Form 8-K of OpenTV Corp., as filed with the Securities and Exchange Commission on May 31, 2005). |
57
| | |
| |
| 10.27† | | Employment Agreement dated as of March 13, 2007 between OpenTV Corp. and Alan Guggenheim (incorporated by reference to Exhibit 10.36 to the Current Report on Form 8-K of OpenTV Corp., as filed with the Securities and Exchange Commission on March 15, 2007). |
| |
| 10.28† | | Separation Agreement dated as of June 27, 2007 between OpenTV Corp. and James Chiddix (incorporated by reference to Exhibit 10.1 to the Current Report on Form 8-K of OpenTV Corp., as filed with the Securities and Exchange Commission on July 3, 2007). |
| |
| 10.29† | | Separation Agreement dated as of March 13, 2007 between OpenTV Corp. and Scott Wornow (incorporated by reference to Exhibit 10.37 to the Current Report on Form 8-K of OpenTV Corp., as filed with the Securities and Exchange Commission on March 15, 2007). |
| |
| 10.30† | | Separation Agreement dated as of March 13, 2007 between OpenTV Corp. and Mazin Jadallah (incorporated by reference to Exhibit 10.38 to the Current Report on Form 8-K of OpenTV Corp., as filed with the Securities and Exchange Commission on March 15, 2007). |
| |
| 10.31† | | Letter Agreement with Nigel W. Bennett dated December 10, 2007 (incorporated by reference to Exhibit 10.1 to the Current Report on Form 8-K of OpenTV Corp., as filed with the Securities and Exchange Commission on December 14, 2007). |
| |
| 10.32 | | Registration Rights Agreement dated as of September 7, 2005 by and among OpenTV Corp., CAM Systems, L.L.C. and StarNet, L.P. (incorporated by reference to Exhibit 10.34 to Quarterly Report on Form 10-Q of OpenTV Corp. for the quarterly period ended September 30, 2005, as filed with the Securities and Exchange Commission on November 7, 2005). |
| |
| 10.33 | | Letter Agreement dated February 10, 2006 between OpenTV Corp. and Liberty Media Corporation (incorporated by reference to Exhibit 10.41 to the Current Report on Form 8-K of OpenTV Corp., as filed with the Securities and Exchange Commission on February 13, 2006). |
| |
| 18.1 | | Letter from KPMG LLP dated March 12, 2004 regarding change in accounting principle (incorporated by reference to Exhibit 18.1 to the Annual Report on Form 10-K of OpenTV Corp. for the year ended December 31, 2003, as filed with the Securities and Exchange Commission on March 15, 2004). |
| |
| 21.1* | | List of Subsidiaries. |
| |
| 23.1* | | Consent of Independent Registered Public Accounting Firm (KPMG LLP). |
| |
| 23.2* | | Consent of Independent Registered Public Accounting Firm (Grant Thornton LLP). |
| |
| 31.1* | | Certification of Chief Executive Officer pursuant to Section 302 of the Sarbanes-Oxley Act of 2002. |
| |
| 31.2* | | Certification of Chief Financial Officer pursuant to Section 302 of the Sarbanes-Oxley Act of 2002. |
| |
| 32.1* | | Certifications of Chief Executive Officer and Chief Financial Officer pursuant to Section 906 of the Sarbanes-Oxley Act of 2002. |
| † | Management contract or compensatory plan or arrangement required to be filed pursuant to Item 15(b) of Form 10-K |
58
SIGNATURES
Pursuant to the requirements of Section 13 or 15(d) of the Securities Exchange Act of 1934, the Registrant has duly caused this report to be signed on its behalf by the undersigned, thereunto duly authorized.
| | | | |
| | | | OPENTV CORP. |
| | |
| Dated: March 11, 2008 | | | | /s/ NIGEL W. BENNETT |
| | | | Nigel W. Bennett Chief Executive Officer |
POWER OF ATTORNEY
KNOW ALL MEN BY THESE PRESENTS, that each person whose signature appears below constitutes and appoints Mark Beariault, Esq. and Nigel W. Bennett his true and lawful attorneys-in-fact and agents, each with full power of substitution and resubstitution, for him and in his name, place and stead, in any and all capacities, to sign any and all amendments to this Annual Report on Form 10-K, and to file the same, with all exhibits thereto, and other documents in connection therewith, with the Securities and Exchange Commission, granting unto said attorney-in-fact and agent full power and authority to do and perform each and every act and thing requisite or necessary to be done in and about the premises, as fully to all intents and purposes as he might or could do in person, hereby ratifying and confirming all that said attorney-in-fact and agent or his substitute, may lawfully do or cause to be done by virtue hereof.
Pursuant to the requirements of the Securities Exchange Act of 1934, this report has been signed below by the following persons on behalf of the Registrant and in the capacities and on the date indicated.
| | | | |
Name | | Title | | Date |
| | |
/s/ ANDRÉ KUDELSKI André Kudelski | | Chairman of the Board of Directors | | March 11, 2008 |
| | |
/s/ NIGEL W. BENNETT Nigel W. Bennett | | Chief Executive Officer (Principal Executive Officer) | | March 11, 2008 |
| | |
/s/ JAMES A. CHIDDIX James A. Chiddix | | Vice Chairman | | March 11, 2008 |
| | |
/s/ JOSEPH DEISS Joseph Deiss | | Director | | March 11, 2008 |
| | |
/s/ LUCIEN GANI Lucien Gani | | Director | | March 11, 2008 |
| | |
/s/ JERRY MACHOVINA Jerry Machovina | | Director | | March 11, 2008 |
| | |
/s/ MERCER REYNOLDS Mercer Reynolds | | Director | | March 11, 2008 |
| | |
/s/ PIERRE ROY Pierre Roy | | Director | | March 11, 2008 |
| | |
/s/ MAURO SALADINI Mauro Saladini | | Director | | March 11, 2008 |
| | |
/s/ CLAUDE SMADJA Claude Smadja | | Director | | March 11, 2008 |
| | |
/s/ ERIC TVETER Eric Tveter | | Director | | March 11, 2008 |
| | |
/s/ SHUM MUKHERJEE Shum Mukherjee | | Chief Financial Officer (Principal Financial Officer and Principal Accounting Officer) | | March 11, 2008 |
59
PART IV
OPENTV CORP.
INDEX TO CONSOLIDATED FINANCIAL STATEMENTS
F-1
Report of Independent Registered Public Accounting Firm
The Board of Directors and Stockholders
OpenTV Corp.
We have audited the accompanying consolidated balance sheets of OpenTV Corp. and subsidiaries (the “Company”) as of December 31, 2007 and 2006, and the related consolidated statements of operations, shareholders’ equity and comprehensive loss, and cash flows for each of the two years in the period ended December 31, 2007. Our audits of the basic financial statements included the financial statement schedule listed in the index appearing under Schedule II. These financial statements and financial statement schedule are the responsibility of the Company’s management. Our responsibility is to express an opinion on these financial statements and financial statement schedule based on our audits.
We conducted our audits in accordance with the standards of the Public Company Accounting Oversight Board (United States). Those standards require that we plan and perform the audit to obtain reasonable assurance about whether the financial statements are free of material misstatement. An audit includes examining, on a test basis, evidence supporting the amounts and disclosures in the financial statements. An audit also includes assessing the accounting principles used and significant estimates made by management, as well as evaluating the overall financial statement presentation. We believe that our audits provide a reasonable basis for our opinion.
In our opinion, the consolidated financial statements referred to above present fairly, in all material respects, the financial position of OpenTV Corp. and subsidiaries as of December 31, 2007 and 2006, and the results of their operations and their cash flows for each of the two years in the period ended December 31, 2007, in conformity with accounting principles generally accepted in the United States of America. Also in our opinion, the related financial statement schedule, when considered in relation to the basic financial statements taken as a whole, presents fairly, in all material respects, the information set forth therein.
As discussed in Note 3 to the consolidated financial statements, the Company adopted Statement of Financial Accounting Standards No. 123 (revised 2004), “Share-Based Payment” in 2006.
We also have audited, in accordance with the standards of the Public Company Accounting Oversight Board (United States), the effectiveness of OpenTV Corp. and subsidiaries’ internal control over financial reporting as of December 31, 2007, based on criteria established inInternal Control—Integrated Frameworkissued by the Committee of Sponsoring Organizations of the Treadway Commission (COSO) and our report dated March 7, 2008 expressed an unqualified opinion thereon.
/s/ GRANT THORNTON LLP
San Francisco, California
March 7, 2008
F-2
Report of Independent Registered Public Accounting Firm
The Board of Directors and Shareholders
OpenTV Corp.:
We have audited the consolidated statements of operations, shareholders’ equity and comprehensive loss, and cash flows of OpenTV Corp. and subsidiaries for the year ended December 31, 2005. In connection with our audit of the consolidated financial statements, we also have audited the related financial statement schedule. These consolidated financial statements are the responsibility of the Company’s management. Our responsibility is to express an opinion on these consolidated financial statements and financial statement schedule based on our audit.
We conducted our audit in accordance with the standards of the Public Company Accounting Oversight Board (United States). Those standards require that we plan and perform the audit to obtain reasonable assurance about whether the financial statements are free of material misstatement. An audit includes examining, on a test basis, evidence supporting the amounts and disclosures in the financial statements. An audit also includes assessing the accounting principles used and significant estimates made by management, as well as evaluating the overall financial statement presentation. We believe that our audit provides a reasonable basis for our opinion.
In our opinion, the consolidated financial statements referred to above present fairly, in all material respects, the results of operations and cash flows of OpenTV Corp. and subsidiaries for the year ended December 31, 2005, in conformity with United States generally accepted accounting principles. Also, in our opinion, the related financial statement schedule, when considered in relation to the basic consolidated financial statements taken as a whole, presents fairly, in all material respects, the information set forth therein.
/s/ KPMG LLP
San Francisco, California
March 30, 2006, except for note 6, as to
which the date is March 11, 2008
F-3
OPENTV CORP.
CONSOLIDATED BALANCE SHEETS
(In thousands, except share amounts)
| | | | | | | | |
| | | December 31,
2007 | | | December 31,
2006 | |
| ASSETS | | | | | | | | |
Current assets: | | | | | | | | |
Cash and cash equivalents | | $ | 58,599 | | | $ | 48,309 | |
Short-term marketable debt securities | | | 20,404 | | | | 8,681 | |
Accounts receivable, net of allowance for doubtful accounts of $565 and $348 at December 31, 2007 and 2006, respectively | | | 16,655 | | | | 18,684 | |
Prepaid expenses and other current assets | | | 5,465 | | | | 5,478 | |
Current assets of discontinued operations | | | — | | | | 2,504 | |
| | | | | | | | |
Total current assets | | | 101,123 | | | | 83,656 | |
Long-term marketable debt securities | | | 2,811 | | | | 7,928 | |
Property and equipment, net | | | 6,554 | | | | 6,879 | |
Goodwill | | | 95,082 | | | | 95,019 | |
Intangible assets, net | | | 12,589 | | | | 18,477 | |
Other assets | | | 1,896 | | | | 4,636 | |
Non-current assets of discontinued operations | | | — | | | | 4,169 | |
| | | | | | | | |
Total assets | | $ | 220,055 | | | $ | 220,764 | |
| | | | | | | | |
| | | | | | | | |
| LIABILITIES, MINORITY INTEREST AND SHAREHOLDERS’ EQUITY | | | | | | | | |
Current liabilities: | | | | | | | | |
Accounts payable | | $ | 2,687 | | | $ | 3,879 | |
Accrued liabilities | | | 17,360 | | | | 15,816 | |
Accrued restructuring | | | 883 | | | | 416 | |
Deferred revenue | | | 14,992 | | | | 12,614 | |
Current liabilities of discontinued operations | | | — | | | | 1,660 | |
| | | | | | | | |
Total current liabilities | | | 35,922 | | | | 34,385 | |
Accrued liabilities, net of current portion | | | 2,764 | | | | 3,121 | |
Accrued restructuring, net of current portion | | | 1,297 | | | | 1,954 | |
Deferred revenue, net of current portion | | | 9,142 | | | | 12,987 | |
| | | | | | | | |
Total liabilities | | | 49,125 | | | | 52,447 | |
Commitments and contingencies (Note 16) | | | | | | | | |
Minority interest | | | 451 | | | | 486 | |
Shareholders’ equity: | | | | | | | | |
Preference shares, no par value, 500,000,000 shares authorized; none issued and outstanding | | | — | | | | — | |
Class A ordinary shares, no par value, 500,000,000 shares authorized; 109,657,613 and 107,906,960 shares issued and outstanding, including treasury shares, at December 31, 2007 and 2006, respectively | | | 2,234,614 | | | | 2,235,495 | |
Class B ordinary shares, no par value, 200,000,000 shares authorized; 30,206,154 and 30,631,746 shares issued and outstanding at December 31, 2007 and 2006, respectively | | | 35,953 | | | | 35,953 | |
Additional paid-in capital | | | 500,162 | | | | 491,630 | |
Treasury shares at cost, zero and 76,327 shares at December 31, 2007 and 2006, respectively | | | — | | | | (38 | ) |
Accumulated other comprehensive loss | | | (141 | ) | | | (261 | ) |
Accumulated deficit | | | (2,600,109 | ) | | | (2,594,948 | ) |
| | | | | | | | |
Total shareholders’ equity | | | 170,479 | | | | 167,831 | |
| | | | | | | | |
Total liabilities, minority interest and shareholders’ equity | | $ | 220,055 | | | $ | 220,764 | |
| | | | | | | | |
The accompanying notes are an integral part of these consolidated financial statements.
F-4
OPENTV CORP.
CONSOLIDATED STATEMENTS OF OPERATIONS
(In thousands, except share and per share amounts)
| | | | | | | | | | | | |
| | | Year Ended December 31, | |
| | | 2007 | | | 2006 | | | 2005 | |
Revenues: | | | | | | | | | | | | |
Royalties and licenses | | $ | 73,735 | | | $ | 65,886 | | | $ | 55,083 | |
Services and other | | | 36,242 | | | | 29,324 | | | | 23,132 | |
| | | | | | | | | | | | |
Total revenues | | | 109,977 | | | | 95,210 | | | | 78,215 | |
Cost of revenues: | | | | | | | | | | | | |
Royalties and licenses | | | 5,115 | | | | 7,788 | | | | 6,393 | |
Services and other | | | 42,944 | | | | 33,208 | | | | 21,389 | |
| | | | | | | | | | | | |
Total cost of revenues | | | 48,059 | | | | 40,996 | | | | 27,782 | |
| | | | | | | | | | | | |
Gross profit | | | 61,918 | | | | 54,214 | | | | 50,433 | |
Operating expenses: | | | | | | | | | | | | |
Research and development | | | 32,718 | | | | 30,687 | | | | 30,958 | |
Sales and marketing | | | 10,829 | | | | 11,857 | | | | 10,968 | |
General and administrative | | | 21,563 | | | | 18,041 | | | | 15,483 | |
Restructuring and impairment costs | | | 267 | | | | 1,021 | | | | 2,545 | |
Amortization of intangible assets | | | 1,618 | | | | 2,082 | | | | 1,738 | |
Impairment of goodwill | | | — | | | | 747 | | | | — | |
| | | | | | | | | | | | |
Total operating expenses | | | 66,995 | | | | 64,435 | | | | 61,692 | |
| | | | | | | | | | | | |
Loss from operations | | | (5,077 | ) | | | (10,221 | ) | | | (11,259 | ) |
Interest income | | | 3,195 | | | | 3,016 | | | | 1,666 | |
Other income | | | 2,789 | | | | 407 | | | | 3,817 | |
Minority interest | | | 35 | | | | 37 | | | | 62 | |
| | | | | | | | | | | | |
Profit (loss) before income taxes | | | 942 | | | | (6,761 | ) | | | (5,714 | ) |
Income tax expense | | | 1,248 | | | | 2,896 | | | | 1,155 | |
| | | | | | | | | | | | |
Net loss from continuing operations | | | (306 | ) | | | (9,657 | ) | | | (6,869 | ) |
Discontinued operations: | | | | | | | | | | | | |
Loss from discontinued operations, net of tax | | | (1,091 | ) | | | (1,161 | ) | | | (1,604 | ) |
Impairment of assets of discontinued operations, net of tax | | | (3,764 | ) | | | — | | | | — | |
| | | | | | | | | | | | |
Net loss from discontinued operations | | | (4,855 | ) | | | (1,161 | ) | | | (1,604 | ) |
| | | | | | | | | | | | |
Net loss | | $ | (5,161 | ) | | $ | (10,818 | ) | | $ | (8,473 | ) |
| | | | | | | | | | | | |
Net loss per share from continuing operations, basic and diluted | | $ | — | | | $ | (0.07 | ) | | $ | (0.06 | ) |
Net loss per share from discontinued operations, basic and diluted | | | (0.04 | ) | | | (0.01 | ) | | | (0.01 | ) |
| | | | | | | | | | | | |
Net loss per share, basic and diluted | | $ | (0.04 | ) | | $ | (0.08 | ) | | $ | (0.07 | ) |
| | | | | | | | | | | | |
Shares used in per share calculation, basic and diluted | | | 139,012,431 | | | | 137,242,329 | | | | 124,812,584 | |
| | | | | | | | | | | | |
The accompanying notes are an integral part of these consolidated financial statements.
F-5
OPENTV CORP.
CONSOLIDATED STATEMENTS OF SHAREHOLDERS’ EQUITY AND COMPREHENSIVE LOSS
(In thousands, except share amounts)
| | | | | | | | | | | | | | | | | | | | | | | | | | | | | | | | | | | | | |
| | | Class A | | Class B | | Additional
Paid-In
Capital | | Treasury
Shares | | | Deferred
Share-based
Compensation | | | Accumulated
Other
Comprehensive
Income (Loss) | | | Accumulated
Deficit | | | Total | | | Other
Comprehensive
Loss | |
| | | Shares | | Amount | | Shares | | Amount | | | | | | | |
Balances, December 31, 2004 | | 91,552,293 | | $ | 2,213,951 | | 30,631,746 | | $ | 35,953 | | $ | 470,453 | | $ | (38 | ) | | $ | (10 | ) | | $ | 523 | | | $ | (2,575,657 | ) | | $ | 145,175 | | | | | |
Share options exercised | | 145,764 | | | 183 | | — | | | — | | | — | | | — | | | | — | | | | — | | | | — | | | | 183 | | | | | |
Shares issued for employee bonus | | 1,162,180 | | | 3,180 | | — | | | — | | | — | | | — | | | | — | | | | — | | | | — | | | | 3,180 | | | | | |
Shares issued for employee and director compensation | | 12,420 | | | 34 | | — | | | — | | | 117 | | | — | | | | — | | | | — | | | | — | | | | 151 | | | | | |
Shares issued in connection with acquisition of CAM Systems | | 5,221,462 | | | 13,050 | | — | | | — | | | — | | | — | | | | — | | | | — | | | | — | | | | 13,050 | | | | | |
Shares issued in exchange for OpenTV, Inc. shares | | 11,000 | | | — | | — | | | — | | | 26 | | | — | | | | — | | | | — | | | | — | | | | 26 | | | | | |
Amortization of deferred share-based compensation | | | | | — | | — | | | — | | | — | | | — | | | | 8 | | | | — | | | | — | | | | 8 | | | | | |
Unrealized gains on investments, net of income taxes | | | | | — | | — | | | — | | | — | | | — | | | | — | | | | 3 | | | | — | | | | 3 | | | $ | 3 | |
Foreign currency translation losses | | | | | — | | — | | | — | | | — | | | — | | | | — | | | | (791 | ) | | | — | | | | (791 | ) | | | (791 | ) |
Net loss | | | | | — | | — | | | — | | | — | | | — | | | | — | | | | — | | | | (8,473 | ) | | | (8,473 | ) | | | (8,473 | ) |
| | | | | | | | | | | | | | | | | | | | | | | | | | | | | | | | | | | | | |
Balances, December 31, 2005 | | 98,105,119 | | | 2,230,398 | | 30,631,746 | | | 35,953 | | | 470,596 | | | (38 | ) | | | (2 | ) | | | (265 | ) | | | (2,584,130 | ) | | | 152,512 | | | $ | (9,261 | ) |
| | | | | | | | | | | | | | | | | | | | | | | | | | | | | | | | | | | | | |
Share options exercised | | 1,214,519 | | | 2,439 | | — | | | — | | | 15 | | | — | | | | — | | | | — | | | | — | | | | 2,454 | | | | | |
Shares issued for employee bonus | | 935,664 | | | 2,658 | | — | | | — | | | — | | | — | | | | — | | | | — | | | | — | | | | 2,658 | | | | | |
Share-based and non-cash employee and director compensation | | — | | | — | | — | | | — | | | 3,443 | | | — | | | | — | | | | — | | | | — | | | | 3,443 | | | | | |
Shares issued in exchange for OpenTV, Inc. shares | | 7,651,658 | | | — | | — | | | — | | | 17,576 | | | — | | | | — | | | | — | | | | — | | | | 17,576 | | | | | |
Amortization of deferred share-based compensation | | — | | | — | | — | | | — | | | — | | | — | | | | 2 | | | | — | | | | — | | | | 2 | | | | | |
Unrealized gains on investments, net of income taxes | | — | | | — | | — | | | — | | | — | | | — | | | | — | | | | 37 | | | | — | | | | 37 | | | $ | 37 | |
Foreign currency translation losses | | — | | | — | | — | | | — | | | — | | | — | | | | — | | | | (33 | ) | | | — | | | | (33 | ) | | | (33 | ) |
Net loss | | — | | | — | | — | | | — | | | — | | | — | | | | — | | | | — | | | | (10,818 | ) | | | (10,818 | ) | | | (10,818 | ) |
| | | | | | | | | | | | | | | | | | | | | | | | | | | | | | | | | | | | | |
Balances, December 31, 2006 | | 107,906,960 | | | 2,235,495 | | 30,631,746 | | | 35,953 | | | 491,630 | | | (38 | ) | | | — | | | | (261 | ) | | | (2,594,948 | ) | | | 167,831 | | | $ | (10,814 | ) |
| | | | | | | | | | | | | | | | | | | | | | | | | | | | | | | | | | | | | |
F-6
OPENTV CORP.
CONSOLIDATED STATEMENTS OF SHAREHOLDERS’ EQUITY AND COMPREHENSIVE LOSS—(Continued)
(In thousands, except share amounts)
| | | | | | | | | | | | | | | | | | | | | | | | | | | | | | | | | | | | | | | | |
| | | Class A | | | Class B | | Additional
Paid-In
Capital | | | Treasury
Shares | | | Deferred
Share-based
Compensation | | Accumulated
Other
Comprehensive
Income (Loss) | | | Accumulated
Deficit | | | Total | | | Other
Comprehensive
Loss | |
| | | Shares | | | Amount | | | Shares | | | Amount | | | | | | | |
Share options exercised | | 275,906 | | | | 303 | | | — | | | | — | | | 18 | | | | — | | | | — | | | — | | | | — | | | | 321 | | | | | |
Share-based and non-cash employee and director compensation, including stock options and restricted share grants | | 2,291,482 | | | | 159 | | | — | | | | — | | | 3,223 | | | | — | | | | — | | | — | | | | — | | | | 3,382 | | | | | |
Shares issued in exchange for OpenTV, Inc. shares | | 34,000 | | | | — | | | — | | | | — | | | 63 | | | | — | | | | — | | | — | | | | — | | | | 63 | | | | | |
Conversion of Class B shares to Class A shares | | 425,592 | | | | — | | | (425,592 | ) | | | — | | | — | | | | — | | | | — | | | — | | | | — | | | | — | | | | | |
Capital contribution from the controlling shareholder | | — | | | | — | | | — | | | | — | | | 5,395 | | | | — | | | | — | | | — | | | | — | | | | 5,395 | | | | | |
Share options repurchased | | — | | | | — | | | — | | | | — | | | (167 | ) | | | — | | | | — | | | — | | | | — | | | | (167 | ) | | | | |
Treasury shares repurchased | | — | | | | — | | | — | | | | — | | | — | | | | (1,305 | ) | | | — | | | — | | | | — | | | | (1,305 | ) | | | | |
Treasury shares retired | | (1,276,327 | ) | | | (1,343 | ) | | — | | | | — | | | — | | | | 1,343 | | | | — | | | — | | | | — | | | | — | | | | | |
Unrealized gains on investments, net of income taxes | | — | | | | — | | | — | | | | — | | | — | | | | — | | | | — | | | 17 | | | | — | | | | 17 | | | $ | 17 | |
Foreign currency translation gains | | — | | | | — | | | — | | | | — | | | — | | | | — | | | | — | | | 103 | | | | — | | | | 103 | | | | 103 | |
Net loss | | — | | | | — | | | — | | | | — | | | — | | | | — | | | | — | | | — | | | | (5,161 | ) | | | (5,161 | ) | | | (5,161 | ) |
| | | | | | | | | | | | | | | | | | | | | | | | | | | | | | | | | | | | | | | | |
Balances, December 31, 2007 | | 109,657,613 | | | $ | 2,234,614 | | | 30,206,154 | | | $ | 35,953 | | $ | 500,162 | | | $ | — | | | $ | — | | $ | (141 | ) | | $ | (2,600,109 | ) | | $ | 170,479 | | | $ | (5,041 | ) |
| | | | | | | | | | | | | | | | | | | | | | | | | | | | | | | | | | | | | | | | |
The accompanying notes are an integral part of these consolidated financial statements.
F-7
OPENTV CORP.
CONSOLIDATED STATEMENTS OF CASH FLOWS
(In thousands)
| | | | | | | | | | | | |
| | | Year Ended December 31, | |
| | | 2007 | | | 2006 | | | 2005 | |
Cash flows from operating activities: | | | | | | | | | | | | |
Net loss | | $ | (5,161 | ) | | $ | (10,818 | ) | | $ | (8,473 | ) |
Less: Loss from discontinued operations | | | (4,855 | ) | | | (1,161 | ) | | | (1,604 | ) |
| | | | | | | | | | | | |
Net loss from continuing operations | | | (306 | ) | | | (9,657 | ) | | | (6,869 | ) |
Adjustments to reconcile net loss to net cash provided by operating activities: | | | | | | | | | | | | |
Depreciation and amortization of property and equipment | | | 3,819 | | | | 3,059 | | | | 3,553 | |
Amortization of intangible assets | | | 5,888 | | | | 6,981 | | | | 5,758 | |
Share-based compensation | | | 3,267 | | | | 3,274 | | | | 8 | |
Non-cash employee compensation | | | 88 | | | | 121 | | | | 151 | |
Provision for (reduction of) doubtful accounts | | | 700 | | | | 82 | | | | (142 | ) |
Impairment costs | | | — | | | | 747 | | | | 602 | |
Gain on sale of cost investment | | | (1,739 | ) | | | — | | | | (3,126 | ) |
Loss on disposal of fixed assets | | | 346 | | | | 24 | | | | — | |
Minority interest | | | (35 | ) | | | (37 | ) | | | (62 | ) |
Changes in operating assets and liabilities: | | | | | | | | | | | | |
Accounts receivable | | | 1,329 | | | | (4,829 | ) | | | 406 | |
Prepaid expenses and other current assets | | | 1,752 | | | | (1,115 | ) | | | (4,004 | ) |
Other assets | | | 2,737 | | | | (1,909 | ) | | | (1,088 | ) |
Accounts payable | | | (1,192 | ) | | | 811 | | | | 743 | |
Accrued liabilities | | | 1,187 | | | | 2,844 | | | | (335 | ) |
Accrued restructuring | | | (190 | ) | | | 439 | | | | 537 | |
Deferred revenue | | | (1,467 | ) | | | 3,017 | | | | 5,051 | |
| | | | | | | | | | | | |
Net cash provided by operating activities of continuing operations | | | 16,184 | | | | 3,852 | | | | 1,183 | |
Net cash provided by (used in) operating activities of discontinued operations | | | 403 | | | | (879 | ) | | | 1,180 | |
| | | | | | | | | | | | |
Total net cash provided by operating activities | | | 16,587 | | | | 2,973 | | | | 2,363 | |
Cash flows from investing activities: | | | | | | | | | | | | |
Purchase of property and equipment | | | (3,378 | ) | | | (4,610 | ) | | | (2,779 | ) |
Cash used in acquisition, net of cash acquired (Note 5) | | | — | | | | — | | | | (4,199 | ) |
Proceeds from sale of cost investment | | | — | | | | — | | | | 7,126 | |
Proceeds from disposal of property and equipment | | | 27 | | | | — | | | | — | |
Proceeds from sale of marketable debt securities | | | 17,646 | | | | 12,448 | | | | 40,155 | |
Purchase of marketable debt securities | | | (24,235 | ) | | | (11,777 | ) | | | (30,035 | ) |
Private equity investments | | | — | | | | — | | | | (300 | ) |
| | | | | | | | | | | | |
Net cash provided by (used in) investing activities of continuing operations | | | (9,940 | ) | | | (3,939 | ) | | | 9,968 | |
Net cash used in investing activities of discontinued operations | | | (573 | ) | | | (32 | ) | | | (296 | ) |
| | | | | | | | | | | | |
Total net cash provided by (used in) investing activities | | | (10,513 | ) | | | (3,971 | ) | | | 9,672 | |
Cash flows from financing activities: | | | | | | | | | | | | |
Repurchase of employee stock options | | | (167 | ) | | | — | | | | — | |
Repurchase of treasury shares | | | (1,305 | ) | | | — | | | | — | |
Capital contribution from the controlling shareholder | | | 5,395 | | | | — | | | | — | |
Proceeds from issuance of ordinary shares | | | 321 | | | | 2,454 | | | | 183 | |
| | | | | | | | | | | | |
Net cash provided by financing activities of continuing operations | | | 4,244 | | | | 2,454 | | | | 183 | |
Effect of exchange rate changes on cash and cash equivalents of continuing operations | | | (198 | ) | | | (325 | ) | | | (216 | ) |
Effect of exchange rate changes on cash and cash equivalents of discontinued operations | | | (137 | ) | | | 256 | | | | (433 | ) |
| | | | | | | | | | | | |
Total effect of exchange rate changes on cash and cash equivalents | | | (335 | ) | | | (69 | ) | | | (649 | ) |
Net increase in cash and cash equivalents of continuing operations | | | 10,290 | | | | 2,042 | | | | 11,118 | |
Net increase (decrease) in cash and cash equivalents of discontinued operations | | | (307 | ) | | | (655 | ) | | | 451 | |
| | | | | | | | | | | | |
Net increase in cash and cash equivalents | | | 9,983 | | | | 1,387 | | | | 11,569 | |
Cash and cash equivalents, beginning of period, of continuing operations | | | 48,309 | | | | 46,267 | | | | 35,149 | |
Cash and cash equivalents, beginning of period, of discontinued operations | | | 307 | | | | 962 | | | | 511 | |
| | | | | | | | | | | | |
Cash and cash equivalents, beginning of period | | | 48,616 | | | | 47,229 | | | | 35,660 | |
Cash and cash equivalents, end of period, of continuing operations | | | 58,599 | | | | 48,309 | | | | 46,267 | |
Cash and cash equivalents, end of period, of discontinued operations | | | — | | | | 307 | | | | 962 | |
| | | | | | | | | | | | |
Cash and cash equivalents, end of period | | $ | 58,599 | | | $ | 48,616 | | | $ | 47,229 | |
| | | | | | | | | | | | |
Supplemental disclosure of cash flow information: | | | | | | | | | | | | |
Cash paid for income taxes | | $ | (1,617 | ) | | $ | (1,415 | ) | | $ | (1,088 | ) |
| | | | | | | | | | | | |
Non-cash investing and financing activities: | | | | | | | | | | | | |
Conversion of exchangeable shares | | $ | 63 | | | $ | 17,576 | | | $ | 26 | |
| | | | | | | | | | | | |
Value of bonus shares issued to employees | | $ | — | | | $ | 2,658 | | | $ | 3,180 | |
| | | | | | | | | | | | |
Retirement of treasury shares | | $ | 1,343 | | | $ | — | | | $ | — | |
| | | | | | | | | | | | |
Value of shares issued in connection with acquisition of CAM Systems (Note 5) | | $ | — | | | $ | — | | | $ | 13,050 | |
| | | | | | | | | | | | |
The accompanying notes are an integral part of these consolidated financial statements.
F-8
OPENTV CORP.
NOTES TO THE CONSOLIDATED FINANCIAL STATEMENTS
December 31, 2007
Note 1. Ownership and Business of OpenTV
We were formed as an international business company incorporated under the International Business Companies Act of the British Virgin Islands in September 1999 to act as a holding company for OpenTV, Inc., which then became our principal operating subsidiary. As of January 1, 2007, the International Business Companies Act was repealed and we are now governed by the provisions of the BVI Business Companies Act, 2004.
On August 27, 2002, Liberty Media Corporation and one of its subsidiaries (collectively, “Liberty”) completed a transaction in which Liberty acquired a controlling interest in us.
On January 16, 2007, Kudelski SA and certain of its subsidiaries (which we collectively refer to as Kudelski) completed a stock purchase transaction with Liberty, pursuant to which Kudelski acquired substantially all of our Class A and Class B ordinary shares owned by Liberty. As of December 31, 2007, Kudelski’s total ownership represented approximately 31.4% of the economic interest and approximately 76.7% of the voting interest of our ordinary shares on an undiluted basis. We were not a direct party to that transaction. We received $5.4 million in cash from Liberty on the closing date of the Kudelski transaction, and in February 2008, we received an additional $14.3 million in cash from Liberty. The aggregate amount of $19.7 million received from Liberty represents the total capital contribution due to us pursuant to an agreement we previously entered into with Liberty in February 2006, which provided for us to receive a portion of any premium received by Liberty in any sale of its stake in OpenTV. During the year ended December 31, 2007, we received approximately $0.4 million in interest income related to the unpaid capital contribution.
We provide software, content and applications, and professional services for digital and interactive television.
Note 2. Basis of Presentation
The consolidated financial statements included herein have been prepared in accordance with accounting principles generally accepted in the United States of America (GAAP).
Principles of Consolidation
The accompanying consolidated financial statements include the accounts of OpenTV Corp., sometimes referred to herein as OpenTV, together with its wholly-owned and majority-owned subsidiaries. All intercompany accounts and transactions have been eliminated.
Certain prior period amounts have been reclassified to conform to the 2007 presentation, primarily related to discontinued operations and the adoption of Financial Accounting Standards Board (FASB) Interpretation (FIN) No. 48, “Accounting for Uncertainty in Income Taxes” (FIN 48), an interpretation of Statement of Financial Accounting Standards (SFAS) No. 109, “Accounting for Income Taxes.”
Use of Estimates
The preparation of the accompanying consolidated financial statements in conformity with GAAP requires management to make certain estimates and assumptions that affect the reported amounts of assets and liabilities and disclosure of contingent assets and liabilities at the date of the consolidated financial statements and the reported amounts of revenue and expenses during the reporting period. Actual results could differ materially
F-9
from these estimates. Significant estimates and assumptions include matters related to revenue recognition, valuation allowances, impairments, restructuring costs and share-based compensation.
Discontinued Operations
In September 2007, we committed to a plan to dispose of Static 2358 Holdings Ltd. (Static), our subsidiary that operated the PlayJam business (PlayJam). In accordance with SFAS No. 144, “Accounting for the Impairment or Disposal of Long Lived Assets” (SFAS 144), the net assets associated with such business unit were considered as “held-for-sale”. The transaction closed on December 31, 2007.
In accordance with SFAS 144, the financial results of the disposal group were classified as a discontinued operation in our consolidated financial statements for all periods presented. Unless noted otherwise, discussions in the footnotes below pertain to continuing operations.
Note 3. Summary of Significant Accounting Policies
Cash and Cash Equivalents
Cash and cash equivalents are stated at cost, which approximates fair value. We consider all highly liquid instruments with original or remaining maturities of three months or less at the date of purchase and money market funds to be cash equivalents. As of December 31, 2007 and 2006, we had approximately $36.5 million and $29.9 million, respectively, of cash and cash equivalents in financial institutions in foreign jurisdictions, of which, respectively, $18.0 million and $11.2 million was denominated in United States dollars.
Marketable Debt Securities
Our policy is to minimize risk by investing in investment grade securities which earn returns based on current interest rates.
We classify all marketable debt securities as available-for-sale in accordance with SFAS No. 115,“Accounting for Certain Investments in Debt and Equity Securities.” Accordingly, our marketable debt securities are carried at fair value as of the balance sheet date. Short-term marketable debt securities are those with remaining maturities at the balance sheet date of one year or less. Long-term marketable debt securities have remaining maturities at the balance sheet date of greater than one year.
Unrealized gains and losses are reported as accumulated other comprehensive income (loss) in the statement of shareholders’ equity. Additionally, realized gains and losses on sales of all such investments are reported in results of operations and computed using the specific identification method. It is our policy to review our marketable debt securities investments on a regular basis to evaluate whether or not any security has experienced an other-than-temporary decline in fair value. If we believe that an other-than-temporary decline exists in one of our marketable debt securities, it is our policy to write down these debt investments to the market value and record the related write-down as an investment loss in our consolidated statements of operations.
Fair Value of Financial Instruments
The reported amounts of our financial instruments, including cash and cash equivalents, short-term marketable debt securities, accounts receivable (net of the allowance for doubtful accounts), accounts payable and accrued liabilities, approximate fair value due to their short maturities.
Concentration of Credit Risk
Financial instruments that potentially subject us to a concentration of credit risk consist principally of cash and cash equivalents, accounts receivable and marketable debt securities. Cash and cash equivalents are primarily invested in a diverse portfolio of money market securities and money market funds in accordance with our
F-10
investment policy. With respect to accounts receivable, our customer base is dispersed across many geographic areas and we generally do not require collateral. We analyze historic collection experience, customer credit-worthiness, current economic trends in each country where our customers are located, and customer payment history when evaluating the adequacy of the allowance for doubtful accounts.
Property and Equipment
Property and equipment are stated at cost less accumulated depreciation and amortization. Depreciation is computed using the straight-line method over the estimated useful lives of the assets of three to seven years. Leasehold improvements are amortized on a straight-line basis over the life of the lease, or the estimated useful life of the asset, whichever is shorter.
Major additions and improvements are capitalized, while replacements, maintenance, and repairs that do not improve or extend the life of the assets are charged to expense. In the period assets are retired or otherwise disposed of, the costs and related accumulated depreciation and amortization are removed from the accounts, and any gain or loss on disposal is included in results of operations.
Goodwill and Intangible Assets
In accordance with SFAS No. 142,“Goodwill and Other Intangible Assets” (SFAS 142), we review our goodwill for impairment annually, or more frequently if facts and circumstances warrant a review. The provisions of SFAS 142 require that a two-step test be performed to assess goodwill for impairment. First, the fair value of each reporting unit is compared to its carrying value. If the fair value exceeds the carrying value, goodwill is not impaired and no further testing is performed. The second step is performed if the carrying value exceeds the fair value. In this case, the implied fair value of the reporting unit’s goodwill is determined and compared to the carrying value of the goodwill. If the carrying value of a reporting unit’s goodwill exceeds its implied fair value, an impairment loss equal to the difference will be recorded.
We completed our annual goodwill impairment test during the fourth quarter of fiscal 2007.
SFAS 142 also requires that intangible assets with definite lives be amortized over their estimated useful life and reviewed for impairment in accordance with SFAS 144.
Intangible assets are stated at cost less accumulated amortization. Amortization of intangible assets is computed on a straight-line basis over the estimated benefit periods. The estimated benefit period ranges from three to thirteen years.
Long-Lived Assets
We account for long-lived assets under SFAS 144, which requires us to review for the impairment of long-lived assets whenever events or changes in circumstances indicate that the carrying amount of an asset might not be recoverable. When such an event occurs, we estimate the future cash flows expected to result from the use of the asset and its eventual disposition. If the undiscounted expected future cash flows are less than the carrying amount of the asset, an impairment loss is recognized for the difference between the asset’s fair value and its carrying value.
Revenue Recognition
We derive revenue from two primary sources: (i) royalties and licenses and (ii) services and other.
Royalties and licenses. In accordance with Statement of Position (SOP) 97-2,“Software Revenue Recognition”(SOP 97-2), we generally recognize royalties upon notification of shipment or activation of our software in set-top boxes and other products by licensees if a signed contract exists, delivery has occurred, the
F-11
fee is fixed or determinable and collection of the resulting receivable is probable. For non-refundable prepaid royalties, we recognize revenue upon delivery of software provided that all other requirements of SOP 97-2 have been met. In accordance with SOP 97-2, we recognize license fees if a signed contract exists, delivery has occurred, the fee is fixed or determinable and collection of the resulting receivable is probable.
Services and other. Professional services earned from software development contracts, customization services and implementation support are generally recognized using contract accounting on the percentage of completion basis in accordance with the provisions of SOP 81-1,“Accounting for Performance of Construction-Type and Certain Production-Type Contracts”(SOP 81-1). If a revenue contract involves the provision of multiple elements, total estimated contract revenues are allocated to each element based on the relative fair value of each element. In the event that fair value is not determinable for each element of a multiple-element contract, the contract is considered to be one accounting unit. If it is reasonably assured that no loss will be incurred under the arrangement, we recognize service revenues using the percentage of completion method using a zero-profit methodology until the services subject to contract accounting are complete. If the arrangement includes the future delivery of specified future software products, we recognize revenue upon delivery of the services and such specified deliverables based on the completed contract method. If total costs are estimated to exceed the relative fair value for the arrangement, then a provision for the estimated loss is made in the period in which the loss first becomes apparent.
We also receive services fees and revenue shares in connection with our advertising solutions and enhanced middleware solutions content. These revenues are recognized in accordance with Securities and Exchange Commission Staff Accounting Bulletin (SAB) No. 104, “Revenue Recognition” (SAB 104). Revenue is recognized only when the price is fixed or determinable, persuasive evidence of an arrangement exists, the service is performed and collectibility of the resulting receivable is reasonably assured.
Revenue shares include arrangements whereby our licensees pay us a percentage of the interactive revenues they earn from their customers. When we have delivered all of the software under such arrangements, we recognize the revenue as the licensee reports our revenue share to us, which is done generally on a quarterly basis.
Advertising fees are recognized as the advertisements are delivered or ratably over the contract period, where applicable, and when collection of the resulting receivable is reasonably assured.
For contracts with multiple obligations (for example, maintenance and other services), and for which vendor-specific objective evidence (VSOE) of fair value of the undelivered elements exists, we recognize revenue for the delivered elements based upon the residual method as prescribed by SOP No. 98-9, “Modification of SOP No. 97-2 with Respect to Certain Transactions.” Generally, we have VSOE of fair value for the maintenance element of software arrangements based on the renewal rates for maintenance in future years as specified in the contracts. In such cases, we defer the maintenance revenue at the outset of the arrangement and recognize it ratably over the period during which the maintenance is to be provided, which generally commences on the date the software is delivered. Payments for maintenance and support are generally made in advance and are non-refundable. VSOE of fair value of the service element is determined based on the price charged when those services are sold separately. For revenue allocated to consulting services and for consulting services sold separately, we recognize revenue as the related services are performed.
Under multiple-element arrangements where the customer receives rights for unspecified products or services when they are made available, we recognize the entire arrangement fee ratably over the term of the arrangement, in the appropriate respective revenue categories. Under multiple-element arrangements where the customer receives rights for specified future products and VSOE of fair value does not exist, we defer all revenue until the earlier of the point at which sufficient VSOE exists for all undelivered elements, or until all elements of the arrangement have been delivered.
F-12
Under multiple-element arrangements where the only undelivered element is maintenance and support and VSOE does not exist, the entire arrangement fee is recognized ratably over either the contractual maintenance and support period, or the period during which maintenance and support is expected to be provided.
We have entered into commercial arrangements involving both product licenses and service elements that are bundled together. Revenues from such bundled offerings under GAAP have been allocated to the“Royalties and licenses” and“Services and other” revenue line items based on the relative fair values of the product and service elements in each of the contracts. Our determination of the relative fair values of these elements is based on the relative amounts of the fees we charge our customers for the product licenses and service elements, as set forth in each of the applicable contracts.
Other Revenue Accounting Policies
In the normal course of business, we act as or use an intermediary or agent in executing transactions with third parties. The determination of whether revenue should be reported as gross or net is based on an assessment of whether we are acting as the principal or acting as an agent in the transaction. In determining whether we serve as principal or agent, we follow the guidance in Emerging Issues Task Force (EITF) 99-19, “Reporting Revenue Gross as a Principal versus Net as an Agent.”
In November 2001, the EITF reached consensus on EITF No. 01-09,“Accounting for Consideration Given by a Vendor to a Customer or Reseller of the Vendor’s Products” (EITF 01-09). In accordance with EITF 01-09, we account for cash consideration given to customers, for which we do not receive a separately identifiable benefit and cannot reasonably estimate fair value, as a reduction of revenue rather than as an expense.
Deferred Revenue and Contract Costs
Deferred revenue consists primarily of billings for royalties, services and licenses to customers with multiple-element arrangements where VSOE of fair value for certain undelivered elements does not exist, and for undelivered products or services which are generally amortized over the term of the arrangement or as such products or services are delivered. Deferred contract costs consist primarily of headcount and headcount-related costs, consulting and subcontractor costs and third party material costs which are considered directly allocable to multiple-element service arrangements accounted for under the contract accounting method in accordance with SOP 81-1. These costs are accumulated in the same manner as inventory costs, and are charged to operations as the related contract revenues are recognized. If total contract costs are estimated to exceed the estimated contract revenues for an arrangement, then a provision for the estimated loss is made in the period in which the loss first becomes apparent.
Research and Development
Costs incurred in the research and development of new software products are expensed as incurred until technological feasibility is established. Development costs are capitalized beginning when a product’s technological feasibility has been established and ending when the product is available for general release to customers, in accordance with SFAS No. 86, “Accounting for the Costs of Computer Software to be Sold, Leased or Otherwise Marketed.” To date, software development costs incurred between completion of a working prototype and general availability of the related product have not been material and have not been capitalized.
Advertising
Costs related to advertising and promotion of products are charged to sales and marketing expense as incurred. Advertising expense for the years ended December 31, 2007, 2006, and 2005 was $0.3 million, $0.9 million, and $0.4 million, respectively.
F-13
401(k) Plan
Employees based in the United States participate in a 401(k) plan which provides retirement benefits through tax-deferred salary deductions for all eligible employees meeting certain age and service requirements. Participating employees may contribute an amount of their eligible compensation, subject to an annual limit. We, at the discretion of our board of directors, may make discretionary matching contributions on behalf of our employees. We made contributions to the plan in the amounts of $0.7 million, $0.7 million, and $0.6 million for the years ended December 31, 2007, 2006 and 2005, respectively.
Employee Bonus
For the years ended December 31, 2007, 2006, and 2005, the compensation committee of our board of directors approved a bonus plan that provided for cash payments or the issuance of our Class A ordinary shares to employees based on company and individual performance objectives. Due to legal restrictions in certain foreign jurisdictions related to the issuance of shares, bonuses awarded to employees in certain foreign jurisdictions other than the United Kingdom were paid solely in cash. Bonus payments in respect of the year ended December 31, 2007 have not yet been made, but the estimated amount recorded as an expense was $5.5 million. The amount recorded as an expense was $5.2 million and $5.8 million, respectively, for each of the years ended December 31, 2006 and 2005.
On August 27, 2007, our board of directors approved the adoption of the 2007 Management Bonus and Equity Issuance Plan. A total of 1,020,232 restricted Class A ordinary shares were issued pursuant to this plan during 2007. In connection with that issuance, we reserved for issuance an additional equivalent number of shares under our 2005 Incentive Plan in accordance with the terms of that plan.
During the first quarter of 2007, we paid approximately $5.1 million in cash to our employees as a bonus for achievement of company and individual performance objectives in 2006. This amount was fully accrued as of December 31, 2006.
During the first quarter of 2006, we paid approximately $0.2 million in cash to our employees as a bonus for achievement of company and individual in performance objective in 2005. During the second quarter of 2006, we paid the full remaining 2005 bonus net of withholding taxes in the form of 935,664 shares of our Class A ordinary shares with an aggregate value of $2.7 million (based on the closing price for our Class A ordinary shares on the issuance date) to our employees in the United States and the United Kingdom and cash to our employees in other jurisdictions. In connection with that issuance, we reserved for issuance an additional equivalent number of shares under our 2005 Incentive Plan in accordance with the terms of that plan.
During the first quarter of 2005, we paid the 2004 bonus net of withholding taxes in the form of 1,162,180 shares of our Class A ordinary shares with an aggregate value of $3.2 million (based on the closing price for our Class A ordinary shares on the issuance date) to our employees in the United States and the United Kingdom and cash in our other foreign jurisdictions.
Operating Leases
We lease office space under operating lease agreements with original lease periods of up to nine years. Certain of the lease agreements contain rent holidays and rent escalation provisions. Rent holidays and rent escalation provisions are considered in determining straight-line rent expense to be recorded over the lease term. The lease term begins on the date of initial possession of the lease property for purposes of recognizing lease expense on a straight-line basis over the term of the lease. Lease renewal periods are considered on a lease-by-lease basis and are generally not included in the initial lease term.
F-14
Income Taxes
We account for income taxes using an asset and liability approach that requires the recognition of taxes payable or refundable for the current year and deferred tax liabilities and assets for the future tax consequences of events that have been recognized in our consolidated financial statements or tax returns. The measurement of current and deferred tax liabilities and assets is based on provisions of the enacted tax law. The measurement of deferred tax assets is reduced, if necessary, by a valuation allowance if it is more likely than not that a deferred benefit will not be realized.
In July 2006, the FASB issued FIN 48, which requires that a position taken or expected to be taken in a tax return be recognized in the consolidated financial statements when it is more likely than not (i.e. a likelihood of more than fifty percent) that the position would be sustained upon examination by tax authorities. A recognized tax position is then measured at the largest amount of benefit that is more likely than not (i.e. greater than fifty percent probability) to be realized upon ultimate settlement. Upon adoption, the cumulative effect of applying the recognition and measurement provisions of FIN 48, if any, shall be reflected as an adjustment to the opening balance of retained earnings.
FIN 48 also requires expanded disclosures including identification of tax positions for which it is reasonably possible that the total amount of unrecognized tax benefits will significantly change in the next twelve months, a description of tax years that remain subject to examination by major tax jurisdictions, a tabular reconciliation of the total amount of unrecognized tax benefits at the beginning and end of each annual reporting period, the total amount of unrecognized tax benefits that, if recognized, would affect the effective tax rate and the total amounts of interest and penalties recognized in the statements of operations and financial position.
On January 1, 2007, we adopted FIN 48. The adoption did not result in an adjustment to accumulated deficit.
Share-Based Compensation
On January 1, 2006, we adopted SFAS No. 123 (revised 2004),“Share-Based Payment” (SFAS 123(R)), that addresses the accounting for share-based payment transactions in which an enterprise receives employee services in exchange for either equity instruments of the enterprise or liabilities that are based on the fair value of the enterprise’s equity instruments or that may be settled by the issuance of such equity instruments. The statement eliminates the ability to account for share-based compensation transactions, as we formerly did, using the intrinsic value method as prescribed by Accounting Principles Board (APB) Opinion No. 25, “Accounting for Stock Issued to Employees” (APB 25), and generally requires that such transactions be accounted for using a fair-value-based method and recognized as expenses in our consolidated statement of operations.
We adopted SFAS 123(R) using the modified prospective method which requires the application of the accounting standard as of January 1, 2006. Our consolidated financial statements as of December 31, 2007 and 2006 reflect the impact of adopting SFAS 123(R). In accordance with the modified prospective method, the consolidated financial statements for prior periods have not been restated to reflect, and do not include, the impact of SFAS 123(R).
Share-based compensation expense recognized in the consolidated statement of operations during the years ended December 31, 2007 and 2006 included compensation expense related to share-based payment awards granted: (i) prior to, but not yet vested, as of December 31, 2005, based on the grant date fair value estimated in accordance with the pro forma provisions of SFAS No. 148, “Accounting for Share-based Compensation—Transition and Disclosure” (SFAS 148); and (ii) subsequent to December 31, 2005, based on the grant date fair value estimated in accordance with the provisions of SFAS 123(R). As share-based compensation expense recognized in the statement of operations for the years ended December 31, 2007 and 2006 is based on awards management reasonably believes, based on various criteria, are ultimately expected to vest, it has been reduced
F-15
for estimated forfeitures. SFAS 123(R), which we applied to grants after December 31, 2005, requires forfeitures to be estimated at the time of grant, based, in part, on employment histories, and revised, if necessary, in subsequent periods if actual forfeitures differ from those estimates. In the pro forma information required under SFAS 148 for the periods prior to 2006, we accounted for forfeitures as they occurred.
Comprehensive Income (loss)
We account for comprehensive income in accordance with the provisions of SFAS No. 130,“Reporting Comprehensive Income.” This statement requires companies to classify items of comprehensive income by their nature in the consolidated financial statements and display the accumulated balance of other comprehensive income separately from retained earnings and additional paid-in capital in the equity section of the consolidated balance sheets. Accordingly, we reported foreign currency translation adjustments and the unrealized gain (loss) on marketable securities in comprehensive income (loss).
Foreign Currency Translation
The functional currency of our foreign subsidiaries is generally the local currency. Assets and liabilities are translated into United States dollars at the balance sheet date exchange rate. Revenues and expenses are translated at the average exchange rate prevailing during the period. The related gains and losses from translation are recorded as a translation adjustment in a separate component of shareholders’ equity. Foreign currency transaction gains and losses are included in results of operations.
Recent Accounting Pronouncements
In September 2006, the FASB issued of SFAS No. 157,“Fair Value Measures” (SFAS 157). SFAS 157 provides guidance for using fair value to measure assets and liabilities and applies whenever other standards require or permit assets or liabilities to be measured at fair value but does not expand the use of fair value in any new circumstances. SFAS 157 is effective for fiscal years beginning after November 15, 2007 and interim periods within those fiscal years. We do not expect SFAS 157 to have a material impact on our consolidated financial statements.
In February 2007, the FASB issued SFAS No. 159,“The Fair Value Option for Financial Assets and Financial Liabilities—Including an Amendment of FASB Statement No. 115” (SFAS 159). SFAS 159 provides the option to report certain financial assets and liabilities at fair value, with the intent to mitigate volatility in financial reporting that can occur when related assets and liabilities are recorded on different bases. SFAS 159 is effective for fiscal years beginning after November 15, 2007. We do not expect SFAS 159 to have a material impact on our consolidated financial statements.
In December 2007, the FASB issued FASB Statement No. 141 (Revised 2007),“Business Combinations”(SFAS 141(R)). Under SFAS 141(R), an acquiring entity will be required to recognize all the assets acquired and liabilities assumed in a transaction at the acquisition-date fair value with limited exceptions. SFAS 141(R) will significantly change the accounting for business combinations. SFAS 141(R) also includes a substantial number of new disclosure requirements. SFAS 141(R) applies prospectively to business combinations for which the acquisition date is on or after the beginning of the first annual reporting period beginning on or after December 15, 2008. Earlier adoption is prohibited.We have not yet determined the impact, if any, the adoption of SFAS 141(R) will have on our consolidated financial statements.
F-16
Note 4. Net Loss Per Share
Basic and diluted net loss per share were computed using the weighted-average number of ordinary shares outstanding during the periods presented. The following weighted items as of December 31 were not included in the computation of diluted net loss per share because the effect would be anti-dilutive:
| | | | | | |
| | | 2007 | | 2006 | | 2005 |
Class A ordinary shares issuable upon exercise of stock options | | 7,609,683 | | 10,493,807 | | 10,035,530 |
Class A ordinary shares issuable for shares of OpenTV, Inc. Class A common stock (including shares of OpenTV, Inc. Class A common stock issuable upon exercise of stock options) | | 671,006 | | 655,542 | | 746,628 |
Class B ordinary shares issuable for shares of OpenTV, Inc. Class B common stock | | — | | 84,387 | | 7,594,796 |
Had such items been included in the calculation of diluted net loss per share, shares used in the calculation would have been increased by approximately 0.9 million, 3.4 million, and 9.5 million in the years ended December 31, 2007, 2006, and 2005, respectively.
Note 5. CAM Systems Acquisition
On September 7, 2005, we acquired substantially all of the cable TV advertising inventory management assets of CAM Systems, L.L.C., or CAMS, and its affiliates in a transaction accounted for as a purchase. For financial reporting purposes, the purchase price was recorded as approximately $17.5 million, consisting of $4.2 million in cash, 5,221,462 of our Class A ordinary shares with an estimated fair value of $13.1 million, as determined under EITF 97-15,“Accounting for Contingency Arrangements Based on Security Prices in a Purchase Business Combination,” which reflected the “floor” for the pricing collar in the transaction, and direct transaction expenses of approximately $0.2 million. Under the terms of that acquisition, the sellers and we agreed to adjust the number of shares issued under specified circumstances. On March 7, 2006, we determined that no adjustments would be required to the purchase price based on the trading value of our Class A ordinary shares.
The total purchase price, including expenses, was allocated based upon a third party appraisal as follows (in thousands):
| | | |
| | | Purchase Price |
Tangible net assets acquired | | $ | 341 |
Intangible assets acquired: | | | |
Developed technology | | | 4,200 |
Customer base | | | 3,300 |
Trademarks | | | 300 |
Goodwill | | | 9,381 |
| | | |
| | $ | 17,522 |
| | | |
The intangible assets consist of customer contracts and relationships, developed technology and trademarks, and have been assigned estimated useful lives of five years, three years and four years, respectively.
The acquired businesses provide an integrated campaign management, or traffic and billing, software system designed and operated to manage local advertising inventory for cable system operators and a sales management software solution designed to assist in the creation of customer proposals, rate card management,
F-17
local advertising research and other related customer relationship services for the local advertising market. We currently intend to continue marketing, developing and supporting these products.
Note 6. Discontinued Operations
In July 2001, we acquired Static, an interactive TV media and entertainment company, which became our PlayJam business unit. In September 2007, we committed to a plan to dispose of Static. In accordance with SFAS 144, the net assets associated with this business unit were considered as “held-for-sale”. The transaction closed on December 31, 2007. The purchase price included cash of $0.2 million, a 19% equity stake in the acquiring entity and contingent consideration that is subject to the acquiring entity’s achievement of net income and realization of net operating losses for tax purposes.
In accordance with SFAS 144, the financial results of the disposal group have been classified as a discontinued operation in our consolidated financial statements for all periods presented.
As a result of a reassessment of the carrying value of the long-lived assets of the discontinued operations, in accordance with SFAS 144 and SFAS 142, during the year ended December 31, 2007, we recorded an impairment charge of $3.6 million representing the entire goodwill balance for PlayJam, $0.2 million of impairment charge to property and equipment, and $1.4 million of loss on the sale of the subsidiary. We determined fair values for purpose of our impairment analysis based on current expectations for the business and the sales price.
The assets and liabilities classified as discontinued operations were all disposed of as of December 31, 2007. The assets and liabilities classified as discontinued operations as of December 31 were as follows (in thousands):
| | | | | | |
| | | December 31,
2007 | | December 31,
2006 |
Cash and cash equivalents | | $ | — | | $ | 307 |
Accounts receivable | | | — | | | 1,876 |
Prepaid expenses and other current assets | | | — | | | 321 |
| | | | | | |
Total current assets of discontinued operations | | $ | — | | $ | 2,504 |
| | | | | | |
Goodwill | | $ | — | | $ | 3,626 |
Property and equipment, net | | | — | | | 352 |
Other assets | | | — | | | 191 |
| | | | | | |
Total non-current assets of discontinued operations | | $ | — | | $ | 4,169 |
| | | | | | |
| | | | | | |
Accounts payable | | $ | — | | $ | 456 |
Accrued liabilities | | | — | | | 1,204 |
| | | | | | |
Total current liabilities of discontinued operations | | $ | — | | $ | 1,660 |
| | | | | | |
F-18
The results of operations included in discontinued operations were as follows (in thousands):
| | | | | | | | | | | | |
| | | Year Ended December 31, | |
| | | 2007 | | | 2006 | | | 2005 | |
Revenues—services and other | | $ | 5,183 | | | $ | 6,698 | | | $ | 9,165 | |
Cost of revenues—services and other | | | 3,700 | | | | 5,937 | | | | 7,020 | |
| | | | | | | | | | | | |
Gross profit | | | 1,483 | | | | 761 | | | | 2,145 | |
Research and development | | | 922 | | | | 1,452 | | | | 2,945 | |
Sales and marketing | | | — | | | | 181 | | | | 480 | |
General and administrative | | | 424 | | | | 503 | | | | 421 | |
Restructuring and impairment costs | | | 66 | | | | 303 | | | | — | |
Impairment of goodwill | | | 3,626 | | | | — | | | | — | |
Impairment of property and equipment | | | 138 | | | | — | | | | — | |
| | | | | | | | | | | | |
Loss from operations | | | (3,693 | ) | | | (1,678 | ) | | | (1,701 | ) |
Interest income | | | 16 | | | | 11 | | | | 12 | |
Other income | | | — | | | | — | | | | 6 | |
Loss on sale of subsidiary | | | (1,339 | ) | | | — | | | | — | |
| | | | | | | | | | | | |
Loss from discontinued operations before income taxes | | | (5,016 | ) | | | (1,667 | ) | | | (1,683 | ) |
Income tax benefit | | | (161 | ) | | | (506 | ) | | | (79 | ) |
| | | | | | | | | | | | |
Net loss from discontinued operations | | $ | (4,855 | ) | | $ | (1,161 | ) | | $ | (1,604 | ) |
| | | | | | | | | | | | |
During the fourth quarter of 2007, we reduced the workforce of our PlayJam business in the United Kingdom by three, resulting in a restructuring provision of $0.1 million for severance that was included as part of results of operations of the discontinued operations. These severance amounts were paid before the related disposal group was sold in December 2007.
During the fourth quarter of 2006, we reduced the workforce of PlayJam in the United Kingdom by nine people, resulting in a restructuring provision of $0.3 million for severance. As of December 31, 2006, all related severance payments had been paid.
The cash flows from the discontinued operations, as presented in the consolidated statement of cash flows, relate to the operations of PlayJam until the divestiture occurred in the fourth quarter of 2007.
The balance of foreign currency translation adjustments associated with Static was eliminated upon divestiture and included in the gain (loss) from discontinued operations.
F-19
Note 7. Balance Sheet Components (in thousands)
| | | | | | | | |
| | | December 31,
2007 | | | December 31,
2006 | |
Prepaid expenses and other current assets: | | | | | | | | |
Value added tax | | $ | 287 | | | $ | 606 | |
Current deferred tax asset | | | 575 | | | | 274 | |
Receivable from sale of cost investment | | | 1,739 | | | | — | |
Deferred contract costs | | | 271 | | | | 650 | |
Other | | | 2,593 | | | | 3,948 | |
| | | | | | | | |
| | $ | 5,465 | | | $ | 5,478 | |
| | | | | | | | |
Property and equipment: | | | | | | | | |
Computers and equipment | | $ | 16,074 | | | $ | 15,093 | |
Software | | | 5,419 | | | | 5,234 | |
Furniture and fixtures | | | 1,659 | | | | 2,632 | |
Leasehold improvements | | | 2,179 | | | | 2,329 | |
| | | | | | | | |
| | | 25,331 | | | | 25,288 | |
Less accumulated depreciation and amortization | | | (18,777 | ) | | | (18,409 | ) |
| | | | | | | | |
| | $ | 6,554 | | | $ | 6,879 | |
| | | | | | | | |
Other assets: | | | | | | | | |
Deposits | | $ | 604 | | | $ | 629 | |
Deferred contract costs | | | 1,162 | | | | 3,136 | |
Other | | | 130 | | | | 871 | |
| | | | | | | | |
| | $ | 1,896 | | | $ | 4,636 | |
| | | | | | | | |
Accrued liabilities (current and non-current): | | | | | | | | |
Accrued payroll and related liabilities | | $ | 10,439 | | | $ | 8,323 | |
Accrued professional fees | | | 1,308 | | | | 1,222 | |
Accrued marketing | | | 673 | | | | 1,457 | |
Accrued income taxes | | | 3,316 | | | | 3,611 | |
Deferred rent | | | 1,483 | | | | 1,569 | |
Other | | | 2,905 | | | | 2,755 | |
| | | | | | | | |
| | $ | 20,124 | | | $ | 18,937 | |
| | | | | | | | |
As of December 31, 2007 and 2006, accounts receivable included approximately $2.2 million and $1.3 million, respectively, of unbilled receivables.
F-20
Note 8. Marketable Debt Securities
The following is a summary of marketable debt securities as of December 31 (in thousands):
| | | | | | | | | | | | | |
| | | 2007 |
| | | Purchase/
Amortized
Cost | | Gross
Unrealized
Gains | | Gross
Unrealized
Losses | | | Estimated
Fair Value |
Corporate debt securities | | $ | 7,535 | | $ | 2 | | $ | (12 | ) | | $ | 7,525 |
Asset-backed securities | | | 3,351 | | | 6 | | | (7 | ) | | | 3,350 |
Money market securities | | | 8,268 | | | 1 | | | — | | | | 8,269 |
U.S. agency debt securities | | | 1,000 | | | 1 | | | — | | | | 1,001 |
Certificates of deposit | | | 259 | | | — | | | — | | | | 259 |
| | | | | | | | | | | | | |
Total short-term marketable debt securities | | | 20,413 | | | 10 | | | (19 | ) | | | 20,404 |
| | | | |
Corporate debt securities | | | 396 | | | 3 | | | — | | | | 399 |
Asset-backed securities | | | 1,324 | | | — | | | (43 | ) | | | 1,281 |
Certificates of deposit | | | 1,131 | | | — | | | — | | | | 1,131 |
| | | | | | | | | | | | | |
Total long-term marketable debt securities | | | 2,851 | | | 3 | | | (43 | ) | | | 2,811 |
| | | | | | | | | | | | | |
Total marketable debt securities | | $ | 23,264 | | $ | 13 | | $ | (62 | ) | | $ | 23,215 |
| | | | | | | | | | | | | |
| |
| | | 2006 |
| | | Purchase/
Amortized
Cost | | Gross
Unrealized
Gains | | Gross
Unrealized
Losses | | | Estimated
Fair Value |
Corporate debt securities | | $ | 1,695 | | $ | 1 | | $ | (5 | ) | | $ | 1,691 |
Asset-backed securities | | | 4,908 | | | 1 | | | (2 | ) | | | 4,907 |
Money market securities | | | 1,590 | | | — | | | — | | | | 1,590 |
U.S. agency debt securities | | | 493 | | | — | | | — | | | | 493 |
| | | | | | | | | | | | | |
Total short-term marketable debt securities | | | 8,686 | | | 2 | | | (7 | ) | | | 8,681 |
| | | | |
Corporate debt securities | | | 5,437 | | | — | | | (56 | ) | | | 5,381 |
Asset-backed securities | | | 553 | | | — | | | — | | | | 553 |
U.S. government debt securities | | | 999 | | | — | | | (5 | ) | | | 994 |
Certificates of deposit | | | 1,000 | | | — | | | — | | | | 1,000 |
| | | | | | | | | | | | | |
Total long-term marketable debt securities | | | 7,989 | | | — | | | (61 | ) | | | 7,928 |
| | | | | | | | | | | | | |
Total marketable debt securities | | $ | 16,675 | | $ | 2 | | $ | (68 | ) | | $ | 16,609 |
| | | | | | | | | | | | | |
As of December 31, 2007, we pledged two certificates of deposit aggregating approximately $1.4 million, of which $0.3 million is included under short-term marketable debt securities and $1.1 million is included under long-term marketable debt securities, as collateral in respect of three standby letters of credit aggregating approximately $1.2 million, two of which were issued to landlords of our leased properties and one of which was issued to a sublessee at our New York City facility which we had vacated in the second quarter of 2005.
F-21
In accordance with EITF 03-01,“The Meaning of Other-Than-Temporary Impairment and Its Application to Certain Investments,” the following table summarizes the fair value and gross unrealized losses related to available-for-sale securities, aggregated by investment category and length of time that individual securities have been in a continuous unrealized loss position, as of December 31, 2007 (in thousands):
| | | | | | | | | | | | | | | | | | | | | |
| | | Less than 12 months | | | 12 months or More | | | Total | |
| | | Fair
Value | | Gross
Unrealized
Losses | | | Fair
Value | | Gross
Unrealized
Losses | | | Fair
Value | | Gross
Unrealized
Losses | |
Corporate debt securities | | $ | 1,044 | | $ | (2 | ) | | $ | 3,533 | | $ | (10 | ) | | $ | 4,577 | | $ | (12 | ) |
Asset-backed securities | | | 1,966 | | | (50 | ) | | | — | | | — | | | | 1,966 | | | (50 | ) |
Money market securities | | | 2,687 | | | — | | | | — | | | — | | | | 2,687 | | | — | |
U.S. government debt securities | | | 499 | | | — | | | | — | | | — | | | | 499 | | | — | |
| | | | | | | | | | | | | | | | | | | | | |
Total | | | 6,196 | | | (52 | ) | | | 3,533 | | | (10 | ) | | | 9,729 | | | (62 | ) |
| | | | | | | | | | | | | | | | | | | | | |
Fair values were determined for each individual security in the investment portfolio, the declines in value of these investments are primarily related to changes in interest rates and are considered to be temporary in nature.
Note 9. Goodwill
As of December 31, 2007, our goodwill balance related to (i) our acquisitions of Wink Communications, Inc., ACTV Inc., BettingCorp and CAMS and (ii) our acquisition of minority interests upon the conversions of OpenTV, Inc. shares to OpenTV Corp. shares. As required by SFAS 142, we have allocated goodwill to our reportable segments. Below is our goodwill reported by segment as of December 31, 2007 and 2006 (in thousands):
| | | | | | |
| | | 2007 | | 2006 |
Middleware solutions | | $ | 71,504 | | $ | 71,679 |
Advertising solutions | | | 23,578 | | | 23,340 |
| | | | | | |
Total | | $ | 95,082 | | $ | 95,019 |
| | | | | | |
Changes in the carrying amount of goodwill during the years ended December 31 were as follows (in thousands):
| | | | | | | |
| | | 2007 | | 2006 | |
Beginning balance | | $ | 95,019 | | $ | 76,498 | |
Conversion of OpenTV, Inc. shares to OpenTV Corp. shares | | | 63 | | | 17,576 | |
Reclassification of certain other assets and intangibles | | | — | | | 1,692 | |
Impairment | | | — | | | (747 | ) |
| | | | | | | |
Ending balance | | $ | 95,082 | | $ | 95,019 | |
| | | | | | | |
During the fourth quarter of 2006, we were informed by iN DEMAND that NASCAR would not be renewing their distribution arrangement with them and that iN DEMAND would therefore not be renewing our production agreement with them. As a result, we recorded an impairment charge of $0.8 million in our advertising solutions segment representing the entire goodwill balance for the NASCAR reporting unit.
Goodwill of approximately $3.6 million related to PlayJam was included in non-current assets of discontinued operations. As a result of a reassessment of the carrying value of the long-lived assets of our discontinued operations, in accordance with SFAS 144 and SFAS 142, during the year ended December 31, 2007, we recorded an impairment charge of $3.6 million representing the entire goodwill balance for our PlayJam business, which has been included in net loss from discontinued operations.
F-22
Based on the results of our annual impairment test, which we perform in the fourth quarter, we determined that no other impairment of goodwill for 2007, 2006 or 2005 existed.
Minority shareholders of OpenTV, Inc., which is a subsidiary of ours that is not publicly traded, have the ability, under certain arrangements, to exchange their shares of OpenTV, Inc. for our shares, generally on a one-for-one basis. As the shares are exchanged, they are accounted for at fair value. This accounting effectively provides that at each exchange date, the exchange is accounted for as a purchase by us of a minority interest in OpenTV, Inc., valued at the number of our Class A ordinary shares issued to effect the exchange multiplied by the market price of a Class A ordinary share on that date.
As of December 31, 2005, Sun Microsystems, Inc. beneficially owned 7,594,796 shares of OpenTV, Inc. Class B common stock. On January 4, 2006, Sun exercised its right to exchange those Class B shares in OpenTV, Inc. for the same number of our Class B ordinary shares. As a result of applying purchase accounting to this exchange, we recorded an additional $17.4 million of goodwill in the three months ended March 31, 2006. On April 6, 2006, Sun Microsystems, Inc. converted its Class B ordinary shares into Class A ordinary shares.
Note 10. Intangible Assets, Net
The components of intangible assets, excluding goodwill, were as follows (in thousands):
| | | | | | | | | | | | | | | |
| | | Useful
Life in
Years | | December 31, 2007 | | | December 31, 2006 |
| | | Gross
Carrying
Amount | | Accumulated
Amortization | | | Net
Carrying
Amount | | Net
Carrying
Amount |
Intangible assets: | | | | | | | | | | | | | | | |
Patents | | 5-13 | | $ | 14,102 | | $ | (4,880 | ) | | $ | 9,222 | | $ | 10,872 |
Developed technologies | | 3-5 | | | 8,600 | | | (7,117 | ) | | | 1,483 | | | 4,103 |
Contracts and relationships | | 5 | | | 3,300 | | | (1,539 | ) | | | 1,761 | | | 3,302 |
Trademarks | | 4 | | | 300 | | | (177 | ) | | | 123 | | | 200 |
| | | | | | | | | | | | | | | |
| | | | $ | 26,302 | | $ | (13,713 | ) | | $ | 12,589 | | $ | 18,477 |
| | | | | | | | | | | | | | | |
The intangible assets are being amortized on a straight-line basis over their estimated useful lives. Aggregate amortization of intangible assets was $5.9 million, $7.0 million, and $5.8 million for the years ended December 31, 2007, 2006, and 2005, respectively. Of the aggregate amount, $4.3 million, $4.9 million, and $4.1 million were reported in cost of revenues (royalties and licenses) in the statement of operations for the years ended December 31, 2007, 2006 and 2005, respectively.
The future annual amortization expense is expected to be as follows (in thousands):
| | | |
Year Ending December 31, | | Amortization
Expense |
2008 | | $ | 3,295 |
2009 | | | 1,785 |
2010 | | | 1,530 |
2011 | | | 1,081 |
2012 | | | 1,081 |
2013 | | | 1,081 |
Thereafter | | | 2,736 |
| | | |
| | $ | 12,589 |
| | | |
F-23
Note 11. Disposal of PlayMonteCarlo Channel Listing and Customer List
In October 2006, we signed an agreement to sell our betting and gaming channel listing on BSkyB in the United Kingdom and BettingCorp’s customer list for its fixed odds gaming business. As part of the transaction, we received approximately $0.7 million (representing £360,000) after a 90-day post-closing transition period and could receive up to approximately an additional $2.3 million (representing £1,200,000) over a 24 month period, subject to, among other things, the achievement of specified revenue targets over that period. Through December 31, 2007, we had not received any of this additional amount. The transaction closed in the fourth quarter of 2006, and as a result we recorded a net gain of approximately $0.1 million reflecting only those proceeds considered determinable beyond a reasonable doubt at that time, net of direct costs. We are no longer engaged in the fixed odds gaming business. Other than the channel listing and customer list, we retained all intellectual property, technology and other assets associated with the BettingCorp business to support our ongoing OpenTV Participate product line.
Note 12. Restructuring and Impairment Costs
We continuously monitor our organizational structure and associated operating expenses. Depending upon events and circumstances, actions may be taken to restructure the business. Restructuring activities could include terminating employees, abandoning excess leased space and incurring other exit costs. Restructuring costs are recorded in accordance with SFAS No. 146, “Accounting for Costs Associated with Exit or Disposal Activities” (SFAS 146). SFAS 146 requires that a liability for a cost associated with an exit or disposal activity be recognized when the liability is incurred. Any resulting restructuring accrual depends on numerous estimates made by management, which are developed based on management’s knowledge of the activity being affected and the cost to exit existing commitments. These estimates could differ from actual results. We monitor the initial estimates periodically and record adjustments for any significant changes.
The following sets forth the activity relating to the restructuring activities for the years ended December 31, 2007, 2006 and 2005 (in thousands):
| | | | | | | | | | | | | | | | |
| | | Employee
Severance
and Benefits | | | Excess
Facilities | | | Asset
Write-offs | | | Total | |
Balance, December 31, 2004 | | $ | — | | | $ | 1,394 | | | $ | — | | | $ | 1,394 | |
2005 provision, net of reversals | | | 383 | | | | 1,860 | | | | 302 | | | | 2,545 | |
Cash payments | | | (170 | ) | | | (2,097 | ) | | | — | | | | (2,267 | ) |
Transfer from accrued liabilities | | | — | | | | 561 | | | | — | | | | 561 | |
Non-cash charges | | | — | | | | — | | | | (302 | ) | | | (302 | ) |
| | | | | | | | | | | | | | | | |
Balance, December 31, 2005 | | | 213 | | | | 1,718 | | | | — | | | | 1,931 | |
2006 provision, net of reversals | | | 1,001 | | | | 20 | | | | — | | | | 1,021 | |
Cash payments | | | (213 | ) | | | (369 | ) | | | — | | | | (582 | ) |
| | | | | | | | | | | | | | | | |
Balance, December 31, 2006 | | | 1,001 | | | | 1,369 | | | | — | | | | 2,370 | |
2007 provision, net of reversals | | | 267 | | | | — | | | | — | | | | 267 | |
Cash payments | | | (610 | ) | | | (152 | ) | | | — | | | | (762 | ) |
Transfer from accrued liabilities | | | — | | | | 305 | | | | — | | | | 305 | |
| | | | | | | | | | | | | | | | |
Balance, December 31, 2007 | | $ | 658 | | | $ | 1,522 | | | $ | — | | | $ | 2,180 | |
| | | | | | | | | | | | | | | | |
In the first quarter of 2005, we recorded a restructuring and impairment provision of $0.4 million, in consideration of the final settlement of our outstanding liabilities relating to our Lexington, Massachusetts facility. This provision consisted of $0.1 million additional restructuring charges to terminate and buy-out the lease, and an impairment of $0.3 million in respect of certain equipment transferred as part of the settlement arrangement. That $0.4 million amount was in addition to the $1.3 million restructuring and impairment provision remaining from our initial provision for this matter of $2.0 million that we had recorded during the
F-24
third quarter of 2002. In the second quarter of 2005, we recorded a restructuring provision of $1.7 million relating to a reduction of excess office space in New York City, net of estimated sub-lease income and existing reserves. This lease was acquired through our acquisition of ACTV in 2003. At the time of acquisition, we recorded a reserve for the estimated fair value of this lease. As of the cease-use date, we had a remaining reserve of $0.5 million, which was reclassified to our restructuring reserve. In the third quarter of 2005, we recorded a restructuring provision of $0.4 million related to the plan to terminate seven employees in our United States and Switzerland operations.
During the fourth quarter of 2006, we reduced the workforce of our PlayMonteCarlo operations in the United Kingdom by two people, resulting in a restructuring provision of $0.1 million for severance. As of December 31, 2006, all related severance payments had been paid. We also recorded a restructuring provision of $0.9 million related to the plan to terminate three senior executives in our United States corporate headquarters.
During the fourth quarter of 2007, we reduced our workforce by eight people in our United States and United Kingdom operations, resulting in a restructuring provision of $0.3 million for severance. As of December 31, 2007, we had paid $0.1 million of the related severance.
The outstanding accrual for employee severance and benefits as of December 31, 2007 is expected to be paid and reduced to zero by the second quarter of 2008. The outstanding accrual for excess facilities relates to operating lease obligations which expire in 2016.
Note 13. Shareholders’ Equity
Authorized share capital
| | • | | 500,000,000 Class A ordinary shares |
| | • | | 200,000,000 Class B ordinary shares |
| | • | | 500,000,000 preference shares—none outstanding |
Voting
The holders of our Class A ordinary shares and Class B ordinary shares are generally entitled to vote as a single class on all matters upon which holders of ordinary shares have a right to vote, subject to the requirements of any applicable laws. Each Class A ordinary share entitles its holder to one vote, and each Class B ordinary share entitles its holder to ten votes. Unless otherwise required by law, and so long as their rights are not adversely affected, the holders of Class A ordinary shares and Class B ordinary shares are entitled to vote on any amendment to our Articles of Association and Memorandum of Association that relates solely to the terms of one or more outstanding series of preference shares.
Dividends and Other Distributions
Subject to the preferential and other dividend rights of any outstanding series of preference shares, the holders of our Class A ordinary shares and Class B ordinary shares are entitled to equal dividends per share when and if declared by our board of directors, except that all dividends payable in ordinary shares will be paid in the form of Class A ordinary shares to holders of Class A ordinary shares and in the form of Class B ordinary shares to holders of Class B ordinary shares. Neither Class A ordinary shares nor Class B ordinary shares may be split, divided or combined unless the other class is proportionally split, divided or combined. In the event we are liquidated, the holders of our Class A ordinary shares and Class B ordinary shares will be treated equally on a per share basis and will be entitled to receive all of our remaining assets following distribution of the preferential and/or other amounts to be distributed to the holders of our preference shares.
F-25
Merger
In the event of a merger, the holders of our Class A ordinary shares and Class B ordinary shares will be entitled to receive the same per share consideration, if any, except that if such consideration includes voting securities (or the right to acquire voting securities or securities exchangeable for or convertible into voting securities), we may (but are not required to) provide for the holders of Class B ordinary shares to receive voting securities (or rights to acquire voting securities) entitling them to ten times the number of votes per share as the voting securities (or rights to acquire voting securities) being received by holders of Class A ordinary shares.
Conversion of Class B Ordinary Shares
Each of our Class B ordinary shares is convertible, at the option of the holder thereof, into Class A ordinary shares on a one-for-one basis.
In the event of a transaction where Class A ordinary shares are converted into or exchanged for one or more other securities, cash or other property (a “Class A Conversion Event”), a holder of Class B ordinary shares thereafter will be entitled to receive, upon the conversion of such Class B ordinary shares, the amount of such securities, cash and other property that such holder would have received if the conversion of such Class B ordinary shares had occurred immediately prior to the record date or effective date, as the case may be, of the Class A Conversion Event.
In January 2007, General Instrument Corporation, one of our shareholders, exercised its right to convert its 121,596 Class B ordinary shares into the same number of Class A ordinary shares. In June 2007, Liberty exercised its right to convert its 303,996 Class B ordinary shares into the same number of Class A ordinary shares. As a result of these conversions, Kudelski is the sole holder of our outstanding Class B ordinary shares.
Exchangeable Share Arrangements
Pursuant to our 2000 Exchange Plan the minority shareholders of OpenTV, Inc. have the ability to exchange their shares of OpenTV, Inc. for shares of our company, generally on a one-for-one basis. As the minority shareholders are not responsible to fund the losses of OpenTV, Inc., we have recorded 100% of the loss in excess of the cost basis of the minority shareholders.
As the shares are exchanged, they are accounted for at fair value. Exchange rights granted under our 2000 Exchange Plan expire on the fifteenth anniversary of the date of grant.
Shares Reserved
As of December 31, 2007, the following Class A ordinary shares were reserved:
| | |
Issuable upon conversion of Class B Ordinary shares | | 30,206,154 |
Issuable upon exchange of shares (including 62,000 shares issuable upon exercise of outstanding options) of OpenTV, Inc. common stock under 2000 Exchange Plan | | 653,566 |
Stock options outstanding | | 5,796,675 |
Stock options reserved for future grant under 2005 Option Plan | | 2,661,496 |
Employee stock purchase plan | | 500,000 |
| | |
Total | | 39,817,891 |
| | |
Agreements with General Instrument and Motorola
In November 2000, we entered into a series of definitive agreements with General Instrument Corporation and Motorola, Inc., which later acquired General Instrument Corporation, dedicated to accelerating interactive television deployments worldwide. One of the agreements provided for the establishment of a co-owned venture
F-26
to provide integration and testing services for network operators. At December 31, 2007 and 2006, the carrying value of Motorola’s minority interest in the venture was $0.5 million and $0.5 million, respectively.
Treasury shares
In December 2007, we repurchased in open market transactions on The NASDAQ Global Market 1,200,000 Class A ordinary shares for approximately $1.3 million and held all such repurchased shares in treasury. On December 28, 2007, we cancelled our entire balance of 1,276,327 treasury shares.
Note 14. Share-based Compensation Plans
Employee Stock Purchase Plan
We have an Amended and Restated 1999 Employee Stock Purchase Plan, or ESPP. Our board of directors suspended the ESPP in 2003 and no options or purchase rights are currently outstanding under the ESPP. In the event our board of directors elects to commence offering periods under our ESPP in the future, the number of Class A ordinary shares issuable under the ESPP will, pursuant to the terms of the ESPP, be reset at 500,000 each successive December 31 through calendar year 2008, in each case for issuances during the following year.
Option Plans
Options are currently outstanding under the following plans: (i) the Amended and Restated OpenTV Corp. 1999 Share Option/Share Issuance Plan (1999 Plan); (ii) the Amended and Restated OpenTV, Inc. 1998 Option/Stock Issuance Plan (1998 Plan); (iii) the OpenTV Corp. 2001 Nonstatutory Stock Option Plan (2001 Plan); (iv) the OpenTV Corp. 2003 Incentive Plan (2003 Plan); (v) the OpenTV Corp. 2005 Incentive Plan (2005 Plan); (vi) option plans relating to outstanding options assumed in connection with the Spyglass merger (collectively, the “Assumed Spyglass Plan”); and (vii) option plans relating to outstanding options assumed in connection with the ACTV merger (collectively, the “Assumed ACTV Plan”).
As a result of our shareholders’ approval of the 2005 Plan on November 10, 2005, no further awards will be granted under the 1999 Plan, 2001 Plan or 2003 Plan. The 1999 Plan, 2001 Plan and 2003 Plan remain in existence for the sole purpose of governing outstanding options issued thereunder until such time as such options expire or have been exercised or cancelled. Options issued under the 1999 Plan, 2001 Plan and 2003 Plan that are forfeited or cancelled are no longer available for future issuance.
2005 Plan. We currently issue options and restricted share awards under the 2005 Plan. The compensation and nominating committee of our board of directors administers the 2005 Plan. The compensation and nominating committee has the discretion to determine grant recipients, the number and exercise price of stock options, and the number of stock appreciation rights, share awards or share units issued under the 2005 Plan. The options may be incentive stock options or non-statutory stock options. Options under the 2005 Plan are granted at an exercise price equal to the fair market value of the underlying shares on the date of grant and typically vest 25% after one year from the date of grant and 1/48th over each of the next 36 months. The term of the options generally is 10 years from the date of grant. Unexercised options generally expire ninety days after termination of employment and are then returned to the pool available for reissuance. A total of 7,955,896 Class A ordinary shares have been reserved for issuance under the 2005 Plan since its inception, and as of December 31, 2007, options to purchase 2,066,577 Class A ordinary shares were outstanding under the 2005 Plan, and 2,661,496 shares were available for future grant.
2003 Plan. Options that were issued under the 2003 Plan were generally granted at an exercise price equal to the fair market value of the underlying shares on the date of grant and, for grants made through the end of 2004, vested 25% after two years from the date of grant and 25% yearly thereafter for the following three years. In 2005, we revised the vesting schedule to be consistent with the schedule generally applicable under the 1999
F-27
and 2001 Plans. The term of the options generally was 10 years from the date of grant. Unexercised options generally expire ninety days after termination of employment with us. A total of 5,000,000 Class A ordinary shares were reserved for issuance under the 2003 Plan. As of December 31, 2007, options to purchase 1,537,794 Class A ordinary shares were outstanding under the 2003 Plan.
2001 Plan. Options that were issued under the 2001 Plan were generally granted at an exercise price equal to the fair market value of the underlying shares on the date of grant and vested 25% after one year from the date of grant and 1/48th over each of the next 36 months. The term of the options generally was 10 years from the date of grant. Unexercised options generally expire ninety days after termination of employment with us. A total of 500,000 Class A ordinary shares were reserved for issuance under the 2001 Plan, and as of December 31, 2007, options to purchase 141,734 Class A ordinary shares were outstanding under the 2001 Plan.
1999 Plan. Options that were issued under the 1999 Plan were generally granted at an exercise price equal to the fair market value of the underlying shares on the date of grant and vested 25% after one year from the date of grant and 1/48th over each of the next 36 months. The term of the options generally was 10 years from the date of grant. Unexercised options generally expire three months after termination of employment with us. A total of 8,980,000 Class A ordinary shares were reserved for issuance under the 1999 Plan, and as of December 31, 2007, options to purchase 1,921,910 Class A ordinary shares were outstanding under the 1999 Plan.
1998 Plan. Effective as of October 23, 1999, options to purchase 5,141,114 shares of Class A common stock of OpenTV, Inc. under the 1998 Plan were assigned to and assumed by us and these options thereafter represented the right to purchase under the 1999 Plan an identical number of our Class A ordinary shares. The remainder of the options then outstanding under the 1998 Plan were not assigned to and assumed by us. OpenTV, Inc. no longer issues options from the 1998 Plan. The 1998 Plan remains in existence for the sole purpose of governing those remaining outstanding options until such time as such options expire or have been exercised or cancelled and the underlying shares have become transferable by the holders. Options or shares awarded under the 1998 Plan that are forfeited or cancelled will no longer be available for issuance. As of December 31, 2007, options to purchase 62,000 shares of OpenTV, Inc.’s Class A common stock were outstanding under the 1998 Plan.
Assumed Plans. Options outstanding under the Assumed Spyglass Plan were converted as a result of the Spyglass acquisition into options to purchase our Class A ordinary shares. As of December 31, 2007, options to purchase 92,734 Class A ordinary shares were outstanding under the Assumed Spyglass Plan.
Options outstanding under the Assumed ACTV Plan were converted as a result of the ACTV acquisition into options to purchase our Class A ordinary shares. As of December 31, 2007, options to purchase 35,926 Class A ordinary shares were outstanding under the Assumed ACTV Plan.
Options outstanding under the Assumed Spyglass Plan and Assumed ACTV Plan that are forfeited or cancelled will no longer be available for reissuance. No new options will be granted under either the Assumed Spyglass Plan or the Assumed ACTV Plan.
Restricted Shares Issued to Employees
In December 2007, we issued 1,211,250 restricted Class A ordinary shares under our 2005 Plan to employees (2007 Restricted Shares), in lieu of an annual stock option grant. 2007 Restricted Shares are restricted from sale or transfer for a period of time that is equivalent to the normal vesting schedule applied to stock options granted under the 2005 Plan.
Restricted Shares Issued to Former Chief Executive Officer (CEO)
In March 2007, we entered into an employment agreement with Alan A. Guggenheim, our former Chief Executive Officer. Pursuant to that agreement, we issued Mr. Guggenheim 60,000 restricted Class A ordinary shares under our 2005 Plan on the date of the employment agreement. In August 2007, Mr. Guggenheim stepped
F-28
down as Chief Executive Officer. The restricted shares issued to Mr. Guggenheim were fully vested upon issuance but are restricted from sale or transfer for a specified period of time.
2007 Management Bonus and Equity Issuance Plan
In August 2007, our board of directors approved the adoption of the 2007 Management Bonus and Equity Issuance Plan (2007 Plan). The 2007 Plan provides that:
| | • | | 2007 bonus awards for certain senior management of OpenTV, other than the Chief Executive Officer, shall be based upon achievement of our profitability targets; |
| | • | | the profitability targets are based upon our cumulative net income measured over any four consecutive fiscal quarters during the period commencing April 1, 2007 and ending December 31, 2009 (Cumulative Net Income), where Cumulative Net Income is based on net income as publicly reported in our consolidated financial statements, subject to certain exclusions; |
| | • | | subject to achievement of the profitability targets, bonus awards will be comprised of a combination of a cash amount and a grant of restricted Class A ordinary shares (2007 Management Restricted Shares) issued pursuant to the 2005 Plan; and |
| | • | | the 2007 Management Restricted Shares will vest, and the cash will become payable, in each case on a pro rata basis, based on the following schedule: |
| | • | | 62.5% upon OpenTV achieving Cumulative Net Income equal to or greater than zero, |
| | • | | 12.5% upon OpenTV achieving Cumulative Net Income equal to $4,000,000, and |
| | • | | 25% upon OpenTV achieving Cumulative Net Income equal to $6,000,000. |
As defined by SFAS 123(R), the 2007 Plan allows for both performance and service elements. Accordingly, once vesting is considered probable, we recognize expense on a straight-line basis over the remaining requisite service period. Final compensation cost is recognized only for awards that ultimately vest. The 2007 Plan payout is a combination of restricted shares and cash. As of December 31, 2007, we have issued 1,020,232 restricted Class A ordinary shares under the 2005 Plan and have accrued approximately $1.1 million of expense related to probable achievement of performance targets.
As of December 31, 2007, none of the profitability targets applicable to shares issued under the 2007 Plan had been achieved and thus, restrictions remained in effect as to all such shares.
Impact of the Adoption of SFAS 123(R)
We adopted SFAS 123(R) using the modified prospective transition method beginning January 1, 2006. Accordingly, during the year ended December 31, 2006, we recorded share-based compensation expense for awards granted prior to, but not yet vested, as of January 1, 2006, as if the fair value method required for pro forma disclosure under SFAS 148 were in effect for expense recognition purposes. For these awards, we have continued to recognize compensation expense using the accelerated amortization method under the provisions of FIN No. 28, “Accounting for Stock Appreciation Rights and Other Variable Stock Option or Award Plans (an Interpretation of APB Opinions No. 15 and 25).” For share-based compensation granted after January 1, 2006, we have recognized compensation expense based on the estimated grant date fair value method using the Black-Scholes valuation model. For these awards, we have recognized compensation expense using a straight-line amortization method. As SFAS 123(R) requires that share-based compensation expense be based on awards that are ultimately expected to vest, share-based compensation for the years ended December 31, 2007 and 2006 has been reduced for estimated forfeitures. When estimating forfeitures, we consider voluntary termination behavior as well as trends of actual option forfeitures.
F-29
The impact on our results of operations of recording share-based compensation was as follows (in thousands):
| | | | | | |
| | | Year Ended
December 31, |
| | | 2007 | | 2006 |
Cost of revenues—services and other | | $ | 517 | | $ | 493 |
Research and development | | | 724 | | | 661 |
Sales and marketing | | | 413 | | | 531 |
General and administrative | | | 1,613 | | | 1,589 |
| | | | | | |
| | $ | 3,267 | | $ | 3,274 |
| | | | | | |
Cash received from option exercises under all share-based compensation plans was approximately $0.3 million and $2.5 million for the year ended December 31, 2007 and 2006, respectively. For the year ended December 31, 2007, we recognized a tax benefit of $0.1 million in the statement of operations related to share-based compensation cost. No income tax benefit was recognized in the statement of operations for share-based compensation costs for the year ended December 31, 2006. No share-based compensation costs were capitalized for the year ended December 31, 2007 and 2006. On June 27, 2007, we repurchased 1,150,000 stock options for $0.2 million from James A. Chiddix, our former Chief Executive Officer, in connection with his resignation as Chief Executive Officer.
Valuation Assumptions
We calculated the fair value of each stock option award on the date of grant using the Black-Scholes valuation model. The following assumptions were used for each respective period:
| | | | | | |
| | | Year Ended December 31, |
| | | 2007 | | 2006 | | 2005 |
Risk-free interest rates | | 3.60% - 5.10% | | 4.28% - 5.22% | | 3.71% - 4.57% |
Average expected lives (months) | | 63 | | 64 | | 75 |
Dividend yield | | — | | — | | — |
Expected volatility | | 64% - 74% | | 78% - 85% | | 99% - 105% |
Our computation of expected volatility for the years ended December 31, 2007, 2006 and 2005 was based on historical volatility of our stock price. Our computation of expected life for the years ended December 31, 2007, 2006 and 2005 was determined based on historical experience of similar awards, giving consideration to the contractual terms of the share-based awards, vesting schedules and expectations of future employee behavior. The interest rate for periods within the contractual life of the award is based on the similar United States Treasury yield curve in effect at the time of grant. While we believe that these assumptions are reasonable, actual experience may differ materially from these assumptions.
We calculated the fair value of restricted shares based on the closing price of our Class A ordinary shares on the date of grant.
F-30
Option Award Activity
The following table summarizes stock option activity under our equity incentive plans:
| | | | | | | | | |
| | | Number of
Options
Outstanding | | | Exercise Price | | Weighted
Average
Exercise Price |
Balance, December 31, 2004 | | 8,477,387 | | | | | | $ | 6.41 |
Options granted | | 3,266,000 | | | $ | 2.09 - $ 3.73 | | $ | 2.76 |
Options exercised | | (145,764 | ) | | $ | 0.33 - $ 2.73 | | $ | 1.25 |
Options forfeited | | (819,627 | ) | | $ | 1.63 - $ 13.87 | | $ | 2.80 |
Options expired | | (452,286 | ) | | $ | 1.05 - $ 86.31 | | $ | 10.81 |
| | | | | | | | | |
Balance, December 31, 2005 | | 10,325,710 | | | | | | $ | 5.42 |
| | | |
Options granted | | 2,239,150 | | | $ | 2.27 - $ 4.00 | | $ | 2.94 |
Options exercised | | (1,214,519 | ) | | $ | 0.33 - $ 2.99 | | $ | 2.01 |
Options forfeited | | (787,081 | ) | | $ | 1.63 - $ 3.94 | | $ | 2.66 |
Options expired | | (882,875 | ) | | $ | 1.63 - $ 94.56 | | $ | 10.37 |
| | | | | | | | | |
Balance, December 31, 2006 | | 9,680,385 | | | | | | $ | 5.04 |
| | | |
Options granted | | 557,500 | | | $ | 1.03 - $ 2.72 | | $ | 2.02 |
Options exercised | | (275,906 | ) | | $ | 0.33 - $ 2.29 | | $ | 1.10 |
Options forfeited | | (1,494,220 | ) | | $ | 1.51 - $ 5.04 | | $ | 3.00 |
Options expired | | (2,609,084 | ) | | $ | 1.51 - $ 54.25 | | $ | 6.31 |
| | | | | | | | | |
Balance, December 31, 2007 | | 5,858,675 | | | | | | $ | 4.89 |
| | | | | | | | | |
The following table summarizes information with respect to options outstanding at December 31, 2007:
| | | | | | | | | | | | |
Exercise Price | | Options Outstanding | | Options Currently Exercisable |
| | Number
Outstanding | | Weighted Average
Remaining
Contractual Life | | Weighted Average
Exercise Price | | Number
Exercisable | | Weighted Average
Exercise Price |
$ 0.33 - $ 2.11 | | 624,202 | | 4.54 | | $ | 1.34 | | 387,498 | | $ | 1.26 |
$ 2.12 - $ 2.69 | | 569,940 | | 8.35 | | $ | 2.37 | | 142,489 | | $ | 2.39 |
$ 2.70 - $ 2.70 | | 1,178,598 | | 6.52 | | $ | 2.70 | | 876,815 | | $ | 2.70 |
$ 2.72 - $ 2.82 | | 302,537 | | 7.49 | | $ | 2.78 | | 177,342 | | $ | 2.78 |
$ 2.84 - $ 2.84 | | 1,335,530 | | 7.71 | | $ | 2.84 | | 679,468 | | $ | 2.84 |
$ 2.85 - $ 3.05 | | 619,241 | | 6.68 | | $ | 2.98 | | 304,495 | | $ | 2.99 |
$ 3.06 - $ 6.00 | | 619,119 | | 5.97 | | $ | 4.39 | | 431,830 | | $ | 4.75 |
$ 6.04 - $ 54.25 | | 599,508 | | 2.71 | | $ | 22.14 | | 599,508 | | $ | 22.14 |
$ 81.00 - $ 82.06 | | 9,000 | | 2.09 | | $ | 81.35 | | 9,000 | | $ | 81.35 |
$ 88.00 - $ 88.00 | | 1,000 | | 1.92 | | $ | 88.00 | | 1,000 | | $ | 88.00 |
| | | | | | | | | | | | |
| | 5,858,675 | | 6.37 | | $ | 4.89 | | 3,609,445 | | $ | 6.28 |
| | | | | | | | | | | | |
Intrinsic Value
The aggregate intrinsic value of an option is calculated as the excess, if any, of the closing price of our Class A ordinary shares over the exercise price of the option. Aggregate intrinsic value is not equivalent to the value determined by the Black Scholes valuation model.
Options Exercised. The aggregate intrinsic value of options exercised under our stock option plans, determined as of the date of option exercise, was $0.3 million, $0.9 million and $0.2 million for the years ended December 31, 2007, 2006 and 2005, respectively.
F-31
Vested and Unvested Options. The aggregate intrinsic value of all vested and unvested options outstanding as of December 31, 2007 was approximately $0.1 million, based on the closing price of our Class A ordinary shares on December 31, 2007, which was $1.32 per share.
Exercisable Options. The aggregate intrinsic value of options currently exercisable as of December 31, 2007 was approximately $0.1 million, based on the closing price of our Class A ordinary shares on December 31, 2007, which was $1.32 per share. The weighted average remaining contractual life of currently exercisable options, calculated at December 31, 2007, was 5.40 years.
Vested and Expected-to-Vest Options. The number of options vested and expected-to-vest as of December 31, 2007 was 4,984,299, the weighted-average exercise price of which was $5.29. The aggregate intrinsic value of options vested and expected-to-vest as of December 31, 2007 was $0.1 million, based on the closing price of our Class A ordinary shares on December 31, 2007, which was $1.32 per share. The weighted average remaining contractual life of options vested and expected-to-vest as of December 31, 2007 was 6.08 years.
Weighted Average Grant-date Fair Value. The weighted average grant-date fair value of options granted was $1.28, $2.06 and $2.27 per share for grants in the years ended December 31, 2007, 2006 and 2005, respectively.
Restricted Shares Activity
The following table summarizes activity relating to restricted shares issued to our employees and to our former Chief Executive Officer:
| | | | | | |
| | | Number of
Shares | | | Weighted Average
Grant Date
Fair Value |
Former CEO restricted shares granted | | 60,000 | | | $ | 2.65 |
Former CEO restricted shares vested | | (60,000 | ) | | $ | 2.65 |
Unvested 2007 Management Restricted Shares | | 1,020,232 | | | $ | 1.43 |
Unvested 2007 Restricted Shares | | 1,211,250 | | | $ | 1.04 |
| | | | | | |
Unvested shares balance, December 31, 2007 | | 2,231,482 | | | $ | 1.22 |
| | | | | | |
Unrecognized Compensation Expense
As of December 31, 2007, there was approximately $2.5 million of unrecognized compensation cost, net of estimated forfeitures, related to unvested share-based compensation arrangements granted under our option plans and 2007 Restricted Shares. That cost is expected to be recognized over a weighted-average period of 1.98 years.
As of December 31, 2007, there was approximately $1.1 million of unrecognized compensation cost related to unvested 2007 Management Restricted Shares issued under the 2007 Plan that is expected to be recognized over a weighted-average period of 1.02 years.
Pro forma Information for Periods Prior to the Adoption of SFAS 123(R)
Prior to the adoption of SFAS 123(R), we accounted for share-based employee compensation arrangements in accordance with the provisions of APB 25 and complied with the disclosure provisions of SFAS 148. Under APB 25, employee share-based compensation expense recognized under SFAS 148 was not reflected in our results of operations for the year ended December 31, 2005 for employee stock option awards as all options were granted with an exercise price equal to the market value of the underlying common stock on the date of grant. Previously reported amounts have not been restated upon adoption of SFAS 123(R).
F-32
Had compensation cost for option plans been determined based on the fair value at the grant dates for the awards under a method prescribed by SFAS 148, our net loss for the year ended December 31, 2005 would have been increased to the pro forma amounts indicated below (in thousands, except per share amounts):
| | | | |
| | | Year Ended
December 31, 2005 | |
Net loss from continuing operations, as reported | | $ | (6,869 | ) |
Add: Share-based employee compensation expense included in reported net loss, | | | | |
net of related tax effects | | | 8 | |
Deduct: Share-based employee compensation expense determined under | | | | |
fair value-based method for all awards, net of related tax effects | | | (4,668 | ) |
| | | | |
Pro-forma net loss | | $ | (11,529 | ) |
| | | | |
Net loss per share, basic and diluted: | | | | |
As reported | | $ | (0.06 | ) |
| | | | |
Pro-forma | | $ | (0.09 | ) |
| | | | |
Note 15. Income Taxes
The components of profit (loss) before income taxes were as follows (in thousands):
| | | | | | | | | | | | |
| | | Year Ended December 31, | |
| | | 2007 | | | 2006 | | | 2005 | |
United States | | $ | (3,760 | ) | | $ | (16,909 | ) | | $ | (8,387 | ) |
International | | | 4,702 | | | | 10,148 | | | | 2,673 | |
| | | | | | | | | | | | |
| | $ | 942 | | | $ | (6,761 | ) | | $ | (5,714 | ) |
| | | | | | | | | | | | |
Income tax expense (benefit) was comprised of the following (in thousands):
| | | | | | | | | | | |
| | | Year Ended December 31, | |
| | | 2007 | | | 2006 | | 2005 | |
Current | | | | | | | | | | | |
United States | | $ | — | | | $ | — | | $ | — | |
International | | | 1,197 | | | | 2,712 | | | 1,378 | |
State | | | 352 | | | | 159 | | | 75 | |
| | | | | | | | | | | |
| | | 1,549 | | | | 2,871 | | | 1,453 | |
Deferred | | | | | | | | | | | |
United States | | | — | | | | — | | | — | |
International | | | (301 | ) | | | 25 | | | (298 | ) |
| | | | | | | | | | | |
| | | (301 | ) | | | 25 | | | (298 | ) |
| | | | | | | | | | | |
Income tax expense | | $ | 1,248 | | | $ | 2,896 | | $ | 1,155 | |
| | | | | | | | | | | |
We have not recognized a deferred tax liability related to foreign subsidiary earnings that we intend to permanently reinvest in the respective foreign jurisdiction.
The tax expense for the year ended December 31, 2007 was primarily attributable to taxes in foreign jurisdictions and various states. In addition, we decreased our reserves for potential foreign tax exposures as these have expired.
F-33
Income tax expense (benefit) differs from the amount computed by applying the United States federal statutory income tax rate to our profit (loss) before income taxes as follows (in thousands):
| | | | | | | | | | | | |
| | | Year Ended December 31, | |
| | | 2007 | | | 2006 | | | 2005 | |
Income tax benefit at the federal statutory rate of 35% | | $ | (1,426 | ) | | $ | (2,950 | ) | | $ | (2,589 | ) |
Change in valuation allowance | | | 301 | | | | 9,082 | | | | 6,863 | |
Foreign tax rate differential | | | 934 | | | | (4,220 | ) | | | (3,385 | ) |
Adjustment related to prior year taxes | | | — | | | | — | | | | 191 | |
Share-based compensation | | | 654 | | | | 904 | | | | — | |
Other | | | 785 | | | | 80 | | | | 75 | |
| | | | | | | | | | | | |
| | $ | 1,248 | | | $ | 2,896 | | | $ | 1,155 | |
| | | | | | | | | | | | |
The components of the net deferred tax assets and liabilities were as follows (in thousands):
| | | | | | | | |
| | | Year Ended December 31, | |
| | | 2007 | | | 2006 | |
Current deferred tax assets (liabilities), net | | | | | | | | |
Deferred revenue | | $ | 8,862 | | | $ | 9,979 | |
Accrued liabilities and reserves | | | 4,480 | | | | 3,668 | |
Other foreign | | | 475 | | | | 189 | |
Foreign net operating loss | | | 100 | | | | 85 | |
Valuation allowance | | | (13,342 | ) | | | (13,647 | ) |
| | | | | | | | |
| | | 575 | | | | 274 | |
Long-term deferred tax assets (liabilities), net | | | | | | | | |
Fixed assets and intangibles basis differences | | | 5,017 | | | | 4,031 | |
Net operating loss carryforwards | | | 75,059 | | | | 136,104 | |
Credits | | | 3,534 | | | | 5,975 | |
Other | | | 1,652 | | | | 2,062 | |
Valuation allowance | | | (85,262 | ) | | | (148,172 | ) |
| | | | | | | | |
| | | — | | | | — | |
| | | | | | | | |
Net deferred tax asset | | $ | 575 | | | $ | 274 | |
| | | | | | | | |
We provided a partial valuation allowance on deferred tax assets in excess of deferred tax liabilities. Because of our limited operating history and cumulative losses, management believes it is more likely than not that the remaining deferred tax asset will not be realized. For selected foreign deferred tax assets, management believes it is more likely than not that the deferred tax asset will be realized, and accordingly no valuation allowance was provided against these amounts in 2007 and 2006.
At December 31, 2007, we had approximately $608 million, $121 million and $2 million, respectively, of federal, state and foreign net operating losses. A significant portion of these carryforwards are subject to limitations as a result of changes of ownership, as defined by federal and state law. Our net operating loss carryforwards were significantly limited as a result of the acquisition of the majority of our voting rights by Kudelski in January 2007. After applying these known limitations, the net operating losses are approximately $191 million, $109 million and $2 million, respectively, for federal, state and foreign net operating losses. After the known limitations, the remaining net operating loss included in the deferred tax asset balance at December 31, 2007 may be subject to additional elimination by further ownership changes as defined by federal and state law. These carryforwards expire between 2009 and 2027 for federal tax purposes and 2008 and 2017 for state tax purposes, if not utilized.
F-34
Uncertain Tax Positions
Effective January 1, 2007, we adopted FIN 48, which includes a two-step approach to recognizing, de-recognizing and measuring uncertain tax positions accounted for in accordance with SFAS 109. As a result of the implementation of FIN 48, we recognized an increase of approximately $2.6 million in the liability for unrecognized tax benefits and a decrease in the related reserve of the same amount. In addition, no material adjustment to the January 1, 2007 balance of retained earnings was required. As of December 31, 2007, unrecognized tax benefits approximated $2.3 million, $2.0 million of which would affect the effective tax rate if recognized.
We adopted a policy to classify accrued interest as part of the accrued FIN 48 liability in the provision for income taxes.
The following table summarizes the activity related to our gross unrecognized tax benefits for the year ended December 31, 2007 (in thousands):
| | | | |
| | | 2007 | |
Balance, January 1, 2007 | | $ | 2,632 | |
Additions for positions of prior years | | | 430 | |
Reductions for tax positions of prior years | | | — | |
Reductions related to statutes of limitations | | | (581 | ) |
Additions based on tax positions related to the current year | | | 154 | |
Decreases—settlements | | | (353 | ) |
| | | | |
Balance, December 31, 2007 | | $ | 2,282 | |
| | | | |
Included in the balance at December 31, 2007 was $2.0 million for tax positions which would affect our effective tax rate if recognized. The remaining balance will affect currency translation adjustment.
As of December 31, 2007, we had accrued approximately $0.3 million for payment of interest related to uncertain tax matters. We have not accrued any penalties related to our uncertain tax positions as we believe that it is more likely than not that there will not be any assessment of penalties.
As of December 31, 2007, we expect a net decrease of approximately $0.9 million to unrecognized tax positions within the next twelve months as a result of the expiry of the applicable statute of limitations for withholding tax exposures in foreign jurisdictions currently reserved.
We file income tax returns in the U.S. federal jurisdiction and in various states and foreign jurisdictions. Each country has its own statute of limitations for making assessment of additional tax liabilities. We are currently open to audit under the statute of limitations by the Internal Revenue Service and the appropriate state income tax authorities for all years since inception due to the net loss carryovers from those years. We are not currently under federal, state or foreign income tax examination.
Note 16. Commitments and Contingencies
Operating Leases
We lease our facilities from third parties under operating lease agreements or sublease agreements in the United States, Europe and Asia Pacific. These leases expire between January 2008 and May 2012. Total rent expense was $4.3 million, $4.2 million, and $3.9 million for the years ended December 31, 2007, 2006 and 2005, respectively.
F-35
Future minimum payments under non-cancelable operating leases as of December 31, 2007 were as follows (in thousands):
| | | |
Year ending December 31, | | Minimum
Commitments |
2008 | | $ | 4,676 |
2009 | | | 3,865 |
2010 | | | 978 |
2011 | | | 537 |
2012 | | | 162 |
Thereafter | | | — |
| | | |
| | $ | 10,218 |
| | | |
We have the right to terminate, without penalty, one of our operating leases prior to its scheduled expiration. If we exercised this early termination right in 2009, our future minimum lease commitments would be reduced by an aggregate of $0.6 million over the current remaining life of that lease. We have not yet made any determination as to whether we intend to exercise such right. If we did exercise such right, while our commitments under this specific lease would be reduced, we might also be required to lease additional space to conduct our business and we cannot be certain, at this time, whether any such actions would possibly result in a net increase in our future minimum lease commitments.
Other Commitments
In the ordinary course of business we enter into various arrangements with vendors and other business partners for bandwidth, marketing, and other services. Future minimum commitments under these arrangements as of December 31, 2007 were $0.5 million for the year ending December 31, 2008. In addition, we also have arrangements with certain parties that provide for revenue sharing payments.
As of December 31, 2007, we had three standby letters of credit aggregating approximately $1.2 million, two of which were issued to landlords of our leased properties, and one of which was issued to a sublessee at our New York facility, which we had vacated in the second quarter of 2005. We pledged two certificates of deposit aggregating approximately $1.4 million, of which $0.3 million was included under short-term marketable debt securities, and $1.1 million was included under long-term marketable debt securities, as collateral in respect of these standby letters of credit.
As of December 31, 2006, we had three standby letters of credit aggregating approximately $1.2 million, for the same purpose as stated above. We pledged approximately $0.5 million of restricted cash, which was included under other assets and one certificate of deposit of $1.0 million, which was included under long-term marketable debt securities, as collateral in respect of these standby letters of credit.
Contingencies
Claims by Former Chief Executive Officer. In November 2007, we received a demand from attorneys for Alan A. Guggenheim, our former Chief Executive Officer, claiming that the company was withholding severance and certain other benefits due him under his employment agreement following termination of his employment in August 2007. We responded that we intended to provide Mr. Guggenheim with all pay and benefits due him under the employment agreement. Thereafter, in December 2007, we were notified by the Occupational Safety and Health Administration (OSHA) of the United States Department of Labor that we had been named in an administrative complaint filed by Mr. Guggenheim alleging violations of Section 806 of the Sarbanes-Oxley Act of 2002, 18 U.S.C. § 1514A. In the complaint, Mr. Guggenheim claims that the company terminated him for reporting conduct that he alleged to be illegal or unethical and seeks money damages, fees and costs, reinstatement and any other available relief. We filed a written statement of position with OSHA denying all of
F-36
Mr. Guggenheim’s allegations. OSHA has not yet determined whether it will conduct an investigation into this matter, and no substantive administrative proceedings have occurred to date. We intend to defend ourselves vigorously in any administrative proceedings and in any subsequent legal proceedings that may be filed by Mr. Guggenheim. We have established a reserve for the severance and other benefits we believe are due to Mr. Guggenheim under the terms of his employment agreement. That reserve is an estimate only and actual costs may be materially different.
Initial Public Offering Securities Litigation. In July 2001, the first of a series of putative securities class actions was filed in the United States District Court for the Southern District of New York against certain investment banks which acted as underwriters for our initial public offering, us and various of our officers and directors. In November 2001, a similar securities class action was filed in the United States District Court for the Southern District of New York against Wink Communications and two of its officers and directors and certain investment banks which acted as underwriters for Wink Communications’ initial public offering. We acquired Wink Communications in October 2002. The complaints allege undisclosed and improper practices concerning the allocation of initial public offering shares, in violation of the federal securities laws, and seek unspecified damages on behalf of persons who purchased OpenTV Class A ordinary shares during the period from November 23, 1999 through December 6, 2000 and Wink Communications’ common stock during the period from August 19, 1999 through December 6, 2000. Other actions have been filed making similar allegations regarding the initial public offerings of more than 300 other companies. All of these lawsuits have been coordinated for pretrial purposes as In re Initial Public Offering Securities Litigation , 21 MC 92 (SAS). Defendants in these cases filed an omnibus motion to dismiss on common pleading issues. All claims against our and Wink Communications’ officers and directors have been dismissed without prejudice in this litigation pursuant to the parties’ stipulation approved by the Court on October 9, 2002. On February 19, 2003, the Court denied in part and granted in part the omnibus motion to dismiss filed on behalf of defendants, including us and Wink Communications. The Court’s order dismissed all claims against us and Wink Communications except for a claim brought under Section 11 of the Securities Act of 1933.
In June 2004, a stipulation of settlement and release of claims against the issuer defendants, including us and Wink Communications, was submitted to the court for approval. On August 31, 2005, the court preliminarily approved the settlement. In December 2006, the appellate court overturned the certification of classes in the six test cases that were selected by the underwriter defendants and plaintiffs in the coordinated proceedings. Neither OpenTV nor Wink Communications is one of the test cases.
Because class certification was a condition of the settlement, it was unlikely that the settlement would receive final Court approval. On June 25, 2007, the Court entered an order terminating the proposed settlement based upon a stipulation among the parties to the settlement. Plaintiffs have filed amended master allegations and amended complaints in the six focus cases, which the defendants in those cases have moved to dismiss. Plaintiffs have also moved for class certification in the six test cases, which the defendants in those cases have opposed. It is uncertain whether there will be any revised or future settlement.
If a settlement does not occur, we believe that we have meritorious defenses to the claims asserted against us and will defend ourselves vigorously. No provision has been made in our consolidated financial statements for this matter. We are unable to predict the likelihood of an unfavorable outcome or estimate our potential liability, if any.
Broadcast Innovation Matter. On November 30, 2001, a suit was filed in the United States District Court for the District of Colorado by Broadcast Innovation, L.L.C., or BI, alleging that DIRECTV, Inc., EchoStar Communications Corporation, Hughes Electronics Corporation, Thomson Multimedia, Inc., Dotcast, Inc. and Pegasus Satellite Television, Inc. are infringing certain claims of United States patent no. 6,076,094, assigned to or licensed by BI. DIRECTV and certain other defendants settled with BI on July 17, 2003. We are unaware of the specific terms of that settlement. Though we are not currently a defendant in the suit, BI may allege that certain of our products, possibly in combination with the products provided by some of the defendants, infringe
F-37
BI’s patent. The agreement between OpenTV, Inc. and EchoStar includes indemnification obligations that may be triggered by the litigation. If liability is found against EchoStar in this matter, and if such a decision implicates our technology or products, EchoStar has notified OpenTV, Inc. of its expectation of indemnification, in which case our business performance, financial position, results of operations or cash flows may be adversely affected. Likewise, if OpenTV, Inc. were to be named as a defendant and it is determined that the products of OpenTV, Inc. infringe any of the asserted claims, and/or it is determined that OpenTV, Inc. is obligated to defend EchoStar in this matter, our business performance, financial position, results of operations or cash flows may be adversely affected. On November 7, 2003, BI filed suit against Charter Communications, Inc. and Comcast Corporation in United States District Court for the District of Colorado, alleging that Charter and Comcast also infringe the ‘094 patent. The agreements between Wink Communications and Charter Communications include indemnification obligations of Wink Communications that may be triggered by the litigation. While reserving all of our rights in respect of this matter, we have conditionally reimbursed Charter for certain reasonable legal expenses that it incurred in connection with this litigation. On August 4, 2004, the District Court found the ‘094 patent invalid. After various procedural matters, including interim appeals, in November 2005, the United States Court of Appeals for the Federal Circuit remanded the case back to the District Court for disposition. On March 8, 2006, the defendants filed a writ of certiorari in this matter with the Supreme Court of the United States to review the decision of the United States Court of Appeals for the Federal Circuit, which had overturned the District Court’s order for summary judgment in favor of the defendants. That writ of certiorari was denied. Charter filed a request with the United States Patent and Trademark Office on June 8, 2006 to re-examine the patent based on prior art references. On July 11, 2006, the District Court ordered a stay of the proceedings pending notice as to whether the re-examination request is accepted by the United States Patent and Trademark Office. On June 21, 2006, Charter filed a motion to stay the litigation pending completion of the Patent Office’s reexamination of the ‘094 patent. On July 11, 2006, the Court granted Charter’s motion and entered an order staying the case. On August 5, 2006, the United States Patent and Trademark Office ordered a re-examination of all of the patent’s claims. The case remains stayed. Based on the information available to us, we have established a reserve for costs and fees that may be incurred in connection with this matter. That reserve is an estimate only and actual costs may be materially different.
The estimate of the potential impact on our financial position or overall results of operations for any of the legal proceedings described in this section could change in the future.
Indemnification
In the normal course of our business, we provide indemnification to customers, subject to limitations, against claims of intellectual property infringement made by third parties arising from the use of our products. Historically, costs related to these indemnification provisions have not been significant. We are not, however, able to estimate the maximum potential impact of these indemnification provisions on our future results of operations since the liabilities associated with those types of claims are dependent on various factors that are not known until an action is commenced.
As permitted under the laws of the British Virgin Islands, we have agreed to indemnify our officers and directors for certain events or occurrences while the officer or director is, or was, serving at our request in such capacity. The maximum potential amount of future payments we could be required to make under these indemnification agreements is unlimited; however, we have director and officer insurance coverage that limits our exposure and enables us to recover a portion of any future amounts paid. We believe the estimated fair value of these indemnification agreements in excess of applicable insurance coverage is not material.
Note 17. Related Party Transactions
On January 16, 2007, Kudelski completed a stock purchase transaction with Liberty, pursuant to which Kudelski acquired substantially all of our Class A and Class B ordinary shares owned by Liberty. As of December 31, 2007, Kudelski’s total ownership represented approximately 31.4% of the economic interest and
F-38
approximately 76.7% of the voting power of our ordinary shares on an undiluted basis. We were not a direct party to that transaction. We received $5.4 million in cash from Liberty on the closing date of the Kudelski transaction, and in February 2008, we received an additional $14.3 million in cash from Liberty. The aggregate amount of $19.7 million received from Liberty represents the total capital contribution due to us pursuant to an agreement we previously entered into with Liberty in February 2006, which provided for us to receive a portion of any premium received by Liberty in any sale of its stake in OpenTV. During the year ended December 31, 2007, we received approximately $0.4 million in interest income related to the unpaid capital contribution.
Prior to March 2008, we participated in the Liberty benefits program for employees in the United States at a cost of $0.4 million, $2.8 million, and $2.0 million for the years ended December 31, 2007, 2006 and 2005, respectively. We believe that this participation provided us with better economic terms than we would have otherwise been able to achieve independent of Liberty.
During the year ended December 31, 2007, we recognized a nominal amount of royalties and licenses and services and other revenues from Nagra France SAS, a subsidiary of Kudelski. For the year ended December 31, 2006, we recognized $0.6 million revenues from Nagravision S.A., a subsidiary of Kudelski, in connection with integration and development work performed for a third party network operator.
The table below reflects transactions involving the following current and former related parties during the periods indicated (in thousands). Besides Kudelski’s ownership of our company mentioned above, Sun Microsystems, referred to in the table below, held approximately 5.4% of the economic interest and approximately 1.8% of the voting power of our ordinary shares on an undiluted basis as of December 31, 2007.
| | | | | | | | | | | | | | |
Related Party | | Nature of Transaction | | Year Ended December 31, | |
| | | 2007 | | | 2006 | | | 2005 | |
Shareholders: | | | | | | | | | | | | | | |
| Kudelski and affliates | | Revenues | | $ | 11 | | | $ | 567 | | | $ | — | |
| Liberty Media | | Employee benefits | | $ | (366 | ) | | $ | (2,795 | ) | | $ | (2,039 | ) |
| Liberty Media affiliates | | Revenues | | $ | — | | | $ | 22 | | | $ | 10 | |
| Sun Microsystems | | Software technology license and equipment costs | | $ | — | | | $ | — | | | $ | 480 | |
Note 18. Segment Information
In August 2007, Ben Bennett was appointed Chief Operating Officer and Acting Chief Executive Officer and was subsequently appointed as Chief Executive Officer in March 2008. Accordingly, Mr. Bennett is our chief operating decision maker, or CODM. As part of the management change in August 2007, we reorganized our reporting units to provide management with better information for allocating the company’s resources and assessing performance in accordance with the new management team’s strategic focus. Our CODM currently assesses our results and financial performance and reviews our internal budgeting reports on the basis of two segments: middleware solutions and advertising solutions. We have prepared this segment analysis in accordance with SFAS 131“Disclosure about Segments of an Enterprise and Related Information,” and accordingly, we have restated the segment information for all earlier periods presented in our consolidated financial statements.
Middleware solutions is composed of set-top box middleware and embedded browser technologies, such as OpenTV Spyglass, as well as software components that are deployed at the network operator’s headend.
Advertising solutions has included our OpenTV Eclipse and Advision products, our PlayJam business, our NASCAR service and related technologies, our PlayMonteCarlo betting and gaming channel, and our OpenTV Participate product. Beginning in 2007, we no longer operate our NASCAR service or the PlayMonteCarlo betting and gaming channel. In September 2007, we signed a letter of intent to sell Static, which operated our
F-39
PlayJam games business, and closed the transaction on December 31, 2007. In accordance with SFAS 144, the financial results of our PlayJam games business have been reclassified as a discontinued operation in our consolidated financial statements for all periods presented.
Our management reviews and assesses the “contribution margin” of each of these segments, which is not a financial measure calculated in accordance with GAAP. We define contribution margin for these purposes as segment revenues less related, direct or indirect, allocable costs, including personnel and personnel-related support costs, communications, facilities, maintenance and support, consulting and subcontractor costs, travel, marketing and network infrastructure and bandwidth costs. There are significant judgments management makes with respect to the direct and indirect allocation of costs that may affect the calculation of contribution margins. While management believes these and other related judgments are reasonable and appropriate, others could assess such matters in ways different than our company’s management.
Contribution margin is a non-GAAP financial measure which excludes unallocated corporate support, interest, taxes, depreciation and amortization, amortization of intangible assets, share-based compensation, impairment of goodwill, impairment of intangibles, other income, minority interest, restructuring provisions, and unusual items such as contract amendments that mitigated potential loss positions. These exclusions reflect costs not considered directly allocable to individual business segments and result in a definition of contribution margin that does not take into account the substantial cost of doing business. Management believes that segment contribution margin is a helpful measure in evaluating the performance of our business segments. While our management may consider contribution margin to be an important measure of comparative operating performance, this measure should be considered in addition to, but not as a substitute for, loss from operations, net loss, cash flow and other measures of financial performance prepared in accordance with GAAP that are otherwise presented in our financial statements. In addition, our calculation of contribution margin may be different from the calculation used by other companies and, therefore, comparability may be affected.
Because these segments reflect the manner in which management reviews our business, they necessarily involve judgments that management believes are reasonable in light of the circumstances under which they are made. These judgments may change over time or may be modified to reflect new facts or circumstances. Segments may also be changed or modified to reflect technologies and applications that are newly created, or that change over time, or other business conditions that evolve, each of which may result in reassessing specific segments and the elements included within each of those segments. Recent events may affect the manner in which we present segments in the future.
F-40
Summarized information by segment was as follows (in thousands):
| | | | | | | | | | | | |
| | | Year Ended December 31, | |
| | | 2007 | | | 2006 | | | 2005 | |
Revenues: | | | | | | | | | | | | |
Middleware solutions | | | | | | | | | | | | |
Royalties and licenses | | $ | 68,673 | | | $ | 60,635 | | | $ | 54,337 | |
Services and other | | | 28,988 | | | | 18,238 | | | | 14,867 | |
| | | | | | | | | | | | |
Subtotal—Middleware solutions | | | 97,661 | | | | 78,873 | | | | 69,204 | |
Advertising solutions | | | | | | | | | | | | |
Royalties and licenses | | | 5,062 | | | | 5,251 | | | | 746 | |
Services and other | | | 7,254 | | | | 11,086 | | | | 8,265 | |
| | | | | | | | | | | | |
Subtotal—Advertising solutions | | | 12,316 | | | | 16,337 | | | | 9,011 | |
| | | | | | | | | | | | |
Total revenues | | $ | 109,977 | | | $ | 95,210 | | | $ | 78,215 | |
| | | | | | | | | | | | |
Contribution margin (loss): | | | | | | | | | | | | |
Middleware solutions | | $ | 32,057 | | | $ | 27,713 | | | $ | 28,042 | |
Advertising solutions | | | (389 | ) | | | (1,382 | ) | | | (7,107 | ) |
| | | | | | | | | | | | |
Total contribution margin | | | 31,668 | | | | 26,331 | | | | 20,935 | |
Unallocated corporate support | | | (23,416 | ) | | | (21,349 | ) | | | (20,179 | ) |
Restructuring and impairment costs | | | (267 | ) | | | (1,021 | ) | | | (2,545 | ) |
Depreciation and amortization | | | (3,819 | ) | | | (3,059 | ) | | | (3,553 | ) |
Amortization of intangible assets | | | (5,888 | ) | | | (6,981 | ) | | | (5,758 | ) |
Share-based and non-cash compensation | | | (3,355 | ) | | | (3,395 | ) | | | (159 | ) |
Interest income | | | 3,195 | | | | 3,016 | | | | 1,666 | |
Other income | | | 2,789 | | | | 407 | | | | 3,817 | |
Minority interest | | | 35 | | | | 37 | | | | 62 | |
Impairment of goodwill | | | — | | | | (747 | ) | | | — | |
| | | | | | | | | | | | |
Profit (loss) before income taxes | | | 942 | | | | (6,761 | ) | | | (5,714 | ) |
Income tax expense | | | 1,248 | | | | 2,896 | | | | 1,155 | |
| | | | | | | | | | | | |
Net loss from continuing operations | | | (306 | ) | | | (9,657 | ) | | | (6,869 | ) |
Discontinued operations: | | | | | | | | | | | | |
Loss from discontinued operations, net of tax | | | (1,091 | ) | | | (1,161 | ) | | | (1,604 | ) |
Impairment of assets of discontinued operations, net of tax | | | (3,764 | ) | | | — | | | | — | |
| | | | | | | | | | | | |
Net loss from discontinued operations | | | (4,855 | ) | | | (1,161 | ) | | | (1,604 | ) |
| | | | | | | | | | | | |
Net loss | | $ | (5,161 | ) | | $ | (10,818 | ) | | $ | (8,473 | ) |
| | | | | | | | | | | | |
F-41
Our revenues by geographic area, based on the location of customers, were as follows (in thousands):
| | | | | | | | | | | | | | | | | | |
| | | Year Ended December 31, | |
| | | 2007 | | % | | | 2006 | | % | | | 2005 | | % | |
Europe, Africa and Middle East | | | | | | | | | | | | | | | | | | |
United Kingdom | | $ | 20,056 | | 18 | % | | $ | 20,763 | | 22 | % | | $ | 15,510 | | 20 | % |
Italy | | | 5,477 | | 5 | % | | | 6,108 | | 6 | % | | | 10,452 | | 13 | % |
Netherlands | | | 16,984 | | 15 | % | | | 1,352 | | 1 | % | | | 121 | | 0 | % |
Other countries | | | 16,411 | | 15 | % | | | 18,033 | | 19 | % | | | 12,824 | | 16 | % |
| | | | | | | | | | | | | | | | | | |
Subtotal | | | 58,928 | | 53 | % | | | 46,256 | | 48 | % | | | 38,907 | | 49 | % |
Americas | | | | | | | | | | | | | | | | | | |
United States | | | 21,515 | | 20 | % | | | 25,391 | | 27 | % | | | 23,280 | | 30 | % |
Other countries | | | 6,449 | | 6 | % | | | 7,552 | | 8 | % | | | 4,620 | | 6 | % |
| | | | | | | | | | | | | | | | | | |
Subtotal | | | 27,964 | | 26 | % | | | 32,943 | | 35 | % | | | 27,900 | | 36 | % |
Asia Pacific | | | | | | | | | | | | | | | | | | |
Japan | | | 10,632 | | 10 | % | | | 9,664 | | 10 | % | | | 5,694 | | 8 | % |
Other countries | | | 12,453 | | 11 | % | | | 6,347 | | 7 | % | | | 5,714 | | 7 | % |
| | | | | | | | | | | | | | | | | | |
Subtotal | | | 23,085 | | 21 | % | | | 16,011 | | 17 | % | | | 11,408 | | 15 | % |
| | | | | | | | | | | | | | | | | | |
| | $ | 109,977 | | 100 | % | | $ | 95,210 | | 100 | % | | $ | 78,215 | | 100 | % |
| | | | | | | | | | | | | | | | | | |
Four major customers accounted for the following percentages of revenues:
| | | | | | | | | |
| | | Year Ended December 31, | |
| | | 2007 | | | 2006 | | | 2005 | |
UPC Broadband | | 17 | % | | 1 | % | | — | % |
Thomson | | 13 | % | | 12 | % | | 5 | % |
Echostar | | 8 | % | | 13 | % | | 18 | % |
Sky Italia | | 5 | % | | 6 | % | | 13 | % |
| | | | | | | | | |
| | 43 | % | | 32 | % | | 36 | % |
| | | | | | | | | |
British Sky Broadcasting, or BSkyB, directly and indirectly accounted for 16%, 17%, and 13% of total revenues for the years ended December 31, 2007, 2006 and 2005, respectively, taking into account the royalties which are paid by four manufacturers who sell set-top boxes to BSkyB, including Thomson.
Two customers respectively accounted for 20% and 17% of net accounts receivable as of December 31, 2007. Two customers respectively accounted for 24% and 14% of net accounts receivable as of December 31, 2006.
Capital expenditures by geographic area was as follows (in thousands):
| | | | | | | | | |
| | | Year Ended December 31, |
| | | 2007 | | 2006 | | 2005 |
United States | | $ | 2,240 | | $ | 3,395 | | $ | 1,659 |
Other countries | | | 1,138 | | | 1,215 | | | 1,120 |
| | | | | | | | | |
| | $ | 3,378 | | $ | 4,610 | | $ | 2,779 |
| | | | | | | | | |
F-42
Long-lived assets by geographic area was as follows (in thousands):
| | | | | | |
| | | December 31,
2007 | | December 31,
2006 |
Property and equipment: | | | | | | |
United States | | $ | 4,506 | | $ | 5,025 |
Other countries | | | 2,048 | | | 1,854 |
| | | | | | |
| | $ | 6,554 | | $ | 6,879 |
| | | | | | |
Other assets: | | | | | | |
United States | | $ | 1,301 | | $ | 4,031 |
Other countries | | | 595 | | | 605 |
| | | | | | |
| | $ | 1,896 | | $ | 4,636 |
| | | | | | |
Note 19. Subsequent Events
In February 2008, we received $14.3 million in cash from Liberty, which will be accounted for as a capital contribution in 2008. This represents the remaining capital contribution due to OpenTV pursuant to an agreement we entered into with Liberty in February 2006, which provided for us to receive a portion of any premium received by Liberty in any sale of its stake in OpenTV. In the aggregate, we received $19.7 million from Liberty in connection with the stock sale transaction between Liberty and Kudelski, which represents 71.4% of the premium received by Liberty in that transaction.
In March 2008, our Board of Directors appointed Nigel (Ben) Bennett as our Chief Executive Officer. Mr. Bennett assumed this role after having served as Acting Chief Executive Officer and Chief Operating Officer since August 2007.
Note 20. Quarterly Consolidated Financial Data (Unaudited)
The following table presents our operating results for each of the eight quarters in the years ended December 31, 2007 and 2006. The information for each of these quarters is unaudited, has been prepared on a basis generally consistent with our audited consolidated financial statements, except for the absence of notes thereto or as otherwise described in our consolidated financial statements. In the opinion of management, all necessary adjustments (consisting only of normal recurring and other adjustments) have been included to present fairly the unaudited consolidated quarterly results. These operating results are not necessarily indicative of the results of any future period.
F-43
The quarterly information was as follows (in thousands, except for share and per share amounts):
| | | | | | | | | | | | | | | | |
2007 Quarter Ended | | December 31 | | | September 30 | | | June 30 | | | March 31 | |
Revenues | | $ | 38,232 | | | $ | 23,674 | | | $ | 23,002 | | | $ | 25,069 | |
Gross profit | | $ | 24,382 | | | $ | 12,374 | | | $ | 11,103 | | | $ | 14,059 | |
Net profit (loss) from continuing operations | | $ | 12,272 | | | $ | (4,784 | ) | | $ | (4,770 | ) | | $ | (3,024 | ) |
Net income (loss) per share from continuing operations, basic and diluted | | | 0.09 | | | | (0.03 | ) | | | (0.03 | ) | | | (0.02 | ) |
Shares used in per share calculation - | | | | | | | | | | | | | | | | |
basic | | | 139,845,242 | | | | 139,052,035 | | | | 138,659,811 | | | | 138,505,301 | |
diluted | | | 140,575,305 | | | | 139,052,035 | | | | 138,659,811 | | | | 138,505,301 | |
| | | | |
2006 Quarter Ended | | December 31 | | | September 30 | | | June 30 | | | March 31 | |
Revenues | | $ | 25,091 | | | $ | 24,971 | | | $ | 21,961 | | | $ | 23,187 | |
Gross profit | | $ | 12,981 | | | $ | 14,751 | | | $ | 12,359 | | | $ | 14,123 | |
Net loss from continuing operations | | $ | (3,185 | ) | | $ | (1,587 | ) | | $ | (2,252 | ) | | $ | (2,633 | ) |
Net loss per share from continuing operations, basic and diluted | | | (0.02 | ) | | | (0.01 | ) | | | (0.02 | ) | | | (0.02 | ) |
Shares used in per share calculation, basic and diluted | | | 137,951,811 | | | | 137,648,870 | | | | 137,392,075 | | | | 135,976,561 | |
The quarter ended December 31, 2007 included $10.8 million of previously deferred revenue from UPC Broadband, a gain of $1.7 million from the sale of a cost investment, and a gain of $1.5 million from a favorable litigation settlement.
F-44
OPENTV CORP.
SCHEDULE II
VALUATION AND QUALIFYING ACCOUNTS
| | | | | | | | | | | | | | |
| | | For the Years Ended December 31, 2007, 2006 and 2005 |
| | Balance at
Beginning
of Year | | Charged
(Credited) to
Operating
Expenses | | | Write-offs
Net of
Recoveries | | | Balance at
End of Year |
Allowance for Doubtful Accounts (in thousands): | | | | | | | | | | | | | | |
2007 | | $ | 348 | | $ | 700 | | | $ | (483 | ) | | $ | 565 |
2006 | | | 305 | | | 82 | | | | (39 | ) | | | 348 |
2005 | | | 559 | | | (142 | ) | | | (112 | ) | | | 305 |
F-45