| |
|
| |
Notes to Financial Statements | BlackRock Large Cap Series Funds, Inc. |
1. Organization and Significant Accounting Policies:
BlackRock Large Cap Core Fund, BlackRock Large Cap Growth Fund and BlackRock Large Cap Value Fund (each a “Fund” and collectively the “Funds”), each a member of BlackRock Large Cap Series Funds, Inc. (the “Corporation”), which is registered under the Investment Company Act of 1940, as amended (the “1940 Act”), as a diversified, open-end management investment company. The Corporation is organized as a Maryland corporation. Each Fund seeks to achieve its investment objective by investing all, or a portion of, its assets in Master Large Cap Core Portfolio, Master Large Cap Growth Portfolio and Master Large Cap Value Portfolio (collectively the “Portfolios” or individually a “Portfolio”), respectively, constituting Master Large Cap Series LLC (the “Master LLC”), each of which has the same investment objective and strategies as the corresponding Fund. The value of a Fund’s investment in the applicable Portfolio reflects the Fund’s proportionate interest in the net assets of such Portfolio. As of September 30, 2010, the percentages of Master Large Cap Core Portfolio, Master Large Cap Growth Portfolio and Master Large Cap Value Portfolio owned by BlackRock Large Cap Core Fund, BlackRock Large Cap Growth Fund and BlackRock Large Cap Value Fund, were 74%, 77% and 91%, respectively. The performance of a Fund is directly affected by the performance of the applicable Portfolio. The financial statements of the Portfolios, including the Schedules of Investments, are included elsewhere in this report and should be read in conjunction with the Funds’ financial statements. The Funds’ financial statements are prepared in conformity with accounting principles generally accepted in the United States of America (“US GAAP”), which may require management to make estimates and assumptions that affect the reported amounts and disclosures in the financial statements. Actual results could differ from those estimates. Each Fund offers multiple classes of shares. Institutional and Service Shares are sold without a sales charge and only to certain eligible investors. Investor A Shares are generally sold with a front-end sales charge. Investor B and Investor C Shares may be subject to a contingent deferred sales charge. Class R Shares are sold without a sales charge and only to certain retirement and other similar plans. All classes of shares have identical voting, dividend, liquidation and other rights and the same terms and conditions, except that Service, Investor A, Investor B, Investor C and Class R Shares bear certain expenses related to the shareholder servicing of such shares, and Investor B, Investor C and Class R Shares also bear certain expenses related to the distribution of such shares. Investor B Shares automatically convert to Investor A Shares after approximately eight years. Investor B Shares are only available through exchanges, dividend reinvestments by existing shareholders or for purchase by certain qualified employee benefit plans. Each class has exclusive voting rights with respect to matters relating to its shareholder servicing and distribution expenditures (except that Investor B shareholders may vote on material changes to the Investor A distribution plan).
The following is a summary of significant accounting policies followed by the Funds:
Fund Reorganization: The Board of Directors of BlackRock Large Cap Core Fund and the Board of Directors and the shareholders of PNC Growth & Income Fund, Inc. (“Growth & Income”) of PNC Funds, Inc. approved a reorganization, pursuant to which BlackRock Large Cap Core Fund acquired substantially all of the assets and assumed substantially all of the liabilities of Growth & Income. The reorganization was a tax-free event and took place on November 14, 2008. The acquisition was accomplished by a tax-free exchange of 316,179 Investor A Shares, 67,564 Investor C Shares and 9,403,899 Institutional Shares of Growth & Income for 329,616 Investor A Shares, 68,866 Investor A Shares and 9,664,610 Institutional Shares, respectively, of BlackRock Large Cap Core Fund. The conversion ratios for Investor A Shares, Investor C Shares and Institutional Shares were 1.04249758, 1.01927550 and 1.02772376, respectively. Growth & Income’s net assets on that date of $78,592,131, including $181,269,534 of paid-in capital, $42,859,725 of net realized capital losses and $59,817,678 of net unrealized depreciation, were combined with those of BlackRock Large Cap Core Fund. The aggregate net assets of BlackRock Large Cap Core Fund immediately after the acquisition amounted to $2,529,461,660.
Valuation: The Funds’ policy is to fair value their financial instruments at market value. Each Fund records its investment in the corresponding Portfolio at fair value based on the Fund’s proportionate interest in the net assets of the Portfolio. Valuation of securities held by the Portfolio, including categorization of fair value measurements, is discussed in Note 1 of the Master LLC’s Notes to Financial Statements, which are included elsewhere in this report.
Investment Transactions and Investment Income: For financial reporting purposes, investment transactions are recorded on the dates the transactions are entered into (the trade dates). Each Fund records daily its proportionate share of the corresponding Portfolio’s income, expenses and realized and unrealized gains and losses. In addition, the Fund accrues its own expenses. Income and realized and unrealized gains and losses on investments are allocated daily to each class based on its relative net assets.
Dividends and Distributions: Dividends and distributions paid by each Fund are recorded on the ex-dividend dates. The amount and timing of dividends and distributions are determined in accordance with federal income tax regulations, which may differ from US GAAP.
Income Taxes: It is each Fund’s policy to comply with the requirements of the Internal Revenue Code of 1986, as amended, applicable to regulated investment companies and to distribute substantially all of its taxable income to its shareholders. Therefore, no federal income tax provision is required.
Each Fund files US federal and various state and local tax returns. No income tax returns are currently under examination. The statute of limitations on the Funds’ US federal tax returns remains open for the year ended September 30, 2010, the period ended September 30, 2009 and the two years ended October 31, 2008. The statutes of limitations on the Funds’ state and local tax returns may remain open for an additional year depending upon the jurisdiction. There are no uncertain tax positions that require recognition of a tax liability.
Other: Expenses directly related to a Fund or its classes are charged to the Fund or class. Other operating expenses shared by several funds are pro rated among those funds on the basis of relative net assets or other appropriate methods. Other expenses of each Fund are allocated daily to each class based on its relative net assets.
| | | |
|
|
|
|
| BLACKROCK LARGE CAP SERIES FUNDS, INC. | SEPTEMBER 30, 2010 | 35 |
| |
|
| |
Notes to Financial Statements (continued) | BlackRock Large Cap Series Funds, Inc. |
2. Administration Agreement and Other Transactions with Affiliates:
The PNC Financial Services Group, Inc. (“PNC”), Bank of America Corporation (“BAC”) and Barclays Bank PLC (“Barclays”) are the largest stockholders of BlackRock, Inc. (“BlackRock”). Due to the ownership structure, PNC is an affiliate of the Funds for 1940 Act purposes, but BAC and Barclays are not.
The Corporation, on behalf of each Fund, entered into an Administration Agreement with BlackRock Advisors, LLC (the “Administrator”), an indirect, wholly owned subsidiary of BlackRock, to provide administrative services (other than investment advice and related portfolio activities). For such services, each Fund pays the Administrator a monthly fee at an annual rate of 0.25% of the average daily value of each Fund’s net assets.
With respect to BlackRock Large Cap Core Fund, the Administrator contractually agreed to waive and/or reimburse fees and/or expenses in order to limit expenses (excluding interest expense, acquired fund fees and expenses and certain other fund expenses) as a percentage of average daily net assets allocated to certain classes of the Fund as follows: 1.14% for Investor A Shares, and 1.97% for Investor B Shares. These amounts are shown as transfer agent fees waived and/or reimbursed — class specific in the Statements of Operations. The Administrator has agreed not to reduce or discontinue this contractual waiver or reimbursement until February 1, 2011, unless approved by the Board, including a majority of the non-interested Directors.
The Corporation, on behalf of each Fund, entered into a Distribution Agreement and Distribution Plan with BlackRock Investments, LLC (“BRIL”), an affiliate of BlackRock. Pursuant to the Distribution Plan and in accordance with Rule 12b-1 under the 1940 Act, each Fund pays BRIL ongoing service and distribution fees. The fees are accrued daily and paid monthly at annual rates based upon the average daily net assets of the shares of each Fund as follows:
| | | | | | | |
|
|
|
|
|
|
| | Service
Fee | | Distribution
Fee | |
|
|
|
|
|
|
Service | | | 0.25 | % | | — | |
Investor A | | | 0.25 | % | | — | |
Investor B | | | 0.25 | % | | 0.75 | % |
Investor C | | | 0.25 | % | | 0.75 | % |
Class R | | | 0.25 | % | | 0.25 | % |
|
|
|
|
|
|
|
|
Pursuant to sub-agreements with BRIL, broker-dealers and BRIL provide shareholder servicing and distribution services to each Fund. The ongoing service and/or distribution fee compensates BRIL and each broker-dealer for providing shareholder servicing and/or distribution related services to Service, Investor A, Investor B, Investor C and Class R shareholders.
For the year ended September 30, 2010, affiliates earned underwriting discounts, direct commissions and dealer concessions on sales of the Funds’ Investor A Shares as follows:
| | | | |
|
|
|
|
| | Investor A | |
|
|
|
|
BlackRock Large Cap Core Fund | | $ | 55,303 | |
BlackRock Large Cap Growth Fund | | $ | 17,801 | |
BlackRock Large Cap Value Fund | | $ | 25,690 | |
|
|
|
|
|
For the year ended September 30, 2010, affiliates received the following contingent deferred sales charges relating to transactions in Investor B and Investor C Shares.
| | | | | | | |
|
|
|
|
|
|
| | Investor B | | Investor C | |
|
|
|
|
|
|
|
|
BlackRock Large Cap Core Fund | | $ | 128,822 | | $ | 45,281 | |
BlackRock Large Cap Growth Fund | | $ | 29,599 | | $ | 7,559 | |
BlackRock Large Cap Value Fund | | $ | 70,049 | | $ | 20,121 | |
|
|
|
|
|
|
|
|
Furthermore, affiliates received contingent deferred sale charges relating to transactions subject to front-end sales charge waivers on Investor A Shares as follows:
| | | | |
|
|
|
|
| | Investor A | |
|
|
|
|
BlackRock Large Cap Core Fund | | $ | 764 | |
BlackRock Large Cap Growth Fund | | $ | 215 | |
BlackRock Large Cap Value Fund | | $ | 11,155 | |
|
|
|
|
|
BNY Mellon Investment Servicing (US) Inc. (formerly PNC Global Investment Servicing (US) Inc. (“PNCGIS”)), serves as transfer agent and dividend disbursing agent. On July 1, 2010, The Bank of New York Mellon Corporation purchased PNCGIS and PFPC Trust Company, which prior to this date was an indirect, wholly owned subsidiary of PNC and an affiliate of the Administrator. Transfer agency fees borne by each Fund are comprised of those fees charged for all shareholder communications including mailing of shareholder reports, dividend and distribution notices, and proxy materials for shareholder meetings, as well as per account and per transaction fees related to servicing and maintenance of shareholder accounts, including the issuing, redeeming and transferring of shares, check writing, anti-money laundering services, and customer identification services. Pursuant to written agreements, certain financial intermediaries, some of which may be affiliates, provide the Funds with sub-accounting, recordkeeping, sub-transfer agency and other administrative services with respect to sub-accounts they service. For these services, these entities receive a fee that could vary depending on, among other things, shareholder accounts, share class and net assets. For the year ended September 30, 2010, the Funds paid the following to affiliates in return for these services, which is included in transfer agent — class specific in the Statements of Operations:
| | | | |
|
|
|
|
|
BlackRock Large Cap Core Fund | | $ | 1,015,843 | |
BlackRock Large Cap Growth Fund | | $ | 63,846 | |
BlackRock Large Cap Value Fund | | $ | 440,040 | |
|
|
|
|
|
The Administrator maintains a call center, which is responsible for providing certain shareholder services to the Funds, such as responding to shareholder inquiries and processing transactions based upon instructions from shareholders with respect to the subscription and redemption of Fund shares. For the year ended September 30, 2010, the Funds reimbursed the Manager the
| | |
|
|
|
36 | BLACKROCK LARGE CAP SERIES FUNDS, INC. | SEPTEMBER 30, 2010 |
| |
|
| |
Notes to Financial Statements (continued) | BlackRock Large Cap Series Funds, Inc. |
following amounts for costs incurred in running the call center, which are included in transfer agent — class specific in the Statements of Operations.
| | | | | | | | | | |
|
|
|
|
|
|
|
|
| | BlackRock
Large Cap Core
Fund | | BlackRock
Large Cap Growth
Fund | | BlackRock
Large Cap Value
Fund | |
|
|
|
|
|
|
|
|
Institutional | | $ | 14,775 | | $ | 678 | | $ | 5,979 | |
Service | | $ | 3 | | $ | 68 | | $ | 1,353 | |
Investor A | | $ | 68,642 | | $ | 4,416 | | $ | 28,348 | |
Investor B | | $ | 10,103 | | $ | 648 | | $ | 2,601 | |
Investor C | | $ | 11,048 | | $ | 2,334 | | $ | 6,988 | |
Class R | | $ | 783 | | $ | 499 | | $ | 1,274 | |
|
|
|
|
|
|
|
|
|
|
|
Certain officers and/or directors of the Corporation are officers and/or directors of BlackRock or its affiliates. The Funds reimburse the Administrator for compensation paid to the Corporation’s Chief Compliance Officer.
3. Income Tax Information:
Reclassifications: Accounting principles generally accepted in the United States of America require that certain components of net assets be adjusted to reflect permanent differences between financial and tax reporting. These reclassifications have no effect on net assets or net asset values per share. The following permanent differences as of September 30, 2010 attributable to the classification of settlement proceeds, net operating losses, non-deductible expenses and distributions paid in excess of taxable income were reclassified to the following accounts:
| | | | | | | | | | |
|
|
|
|
|
|
|
|
|
|
|
| | BlackRock
Large Cap Core
Fund | | BlackRock
Large Cap Growth
Fund | | BlackRock
Large Cap Value
Fund | |
|
|
|
|
|
|
|
|
Paid-in capital | | $ | (71,567 | ) | $ | (1,312,133 | ) | $ | (205 | ) |
Undistributed net investment income | | $ | 71,567 | | $ | 1,312,133 | | $ | 4,258 | |
Accumulated net realized loss | | | — | | | — | | $ | (4,053 | ) |
|
|
|
|
|
|
|
|
|
|
|
The tax character of distributions paid during the fiscal year ended September 30, 2010 and the period ended September 30, 2009 was as follows:
| | | | | | | | | | |
|
|
|
|
|
|
|
|
| | BlackRock
Large Cap Core
Fund | | BlackRock
Large Cap Growth
Fund | | BlackRock
Large Cap Value
Fund | |
|
|
|
|
|
|
|
|
Ordinary income | | | | | | | | | | |
9/30/2010 | | $ | 26,573,055 | | $ | 713,132 | | $ | 20,000,254 | |
9/30/2009 | | | — | | | — | | $ | 21,500,277 | |
|
|
|
|
|
|
|
|
|
|
|
Total distributions | | | | | | | | | | |
9/30/2010 | | $ | 26,573,055 | | $ | 713,132 | | $ | 20,000,254 | |
| |
|
|
|
|
|
|
|
|
|
9/30/2009 | | | — | | | — | | $ | 21,500,277 | |
| |
|
|
|
|
|
|
|
|
|
As of September 30, 2010, the tax components of accumulated net losses were as follows:
| | | | | | | | | | |
|
|
|
|
|
|
|
|
| | BlackRock
Large Cap Core
Fund | | BlackRock
Large Cap Growth
Fund | | BlackRock
Large Cap Value
Fund | |
|
|
|
|
|
|
|
|
Undistributed ordinary income | | $ | 8,417,269 | | | — | | $ | 11,031,867 | |
Capital loss carryforwards | | | (899,575,444 | ) | $ | (101,382,129 | ) | | (1,019,993,828 | ) |
Net unrealized gains* | | | 200,560,477 | | | 34,104,727 | | | 24,638,669 | |
| |
|
|
|
|
|
|
|
|
|
Total | | $ | (690,597,698 | ) | $ | (67,277,402 | ) | $ | (984,323,292 | ) |
| |
|
|
|
|
|
|
|
|
|
| | |
| * | The differences between book-basis and tax-basis net unrealized gains were attributable primarily to the tax deferral of losses on wash sales and the timing and recognition of partnership income. |
As of September 30, 2010, the Funds had capital loss carryforwards available to offset future realized capital gains through the indicated expiration dates:
| | | | | | | | | | |
|
|
|
|
|
|
|
|
|
|
|
Expires September 30, | | BlackRock
Large Cap Core
Fund | | BlackRock
Large Cap Growth
Fund | | BlackRock
Large Cap Value
Fund | |
|
|
|
|
|
|
|
|
2016 | | $ | 196,432,528 | | | — | | $ | 236,415,548 | |
2017 | | | 703,142,916 | | $ | 101,382,129 | | | 783,578,280 | |
| |
|
|
|
|
|
|
|
|
|
Total | | $ | 899,575,444 | | $ | 101,382,129 | | $ | 1,019,993,828 | |
| |
|
|
|
|
|
|
|
|
|
| | | |
|
|
|
|
| BLACKROCK LARGE CAP SERIES FUNDS, INC. | SEPTEMBER 30, 2010 | 37 |
| |
|
| |
Notes to Financial Statements (continued) | BlackRock Large Cap Series Funds, Inc. |
4. Capital Share Transactions:
Transactions in capital shares for each class were as follows:
| | | | | | | | | | | | | | | | | | | |
| | Year Ended
September 30, 2010 | | Period November 1, 2008 to
September 30, 2009 | | Year Ended
October 31, 2008 | |
| |
| |
| |
|
|
BlackRock Large Cap Core Fund | | Shares | | Amount | | Shares | | Amount | | Shares | | Amount | |
|
|
|
|
|
|
|
|
|
|
|
|
|
|
Institutional | | | | | | | | | | | | | | | | | | | |
|
|
|
|
|
|
|
|
|
|
|
|
|
|
|
|
|
|
|
|
Shares sold | | | 10,773,130 | | $ | 108,830,104 | | | 43,838,825 | | $ | 396,894,309 | | | 18,307,143 | | $ | 213,274,693 | |
Shares issued resulting from reorganization | | | — | | | — | | | 9,664,610 | | | 75,542,880 | | | — | | | — | |
Shares issued to shareholders in reinvestment of dividends and distributions | | | 995,656 | | | 10,056,127 | | | — | | | — | | | 2,274,133 | | | 30,541,847 | |
| |
|
|
|
|
| |
|
|
|
|
| |
|
|
|
|
|
|
Total issued | | | 11,768,786 | | | 118,886,231 | | | 53,503,435 | | | 472,437,189 | | | 20,581,276 | | | 243,816,540 | |
Shares redeemed | | | (58,705,823 | ) | | (580,312,532 | ) | | (23,884,724 | ) | | (198,928,273 | ) | | (44,290,807 | ) | | (536,280,456 | ) |
| |
|
|
|
|
| |
|
|
|
|
| |
|
|
|
|
|
|
Net increase (decrease) | | | (46,937,037 | ) | $ | (461,426,301 | ) | | 29,618,711 | | $ | 273,508,916 | | | (23,709,531 | ) | $ | (292,463,916 | ) |
| |
|
|
|
|
| |
|
|
|
|
| |
|
|
|
|
|
|
| | | | | | | | | | | | | | | | | | | |
|
|
|
|
|
|
|
|
|
|
|
|
|
|
|
|
|
|
|
|
Service | | | | | | | | | | | | | | | | | | | |
|
|
|
|
|
|
|
|
|
|
|
|
|
|
|
|
|
|
|
|
Shares sold | | | 21 | | $ | 209 | | | 1,434 | | $ | 12,041 | | | 1,706 | | $ | 20,740 | |
Shares issued to shareholders in reinvestment of dividends and distributions | | | 68 | | | 670 | | | — | | | — | | | 207 | | | 2,724 | |
| |
|
|
|
|
| |
|
|
|
|
| |
|
|
|
|
|
|
Total issued | | | 89 | | | 879 | | | 1,434 | | | 12,041 | | | 1,913 | | | 23,464 | |
Shares redeemed | | | (4,462 | ) | | (43,976 | ) | | (3,851 | ) | | (33,636 | ) | | (2,490 | ) | | (29,767 | ) |
| |
|
|
|
|
| |
|
|
|
|
| |
|
|
|
|
|
|
Net decrease | | | (4,373 | ) | $ | (43,097 | ) | | (2,417 | ) | $ | (21,595 | ) | | (577 | ) | $ | (6,303 | ) |
| |
|
|
|
|
| |
|
|
|
|
| |
|
|
|
|
|
|
| | | | | | | | | | | | | | | | | | | |
|
|
|
|
|
|
|
|
|
|
|
|
|
|
|
|
|
|
|
|
Investor A | | | | | | | | | | | | | | | | | | | |
|
|
|
|
|
|
|
|
|
|
|
|
|
|
|
|
|
|
|
|
Shares sold and automatic conversion of shares | | | 13,647,851 | | $ | 134,090,944 | | | 19,460,075 | | $ | 156,006,893 | | | 25,121,752 | | $ | 287,778,279 | |
Shares issued resulting from reorganization | | | — | | | — | | | 398,482 | | | 3,049,251 | | | — | | | — | |
Shares issued to shareholders in reinvestment of dividends and distributions | | | 1,022,108 | | | 10,098,403 | | | — | | | — | | | 3,501,677 | | | 46,152,207 | |
| |
|
|
|
|
| |
|
|
|
|
| |
|
|
|
|
|
|
Total issued | | | 14,669,959 | | | 144,189,347 | | | 19,858,557 | | | 159,056,144 | | | 28,623,429 | | | 333,930,486 | |
Shares redeemed | | | (28,324,813 | ) | | (278,146,597 | ) | | (29,001,793 | ) | | (232,580,039 | ) | | (36,162,977 | ) | | (410,373,242 | ) |
| |
|
|
|
|
| |
|
|
|
|
| |
|
|
|
|
|
|
Net decrease | | | (13,654,854 | ) | $ | (133,957,250 | ) | | (9,143,236 | ) | $ | (73,523,895 | ) | | (7,539,548 | ) | $ | (76,442,756 | ) |
| |
|
|
|
|
| |
|
|
|
|
| |
|
|
|
|
|
|
| | | | | | | | | | | | | | | | | | | |
|
|
|
|
|
|
|
|
|
|
|
|
|
|
|
|
|
|
|
|
Investor B | | | | | | | | | | | | | | | | | | | |
|
|
|
|
|
|
|
|
|
|
|
|
|
|
|
|
|
|
|
|
Shares sold | | | 485,306 | | $ | 4,475,426 | | | 1,330,571 | | $ | 9,828,180 | | | 1,944,126 | | $ | 21,374,807 | |
Shares issued to shareholders in reinvestment of dividends and distributions | | | 18,880 | | | 175,014 | | | — | | | — | | | 965,784 | | | 12,033,720 | |
| |
|
|
|
|
| |
|
|
|
|
| |
|
|
|
|
|
|
Total issued | | | 504,186 | | | 4,650,440 | | | 1,330,571 | | | 9,828,180 | | | 2,909,910 | | | 33,408,527 | |
Shares redeemed and automatic conversion of shares | | | (5,540,874 | ) | | (51,182,780 | ) | | (10,542,617 | ) | | (78,386,183 | ) | | (16,534,915 | ) | | (175,371,510 | ) |
| |
|
|
|
|
| |
|
|
|
|
| |
|
|
|
|
|
|
Net decrease | | | (5,036,688 | ) | $ | (46,532,340 | ) | | (9,212,046 | ) | $ | (68,558,003 | ) | | (13,625,005 | ) | $ | (141,962,983 | ) |
| |
|
|
|
|
| |
|
|
|
|
| |
|
|
|
|
|
|
| | | | | | | | | | | | | | | | | | | |
|
|
|
|
|
|
|
|
|
|
|
|
|
|
|
|
|
|
|
|
Investor C | | | | | | | | | | | | | | | | | | | |
|
|
|
|
|
|
|
|
|
|
|
|
|
|
|
|
|
|
|
|
Shares sold | | | 9,126,282 | | $ | 83,325,024 | | | 12,253,383 | | $ | 91,559,769 | | | 18,173,395 | | $ | 198,511,648 | |
Shares issued to shareholders in reinvestment of dividends and distributions | | | 184,903 | | | 1,699,248 | | | — | | | — | | | 2,978,085 | | | 36,928,497 | |
| |
|
|
|
|
| |
|
|
|
|
| |
|
|
|
|
|
|
Total issued | | | 9,311,185 | | | 85,024,272 | | | 12,253,383 | | | 91,559,769 | | | 21,151,480 | | | 235,440,145 | |
Shares redeemed | | | (19,911,091 | ) | | (181,463,376 | ) | | (27,245,486 | ) | | (201,291,278 | ) | | (37,605,977 | ) | | (400,427,690 | ) |
| |
|
|
|
|
| |
|
|
|
|
| |
|
|
|
|
|
|
Net decrease | | | (10,599,906 | ) | $ | (96,439,104 | ) | | (14,992,103 | ) | $ | (109,731,509 | ) | | (16,454,497 | ) | $ | (164,987,545 | ) |
| |
|
|
|
|
| |
|
|
|
|
| |
|
|
|
|
|
|
| | |
|
|
|
38 | BLACKROCK LARGE CAP SERIES FUNDS, INC. | SEPTEMBER 30, 2010 |
| |
|
| |
Notes to Financial Statements (continued) | BlackRock Large Cap Series Funds, Inc. |
| | | | | | | | | | | | | | | | | | | |
| | Year Ended
September 30, 2010 | | Period November 1, 2008 to
September 30, 2009 | | Year Ended
October 31, 2008 | |
| |
| |
| |
|
|
BlackRock Large Cap Core Fund (concluded) | | Shares | | Amount | | Shares | | Amount | | Shares | | Amount | |
|
|
|
|
|
|
|
|
|
|
|
|
|
|
Class R | | | | | | | | | | | | | | | | | | | |
|
|
|
|
|
|
|
|
|
|
|
|
|
|
|
|
|
|
|
|
Shares sold | | | 2,430,715 | | $ | 23,002,677 | | | 3,485,022 | | $ | 26,708,974 | | | 5,011,848 | | $ | 56,841,792 | |
Shares issued to shareholders in reinvestment of dividends and distributions | | | 64,796 | | | 614,263 | | | — | | | — | | | 351,544 | | | 4,475,160 | |
| |
|
|
|
|
| |
|
|
|
|
| |
|
|
|
|
|
|
Total issued | | | 2,495,511 | | | 23,616,940 | | | 3,485,022 | | | 26,708,974 | | | 5,363,392 | | | 61,316,952 | |
Shares redeemed | | | (4,437,568 | ) | | (41,770,158 | ) | | (4,955,971 | ) | | (38,331,982 | ) | | (5,004,446 | ) | | (54,816,870 | ) |
| |
|
|
|
|
| |
|
|
|
|
| |
|
|
|
|
|
|
Net increase (decrease) | | | (1,942,057 | ) | $ | (18,153,218 | ) | | (1,470,949 | ) | $ | (11,623,008 | ) | | 358,946 | | $ | 6,500,082 | |
| |
|
|
|
|
| |
|
|
|
|
| |
|
|
|
|
|
|
| | | | | | | | | | | | | | | | | | | |
BlackRock Large Cap Growth Fund | | | | | | | | | | | | | | | | | | | |
|
|
|
|
|
|
|
|
|
|
|
|
|
|
|
|
|
|
|
|
Institutional | | | | | | | | | | | | | | | | | | | |
|
|
|
|
|
|
|
|
|
|
|
|
|
|
|
|
|
|
|
|
Shares sold | | | 1,338,286 | | $ | 12,666,317 | | | 3,200,408 | | $ | 23,028,793 | | | 7,511,633 | | $ | 73,321,006 | |
Shares issued to shareholders in reinvestment of dividends and distributions | | | 14,931 | | | 140,651 | | | — | | | — | | | 712,440 | | | 8,123,721 | |
| |
|
|
|
|
| |
|
|
|
|
| |
|
|
|
|
|
|
Total issued | | | 1,353,217 | | | 12,806,968 | | | 3,200,408 | | | 23,028,793 | | | 8,224,073 | | | 81,444,727 | |
Shares redeemed | | | (4,102,509 | ) | | (38,052,825 | ) | | (9,449,134 | ) | | (66,001,834 | ) | | (21,883,831 | ) | | (232,545,666 | ) |
| |
|
|
|
|
| |
|
|
|
|
| |
|
|
|
|
|
|
Net decrease | | | (2,749,292 | ) | $ | (25,245,857 | ) | | (6,248,726 | ) | $ | (42,973,041 | ) | | (13,659,758 | ) | $ | (151,100,939 | ) |
| |
|
|
|
|
| |
|
|
|
|
| |
|
|
|
|
|
|
| | | | | | | | | | | | | | | | | | | |
|
|
|
|
|
|
|
|
|
|
|
|
|
|
|
|
|
|
|
|
Service | | | | | | | | | | | | | | | | | | | |
|
|
|
|
|
|
|
|
|
|
|
|
|
|
|
|
|
|
|
|
Shares sold | | | 314,193 | | $ | 2,934,482 | | | 739,068 | | $ | 5,283,078 | | | 800,038 | | $ | 8,201,394 | |
Shares issued to shareholders in reinvestment of dividends and distributions | | | 2,316 | | | 21,700 | | | — | | | — | | | 25,764 | | | 292,397 | |
| |
|
|
|
|
| |
|
|
|
|
| |
|
|
|
|
|
|
Total issued | | | 316,509 | | | 2,956,182 | | | 739,068 | | | 5,283,078 | | | 825,802 | | | 8,493,791 | |
Shares redeemed | | | (407,564 | ) | | (3,752,048 | ) | | (837,138 | ) | | (6,169,884 | ) | | (343,432 | ) | | (3,339,036 | ) |
| |
|
|
|
|
| |
|
|
|
|
| |
|
|
|
|
|
|
Net increase (decrease) | | | (91,055 | ) | $ | (795,866 | ) | | (98,070 | ) | $ | (886,806 | ) | | 482,370 | | $ | 5,154,755 | |
| |
|
|
|
|
| |
|
|
|
|
| |
|
|
|
|
|
|
| | | | | | | | | | | | | | | | | | | |
|
|
|
|
|
|
|
|
|
|
|
|
|
|
|
|
|
|
|
|
Investor A | | | | | | | | | | | | | | | | | | | |
|
|
|
|
|
|
|
|
|
|
|
|
|
|
|
|
|
|
|
|
Shares sold and automatic conversion of shares | | | 6,818,978 | | $ | 62,794,718 | | | 15,330,815 | | $ | 108,752,602 | | | 11,239,300 | | $ | 111,809,291 | |
Shares issued to shareholders in reinvestment of dividends and distributions | | | 49,226 | | | 451,399 | | | — | | | — | | | 738,365 | | | 8,229,629 | |
| |
|
|
|
|
| |
|
|
|
|
| |
|
|
|
|
|
|
Total issued | | | 6,868,204 | | | 63,246,117 | | | 15,330,815 | | | 108,752,602 | | | 11,977,665 | | | 120,038,920 | |
Shares redeemed | | | (10,233,312 | ) | | (93,172,865 | ) | | (9,279,289 | ) | | (66,682,725 | ) | | (14,146,657 | ) | | (138,339,235 | ) |
| |
|
|
|
|
| |
|
|
|
|
| |
|
|
|
|
|
|
Net increase (decrease) | | | (3,365,108 | ) | $ | (29,926,748 | ) | | 6,051,526 | | $ | 42,069,877 | | | (2,168,992 | ) | $ | (18,300,315 | ) |
| |
|
|
|
|
| |
|
|
|
|
| |
|
|
|
|
|
|
| | | | | | | | | | | | | | | | | | | |
|
|
|
|
|
|
|
|
|
|
|
|
|
|
|
|
|
|
|
|
Investor B | | | | | | | | | | | | | | | | | | | |
|
|
|
|
|
|
|
|
|
|
|
|
|
|
|
|
|
|
|
|
Shares sold | | | 118,538 | | $ | 998,894 | | | 553,780 | | $ | 3,562,794 | | | 1,001,693 | | $ | 9,563,976 | |
Shares issued to shareholders in reinvestment of dividends and distributions | | | — | | | — | | | — | | | — | | | 249,325 | | | 2,610,264 | |
| |
|
|
|
|
| |
|
|
|
|
| |
|
|
|
|
|
|
Total issued | | | 118,538 | | | 998,894 | | | 553,780 | | | 3,562,794 | | | 1,251,018 | | | 12,174,240 | |
Shares redeemed and automatic conversion of shares | | | (1,720,564 | ) | | (14,492,638 | ) | | (3,063,760 | ) | | (19,937,014 | ) | | (4,616,366 | ) | | (41,341,832 | ) |
| |
|
|
|
|
| |
|
|
|
|
| |
|
|
|
|
|
|
Net decrease | | | (1,602,026 | ) | $ | (13,493,744 | ) | | (2,509,980 | ) | $ | (16,374,220 | ) | | (3,365,348 | ) | $ | (29,167,592 | ) |
| |
|
|
|
|
| |
|
|
|
|
| |
|
|
|
|
|
|
| | | | | | | | | | | | | | | | | | | |
|
|
|
|
|
|
|
|
|
|
|
|
|
|
|
|
|
|
|
|
Investor C | | | | | | | | | | | | | | | | | | | |
|
|
|
|
|
|
|
|
|
|
|
|
|
|
|
|
|
|
|
|
Shares sold | | | 2,236,747 | | $ | 18,917,169 | | | 4,024,125 | | $ | 26,137,785 | | | 5,629,306 | | $ | 52,751,745 | |
Shares issued to shareholders in reinvestment of dividends and distributions | | | — | | | — | | | — | | | — | | | 698,980 | | | 7,309,379 | |
| |
|
|
|
|
| |
|
|
|
|
| |
|
|
|
|
|
|
Total issued | | | 2,236,747 | | | 18,917,169 | | | 4,024,125 | | | 26,137,785 | | | 6,328,286 | | | 60,061,124 | |
Shares redeemed | | | (5,624,127 | ) | | (47,375,242 | ) | | (7,506,579 | ) | | (49,077,741 | ) | | (9,646,626 | ) | | (87,478,848 | ) |
| |
|
|
|
|
| |
|
|
|
|
| |
|
|
|
|
|
|
Net decrease | | | (3,387,380 | ) | $ | (28,458,073 | ) | | (3,482,454 | ) | $ | (22,939,956 | ) | | (3,318,340 | ) | $ | (27,417,724 | ) |
| |
|
|
|
|
| |
|
|
|
|
| |
|
|
|
|
|
|
| | | |
|
|
|
|
| BLACKROCK LARGE CAP SERIES FUNDS, INC. | SEPTEMBER 30, 2010 | 39 |
| |
|
| |
Notes to Financial Statements (continued) | BlackRock Large Cap Series Funds, Inc. |
| | | | | | | | | | | | | | | | |
| | Year Ended
September 30, 2010 | | Period November 1, 2008 to
September 30, 2009 | | Year Ended
October 31, 2008 | |
| |
| |
| |
|
|
BlackRock Large Cap Growth Fund (concluded) | | Shares | | Amount | | Shares | | Amount | | Shares | | Amount | |
|
|
|
|
|
|
|
|
|
|
|
|
|
|
Class R | | | | | | | | | | | | | | | | |
|
|
|
|
|
|
|
|
|
|
|
|
|
|
|
|
|
Shares sold | | 2,092,702 | | $ | 18,494,679 | | 3,385,315 | | $ | 23,673,982 | | 3,819,354 | | $ | 36,987,224 | |
Shares issued to shareholders in reinvestment of dividends and distributions | | — | | | — | | — | | | — | | 242,342 | | | 2,618,770 | |
| |
|
|
|
| |
|
|
|
| |
|
|
|
|
|
Total issued | | 2,092,702 | | | 18,494,679 | | 3,385,315 | | | 23,673,982 | | 4,061,696 | | | 39,605,994 | |
Shares redeemed | | (3,910,116 | ) | | (34,501,312 | ) | (3,807,630 | ) | | (26,171,138 | ) | (4,306,198 | ) | | (40,459,087 | ) |
| |
|
|
|
| |
|
|
|
| |
|
|
|
|
|
Net decrease | | (1,817,414 | ) | $ | (16,006,633 | ) | (422,315 | ) | $ | (2,497,156 | ) | (244,502 | ) | $ | (853,093 | ) |
| |
|
|
|
| |
|
|
|
| |
|
|
|
|
|
| | | | | | | | | | | | | | | | |
BlackRock Large Cap Value Fund | | | | | | | | | | | | | | | | |
|
|
|
|
|
|
|
|
|
|
|
|
|
|
|
|
|
Institutional | | | | | | | | | | | | | | | | |
|
|
|
|
|
|
|
|
|
|
|
|
|
|
|
|
|
Shares sold | | 19,278,100 | | $ | 258,452,858 | | 32,615,703 | | $ | 371,335,366 | | 36,894,137 | | $ | 614,681,902 | |
Shares issued to shareholders in reinvestment of dividends and distributions | | 623,361 | | | 8,446,534 | | 832,481 | | | 9,823,482 | | 4,133,919 | | | 77,302,827 | |
| |
|
|
|
| |
|
|
|
| |
|
|
|
|
|
Total issued | | 19,901,461 | | | 266,899,392 | | 33,448,184 | | | 381,158,848 | | 41,028,056 | | | 691,984,729 | |
Shares redeemed | | (31,410,550 | ) | | (423,309,905 | ) | (37,939,377 | ) | | (425,168,526 | ) | (33,791,812 | ) | | (566,502,267 | ) |
| |
|
|
|
| |
|
|
|
| |
|
|
|
|
|
Net increase (decrease) | | (11,509,089 | ) | $ | (156,410,513 | ) | (4,491,193 | ) | $ | (44,009,678 | ) | 7,236,244 | | $ | 125,482,462 | |
| |
|
|
|
| |
|
|
|
| |
|
|
|
|
|
| | | | | | | | | | | | | | | | |
|
|
|
|
|
|
|
|
|
|
|
|
|
|
|
|
|
Service | | | | | | | | | | | | | | | | |
|
|
|
|
|
|
|
|
|
|
|
|
|
|
|
|
|
Shares sold | | 580,761 | | $ | 7,814,152 | | 869,931 | | $ | 10,024,519 | | 706,019 | | $ | 11,959,010 | |
Shares issued to shareholders in reinvestment of dividends and distributions | | 22,284 | | | 301,721 | | 25,134 | | | 296,329 | | 112,372 | | | 2,099,110 | |
| |
|
|
|
| |
|
|
|
| |
|
|
|
|
|
Total issued | | 603,045 | | | 8,115,873 | | 895,065 | | | 10,320,848 | | 818,391 | | | 14,058,120 | |
Shares redeemed | | (546,758 | ) | | (7,307,183 | ) | (700,419 | ) | | (7,985,278 | ) | (420,028 | ) | | (6,793,559 | ) |
| |
|
|
|
| |
|
|
|
| |
|
|
|
|
|
Net increase | | 56,287 | | $ | 808,690 | | 194,646 | | $ | 2,335,570 | | 398,363 | | $ | 7,264,561 | |
| |
|
|
|
| |
|
|
|
| |
|
|
|
|
|
| | | | | | | | | | | | | | | | |
|
|
|
|
|
|
|
|
|
|
|
|
|
|
|
|
|
Investor A | | | | | | | | | | | | | | | | |
|
|
|
|
|
|
|
|
|
|
|
|
|
|
|
|
|
Shares sold and automatic conversion of shares | | 11,944,824 | | $ | 158,688,148 | | 22,786,796 | | $ | 253,248,797 | | 48,856,474 | | $ | 810,946,846 | |
Shares issued to shareholders in reinvestment of dividends and distributions | | 585,808 | | | 7,814,678 | | 697,851 | | | 8,109,178 | | 8,148,668 | | | 149,528,060 | |
| |
|
|
|
| |
|
|
|
| |
|
|
|
|
|
Total issued | | 12,530,632 | | | 166,502,826 | | 23,484,647 | | | 261,357,975 | | 57,005,142 | | | 960,474,906 | |
Shares redeemed | | (30,481,178 | ) | | (401,417,990 | ) | (56,253,555 | ) | | (638,708,323 | ) | (71,052,529 | ) | | (1,126,150,477 | ) |
| |
|
|
|
| |
|
|
|
| |
|
|
|
|
|
Net decrease | | (17,950,546 | ) | $ | (234,915,164 | ) | (32,768,908 | ) | $ | (377,350,348 | ) | (14,047,387 | ) | $ | (165,675,571 | ) |
| |
|
|
|
| |
|
|
|
| |
|
|
|
|
|
|
|
|
|
|
|
|
|
|
|
|
|
|
|
|
|
|
|
Investor B | | | | | | | | | | | | | | | | |
|
|
|
|
|
|
|
|
|
|
|
|
|
|
|
|
|
Shares sold | | 265,031 | | $ | 3,329,020 | | 719,124 | | $ | 7,481,609 | | 1,092,265 | | $ | 17,474,705 | |
Shares issued to shareholders in reinvestment of dividends and distributions | | — | | | — | | — | | | — | | 854,376 | | | 14,866,308 | |
| |
|
|
|
| |
|
|
|
| |
|
|
|
|
|
Total issued | | 265,031 | | | 3,329,020 | | 719,124 | | $ | 7,481,609 | | 1,946,641 | | | 32,341,013 | |
Shares redeemed and automatic conversion of shares | | (2,500,232 | ) | | (31,383,426 | ) | (5,053,679 | ) | | (52,822,330 | ) | (6,636,951 | ) | | (100,755,559 | ) |
| |
|
|
|
| |
|
|
|
| |
|
|
|
|
|
Net decrease | | (2,235,201 | ) | $ | (28,054,406 | ) | (4,334,555 | ) | $ | (45,340,721 | ) | (4,690,310 | ) | $ | (68,414,546 | ) |
| |
|
|
|
| |
|
|
|
| |
|
|
|
|
|
| | |
|
|
|
40 | BLACKROCK LARGE CAP SERIES FUNDS, INC. | SEPTEMBER 30, 2010 |
| |
|
| |
Notes to Financial Statements (concluded) | BlackRock Large Cap Series Funds, Inc. |
| | | | | | | | | | | | | | | | |
| | Year Ended
September 30, 2010 | | Period November 1, 2008 to
September 30, 2009 | | Year Ended
October 31, 2008 | |
| |
| |
| |
|
|
BlackRock Large Cap Value Fund (concluded) | | Shares | | Amount | | Shares | | Amount | | Shares | | Amount | |
|
|
|
|
|
|
|
|
|
|
|
|
|
|
Investor C | | | | | | | | | | | | | | | | |
|
|
|
|
|
|
|
|
|
|
|
|
|
|
|
|
|
Shares sold | | 3,543,382 | | $ | 44,307,468 | | 5,645,722 | | $ | 59,078,869 | | 8,488,185 | | $ | 132,881,032 | |
Shares issued to shareholders in reinvestment of dividends and distributions | | 47,979 | | | 604,065 | | — | | | — | | 3,171,063 | | | 54,954,834 | |
| |
|
|
|
| |
|
|
|
| |
|
|
|
|
|
Total issued | | 3,591,361 | | | 44,911,533 | | 5,645,722 | | | 59,078,869 | | 11,659,248 | | | 187,835,866 | |
Shares redeemed | | (10,921,436 | ) | | (135,789,995 | ) | (14,777,083 | ) | | (154,061,182 | ) | (20,768,438 | ) | | (319,453,157 | ) |
| |
|
|
|
| |
|
|
|
| |
|
|
|
|
|
Net decrease | | (7,330,075 | ) | $ | (90,878,462 | ) | (9,131,361 | ) | $ | (94,982,313 | ) | (9,109,190 | ) | $ | (131,617,291 | ) |
| |
|
|
|
| |
|
|
|
| |
|
|
|
|
|
|
|
|
|
|
|
|
|
|
|
|
|
|
|
|
|
|
|
Class R | | | | | | | | | | | | | | | | |
|
|
|
|
|
|
|
|
|
|
|
|
|
|
|
|
|
Shares sold | | 2,802,283 | | $ | 35,887,564 | | 4,471,624 | | $ | 48,009,946 | | 5,771,456 | | $ | 92,978,324 | |
Shares issued to shareholders in reinvestment of dividends and distributions | | 75,054 | | | 968,198 | | 65,284 | | | 734,458 | | 788,255 | | | 14,015,179 | |
| |
|
|
|
| |
|
|
|
| |
|
|
|
|
|
Total issued | | 2,877,337 | | | 36,855,762 | | 4,536,908 | | | 48,744,404 | | 6,559,711 | | | 106,993,503 | |
Shares redeemed | | (5,039,688 | ) | | (64,616,144 | ) | (5,511,545 | ) | | (59,524,278 | ) | (4,981,736 | ) | | (78,250,333 | ) |
| |
|
|
|
| |
|
|
|
| |
|
|
|
|
|
Net increase (decrease) | | (2,162,351 | ) | $ | (27,760,382 | ) | (974,637 | ) | $ | (10,779,874 | ) | 1,577,975 | | $ | 28,743,170 | |
| |
|
|
|
| |
|
|
|
| |
|
|
|
|
|
4. Subsequent Events:
Management has evaluated the impact of all subsequent events on each Fund through the date the financial statements were issued and has determined that there were no subsequent events requiring adjustment or additional disclosure in the financial statements.
| | | |
|
|
|
|
| BLACKROCK LARGE CAP SERIES FUNDS, INC. | SEPTEMBER 30, 2010 | 41 |
| |
|
| |
Report of Independent Registered Public Accounting Firm | BlackRock Large Cap Series Funds, Inc. |
To the Shareholders and Board of Directors of BlackRock Large Cap Series Funds, Inc.:
We have audited the accompanying statements of assets and liabilities of BlackRock Large Cap Core Fund, BlackRock Large Cap Growth Fund and BlackRock Large Cap Value Fund, three of the series constituting BlackRock Large Cap Series Funds, Inc. (the “Fund”), as of September 30, 2010, and the related statements of operations for the year then ended, the statements of changes in net assets for the year then ended, for the period November 1, 2008 through September 30, 2009, and for the year ended October 31, 2008, and the financial highlights for the year ended September 30, 2010, for the period November 1, 2008 through September 30, 2009, and for each of the four years in the period ended October 31, 2008. These financial statements and financial highlights are the responsibility of the Fund’s management. Our responsibility is to express an opinion on these financial statements and financial highlights based on our audits.
We conducted our audits in accordance with the standards of the Public Company Accounting Oversight Board (United States). Those standards require that we plan and perform the audit to obtain reasonable assurance about whether the financial statements and financial highlights are free of material misstatement. The Fund is not required to have, nor were we engaged to perform, an audit of its internal control over financial reporting. Our audits included consideration of internal control over financial reporting as a basis for designing audit procedures that are appropriate in the circumstances, but not for the purpose of expressing an opinion on the effectiveness of the Fund’s internal control over financial reporting. Accordingly, we express no such opinion. An audit also includes examining, on a test basis, evidence supporting the amounts and disclosures in the financial statements, assessing the accounting principles used and significant estimates made by management, as well as evaluating the overall financial statement presentation. We believe that our audits provide a reasonable basis for our opinion.
In our opinion, the financial statements and financial highlights referred to above present fairly, in all material respects, the financial positions of BlackRock Large Cap Core Fund, BlackRock Large Cap Growth Fund and BlackRock Large Cap Value Fund of BlackRock Large Cap Series Funds, Inc. as of September 30, 2010, the results of their operations for the year then ended, the changes in their net assets for the year then ended, for the period November 1, 2008 through September 30, 2009, and for the year ended October 31, 2008, and the financial highlights for the year ended September 30, 2010, for the period November 1, 2008 through September 30, 2009, and for each of the four years in the period ended October 31, 2008, in conformity with accounting principles generally accepted in the United States of America.
Deloitte & Touche LLP
Princeton, New Jersey
November 26, 2010
| | | | |
|
Important Tax Information (Unaudited) |
|
|
The following information is provided with respect to the ordinary income distributions paid during the taxable year ended September 30, 2010: |
| | | | |
|
|
|
|
|
| Payable
Date | BlackRock
Large Cap
Core Fund | BlackRock
Large Cap
Growth Fund | BlackRock
Large Cap
Value Fund |
|
|
|
|
|
Qualified Dividend Income for Individuals | 12/17/09 | 100% | 100% | 100% |
|
|
|
|
|
Dividends Qualifying for the Dividend Received Deduction for Corporations | 12/17/09 | 100% | 100% | 100% |
|
|
|
|
|
| | |
|
|
|
42 | BLACKROCK LARGE CAP SERIES FUNDS, INC. | SEPTEMBER 30, 2010 |
| |
|
| |
Portfolio Information as of September 30, 2010 | Master Large Cap Series LLC |
| | | | |
|
|
|
|
|
Ten Largest Holdings | | | | |
|
|
|
|
|
| | | | |
Master Large Cap Core Portfolio | | Percent of
Long-Term Investments | |
|
|
|
|
|
Intel Corp. | | 2 | % | |
Exxon Mobil Corp. | | 2 | | |
Comcast Corp., Class A | | 1 | | |
Amgen, Inc. | | 1 | | |
UnitedHealth Group, Inc. | | 1 | | |
Eli Lilly & Co. | | 1 | | |
Dell, Inc. | | 1 | | |
News Corp., Class A | | 1 | | |
Corning, Inc. | | 1 | | |
Apple, Inc. | | 1 | | |
|
|
|
|
|
|
Master Large Cap Growth Portfolio | | Percent of
Long-Term Investments | |
|
|
|
|
|
Microsoft Corp. | | 3 | % | |
Exxon Mobil Corp. | | 3 | | |
Apple, Inc. | | 2 | | |
Intel Corp. | | 2 | | |
Ford Motor Co. | | 2 | | |
Abbott Laboratories | | 2 | | |
Dell, Inc. | | 1 | | |
TJX Cos., Inc. | | 1 | | |
Manitowoc Co. | | 1 | | |
Limited Brands, Inc. | | 1 | | |
|
|
|
|
|
| | | | |
Master Large Cap Value Portfolio | | Percent of
Long-Term Investments | |
|
|
|
|
|
Bank of America Corp. | | 3 | % | |
Citigroup, Inc. | | 2 | | |
UnitedHealth Group, Inc. | | 2 | | |
Intel Corp. | | 2 | | |
Eli Lilly & Co. | | 2 | | |
Corning, Inc. | | 1 | | |
News Corp., Class A | | 1 | | |
Comcast Corp., Class A | | 1 | | |
Marathon Oil Corp. | | 1 | | |
Capital One Financial Corp. | | 1 | | |
|
|
|
|
|
| | | | |
|
|
|
|
|
Sector Allocation | | | | |
|
|
|
|
|
| | | | |
Master Large Cap Core Portfolio | | Percent of
Long-Term Investments | |
|
|
|
|
|
Information Technology | | 19 | % | |
Consumer Discretionary | | 18 | | |
Health Care | | 16 | | |
Industrials | | 10 | | |
Energy | | 9 | | |
Financials | | 7 | | |
Utilities | | 7 | | |
Materials | | 5 | | |
Consumer Staples | | 5 | | |
Telecommunication Services | | 4 | | |
|
|
|
|
|
| | | | |
Master Large Cap Growth Portfolio | | Percent of
Long-Term Investments | |
|
|
|
|
|
Information Technology | | 25 | % | |
Consumer Discretionary | | 24 | | |
Health Care | | 16 | | |
Industrials | | 11 | | |
Energy | | 9 | | |
Materials | | 5 | | |
Utilities | | 3 | | |
Telecommunication Services | | 3 | | |
Consumer Staples | | 3 | | |
Financials | | 1 | | |
|
|
|
|
|
| | | | |
Master Large Cap Value Portfolio | | Percent of
Long-Term Investments | |
|
|
|
|
|
Financials | | 17 | % | |
Health Care | | 14 | | |
Industrials | | 12 | | |
Consumer Discretionary | | 11 | | |
Information Technology | | 11 | | |
Utilities | | 11 | | |
Energy | | 7 | | |
Materials | | 7 | | |
Consumer Staples | | 5 | | |
Telecommunication Services | | 5 | | |
|
|
|
|
|
| |
| For Portfolio compliance purposes, sector and industry classifications refer to any one or more of the sector and industry sub-classifications used by one or more widely recognized market indexes or ratings group indexes, and/or as defined by Portfolio management. This definition may not apply for purposes of this report, which may combine sector and industry sub-classifications for reporting ease. |
| | | |
|
|
|
|
| BLACKROCK LARGE CAP SERIES FUNDS, INC. | SEPTEMBER 30, 2010 | 43 |
| |
|
|
| |
Schedule of Investments September 30, 2010 | Master Large Cap Core Portfolio |
| (Percentages shown are based on Net Assets) |
| | | | | | | |
Common Stocks | | Shares | | Value | |
|
|
|
|
|
|
|
|
Consumer Discretionary — 17.6% | | | | | | | |
Auto Components — 1.0% | | | | | | | |
Goodyear Tire & Rubber Co. (a) | | | 3,120,000 | | $ | 33,540,000 | |
|
|
|
|
|
|
|
|
Automobiles — 1.3% | | | | | | | |
Ford Motor Co. (a) | | | 1,180,000 | | | 14,443,200 | |
Harley-Davidson, Inc. (b) | | | 970,000 | | | 27,586,800 | |
| | | | |
|
|
|
| | | | | | 42,030,000 | |
|
|
|
|
|
|
|
|
Household Durables — 0.3% | | | | | | | |
Whirlpool Corp. | | | 130,000 | | | 10,524,800 | |
|
|
|
|
|
|
|
|
Internet & Catalog Retail — 1.1% | | | | | | | |
Liberty Media Holding Corp. — Interactive (a) | | | 2,490,000 | | | 34,137,900 | |
|
|
|
|
|
|
|
|
Media — 4.8% | | | | | | | |
CBS Corp., Class B | | | 650,000 | | | 10,309,000 | |
Comcast Corp., Class A | | | 2,660,000 | | | 48,092,800 | |
Gannett Co., Inc. | | | 640,000 | | | 7,827,200 | |
Interpublic Group of Cos., Inc. (a) | | | 3,340,000 | | | 33,500,200 | |
Liberty Global, Inc. (a)(b) | | | 420,000 | | | 12,940,200 | |
News Corp., Class A | | | 3,070,000 | | | 40,094,200 | |
| | | | |
|
|
|
| | | | | | 152,763,600 | |
|
|
|
|
|
|
|
|
Multiline Retail — 1.9% | | | | | | | |
Big Lots, Inc. (a) | | | 840,000 | | | 27,930,000 | |
Macy’s, Inc. | | | 1,510,000 | | | 34,865,900 | |
| | | | |
|
|
|
| | | | | | 62,795,900 | |
|
|
|
|
|
|
|
|
Specialty Retail — 7.2% | | | | | | | |
Advance Auto Parts, Inc. | | | 560,000 | | | 32,860,800 | |
Gap, Inc. | | | 1,820,000 | | | 33,924,800 | |
Limited Brands, Inc. | | | 1,290,000 | | | 34,546,200 | |
PetSmart, Inc. | | | 930,000 | | | 32,550,000 | |
Ross Stores, Inc. | | | 600,000 | | | 32,772,000 | |
TJX Cos., Inc. | | | 710,000 | | | 31,687,300 | |
Williams-Sonoma, Inc. | | | 990,000 | | | 31,383,000 | |
| | | | |
|
|
|
| | | | | | 229,724,100 | |
|
|
|
|
|
|
|
|
Total Consumer Discretionary | | | | | | 565,516,300 | |
|
|
|
|
|
|
|
|
Consumer Staples — 4.5% | | | | | | | |
Beverages — 1.1% | | | | | | | |
Dr. Pepper Snapple Group, Inc. | | | 970,000 | | | 34,454,400 | |
|
|
|
|
|
|
|
|
Food & Staples Retailing — 0.6% | | | | | | | |
Safeway, Inc. (b) | | | 880,000 | | | 18,620,800 | |
|
|
|
|
|
|
|
|
Food Products — 1.4% | | | | | | | |
ConAgra Foods, Inc. | | | 850,000 | | | 18,649,000 | |
Hershey Co. | | | 510,000 | | | 24,270,900 | |
Tyson Foods, Inc., Class A | | | 200,000 | | | 3,204,000 | |
| | | | |
|
|
|
| | | | | | 46,123,900 | |
|
|
|
|
|
|
|
|
Household Products — 0.5% | | | | | | | |
Procter & Gamble Co. | | | 300,000 | | | 17,991,000 | |
|
|
|
|
|
|
|
|
Personal Products — 0.9% | | | | | | | |
NBTY, Inc. (a) | | | 510,000 | | | 28,039,800 | |
|
|
|
|
|
|
|
|
Total Consumer Staples | | | | | | 145,229,900 | |
|
|
|
|
|
|
|
|
Energy — 9.2% | | | | | | | |
Energy Equipment & Services — 1.7% | | | | | | | |
Exterran Holdings, Inc. (a) | | | 460,000 | | | 10,446,600 | |
McDermott International, Inc. (a) | | | 1,260,000 | | | 18,622,800 | |
Nabors Industries Ltd. (a) | | | 1,030,000 | | | 18,601,800 | |
Oil States International, Inc. (a) | | | 130,000 | | | 6,051,500 | |
| | | | |
|
|
|
| | | | | | 53,722,700 | |
|
|
|
|
|
|
|
|
| | | | | | | |
Common Stocks | | Shares | | Value | |
|
|
|
|
|
|
|
|
Energy (concluded) | | | | | | | |
Oil, Gas & Consumable Fuels — 7.5% | | | | | | | |
Chevron Corp. | | | 170,000 | | $ | 13,778,500 | |
Cimarex Energy Co. | | | 130,000 | | | 8,603,400 | |
Exxon Mobil Corp. | | | 880,000 | | | 54,375,200 | |
Marathon Oil Corp. | | | 1,200,000 | | | 39,720,000 | |
Mariner Energy, Inc. (a) | | | 1,350,000 | | | 32,710,500 | |
SM Energy Co. | | | 490,000 | | | 18,355,400 | |
Sunoco, Inc. | | | 970,000 | | | 35,405,000 | |
Williams Cos., Inc. | | | 1,930,000 | | | 36,882,300 | |
| | | | |
|
|
|
| | | | | | 239,830,300 | |
|
|
|
|
|
|
|
|
Total Energy | | | | | | 293,553,000 | |
|
|
|
|
|
|
|
|
Financials — 7.3% | | | | | | | |
Commercial Banks — 2.3% | | | | | | | |
Fifth Third Bancorp | | | 2,920,000 | | | 35,127,600 | |
Regions Financial Corp. | | | 4,870,000 | | | 35,404,900 | |
Wells Fargo & Co. | | | 140,000 | | | 3,518,200 | |
| | | | |
|
|
|
| | | | | | 74,050,700 | |
|
|
|
|
|
|
|
|
Consumer Finance — 1.2% | | | | | | | |
Capital One Financial Corp. | | | 950,000 | | | 37,572,500 | |
|
|
|
|
|
|
|
|
Diversified Financial Services — 1.5% | | | | | | | |
Bank of America Corp. | | | 610,000 | | | 7,997,100 | |
Citigroup, Inc. (a) | | | 8,170,000 | | | 31,863,000 | |
JPMorgan Chase & Co. | | | 240,000 | | | 9,136,800 | |
| | | | |
|
|
|
| | | | | | 48,996,900 | |
|
|
|
|
|
|
|
|
Insurance — 2.3% | | | | | | | |
Assurant, Inc. | | | 820,000 | | | 33,374,000 | |
Berkshire Hathaway, Inc. (a) | | | 100,000 | | | 8,268,000 | |
Old Republic International Corp. | | | 360,000 | | | 4,986,000 | |
UnumProvident Corp. | | | 1,170,000 | | | 25,915,500 | |
| | | | |
|
|
|
| | | | | | 72,543,500 | |
|
|
|
|
|
|
|
|
Total Financials | | | | | | 233,163,600 | |
|
|
|
|
|
|
|
|
Health Care — 16.0% | | | | | | | |
Biotechnology — 1.4% | | | | | | | |
Amgen, Inc. (a) | | | 830,000 | | | 45,741,300 | |
|
|
|
|
|
|
|
|
Health Care Providers & Services — 9.9% | | | | | | | |
Aetna, Inc. | | | 1,150,000 | | | 36,351,500 | |
AmerisourceBergen Corp. | | | 760,000 | | | 23,301,600 | |
Cardinal Health, Inc. | | | 1,130,000 | | | 37,335,200 | |
Community Health Systems, Inc. (a) | | | 80,000 | | | 2,477,600 | |
Coventry Health Care, Inc. (a) | | | 840,000 | | | 18,085,200 | |
Health Management Associates, Inc., Class A (a) | | | 4,010,000 | | | 30,716,600 | |
Humana, Inc. (a) | | | 680,000 | | | 34,163,200 | |
Lincare Holdings, Inc. | | | 1,290,000 | | | 32,366,100 | |
Tenet Healthcare Corp. (a) | | | 4,510,000 | | | 21,287,200 | |
UnitedHealth Group, Inc. | | | 1,290,000 | | | 45,291,900 | |
WellPoint, Inc. (a) | | | 670,000 | | | 37,948,800 | |
| | | | |
|
|
|
| | | | | | 319,324,900 | |
|
|
|
|
|
|
|
|
Life Sciences Tools & Services — 0.5% | | | | | | | |
Pharmaceutical Product Development, Inc. | | | 590,000 | | | 14,626,100 | |
|
|
|
|
|
|
|
|
Pharmaceuticals — 4.2% | | | | | | | |
Eli Lilly & Co. (b) | | | 1,130,000 | | | 41,278,900 | |
Endo Pharmaceuticals Holdings, Inc. (a) | | | 740,000 | | | 24,597,600 | |
Forest Laboratories, Inc. (a) | | | 440,000 | | | 13,609,200 | |
Johnson & Johnson (b) | | | 640,000 | | | 39,654,400 | |
King Pharmaceuticals, Inc. (a) | | | 860,000 | | | 8,565,600 | |
Pfizer, Inc. | | | 380,000 | | | 6,524,600 | |
| | | | |
|
|
|
| | | | | | 134,230,300 | |
|
|
|
|
|
|
|
|
Total Health Care | | | | | | 513,922,600 | |
|
|
|
|
|
|
|
|
| | |
See Notes to Financial Statements. |
|
|
|
44 | BLACKROCK LARGE CAP SERIES FUNDS, INC. | SEPTEMBER 30, 2010 |
| |
|
|
| |
Schedule of Investments (continued) | Master Large Cap Core Portfolio |
| (Percentages shown are based on Net Assets) |
| | | | | | | |
Common Stocks | | Shares | | Value | |
|
|
|
|
|
|
|
|
Industrials — 10.1% | | | | | | | |
Aerospace & Defense — 2.2% | | | | | | | |
L-3 Communications Holdings, Inc. | | | 480,000 | | $ | 34,689,600 | |
Raytheon Co. | | | 810,000 | | | 37,025,100 | |
| | | | |
|
|
|
| | | | | | 71,714,700 | |
|
|
|
|
|
|
|
|
Airlines — 1.1% | | | | | | | |
Southwest Airlines Co. | | | 2,630,000 | | | 34,374,100 | |
|
|
|
|
|
|
|
|
Building Products — 0.9% | | | | | | | |
Owens Corning, Inc. (a) | | | 1,090,000 | | | 27,936,700 | |
|
|
|
|
|
|
|
|
Commercial Services & Supplies — 0.4% | | | | | | | |
R.R. Donnelley & Sons Co. | | | 810,000 | | | 13,737,600 | |
|
|
|
|
|
|
|
|
Construction & Engineering — 0.7% | | | | | | | |
KBR, Inc. | | | 540,000 | | | 13,305,600 | |
Shaw Group, Inc. (a) | | | 310,000 | | | 10,403,600 | |
| | | | |
|
|
|
| | | | | | 23,709,200 | |
|
|
|
|
|
|
|
|
Electrical Equipment — 0.4% | | | | | | | |
General Cable Corp. (a) | | | 470,000 | | | 12,746,400 | |
|
|
|
|
|
|
|
|
Industrial Conglomerates — 2.1% | | | | | | | |
General Electric Co. | | | 2,120,000 | | | 34,450,000 | |
Textron, Inc. | | | 1,610,000 | | | 33,101,600 | |
| | | | |
|
|
|
| | | | | | 67,551,600 | |
|
|
|
|
|
|
|
|
Machinery — 1.9% | | | | | | | |
Manitowoc Co. | | | 2,740,000 | | | 33,181,400 | |
Oshkosh Corp. (a) | | | 480,000 | | | 13,200,000 | |
Timken Co. | | | 160,000 | | | 6,137,600 | |
Toro Co. | | | 170,000 | | | 9,559,100 | |
| | | | |
|
|
|
| | | | | | 62,078,100 | |
|
|
|
|
|
|
|
|
Road & Rail — 0.4% | | | | | | | |
Ryder System, Inc. | | | 270,000 | | | 11,547,900 | |
|
|
|
|
|
|
|
|
Total Industrials | | | | | | 325,396,300 | |
|
|
|
|
|
|
|
|
Information Technology — 18.9% | | | | | | | |
Communications Equipment — 1.7% | | | | | | | |
Cisco Systems, Inc. (a) | | | 50,000 | | | 1,095,000 | |
Motorola, Inc. (a) | | | 4,540,000 | | | 38,726,200 | |
Tellabs, Inc. | | | 2,040,000 | | | 15,198,000 | |
| | | | |
|
|
|
| | | | | | 55,019,200 | |
|
|
|
|
|
|
|
|
Computers & Peripherals — 6.5% | | | | | | | |
Apple, Inc. (a) | | | 140,000 | | | 39,725,000 | |
Dell, Inc. (a) | | | 3,100,000 | | | 40,176,000 | |
Lexmark International, Inc., Class A (a) | | | 730,000 | | | 32,572,600 | |
SanDisk Corp. (a) | | | 960,000 | | | 35,184,000 | |
Seagate Technology (a) | | | 2,810,000 | | | 33,101,800 | |
Western Digital Corp. (a) | | | 1,000,000 | | | 28,390,000 | |
| | | | |
|
|
|
| | | | | | 209,149,400 | |
|
|
|
|
|
|
|
|
Electronic Equipment, Instruments & Components — 1.3% | | | | | | | |
Corning, Inc. | | | 2,180,000 | | | 39,850,400 | |
|
|
|
|
|
|
|
|
IT Services — 1.7% | | | | | | | |
Gartner, Inc., Class A (a) | | | 160,000 | | | 4,710,400 | |
Hewitt Associates, Inc., Class A (a) | | | 690,000 | | | 34,796,700 | |
International Business Machines Corp. | | | 110,000 | | | 14,755,400 | |
| | | | |
|
|
|
| | | | | | 54,262,500 | |
|
|
|
|
|
|
|
|
Internet Software & Services — 0.5% | | | | | | | |
AOL, Inc. (a) | | | 470,000 | | | 11,632,500 | |
Google, Inc., Class A (a) | | | 10,000 | | | 5,257,900 | |
| | | | |
|
|
|
| | | | | | 16,890,400 | |
|
|
|
|
|
|
|
|
| | | | | | | |
Common Stocks | | Shares | | Value | |
|
|
|
|
|
|
|
|
Information Technology (concluded) | | | | | | | |
Semiconductors & Semiconductor Equipment — 4.3% | | | | | | | |
Altera Corp. | | | 1,180,000 | | $ | 35,588,800 | |
Applied Materials, Inc. | | | 590,000 | | | 6,891,200 | |
Intel Corp. | | | 3,310,000 | | | 63,651,300 | |
National Semiconductor Corp. | | | 2,570,000 | | | 32,818,900 | |
| | | | |
|
|
|
| | | | | | 138,950,200 | |
|
|
|
|
|
|
|
|
Software — 2.9% | | | | | | | |
CA, Inc. | | | 1,680,000 | | | 35,481,600 | |
Microsoft Corp. | | | 870,000 | | | 21,306,300 | |
Symantec Corp. (a) | | | 2,300,000 | | | 34,891,000 | |
| | | | |
|
|
|
| | | | | | 91,678,900 | |
|
|
|
|
|
|
|
|
Total Information Technology | | | | | | 605,801,000 | |
|
|
|
|
|
|
|
|
Materials — 4.8% | | | | | | | |
Chemicals — 2.0% | | | | | | | |
Ashland, Inc. | | | 660,000 | | | 32,188,200 | |
Huntsman Corp. | | | 170,000 | | | 1,965,200 | |
Lubrizol Corp. | | | 290,000 | | | 30,731,300 | |
| | | | |
|
|
|
| | | | | | 64,884,700 | |
|
|
|
|
|
|
|
|
Containers & Packaging — 1.2% | | | | | | | |
Crown Holdings, Inc. (a) | | | 1,140,000 | | | 32,672,400 | |
Sealed Air Corp. | | | 210,000 | | | 4,720,800 | |
| | | | |
|
|
|
| | | | | | 37,393,200 | |
|
|
|
|
|
|
|
|
Paper & Forest Products — 1.6% | | | | | | | |
International Paper Co. | | | 1,490,000 | | | 32,407,500 | |
MeadWestvaco Corp. | | | 840,000 | | | 20,479,200 | |
| | | | |
|
|
|
| | | | | | 52,886,700 | |
|
|
|
|
|
|
|
|
Total Materials | | | | | | 155,164,600 | |
|
|
|
|
|
|
|
|
Telecommunication Services — 4.5% | | | | | | | |
Diversified Telecommunication Services — 2.3% | | | | | | | |
AT&T Inc. | | | 570,000 | | | 16,302,000 | |
Qwest Communications International, Inc. | | | 6,030,000 | | | 37,808,100 | |
TW Telecom, Inc. (a) | | | 940,000 | | | 17,455,800 | |
| | | | |
|
|
|
| | | | | | 71,565,900 | |
|
|
|
|
|
|
|
|
Wireless Telecommunication Services — 2.2% | | | | | | | |
MetroPCS Communications, Inc. (a)(b) | | | 3,170,000 | | | 33,158,200 | |
Sprint Nextel Corp. (a)(b) | | | 8,180,000 | | | 37,873,400 | |
| | | | |
|
|
|
| | | | | | 71,031,600 | |
|
|
|
|
|
|
|
|
Total Telecommunication Services | | | | | | 142,597,500 | |
|
|
|
|
|
|
|
|
Utilities — 7.2% | | | | | | | |
Electric Utilities — 1.1% | | | | | | | |
Edison International | | | 1,000,000 | | | 34,390,000 | |
|
|
|
|
|
|
|
|
Gas Utilities — 0.9% | | | | | | | |
Questar Corp. | | | 1,710,000 | | | 29,976,300 | |
|
|
|
|
|
|
|
|
Independent Power Producers & | | | | | | | |
Energy Traders — 3.1% | | | | | | | |
Calpine Corp. (a) | | | 1,650,000 | | | 20,542,500 | |
Constellation Energy Group, Inc. | | | 1,040,000 | | | 33,529,600 | |
Mirant Corp. (a) | | | 1,120,000 | | | 11,155,200 | |
NRG Energy, Inc. (a) | | | 1,620,000 | | | 33,728,400 | |
| | | | |
|
|
|
| | | | | | 98,955,700 | |
|
|
|
|
|
|
|
|
Multi-Utilities — 2.1% | | | | | | | |
CMS Energy Corp. | | | 1,850,000 | | | 33,337,000 | |
Integrys Energy Group, Inc. | | | 110,000 | | | 5,726,600 | |
NiSource, Inc. | | | 1,670,000 | | | 29,058,000 | |
| | | | |
|
|
|
| | | | | | 68,121,600 | |
|
|
|
|
|
|
|
|
Total Utilities | | | | | | 231,443,600 | |
|
|
|
|
|
|
|
|
Total Long-Term Investments
(Cost — $2,898,171,093) — 100.1% | | | | | | 3,211,788,400 | |
|
|
|
|
|
|
|
|
| | | |
See Notes to Financial Statements. |
|
|
|
|
| BLACKROCK LARGE CAP SERIES FUNDS, INC. | SEPTEMBER 30, 2010 | 45 |
| |
|
|
| |
Schedule of Investments (concluded) | Master Large Cap Core Portfolio |
| (Percentages shown are based on Net Assets) |
| | | | | | | |
Short-Term Securities | | Beneficial
Interest
(000 | ) | | Value | |
|
|
|
|
|
|
|
|
BlackRock Liquidity Series, LLC Money Market Series, 0.36% (c)(d)(e) | | $ | 113,625 | | $ | 113,624,600 | |
|
|
|
|
|
|
|
|
Total Short-Term Securities
(Cost — $113,624,600) — 3.5% | | | | | | 113,624,600 | |
|
|
|
|
|
|
|
|
Total Investments (Cost — $3,011,795,693*) — 103.6% | | | | | | 3,325,413,000 | |
|
Liabilities in Excess of Other Assets — (3.6)% | | | | | | (115,927,179 | ) |
| | | | |
|
|
|
Net Assets — 100.0% | | | | | $ | 3,209,485,821 | |
| | | | |
|
|
|
| |
|
|
* | The cost and unrealized appreciation (depreciation) of investments as of September 30, 2010, as computed for federal income tax purposes, were as follows: |
| | | | |
Aggregate cost | | $ | 3,056,235,489 | |
| |
|
|
|
Gross unrealized appreciation | | $ | 375,640,969 | |
Gross unrealized depreciation | | | (106,463,458 | ) |
| |
|
|
|
Net unrealized appreciation | | $ | 269,177,511 | |
| |
|
|
|
| |
(a) | Non-income producing security. |
| |
(b) | Security, or a portion of security, is on loan. |
| |
(c) | Investments in companies considered to be an affiliate of the Portfolio during the year, for purposes of Section 2(a)(3) of the Investment Company Act of 1940, as amended, were as follows: |
| | | | | | | | | | | | | |
|
|
|
|
|
|
|
|
|
|
Affiliate | | Beneficial
Interest Held at
September 30,
2009 | | Net
Activity | | Beneficial
Interest Held at
September 30,
2010 | | Income | |
|
|
|
|
|
|
|
|
|
|
BlackRock Liquidity Funds, TempFund, Institutional Class | | $ | 31,839,442 | | $ | (31,839,442 | ) | | — | | $ | 725 | |
BlackRock Liquidity Series, LLC Money Market Series | | $ | 129,521,650 | | $ | (15,897,050 | ) | $ | 113,624,600 | | $ | 290,336 | |
|
|
|
|
|
|
|
|
|
|
|
|
|
|
| | |
(d) | Represents the current yield as of report date. |
| |
(e) | Security was purchased with the cash collateral from loaned securities. |
| |
• | For Portfolio compliance purposes, the Portfolio’s sector and industry classifications refer to any one or more of the sector and industry sub-classifications used by one or more widely recognized market indexes or rating group indexes, and/or as defined by Portfolio management. This definition may not apply for purposes of this report, which may combine such sector and industry sub-classifications for reporting ease. |
| |
• | Fair Value Measurements — Various inputs are used in determining the fair value of investments, which are as follows: |
| |
| • | Level 1 — price quotations in active markets/exchanges for identical assets and liabilities |
| | |
| • | Level 2 — other observable inputs (including, but not limited to: quoted prices for similar assets or liabilities in markets that are active, quoted prices for identical or similar assets or liabilities in markets that are not active, inputs other than quoted prices that are observable for the assets or liabilities (such as interest rates, yield curves, volatilities, prepayment speeds, loss severities, credit risks and default rates) or other market-corroborated inputs) |
| | |
| • | Level 3 — unobservable inputs based on the best information available in the circumstances, to the extent observable inputs are not available (including the Portfolio’s own assumptions used in determining the fair value of investments) |
| | |
| The inputs or methodologies used for valuing securities are not necessarily an indication of the risk associated with investing in those securities. For information about the Portfolio’s policy regarding valuation of investments and other significant accounting policies, please refer to Note 1 of the Notes to Financial Statements. |
| |
| The following table summarizes the inputs used as of September 30, 2010 in determining the fair valuation of the Portfolio’s investments: |
| | | | | | | | | | | | | |
|
|
|
|
|
|
|
|
|
|
Valuation Inputs | | Level 1 | | Level 2 | | Level 3 | | Total | |
|
|
|
|
|
|
|
|
|
|
Assets: | | | | | | | | | | | | | |
Investments in Securities: | | | | | | | | | | | | | |
Long-Term Investments1 | | $ | 3,211,788,400 | | | — | | | — | | $ | 3,211,788,400 | |
Short-Term Securities | | | — | | $ | 113,624,600 | | | — | | | 113,624,600 | |
| |
|
|
|
|
|
|
|
|
|
|
|
|
Total | | $ | 3,211,788,400 | | $ | 113,624,600 | | | — | | $ | 3,325,413,000 | |
| |
|
|
|
|
|
|
|
|
|
|
|
|
| | |
| 1 | See above Schedule of Investments for values in each sector and industry. |
| | |
See Notes to Financial Statements. |
|
|
|
46 | BLACKROCK LARGE CAP SERIES FUNDS, INC. | SEPTEMBER 30, 2010 |
| |
|
| |
Schedule of Investments September 30, 2010 | Master Large Cap Growth Portfolio |
| (Percentages shown are based on Net Assets) |
| | | | | | | |
Common Stocks | | Shares | | Value | |
|
|
|
|
|
|
|
|
Consumer Discretionary — 23.5% | | | | | | | |
Auto Components — 1.4% | | | | | | | |
Federal-Mogul Corp., Class A (a) | | | 133,000 | | $ | 2,515,030 | |
The Goodyear Tire & Rubber Co. (a) | | | 653,000 | | | 7,019,750 | |
| | | | |
|
|
|
| | | | | | 9,534,780 | |
|
|
|
|
|
|
|
|
Automobiles — 1.7% | | | | | | | |
Ford Motor Co. (a) | | | 916,000 | | | 11,211,840 | |
|
|
|
|
|
|
|
|
Diversified Consumer Services — 2.2% | | | | | | | |
Career Education Corp. (a) | | | 204,000 | | | 4,379,880 | |
H&R Block, Inc. | | | 540,000 | | | 6,993,000 | |
ITT Educational Services, Inc. (a) | | | 47,000 | | | 3,302,690 | |
| | | | |
|
|
|
| | | | | | 14,675,570 | |
|
|
|
|
|
|
|
|
Hotels, Restaurants & Leisure — 1.3% | | | | | | | |
Starbucks Corp. | | | 151,000 | | | 3,862,580 | |
Wyndham Worldwide Corp. | | | 188,000 | | | 5,164,360 | |
| | | | |
|
|
|
| | | | | | 9,026,940 | |
|
|
|
|
|
|
|
|
Internet & Catalog Retail — 1.0% | | | | | | | |
Expedia, Inc. (b) | | | 233,000 | | | 6,572,930 | |
|
|
|
|
|
|
|
|
Media — 5.3% | | | | | | | |
CBS Corp., Class B | | | 448,000 | | | 7,105,280 | |
DIRECTV, Class A (a) | | | 182,000 | | | 7,576,660 | |
Interpublic Group of Cos., Inc. (a) | | | 759,000 | | | 7,612,770 | |
John Wiley & Sons, Inc., Class A | | | 140,000 | | | 5,720,400 | |
News Corp., Class A | | | 555,000 | | | 7,248,300 | |
| | | | |
|
|
|
| | | | | | 35,263,410 | |
|
|
|
|
|
|
|
|
Multiline Retail — 2.5% | | | | | | | |
Big Lots, Inc. (a) | | | 199,000 | | | 6,616,750 | |
Dollar Tree, Inc. (a) | | | 97,000 | | | 4,729,720 | |
Target Corp. | | | 104,000 | | | 5,557,760 | |
| | | | |
|
|
|
| | | | | | 16,904,230 | |
|
|
|
|
|
|
|
|
Specialty Retail — 8.1% | | | | | | | |
Advance Auto Parts, Inc. | | | 122,000 | | | 7,158,960 | |
Aéropostale, Inc. (a) | | | 114,000 | | | 2,650,500 | |
The Gap, Inc. | | | 384,000 | | | 7,157,760 | |
Limited Brands, Inc. | | | 295,000 | | | 7,900,100 | |
PetSmart, Inc. | | | 198,000 | | | 6,930,000 | |
Ross Stores, Inc. | | | 130,000 | | | 7,100,600 | |
TJX Cos., Inc. | | | 192,000 | | | 8,568,960 | |
Williams-Sonoma, Inc. | | | 228,000 | | | 7,227,600 | |
| | | | |
|
|
|
| | | | | | 54,694,480 | |
|
|
|
|
|
|
|
|
Total Consumer Discretionary | | | | | | 157,884,180 | |
|
|
|
|
|
|
|
|
Consumer Staples — 2.6% | | | | | | | |
Beverages — 1.0% | | | | | | | |
Dr. Pepper Snapple Group, Inc. | | | 194,000 | | | 6,890,880 | |
|
|
|
|
|
|
|
|
Food & Staples Retailing — 0.5% | | | | | | | |
The Kroger Co. | | | 147,000 | | | 3,184,020 | |
|
|
|
|
|
|
|
|
Food Products — 1.1% | | | | | | | |
Hershey Co. | | | 152,000 | | | 7,233,680 | |
|
|
|
|
|
|
|
|
Total Consumer Staples | | | | | | 17,308,580 | |
|
|
|
|
|
|
|
|
Energy — 8.9% | | | | | | | |
Energy Equipment & Services — 2.1% | | | | | | | |
Exterran Holdings, Inc. (a) | | | 306,000 | | | 6,949,260 | |
McDermott International, Inc. (a) | | | 489,000 | | | 7,227,420 | |
| | | | |
|
|
|
| | | | | | 14,176,680 | |
|
|
|
|
|
|
|
|
| | | | | | | |
Common Stocks | | Shares | | Value | |
|
|
|
|
|
|
|
|
Energy (concluded) | | | | | | | |
Oil, Gas & Consumable Fuels — 6.8% | | | | | | | |
Exxon Mobil Corp. | | | 313,000 | | $ | 19,340,270 | |
Marathon Oil Corp. | | | 227,000 | | | 7,513,700 | |
Mariner Energy, Inc. (a) | | | 273,000 | | | 6,614,790 | |
SM Energy Co. | | | 162,000 | | | 6,068,520 | |
Whiting Petroleum Corp. (a) | | | 65,000 | | | 6,208,150 | |
| | | | |
|
|
|
| | | | | | 45,745,430 | |
|
|
|
|
|
|
|
|
Total Energy | | | | | | 59,922,110 | |
|
|
|
|
|
|
|
|
Financials — 1.1% | | | | | | | |
Consumer Finance — 0.9% | | | | | | | |
Capital One Financial Corp. | | | 153,000 | | | 6,051,150 | |
|
|
|
|
|
|
|
|
Insurance — 0.2% | | | | | | | |
Endurance Specialty Holdings Ltd. | | | 39,000 | | | 1,552,200 | |
|
|
|
|
|
|
|
|
Total Financials | | | | | | 7,603,350 | |
|
|
|
|
|
|
|
|
Health Care — 15.7% | | | | | | | |
Health Care Providers & Services — 10.0% | | | | | | | |
Aetna, Inc. | | | 227,000 | | | 7,175,470 | |
Cardinal Health, Inc. | | | 218,000 | | | 7,202,720 | |
Community Health Systems, Inc. (a) | | | 181,000 | | | 5,605,570 | |
Coventry Health Care, Inc. (a) | | | 317,000 | | | 6,825,010 | |
Health Management Associates, Inc., Class A (a) | | | 927,000 | | | 7,100,820 | |
Humana, Inc. (a) | | | 131,000 | | | 6,581,440 | |
Lincare Holdings, Inc. | | | 271,000 | | | 6,799,390 | |
Tenet Healthcare Corp. (a) | | | 1,490,000 | | | 7,032,800 | |
UnitedHealth Group, Inc. | | | 190,000 | | | 6,670,900 | |
WellPoint, Inc. (a) | | | 115,000 | | | 6,513,600 | |
| | | | |
|
|
|
| | | | | | 67,507,720 | |
|
|
|
|
|
|
|
|
Life Sciences Tools & Services — 1.1% | | | | | | | |
Pharmaceutical Product Development, Inc. | | | 288,000 | | | 7,139,520 | |
|
|
|
|
|
|
|
|
Pharmaceuticals — 4.6% | | | | | | | |
Abbott Laboratories | | | 214,000 | | | 11,179,360 | |
Bristol-Myers Squibb Co. | | | 234,000 | | | 6,343,740 | |
Eli Lilly & Co. | | | 210,000 | | | 7,671,300 | |
Endo Pharmaceuticals Holdings, Inc. (a) | | | 172,000 | | | 5,717,280 | |
| | | | |
|
|
|
| | | | | | 30,911,680 | |
|
|
|
|
|
|
|
|
Total Health Care | | | | | | 105,558,920 | |
|
|
|
|
|
|
|
|
Industrials — 11.2% | | | | | | | |
Aerospace & Defense — 0.9% | | | | | | | |
Raytheon Co. | | | 132,000 | | | 6,033,720 | |
|
|
|
|
|
|
|
|
Airlines — 0.5% | | | | | | | |
Southwest Airlines Co. | | | 244,000 | | | 3,189,080 | |
|
|
|
|
|
|
|
|
Building Products — 0.9% | | | | | | | |
Owens Corning, Inc. (a) | | | 227,000 | | | 5,818,010 | |
|
|
|
|
|
|
|
|
Commercial Services & Supplies — 1.0% | | | | | | | |
R.R. Donnelley & Sons Co. | | | 396,000 | | | 6,716,160 | |
|
|
|
|
|
|
|
|
Construction & Engineering — 1.9% | | | | | | | |
KBR, Inc. | | | 282,000 | | | 6,948,480 | |
URS Corp. (a) | | | 143,000 | | | 5,431,140 | |
| | | | |
|
|
|
| | | | | | 12,379,620 | |
|
|
|
|
|
|
|
|
Electrical Equipment — 1.4% | | | | | | | |
General Cable Corp. (a) | | | 112,000 | | | 3,037,440 | |
Thomas & Betts Corp. (a) | | | 159,000 | | | 6,522,180 | |
| | | | |
|
|
|
| | | | | | 9,559,620 | |
|
|
|
|
|
|
|
|
Industrial Conglomerates — 1.0% | | | | | | | |
Textron, Inc. | | | 337,000 | | | 6,928,720 | |
|
|
|
|
|
|
|
|
| | | |
See Notes to Financial Statements. | | |
|
|
|
|
| BLACKROCK LARGE CAP SERIES FUNDS, INC. | SEPTEMBER 30, 2010 | 47 |
| |
|
| |
Schedule of Investments (continued) | Master Large Cap Growth Portfolio |
| (Percentages shown are based on Net Assets) |
| | | | | | | |
Common Stocks | | Shares | | Value | |
|
|
|
|
|
|
|
|
Industrials (concluded) | | | | | | | |
Machinery — 3.4% | | | | | | | |
Manitowoc Co. | | | 672,000 | | $ | 8,137,920 | |
Oshkosh Corp. (a) | | | 216,000 | | | 5,940,000 | |
Timken Co. | | | 52,000 | | | 1,994,720 | |
Toro Co. | | | 120,000 | | | 6,747,600 | |
| | | | |
|
|
|
| | | | | | 22,820,240 | |
|
|
|
|
|
|
|
|
Trading Companies & Distributors — 0.2% | | | | | | | |
WESCO International, Inc. (a) | | | 41,000 | | | 1,610,890 | |
|
|
|
|
|
|
|
|
Total Industrials | | | | | | 75,056,060 | |
|
|
|
|
|
|
|
|
Information Technology — 24.9% | | | | | | | |
Communications Equipment — 0.2% | | | | | | | |
Cisco Systems, Inc. (a) | | | 54,000 | | | 1,182,600 | |
|
|
|
|
|
|
|
|
Computers & Peripherals — 7.0% | | | | | | | |
Apple, Inc. (a) | | | 56,000 | | | 15,890,000 | |
Dell, Inc. (a) | | | 723,000 | | | 9,370,080 | |
SanDisk Corp. (a) | | | 203,000 | | | 7,439,950 | |
Seagate Technology (a) | | | 626,000 | | | 7,374,280 | |
Western Digital Corp. (a) | | | 241,000 | | | 6,841,990 | |
| | | | |
|
|
|
| | | | | | 46,916,300 | |
|
|
|
|
|
|
|
|
Electronic Equipment, Instruments & Components — 1.8% | | | | | | | |
AVX Corp. | | | 346,000 | | | 4,781,720 | |
Corning, Inc. | | | 406,000 | | | 7,421,680 | |
| | | | |
|
|
|
| | | | | | 12,203,400 | |
|
|
|
|
|
|
|
|
IT Services — 4.5% | | | | | | | |
Amdocs Ltd. (a) | | | 240,000 | | | 6,878,400 | |
Gartner, Inc., Class A (a) | | | 239,000 | | | 7,036,160 | |
Hewitt Associates, Inc., Class A (a) | | | 142,000 | | | 7,161,060 | |
International Business Machines Corp. | | | 48,000 | | | 6,438,720 | |
Total System Services, Inc. | | | 163,000 | | | 2,484,120 | |
The Western Union Co. | | | 27,000 | | | 477,090 | |
| | | | |
|
|
|
| | | | | | 30,475,550 | |
|
|
|
|
|
|
|
|
Internet Software & Services — 0.2% | | | | | | | |
Google, Inc., Class A (a) | | | 2,000 | | | 1,051,580 | |
|
|
|
|
|
|
|
|
Machinery — 0.9% | | | | | | | |
CNH Global NV | | | 167,000 | | | 6,118,880 | |
|
|
|
|
|
|
|
|
Semiconductors & Semiconductor Equipment — 5.1% | | | | | | | |
Altera Corp. | | | 251,000 | | | 7,570,160 | |
Intel Corp. | | | 776,000 | | | 14,922,480 | |
Micron Technology, Inc. (a)(b) | | | 664,000 | | | 4,787,440 | |
National Semiconductor Corp. | | | 551,000 | | | 7,036,270 | |
| | | | |
|
|
|
| | | | | | 34,316,350 | |
|
|
|
|
|
|
|
|
Software — 5.2% | | | | | | | |
CA, Inc. | | | 356,000 | | | 7,518,720 | |
Microsoft Corp. | | | 831,000 | | | 20,351,190 | |
Symantec Corp. (a) | | | 460,000 | | | 6,978,200 | |
| | | | |
|
|
|
| | | | | | 34,848,110 | |
|
|
|
|
|
|
|
|
Total Information Technology | | | | | | 167,112,770 | |
|
|
|
|
|
|
|
|
Materials — 4.8% | | | | | | | |
Chemicals — 2.7% | | | | | | | |
Ashland, Inc. | | | 124,000 | | | 6,047,480 | |
Nalco Holding Co. | | | 264,000 | | | 6,655,440 | |
RPM International, Inc. | | | 281,000 | | | 5,597,520 | |
| | | | |
|
|
|
| | | | | | 18,300,440 | |
|
|
|
|
|
|
|
|
| | | | | | | |
Common Stocks | | Shares | | Value | |
|
|
|
|
|
|
|
|
Materials (concluded) | | | | | | | |
Containers & Packaging — 0.6% | | | | | | | |
Crown Holdings, Inc. (a) | | | 140,000 | | $ | 4,012,400 | |
|
|
|
|
|
|
|
|
Metals & Mining — 0.4% | | | | | | | |
Alcoa, Inc. | | | 106,000 | | | 1,283,660 | |
Titanium Metals Corp. (a) | | | 57,000 | | | 1,137,720 | |
| | | | |
|
|
|
| | | | | | 2,421,380 | |
|
|
|
|
|
|
|
|
Paper & Forest Products — 1.1% | | | | | | | |
International Paper Co. | | | 343,000 | | | 7,460,250 | |
|
|
|
|
|
|
|
|
Total Materials | | | | | | 32,194,470 | |
|
|
|
|
|
|
|
|
Telecommunication Services — 2.7% | | | | | | | |
Diversified Telecommunication Services — 1.2% | | | | | | | |
Frontier Communications Corp. | | | 126,000 | | | 1,029,420 | |
TW Telecom, Inc. (a) | | | 373,000 | | | 6,926,610 | |
| | | | |
|
|
|
| | | | | | 7,956,030 | |
|
|
|
|
|
|
|
|
Wireless Telecommunication Services — 1.5% | | | | | | | |
MetroPCS Communications, Inc. (a)(b) | | | 701,000 | | | 7,332,460 | |
NII Holdings, Inc. (a) | | | 78,000 | | | 3,205,800 | |
| | | | |
|
|
|
| | | | | | 10,538,260 | |
|
|
|
|
|
|
|
|
Total Telecommunication Services | | | | | | 18,494,290 | |
|
|
|
|
|
|
|
|
Utilities — 3.5% | | | | | | | |
Electric Utilities — 0.5% | | | | | | | |
NV Energy, Inc. | | | 252,000 | | | 3,313,800 | |
|
|
|
|
|
|
|
|
Independent Power Producers & Energy Traders — 2.0% | | | | | | | |
Calpine Corp. (a) | | | 558,000 | | | 6,947,100 | |
Constellation Energy Group, Inc. | | | 193,000 | | | 6,222,320 | |
| | | | |
|
|
|
| | | | | | 13,169,420 | |
|
|
|
|
|
|
|
|
Multi-Utilities — 1.0% | | | | | | | |
Integrys Energy Group, Inc. (b) | | | 129,000 | | | 6,715,740 | |
|
|
|
|
|
|
|
|
Total Utilities | | | | | | 23,198,960 | |
|
|
|
|
|
|
|
|
Total Long-Term Investments
(Cost — $611,968,870) — 98.9% | | | | | | 664,333,690 | |
|
|
|
|
|
|
|
|
| | | | | | | |
|
| | | | | | | |
Short-Term Securities | | | | | | | |
|
|
|
|
|
|
|
|
BlackRock Liquidity Funds, TempFund,
Institutional Class, 0.23% (c)(d) | | | 346,978 | | | 346,978 | |
|
|
|
|
|
|
|
|
| | | | | | | |
| | Beneficial
Interest
(000) | | | | |
|
|
|
|
|
|
|
|
BlackRock Liquidity Series, LLC
Money Market Series, 0.36% (c)(d)(e) | | $ | 19,524 | | | 19,523,700 | |
|
|
|
|
|
|
|
|
Total Short-Term Securities
(Cost — $19,870,678) — 2.9% | | | | | | 19,870,678 | |
|
|
|
|
|
|
|
|
Total Investments (Cost — $631,839,548*) — 101. 8% | | | | | | 684,204,368 | |
Liabilities in Excess of Other Assets — (1.8)% | | | | | | (12,370,403 | ) |
| | | | |
|
|
|
Net Assets — 100.0% | | | | | $ | 671,833,965 | |
| | | | |
|
|
|
| | |
See Notes to Financial Statements. | |
|
|
|
48 | BLACKROCK LARGE CAP SERIES FUNDS, INC. | SEPTEMBER 30, 2010 |
| |
|
| |
Schedule of Investments (concluded) | Master Large Cap Growth Portfolio |
| |
* | The cost and unrealized appreciation (depreciation) of investments as of September 30, 2010, as computed for federal income tax purposes, were as follows: |
| | | | |
Aggregate cost | | $ | 640,440,810 | |
| |
|
|
|
Gross unrealized appreciation | | $ | 67,345,146 | |
Gross unrealized depreciation | | | (23,581,588 | ) |
| |
|
|
|
Net unrealized appreciation | | $ | 43,763,558 | |
| |
|
|
|
| |
(a) | Non-income producing security. |
| |
(b) | Security, or a portion of security, is on loan. |
| |
(c) | Investments in companies considered to be an affiliate of the Portfolio during the year, for purposes of Section 2(a)(3) of the Investment Company Act of 1940, as amended, were as follows: |
| | | | | | | | | | | | | |
|
|
|
|
|
|
|
|
|
|
Affiliate | | Shares/
Beneficial
Interest Held at
September 30,
2009 | | Net
Activity | | Shares/
Beneficial
Interest Held at
September 30,
2010 | | Income | |
|
|
|
|
|
|
|
|
|
|
BlackRock Liquidity Funds, TempFund, Institutional Class | | | — | | | 346,978 | | | 346,978 | | $ | 286 | |
BlackRock Liquidity Series, LLC Money Market Series | | $ | 15,448,500 | | $ | 4,075,200 | | $ | 19,523,700 | | $ | 35,501 | |
|
|
|
|
|
|
|
|
|
|
| | |
(d) | Represents the current yield as of report date. |
| | |
(e) | Security was purchased with the cash collateral from loaned securities. |
| | |
• | For Portfolio compliance purposes, the Portfolio’s sector and industry classifications refer to any one or more of the sector and industry sub-classifications used by one or more widely recognized market indexes or rating group indexes, and/or as defined by Portfolio management. This definition may not apply for purposes of this report, which may combine such sector and industry sub-classifications for reporting ease. |
| | |
• | Fair Value Measurements — Various inputs are used in determining the fair value of investments, which are as follows: |
| | |
| • | Level 1 — price quotations in active markets/exchanges for identical assets and liabilities |
| | |
| • | Level 2 — other observable inputs (including, but not limited to: quoted prices for similar assets or liabilities in markets that are active, quoted prices for identical or similar assets or liabilities in markets that are not active, inputs other than quoted prices that are observable for the assets or liabilities (such as interest rates, yield curves, volatilities, prepayment speeds, loss severities, credit risks and default rates) or other market-corroborated inputs) |
| | |
| • | Level 3 — unobservable inputs based on the best information available in the circumstances, to the extent observable inputs are not available (including the Portfolio’s own assumptions used in determining the fair value of investments) |
| | |
| The inputs or methodologies used for valuing securities are not necessarily an indication of the risk associated with investing in those securities. For information about the Portfolio’s policy regarding valuation of investments and other significant accounting policies, please refer to Note 1 of the Notes to Financial Statements. |
| | |
| The following table summarizes the inputs used as of September 30, 2010 in determining the fair valuation of the Portfolio’s investments: |
| | | | | | | | | | | | | |
|
|
|
|
|
|
|
|
|
|
Valuation Inputs | | Level 1 | | Level 2 | | Level 3 | | Total | |
|
|
|
|
|
|
|
|
|
|
Assets: | | | | | | | | | | | | | |
Investments in Securities: | | | | | | | | | | | | | |
Long-Term Investments1 | | $ | 664,333,690 | | | — | | | — | | $ | 664,333,690 | |
Short-Term Securities | | | 346,978 | | $ | 19,523,700 | | | — | | | 19,870,678 | |
| |
|
|
|
|
|
|
|
|
|
|
|
|
Total | | $ | 664,680,668 | | $ | 19,523,700 | | | — | | $ | 684,204,368 | |
| |
|
|
|
|
|
|
|
|
|
|
|
|
| | |
| 1 | See above Schedule of Investments for values in each sector and industry. |
| | | |
See Notes to Financial Statements. | | |
|
|
|
|
| BLACKROCK LARGE CAP SERIES FUNDS, INC. | SEPTEMBER 30, 2010 | 49 |
| |
|
| |
Schedule of Investments September 30, 2010 | Master Large Cap Value Portfolio
(Percentages shown are based on Net Assets) |
| | | | | | | |
Common Stocks | | Shares | | Value | |
|
|
|
|
|
|
Consumer Discretionary — 10.9% | | | | | | | |
Internet & Catalog Retail — 0.3% | | | | | | | |
Liberty Media Holding Corp. — Interactive (a) | | | 530,000 | | $ | 7,266,300 | |
|
|
|
|
|
|
|
|
Media — 5.3% | | | | | | | |
CBS Corp., Class B | | | 1,580,000 | | | 25,058,800 | |
Comcast Corp., Class A | | | 1,700,000 | | | 30,736,000 | |
DISH Network Corp. | | | 300,000 | | | 5,748,000 | |
Gannett Co., Inc. | | | 1,800,000 | | | 22,014,000 | |
News Corp., Class A | | | 2,370,000 | | | 30,952,200 | |
| | | | |
|
|
|
| | | | | | 114,509,000 | |
|
|
|
|
|
|
|
|
Multiline Retail — 1.2% | | | | | | | |
Macy’s, Inc. | | | 1,140,000 | | | 26,322,600 | |
|
|
|
|
|
|
|
|
Specialty Retail — 4.1% | | | | | | | |
Foot Locker, Inc. | | | 1,610,000 | | | 23,393,300 | |
GameStop Corp., Class A (a) | | | 310,000 | | | 6,110,100 | |
The Gap, Inc. | | | 1,170,000 | | | 21,808,800 | |
Limited Brands, Inc. | | | 840,000 | | | 22,495,200 | |
Signet Jewelers Ltd. (a) | | | 390,000 | | | 12,378,600 | |
Williams-Sonoma, Inc. | | | 100,000 | | | 3,170,000 | |
| | | | |
|
|
|
| | | | | | 89,356,000 | |
|
|
|
|
|
|
|
|
Total Consumer Discretionary | | | | | | 237,453,900 | |
|
|
|
|
|
|
|
|
Consumer Staples — 5.2% | | | | | | | |
Beverages — 1.1% | | | | | | | |
Dr. Pepper Snapple Group, Inc. | | | 660,000 | | | 23,443,200 | |
|
|
|
|
|
|
|
|
Food & Staples Retailing — 0.5% | | | | | | | |
The Kroger Co. | | | 460,000 | | | 9,963,600 | |
|
|
|
|
|
|
|
|
Food Products — 2.8% | | | | | | | |
ConAgra Foods, Inc. | | | 1,110,000 | | | 24,353,400 | |
Corn Products International, Inc. | | | 250,000 | | | 9,375,000 | |
Del Monte Foods Co. | | | 230,000 | | | 3,015,300 | |
Tyson Foods, Inc., Class A | | | 1,540,000 | | | 24,670,800 | |
| | | | |
|
|
|
| | | | | | 61,414,500 | |
|
|
|
|
|
|
|
|
Household Products — 0.8% | | | | | | | |
The Procter & Gamble Co. | | | 300,000 | | | 17,991,000 | |
|
|
|
|
|
|
|
|
Total Consumer Staples | | | | | | 112,812,300 | |
|
|
|
|
|
|
|
|
Energy — 7.2% | | | | | | | |
Energy Equipment & Services — 1.8% | | | | | | | |
Exterran Holdings, Inc. (a) | | | 690,000 | | | 15,669,900 | |
McDermott International, Inc. (a) | | | 1,600,000 | | | 23,648,000 | |
| | | | |
|
|
|
| | | | | | 39,317,900 | |
|
|
|
|
|
|
|
|
Oil, Gas & Consumable Fuels — 5.4% | | | | | | | |
Chevron Corp. | | | 180,000 | | | 14,589,000 | |
Marathon Oil Corp. | | | 900,000 | | | 29,790,000 | |
Sunoco, Inc. | | | 600,000 | | | 21,900,000 | |
Valero Energy Corp. | | | 1,510,000 | | | 26,440,100 | |
Williams Cos., Inc. | | | 1,270,000 | | | 24,269,700 | |
| | | | |
|
|
|
| | | | | | 116,988,800 | |
|
|
|
|
|
|
|
|
Total Energy | | | | | | 156,306,700 | |
|
|
|
|
|
|
|
|
Financials — 17.3% | | | | | | | |
Commercial Banks — 3.5% | | | | | | | |
Fifth Third Bancorp | | | 2,140,000 | | | 25,744,200 | |
Fulton Financial Corp. | | | 1,650,000 | | | 14,949,000 | |
Regions Financial Corp. | | | 3,700,000 | | | 26,899,000 | |
SunTrust Banks, Inc. | | | 260,000 | | | 6,715,800 | |
Wells Fargo & Co. | | | 80,000 | | | 2,010,400 | |
| | | | |
|
|
|
| | | | | | 76,318,400 | |
|
|
|
|
|
|
|
|
| | | | | | | |
Common Stocks | | Shares | | Value | |
|
|
|
|
|
|
Financials (concluded) | | | | | | | |
Consumer Finance — 2.1% | | | | | | | |
AmeriCredit Corp. (a) | | | 30,000 | | $ | 733,800 | |
Capital One Financial Corp. | | | 740,000 | | | 29,267,000 | |
SLM Corp. (a) | | | 1,290,000 | | | 14,899,500 | |
| | | | |
|
|
|
| | | | | | 44,900,300 | |
|
|
|
|
|
|
|
|
Diversified Financial Services — 6.2% | | | | | | | |
Bank of America Corp. | | | 5,270,000 | | | 69,089,700 | |
Citigroup, Inc. (a) | | | 13,420,000 | | | 52,338,000 | |
JPMorgan Chase & Co. | | | 360,000 | | | 13,705,200 | |
| | | | |
|
|
|
| | | | | | 135,132,900 | |
|
|
|
|
|
|
|
|
Insurance — 5.5% | | | | | | | |
American Financial Group, Inc. | | | 780,000 | | | 23,852,400 | |
Aspen Insurance Holdings Ltd. | | | 690,000 | | | 20,893,200 | |
Assurant, Inc. | | | 600,000 | | | 24,420,000 | |
Berkshire Hathaway, Inc. (a) | | | 130,000 | | | 10,748,400 | |
Protective Life Corp. | | | 210,000 | | | 4,569,600 | |
Prudential Financial, Inc. | | | 110,000 | | | 5,959,800 | |
Unitrin, Inc. | | | 210,000 | | | 5,121,900 | |
UnumProvident Corp. | | | 1,110,000 | | | 24,586,500 | |
| | | | |
|
|
|
| | | | | | 120,151,800 | |
|
|
|
|
|
|
|
|
Total Financials | | | | | | 376,503,400 | |
|
|
|
|
|
|
|
|
Health Care — 13.6% | | | | | | | |
Health Care Providers & Services — 10.1% | | | | | | | |
Aetna, Inc. | | | 910,000 | | | 28,765,100 | |
Cardinal Health, Inc. | | | 790,000 | | | 26,101,600 | |
Cigna Corp. | | | 720,000 | | | 25,761,600 | |
Coventry Health Care, Inc. (a) | | | 1,140,000 | | | 24,544,200 | |
Health Net, Inc. (a) | | | 840,000 | | | 22,839,600 | |
Humana, Inc. (a) | | | 490,000 | | | 24,617,600 | |
UnitedHealth Group, Inc. | | | 1,070,000 | | | 37,567,700 | |
WellPoint, Inc. (a) | | | 510,000 | | | 28,886,400 | |
| | | | |
|
|
|
| | | | | | 219,083,800 | |
|
|
|
|
|
|
|
|
Pharmaceuticals — 3.5% | | | | | | | |
Eli Lilly & Co. (b) | | | 920,000 | | | 33,607,600 | |
Johnson & Johnson | | | 180,000 | | | 11,152,800 | |
King Pharmaceuticals, Inc. (a) | | | 2,450,000 | | | 24,402,000 | |
Pfizer, Inc. | | | 480,000 | | | 8,241,600 | |
| | | | |
|
|
|
| | | | | | 77,404,000 | |
|
|
|
|
|
|
|
|
Total Health Care | | | | | | 296,487,800 | |
|
|
|
|
|
|
|
|
Industrials — 11.7% | | | | | | | |
Aerospace & Defense — 2.4% | | | | | | | |
L-3 Communications Holdings, Inc. | | | 320,000 | | | 23,126,400 | |
Raytheon Co. | | | 640,000 | | | 29,254,400 | |
| | | | |
|
|
|
| | | | | | 52,380,800 | |
|
|
|
|
|
|
|
|
Airlines — 0.7% | | | | | | | |
Southwest Airlines Co. | | | 1,130,000 | | | 14,769,100 | |
|
|
|
|
|
|
|
|
Building Products — 0.8% | | | | | | | |
Owens Corning, Inc. (a) | | | 670,000 | | | 17,172,100 | |
|
|
|
|
|
|
|
|
Commercial Services & Supplies — 0.7% | | | | | | | |
R.R. Donnelley & Sons Co. | | | 900,000 | | | 15,264,000 | |
|
|
|
|
|
|
|
|
Construction & Engineering — 1.1% | | | | | | | |
KBR, Inc. | | | 1,000,000 | | | 24,640,000 | |
|
|
|
|
|
|
|
|
Industrial Conglomerates — 1.3% | | | | | | | |
General Electric Co. | | | 1,780,000 | | | 28,925,000 | |
|
|
|
|
|
|
|
|
| | | |
See Notes to Financial Statements. |
|
50 | BLACKROCK LARGE CAP SERIES FUNDS, INC. | SEPTEMBER 30, 2010 | |
| |
|
|
Schedule of Investments (continued) | Master Large Cap Value Portfolio
(Percentages shown are based on Net Assets) |
| | | | | | | |
Common Stocks | | Shares | | Value | |
|
|
|
|
|
|
Industrials (concluded) | | | | | | | |
Machinery — 3.7% | | | | | | | |
Manitowoc Co. | | | 2,100,000 | | $ | 25,431,000 | |
Oshkosh Corp. (a) | | | 360,000 | | | 9,900,000 | |
Timken Co. | | | 570,000 | | | 21,865,200 | |
Trinity Industries, Inc. (b) | | | 1,010,000 | | | 22,492,700 | |
| | | | |
|
|
|
| | | | | | 79,688,900 | |
|
|
|
|
|
|
|
|
Road & Rail — 1.0% | | | | | | | |
Ryder System, Inc. | | | 510,000 | | | 21,812,700 | |
|
|
|
|
|
|
|
|
Total Industrials | | | | | | 254,652,600 | |
|
|
|
|
|
|
|
|
Information Technology — 11.4% | | | | | | | |
Communications Equipment — 0.5% | | | | | | | |
Motorola, Inc. (a) | | | 1,430,000 | | | 12,197,900 | |
|
|
|
|
|
|
|
|
Computers & Peripherals — 3.1% | | | | | | | |
Lexmark International, Inc., Class A (a) | | | 510,000 | | | 22,756,200 | |
Seagate Technology (a) | | | 1,870,000 | | | 22,028,600 | |
Western Digital Corp. (a) | | | 830,000 | | | 23,563,700 | |
| | | | |
|
|
|
| | | | | | 68,348,500 | |
|
|
|
|
|
|
|
|
Electronic Equipment, Instruments &
Components — 2.5% | | | | | | | |
Corning, Inc. | | | 1,700,000 | | | 31,076,000 | |
Vishay Intertechnology, Inc. (a) | | | 2,410,000 | | | 23,328,800 | |
| | | | |
|
|
|
| | | | | | 54,404,800 | |
|
|
|
|
|
|
|
|
IT Services — 0.5% | | | | | | | |
CoreLogic, Inc. (a) | | | 560,000 | | | 10,729,600 | |
|
|
|
|
|
|
|
|
Internet Software & Services — 1.1% | | | | | | | |
AOL, Inc. (a) | | | 950,000 | | | 23,512,500 | |
|
|
|
|
|
|
|
|
Semiconductors & Semiconductor
Equipment — 2.6% | | | | | | | |
Intel Corp. | | | 1,850,000 | | | 35,575,500 | |
National Semiconductor Corp. | | | 1,590,000 | | | 20,304,300 | |
| | | | |
|
|
|
| | | | | | 55,879,800 | |
|
|
|
|
|
|
|
|
Software — 1.1% | | | | | | | |
CA, Inc. | | | 1,100,000 | | | 23,232,000 | |
|
|
|
|
|
|
|
|
Total Information Technology | | | | | | 248,305,100 | |
|
|
|
|
|
|
|
|
Materials — 7.2% | | | | | | | |
Chemicals — 2.8% | | | | | | | |
Ashland, Inc. | | | 450,000 | | | 21,946,500 | |
Cabot Corp. | | | 410,000 | | | 13,353,700 | |
Cytec Industries, Inc. | | | 400,000 | | | 22,552,000 | |
RPM International, Inc. | | | 160,000 | | | 3,187,200 | |
| | | | |
|
|
|
| | | | | | 61,039,400 | |
|
|
|
|
|
|
|
|
Containers & Packaging — 1.1% | | | | | | | |
Sealed Air Corp. | | | 1,080,000 | | | 24,278,400 | |
|
|
|
|
|
|
|
|
Paper & Forest Products — 3.3% | | | | | | | |
International Paper Co. | | | 1,040,000 | | | 22,620,000 | |
MeadWestvaco Corp. | | | 980,000 | | | 23,892,400 | |
Weyerhaeuser Co. | | | 1,530,000 | | | 24,112,800 | |
| | | | |
|
|
|
| | | | | | 70,625,200 | |
|
|
|
|
|
|
|
|
Total Materials | | | | | | 155,943,000 | |
|
|
|
|
|
|
|
|
| | | | | | | |
Common Stocks | | Shares | | Value | |
|
|
|
|
|
|
Telecommunication Services — 5.4% | | | | | | | |
Diversified Telecommunication Services — 2.5% | | | | | | | |
AT&T Inc. | | | 700,000 | | $ | 20,020,000 | |
Qwest Communications International, Inc. | | | 4,160,000 | | | 26,083,200 | |
Verizon Communications, Inc. | | | 230,000 | | | 7,495,700 | |
| | | | |
|
|
|
| | | | | | 53,598,900 | |
|
|
|
|
|
|
|
|
Wireless Telecommunication Services — 2.9% | | | | | | | |
MetroPCS Communications, Inc. (a) | | | 2,340,000 | | | 24,476,400 | |
Sprint Nextel Corp. (a) | | | 6,320,000 | | | 29,261,600 | |
Telephone & Data Systems, Inc. | | | 290,000 | | | 9,512,000 | |
| | | | |
|
|
|
| | | | | | 63,250,000 | |
|
|
|
|
|
|
|
|
Total Telecommunication Services | | | | | | 116,848,900 | |
|
|
|
|
|
|
|
|
Utilities — 10.7% | | | | | | | |
Electric Utilities — 3.4% | | | | | | | |
Edison International | | | 770,000 | | | 26,480,300 | |
NV Energy, Inc. | | | 1,800,000 | | | 23,670,000 | |
Pepco Holdings, Inc. | | | 1,250,000 | | | 23,250,000 | |
| | | | |
|
|
|
| | | | | | 73,400,300 | |
|
|
|
|
|
|
|
|
Gas Utilities — 1.1% | | | | | | | |
Questar Corp. | | | 1,350,000 | | | 23,665,500 | |
|
|
|
|
|
|
|
|
Independent Power Producers &
Energy Traders — 2.9% | | | | | | | |
Calpine Corp. (a) | | | 340,000 | | | 4,233,000 | |
Constellation Energy Group, Inc. | | | 470,000 | | | 15,152,800 | |
Mirant Corp. (a) | | | 2,080,000 | | | 20,716,800 | |
NRG Energy, Inc. (a) | | | 1,150,000 | | | 23,943,000 | |
| | | | |
|
|
|
| | | | | | 64,045,600 | |
|
|
|
|
|
|
|
|
Multi-Utilities — 3.3% | | | | | | | |
CMS Energy Corp. | | | 1,320,000 | | | 23,786,400 | |
Integrys Energy Group, Inc. | | | 440,000 | | | 22,906,400 | |
NiSource, Inc. | | | 1,390,000 | | | 24,186,000 | |
| | | | |
|
|
|
| | | | | | 70,878,800 | |
|
|
|
|
|
|
|
|
Total Utilities | | | | | | 231,990,200 | |
|
|
|
|
|
|
|
|
Total Long-Term Investments
(Cost — $2,080,553,676) — 100.6% | | | | | | 2,187,303,900 | |
|
|
|
|
|
|
|
|
| | | | | | | |
|
|
|
|
|
|
|
|
|
Short-Term Securities | | | | | | | |
|
|
|
|
|
|
|
|
BlackRock Liquidity Funds, TempFund,
Institutional Class, 0.23% (c)(d) | | | 40 | | | 40 | |
|
|
|
|
|
|
|
|
| | | | | | | |
| | Beneficial
Interest
(000) | | | | |
|
|
|
|
|
|
|
BlackRock Liquidity Series, LLC
Money Market Series, 0.36% (c)(d)(e) | | $ | 36,458 | | | 36,457,500 | |
|
|
|
|
|
|
|
|
Total Short-Term Securities
(Cost — $36,457,540) — 1.7% | | | | | | 36,457,540 | |
|
|
|
|
|
|
|
|
Total Investments (Cost — $2,117,011,216*) — 102.3% | | | | | | 2,223,761,440 | |
Liabilities in Excess of Other Assets — (2.3)% | | | | | | (50,619,279 | ) |
| | | | |
|
|
|
Net Assets — 100.0% | | | | | $ | 2,173,142,161 | |
| | | | |
|
|
|
| |
* | The cost and unrealized appreciation (depreciation) of investments as of September 30, 2010, as computed for federal income tax purposes, were as follows: |
| | | | |
Aggregate cost | | $ | 2,196,940,057 | |
| |
|
|
|
Gross unrealized appreciation | | $ | 150,289,577 | |
Gross unrealized depreciation | | | (123,468,194 | ) |
| |
|
|
|
Net unrealized appreciation | | $ | 26,821,383 | |
| |
|
|
|
| |
(a) | Non-income producing security. |
| |
(b) | Security, or a portion of security, is on loan. |
| | | |
See Notes to Financial Statements. | | |
|
|
|
| BLACKROCK LARGE CAP SERIES FUNDS, INC. | SEPTEMBER 30, 2010 | 51 |
| |
|
| |
Schedule of Investments (concluded) | Master Large Cap Value Portfolio |
| |
(c) | Investments in companies considered to be an affiliate of the Portfolio during the year, for purposes of Section 2(a)(3) of the Investment Company Act of 1940, as amended, were as follows: |
| | | | | | | | | | | | | |
|
|
|
|
|
|
|
|
|
|
|
|
|
|
Affiliate | | Shares/
Beneficial
Interest Held at
September 30,
2009 | | Net
Activity | | Shares/
Beneficial
Interest Held at
September 30,
2010 | | Income | |
|
|
|
|
|
|
|
|
|
|
BlackRock Liquidity Funds, TempFund, Institutional Class | | | — | | | 40 | | | 40 | | $ | 709 | |
BlackRock Liquidity Series, LLC Money Market Series | | $ | 55,738,150 | | $ | (19,280,650 | ) | $ | 36,457,500 | | $ | 93,307 | |
|
|
|
|
|
|
|
|
|
|
|
|
|
|
| | |
(d) | Represents the current yield as of report date. |
| |
(e) | Security was purchased with the cash collateral from loaned securities. |
| |
• | For Portfolio compliance purposes, the Portfolio’s sector and industry classifications refer to any one or more of the sector and industry sub-classifications used by one or more widely recognized market indexes or rating group indexes, and/or as defined by Portfolio management. This definition may not apply for purposes of this report, which may combine such sector and industry sub-classifications for reporting ease. |
| |
• | Fair Value Measurements — Various inputs are used in determining the fair value of investments, which are as follows: |
| |
| • | Level 1 — price quotations in active markets/exchanges for identical assets and liabilities |
| | |
| • | Level 2 — other observable inputs (including, but not limited to: quoted prices for similar assets or liabilities in markets that are active, quoted prices for identical or similar assets or liabilities in markets that are not active, inputs other than quoted prices that are observable for the assets or liabilities (such as interest rates, yield curves, volatilities, prepayment speeds, loss severities, credit risks and default rates) or other market-corroborated inputs) |
| | |
| • | Level 3 — unobservable inputs based on the best information available in the circumstances, to the extent observable inputs are not available (including the Portfolio’s own assumptions used in determining the fair value of investments) |
| | |
| The inputs or methodologies used for valuing securities are not necessarily an indication of the risk associated with investing in those securities. For information about the Portfolio’s policy regarding valuation of investments and other significant accounting policies, please refer to Note 1 of the Notes to Financial Statements. |
| |
| The following table summarizes the inputs used as of September 30, 2010 in determining the fair valuation of the Portfolio’s investments: |
| | | | | | | | | | | | | |
|
|
|
|
|
|
|
|
|
|
Valuation Inputs | | Level 1 | | Level 2 | | Level 3 | | Total | |
|
|
|
|
|
|
|
|
|
|
Assets: | | | | | | | | | | | | | |
Investments in Securities: | | | | | | | | | | | | | |
Long-Term Investments1 | | $ | 2,187,303,900 | | | — | | | — | | $ | 2,187,303,900 | |
Short-Term Securities | | | 40 | | $ | 36,457,500 | | | — | | | 36,457,540 | |
| |
|
|
|
|
|
|
|
|
|
|
|
|
Total | | $ | 2,187,303,940 | | $ | 36,457,500 | | | — | | $ | 2,223,761,440 | |
| |
|
|
|
|
|
|
|
|
|
|
|
|
| | |
| 1 | See above Schedule of Investments for values in each sector and industry. |
| | | |
See Notes to Financial Statements. |
|
52 | BLACKROCK LARGE CAP SERIES FUNDS, INC. | SEPTEMBER 30, 2010 | |
| |
|
|
| |
Statements of Assets and Liabilities | Master Large Cap Series LLC |
| | | | | | | | | | |
September 30, 2010 | | Master Large
Cap Core
Portfolio | | Master Large
Cap Growth
Portfolio | | Master Large
Cap Value
Portfolio | |
|
|
|
|
|
|
|
|
Assets | | | | | | | | | | |
|
|
|
|
|
|
|
|
|
|
|
Investments at value — unaffiliated1,2 | | $ | 3,211,788,400 | | $ | 664,333,690 | | $ | 2,187,303,900 | |
Investments at value — affiliated3 | | | 113,624,600 | | | 19,870,678 | | | 36,457,540 | |
Investments sold receivable | | | 82,079,200 | | | 20,518,327 | | | 68,070,027 | |
Dividends receivable | | | 2,703,500 | | | 524,145 | | | 1,891,650 | |
Securities lending income receivable — affiliated | | | 22,531 | | | 5,558 | | | 10,456 | |
Contributions receivable from investors | | | 105,243 | | | 7,017,770 | | | 110,394 | |
Prepaid expenses | | | 66,802 | | | 15,077 | | | 62,850 | |
| |
|
|
|
|
|
|
|
|
|
Total assets | | | 3,410,390,276 | | | 712,285,245 | | | 2,293,906,817 | |
| |
|
|
|
|
|
|
|
|
|
| | | | | | | | | | |
|
|
|
|
|
|
|
|
|
|
|
Liabilities | | | | | | | | | | |
|
|
|
|
|
|
|
|
|
|
|
Collateral on securities loaned, at value | | | 113,624,600 | | | 19,523,700 | | | 36,457,500 | |
Bank overdraft | | | 7,252,302 | | | — | | | 10,083,253 | |
Investments purchased payable | | | 75,334,661 | | | 20,557,803 | | | 57,171,877 | |
Withdrawals payable to investors | | | 3,132,078 | | | — | | | 15,937,002 | |
Investment advisory fees payable | | | 1,226,585 | | | 265,268 | | | 888,288 | |
Other affiliates payable | | | 17,559 | | | 3,294 | | | 11,091 | |
Directors’ fees payable | | | 1,120 | | | 241 | | | 716 | |
Other accrued expenses payable | | | 314,727 | | | 100,763 | | | 213,616 | |
Other liabilities payable | | | 823 | | | 211 | | | 1,313 | |
| |
|
|
|
|
|
|
|
|
|
Total liabilities | | | 200,904,455 | | | 40,451,280 | | | 120,764,656 | |
| |
|
|
|
|
|
|
|
|
|
Net Assets | | $ | 3,209,485,821 | | $ | 671,833,965 | | $ | 2,173,142,161 | |
| |
|
|
|
|
|
|
|
|
|
| | | | | | | | | | |
|
|
|
|
|
|
|
|
|
|
|
Net Assets Consist of | | | | | | | | | | |
|
|
|
|
|
|
|
|
|
|
|
Investors’ capital | | $ | 2,895,868,514 | | $ | 619,469,145 | | $ | 2,066,391,937 | |
Net unrealized appreciation/depreciation | | | 313,617,307 | | | 52,364,820 | | | 106,750,224 | |
| |
|
|
|
|
|
|
|
|
|
Net Assets | | $ | 3,209,485,821 | | $ | 671,833,965 | | $ | 2,173,142,161 | |
| |
|
|
|
|
|
|
|
|
|
1 Investments at cost — unaffiliated | | $ | 2,898,171,093 | | $ | 611,968,870 | | $ | 2,080,553,676 | |
| |
|
|
|
|
|
|
|
|
|
2 Securities loaned at value | | $ | 110,435,971 | | $ | 18,823,082 | | $ | 35,494,206 | |
| |
|
|
|
|
|
|
|
|
|
3 Investments at cost — affiliated | | $ | 113,624,600 | | $ | 19,870,678 | | $ | 36,457,540 | |
| |
|
|
|
|
|
|
|
|
|
| | | |
See Notes to Financial Statements. | | |
|
|
|
| BLACKROCK LARGE CAP SERIES FUNDS, INC. | SEPTEMBER 30, 2010 | 53 |
| |
|
|
| |
Statements of Operations | Master Large Cap Series LLC |
| | | | | | | | | | |
Year Ended September 30, 2010 | | Master Large
Cap Core
Portfolio | | Master Large
Cap Growth
Portfolio | | Master Large
Cap Value
Portfolio | |
|
|
|
|
|
|
|
|
Investment Income | | | | | | | | | | |
|
|
|
|
|
|
|
|
|
|
|
Dividends | | $ | 60,064,671 | | $ | 9,044,459 | | $ | 45,941,317 | |
Securities lending — affiliated | | | 290,336 | | | 35,501 | | | 93,307 | |
Dividends — affiliated | | | 725 | | | 286 | | | 709 | |
Interest | | | 216,095 | | | 41,481 | | | 69 | |
| |
|
|
|
|
|
|
|
|
|
Total income | | | 60,571,827 | | | 9,121,727 | | | 46,035,402 | |
| |
|
|
|
|
|
|
|
|
|
| | | | | | | | | | |
|
|
|
|
|
|
|
|
|
|
|
Expenses | | | | | | | | | | |
|
|
|
|
|
|
|
|
|
|
|
Investment advisory | | | 17,455,621 | | | 3,530,677 | | | 12,190,974 | |
Accounting services | | | 632,953 | | | 251,669 | | | 491,843 | |
Custodian | | | 204,504 | | | 66,014 | | | 167,687 | |
Professional | | | 112,384 | | | 61,536 | | | 58,720 | |
Directors | | | 81,023 | | | 19,861 | | | 53,956 | |
Printing | | | 7,017 | | | 1,353 | | | 4,265 | |
Miscellaneous | | | 81,961 | | | 20,307 | | | 63,747 | |
| |
|
|
|
|
|
|
|
|
|
Total expenses | | | 18,575,463 | | | 3,951,417 | | | 13,031,192 | |
Less fees waived by advisor | | | (599 | ) | | (99 | ) | | (184 | ) |
| |
|
|
|
|
|
|
|
|
|
Total expenses after fees waived | | | 18,574,864 | | | 3,951,318 | | | 13,031,008 | |
| |
|
|
|
|
|
|
|
|
|
Net investment income | | | 41,996,963 | | | 5,170,409 | | | 33,004,394 | |
| |
|
|
|
|
|
|
|
|
|
| | | | | | | | | | |
|
|
|
|
|
|
|
|
|
|
|
Realized and Unrealized Gain (Loss) | | | | | | | | | | |
|
|
|
|
|
|
|
|
|
|
|
Net realized gain from: | | | | | | | | | | |
Investments | | | 407,516,634 | | | 102,377,389 | | | 367,217,114 | |
Payment by affiliate | | | 2,278,260 | | | 68,976 | | | — | |
| |
|
|
|
|
|
|
|
|
|
| | | 409,794,894 | | | 102,446,365 | | | 367,217,114 | |
| |
|
|
|
|
|
|
|
|
|
Net change in unrealized appreciation/depreciation on investments | | | (226,914,201 | ) | | (55,277,639 | ) | | (289,936,488 | ) |
| |
|
|
|
|
|
|
|
|
|
Total realized and unrealized gain | | | 182,880,693 | | | 47,168,726 | | | 77,280,626 | |
| |
|
|
|
|
|
|
|
|
|
Net Increase in Net Assets Resulting from Operations | | $ | 224,877,656 | | $ | 52,339,135 | | $ | 110,285,020 | |
| |
|
|
|
|
|
|
|
|
|
| | |
See Notes to Financial Statements. |
|
|
|
54 | BLACKROCK LARGE CAP SERIES FUNDS, INC. | SEPTEMBER 30, 2010 |
| |
|
|
| |
Statements of Changes in Net Assets | Master Large Cap Series LLC |
| | | | | | | | | | | | | | | | | | | |
| | Master Large Cap Core Portfolio | | Master Large Cap Growth Portfolio | |
| |
| |
|
|
Increase (Decrease) in Net Assets: | | Year Ended
September 30,
2010 | | Period
November 1,
2008 to
September 30,
2009 | | Year Ended
October 31,
2008 | | Year Ended
September 30,
2010 | | Period
November 1,
2008 to
September 30,
2009 | | Year Ended
October 31,
2008 | |
|
|
|
|
|
|
|
|
|
|
|
|
|
|
Operations | | | | | | | | | | | | | | | | | | | |
|
|
|
|
|
|
|
|
|
|
|
|
|
|
|
|
|
|
|
|
Net investment income | | $ | 41,996,963 | | $ | 45,398,506 | | $ | 41,118,548 | | $ | 5,170,409 | | $ | 4,690,392 | | $ | 5,455,044 | |
Net realized gain (loss) | | | 409,794,894 | | | (778,429,718 | ) | | (521,502,159 | ) | | 102,446,365 | | | (130,730,353 | ) | | (114,597,872 | ) |
Net change in unrealized appreciation/depreciation | | | (226,914,201 | ) | | 1,174,704,782 | | | (1,536,726,590 | ) | | (55,277,639 | ) | | 248,627,811 | | | (333,142,941 | ) |
| |
|
|
|
|
|
|
|
| |
|
|
|
|
|
|
|
|
|
Net increase (decrease) in net assets resulting from operations | | | 224,877,656 | | | 441,673,570 | | | (2,017,110,201 | ) | | 52,339,135 | | | 122,587,850 | | | (442,285,769 | ) |
| |
|
|
|
|
|
|
|
| |
|
|
|
|
|
|
|
|
|
| | | | | | | | | | | | | | | | | | | |
|
|
|
|
|
|
|
|
|
|
|
|
|
|
|
|
|
|
|
|
Capital Transactions | | | | | | | | | | | | | | | | | | | |
|
|
|
|
|
|
|
|
|
|
|
|
|
|
|
|
|
|
|
|
Proceeds from contributions | | | 390,820,213 | | | 1,506,405,011 | | | 986,366,566 | | | 145,816,428 | | | 215,325,909 | | | 469,632,427 | |
Value of withdrawals | | | (1,352,534,366 | ) | | (845,271,038 | ) | | (1,775,472,579 | ) | | (260,209,274 | ) | | (269,988,785 | ) | | (595,379,184 | ) |
| |
|
|
|
|
|
|
|
| |
|
|
|
|
|
|
|
|
|
Net increase (decrease) in net assets derived from capital transactions | | | (961,714,153 | ) | | 661,133,973 | | | (789,106,013 | ) | | (114,392,846 | ) | | (54,662,876 | ) | | (125,746,757 | ) |
| |
|
|
|
|
|
|
|
| |
|
|
|
|
|
|
|
|
|
| | | | | | | | | | | | | | | | | | | |
|
|
|
|
|
|
|
|
|
|
|
|
|
|
|
|
|
|
|
|
Net Assets | | | | | | | | | | | | | | | | | | | |
|
|
|
|
|
|
|
|
|
|
|
|
|
|
|
|
|
|
|
|
Total increase (decrease) in net assets | | | (736,836,497 | ) | | 1,102,807,543 | | | (2,806,216,214 | ) | | (62,053,711 | ) | | 67,924,974 | | | (568,032,526 | ) |
Beginning of period | | | 3,946,322,318 | | | 2,843,514,775 | | | 5,649,730,989 | | | 733,887,676 | | | 665,962,702 | | | 1,233,995,228 | |
| |
|
|
|
|
|
|
|
| |
|
|
|
|
|
|
|
|
|
End of period | | $ | 3,209,485,821 | | $ | 3,946,322,318 | | $ | 2,843,514,775 | | $ | 671,833,965 | | $ | 733,887,676 | | $ | 665,962,702 | |
| |
|
|
|
|
|
|
|
| |
|
|
|
|
|
|
|
|
|
Master Large Cap Series LLC
| | | | | | | | | | |
| | Master Large Cap Value Portfolio | |
| |
|
|
|
|
|
|
Increase (Decrease) in Net Assets: | | Year Ended
September 30,
2010 | | Period
November 1,
2008 to
September 30,
2009 | | Year Ended
October 31,
2008 | |
|
|
|
|
|
|
|
|
Operations | | | | | | | | | | |
|
|
|
|
|
|
|
|
|
|
|
Net investment income | | $ | 33,004,394 | | $ | 44,699,454 | | $ | 56,250,234 | |
Net realized gain (loss) | | | 367,217,114 | | | (907,436,935 | ) | | (586,455,313 | ) |
Net change in unrealized appreciation/depreciation | | | (289,936,488 | ) | | 1,046,928,266 | | | (1,366,434,994 | ) |
| |
|
|
|
|
|
|
|
|
|
Net increase (decrease) in net assets resulting from operations | | | 110,285,020 | | | 184,190,785 | | | (1,896,640,073 | ) |
| |
|
|
|
|
|
|
|
|
|
| | | | | | | | | | |
|
|
|
|
|
|
|
|
|
|
|
Capital Transactions | | | | | | | | | | |
|
|
|
|
|
|
|
|
|
|
|
Proceeds from contributions | | | 567,720,441 | | | 812,993,042 | | | 1,889,127,025 | |
Value of withdrawals | | | (1,150,721,411 | ) | | (1,414,441,343 | ) | | (2,321,525,876 | ) |
| |
|
|
|
|
|
|
|
|
|
Net decrease in net assets derived from capital transactions | | | (583,000,970 | ) | | (601,448,301 | ) | | (432,398,851 | ) |
| |
|
|
|
|
|
|
|
|
|
| | | | | | | | | | |
|
|
|
|
|
|
|
|
|
|
|
Net Assets | | | | | | | | | | |
|
|
|
|
|
|
|
|
|
|
|
Total decrease in net assets | | | (472,715,950 | ) | | (417,257,516 | ) | | (2,329,038,924 | ) |
Beginning of period | | | 2,645,858,111 | | | 3,063,115,627 | | | 5,392,154,551 | |
| |
|
|
|
|
|
|
|
|
|
End of period | | $ | 2,173,142,161 | | $ | 2,645,858,111 | | $ | 3,063,115,627 | |
| |
|
|
|
|
|
|
|
|
|
| | | |
See Notes to Financial Statements. | | |
|
|
|
|
| BLACKROCK LARGE CAP SERIES FUNDS, INC. | SEPTEMBER 30, 2010 | 55 |
| |
|
| |
Financial Highlights | Master Large Cap Series LLC |
| | | | | | | | | | | | | | | | | | | |
| | | Master Large Cap Core Portfolio | |
| | |
|
|
| | | | Period
November 1,
2008 to
September 30,
2009 | | | | | | | | | |
| | Year
Ended
September 30,
2010 | | | | | | | | | | |
| | | | Year Ended October 31, | |
| | | |
|
|
| | | | 2008 | | 2007 | | 2006 | | 2005 | |
|
|
|
|
|
|
|
|
|
|
|
|
|
|
|
|
|
|
|
|
Total Investment Return | | | | | | | | | | | | | | | | | | | |
|
|
|
|
|
|
|
|
|
|
|
|
|
|
|
|
|
|
|
|
Total investment return | | | 6.16 | % | | 12.63 | %1,2 | | (38.84 | )% | | 13.94 | % | | 17.32 | % | | 18.35 | % |
| |
|
|
|
|
|
|
|
|
|
|
|
|
|
|
|
|
|
|
| | | | | | | | | | | | | | | | | | | |
|
|
|
|
|
|
|
|
|
|
|
|
|
|
|
|
|
|
|
|
Ratios to Average Net Assets | | | | | | | | | | | | | | | | | | | |
|
|
|
|
|
|
|
|
|
|
|
|
|
|
|
|
|
|
|
|
Total expenses | | | 0.49 | % | | 0.50 | %3 | | 0.50 | % | | 0.49 | % | | 0.49 | % | | 0.51 | % |
| |
|
|
|
|
|
|
|
|
|
|
|
|
|
|
|
|
|
|
Total expenses after fees waived | | | 0.49 | % | | 0.50 | %3 | | 0.50 | % | | 0.49 | % | | 0.49 | % | | 0.51 | % |
| |
|
|
|
|
|
|
|
|
|
|
|
|
|
|
|
|
|
|
Net investment income | | | 1.11 | % | | 1.56 | %3 | | 0.93 | % | | 0.63 | % | | 0.58 | % | | 0.72 | % |
| |
|
|
|
|
|
|
|
|
|
|
|
|
|
|
|
|
|
|
|
|
|
|
|
|
|
|
|
|
|
|
|
|
|
|
|
|
|
|
|
Supplemental Data | | | | | | | | | | | | | | | | | | | |
|
|
|
|
|
|
|
|
|
|
|
|
|
|
|
|
|
|
|
|
Net assets, end of period (000) | | $ | 3,209,486 | | $ | 3,946,322 | | $ | 2,843,515 | | $ | 5,649,731 | | $ | 3,876,639 | | $ | 2,666,699 | |
| |
|
|
|
|
|
|
|
|
|
|
|
|
|
|
|
|
|
|
Portfolio turnover | | | 173 | % | | 168 | % | | 109 | % | | 96 | % | | 88 | % | | 94 | % |
| |
|
|
|
|
|
|
|
|
|
|
|
|
|
|
|
|
|
|
| | | | | | | | | | | | | | | | | | | |
| | | Master Large Cap Growth Portfolio | |
| | |
| |
| | Year
Ended
September 30,
2010 | | Period
November 1,
2008 to
September 30,
2009 | | | | | | | | | |
| | | | | | | | | | | |
| | | | Year Ended October 31, | |
| | | |
| |
| | | | 2008 | | 2007 | | 2006 | | 2005 | |
|
|
|
|
|
|
|
|
|
|
|
|
|
|
|
|
|
|
|
|
Total Investment Return | | | | | | | | | | | | | | | | | | | |
|
|
|
|
|
|
|
|
|
|
|
|
|
|
|
|
|
|
|
|
Total investment return | | | 7.68 | % | | 20.49 | %1,4 | | (37.96 | )% | | 17.47 | % | | 14.05 | % | | 12.47 | % |
| |
|
|
|
|
|
|
|
|
|
|
|
|
|
|
|
|
|
|
|
|
|
|
|
|
|
|
|
|
|
|
|
|
|
|
|
|
|
|
|
Ratios to Average Net Assets | | | | | | | | | | | | | | | | | | | |
|
|
|
|
|
|
|
|
|
|
|
|
|
|
|
|
|
|
|
|
Total expenses | | | 0.56 | % | | 0.57 | %3 | | 0.56 | % | | 0.56 | % | | 0.56 | % | | 0.57 | % |
| |
|
|
|
|
|
|
|
|
|
|
|
|
|
|
|
|
|
|
Total expenses after fees waived | | | 0.56 | % | | 0.57 | %3 | | 0.56 | % | | 0.56 | % | | 0.56 | % | | 0.57 | % |
| |
|
|
|
|
|
|
|
|
|
|
|
|
|
|
|
|
|
|
Net investment income | | | 0.73 | % | | 0.81 | %3 | | 0.54 | % | | 0.25 | % | | 0.26 | % | | 0.33 | % |
| |
|
|
|
|
|
|
|
|
|
|
|
|
|
|
|
|
|
|
|
|
|
|
|
|
|
|
|
|
|
|
|
|
|
|
|
|
|
|
|
Supplemental Data | | | | | | | | | | | | | | | | | | | |
|
|
|
|
|
|
|
|
|
|
|
|
|
|
|
|
|
|
|
|
Net assets, end of period (000) | | $ | 671,834 | | $ | 733,888 | | $ | 665,963 | | $ | 1,233,995 | | $ | 785,377 | | $ | 489,398 | |
| |
|
|
|
|
|
|
|
|
|
|
|
|
|
|
|
|
|
|
Portfolio turnover | | | 232 | % | | 242 | % | | 144 | % | | 87 | % | | 117 | % | | 132 | % |
| |
|
|
|
|
|
|
|
|
|
|
|
|
|
|
|
|
|
|
| | |
| 1 | Aggregate total investment return. |
| | |
| 2 | Includes proceeds received from a settlement of litigation, which impacted the Portfolio’s total investment return. Not including these proceeds, the Portfolio’s total investment return would have been 12.39%. |
| | |
| 3 | Annualized. |
| | |
| 4 | Includes proceeds received from a settlement of litigation, which impacted the Portfolio’s total investment return. Not including these proceeds, the Portfolio’s total investment return would have been 20.23%. |
| | |
See Notes to Financial Statements. | |
|
56 | BLACKROCK LARGE CAP SERIES FUNDS, INC. | SEPTEMBER 30, 2010 |
| |
|
| |
Financial Highlights (concluded) | Master Large Cap Series LLC |
| | | | | | | | | | | | | | | | | | | |
| | | Master Large Cap Value Portfolio | |
| |
| |
| | Year
Ended
September 30,
2010 | | Period
November 1,
2008 to
September 30,
2009 | | | | | | | | | |
| | | | | | | | | | | |
| | | | Year Ended October 31, | |
| | | |
| |
| | | | 2008 | | 2007 | | 2006 | | 2005 | |
|
|
|
|
|
|
|
|
|
|
|
|
|
|
|
|
|
|
|
|
Total Investment Return | | | | | | | | | | | | | | | | | | | |
|
|
|
|
|
|
|
|
|
|
|
|
|
|
|
|
|
|
|
|
Total investment return | | | 4.36 | % | | 9.03 | %1,2 | | (36.54 | )% | | 12.72 | % | | 18.48 | % | | 21.93 | % |
| |
|
|
|
|
|
|
|
|
|
|
|
|
|
|
|
|
|
|
|
|
|
|
|
|
|
|
|
|
|
|
|
|
|
|
|
|
|
|
|
Ratios to Average Net Assets | | | | | | | | | | | | | | | | | | | |
|
|
|
|
|
|
|
|
|
|
|
|
|
|
|
|
|
|
|
|
Total expenses | | | 0.53 | % | | 0.54 | %3 | | 0.51 | % | | 0.51 | % | | 0.53 | % | | 0.55 | % |
| |
|
|
|
|
|
|
|
|
|
|
|
|
|
|
|
|
|
|
Total expenses after fees waived | | | 0.53 | % | | 0.54 | %3 | | 0.51 | % | | 0.51 | % | | 0.53 | % | | 0.55 | % |
| |
|
|
|
|
|
|
|
|
|
|
|
|
|
|
|
|
|
|
Net investment income | | | 1.35 | % | | 1.88 | %3 | | 1.22 | % | | 0.95 | % | | 0.73 | % | | 0.80 | % |
| |
|
|
|
|
|
|
|
|
|
|
|
|
|
|
|
|
|
|
| | | | | | | | | | | | | | | | | | | |
|
|
|
|
|
|
|
|
|
|
|
|
|
|
|
|
|
|
|
|
Supplemental Data | | | | | | | | | | | | | | | | | | | |
|
|
|
|
|
|
|
|
|
|
|
|
|
|
|
|
|
|
|
|
Net assets, end of period (000) | | $ | 2,173,142 | | $ | 2,645,858 | | $ | 3,063,116 | | $ | 5,392,155 | | $ | 3,927,926 | | $ | 1,535,988 | |
| |
|
|
|
|
|
|
|
|
|
|
|
|
|
|
|
|
|
|
Portfolio turnover | | | 183 | % | | 151 | % | | 108 | % | | 72 | % | | 71 | % | | 95 | % |
| |
|
|
|
|
|
|
|
|
|
|
|
|
|
|
|
|
|
|
| | |
| 1 | Aggregate total investment return. |
| | |
| 2 | Includes proceeds received from a settlement of litigation, which impacted the Portfolio’s total investment return. Not including these proceeds, the Portfolio’s total investment return would have been 8.61%. |
| | |
| 3 | Annualized. |
| | | |
See Notes to Financial Statements. | | |
|
| BLACKROCK LARGE CAP SERIES FUNDS, INC. | SEPTEMBER 30, 2010 | 57 |
| |
|
|
Notes to Financial Statements | Master Large Cap Series LLC |
1. Organization and Significant Accounting Policies:
Master Large Cap Core Portfolio, Master Large Cap Growth Portfolio and Master Large Cap Value Portfolio (collectively the “Portfolios” or individually a “Portfolio”) constitute the Master Large Cap Series LLC (collectively, the “Master LLC”). The Master LLC is registered under the Investment Company Act of 1940, as amended (the “1940 Act”), as a diversified open-end management investment company and is organized as a Delaware limited liability company. The Limited Liability Company Agreement permits the Board of Directors (the “Board”) to issue non-transferable interests in the Master LLC, subject to certain limitations. The Master LLC’s financial statements are prepared in conformity with accounting principles generally accepted in the United States of America, which may require management to make estimates and assumptions that affect the reported amounts and disclosures in the financial statements. Actual results could differ from those estimates.
The following is a summary of significant accounting policies followed by the Master LLC:
Reorganization:
Master Large Cap Core Portfolio
On November 14, 2008, an investor of the Portfolio acquired all of the assets and certain stated liabilities of PNC Growth & Income Fund (the “PNC Fund”), a series of PNC Funds, Inc. The reorganization was pursuant to an Agreement and Plan of Reorganization, which was approved by the shareholders of the PNC Fund on October 31, 2008. As a result of the reorganization, which included $59,817,678 of net unrealized depreciation, the Portfolio received an in-kind contribution of portfolio securities.
Valuation: The Portfolios’ policy is to fair value their financial instruments at market value using independent dealers or pricing services under policies approved by the Board. Equity investments traded on a recognized securities exchange or the NASDAQ Global Market System are valued at the last reported sale price that day or the NASDAQ official closing price, if applicable. For equity investments traded on more than one exchange, the last reported sale price on the exchange where the stock is primarily traded is used. Equity investments traded on a recognized exchange for which there were no sales on that day are valued at the last available bid price. If no bid price is available, the prior day’s price will be used, unless it is determined that such prior day’s price no longer reflects the fair value of the security. Investments in open-end investment companies are valued at net asset value each business day. Short-term securities with remaining maturities of 60 days or less may be valued at amortized cost, which approximates fair value.
The Portfolios value their investments in BlackRock Liquidity Series, LLC Money Market Series (the “Money Market Series”), at fair value, which is ordinarily based upon their pro rata ownership in the net assets of the underlying fund. The Money Market Series seeks current income consistent with maintaining liquidity and preserving capital. Although the Money Market Series is not registered under the 1940 Act, its investments will follow the parameters of investments by a money market fund that is subject to Rule 2a-7 promulgated by the Securities and Exchange Commission (“SEC”) under the 1940 Act. The Portfolios may withdraw up to 25% of their investment daily, although the manager of the Money Market Series, in its sole discretion, may permit an investor to withdraw more than 25% on any one day.
In the event that application of these methods of valuation results in a price for an investment which is deemed not to be representative of the market value of such investment or is not available, the investment will be valued in accordance with a policy approved by the Board as reflecting fair value (“Fair Value Assets”). When determining the price for Fair Value Assets, the investment advisor and/or the sub-advisor seeks to determine the price that the Portfolio might reasonably expect to receive from the current sale of that asset in an arm’s-length transaction. Fair value determinations shall be based upon all available factors that the investment advisor and/or sub-advisor deems relevant. The pricing of all Fair Value Assets is subsequently reported to the Board or a committee thereof.
Investment Transactions and Investment Income: For financial reporting purposes, investment transactions are recorded on the dates the transactions are entered into (the trade dates). Realized gains and losses on investment transactions are determined on the identified cost basis. Dividend income is recorded on the ex-dividend dates. Dividends from foreign securities where the ex-dividend date may have passed are subsequently recorded when the Portfolios have determined the ex-dividend date. Upon notification from issuers, some of the dividend income received from a real estate investment trust may be redesignated as a reduction of cost of the related investment and/or realized gain. Interest income is recognized on the accrual basis.
Securities Lending: The Portfolios may lend securities to financial institutions that provide cash as collateral, which will be maintained at all times in an amount equal to at least 100% of the current market value of the loaned securities. The market value of the loaned securities is determined at the close of business of the Portfolios and any additional required collateral is delivered to the Portfolios on the next business day. Securities lending income, as disclosed in the Statements of Operations, represents the income earned from the investment of the cash collateral, net of rebates paid to, or fees paid by, borrowers and less the fees paid to the securities lending agent. During the term of the loan, the Portfolios are entitled to dividend and interest payments on the securities loaned. Loans of securities are terminable at any time and the borrower, after notice, is required to return borrowed securities within the standard time period for settlement of securities transactions. In the event that the borrower defaults on its obligation to return borrowed securities because of insolvency or for any other reason, the Portfolios could experience delays and costs in gaining access to the collateral. The Portfolios also could suffer a loss if the value of an investment purchased with cash collateral falls below the market value of loaned securities or if the value of an investment purchased with cash collateral falls below the value of the original cash collateral received.
Income Taxes: Each Portfolio is classified as a partnership for federal income tax purposes. As such, each investor in the Portfolio is treated as owner of its proportionate share of the net assets, income, expenses and realized and unrealized gains and losses of the Portfolio. Therefore, no federal income tax provision is required. It is intended that the Portfolios’ assets will be managed so an investor in the Portfolio can satisfy the requirements of Sub-chapter M of the Internal Revenue Code of 1986, as amended.
Other: Expenses directly related to one of the Portfolios are charged to that Portfolio. Other operating expenses shared by several funds are pro rated among those funds on the basis of relative net assets or other appropriate
| | |
|
|
|
58 | BLACKROCK LARGE CAP SERIES FUNDS, INC. | SEPTEMBER 30, 2010 |
| |
|
|
Notes to Financial Statements (continued) | Master Large Cap Series LLC |
methods. Each Portfolio has an arrangement with the custodian whereby fees may be reduced by credits earned on uninvested cash balances, which if applicable are shown as fees paid indirectly in the Statements of Operations. The custodian imposes fees on overdrawn cash balances, which can be offset by accumulated credits earned or may result in additional custody charges.
2. Investment Advisory Agreement and Other Transactions with Affiliates:
The PNC Financial Services Group, Inc. (“PNC”), Bank of America Corporation (“BAC”) and Barclays Bank PLC (“Barclays”) are the largest stockholders of BlackRock, Inc. (“BlackRock”). Due to the ownership structure, PNC is an affiliate of the Portfolios for 1940 Act purposes, but BAC and Barclays are not.
The Master LLC, on behalf of each Portfolio, entered into an Investment Advisory Agreement with BlackRock Advisors, LLC (the “Manager”), the Portfolios’ investment advisor, an indirect, wholly owned subsidiary of BlackRock, to provide investment advisory and administration services.
The Manager is responsible for the management of each Portfolio and provides the necessary personnel, facilities, equipment and certain other services necessary to the operations of each Portfolio. For such services, each Portfolio pays the Manager a monthly fee at the following annual rates of each Portfolio’s average daily net assets:
| | | |
Master Large Cap Core Portfolio | | | |
|
Portion of Average Daily Value of Net Assets | | Rate | |
|
Not exceeding $1 billion | | 0.50 | % |
In excess of $1 billion, but not exceeding $5 billion | | 0.45 | % |
In excess of $5 billion | | 0.40 | % |
|
| | | |
Master Large Cap Growth Portfolio | | | |
|
Portion of Average Daily Value of Net Assets | | Rate | |
|
Not exceeding $5 billion | | 0.50 | % |
In excess of $5 billion | | 0.45 | % |
|
| | | |
Master Large Cap Value Portfolio | | | |
|
Portion of Average Daily Value of Net Assets | | Rate | |
|
Not exceeding $3 billion | | 0.50 | % |
In excess of $3 billion | | 0.45 | % |
|
The Manager voluntarily agreed to waive its investment advisory fees by the amount of investment advisory fees each Portfolio pays to the Manager indirectly through its investment in affiliated money market funds, however, the Manager does not waive its investment advisory fees by the amount of investment advisory fees paid through each Portfolio’s investment in other affiliated investment companies, if any. This amount is shown as fees waived by advisor in the Statements of Operations.
The Manager entered into a separate sub-advisory agreement with BlackRock Investment Management, LLC (“BIM”), an affiliate of the Manager. The Manager pays BIM for services it provides, a monthly fee that is a percentage of the investment advisory fees paid by each Portfolio to the Manager.
For the year ended September 30, 2010, each Portfolio reimbursed the Manager for certain accounting services, which are included in accounting services in the Statements of Operations. The reimbursements were as follows:
| | | | |
|
Master Large Cap Core Portfolio | | $ | 73,376 | |
Master Large Cap Growth Portfolio | | $ | 13,624 | |
Master Large Cap Value Portfolio | | $ | 46,040 | |
|
The Portfolios have received an exemptive order from the SEC permitting them, among other things, to pay an affiliated securities lending agent a fee based on a share of the income derived from the securities lending activities and has retained BIM as the securities lending agent. BIM may, on behalf of the Portfolios, invest cash collateral received by the Portfolios for such loans, among other things, in a private investment company managed by the Manager or in registered money market funds advised by the Manager or its affiliates. The market value of securities on loan and the value of the related collateral are shown in the Statements of Assets and Liabilities as securities loaned and collateral on securities loaned, at value, respectively. The cash collateral invested by BIM is disclosed in the Schedules of Investments. The share of income earned by the Portfolios on such investments is shown as securities lending — affiliated in the Statements of Operations. For the year ended September 30, 2010, BIM received the following in securities lending agent fees related to securities lending activities for the Portfolios:
| | | | |
|
Master Large Cap Core Portfolio | | $ | 72,814 | |
Master Large Cap Growth Portfolio | | $ | 8,961 | |
Master Large Cap Value Portfolio | | $ | 23,295 | |
|
The Manager reimbursed Master Large Cap Core Portfolio and Master Large Cap Growth Portfolio $2,278,260 and $68,976, respectively, for net losses associated with certain investment transactions. These amounts are shown as payment by affiliates in the Statements of Operations.
Certain officers and/or directors of the Portfolios are officers and/or directors of BlackRock or its affiliates.
3. Investments:
Purchases and sales of investments, excluding short-term securities for the year ended September 30, 2010, were as follows:
| | | | | | | |
|
| | Purchases | | Sales | |
|
Master Large Cap Core Portfolio | | $ | 6,409,399,080 | | $ | 7,328,183,522 | |
Master Large Cap Growth Portfolio | | $ | 1,619,332,771 | | $ | 1,737,945,660 | |
Master Large Cap Value Portfolio | | $ | 4,407,194,346 | | $ | 4,950,056,303 | |
|
| | | |
|
|
|
|
| BLACKROCK LARGE CAP SERIES FUNDS, INC. | SEPTEMBER 30, 2010 | 59 |
| |
|
|
Notes to Financial Statements (concluded) | Master Large Cap Series LLC |
4. Borrowings:
The Master LLC, on behalf of the Portfolios, along with certain other funds managed by the Manager and its affiliates, is a party to a $500 million credit agreement with a group of lenders, which expires in November 2010 and was subsequently renewed until November 2011. Each Portfolio may borrow under the credit agreement to fund shareholder redemptions. Effective November 2008, the credit agreement had the following terms: 0.02% upfront fee on the aggregate commitment amount which was allocated to each Portfolio based on its net assets as of October 31, 2008, a commitment fee of 0.08% per annum based on each Portfolio’s pro rata share of the unused portion of the credit agreement, which is included in miscellaneous in the Statements of Operations, and interest at a rate equal to the higher of (a) federal funds effective rate and (b) reserve adjusted one-month LIBOR, plus, in each case, the higher of (i) 1.50% and (ii) 50% of the CDX Index (as defined in the credit agreement) on amounts borrowed. Effective November 2009, the credit agreement was renewed with the following terms: 0.02% upfront fee on the aggregate commitment amount which was allocated to each Portfolio based on its net assets as of October 31, 2009, a commitment fee of 0.10% per annum based on each Portfolio’s pro rata share of the unused portion of the credit agreement which is included in miscellaneous in the Statements of Operations, and interest at a rate equal to the higher of (a) the one-month LIBOR plus 1.25% per annum and (b) the Fed Funds rate plus 1.25% per annum on amounts borrowed. The Portfolios did not borrow under the credit agreement during the year ended September 30, 2010.
5. Concentration, Market and Credit Risk:
Master Large Cap Growth Portfolio invests a significant portion of its assets in securities in the information technology and consumer discretionary sectors. Changes in economic conditions affecting the information technology and consumer discretionary sectors would have a greater impact on Master Large Cap Growth Portfolio and could affect the value, income and/or liquidity of positions in such securities.
In the normal course of business, the Portfolios invest in securities and enter into transactions where risks exist due to fluctuations in the market (market risk) or failure of the issuer of a security to meet all its obligations (issuer credit risk). The value of securities held by the Portfolios may decline in response to certain events, including those directly involving the issuers whose securities are owned by the Portfolios; conditions affecting the general economy; overall market changes; local, regional or global political, social or economic instability; and currency and interest rate and price fluctuations. Similar to issuer credit risk, the Portfolios may be exposed to counterparty credit risk, or the risk that an entity with which the Portfolios have unsettled or open transactions may fail to or be unable to perform on its commitments. The Portfolios manage counterparty credit risk by entering into transactions only with counterparties that they believe have the financial resources to honor their obligations and by monitoring the financial stability of those counterparties. Financial assets, which potentially expose the Portfolios to market, issuer and counterparty credit risks, consist principally of financial instruments and receivables due from counterparties. The extent of the Portfolios’ exposure to market, issuer and counterparty credit risks with respect to these financial assets is generally approximated by their value recorded in the Portfolios’ Statements of Assets and Liabilities, less any collateral held by the Master LLC.
6. Subsequent Events:
Management has evaluated the impact of all subsequent events on each Portfolio through the date the financial statements were issued and has determined that there were no subsequent events requiring adjustment or additional disclosure in the financial statements.
| | |
|
|
|
60 | BLACKROCK LARGE CAP SERIES FUNDS, INC. | SEPTEMBER 30, 2010 |
| |
|
|
Report of Independent Registered Public Accounting Firm | Master Large Cap Series LLC |
To the Investors and Board of Directors of
Master Large Cap Series LLC:
We have audited the accompanying statements of assets and liabilities, including the schedules of investments, of Master Large Cap Series LLC (the “Master LLC”) comprised of Master Large Cap Core Portfolio, Master Large Cap Growth Portfolio and Master Large Cap Value Portfolio, as of September 30, 2010, and the related statements of operations for the year then ended, the statements of changes in net assets for the year then ended, for the period November 1, 2008 through September 30, 2009, and for the year ended October 31, 2008, and the financial highlights for the year ended September 30, 2010, for the period November 1, 2008 through September 30, 2009, and for each of the four years in the period ended October 31, 2008. These financial statements and financial highlights are the responsibility of the Master LLC’s management. Our responsibility is to express an opinion on these financial statements and financial highlights based on our audits.
We conducted our audits in accordance with the standards of the Public Company Accounting Oversight Board (United States). Those standards require that we plan and perform the audit to obtain reasonable assurance about whether the financial statements and financial highlights are free of material misstatement. The Master LLC is not required to have, nor were we engaged to perform, an audit of its internal control over financial reporting. Our audits included consideration of internal control over financial reporting as a basis for designing audit procedures that are appropriate in the circumstances, but not for the purpose of expressing an opinion on the effectiveness of the Corporation’s internal control over financial reporting. Accordingly, we express no such opinion. An audit also includes examining, on a test basis, evidence supporting the amounts and disclosures in the financial statements, assessing the accounting principles used and significant estimates made by management, as well as evaluating the overall financial statement presentation. Our procedures included confirmation of securities owned as of September 30, 2010, by correspondence with the custodian and brokers; where replies were not received from brokers, we performed other auditing procedures. We believe that our audits provide a reasonable basis for our opinion.
In our opinion, the financial statements and financial highlights referred to above present fairly, in all material respects, the financial positions of Master Large Cap Core Portfolio, Master Large Cap Growth Portfolio and Master Large Cap Value Portfolio of Master Large Cap Series LLC, as of September 30, 2010, the results of their operations for the year then ended, the changes in their net assets for the year then ended, for the period November 1, 2008 through September 30, 2009, and for the year ended October 31, 2008, and the financial highlights for the year ended September 30, 2010, the period November 1, 2008 through September 30, 2009, and for each of the four years in the period ended October 31, 2008, in conformity with accounting principles generally accepted in the United States of America.
Deloitte & Touche LLP
Princeton, New Jersey
November 26, 2010
| | | |
|
|
|
|
| BLACKROCK LARGE CAP SERIES FUNDS, INC. | SEPTEMBER 30, 2010 | 61 |
|
|
|
Disclosure of Investment Advisory Agreement and Sub-Advisory Agreement |
The Board of Directors of Master Large Cap Series LLC (the “Master LLC”) met on April 20, 2010 and May 18 – 19, 2010 to consider the approval of the Master LLC’s investment advisory agreement (the “Advisory Agreement”) with BlackRock Advisors, LLC (the “Manager”), the Master LLC’s investment advisor, on behalf of each of Master Large Cap Core Portfolio, Master Large Cap Growth Portfolio and Master Large Cap Value Portfolio (each a “Master Portfolio,” and together, the “Master Portfolios”). The Board of Directors of the Master LLC also considered the approval of the sub-advisory agreement (the “Sub-Advisory Agreement”) between the Manager and BlackRock Investment Management, LLC (the “Sub-Advisor”), with respect to each Master Portfolio. BlackRock Large Cap Core Fund, BlackRock Large Cap Growth Fund and BlackRock Large Cap Value Fund (each a “Feeder Fund,” and together, the “Feeder Funds”), each a series of BlackRock Large Cap Series Funds, Inc. (the “Corporation”), currently invests all of their investable assets in Master Large Cap Core Portfolio, Master Large Cap Growth Portfolio and Master Large Cap Value Portfolio, respectively. Accordingly, the Board of Directors of the Corporation also considered the approval of the Advisory Agreement and the Sub-Advisory Agreement. The Manager and the Sub-Advisor are referred to herein as “BlackRock.” The Advisory Agreement and the Sub-Advisory Agreement are referred to herein as the “Agreements.” For simplicity, the Board of Directors of the Master LLC and the Board of Directors of the Corporation are referred to herein collectively as the “Board,” and the members are referred to as “Board Members.”
Activities and Composition of the Board
The Board consists of thirteen individuals, eleven of whom are not “interested persons” of the Master LLC or the Corporation as defined in the Investment Company Act of 1940, as amended (the “1940 Act”) (the “Independent Board Members”). The Board Members are responsible for the oversight of the operations of each Master Portfolio or Feeder Fund, as pertinent, and perform the various duties imposed on the directors of investment companies by the 1940 Act. The Independent Board Members have retained independent legal counsel to assist them in connection with their duties. The Co-Chairs of the Board are each Independent Board Members. The Board has established five standing committees: an Audit Committee, a Governance and Nominating Committee, a Compliance Committee, a Performance Oversight and Contract Committee and an Executive Committee, each of which is composed of Independent Board Members (except for the Executive Committee, which also has one interested Board Member) and is chaired by Independent Board Members. The Board also has one ad hoc committee, the Joint Product Pricing Committee, which consists of Independent Board Members and directors/trustees of the boards of certain other BlackRock-managed funds, who are not “interested persons” of their respective funds.
The Agreements
Pursuant to the 1940 Act, the Board is required to consider the continuation of the Agreements on an annual basis. In connection with this process, the Board assessed, among other things, the nature, scope and quality of the services provided to the Feeder Funds and the Master Portfolios by the personnel of BlackRock and its affiliates, including investment management, administrative and shareholder services, oversight of fund accounting and custody, marketing services and assistance in meeting applicable legal and regulatory requirements.
From time to time throughout the year, the Board, acting directly and through its committees, considers at each of its meetings factors that are relevant to its annual consideration of the renewal of the Agreements, including the services and support provided by BlackRock to each Master Portfolio, each Feeder Fund and their shareholders. Among the matters the Board considered were: (a) investment performance for one-, three- and five-year periods, as applicable, against peer funds, and applicable benchmarks, if any, as well as senior management’s and portfolio managers’ analysis of the reasons for any over performance or underperformance against its peers and/or benchmark, as applicable; (b) fees, including advisory, administration, if applicable, and other amounts paid to BlackRock and its affiliates by each Master Portfolio and/or Feeder Fund for services, such as transfer agency, marketing and distribution, call center and fund accounting; (c) Master Portfolio and/or Feeder Fund operating expenses; (d) the resources devoted to and compliance reports relating to each Master Portfolio’s and each Feeder Fund’s investment objective, policies and restrictions; (e) each Master Portfolio’s and each Feeder Fund’s compliance with its respective Code of Ethics and compliance policies and procedures; (f) the nature, cost and character of non-investment management services provided by BlackRock and its affiliates; (g) BlackRock’s and other service providers’ internal controls; (h) BlackRock’s implementation of the proxy voting policies approved by the Board; (i) the use of brokerage commissions and execution quality of portfolio transactions; (j) BlackRock’s implementation of each Master Portfolio’s and/or Feeder Fund’s valuation and liquidity procedures; (k) an analysis of contractual and actual management fees for products with similar investment objectives across the open-end fund, closed-end fund and institutional account product channels, as applicable; and (l) periodic updates on BlackRock’s business.
Board Considerations in Approving the Agreements
The Approval Process: Prior to the April 20, 2010 meeting, the Board requested and received materials specifically relating to the Agreements. The Board is engaged in a process with BlackRock to periodically review the nature and scope of the information provided to better assist its deliberations. The materials provided in connection with the April meeting included: (a) information independently compiled and prepared by Lipper, Inc. (“Lipper”) on fees and expenses of each Master Portfolio and Feeder Fund, as applicable, and the investment performance of each Feeder Fund as compared with a peer group of funds as determined by Lipper (collectively, “Peers”); (b) information on the profitability of the Agreements to BlackRock and a discussion of fall-out benefits to BlackRock and its affiliates and significant shareholders; (c) a general analysis provided by BlackRock concerning investment advisory fees charged to other clients, such as institutional clients and closed-end funds, under similar investment mandates, as well as the performance of such other clients, as applicable; (d) the impact of economies of scale; (e) a summary of aggregate amounts paid by each Master Portfolio and/or Feeder Fund to BlackRock; (f) sales and redemption data regarding each Feeder Fund’s shares; and (g) if applicable, a comparison of management fees to similar BlackRock open-end funds, as classified by Lipper.
| | |
|
|
|
62 | BLACKROCK LARGE CAP SERIES FUNDS, INC. | SEPTEMBER 30, 2010 |
|
|
|
Disclosure of Investment Advisory Agreement and Sub-Advisory Agreement (continued) |
At an in-person meeting held on April 20, 2010, the Board reviewed materials relating to its consideration of the Agreements. As a result of the discussions that occurred during the April 20, 2010 meeting, the Board presented BlackRock with questions and requests for additional information and BlackRock responded to these requests with additional written information in advance of the May 18 – 19, 2010 Board meeting.
At an in-person meeting held on May 18 – 19, 2010, the Board of the Master LLC, including the Independent Board Members, unanimously approved the continuation of the Advisory Agreement between the Manager and the Master LLC on behalf of each Master Portfolio and the Sub-Advisory Agreement between the Manager and the Sub-Advisor with respect to each Master Portfolio, each for a one-year term ending June 30, 2011. The Board of the Corporation, including the Independent Board Members, also considered the continuation of the Agreements and found the Agreements to be satisfactory. In approving the continuation of the Agreements, the Board considered: (a) the nature, extent and quality of the services provided by BlackRock; (b) the investment performance of each Master Portfolio, each Feeder Fund and BlackRock; (c) the advisory fee and the cost of the services and profits to be realized by BlackRock and its affiliates from their relationship with each Master Portfolio and Feeder Fund; (d) economies of scale; and (e) other factors deemed relevant by the Board Members.
The Board also considered other matters it deemed important to the approval process, such as payments made to BlackRock or its affiliates relating to the distribution of Feeder Fund shares, services related to the valuation and pricing of portfolio holdings of each Master Portfolio, direct and indirect benefits to BlackRock and its affiliates and significant shareholders from their relationship with the Master Portfolios and the Feeder Funds and advice from independent legal counsel with respect to the review process and materials submitted for the Board’s review. The Board noted the willingness of BlackRock personnel to engage in open, candid discussions with the Board. The Board did not identify any particular information as controlling, and each Board Member may have attributed different weights to the various items considered.
A. Nature, Extent and Quality of the Services Provided by BlackRock:
The Board, including the Independent Board Members, reviewed the nature, extent and quality of services provided by BlackRock, including the investment advisory services and the resulting performance of each Feeder Fund. Throughout the year, the Board compared each Feeder Fund’s performance to the performance of a comparable group of mutual funds, and the performance of a relevant benchmark, if any. The Board met with BlackRock’s senior management personnel responsible for investment operations, including the senior investment officers. The Board also reviewed the materials provided by each Master Portfolio’s portfolio management team discussing Master Portfolio performance and each Master Portfolio’s investment objective, strategies and outlook.
The Board considered, among other factors, the number, education and experience of BlackRock’s investment personnel generally and each Master Portfolio’s portfolio management team, investments by portfolio managers in the funds they manage, BlackRock’s portfolio trading capabilities, BlackRock’s use of technology, BlackRock’s commitment to compliance, BlackRock’s credit analysis capabilities, BlackRock’s risk analysis capabilities and BlackRock’s approach to training and retaining portfolio managers and other research, advisory and management personnel. The Board also reviewed a general description of BlackRock’s compensation structure with respect to each Master Portfolio’s portfolio management team and BlackRock’s ability to attract and retain high-quality talent.
In addition to advisory services, the Board considered the quality of the administrative and non-investment advisory services provided to each Master Portfolio and Feeder Fund. BlackRock and its affiliates and significant shareholders provide each Master Portfolio and Feeder Fund with certain administrative, transfer agency, shareholder and other services (in addition to any such services provided to each Master Portfolio and Feeder Fund by third parties) and officers and other personnel as are necessary for the operations of the Master Portfolio and Feeder Fund. In addition to investment advisory services, BlackRock and its affiliates provide each Master Portfolio and Feeder Fund with other services, including: (i) preparing disclosure documents, such as the prospectus, the statement of additional information and periodic shareholder reports; (ii) assisting with daily accounting and pricing; (iii) overseeing and coordinating the activities of other service providers; (iv) organizing Board meetings and preparing the materials for such Board meetings; (v) providing legal and compliance support; and (vi) performing other administrative functions necessary for the operation of the Master Portfolio and the Feeder Fund, such as tax reporting, fulfilling regulatory filing requirements, and call center services. The Board reviewed the structure and duties of BlackRock’s fund administration, accounting, legal and compliance departments and considered BlackRock’s policies and procedures for assuring compliance with applicable laws and regulations.
B. The Investment Performance of each Master Portfolio, each Feeder Fund and BlackRock: The Board, including the Independent Board Members, also reviewed and considered the performance history of each Master Portfolio and Feeder Fund, as applicable. The Board noted that each Master Portfolio’s investment results correspond directly to the investment results of the applicable Feeder Fund. In preparation for the April 20, 2010 meeting, the Board was provided with reports, independently prepared by Lipper, which included a comprehensive analysis of each Feeder Fund’s performance. The Board also reviewed a narrative and statistical analysis of the Lipper data that was prepared by BlackRock, which analyzed various factors that affect Lipper’s rankings. In connection with its review, the Board received and reviewed information regarding the investment performance of each Feeder Fund as compared to a representative group of similar funds as determined by Lipper and to all funds in such Feeder Fund’s applicable Lipper category. The Board was provided with a description of the methodology used by Lipper to select peer funds. The Board regularly reviews the performance of each Master Portfolio and Feeder Fund, as applicable, throughout the year. The Board attaches more importance to performance over relatively long periods of time, typically three to five years.
The Board noted that BlackRock Large Cap Core Fund performed below the median of its Lipper Performance Universe in each of the one-, three- and five-year periods reported. The Board and BlackRock reviewed the reasons for the Feeder Fund’s underperformance during these periods compared with its Peers. The Board was informed that, among other things, the Master Large Cap Core Portfolio’s fundamental orientation, preference for growth visibility and valuation discipline kept it out of many of the high beta cyclical stocks that
| | | |
|
|
|
|
| BLACKROCK LARGE CAP SERIES FUNDS, INC. | SEPTEMBER 30, 2010 | 63 |
|
|
|
Disclosure of Investment Advisory Agreement and Sub-Advisory Agreement (continued) |
outperformed during 2009. For the three-year period, information technology, industrials, energy and consumer staples detracted from performance. For the five-year period, stock selection in information technology and industrials and an underweight in consumer staples hurt performance relative to the Feeder Fund’s Peers.
The Board noted that although BlackRock Large Cap Growth Fund and BlackRock Large Cap Value Fund underperformed their respective Peers in two of the one-, three- and five-year periods reported, underperformance for at least one of the periods was within 10% of the Lipper Performance Universe median return of their respective Peers.
The Board and BlackRock discussed BlackRock’s strategy for improving each Feeder Fund’s performance and BlackRock’s commitment to providing the resources necessary to assist each Master Portfolio’s portfolio managers and to improve such Feeder Fund’s performance.
C. Consideration of the Advisory Fees and the Cost of the Services and Profits to be Realized by BlackRock and its Affiliates from their Relationship with each Master Portfolio and Feeder Fund: The Board, including the Independent Board Members, reviewed each Master Portfolio’s contractual advisory fee rate compared with the other funds in the corresponding Feeder Fund’s Lipper category. It also compared each Feeder Fund’s total expenses, as well as actual management fees, to those of other funds in its Lipper category. The Board considered the services provided and the fees charged by BlackRock to other types of clients with similar investment mandates, including separately managed institutional accounts.
The Board received and reviewed statements relating to BlackRock’s financial condition and profitability with respect to the services it provided each Master Portfolio and Feeder Fund. The Board was also provided with a profitability analysis that detailed the revenues earned and the expenses incurred by BlackRock for services provided to each Master Portfolio and Feeder Fund. The Board reviewed BlackRock’s profitability with respect to each Master Portfolio and Feeder Fund, as applicable, and other funds the Board currently oversees for the year ended December 31, 2009 compared to available aggregate profitability data provided for the year ended December 31, 2008. The Board reviewed BlackRock’s profitability with respect to other fund complexes managed by the Manager and/or its affiliates. The Board reviewed BlackRock’s assumptions and methodology of allocating expenses in the profitability analysis, noting the inherent limitations in allocating costs among various advisory products. The Board recognized that profitability may be affected by numerous factors including, among other things, fee waivers and expense reimbursements by the Manager, the types of funds managed, expense allocations and business mix, and the difficulty of comparing profitability as a result of those factors.
The Board noted that, in general, individual fund or product line profitability of other advisors is not publicly available. Nevertheless, to the extent such information was available, the Board considered BlackRock’s operating margin, in general, compared to the operating margin for leading investment management firms whose operations include advising open-end funds, among other product types. That data indicates that operating margins for BlackRock with respect to its registered funds are generally consistent with margins earned by similarly situated publicly traded competitors. In addition, the Board considered, among other things, certain third party data comparing BlackRock’s operating margin with that of other publicly traded asset management firms. That third party data indicates that larger asset bases do not, in themselves, translate to higher profit margins.
In addition, the Board considered the cost of the services provided to each Master Portfolio and Feeder Fund by BlackRock, and BlackRock’s and its affiliates’ profits relating to the management and distribution of each Master Portfolio and Feeder Fund and the other funds advised by BlackRock and its affiliates. As part of its analysis, the Board reviewed BlackRock’s methodology in allocating its costs to the management of each Master Portfolio and Feeder Fund. The Board also considered whether BlackRock has the financial resources necessary to attract and retain high-quality investment management personnel to perform its obligations under the Agreements and to continue to provide the high quality of services that is expected by the Board.
The Board noted that each Master Portfolio’s contractual advisory fee rate was lower than or equal to the median contractual advisory fee rate paid by the Peers of the applicable Feeder Fund, in each case before taking into account any expense reimbursements or fee waivers.
The Board also noted that each Master Portfolio has an advisory fee arrangement that includes breakpoints that adjust the fee rate downward as the size of the Master Portfolio increases above certain contractually specified levels.
The Board further noted that BlackRock has contractually agreed to waive fees and/or reimburse expenses in order to limit, to a specified amount, BlackRock Large Cap Core Fund’s total operating expenses as a percentage of the Feeder Fund’s average daily net assets on a class-by-class basis, as applicable.
D. Economies of Scale: The Board, including the Independent Board Members, considered the extent to which economies of scale might be realized as the assets of each Master Portfolio and Feeder Fund increase. The Board also considered the extent to which each Master Portfolio and Feeder Fund benefit from such economies and whether there should be changes in the advisory fee rate or structure in order to enable each Master Portfolio and Feeder Fund to participate in these economies of scale, for example through the use of revised breakpoints in the advisory fee based upon the asset level of each Master Portfolio.
E. Other Factors Deemed Relevant by the Board Members: The Board, including the Independent Board Members, also took into account other ancillary or “fall-out” benefits that BlackRock or its affiliates and significant shareholders may derive from their respective relationships with each Master Portfolio and Feeder Fund, both tangible and intangible, such as BlackRock’s ability to leverage its investment professionals who manage other portfolios, an increase in BlackRock’s profile in the investment advisory community, and the engagement of BlackRock’s affiliates and significant shareholders as service providers to each Master Portfolio and Feeder Fund, including for administrative, transfer agency and distribution services. The Board also considered BlackRock’s overall operations and its efforts to expand the scale of, and improve the quality of, its operations. The Board also noted that BlackRock may use and benefit from third party research obtained by soft dollars generated by certain mutual fund transactions to assist in managing all or a number of its other client accounts. The Board further noted that BlackRock completed the acquisition of a complex of exchange-traded funds
| | |
|
|
|
64 | BLACKROCK LARGE CAP SERIES FUNDS, INC. | SEPTEMBER 30, 2010 |
|
|
|
Disclosure of Investment Advisory Agreement and Sub-Advisory Agreement (concluded) |
(“ETFs”) on December 1, 2009, and that BlackRock’s funds may invest in such ETFs without any offset against the management fees payable by the funds to BlackRock.
In connection with its consideration of the Agreements, the Board also received information regarding BlackRock’s brokerage and soft dollar practices. The Board received reports from BlackRock which included information on brokerage commissions and trade execution practices throughout the year.
The Board noted the competitive nature of the open-end fund marketplace, and that shareholders are able to redeem their Feeder Fund shares if they believe that the applicable Feeder Fund’s and/or Master Portfolio’s fees and expenses are too high or if they are dissatisfied with the performance of such Feeder Fund.
Conclusion
The Board of the Master LLC, including the Independent Board Members, unanimously approved the continuation of the Advisory Agreement between the Manager and the Master LLC on behalf of each Master Portfolio for a one-year term ending June 30, 2011 and the Sub-Advisory Agreement between the Manager and the Sub-Advisor, with respect to each Master Portfolio, for a one-year term ending June 30, 2011. As part of its approval, the Board of the Master LLC considered the discussions of BlackRock’s fee structure, as it applies to each Master Portfolio, being conducted by the ad hoc Joint Product Pricing Committee. Based upon its evaluation of all of the aforementioned factors in their totality, the Board of the Master LLC, including the Independent Board Members, was satisfied that the terms of the Agreements were fair and reasonable and in the best interest of each Master Portfolio and its shareholders. The Board of the Corporation, including the Independent Board Members, also considered the continuation of the Agreements with respect to each Master Portfolio and found the Agreements to be satisfactory. In arriving at a decision to approve the Agreements, the Board of the Master LLC did not identify any single factor or group of factors as all-important or controlling, but considered all factors together, and different Board Members may have attributed different weights to the various factors considered. The Independent Board Members were also assisted by the advice of independent legal counsel in making this determination. The contractual fee arrangements for each Master Portfolio reflect the results of several years of review by the Board Members and predecessor Board Members, and discussions between such Board Members (and predecessor Board Members) and BlackRock. Certain aspects of the arrangements may be the subject of more attention in some years than in others, and the Board Members’ conclusions may be based in part on their consideration of these arrangements in prior years.
| | | |
|
|
|
|
| BLACKROCK LARGE CAP SERIES FUNDS, INC. | SEPTEMBER 30, 2010 | 65 |
| | | | | | | | | | |
Name, Address
and Year of Birth | | Position(s)
Held with
Corporation/
Master LLC | | Length
of Time
Served as
a Director2 | | Principal Occupation(s) During Past Five Years | | Number of BlackRock-
Advised Registered
Investment Companies
(“RICs”) Consisting of
Investment Portfolios
(“Portfolios”) Overseen | | Public
Directorships |
|
|
|
|
|
|
|
|
|
|
|
Non-Interested Directors1 | | | | | | |
|
|
|
|
|
|
|
|
|
|
|
Ronald W. Forbes
55 East 52nd Street
New York, NY 10055
1940 | | Co-Chair of the Board and Director | | Since
2007 | | Professor Emeritus of Finance, School of Business, State University of New York at Albany since 2000. | | 36 RICs consisting of 95 Portfolios | | None |
|
|
|
|
|
|
|
|
|
|
|
Rodney D. Johnson
55 East 52nd Street
New York, NY 10055
1941 | | Co-Chair of the Board and Director | | Since
2007 | | President, Fairmount Capital Advisors, Inc. since 1987; Director, Fox Chase Cancer Center since 2004; Member of the Archdiocesan Investment Committee of the Archdiocese of Philadelphia since 2004; Director, The Committee of Seventy (civic) since 2006. | | 36 RICs consisting of 95 Portfolios | | None |
|
|
|
|
|
|
|
|
|
|
|
David O. Beim
55 East 52nd Street
New York, NY 10055
1940 | | Director | | Since
2007 | | Professor of Finance and Economics at the Columbia University Graduate School of Business since 1991; Trustee, Phillips Exeter Academy since 2002; Chairman, Wave Hill, Inc. (public garden and cultural center) from 1990 to 2006. | | 36 RICs consisting of 95 Portfolios | | None |
|
|
|
|
|
|
|
|
|
|
|
Dr. Matina S. Horner
55 East 52nd Street
New York, NY 10055
1939 | | Director | | Since
2007 | | Executive Vice President of Teachers Insurance and Annuity Association and College Retirement Equities Fund from 1989 to 2003. | | 36 RICs consisting of 95 Portfolios | | NSTAR (electric and gas utility) |
|
|
|
|
|
|
|
|
|
|
|
Herbert I. London
55 East 52nd Street
New York, NY 10055
1939 | | Director and Member of the Audit Committee | | Since
1999 | | Professor Emeritus, New York University since 2005; John M. Olin Professor of Humanities, New York University from 1993 to 2005 and Professor thereof from 1980 to 2005; President, Hudson Institute (policy research organization) since 1997 and Trustee thereof since 1980; Chairman of the Board of Trustees for Grantham University since 2006; Director, InnoCentive, Inc. (strategic solutions company) since 2005; Director, Cerego, LLC (software development and design) since 2005. | | 36 RICs consisting of 95 Portfolios | | AIMS Worldwide, Inc. (marketing) |
|
|
|
|
|
|
|
|
|
|
|
Cynthia A. Montgomery
55 East 52nd Street
New York, NY 10055
1952 | | Director | | Since
2007 | | Professor, Harvard Business School since 1989; Director, Harvard Business School Publishing since 2005; Director, McLean Hospital since 2005. | | 36 RICs consisting of 95 Portfolios | | Newell Rubbermaid, Inc. (manufacturing) |
|
|
|
|
|
|
|
|
|
|
|
Joseph P. Platt, Jr.
55 East 52nd Street
New York, NY 10055
1947 | | Director | | Since
2007 | | Director, The West Penn Allegheny Health System (a not-for-profit health system) since 2008; Director, Jones and Brown (Canadian insurance broker) since 1998; General Partner, Thorn Partners, LP (private investment) since 1998; Partner, Amarna Corporation, LLC (private investment company) from 2002 to 2008. | | 36 RICs consisting of 95 Portfolios | | Greenlight Capital Re, Ltd (reinsurance company); WQED Multi-Media (public broadcasting not-for-profit) |
|
|
|
|
|
|
|
|
|
|
|
Robert C. Robb, Jr.
55 East 52nd Street
New York, NY 10055
1945 | | Director | | Since
2007 | | Partner, Lewis, Eckert, Robb and Company (management and financial consulting firm) since 1981. | | 36 RICs consisting of 95 Portfolios | | None |
|
|
|
|
|
|
|
|
|
|
|
| | |
|
|
|
66 | BLACKROCK LARGE CAP SERIES FUNDS, INC. | SEPTEMBER 30, 2010 |
|
|
|
Officers and Directors (continued) |
| | | | | | | | | | |
Name, Address
and Year of Birth | | Position(s)
Held with
Corporation/
Master LLC | | Length
of Time
Served as
a Director2 | | Principal Occupation(s) During Past Five Years | | Number of BlackRock-
Advised Registered
Investment Companies
(“RICs”) Consisting of
Investment Portfolios
(“Portfolios”) Overseen | | Public
Directorships |
|
|
|
|
|
|
|
|
|
|
|
Non-Interested Directors1 (concluded) |
|
|
|
|
|
|
|
|
|
|
|
Toby Rosenblatt
55 East 52nd Street
New York, NY 10055
1938 | | Director | | Since
2007 | | President, Founders Investments Ltd. (private investments) since 1999; Director, College Access Foundation of California (philanthropic foundation) since 2009; Director, Forward Management, LLC since 2007; Director, The James Irvine Foundation (philanthropic foundation) from 1998 to 2008. | | 36 RICs consisting of 95 Portfolios | | A.P. Pharma, Inc. (specialty pharmaceuticals) |
|
|
|
|
|
|
|
|
|
|
|
Kenneth L. Urish
55 East 52nd Street
New York, NY 10055
1951 | | Chair of the Audit Committee and Director | | Since
2007 | | Managing Partner, Urish Popeck & Co., LLC (certified public accountants and consultants) since 1976; Member of External Advisory Board, The Pennsylvania State University Accounting Department since 2001; Trustee, The Holy Family Foundation since 2001; Committee Member, Professional Ethics Committee of the Pennsylvania Institute of Certified Public Accountants from 2007 to 2010; President and Trustee, Pittsburgh Catholic Publishing Associates from 2003 to 2008; Director, Inter-Tel from 2006 to 2007. | | 36 RICs consisting of 95 Portfolios | | None |
|
|
|
|
|
|
|
|
|
|
|
Frederick W. Winter
55 East 52nd Street
New York, NY 10055
1945 | | Director and Member of the Audit Committee | | Since
2007 | | Professor and Dean Emeritus of the Joseph M. Katz School of Business, University of Pittsburgh since 2005 and Dean thereof from 1997 to 2005; Director, Alkon Corporation (pneumatics) since 1992; Director, Tippman Sports (recreation) since 2005; Director, Indotronix International (IT services) from 2004 to 2008. | | 36 RICs consisting of 95 Portfolios | | None |
| | |
|
|
|
| 1 | Directors serve until their resignation, removal or death, or until December 31 of the year in which they turn 72. The Board has approved one-year extensions in terms of Directors who turn 72 prior to December 31, 2013. |
| | |
| 2 | Date shown is the earliest date a person has served as a director of the Corporation/Master LLC covered by this annual report. Following the combination of Merrill Lynch Investment Managers, L.P. (“MLIM”) and BlackRock, Inc. (“BlackRock”) in September 2006, the various legacy MLIM and legacy BlackRock Fund boards were realigned and consolidated into three new Fund boards in 2007. As a result, although the chart shows directors as joining the Corporation’s/ Master LLC’s board in 2007, each director first became a member of the board of other legacy MLIM or legacy BlackRock Funds as follows: David O. Beim, 1998; Ronald W. Forbes, 1977; Dr. Matina S. Horner, 2004; Rodney D. Johnson, 1995; Herbert I. London, 1987; Cynthia A. Montgomery, 1994; Joseph P. Platt, Jr., 1999; Robert C. Robb, Jr., 1999; Toby Rosenblatt, 2005; Kenneth L. Urish, 1999; and Frederick W. Winter, 1999. |
| | | | | | | | | | |
|
|
|
|
|
|
|
|
|
|
|
Interested Directors3 |
|
|
|
|
|
|
|
|
|
|
|
Richard S. Davis
55 East 52nd Street
New York, NY 10055
1945 | | Director | | Since
2007 | | Managing Director, BlackRock, Inc. since 2005; Chief Executive Officer, State Street Research & Management Company from 2000 to 2005; Chairman of the Board of Trustees, State Street Research Mutual Funds from 2000 to 2005. | | 169 RICs consisting of 290 Portfolios | | None |
|
|
|
|
|
|
|
|
|
|
|
Henry Gabbay
55 East 52nd Street
New York, NY 10055
1947 | | Director | | Since
2007 | | Consultant, BlackRock, Inc. from 2007 to 2008; Managing Director, BlackRock, Inc. from 1989 to 2007; Chief Administrative Officer, BlackRock Advisors, LLC from 1998 to 2007; President of BlackRock Funds and BlackRock Bond Allocation Target Shares from 2005 to 2007 and Treasurer of certain closed-end Funds in the BlackRock fund complex from 1989 to 2006. | | 169 RICs consisting of 290 Portfolios | | None |
| | |
|
|
|
| 3 | Mr. Davis is an “interested person” as defined in the 1940 Act, of the Corporation/Master LLC based on his positions with BlackRock, Inc. and its affiliates. Mr. Gabbay is an “interested person” of the Corporation/Master LLC based on his former positions with BlackRock, Inc. and its affiliates as well as his ownership of BlackRock, Inc. and The PNC Financial Services Group, Inc. securities. Directors serve until their resignation, removal or death, or until December 31 of the year in which they turn 72. The Board has approved one-year extensions in terms of Directors who turn 72 prior to December 31, 2013. |
| | | |
|
|
|
|
| BLACKROCK LARGE CAP SERIES FUNDS, INC. | SEPTEMBER 30, 2010 | 67 |
|
|
|
Officers and Directors (concluded) |
| | | | | | |
Name, Address
and Year of Birth | | Position(s)
Held with
Corporation/
Master LLC | | Length
of Time
Served | | Principal Occupation(s) During Past Five Years |
|
|
|
|
|
|
|
Officers* |
|
|
|
|
|
|
|
John M. Perlowski
55 East 52nd Street
New York, NY 10055
1964 | | President and Chief Executive Officer | | Since 2010 | | Managing Director of BlackRock, Inc. since 2009; Global Head of BlackRock Fund Administration since 2009; Managing Director and Chief Operating Officer of the Global Product Group at Goldman Sachs Asset Management, L.P. from 2003 to 2009; Treasurer of Goldman Sachs Mutual Funds from 2003 to 2009 and Senior Vice President thereof from 2007 to 2009; Director of Goldman Sachs Offshore Funds from 2002 to 2009. |
|
|
|
|
|
|
|
Jeffrey Holland, CFA
55 East 52nd Street
New York, NY 10055
1971 | | Vice President | | Since 2009 | | Managing Director of BlackRock, Inc. since 2010; Director of BlackRock, Inc. from 2006 to 2009; Chief Operating Officer of BlackRock’s US Retail Group since 2009; Co-head of Product Development and Management for BlackRock’s US Retail Group from 2007 to 2009; Product Manager of Raymond James & Associates from 2003 to 2006. |
|
|
|
|
|
|
|
Brendan Kyne
55 East 52nd Street
New York, NY 10055
1977 | | Vice President | | Since 2009 | | Managing Director of BlackRock, Inc. since 2010; Director of BlackRock, Inc. from 2008 to 2009; Head of Product Development and Management for BlackRock’s US Retail Group since 2009, Co-head thereof from 2007 to 2009; Vice President of BlackRock, Inc. from 2005 to 2008; Associate of BlackRock, Inc. from 2002 to 2008. |
|
|
|
|
|
|
|
Brian Schmidt
55 East 52nd Street
New York, NY 10055
1958 | | Vice President | | Since 2009 | | Managing Director of BlackRock, Inc. since 2004; Various positions with U.S. Trust Company from 1991 to 2003 including Director from 2001 to 2003 and Senior Vice President from 1998 to 2003; Vice President, Chief Financial Officer and Treasurer of Excelsior Funds, Inc., Excelsior Tax-Exempt Funds, Inc. and Excelsior Funds Trust from 2001 to 2003. |
|
|
|
|
|
|
|
Neal Andrews
55 East 52nd Street
New York, NY 10055
1966 | | Chief Financial Officer | | Since 2007 | | Managing Director of BlackRock, Inc. since 2006; Senior Vice President and Line of Business Head of Fund Accounting and Administration at PNC Global Investment Servicing (U.S.) Inc. from 1992 to 2006. |
|
|
|
|
|
|
|
Jay Fife
55 East 52nd Street
New York, NY 10055
1970 | | Treasurer | | Since 2007 | | Managing Director of BlackRock, Inc. since 2007; Director of BlackRock, Inc. in 2006; Assistant Treasurer of the Merrill Lynch Investment Managers, L.P. (“MLIM”) and Fund Asset Management, L.P. advised funds from 2005 to 2006; Director of MLIM Fund Services Group from 2001 to 2006. |
|
|
|
|
|
|
|
Brian Kindelan
55 East 52nd Street
New York, NY 10055
1959 | | Chief Compliance Officer | | Since 2007 | | Chief Compliance Officer of the BlackRock-advised funds since 2007; Managing Director and Senior Counsel of BlackRock, Inc. since 2005. |
|
|
|
|
|
|
|
Howard Surloff
55 East 52nd Street
New York, NY 10055
1965 | | Secretary | | Since 2007 | | Managing Director and General Counsel of US Funds at BlackRock, Inc. since 2006; General Counsel (US) of Goldman Sachs Asset Management, L.P. from 1993 to 2006. |
| | |
|
|
|
| * | Officers of the Corporation/Master LLC serve at the pleasure of the Board. |
|
|
|
| Further information about the Corporation’s Officers and Directors is available in the Corporation’s Statement of Additional Information, which can be obtained without charge by calling (800) 441-7762. |
|
|
|
|
Investment Advisor |
BlackRock Advisors, LLC |
Wilmington, DE 19809 |
|
Custodian |
Brown Brothers Harriman & Co. |
Boston, MA 02109 |
|
Transfer Agent |
BNY Mellon Investment Servicing (US) Inc. |
Wilmington, DE 19809 |
|
Accounting Agent |
State Street Bank and Trust Company |
Princeton, NJ 08540 |
|
Sub-Advisor |
BlackRock Investment Management, LLC |
Plainsboro, NJ 08536 |
|
Distributor |
BlackRock Investments, LLC |
New York, NY 10022 |
|
Legal Counsel |
Sidley Austin LLP |
New York, NY 10019 |
|
Independent Registered Public Accounting Firm |
Deloitte & Touche LLP |
Princeton, NJ 08540 |
|
Address of the Funds |
100 Bellevue Parkway |
Wilmington, DE 19809 |
|
Effective September 24, 2010, John M. Perlowski became President and Chief Executive Officer of the Corporation/Master LLC. |
| | |
|
|
|
68 | BLACKROCK LARGE CAP SERIES FUNDS, INC. | SEPTEMBER 30, 2010 |
|
|
|
Additional Information |
|
|
General Information |
|
Electronic Delivery
Electronic copies of most financial reports and prospectuses are available on the Funds’ website or shareholders can sign up for e-mail notifications of quarterly statements, annual and semi-annual reports and prospectuses by enrolling in the Funds’ electronic delivery program.
To enroll:
Shareholders Who Hold Accounts with Investment Advisors, Banks or Brokerages:
Please contact your financial advisor. Please note that not all investment advisors, banks or brokerages may offer this service.
Shareholders Who Hold Accounts Directly with BlackRock:
| |
1) | Access the BlackRock website at http://www.blackrock.com/edelivery |
| |
2) | Select “eDelivery” under the “More Information” section |
| |
3) | Log into your account |
Householding
The Funds will mail only one copy of shareholder documents, including prospectuses, annual and semi-annual reports and proxy statements, to shareholders with multiple accounts at the same address. This practice is commonly called “householding” and is intended to reduce expenses and eliminate duplicate mailings of shareholder documents. Mailings of your shareholder documents may be householded indefinitely unless you instruct us otherwise. If you do not want the mailing of these documents to be combined with those for other members of your household, please call (800) 441-7762.
Availability of Quarterly Portfolio Schedule
The Funds/Master LLC file their complete schedule of portfolio holdings with the Securities and Exchange Commission (the “SEC”) for the first and third quarters of each fiscal year on Form N-Q. The Funds’/Master LLC’s Forms N-Q are available on the SEC’s website at http://www.sec.gov and may also be reviewed and copied at the SEC’s Public Reference Room in Washington, D.C. Information on the operation of the Public Reference Room may be obtained by calling (800) SEC-0330. The Funds’/Master LLC’s Forms N-Q may also be obtained upon request and without charge by calling (800) 441-7762.
Availability of Proxy Voting Policies and Procedures
A description of the policies and procedures that the Funds/Master LLC use to determine how to vote proxies relating to portfolio securities is available (1) without charge, upon request, by calling (800) 441-7762; (2) at http://www.blackrock.com; and (3) on the SEC’s website at http://www.sec.gov.
Availability of Proxy Voting Record
Information about how the Funds/Master LLC voted proxies relating to securities held in the Funds’/Master LLC’s portfolios during the most recent 12-month period ended June 30 is available upon request and without charge (1) at http://www.blackrock.com or by calling (800) 441-7762 and (2) on the SEC’s website at http://www.sec.gov.
| | | |
|
|
|
|
| BLACKROCK LARGE CAP SERIES FUNDS, INC. | SEPTEMBER 30, 2010 | 69 |
|
|
|
Additional Information (concluded) |
|
|
Shareholder Privileges |
|
Account Information
Call us at (800) 441-7762 from 8:00 AM to 6:00 PM EST on any business day to get information about your account balances, recent transactions and share prices. You can also reach us on the Web at http://www.blackrock.com/funds.
Automatic Investment Plans
Investor Class shareholders who want to invest regularly can arrange to have $50 or more automatically deducted from their checking or savings account and invested in any of the BlackRock funds.
Systematic Withdrawal Plans
Investor Class shareholders can establish a systematic withdrawal plan and receive periodic payments of $50 or more from their BlackRock funds, as long as their account balance is at least $10,000.
Retirement Plans
Shareholders may make investments in conjunction with Traditional, Rollover, Roth, Coverdell, Simple IRAs, SEP IRAs and 403(b) Plans.
|
|
BlackRock Privacy Principles |
|
BlackRock is committed to maintaining the privacy of its current and former fund investors and individual clients (collectively, “Clients”) and to safeguarding their non-public personal information. The following information is provided to help you understand what personal information BlackRock collects, how we protect that information and why in certain cases we share such information with select parties.
If you are located in a jurisdiction where specific laws, rules or regulations require BlackRock to provide you with additional or different privacy-related rights beyond what is set forth below, then BlackRock will comply with those specific laws, rules or regulations.
BlackRock obtains or verifies personal non-public information from and about you from different sources, including the following: (i) information we receive from you or, if applicable, your financial intermediary, on applications, forms or other documents; (ii) information about your transactions with us, our affiliates, or others; (iii) information we receive from a consumer reporting agency; and (iv) from visits to our websites.
BlackRock does not sell or disclose to non-affiliated third parties any non-public personal information about its Clients, except as permitted by law or as is necessary to respond to regulatory requests or to service Client accounts. These non-affiliated third parties are required to protect the confidentiality and security of this information and to use it only for its intended purpose.
We may share information with our affiliates to service your account or to provide you with information about other BlackRock products or services that may be of interest to you. In addition, BlackRock restricts access to non-public personal information about its Clients to those BlackRock employees with a legitimate business need for the information. BlackRock maintains physical, electronic and procedural safeguards that are designed to protect the non-public personal information of its Clients, including procedures relating to the proper storage and disposal of such information.
| | | |
|
|
|
|
70 | BLACKROCK LARGE CAP SERIES FUNDS, INC. | SEPTEMBER 30, 2010 | |
|
|
|
A World-Class Mutual Fund Family |
BlackRock offers a diverse lineup of open-end mutual funds crossing all investment styles and managed by experts in equity, fixed income and tax-exempt investing.
BlackRock All-Cap Energy & Resources Portfolio
BlackRock Asset Allocation Portfolio†
BlackRock Balanced Capital Fund†
BlackRock Basic Value Fund
BlackRock Capital Appreciation Fund
BlackRock Energy & Resources Portfolio
BlackRock Equity Dividend Fund
BlackRock Euro Fund
BlackRock Focus Growth Fund
BlackRock Focus Value Fund
BlackRock Global Allocation Fund†
BlackRock Global Dynamic Equity Fund
BlackRock Global Emerging Markets Fund
BlackRock Global Financial Services Fund
BlackRock Global Growth Fund
BlackRock Global Opportunities Portfolio
BlackRock Global SmallCap Fund
BlackRock Health Sciences Opportunities Portfolio
BlackRock Healthcare Fund
BlackRock Index Equity Portfolio*
BlackRock International Fund
BlackRock International Index Fund
BlackRock International Opportunities Portfolio
BlackRock International Value Fund
BlackRock Large Cap Core Fund
BlackRock Large Cap Core Plus Fund
BlackRock Large Cap Growth Fund
BlackRock Large Cap Value Fund
BlackRock Latin America Fund
BlackRock Mid-Cap Growth Equity Portfolio
BlackRock Mid-Cap Value Equity Portfolio
BlackRock Mid Cap Value Opportunities Fund
BlackRock Natural Resources Trust
BlackRock Pacific Fund
BlackRock Science & Technology Opportunities Portfolio
BlackRock Small Cap Core Equity Portfolio
BlackRock Small Cap Growth Equity Portfolio
BlackRock Small Cap Growth Fund II
BlackRock Small Cap Index Fund
BlackRock Small/Mid-Cap Growth Portfolio
BlackRock S&P 500 Index Fund
BlackRock S&P 500 Stock Fund
BlackRock U.S. Opportunities Portfolio
BlackRock Utilities and Telecommunications Fund
BlackRock Value Opportunities Fund
BlackRock World Gold Fund
BlackRock Bond Index Fund
BlackRock Bond Portfolio
BlackRock Emerging Market Debt Portfolio
BlackRock Floating Rate Income Portfolio
BlackRock GNMA Portfolio
BlackRock Global Dividend Income Portfolio†
BlackRock Government Income Portfolio
BlackRock High Income Fund
BlackRock High Yield Bond Portfolio
BlackRock Income Portfolio†
BlackRock Inflation Protected Bond Portfolio
BlackRock Intermediate Government Bond Portfolio
BlackRock International Bond Portfolio
BlackRock Long Duration Bond Portfolio
BlackRock Low Duration Bond Portfolio
BlackRock Managed Income Portfolio
BlackRock Multi-Sector Bond Portfolio
BlackRock Short-Term Bond Fund
BlackRock Strategic Income Opportunities Portfolio
BlackRock Total Return Fund
BlackRock Total Return Portfolio II
BlackRock World Income Fund
BlackRock AMT-Free Municipal Bond Portfolio
BlackRock California Municipal Bond Fund
BlackRock High Yield Municipal Fund
BlackRock Intermediate Municipal Fund
BlackRock Kentucky Municipal Bond Portfolio
BlackRock Municipal Insured Fund
BlackRock National Municipal Fund
BlackRock New Jersey Municipal Bond Fund
BlackRock New York Municipal Bond Fund
BlackRock Ohio Municipal Bond Portfolio
BlackRock Pennsylvania Municipal Bond Fund
BlackRock Short-Term Municipal Fund
|
|
Target Risk & Target Date Funds† |
|
BlackRock Prepared Portfolios
Conservative Prepared Portfolio
Moderate Prepared Portfolio
Growth Prepared Portfolio
Aggressive Growth Prepared Portfolio
BlackRock Lifecycle Prepared Portfolios
2015
2020
2025
2030
2035
2040
2045
2050
BlackRock LifePath Portfolios
Retirement
2020
2025
2030
2035
2040
2045
2050
2055
| |
* | See the prospectus for information on specific limitations on investments in the fund. |
| |
† | Mixed asset fund. |
BlackRock mutual funds are currently distributed by BlackRock Investments, LLC. You should consider the investment objectives, risks, charges and expenses of the funds under consideration carefully before investing. Each fund’s prospectus contains this and other information and is available at www.blackrock.com or by calling (800) 441-7762 or from your financial advisor. The prospectus should be read carefully before investing.
| | | |
|
|
|
|
| BLACKROCK LARGE CAP SERIES FUNDS, INC. | SEPTEMBER 30, 2010 | 71 |
These reports are not authorized for use as an offer of sale or a solicitation of an offer to buy shares of the Funds unless accompanied or preceded by the Funds’ current prospectus. Past performance results shown in these reports should not be considered a representation of future performance. Investment returns and principal value of shares will fluctuate so that shares, when redeemed, may be worth more or less than their original cost. Statements and other information herein are as dated and are subject to change.

| |
#CAPSERIES-9/10 | 
|
| |

| September 30, 2010 |
Annual Report
BlackRock Large Cap Series Funds, Inc.
| |
► | BlackRock Large Cap Core Retirement Portfolio |
| |
► | BlackRock Large Cap Growth Retirement Portfolio |
| |
► | BlackRock Large Cap Value Retirement Portfolio |
|
Not FDIC Insured § No Bank Guarantee § May Lose Value |
| | |
|
|
|
2 | BLACKROCK LARGE CAP SERIES FUNDS, INC. | SEPTEMBER 30, 2010 |
The global economic recovery that began in 2009 has continued on its choppy course this year, delivering mixed economic data and gradual if uneven improvement of investor sentiment. The risks of a double-dip recession continue to recede, but the economy remains mired in a slow-growth environment. The major short-term ambiguities that kept market participants on the fence — the US financial reform bill, political uncertainty, European bank stress test results, and European sovereign funding — have all abated to some degree, allowing market conditions to regain some degree of normalcy and demonstrate growth. In the United States, the National Bureau of Economic Research declared that the “Great Recession” ended in June 2009. Spanning December 2007 to June 2009, this marked the longest reported recession since the Great Depression. Structural problems of ongoing deleveraging and weak spending among businesses and households weigh heavily on the pace of economic growth. The Federal Reserve Board has made it clear that additional policy action will be needed to combat the slow pace of growth, high unemployment, and deflation risks.
The high levels of volatility experienced in global equity markets throughout 2009 continued into 2010 as uncertainty driven by mixed economic data and lingering credit issues caused stocks to trade in both directions, but by the end of the first quarter, most markets had managed to post gains. The second quarter, in contrast, brought higher levels of volatility and a “flight to quality” as investor sentiment was dominated by fears of a double-dip recession. Global equity markets saw negative quarterly returns — and for many markets, the first significant downturn since the bull market began in March 2009. As the end of the 12-month period drew near, economic data turned less negative and strong corporate earnings reports became increasingly consistent. These factors along with the anticipation of further quantitative easing drove equity markets higher in the third quarter, with most markets recapturing their second quarter losses and moving into positive territory year-to-date. International equities turned positive, posting gains on both a six- and 12-month basis. In the US, both large and small cap equities posted robust gains for the 12-month period; however large cap stocks remain negative on a six-month basis while small caps turned positive.
In fixed income markets, yields fluctuated but generally declined over the past 12 months amid heightened uncertainty. Weak economic data, lingering credit problems and, near the end of the period, the expectation of additional quantitative easing drove interest rates lower and bond prices higher. Treasuries rallied over the period, modestly outperforming the credit spread sectors of the market. Corporate credit spreads benefited from the low interest rate environment and high yield fixed income became increasingly attractive due to declining default rates and better-than-expected results on European bank stress tests. Tax-exempt municipal bonds performed well over the 12-month period, driven primarily by technical factors including favorable supply-and-demand dynamics.
Cash investments, as represented by the 3-month Treasury bill, returned only a fraction over 0% for the 12-month period as short-term interest rates remained low. Yields on money market securities remain near all-time lows.
Against this backdrop, the major market averages posted the following returns:
| | | | | | | |
Total Returns as of September 30, 2010 | | 6-month | | 12-month | |
|
|
|
|
|
|
|
|
US large cap equities (S&P 500 Index) | | (1.42 | )% | | 10.16 | % | |
|
|
|
|
|
|
|
|
US small cap equities (Russell 2000 Index) | | 0.25 | | | 13.35 | | |
|
|
|
|
|
|
|
|
International equities (MSCI Europe, Australasia, Far East Index) | | 0.20 | | | 3.27 | | |
|
|
|
|
|
|
|
|
3-month Treasury bill (BofA Merrill Lynch 3-Month Treasury Bill Index) | | 0.07 | | | 0.13 | | |
|
|
|
|
|
|
|
|
US Treasury securities (BofA Merrill Lynch 10-Year US Treasury Index) | | 13.20 | | | 10.23 | | |
|
|
|
|
|
|
|
|
US investment grade bonds (Barclays Capital US Aggregate Bond Index) | | 6.05 | | | 8.16 | | |
|
|
|
|
|
|
|
|
Tax-exempt municipal bonds (Barclays Capital Municipal Bond Index) | | 5.51 | | | 5.81 | | |
|
|
|
|
|
|
|
|
US high yield bonds (Barclays Capital US Corporate High Yield 2% Issuer Capped Index) | | 6.55 | | | 18.24 | | |
|
|
|
|
|
|
|
|
Past performance is no guarantee of future results. Index performance shown for illustrative purposes only. You cannot invest directly in an index.
As global economic conditions continue to improve, investors across the world continue to face uncertainty about the future of economic growth. Through periods of uncertainty, as ever, BlackRock’s full resources are dedicated to the management of our clients’ assets. For additional market perspective and investment insight, visit www.blackrock.com/shareholdermagazine, where you’ll find the most recent issue of our award-winning Shareholder® magazine, as well as its quarterly companion newsletter, Shareholder Perspectives. We thank you for entrusting BlackRock with your investments, and we look forward to your continued partnership in the months and years ahead.
Sincerely,
Rob Kapito
President, BlackRock Advisors, LLC
| | |
|
|
|
THIS PAGE NOT PART OF YOUR FUND REPORT | | 3 |
| |
|
| |
Fund Summary as of September 30, 2010 | BlackRock Large Cap Core Retirement Portfolio |
|
|
Portfolio Management Commentary |
|
| |
| How did the Fund perform? |
| |
• | BlackRock Large Cap Core Retirement Portfolio (the “Fund”), through its investment in Master Large Cap Core Portfolio (the “Portfolio”), underperformed its benchmark, the Russell 1000 Index, for the 12-month period ended September 30, 2010. |
| |
| What factors influenced performance? |
| |
• | Overall, negative results in the industrials, information technology (“IT”) and energy sectors overshadowed positive results in the health care and financials sectors. |
| |
• | Stock selection (primarily in the electrical equipment and aerospace & defense industries) drove underperformance within industrials. Underperformance of electrical equipment holdings reflected continued weakness in commercial construction, while lingering government budget deficit concerns adversely affected aerospace & defense holdings. Stock selection hindered performance in the IT sector as well, with weakness most pronounced in the computers & peripherals industry. The Portfolio had a notable exposure to the personal computer (“PC”) market, which struggled as general concerns about macroeconomic growth dampened consumer demand. Additionally, the rapid (and ongoing) adoption of tablets and other mobile devices led to some cannibalization of the traditional consumer PC market. Lastly, equipment & services names detracted from results within energy. Earlier in the reporting period, energy holdings struggled amid commodity price volatility related to the economic slowdown, as well as contagion from the oil spill in the Gulf of Mexico. In the latter half of the reporting period, underexposure to the industry was a negative, as many of the names that underperformed amid the Gulf oil spill bounced back from their lows. |
| |
• | The largest individual detractors from performance were Seagate Technology, NRG Energy, Inc., AES Corp. and Sears Holdings Corp. An underweight in Apple, Inc. also hindered relative returns. |
| |
• | Conversely, health care was the largest source of positive performance during the 12 months, as the passage of the reform bill resolved uncertainty that had previously clouded the sector’s outlook. An overweight in health care providers & services was particularly beneficial as holdings of health maintenance organizations outperformed due to stellar earnings results and investor comfort with the outcome of reform. An underweight and stock selection in the health care equipment & supplies industry also was additive. In the financials sector, a considerable underweight (particularly in diversified financial services and capital markets names) aided relative results, as the sector lagged the broader market due to continued regulatory and business model uncertainty and revenue growth challenges. |
| |
• | The largest individual contributors to performance were Limited Brands, Inc., UnitedHealth Group, Inc., Lubrizol Corp., Walter Energy, Inc. and Mylan, Inc. |
| |
| Describe recent portfolio activity. |
| |
• | During the annual period, we considerably increased exposure to the consumer discretionary and IT sectors. We significantly reduced the Portfolio’s weighting in energy, along with modest decreases in consumer staples, health care and industrials. |
| |
• | The largest security purchases in the Portfolio were Intel Corp., Seagate Technology, Comcast Corp. (Class A), National Semiconductor Corp. and Eli Lilly & Co. The largest sales included Philip Morris International Inc., Verizon Communications Inc., Schering-Plough Corp., Walter Energy and Anadarko Petroleum Corp. |
| |
| Describe portfolio positioning at period end. |
| |
• | At period end, we maintained the Portfolio’s pro-cyclical bias, emphasizing companies with strong balance sheets and superior free cash flow. However, we balanced that positioning with exposure to traditional defensive (i.e., less economically sensitive) areas. The Portfolio’s largest sector overweights included consumer discretionary and health care. The largest underweights were in financials and consumer staples. As always, we rely on a disciplined investment process and a belief in the importance of portfolio construction and risk management to strive to deliver consistent outperformance over the long term. |
The views expressed reflect the opinions of BlackRock as of the date of this report and are subject to change based on changes in market, economic or other conditions. These views are not intended to be a forecast of future events and are no guarantee of future results.
| | |
|
|
|
4 | BLACKROCK LARGE CAP SERIES FUNDS, INC. | SEPTEMBER 30, 2010 |
| |
|
| |
| BlackRock Large Cap Core Retirement Portfolio |
|
|
Total Return Based on a $10,000 Investment |
|
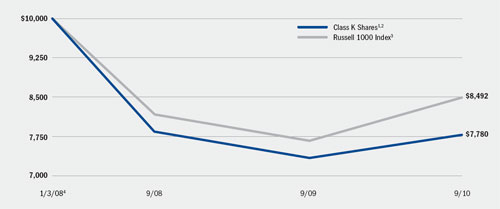
| |
1 | Assuming transaction costs and other operating expenses, including administration fees, if any. |
| |
2 | The Fund invests all of its assets in Master Large Cap Core Portfolio of Master Large Cap Series LLC. The Portfolio invests at least 80% of its assets in equity securities of large cap companies located in the United States that the investment advisor selects from among those that are, at the time of purchase, included in the Russell 1000 Index. |
| |
3 | This unmanaged broad-based index measures the performance of the 1,000 largest companies in the Russell 3000 Index, which represents approximately 90% of the total market capitalization of the Russell 3000 Index. |
| |
4 | Commencement of operations. |
|
|
Performance Summary for the Period Ended September 30, 2010 |
|
| | | | | | | | | | |
| | | | Average Annual Total Returns5 |
| | 6-Month
Total Returns | |
|
|
| | | | 1 Year | | | Since Inception6 | |
|
|
|
|
|
|
|
|
|
|
|
Class K | | | (5.09 | )% | | 6.01 | % | | (8.75 | )% |
Russell 1000 Index | | | (1.21 | ) | | 10.75 | | | (5.79 | ) |
|
|
|
|
|
|
|
|
|
|
|
| |
5 | See “About Fund Performance” on page 10 for a detailed description of the share class, including any related sales charges and fees. |
| |
6 | The Fund commenced operations on January 3, 2008.
Past performance is not indicative of future results. |
| | | | | | | | | | | | | | | | | | | | | | |
| | Actual | | Hypothetical8 | | | | |
| |
| |
| | | | |
| | Beginning
Account Value
April 1, 2010 | | Ending
Account Value
September 30, 2010 | | Expenses Paid
During the Period7 | | Beginning
Account Value
April 1, 2010 | | Ending
Account Value
September 30, 2010 | | Expenses Paid
During the Period7 | | Annualized
Expense Ratio | |
|
|
|
|
|
|
|
|
|
|
|
|
|
|
|
|
Class K | | | $1,000.00 | | | $949.10 | | | $3.27 | | | $1,000.00 | | | $1,021.74 | | | $3.40 | | | 0.67% | |
|
|
|
|
|
|
|
|
|
|
|
|
|
|
|
|
|
|
|
|
|
|
|
| |
7 | Expenses are equal to the Fund’s annualized expense ratio multiplied by the average account value over the period, multiplied by 183/365 (to reflect the one-half year period shown). Because the Fund is a feeder fund, the expense table reflects the expenses of both the feeder fund and the master portfolio in which it invests. |
| |
8 | Hypothetical 5% annual return before expenses is calculated by pro rating the number of days in the most recent fiscal half year divided by 365.
See “Disclosure of Expenses” on page 10 for further information on how expenses were calculated. |
| | | |
|
|
|
|
| BLACKROCK LARGE CAP SERIES FUNDS, INC. | SEPTEMBER 30, 2010 | 5 |
| |
|
| |
Fund Summary as of September 30, 2010 | BlackRock Large Cap Growth Retirement Portfolio |
|
|
Portfolio Management Commentary |
|
| |
| How did the Fund perform? |
| |
• | BlackRock Large Cap Growth Retirement Portfolio (the “Fund”), through its investment in Master Large Cap Growth Portfolio (the “Portfolio”), underperformed its benchmark, the Russell 1000 Growth Index, for the 12-month period ended September 30, 2010. |
| |
| What factors influenced performance? |
| |
• | Overall, negative results in the IT, industrials and energy sectors overshadowed positive results in health care, telecommunication services and consumer discretionary. |
| |
• | Stock selection (primarily in the computers & peripherals industry) drove underperformance within IT. The Portfolio had a notable exposure to the personal computer (“PC”) market, which struggled as general concerns about macroeconomic growth dampened consumer demand. Additionally, the rapid (and ongoing) adoption of tablets and other mobile devices led to some cannibalization of the traditional consumer PC market. An underweight position and stock selection in semiconductor names also hurt performance. Stock selection hindered performance in the industrials sector as well. Weakness was most pronounced in the commercial services & supplies industry, where select commercial printing holdings were pressured by depressed print advertising spending and industry overcapacity. Lastly, equipment & services names detracted from results within energy. Earlier in the reporting period, energy holdings struggled amid commodity price volatility related to the economic slowdown, as well as contagion from the oil spill in the Gulf of Mexico. In the latter half of the reporting period, underexposure to the industry was a negative, as many of the names that underperformed amid the Gulf oil spill bounced back from their lows. |
| |
• | The largest individual detractors from performance were Seagate Technology, Microsoft Corp., Philip Morris International, Inc. and AES Corp. An underweight in Apple, Inc. proved unfavorable as well. |
| |
• | Conversely, health care was the largest source of positive performance during the 12 months, as the passage of the reform bill resolved uncertainty that had previously clouded the sector’s outlook. An underweight position and positive stock selection in the health care equipment & supplies industry was particularly beneficial, as was selection among defensive pharmaceutical names. Within the telecommunication services sector, the Portfolio’s overweight allocation to the wireless industry aided results, as select holdings demonstrated improving subscriber growth trends. Strong selection amongst specialty retailers benefited performance within consumer discretionary. |
| |
• | The largest individual contributors to performance were Sybase Inc., MetroPCS Communications, Inc., Cisco Systems, Inc. and Limited Brands, Inc. A lack of exposure to Hewlett-Packard Co. and Monsanto Co. also aided relative performance. |
| |
| Describe recent portfolio activity. |
| |
• | During the annual period, we significantly increased the Portfolio’s weighting in the consumer discretionary sector, along with modest increases in IT and telecommunication services. We considerably reduced allocations to health care, energy and consumer staples. |
| |
• | The largest purchases in the Portfolio were Exxon Mobil Corp., Intel Corp., Abbott Laboratories, Seagate Technology and Ford Motor Co. The largest sales included Philip Morris International, Oracle Corp., Amgen, Inc., Johnson & Johnson and Schering-Plough Corp. |
| |
| Describe portfolio positioning at period end. |
| |
• | At period end, we maintained the Portfolio’s pro-cyclical bias, emphasizing companies with strong balance sheets and superior free cash flow. However, we balanced that positioning with exposure to traditional defensive (i.e., less economically sensitive) areas. The Portfolio’s largest sector overweights included consumer discretionary and health care. The largest underweights were in consumer staples and IT. As always, we rely on a disciplined investment process and a belief in the importance of portfolio construction and risk management to strive to deliver consistent outperformance over the long term. |
| |
| The views expressed reflect the opinions of BlackRock as of the date of this report and are subject to change based on changes in market, economic or other conditions. These views are not intended to be a forecast of future events and are no guarantee of future results. |
| | |
|
|
|
6 | BLACKROCK LARGE CAP SERIES FUNDS, INC. | SEPTEMBER 30, 2010 |
|
|
|
BlackRock Large Cap Growth Retirement Portfolio |
|
|
Total Return Based on a $10,000 Investment |
|
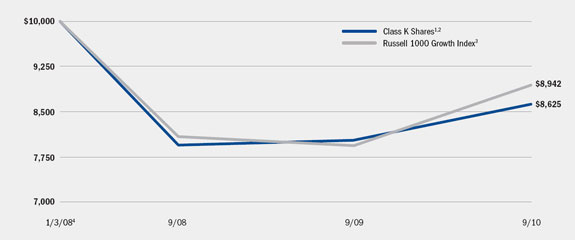
| |
1 | Assuming transaction costs and other operating expenses, including administration fees, if any. |
| |
2 | The Fund invests all of its assets in Master Large Cap Growth Portfolio of Master Large Cap Series LLC. The Portfolio invests at least 80% of its assets in equity securities of large cap companies located in the United States that the investment advisor selects from among those that are, at the time of purchase, included in the Russell 1000 Growth Index. |
| |
3 | This unmanaged broad-based index is a subset of the Russell 1000 Index consisting of those Russell 1000 securities with a greater-than-average growth orientation. |
| |
4 | Commencement of operations. |
|
|
Performance Summary for the Period Ended September 30, 2010 |
|
| | | | | | | | | | |
| | 6-Month
Total Returns | | Average Annual Total Returns5 | |
| | |
|
|
| | | 1 Year | | Since Inception6 | |
|
|
|
|
|
|
|
|
Class K | | (4.79 | )% | | 7.46 | % | | (5.25 | )% | |
Russell 1000 Growth Index | | (0.27 | ) | | 12.65 | | | (4.00 | ) | |
|
|
|
|
|
|
|
|
|
|
|
| | |
| 5 | See “About Fund Performance” on page 10 for a detailed description of the share class, including any related sales charges and fees. |
| | |
| 6 | The Fund commenced operations on January 3, 2008. |
| | |
| | Past performance is not indicative of future results. |
| | | | | | | | | | | | | | | | | | | | | | |
| | Actual | | Hypothetical8 | | | |
| |
| |
| | | |
| | Beginning
Account Value
April 1, 2010 | | Ending
Account Value
September 30, 2010 | | Expenses Paid
During the Period7 | | Beginning
Account Value
April 1, 2010 | | Ending
Account Value
September 30, 2010 | | Expenses Paid
During the Period7 | | Annualized
Expense Ratio | |
|
|
|
|
|
|
|
|
|
|
|
|
|
|
|
|
Class K | | $1,000.00 | | $952.10 | | $3.28 | | $1,000.00 | | $1,021.74 | | $3.40 | | 0.67% | |
|
|
|
|
|
|
|
|
|
|
|
|
|
|
|
|
|
|
|
|
|
|
|
| | |
| 7 | Expenses are equal to the Fund’s annualized expense ratio multiplied by the average account value over the period, multiplied by 183/365 (to reflect the one-half year period shown). Because the Fund is a feeder fund, the expense table reflects the expenses of both the feeder fund and the master portfolio in which it invests. |
| | |
| 8 | Hypothetical 5% annual return before expenses is calculated by pro rating the number of days in the most recent fiscal half year divided by 365.
See “Disclosure of Expenses” on page 10 for further information on how expenses were calculated. |
| | | |
|
|
|
|
| BLACKROCK LARGE CAP SERIES FUNDS, INC. | SEPTEMBER 30, 2010 | 7 |
| |
|
|
Fund Summary as of September 30, 2010 | BlackRock Large Cap Value Retirement Portfolio |
|
|
Portfolio Management Commentary |
|
| |
| How did the Fund perform? |
| |
• | BlackRock Large Cap Value Retirement Portfolio (the “Fund”), through its investment in Master Large Cap Value Portfolio (the “Portfolio”), underperformed its benchmark, the Russell 1000 Value Index, for the 12-month period ended September 30, 2010. |
| |
| What factors influenced performance? |
| |
• | Overall, negative results in the utilities, industrials and financials sectors overshadowed positive results in health care. |
| |
• | The majority of the Portfolio’s underperformance came from the utilities sector, where stock selection detracted for the period. An overweight in independent power producers was particularly detrimental as falling natural gas and rising thermal coal prices hurt performance across the industry. Stock selection was also negative within industrials, primarily in the aerospace & defense and road & rail industries. Lingering government budget deficit concerns adversely affected aerospace & defense names. An underweight in road & rail names hurt relative results as transport companies benefited from early-cycle leverage associated with improved freight volumes. In the financials sector, stock selection amongst insurers detracted from performance, as did a lack of exposure to real estate investment trusts, which performed well amid a re-risking of the market. |
| |
• | The largest individual detractors from performance were Mirant Corp., NRG Energy, Inc., Seagate Technology, Verizon Communications, Inc. and AES Corp. |
| |
• | Conversely, the health care sector was the largest source of positive performance, as the passage of the reform bill resolved uncertainty that had previously clouded the sector’s outlook. An overweight in health care providers & services was particularly beneficial as holdings of health maintenance organizations outperformed due to stellar earnings results and investor comfort with the outcome of reform. |
| |
• | The largest individual contributors to performance were Limited Brands, Inc., Timken Co., Lincare Holdings, Inc. and UnitedHealth Group, Inc. Underweights in JPMorgan Chase & Co. and Wells Fargo & Co. enhanced relative returns as well. |
| |
| Describe recent portfolio activity. |
| |
• | During the annual period, we considerably increased the Portfolio’s weighting in the consumer discretionary sector, along with modest increases in IT, industrials and financials. We significantly reduced the weighting in energy, and modestly decreased weightings in health care and telecommunication services. |
| |
• | The largest purchases in the Portfolio were Bank of America Corp., Citigroup, Inc., Intel Corp., Seagate Technology and Eli Lilly & Co. The largest sales included ConocoPhillips, Exxon Mobil Corp., Verizon Communications, The Goldman Sachs Group, Inc. and Anadarko Petroleum Corp. |
| |
| Describe portfolio positioning at period end. |
| |
• | At period end, we maintained the Portfolio’s pro-cyclical bias, emphasizing companies with strong balance sheets and superior free cash flow. However, we balanced that positioning with exposure to traditional defensive (i.e., less economically sensitive) areas. The Portfolio’s largest sector overweights included IT and consumer discretionary. The largest underweights were in financials and consumer staples. As always, we rely on a disciplined investment process and a belief in the importance of portfolio construction and risk management to strive to deliver consistent outperformance over the long term. |
The views expressed reflect the opinions of BlackRock as of the date of this report and are subject to change based on changes in market, economic or other conditions. These views are not intended to be a forecast of future events and are no guarantee of future results.
| | |
|
|
|
8 | BLACKROCK LARGE CAP SERIES FUNDS, INC. | SEPTEMBER 30, 2010 |
|
|
|
BlackRock Large Cap Value Retirement Portfolio |
|
|
Total Return Based on a $10,000 Investment |
|
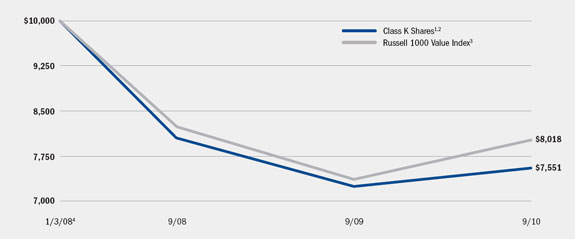
| |
1 | Assuming transaction costs and other operating expenses, including administration fees, if any. |
| |
2 | The Fund invests all of its assets in Master Large Cap Value Portfolio of the Master Large Cap Series LLC. The Portfolio invests at least 80% of its assets in equity securities of large cap companies located in the United States that the investment advisor selects from among those that are, at the time of purchase, included in the Russell 1000 Value Index. |
| |
3 | This unmanaged broad-based index is a subset of the Russell 1000 Index consisting of those Russell 1000 securities with lower price/book ratios and lower forecasted growth values. |
| |
4 | Commencement of operations. |
|
|
Performance Summary for the Period Ended September 30, 2010 |
|
| | | | | | | | | | |
| | 6-Month
Total Returns | | Average Annual Total Returns5 | |
| | |
|
|
| | | 1 Year | | Since Inception6 | |
|
|
|
|
|
|
|
|
Class K | | (4.67 | )% | | 4.23 | % | | (9.74 | )% | |
Russell 1000 Value Index | | (2.14 | ) | | 8.90 | | | (7.74 | ) | |
|
|
|
|
|
|
|
|
|
|
|
| | |
| 5 | See “About Fund Performance” on page 10 for a detailed description of the share class, including any related sales charges and fees. |
| | |
| 6 | The Fund commenced operations on January 3, 2008. |
| | |
| | Past performance is not indicative of future results. |
| | | | | | | | | | | | | | | | | | | | | | |
| | Actual | | Hypothetical8 | | | |
| |
| |
| | | |
| | Beginning
Account Value
April 1, 2010 | | Ending
Account Value
September 30, 2010 | | Expenses Paid
During the Period7 | | Beginning
Account Value
April 1, 2010 | | Ending
Account Value
September 30, 2010 | | Expenses Paid
During the Period7 | | Annualized
Expense Ratio | |
|
|
|
|
|
|
|
|
|
|
|
|
|
|
|
|
Class K | | $1,000.00 | | $953.30 | | $3.28 | | $1,000.00 | | $1,021.74 | | $3.40 | | 0.67% | |
|
|
|
|
|
|
|
|
|
|
|
|
|
|
|
|
|
|
|
|
|
|
|
| | |
| 7 | Expenses are equal to the Fund’s annualized expense ratio multiplied by the average account value over the period, multiplied by 183/365 (to reflect the one-half year period shown). Because the Fund is a feeder fund, the expense table reflects the expenses of both the feeder fund and the master portfolio in which it invests. |
| | |
| 8 | Hypothetical 5% annual return before expenses is calculated by pro rating the number of days in the most recent fiscal half year divided by 365.
See “Disclosure of Expenses” on page 10 for further information on how expenses were calculated. |
| | | |
|
|
|
|
| BLACKROCK LARGE CAP SERIES FUNDS, INC. | SEPTEMBER 30, 2010 | 9 |
|
|
|
About Fund Performance | BlackRock Large Cap Series Funds, Inc. |
| |
• | Class K Shares are not subject to any sales charge. Class K Shares bear no ongoing distribution or service fees and are available only to eligible investors. |
Performance information reflects past performance and does not guarantee future results. Current performance may be lower or higher than the performance data quoted. Refer to www.blackrock.com/funds to obtain performance data current to the most recent month-end. Performance results do not reflect the deduction of taxes that a shareholder would pay on fund distributions or the redemption of fund shares. Figures shown in each of the performance tables on the previous pages assume reinvestment of all dividends and capital gain distributions, if any, at net asset value on the ex-dividend date. Investment return and principal value of shares will fluctuate so that shares, when redeemed, may be worth more or less than their original cost. The Funds’ administrator waived and/or reimbursed a portion of each of the Fund’s expenses. Without such waiver and/or reimbursement, the Funds’ performance would have been lower. The administrator is under no obligation to waive and/or reimburse or continue waiving and/or reimbursing its fees.
Shareholders of these Funds may incur the following charges: (a) expenses related to transactions, including sales charges, redemption fees and exchange fees; and (b) operating expenses including administration fees, service and distribution fees including 12b-1 fees and other Fund expenses. The expense examples on the previous pages (which are based on a hypothetical investment of $1,000 invested on April 1, 2010 and held through September 30, 2010) are intended to assist shareholders both in calculating expenses based on an investment in each Fund and in comparing these expenses with similar costs of investing in other mutual funds.
The tables provide information about actual account values and actual expenses. In order to estimate the expenses a shareholder paid during the period covered by this report, shareholders can divide their account value by $1,000 and then multiply the result by the number corresponding to their Fund and share class under the heading entitled “Expenses Paid During the Period.”
The tables also provide information about hypothetical account values and hypothetical expenses based on the Funds’ actual expense ratio and an assumed rate of return of 5% per year before expenses. In order to assist shareholders in comparing the ongoing expenses of investing in these Funds and other funds, compare the 5% hypothetical example with the 5% hypothetical examples that appear in other funds’ shareholder reports.
The expenses shown in the tables are intended to highlight shareholders’ ongoing costs only and do not reflect any transactional expenses, such as sales charges, redemption fees or exchange fees. Therefore, the hypothetical examples are useful in comparing ongoing expenses only, and will not help shareholders determine the relative total expenses of owning different funds. If these transactional expenses were included, shareholder expenses would have been higher.
| | |
|
|
|
10 | BLACKROCK LARGE CAP SERIES FUNDS, INC. | SEPTEMBER 30, 2010 |
| |
|
| |
Statements of Assets and Liabilities | BlackRock Large Cap Series Funds, Inc. |
| | | | | | | | | | | |
| | | |
September 30, 2010 | | BlackRock
Large Cap Core
Retirement
Portfolio | | BlackRock
Large Cap Growth
Retirement
Portfolio | | BlackRock
Large Cap Value
Retirement
Portfolio | |
|
|
|
|
|
|
|
|
|
|
|
Assets | | | | | | | | | | |
|
|
|
|
|
|
|
|
|
|
|
Investments at value — affiliated — Master Large Cap Core Portfolio, Master Large Cap Growth Portfolio, Master Large Cap Value Portfolio (the “Portfolios”), respectively1 | | $ | 113,287,403 | | $ | 86,723,041 | | $ | 166,965,910 | |
Capital shares sold receivable | | | 122,551 | | | 98,649 | | | 163,618 | |
Receivable from administrator | | | 1,193 | | | 2,246 | | | 6,729 | |
Prepaid expenses | | | 185 | | | 185 | | | 335 | |
| |
|
|
|
|
|
|
|
|
|
Total assets | | | 113,411,332 | | | 86,824,121 | | | 167,136,592 | |
| |
|
|
|
|
|
|
|
|
|
| | | | | | | | | | |
|
|
|
|
|
|
|
|
|
|
|
Liabilities | | | | | | | | | | |
|
|
|
|
|
|
|
|
|
|
|
Contributions payable to the Portfolios | | | 89,313 | | | 52,768 | | | 110,394 | |
Capital shares redeemed payable | | | 33,238 | | | 45,881 | | | 53,224 | |
Other affiliates payable | | | 213 | | | 159 | | | 295 | |
Officer’s fees payable | | | 14 | | | 10 | | | 19 | |
Other accrued expenses payable | | | 47,213 | | | 63,706 | | | 89,912 | |
| |
|
|
|
|
|
|
|
|
|
Total liabilities | | | 169,991 | | | 162,524 | | | 253,844 | |
| |
|
|
|
|
|
|
|
|
|
Net Assets | | $ | 113,241,341 | | $ | 86,661,597 | | $ | 166,882,748 | |
| |
|
|
|
|
|
|
|
|
|
| | | | | | | | | | |
|
|
|
|
|
|
|
|
|
|
|
Net Assets Consist of | | | | | | | | | | |
|
|
|
|
|
|
|
|
|
|
|
Paid-in capital2 | | $ | 153,637,275 | | $ | 108,619,227 | | $ | 189,637,254 | |
Undistributed net investment income | | | 643,051 | | | 326,685 | | | 1,369,716 | |
Accumulated net realized loss allocated from the Portfolios | | | (51,668,517 | ) | | (28,556,820 | ) | | (23,120,151 | ) |
Net unrealized appreciation/depreciation allocated from the Portfolios | | | 10,629,532 | | | 6,272,505 | | | (1,004,071 | ) |
| |
|
|
|
|
|
|
|
|
|
Net Assets | | $ | 113,241,341 | | $ | 86,661,597 | | $ | 166,882,748 | |
| |
|
|
|
|
|
|
|
|
|
Class K — Net asset value per common share, 200 million shares authorized, $0.10 par value | | $ | 10.06 | | $ | 9.54 | | $ | 13.67 | |
| | |
|
|
|
|
|
|
|
|
|
1 | Investments at cost | | $ | 102,657,871 | | $ | 80,450,536 | | $ | 167,969,981 | |
| | |
|
|
|
|
|
|
|
|
|
2 | Shares outstanding | | | 11,257,641 | | | 9,079,575 | | | 12,204,293 | |
| | |
|
|
|
|
|
|
|
|
|
| | | |
See Notes to Financial Statements. |
|
| BLACKROCK LARGE CAP SERIES FUNDS, INC. | SEPTEMBER 30, 2010 | 11 |
| |
|
| |
Statements of Operations | BlackRock Large Cap Series Funds, Inc. |
| | | | | | | | | | |
Year Ended September 30, 2010 | | BlackRock
Large Cap Core
Retirement
Portfolio | | BlackRock
Large Cap Growth
Retirement
Portfolio | | BlackRock
Large Cap Value
Retirement
Portfolio | |
|
|
|
|
|
|
|
|
|
|
|
Investment Income | | | | | | | | | | |
|
|
|
|
|
|
|
|
|
|
|
Net investment income allocated from the Portfolios: | | | | | | | | | | |
Dividends | | $ | 1,804,814 | | $ | 1,104,647 | | $ | 3,034,885 | |
Securities lending — affiliated | | | 8,647 | | | 4,339 | | | 6,276 | |
Dividends — affiliated | | | 23 | | | 33 | | | 43 | |
Interest | | | 6,048 | | | 4,758 | | | 5 | |
Expenses | | | (559,676 | ) | | (482,421 | ) | | (864,995 | ) |
| |
|
|
|
|
|
|
|
|
|
Total income | | | 1,259,856 | | | 631,356 | | | 2,176,214 | |
| |
|
|
|
|
|
|
|
|
|
| | | | | | | | | | |
|
|
|
|
|
|
|
|
|
|
|
Expenses | | | | | | | | | | |
|
|
|
|
|
|
|
|
|
|
|
Transfer agent | | | 147,411 | | | 139,904 | | | 213,771 | |
Printing | | | 21,929 | | | 16,744 | | | 30,596 | |
Professional | | | 21,146 | | | 19,009 | | | 28,453 | |
Registration | | | 16,627 | | | 14,868 | | | 15,445 | |
Officer | | | 57 | | | 43 | | | 81 | |
Miscellaneous | | | 5,928 | | | 5,510 | | | 5,857 | |
| |
|
|
|
|
|
|
|
|
|
Total expenses | | | 213,098 | | | 196,078 | | | 294,203 | |
Less fees reimbursed by administrator | | | (13,486 | ) | | (101,953 | ) | | (74,627 | ) |
| |
|
|
|
|
|
|
|
|
|
Total expenses after reimbursement | | | 199,612 | | | 94,125 | | | 219,576 | |
| |
|
|
|
|
|
|
|
|
|
Net investment income | | | 1,060,244 | | | 537,231 | | | 1,956,638 | |
| |
|
|
|
|
|
|
|
|
|
| | | | | | | | | | |
|
|
|
|
|
|
|
|
|
|
|
Realized and Unrealized Gain (Loss) Allocated from the Portfolios | | | | | | | | | | |
|
|
|
|
|
|
|
|
|
|
|
Net realized gain from investments | | | 10,737,225 | | | 11,335,101 | | | 18,963,147 | |
Net change in unrealized appreciation/depreciation on investments | | | (5,417,728 | ) | | (5,869,761 | ) | | (14,550,524 | ) |
| |
|
|
|
|
|
|
|
|
|
Total realized and unrealized gain | | | 5,319,497 | | | 5,465,340 | | | 4,412,623 | |
| |
|
|
|
|
|
|
|
|
|
Net Increase in Net Assets Resulting from Operations | | $ | 6,379,741 | | $ | 6,002,571 | | $ | 6,369,261 | |
| |
|
|
|
|
|
|
|
|
|
| | |
See Notes to Financial Statements. |
|
12 | BLACKROCK LARGE CAP SERIES FUNDS, INC. | SEPTEMBER 30, 2010 |
| |
|
| |
Statements of Changes in Net Assets | BlackRock Large Cap Series Funds, Inc. |
| | | | | | | | | | | | | | | | | | | | | | | | | | | | |
| | BlackRock
Large Cap Core
Retirement
Portfolio | | BlackRock
Large Cap Growth
Retirement
Portfolio | | BlackRock
Large Cap Value
Retirement
Portfolio | |
| |
| |
| |
|
|
| | Year
Ended
September 30,
2010 | | Period
November 1,
2008 to
September 30,
2009 | | Period
January 3,
20081 to
October 31,
2008 | | Year
Ended
September 30,
2010 | | Period
November 1,
2008 to
September 30,
2009 | | Period
January 3,
20081 to
October 31,
2008 | | Year
Ended
September 30,
2010 | | Period
November 1,
2008 to
September 30,
2009 | | Period
January 3,
20081 to
October 31,
2008 | |
|
|
|
|
|
|
|
|
|
|
|
|
|
|
|
|
|
|
|
|
|
|
|
|
|
|
|
|
|
Operations | | | | | | | | | | | | | | | | | | | | | | | | | | | | |
|
|
|
|
|
|
|
|
|
|
|
|
|
|
|
|
|
|
|
|
|
|
|
|
|
|
|
|
|
Net investment income | | $ | 1,060,244 | | $ | 1,269,155 | | $ | 890,928 | | $ | 537,231 | | $ | 498,698 | | $ | 278,830 | | $ | 1,956,638 | | $ | 1,899,074 | | $ | 895,410 | |
Net realized gain (loss) | | | 10,737,225 | | | (25,295,594 | ) | | (37,110,148 | ) | | 11,335,101 | | | (17,833,904 | ) | | (22,058,017 | ) | | 18,963,147 | | | (17,904,084 | ) | | (24,176,745 | ) |
Net change in unrealized appreciation/depreciation | | | (5,417,728 | ) | | 36,497,446 | | | (20,450,186 | ) | | (5,869,761 | ) | | 31,525,033 | | | (19,382,767 | ) | | (14,550,524 | ) | | 26,258,149 | | | (12,711,696 | ) |
| |
|
|
|
|
|
|
|
| |
|
|
|
|
|
|
|
| |
|
|
|
|
|
|
|
|
|
Net increase (decrease) in net assets resulting from operations | | | 6,379,741 | | | 12,471,007 | | | (56,669,406 | ) | | 6,002,571 | | | 14,189,827 | | | (41,161,954 | ) | | 6,369,261 | | | 10,253,139 | | | (35,993,031 | ) |
| |
|
|
|
|
|
|
|
| |
|
|
|
|
|
|
|
| |
|
|
|
|
|
|
|
|
|
| | | | | | | | | | | | | | | | | | | | | | | | | | | | |
|
|
|
|
|
|
|
|
|
|
|
|
|
|
|
|
|
|
|
|
|
|
|
|
|
|
|
|
|
Dividends to Shareholders From | | | | | | | | | | | | | | | | | | | | | | | | | | | | |
|
|
|
|
|
|
|
|
|
|
|
|
|
|
|
|
|
|
|
|
|
|
|
|
|
|
|
|
|
Net investment income | | | (1,400,002 | ) | | (1,200,011 | ) | | — | | | (500,007 | ) | | (500,011 | ) | | — | | | (2,000,004 | ) | | (1,400,005 | ) | | — | |
| |
|
|
|
|
|
|
|
| |
|
|
|
|
|
|
|
| |
|
|
|
|
|
|
|
|
|
| | | | | | | | | | | | | | | | | | | | | | | | | | | | |
|
|
|
|
|
|
|
|
|
|
|
|
|
|
|
|
|
|
|
|
|
|
|
|
|
|
|
|
|
Capital Share Transactions | | | | | | | | | | | | | | | | | | | | | | | | | | | | |
|
|
|
|
|
|
|
|
|
|
|
|
|
|
|
|
|
|
|
|
|
|
|
|
|
|
|
|
|
Net increase (decrease) in net assets derived from capital share transactions | | | (926,352 | ) | | (7,307,145 | ) | | 161,893,509 | | | (1,939,099 | ) | | (11,474,101 | ) | | 122,044,371 | | | 29,953,412 | | | (4,452,214 | ) | | 164,152,190 | |
| |
|
|
|
|
|
|
|
| |
|
|
|
|
|
|
|
| |
|
|
|
|
|
|
|
|
|
| | | | | | | | | | | | | | | | | | | | | | | | | | | | |
|
|
|
|
|
|
|
|
|
|
|
|
|
|
|
|
|
|
|
|
|
|
|
|
|
|
|
|
|
Net Assets | | | | | | | | | | | | | | | | | | | | | | | | | | | | |
|
|
|
|
|
|
|
|
|
|
|
|
|
|
|
|
|
|
|
|
|
|
|
|
|
|
|
|
|
Total increase in net assets | | | 4,053,387 | | | 3,963,851 | | | 105,224,103 | | | 3,563,465 | | | 2,215,715 | | | 80,882,417 | | | 34,322,669 | | | 4,400,920 | | | 128,159,159 | |
Beginning of period | | | 109,187,954 | | | 105,224,103 | | | — | | | 83,098,132 | | | 80,882,417 | | | — | | | 132,560,079 | | | 128,159,159 | | | — | |
| |
|
|
|
|
|
|
|
| |
|
|
|
|
|
|
|
| |
|
|
|
|
|
|
|
|
|
End of period | | $ | 113,241,341 | | $ | 109,187,954 | | $ | 105,224,103 | | $ | 86,661,597 | | $ | 83,098,132 | | $ | 80,882,417 | | $ | 166,882,748 | | $ | 132,560,079 | | $ | 128,159,159 | |
| |
|
|
|
|
|
|
|
| |
|
|
|
|
|
|
|
| |
|
|
|
|
|
|
|
|
|
Undistributed net investment income | | $ | 643,051 | | $ | 982,809 | | $ | 908,495 | | $ | 326,685 | | $ | 289,461 | | $ | 289,143 | | $ | 1,369,716 | | $ | 1,412,855 | | $ | 910,850 | |
| |
|
|
|
|
|
|
|
| |
|
|
|
|
|
|
|
| |
|
|
|
|
|
|
|
|
|
| | |
| 1 | Commencement of operations. |
| | | |
See Notes to Financial Statements. |
|
| BLACKROCK LARGE CAP SERIES FUNDS, INC. | SEPTEMBER 30, 2010 | 13 |
| |
|
| |
Financial Highlights | BlackRock Large Cap Series Funds, Inc. |
| | | | | | | | | | | | | | | | | | | | | | | | | | | | |
| | Class K | |
| |
|
|
| | BlackRock
Large Cap Core
Retirement
Portfolio | | BlackRock
Large Cap Growth
Retirement
Portfolio | | BlackRock
Large Cap Value
Retirement
Portfolio | |
| |
| |
| |
|
|
| | Year
Ended
September 30,
2010 | | Period
November 1,
2008 to
September 30,
2009 | | Period
January 3,
20081 to
October 31,
2008 | | Year
Ended
September 30,
2010 | | Period
November 1,
2008 to
September 30,
2009 | | Period
January 3,
20081 to
October 31,
2008 | | Year
Ended
September 30,
2010 | | Period
November 1,
2008 to
September 30,
2009 | | Period
January 3,
20081 to
October 31,
2008 | |
|
|
|
|
|
|
|
|
|
|
|
|
|
|
|
|
|
|
|
|
Per Share Operating Performance | | | | | | | | | | | | | | | | | | | | | | | | | | | | |
|
|
|
|
|
|
|
|
|
|
|
|
|
|
|
|
|
|
|
|
|
|
|
|
|
|
|
|
|
Net asset value, beginning of period | | $ | 9.61 | | $ | 8.64 | | $ | 13.25 | | $ | 8.93 | | $ | 7.45 | | $ | 11.20 | | $ | 13.28 | | $ | 12.33 | | $ | 18.54 | |
| |
|
|
|
|
|
|
|
| |
|
|
|
|
|
|
|
| |
|
|
|
|
|
|
|
|
|
Net investment income2 | | | 0.09 | | | 0.11 | | | 0.07 | | | 0.06 | | | 0.05 | | | 0.02 | | | 0.17 | | | 0.18 | | | 0.13 | |
Net realized and unrealized gain (loss) | | | 0.49 | | | 0.96 | | | (4.68 | ) | | 0.61 | | | 1.48 | | | (3.77 | ) | | 0.39 | | | 0.91 | | | (6.34 | ) |
| |
|
|
|
|
|
|
|
| |
|
|
|
|
|
|
|
| |
|
|
|
|
|
|
|
|
|
Net increase (decrease) from investment operations | | | 0.58 | | | 1.07 | | | (4.61 | ) | | 0.67 | | | 1.53 | | | (3.75 | ) | | 0.56 | | | 1.09 | | | (6.21 | ) |
| |
|
|
|
|
|
|
|
| |
|
|
|
|
|
|
|
| |
|
|
|
|
|
|
|
|
|
Dividends from net investment income | | | (0.13 | ) | | (0.10 | ) | | — | | | (0.06 | ) | | (0.05 | ) | | — | | | (0.17 | ) | | (0.14 | ) | | — | |
| |
|
|
|
|
|
|
|
| |
|
|
|
|
|
|
|
| |
|
|
|
|
|
|
|
|
|
Net asset value, end of period | | $ | 10.06 | | $ | 9.61 | | $ | 8.64 | | $ | 9.54 | | $ | 8.93 | | $ | 7.45 | | $ | 13.67 | | $ | 13.28 | | $ | 12.33 | |
| |
|
|
|
|
|
|
|
| |
|
|
|
|
|
|
|
| |
|
|
|
|
|
|
|
|
|
| | | | | | | | | | | | | | | | | | | | | | | | | | | | |
|
|
|
|
|
|
|
|
|
|
|
|
|
|
|
|
|
|
|
|
|
|
|
|
|
|
|
|
|
Total Investment Return3 | | | | | | | | | | | | | | | | | | | | | | | | | | | | |
|
|
|
|
|
|
|
|
|
|
|
|
|
|
|
|
|
|
|
|
|
|
|
|
|
|
|
|
|
Based on net asset value | | | 6.01 | % | | 12.55 | %4,5 | | (34.79 | )%4 | | 7.46 | % | | 20.66 | %4,6 | | (33.48 | )%4 | | 4.23 | % | | 8.93 | %4,7 | | (33.50 | )%4 |
| |
|
|
|
|
|
|
|
| |
|
|
|
|
|
|
|
| |
|
|
|
|
|
|
|
|
|
| | | | | | | | | | | | | | | | | | | | | | | | | | | | |
|
|
|
|
|
|
|
|
|
|
|
|
|
|
|
|
|
|
|
|
|
|
|
|
|
|
|
|
|
Ratios to Average Net Assets8 | | | | | | | | | | | | | | | | | | | | | | | | | | | | |
|
|
|
|
|
|
|
|
|
|
|
|
|
|
|
|
|
|
|
|
|
|
|
|
|
|
|
|
|
Total expenses | | | 0.68 | % | | 0.73 | %9 | | 0.71 | %9 | | 0.79 | % | | 0.88 | %9 | | 0.81 | %9 | | 0.72 | % | | 0.77 | %9 | | 0.78 | %9 |
| |
|
|
|
|
|
|
|
| |
|
|
|
|
|
|
|
| |
|
|
|
|
|
|
|
|
|
Total expenses after reimbursement | | | 0.67 | % | | 0.66 | %9 | | 0.62 | %9 | | 0.67 | % | | 0.66 | %9 | | 0.65 | %9 | | 0.67 | % | | 0.66 | %9 | | 0.63 | %9 |
| |
|
|
|
|
|
|
|
| |
|
|
|
|
|
|
|
| |
|
|
|
|
|
|
|
|
|
Net investment income | | | 0.93 | % | | 1.39 | %9 | | 0.76 | %9 | | 0.62 | % | | 0.73 | %9 | | 0.30 | %9 | | 1.21 | % | | 1.74 | %9 | | 1.03 | %9 |
| |
|
|
|
|
|
|
|
| |
|
|
|
|
|
|
|
| |
|
|
|
|
|
|
|
|
|
| | | | | | | | | | | | | | | | | | | | | | | | | | | | |
|
|
|
|
|
|
|
|
|
|
|
|
|
|
|
|
|
|
|
|
|
|
|
|
|
|
|
|
|
Supplemental Data | | | | | | | | | | | | | | | | | | | | | | | | | | | | |
|
|
|
|
|
|
|
|
|
|
|
|
|
|
|
|
|
|
|
|
|
|
|
|
|
|
|
|
|
Net assets, end of period (000) | | $ | 113,241 | | $ | 109,188 | | $ | 105,224 | | $ | 86,662 | | $ | 83,098 | | $ | 80,882 | | $ | 166,883 | | $ | 132,560 | | $ | 128,159 | |
| |
|
|
|
|
|
|
|
| |
|
|
|
|
|
|
|
| |
|
|
|
|
|
|
|
|
|
Portfolio turnover of the Portfolio | | | 173 | % | | 168 | % | | 109 | % | | 232 | % | | 242 | % | | 144 | % | | 183 | % | | 151 | % | | 108 | % |
| |
|
|
|
|
|
|
|
| |
|
|
|
|
|
|
|
| |
|
|
|
|
|
|
|
|
|
| | |
| 1 | Commencement of operations. |
| | |
| 2 | Based on average shares outstanding. |
| | |
| 3 | Where applicable, total investment returns include the reinvestment of dividends and distributions. |
| | |
| 4 | Aggregate total investment return. |
| | |
| 5 | Includes proceeds received from a settlement of litigation, through its investment in the Portfolio, which impacted the Fund’s total investment return. Not including these proceeds, the total investment return would have been 12.08%. |
| | |
| 6 | Includes proceeds received from a settlement of litigation, through its investment in the Portfolio, which impacted the Fund’s total investment return. Not including these proceeds, the total investment return would have been 20.25%. |
| | |
| 7 | Includes proceeds received from a settlement of litigation, through its investment in the Portfolio, which impacted the Fund’s total investment return. Not including these proceeds, the total investment return would have been 8.52%. |
| | |
| 8 | Includes the Fund’s share of the applicable Portfolio’s allocated expenses and/or net investment income (loss). |
| | |
| 9 | Annualized. |
| | |
See Notes to Financial Statements. |
|
14 | BLACKROCK LARGE CAP SERIES FUNDS, INC. | SEPTEMBER 30, 2010 |
| |
|
|
| |
Notes to Financial Statements | BlackRock Large Cap Series Funds, Inc. |
1. Organization and Significant Accounting Policies:
BlackRock Large Cap Core Retirement Portfolio, BlackRock Large Cap Growth Retirement Portfolio and BlackRock Large Cap Value Retirement Portfolio (collectively the “Funds” or individually a “Fund”), constitute three of the series of BlackRock Large Cap Series Funds, Inc. (the “Corporation”), which is registered under the Investment Company Act of 1940, as amended (the “1940 Act”), as a diversified, open-end management investment company. The Corporation is organized as a Maryland corporation. Each Fund seeks to achieve its investment objective by investing all, or a portion of, its assets in Master Large Cap Core Portfolio, Master Large Cap Growth Portfolio and Master Large Cap Value Portfolio (collectively the “Portfolios” or individually a “Portfolio”), respectively, constituting Master Large Cap Series LLC (the “Master LLC”), each of which has the same investment objective and strategies as the corresponding Fund. The value of a Fund’s investment in the applicable Portfolio reflects the Fund’s proportionate interest in the net assets of such Portfolio. As of September 30, 2010, the percentages of Master Large Cap Core Portfolio, Master Large Cap Growth Portfolio and Master Large Cap Value Portfolio owned by BlackRock Large Cap Core Retirement Portfolio, BlackRock Large Cap Growth Retirement Portfolio and BlackRock Large Cap Value Retirement Portfolio, were 4%, 13% and 8%, respectively. The performance of a Fund is directly affected by the performance of the applicable Portfolio. The financial statements of the Portfolios, including the Schedules of Investments, are included elsewhere in this report and should be read in conjunction with the Funds’ financial statements. The Funds’ financial statements are prepared in conformity with accounting principles generally accepted in the United States of America (“US GAAP”), which may require management to make estimates and assumptions that affect the reported amounts and disclosures in the financial statements. Actual results could differ from those estimates.
The following is a summary of significant accounting policies followed by the Funds:
Valuation: The Funds’ policy is to fair value their financial instruments at market value. Each Fund records its investment in the corresponding Portfolio at fair value based on the Fund’s proportionate interest in the net assets of the Portfolio. Valuation of securities held by a Portfolio, including categorization of fair value measurements, is discussed in Note 1 of the Master LLC ‘s Notes to Financial Statements, which are included elsewhere in this report.
Investment Transactions and Investment Income: For financial reporting purposes, investment transactions are recorded on the dates the transactions are entered into (the trade dates). Each Fund records daily its proportionate share of the corresponding Portfolio’s income, expenses and realized and unrealized gains and losses. In addition, the Fund accrues its own expenses.
Dividends and Distributions: Dividends and distributions paid by each Fund are recorded on the ex-dividend dates. The amount and timing of dividends and distributions are determined in accordance with federal income tax regulations, which may differ from US GAAP.
Income Taxes: It is each Fund’s policy to comply with the requirements of the Internal Revenue Code of 1986, as amended, applicable to regulated investment companies and to distribute substantially all of its taxable income to its shareholders. Therefore, no federal income tax provision is required.
Each Fund files US federal and various state and local tax returns. No income tax returns are currently under examination. The statute of limitations on each Fund’s US federal, state and local tax returns remains open for the year ended September 30, 2010 and the periods ended September 30, 2009 and October 31, 2008. There are no uncertain tax positions that require recognition of a tax liability.
Other: Expenses directly related to a Fund are charged to that Fund. Other operating expenses shared by several funds are pro rated among those funds on the basis of relative net assets or other appropriate methods.
2. Administration Agreement and Other Transactions with Affiliates:
The PNC Financial Services Group, Inc. (“PNC”), Bank of America Corporation (“BAC”) and Barclays Bank PLC (“Barclays”) are the largest stockholders of BlackRock, Inc. (“BlackRock”). Due to the ownership structure, PNC is an affiliate of the Funds for 1940 Act purposes, but BAC and Barclays are not.
The Corporation, on behalf of each Fund, entered into an Administration Agreement with BlackRock Advisors, LLC (the “Administrator”), an indirect, wholly owned subsidiary of BlackRock, to provide administrative services (other than investment advice and related portfolio activities).
The Administrator does not receive an administration fee. The Administrator has contractually agreed to waive and/or reimburse fees and/or expenses of each Fund in order to limit expenses (excluding interest expense, acquired fund fees and expenses and certain other fund expenses) of each Fund to 0.67% of the average daily net assets of such Fund. This arrangement has a one-year term and is renewable. The Administrator has agreed not to reduce or discontinue this contractual waiver or reimbursement until February 1, 2011 unless approved by the Board of Directors including a majority of the noninterested Directors. These amounts are shown as fees reimbursed by administrator in the Statements of Operations.
BNY Mellon Investment Servicing (US) Inc. (formerly PNC Global Investment Servicing (US) Inc. (“PNCGIS”)), serves as transfer agent and dividend disbursing agent. On July 1, 2010, The Bank of New York Mellon Corporation purchased PNCGIS and PFPC Trust Company, which prior to this date was an indirect, wholly owned subsidiary of PNC and an affiliate of the Administrator. Transfer agency fees borne by each Fund are comprised of those fees charged for all shareholder communications including mailing of shareholder reports, dividend and distribution notices, and proxy materials for shareholder meetings, as well as per account and per transaction fees related to servicing and maintenance of shareholder accounts, including the issuing, redeeming and transferring of shares, check writing, anti-money laundering services, and customer identification services. Pursuant to written agreements, certain financial intermediaries, some of which may be affiliates, provide the Funds with sub-accounting, recordkeeping, sub-transfer agency and other administrative services with respect to sub-accounts they service. For these services, these entities receive a fee that could vary depending on,
| | | |
|
|
|
|
| BLACKROCK LARGE CAP SERIES FUNDS, INC. | SEPTEMBER 30, 2010 | 15 |
| |
|
|
| |
Notes to Financial Statements (continued) | BlackRock Large Cap Series Funds, Inc. |
among other things, shareholder accounts, share class and net assets. For the year ended September 30, 2010, the Funds paid the following to affiliates in return for these services, which is included in transfer agent in the Statements of Operations:
| | | | |
|
|
|
|
|
BlackRock Large Cap Core Retirement Portfolio | | $ | 48 | |
BlackRock Large Cap Growth Retirement Portfolio | | $ | 18 | |
BlackRock Large Cap Value Retirement Portfolio | | $ | 101 | |
|
|
|
|
|
The Administrator maintains a call center, which is responsible for providing shareholder services to the Funds, such as responding to shareholder inquiries and processing transactions based upon instructions from shareholders with respect to the subscription and redemption of Fund shares. For the year ended September 30, 2010, each Fund reimbursed the Administrator the following amounts for costs incurred in running the call center, which are included in transfer agent in the Statements of Operations.
| | | | |
|
|
|
|
|
BlackRock Large Cap Core Retirement Portfolio | | $ | 801 | |
BlackRock Large Cap Growth Retirement Portfolio | | $ | 603 | |
BlackRock Large Cap Value Retirement Portfolio | | $ | 1,131 | |
|
|
|
|
|
Certain officers and/or Directors of the Corporation are officers and/or directors of BlackRock or its affiliates. The Funds reimburse the Administrator for compensation paid to the Funds’ Chief Compliance Officer.
3. Income Tax Information:
Reclassifications: Accounting principles generally accepted in the United States of America require that certain components of net assets be adjusted to reflect permanent differences between financial and tax reporting. These reclassifications have no effect on net assets or net asset values per share. The following permanent differences as of September 30, 2010 attributable to the classification of settlement proceeds and non-deductible expenses were reclassified to the following accounts:
| | | | | | |
|
|
|
|
|
| | BlackRock
Large Cap Value
Retirement
Portfolio | |
|
|
|
|
|
Paid-in capital | | $ | (17 | ) | |
Undistributed net investment income | | $ | 227 | | |
Accumulated net realized loss | | $ | (210 | ) | |
|
|
|
|
|
| | | | | | | |
The tax character of distributions paid during the fiscal years ended September 30, 2010 and September 30, 2009 was as follows:
| | | | | | | | | | | | | | | | |
|
|
|
|
|
|
|
|
|
|
|
|
|
|
|
|
|
| | | | | BlackRock
Large Cap Core
Retirement
Portfolio | | BlackRock
Large Cap Growth
Retirement
Portfolio | | BlackRock
Large Cap Value
Retirement
Portfolio | |
|
|
|
|
|
|
|
|
|
|
|
|
|
|
|
|
|
Ordinary income | | | | | | | | | | | | | | | | |
9/30/2010 | | | | | $ | 1,400,002 | | | $ | 500,007 | | | $ | 2,000,004 | | |
9/30/2009 | | | | | $ | 1,200,011 | | | $ | 500,011 | | | $ | 1,400,005 | | |
|
|
|
|
|
|
|
|
|
|
|
|
|
|
|
|
|
Total distributions | | | | | | | | | | | | | | | | |
9/30/2010 | | | | | $ | 1,400,002 | | | $ | 500,007 | | | $ | 2,000,004 | | |
| | | | |
|
|
|
|
|
|
|
|
|
|
|
|
9/30/2009 | | | | | $ | 1,200,011 | | | $ | 500,011 | | | $ | 1,400,005 | | |
| | | | |
|
|
|
|
|
|
|
|
|
|
|
|
As of September 30, 2010, the tax components of accumulated net losses were as follows:
| | | | | | | | | | |
|
|
|
|
|
|
|
|
|
|
|
| | BlackRock
Large Cap Core
Retirement
Portfolio | | BlackRock
Large Cap Growth
Retirement
Portfolio | | BlackRock
Large Cap Value
Retirement
Portfolio | |
|
|
|
|
|
|
|
|
|
|
|
Undistributed ordinary income | | $ | 629,276 | | $ | 317,014 | | $ | 1,353,832 | |
Capital loss carryforwards | | | (50,073,326 | ) | | (27,798,877 | ) | | (25,983,137 | ) |
Net unrealized gains* | | | 9,048,116 | | | 5,524,233 | | | 1,874,799 | |
| |
|
|
|
|
|
|
|
|
|
Total | | $ | (40,395,934 | ) | $ | (21,957,630 | ) | $ | (22,754,506 | ) |
| |
|
|
|
|
|
|
|
|
|
| | |
| * | The differences between book-basis and tax-basis net unrealized gains were attributable primarily to the tax deferral of losses on wash sales and the timing and recognition of partnership income. |
As of September 30, 2010, the Funds had capital loss carryforwards available to offset future realized capital gains through the indicated expiration dates:
| | | | | | | | | | |
|
|
|
|
|
|
|
|
|
|
|
Expires September 30, | | BlackRock
Large Cap Core
Retirement
Portfolio | | BlackRock
Large Cap Growth
Retirement
Portfolio | | BlackRock
Large Cap Value
Retirement
Portfolio | |
|
|
|
|
|
|
|
|
2016 | | $ | 25,584,450 | | $ | 9,547,659 | | $ | 10,074,617 | |
2017 | | | 24,488,876 | | | 18,251,218 | | | 15,908,520 | |
| |
|
|
|
|
|
|
|
|
|
Total | | $ | 50,073,326 | | $ | 27,798,877 | | $ | 25,983,137 | |
| |
|
|
|
|
|
|
|
|
|
| | |
|
|
|
16 | BLACKROCK LARGE CAP SERIES FUNDS, INC. | SEPTEMBER 30, 2010 |
| |
|
|
| |
Notes to Financial Statements (concluded) | BlackRock Large Cap Series Funds, Inc. |
4. Capital Share Transactions:
Transactions in capital shares for Class K were as follows:
| | | | | | | | | | | | | | | | | | | |
BlackRock Large Cap Core
Retirement Portfolio | | Year Ended
September 30, 2010 | | Period November 1, 2008 to
September 30, 2009 | | Period January 3, 20081 to
October 31, 2008 | |
|
| |
| |
|
|
| Shares | | Amount | | Shares | | Amount | | Shares | | Amount | |
|
|
|
|
|
|
|
|
|
|
|
|
|
|
Class K | | | | | | | | | | | | | | | | | | | |
|
|
|
|
|
|
|
|
|
|
|
|
|
|
|
|
|
|
|
|
Shares sold | | | 2,791,444 | | $ | 28,019,345 | | | 3,221,197 | | $ | 25,865,214 | | | 15,728,260 | | $ | 202,504,200 | |
Shares issued to shareholders in reinvestment of dividends | | | 132,185 | | | 1,324,321 | | | 140,867 | | | 1,171,704 | | | — | | | — | |
| |
|
|
|
|
| |
|
|
|
|
| |
|
|
|
|
|
|
Total issued | | | 2,923,629 | | | 29,343,666 | | | 3,362,064 | | | 27,036,918 | | | 15,728,260 | | | 202,504,200 | |
Shares redeemed | | | (3,031,135 | ) | | (30,270,018 | ) | | (4,181,262 | ) | | (34,344,063 | ) | | (3,543,915 | ) | | (40,610,691 | ) |
| |
|
|
|
|
| |
|
|
|
|
| |
|
|
|
|
|
|
Net increase (decrease) | | | (107,506 | ) | $ | (926,352 | ) | | (819,198 | ) | $ | (7,307,145 | ) | | 12,184,345 | | $ | 161,893,509 | |
| |
|
|
|
|
| |
|
|
|
|
| |
|
|
|
|
|
|
| | | | | | | | | | | | | | | | | | | |
BlackRock Large Cap Growth Retirement Portfolio | | | | | | | | | | | | | | | | | | | |
|
|
|
|
|
|
|
|
|
|
|
|
|
|
|
|
|
|
|
|
Class K | | | | | | | | | | | | | | | | | | | |
|
|
|
|
|
|
|
|
|
|
|
|
|
|
|
|
|
|
|
|
Shares sold | | | 2,203,293 | | $ | 20,810,169 | | | 2,606,730 | | $ | 18,886,875 | | | 14,459,452 | | $ | 157,367,603 | |
Shares issued to shareholders in reinvestment of dividends | | | 49,515 | | | 465,345 | | | 67,964 | | | 481,662 | | | — | | | — | |
| |
|
|
|
|
| |
|
|
|
|
| |
|
|
|
|
|
|
Total issued | | | 2,252,808 | | | 21,275,514 | | | 2,674,694 | | | 19,368,537 | | | 14,459,452 | | | 157,367,603 | |
Shares redeemed | | | (2,481,885 | ) | | (23,214,613 | ) | | (4,220,846 | ) | | (30,842,638 | ) | | (3,604,648 | ) | | (35,323,232 | ) |
| |
|
|
|
|
| |
|
|
|
|
| |
|
|
|
|
|
|
Net increase (decrease) | | | (229,077 | ) | $ | (1,939,099 | ) | | (1,546,152 | ) | $ | (11,474,101 | ) | | 10,854,804 | | $ | 122,044,371 | |
| |
|
|
|
|
| |
|
|
|
|
| |
|
|
|
|
|
|
| | | | | | | | | | | | | | | | | | | |
BlackRock Large Cap Value Retirement Portfolio | | | | | | | | | | | | | | | | | | | |
|
|
|
|
|
|
|
|
|
|
|
|
|
|
|
|
|
|
|
|
Class K | | | | | | | | | | | | | | | | | | | |
|
|
|
|
|
|
|
|
|
|
|
|
|
|
|
|
|
|
|
|
Shares sold | | | 4,367,548 | | $ | 59,137,520 | | | 2,120,540 | | $ | 24,422,164 | | | 12,490,568 | | $ | 198,023,858 | |
Shares issued to shareholders in reinvestment of dividends | | | 142,671 | | | 1,950,228 | | | 116,254 | | | 1,380,656 | | | — | | | — | |
| |
|
|
|
|
| |
|
|
|
|
| |
|
|
|
|
|
|
Total issued | | | 4,510,219 | | | 61,087,748 | | | 2,236,794 | | | 25,802,820 | | | 12,490,568 | | | 198,023,858 | |
Shares redeemed | | | (2,288,667 | ) | | (31,134,336 | ) | | (2,650,582 | ) | | (30,255,034 | ) | | (2,094,039 | ) | | (33,871,668 | ) |
| |
|
|
|
|
| |
|
|
|
|
| |
|
|
|
|
|
|
Net increase (decrease) | | | 2,221,552 | | $ | 29,953,412 | | | (413,788 | ) | $ | (4,452,214 | ) | | 10,396,529 | | $ | 164,152,190 | |
| |
|
|
|
|
| |
|
|
|
|
| |
|
|
|
|
|
|
| | |
| 1 | Commencement of operations. |
5. Subsequent Events:
Management has evaluated the impact of all subsequent events on each Fund through the date the financial statements were issued and has determined that there were no subsequent events requiring adjustment or additional disclosure in the financial statements.
| | | |
|
|
|
|
| BLACKROCK LARGE CAP SERIES FUNDS, INC. | SEPTEMBER 30, 2010 | 17 |
| |
|
|
| |
Report of Independent Registered Public Accounting Firm | BlackRock Large Cap Series Funds, Inc. |
To the Shareholders and Board of Directors of BlackRock Large Cap Series Funds, Inc.:
We have audited the accompanying statements of assets and liabilities of BlackRock Large Cap Core Retirement Portfolio, BlackRock Large Cap Growth Retirement Portfolio and BlackRock Large Cap Value Retirement Portfolio, three of the series constituting BlackRock Large Cap Series Funds, Inc. (the “Fund”), as of September 30, 2010, and the related statements of operations for the year then ended, and the statements of changes in net assets and the financial highlights for the year then ended, for the period November 1, 2008 through September 30, 2009, and for the period January 3, 2008 (commencement of operations) through October 31, 2008. These financial statements and financial highlights are the responsibility of the Fund’s management. Our responsibility is to express an opinion on these financial statements and financial highlights based on our audits.
We conducted our audits in accordance with the standards of the Public Company Accounting Oversight Board (United States). Those standards require that we plan and perform the audit to obtain reasonable assurance about whether the financial statements and financial highlights are free of material misstatement. The Fund is not required to have, nor were we engaged to perform, an audit of its internal control over financial reporting. Our audits included consideration of internal control over financial reporting as a basis for designing audit procedures that are appropriate in the circumstances, but not for the purpose of expressing an opinion on the effectiveness of the Fund’s internal control over financial reporting. Accordingly, we express no such opinion. An audit also includes examining, on a test basis, evidence supporting the amounts and disclosures in the financial statements, assessing the accounting principles used and significant estimates made by management, as well as evaluating the overall financial statement presentation. We believe that our audits provide a reasonable basis for our opinion.
In our opinion, the financial statements and financial highlights referred to above present fairly, in all material respects, the financial positions of BlackRock Large Cap Core Retirement Portfolio, BlackRock Large Cap Growth Retirement Portfolio and BlackRock Large Cap Value Retirement Portfolio of BlackRock Large Cap Series Funds, Inc. as of September 30, 2010, the results of their operations for the year then ended, and the changes in their net assets and the financial highlights for the year then ended, for the period November 1, 2008 through September 30, 2009, and for the period January 3, 2008 (commencement of operations) through October 31, 2008, in conformity with accounting principles generally accepted in the United States of America.
Deloitte & ToucheLLP
Princeton, New Jersey
November 26, 2010
| | | | | | | | | | | | | | | | | |
|
|
|
|
|
|
|
|
|
|
|
|
|
|
|
|
|
|
Important Tax Information (Unaudited) | | | | | | | | | | | | | | | | | |
|
|
|
|
|
|
|
|
|
|
|
|
|
|
|
|
|
|
|
The following information is provided with respect to the ordinary income distributions paid during the fiscal year ended September 30, 2010: |
|
|
|
|
|
|
|
|
|
|
|
|
|
|
|
|
|
|
|
| | Payable Date | | BlackRock
Large Cap Core
Retirement
Portfolio | | BlackRock
Large Cap Growth
Retirement
Portfolio | | BlackRock
Large Cap Value
Retirement
Portfolio | |
|
|
|
|
|
|
|
|
|
|
Qualified Dividend Income for Individuals | | | 12/17/09 | | | | 100% | | | | 100% | | | | 100% | | |
|
|
|
|
|
|
|
|
|
|
|
|
|
|
|
|
|
|
Dividends Qualifying for the Dividend Received Deduction for Corporations | | | 12/17/09 | | | | 100% | | | | 100% | | | | 100% | | |
|
|
|
|
|
|
|
|
|
|
|
|
|
|
|
|
|
|
| | |
|
|
|
18 | BLACKROCK LARGE CAP SERIES FUNDS, INC. | SEPTEMBER 30, 2010 |
| |
|
|
| |
Portfolio Information as of September 30, 2010 | Master Large Cap Series LLC |
| | | | | |
|
|
|
|
|
Ten Largest Holdings | | | | |
|
|
|
|
|
|
Master Large Cap Core Portfolio | | Percent of
Long-Term Investments | |
|
|
|
|
Intel Corp. | | | 2 | % | |
Exxon Mobil Corp. | | | 2 | | |
Comcast Corp., Class A | | | 1 | | |
Amgen, Inc. | | | 1 | | |
UnitedHealth Group, Inc. | | | 1 | | |
Eli Lilly & Co. | | | 1 | | |
Dell, Inc. | | | 1 | | |
News Corp., Class A | | | 1 | | |
Corning, Inc. | | | 1 | | |
Apple, Inc. | | | 1 | | |
|
|
|
|
|
|
| | | | | |
Master Large Cap Growth Portfolio | | Percent of
Long-Term Investments | |
|
|
|
|
|
|
Microsoft Corp. | | | 3 | % | |
Exxon Mobil Corp. | | | 3 | | |
Apple, Inc. | | | 2 | | |
Intel Corp. | | | 2 | | |
Ford Motor Co. | | | 2 | | |
Abbott Laboratories | | | 2 | | |
Dell, Inc. | | | 1 | | |
TJX Cos., Inc. | | | 1 | | |
Manitowoc Co. | | | 1 | | |
Limited Brands, Inc. | | | 1 | | |
|
|
|
|
|
|
| | | | | |
Master Large Cap Value Portfolio | | Percent of
Long-Term Investments | |
|
|
|
|
|
|
Bank of America Corp. | | | 3 | % | |
Citigroup, Inc. | | | 2 | | |
UnitedHealth Group, Inc. | | | 2 | | |
Intel Corp. | | | 2 | | |
Eli Lilly & Co. | | | 2 | | |
Corning, Inc. | | | 1 | | |
News Corp., Class A | | | 1 | | |
Comcast Corp., Class A | | | 1 | | |
Marathon Oil Corp. | | | 1 | | |
Capital One Financial Corp. | | | 1 | | |
|
|
|
|
|
|
| | | | | |
Master Large Cap Core Portfolio | | Percent of
Long-Term Investments | |
|
|
|
|
|
|
Information Technology | | | 19 | % | |
Consumer Discretionary | | | 18 | | |
Health Care | | | 16 | | |
Industrials | | | 10 | | |
Energy | | | 9 | | |
Financials | | | 7 | | |
Utilities | | | 7 | | |
Materials | | | 5 | | |
Consumer Staples | | | 5 | | |
Telecommunication Services | | | 4 | | |
|
|
|
|
|
|
| | | | | |
Master Large Cap Growth Portfolio | | Percent of
Long-Term Investments | |
|
|
|
|
|
|
Information Technology | | | 25 | % | |
Consumer Discretionary | | | 24 | | |
Health Care | | | 16 | | |
Industrials | | | 11 | | |
Energy | | | 9 | | |
Materials | | | 5 | | |
Utilities | | | 3 | | |
Telecommunication Services | | | 3 | | |
Consumer Staples | | | 3 | | |
Financials | | | 1 | | |
|
|
|
|
|
|
| | | | | |
Master Large Cap Value Portfolio | | Percent of
Long-Term Investments | |
|
|
|
|
|
|
Financials | | | 17 | % | |
Health Care | | | 14 | | |
Industrials | | | 12 | | |
Consumer Discretionary | | | 11 | | |
Information Technology | | | 11 | | |
Utilities | | | 11 | | |
Energy | | | 7 | | |
Materials | | | 7 | | |
Consumer Staples | | | 5 | | |
Telecommunication Services | | | 5 | | |
|
|
|
|
|
|
| |
| For Portfolio compliance purposes, sector and industry classifications refer to any one or more of the sector and industry sub-classifications used by one or more widely recognized market indexes or ratings group indexes, and/or as defined by Portfolio management. This definition may not apply for purposes of this report, which may combine sector and industry sub-classifications for reporting ease. |
| | | |
|
|
|
|
| BLACKROCK LARGE CAP SERIES FUNDS, INC. | SEPTEMBER 30, 2010 | 19 |
| |
|
|
Schedule of Investments September 30, 2010 | Master Large Cap Core Portfolio |
| (Percentages shown are based on Net Assets) |
| | | | | | | |
Common Stocks | | | Shares | | Value | |
|
|
|
|
|
|
|
|
Consumer Discretionary — 17.6% | | | | | | | |
Auto Components — 1.0% | | | | | | | |
Goodyear Tire & Rubber Co. (a) | | | 3,120,000 | | $ | 33,540,000 | |
|
|
|
|
|
|
|
|
Automobiles — 1.3% | | | | | | | |
Ford Motor Co. (a) | | | 1,180,000 | | | 14,443,200 | |
Harley-Davidson, Inc. (b) | | | 970,000 | | | 27,586,800 | |
| | | | |
|
|
|
| | | | | | 42,030,000 | |
|
|
|
|
|
|
|
|
Household Durables — 0.3% | | | | | | | |
Whirlpool Corp. | | | 130,000 | | | 10,524,800 | |
|
|
|
|
|
|
|
|
Internet & Catalog Retail — 1.1% | | | | | | | |
Liberty Media Holding Corp. — Interactive (a) | | | 2,490,000 | | | 34,137,900 | |
|
|
|
|
|
|
|
|
Media — 4.8% | | | | | | | |
CBS Corp., Class B | | | 650,000 | | | 10,309,000 | |
Comcast Corp., Class A | | | 2,660,000 | | | 48,092,800 | |
Gannett Co., Inc. | | | 640,000 | | | 7,827,200 | |
Interpublic Group of Cos., Inc. (a) | | | 3,340,000 | | | 33,500,200 | |
Liberty Global, Inc. (a)(b) | | | 420,000 | | | 12,940,200 | |
News Corp., Class A | | | 3,070,000 | | | 40,094,200 | |
| | | | |
|
|
|
| | | | | | 152,763,600 | |
|
|
|
|
|
|
|
|
Multiline Retail — 1.9% | | | | | | | |
Big Lots, Inc. (a) | | | 840,000 | | | 27,930,000 | |
Macy’s, Inc. | | | 1,510,000 | | | 34,865,900 | |
| | | | |
|
|
|
| | | | | | 62,795,900 | |
|
|
|
|
|
|
|
|
Specialty Retail — 7.2% | | | | | | | |
Advance Auto Parts, Inc. | | | 560,000 | | | 32,860,800 | |
Gap, Inc. | | | 1,820,000 | | | 33,924,800 | |
Limited Brands, Inc. | | | 1,290,000 | | | 34,546,200 | |
PetSmart, Inc. | | | 930,000 | | | 32,550,000 | |
Ross Stores, Inc. | | | 600,000 | | | 32,772,000 | |
TJX Cos., Inc. | | | 710,000 | | | 31,687,300 | |
Williams-Sonoma, Inc. | | | 990,000 | | | 31,383,000 | |
| | | | |
|
|
|
| | | | | | 229,724,100 | |
|
|
|
|
|
|
|
|
Total Consumer Discretionary | | | | | | 565,516,300 | |
|
|
|
|
|
|
|
|
Consumer Staples — 4.5% | | | | | | | |
Beverages — 1.1% | | | | | | | |
Dr. Pepper Snapple Group, Inc. | | | 970,000 | | | 34,454,400 | |
|
|
|
|
|
|
|
|
Food & Staples Retailing — 0.6% | | | | | | | |
Safeway, Inc. (b) | | | 880,000 | | | 18,620,800 | |
|
|
|
|
|
|
|
|
Food Products — 1.4% | | | | | | | |
ConAgra Foods, Inc. | | | 850,000 | | | 18,649,000 | |
Hershey Co. | | | 510,000 | | | 24,270,900 | |
Tyson Foods, Inc., Class A | | | 200,000 | | | 3,204,000 | |
| | | | |
|
|
|
| | | | | | 46,123,900 | |
|
|
|
|
|
|
|
|
Household Products — 0.5% | | | | | | | |
Procter & Gamble Co. | | | 300,000 | | | 17,991,000 | |
|
|
|
|
|
|
|
|
Personal Products — 0.9% | | | | | | | |
NBTY, Inc. (a) | | | 510,000 | | | 28,039,800 | |
|
|
|
|
|
|
|
|
Total Consumer Staples | | | | | | 145,229,900 | |
|
|
|
|
|
|
|
|
Energy — 9.2% | | | | | | | |
Energy Equipment & Services — 1.7% | | | | | | | |
Exterran Holdings, Inc. (a) | | | 460,000 | | | 10,446,600 | |
McDermott International, Inc. (a) | | | 1,260,000 | | | 18,622,800 | |
Nabors Industries Ltd. (a) | | | 1,030,000 | | | 18,601,800 | |
Oil States International, Inc. (a) | | | 130,000 | | | 6,051,500 | |
| | | | |
|
|
|
| | | | | | 53,722,700 | |
|
|
|
|
|
|
|
|
| | | | | | | |
Common Stocks | | | Shares | | Value | |
|
|
|
|
|
|
|
|
Energy (concluded) | | | | | | | |
Oil, Gas & Consumable Fuels — 7.5% | | | | | | | |
Chevron Corp. | | | 170,000 | | $ | 13,778,500 | |
Cimarex Energy Co. | | | 130,000 | | | 8,603,400 | |
Exxon Mobil Corp. | | | 880,000 | | | 54,375,200 | |
Marathon Oil Corp. | | | 1,200,000 | | | 39,720,000 | |
Mariner Energy, Inc. (a) | | | 1,350,000 | | | 32,710,500 | |
SM Energy Co. | | | 490,000 | | | 18,355,400 | |
Sunoco, Inc. | | | 970,000 | | | 35,405,000 | |
Williams Cos., Inc. | | | 1,930,000 | | | 36,882,300 | |
| | | | |
|
|
|
| | | | | | 239,830,300 | |
|
|
|
|
|
|
|
|
Total Energy | | | | | | 293,553,000 | |
|
|
|
|
|
|
|
|
Financials — 7.3% | | | | | | | |
Commercial Banks — 2.3% | | | | | | | |
Fifth Third Bancorp | | | 2,920,000 | | | 35,127,600 | |
Regions Financial Corp. | | | 4,870,000 | | | 35,404,900 | |
Wells Fargo & Co. | | | 140,000 | | | 3,518,200 | |
| | | | |
|
|
|
| | | | | | 74,050,700 | |
|
|
|
|
|
|
|
|
Consumer Finance — 1.2% | | | | | | | |
Capital One Financial Corp. | | | 950,000 | | | 37,572,500 | |
|
|
|
|
|
|
|
|
Diversified Financial Services — 1.5% | | | | | | | |
Bank of America Corp. | | | 610,000 | | | 7,997,100 | |
Citigroup, Inc. (a) | | | 8,170,000 | | | 31,863,000 | |
JPMorgan Chase & Co. | | | 240,000 | | | 9,136,800 | |
| | | | |
|
|
|
| | | | | | 48,996,900 | |
|
|
|
|
|
|
|
|
Insurance — 2.3% | | | | | | | |
Assurant, Inc. | | | 820,000 | | | 33,374,000 | |
Berkshire Hathaway, Inc. (a) | | | 100,000 | | | 8,268,000 | |
Old Republic International Corp. | | | 360,000 | | | 4,986,000 | |
UnumProvident Corp. | | | 1,170,000 | | | 25,915,500 | |
| | | | |
|
|
|
| | | | | | 72,543,500 | |
|
|
|
|
|
|
|
|
Total Financials | | | | | | 233,163,600 | |
|
|
|
|
|
|
|
|
Health Care — 16.0% | | | | | | | |
Biotechnology — 1.4% | | | | | | | |
Amgen, Inc. (a) | | | 830,000 | | | 45,741,300 | |
|
|
|
|
|
|
|
|
Health Care Providers & Services — 9.9% | | | | | | | |
Aetna, Inc. | | | 1,150,000 | | | 36,351,500 | |
AmerisourceBergen Corp. | | | 760,000 | | | 23,301,600 | |
Cardinal Health, Inc. | | | 1,130,000 | | | 37,335,200 | |
Community Health Systems, Inc. (a) | | | 80,000 | | | 2,477,600 | |
Coventry Health Care, Inc. (a) | | | 840,000 | | | 18,085,200 | |
Health Management Associates, Inc., Class A (a) | | | 4,010,000 | | | 30,716,600 | |
Humana, Inc. (a) | | | 680,000 | | | 34,163,200 | |
Lincare Holdings, Inc. | | | 1,290,000 | | | 32,366,100 | |
Tenet Healthcare Corp. (a) | | | 4,510,000 | | | 21,287,200 | |
UnitedHealth Group, Inc. | | | 1,290,000 | | | 45,291,900 | |
WellPoint, Inc. (a) | | | 670,000 | | | 37,948,800 | |
| | | | |
|
|
|
| | | | | | 319,324,900 | |
|
|
|
|
|
|
|
|
Life Sciences Tools & Services — 0.5% | | | | | | | |
Pharmaceutical Product Development, Inc. | | | 590,000 | | | 14,626,100 | |
|
|
|
|
|
|
|
|
Pharmaceuticals — 4.2% | | | | | | | |
Eli Lilly & Co. (b) | | | 1,130,000 | | | 41,278,900 | |
Endo Pharmaceuticals Holdings, Inc. (a) | | | 740,000 | | | 24,597,600 | |
Forest Laboratories, Inc. (a) | | | 440,000 | | | 13,609,200 | |
Johnson & Johnson (b) | | | 640,000 | | | 39,654,400 | |
King Pharmaceuticals, Inc. (a) | | | 860,000 | | | 8,565,600 | |
Pfizer, Inc. | | | 380,000 | | | 6,524,600 | |
| | | | |
|
|
|
| | | | | | 134,230,300 | |
|
|
|
|
|
|
|
|
Total Health Care | | | | | | 513,922,600 | |
|
|
|
|
|
|
|
|
| | | |
See Notes to Financial Statements. |
|
20 | BLACKROCK LARGE CAP SERIES FUNDS, INC. | SEPTEMBER 30, 2010 | |
| |
|
|
Schedule of Investments (continued) | Master Large Cap Core Portfolio |
| (Percentages shown are based on Net Assets) |
| | | | | | | |
Common Stocks | | | Shares | | Value | |
|
|
|
|
|
|
|
|
Industrials — 10.1% | | | | | | | |
Aerospace & Defense — 2.2% | | | | | | | |
L-3 Communications Holdings, Inc. | | | 480,000 | | $ | 34,689,600 | |
Raytheon Co. | | | 810,000 | | | 37,025,100 | |
| | | | |
|
|
|
| | | | | | 71,714,700 | |
|
|
|
|
|
|
|
|
Airlines — 1.1% | | | | | | | |
Southwest Airlines Co. | | | 2,630,000 | | | 34,374,100 | |
|
|
|
|
|
|
|
|
Building Products — 0.9% | | | | | | | |
Owens Corning, Inc. (a) | | | 1,090,000 | | | 27,936,700 | |
|
|
|
|
|
|
|
|
Commercial Services & Supplies — 0.4% | | | | | | | |
R.R. Donnelley & Sons Co. | | | 810,000 | | | 13,737,600 | |
|
|
|
|
|
|
|
|
Construction & Engineering — 0.7% | | | | | | | |
KBR, Inc. | | | 540,000 | | | 13,305,600 | |
Shaw Group, Inc. (a) | | | 310,000 | | | 10,403,600 | |
| | | | |
|
|
|
| | | | | | 23,709,200 | |
|
|
|
|
|
|
|
|
Electrical Equipment — 0.4% | | | | | | | |
General Cable Corp. (a) | | | 470,000 | | | 12,746,400 | |
|
|
|
|
|
|
|
|
Industrial Conglomerates — 2.1% | | | | | | | |
General Electric Co. | | | 2,120,000 | | | 34,450,000 | |
Textron, Inc. | | | 1,610,000 | | | 33,101,600 | |
| | | | |
|
|
|
| | | | | | 67,551,600 | |
|
|
|
|
|
|
|
|
Machinery — 1.9% | | | | | | | |
Manitowoc Co. | | | 2,740,000 | | | 33,181,400 | |
Oshkosh Corp. (a) | | | 480,000 | | | 13,200,000 | |
Timken Co. | | | 160,000 | | | 6,137,600 | |
Toro Co. | | | 170,000 | | | 9,559,100 | |
| | | | |
|
|
|
| | | | | | 62,078,100 | |
|
|
|
|
|
|
|
|
Road & Rail — 0.4% | | | | | | | |
Ryder System, Inc. | | | 270,000 | | | 11,547,900 | |
|
|
|
|
|
|
|
|
Total Industrials | | | | | | 325,396,300 | |
|
|
|
|
|
|
|
|
Information Technology — 18.9% | | | | | | | |
Communications Equipment — 1.7% | | | | | | | |
Cisco Systems, Inc. (a) | | | 50,000 | | | 1,095,000 | |
Motorola, Inc. (a) | | | 4,540,000 | | | 38,726,200 | |
Tellabs, Inc. | | | 2,040,000 | | | 15,198,000 | |
| | | | |
|
|
|
| | | | | | 55,019,200 | |
|
|
|
|
|
|
|
|
Computers & Peripherals — 6.5% | | | | | | | |
Apple, Inc. (a) | | | 140,000 | | | 39,725,000 | |
Dell, Inc. (a) | | | 3,100,000 | | | 40,176,000 | |
Lexmark International, Inc., Class A (a) | | | 730,000 | | | 32,572,600 | |
SanDisk Corp. (a) | | | 960,000 | | | 35,184,000 | |
Seagate Technology (a) | | | 2,810,000 | | | 33,101,800 | |
Western Digital Corp. (a) | | | 1,000,000 | | | 28,390,000 | |
| | | | |
|
|
|
| | | | | | 209,149,400 | |
|
|
|
|
|
|
|
|
Electronic Equipment, Instruments & Components — 1.3% | | | | | | | |
Corning, Inc. | | | 2,180,000 | | | 39,850,400 | |
|
|
|
|
|
|
|
|
IT Services — 1.7% | | | | | | | |
Gartner, Inc., Class A (a) | | | 160,000 | | | 4,710,400 | |
Hewitt Associates, Inc., Class A (a) | | | 690,000 | | | 34,796,700 | |
International Business Machines Corp. | | | 110,000 | | | 14,755,400 | |
| | | | |
|
|
|
| | | | | | 54,262,500 | |
|
|
|
|
|
|
|
|
Internet Software & Services — 0.5% | | | | | | | |
AOL, Inc. (a) | | | 470,000 | | | 11,632,500 | |
Google, Inc., Class A (a) | | | 10,000 | | | 5,257,900 | |
| | | | |
|
|
|
| | | | | | 16,890,400 | |
|
|
|
|
|
|
|
|
| | | | | | | |
Common Stocks | | | Shares | | Value | |
|
|
|
|
|
|
|
|
Information Technology (concluded) | | | | | | | |
Semiconductors & Semiconductor Equipment — 4.3% | | | | | | | |
Altera Corp. | | | 1,180,000 | | $ | 35,588,800 | |
Applied Materials, Inc. | | | 590,000 | | | 6,891,200 | |
Intel Corp. | | | 3,310,000 | | | 63,651,300 | |
National Semiconductor Corp. | | | 2,570,000 | | | 32,818,900 | |
| | | | |
|
|
|
| | | | | | 138,950,200 | |
|
|
|
|
|
|
|
|
Software — 2.9% | | | | | | | |
CA, Inc. | | | 1,680,000 | | | 35,481,600 | |
Microsoft Corp. | | | 870,000 | | | 21,306,300 | |
Symantec Corp. (a) | | | 2,300,000 | | | 34,891,000 | |
| | | | |
|
|
|
| | | | | | 91,678,900 | |
|
|
|
|
|
|
|
|
Total Information Technology | | | | | | 605,801,000 | |
|
|
|
|
|
|
|
|
Materials — 4.8% | | | | | | | |
Chemicals — 2.0% | | | | | | | |
Ashland, Inc. | | | 660,000 | | | 32,188,200 | |
Huntsman Corp. | | | 170,000 | | | 1,965,200 | |
Lubrizol Corp. | | | 290,000 | | | 30,731,300 | |
| | | | |
|
|
|
| | | | | | 64,884,700 | |
|
|
|
|
|
|
|
|
Containers & Packaging — 1.2% | | | | | | | |
Crown Holdings, Inc. (a) | | | 1,140,000 | | | 32,672,400 | |
Sealed Air Corp. | | | 210,000 | | | 4,720,800 | |
| | | | |
|
|
|
| | | | | | 37,393,200 | |
|
|
|
|
|
|
|
|
Paper & Forest Products — 1.6% | | | | | | | |
International Paper Co. | | | 1,490,000 | | | 32,407,500 | |
MeadWestvaco Corp. | | | 840,000 | | | 20,479,200 | |
| | | | |
|
|
|
| | | | | | 52,886,700 | |
|
|
|
|
|
|
|
|
Total Materials | | | | | | 155,164,600 | |
|
|
|
|
|
|
|
|
Telecommunication Services — 4.5% | | | | | | | |
Diversified Telecommunication Services — 2.3% | | | | | | | |
AT&T Inc. | | | 570,000 | | | 16,302,000 | |
Qwest Communications International, Inc. | | | 6,030,000 | | | 37,808,100 | |
TW Telecom, Inc. (a) | | | 940,000 | | | 17,455,800 | |
| | | | |
|
|
|
| | | | | | 71,565,900 | |
|
|
|
|
|
|
|
|
Wireless Telecommunication Services — 2.2% | | | | | | | |
MetroPCS Communications, Inc. (a)(b) | | | 3,170,000 | | | 33,158,200 | |
Sprint Nextel Corp. (a)(b) | | | 8,180,000 | | | 37,873,400 | |
| | | | |
|
|
|
| | | | | | 71,031,600 | |
|
|
|
|
|
|
|
|
Total Telecommunication Services | | | | | | 142,597,500 | |
|
|
|
|
|
|
|
|
Utilities — 7.2% | | | | | | | |
Electric Utilities — 1.1% | | | | | | | |
Edison International | | | 1,000,000 | | | 34,390,000 | |
|
|
|
|
|
|
|
|
Gas Utilities — 0.9% | | | | | | | |
Questar Corp. | | | 1,710,000 | | | 29,976,300 | |
|
|
|
|
|
|
|
|
Independent Power Producers & Energy Traders — 3.1% | | | | | | | |
Calpine Corp. (a) | | | 1,650,000 | | | 20,542,500 | |
Constellation Energy Group, Inc. | | | 1,040,000 | | | 33,529,600 | |
Mirant Corp. (a) | | | 1,120,000 | | | 11,155,200 | |
NRG Energy, Inc. (a) | | | 1,620,000 | | | 33,728,400 | |
| | | | |
|
|
|
| | | | | | 98,955,700 | |
|
|
|
|
|
|
|
|
Multi-Utilities — 2.1% | | | | | | | |
CMS Energy Corp. | | | 1,850,000 | | | 33,337,000 | |
Integrys Energy Group, Inc. | | | 110,000 | | | 5,726,600 | |
NiSource, Inc. | | | 1,670,000 | | | 29,058,000 | |
| | | | |
|
|
|
| | | | | | 68,121,600 | |
|
|
|
|
|
|
|
|
Total Utilities | | | | | | 231,443,600 | |
|
|
|
|
|
|
|
|
Total Long-Term Investments
(Cost — $2,898,171,093) — 100.1% | | | | | | 3,211,788,400 | |
|
|
|
|
|
|
|
|
| | | |
See Notes to Financial Statements. |
|
| BLACKROCK LARGE CAP SERIES FUNDS, INC. | SEPTEMBER 30, 2010 | 21 |
| |
|
|
Schedule of Investments (concluded) | Master Large Cap Core Portfolio |
| (Percentages shown are based on Net Assets) |
| | | | | | | |
Short-Term Securities | | Beneficial
Interest
(000) | | Value | |
|
|
|
|
|
|
BlackRock Liquidity Series, LLC Money Market Series, 0.36% (c)(d)(e) | | $ | 113,625 | | $ | 113,624,600 | |
|
|
|
|
|
|
|
|
Total Short-Term Securities
(Cost — $113,624,600) — 3.5% | | | | | | 113,624,600 | |
|
|
|
|
|
|
|
|
Total Investments (Cost — $3,011,795,693*) — 103.6% | | | | | | 3,325,413,000 | |
Liabilities in Excess of Other Assets — (3.6)% | | | | | | (115,927,179 | ) |
| | | | |
|
|
|
Net Assets — 100.0% | | | | | $ | 3,209,485,821 | |
| | | | |
|
|
|
| | | | | | | |
|
|
|
|
|
|
|
|
| |
* | The cost and unrealized appreciation (depreciation) of investments as of September 30, 2010, as computed for federal income tax purposes, were as follows: |
| | | | |
Aggregate cost | | $ | 3,056,235,489 | |
| |
|
|
|
Gross unrealized appreciation | | $ | 375,640,969 | |
Gross unrealized depreciation | | | (106,463,458 | ) |
| |
|
|
|
Net unrealized appreciation | | $ | 269,177,511 | |
| |
|
|
|
| |
(a) | Non-income producing security. |
| |
(b) | Security, or a portion of security, is on loan. |
| |
(c) | Investments in companies considered to be an affiliate of the Portfolio during the year, for purposes of Section 2(a)(3) of the Investment Company Act of 1940, as amended, were as follows: |
| | | | | | | | | | | | | |
|
|
|
|
|
|
|
|
|
|
Affiliate | | Beneficial
Interest Held at
September 30,
2009 | | Net
Activity | | Beneficial
Interest Held at
September 30,
2010 | | Income | |
|
|
|
|
|
|
|
|
|
|
BlackRock Liquidity Funds, TempFund, Institutional Class | | $ | 31,839,442 | | $ | (31,839,442 | ) | | — | | $ | 725 | |
BlackRock Liquidity Series, LLC Money Market Series | | $ | 129,521,650 | | $ | (15,897,050 | ) | $ | 113,624,600 | | $ | 290,336 | |
|
|
|
|
|
|
|
|
|
|
|
|
|
|
| | |
(d) | Represents the current yield as of report date. |
| |
(e) | Security was purchased with the cash collateral from loaned securities. |
| |
• | For Portfolio compliance purposes, the Portfolio’s sector and industry classifications refer to any one or more of the sector and industry sub-classifications used by one or more widely recognized market indexes or rating group indexes, and/or as defined by Portfolio management. This definition may not apply for purposes of this report, which may combine such sector and industry sub-classifications for reporting ease. |
| |
• | Fair Value Measurements — Various inputs are used in determining the fair value of investments, which are as follows: |
| |
| • | Level 1 — price quotations in active markets/exchanges for identical assets and liabilities |
| | |
| • | Level 2 — other observable inputs (including, but not limited to: quoted prices for similar assets or liabilities in markets that are active, quoted prices for identical or similar assets or liabilities in markets that are not active, inputs other than quoted prices that are observable for the assets or liabilities (such as interest rates, yield curves, volatilities, prepayment speeds, loss severities, credit risks and default rates) or other market-corroborated inputs) |
| | |
| • | Level 3 — unobservable inputs based on the best information available in the circumstances, to the extent observable inputs are not available (including the Portfolio’s own assumptions used in determining the fair value of investments) |
| | |
| The inputs or methodologies used for valuing securities are not necessarily an indication of the risk associated with investing in those securities. For information about the Portfolio’s policy regarding valuation of investments and other significant accounting policies, please refer to Note 1 of the Notes to Financial Statements. |
| |
| The following table summarizes the inputs used as of September 30, 2010 in determining the fair valuation of the Portfolio’s investments: |
| | | | | | | | | | | | | |
|
|
|
|
|
|
|
|
|
|
Valuation Inputs | | Level 1 | | Level 2 | | Level 3 | | Total | |
|
|
|
|
|
|
|
|
|
|
Assets: | | | | | | | | | | | | | |
Investments in Securities: | | | | | | | | | | | | | |
Long-Term Investments1 | | $ | 3,211,788,400 | | | — | | | — | | $ | 3,211,788,400 | |
Short-Term Securities | | | — | | $ | 113,624,600 | | | — | | | 113,624,600 | |
| |
|
|
|
|
|
|
|
|
|
|
|
|
Total | | $ | 3,211,788,400 | | $ | 113,624,600 | | | — | | $ | 3,325,413,000 | |
| |
|
|
|
|
|
|
|
|
|
|
|
|
| | |
| 1 | See above Schedule of Investments for values in each sector and industry. |
| | | |
See Notes to Financial Statements. |
|
22 | BLACKROCK LARGE CAP SERIES FUNDS, INC. | SEPTEMBER 30, 2010 | |
| |
|
|
Schedule of Investments September 30, 2010 | Master Large Cap Growth Portfolio |
| (Percentages shown are based on Net Assets) |
| | | | | | | |
Common Stocks | | | Shares | | Value | |
|
|
|
|
|
|
|
|
Consumer Discretionary — 23.5% | | | | | | | |
Auto Components — 1.4% | | | | | | | |
Federal-Mogul Corp., Class A (a) | | | 133,000 | | $ | 2,515,030 | |
The Goodyear Tire & Rubber Co. (a) | | | 653,000 | | | 7,019,750 | |
| | | | |
|
|
|
| | | | | | 9,534,780 | |
|
|
|
|
|
|
|
|
Automobiles — 1.7% | | | | | | | |
Ford Motor Co. (a) | | | 916,000 | | | 11,211,840 | |
|
|
|
|
|
|
|
|
Diversified Consumer Services — 2.2% | | | | | | | |
Career Education Corp. (a) | | | 204,000 | | | 4,379,880 | |
H&R Block, Inc. | | | 540,000 | | | 6,993,000 | |
ITT Educational Services, Inc. (a) | | | 47,000 | | | 3,302,690 | |
| | | | |
|
|
|
| | | | | | 14,675,570 | |
|
|
|
|
|
|
|
|
Hotels, Restaurants & Leisure — 1.3% | | | | | | | |
Starbucks Corp. | | | 151,000 | | | 3,862,580 | |
Wyndham Worldwide Corp. | | | 188,000 | | | 5,164,360 | |
| | | | |
|
|
|
| | | | | | 9,026,940 | |
|
|
|
|
|
|
|
|
Internet & Catalog Retail — 1.0% | | | | | | | |
Expedia, Inc. (b) | | | 233,000 | | | 6,572,930 | |
|
|
|
|
|
|
|
|
Media — 5.3% | | | | | | | |
CBS Corp., Class B | | | 448,000 | | | 7,105,280 | |
DIRECTV, Class A (a) | | | 182,000 | | | 7,576,660 | |
Interpublic Group of Cos., Inc. (a) | | | 759,000 | | | 7,612,770 | |
John Wiley & Sons, Inc., Class A | | | 140,000 | | | 5,720,400 | |
News Corp., Class A | | | 555,000 | | | 7,248,300 | |
| | | | |
|
|
|
| | | | | | 35,263,410 | |
|
|
|
|
|
|
|
|
Multiline Retail — 2.5% | | | | | | | |
Big Lots, Inc. (a) | | | 199,000 | | | 6,616,750 | |
Dollar Tree, Inc. (a) | | | 97,000 | | | 4,729,720 | |
Target Corp. | | | 104,000 | | | 5,557,760 | |
| | | | |
|
|
|
| | | | | | 16,904,230 | |
|
|
|
|
|
|
|
|
Specialty Retail — 8.1% | | | | | | | |
Advance Auto Parts, Inc. | | | 122,000 | | | 7,158,960 | |
Aéropostale, Inc. (a) | | | 114,000 | | | 2,650,500 | |
The Gap, Inc. | | | 384,000 | | | 7,157,760 | |
Limited Brands, Inc. | | | 295,000 | | | 7,900,100 | |
PetSmart, Inc. | | | 198,000 | | | 6,930,000 | |
Ross Stores, Inc. | | | 130,000 | | | 7,100,600 | |
TJX Cos., Inc. | | | 192,000 | | | 8,568,960 | |
Williams-Sonoma, Inc. | | | 228,000 | | | 7,227,600 | |
| | | | |
|
|
|
| | | | | | 54,694,480 | |
|
|
|
|
|
|
|
|
Total Consumer Discretionary | | | | | | 157,884,180 | |
|
|
|
|
|
|
|
|
Consumer Staples — 2.6% | | | | | | | |
Beverages — 1.0% | | | | | | | |
Dr. Pepper Snapple Group, Inc. | | | 194,000 | | | 6,890,880 | |
|
|
|
|
|
|
|
|
Food & Staples Retailing — 0.5% | | | | | | | |
The Kroger Co. | | | 147,000 | | | 3,184,020 | |
|
|
|
|
|
|
|
|
Food Products — 1.1% | | | | | | | |
Hershey Co. | | | 152,000 | | | 7,233,680 | |
|
|
|
|
|
|
|
|
Total Consumer Staples | | | | | | 17,308,580 | |
|
|
|
|
|
|
|
|
Energy — 8.9% | | | | | | | |
Energy Equipment & Services — 2.1% | | | | | | | |
Exterran Holdings, Inc. (a) | | | 306,000 | | | 6,949,260 | |
McDermott International, Inc. (a) | | | 489,000 | | | 7,227,420 | |
| | | | |
|
|
|
| | | | | | 14,176,680 | |
|
|
|
|
|
|
|
|
| | | | | | | |
Common Stocks | | | Shares | | Value | |
|
|
|
|
|
|
|
|
Energy (concluded) | | | | | | | |
Oil, Gas & Consumable Fuels — 6.8% | | | | | | | |
Exxon Mobil Corp. | | | 313,000 | | $ | 19,340,270 | |
Marathon Oil Corp. | | | 227,000 | | | 7,513,700 | |
Mariner Energy, Inc. (a) | | | 273,000 | | | 6,614,790 | |
SM Energy Co. | | | 162,000 | | | 6,068,520 | |
Whiting Petroleum Corp. (a) | | | 65,000 | | | 6,208,150 | |
| | | | |
|
|
|
| | | | | | 45,745,430 | |
|
|
|
|
|
|
|
|
Total Energy | | | | | | 59,922,110 | |
|
|
|
|
|
|
|
|
Financials — 1.1% | | | | | | | |
Consumer Finance — 0.9% | | | | | | | |
Capital One Financial Corp. | | | 153,000 | | | 6,051,150 | |
|
|
|
|
|
|
|
|
Insurance — 0.2% | | | | | | | |
Endurance Specialty Holdings Ltd. | | | 39,000 | | | 1,552,200 | |
|
|
|
|
|
|
|
|
Total Financials | | | | | | 7,603,350 | |
|
|
|
|
|
|
|
|
Health Care — 15.7% | | | | | | | |
Health Care Providers & Services — 10.0% | | | | | | | |
Aetna, Inc. | | | 227,000 | | | 7,175,470 | |
Cardinal Health, Inc. | | | 218,000 | | | 7,202,720 | |
Community Health Systems, Inc. (a) | | | 181,000 | | | 5,605,570 | |
Coventry Health Care, Inc. (a) | | | 317,000 | | | 6,825,010 | |
Health Management Associates, Inc., Class A (a) | | | 927,000 | | | 7,100,820 | |
Humana, Inc. (a) | | | 131,000 | | | 6,581,440 | |
Lincare Holdings, Inc. | | | 271,000 | | | 6,799,390 | |
Tenet Healthcare Corp. (a) | | | 1,490,000 | | | 7,032,800 | |
UnitedHealth Group, Inc. | | | 190,000 | | | 6,670,900 | |
WellPoint, Inc. (a) | | | 115,000 | | | 6,513,600 | |
| | | | |
|
|
|
| | | | | | 67,507,720 | |
|
|
|
|
|
|
|
|
Life Sciences Tools & Services — 1.1% | | | | | | | |
Pharmaceutical Product Development, Inc. | | | 288,000 | | | 7,139,520 | |
|
|
|
|
|
|
|
|
Pharmaceuticals — 4.6% | | | | | | | |
Abbott Laboratories | | | 214,000 | | | 11,179,360 | |
Bristol-Myers Squibb Co. | | | 234,000 | | | 6,343,740 | |
Eli Lilly & Co. | | | 210,000 | | | 7,671,300 | |
Endo Pharmaceuticals Holdings, Inc. (a) | | | 172,000 | | | 5,717,280 | |
| | | | |
|
|
|
| | | | | | 30,911,680 | |
|
|
|
|
|
|
|
|
Total Health Care | | | | | | 105,558,920 | |
|
|
|
|
|
|
|
|
Industrials — 11.2% | | | | | | | |
Aerospace & Defense — 0.9% | | | | | | | |
Raytheon Co. | | | 132,000 | | | 6,033,720 | |
|
|
|
|
|
|
|
|
Airlines — 0.5% | | | | | | | |
Southwest Airlines Co. | | | 244,000 | | | 3,189,080 | |
|
|
|
|
|
|
|
|
Building Products — 0.9% | | | | | | | |
Owens Corning, Inc. (a) | | | 227,000 | | | 5,818,010 | |
|
|
|
|
|
|
|
|
Commercial Services & Supplies — 1.0% | | | | | | | |
R.R. Donnelley & Sons Co. | | | 396,000 | | | 6,716,160 | |
|
|
|
|
|
|
|
|
Construction & Engineering — 1.9% | | | | | | | |
KBR, Inc. | | | 282,000 | | | 6,948,480 | |
URS Corp. (a) | | | 143,000 | | | 5,431,140 | |
| | | | |
|
|
|
| | | | | | 12,379,620 | |
|
|
|
|
|
|
|
|
Electrical Equipment — 1.4% | | | | | | | |
General Cable Corp. (a) | | | 112,000 | | | 3,037,440 | |
Thomas & Betts Corp. (a) | | | 159,000 | | | 6,522,180 | |
| | | | |
|
|
|
| | | | | | 9,559,620 | |
|
|
|
|
|
|
|
|
Industrial Conglomerates — 1.0% | | | | | | | |
Textron, Inc. | | | 337,000 | | | 6,928,720 | |
|
|
|
|
|
|
|
|
| | | |
See Notes to Financial Statements. |
|
| BLACKROCK LARGE CAP SERIES FUNDS, INC. | SEPTEMBER 30, 2010 | 23 |
| |
|
|
Schedule of Investments (continued) | Master Large Cap Growth Portfolio |
| (Percentages shown are based on Net Assets) |
| | | | | | | |
Common Stocks | | | Shares | | Value | |
|
|
|
|
|
|
|
|
Industrials (concluded) | | | | | | | |
Machinery — 3.4% | | | | | | | |
Manitowoc Co. | | | 672,000 | | $ | 8,137,920 | |
Oshkosh Corp. (a) | | | 216,000 | | | 5,940,000 | |
Timken Co. | | | 52,000 | | | 1,994,720 | |
Toro Co. | | | 120,000 | | | 6,747,600 | |
| | | | |
|
|
|
| | | | | | 22,820,240 | |
|
|
|
|
|
|
|
|
Trading Companies & Distributors — 0.2% | | | | | | | |
WESCO International, Inc. (a) | | | 41,000 | | | 1,610,890 | |
|
|
|
|
|
|
|
|
Total Industrials | | | | | | 75,056,060 | |
|
|
|
|
|
|
|
|
Information Technology — 24.9% | | | | | | | |
Communications Equipment — 0.2% | | | | | | | |
Cisco Systems, Inc. (a) | | | 54,000 | | | 1,182,600 | |
|
|
|
|
|
|
|
|
Computers & Peripherals — 7.0% | | | | | | | |
Apple, Inc. (a) | | | 56,000 | | | 15,890,000 | |
Dell, Inc. (a) | | | 723,000 | | | 9,370,080 | |
SanDisk Corp. (a) | | | 203,000 | | | 7,439,950 | |
Seagate Technology (a) | | | 626,000 | | | 7,374,280 | |
Western Digital Corp. (a) | | | 241,000 | | | 6,841,990 | |
| | | | |
|
|
|
| | | | | | 46,916,300 | |
|
|
|
|
|
|
|
|
Electronic Equipment, Instruments & Components — 1.8% | | | | | | | |
AVX Corp. | | | 346,000 | | | 4,781,720 | |
Corning, Inc. | | | 406,000 | | | 7,421,680 | |
| | | | |
|
|
|
| | | | | | 12,203,400 | |
|
|
|
|
|
|
|
|
IT Services — 4.5% | | | | | | | |
Amdocs Ltd. (a) | | | 240,000 | | | 6,878,400 | |
Gartner, Inc., Class A (a) | | | 239,000 | | | 7,036,160 | |
Hewitt Associates, Inc., Class A (a) | | | 142,000 | | | 7,161,060 | |
International Business Machines Corp. | | | 48,000 | | | 6,438,720 | |
Total System Services, Inc. | | | 163,000 | | | 2,484,120 | |
The Western Union Co. | | | 27,000 | | | 477,090 | |
| | | | |
|
|
|
| | | | | | 30,475,550 | |
|
|
|
|
|
|
|
|
Internet Software & Services — 0.2% | | | | | | | |
Google, Inc., Class A (a) | | | 2,000 | | | 1,051,580 | |
|
|
|
|
|
|
|
|
Machinery — 0.9% | | | | | | | |
CNH Global NV | | | 167,000 | | | 6,118,880 | |
|
|
|
|
|
|
|
|
Semiconductors & Semiconductor Equipment — 5.1% | | | | | | | |
Altera Corp. | | | 251,000 | | | 7,570,160 | |
Intel Corp. | | | 776,000 | | | 14,922,480 | |
Micron Technology, Inc. (a)(b) | | | 664,000 | | | 4,787,440 | |
National Semiconductor Corp. | | | 551,000 | | | 7,036,270 | |
| | | | |
|
|
|
| | | | | | 34,316,350 | |
|
|
|
|
|
|
|
|
Software — 5.2% | | | | | | | |
CA, Inc. | | | 356,000 | | | 7,518,720 | |
Microsoft Corp. | | | 831,000 | | | 20,351,190 | |
Symantec Corp. (a) | | | 460,000 | | | 6,978,200 | |
| | | | |
|
|
|
| | | | | | 34,848,110 | |
|
|
|
|
|
|
|
|
Total Information Technology | | | | | | 167,112,770 | |
|
|
|
|
|
|
|
|
Materials — 4.8% | | | | | | | |
Chemicals — 2.7% | | | | | | | |
Ashland, Inc. | | | 124,000 | | | 6,047,480 | |
Nalco Holding Co. | | | 264,000 | | | 6,655,440 | |
RPM International, Inc. | | | 281,000 | | | 5,597,520 | |
| | | | |
|
|
|
| | | | | | 18,300,440 | |
|
|
|
|
|
|
|
|
| | | | | | | |
Common Stocks | | | Shares | | Value | |
|
|
|
|
|
|
|
|
Materials (concluded) | | | | | | | |
Containers & Packaging — 0.6% | | | | | | | |
Crown Holdings, Inc. (a) | | | 140,000 | | $ | 4,012,400 | |
|
|
|
|
|
|
|
|
Metals & Mining — 0.4% | | | | | | | |
Alcoa, Inc. | | | 106,000 | | | 1,283,660 | |
Titanium Metals Corp. (a) | | | 57,000 | | | 1,137,720 | |
| | | | |
|
|
|
| | | | | | 2,421,380 | |
|
|
|
|
|
|
|
|
Paper & Forest Products — 1.1% | | | | | | | |
International Paper Co. | | | 343,000 | | | 7,460,250 | |
|
|
|
|
|
|
|
|
Total Materials | | | | | | 32,194,470 | |
|
|
|
|
|
|
|
|
Telecommunication Services — 2.7% | | | | | | | |
Diversified Telecommunication Services — 1.2% | | | | | | | |
Frontier Communications Corp. | | | 126,000 | | | 1,029,420 | |
TW Telecom, Inc. (a) | | | 373,000 | | | 6,926,610 | |
| | | | |
|
|
|
| | | | | | 7,956,030 | |
|
|
|
|
|
|
|
|
Wireless Telecommunication Services — 1.5% | | | | | | | |
MetroPCS Communications, Inc. (a)(b) | | | 701,000 | | | 7,332,460 | |
NII Holdings, Inc. (a) | | | 78,000 | | | 3,205,800 | |
| | | | |
|
|
|
| | | | | | 10,538,260 | |
|
|
|
|
|
|
|
|
Total Telecommunication Services | | | | | | 18,494,290 | |
|
|
|
|
|
|
|
|
Utilities — 3.5% | | | | | | | |
Electric Utilities — 0.5% | | | | | | | |
NV Energy, Inc. | | | 252,000 | | | 3,313,800 | |
|
|
|
|
|
|
|
|
Independent Power Producers & Energy Traders — 2.0% | | | | | | | |
Calpine Corp. (a) | | | 558,000 | | | 6,947,100 | |
Constellation Energy Group, Inc. | | | 193,000 | | | 6,222,320 | |
| | | | |
|
|
|
| | | | | | 13,169,420 | |
|
|
|
|
|
|
|
|
Multi-Utilities — 1.0% | | | | | | | |
Integrys Energy Group, Inc. (b) | | | 129,000 | | | 6,715,740 | |
|
|
|
|
|
|
|
|
Total Utilities | | | | | | 23,198,960 | |
|
|
|
|
|
|
|
|
Total Long-Term Investments
(Cost — $611,968,870) — 98.9% | | | | | | 664,333,690 | |
|
|
|
|
|
|
|
|
| | | | | | | |
|
| | | | | | | |
Short-Term Securities | | | | | | | |
|
|
|
|
|
|
|
|
BlackRock Liquidity Funds, TempFund, Institutional Class, 0.23% (c)(d) | | | 346,978 | | | 346,978 | |
|
|
|
|
|
|
|
|
| | | | | | | |
| | | Beneficial
Interest
(000) | | | | |
|
|
|
|
|
|
|
|
BlackRock Liquidity Series, LLC Money Market Series, 0.36% (c)(d)(e) | | $ | 19,524 | | | 19,523,700 | |
|
Total Short-Term Securities
(Cost — $19,870,678) — 2.9% | | | | | | 19,870,678 | |
|
|
|
|
|
|
|
|
Total Investments (Cost — $631,839,548*) — 101.8% | | | | | | 684,204,368 | |
Liabilities in Excess of Other Assets — (1.8)% | | | | | | (12,370,403 | ) |
| | | | |
|
|
|
Net Assets — 100.0% | | | | | $ | 671,833,965 | |
| | | | |
|
|
|
| | | |
See Notes to Financial Statements. |
|
24 | BLACKROCK LARGE CAP SERIES FUNDS, INC. | SEPTEMBER 30, 2010 | |
| |
|
|
Schedule of Investments (concluded) | Master Large Cap Growth Portfolio |
| |
* | The cost and unrealized appreciation (depreciation) of investments as of September 30, 2010, as computed for federal income tax purposes, were as follows: |
| | | | |
Aggregate cost | | $ | 640,440,810 | |
| |
|
|
|
Gross unrealized appreciation | | $ | 67,345,146 | |
Gross unrealized depreciation | | | (23,581,588 | ) |
| |
|
|
|
Net unrealized appreciation | | $ | 43,763,558 | |
| |
|
|
|
| |
(a) | Non-income producing security. |
| |
(b) | Security, or a portion of security, is on loan. |
| |
(c) | Investments in companies considered to be an affiliate of the Portfolio during the year, for purposes of Section 2(a)(3) of the Investment Company Act of 1940, as amended, were as follows: |
| | | | | | | | | | | | | |
|
|
|
|
|
|
|
|
|
|
Affiliate | | Shares/
Beneficial
Interest Held at
September 30,
2009 | | Net
Activity | | Shares/
Beneficial
Interest Held at
September 30,
2010 | | Income | |
|
|
|
|
|
|
|
|
|
|
BlackRock Liquidity Funds, TempFund, Institutional Class | | | — | | | 346,978 | | | 346,978 | | $ | 286 | |
BlackRock Liquidity Series, LLC Money Market Series | | $ | 15,448,500 | | $ | 4,075,200 | | $ | 19,523,700 | | $ | 35,501 | |
|
|
|
|
|
|
|
|
|
|
|
|
|
|
| | |
(d) | Represents the current yield as of report date. |
| |
(e) | Security was purchased with the cash collateral from loaned securities. |
| |
• | For Portfolio compliance purposes, the Portfolio’s sector and industry classifications refer to any one or more of the sector and industry sub-classifications used by one or more widely recognized market indexes or rating group indexes, and/or as defined by Portfolio management. This definition may not apply for purposes of this report, which may combine such sector and industry sub-classifications for reporting ease. |
| |
• | Fair Value Measurements — Various inputs are used in determining the fair value of investments, which are as follows: |
| |
| • | Level 1 — price quotations in active markets/exchanges for identical assets and liabilities |
| | |
| • | Level 2 — other observable inputs (including, but not limited to: quoted prices for similar assets or liabilities in markets that are active, quoted prices for identical or similar assets or liabilities in markets that are not active, inputs other than quoted prices that are observable for the assets or liabilities (such as interest rates, yield curves, volatilities, prepayment speeds, loss severities, credit risks and default rates) or other market-corroborated inputs) |
| | |
| • | Level 3 — unobservable inputs based on the best information available in the circumstances, to the extent observable inputs are not available (including the Portfolio’s own assumptions used in determining the fair value of investments) |
| | |
| The inputs or methodologies used for valuing securities are not necessarily an indication of the risk associated with investing in those securities. For information about the Portfolio’s policy regarding valuation of investments and other significant accounting policies, please refer to Note 1 of the Notes to Financial Statements. |
| |
| The following table summarizes the inputs used as of September 30, 2010 in determining the fair valuation of the Portfolio’s investments: |
| | | | | | | | | | | | | |
|
|
|
|
|
|
|
|
|
|
Valuation Inputs | | Level 1 | | Level 2 | | Level 3 | | Total | |
|
|
|
|
|
|
|
|
|
|
Assets: | | | | | | | | | | | | | |
Investments in Securities: | | | | | | | | | | | | | |
Long-Term Investments1 | | $ | 664,333,690 | | | — | | | — | | $ | 664,333,690 | |
Short-Term Securities | | | 346,978 | | $ | 19,523,700 | | | — | | | 19,870,678 | |
| |
|
|
|
|
|
|
|
|
|
|
|
|
Total | | $ | 664,680,668 | | $ | 19,523,700 | | | — | | $ | 684,204,368 | |
| |
|
|
|
|
|
|
|
|
|
|
|
|
| | |
| 1 | See above Schedule of Investments for values in each sector and industry. |
| | | |
See Notes to Financial Statements. |
|
| BLACKROCK LARGE CAP SERIES FUNDS, INC. | SEPTEMBER 30, 2010 | 25 |
| |
|
| |
Schedule of Investments September 30, 2010 | Master Large Cap Value Portfolio
(Percentages shown are based on Net Assets) |
| | | | | | | |
Common Stocks | | Shares | | Value | |
|
|
|
|
|
|
|
|
Consumer Discretionary — 10.9% | | | | | | | |
Internet & Catalog Retail — 0.3% | | | | | | | |
Liberty Media Holding Corp. — Interactive (a) | | | 530,000 | | $ | 7,266,300 | |
|
|
|
|
|
|
|
|
Media — 5.3% | | | | | | | |
CBS Corp., Class B | | | 1,580,000 | | | 25,058,800 | |
Comcast Corp., Class A | | | 1,700,000 | | | 30,736,000 | |
DISH Network Corp. | | | 300,000 | | | 5,748,000 | |
Gannett Co., Inc. | | | 1,800,000 | | | 22,014,000 | |
News Corp., Class A | | | 2,370,000 | | | 30,952,200 | |
| | | | |
|
|
|
| | | | | | 114,509,000 | |
|
|
|
|
|
|
|
|
Multiline Retail — 1.2% | | | | | | | |
Macy’s, Inc. | | | 1,140,000 | | | 26,322,600 | |
|
|
|
|
|
|
|
|
Specialty Retail — 4.1% | | | | | | | |
Foot Locker, Inc. | | | 1,610,000 | | | 23,393,300 | |
GameStop Corp., Class A (a) | | | 310,000 | | | 6,110,100 | |
The Gap, Inc. | | | 1,170,000 | | | 21,808,800 | |
Limited Brands, Inc. | | | 840,000 | | | 22,495,200 | |
Signet Jewelers Ltd. (a) | | | 390,000 | | | 12,378,600 | |
Williams-Sonoma, Inc. | | | 100,000 | | | 3,170,000 | |
| | | | |
|
|
|
| | | | | | 89,356,000 | |
|
|
|
|
|
|
|
|
Total Consumer Discretionary | | | | | | 237,453,900 | |
|
|
|
|
|
|
|
|
Consumer Staples — 5.2% | | | | | | | |
Beverages — 1.1% | | | | | | | |
Dr. Pepper Snapple Group, Inc. | | | 660,000 | | | 23,443,200 | |
|
|
|
|
|
|
|
|
Food & Staples Retailing — 0.5% | | | | | | | |
The Kroger Co. | | | 460,000 | | | 9,963,600 | |
|
|
|
|
|
|
|
|
Food Products — 2.8% | | | | | | | |
ConAgra Foods, Inc. | | | 1,110,000 | | | 24,353,400 | |
Corn Products International, Inc. | | | 250,000 | | | 9,375,000 | |
Del Monte Foods Co. | | | 230,000 | | | 3,015,300 | |
Tyson Foods, Inc., Class A | | | 1,540,000 | | | 24,670,800 | |
| | | | |
|
|
|
| | | | | | 61,414,500 | |
|
|
|
|
|
|
|
|
Household Products — 0.8% | | | | | | | |
The Procter & Gamble Co. | | | 300,000 | | | 17,991,000 | |
|
|
|
|
|
|
|
|
Total Consumer Staples | | | | | | 112,812,300 | |
|
|
|
|
|
|
|
|
Energy — 7.2% | | | | | | | |
Energy Equipment & Services — 1.8% | | | | | | | |
Exterran Holdings, Inc. (a) | | | 690,000 | | | 15,669,900 | |
McDermott International, Inc. (a) | | | 1,600,000 | | | 23,648,000 | |
| | | | |
|
|
|
| | | | | | 39,317,900 | |
|
|
|
|
|
|
|
|
Oil, Gas & Consumable Fuels — 5.4% | | | | | | | |
Chevron Corp. | | | 180,000 | | | 14,589,000 | |
Marathon Oil Corp. | | | 900,000 | | | 29,790,000 | |
Sunoco, Inc. | | | 600,000 | | | 21,900,000 | |
Valero Energy Corp. | | | 1,510,000 | | | 26,440,100 | |
Williams Cos., Inc. | | | 1,270,000 | | | 24,269,700 | |
| | | | |
|
|
|
| | | | | | 116,988,800 | |
|
|
|
|
|
|
|
|
Total Energy | | | | | | 156,306,700 | |
|
|
|
|
|
|
|
|
Financials — 17.3% | | | | | | | |
Commercial Banks — 3.5% | | | | | | | |
Fifth Third Bancorp | | | 2,140,000 | | | 25,744,200 | |
Fulton Financial Corp. | | | 1,650,000 | | | 14,949,000 | |
Regions Financial Corp. | | | 3,700,000 | | | 26,899,000 | |
SunTrust Banks, Inc. | | | 260,000 | | | 6,715,800 | |
Wells Fargo & Co. | | | 80,000 | | | 2,010,400 | |
| | | | |
|
|
|
| | | | | | 76,318,400 | |
|
|
|
|
|
|
|
|
| | | | | | | |
Common Stocks | | Shares | | Value | |
|
|
|
|
|
|
|
|
Financials (concluded) | | | | | | | |
Consumer Finance — 2.1% | | | | | | | |
AmeriCredit Corp. (a) | | | 30,000 | | $ | 733,800 | |
Capital One Financial Corp. | | | 740,000 | | | 29,267,000 | |
SLM Corp. (a) | | | 1,290,000 | | | 14,899,500 | |
| | | | |
|
|
|
| | | | | | 44,900,300 | |
|
|
|
|
|
|
|
|
Diversified Financial Services — 6.2% | | | | | | | |
Bank of America Corp. | | | 5,270,000 | | | 69,089,700 | |
Citigroup, Inc. (a) | | | 13,420,000 | | | 52,338,000 | |
JPMorgan Chase & Co. | | | 360,000 | | | 13,705,200 | |
| | | | |
|
|
|
| | | | | | 135,132,900 | |
|
|
|
|
|
|
|
|
Insurance — 5.5% | | | | | | | |
American Financial Group, Inc. | | | 780,000 | | | 23,852,400 | |
Aspen Insurance Holdings Ltd. | | | 690,000 | | | 20,893,200 | |
Assurant, Inc. | | | 600,000 | | | 24,420,000 | |
Berkshire Hathaway, Inc. (a) | | | 130,000 | | | 10,748,400 | |
Protective Life Corp. | | | 210,000 | | | 4,569,600 | |
Prudential Financial, Inc. | | | 110,000 | | | 5,959,800 | |
Unitrin, Inc. | | | 210,000 | | | 5,121,900 | |
UnumProvident Corp. | | | 1,110,000 | | | 24,586,500 | |
| | | | |
|
|
|
| | | | | | 120,151,800 | |
|
|
|
|
|
|
|
|
Total Financials | | | | | | 376,503,400 | |
|
|
|
|
|
|
|
|
Health Care — 13.6% | | | | | | | |
Health Care Providers & Services — 10.1% | | | | | | | |
Aetna, Inc. | | | 910,000 | | | 28,765,100 | |
Cardinal Health, Inc. | | | 790,000 | | | 26,101,600 | |
Cigna Corp. | | | 720,000 | | | 25,761,600 | |
Coventry Health Care, Inc. (a) | | | 1,140,000 | | | 24,544,200 | |
Health Net, Inc. (a) | | | 840,000 | | | 22,839,600 | |
Humana, Inc. (a) | | | 490,000 | | | 24,617,600 | |
UnitedHealth Group, Inc. | | | 1,070,000 | | | 37,567,700 | |
WellPoint, Inc. (a) | | | 510,000 | | | 28,886,400 | |
| | | | |
|
|
|
| | | | | | 219,083,800 | |
|
|
|
|
|
|
|
|
Pharmaceuticals — 3.5% | | | | | | | |
Eli Lilly & Co. (b) | | | 920,000 | | | 33,607,600 | |
Johnson & Johnson | | | 180,000 | | | 11,152,800 | |
King Pharmaceuticals, Inc. (a) | | | 2,450,000 | | | 24,402,000 | |
Pfizer, Inc. | | | 480,000 | | | 8,241,600 | |
| | | | |
|
|
|
| | | | | | 77,404,000 | |
|
|
|
|
|
|
|
|
Total Health Care | | | | | | 296,487,800 | |
|
|
|
|
|
|
|
|
Industrials — 11.7% | | | | | | | |
Aerospace & Defense — 2.4% | | | | | | | |
L-3 Communications Holdings, Inc. | | | 320,000 | | | 23,126,400 | |
Raytheon Co. | | | 640,000 | | | 29,254,400 | |
| | | | |
|
|
|
| | | | | | 52,380,800 | |
|
|
|
|
|
|
|
|
Airlines — 0.7% | | | | | | | |
Southwest Airlines Co. | | | 1,130,000 | | | 14,769,100 | |
|
|
|
|
|
|
|
|
Building Products — 0.8% | | | | | | | |
Owens Corning, Inc. (a) | | | 670,000 | | | 17,172,100 | |
|
|
|
|
|
|
|
|
Commercial Services & Supplies — 0.7% | | | | | | | |
R.R. Donnelley & Sons Co. | | | 900,000 | | | 15,264,000 | |
|
|
|
|
|
|
|
|
Construction & Engineering — 1.1% | | | | | | | |
KBR, Inc. | | | 1,000,000 | | | 24,640,000 | |
|
|
|
|
|
|
|
|
Industrial Conglomerates — 1.3% | | | | | | | |
General Electric Co. | | | 1,780,000 | | | 28,925,000 | |
|
|
|
|
|
|
|
|
| | |
See Notes to Financial Statements. |
|
26 | BLACKROCK LARGE CAP SERIES FUNDS, INC. | SEPTEMBER 30, 2010 |
| |
|
| |
Schedule of Investments (continued) | Master Large Cap Value Portfolio
(Percentages shown are based on Net Assets) |
| | | | | | | |
Common Stocks | | Shares | | Value | |
|
|
|
|
|
|
|
|
Industrials (concluded) | | | | | | | |
Machinery — 3.7% | | | | | | | |
Manitowoc Co. | | | 2,100,000 | | $ | 25,431,000 | |
Oshkosh Corp. (a) | | | 360,000 | | | 9,900,000 | |
Timken Co. | | | 570,000 | | | 21,865,200 | |
Trinity Industries, Inc. (b) | | | 1,010,000 | | | 22,492,700 | |
| | | | |
|
|
|
| | | | | | 79,688,900 | |
|
|
|
|
|
|
|
|
Road & Rail — 1.0% | | | | | | | |
Ryder System, Inc. | | | 510,000 | | | 21,812,700 | |
|
|
|
|
|
|
|
|
Total Industrials | | | | | | 254,652,600 | |
|
|
|
|
|
|
|
|
Information Technology — 11.4% | | | | | | | |
Communications Equipment — 0.5% | | | | | | | |
Motorola, Inc. (a) | | | 1,430,000 | | | 12,197,900 | |
|
|
|
|
|
|
|
|
Computers & Peripherals — 3.1% | | | | | | | |
Lexmark International, Inc., Class A (a) | | | 510,000 | | | 22,756,200 | |
Seagate Technology (a) | | | 1,870,000 | | | 22,028,600 | |
Western Digital Corp. (a) | | | 830,000 | | | 23,563,700 | |
| | | | |
|
|
|
| | | | | | 68,348,500 | |
|
|
|
|
|
|
|
|
Electronic Equipment, Instruments & Components — 2.5% | | | | | | | |
Corning, Inc. | | | 1,700,000 | | | 31,076,000 | |
Vishay Intertechnology, Inc. (a) | | | 2,410,000 | | | 23,328,800 | |
| | | | |
|
|
|
| | | | | | 54,404,800 | |
|
|
|
|
|
|
|
|
IT Services — 0.5% | | | | | | | |
CoreLogic, Inc. (a) | | | 560,000 | | | 10,729,600 | |
|
|
|
|
|
|
|
|
Internet Software & Services — 1.1% | | | | | | | |
AOL, Inc. (a) | | | 950,000 | | | 23,512,500 | |
|
|
|
|
|
|
|
|
Semiconductors & Semiconductor Equipment — 2.6% | | | | | | | |
Intel Corp. | | | 1,850,000 | | | 35,575,500 | |
National Semiconductor Corp. | | | 1,590,000 | | | 20,304,300 | |
| | | | |
|
|
|
| | | | | | 55,879,800 | |
|
|
|
|
|
|
|
|
Software — 1.1% | | | | | | | |
CA, Inc. | | | 1,100,000 | | | 23,232,000 | |
|
|
|
|
|
|
|
|
Total Information Technology | | | | | | 248,305,100 | |
|
|
|
|
|
|
|
|
Materials — 7.2% | | | | | | | |
Chemicals — 2.8% | | | | | | | |
Ashland, Inc. | | | 450,000 | | | 21,946,500 | |
Cabot Corp. | | | 410,000 | | | 13,353,700 | |
Cytec Industries, Inc. | | | 400,000 | | | 22,552,000 | |
RPM International, Inc. | | | 160,000 | | | 3,187,200 | |
| | | | |
|
|
|
| | | | | | 61,039,400 | |
|
|
|
|
|
|
|
|
Containers & Packaging — 1.1% | | | | | | | |
Sealed Air Corp. | | | 1,080,000 | | | 24,278,400 | |
|
|
|
|
|
|
|
|
Paper & Forest Products — 3.3% | | | | | | | |
International Paper Co. | | | 1,040,000 | | | 22,620,000 | |
MeadWestvaco Corp. | | | 980,000 | | | 23,892,400 | |
Weyerhaeuser Co. | | | 1,530,000 | | | 24,112,800 | |
| | | | |
|
|
|
| | | | | | 70,625,200 | |
|
|
|
|
|
|
|
|
Total Materials | | | | | | 155,943,000 | |
|
|
|
|
|
|
|
|
| | | | | | | |
Common Stocks | | Shares | | Value | |
|
|
|
|
|
|
|
|
Telecommunication Services — 5.4% | | | | | | | |
Diversified Telecommunication Services — 2.5% | | | | | | | |
AT&T Inc. | | | 700,000 | | $ | 20,020,000 | |
Qwest Communications International, Inc. | | | 4,160,000 | | | 26,083,200 | |
Verizon Communications, Inc. | | | 230,000 | | | 7,495,700 | |
| | | | |
|
|
|
| | | | | | 53,598,900 | |
|
|
|
|
|
|
|
|
Wireless Telecommunication Services — 2.9% | | | | | | | |
MetroPCS Communications, Inc. (a) | | | 2,340,000 | | | 24,476,400 | |
Sprint Nextel Corp. (a) | | | 6,320,000 | | | 29,261,600 | |
Telephone & Data Systems, Inc. | | | 290,000 | | | 9,512,000 | |
| | | | |
|
|
|
| | | | | | 63,250,000 | |
|
|
|
|
|
|
|
|
Total Telecommunication Services | | | | | | 116,848,900 | |
|
|
|
|
|
|
|
|
Utilities — 10.7% | | | | | | | |
Electric Utilities — 3.4% | | | | | | | |
Edison International | | | 770,000 | | | 26,480,300 | |
NV Energy, Inc. | | | 1,800,000 | | | 23,670,000 | |
Pepco Holdings, Inc. | | | 1,250,000 | | | 23,250,000 | |
| | | | |
|
|
|
| | | | | | 73,400,300 | |
|
|
|
|
|
|
|
|
Gas Utilities — 1.1% | | | | | | | |
Questar Corp. | | | 1,350,000 | | | 23,665,500 | |
|
|
|
|
|
|
|
|
Independent Power Producers & Energy Traders — 2.9% | | | | | | | |
Calpine Corp. (a) | | | 340,000 | | | 4,233,000 | |
Constellation Energy Group, Inc. | | | 470,000 | | | 15,152,800 | |
Mirant Corp. (a) | | | 2,080,000 | | | 20,716,800 | |
NRG Energy, Inc. (a) | | | 1,150,000 | | | 23,943,000 | |
| | | | |
|
|
|
| | | | | | 64,045,600 | |
|
|
|
|
|
|
|
|
Multi-Utilities — 3.3% | | | | | | | |
CMS Energy Corp. | | | 1,320,000 | | | 23,786,400 | |
Integrys Energy Group, Inc. | | | 440,000 | | | 22,906,400 | |
NiSource, Inc. | | | 1,390,000 | | | 24,186,000 | |
| | | | |
|
|
|
| | | | | | 70,878,800 | |
|
|
|
|
|
|
|
|
Total Utilities | | | | | | 231,990,200 | |
|
|
|
|
|
|
|
|
Total Long-Term Investments
(Cost — $2,080,553,676) — 100.6% | | | | | | 2,187,303,900 | |
|
|
|
|
|
|
|
|
| | | | | | | |
|
|
|
|
|
|
|
|
|
Short-Term Securities | | | | | | | |
|
|
|
|
|
|
|
|
BlackRock Liquidity Funds, TempFund, Institutional Class, 0.23% (c)(d) | | | 40 | | | 40 | |
|
|
|
|
|
|
|
|
| | | | | | | |
| | Beneficial
Interest
(000) | | | |
|
|
|
|
|
|
|
|
BlackRock Liquidity Series, LLC Money Market Series, 0.36% (c)(d)(e) | | $ | 36,458 | | | 36,457,500 | |
|
Total Short-Term Securities
(Cost — $36,457,540) — 1.7% | | | | | | 36,457,540 | |
|
|
|
|
|
|
|
|
Total Investments (Cost — $2,117,011,216*) — 102.3% | | | | | | 2,223,761,440 | |
Liabilities in Excess of Other Assets — (2.3)% | | | | | | (50,619,279 | ) |
| | | | |
|
|
|
Net Assets — 100.0% | | | | | $ | 2,173,142,161 | |
| | | | |
|
|
|
| |
* | The cost and unrealized appreciation (depreciation) of investments as of September 30, 2010, as computed for federal income tax purposes, were as follows: |
| | | | | | | |
Aggregate cost | | | | | $ | 2,196,940,057 | |
| | | | |
|
|
|
Gross unrealized appreciation | | | | | $ | 150,289,577 | |
Gross unrealized depreciation | | | | | | (123,468,194 | ) |
| | | | |
|
|
|
Net unrealized appreciation | | | | | $ | 26,821,383 | |
| | | | |
|
|
|
| |
(a) | Non-income producing security. |
| |
(b) | Security, or a portion of security, is on loan. |
| | | |
See Notes to Financial Statements. |
|
| BLACKROCK LARGE CAP SERIES FUNDS, INC. | SEPTEMBER 30, 2010 | 27 |
| |
|
| |
Schedule of Investments (concluded) | Master Large Cap Value Portfolio |
| |
(c) | Investments in companies considered to be an affiliate of the Portfolio during the year, for purposes of Section 2(a)(3) of the Investment Company Act of 1940, as amended, were as follows: |
| | | | | | | | | | | | | |
|
|
|
|
|
|
|
|
|
|
|
|
|
|
Affiliate | | Shares/
Beneficial
Interest Held at
September 30,
2009 | | Net
Activity | | Shares/
Beneficial
Interest Held at
September 30,
2010 | | Income | |
|
|
|
|
|
|
|
|
|
|
|
|
|
|
BlackRock Liquidity Funds, TempFund, Institutional Class | | | — | | | 40 | | | 40 | | $ | 709 | |
BlackRock Liquidity Series, LLC Money Market Series | | $ | 55,738,150 | | $ | (19,280,650 | ) | $ | 36,457,500 | | $ | 93,307 | |
|
|
|
|
|
|
|
|
|
|
|
|
|
|
| | |
(d) | Represents the current yield as of report date. |
| | |
(e) | Security was purchased with the cash collateral from loaned securities. |
| | |
• | For Portfolio compliance purposes, the Portfolio’s sector and industry classifications refer to any one or more of the sector and industry sub-classifications used by one or more widely recognized market indexes or rating group indexes, and/or as defined by Portfolio management. This definition may not apply for purposes of this report, which may combine such sector and industry sub-classifications for reporting ease. |
| | |
• | Fair Value Measurements — Various inputs are used in determining the fair value of investments, which are as follows: |
| | |
| • | Level 1 — price quotations in active markets/exchanges for identical assets and liabilities |
| | |
| • | Level 2 — other observable inputs (including, but not limited to: quoted prices for similar assets or liabilities in markets that are active, quoted prices for identical or similar assets or liabilities in markets that are not active, inputs other than quoted prices that are observable for the assets or liabilities (such as interest rates, yield curves, volatilities, prepayment speeds, loss severities, credit risks and default rates) or other market-corroborated inputs) |
| | |
| • | Level 3 — unobservable inputs based on the best information available in the circumstances, to the extent observable inputs are not available (including the Portfolio’s own assumptions used in determining the fair value of investments) |
| | |
| The inputs or methodologies used for valuing securities are not necessarily an indication of the risk associated with investing in those securities. For information about the Portfolio’s policy regarding valuation of investments and other significant accounting policies, please refer to Note 1 of the Notes to Financial Statements. |
| | |
| The following table summarizes the inputs used as of September 30, 2010 in determining the fair valuation of the Portfolio’s investments: |
| | | | | | | | | | | | | |
|
|
|
|
|
|
|
|
|
|
Valuation Inputs | | Level 1 | | Level 2 | | Level 3 | | Total | |
|
|
|
|
|
|
|
|
|
|
|
|
|
|
Assets: | | | | | | | | | | | | | |
Investments in Securities: | | | | | | | | | | | | | |
Long-Term Investments1 | | $ | 2,187,303,900 | | | — | | | — | | $ | 2,187,303,900 | |
Short-Term Securities | | | 40 | | $ | 36,457,500 | | | — | | | 36,457,540 | |
| |
|
|
|
|
|
|
|
|
|
|
|
|
Total | | $ | 2,187,303,940 | | $ | 36,457,500 | | | — | | $ | 2,223,761,440 | |
| |
|
|
|
|
|
|
|
|
|
|
|
|
| |
1 | See above Schedule of Investments for values in each sector and industry. |
| | |
See Notes to Financial Statements. |
|
28 | BLACKROCK LARGE CAP SERIES FUNDS, INC. | SEPTEMBER 30, 2010 |
| |
|
|
|
Statements of Assets and Liabilities | Master Large Cap Series LLC |
| | | | | | | | | | |
September 30, 2010 | | Master Large
Cap Core
Portfolio | | Master Large
Cap Growth
Portfolio | | Master Large
Cap Value
Portfolio | |
|
|
|
|
|
|
|
|
Assets | | | | | | | | | | |
|
|
|
|
|
|
|
|
|
|
|
Investments at value — unaffiliated1,2 | | $ | 3,211,788,400 | | $ | 664,333,690 | | $ | 2,187,303,900 | |
Investments at value — affiliated3 | | | 113,624,600 | | | 19,870,678 | | | 36,457,540 | |
Investments sold receivable | | | 82,079,200 | | | 20,518,327 | | | 68,070,027 | |
Dividends receivable | | | 2,703,500 | | | 524,145 | | | 1,891,650 | |
Securities lending income receivable — affiliated | | | 22,531 | | | 5,558 | | | 10,456 | |
Contributions receivable from investors | | | 105,243 | | | 7,017,770 | | | 110,394 | |
Prepaid expenses | | | 66,802 | | | 15,077 | | | 62,850 | |
| |
|
|
|
|
|
|
|
|
|
Total assets | | | 3,410,390,276 | | | 712,285,245 | | | 2,293,906,817 | |
| |
|
|
|
|
|
|
|
|
|
| | | | | | | | | | |
|
|
|
|
|
|
|
|
|
|
|
Liabilities | | | | | | | | | | |
|
|
|
|
|
|
|
|
|
|
|
Collateral on securities loaned, at value | | | 113,624,600 | | | 19,523,700 | | | 36,457,500 | |
Bank overdraft | | | 7,252,302 | | | — | | | 10,083,253 | |
Investments purchased payable | | | 75,334,661 | | | 20,557,803 | | | 57,171,877 | |
Withdrawals payable to investors | | | 3,132,078 | | | — | | | 15,937,002 | |
Investment advisory fees payable | | | 1,226,585 | | | 265,268 | | | 888,288 | |
Other affiliates payable | | | 17,559 | | | 3,294 | | | 11,091 | |
Directors’ fees payable | | | 1,120 | | | 241 | | | 716 | |
Other accrued expenses payable | | | 314,727 | | | 100,763 | | | 213,616 | |
Other liabilities payable | | | 823 | | | 211 | | | 1,313 | |
| |
|
|
|
|
|
|
|
|
|
Total liabilities | | | 200,904,455 | | | 40,451,280 | | | 120,764,656 | |
| |
|
|
|
|
|
|
|
|
|
Net Assets | | $ | 3,209,485,821 | | $ | 671,833,965 | | $ | 2,173,142,161 | |
| |
|
|
|
|
|
|
|
|
|
| | | | | | | | | | |
|
|
|
|
|
|
|
|
|
|
|
Net Assets Consist of | | | | | | | | | | |
|
|
|
|
|
|
|
|
|
|
|
Investors’ capital | | $ | 2,895,868,514 | | $ | 619,469,145 | | $ | 2,066,391,937 | |
Net unrealized appreciation/depreciation | | | 313,617,307 | | | 52,364,820 | | | 106,750,224 | |
| |
|
|
|
|
|
|
|
|
|
Net Assets | | $ | 3,209,485,821 | | $ | 671,833,965 | | $ | 2,173,142,161 | |
| |
|
|
|
|
|
|
|
|
|
1 Investments at cost — unaffiliated | | $ | 2,898,171,093 | | $ | 611,968,870 | | $ | 2,080,553,676 | |
| |
|
|
|
|
|
|
|
|
|
2 Securities loaned at value | | $ | 110,435,971 | | $ | 18,823,082 | | $ | 35,494,206 | |
| |
|
|
|
|
|
|
|
|
|
3 Investments at cost — affiliated | | $ | 113,624,600 | | $ | 19,870,678 | | $ | 36,457,540 | |
| |
|
|
|
|
|
|
|
|
|
| | | |
See Notes to Financial Statements. | | |
|
|
|
|
| BLACKROCK LARGE CAP SERIES FUNDS, INC. | SEPTEMBER 30, 2010 | 29 |
| |
|
|
| |
Statements of Operations | Master Large Cap Series LLC |
| | | | | | | | | | |
Year Ended September 30, 2010 | | Master Large
Cap Core
Portfolio | | Master Large
Cap Growth
Portfolio | | Master Large
Cap Value
Portfolio | |
|
|
|
|
|
|
|
|
Investment Income | | | | | | | | | | |
|
|
|
|
|
|
|
|
|
|
|
Dividends | | $ | 60,064,671 | | $ | 9,044,459 | | $ | 45,941,317 | |
Securities lending — affiliated | | | 290,336 | | | 35,501 | | | 93,307 | |
Dividends — affiliated | | | 725 | | | 286 | | | 709 | |
Interest | | | 216,095 | | | 41,481 | | | 69 | |
| |
|
|
|
|
|
|
|
|
|
Total income | | | 60,571,827 | | | 9,121,727 | | | 46,035,402 | |
| |
|
|
|
|
|
|
|
|
|
| | | | | | | | | | |
|
|
|
|
|
|
|
|
|
|
|
Expenses | | | | | | | | | | |
|
|
|
|
|
|
|
|
|
|
|
Investment advisory | | | 17,455,621 | | | 3,530,677 | | | 12,190,974 | |
Accounting services | | | 632,953 | | | 251,669 | | | 491,843 | |
Custodian | | | 204,504 | | | 66,014 | | | 167,687 | |
Professional | | | 112,384 | | | 61,536 | | | 58,720 | |
Directors | | | 81,023 | | | 19,861 | | | 53,956 | |
Printing | | | 7,017 | | | 1,353 | | | 4,265 | |
Miscellaneous | | | 81,961 | | | 20,307 | | | 63,747 | |
| |
|
|
|
|
|
|
|
|
|
Total expenses | | | 18,575,463 | | | 3,951,417 | | | 13,031,192 | |
Less fees waived by advisor | | | (599 | ) | | (99 | ) | | (184 | ) |
| |
|
|
|
|
|
|
|
|
|
Total expenses after fees waived | | | 18,574,864 | | | 3,951,318 | | | 13,031,008 | |
| |
|
|
|
|
|
|
|
|
|
Net investment income | | | 41,996,963 | | | 5,170,409 | | | 33,004,394 | |
| |
|
|
|
|
|
|
|
|
|
| | | | | | | | | | |
|
|
|
|
|
|
|
|
|
|
|
Realized and Unrealized Gain (Loss) | | | | | | | | | | |
|
|
|
|
|
|
|
|
|
|
|
Net realized gain from: | | | | | | | | | | |
Investments | | | 407,516,634 | | | 102,377,389 | | | 367,217,114 | |
Payment by affiliate | | | 2,278,260 | | | 68,976 | | | — | |
| |
|
|
|
|
|
|
|
|
|
| | | 409,794,894 | | | 102,446,365 | | | 367,217,114 | |
| |
|
|
|
|
|
|
|
|
|
Net change in unrealized appreciation/depreciation on investments | | | (226,914,201 | ) | | (55,277,639 | ) | | (289,936,488 | ) |
| |
|
|
|
|
|
|
|
|
|
Total realized and unrealized gain | | | 182,880,693 | | | 47,168,726 | | | 77,280,626 | |
| |
|
|
|
|
|
|
|
|
|
Net Increase in Net Assets Resulting from Operations | | $ | 224,877,656 | | $ | 52,339,135 | | $ | 110,285,020 | |
| |
|
|
|
|
|
|
|
|
|
| | |
See Notes to Financial Statements. |
|
|
|
30 | BLACKROCK LARGE CAP SERIES FUNDS, INC. | SEPTEMBER 30, 2010 |
| |
|
|
| |
Statements of Changes in Net Assets | Master Large Cap Series LLC |
| | | | | | | | | | | | | | | | | | | |
| | Master Large Cap Core Portfolio | | Master Large Cap Growth Portfolio | |
| |
| |
| |
Increase (Decrease) in Net Assets: | | Year Ended
September 30,
2010 | | Period
November 1,
2008 to
September 30,
2009 | | Year Ended
October 31,
2008 | | Year Ended
September 30,
2010 | | Period
November 1,
2008 to
September 30,
2009 | | Year Ended
October 31,
2008 | |
|
|
|
|
|
|
|
|
|
|
|
|
|
|
|
|
|
|
|
|
Operations | | | | | | | | | | | | | | | | | | | |
|
|
|
|
|
|
|
|
|
|
|
|
|
|
|
|
|
|
|
|
Net investment income | | $ | 41,996,963 | | $ | 45,398,506 | | $ | 41,118,548 | | $ | 5,170,409 | | $ | 4,690,392 | | $ | 5,455,044 | |
Net realized gain (loss) | | | 409,794,894 | | | (778,429,718 | ) | | (521,502,159 | ) | | 102,446,365 | | | (130,730,353 | ) | | (114,597,872 | ) |
Net change in unrealized appreciation/depreciation | | | (226,914,201 | ) | | 1,174,704,782 | | | (1,536,726,590 | ) | | (55,277,639 | ) | | 248,627,811 | | | (333,142,941 | ) |
| |
|
|
|
|
|
|
|
|
|
|
|
|
|
|
|
|
|
|
Net increase (decrease) in net assets resulting from operations | | | 224,877,656 | | | 441,673,570 | | | (2,017,110,201 | ) | | 52,339,135 | | | 122,587,850 | | | (442,285,769 | ) |
| |
|
|
|
|
|
|
|
|
|
|
|
|
|
|
|
|
|
|
| | | | | | | | | | | | | | | | | | | |
|
|
|
|
|
|
|
|
|
|
|
|
|
|
|
|
|
|
|
|
Capital Transactions | | | | | | | | | | | | | | | | | | | |
|
|
|
|
|
|
|
|
|
|
|
|
|
|
|
|
|
|
|
|
Proceeds from contributions | | | 390,820,213 | | | 1,506,405,011 | | | 986,366,566 | | | 145,816,428 | | | 215,325,909 | | | 469,632,427 | |
Value of withdrawals | | | (1,352,534,366 | ) | | (845,271,038 | ) | | (1,775,472,579 | ) | | (260,209,274 | ) | | (269,988,785 | ) | | (595,379,184 | ) |
| |
|
|
|
|
|
|
|
|
|
|
|
|
|
|
|
|
|
|
Net increase (decrease) in net assets derived from capital transactions | | | (961,714,153 | ) | | 661,133,973 | | | (789,106,013 | ) | | (114,392,846 | ) | | (54,662,876 | ) | | (125,746,757 | ) |
| |
|
|
|
|
|
|
|
|
|
|
|
|
|
|
|
|
|
|
| | | | | | | | | | | | | | | | | | | |
|
|
|
|
|
|
|
|
|
|
|
|
|
|
|
|
|
|
|
|
Net Assets | | | | | | | | | | | | | | | | | | | |
|
|
|
|
|
|
|
|
|
|
|
|
|
|
|
|
|
|
|
|
Total increase (decrease) in net assets | | | (736,836,497 | ) | | 1,102,807,543 | | | (2,806,216,214 | ) | | (62,053,711 | ) | | 67,924,974 | | | (568,032,526 | ) |
Beginning of period | | | 3,946,322,318 | | | 2,843,514,775 | | | 5,649,730,989 | | | 733,887,676 | | | 665,962,702 | | | 1,233,995,228 | |
| |
|
|
|
|
|
|
|
|
|
|
|
|
|
|
|
|
|
|
End of period | | $ | 3,209,485,821 | | $ | 3,946,322,318 | | $ | 2,843,514,775 | | $ | 671,833,965 | | $ | 733,887,676 | | $ | 665,962,702 | |
| |
|
|
|
|
|
|
|
|
|
|
|
|
|
|
|
|
|
|
| | | | | | | | | | |
| | Master Large Cap Series LLC |
| | | |
| | Master Large Cap Value Portfolio | |
| |
| |
Increase (Decrease) in Net Assets: | | Year Ended
September 30,
2010 | | Period
November 1,
2008 to
September 30,
2009 | | Year Ended
October 31,
2008 | |
|
|
|
|
|
|
|
|
Operations | | | | | | | | | | |
|
|
|
|
|
|
|
|
|
|
|
Net investment income | | $ | 33,004,394 | | $ | 44,699,454 | | $ | 56,250,234 | |
Net realized gain (loss) | | | 367,217,114 | | | (907,436,935 | ) | | (586,455,313 | ) |
Net change in unrealized appreciation/depreciation | | | (289,936,488 | ) | | 1,046,928,266 | | | (1,366,434,994 | ) |
| |
|
|
|
|
|
|
|
|
|
Net increase (decrease) in net assets resulting from operations | | | 110,285,020 | | | 184,190,785 | | | (1,896,640,073 | ) |
| |
|
|
|
|
|
|
|
|
|
| | | | | | | | | | |
|
|
|
|
|
|
|
|
|
|
|
Capital Transactions | | | | | | | | | | |
|
|
|
|
|
|
|
|
|
|
|
Proceeds from contributions | | | 567,720,441 | | | 812,993,042 | | | 1,889,127,025 | |
Value of withdrawals | | | (1,150,721,411 | ) | | (1,414,441,343 | ) | | (2,321,525,876 | ) |
| |
|
|
|
|
|
|
|
|
|
Net decrease in net assets derived from capital transactions | | | (583,000,970 | ) | | (601,448,301 | ) | | (432,398,851 | ) |
| |
|
|
|
|
|
|
|
|
|
| | | | | | | | | | |
|
|
|
|
|
|
|
|
|
|
|
Net Assets | | | | | | | | | | |
|
|
|
|
|
|
|
|
|
|
|
Total decrease in net assets | | | (472,715,950 | ) | | (417,257,516 | ) | | (2,329,038,924 | ) |
Beginning of period | | | 2,645,858,111 | | | 3,063,115,627 | | | 5,392,154,551 | |
| |
|
|
|
|
|
|
|
|
|
End of period | | $ | 2,173,142,161 | | $ | 2,645,858,111 | | $ | 3,063,115,627 | |
| |
|
|
|
|
|
|
|
|
|
| | | |
See Notes to Financial Statements. | | |
|
|
|
|
| BLACKROCK LARGE CAP SERIES FUNDS, INC. | SEPTEMBER 30, 2010 | 31 |
| |
|
|
| |
Financial Highlights | Master Large Cap Series LLC |
| | | | | | | | | | | | | | | | | | | |
| | Master Large Cap Core Portfolio |
| |
|
| | Year
Ended
September 30,
2010 | | Period
November 1,
2008 to
September 30,
2009 | | | |
| | | | | |
| | | | Year Ended October 31, | |
| | | |
|
|
| | | | 2008 | | 2007 | | 2006 | | 2005 | |
|
|
|
|
|
|
|
|
|
|
|
|
|
|
|
|
|
|
|
|
Total Investment Return | | | | | | | | | | | | | | | | | | | |
|
|
|
|
|
|
|
|
|
|
|
|
|
|
|
|
|
|
|
|
Total investment return | | | 6.16 | % | | 12.63 | %1,2 | | (38.84 | )% | | 13.94 | % | | 17.32 | % | | 18.35 | % |
| |
|
|
|
|
|
|
|
|
|
|
|
|
|
|
|
|
|
|
| | | | | | | | | | | | | | | | | | | |
|
|
|
|
|
|
|
|
|
|
|
|
|
|
|
|
|
|
|
|
Ratios to Average Net Assets | | | | | | | | | | | | | | | | | | | |
|
|
|
|
|
|
|
|
|
|
|
|
|
|
|
|
|
|
|
|
Total expenses | | | 0.49 | % | | 0.50 | %3 | | 0.50 | % | | 0.49 | % | | 0.49 | % | | 0.51 | % |
| |
|
|
|
|
|
|
|
|
|
|
|
|
|
|
|
|
|
|
Total expenses after fees waived | | | 0.49 | % | | 0.50 | %3 | | 0.50 | % | | 0.49 | % | | 0.49 | % | | 0.51 | % |
| |
|
|
|
|
|
|
|
|
|
|
|
|
|
|
|
|
|
|
Net investment income | | | 1.11 | % | | 1.56 | %3 | | 0.93 | % | | 0.63 | % | | 0.58 | % | | 0.72 | % |
| |
|
|
|
|
|
|
|
|
|
|
|
|
|
|
|
|
|
|
| | | | | | | | | | | | | | | | | | | |
|
|
|
|
|
|
|
|
|
|
|
|
|
|
|
|
|
|
|
|
Supplemental Data | | | | | | | | | | | | | | | | | | | |
|
|
|
|
|
|
|
|
|
|
|
|
|
|
|
|
|
|
|
|
Net assets, end of period (000) | | $ | 3,209,486 | | $ | 3,946,322 | | $ | 2,843,515 | | $ | 5,649,731 | | $ | 3,876,639 | | $ | 2,666,699 | |
| |
|
|
|
|
|
|
|
|
|
|
|
|
|
|
|
|
|
|
Portfolio turnover | | | 173 | % | | 168 | % | | 109 | % | | 96 | % | | 88 | % | | 94 | % |
| |
|
|
|
|
|
|
|
|
|
|
|
|
|
|
|
|
|
|
| | | | | | | | | | | | | | | | | | | |
| | Master Large Cap Growth Portfolio |
| |
|
|
| | Year
Ended
September 30,
2010 | | Period
November 1,
2008 to
September 30,
2009 | | | | | | | | | | | | | |
| | | | | | | | | | | | | | | |
| | | | Year Ended October 31, | |
| | | |
|
|
| | | | 2008 | | 2007 | | 2006 | | 2005 | |
|
|
|
|
|
|
|
|
|
|
|
|
|
|
Total Investment Return | | | | | | | | | | | | | | | | | | | |
|
|
|
|
|
|
|
|
|
|
|
|
|
|
|
|
|
|
|
|
Total investment return | | | 7.68 | % | | 20.49 | %1,4 | | (37.96 | )% | | 17.47 | % | | 14.05 | % | | 12.47 | % |
| |
|
|
|
|
|
|
|
|
|
|
|
|
|
|
|
|
|
|
| | | | | | | | | | | | | | | | | | | |
|
|
|
|
|
|
|
|
|
|
|
|
|
|
|
|
|
|
|
|
Ratios to Average Net Assets | | | | | | | | | | | | | | | | | | | |
|
|
|
|
|
|
|
|
|
|
|
|
|
|
|
|
|
|
|
|
Total expenses | | | 0.56 | % | | 0.57 | %3 | | 0.56 | % | | 0.56 | % | | 0.56 | % | | 0.57 | % |
| |
|
|
|
|
|
|
|
|
|
|
|
|
|
|
|
|
|
|
Total expenses after fees waived | | | 0.56 | % | | 0.57 | %3 | | 0.56 | % | | 0.56 | % | | 0.56 | % | | 0.57 | % |
| |
|
|
|
|
|
|
|
|
|
|
|
|
|
|
|
|
|
|
Net investment income | | | 0.73 | % | | 0.81 | %3 | | 0.54 | % | | 0.25 | % | | 0.26 | % | | 0.33 | % |
| |
|
|
|
|
|
|
|
|
|
|
|
|
|
|
|
|
|
|
| | | | | | | | | | | | | | | | | | | |
|
|
|
|
|
|
|
|
|
|
|
|
|
|
|
|
|
|
|
|
Supplemental Data | | | | | | | | | | | | | | | | | | | |
|
|
|
|
|
|
|
|
|
|
|
|
|
|
|
|
|
|
|
|
Net assets, end of period (000) | | $ | 671,834 | | $ | 733,888 | | $ | 665,963 | | $ | 1,233,995 | | $ | 785,377 | | $ | 489,398 | |
| |
|
|
|
|
|
|
|
|
|
|
|
|
|
|
|
|
|
|
Portfolio turnover | | | 232 | % | | 242 | % | | 144 | % | | 87 | % | | 117 | % | | 132 | % |
| |
|
|
|
|
|
|
|
|
|
|
|
|
|
|
|
|
|
|
| | |
| 1 | Aggregate total investment return. |
| | |
| 2 | Includes proceeds received from a settlement of litigation, which impacted the Portfolio’s total investment return. Not including these proceeds, the Portfolio’s total investment return would have been 12.39%. |
| | |
| 3 | Annualized. |
| | |
| 4 | Includes proceeds received from a settlement of litigation, which impacted the Portfolio’s total investment return. Not including these proceeds, the Portfolio’s total investment return would have been 20.23%. |
| | |
See Notes to Financial Statements. |
|
|
|
32 | BLACKROCK LARGE CAP SERIES FUNDS, INC. | SEPTEMBER 30, 2010 |
| |
|
|
| |
Financial Highlights (concluded) | Master Large Cap Series LLC |
| | | | | | | | | | | | | | | | | | | |
| | Master Large Cap Value Portfolio | |
| |
|
|
| | Year
Ended
September 30,
2010 | | Period
November 1,
2008 to
September 30,
2009 | | | |
| | | | | |
| | | | Year Ended October 31, | |
| | | |
|
|
| | | | 2008 | | 2007 | | 2006 | | 2005 | |
|
|
|
|
|
|
|
|
|
|
|
|
|
|
|
|
|
|
|
|
Total Investment Return | | | | | | | | | | | | | | | | | | | |
|
|
|
|
|
|
|
|
|
|
|
|
|
|
|
|
|
|
|
|
Total investment return | | | 4.36 | % | | 9.03 | %1,2 | | (36.54 | )% | | 12.72 | % | | 18.48 | % | | 21.93 | % |
| |
|
|
|
|
|
|
|
|
|
|
|
|
|
|
|
|
|
|
| | | | | | | | | | | | | | | | | | | |
|
|
|
|
|
|
|
|
|
|
|
|
|
|
|
|
|
|
|
|
Ratios to Average Net Assets | | | | | | | | | | | | | | | | | | | |
|
|
|
|
|
|
|
|
|
|
|
|
|
|
|
|
|
|
|
|
Total expenses | | | 0.53 | % | | 0.54 | %3 | | 0.51 | % | | 0.51 | % | | 0.53 | % | | 0.55 | % |
| |
|
|
|
|
|
|
|
|
|
|
|
|
|
|
|
|
|
|
Total expenses after fees waived | | | 0.53 | % | | 0.54 | %3 | | 0.51 | % | | 0.51 | % | | 0.53 | % | | 0.55 | % |
| |
|
|
|
|
|
|
|
|
|
|
|
|
|
|
|
|
|
|
Net investment income | | | 1.35 | % | | 1.88 | %3 | | 1.22 | % | | 0.95 | % | | 0.73 | % | | 0.80 | % |
| |
|
|
|
|
|
|
|
|
|
|
|
|
|
|
|
|
|
|
| | | | | | | | | | | | | | | | | | | |
|
|
|
|
|
|
|
|
|
|
|
|
|
|
|
|
|
|
|
|
Supplemental Data | | | | | | | | | | | | | | | | | | | |
|
|
|
|
|
|
|
|
|
|
|
|
|
|
|
|
|
|
|
|
Net assets, end of period (000) | | $ | 2,173,142 | | $ | 2,645,858 | | $ | 3,063,116 | | $ | 5,392,155 | | $ | 3,927,926 | | $ | 1,535,988 | |
| |
|
|
|
|
|
|
|
|
|
|
|
|
|
|
|
|
|
|
Portfolio turnover | | | 183 | % | | 151 | % | | 108 | % | | 72 | % | | 71 | % | | 95 | % |
| |
|
|
|
|
|
|
|
|
|
|
|
|
|
|
|
|
|
|
| | |
| 1 | Aggregate total investment return. |
| | |
| 2 | Includes proceeds received from a settlement of litigation, which impacted the Portfolio’s total investment return. Not including these proceeds, the Portfolio’s total investment return would have been 8.61%. |
| | |
| 3 | Annualized. |
| | | |
See Notes to Financial Statements. | | |
|
|
|
|
| BLACKROCK LARGE CAP SERIES FUNDS, INC. | SEPTEMBER 30, 2010 | 33 |
| |
|
| |
Notes to Financial Statements | Master Large Cap Series LLC |
1. Organization and Significant Accounting Policies:
Master Large Cap Core Portfolio, Master Large Cap Growth Portfolio and Master Large Cap Value Portfolio (collectively the “Portfolios” or individually a “Portfolio”) constitute the Master Large Cap Series LLC (collectively, the “Master LLC”). The Master LLC is registered under the Investment Company Act of 1940, as amended (the “1940 Act”), as a diversified open-end management investment company and is organized as a Delaware limited liability company. The Limited Liability Company Agreement permits the Board of Directors (the “Board”) to issue non-transferable interests in the Master LLC, subject to certain limitations. The Master LLC’s financial statements are prepared in conformity with accounting principles generally accepted in the United States of America, which may require management to make estimates and assumptions that affect the reported amounts and disclosures in the financial statements. Actual results could differ from those estimates.
The following is a summary of significant accounting policies followed by the Master LLC:
Reorganization:
Master Large Cap Core Portfolio
On November 14, 2008, an investor of the Portfolio acquired all of the assets and certain stated liabilities of PNC Growth & Income Fund (the “PNC Fund”), a series of PNC Funds, Inc. The reorganization was pursuant to an Agreement and Plan of Reorganization, which was approved by the shareholders of the PNC Fund on October 31, 2008. As a result of the reorganization, which included $59,817,678 of net unrealized depreciation, the Portfolio received an in-kind contribution of portfolio securities.
Valuation: The Portfolios’ policy is to fair value their financial instruments at market value using independent dealers or pricing services under policies approved by the Board. Equity investments traded on a recognized securities exchange or the NASDAQ Global Market System are valued at the last reported sale price that day or the NASDAQ official closing price, if applicable. For equity investments traded on more than one exchange, the last reported sale price on the exchange where the stock is primarily traded is used. Equity investments traded on a recognized exchange for which there were no sales on that day are valued at the last available bid price. If no bid price is available, the prior day’s price will be used, unless it is determined that such prior day’s price no longer reflects the fair value of the security. Investments in open-end investment companies are valued at net asset value each business day. Short-term securities with remaining maturities of 60 days or less may be valued at amortized cost, which approximates fair value.
The Portfolios value their investments in BlackRock Liquidity Series, LLC Money Market Series (the “Money Market Series”), at fair value, which is ordinarily based upon their pro rata ownership in the net assets of the underlying fund. The Money Market Series seeks current income consistent with maintaining liquidity and preserving capital. Although the Money Market Series is not registered under the 1940 Act, its investments will follow the parameters of investments by a money market fund that is subject to Rule 2a-7 promulgated by the Securities and Exchange Commission (“SEC”) under the 1940 Act. The Portfolios may withdraw up to 25% of their investment daily, although the manager of the Money Market Series, in its sole discretion, may permit an investor to withdraw more than 25% on any one day.
In the event that application of these methods of valuation results in a price for an investment which is deemed not to be representative of the market value of such investment or is not available, the investment will be valued in accordance with a policy approved by the Board as reflecting fair value (“Fair Value Assets”). When determining the price for Fair Value Assets, the investment advisor and/or the sub-advisor seeks to determine the price that the Portfolio might reasonably expect to receive from the current sale of that asset in an arm’s-length transaction. Fair value determinations shall be based upon all available factors that the investment advisor and/or sub-advisor deems relevant. The pricing of all Fair Value Assets is subsequently reported to the Board or a committee thereof.
Investment Transactions and Investment Income: For financial reporting purposes, investment transactions are recorded on the dates the transactions are entered into (the trade dates). Realized gains and losses on investment transactions are determined on the identified cost basis. Dividend income is recorded on the ex-dividend dates. Dividends from foreign securities where the ex-dividend date may have passed are subsequently recorded when the Portfolios have determined the ex-dividend date. Upon notification from issuers, some of the dividend income received from a real estate investment trust may be redesignated as a reduction of cost of the related investment and/or realized gain. Interest income is recognized on the accrual basis.
Securities Lending: The Portfolios may lend securities to financial institutions that provide cash as collateral, which will be maintained at all times in an amount equal to at least 100% of the current market value of the loaned securities. The market value of the loaned securities is determined at the close of business of the Portfolios and any additional required collateral is delivered to the Portfolios on the next business day. Securities lending income, as disclosed in the Statements of Operations, represents the income earned from the investment of the cash collateral, net of rebates paid to, or fees paid by, borrowers and less the fees paid to the securities lending agent. During the term of the loan, the Portfolios are entitled to dividend and interest payments on the securities loaned. Loans of securities are terminable at any time and the borrower, after notice, is required to return borrowed securities within the standard time period for settlement of securities transactions. In the event that the borrower defaults on its obligation to return borrowed securities because of insolvency or for any other reason, the Portfolios could experience delays and costs in gaining access to the collateral. The Portfolios also could suffer a loss if the value of an investment purchased with cash collateral falls below the market value of loaned securities or if the value of an investment purchased with cash collateral falls below the value of the original cash collateral received.
Income Taxes: Each Portfolio is classified as a partnership for federal income tax purposes. As such, each investor in the Portfolio is treated as owner of its proportionate share of the net assets, income, expenses and realized and unrealized gains and losses of the Portfolio. Therefore, no federal income tax provision is required. It is intended that the Portfolios’ assets will be managed so an investor in the Portfolio can satisfy the requirements of Sub-chapter M of the Internal Revenue Code of 1986, as amended.
Other: Expenses directly related to one of the Portfolios are charged to that Portfolio. Other operating expenses shared by several funds are pro rated among those funds on the basis of relative net assets or other appropriate
| | |
|
|
|
34 | BLACKROCK LARGE CAP SERIES FUNDS, INC. | SEPTEMBER 30, 2010 |
| |
|
| |
Notes to Financial Statements (continued) | Master Large Cap Series LLC |
methods. Each Portfolio has an arrangement with the custodian whereby fees may be reduced by credits earned on uninvested cash balances, which if applicable are shown as fees paid indirectly in the Statements of Operations. The custodian imposes fees on overdrawn cash balances, which can be offset by accumulated credits earned or may result in additional custody charges.
2. Investment Advisory Agreement and Other Transactions with Affiliates:
The PNC Financial Services Group, Inc. (“PNC”), Bank of America Corporation (“BAC”) and Barclays Bank PLC (“Barclays”) are the largest stockholders of BlackRock, Inc. (“BlackRock”). Due to the ownership structure, PNC is an affiliate of the Portfolios for 1940 Act purposes, but BAC and Barclays are not.
The Master LLC, on behalf of each Portfolio, entered into an Investment Advisory Agreement with BlackRock Advisors, LLC (the “Manager”), the Portfolios’ investment advisor, an indirect, wholly owned subsidiary of BlackRock, to provide investment advisory and administration services.
The Manager is responsible for the management of each Portfolio and provides the necessary personnel, facilities, equipment and certain other services necessary to the operations of each Portfolio. For such services, each Portfolio pays the Manager a monthly fee at the following annual rates of each Portfolio’s average daily net assets:
Master Large Cap Core Portfolio
| | | | |
|
|
|
|
|
Portion of Average Daily Value of Net Assets | | | Rate | |
|
|
|
|
|
Not exceeding $1 billion | | | 0.50% | |
In excess of $1 billion, but not exceeding $5 billion | | | 0.45% | |
In excess of $5 billion | | | 0.40% | |
|
|
|
|
|
| | | | |
Master Large Cap Growth Portfolio | | | | |
| | | | |
|
|
|
|
|
Portion of Average Daily Value of Net Assets | | | Rate | |
|
|
|
|
|
Not exceeding $5 billion | | | 0.50% | |
In excess of $5 billion | | | 0.45% | |
|
|
|
|
|
| | | | |
Master Large Cap Value Portfolio | | | | |
| | | | |
|
|
|
|
|
Portion of Average Daily Value of Net Assets | | | Rate | |
|
|
|
|
|
Not exceeding $3 billion | | | 0.50% | |
In excess of $3 billion | | | 0.45% | |
|
|
|
|
|
The Manager voluntarily agreed to waive its investment advisory fees by the amount of investment advisory fees each Portfolio pays to the Manager indirectly through its investment in affiliated money market funds, however, the Manager does not waive its investment advisory fees by the amount of investment advisory fees paid through each Portfolio’s investment in other affiliated investment companies, if any. This amount is shown as fees waived by advisor in the Statements of Operations.
The Manager entered into a separate sub-advisory agreement with BlackRock Investment Management, LLC (“BIM”), an affiliate of the Manager. The Manager pays BIM for services it provides, a monthly fee that is a percentage of the investment advisory fees paid by each Portfolio to the Manager.
For the year ended September 30, 2010, each Portfolio reimbursed the Manager for certain accounting services, which are included in accounting services in the Statements of Operations. The reimbursements were as follows:
| | | | |
|
|
|
|
|
Master Large Cap Core Portfolio | | $ | 73,376 | |
Master Large Cap Growth Portfolio | | $ | 13,624 | |
Master Large Cap Value Portfolio | | $ | 46,040 | |
|
|
|
|
|
The Portfolios have received an exemptive order from the SEC permitting them, among other things, to pay an affiliated securities lending agent a fee based on a share of the income derived from the securities lending activities and has retained BIM as the securities lending agent. BIM may, on behalf of the Portfolios, invest cash collateral received by the Portfolios for such loans, among other things, in a private investment company managed by the Manager or in registered money market funds advised by the Manager or its affiliates. The market value of securities on loan and the value of the related collateral are shown in the Statements of Assets and Liabilities as securities loaned and collateral on securities loaned, at value, respectively. The cash collateral invested by BIM is disclosed in the Schedules of Investments. The share of income earned by the Portfolios on such investments is shown as securities lending — affiliated in the Statements of Operations. For the year ended September 30, 2010, BIM received the following in securities lending agent fees related to securities lending activities for the Portfolios:
| | | | |
|
|
|
|
|
Master Large Cap Core Portfolio | | $ | 72,814 | |
Master Large Cap Growth Portfolio | | $ | 8,961 | |
Master Large Cap Value Portfolio | | $ | 23,295 | |
|
|
|
|
|
The Manager reimbursed Master Large Cap Core Portfolio and Master Large Cap Growth Portfolio $2,278,260 and $68,976, respectively, for net losses associated with certain investment transactions. These amounts are shown as payment by affiliates in the Statements of Operations.
Certain officers and/or directors of the Portfolios are officers and/or directors of BlackRock or its affiliates.
3. Investments:
Purchases and sales of investments, excluding short-term securities for the year ended September 30, 2010, were as follows:
| | | | | | | |
|
|
|
|
|
|
| | Purchases | | Sales | |
|
|
|
|
|
|
Master Large Cap Core Portfolio | | $ | 6,409,399,080 | | $ | 7,328,183,522 | |
Master Large Cap Growth Portfolio | | $ | 1,619,332,771 | | $ | 1,737,945,660 | |
Master Large Cap Value Portfolio | | $ | 4,407,194,346 | | $ | 4,950,056,303 | |
|
|
|
|
|
|
|
|
| | | |
|
|
|
|
| BLACKROCK LARGE CAP SERIES FUNDS, INC. | SEPTEMBER 30, 2010 | 35 |
| |
|
| |
Notes to Financial Statements (concluded) | Master Large Cap Series LLC |
4. Borrowings:
The Master LLC, on behalf of the Portfolios, along with certain other funds managed by the Manager and its affiliates, is a party to a $500 million credit agreement with a group of lenders, which expires in November 2010 and was subsequently renewed until November 2011. Each Portfolio may borrow under the credit agreement to fund shareholder redemptions. Effective November 2008, the credit agreement had the following terms: 0.02% upfront fee on the aggregate commitment amount which was allocated to each Portfolio based on its net assets as of October 31, 2008, a commitment fee of 0.08% per annum based on each Portfolio’s pro rata share of the unused portion of the credit agreement, which is included in miscellaneous in the Statements of Operations, and interest at a rate equal to the higher of (a) federal funds effective rate and (b) reserve adjusted one-month LIBOR, plus, in each case, the higher of (i) 1.50% and (ii) 50% of the CDX Index (as defined in the credit agreement) on amounts borrowed. Effective November 2009, the credit agreement was renewed with the following terms: 0.02% upfront fee on the aggregate commitment amount which was allocated to each Portfolio based on its net assets as of October 31, 2009, a commitment fee of 0.10% per annum based on each Portfolio’s pro rata share of the unused portion of the credit agreement which is included in miscellaneous in the Statements of Operations, and interest at a rate equal to the higher of (a) the one-month LIBOR plus 1.25% per annum and (b) the Fed Funds rate plus 1.25% per annum on amounts borrowed. The Portfolios did not borrow under the credit agreement during the year ended September 30, 2010.
5. Concentration, Market and Credit Risk:
Master Large Cap Growth Portfolio invests a significant portion of its assets in securities in the information technology and consumer discretionary sectors. Changes in economic conditions affecting the information technology and consumer discretionary sectors would have a greater impact on Master Large Cap Growth Portfolio and could affect the value, income and/or liquidity of positions in such securities.
In the normal course of business, the Portfolios invest in securities and enter into transactions where risks exist due to fluctuations in the market (market risk) or failure of the issuer of a security to meet all its obligations (issuer credit risk). The value of securities held by the Portfolios may decline in response to certain events, including those directly involving the issuers whose securities are owned by the Portfolios; conditions affecting the general economy; overall market changes; local, regional or global political, social or economic instability; and currency and interest rate and price fluctuations. Similar to issuer credit risk, the Portfolios may be exposed to counterparty credit risk, or the risk that an entity with which the Portfolios have unsettled or open transactions may fail to or be unable to perform on its commitments. The Portfolios manage counterparty credit risk by entering into transactions only with counterparties that they believe have the financial resources to honor their obligations and by monitoring the financial stability of those counterparties. Financial assets, which potentially expose the Portfolios to market, issuer and counterparty credit risks, consist principally of financial instruments and receivables due from counterparties. The extent of the Portfolios’ exposure to market, issuer and counterparty credit risks with respect to these financial assets is generally approximated by their value recorded in the Portfolios’ Statements of Assets and Liabilities, less any collateral held by the Master LLC.
6. Subsequent Events:
Management has evaluated the impact of all subsequent events on each Portfolio through the date the financial statements were issued and has determined that there were no subsequent events requiring adjustment or additional disclosure in the financial statements.
| | |
|
36 | BLACKROCK LARGE CAP SERIES FUNDS, INC. | SEPTEMBER 30, 2010 |
| |
|
| |
Report of Independent Registered Public Accounting Firm | Master Large Cap Series LLC |
To the Investors and Board of Directors of Master Large Cap Series LLC:
We have audited the accompanying statements of assets and liabilities, including the schedules of investments, of Master Large Cap Series LLC (the “Master LLC”) comprised of Master Large Cap Core Portfolio, Master Large Cap Growth Portfolio and Master Large Cap Value Portfolio, as of September 30, 2010, and the related statements of operations for the year then ended, the statements of changes in net assets for the year then ended, for the period November 1, 2008 through September 30, 2009, and for the year ended October 31, 2008, and the financial highlights for the year ended September 30, 2010, for the period November 1, 2008 through September 30, 2009, and for each of the four years in the period ended October 31, 2008. These financial statements and financial highlights are the responsibility of the Master LLC’s management. Our responsibility is to express an opinion on these financial statements and financial highlights based on our audits.
We conducted our audits in accordance with the standards of the Public Company Accounting Oversight Board (United States). Those standards require that we plan and perform the audit to obtain reasonable assurance about whether the financial statements and financial highlights are free of material misstatement. The Master LLC is not required to have, nor were we engaged to perform, an audit of its internal control over financial reporting. Our audits included consideration of internal control over financial reporting as a basis for designing audit procedures that are appropriate in the circumstances, but not for the purpose of expressing an opinion on the effectiveness of the Corporation’s internal control over financial reporting. Accordingly, we express no such opinion. An audit also includes examining, on a test basis, evidence supporting the amounts and disclosures in the financial statements, assessing the accounting principles used and significant estimates made by management, as well as evaluating the overall financial statement presentation. Our procedures included confirmation of securities owned as of September 30, 2010, by correspondence with the custodian and brokers; where replies were not received from brokers, we performed other auditing procedures. We believe that our audits provide a reasonable basis for our opinion.
In our opinion, the financial statements and financial highlights referred to above present fairly, in all material respects, the financial positions of Master Large Cap Core Portfolio, Master Large Cap Growth Portfolio and Master Large Cap Value Portfolio of Master Large Cap Series LLC, as of September 30, 2010, the results of their operations for the year then ended, the changes in their net assets for the year then ended, for the period November 1, 2008 through September 30, 2009, and for the year ended October 31, 2008, and the financial highlights for the year ended September 30, 2010, the period November 1, 2008 through September 30, 2009, and for each of the four years in the period ended October 31, 2008, in conformity with accounting principles generally accepted in the United States of America.
Deloitte & Touche LLP
Princeton, New Jersey
November 26, 2010
| | | |
|
|
|
|
| BLACKROCK LARGE CAP SERIES FUNDS, INC. | SEPTEMBER 30, 2010 | 37 |
|
|
|
Disclosure of Investment Advisory Agreement and Sub-Advisory Agreement |
The Board of Directors of Master Large Cap Series LLC (the “Master LLC”) met on April 20, 2010 and May 18 – 19, 2010 to consider the approval of the Master LLC’s investment advisory agreement (the “Advisory Agreement”) with BlackRock Advisors, LLC (the “Manager”), the Master LLC’s investment advisor, on behalf of each of Master Large Cap Core Portfolio, Master Large Cap Growth Portfolio and Master Large Cap Value Portfolio (each a “Master Portfolio,” and together, the “Master Portfolios”). The Board of Directors of the Master LLC also considered the approval of the sub-advisory agreement (the “Sub-Advisory Agreement”) between the Manager and BlackRock Investment Management, LLC (the “Sub-Advisor”), with respect to each Master Portfolio. BlackRock Large Cap Core Retirement Portfolio, BlackRock Large Cap Growth Retirement Portfolio and BlackRock Large Cap Value Retirement Portfolio (each a “Feeder Fund,” and together, the “Feeder Funds”), each a series of BlackRock Large Cap Series Funds, Inc. (the “Corporation”), currently invests all of their investable assets in Master Large Cap Core Portfolio, Master Large Cap Growth Portfolio and Master Large Cap Value Portfolio, respectively. Accordingly, the Board of Directors of the Corporation also considered the approval of the Advisory Agreement and the Sub-Advisory Agreement. The Manager and the Sub-Advisor are referred to herein as “BlackRock.” The Advisory Agreement and the Sub-Advisory Agreement are referred to herein as the “Agreements.” For simplicity, the Board of Directors of the Master LLC and the Board of Directors of the Corporation are referred to herein collectively as the “Board,” and the members are referred to as “Board Members.”
Activities and Composition of the Board
The Board consists of thirteen individuals, eleven of whom are not “interested persons” of the Master LLC or the Corporation as defined in the Investment Company Act of 1940, as amended (the “1940 Act”) (the “Independent Board Members”). The Board Members are responsible for the oversight of the operations of each Master Portfolio or Feeder Fund, as pertinent, and perform the various duties imposed on the directors of investment companies by the 1940 Act. The Independent Board Members have retained independent legal counsel to assist them in connection with their duties. The Co-Chairs of the Board are each Independent Board Members. The Board has established five standing committees: an Audit Committee, a Governance and Nominating Committee, a Compliance Committee, a Performance Oversight and Contract Committee and an Executive Committee, each of which is composed of Independent Board Members (except for the Executive Committee, which also has one interested Board Member) and is chaired by Independent Board Members. The Board also has one ad hoc committee, the Joint Product Pricing Committee, which consists of Independent Board Members and directors/trustees of the boards of certain other BlackRock-managed funds, who are not “interested persons” of their respective funds.
The Agreements
Pursuant to the 1940 Act, the Board is required to consider the continuation of the Agreements on an annual basis. In connection with this process, the Board assessed, among other things, the nature, scope and quality of the services provided to the Feeder Funds and the Master Portfolios by the personnel of BlackRock and its affiliates, including investment management, administrative and shareholder services, oversight of fund accounting and custody, marketing services and assistance in meeting applicable legal and regulatory requirements.
From time to time throughout the year, the Board, acting directly and through its committees, considers at each of its meetings factors that are relevant to its annual consideration of the renewal of the Agreements, including the services and support provided by BlackRock to each Master Portfolio, each Feeder Fund and their shareholders. Among the matters the Board considered were: (a) investment performance for one-, three- and five-year periods, as applicable, against peer funds, and applicable benchmarks, if any, as well as senior management’s and portfolio managers’ analysis of the reasons for any over performance or underperformance against its peers and/or benchmark, as applicable; (b) fees, including advisory, administration, if applicable, and other amounts paid to BlackRock and its affiliates by each Master Portfolio and/or Feeder Fund for services, such as transfer agency, marketing and distribution, call center and fund accounting; (c) Master Portfolio and/or Feeder Fund operating expenses; (d) the resources devoted to and compliance reports relating to each Master Portfolio’s and each Feeder Fund’s investment objective, policies and restrictions; (e) each Master Portfolio’s and each Feeder Fund’s compliance with its respective Code of Ethics and compliance policies and procedures; (f) the nature, cost and character of non-investment management services provided by BlackRock and its affiliates; (g) BlackRock’s and other service providers’ internal controls; (h) BlackRock’s implementation of the proxy voting policies approved by the Board; (i) the use of brokerage commissions and execution quality of portfolio transactions; (j) BlackRock’s implementation of each Master Portfolio’s and/or Feeder Fund’s valuation and liquidity procedures; (k) an analysis of contractual and actual management fees for products with similar investment objectives across the open-end fund, closed-end fund and institutional account product channels, as applicable; and (l) periodic updates on BlackRock’s business.
Board Considerations in Approving the Agreements
The Approval Process: Prior to the April 20, 2010 meeting, the Board requested and received materials specifically relating to the Agreements. The Board is engaged in a process with BlackRock to periodically review the nature and scope of the information provided to better assist its deliberations. The materials provided in connection with the April meeting included: (a) information independently compiled and prepared by Lipper, Inc. (“Lipper”) on fees and expenses of each Master Portfolio and Feeder Fund, as applicable, and the investment performance of each Feeder Fund as compared with a peer group of funds as determined by Lipper (collectively, “Peers”); (b) information on the profitability of the Agreements to BlackRock and a discussion of fall-out benefits to BlackRock and its affiliates and significant shareholders; (c) a general analysis provided by BlackRock concerning investment advisory fees charged to other clients, such as institutional clients and closed-end funds, under similar investment mandates, as well as the performance of such other clients, as applicable; (d) the impact of economies of scale; (e) a summary of aggregate amounts paid by each Master Portfolio and/or Feeder Fund to BlackRock; (f) sales and redemption data regarding each Feeder Fund’s shares; and (g) if applicable, a comparison of management fees to similar BlackRock open-end funds, as classified by Lipper.
| | |
|
|
|
38 | BLACKROCK LARGE CAP SERIES FUNDS, INC. | SEPTEMBER 30, 2010 |
|
|
|
Disclosure of Investment Advisory Agreement and Sub-Advisory Agreement (continued) |
At an in-person meeting held on April 20, 2010, the Board reviewed materials relating to its consideration of the Agreements. As a result of the discussions that occurred during the April 20, 2010 meeting, the Board presented BlackRock with questions and requests for additional information and BlackRock responded to these requests with additional written information in advance of the May 18 – 19, 2010 Board meeting.
At an in-person meeting held on May 18 – 19, 2010, the Board of the Master LLC, including the Independent Board Members, unanimously approved the continuation of the Advisory Agreement between the Manager and the Master LLC on behalf of each Master Portfolio and the Sub-Advisory Agreement between the Manager and the Sub-Advisor with respect to each Master Portfolio, each for a one-year term ending June 30, 2011. The Board of the Corporation, including the Independent Board Members, also considered the continuation of the Agreements and found the Agreements to be satisfactory. In approving the continuation of the Agreements, the Board considered: (a) the nature, extent and quality of the services provided by BlackRock; (b) the investment performance of each Master Portfolio, each Feeder Fund and BlackRock; (c) the advisory fee and the cost of the services and profits to be realized by BlackRock and its affiliates from their relationship with each Master Portfolio and Feeder Fund; (d) economies of scale; and (e) other factors deemed relevant by the Board Members.
The Board also considered other matters it deemed important to the approval process, such as payments made to BlackRock or its affiliates relating to the distribution of Feeder Fund shares, services related to the valuation and pricing of portfolio holdings of each Master Portfolio, direct and indirect benefits to BlackRock and its affiliates and significant shareholders from their relationship with the Master Portfolios and the Feeder Funds and advice from independent legal counsel with respect to the review process and materials submitted for the Board’s review. The Board noted the willingness of BlackRock personnel to engage in open, candid discussions with the Board. The Board did not identify any particular information as controlling, and each Board Member may have attributed different weights to the various items considered.
A. Nature, Extent and Quality of the Services Provided by BlackRock: The Board, including the Independent Board Members, reviewed the nature, extent and quality of services provided by BlackRock, including the investment advisory services and the resulting performance of each Feeder Fund. Throughout the year, the Board compared each Feeder Fund’s performance to the performance of a comparable group of mutual funds, and the performance of a relevant benchmark, if any. The Board met with BlackRock’s senior management personnel responsible for investment operations, including the senior investment officers. The Board also reviewed the materials provided by each Master Portfolio’s portfolio management team discussing Master Portfolio performance and each Master Portfolio’s investment objective, strategies and outlook.
The Board considered, among other factors, the number, education and experience of BlackRock’s investment personnel generally and each Master Portfolio’s portfolio management team, investments by portfolio managers in the funds they manage, BlackRock’s portfolio trading capabilities, BlackRock’s use of technology, BlackRock’s commitment to compliance, BlackRock’s credit analysis capabilities, BlackRock’s risk analysis capabilities and BlackRock’s approach to training and retaining portfolio managers and other research, advisory and management personnel. The Board also reviewed a general description of BlackRock’s compensation structure with respect to each Master Portfolio’s portfolio management team and BlackRock’s ability to attract and retain high-quality talent.
In addition to advisory services, the Board considered the quality of the administrative and non-investment advisory services provided to each Master Portfolio and Feeder Fund. BlackRock and its affiliates and significant shareholders provide each Master Portfolio and Feeder Fund with certain administrative, transfer agency, shareholder and other services (in addition to any such services provided to each Master Portfolio and Feeder Fund by third parties) and officers and other personnel as are necessary for the operations of the Master Portfolio and Feeder Fund. In addition to investment advisory services, BlackRock and its affiliates provide each Master Portfolio and Feeder Fund with other services, including: (i) preparing disclosure documents, such as the prospectus, the statement of additional information and periodic shareholder reports; (ii) assisting with daily accounting and pricing; (iii) overseeing and coordinating the activities of other service providers; (iv) organizing Board meetings and preparing the materials for such Board meetings; (v) providing legal and compliance support; and (vi) performing other administrative functions necessary for the operation of the Master Portfolio and the Feeder Fund, such as tax reporting, fulfilling regulatory filing requirements, and call center services. The Board reviewed the structure and duties of BlackRock’s fund administration, accounting, legal and compliance departments and considered BlackRock’s policies and procedures for assuring compliance with applicable laws and regulations.
B. The Investment Performance of each Master Portfolio, each Feeder Fund and BlackRock: The Board, including the Independent Board Members, also reviewed and considered the performance history of each Master Portfolio and Feeder Fund, as applicable. The Board noted that each Master Portfolio’s investment results correspond directly to the investment results of the applicable Feeder Fund. In preparation for the April 20, 2010 meeting, the Board was provided with reports, independently prepared by Lipper, which included a comprehensive analysis of each Feeder Fund’s performance. The Board also reviewed a narrative and statistical analysis of the Lipper data that was prepared by BlackRock, which analyzed various factors that affect Lipper’s rankings. In connection with its review, the Board received and reviewed information regarding the investment performance of each Feeder Fund as compared to a representative group of similar funds as determined by Lipper and to all funds in such Feeder Fund’s applicable Lipper category. The Board was provided with a description of the methodology used by Lipper to select peer funds. The Board regularly reviews the performance of each Master Portfolio and Feeder Fund, as applicable, throughout the year. The Board attaches more importance to performance over relatively long periods of time, typically three to five years.
The Board noted that BlackRock Large Cap Core Retirement Portfolio performed below the median of its Lipper Performance Universe for both the one-year and since-inception periods reported. The Board and BlackRock reviewed the reasons for the Feeder Fund’s underperformance during these periods compared with its Peers. The Board was informed that, among other things, the Master Large Cap Core Portfolio’s fundamental orientation, preference for growth visibility and valuation discipline kept it out of many of the
| | | |
|
|
|
|
| BLACKROCK LARGE CAP SERIES FUNDS, INC. | SEPTEMBER 30, 2010 | 39 |
|
|
|
Disclosure of Investment Advisory Agreement and Sub-Advisory Agreement (continued) |
high beta cyclical stocks that outperformed during 2009. Since inception, stock selection in industrials (machinery & defense), information technology and energy (oil, gas & consumable fuels) and an overweight to health care (health care equipment & services) impacted performance.
The Board and BlackRock discussed BlackRock’s strategy for improving BlackRock Large Cap Core Retirement Portfolio’s performance and BlackRock’s commitment to providing the resources necessary to assist the Master Large Cap Core Portfolio’s portfolio managers and to improve the Feeder Fund’s performance.
The Board noted that, in general, BlackRock Large Cap Growth Retirement Portfolio performed better than its Peers in that the Feeder Fund’s performance was at or above the median of its Lipper Performance Universe in either the one-year or since-inception periods reported.
The Board noted that BlackRock Large Cap Value Retirement Portfolio performed below the median of its Lipper Performance Universe for both the one-year and since-inception periods reported. The Board and BlackRock reviewed the reasons for the Feeder Fund’s underperformance during these periods compared with its Peers. The Board was informed that, among other things, the Master Large Cap Value Portfolio’s fundamental orientation, preference for growth visibility and valuation discipline kept it out of many of the high beta cyclical stocks that outperformed during 2009. In the since-inception period, security selection in industrials and an underweight and security selection in materials were the primary detractors from performance.
The Board and BlackRock discussed BlackRock’s strategy for improving BlackRock Large Cap Value Retirement Portfolio’s performance and BlackRock’s commitment to providing the resources necessary to assist the Master Large Cap Value Portfolio’s portfolio managers and to improve the Feeder Fund’s performance.
C. Consideration of the Advisory Fees and the Cost of the Services and Profits to be Realized by BlackRock and its Affiliates from their Relationship with each Master Portfolio and Feeder Fund: The Board, including the Independent Board Members, reviewed each Master Portfolio’s contractual advisory fee rate compared with the other funds in the corresponding Feeder Fund’s Lipper category. It also compared each Feeder Fund’s total expenses, as well as actual management fees, to those of other funds in its Lipper category. The Board considered the services provided and the fees charged by BlackRock to other types of clients with similar investment mandates, including separately managed institutional accounts.
The Board received and reviewed statements relating to BlackRock’s financial condition and profitability with respect to the services it provided each Master Portfolio and Feeder Fund. The Board was also provided with a profitability analysis that detailed the revenues earned and the expenses incurred by BlackRock for services provided to each Master Portfolio and Feeder Fund. The Board reviewed BlackRock’s profitability with respect to each Master Portfolio and Feeder Fund, as applicable, and other funds the Board currently oversees for the year ended December 31, 2009 compared to available aggregate profitability data provided for the year ended December 31, 2008. The Board reviewed BlackRock’s profitability with respect to other fund complexes managed by the Manager and/or its affiliates. The Board reviewed BlackRock’s assumptions and methodology of allocating expenses in the profitability analysis, noting the inherent limitations in allocating costs among various advisory products. The Board recognized that profitability may be affected by numerous factors including, among other things, fee waivers and expense reimbursements by the Manager, the types of funds managed, expense allocations and business mix, and the difficulty of comparing profitability as a result of those factors.
The Board noted that, in general, individual fund or product line profitability of other advisors is not publicly available. Nevertheless, to the extent such information was available, the Board considered BlackRock’s operating margin, in general, compared to the operating margin for leading investment management firms whose operations include advising open-end funds, among other product types. That data indicates that operating margins for BlackRock with respect to its registered funds are generally consistent with margins earned by similarly situated publicly traded competitors. In addition, the Board considered, among other things, certain third party data comparing BlackRock’s operating margin with that of other publicly traded asset management firms. That third party data indicates that larger asset bases do not, in themselves, translate to higher profit margins.
In addition, the Board considered the cost of the services provided to each Master Portfolio and Feeder Fund by BlackRock, and BlackRock’s and its affiliates’ profits relating to the management and distribution of each Master Portfolio and Feeder Fund and the other funds advised by BlackRock and its affiliates. As part of its analysis, the Board reviewed BlackRock’s methodology in allocating its costs to the management of each Master Portfolio and Feeder Fund. The Board also considered whether BlackRock has the financial resources necessary to attract and retain high-quality investment management personnel to perform its obligations under the Agreements and to continue to provide the high quality of services that is expected by the Board.
The Board noted that each Master Portfolio’s contractual advisory fee rate was lower than or equal to the median contractual advisory fee rate paid by the Peers of the applicable Feeder Fund, in each case before taking into account any expense reimbursements or fee waivers. The Board also noted that each Master Portfolio has an advisory fee arrangement that includes breakpoints that adjust the fee rate downward as the size of the Master Portfolio increases above certain contractually specified levels. The Board further noted that BlackRock has contractually agreed to waive fees and/or reimburse expenses in order to limit, to a specified amount, each Feeder Fund’s total operating expenses as a percentage of the Feeder Fund’s average daily net assets on a class-by-class basis, as applicable.
D. Economies of Scale: The Board, including the Independent Board Members, considered the extent to which economies of scale might be realized as the assets of each Master Portfolio and Feeder Fund increase. The Board also considered the extent to which each Master Portfolio and Feeder Fund benefit from such economies and whether there should be changes in the advisory fee rate or structure in order to enable each Master Portfolio and Feeder Fund to participate in these economies of scale, for example through the use of revised breakpoints in the advisory fee based upon the asset level of each Master Portfolio.
| | |
|
|
|
40 | BLACKROCK LARGE CAP SERIES FUNDS, INC. | SEPTEMBER 30, 2010 |
|
|
|
Disclosure of Investment Advisory Agreement and Sub-Advisory Agreement (concluded) |
E. Other Factors Deemed Relevant by the Board Members: The Board, including the Independent Board Members, also took into account other ancillary or “fall-out” benefits that BlackRock or its affiliates and significant shareholders may derive from their respective relationships with each Master Portfolio and Feeder Fund, both tangible and intangible, such as BlackRock’s ability to leverage its investment professionals who manage other portfolios, an increase in BlackRock’s profile in the investment advisory community, and the engagement of BlackRock’s affiliates and significant shareholders as service providers to each Master Portfolio and Feeder Fund, including for administrative, transfer agency and distribution services. The Board also considered BlackRock’s overall operations and its efforts to expand the scale of, and improve the quality of, its operations. The Board also noted that BlackRock may use and benefit from third party research obtained by soft dollars generated by certain mutual fund transactions to assist in managing all or a number of its other client accounts. The Board further noted that BlackRock completed the acquisition of a complex of exchange-traded funds (“ETFs”) on December 1, 2009, and that BlackRock’s funds may invest in such ETFs without any offset against the management fees payable by the funds to BlackRock.
In connection with its consideration of the Agreements, the Board also received information regarding BlackRock’s brokerage and soft dollar practices. The Board received reports from BlackRock which included information on brokerage commissions and trade execution practices throughout the year.
The Board noted the competitive nature of the open-end fund marketplace, and that shareholders are able to redeem their Feeder Fund shares if they believe that the applicable Feeder Fund’s and/or Master Portfolio’s fees and expenses are too high or if they are dissatisfied with the performance of such Feeder Fund.
Conclusion
The Board of the Master LLC, including the Independent Board Members, unanimously approved the continuation of the Advisory Agreement between the Manager and the Master LLC on behalf of each Master Portfolio for a one-year term ending June 30, 2011 and the Sub-Advisory Agreement between the Manager and the Sub-Advisor, with respect to each Master Portfolio, for a one-year term ending June 30, 2011. As part of its approval, the Board of the Master LLC considered the discussions of BlackRock’s fee structure, as it applies to each Master Portfolio, being conducted by the ad hoc Joint Product Pricing Committee. Based upon its evaluation of all of the aforementioned factors in their totality, the Board of the Master LLC, including the Independent Board Members, was satisfied that the terms of the Agreements were fair and reasonable and in the best interest of each Master Portfolio and its shareholders. The Board of the Corporation, including the Independent Board Members, also considered the continuation of the Agreements with respect to each Master Portfolio and found the Agreements to be satisfactory. In arriving at a decision to approve the Agreements, the Board of the Master LLC did not identify any single factor or group of factors as all-important or controlling, but considered all factors together, and different Board Members may have attributed different weights to the various factors considered. The Independent Board Members were also assisted by the advice of independent legal counsel in making this determination. The contractual fee arrangements for each Master Portfolio reflect the results of several years of review by the Board Members and predecessor Board Members, and discussions between such Board Members (and predecessor Board Members) and BlackRock. Certain aspects of the arrangements may be the subject of more attention in some years than in others, and the Board Members’ conclusions may be based in part on their consideration of these arrangements in prior years.
| | | |
|
|
|
|
| BLACKROCK LARGE CAP SERIES FUNDS, INC. | SEPTEMBER 30, 2010 | 41 |
| | | | | | | | | | |
Name, Address
and Year of Birth | | Position(s)
Held with
Corporation/
Master LLC | | Length
of Time
Served as
a Director2 | | Principal Occupation(s) During Past Five Years | | Number of BlackRock-
Advised Registered
Investment Companies
(“RICs”) Consisting of
Investment Portfolios
(“Portfolios”) Overseen | | Public
Directorships |
|
|
|
|
|
|
|
|
|
|
|
Non-Interested Directors1 | | | |
|
|
|
|
|
|
|
|
|
|
|
Ronald W. Forbes
55 East 52nd Street
New York, NY 10055
1940 | | Co-Chair of the Board and Director | | Since
2007 | | Professor Emeritus of Finance, School of Business, State University of New York at Albany since 2000. | | 36 RICs consisting of
95 Portfolios | | None |
|
|
|
|
|
|
|
|
|
|
|
Rodney D. Johnson
55 East 52nd Street
New York, NY 10055
1941 | | Co-Chair of the Board and Director | | Since
2007 | | President, Fairmount Capital Advisors, Inc. since 1987; Director, Fox Chase Cancer Center since 2004; Member of the Archdiocesan Investment Committee of the Archdiocese of Philadelphia since 2004; Director, The Committee of Seventy (civic) since 2006. | | 36 RICs consisting of
95 Portfolios | | None |
|
|
|
|
|
|
|
|
|
|
|
David O. Beim
55 East 52nd Street
New York, NY 10055
1940 | | Director | | Since
2007 | | Professor of Finance and Economics at the Columbia University Graduate School of Business since 1991; Trustee, Phillips Exeter Academy since 2002; Chairman, Wave Hill, Inc. (public garden and cultural center) from 1990 to 2006. | | 36 RICs consisting of
95 Portfolios | | None |
|
|
|
|
|
|
|
|
|
|
|
Dr. Matina S. Horner
55 East 52nd Street
New York, NY 10055
1939 | | Director | | Since
2007 | | Executive Vice President of Teachers Insurance and Annuity Association and College Retirement Equities Fund from 1989 to 2003. | | 36 RICs consisting of
95 Portfolios | | NSTAR (electric and gas utility) |
|
|
|
|
|
|
|
|
|
|
|
Herbert I. London
55 East 52nd Street
New York, NY 10055
1939 | | Director and Member of the Audit Committee | | Since
1999 | | Professor Emeritus, New York University since 2005; John M. Olin Professor of Humanities, New York University from 1993 to 2005 and Professor thereof from 1980 to 2005; President, Hudson Institute (policy research organization) since 1997 and Trustee thereof since 1980; Chairman of the Board of Trustees for Grantham University since 2006; Director, InnoCentive, Inc. (strategic solutions company) since 2005; Director, Cerego, LLC (software development and design) since 2005. | | 36 RICs consisting of
95 Portfolios | | AIMS Worldwide, Inc. (marketing) |
|
|
|
|
|
|
|
|
|
|
|
Cynthia A. Montgomery
55 East 52nd Street
New York, NY 10055
1952 | | Director | | Since
2007 | | Professor, Harvard Business School since 1989; Director, Harvard Business School Publishing since 2005; Director, McLean Hospital since 2005. | | 36 RICs consisting of
95 Portfolios | | Newell Rubbermaid, Inc. (manufacturing) |
|
|
|
|
|
|
|
|
|
|
|
Joseph P. Platt, Jr.
55 East 52nd Street
New York, NY 10055
1947 | | Director | | Since
2007 | | Director, The West Penn Allegheny Health System (a not-for-profit health system) since 2008; Director, Jones and Brown (Canadian insurance broker) since 1998; General Partner, Thorn Partners, LP (private investment) since 1998; Partner, Amarna Corporation, LLC (private investment company) from 2002 to 2008. | | 36 RICs consisting of
95 Portfolios | | Greenlight Capital Re, Ltd (reinsurance company); WQED Multi-Media (public broadcasting not-for-profit) |
|
|
|
|
|
|
|
|
|
|
|
Robert C. Robb, Jr.
55 East 52nd Street
New York, NY 10055
1945 | | Director | | Since
2007 | | Partner, Lewis, Eckert, Robb and Company (management and financial consulting firm) since 1981. | | 36 RICs consisting of
95 Portfolios | | None |
|
|
|
|
|
|
|
|
|
|
|
| | |
|
|
|
42 | BLACKROCK LARGE CAP SERIES FUNDS, INC. | SEPTEMBER 30, 2010 |
|
|
|
Officers and Directors (continued) |
| | | | | | | | | | |
Name, Address
and Year of Birth | | Position(s)
Held with
Corporation/
Master LLC | | Length
of Time
Served as
a Director2 | | Principal Occupation(s) During Past Five Years | | Number of BlackRock-
Advised Registered
Investment Companies
(“RICs”) Consisting of
Investment Portfolios
(“Portfolios”) Overseen | | Public
Directorships |
|
|
|
|
|
|
|
|
|
|
|
Non-Interested Directors1 (concluded) | | | | |
|
|
|
|
|
Toby Rosenblatt
55 East 52nd Street
New York, NY 10055
1938 | | Director | | Since
2007 | | President, Founders Investments Ltd. (private investments) since 1999; Director, College Access Foundation of California (philanthropic foundation) since 2009; Director, Forward Management, LLC since 2007; Director, The James Irvine Foundation (philanthropic foundation) from 1998 to 2008. | | 36 RICs consisting of
95 Portfolios | | A. P. Pharma, Inc. (specialty pharmaceuticals) |
|
|
|
|
|
|
|
|
|
|
|
Kenneth L. Urish
55 East 52nd Street
New York, NY 10055
1951 | | Chair of the Audit Committee and Director | | Since
2007 | | Managing Partner, Urish Popeck & Co., LLC (certified public accountants and consultants) since 1976; Member of External Advisory Board, The Pennsylvania State University Accounting Department since 2001; Trustee, The Holy Family Foundation since 2001; Committee Member, Professional Ethics Committee of the Pennsylvania Institute of Certified Public Accountants from 2007 to 2010; President and Trustee, Pittsburgh Catholic Publishing Associates from 2003 to 2008; Director, Inter-Tel from 2006 to 2007. | | 36 RICs consisting of
95 Portfolios | | None |
|
|
|
|
|
|
|
|
|
|
|
Frederick W. Winter
55 East 52nd Street
New York, NY 10055
1945 | | Director and Member of the Audit Committee | | Since
2007 | | Professor and Dean Emeritus of the Joseph M. Katz School of Business, University of Pittsburgh since 2005 and Dean thereof from 1997 to 2005; Director, Alkon Corporation (pneumatics) since 1992; Director, Tippman Sports (recreation) since 2005; Director, Indotronix International (IT services) from 2004 to 2008. | | 36 RICs consisting of
95 Portfolios | | None |
| | |
|
|
|
| 1 | Directors serve until their resignation, removal or death, or until December 31 of the year in which they turn 72. The Board has approved one-year extensions in terms of Directors who turn 72 prior to December 31, 2013. |
| | |
| 2 | Date shown is the earliest date a person has served as a director of the Corporation/Master LLC covered by this annual report. Following the combination of Merrill Lynch Investment Managers, L.P. (“MLIM”) and BlackRock, Inc. (“BlackRock”) in September 2006, the various legacy MLIM and legacy BlackRock fund boards were realigned and consolidated into three new fund boards in 2007. As a result, although the chart shows directors as joining the Corporation’s/Master LLC’s board in 2007, each director first became a member of the board of other legacy MLIM or legacy BlackRock Funds as follows: David O. Beim, 1998; Ronald W. Forbes, 1977; Dr. Matina S. Horner, 2004; Rodney D. Johnson, 1995; Herbert I. London, 1987; Cynthia A. Montgomery, 1994; Joseph P. Platt, Jr., 1999; Robert C. Robb, Jr., 1999; Toby Rosenblatt, 2005; Kenneth L. Urish, 1999; and Frederick W. Winter, 1999. |
| | | | | | | | | | |
|
|
|
|
|
|
|
|
|
|
|
Interested Directors3 | | |
|
|
|
|
|
|
|
|
|
|
|
Richard S. Davis
55 East 52nd Street
New York, NY 10055
1945 | | Director | | Since
2007 | | Managing Director, BlackRock, Inc. since 2005; Chief Executive Officer, State Street Research & Management Company from 2000 to 2005; Chairman of the Board of Trustees, State Street Research Mutual Funds from 2000 to 2005. | | 169 RICs consisting of
290 Portfolios | | None |
|
|
|
|
|
|
|
|
|
|
|
Henry Gabbay
55 East 52nd Street
New York, NY 10055
1947 | | Director | | Since
2007 | | Consultant, BlackRock, Inc. from 2007 to 2008; Managing Director, BlackRock, Inc. from 1989 to 2007; Chief Administrative Officer, BlackRock Advisors, LLC from 1998 to 2007; President of BlackRock Funds and BlackRock Bond Allocation Target Shares from 2005 to 2007 and Treasurer of certain closed-end Funds in the BlackRock fund complex from 1989 to 2006. | | 169 RICs consisting of
290 Portfolios | | None |
| | |
|
|
|
| 3 | Mr. Davis is an “interested person” as defined in the 1940 Act, of the Corporation/Master LLC based on his positions with BlackRock, Inc. and its affiliates. Mr. Gabbay is an “interested person” of the Corporation/Master LLC based on his former positions with BlackRock, Inc. and its affiliates as well as his ownership of BlackRock, Inc. and PNC Financial Services Group, Inc. securities. Directors serve until their resignation, removal or death, or until December 31 of the year in which they turn 72. The Board has approved one-year extensions in terms of Directors who turn 72 prior to December 31, 2013. |
| | | |
|
|
|
|
| BLACKROCK LARGE CAP SERIES FUNDS, INC. | SEPTEMBER 30, 2010 | 43 |
|
|
|
Officers and Directors (concluded) |
| | | | | | |
Name, Address
and Year of Birth | | Position(s)
Held with
Corporation/
Master LLC | | Length
of Time
Served | | Principal Occupation(s) During Past Five Years |
|
|
|
|
|
|
|
Officers* | | | | | | |
|
|
|
|
|
|
|
John M. Perlowski
55 East 52nd Street
New York, NY 10055
1964 | | President and Chief Executive Officer | | Since
2010 | | Managing Director of BlackRock, Inc. since 2009; Global Head of BlackRock Fund Administration since 2009; Managing Director and Chief Operating Officer of the Global Product Group at Goldman Sachs Asset Management, L.P. from 2003 to 2009; Treasurer of Goldman Sachs Mutual Funds from 2003 to 2009 and Senior Vice President thereof from 2007 to 2009; Director of Goldman Sachs Offshore Funds from 2002 to 2009. |
|
|
|
|
|
|
|
Jeffrey Holland, CFA
55 East 52nd Street
New York, NY 10055
1971 | | Vice President | | Since
2009 | | Managing Director of BlackRock, Inc. since 2010; Director of BlackRock, Inc. from 2006 to 2009; Chief Operating Officer of BlackRock’s US Retail Group since 2009; Co-head of Product Development and Management for BlackRock’s US Retail Group from 2007 to 2009; Product Manager of Raymond James & Associates from 2003 to 2006. |
|
|
|
|
|
|
|
Brendan Kyne
55 East 52nd Street
New York, NY 10055
1977 | | Vice President | | Since
2009 | | Managing Director of BlackRock, Inc. since 2010; Director of BlackRock, Inc. from 2008 to 2009; Head of Product Development and Management for BlackRock’s US Retail Group since 2009, Co-head thereof from 2007 to 2009; Vice President of BlackRock, Inc. from 2005 to 2008. |
|
|
|
|
|
|
|
Brian Schmidt
55 East 52nd Street
New York, NY 10055
1958 | | Vice President | | Since
2009 | | Managing Director of BlackRock, Inc. since 2004; Various positions with U.S. Trust Company from 1991 to 2003 including Director from 2001 to 2003 and Senior Vice President from 1998 to 2003; Vice President, Chief Financial Officer and Treasurer of Excelsior Funds, Inc., Excelsior Tax-Exempt Funds, Inc. and Excelsior Funds Trust from 2001 to 2003. |
|
|
|
|
|
|
|
Neal Andrews
55 East 52nd Street
New York, NY 10055
1966 | | Chief Financial Officer | | Since
2007 | | Managing Director of BlackRock, Inc. since 2006; Senior Vice President and Line of Business Head of Fund Accounting and Administration at PNC Global Investment Servicing (US) Inc. from 1992 to 2006. |
|
|
|
|
|
|
|
Jay Fife
55 East 52nd Street
New York, NY 10055
1970 | | Treasurer | | Since
2007 | | Managing Director of BlackRock, Inc. since 2007 and Director in 2006; Assistant Treasurer of the Merrill Lynch Investment Managers, L.P. (“MLIM”) and Fund Asset Management, L.P. advised funds from 2005 to 2006; Director of MLIM Fund Services Group from 2001 to 2006. |
|
|
|
|
|
|
|
Brian Kindelan
55 East 52nd Street
New York, NY 10055
1959 | | Chief Compliance Officer | | Since
2007 | | Chief Compliance Officer of the BlackRock-advised funds since 2007; Managing Director and Senior Counsel of BlackRock, Inc. since 2005. |
|
|
|
|
|
|
|
Howard Surloff
55 East 52nd Street
New York, NY 10055
1965 | | Secretary | | Since
2007 | | Managing Director and General Counsel of U.S. Funds at BlackRock, Inc. since 2006; General Counsel (US) of Goldman Sachs Asset Management, L.P. from 1993 to 2006. |
| | |
|
|
| * | Officers of the Corporation/Master LLC serve at the pleasure of the Board. |
|
|
| Further information about the Corporation’s Officers and Directors is available in the Corporation’s Statement of Additional Information, which can be obtained without charge by calling (800) 441-7762. |
|
|
Investment Advisor
BlackRock Advisors, LLC
Wilmington, DE 19809
Custodian
Brown Brothers Harriman & Co.
Boston, MA 02109
Transfer Agent
BNY Mellon Investment
Servicing (US) Inc.
Wilmington, DE 19809
Accounting Agent
State Street Bank and
Trust Company
Princeton, NJ 08540
Sub-Advisor
BlackRock Investment
Management, LLC
Plainsboro, NJ 08536
Distributor
BlackRock Investments, LLC
New York, NY 10022
Legal Counsel
Sidley Austin LLP
New York, NY 10019
Independent Registered Public Accounting Firm
Deloitte & Touche LLP
Princeton, NJ 08540
Address of the Funds
100 Bellevue Parkway
Wilmington, DE 19809
|
Effective September 24, 2010, John M. Perlowski became President and Chief Executive Officer of the Corporation/Master LLC. |
| | |
|
|
|
44 | BLACKROCK LARGE CAP SERIES FUNDS, INC. | SEPTEMBER 30, 2010 |
|
|
|
Additional Information |
|
|
General Information |
|
Electronic Delivery
Electronic copies of most financial reports and prospectuses are available on the Funds’ website or shareholders can sign up for e-mail notifications of quarterly statements, annual and semi-annual reports and prospectuses by enrolling in the Funds’ electronic delivery program.
To enroll:
Shareholders Who Hold Accounts with Investment Advisors, Banks or Brokerages:
Please contact your financial advisor. Please note that not all investment advisors, banks or brokerages may offer this service.
Shareholders Who Hold Accounts Directly with BlackRock:
| |
1) | Access the BlackRock website at http://www.blackrock.com/edelivery |
| |
2) | Select “eDelivery” under the “More Information” section |
| |
3) | Log into your account |
Householding
The Funds will mail only one copy of shareholder documents, including prospectuses, annual and semi-annual reports and proxy statements, to shareholders with multiple accounts at the same address. This practice is commonly called “householding” and is intended to reduce expenses and eliminate duplicate mailings of shareholder documents. Mailings of your shareholder documents may be householded indefinitely unless you instruct us otherwise. If you do not want the mailing of these documents to be combined with those for other members of your household, please call (800) 441-7762.
Availability of Quarterly Portfolio Schedule
The Funds/Master LLC file their complete schedule of portfolio holdings with the Securities and Exchange Commission (the “SEC”) for the first and third quarters of each fiscal year on Form N-Q. The Funds’/Master LLC’s Forms N-Q are available on the SEC’s website at http://www.sec.gov and may also be reviewed and copied at the SEC’s Public Reference Room in Washington, D.C. Information on the operation of the Public Reference Room may be obtained by calling (800) SEC-0330. The Funds’/Master LLC’s Forms N-Q may also be obtained upon request and without charge by calling (800) 441-7762.
Availability of Proxy Voting Policies and Procedures
A description of the policies and procedures that the Funds/Master LLC use to determine how to vote proxies relating to portfolio securities is available (1) without charge, upon request, by calling (800) 441-7762; (2) at http://www.blackrock.com; and (3) on the SEC’s website at http://www.sec.gov.
Availability of Proxy Voting Record
Information about how the Funds/Master LLC voted proxies relating to securities held in the Funds’/Master LLC’s portfolios, during the most recent 12-month period ended June 30 is available upon request and without charge (1) at http:// www.blackrock.com or by calling (800) 441-7762 and (2) on the SEC’s website at http://www.sec.gov.
| | | |
|
|
|
|
| BLACKROCK LARGE CAP SERIES FUNDS, INC. | SEPTEMBER 30, 2010 | 45 |
|
|
|
Additional Information (concluded) |
|
|
Shareholder Privileges |
|
Account Information
Call us at (800) 441-7762 from 8:00 AM to 6:00 PM EST on any business day to get information about your account balances, recent transactions and share prices. You can also reach us on the Web at http://www.blackrock.com/funds.
Automatic Investment Plans
Investor Class shareholders who want to invest regularly can arrange to have $50 or more automatically deducted from their checking or savings account and invested in any of the BlackRock funds.
Systematic Withdrawal Plans
Investor Class shareholders can establish a systematic withdrawal plan and receive periodic payments of $50 or more from their BlackRock funds, as long as their account balance is at least $10,000.
Retirement Plans
Shareholders may make investments in conjunction with Traditional, Rollover, Roth, Coverdell, Simple IRAs, SEP IRAs and 403(b) Plans.
|
|
BlackRock Privacy Principles |
|
BlackRock is committed to maintaining the privacy of its current and former fund investors and individual clients (collectively, “Clients”) and to safeguarding their non-public personal information. The following information is provided to help you understand what personal information BlackRock collects, how we protect that information and why in certain cases we share such information with select parties.
If you are located in a jurisdiction where specific laws, rules or regulations require BlackRock to provide you with additional or different privacy-related rights beyond what is set forth below, then BlackRock will comply with those specific laws, rules or regulations.
BlackRock obtains or verifies personal non-public information from and about you from different sources, including the following: (i) information we receive from you or, if applicable, your financial intermediary, on applications, forms or other documents; (ii) information about your transactions with us, our affiliates, or others; (iii) information we receive from a consumer reporting agency; and (iv) from visits to our websites.
BlackRock does not sell or disclose to non-affiliated third parties any non-public personal information about its Clients, except as permitted by law or as is necessary to respond to regulatory requests or to service Client accounts. These non-affiliated third parties are required to protect the confidentiality and security of this information and to use it only for its intended purpose.
We may share information with our affiliates to service your account or to provide you with information about other BlackRock products or services that may be of interest to you. In addition, BlackRock restricts access to non-public personal information about its Clients to those BlackRock employees with a legitimate business need for the information. BlackRock maintains physical, electronic and procedural safeguards that are designed to protect the non-public personal information of its Clients, including procedures relating to the proper storage and disposal of such information.
| | |
|
|
|
46 | BLACKROCK LARGE CAP SERIES FUNDS, INC. | SEPTEMBER 30, 2010 |
|
|
|
A World-Class Mutual Fund Family |
BlackRock offers a diverse lineup of open-end mutual funds crossing all investment styles and managed by experts in equity, fixed income and tax-exempt investing.
| |
|
Equity Funds |
|
BlackRock All-Cap Energy & Resources Portfolio |
BlackRock Asset Allocation Portfolio† |
BlackRock Balanced Capital Fund† |
BlackRock Basic Value Fund |
BlackRock Capital Appreciation Fund |
BlackRock Energy & Resources Portfolio |
BlackRock Equity Dividend Fund |
BlackRock EuroFund |
BlackRock Focus Growth Fund |
BlackRock Focus Value Fund |
BlackRock Global Allocation Fund† |
BlackRock Global Dynamic Equity Fund |
BlackRock Global Emerging Markets Fund |
BlackRock Global Financial Services Fund |
BlackRock Global Growth Fund |
BlackRock Global Opportunities Portfolio |
BlackRock Global SmallCap Fund |
BlackRock Health Sciences Opportunities Portfolio |
BlackRock Healthcare Fund |
BlackRock Index Equity Portfolio* |
BlackRock International Fund |
BlackRock International Index Fund |
BlackRock International Opportunities Portfolio |
BlackRock International Value Fund |
BlackRock Large Cap Core Fund |
BlackRock Large Cap Core Plus Fund |
BlackRock Large Cap Growth Fund |
BlackRock Large Cap Value Fund |
BlackRock Latin America Fund |
BlackRock Mid-Cap Growth Equity Portfolio |
BlackRock Mid-Cap Value Equity Portfolio |
BlackRock Mid Cap Value Opportunities Fund |
BlackRock Natural Resources Trust |
BlackRock Pacific Fund |
BlackRock Science & Technology Opportunities Portfolio |
BlackRock Small Cap Core Equity Portfolio |
BlackRock Small Cap Growth Equity Portfolio |
BlackRock Small Cap Growth Fund II |
BlackRock Small Cap Index Fund |
BlackRock Small/Mid-Cap Growth Portfolio |
BlackRock S&P 500 Index Fund |
BlackRock S&P 500 Stock Fund |
BlackRock U.S. Opportunities Portfolio |
BlackRock Utilities and Telecommunications Fund |
BlackRock Value Opportunities Fund |
BlackRock World Gold Fund |
|
|
Fixed Income Funds |
|
BlackRock Bond Index Fund |
BlackRock Bond Portfolio |
BlackRock Emerging Market Debt Portfolio |
BlackRock Floating Rate Income Portfolio |
BlackRock GNMA Portfolio |
BlackRock Global Dividend Income Portfolio† |
BlackRock Government Income Portfolio |
BlackRock High Income Fund |
BlackRock High Yield Bond Portfolio |
BlackRock Income Portfolio† |
BlackRock Inflation Protected Bond Portfolio |
BlackRock Intermediate Government Bond Portfolio |
BlackRock International Bond Portfolio |
BlackRock Long Duration Bond Portfolio |
BlackRock Low Duration Bond Portfolio |
BlackRock Managed Income Portfolio |
BlackRock Multi-Sector Bond Portfolio |
BlackRock Short-Term Bond Fund |
BlackRock Strategic Income Opportunities Portfolio |
BlackRock Total Return Fund |
BlackRock Total Return Portfolio II |
BlackRock World Income Fund |
|
|
Municipal Bond Funds |
|
BlackRock AMT-Free Municipal Bond Portfolio |
BlackRock California Municipal Bond Fund |
BlackRock High Yield Municipal Fund |
BlackRock Intermediate Municipal Fund |
BlackRock Kentucky Municipal Bond Portfolio |
BlackRock Municipal Insured Fund |
BlackRock National Municipal Fund |
BlackRock New Jersey Municipal Bond Fund |
BlackRock New York Municipal Bond Fund |
BlackRock Ohio Municipal Bond Portfolio |
BlackRock Pennsylvania Municipal Bond Fund |
BlackRock Short-Term Municipal Fund |
|
|
Target Risk & Target Date Funds† |
|
BlackRock Prepared Portfolios |
Conservative Prepared Portfolio |
Moderate Prepared Portfolio |
Growth Prepared Portfolio |
Aggressive Growth Prepared Portfolio |
|
BlackRock Lifecycle Prepared Portfolios |
2015 |
2020 |
2025 |
2030 |
2035 |
2040 |
2045 |
2050 |
|
BlackRock LifePath Portfolios |
Retirement |
2020 |
2025 |
2030 |
2035 |
2040 |
2045 |
2050 |
2055 |
| |
* | See the prospectus for information on specific limitations on investments in the fund. |
|
† | Mixed asset fund. |
BlackRock mutual funds are currently distributed by BlackRock Investments, LLC. You should consider the investment objectives, risks, charges and expenses of the funds under consideration carefully before investing. Each fund’s prospectus contains this and other information and is available at www.blackrock.com or by calling (800) 441-7762 or from your financial advisor. The prospectus should be read carefully before investing.
| | | |
|
|
|
|
| BLACKROCK LARGE CAP SERIES FUNDS, INC. | SEPTEMBER 30, 2010 | 47 |
These reports are not authorized for use as an offer of sale or a solicitation of an offer to buy shares of the Funds unless accompanied or preceded by the Funds’ current prospectus. Past performance results shown in these reports should not be considered a representation of future performance. Investment returns and principal value of shares will fluctuate so that shares, when redeemed, may be worth more or less than their original cost. Statements and other information herein are as dated and are subject to change.
| |

|
| |
#LCSRP-9/10 | 
|
Item 2 – | Code of Ethics – The registrant (or the “Fund”) has adopted a code of ethics, as of the end of the period covered by this report, applicable to the registrant’s principal executive officer, principal financial officer and principal accounting officer, or persons performing similar functions. During the period covered by this report, there have been no amendments to or waivers granted under the code of ethics. A copy of the code of ethics is available without charge at www.blackrock.com. |
| |
Item 3 – | Audit Committee Financial Expert – The registrant’s board of directors or trustees, as applicable (the “board of directors”), has determined that (i) the registrant has the following audit committee financial expert serving on its audit committee and (ii) each audit committee financial expert is independent: |
| Kenneth L. Urish |
| |
| Under applicable securities laws, a person determined to be an audit committee financial expert will not be deemed an “expert” for any purpose, including without limitation for the purposes of Section 11 of the Securities Act of 1933, as a result of being designated or identified as an audit committee financial expert. The designation or identification as an audit committee financial expert does not impose on such person any duties, obligations, or liabilities greater than the duties, obligations, and liabilities imposed on such person as a member of the audit committee and board of directors in the absence of such designation or identification. |
| |
Item 4 – | Principal Accountant Fees and Services |
| (a) Audit Fees | (b) Audit-Related Fees1 | (c) Tax Fees2 | (d) All Other Fees3 |
Entity Name | Current Fiscal Year End | Previous Fiscal Year End | Current Fiscal Year End | Previous Fiscal Year End | Current Fiscal Year End | Previous Fiscal Year End | Current Fiscal Year End | Previous Fiscal Year End |
BlackRock Large Cap Core Fund | $6,800 | $6,800 | $0 | $0 | $6,100 | $6,100 | $625 | $1,028 |
BlackRock Large Cap Growth Fund | $6,800 | $6,800 | $0 | $0 | $6,100 | $6,100 | $128 | $1,028 |
BlackRock Large Cap Value Fund | $6,800 | $6,800 | $0 | $0 | $6,100 | $6,100 | $619 | $1,028 |
BlackRock Large Cap Core Retirement Portfolio | $6,800 | $6,800 | $0 | $0 | $6,100 | $6,100 | $25 | $1,028 |
BlackRock Large Cap Growth Retirement Portfolio | $6,800 | $6,800 | $0 | $0 | $6,100 | $6,100 | $19 | $1,028 |
BlackRock Large Cap Value Retirement Portfolio | $6,800 | $6,800 | $0 | $0 | $6,100 | $6,100 | $30 | $1,028 |
Master Large Cap Core Portfolio | $34,500 | $34,500 | $0 | $0 | $9,200 | $9,200 | $0 | $0 |
Master Large Cap Growth Portfolio | $31,500 | $31,500 | $0 | $0 | $9,200 | $9,200 | $0 | $0 |
Master Large Cap Value Portfolio | $31,500 | $31,500 | $0 | $0 | $9,200 | $9,200 | $0 | $0 |
1 The nature of the services include assurance and related services reasonably related to the performance of the audit of financial statements not included in Audit Fees.
2 The nature of the services include tax compliance, tax advice and tax planning.
3 The nature of the services include a review of compliance procedures and attestation thereto.
| (e)(1) Audit Committee Pre-Approval Policies and Procedures: |
| |
| The registrant’s audit committee (the “Committee”) has adopted policies and procedures with regard to the pre-approval of services. Audit, audit-related and tax compliance services provided to the |
| registrant on an annual basis require specific pre-approval by the Committee. The Committee also must approve other non-audit services provided to the registrant and those non-audit services provided to the registrant’s affiliated service providers that relate directly to the operations and the financial reporting of the registrant. Certain of these non-audit services that the Committee believes are a) consistent with the SEC’s auditor independence rules and b) routine and recurring services that will not impair the independence of the independent accountants may be approved by the Committee without consideration on a specific case-by-case basis (“general pre-approval”). The term of any general pre-approval is 12 months from the date of the pre-approval, unless the Committee provides for a different period. Tax or other non-audit services provided to the registrant which have a direct impact on the operation or financial reporting of the registrant will only be deemed pre-approved provided that any individual project does not exceed $10,000 attributable to the registrant or $50,000 per project. For this purpose, multiple projects will be aggregated to determine if they exceed the previously mentioned cost levels. |
| |
| Any proposed services exceeding the pre-approved cost levels will require specific pre-approval by the Committee, as will any other services not subject to general pre-approval (e.g., unanticipated but permissible services). The Committee is informed of each service approved subject to general pre-approval at the next regularly scheduled in-person board meeting. At this meeting, an analysis of such services is presented to the Committee for ratification. The Committee may delegate to the Committee Chairman the authority to approve the provision of and fees for any specific engagement of permitted non-audit services, including services exceeding pre-approved cost levels. |
| |
| (e)(2) None of the services described in each of Items 4(b) through (d) were approved by the audit committee pursuant to paragraph (c)(7)(i)(C) of Rule 2-01 of Regulation S-X. |
| |
| (f) Not Applicable |
| |
| (g) Affiliates’ Aggregate Non-Audit Fees: |
Entity Name | Current Fiscal Year End | Previous Fiscal Year End |
BlackRock Large Cap Core Fund | $17,502 | $409,628 |
BlackRock Large Cap Growth Fund | $17,005 | $409,628 |
BlackRock Large Cap Value Fund | $17,496 | $409,628 |
BlackRock Large Cap Core Retirement Portfolio | $16,902 | $409,628 |
BlackRock Large Cap Growth Retirement Portfolio | $16,896 | $409,628 |
BlackRock Large Cap Value Retirement Portfolio | $16,907 | $409,628 |
Master Large Cap Core Portfolio | $19,977 | $411,700 |
Master Large Cap Growth Portfolio | $19,977 | $411,700 |
Master Large Cap Value Portfolio | $19,977 | $411,700 |
| (h) The registrant’s audit committee has considered and determined that the provision of non-audit services that were rendered to the registrant’s investment adviser (not including any non-affiliated sub-adviser whose role is primarily portfolio management and is subcontracted with or overseen by the registrant’s |
| investment adviser), and any entity controlling, controlled by, or under common control with the investment adviser that provides ongoing services to the registrant that were not pre-approved pursuant to paragraph (c)(7)(ii) of Rule 2-01 of Regulation S-X is compatible with maintaining the principal accountant’s independence. |
| |
| Regulation S-X Rule 2-01(c)(7)(ii) – $10,777, 0% |
| |
Item 5 – | Audit Committee of Listed Registrants – Not Applicable |
| |
Item 6 – | Investments |
| (a) The registrant’s Schedule of Investments is included as part of the Report to Stockholders filed under Item 1 of this form. |
| (b) Not Applicable due to no such divestments during the semi-annual period covered since the previous Form N-CSR filing. |
| |
Item 7 – | Disclosure of Proxy Voting Policies and Procedures for Closed-End Management Investment Companies – Not Applicable |
| |
Item 8 – | Portfolio Managers of Closed-End Management Investment Companies – Not Applicable |
| |
Item 9 – | Purchases of Equity Securities by Closed-End Management Investment Company and Affiliated Purchasers – Not Applicable |
| |
Item 10 – | Submission of Matters to a Vote of Security Holders – The registrant’s Nominating and Governance Committee will consider nominees to the board of directors recommended by shareholders when a vacancy becomes available. Shareholders who wish to recommend a nominee should send nominations which include biographical information and set forth the qualifications of the proposed nominee to the registrant’s Secretary. There have been no material changes to these procedures. |
| |
Item 11 – | Controls and Procedures |
| |
11(a) – | The registrant’s principal executive and principal financial officers or persons performing similar functions have concluded that the registrant’s disclosure controls and procedures (as defined in Rule 30a-3(c) under the Investment Company Act of 1940, as amended (the “1940 Act”)) are effective as of a date within 90 days of the filing of this report based on the evaluation of these controls and procedures required by Rule 30a-3(b) under the 1940 Act and Rule 15d-15(b) under the Securities Exchange Act of 1934, as amended. |
| |
11(b) – | There were no changes in the registrant’s internal control over financial reporting (as defined in Rule 30a-3(d) under the 1940 Act) that occurred during the second fiscal quarter of the period covered by this report that have materially affected, or are reasonably likely to materially affect, the registrant’s internal control over financial reporting. |
| |
Item 12 – | Exhibits attached hereto |
| |
12(a)(1) – | Code of Ethics – See Item 2 |
| |
12(a)(2) – | Certifications – Attached hereto |
| |
12(a)(3) – | Not Applicable |
| |
12(b) – | Certifications – Attached hereto |
| Pursuant to the requirements of the Securities Exchange Act of 1934 and the Investment Company Act of 1940, the registrant has duly caused this report to be signed on its behalf by the undersigned, thereunto duly authorized. |
| |
| BlackRock Large Cap Series Funds, Inc. and Master Large Cap Series LLC |
| | |
| | By: | /s/ John M. Perlowski | |
| | | John M. Perlowski |
| | | Chief Executive Officer of |
| | | BlackRock Large Cap Series Funds, Inc. and Master Large Cap Series LLC |
| | |
| | Date: December 1, 2010 |
| | |
| | Pursuant to the requirements of the Securities Exchange Act of 1934 and the Investment Company Act of 1940, this report has been signed below by the following persons on behalf of the registrant and in the capacities and on the dates indicated. |
| | |
| | By: | /s/ John M. Perlowski | |
| | | John M. Perlowski |
| | | Chief Executive Officer (principal executive officer) of |
| | | BlackRock Large Cap Series Funds, Inc. and Master Large Cap Series LLC |
| | |
| | Date: December 1, 2010 |
| | |
| | By: | /s/ Neal J. Andrews | |
| | | Neal J. Andrews |
| | | Chief Financial Officer (principal financial officer) of |
| | | BlackRock Large Cap Series Funds, Inc. and Master Large Cap Series LLC |
| | | |
| | Date: December 1, 2010 |
| | |