UNITED STATES
SECURITIES AND EXCHANGE COMMISSION
Washington, D.C. 20549
FORM N-CSR
CERTIFIED SHAREHOLDER REPORT OF REGISTERED MANAGEMENT INVESTMENT COMPANIES
Investment Company Act file number: 811-09637 and 811-09739
Name of Fund: BlackRock Large Cap Series Funds, Inc.
BlackRock Large Cap Core Fund
BlackRock Large Cap Core Retirement Portfolio
BlackRock Large Cap Growth Fund
BlackRock Large Cap Growth Retirement Portfolio
BlackRock Large Cap Value Fund
BlackRock Large Cap Value Retirement Portfolio
Master Large Cap Series LLC
Master Large Cap Core Portfolio
Master Large Cap Growth Portfolio
Master Large Cap Value Portfolio
Fund Address: 100 Bellevue Parkway, Wilmington, DE 19809
Name and address of agent for service: John M. Perlowski, Chief Executive Officer, BlackRock Large Cap Series Funds, Inc. and Master Large Cap Series LLC, 55 East 52nd Street, New York, NY 10055
Registrants’ telephone number, including area code: (800) 441-7762
Date of fiscal year end: 09/30/2013
Date of reporting period: 09/30/2013
Item 1 – Report to Stockholders
SEPTEMBER 30, 2013
BlackRock Large Cap Series Funds, Inc.
„ BlackRock Large Cap Core Fund
„ BlackRock Large Cap Growth Fund
„ BlackRock Large Cap Value Fund
„ BlackRock Large Cap Core Retirement Portfolio
„ BlackRock Large Cap Growth Retirement Portfolio
„ BlackRock Large Cap Value Retirement Portfolio
| | |
| Not FDIC Insured ¡ May Lose Value ¡ No Bank Guarantee | | |
| | | | | | |
| 2 | | BLACKROCK LARGE CAP SERIES FUNDS, INC. | | SEPTEMBER 30, 2013 | | |
Dear Shareholder
One year ago, financial markets were in a soft patch as global trade slowed, driven by a recession in Europe and decelerating growth in China. Volatility increased toward the end of 2012 due to growing concern that bipartisan gridlock in Washington, D.C. would preclude a timely resolution to US budget negotiations. Failure to reach an agreement before the end of the year would have triggered the “fiscal cliff” of pre-mandated tax increases and spending cuts as of the beginning of 2013, putting the US economy at risk for recession. The worst of the fiscal cliff was averted, however, with a last-minute tax deal, allowing markets to get off to a strong start in 2013. Money that had been pulled to the sidelines amid year-end tax-rate uncertainty poured back into the markets in January. Key indicators signaling modest but broad-based improvements in the world’s major economies, coupled with the absence of negative headlines from Europe, fostered an aura of comfort for investors. Global equities surged, while rising US Treasury yields pressured high quality fixed income assets. (Bond prices fall when yields rise.)
Global economic momentum slowed in February and the pace of the rally moderated. In the months that followed, US stocks outperformed international stocks, as the US recovery showed greater stability compared to most other regions. Slow, but positive, growth in the United States was sufficient to support corporate earnings, while uncomfortably high unemployment reinforced expectations that the Federal Reserve would keep interest rates low. International markets experienced higher levels of volatility given a resurgence of political instability in Italy, a severe banking crisis in Cyprus and a generally poor outlook for European economies. Emerging markets significantly lagged the rest of the world as growth in these economies, particularly in China and Brazil, fell short of expectations.
In May, comments from the Fed suggesting a possible reduction of its bond-buying stimulus program before the end of 2013 roiled markets around the world. Equities plummeted and a dramatic increase in US Treasury yields resulted in tumbling bond prices. Markets rebounded in late June when the tone of the US central bank turned more dovish. Improving economic indicators and a positive outlook for corporate earnings further boosted risk assets in July, with major US equity indices hitting new record highs.
Markets slumped again in August as investors became wary amid looming macro risks. Mixed economic data stirred up worries about global growth and renewed anxieties about when and how much the Fed would scale back on its asset purchase program. Additional volatility stemmed from the escalation of the revolution in Egypt and the civil war in Syria. These conflicts underscored the broader issue of rising geopolitical instability in the Middle East/North Africa region and put upward pressure on oil prices, creating an additional headwind for global economic growth.
September was surprisingly positive for investors thanks to the easing of several key risks. Most importantly, the Federal Reserve defied market expectations with its decision to maintain the current pace of its asset purchase program. Additionally, the more hawkish candidate to become the next Federal Reserve Chairman, Larry Summers, withdrew from the race. On the geopolitical front, the violence in Egypt subsided and the situation in Syria no longer appeared to warrant foreign military intervention. In Europe, the re-election of Angela Merkel as Chancellor of Germany was welcomed as a continuation of the status quo. These developments drove all asset classes generally higher for the month of September even though the final week of the month saw risk markets decline due to political wrangling over US fiscal policy, which ultimately led to a government shutdown at the close of the period.
Though we’ve seen periods of heightened uncertainty and market volatility over the past year, riskier asset classes generally outperformed lower-risk investments. Developed market equities generated the strongest returns for the 6- and 12-month periods ended September 30, 2013. Emerging markets, in contrast, struggled with slowing growth and weakening currencies. Rising interest rates resulted in poor performance for most fixed income assets, especially US Treasury bonds and other higher quality sectors such as tax-exempt municipals and investment grade corporate bonds. High yield bonds, on the other hand, generated positive returns as investors looked to the asset class for income in the low-rate environment. Short-term interest rates remained near zero, keeping yields on money market securities near historical lows.
At BlackRock, we believe investors need to think globally and extend their scope across a broader array of asset classes and be prepared to move freely as market conditions change over time. We encourage you to talk with your financial advisor and visit www.blackrock.com for further insight about investing in today’s world.
Sincerely,

Rob Kapito
President, BlackRock Advisors, LLC

“Though we’ve seen periods of heightened uncertainty and market volatility over the past year, riskier asset classes generally outperformed lower-risk investments.”
Rob Kapito
President, BlackRock Advisors, LLC
| | | | | | | | |
| Total Returns as of September 30, 2013 | |
| | | 6-month | | | 12-month | |
US large cap equities
(S&P 500® Index) | | | 8.31 | % | | | 19.34 | % |
US small cap equities
(Russell 2000® Index) | | | 13.61 | | | | 30.06 | |
International equities
(MSCI Europe, Australasia, Far East Index) | | | 10.47 | | | | 23.77 | |
Emerging market equities
(MSCI Emerging Markets Index) | | | (2.78 | ) | | | 0.98 | |
3-month Treasury bill
(BofA Merrill Lynch
3-Month US Treasury
Bill Index) | | | 0.04 | | | | 0.10 | |
US Treasury securities
(BofA Merrill Lynch
10- Year US Treasury
Index) | | | (5.19 | ) | | | (5.71 | ) |
US investment grade
bonds (Barclays US
Aggregate Bond Index) | | | (1.77 | ) | | | (1.68 | ) |
Tax-exempt municipal
bonds (S&P Municipal Bond Index) | | | (3.47 | ) | | | (2.25 | ) |
US high yield bonds
(Barclays US Corporate
High Yield 2% Issuer
Capped Index) | | | 0.81 | | | | 7.14 | |
|
| Past performance is no guarantee of future results. Index performance is shown for illustrative purposes only. You cannot invest directly in an index. | |
| | | | | | |
| | | THIS PAGE NOT PART OF YOUR FUND REPORT | | | | 3 |
| | | | |
| Fund Summary as of September 30, 2013 | | | BlackRock Large Cap Core Fund | |
BlackRock Large Cap Core Fund’s (the “Fund”) investment objective is to seek long-term capital growth. In other words, the Fund tries to choose investments that will increase in value.
|
| Portfolio Management Commentary |
How did the Fund perform?
| Ÿ | | For the 12-month period ended September 30, 2013, the Fund, through its investment in Master Large Cap Core Portfolio (the “Portfolio”), generated strong positive returns, but underperformed its benchmark, the Russell 1000® Index. |
What factors influenced performance?
| Ÿ | | The Portfolio’s underperformance relative to the benchmark index was attributable mainly to stock selection within the health care and information technology (“IT”) sectors. In the health care sector, a lack of exposure to biotechnology, the top-performing industry in the sector, had a negative impact on relative returns. Although the Portfolio added exposure to biotechnology later in the reporting period, the move proved untimely in the short run as a number of stocks subsequently declined. Positioning in the pharmaceuticals segment was an additional source of weakness. In the IT sector, underperformance came from the Portfolio’s holdings in the computers & peripherals industry. Specifically, an overweight in Apple, Inc. detracted as the stock tumbled amid investors’ increasing concerns about weakening profit margins and the company’s ability to continue to innovate and drive demand for its products. The Portfolio’s overweight in data storage provider EMC Corp. weighed on returns as well. Positioning within the IT services industry was another source of underperformance. Shares of data analytics firm Teradata Corp. lagged amid ongoing softness in enterprise IT spending. The Portfolio’s investment in money transfer company Western Union Co. also hampered results before the stock was sold from the Portfolio. |
| Ÿ | | Positive relative performance for the period was driven in large part by the Portfolio’s broad underweight to high-yielding, high-payout stocks, which outperformed in the first four months of 2013, but performance |
| | | subsequently lagged. An analysis of these defensive groups, such as consumer staples, utilities, real estate investment trusts (“REITs”) and telecommunication services stocks, indicated that their relative valuations were higher than at nearly any point in the last 30 years, and, as a result, the Portfolio maintained underweights or entirely avoided these segments. |
| Ÿ | | At the sector level, stock selection within financials and industrials contributed positively to performance. In financials, an overweight in US money center banks had a positive impact on results as key holdings, including Citigroup, Inc. and The Goldman Sachs Group, Inc., surged on a strong recovery in capital markets activity, progress in cost-saving initiatives and improving trends across the broader US economy. The prospect of rising interest rates was an additional tailwind for financial holdings, while the Portfolio’s avoidance of interest-rate-sensitive REITs (highlighted above) proved advantageous as well. Within industrials, an overweight in airline names, including United Continental Holdings, Inc. and Delta Air Lines, Inc., boosted returns. Airline stocks performed well as a combination of strong demand, higher ticket prices and slimmed-down operations resulted in increased profits industry-wide. |
Describe recent portfolio activity.
| Ÿ | | During the 12-month period, the Portfolio significantly increased exposure to the financials, industrials and IT sectors, while notably reducing its weightings in consumer staples and utilities. |
Describe portfolio positioning at period end.
| Ÿ | | Relative to the Russell 1000® Index, the Portfolio ended the period with its largest sector overweights in financials and health care, while consumer staples and utilities were the most significant underweights. |
The views expressed reflect the opinions of BlackRock as of the date of this report and are subject to change based on changes in market, economic or other conditions. These views are not intended to be a forecast of future events and are no guarantee of future results.
| | | | | | |
| 4 | | BLACKROCK LARGE CAP SERIES FUNDS, INC. | | SEPTEMBER 30, 2013 | | |
| | | | |
| | | | BlackRock Large Cap Core Fund | |
|
| Total Return Based on a $10,000 Investment |
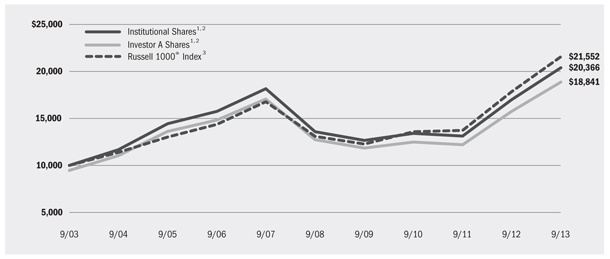
| | 1 | Assuming maximum sales charges, if any, transaction costs and other operating expenses, including administration fees, if any. Institutional Shares do not have a sales charge. |
| | 2 | The Fund invests all of its assets in the Portfolio, a series of Master Large Cap Series LLC. The Portfolio invests at least 80% of its assets in equity securities, primarily common stock, of large cap companies located in the United States that the investment advisor selects from among those that are, at the time of purchase, included in the Russell 1000® Index. |
| | 3 | This index measures the performance of the 1,000 largest companies in the Russell 3000® Index, which represents approximately 90% of the total market capitalization of the Russell 3000® Index. |
| | | | | | | | | | | | | | | | | | | | | | | | | | | | |
| Performance Summary for the Period Ended September 30, 2013 | |
| | | | | | Average Annual Total Returns4 | |
| | | | | | 1 Year | | | 5 Years | | | 10 Years | |
| | | 6-Month
Total Returns | | | w/o sales
charge | | | w/ sales
charge | | | w/o sales
charge | | | w/ sales
charge | | | w/o sales
charge | | | w/ sales
charge | |
Institutional | | | 8.63 | % | | | 20.00 | % | | | N/A | | | | 8.46 | % | | | N/A | | | | 7.37 | % | | | N/A | |
Service | | | 8.36 | | | | 19.42 | | | | N/A | | | | 8.15 | | | | N/A | | | | 7.09 | | | | N/A | |
Investor A | | | 8.44 | | | | 19.71 | | | | 13.43 | % | | | 8.19 | | | | 7.03 | % | | | 7.12 | | | | 6.54 | % |
Investor B | | | 7.99 | | | | 18.65 | | | | 14.15 | | | | 7.33 | | | | 7.02 | | | | 6.43 | | | | 6.43 | |
Investor C | | | 7.94 | | | | 18.62 | | | | 17.62 | | | | 7.23 | | | | 7.23 | | | | 6.21 | | | | 6.21 | |
Class R | | | 8.25 | | | | 19.26 | | | | N/A | | | | 7.77 | | | | N/A | | | | 6.74 | | | | N/A | |
Russell 1000® Index | | | 8.83 | | | | 20.91 | | | | N/A | | | | 10.53 | | | | N/A | | | | 7.98 | | | | N/A | |
| | 4 | Assuming maximum sales charges, if any. Average annual total returns with and without sales charges reflect reductions for distribution and service fees. See “About Fund Performance” on page 16 for a detailed description of share classes, including any related sales charges and fees. |
| | | N/A—Not applicable as share class and index do not have a sales charge. |
| | | Past performance is not indicative of future results. |
| | | | | | | | | | | | | | |
| Expense Example |
| | | Actual | | Hypothetical6 | | |
| | | Beginning
Account Value
April 1, 2013 | | Ending
Account Value
September 30, 2013 | | Expenses Paid
During the Period5 | | Beginning
Account Value
April 1, 2013 | | Ending
Account Value
September 30, 2013 | | Expenses Paid
During the Period5 | | Annualized
Expense Ratio |
Institutional | | $1,000.00 | | $1,086.30 | | $4.53 | | $1,000.00 | | $1,020.59 | | $4.38 | | 0.87% |
Service | | $1,000.00 | | $1,083.60 | | $6.23 | | $1,000.00 | | $1,018.95 | | $6.04 | | 1.20% |
Investor A | | $1,000.00 | | $1,084.40 | | $5.92 | | $1,000.00 | | $1,019.25 | | $5.74 | | 1.14% |
Investor B | | $1,000.00 | | $1,079.90 | | $10.22 | | $1,000.00 | | $1,015.11 | | $9.90 | | 1.97% |
Investor C | | $1,000.00 | | $1,079.40 | | $10.21 | | $1,000.00 | | $1,015.11 | | $9.90 | | 1.97% |
Class R | | $1,000.00 | | $1,082.50 | | $7.42 | | $1,000.00 | | $1,017.80 | | $7.19 | | 1.43% |
| | 5 | For each class of the Fund, expenses are equal to the annualized expense ratio for the class, multiplied by the average account value over the period, multiplied by 183/365 (to reflect the one-half year period shown). Because the Fund invests all of its assets in the Portfolio, the expense table reflects the net expenses of both the Fund and the Portfolio in which it invests. |
| | 6 | Hypothetical 5% annual return before expenses is calculated by pro rating the number of days in the most recent fiscal half year divided by 365. |
| | | See “Disclosure of Expenses” on page 16 for further information on how expenses were calculated. |
| | | | | | |
| | | BLACKROCK LARGE CAP SERIES FUNDS, INC. | | SEPTEMBER 30, 2013 | | 5 |
| | | | |
| Fund Summary as of September 30, 2013 | | | BlackRock Large Cap Growth Fund | |
BlackRock Large Cap Growth Fund’s (the “Fund”) investment objective is to seek long-term capital growth. In other words, the Fund tries to choose investments that will increase in value.
|
| Portfolio Management Commentary |
How did the Fund perform?
| Ÿ | | For the 12-month period ended September 30, 2013, the Fund, through its investment in Master Large Cap Growth Portfolio (the “Portfolio”), generated strong positive returns, but underperformed its benchmark, the Russell 1000® Growth Index. |
What factors influenced performance?
| Ÿ | | Relative to the benchmark index, negative performance in the information technology (“IT”), energy and health care sectors overshadowed positive results in the industrials and materials sectors. |
| Ÿ | | Positioning within the IT sector was the largest detractor from performance, with holdings in the computers & peripherals, internet software & services and IT services industries representing the majority of the underperformance. Within computers & peripherals, an overweight in Apple, Inc. detracted as the stock tumbled amid investors’ increasing concerns about weakening profit margins and the company’s ability to continue to innovate and drive demand for its products. An overweight in data storage provider EMC Corp. weighed on performance as well. The Portfolio’s lack of exposure to social media giant Facebook, Inc. had a negative impact on results within internet software & services as the stock more than doubled during the period. In IT services, shares of data analytics firm Teradata Corp. lagged amid ongoing softness in enterprise IT spending. The Portfolio’s investment in money transfer company Western Union Co. also hampered results before the stock was sold from the Portfolio. |
| Ÿ | | In the energy sector, volatility in crude oil prices and the narrowing of crack spreads (i.e., the difference between the price of crude oil and prices of the petroleum products derived from it) raised concerns about the sustainability of profit margins for oil refiners held in the Portfolio, |
| | | including PBF Energy, Inc. and Marathon Petroleum Corp. In the health care sector, a lack of exposure to biotechnology hurt relative results, as it was the top-performing industry in the sector. Although the Portfolio added exposure to biotechnology later in the reporting period, the move proved untimely in the short run as a number of stocks subsequently declined. |
| Ÿ | | Conversely, stock selection in the industrials sector drove positive performance, with an overweight in airline names, including United Continental Holdings, Inc., Copa Holdings SA and Delta Air Lines, Inc., providing the greatest benefit. Airline stocks outperformed as a combination of strong demand, higher ticket prices and slimmed-down operations resulted in increased profits industry-wide. Select machinery and industrial conglomerates holdings also added to relative results. The materials sector, notably the Portfolio’s overweight in containerboard manufacturers, was also a source of strength. Top names such as Packaging Corp. of America and International Paper Co. recorded strong gains as industry consolidation has led to improved competitive conditions and increased pricing power. |
Describe recent portfolio activity.
| Ÿ | | During the 12-month period, the Portfolio increased exposure to the health care, financials and consumer discretionary sectors, while materially reducing its weighting in consumer staples. |
Describe portfolio positioning at period end.
| Ÿ | | Relative to the Russell 1000® Growth Index, the Portfolio ended the period with its largest sector overweights in health care and energy, while consumer staples and consumer discretionary were the most significant underweights. |
The views expressed reflect the opinions of BlackRock as of the date of this report and are subject to change based on changes in market, economic or other conditions. These views are not intended to be a forecast of future events and are no guarantee of future results.
| | | | | | |
| 6 | | BLACKROCK LARGE CAP SERIES FUNDS, INC. | | SEPTEMBER 30, 2013 | | |
| | | | |
| | | | BlackRock Large Cap Growth Fund | |
|
| Total Return Based on a $10,000 Investment |
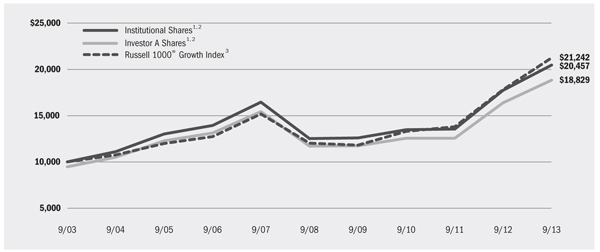
| | 1 | Assuming maximum sales charges, if any, transaction costs and other operating expenses, including administration fees, if any. Institutional Shares do not have a sales charge. |
| | 2 | The Fund invests all of its assets in the Portfolio, a series of Master Large Cap Series LLC. The Portfolio invests at least 80% of its assets in equity securities, primarily common stock, of large cap companies located in the United States that the investment advisor selects from among those that are, at the time of purchase, included in the Russell 1000® Growth Index. |
| | 3 | This index is a subset of the Russell 1000® Index consisting of those Russell 1000® securities with greater-than-average growth orientation. |
| | | | | | | | | | | | | | | | | | | | | | | | | | | | |
| Performance Summary for the Period Ended September 30, 2013 | |
| | | | | | Average Annual Total Returns4 | |
| | | | | | 1 Year | | | 5 Years | | | 10 Years | |
| | | 6-Month
Total Returns | | | w/o sales charge | | | w/ sales charge | | | w/o sales charge | | | w/ sales charge | | | w/o sales charge | | | w/ sales charge | |
Institutional | | | 10.08 | % | | | 15.33 | % | | | N/A | | | | 10.35 | % | | | N/A | | | | 7.42 | % | | | N/A | |
Service | | | 9.93 | | | | 14.98 | | | | N/A | | | | 10.08 | | | | N/A | | | | 7.16 | | | | N/A | |
Investor A | | | 9.86 | | | | 14.90 | | | | 8.87 | % | | | 9.99 | | | | 8.81 | % | | | 7.11 | | | | 6.53 | % |
Investor B | | | 9.47 | | | | 13.92 | | | | 9.42 | | | | 9.12 | | | | 8.84 | | | | 6.43 | | | | 6.43 | |
Investor C | | | 9.40 | | | | 14.02 | | | | 13.02 | | | | 9.12 | | | | 9.12 | | | | 6.27 | | | | 6.27 | |
Class R | | | 9.77 | | | | 14.61 | | | | N/A | | | | 9.66 | | | | N/A | | | | 6.79 | | | | N/A | |
Russell 1000® Growth Index | | | 10.34 | | | | 19.27 | | | | N/A | | | | 12.07 | | | | N/A | | | | 7.82 | | | | N/A | |
| | 4 | Assuming maximum sales charges, if any. Average annual total returns with and without sales charges reflect reductions for distribution and service fees. See “About Fund Performance” on page 16 for a detailed description of share classes, including any related sales charges and fees. |
| | | N/A—Not applicable as share class and index do not have a sales charge. |
| | | Past performance is not indicative of future results. |
| | | | | | | | | | | | | | |
| Expense Example |
| | | Actual | | Hypothetical6 | | |
| | | Beginning
Account Value
April 1, 2013 | | Ending
Account Value
September 30, 2013 | | Expenses Paid
During the Period5 | | Beginning
Account Value
April 1, 2013 | | Ending
Account Value
September 30, 2013 | | Expenses Paid
During the Period5 | | Annualized
Expense Ratio |
Institutional | | $1,000.00 | | $1,100.80 | | $4.87 | | $1,000.00 | | $1,020.29 | | $4.68 | | 0.93% |
Service | | $1,000.00 | | $1,099.30 | | $6.18 | | $1,000.00 | | $1,019.05 | | $5.94 | | 1.18% |
Investor A | | $1,000.00 | | $1,098.60 | | $6.44 | | $1,000.00 | | $1,018.80 | | $6.19 | | 1.23% |
Investor B | | $1,000.00 | | $1,094.70 | | $10.91 | | $1,000.00 | | $1,014.51 | | $10.50 | | 2.09% |
Investor C | | $1,000.00 | | $1,094.00 | | $10.55 | | $1,000.00 | | $1,014.86 | | $10.15 | | 2.02% |
Class R | | $1,000.00 | | $1,097.70 | | $7.74 | | $1,000.00 | | $1,017.55 | | $7.44 | | 1.48% |
| | 5 | For each class of the Fund, expenses are equal to the annualized expense ratio for the class, multiplied by the average account value over the period, multiplied by 183/365 (to reflect the one-half year period shown). Because the Fund invests all of its assets in the Portfolio, the expense table reflects the net expenses of both the Fund and the Portfolio in which it invests. |
| | 6 | Hypothetical 5% annual return before expenses is calculated by pro rating the number of days in the most recent fiscal half year divided by 365. |
| | | See “Disclosure of Expenses” on page 16 for further information on how expenses were calculated. |
| | | | | | |
| | | BLACKROCK LARGE CAP SERIES FUNDS, INC. | | SEPTEMBER 30, 2013 | | 7 |
| | | | |
| Fund Summary as of September 30, 2013 | | | BlackRock Large Cap Value Fund | |
BlackRock Large Cap Value Fund’s (the “Fund”) investment objective is to seek long-term capital growth. In other words, the Fund tries to choose investments that will increase in value.
|
| Portfolio Management Commentary |
How did the Fund perform?
| Ÿ | | For the 12-month period ended September 30, 2013, through its investment in Master Large Cap Value Portfolio (the “Portfolio”), the Fund’s Institutional Shares outperformed the benchmark, the Russell 1000® Value Index, while all other share classes underperformed the benchmark index. |
What factors influenced performance?
| Ÿ | | Positive relative performance for the period was driven in large part by the Portfolio’s broad underweight to high-yielding, high-payout stocks, which outperformed in the first four months of 2013, but subsequently lagged. An analysis of these defensive groups, such as consumer staples, utilities, real estate investment trusts (“REITs”) and telecommunication services stocks, indicated their relative valuations were higher than nearly any point in the last 30 years, thus the Portfolio maintained underweights or entirely avoided these segments. |
| Ÿ | | At the sector level, stock selection within industrials and financials contributed positively to performance. In industrials, an overweight in airline names, including United Continental Holdings, Inc. and Delta Air Lines, Inc., provided the greatest benefit. Airline stocks outperformed as a combination of strong demand, higher ticket prices and slimmed-down operations resulted in increased profits industry-wide. Select machinery and industrial conglomerates holdings also added to relative results. In financials, an overweight in US money center banks had a positive impact on results as key holdings, including Citigroup, Inc. and The Goldman Sachs Group, Inc., surged on a strong recovery in capital markets activity, progress in cost-saving initiatives and improving trends across the broader US economy. The Portfolio’s avoidance of the yield-sensitive REITs segment proved advantageous as well. The Portfolio’s holdings in property & casualty insurers, including American International Group, Inc. and American Financial Group, Inc., lifted returns as these companies benefited from improving industry pricing trends and a |
| | | benign loss cost environment (i.e., a light hurricane season and mild tort environment). |
| Ÿ | | Conversely, stock selection detracted from performance in the health care sector. Weakness was most notable in the providers & services segment, mainly for-profit health insurers, where UnitedHealth Group, Inc. had the greatest negative impact. Earlier in the reporting period, the Portfolio sold the stock due to concerns about possible cuts to Medicare Advantage reimbursement rates, which would significantly erode the company’s profitability. Shares later rallied, however, as the Centers for Medicare and Medicaid Services reversed course on the proposed rate cuts. Positioning within the pharmaceutical industry also hindered results. |
| Ÿ | | In the energy sector, volatility in crude oil prices and the narrowing of crack spreads (i.e., the difference between the price of crude oil and prices of the petroleum products derived from it) raised concerns about the sustainability of profit margins for oil refiners held in the Portfolio, including PBF Energy, Inc. and Tesoro Corp. Additional individual detractors included major oil companies Chevron Corp. and Exxon Mobil Corp., which saw profits fall amid a drop in oil prices, lower production and softer demand for refining products. Moreover, these names generally lagged the performance of higher-beta (i.e., more volatile than the market) exploration and production stocks. |
Describe recent portfolio activity.
| Ÿ | | During the 12-month period, the Portfolio significantly increased exposure to the IT and financials sectors, while notably reducing its weightings in energy, consumer discretionary, health care and utilities. |
Describe portfolio positioning at period end.
| Ÿ | | Relative to the Russell 1000® Value Index, the Portfolio ended the period with its largest sector overweights in financials and industrials, while utilities was the most significant underweight. |
The views expressed reflect the opinions of BlackRock as of the date of this report and are subject to change based on changes in market, economic or other conditions. These views are not intended to be a forecast of future events and are no guarantee of future results.
| | | | | | |
| 8 | | BLACKROCK LARGE CAP SERIES FUNDS, INC. | | SEPTEMBER 30, 2013 | | |
| | | | |
| | | | BlackRock Large Cap Value Fund | |
|
| Total Return Based on a $10,000 Investment |

| | 1 | Assuming maximum sales charges, if any, transaction costs and other operating expenses, including administration fees, if any. Institutional Shares do not have a sales charge. |
| | 2 | The Fund invests all of its assets in the Portfolio, a series of Master Large Cap Series LLC. The Portfolio invests at least 80% of its assets in equity securities, primarily common stock, of large cap companies located in the United States that the investment advisor selects from among those that are, at the time of purchase, included in the Russell 1000® Value Index. |
| | 3 | This index is a subset of the Russell 1000® Index consisting of those Russell 1000® securities with lower price-to-book ratios and lower forecasted growth values. |
| | | | | | | | | | | | | | | | | | | | | | | | | | | | |
| Performance Summary for the Period Ended September 30, 2013 | |
| | | | | | Average Annual Total Returns4 | |
| | | | | | 1 Year | | | 5 Years | | | 10 Years | |
| | | 6-Month
Total Returns | | | w/o sales
charge | | | w/ sales
charge | | | w/o sales
charge | | | w/ sales
charge | | | w/o sales
charge | | | w/ sales
charge | |
Institutional | | | 6.62 | % | | | 22.38 | % | | | N/A | | | | 6.24 | % | | | N/A | | | | 7.56 | % | | | N/A | |
Service | | | 6.35 | | | | 21.98 | | | | N/A | | | | 6.00 | | | | N/A | | | | 7.31 | | | | N/A | |
Investor A | | | 6.44 | | | | 22.07 | | | | 15.66 | % | | | 5.96 | | | | 4.82 | % | | | 7.28 | | | | 6.70 | % |
Investor B | | | 6.02 | | | | 20.98 | | | | 16.48 | | | | 5.02 | | | | 4.69 | | | | 6.58 | | | | 6.58 | |
Investor C | | | 6.01 | | | | 21.06 | | | | 20.06 | | | | 5.06 | | | | 5.06 | | | | 6.40 | | | | 6.40 | |
Class R | | | 6.31 | | | | 21.70 | | | | N/A | | | | 5.62 | | | | N/A | | | | 6.95 | | | | N/A | |
Russell 1000® Value Index | | | 7.27 | | | | 22.30 | | | | N/A | | | | 8.86 | | | | N/A | | | | 7.99 | | | | N/A | |
| | 4 | Assuming maximum sales charges, if any. Average annual total returns with and without sales charges reflect reductions for distribution and service fees. See “About Fund Performance” on page 16 for a detailed description of share classes, including any related sales charges and fees. |
| | | N/A—Not applicable as share class and index do not have a sales charge. |
| | | Past performance is not indicative of future results. |
| | | | | | | | | | | | | | |
| Expense Example |
| | | Actual | | Hypothetical6 | | |
| | | Beginning
Account Value
April 1, 2013 | | Ending
Account Value
September 30, 2013 | | Expenses Paid
During the Period5 | | Beginning
Account Value
April 1, 2013 | | Ending
Account Value
September 30, 2013 | | Expenses Paid
During the Period5 | | Annualized
Expense Ratio |
Institutional | | $1,000.00 | | $1,066.20 | | $4.53 | | $1,000.00 | | $1,020.54 | | $4.43 | | 0.88% |
Service | | $1,000.00 | | $1,063.50 | | $6.07 | | $1,000.00 | | $1,019.05 | | $5.94 | | 1.18% |
Investor A | | $1,000.00 | | $1,064.40 | | $5.97 | | $1,000.00 | | $1,019.15 | | $5.84 | | 1.16% |
Investor B | | $1,000.00 | | $1,060.20 | | $10.58 | | $1,000.00 | | $1,014.66 | | $10.35 | | 2.06% |
Investor C | | $1,000.00 | | $1,060.10 | | $10.02 | | $1,000.00 | | $1,015.21 | | $9.80 | | 1.95% |
Class R | | $1,000.00 | | $1,063.10 | | $7.30 | | $1,000.00 | | $1,017.85 | | $7.14 | | 1.42% |
| | 5 | For each class of the Fund, expenses are equal to the annualized expense ratio for the class, multiplied by the average account value over the period, multiplied by 183/365 (to reflect the one-half year period shown). Because the Fund invests all of its assets in the Portfolio, the expense table reflects the net expenses of both the Fund and the Portfolio in which it invests. |
| | 6 | Hypothetical 5% annual return before expenses is calculated by pro rating the number of days in the most recent fiscal half year divided by 365. |
| | | See “Disclosure of Expenses” on page 16 for further information on how expenses were calculated. |
| | | | | | |
| | | BLACKROCK LARGE CAP SERIES FUNDS, INC. | | SEPTEMBER 30, 2013 | | 9 |
| | | | |
| Fund Summary as of September 30, 2013 | | | BlackRock Large Cap Core Retirement Portfolio | |
BlackRock Large Cap Core Retirement Portfolio’s (the “Fund”) investment objective is to seek long-term capital growth. In other words, the Fund tries to choose investments that will increase in value.
|
| Portfolio Management Commentary |
How did the Fund perform?
| Ÿ | | For the 12-month period ended September 30, 2013, the Fund, through its investment in Master Large Cap Core Portfolio (the “Portfolio”), generated strong positive returns, but underperformed its benchmark, the Russell 1000® Index. |
What factors influenced performance?
| Ÿ | | The Portfolio’s underperformance relative to the benchmark index was attributable mainly to stock selection within the health care and information technology (“IT”) sectors. In the health care sector, a lack of exposure to biotechnology, the top-performing industry in the sector, had a negative impact on relative returns. Although the Portfolio added exposure to biotechnology later in the reporting period, the move proved untimely in the short run as a number of stocks subsequently declined. Positioning in the pharmaceuticals segment was an additional source of weakness. In the IT sector, underperformance came from the Portfolio’s holdings in the computers & peripherals industry. Specifically, an overweight in Apple, Inc. detracted as the stock tumbled amid investors’ increasing concerns about weakening profit margins and the company’s ability to continue to innovate and drive demand for its products. The Portfolio’s overweight in data storage provider EMC Corp. weighed on returns as well. Positioning within the IT services industry was another source of underperformance. Shares of data analytics firm Teradata Corp. lagged amid ongoing softness in enterprise IT spending. The Portfolio’s investment in money transfer company Western Union Co. also hampered results before the stock was sold from the Portfolio. |
| Ÿ | | Positive relative performance for the period was driven in large part by the Portfolio’s broad underweight to high-yielding, high-payout stocks, which outperformed in the first four months of 2013, but performance |
| | | subsequently lagged. An analysis of these defensive groups, such as consumer staples, utilities, real estate investment trusts (“REITs”) and telecommunication services stocks, indicated that their relative valuations were higher than at nearly any point in the last 30 years, and, as a result, the Portfolio maintained underweights or entirely avoided these segments. |
| Ÿ | | At the sector level, stock selection within financials and industrials contributed positively to performance. In financials, an overweight in US money center banks had a positive impact on results as key holdings, including Citigroup, Inc. and The Goldman Sachs Group, Inc., surged on a strong recovery in capital markets activity, progress in cost-saving initiatives and improving trends across the broader US economy. The prospect of rising interest rates was an additional tailwind for financial holdings, while the Portfolio’s avoidance of interest-rate-sensitive REITs (highlighted above) proved advantageous as well. Within industrials, an overweight in airline names, including United Continental Holdings, Inc. and Delta Air Lines, Inc., boosted returns. Airline stocks performed well as a combination of strong demand, higher ticket prices and slimmed-down operations resulted in increased profits industry-wide. |
Describe recent portfolio activity.
| Ÿ | | During the 12-month period, the Portfolio significantly increased exposure to the financials, industrials and IT sectors, while notably reducing its weightings in consumer staples and utilities. |
Describe portfolio positioning at period end.
| Ÿ | | Relative to the Russell 1000® Index, the Portfolio ended the period with its largest sector overweights in financials and health care, while consumer staples and utilities were the most significant underweights. |
The views expressed reflect the opinions of BlackRock as of the date of this report and are subject to change based on changes in market, economic or other conditions. These views are not intended to be a forecast of future events and are no guarantee of future results.
| | | | | | |
| 10 | | BLACKROCK LARGE CAP SERIES FUNDS, INC. | | SEPTEMBER 30, 2013 | | |
| | | | |
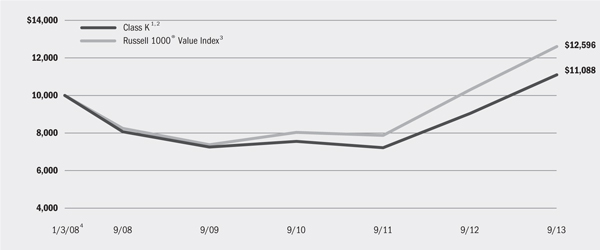
| | | | BlackRock Large Cap Core Retirement Portfolio | |
|
| Total Return Based on a $10,000 Investment |
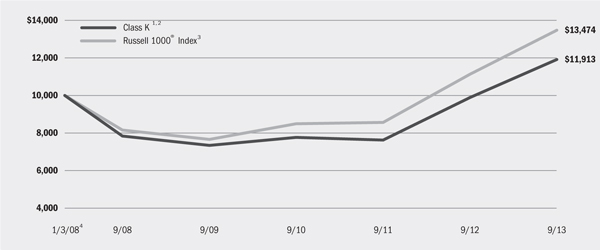
| | 1 | Assuming transaction costs and other operating expenses, including administration fees, if any. |
| | 2 | The Fund invests all of its assets in the Portfolio, a Series of Master Large Cap Series LLC. The Portfolio invests at least 80% of its assets in equity securities, primarily common stock, of large cap companies located in the United States that the investment advisor selects from among those that are, at the time of purchase, included in the Russell 1000® Index. |
| | 3 | The index measures the performance of the 1,000 largest companies in the Russell 3000® Index, which represents approximately 90% of the total market capitalization of the Russell 3000® Index. |
| | 4 | Commencement of operations. |
|
| Performance Summary for the Period Ended September 30, 2013 |
| | | | | | | | | | | | | | | | |
| | | | | | Average Annual Total Returns5 | |
| | | 6-Month
Total Returns | | | 1 Year | | | 5 Years | | | Since
Inception6 | |
Class K | | | 8.73 | % | | | 20.27 | % | | | 8.72 | % | | | 3.10 | % |
Russell 1000® Index | | | 8.83 | | | | 20.91 | | | | 10.53 | | | | 5.33 | |
| | 5 | See “About Fund Performance” on page 16 for a detailed description of the share class, including any related sales charges and fees. |
| | 6 | The Fund commenced operations on January 3, 2008. |
| | | Past performance is not indicative of future results. |
| | | | | | | | | | | | | | |
| | | Actual | | Hypothetical8 | | |
| | | Beginning
Account Value
April 1, 2013 | | Ending
Account Value
September 30, 2013 | | Expenses Paid
During the Period7 | | Beginning
Account Value
April 1, 2013 | | Ending
Account Value
September 30, 2013 | | Expenses Paid
During the Period7 | | Annualized
Expense Ratio |
Class K | | $1,000.00 | | $1,087.30 | | $3.02 | | $1,000.00 | | $1,022.04 | | $2.92 | | 0.58% |
| | 7 | Expenses are equal to the Fund’s annualized expense ratio, multiplied by the average account value over the period, multiplied by 183/365 (to reflect the one-half year period shown). Because the Fund invests all of its assets in the Portfolio, the expense example reflects the net expenses of both the Fund and the Portfolio in which it invests. |
| | 8 | Hypothetical 5% annual return before expenses is calculated by pro rating the number of days in the most recent fiscal half year divided by 365. |
| | | See “Disclosure of Expenses” on page 16 for further information on how expenses were calculated. |
| | | | | | |
| | | BLACKROCK LARGE CAP SERIES FUNDS, INC. | | SEPTEMBER 30, 2013 | | 11 |
| | | | |
| Fund Summary as of September 30, 2013 | | | BlackRock Large Cap Growth Retirement Portfolio | |
BlackRock Large Cap Growth Retirement Portfolio’s (the “Fund”) investment objective is to seek long-term capital growth. In other words, the Fund tries to choose investments that will increase in value.
|
| Portfolio Management Commentary |
How did the Fund perform?
| Ÿ | | For the 12-month period ended September 30, 2013, the Fund, through its investment in Master Large Cap Growth Portfolio (the “Portfolio”), generated strong positive returns, but underperformed its benchmark, the Russell 1000® Growth Index. |
What factors influenced performance?
| Ÿ | | Relative to the benchmark index, negative performance in the information technology (“IT”), energy and health care sectors overshadowed positive results in the industrials and materials sectors. |
| Ÿ | | Positioning within the IT sector was the largest detractor from performance, with holdings in the computers & peripherals, internet software & services and IT services industries representing the majority of the underperformance. Within computers & peripherals, an overweight in Apple, Inc. detracted as the stock tumbled amid investors’ increasing concerns about weakening profit margins and the company’s ability to continue to innovate and drive demand for its products. An overweight in data storage provider EMC Corp. weighed on performance as well. The Portfolio’s lack of exposure to social media giant Facebook, Inc. had a negative impact on results within internet software & services as the stock more than doubled during the period. In IT services, shares of data analytics firm Teradata Corp. lagged amid ongoing softness in enterprise IT spending. The Portfolio’s investment in money transfer company Western Union Co. also hampered results before the stock was sold from the Portfolio. |
| Ÿ | | In the energy sector, volatility in crude oil prices and the narrowing of crack spreads (i.e., the difference between the price of crude oil and prices of the petroleum products derived from it) raised concerns about the sustainability of profit margins for oil refiners held in the Portfolio, |
| | | including PBF Energy, Inc. and Marathon Petroleum Corp. In the health care sector, a lack of exposure to biotechnology hurt relative results, as it was the top-performing industry in the sector. Although the Portfolio added exposure to biotechnology later in the reporting period, the move proved untimely in the short run as a number of stocks subsequently declined. |
| Ÿ | | Conversely, stock selection in the industrials sector drove positive performance, with an overweight in airline names, including United Continental Holdings, Inc., Copa Holdings SA and Delta Air Lines, Inc., providing the greatest benefit. Airline stocks outperformed as a combination of strong demand, higher ticket prices and slimmed-down operations resulted in increased profits industry-wide. Select machinery and industrial conglomerates holdings also added to relative results. The materials sector, notably the Portfolio’s overweight in containerboard manufacturers, was also a source of strength. Top names such as Packaging Corp. of America and International Paper Co. recorded strong gains as industry consolidation has led to improved competitive conditions and increased pricing power. |
Describe recent portfolio activity.
| Ÿ | | During the 12-month period, the Portfolio increased exposure to the health care, financials and consumer discretionary sectors, while materially reducing its weighting in consumer staples. |
Describe portfolio positioning at period end.
| Ÿ | | Relative to the Russell 1000® Growth Index, the Portfolio ended the period with its largest sector overweights in health care and energy, while consumer staples and consumer discretionary were the most significant underweights. |
The views expressed reflect the opinions of BlackRock as of the date of this report and are subject to change based on changes in market, economic or other conditions. These views are not intended to be a forecast of future events and are no guarantee of future results.
| | | | | | |
| 12 | | BLACKROCK LARGE CAP SERIES FUNDS, INC. | | SEPTEMBER 30, 2013 | | |
| | | | |
| | | | BlackRock Large Cap Growth Retirement Portfolio | |
|
| Total Return Based on a $10,000 Investment |
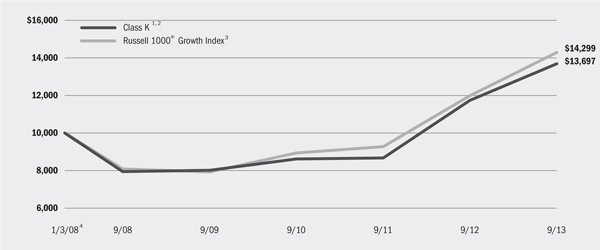
| | 1 | Assuming transaction costs and other operating expenses, including administration fees, if any. |
| | 2 | The Fund invests all of its assets in the Portfolio, a series of Master Large Cap Series LLC. The Portfolio invests at least 80% of its assets in equity securities, primarily common stock, of large cap companies located in the United States that the investment advisor selects from among these that are, at the time of purchase, included in the Russell 1000® Growth Index. |
| | 3 | The index is a subset of the Russell 1000® Index consisting of those Russell 1000® securities with greater-than-average growth orientation. |
| | 4 | Commencement of operations. |
| | | | | | | | | | | | | | | | |
| Performance Summary for the Period Ended September 30, 2013 | |
| | | | | | Average Annual Total Returns5 | |
| | | 6-Month
Total Returns | | | 1 Year | | | 5 Years | | | Since
Inception6 | |
Class K | | | 10.24 | % | | | 16.60 | % | | | 11.50 | % | | | 5.63 | % |
Russell 1000® Growth Index | | | 10.34 | | | | 19.27 | | | | 12.07 | | | | 6.43 | |
| | 5 | See “About Fund Performance” on page 16 for a detailed description of the share class, including any related sales charges and fees. |
| | 6 | The Fund commenced operations on January 3, 2008. |
| | | Past performance is not indicative of future results. |
| | | | | | | | | | | | | | |
| Expense Example |
| | | Actual | | Hypothetical8 | | |
| | | Beginning
Account Value
April 1, 2013 | | Ending
Account Value
September 30, 2013 | | Expenses Paid
During the Period7 | | Beginning
Account Value
April 1, 2013 | | Ending
Account Value
September 30, 2013 | | Expenses Paid
During the Period7 | | Annualized
Expense Ratio |
Class K | | $1,000.00 | | $1,102.40 | | $3.51 | | $1,000.00 | | $1,021.59 | | $3.38 | | 0.67% |
| | 7 | Expenses are equal to the Fund’s annualized expense ratio, multiplied by the average account value over the period, multiplied by 183/365 (to reflect the one-half year period shown). Because the Fund invests all of its assets in the Portfolio, the expense example reflects the net expenses of both the Fund and the Portfolio in which it invests. |
| | 8 | Hypothetical 5% annual return before expenses is calculated by pro rating the number of days in the most recent fiscal half year divided by 365. |
| | | See “Disclosure of Expenses” on page 16 for further information on how expenses were calculated. |
| | | | | | |
| | | BLACKROCK LARGE CAP SERIES FUNDS, INC. | | SEPTEMBER 30, 2013 | | 13 |
| | | | |
| Fund Summary as of September 30, 2013 | | | BlackRock Large Cap Value Retirement Portfolio | |
BlackRock Large Cap Value Retirement Portfolio’s (the “Fund”) investment objective is to seek long-term capital growth. In other words, the Fund tries to choose investments that will increase in value.
|
| Portfolio Management Commentary |
How did the Fund perform?
| Ÿ | | For the 12-month period ended September 30, 2013, the Fund, through its investment in Master Large Cap Value Portfolio (the “Portfolio”), outperformed its benchmark, the Russell 1000® Value Index. |
What factors influenced performance?
| Ÿ | | Positive relative performance for the period was driven in large part by the Portfolio’s broad underweight to high-yielding, high-payout stocks, which outperformed in the first four months of 2013, but subsequently lagged. An analysis of these defensive groups, such as consumer staples, utilities, real estate investment trusts (“REITs”) and telecommunication services stocks, indicated their relative valuations were higher than nearly any point in the last 30 years, thus the Portfolio maintained underweights or entirely avoided these segments. |
| Ÿ | | At the sector level, stock selection within industrials and financials contributed positively to performance. In industrials, an overweight in airline names, including United Continental Holdings, Inc. and Delta Air Lines, Inc., provided the greatest benefit. Airline stocks outperformed as a combination of strong demand, higher ticket prices and slimmed-down operations resulted in increased profits industry-wide. Select machinery and industrial conglomerates holdings also added to relative results. In financials, an overweight in US money center banks had a positive impact on results as key holdings, including Citigroup, Inc. and The Goldman Sachs Group, Inc., surged on a strong recovery in capital markets activity, progress in cost-saving initiatives and improving trends across the broader US economy. The Portfolio’s avoidance of the yield-sensitive REITs segment proved advantageous as well. The Portfolio’s holdings in property & casualty insurers, including American International Group, Inc. and American Financial Group, Inc., lifted returns as these companies benefited from improving industry pricing trends and a benign loss cost environment (i.e., a light hurricane season and mild tort environment). |
| Ÿ | | Conversely, stock selection detracted from performance in the health care sector. Weakness was most notable in the providers & services segment, mainly for-profit health insurers, where UnitedHealth Group, Inc. had the greatest negative impact. Earlier in the reporting period, the Portfolio sold the stock due to concerns about possible cuts to Medicare Advantage reimbursement rates, which would significantly erode the company’s profitability. Shares later rallied, however, as the Centers for Medicare and Medicaid Services reversed course on the proposed rate cuts. Positioning within the pharmaceutical industry also hindered results. |
| Ÿ | | In the energy sector, volatility in crude oil prices and the narrowing of crack spreads (i.e., the difference between the price of crude oil and prices of the petroleum products derived from it) raised concerns about the sustainability of profit margins for oil refiners held in the Portfolio, including PBF Energy. Inc. and Tesoro Corp. Additional individual detractors included major oil companies Chevron Corp. and Exxon Mobil Corp., which saw profits fall amid a drop in oil prices, lower production and softer demand for refining products. Moreover, these names generally lagged the performance of higher-beta (i.e., more volatile than the market) exploration and production stocks. |
Describe recent portfolio activity.
| Ÿ | | During the 12-month period, the Portfolio significantly increased exposure to the IT and financials sectors, while notably reducing its weightings in energy, consumer discretionary, health care and utilities. |
Describe portfolio positioning at period end.
| Ÿ | | Relative to the Russell 1000® Value Index, the Portfolio ended the period with its largest sector overweights in financials and industrials, while utilities was the most significant underweight. |
The views expressed reflect the opinions of BlackRock as of the date of this report and are subject to change based on changes in market, economic or other conditions. These views are not intended to be a forecast of future events and are no guarantee of future results.
| | | | | | |
| 14 | | BLACKROCK LARGE CAP SERIES FUNDS, INC. | | SEPTEMBER 30, 2013 | | |
| | | | |
| | | | BlackRock Large Cap Value Retirement Portfolio | |
|
| Total Return Based on a $10,000 Investment |
| | 1 | Assuming transaction costs and other operating expenses, including administration fees, if any. |
| | 2 | The Fund invests all of its assets in the Portfolio, a series of Master Large Cap Series LLC. The Portfolio invests at least 80% of its assets in equity securities, primarily common stock, of large cap companies located in the United States that the investment advisor selects from among these that are, at the time of purchase, included in the Russell 1000® Value Index. |
| | 3 | The index is a subset of the Russell 1000® Index consisting of those Russell 1000® securities with lower price-to-book ratios and lower forecasted growth values. |
| | 4 | Commencement of operations. |
| | | | | | | | | | | | | | | | |
| Performance Summary for the Period Ended September 30, 2013 | |
| | | | | | Average Annual Total Returns5 | |
| | | 6-Month
Total Returns | | | 1 Year | | | 5 Years | | | Since
Inception6 | |
Class K | | | 6.70 | % | | | 22.71 | % | | | 6.61 | % | | | 1.81 | % |
Russell 1000® Value Index | | | 7.27 | | | | 22.30 | | | | 8.86 | | | | 4.10 | |
| | 5 | See “About Fund Performance” on page 16 for a detailed description of the share class, including any related sales charges and fees. |
| | 6 | The Fund commenced operations on January 3, 2008. |
| | | Past performance is not indicative of future results. |
| | | | | | | | | | | | | | |
| Expense Example |
| | | Actual | | Hypothetical8 | | |
| | | Beginning
Account Value
April 1, 2013 | | Ending
Account Value
September 30, 2013 | | Expenses Paid
During the Period7 | | Beginning
Account Value
April 1, 2013 | | Ending
Account Value
September 30, 2013 | | Expenses Paid
During the Period7 | | Annualized
Expense Ratio |
Class K | | $1,000.00 | | $1,067.00 | | $3.45 | | $1,000.00 | | $1,021.59 | | $3.38 | | 0.67% |
| | 7 | Expenses are equal to the Fund’s annualized expense ratio, multiplied by the average account value over the period, multiplied by 183/365 (to reflect the one-half year period shown). Because the Fund invests all of its assets in the Portfolio, the expense example reflects the net expenses of both the Fund and the Portfolio in which it invests. |
| | 8 | Hypothetical 5% annual return before expenses is calculated by pro rating the number of days in the most recent fiscal half year divided by 365. |
| | | See “Disclosure of Expenses” on page 16 for further information on how expenses were calculated. |
| | | | | | |
| | | BLACKROCK LARGE CAP SERIES FUNDS, INC. | | SEPTEMBER 30, 2013 | | 15 |
| | | | |
| About Fund Performance | | | BlackRock Large Cap Series Funds, Inc. | |
| Ÿ | | Institutional and Class K Shares are not subject to any sales charge. These shares bear no ongoing distribution or service fees and are available only to eligible investors. |
| Ÿ | | Service Shares are not subject to any sales charge. These shares are subject to a service fee of 0.25% per year (but no distribution fee) and are available only to eligible investors. Service Share performance results for BlackRock Large Cap Growth Fund and BlackRock Large Cap Value Fund, prior to October 2, 2006 and for BlackRock Large Cap Core Fund, prior to September 24, 2007, are those of the applicable Fund’s Institutional Shares (which have no distribution or service fees) restated to reflect the Service Share fees. |
| Ÿ | | Investor A Shares are subject to a maximum initial sales charge (front-end load) of 5.25% and a service fee of 0.25% per year (but no distribution fee). Certain redemptions of these shares may be subject to a contingent deferred sales charge (“CDSC”) where no initial sales charge was paid at the time of purchase. |
| Ÿ | | Investor B Shares are subject to a maximum CDSC of 4.50% declining to 0% after six years. In addition, these shares are subject to a distribution fee of 0.75% per year and a service fee of 0.25% per year. These shares automatically convert to Investor A Shares after approximately eight years. (There is no initial sales charge for automatic share conversions.) All returns for periods greater than eight years reflect this conversion. These Shares are only available through exchanges and dividend reinvestments by existing shareholders and for purchase by certain employer-sponsored retirement plans. |
| Ÿ | | Investor C Shares are subject to a 1.00% CDSC if redeemed within one year of purchase. In addition, these shares are subject to a distribution fee of 0.75% per year and a service fee of 0.25% per year. |
| Ÿ | | Class R Shares are not subject to any sales charge. These shares are subject to a distribution fee of 0.25% per year and a service fee of 0.25% per year. These shares are available only to certain employer-sponsored retirement plans. |
Performance information reflects past performance and does not guarantee future results. Current performance may be lower or higher than the performance data quoted. Refer to www.blackrock.com/funds to obtain performance data current to the most recent month end. Performance results do not reflect the deduction of taxes that a shareholder would pay on fund distributions or the redemption of fund shares. Figures shown in the performance tables on the previous pages assume reinvestment of all dividends and distributions, if any, at net asset value (“NAV”) on the ex-dividend date. Investment return and principal value of shares will fluctuate so that shares, when redeemed, may be worth more or less than their original cost. Dividends paid to each class of shares will vary because of the different levels of service, distribution and transfer agency fees applicable to each class, which are deducted from the income available to be paid to shareholders.
BlackRock Large Cap Core Fund, BlackRock Large Cap Value Fund, BlackRock Large Cap Growth Retirement Portfolio and BlackRock Large Cap Value Retirement Portfolio’s administrator waived and/or reimbursed a portion of the Fund’s expenses. Without such waiver and/or reimbursement, the Fund’s performance would have been lower. The administrator is under no obligation to waive and/or reimburse or continue waiving and/or reimbursing its fees. See Note 3 of the Notes to Financial Statements for additional information on waivers and reimbursements.
Shareholders of each Fund may incur the following charges: (a) transactional expenses, such as sales charges and (b) operating expenses, including administration, service and distribution fees, including 12b-1 fees, and other Fund expenses. The expense examples shown on the previous pages (which are based on a hypothetical investment of $1,000 invested on April 1, 2013 and held through September 30, 2013) are intended to assist shareholders both in calculating expenses based on an investment in each Fund and in comparing these expenses with similar costs of investing in other mutual funds.
The expense examples provide information about actual account values and actual expenses. In order to estimate the expenses a shareholder paid during the period covered by this report, shareholders can divide their account value by $1,000 and then multiply the result by the number corresponding to their Fund and share class under the heading entitled “Expenses Paid During the Period.”
The expense examples also provide information about hypothetical account values and hypothetical expenses based on each Fund’s actual expense ratio and an assumed rate of return of 5% per year before expenses. In order to assist shareholders in comparing the ongoing expenses of investing in these Funds and other funds, compare the 5% hypothetical example with the 5% hypothetical examples that appear in other funds’ shareholder reports.
The expenses shown in the expense examples are intended to highlight shareholders’ ongoing costs only and do not reflect any transactional expenses, such as sales charges or exchange fees, if any. Therefore, the hypothetical example is useful in comparing ongoing expenses only, and will not help shareholders determine the relative total expenses of owning different funds. If these transactional expenses were included, shareholder expenses would have been higher.
| | |
| Derivative Financial Instruments | | |
Master Large Cap Core Portfolio, Master Large Cap Core Growth Portfolio and Master Large Cap Value Portfolio (the “Portfolios”) may invest in various derivative financial instruments, including financial futures contracts and foreign currency exchange contracts, as specified in Note 4 of the Portfolios’ Notes to Financial Statements, which may constitute forms of economic leverage. Such derivative financial instruments are used to obtain exposure to a market without owning or taking physical custody of securities or to hedge market and foreign currency exchange rate risks. Derivative financial instruments involve risks, including the imperfect correlation between the value of a derivative financial instrument and the underlying asset, possible default of the counterparty to the transaction or
illiquidity of the derivative financial instrument. The Portfolios’ ability to use a derivative financial instrument successfully depends on the investment advisor’s ability to predict pertinent market movements accurately, which cannot be assured. The use of derivative financial instruments may result in losses greater than if they had not been used, may require a Portfolio to sell or purchase portfolio investments at inopportune times or for distressed values, may limit the amount of appreciation a Portfolio can realize on an investment, may result in lower dividends paid to shareholders or may cause a Portfolio to hold an investment that it might otherwise sell. The Portfolios’ investments in these instruments are discussed in detail in the Portfolios’ Notes to Financial Statements.
| | | | | | |
| 16 | | BLACKROCK LARGE CAP SERIES FUNDS, INC. | | SEPTEMBER 30, 2013 | | |
| | | | |
| Statements of Assets and Liabilities | | | BlackRock Large Cap Series Funds, Inc. | |
| | | | | | | | | | | | | | | | | | | | | | | | |
| September 30, 2013 | | BlackRock
Large Cap
Core Fund | | | BlackRock
Large Cap
Growth Fund | | | BlackRock
Large Cap
Value Fund | | | BlackRock
Large Cap
Core
Retirement
Portfolio | | | BlackRock
Large Cap
Growth
Retirement
Portfolio | | | BlackRock
Large Cap
Value
Retirement
Portfolio | |
| | | | | | | | | | | | | | | | | | | | | | | | |
| Assets | | | | | | | | | | | | | | | | | | | | | | | | |
Investments at value — from the applicable Portfolio1 | | $ | 1,698,430,231 | | | $ | 963,828,622 | | | $ | 821,552,389 | | | $ | 70,246,123 | | | $ | 1,279,662 | | | $ | 133,962,815 | |
Withdrawals receivable from the Portfolio | | | 992,815 | | | | 586,164 | | | | 2,539,106 | | | | 46,672 | | | | — | | | | — | |
Capital shares sold receivable | | | 1,175,298 | | | | 1,184,772 | | | | 929,807 | | | | 100,789 | | | | — | | | | 185,361 | |
Receivable from administrator | | | 32,486 | | | | — | | | | — | | | | — | | | | 19,464 | | | | 5,462 | |
Prepaid expenses | | | 40,876 | | | | 20,263 | | | | 20,268 | | | | 8,277 | | | | 6,308 | | | | 8,517 | |
| | | | |
Total assets | | | 1,700,671,706 | | | | 965,619,821 | | | | 825,041,570 | | | | 70,401,861 | | | | 1,305,434 | | | | 134,162,155 | |
| | | | |
| | | | | | | | | | | | | | | | | | | | | | | | |
| Liabilities | | | | | | | | | | | | | | | | | | | | | | | | |
Capital shares redeemed payable | | | 2,168,113 | | | | 1,770,936 | | | | 3,468,913 | | | | 147,461 | | | | — | | | | 24,010 | |
Contributions payable to the Portfolio | | | — | | | | — | | | | — | | | | — | | | | — | | | | 161,351 | |
Service and distribution fees payable | | | 491,589 | | | | 246,764 | | | | 275,771 | | | | — | | | | — | | | | — | |
Administration fees payable | | | 349,717 | | | | 209,574 | | | | 137,009 | | | | — | | | | — | | | | — | |
Transfer agent fees payable | | | 740,395 | | | | 298,945 | | | | 553,453 | | | | 4,643 | | | | 289 | | | | 28,719 | |
Professional fees payable | | | 41,762 | | | | 31,174 | | | | 36,414 | | | | 21,597 | | | | 20,080 | | | | 22,732 | |
Printing fees payable | | | 27,609 | | | | 18,754 | | | | 21,303 | | | | 5,731 | | | | 2,463 | | | | 2,713 | |
Officer’s fees payable | | | 182 | | | | 103 | | | | 100 | | | | 7 | | | | — | | | | 13 | |
Other affiliates payable | | | — | | | | 67,882 | | | | 47,644 | | | | 438 | | | | — | | | | 333 | |
Other accrued expenses payable | | | 2,334 | | | | 2,226 | | | | 2,195 | | | | 982 | | | | 949 | | | | 964 | |
| | | | |
Total liabilities | | | 3,821,701 | | | | 2,646,358 | | | | 4,542,802 | | | | 180,859 | | | | 23,781 | | | | 240,835 | |
| | | | |
Net Assets | | $ | 1,696,850,005 | | | $ | 962,973,463 | | | $ | 820,498,768 | | | $ | 70,221,002 | | | $ | 1,281,653 | | | $ | 133,921,320 | |
| | | | |
| | | | | | | | | | | | | | | | | | | | | | | | |
| Net Assets Consist of | | | | | | | | | | | | | | | | | | | | | | | | |
Paid-in capital | | $ | 1,655,987,023 | | | $ | 711,341,742 | | | $ | 1,368,533,356 | | | $ | 68,551,671 | | | | — | | | $ | 106,299,610 | |
Undistributed net investment income | | | — | | | | — | | | | — | | | | — | | | | — | | | | 558,987 | |
Accumulated net realized gain (loss) allocated from the Portfolio | | | (350,860,344 | ) | | | 67,163,877 | | | | (752,436,540 | ) | | | (20,911,333 | ) | | $ | 182,433 | 2 | | | 15,484,360 | |
Net unrealized appreciation/depreciation allocated from the Portfolio | | | 391,723,326 | | | | 184,467,844 | | | | 204,401,952 | | | | 22,580,664 | | | | 1,099,220 | | | | 11,578,363 | |
| | | | |
Net Assets | | $ | 1,696,850,005 | | | $ | 962,973,463 | | | $ | 820,498,768 | | | $ | 70,221,002 | | | $ | 1,281,653 | | | $ | 133,921,320 | |
| | | | |
1 Investments at cost | | $ | 1,306,706,905 | | | $ | 779,360,778 | | | $ | 617,150,437 | | | $ | 47,665,459 | | | $ | 180,442 | | | $ | 122,384,452 | |
| | | | | | | | | | | | |
2 Includes the excess of capital shares redeemed over proceeds from capital shares sold and shares issued for reinvestment of dividends in the amount of $378,394. |
See Notes to Financial Statements.
| | | | | | |
| | | BLACKROCK LARGE CAP SERIES FUNDS, INC. | | SEPTEMBER 30, 2013 | | 17 |
| | | | |
| Statements of Assets and Liabilities (concluded) | | | BlackRock Large Cap Series Funds, Inc. | |
| | | | | | | | | | | | | | | | | | | | | | | | |
| September 30, 2013 | | BlackRock
Large Cap Core Fund | | | BlackRock
Large Cap
Growth Fund | | | BlackRock
Large Cap
Value Fund | | | BlackRock
Large Cap
Core
Retirement
Portfolio | | | BlackRock
Large Cap
Growth
Retirement
Portfolio | | | BlackRock
Large Cap
Value
Retirement
Portfolio | |
| | | | | | | | | | | | | | | | | | | | | | | | |
| Net Asset Value | | | | | | | | | | | | | | | | | | | | | | | | |
Institutional | | | | | | | | | | | | | | | | | | | | | | | | |
Net assets | | $ | 527,235,720 | | | $ | 311,126,655 | | | $ | 190,423,442 | | | | — | | | | — | | | | — | |
| | | | |
Shares outstanding, $0.10 par value3 | | | 35,512,687 | | | | 23,366,324 | | | | 10,103,210 | | | | — | | | | — | | | | — | |
| | | | |
Net asset value | | $ | 14.85 | | | $ | 13.32 | | | $ | 18.85 | | | | — | | | | — | | | | — | |
| | | | |
Service | | | | | | | | | | | | | | | | | | | | | | | | |
Net assets | | $ | 968,066 | | | $ | 1,624,094 | | | $ | 13,296,228 | | | | — | | | | — | | | | — | |
| | | | |
Shares outstanding, $0.10 par value4 | | | 65,501 | | | | 123,249 | | | | 709,071 | | | | — | | | | — | | | | — | |
| | | | |
Net asset value | | $ | 14.78 | | | $ | 13.18 | | | $ | 18.75 | | | | — | | | | — | | | | — | |
| | | | |
Investor A | | | | | | | | | | | | | | | | | | | | | | | | |
Net assets | | $ | 732,669,182 | | | $ | 449,729,006 | | | $ | 353,444,691 | | | | — | | | | — | | | | — | |
| | | | |
Shares outstanding, $0.10 par value5 | | | 50,475,578 | | | | 35,074,455 | | | | 19,082,596 | | | | — | | | | — | | | | — | |
| | | | |
Net asset value | | $ | 14.52 | | | $ | 12.82 | | | $ | 18.52 | | | | — | | | | — | | | | — | |
| | | | |
Investor B | | | | | | | | | | | | | | | | | | | | | | | | |
Net assets | | $ | 21,835,335 | | | $ | 4,655,832 | | | $ | 9,377,477 | | | | — | | | | — | | | | — | |
| | | | |
Shares outstanding, $0.10 par value6 | | | 1,615,183 | | | | 402,758 | | | | 537,845 | | | | — | | | | — | | | | — | |
| | | | |
Net asset value | | $ | 13.52 | | | $ | 11.56 | | | $ | 17.44 | | | | — | | | | — | | | | — | |
| | | | |
Investor C | | | | | | | | | | | | | | | | | | | | | | | | |
Net assets | | $ | 369,811,738 | | | $ | 171,429,542 | | | $ | 204,690,076 | | | | — | | | | — | | | | — | |
| | | | |
Shares outstanding, $0.10 par value7 | | | 27,756,872 | | | | 14,875,666 | | | | 11,836,605 | | | | — | | | | — | | | | — | |
| | | | |
Net asset value | | $ | 13.32 | | | $ | 11.52 | | | $ | 17.29 | | | | — | | | | — | | | | — | |
| | | | |
Class R | | | | | | | | | | | | | | | | | | | | | | | | |
Net assets | | $ | 44,329,964 | | | $ | 24,408,334 | | | $ | 49,266,854 | | | | — | | | | — | | | | — | |
| | | | |
Shares outstanding, $0.10 par value8 | | | 3,186,959 | | | | 1,993,051 | | | | 2,758,317 | | | | — | | | | — | | | | — | |
| | | | |
Net asset value | | $ | 13.91 | | | $ | 12.25 | | | $ | 17.86 | | | | — | | | | — | | | | — | |
| | | | |
Class K | | | | | | | | | | | | | | | | | | | | | | | | |
Net assets | | | — | | | | — | | | | — | | | $ | 70,221,002 | | | $ | 1,281,653 | | | $ | 133,921,320 | |
| | | | |
Shares outstanding, $0.10 par value9 | | | — | | | | — | | | | — | | | | 4,780,649 | | | | 163,014 | | | | 7,005,229 | |
| | | | |
Net asset value | | | — | | | | — | | | | — | | | $ | 14.69 | | | $ | 7.86 | | | $ | 19.12 | |
| | | | |
3 Shares Authorized — Institutional | | | 400 million | | | | 100 million | | | | 400 million | | | | — | | | | — | | | | — | |
4 Shares Authorized — Service | | | 50 million | | | | 50 million | | | | 50 million | | | | — | | | | — | | | | — | |
5 Shares Authorized — Investor A | | | 300 million | | | | 100 million | | | | 400 million | | | | — | | | | — | | | | — | |
6 Shares Authorized — Investor B | | | 200 million | | | | 200 million | | | | 200 million | | | | — | | | | — | | | | — | |
7 Shares Authorized — Investor C | | | 400 million | | | | 100 million | | | | 400 million | | | | — | | | | — | | | | — | |
8 Shares Authorized — Class R | | | 200 million | | | | 200 million | | | | 200 million | | | | — | | | | — | | | | — | |
9 Shares Authorized — Class K | | | — | | | | — | | | | — | | | | 200 million | | | | 200 million | | | | 200 million | |
See Notes to Financial Statements.
| | | | | | |
| 18 | | BLACKROCK LARGE CAP SERIES FUNDS, INC. | �� | SEPTEMBER 30, 2013 | | |
| | | | |
| Statements of Operations | | | BlackRock Large Cap Series Funds, Inc. | |
| | | | | | | | | | | | | | | | | | | | | | | | |
| Year Ended September 30, 2013 | | BlackRock
Large Cap Core Fund | | | BlackRock
Large Cap
Growth Fund | | | BlackRock
Large Cap
Value Fund | | | BlackRock
Large Cap
Core
Retirement
Portfolio | | | BlackRock
Large Cap
Growth
Retirement
Portfolio | | | BlackRock
Large Cap
Value
Retirement
Portfolio | |
| | | | | | | | | | | | | | | | | | | | | | | | |
| Investment Income | | | | | | | | | | | | | | | | | | | | | | | | |
Net investment income allocated from the applicable Portfolio: | | | | | | | | | | | | | | | | | | | | | | | | |
Dividends — unaffiliated | | $ | 29,790,048 | | | $ | 16,261,950 | | | $ | 18,991,436 | | | $ | 1,296,244 | | | $ | 27,245 | | | $ | 2,484,686 | |
Foreign taxes withheld | | | (96,394 | ) | | | (55,042 | ) | | | (56,225 | ) | | | (4,057 | ) | | | (85 | ) | | | (7,705 | ) |
Securities lending — affiliated — net | | | 17,561 | | | | 205,063 | | | | 16,305 | | | | 758 | | | | 291 | | | | 2,282 | |
Dividends — affiliated | | | 16,373 | | | | 24,901 | | | | 10,574 | | | | 708 | | | | 42 | | | | 1,342 | |
Expenses | | | (8,318,146 | ) | | | (4,965,915 | ) | | | (4,818,240 | ) | | | (358,243 | ) | | | (7,838 | ) | | | (637,636 | ) |
Fees waived | | | 14,107 | | | | 20,314 | | | | 8,194 | | | | 592 | | | | 31 | | | | 1,105 | |
| | | | |
Total income | | | 21,423,549 | | | | 11,491,271 | | | | 14,152,044 | | | | 936,002 | | | | 19,686 | | | | 1,844,074 | |
| | | | |
| | | | | | | | | | | | | | | | | | | | | | | | |
| Fund Expenses | | | | | | | | | | | | | | | | | | | | | | | | |
Administration | | | 4,152,120 | | | | 2,301,948 | | | | 2,233,529 | | | | — | | | | — | | | | — | |
Service — Service | | | 672 | | | | 18,290 | | | | 59,460 | | | | — | | | | — | | | | — | |
Service — Investor A | | | 1,760,454 | | | | 1,044,571 | | | | 989,189 | | | | — | | | | — | | | | — | |
Service and distribution — Investor B | | | 276,349 | | | | 60,406 | | | | 124,959 | | | | — | | | | — | | | | — | |
Service and distribution — Investor C | | | 3,630,014 | | | | 1,643,281 | | | | 2,090,546 | | | | — | | | | — | | | | — | |
Service and distribution — Class R | | | 228,039 | | | | 132,918 | | | | 278,989 | | | | — | | | | — | | | | — | |
Transfer agent — Institutional | | | 639,536 | | | | 453,716 | | | | 405,003 | | | | — | | | | — | | | | — | |
Transfer agent — Service | | | 531 | | | | 11,802 | | | | 36,358 | | | | — | | | | — | | | | — | |
Transfer agent — Investor A | | | 1,775,541 | | | | 780,863 | | | | 735,975 | | | | — | | | | — | | | | — | |
Transfer agent — Investor B | | | 149,251 | | | | 19,453 | | | | 47,075 | | | | — | | | | — | | | | — | |
Transfer agent — Investor C | | | 882,846 | | | | 368,054 | | | | 521,538 | | | | — | | | | — | | | | — | |
Transfer agent — Class R | | | 97,825 | | | | 59,903 | | | | 122,435 | | | | — | | | | — | | | | — | |
Transfer agent — Class K | | | — | | | | — | | | | — | | | | 10,557 | | | | 34 | | | | 111,211 | |
Printing | | | 71,018 | | | | 48,214 | | | | 37,827 | | | | 9,402 | | | | 4,804 | | | | 7,299 | |
Registration | | | 65,677 | | | | 84,491 | | | | 64,821 | | | | 17,287 | | | | 7,047 | | | | 16,030 | |
Professional | | | 32,222 | | | | 41,141 | | | | 49,032 | | | | 24,487 | | | | 15,541 | | | | 27,107 | |
Officer | | | 606 | | | | 555 | | | | 240 | | | | 11 | | | | 151 | | | | 17 | |
Miscellaneous | | | 12,051 | | | | 19,875 | | | | 12,130 | | | | 5,629 | | | | 5,539 | | | | 5,614 | |
| | | | |
Total expenses | | | 13,774,752 | | | | 7,089,481 | | | | 7,809,106 | | | | 67,373 | | | | 33,116 | | | | 167,278 | |
Less fees waived and/or reimbursed by administrator | | | — | | | | — | | | | (446,706 | ) | | | — | | | | (31,164 | ) | | | (2,471 | ) |
Less transfer agent fees reimbursed — Investor A | | | (871,097 | ) | | | — | | | | — | | | | — | | | | — | | | | — | |
Less transfer agent fees reimbursed — Investor B | | | (92,171 | ) | | | — | | | | — | | | | — | | | | — | | | | — | |
Less transfer agent fees reimbursed — Class K | | | — | | | | — | | | | — | | | | — | | | | (34 | ) | | | (12,213 | ) |
| | | | |
Total expenses after fees waived and/or reimbursed | | | 12,811,484 | | | | 7,089,481 | | | | 7,362,400 | | | | 67,373 | | | | 1,918 | | | | 152,594 | |
| | | | |
Net investment income | | | 8,612,065 | | | | 4,401,790 | | | | 6,789,644 | | | | 868,629 | | | | 17,768 | | | | 1,691,480 | |
| | | | |
| | | | | | | | | | | | | | | | | | | | | | | | |
| Realized and Unrealized Gain (Loss) Allocated from the Applicable Portfolio | | | | | | | | | | | | | | | | | | | | | | | | |
Net realized gain from investments, financial futures contracts, and foreign currency transactions | | | 201,010,591 | | | | 84,817,503 | | | | 107,517,914 | | | | 13,884,841 | | | | 674,823 | | | | 13,735,681 | |
Net change in unrealized appreciation/depreciation on investments | | | 85,395,925 | | | | 42,469,961 | | | | 63,563,859 | | | | (1,838,744 | ) | | | (524,337 | ) | | | 8,276,350 | |
| | | | |
Total realized and unrealized gain | | | 286,406,516 | | | | 127,287,464 | | | | 171,081,773 | | | | 12,046,097 | | | | 150,486 | | | | 22,012,031 | |
| | | | |
Net Increase in Net Assets Resulting from Operations | | $ | 295,018,581 | | | $ | 131,689,254 | | | $ | 177,871,417 | | | $ | 12,914,726 | | | $ | 168,254 | | | $ | 23,703,511 | |
| | | | |
See Notes to Financial Statements.
| | | | | | |
| | | BLACKROCK LARGE CAP SERIES FUNDS, INC. | | SEPTEMBER 30, 2013 | | 19 |
| | | | |
| Statements of Changes in Net Assets | | | BlackRock Large Cap Series Funds, Inc. | |
| | | | | | | | | | | | | | | | |
| | | BlackRock
Large Cap Core Fund | | | BlackRock
Large Cap Growth Fund | |
| | | Year Ended September 30, | | | Year Ended September 30, | |
| Increase (Decrease) in Net Assets: | | 2013 | | | 2012 | | | 2013 | | | 2012 | |
| | | | | | | | | | | | | | | | |
| Operations | | | | | | | | | | | | | | | | |
Net investment income | | $ | 8,612,065 | | | $ | 16,132,564 | | | $ | 4,401,790 | | | $ | 8,609,897 | |
Net realized gain | | | 201,010,591 | | | | 76,617,478 | | | | 84,817,503 | | | | 63,189,611 | |
Net change in unrealized appreciation/depreciation | | | 85,395,925 | | | | 343,135,730 | | | | 42,469,961 | | | | 182,192,544 | |
| | | | |
Net increase in net assets resulting from operations | | | 295,018,581 | | | | 435,885,772 | | | | 131,689,254 | | | | 253,992,052 | |
| | | | |
| | | | | | | | | | | | | | | | |
| Dividends and Distributions to Shareholders From1 | | | | | | | | | | | | | | | | |
Net investment income: | | | | | | | | | | | | | | | | |
Institutional | | | (10,378,743 | ) | | | (4,352,889 | ) | | | (5,073,393 | ) | | | (1,412,861 | ) |
Service | | | (185 | ) | | | — | | | | (187,426 | ) | | | (6,869 | ) |
Investor A | | | (11,473,397 | ) | | | (2,849,708 | ) | | | (7,269,585 | ) | | | (580,273 | ) |
Investor B | | | (95,166 | ) | | | — | | | | (65,126 | ) | | | — | |
Investor C | | | (2,487,652 | ) | | | — | | | | (1,983,615 | ) | | | — | |
Class R | | | (564,840 | ) | | | — | | | | (420,926 | ) | | | — | |
Net realized gains: | | | | | | | | | | | | | | | | |
Institutional | | | — | | | | | | | | (14,860,180 | ) | | | — | |
Service | | | — | | | | — | | | | (637,431 | ) | | | — | |
Investor A | | | — | | | | | | | | (23,081,522 | ) | | | — | |
Investor B | | | — | | | | — | | | | (454,536 | ) | | | — | |
Investor C | | | — | | | | — | | | | (10,278,287 | ) | | | — | |
Class R | | | — | | | | — | | | | (1,639,203 | ) | | | — | |
| | | | |
Decrease in net assets resulting from dividends and distributions to shareholders | | | (24,999,983 | ) | | | (7,202,597 | ) | | | (65,951,230 | ) | | | (2,000,003 | ) |
| | | | |
| | | | | | | | | | | | | | | | |
| Capital Share Transactions | | | | | | | | | | | | | | | | |
Net increase (decrease) in net assets derived from capital share transactions | | | (230,598,517 | ) | | | (386,865,700 | ) | | | 7,688,645 | | | | (161,987,457 | ) |
| | | | |
| | | | | | | | | | | | | | | | |
| Net Assets | | | | | | | | | | | | | | | | |
Total increase in net assets | | | 39,420,081 | | | | 41,817,475 | | | | 73,426,669 | | | | 90,004,592 | |
Beginning of year | | | 1,657,429,924 | | | | 1,615,612,449 | | | | 889,546,794 | | | | 799,542,202 | |
| | | | |
End of year | | $ | 1,696,850,005 | | | $ | 1,657,429,924 | | | $ | 962,973,463 | | | $ | 889,546,794 | |
| | | | |
Undistributed net investment income, end of year | | | — | | | $ | 15,095,839 | | | | — | | | $ | 8,029,786 | |
| | | | |
| | 1 | Dividends and distributions are determined in accordance with federal income tax regulations. |
See Notes to Financial Statements.
| | | | | | |
| 20 | | BLACKROCK LARGE CAP SERIES FUNDS, INC. | | SEPTEMBER 30, 2013 | | |
| | | | |
| Statements of Changes in Net Assets (continued) | | | BlackRock Large Cap Series Funds, Inc. | |
| | | | | | | | | | | | | | | | |
| | | BlackRock
Large Cap Value Fund | | | BlackRock
Large Cap Core Retirement Portfolio | |
| | | Year Ended September 30, | | | Year Ended September 30, | |
| Increase (Decrease) in Net Assets: | | 2013 | | | 2012 | | | 2013 | | | 2012 | |
| | | | | | | | | | | | | | | | |
| Operations | | | | | | | | | | | | | | | | |
Net investment income | | $ | 6,789,644 | | | $ | 10,258,790 | | | $ | 868,629 | | | $ | 1,892,265 | |
Net realized gain | | | 107,517,914 | | | | 44,982,388 | | | | 13,884,841 | | | | 9,881,530 | |
Net change in unrealized appreciation/depreciation | | | 63,563,859 | | | | 205,886,296 | | | | (1,838,744 | ) | | | 28,239,687 | |
| | | | | | | | |
Net increase in net assets resulting from operations | | | 177,871,417 | | | | 261,127,474 | | | | 12,914,726 | | | | 40,013,482 | |
| | | | | | | | |
| | | | | | | | | | | | | | | | |
| Dividends to Shareholders From1 | | | | | | | | | | | | | | | | |
Net investment income: | | | | | | | | | | | | | | | | |
Institutional | | | (5,127,680 | ) | | | (3,669,706 | ) | | | — | | | | — | |
Service | | | (544,205 | ) | | | (278,874 | ) | | | — | | | | — | |
Investor A | | | (7,511,800 | ) | | | (3,284,247 | ) | | | — | | | | — | |
Investor B | | | (99,626 | ) | | | — | | | | — | | | | — | |
Investor C | | | (2,331,994 | ) | | | — | | | | — | | | | — | |
Class R | | | (884,702 | ) | | | (267,234 | ) | | | — | | | | — | |
Class K | | | — | | | | — | | | | (1,900,001 | ) | | | (1,597,998 | ) |
| | | | | | | | |
Decrease in net assets resulting from dividends to shareholders | | | (16,500,007 | ) | | | (7,500,061 | ) | | | (1,900,001 | ) | | | (1,597,998 | ) |
| | | | | | | | |
| | | | | | | | | | | | | | | | |
| Capital Share Transactions | | | | | | | | | | | | | | | | |
Net decrease in net assets derived from capital share transactions | | | (299,975,034 | ) | | | (478,809,563 | ) | | | (22,015,118 | ) | | | (86,685,132 | ) |
| | | | | | | | |
| | | | | | | | | | | | | | | | |
| Net Assets | | | | | | | | | | | | | | | | |
Total decrease in net assets | | | (138,603,624 | ) | | | (225,182,150 | ) | | | (11,000,393 | ) | | | (48,269,648 | ) |
Beginning of year | | | 959,102,392 | | | | 1,184,284,542 | | | | 81,221,395 | | | | 129,491,043 | |
| | | | | | | | |
End of year | | $ | 820,498,768 | | | $ | 959,102,392 | | | $ | 70,221,002 | | | $ | 81,221,395 | |
| | | | | | | | |
Undistributed net investment income, end of year | | | — | | | $ | 9,563,531 | | | | — | | | $ | 1,026,025 | |
| | | | | | | | |
| | 1 | Dividends are determined in accordance with federal income tax regulations. |
See Notes to Financial Statements.
| | | | | | |
| | | BLACKROCK LARGE CAP SERIES FUNDS, INC. | | SEPTEMBER 30, 2013 | | 21 |
| | | | |
| Statements of Changes in Net Assets (concluded) | | | BlackRock Large Cap Series Funds, Inc. | |
| | | | | | | | | | | | | | | | |
| | | BlackRock
Large Cap Growth Retirement Portfolio | | | BlackRock
Large Cap Value Retirement Portfolio | |
| | | Year Ended September 30, | | | Year Ended September 30, | |
| Increase (Decrease) in Net Assets: | | 2013 | | | 2012 | | | 2013 | | | 2012 | |
| | | | | | | | | | | | | | | | |
| Operations | | | | | | | | | | | | | | | | |
Net investment income | | $ | 17,768 | | | $ | 782,587 | | | $ | 1,691,480 | | | $ | 2,169,991 | |
Net realized gain | | | 674,823 | | | | 21,871,504 | | | | 13,735,681 | | | | 10,293,461 | |
Net change in unrealized appreciation/depreciation | | | (524,337 | ) | | | 7,364,220 | | | | 8,276,350 | | | | 24,642,875 | |
| | | | | | | | |
Net increase in net assets resulting from operations | | | 168,254 | | | | 30,018,311 | | | | 23,703,511 | | | | 37,106,327 | |
| | | | | | | | |
| | | | | | | | | | | | | | | | |
| Dividends and Distributions to Shareholders From1 | | | | | | | | | | | | | | | | |
Net investment income: | | | | | | | | | | | | | | | | |
Class K | | | (260,000 | ) | | | (950,003 | ) | | | (2,300,006 | ) | | | (2,300,002 | ) |
Net realized gains: | | | | | | | | | | | | | | | | |
Class K | | | (758,868 | ) | | | — | | | | — | | | | — | |
| | | | | | | | |
Decrease in net assets resulting from dividends and distributions to shareholders | | | (1,018,868 | ) | | | (950,003 | ) | | | (2,300,006 | ) | | | (2,300,002 | ) |
| | | | | | | | |
| | | | | | | | | | | | | | | | |
| Capital Share Transactions | | | | | | | | | | | | | | | | |
Net increase (decrease) in net assets derived from capital share transactions | | | (110,476 | ) | | | (126,994,986 | ) | | | 8,881,427 | | | | (76,133,782 | ) |
| | | | | | | | |
| | | | | | | | | | | | | | | | |
| Net Assets | | | | | | | | | | | | | | | | |
Total increase (decrease) in net assets | | | (961,090 | ) | | | (97,926,678 | ) | | | 30,284,932 | | | | (41,327,457 | ) |
Beginning of year | | | 2,242,743 | | | | 100,169,421 | | | | 103,636,388 | | | | 144,963,845 | |
| | | | | | | | |
End of year | | $ | 1,281,653 | | | $ | 2,242,743 | | | $ | 133,921,320 | | | $ | 103,636,388 | |
| | | | | | | | |
Undistributed net investment income, end of year | | | — | | | $ | 238,710 | | | $ | 558,987 | | | $ | 1,168,442 | |
| | | | | | | | |
| | 1 | Dividends and distributions are determined in accordance with federal income tax regulations. |
See Notes to Financial Statements.
| | | | | | |
| 22 | | BLACKROCK LARGE CAP SERIES FUNDS, INC. | | SEPTEMBER 30, 2013 | | |
| | | | |
| Financial Highlights | | | BlackRock Large Cap Core Fund | |
| | | | | | | | | | | | | | | | | | | | | | | | |
| | | Institutional | |
| | | Year Ended September 30, | | | Period
November 1,
2008 to September 30,
2009 | | | Year Ended October 31,
2008 | |
| | | 2013 | | | 2012 | | | 2011 | | | 2010 | | | |
| Per Share Operating Performance | | | | | | | | | | | | | | | | | | | | | | | | |
Net asset value, beginning of period | | $ | 12.64 | | | $ | 9.84 | | | $ | 10.11 | | | $ | 9.68 | | | $ | 8.62 | | | $ | 14.60 | |
| | | | |
Net investment income1 | | | 0.12 | | | | 0.16 | | | | 0.07 | | | | 0.06 | | | | 0.09 | | | | 0.07 | |
Net realized and unrealized gain (loss) | | | 2.36 | | | | 2.73 | | | | (0.28 | ) | | | 0.49 | | | | 0.97 | | | | (5.66 | ) |
| | | | |
Net increase (decrease) from investment operations | | | 2.48 | | | | 2.89 | | | | (0.21 | ) | | | 0.55 | | | | 1.06 | | | | (5.59 | ) |
| | | | |
Dividends and distributions from:2 | | | | | | | | | | | | | | | | | | | | | | | | |
Net investment income | | | (0.27 | ) | | | (0.09 | ) | | | (0.06 | ) | | | (0.12 | ) | | | — | | | | — | |
Net realized gain | | | — | | | | — | | | | — | | | | — | | | | — | | | | (0.39 | ) |
| | | | |
Total dividends and distributions | | | (0.27 | ) | | | (0.09 | ) | | | (0.06 | ) | | | (0.12 | ) | | | — | | | | (0.39 | ) |
| | | | |
Net asset value, end of period | | $ | 14.85 | | | $ | 12.64 | | | $ | 9.84 | | | $ | 10.11 | | | $ | 9.68 | | | $ | 8.62 | |
| | | | |
| | | | | | | | | | | | | | | | | | | | | | | | |
| Total Investment Return3 | | | | | | | | | | | | | | | | | | | | | | | | |
Based on net asset value | | | 20.00 | % | | | 29.55 | % | | | (2.16 | )% | | | 5.69 | % | | | 12.30 | %4,5 | | | (39.25 | )% |
| | | | |
| | | | | | | | | | | | | | | | | | | | | | | | |
| Ratios to Average Net Assets6 | | | | | | | | | | | | | | | | | | | | | | | | |
Total expenses | | | 0.88 | %7 | | | 0.77 | %7,8 | | | 1.05 | %7 | | | 0.98 | % | | | 0.89 | %9 | | | 0.86 | % |
| | | | |
Total expenses after fees waived and/or reimbursed | | | 0.88 | %7 | | | 0.77 | %7,8 | | | 1.05 | %7 | | | 0.98 | % | | | 0.89 | %9 | | | 0.86 | % |
| | | | |
Net investment income | | | 0.90 | %7 | | | 1.41 | %7,8 | | | 0.58 | %7 | | | 0.63 | % | | | 1.15 | %9 | | | 0.58 | % |
| | | | |
| | | | | | | | | | | | | | | | | | | | | | | | |
| Supplemental Data | | | | | | | | | | | | | | | | | | | | | | | | |
Net assets, end of period (000) | | $ | 527,236 | | | $ | 513,245 | | | $ | 489,847 | | | $ | 646,562 | | | $ | 1,073,342 | | | $ | 700,113 | |
| | | | |
Portfolio turnover of the Portfolio | | | 50 | % | | | 128 | % | | | 129 | % | | | 173 | % | | | 168 | % | | | 109 | % |
| | | | |
| | 1 | Based on average shares outstanding. |
| | 2 | Dividends and distributions are determined in accordance with federal income tax regulations. |
| | 3 | Where applicable, total investment returns assume the reinvestment of dividends and distributions. |
| | 4 | Includes proceeds received from a settlement of litigation, through its investment in the Portfolio, which impacted the Fund’s total investment return. Not including these proceeds, the total investment return would have been 12.06%. |
| | 5 | Aggregate total investment return. |
| | 6 | Includes the Fund’s share of the Portfolios’ allocated expenses and/or net investment income. |
| | 7 | Includes the Fund’s share of the Portfolio’s allocated fees waived of less than 0.01%. |
| | 8 | Includes a non-recurring expense adjustment, which impacted the ratios for total expenses, total expenses after fees waived and/or reimbursed and net investment income. Excluding this adjustment, the ratios would have been 0.90%, 0.90% and 1.28%, respectively. |
See Notes to Financial Statements.
| | | | | | |
| | | BLACKROCK LARGE CAP SERIES FUNDS, INC. | | SEPTEMBER 30, 2013 | | 23 |
| | | | |
| Financial Highlights (continued) | | | BlackRock Large Cap Core Fund | |
| | | | | | | | | | | | | | | | | | | | | | | | |
| | | Service | |
| | | Year Ended September 30, | | | Period November 1, 2008 to September 30, 2009 | | | Year Ended October 31, 2008 | |
| | | 2013 | | | 2012 | | | 2011 | | | 2010 | | | |
| Per Share Operating Performance | | | | | | | | | | | | | | | | | | | | | | | | |
Net asset value, beginning of period | | $ | 12.39 | | | $ | 9.60 | | | $ | 9.89 | | | $ | 9.47 | | | $ | 8.44 | | | $ | 14.33 | |
| | | | |
Net investment income1 | | | 0.07 | | | | 0.11 | | | | 0.04 | | | | 0.05 | | | | 0.07 | | | | 0.04 | |
Net realized and unrealized gain (loss) | | | 2.33 | | | | 2.68 | | | | (0.27 | ) | | | 0.47 | | | | 0.96 | | | | (5.55 | ) |
| | | | |
Net increase (decrease) from investment operations | | | 2.40 | | | | 2.79 | | | | (0.23 | ) | | | 0.52 | | | | 1.03 | | | | (5.51 | ) |
| | | | |
Dividends and distributions from:2 | | | | | | | | | | | | | | | | | | | | | | | | |
Net investment income (loss) | | | (0.01 | ) | | | — | | | | (0.06 | ) | | | (0.10 | ) | | | — | | | | — | |
Net realized gain | | | — | | | | — | | | | — | | | | — | | | | — | | | | (0.38 | ) |
| | | | |
Total dividends and distributions | | | (0.01 | ) | | | — | | | | (0.06 | ) | | | (0.10 | ) | | | — | | | | (0.38 | ) |
| | | | |
Net asset value, end of period | | $ | 14.78 | | | $ | 12.39 | | | $ | 9.60 | | | $ | 9.89 | | | $ | 9.47 | | | $ | 8.44 | |
| | | | |
| | | | | | | | | | | | | | | | | | | | | | | | |
| Total Investment Return3 | | | | | | | | | | | | | | | | | | | | | | | | |
Based on net asset value | | | 19.42 | % | | | 29.06 | % | | | (2.41 | )% | | | 5.53 | % | | | 12.20 | %4,5 | | | (39.39 | )% |
| | | | |
| | | | | | | | | | | | | | | | | | | | | | | | |
| Ratios to Average Net Assets6 | | | | | | | | | | | | | | | | | | | | | | | | |
Total expenses | | | 1.20 | %7 | | | 1.05 | %7 | | | 1.25 | %7 | | | 1.12 | % | | | 1.09 | %8 | | | 1.06 | % |
| | | | |
Total expenses after fees waived and/or reimbursed | | | 1.20 | %7 | | | 1.05 | %7 | | | 1.25 | %7 | | | 1.12 | % | | | 1.09 | %8 | | | 1.06 | % |
| | | | |
Net investment income | | | 0.55 | %7 | | | 0.96 | %7 | | | 0.39 | %7 | | | 0.49 | % | | | 0.95 | %8 | | | 0.37 | % |
| | | | |
| | | | | | | | | | | | | | | | | | | | | | | | |
| Supplemental Data | | | | | | | | | | | | | | | | | | | | | | | | |
Net assets, end of period (000) | | $ | 968 | | | $ | 1,578 | | | $ | 270 | | | $ | 369 | | | $ | 395 | | | $ | 372 | |
| | | | |
Portfolio turnover of the Portfolio | | | 50 | % | | | 128 | % | | | 129 | % | | | 173 | % | | | 168 | % | | | 109 | % |
| | | | |
| | 1 | Based on average shares outstanding. |
| | 2 | Dividends and distributions are determined in accordance with federal income tax regulations. |
| | 3 | Where applicable, total investment returns assume the reinvestment of dividends and distributions. |
| | 4 | Includes proceeds received from a settlement of litigation, through its investment in the Portfolio, which impacted the Fund’s total investment return. Not including these proceeds, the total investment return would have been 11.85%. |
| | 5 | Aggregate total investment return. |
| | 6 | Includes the Fund’s share of the Portfolios’ allocated expenses and/or net investment income. |
| | 7 | Includes the Fund’s share of the Portfolio’s allocated fees waived of less than 0.01%. |
See Notes to Financial Statements.
| | | | | | |
| 24 | | BLACKROCK LARGE CAP SERIES FUNDS, INC. | | SEPTEMBER 30, 2013 | | |
| | | | |
| Financial Highlights (continued) | | | BlackRock Large Cap Core Fund | |
| | | | | | | | | | | | | | | | | | | | | | | | |
| | | Investor A | |
| | | Year Ended September 30, | | | Period November 1, 2008 to September 30, 2009 | | | Year Ended October 31, 2008 | |
| | | 2013 | | | 2012 | | | 2011 | | | 2010 | | | |
| Per Share Operating Performance | | | | | | | | | | | | | | | | | | | | | | | | |
Net asset value, beginning of period | | $ | 12.34 | | | $ | 9.61 | | | $ | 9.88 | | | $ | 9.46 | | | $ | 8.44 | | | $ | 14.33 | |
| | | | |
Net investment income1 | | | 0.09 | | | | 0.12 | | | | 0.06 | | | | 0.05 | | | | 0.07 | | | | 0.04 | |
Net realized and unrealized gain (loss) | | | 2.30 | | | | 2.65 | | | | (0.28 | ) | | | 0.47 | | | | 0.95 | | | | (5.54 | ) |
| | | | |
Net increase (decrease) from investment operations | | | 2.39 | | | | 2.77 | | | | (0.22 | ) | | | 0.52 | | | | 1.02 | | | | (5.50 | ) |
| | | | |
Dividends and distributions from:2 | | | | | | | | | | | | | | | | | | | | | | | | |
Net investment income | | | (0.21 | ) | | | (0.04 | ) | | | (0.05 | ) | | | (0.10 | ) | | | — | | | | — | |
Net realized gain | | | — | | | | — | | | | — | | | | — | | | | — | | | | (0.39 | ) |
| | | | |
Total dividends and distributions | | | (0.21 | ) | | | (0.04 | ) | | | (0.05 | ) | | | (0.10 | ) | | | — | | | | (0.39 | ) |
| | | | |
Net asset value, end of period | | $ | 14.52 | | | $ | 12.34 | | | $ | 9.61 | | | $ | 9.88 | | | $ | 9.46 | | | $ | 8.44 | |
| | | | |
| | | | | | | | | | | | | | | | | | | | | | | | |
| Total Investment Return3 | | | | | | | | | | | | | | | | | | | | | | | | |
Based on net asset value | | | 19.71 | % | | | 28.96 | % | | | (2.24 | )% | | | 5.50 | % | | | 12.09 | %4,5 | | | (39.38 | )% |
| | | | |
| | | | | | | | | | | | | | | | | | | | | | | | |
| Ratios to Average Net Assets6 | | | | | | | | | | | | | | | | | | | | | | | | |
Total expenses | | | 1.26 | %7 | | | 1.28 | %7 | | | 1.23 | %7 | | | 1.25 | % | | | 1.32 | %8 | | | 1.23 | % |
| | | | |
Total expenses after fees waived and/or reimbursed | | | 1.14 | %7 | | | 1.14 | %7 | | | 1.14 | %7 | | | 1.14 | % | | | 1.12 | %8 | | | 1.11 | % |
| | | | |
Net investment income | | | 0.65 | %7 | | | 1.04 | %7 | | | 0.48 | %7 | | | 0.47 | % | | | 0.93 | %8 | | | 0.32 | % |
| | | | |
| | | | | | | | | | | | | | | | | | | | | | | | |
| Supplemental Data | | | | | | | | | | | | | | | | | | | | | | | | |
Net assets, end of period (000) | | $ | 732,669 | | | $ | 696,484 | | | $ | 634,822 | | | $ | 973,066 | | | $ | 1,060,517 | | | $ | 1,023,005 | |
| | | | |
Portfolio turnover of the Portfolio | | | 50 | % | | | 128 | % | | | 129 | % | | | 173 | % | | | 168 | % | | | 109 | % |
| | | | |
| | 1 | Based on average shares outstanding. |
| | 2 | Dividends and distributions are determined in accordance with federal income tax regulations. |
| | 3 | Where applicable, total investment returns exclude the effects of any sales charges and assume the reinvestment of dividends and distributions. |
| | 4 | Includes proceeds received from a settlement of litigation, through its investment in the Portfolio, which impacted the Fund’s total investment return. Not including these proceeds, the total investment return would have been 11.73%. |
| | 5 | Aggregate total investment return. |
| | 6 | Includes the Fund’s share of the Portfolios’ allocated expenses and/or net investment income. |
| | 7 | Includes the Fund’s share of the Portfolio’s allocated fees waived of less than 0.01%. |
See Notes to Financial Statements.
| | | | | | |
| | | BLACKROCK LARGE CAP SERIES FUNDS, INC. | | SEPTEMBER 30, 2013 | | 25 |
| | | | |
| Financial Highlights (continued) | | | BlackRock Large Cap Core Fund | |
| | | | | | | | | | | | | | | | | | | | | | | | |
| | | Investor B | |
| | | Year Ended September 30, | | | Period November 1, 2008 to September 30, 2009 | | | Year Ended October 31, 2008 | |
| | | 2013 | | | 2012 | | | 2011 | | | 2010 | | | |
| Per Share Operating Performance | | | | | | | | | | | | | | | | | | | | | | | | |
Net asset value, beginning of period | | $ | 11.43 | | | $ | 8.93 | | | $ | 9.22 | | | $ | 8.82 | | | $ | 7.92 | | | $ | 13.57 | |
| | | | |
Net investment income (loss)1 | | | (0.02 | ) | | | 0.03 | | | | (0.04 | ) | | | (0.03 | ) | | | 0.01 | | | | (0.05 | ) |
Net realized and unrealized gain (loss) | | | 2.15 | | | | 2.47 | | | | (0.25 | ) | | | 0.45 | | | | 0.89 | | | | (5.23 | ) |
| | | | |
Net increase (decrease) from investment operations | | | 2.13 | | | | 2.50 | | | | (0.29 | ) | | | 0.42 | | | | 0.90 | | | | (5.28 | ) |
| | | | |
Dividends and distributions from:2 | | | | | | | | | | | | | | | | | | | | | | | | |
Net investment income | | | (0.04 | ) | | | — | | | | — | | | | (0.02 | ) | | | — | | | | — | |
Net realized gain | | | — | | | | — | | | | — | | | | — | | | | — | | | | (0.37 | ) |
| | | | |
Total dividends and distributions | | | (0.04 | ) | | | — | | | | — | | | | (0.02 | ) | | | — | | | | (0.37 | ) |
| | | | |
Net asset value, end of period | | $ | 13.52 | | | $ | 11.43 | | | $ | 8.93 | | | $ | 9.22 | | | $ | 8.82 | | | $ | 7.92 | |
| | | | |
| | | | | | | | | | | | | | | | | | | | | | | | |
| Total Investment Return3 | | | | | | | | | | | | | | | | | | | | | | | | |
Based on net asset value | | | 18.65 | % | | | 28.00 | % | | | (3.15 | )% | | | 4.71 | % | | | 11.36 | %4,5 | | | (39.90 | )% |
| | | | |
| | | | | | | | | | | | | | | | | | | | | | | | |
| Ratios to Average Net Assets6 | | | | | | | | | | | | | | | | | | | | | | | | |
Total expenses | | | 2.30 | %7 | | | 2.18 | %7 | | | 2.14 | %7 | | | 2.16 | % | | | 2.25 | %8 | | | 2.04 | % |
| | | | |
Total expenses after fees waived and/or reimbursed | | | 1.97 | %7 | | | 1.96 | %7 | | | 1.97 | %7 | | | 1.97 | % | | | 1.91 | %8 | | | 1.88 | % |
| | | | |
Net investment income (loss) | | | (0.15 | )%7 | | | 0.24 | %7 | | | (0.34 | )%7 | | | (0.35 | )% | | | 0.18 | %8 | | | (0.45 | )% |
| | | | |
| | | | | | | | | | | | | | | | | | | | | | | | |
| Supplemental Data | | | | | | | | | | | | | | | | | | | | | | | | |
Net assets, end of period (000) | | $ | 21,835 | | | $ | 33,719 | | | $ | 47,836 | | | $ | 78,876 | | | $ | 119,910 | | | $ | 180,730 | |
| | | | |
Portfolio turnover of the Portfolio | | | 50 | % | | | 128 | % | | | 129 | % | | | 173 | % | | | 168 | % | | | 109 | % |
| | | | |
| | 1 | Based on average shares outstanding. |
| | 2 | Dividends and distributions are determined in accordance with federal income tax regulations. |
| | 3 | Where applicable, total investment returns exclude the effects of any sales charges and assume the reinvestment of dividends and distributions. |
| | 4 | Includes proceeds received from a settlement of litigation, through its investment in the Portfolio, which impacted the Fund’s total investment return. Not including these proceeds, the total investment return would have been 10.86%. |
| | 5 | Aggregate total investment return. |
| | 6 | Includes the Fund’s share of the Portfolios’ allocated expenses and/or net investment income. |
| | 7 | Includes the Fund’s share of the Portfolio’s allocated fees waived of less than 0.01%. |
See Notes to Financial Statements.
| | | | | | |
| 26 | | BLACKROCK LARGE CAP SERIES FUNDS, INC. | | SEPTEMBER 30, 2013 | | |
| | | | |
| Financial Highlights (continued) | | | BlackRock Large Cap Core Fund | |
| | | | | | | | | | | | | | | | | | | | | | | | |
| | | Investor C | |
| | | Year Ended September 30, | | | Period
November 1, 2008 to
September 30, 2009 | | | Year Ended
October 31, 2008 | |
| | | |
| | | 2013 | | | 2012 | | | 2011 | | | 2010 | | | |
| Per Share Operating Performance | | | | | | | | | | | | | | | | | | | | | | | | |
Net asset value, beginning of period | | $ | 11.31 | | | $ | 8.85 | | | $ | 9.13 | | | $ | 8.76 | | | $ | 7.88 | | | $ | 13.51 | |
| | | | |
Net investment income (loss)1 | | | (0.03 | ) | | | 0.02 | | | | (0.04 | ) | | | (0.04 | ) | | | (0.00 | )2 | | | (0.06 | ) |
Net realized and unrealized gain (loss) | | | 2.12 | | | | 2.44 | | | | (0.24 | ) | | | 0.44 | | | | 0.88 | | | | (5.20 | ) |
| | | | |
Net increase (decrease) from investment operations | | | 2.09 | | | | 2.46 | | | | (0.28 | ) | | | 0.40 | | | | 0.88 | | | | (5.26 | ) |
| | | | |
Dividends and distributions from:3 | | | | | | | | | | | | | | | | | | | | | | | | |
Net investment income | | | (0.08 | ) | | | — | | | | — | | | | (0.03 | ) | | | — | | | | — | |
Net realized gain | | | — | | | | — | | | | — | | | | — | | | | — | | | | (0.37 | ) |
| | | | |
Total dividends and distributions | | | (0.08 | ) | | | — | | | | — | | | | (0.03 | ) | | | — | | | | (0.37 | ) |
| | | | |
Net asset value, end of period | | $ | 13.32 | | | $ | 11.31 | | | $ | 8.85 | | | $ | 9.13 | | | $ | 8.76 | | | $ | 7.88 | |
| | | | |
| | | | | | | | | | | | | | | | | | | | | | | | |
| Total Investment Return4 | | | | | | | | | | | | | | | | | | | | | | | | |
Based on net asset value | | | 18.62 | % | | | 27.80 | % | | | (3.07 | )% | | | 4.51 | % | | | 11.17 | %5,6 | | | (39.93 | )% |
| | | | |
| | | | | | | | | | | | | | | | | | | | | | | | |
| Ratios to Average Net Assets7 | | | | | | | | | | | | | | | | | | | | | | | | |
Total expenses | | | 2.01 | %8 | | | 1.97 | %8,9 | | | 2.00 | %8 | | | 2.02 | % | | | 2.09 | %10 | | | 1.97 | % |
| | | | |
Total expenses after fees waived and/or reimbursed | | | 2.01 | %8 | | | 1.97 | %8,9 | | | 2.00 | %8 | | | 2.02 | % | | | 2.09 | %10 | | | 1.97 | % |
| | | | |
Net investment income (loss) | | | (0.22 | )%8 | | | 0.22 | %8,9 | | | (0.38 | )%8 | | | (0.41 | )% | | | (0.03 | )%10 | | | (0.54 | )% |
| | | | |
| | | | | | | | | | | | | | | | | | | | | | | | |
| Supplemental Data | | | | | | | | | | | | | | | | | | | | | | | | |
Net assets, end of period (000) | | $ | 369,812 | | | $ | 363,613 | | | $ | 393,172 | | | $ | 594,396 | | | $ | 662,591 | | | $ | 714,368 | |
| | | | |
Portfolio turnover of the Portfolio | | | 50 | % | | | 128 | % | | | 129 | % | | | 173 | % | | | 168 | % | | | 109 | % |
| | | | |
| | 1 | Based on average shares outstanding. |
| | 2 | Amount is greater than $(0.005) per share. |
| | 3 | Dividends and distributions are determined in accordance with federal income tax regulations. |
| | 4 | Where applicable, total investment returns exclude the effects of any sales charges and assume the reinvestment of dividends and distributions. |
| | 5 | Includes proceeds received from a settlement of litigation, through its investment in the Portfolio, which impacted the Fund’s total investment return. Not including these proceeds, the total investment return would have been 10.66%. |
| | 6 | Aggregate total investment return. |
| | 7 | Includes the Fund’s share of the Portfolios’ allocated expenses and/or net investment income. |
| | 8 | Includes the Fund’s share of the Portfolio’s allocated fees waived of less than 0.01%. |
| | 9 | Includes a non-recurring expense adjustment, which impacted the ratios for total expenses, total expenses after fees waived and/or reimbursed and net investment income. Excluding this adjustment, the ratios would have been 2.05%, 2.05% and 0.14%, respectively. |
See Notes to Financial Statements.
| | | | | | |
| | | BLACKROCK LARGE CAP SERIES FUNDS, INC. | | SEPTEMBER 30, 2013 | | 27 |
| | | | |
| Financial Highlights (concluded) | | | BlackRock Large Cap Core Fund | |
| | | | | | | | | | | | | | | | | | | | | | | | |
| | | Class R | |
| | | Year Ended September 30, | | | Period
November 1,
2008 to
September 30, 2009 | | | Year Ended
October 31, 2008 | |
| | | 2013 | | | 2012 | | | 2011 | | | 2010 | | | |
| Per Share Operating Performance | | | | | | | | | | | | | | | | | | | | | | | | |
Net asset value, beginning of period | | $ | 11.81 | | | $ | 9.19 | | | $ | 9.46 | | | $ | 9.06 | | | $ | 8.11 | | | $ | 13.85 | |
| | | | |
Net investment income (loss)1 | | | 0.04 | | | | 0.07 | | | | 0.01 | | | | 0.01 | | | | 0.03 | | | | (0.01 | ) |
Net realized and unrealized gain (loss) | | | 2.21 | | | | 2.55 | | | | (0.26 | ) | | | 0.45 | | | | 0.92 | | | | (5.35 | ) |
| | | | |
Net increase (decrease) from investment operations | | | 2.25 | | | | 2.62 | | | | (0.25 | ) | | | 0.46 | | | | 0.95 | | | | (5.36 | ) |
| | | | |
Dividends and distributions from:2 | | | | | | | | | | | | | | | | | | | | | | | | |
Net investment income | | | (0.15 | ) | | | — | | | | (0.02 | ) | | | (0.06 | ) | | | — | | | | — | |
Net realized gain | | | — | | | | — | | | | — | | | | — | | | | — | | | | (0.38 | ) |
| | | | |
Total dividends and distributions | | | (0.15 | ) | | | — | | | | (0.02 | ) | | | (0.06 | ) | | | — | | | | (0.38 | ) |
| | | | |
Net asset value, end of period | | $ | 13.91 | | | $ | 11.81 | | | $ | 9.19 | | | $ | 9.46 | | | $ | 9.06 | | | $ | 8.11 | |
| | | | |
| | | | | | | | | | | | | | | | | | | | | | | | |
| Total Investment Return3 | | | | | | | | | | | | | | | | | | | | | | | | |
Based on net asset value | | | 19.26 | % | | | 28.51 | % | | | (2.68 | )% | | | 5.09 | % | | | 11.71 | %4,5 | | | (39.71 | )% |
| | | | |
| | | | | | | | | | | | | | | | | | | | | | | | |
| Ratios to Average Net Assets6 | | | | | | | | | | | | | | | | | | | | | | | | |
Total expenses | | | 1.48 | %7 | | | 1.53 | %7 | | | 1.51 | %7 | | | 1.54 | % | | | 1.61 | %8 | | | 1.54 | % |
| | | | |
Total expenses after fees waived and/or reimbursed | | | 1.48 | %7 | | | 1.53 | %7 | | | 1.51 | %7 | | | 1.54 | % | | | 1.61 | %8 | | | 1.54 | % |
| | | | |
Net investment income (loss) | | | 0.32 | %7 | | | 0.66 | %7 | | | 0.12 | %7 | | | 0.07 | % | | | 0.44 | %8 | | | (0.12 | )% |
| | | | |
| | | | | | | | | | | | | | | | | | | | | | | | |
| Supplemental Data | | | | | | | | | | | | | | | | | | | | | | | | |
Net assets, end of period (000) | | $ | 44,330 | | | $ | 48,790 | | | $ | 49,665 | | | $ | 80,950 | | | $ | 95,098 | | | $ | 97,139 | |
| | | | |
Portfolio turnover of the Portfolio | | | 50 | % | | | 128 | % | | | 129 | % | | | 173 | % | | | 168 | % | | | 109 | % |
| | | | |
| | 1 | Based on average shares outstanding. |
| | 2 | Dividends and distributions are determined in accordance with federal income tax regulations. |
| | 3 | Where applicable, total investment returns assume the reinvestment of dividends and distributions. |
| | 4 | Includes proceeds received from a settlement of litigation, through its investment in the Portfolio, which impacted the Fund’s total investment return. Not including these proceeds, the total investment return would have been 11.22%. |
| | 5 | Aggregate total investment return. |
| | 6 | Includes the Fund’s share of the Portfolios’ allocated expenses and/or net investment income. |
| | 7 | Includes the Fund’s share of the Portfolio’s allocated fees waived of less than 0.01%. |
See Notes to Financial Statements.
| | | | | | |
| 28 | | BLACKROCK LARGE CAP SERIES FUNDS, INC. | | SEPTEMBER 30, 2013 | | |
| | | | |
| Financial Highlights | | | BlackRock Large Cap Growth Fund | |
| | | | | | | | | | | | | | | | | | | | | | | | |
| | | Institutional | |
| | | Year Ended September 30, | | | Period
November 1,
2008 to
September 30, 2009 | | | Year Ended
October 31, 2008 | |
| | | 2013 | | | 2012 | | | 2011 | | | 2010 | | | |
| Per Share Operating Performance | | | | | | | | | | | | | | | | | | | | | | | | |
Net asset value, beginning of period | | $ | 12.50 | | | $ | 9.57 | | | $ | 9.54 | | | $ | 8.92 | | | $ | 7.43 | | | $ | 12.40 | |
| | | | |
Net investment income1 | | | 0.10 | | | | 0.14 | | | | 0.06 | | | | 0.03 | | | | 0.02 | | | | 0.02 | |
Net realized and unrealized gain (loss) | | | 1.65 | | | | 2.83 | | | | (0.03 | ) | | | 0.62 | | | | 1.47 | | | | (4.67 | ) |
| | | | |
Net increase (decrease) from investment operations | | | 1.75 | | | | 2.97 | | | | 0.03 | | | | 0.65 | | | | 1.49 | | | | (4.65 | ) |
| | | | |
Dividends and distributions from:2 | | | | | | | | | | | | | | | | | | | | | | | | |
Net investment income | | | (0.24 | ) | | | (0.04 | ) | | | — | | | | (0.03 | ) | | | — | | | | — | |
Net realized gain | | | (0.69 | ) | | | — | | | | — | | | | — | | | | — | | | | (0.32 | ) |
| | | | |
Total dividends and distributions | | | (0.93 | ) | | | (0.04 | ) | | | — | | | | (0.03 | ) | | | — | | | | (0.32 | ) |
| | | | |
Net asset value, end of period | | $ | 13.32 | | | $ | 12.50 | | | $ | 9.57 | | | $ | 9.54 | | | $ | 8.92 | | | $ | 7.43 | |
| | | | |
| | | | | | | | | | | | | | | | | | | | | | | | |
| Total Investment Return3 | | | | | | | | | | | | | | | | | | | | | | | | |
Based on net asset value | | | 15.33 | % | | | 31.16 | % | | | 0.31 | % | | | 7.25 | % | | | 20.05 | %4,5 | | | (38.41 | )% |
| | | | |
| | | | | | | | | | | | | | | | | | | | | | | | |
| Ratios to Average Net Assets6 | | | | | | | | | | | | | | | | | | | | | | | | |
Total expenses | | | 0.96 | %7 | | | 0.97 | %7 | | | 0.96 | %7 | | | 1.01 | % | | | 1.07 | %8 | | | 0.96 | % |
| | | | |
Net investment income | | | 0.81 | %7 | | | 1.19 | %7 | | | 0.52 | %7 | | | 0.28 | % | | | 0.35 | %8 | | | 0.21 | % |
| | | | |
| | | | | | | | | | | | | | | | | | | | | | | | |
| Supplemental Data | | | | | | | | | | | | | | | | | | | | | | | | |
Net assets, end of period (000) | | $ | 311,127 | | | $ | 267,083 | | | $ | 300,111 | | | $ | 66,857 | | | $ | 87,078 | | | $ | 118,873 | |
| | | | |
Portfolio turnover of the Portfolio | | | 54 | % | | | 132 | % | | | 169 | % | | | 232 | % | | | 242 | % | | | 144 | % |
| | | | |
| | 1 | Based on average shares outstanding. |
| | 2 | Dividends and distributions are determined in accordance with federal income tax regulations. |
| | 3 | Where applicable, total investment returns assume the reinvestment of dividends and distributions. |
| | 4 | Includes proceeds received from a settlement of litigation, through its investment in the Portfolio, which impacted the Fund’s total investment return. Not including these proceeds, the total investment return would have been 19.79%. |
| | 5 | Aggregate total investment return. |
| | 6 | Includes the Fund’s share of the Portfolios’ allocated expenses and/or net investment income. |
| | 7 | Includes the Fund’s share of the Portfolio’s allocated fees waived of less than 0.01%. |
See Notes to Financial Statements.
| | | | | | |
| | | BLACKROCK LARGE CAP SERIES FUNDS, INC. | | SEPTEMBER 30, 2013 | | 29 |
| | | | |
| Financial Highlights (continued) | | | BlackRock Large Cap Growth Fund | |
| | | | | | | | | | | | | | | | | | | | | | | | |
| | | Service | |
| | | Year Ended September 30, | | | Period
November 1,
2008 to
September 30, 2009 | | | Year Ended
October 31, 2008 | |
| | | 2013 | | | 2012 | | | 2011 | | | 2010 | | | |
| Per Share Operating Performance | | | | | | | | | | | | | | | | | | | | | | | | |
Net asset value, beginning of period | | $ | 12.38 | | | $ | 9.48 | | | $ | 9.47 | | | $ | 8.87 | | | $ | 7.39 | | | $ | 12.37 | |
| | | | |
Net investment income (loss)1 | | | 0.07 | | | | 0.09 | | | | 0.03 | | | | 0.01 | | | | 0.01 | | | | (0.01 | ) |
Net realized and unrealized gain (loss) | | | 1.62 | | | | 2.82 | | | | (0.02 | ) | | | 0.61 | | | | 1.47 | | | | (4.65 | ) |
| | | | |
Net increase (decrease) from investment operations | | | 1.69 | | | | 2.91 | | | | 0.01 | | | | 0.62 | | | | 1.48 | | | | (4.66 | ) |
| | | | |
Dividends and distributions from:2 | | | | | | | | | | | | | | | | | | | | | | | | |
Net investment income | | | (0.20 | ) | | | (0.01 | ) | | | — | | | | (0.02 | ) | | | — | | | | — | |
Net realized gain | | | (0.69 | ) | | | — | | | | — | | | | — | | | | — | | | | (0.32 | ) |
| | | | |
Total dividends and distributions | | | (0.89 | ) | | | (0.01 | ) | | | — | | | | (0.02 | ) | | | — | | | | (0.32 | ) |
| | | | |
Net asset value, end of period | | $ | 13.18 | | | $ | 12.38 | | | $ | 9.48 | | | $ | 9.47 | | | $ | 8.87 | | | $ | 7.39 | |
| | | | |
| | | | | | | | | | | | | | | | | | | | | | | | |
| Total Investment Return3 | | | | | | | | | | | | | | | | | | | | | | | | |
Based on net asset value | | | 14.98 | % | | | 30.67 | % | | | 0.11 | % | | | 6.97 | % | | | 20.03 | %4,5 | | | (38.59 | )% |
| | | | |
| | | | | | | | | | | | | | | | | | | | | | | | |
| Ratios to Average Net Assets6 | | | | | | | | | | | | | | | | | | | | | | | | |
Total expenses | | | 1.23 | %7 | | | 1.33 | %7 | | | 1.16 | %7 | | | 1.22 | % | | | 1.22 | %8 | | | 1.14 | % |
| | | | |
Net investment income (loss) | | | 0.62 | %7 | | | 0.81 | %7 | | | 0.29 | %7 | | | 0.07 | % | | | 0.16 | %8 | | | (0.07 | )% |
| | | | |
| | | | | | | | | | | | | | | | | | | | | | | | |
| Supplemental Data | | | | | | | | | | | | | | | | | | | | | | | | |
Net assets, end of period (000) | | $ | 1,624 | | | $ | 11,865 | | | $ | 10,734 | | | $ | 11,299 | | | $ | 11,392 | | | $ | 10,218 | |
| | | | |
Portfolio turnover of the Portfolio | | | 54 | % | | | 132 | % | | | 169 | % | | | 232 | % | | | 242 | % | | | 144 | % |
| | | | |
| | 1 | Based on average shares outstanding. |
| | 2 | Dividends and distributions are determined in accordance with federal income tax regulations. |
| | 3 | Where applicable, total investment returns assume the reinvestment of dividends and distributions. |
| | 4 | Includes proceeds received from a settlement of litigation, through its investment in the Portfolio, which impacted the Fund’s total investment return. Not including these proceeds, the total investment return would have been 19.62%. |
| | 5 | Aggregate total investment return. |
| | 6 | Includes the Fund’s share of the Portfolios’ allocated expenses and/or net investment income. |
| | 7 | Includes the Fund’s share of the Portfolio’s allocated fees waived of less than 0.01%. |
See Notes to Financial Statements.
| | | | | | |
| 30 | | BLACKROCK LARGE CAP SERIES FUNDS, INC. | | SEPTEMBER 30, 2013 | | |
| | | | |
| Financial Highlights (continued) | | | BlackRock Large Cap Growth Fund | |
| | | | | | | | | | | | | | | | | | | | | | | | |
| | | Investor A | |
| | | Year Ended September 30, | | | Period
November 1,
2008 to
September 30, 2009 | | | Year Ended
October 31, 2008 | |
| | | 2013 | | | 2012 | | | 2011 | | | 2010 | | | |
| Per Share Operating Performance | | | | | | | | | | | | | | | | | | | | | | | | |
Net asset value, beginning of period | | $ | 12.09 | | | $ | 9.26 | | | $ | 9.26 | | | $ | 8.68 | | | $ | 7.24 | | | $ | 12.15 | |
| | | | |
Net investment income (loss)1 | | | 0.06 | | | | 0.10 | | | | 0.02 | | | | (0.00 | )2 | | | (0.00 | )2 | | | (0.02 | ) |
Net realized and unrealized gain (loss) | | | 1.58 | | | | 2.75 | | | | (0.02 | ) | | | 0.60 | | | | 1.44 | | | | (4.57 | ) |
| | | | |
Net increase (decrease) from investment operations | | | 1.64 | | | | 2.85 | | | | — | | | | 0.60 | | | | 1.44 | | | | (4.59 | ) |
| | | | |
Dividends and distributions from:3 | | | | | | | | | | | | | | | | | | | | | | | | |
Net investment income | | | (0.22 | ) | | | (0.02 | ) | | | — | | | | (0.02 | ) | | | — | | | | — | |
Net realized gain | | | (0.69 | ) | | | — | | | | — | | | | — | | | | — | | | | (0.32 | ) |
| | | | |
Total dividends and distributions | | | (0.91 | ) | | | (0.02 | ) | | | — | | | | (0.02 | ) | | | — | | | | (0.32 | ) |
| | | | |
Net asset value, end of period | | $ | 12.82 | | | $ | 12.09 | | | $ | 9.26 | | | $ | 9.26 | | | $ | 8.68 | | | $ | 7.24 | |
| | | | |
| | | | | | | | | | | | | | | | | | | | | | | | |
| Total Investment Return4 | | | | | | | | | | | | | | | | | | | | | | | | |
Based on net asset value | | | 14.90 | % | | | 30.78 | % | | | 0.00 | % | | | 6.86 | % | | | 19.89 | %5,6 | | | (38.72 | )% |
| | | | |
| | | | | | | | | | | | | | | | | | | | | | | | |
| Ratios to Average Net Assets7 | | | | | | | | | | | | | | | | | | | | | | | | |
Total expenses | | | 1.25 | %8 | | | 1.26 | %8 | | | 1.27 | %8 | | | 1.31 | % | | | 1.39 | %9 | | | 1.31 | % |
| | | | |
Net investment income (loss) | | | 0.54 | %8 | | | 0.90 | %8 | | | 0.21 | %8 | | | (0.01 | )% | | | (0.02 | )%9 | | | (0.21 | )% |
| | | | |
| | | | | | | | | | | | | | | | | | | | | | | | |
| Supplemental Data | | | | | | | | | | | | | | | | | | | | | | | | |
Net assets, end of period (000) | | $ | 449,729 | | | $ | 405,154 | | | $ | 318,230 | | | $ | 254,354 | | | $ | 267,606 | | | $ | 179,528 | |
| | | | |
Portfolio turnover of the Portfolio | | | 54 | % | | | 132 | % | | | 169 | % | | | 232 | % | | | 242 | % | | | 144 | % |
| | | | |
| | 1 | Based on average shares outstanding. |
| | 2 | Amount is greater than $(0.005) per share. |
| | 3 | Dividends and distributions are determined in accordance with federal income tax regulations. |
| | 4 | Where applicable, total investment returns exclude the effects of any sales charges and assume the reinvestment of dividends and distributions. |
| | 5 | Includes proceeds received from a settlement of litigation, through its investment in the Portfolio, which impacted the Fund’s total investment return. Not including these proceeds, the total investment return would have been 19.47%. |
| | 6 | Aggregate total investment return. |
| | 7 | Includes the Fund’s share of the Portfolios’ allocated expenses and/or net investment income. |
| | 8 | Includes the Fund’s share of the Portfolio’s allocated fees waived of less than 0.01%. |
See Notes to Financial Statements.
| | | | | | |
| | | BLACKROCK LARGE CAP SERIES FUNDS, INC. | | SEPTEMBER 30, 2013 | | 31 |
| | | | |
| Financial Highlights (continued) | | | BlackRock Large Cap Growth Fund | |
| | | | | | | | | | | | | | | | | | | | | | | | |
| | | Investor B | |
| | | Year Ended September 30, | | | Period
November 1,
2008 to
September 30, 2009 | | | Year Ended
October 31, 2008 | |
| | | 2013 | | | 2012 | | | 2011 | | | 2010 | | | |
| Per Share Operating Performance | | | | | | | | | | | | | | | | | | | | | | | | |
Net asset value, beginning of period | | $ | 10.96 | | | $ | 8.45 | | | $ | 8.52 | | | $ | 8.03 | | | $ | 6.75 | | | $ | 11.43 | |
| | | | |
Net investment loss1 | | | (0.03 | ) | | | (0.00 | )2 | | | (0.06 | ) | | | (0.07 | ) | | | (0.05 | ) | | | (0.09 | ) |
Net realized and unrealized gain (loss) | | | 1.42 | | | | 2.51 | | | | (0.01 | ) | | | 0.56 | | | | 1.33 | | | | (4.27 | ) |
| | | | |
Net increase (decrease) from investment operations | | | 1.39 | | | | 2.51 | | | | (0.07 | ) | | | 0.49 | | | | 1.28 | | | | (4.36 | ) |
| | | | |
Dividends and distributions from:3 | | | | | | | | | | | | | | | | | | | | | | | | |
Net investment income | | | (0.10 | ) | | | — | | | | — | | | | — | | | | — | | | | — | |
Net realized gain | | | (0.69 | ) | | | — | | | | — | | | | — | | | | — | | | | (0.32 | ) |
| | | | |
Total dividends and distributions | | | (0.79 | ) | | | — | | | | — | | | | — | | | | — | | | | (0.32 | ) |
| | | | |
Net asset value, end of period | | $ | 11.56 | | | $ | 10.96 | | | $ | 8.45 | | | $ | 8.52 | | | $ | 8.03 | | | $ | 6.75 | |
| | | | |
| | | | | | | | | | | | | | | | | | | | | | | | |
| Total Investment Return4 | | | | | | | | | | | | | | | | | | | | | | | | |
Based on net asset value | | | 13.92 | % | | | 29.70 | % | | | (0.82 | )% | | | 6.10 | % | | | 18.96 | %5,6 | | | (39.15 | )% |
| | | | |
| | | | | | | | | | | | | | | | | | | | | | | | |
| Ratios to Average Net Assets7 | | | | | | | | | | | | | | | | | | | | | | | | |
Total expenses | | | 2.14 | %8 | | | 2.13 | %8 | | | 2.08 | %8 | | | 2.11 | % | | | 2.17 | %9 | | | 2.05 | % |
| | | | |
Net investment loss | | | (0.30 | )%8 | | | (0.01 | )%8 | | | (0.61 | )%8 | | | (0.81 | )% | | | (0.75 | )%9 | | | (0.93 | )% |
| | | | |
| | | | | | | | | | | | | | | | | | | | | | | | |
| Supplemental Data | | | | | | | | | | | | | | | | | | | | | | | | |
Net assets, end of period (000) | | $ | 4,656 | | | $ | 7,826 | | | $ | 10,372 | | | $ | 14,937 | | | $ | 26,959 | | | $ | 39,608 | |
| | | | |
Portfolio turnover of the Portfolio | | | 54 | % | | | 132 | % | | | 169 | % | | | 232 | % | | | 242 | % | | | 144 | % |
| | | | |
| | 1 | Based on average shares outstanding. |
| | 2 | Amount is greater than $(0.005) per share. |
| | 3 | Dividends and distributions are determined in accordance with federal income tax regulations. |
| | 4 | Where applicable, total investment returns exclude the effects of any sales charges and assume the reinvestment of dividends and distributions. |
| | 5 | Includes proceeds received from a settlement of litigation, through its investment in the Portfolio, which impacted the Fund’s total investment return. Not including these proceeds, the total investment return would have been 18.66%. |
| | 6 | Aggregate total investment return. |
| | 7 | Includes the Fund’s share of the Portfolios’ allocated expenses and/or net investment income. |
| | 8 | Includes the Fund’s share of the Portfolio’s allocated fees waived of less than 0.01%. |
See Notes to Financial Statements.
| | | | | | |
| 32 | | BLACKROCK LARGE CAP SERIES FUNDS, INC. | | SEPTEMBER 30, 2013 | | |
| | | | |
| Financial Highlights (continued) | | | BlackRock Large Cap Growth Fund | |
| | | | | | | | | | | | | | | | | | | | | | | | |
| | | Investor C | |
| | | Year Ended September 30, | | | Period
November 1,
2008 to
September 30, 2009 | | | Year Ended
October 31, 2008 | |
| | | 2013 | | | 2012 | | | 2011 | | | 2010 | | | |
| Per Share Operating Performance | | | | | | | | | | | | | | | | | | | | | | | | |
Net asset value, beginning of period | | $ | 10.95 | | | $ | 8.44 | | | $ | 8.51 | | | $ | 8.03 | | | $ | 6.75 | | | $ | 11.42 | |
| | | | |
Net investment income (loss)1 | | | (0.03 | ) | | | 0.01 | | | | (0.06 | ) | | | (0.07 | ) | | | (0.05 | ) | | | (0.09 | ) |
Net realized and unrealized gain (loss) | | | 1.42 | | | | 2.50 | | | | (0.01 | ) | | | 0.55 | | | | 1.33 | | | | (4.26 | ) |
| | | | |
Net increase (decrease) from investment operations | | | 1.39 | | | | 2.51 | | | | (0.07 | ) | | | 0.48 | | | | 1.28 | | | | (4.35 | ) |
| | | | |
Dividends and distributions from:2 | | | | | | | | | | | | | | | | | | | | | | | | |
Net investment income | | | (0.13 | ) | | | — | | | | — | | | | — | | | | — | | | | — | |
Net realized gain | | | (0.69 | ) | | | — | | | | — | | | | — | | | | — | | | | (0.32 | ) |
| | | | |
Total dividends and distributions | | | (0.82 | ) | | | — | | | | — | | | | — | | | | — | | | | (0.32 | ) |
| | | | |
Net asset value, end of period | | $ | 11.52 | | | $ | 10.95 | | | $ | 8.44 | | | $ | 8.51 | | | $ | 8.03 | | | $ | 6.75 | |
| | | | |
| | | | | | | | | | | | | | | | | | | | | | | | |
| Total Investment Return3 | | | | | | | | | | | | | | | | | | | | | | | | |
Based on net asset value | | | 14.02 | % | | | 29.74 | % | | | (0.82 | )% | | | 5.98 | % | | | 18.96 | %4,5 | | | (39.10 | )% |
| | | | |
| | | | | | | | | | | | | | | | | | | | | | | | |
| Ratios to Average Net Assets6 | | | | | | | | | | | | | | | | | | | | | | | | |
Total expenses | | | 2.04 | %7 | | | 2.07 | %7 | | | 2.05 | %7 | | | 2.12 | % | | | 2.20 | %8 | | | 2.05 | % |
| | | | |
Net investment income (loss) | | | (0.24 | )%7 | | | 0.09 | %7 | | | (0.60 | )%7 | | | (0.82 | )% | | | (0.81 | )%8 | | | (0.95 | )% |
| | | | |
| | | | | | | | | | | | | | | | | | | | | | | | |
| Supplemental Data | | | | | | | | | | | | | | | | | | | | | | | | |
Net assets, end of period (000) | | $ | 171,430 | | | $ | 167,518 | | | $ | 129,227 | | | $ | 121,936 | | | $ | 142,215 | | | $ | 143,081 | |
| | | | |
Portfolio turnover of the Portfolio | | | 54 | % | | | 132 | % | | | 169 | % | | | 232 | % | | | 242 | % | | | 144 | % |
| | | | |
| | 1 | Based on average shares outstanding. |
| | 2 | Dividends and distributions are determined in accordance with federal income tax regulations. |
| | 3 | Where applicable, total investment returns exclude the effects of any sales charges and assume the reinvestment of dividends and distributions. |
| | 4 | Includes proceeds received from a settlement of litigation, through its investment in the Portfolio, which impacted the Fund’s total investment return. Not including these proceeds, the total investment return would have been 18.52%. |
| | 5 | Aggregate total investment return. |
| | 6 | Includes the Fund’s share of the Portfolios’ allocated expenses and/or net investment income. |
| | 7 | Includes the Fund’s share of the Portfolio’s allocated fees waived of less than 0.01%. |
See Notes to Financial Statements.
| | | | | | |
| | | BLACKROCK LARGE CAP SERIES FUNDS, INC. | | SEPTEMBER 30, 2013 | | 33 |
| | | | |
| Financial Highlights (concluded) | | | BlackRock Large Cap Growth Fund | |
| | | | | | | | | | | | | | | | | | | | | | | | |
| | | Class R | |
| | | Year Ended September 30, | | | Period
November 1,
2008 to
September 30, 2009 | | | Year Ended
October 31, 2008 | |
| | | 2013 | | | 2012 | | | 2011 | | | 2010 | | | |
| Per Share Operating Performance | | | | | | | | | | | | | | | | | | | | | | | | |
Net asset value, beginning of period | | $ | 11.58 | | | $ | 8.88 | | | $ | 8.91 | | | $ | 8.36 | | | $ | 7.00 | | | $ | 11.79 | |
| | | | |
Net investment income (loss)1 | | | 0.03 | | | | 0.06 | | | | (0.01 | ) | | | (0.03 | ) | | | (0.02 | ) | | | (0.05 | ) |
Net realized and unrealized gain (loss) | | | 1.51 | | | | 2.64 | | | | (0.02 | ) | | | 0.58 | | | | 1.38 | | | | (4.42 | ) |
| | | | |
Net increase (decrease) from investment operations | | | 1.54 | | | | 2.70 | | | | (0.03 | ) | | | 0.55 | | | | 1.36 | | | | (4.47 | ) |
| | | | |
Dividends and distributions from:2 | | | | | | | | | | | | | | | | | | | | | | | | |
Net investment income | | | (0.18 | ) | | | — | | | | — | | | | — | | | | — | | | | — | |
Net realized gain | | | (0.69 | ) | | | — | | | | — | | | | — | | | | — | | | | (0.32 | ) |
| | | | |
Total dividends and distributions | | | (0.87 | ) | | | — | | | | — | | | | — | | | | — | | | | (0.32 | ) |
| | | | |
Net asset value, end of period | | $ | 12.25 | | | $ | 11.58 | | | $ | 8.88 | | | $ | 8.91 | | | $ | 8.36 | | | $ | 7.00 | |
| | | | |
| | | | | | | | | | | | | | | | | | | | | | | | |
| Total Investment Return3 | | | | | | | | | | | | | | | | | | | | | | | | |
Based on net asset value | | | 14.61 | % | | | 30.41 | % | | | (0.34 | )% | | | 6.58 | % | | | 19.43 | %4,5 | | | (38.88 | )% |
| | | | |
| | | | | | | | | | | | | | | | | | | | | | | | |
| Ratios to Average Net Assets6 | | | | | | | | | | | | | | | | | | | | | | | | |
Total expenses | | | 1.54 | %7 | | | 1.56 | %7 | | | 1.60 | %7 | | | 1.65 | % | | | 1.76 | %8 | | | 1.64 | % |
| | | | |
Net investment income (loss) | | | 0.27 | %7 | | | 0.57 | %7 | | | (0.12 | )%7 | | | (0.35 | )% | | | (0.37 | )%8 | | | (0.53 | )% |
| | | | |
| | | | | | | | | | | | | | | | | | | | | | | | |
| Supplemental Data | | | | | | | | | | | | | | | | | | | | | | | | |
Net assets, end of period (000) | | $ | 24,408 | | | $ | 30,101 | | | $ | 30,868 | | | $ | 50,093 | | | $ | 62,231 | | | $ | 55,073 | |
| | | | |
Portfolio turnover of the Portfolio | | | 54 | % | | | 132 | % | | | 169 | % | | | 232 | % | | | 242 | % | | | 144 | % |
| | | | |
| | 1 | Based on average shares outstanding. |
| | 2 | Dividends and distributions are determined in accordance with federal income tax regulations. |
| | 3 | Where applicable, total investment returns assume the reinvestment of dividends and distributions. |
| | 4 | Includes proceeds received from a settlement of litigation, through its investment in the Portfolio, which impacted the Fund’s total investment return. Not including these proceeds, the total investment return would have been 19.15%. |
| | 5 | Aggregate total investment return. |
| | 6 | Includes the Fund’s share of the Portfolios’ allocated expenses and/or net investment income. |
| | 7 | Includes the Fund’s share of the Portfolio’s allocated fees waived of less than 0.01%. |
See Notes to Financial Statements.
| | | | | | |
| 34 | | BLACKROCK LARGE CAP SERIES FUNDS, INC. | | SEPTEMBER 30, 2013 | | |
| | | | |
| Financial Highlights | | | BlackRock Large Cap Value Fund | |
| | | | | | | | | | | | | | | | | | | | | | | | |
| | | Institutional | |
| | | Year Ended September 30, | | | Period
November 1,
2008 to
September 30, 2009 | | | Year Ended
October 31, 2008 | |
| | | 2013 | | | 2012 | | | 2011 | | | 2010 | | | |
| Per Share Operating Performance | | | | | | | | | | | | | | | | | | | | | | | | |
Net asset value, beginning of period | | $ | 15.75 | | | $ | 12.74 | | | $ | 13.51 | | | $ | 13.16 | | | $ | 12.29 | | | $ | 20.95 | |
| | | | |
Net investment income1 | | | 0.21 | | | | 0.20 | | | | 0.12 | | | | 0.11 | | | | 0.14 | | | | 0.14 | |
Net realized and unrealized gain (loss) | | | 3.25 | | | | 2.94 | | | | (0.75 | ) | | | 0.40 | | | | 0.90 | | | | (7.42 | ) |
| | | | |
Net increase (decrease) from investment operations | | | 3.46 | | | | 3.14 | | | | (0.63 | ) | | | 0.51 | | | | 1.04 | | | | (7.28 | ) |
| | | | |
Dividends and distributions from:2 | | | | | | | | | | | | | | | | | | | | | | | | |
Net investment income | | | (0.36 | ) | | | (0.13 | ) | | | (0.14 | ) | | | (0.16 | ) | | | (0.17 | ) | | | (0.05 | ) |
Net realized gain | | | — | | | | — | | | | — | | | | — | | | | — | | | | (1.33 | ) |
| | | | |
Total dividends and distributions | | | (0.36 | ) | | | (0.13 | ) | | | (0.14 | ) | | | (0.16 | ) | | | (0.17 | ) | | | (1.38 | ) |
| | | | |
Net asset value, end of period | | $ | 18.85 | | | $ | 15.75 | | | $ | 12.74 | | | $ | 13.51 | | | $ | 13.16 | | | $ | 12.29 | |
| | | | |
| | | | | | | | | | | | | | | | | | | | | | | | |
| Total Investment Return3 | | | | | | | | | | | | | | | | | | | | | | | | |
Based on net asset value | | | 22.38 | % | | | 24.84 | % | | | (4.82 | )% | | | 3.88 | % | | | 8.60 | %4,5 | | | (37.01 | )% |
| | | | |
| | | | | | | | | | | | | | | | | | | | | | | | |
| Ratios to Average Net Assets6 | | | | | | | | | | | | | | | | | | | | | | | | |
Total expenses | | | 1.00 | %7 | | | 0.96 | % | | | 1.03 | % | | | 1.03 | % | | | 1.05 | %8 | | | 0.93 | % |
| | | | |
Total expenses after fees waived and/or reimbursed | | | 0.94 | %7 | | | 0.95 | % | | | 1.03 | % | | | 1.03 | % | | | 1.05 | %8 | | | 0.93 | % |
| | | | |
Net investment income | | | 1.19 | %7 | | | 1.33 | % | | | 0.81 | % | | | 0.85 | % | | | 1.35 | %8 | | | 0.81 | % |
| | | | |
| | | | | | | | | | | | | | | | | | | | | | | | |
| Supplemental Data | | | | | | | | | | | | | | | | | | | | | | | | |
Net assets, end of period (000) | | $ | 190,423 | | | $ | 251,764 | | | $ | 364,624 | | | $ | 737,610 | | | $ | 869,863 | | | $ | 867,750 | |
| | | | |
Portfolio turnover of the Portfolio | | | 40 | % | | | 147 | % | | | 156 | % | | | 183 | % | | | 151 | % | | | 108 | % |
| | | | |
| | 1 | Based on average shares outstanding. |
| | 2 | Dividends and distributions are determined in accordance with federal income tax regulations. |
| | 3 | Where applicable, total investment returns assume the reinvestment of dividends and distributions. |
| | 4 | Includes proceeds received from a settlement of litigation, through its investment in the Portfolio, which impacted the Fund’s total investment return. Not including these proceeds, the total investment return would have been 8.18%. |
| | 5 | Aggregate total investment return. |
| | 6 | Includes the Fund’s share of the Portfolios’ allocated expenses and/or net investment income. |
| | 7 | Includes the Fund’s share of the Portfolio’s allocated fees waived of less than 0.01%. |
See Notes to Financial Statements.
| | | | | | |
| | | BLACKROCK LARGE CAP SERIES FUNDS, INC. | | SEPTEMBER 30, 2013 | | 35 |
| | | | |
| Financial Highlights (continued) | | | BlackRock Large Cap Value Fund | |
| | | | | | | | | | | | | | | | | | | | | | | | |
| | | Service | |
| | | Year Ended September 30, | | | Period
November 1,
2008 to
September 30, 2009 | | | Year Ended
October 31, 2008 | |
| | | 2013 | | | 2012 | | | 2011 | | | 2010 | | | |
| Per Share Operating Performance | | | | | | | | | | | | | | | | | | | | | | | | |
Net asset value, beginning of period | | $ | 15.67 | | | $ | 12.71 | | | $ | 13.48 | | | $ | 13.13 | | | $ | 12.26 | | | $ | 20.89 | |
| | | | |
Net investment income1 | | | 0.16 | | | | 0.15 | | | | 0.10 | | | | 0.09 | | | | 0.12 | | | | 0.10 | |
Net realized and unrealized gain (loss) | | | 3.23 | | | | 2.94 | | | | (0.75 | ) | | | 0.40 | | | | 0.89 | | | | (7.38 | ) |
| | | | |
Net increase (decrease) from investment operations | | | 3.39 | | | | 3.09 | | | | (0.65 | ) | | | 0.49 | | | | 1.01 | | | | (7.28 | ) |
| | | | |
Dividends and distributions from:2 | | | | | | | | | | | | | | | | | | | | | | | | |
Net investment income | | | (0.31 | ) | | | (0.13 | ) | | | (0.12 | ) | | | (0.14 | ) | | | (0.14 | ) | | | (0.02 | ) |
Net realized gain | | | — | | | | — | | | | — | | | | — | | | | — | | | | (1.33 | ) |
| | | | |
Total dividends and distributions | | | (0.31 | ) | | | (0.13 | ) | | | (0.12 | ) | | | (0.14 | ) | | | (0.14 | ) | | | (1.35 | ) |
| | | | |
Net asset value, end of period | | $ | 18.75 | | | $ | 15.67 | | | $ | 12.71 | | | $ | 13.48 | | | $ | 13.13 | | | $ | 12.26 | |
| | | | |
| | | | | | | | | | | | | | | | | | | | | | | | |
| Total Investment Return3 | | | | | | | | | | | | | | | | | | | | | | | | |
Based on net asset value | | | 21.98 | % | | | 24.43 | % | | | (4.95 | )% | | | 3.75 | % | | | 8.37 | %4,5 | | | (37.10 | )% |
| | | | |
| | | | | | | | | | | | | | | | | | | | | | | | |
| Ratios to Average Net Assets6 | | | | | | | | | | | | | | | | | | | | | | | | |
Total expenses | | | 1.23 | %7 | | | 1.27 | % | | | 1.17 | % | | | 1.18 | % | | | 1.22 | %8 | | | 1.12 | % |
| | | | |
Total expenses after fees waived and/or reimbursed | | | 1.18 | %7 | | | 1.25 | % | | | 1.17 | % | | | 1.18 | % | | | 1.22 | %8 | | | 1.12 | % |
| | | | |
Net investment income | | | 0.93 | %7 | | | 0.99 | % | | | 0.64 | % | | | 0.70 | % | | | 1.16 | %8 | | | 0.62 | % |
| | | | |
| | | | | | | | | | | | | | | | | | | | | | | | |
| Supplemental Data | | | | | | | | | | | | | | | | | | | | | | | | |
Net assets, end of period (000) | | $ | 13,296 | | | $ | 28,746 | | | $ | 29,586 | | | $ | 30,564 | | | $ | 29,033 | | | $ | 24,717 | |
| | | | |
Portfolio turnover of the Portfolio | | | 40 | % | | | 147 | % | | | 156 | % | | | 183 | % | | | 151 | % | | | 108 | % |
| | | | |
| | 1 | Based on average shares outstanding. |
| | 2 | Dividends and distributions are determined in accordance with federal income tax regulations. |
| | 3 | Where applicable, total investment returns assume the reinvestment of dividends and distributions. |
| | 4 | Includes proceeds received from a settlement of litigation, through its investment in the Portfolio, which impacted the Fund’s total investment return. Not including these proceeds, the total investment return would have been 7.96%. |
| | 5 | Aggregate total investment return. |
| | 6 | Includes the Fund’s share of the Portfolios’ allocated expenses and/or net investment income. |
| | 7 | Includes the Fund’s share of the Portfolio’s allocated fees waived of less than 0.01%. |
See Notes to Financial Statements.
| | | | | | |
| 36 | | BLACKROCK LARGE CAP SERIES FUNDS, INC. | | SEPTEMBER 30, 2013 | | |
| | | | |
| Financial Highlights (continued) | | | BlackRock Large Cap Value Fund | |
| | | | | | | | | | | | | | | | | | | | | | | | |
| | | Investor A | |
| | | Year Ended September 30, | | | Period
November 1,
2008 to
September 30, 2009 | | | Year Ended
October 31, 2008 | |
| | | 2013 | | | 2012 | | | 2011 | | | 2010 | | | |
| Per Share Operating Performance | | | | | | | | | | | | | | | | | | | | | | | | |
Net asset value, beginning of period | | $ | 15.48 | | | $ | 12.53 | | | $ | 13.29 | | | $ | 12.92 | | | $ | 12.03 | | | $ | 20.54 | |
| | | | |
Net investment income1 | | | 0.15 | | | | 0.14 | | | | 0.08 | | | | 0.09 | | | | 0.11 | | | | 0.09 | |
Net realized and unrealized gain (loss) | | | 3.21 | | | | 2.90 | | | | (0.74 | ) | | | 0.40 | | | | 0.87 | | | | (7.26 | ) |
| | | | |
Net increase (decrease) from investment operations | | | 3.36 | | | | 3.04 | | | | (0.66 | ) | | | 0.49 | | | | 0.98 | | | | (7.17 | ) |
| | | | |
Dividends and distributions from:2 | | | | | | | | | | | | | | | | | | | | | | | | |
Net investment income | | | (0.32 | ) | | | (0.09 | ) | | | (0.10 | ) | | | (0.12 | ) | | | (0.09 | ) | | | (0.01 | ) |
Net realized gain | | | — | | | | — | | | | — | | | | — | | | | — | | | | (1.33 | ) |
| | | | |
Total dividends and distributions | | | (0.32 | ) | | | (0.09 | ) | | | (0.10 | ) | | | (0.12 | ) | | | (0.09 | ) | | | (1.34 | ) |
| | | | |
Net asset value, end of period | | $ | 18.52 | | | $ | 15.48 | | | $ | 12.53 | | | $ | 13.29 | | | $ | 12.92 | | | $ | 12.03 | |
| | | | |
| | | | | | | | | | | | | | | | | | | | | | | | |
| Total Investment Return3 | | | | | | | | | | | | | | | | | | | | | | | | |
Based on net asset value | | | 22.07 | % | | | 24.38 | % | | | (5.04 | )% | | | 3.75 | % | | | 8.22 | %4,5 | | | (37.17 | )% |
| | | | |
| | | | | | | | | | | | | | | | | | | | | | | | |
| Ratios to Average Net Assets6 | | | | | | | | | | | | | | | | | | | | | | | | |
Total expenses | | | 1.26 | %7 | | | 1.27 | % | | | 1.24 | % | | | 1.23 | % | | | 1.40 | %8 | | | 1.22 | % |
| | | | |
Total expenses after fees waived and/or reimbursed | | | 1.21 | %7 | | | 1.26 | % | | | 1.24 | % | | | 1.23 | % | | | 1.40 | %8 | | | 1.22 | % |
| | | | |
Net investment income | | | 0.91 | %7 | | | 0.99 | % | | | 0.57 | % | | | 0.67 | % | | | 1.04 | %8 | | | 0.52 | % |
| | | | |
| | | | | | | | | | | | | | | | | | | | | | | | |
| Supplemental Data | | | | | | | | | | | | | | | | | | | | | | | | |
Net assets, end of period (000) | | $ | 353,445 | | | $ | 392,575 | | | $ | 479,707 | | | $ | 756,124 | | | $ | 967,445 | | | $ | 1,295,100 | |
| | | | |
Portfolio turnover of the Portfolio | | | 40 | % | | | 147 | % | | | 156 | % | | | 183 | % | | | 151 | % | | | 108 | % |
| | | | |
| | 1 | Based on average shares outstanding. |
| | 2 | Dividends and distributions are determined in accordance with federal income tax regulations. |
| | 3 | Where applicable, total investment returns exclude the effects of any sales charges and assume the reinvestment of dividends and distributions. |
| | 4 | Includes proceeds received from a settlement of litigation, through its investment in the Portfolio, which impacted the Fund’s total investment return. Not including these proceeds, the total investment return would have been 7.80%. |
| | 5 | Aggregate total investment return. |
| | 6 | Includes the Fund’s share of the Portfolios’ allocated expenses and/or net investment income. |
| | 7 | Includes the Fund’s share of the Portfolio’s allocated fees waived of less than 0.01%. |
See Notes to Financial Statements.
| | | | | | |
| | | BLACKROCK LARGE CAP SERIES FUNDS, INC. | | SEPTEMBER 30, 2013 | | 37 |
| | | | |
| Financial Highlights (continued) | | | BlackRock Large Cap Value Fund | |
| | | | | | | | | | | | | | | | | | | | | | | | |
| | | Investor B | |
| | | Year Ended September 30, | | | Period
November 1,
2008 to
September 30, 2009 | | | Year Ended
October 31, 2008 | |
| | | 2013 | | | 2012 | | | 2011 | | | 2010 | | | |
| Per Share Operating Performance | | | | | | | | | | | | | | | | | | | | | | | | |
Net asset value, beginning of period | | $ | 14.52 | | | $ | 11.78 | | | $ | 12.52 | | | $ | 12.18 | | | $ | 11.34 | | | $ | 19.41 | |
| | | | |
Net investment income (loss)1 | | | 0.00 | 2 | | | 0.01 | | | | (0.04 | ) | | | (0.03 | ) | | | 0.03 | | | | (0.04 | ) |
Net realized and unrealized gain (loss) | | | 3.03 | | | | 2.73 | | | | (0.70 | ) | | | 0.37 | | | | 0.81 | | | | (6.85 | ) |
| | | | |
Net increase (decrease) from investment operations | | | 3.03 | | | | 2.74 | | | | (0.74 | ) | | | 0.34 | | | | 0.84 | | | | (6.89 | ) |
| | | | |
Dividends and distributions from:3 | | | | | | | | | | | | | | | | | | | | | | | | |
Net investment income | | | (0.11 | ) | | | — | | | | — | | | | — | | | | — | | | | — | |
Net realized gain | | | — | | | | — | | | | — | | | | — | | | | — | | | | (1.18 | ) |
| | | | |
Total dividends and distributions | | | (0.11 | ) | | | — | | | | — | | | | — | | | | — | | | | (1.18 | ) |
| | | | |
Net asset value, end of period | | $ | 17.44 | | | $ | 14.52 | | | $ | 11.78 | | | $ | 12.52 | | | $ | 12.18 | | | $ | 11.34 | |
| | | | |
| | | | | | | | | | | | | | | | | | | | | | | | |
| Total Investment Return4 | | | | | | | | | | | | | | | | | | | | | | | | |
Based on net asset value | | | 20.98 | % | | | 23.26 | % | | | (5.91 | )% | | | 2.79 | % | | | 7.41 | %5,6 | | | (37.62 | )% |
| | | | |
| | | | | | | | | | | | | | | | | | | | | | | | |
| Ratios to Average Net Assets7 | | | | | | | | | | | | | | | | | | | | | | | | |
Total expenses | | | 2.20 | %8 | | | 2.21 | % | | | 2.12 | % | | | 2.14 | % | | | 2.21 | %9 | | | 1.99 | % |
| | | | |
Total expenses after fees waived and/or reimbursed | | | 2.15 | %8 | | | 2.20 | % | | | 2.12 | % | | | 2.14 | % | | | 2.21 | %9 | | | 1.99 | % |
| | | | |
Net investment income (loss) | | | 0.00 | %8 | | | 0.07 | % | | | (0.31 | )% | | | (0.24 | )% | | | 0.28 | %9 | | | (0.24 | )% |
| | | | |
| | | | | | | | | | | | | | | | | | | | | | | | |
| Supplemental Data | | | | | | | | | | | | | | | | | | | | | | | | |
Net assets, end of period (000) | | $ | 9,377 | | | $ | 15,404 | | | $ | 22,168 | | | $ | 37,720 | | | $ | 63,930 | | | $ | 108,660 | |
| | | | |
Portfolio turnover of the Portfolio | | | 40 | % | | | 147 | % | | | 156 | % | | | 183 | % | | | 151 | % | | | 108 | % |
| | | | |
| | 1 | Based on average shares outstanding. |
| | 2 | Amount is less than $0.005 per share. |
| | 3 | Dividends and distributions are determined in accordance with federal income tax regulations. |
| | 4 | Where applicable, total investment returns exclude the effects of any sales charges and assume the reinvestment of dividends and distributions. |
| | 5 | Includes proceeds received from a settlement of litigation, through its investment in the Portfolio, which impacted the Fund’s total investment return. Not including these proceeds, the total investment return would have been 6.97%. |
| | 6 | Aggregate total investment return. |
| | 7 | Includes the Fund’s share of the Portfolios’ allocated expenses and/or net investment income. |
| | 8 | Includes the Fund’s share of the Portfolio’s allocated fees waived of less than 0.01%. |
See Notes to Financial Statements.
| | | | | | |
| 38 | | BLACKROCK LARGE CAP SERIES FUNDS, INC. | | SEPTEMBER 30, 2013 | | |
| | | | |
| Financial Highlights (continued) | | | BlackRock Large Cap Value Fund | |
| | | | | | | | | | | | | | | | | | | | | | | | |
| | | Investor C | |
| | | Year Ended September 30 | | | Period
November 1,
2008 to
September 30, 2009 | | | Year Ended
October 31, 2008 | |
| | | 2013 | | | 2012 | | | 2011 | | | 2010 | | | |
| Per Share Operating Performance | | | | | | | | | | | | | | | | | | | | | | | | |
Net asset value, beginning of period | | $ | 14.45 | | | $ | 11.72 | | | $ | 12.44 | | | $ | 12.13 | | | $ | 11.29 | | | $ | 19.37 | |
| | | | |
Net investment income (loss)1 | | | 0.02 | | | | 0.02 | | | | (0.04 | ) | | | (0.03 | ) | | | 0.02 | | | | (0.04 | ) |
Net realized and unrealized gain (loss) | | | 2.99 | | | | 2.71 | | | | (0.68 | ) | | | 0.36 | | | | 0.82 | | | | (6.83 | ) |
| | | | |
Net increase (decrease) from investment operations | | | 3.01 | | | | 2.73 | | | | (0.72 | ) | | | 0.33 | | | | 0.84 | | | | (6.87 | ) |
| | | | |
Dividends and distributions from:2 | | | | | | | | | | | | | | | | | | | | | | | | |
Net investment income | | | (0.17 | ) | | | — | | | | — | | | | (0.02 | ) | | | — | | | | — | |
Net realized gain | | | — | | | | — | | | | — | | | | — | | | | — | | | | (1.21 | ) |
| | | | |
Total dividends and distributions | | | (0.17 | ) | | | — | | | | — | | | | (0.02 | ) | | | — | | | | (1.21 | ) |
| | | | |
Net asset value, end of period | | $ | 17.29 | | | $ | 14.45 | | | $ | 11.72 | | | $ | 12.44 | | | $ | 12.13 | | | $ | 11.29 | |
| | | | |
| | | | | | | | | | | | | | | | | | | | | | | | |
| Total Investment Return3 | | | | | | | | | | | | | | | | | | | | | | | | |
Based on net asset value | | | 21.06 | % | | | 23.29 | % | | | (5.79 | )% | | | 2.74 | % | | | 7.44 | %4,5 | | | (37.66 | )% |
| | | | |
| | | | | | | | | | | | | | | | | | | | | | | | |
| Ratios to Average Net Assets6 | | | | | | | | | | | | | | | | | | | | | | | | |
Total expenses | | | 2.07 | %7 | | | 2.12 | % | | | 2.10 | % | | | 2.11 | % | | | 2.19 | %8 | | | 2.00 | % |
| | | | |
Total expenses after fees waived and/or reimbursed | | | 2.02 | %7 | | | 2.11 | % | | | 2.10 | % | | | 2.11 | % | | | 2.19 | %8 | | | 2.00 | % |
| | | | |
Net investment income (loss) | | | 0.09 | %7 | | | 0.14 | % | | | (0.29 | )% | | | (0.22 | )% | | | 0.24 | %8 | | | (0.26 | )% |
| | | | |
| | | | | | | | | | | | | | | | | | | | | | | | |
| Supplemental Data | | | | | | | | | | | | | | | | | | | | | | | | |
Net assets, end of period (000) | | $ | 204,690 | | | $ | 210,681 | | | $ | 220,527 | | | $ | 298,040 | | | $ | 379,388 | | | $ | 456,180 | |
| | | | |
Portfolio turnover of the Portfolio | | | 40 | % | | | 147 | % | | | 156 | % | | | 183 | % | | | 151 | % | | | 108 | % |
| | | | |
| | 1 | Based on average shares outstanding. |
| | 2 | Dividends and distributions are determined in accordance with federal income tax regulations. |
| | 3 | Where applicable, total investment returns exclude the effects of any sales charges and assume the reinvestment of dividends and distributions. |
| | 4 | Includes proceeds received from a settlement of litigation, through its investment in the Portfolio, which impacted the Fund’s total investment return. Not including these proceeds, the total investment return would have been 7.00%. |
| | 5 | Aggregate total investment return. |
| | 6 | Includes the Fund’s share of the Portfolios’ allocated expenses and/or net investment income. |
| | 7 | Includes the Fund’s share of the Portfolio’s allocated fees waived of less than 0.01%. |
See Notes to Financial Statements.
| | | | | | |
| | | BLACKROCK LARGE CAP SERIES FUNDS, INC. | | SEPTEMBER 30, 2013 | | 39 |
| | | | |
| Financial Highlights (concluded) | | | BlackRock Large Cap Value Fund | |
| | | | | | | | | | | | | | | | | | | | | | | | |
| | | Class R | |
| | | Year Ended September 30, | | | Period November 1, 2008 to September 30, 2009 | | | Year Ended October 31, 2008 | |
| | | 2013 | | | 2012 | | | 2011 | | | 2010 | | | |
| Per Share Operating Performance | | | | | | | | | | | | | | | | | | | | | | | | |
Net asset value, beginning of period | | $ | 14.92 | | | $ | 12.08 | | | $ | 12.81 | | | $ | 12.48 | | | $ | 11.63 | | | $ | 19.92 | |
| | | | |
Net investment income1 | | | 0.10 | | | | 0.09 | | | | 0.04 | | | | 0.04 | | | | 0.07 | | | | 0.03 | |
Net realized and unrealized gain (loss) | | | 3.09 | | | | 2.80 | | | | (0.72 | ) | | | 0.38 | | | | 0.84 | | | | (7.02 | ) |
| | | | |
Net increase (decrease) from investment operations | | | 3.19 | | | | 2.89 | | | | (0.68 | ) | | | 0.42 | | | | 0.91 | | | | (6.99 | ) |
| | | | |
Dividends and distributions from:2 | | | | | | | | | | | | | | | | | | | | | | | | |
Net investment income | | | (0.25 | ) | | | (0.05 | ) | | | (0.05 | ) | | | (0.09 | ) | | | (0.06 | ) | | | — | |
Net realized gain | | | — | | | | — | | | | — | | | | — | | | | — | | | | (1.30 | ) |
| | | | |
Total dividends and distributions | | | (0.25 | ) | | | (0.05 | ) | | | (0.05 | ) | | | (0.09 | ) | | | (0.06 | ) | | | (1.30 | ) |
| | | | |
Net asset value, end of period | | $ | 17.86 | | | $ | 14.92 | | | $ | 12.08 | | | $ | 12.81 | | | $ | 12.48 | | | $ | 11.63 | |
| | | | |
| | | | | | | | | | | | | | | | | | | | | | | | |
| Total Investment Return3 | | | | | | | | | | | | | | | | | | | | | | | | |
Based on net asset value | | | 21.70 | % | | | 23.98 | % | | | (5.32 | )% | | | 3.35 | % | | | 7.88 | %4,5 | | | (37.35 | )% |
| | | | |
| | | | | | | | | | | | | | | | | | | | | | | | |
| Ratios to Average Net Assets6 | | | | | | | | | | | | | | | | | | | | | | | | |
Total expenses | | | 1.54 | %7 | | | 1.57 | % | | | 1.56 | % | | | 1.60 | % | | | 1.68 | %8 | | | 1.55 | % |
| | | | |
Total expenses after fees waived and/or reimbursed | | | 1.49 | %7 | | | 1.56 | % | | | 1.56 | % | | | 1.60 | % | | | 1.68 | %8 | | | 1.55 | % |
| | | | |
Net investment income | | | 0.63 | %7 | | | 0.70 | % | | | 0.25 | % | | | 0.29 | % | | | 0.72 | %8 | | | 0.19 | % |
| | | | |
| | | | | | | | | | | | | | | | | | | | | | | | |
| Supplemental Data | | | | | | | | | | | | | | | | | | | | | | | | |
Net assets, end of period (000) | | $ | 49,267 | | | $ | 59,934 | | | $ | 67,672 | | | $ | 115,763 | | | $ | 139,827 | | | $ | 141,571 | |
| | | | |
Portfolio turnover of the Portfolio | | | 40 | % | | | 147 | % | | | 156 | % | | | 183 | % | | | 151 | % | | | 108 | % |
| | | | |
| | 1 | Based on average shares outstanding. |
| | 2 | Dividends and distributions are determined in accordance with federal income tax regulations. |
| | 3 | Where applicable, total investment returns assume the reinvestment of dividends and distributions. |
| | 4 | Includes proceeds received from a settlement of litigation, through its investment in the Portfolio, which impacted the Fund’s total investment return. Not including these proceeds, the total investment return would have been 7.45%. |
| | 5 | Aggregate total investment return. |
| | 6 | Includes the Fund’s share of the Portfolios’ allocated expenses and/or net investment income. |
| | 7 | Includes the Fund’s share of the Portfolio’s allocated fees waived of less than 0.01%. |
See Notes to Financial Statements.
| | | | | | |
| 40 | | BLACKROCK LARGE CAP SERIES FUNDS, INC. | | SEPTEMBER 30, 2013 | | |
| | | | |
| Financial Highlights | | | BlackRock Large Cap Core Retirement Portfolio | |
| | | | | | | | | | | | | | | | | | | | | | | | |
| | | Class K | |
| | | Year Ended September 30, | | | Period
November 1,
2008 to
September 30, 2009 | | | Period
January 3,
20081 to
October 31, 2008 | |
| | | 2013 | | | 2012 | | | 2011 | | | 2010 | | | |
| Per Share Operating Performance | | | | | | | | | | | | | | | | | | | | | | | | |
Net asset value, beginning of period | | $ | 12.51 | | | $ | 9.78 | | | $ | 10.06 | | | $ | 9.61 | | | $ | 8.64 | | | $ | 13.25 | |
| | | | |
Net investment income2 | | | 0.16 | | | | 0.18 | | | | 0.11 | | | | 0.09 | | | | 0.11 | | | | 0.07 | |
Net realized and unrealized gain (loss) | | | 2.32 | | | | 2.69 | | | | (0.28 | ) | | | 0.49 | | | | 0.96 | | | | (4.68 | ) |
| | | | |
Net increase (decrease) from investment operations | | | 2.48 | | | | 2.87 | | | | (0.17 | ) | | | 0.58 | | | | 1.07 | | | | (4.61 | ) |
| | | | |
Dividends from net investment income3 | | | (0.30 | ) | | | (0.14 | ) | | | (0.11 | ) | | | (0.13 | ) | | | (0.10 | ) | | | — | |
| | | | |
Net asset value, end of period | | $ | 14.69 | | | $ | 12.51 | | | $ | 9.78 | | | $ | 10.06 | | | $ | 9.61 | | | $ | 8.64 | |
| | | | |
| | | | | | | | | | | | | | | | | | | | | | | | |
| Total Investment Return4 | | | | | | | | | | | | | | | | | | | | | | | | |
Based on net asset value | | | 20.27 | % | | | 29.67 | % | | | (1.81 | )% | | | 6.01 | % | | | 12.55 | %5,6 | | | (34.79 | )%6 |
| | | | |
| | | | | | | | | | | | | | | | | | | | | | | | |
| Ratios to Average Net Assets7 | | | | | | | | | | | | | | | | | | | | | | | | |
Total expenses | | | 0.59 | %8 | | | 0.60 | %8 | | | 0.67 | %8 | | | 0.68 | % | | | 0.73 | %9 | | | 0.71 | %9 |
| | | | |
Total expenses after reimbursement | | | 0.59 | %8 | | | 0.59 | %8 | | | 0.67 | %8 | | | 0.67 | % | | | 0.66 | %9 | | | 0.62 | %9 |
| | | | |
Net investment income | | | 1.21 | %8 | | | 1.59 | %8 | | | 0.96 | %8 | | | 0.93 | % | | | 1.39 | %9 | | | 0.76 | %9 |
| | | | |
| | | | | | | | | | | | | | | | | | | | | | | | |
| Supplemental Data | | | | | | | | | | | | | | | | | | | | | | | | |
Net assets, end of period (000) | | $ | 70,221 | | | $ | 81,221 | | | $ | 129,491 | | | $ | 113,241 | | | $ | 109,188 | | | $ | 105,224 | |
| | | | |
Portfolio turnover of the Portfolio | | | 50 | % | | | 128 | % | | | 129 | % | | | 173 | % | | | 168 | % | | | 109 | % |
| | | | |
| | 1 | Commencement of operations. |
| | 2 | Based on average shares outstanding. |
| | 3 | Dividends are determined in accordance with federal income tax regulations. |
| | 4 | Where applicable, total investment returns assume the reinvestment of dividends and distributions. |
| | 5 | Includes proceeds received from a settlement of litigation, through its investment in the Portfolio, which impacted the Fund’s total investment return. Not including these proceeds, the total investment return would have been 12.08%. |
| | 6 | Aggregate total investment return. |
| | 7 | Includes the Fund’s share of the Portfolios’ allocated expenses and/or net investment income. |
| | 8 | Includes the Fund’s share of the Portfolio’s allocated fees waived of less than 0.01%. |
See Notes to Financial Statements.
| | | | | | |
| | | BLACKROCK LARGE CAP SERIES FUNDS, INC. | | SEPTEMBER 30, 2013 | | 41 |
| | | | |
| Financial Highlights | | | BlackRock Large Cap Growth Retirement Portfolio | |
| | | | | | | | | | | | | | | | | | | | | | | | |
| | | Class K | |
| | | Year Ended September 30, | | | Period
November 1,
2008 to
September 30, 2009 | | | Period
January 3,
20081 to
October 31, 2008 | |
| | | 2013 | | | 2012 | | | 2011 | | | 2010 | | | |
| Per Share Operating Performance | | | | | | | | | | | | | | | | | | | | | | | | |
Net asset value, beginning of period | | $ | 12.78 | | | $ | 9.53 | | | $ | 9.54 | | | $ | 8.93 | | | $ | 7.45 | | | $ | 11.20 | |
| | | | |
Net investment income2 | | | 0.10 | | | | 0.15 | | | | 0.08 | | | | 0.06 | | | | 0.05 | | | | 0.02 | |
Net realized and unrealized gain (loss) | | | 0.86 | | | | 3.19 | | | | (0.01 | ) | | | 0.61 | | | | 1.48 | | | | (3.77 | ) |
| | | | |
Net increase (decrease) from investment operations | | | 0.96 | | | | 3.34 | | | | 0.07 | | | | 0.67 | | | | 1.53 | | | | (3.75 | ) |
| | | | |
Dividends and distributions from:3 | | | | | | | | | | | | | | | | | | | | | | | | |
Net investment income | | | (1.50 | ) | | | (0.09 | ) | | | (0.08 | ) | | | (0.06 | ) | | | (0.05 | ) | | | — | |
Net realized gains | | | (4.38 | ) | | | — | | | | — | | | | — | | | | — | | | | — | |
| | | | |
Total dividends and distributions | | | (5.88 | ) | | | (0.09 | ) | | | (0.08 | ) | | | (0.06 | ) | | | (0.05 | ) | | | — | |
| | | | |
Net asset value, end of period | | $ | 7.86 | | | $ | 12.78 | | | $ | 9.53 | | | $ | 9.54 | | | $ | 8.93 | | | $ | 7.45 | |
| | | | |
| | | | | | | | | | | | | | | | | | | | | | | | |
| Total Investment Return4 | | | | | | | | | | | | | | | | | | | | | | | | |
Based on net asset value | | | 16.60 | % | | | 35.29 | % | | | 0.68 | % | | | 7.46 | % | | | 20.66 | %5,6 | | | (33.48 | )%6 |
| | | | |
| | | | | | | | | | | | | | | | | | | | | | | | |
| Ratios to Average Net Assets7 | | | | | | | | | | | | | | | | | | | | | | | | |
Total expenses | | | 2.83 | %8 | | | 0.70 | %8 | | | 0.71 | %8 | | | 0.79 | % | | | 0.88 | %9 | | | 0.81 | %9 |
| | | | |
Total expenses after fees waived and/or reimbursed | | | 0.67 | %8 | | | 0.64 | %8 | | | 0.67 | %8 | | | 0.67 | % | | | 0.66 | %9 | | | 0.65 | %9 |
| | | | |
Net investment income | | | 1.23 | %8 | | | 1.35 | %8 | | | 0.77 | %8 | | | 0.62 | % | | | 0.73 | %9 | | | 0.30 | %9 |
| | | | |
| | | | | | | | | | | | | | | | | | | | | | | | |
| Supplemental Data | | | | | | | | | | | | | | | | | | | | | | | | |
Net assets, end of period (000) | | $ | 1,282 | | | $ | 2,243 | | | $ | 100,169 | | | $ | 86,662 | | | $ | 83,098 | | | $ | 80,882 | |
| | | | |
Portfolio turnover of the Portfolio | | | 54 | % | | | 132 | % | | | 169 | % | | | 232 | % | | | 242 | % | | | 144 | % |
| | | | |
| | 1 | Commencement of operations. |
| | 2 | Based on average shares outstanding. |
| | 3 | Dividends and distributions are determined in accordance with federal income tax regulations. |
| | 4 | Where applicable, total investment returns assume the reinvestment of dividends and distributions. |
| | 5 | Includes proceeds received from a settlement of litigation, through its investment in the Portfolio, which impacted the Fund’s total investment return. Not including these proceeds, the total investment return would have been 20.25%. |
| | 6 | Aggregate total investment return. |
| | 7 | Includes the Fund’s share of the Portfolio’s allocated expenses and/or net investment income. |
| | 8 | Includes the Fund’s share of the Portfolio’s allocated fees waived of less than 0.01%. |
See Notes to Financial Statements.
| | | | | | |
| 42 | | BLACKROCK LARGE CAP SERIES FUNDS, INC. | | SEPTEMBER 30, 2013 | | |
| | | | |
| Financial Highlights | | | BlackRock Large Cap Value Retirement Portfolio | |
| | | | | | | | | | | | | | | | | | | | | | | | |
| | | Class K | |
| | | Year Ended September 30, | | | Period November 1,
2008 to
September 30, 2009 | | | Period
January 3,
20081 to
October 31, 2008 | |
| | | 2013 | | | 2012 | | | 2011 | | | 2010 | | | |
| Per Share Operating Performance | | | | | | | | | | | | | | | | | | | | | | | | |
Net asset value, beginning of period | | $ | 15.93 | | | $ | 12.91 | | | $ | 13.67 | | | $ | 13.28 | | | $ | 12.33 | | | $ | 18.54 | |
| | | | |
Net investment income2 | | | 0.25 | | | | 0.24 | | | | 0.17 | | | | 0.17 | | | | 0.18 | | | | 0.13 | |
Net realized and unrealized gain (loss) | | | 3.30 | | | | 2.99 | | | | (0.76 | ) | | | 0.39 | | | | 0.91 | | | | (6.34 | ) |
| | | | |
Net increase (decrease) from investment operations | | | 3.55 | | | | 3.23 | | | | (0.59 | ) | | | 0.56 | | | | 1.09 | | | | (6.21 | ) |
| | | | |
Dividends from net investment income3 | | | (0.36 | ) | | | (0.21 | ) | | | (0.17 | ) | | | (0.17 | ) | | | (0.14 | ) | | | — | |
| | | | |
Net asset value, end of period | | $ | 19.12 | | | $ | 15.93 | | | $ | 12.91 | | | $ | 13.67 | | | $ | 13.28 | | | $ | 12.33 | |
| | | | |
| | | | | | | | | | | | | | | | | | | | | | | | |
| Total Investment Return4 | | | | | | | | | | | | | | | | | | | | | | | | |
Based on net asset value | | | 22.71 | % | | | 25.23 | % | | | (4.44 | )% | | | 4.23 | % | | | 8.93 | %5,6 | | | (33.50 | )%6 |
| | | | |
| | | | | | | | | | | | | | | | | | | | | | | | |
| Ratios to Average Net Assets7 | | | | | | | | | | | | | | | | | | | | | | | | |
Total expenses | | | 0.68 | %8 | | | 0.67 | % | | | 0.70 | % | | | 0.72 | % | | | 0.77 | %9 | | | 0.78 | %9 |
| | | | |
Total expenses after reimbursement | | | 0.67 | %8 | | | 0.62 | % | | | 0.67 | % | | | 0.67 | % | | | 0.66 | %9 | | | 0.63 | %9 |
| | | | |
Net investment income | | | 1.42 | %8 | | | 1.63 | % | | | 1.13 | % | | | 1.21 | % | | | 1.74 | %9 | | | 1.03 | %9 |
| | | | |
| | | | | | | | | | | | | | | | | | | | | | | | |
| Supplemental Data | | | | | | | | | | | | | | | | | | | | | | | | |
Net assets, end of period (000) | | $ | 133,921 | | | $ | 103,636 | | | $ | 144,964 | | | $ | 166,883 | | | $ | 132,560 | | | $ | 128,159 | |
| | | | |
Portfolio turnover of the Portfolio | | | 40 | % | | | 147 | % | | | 156 | % | | | 183 | % | | | 151 | % | | | 108 | % |
| | | | |
| | 1 | Commencement of operations. |
| | 2 | Based on average shares outstanding. |
| | 3 | Dividends are determined in accordance with federal income tax regulations. |
| | 4 | Where applicable, total investment returns assume the reinvestment of dividends and distributions. |
| | 5 | Includes proceeds received from a settlement of litigation, through its investment in the Portfolio, which impacted the Fund’s total investment return. Not including these proceeds, the total investment return would have been 8.52%. |
| | 6 | Aggregate total investment return. |
| | 7 | Includes the Fund’s share of the Portfolios’ allocated expenses and/or net investment income. |
| | 8 | Includes the Fund’s share of the Portfolio’s allocated fees waived of less than 0.01%. |
See Notes to Financial Statements.
| | | | | | |
| | | BLACKROCK LARGE CAP SERIES FUNDS, INC. | | SEPTEMBER 30, 2013 | | 43 |
| | | | |
| Notes to Financial Statements | | | BlackRock Large Cap Series Funds, Inc. | |
1. Organization:
BlackRock Large Cap Core Fund (“Large Cap Core”), BlackRock Large Cap Growth Fund (“Large Cap Growth”), BlackRock Large Cap Value Fund (“Large Cap Value”), BlackRock Large Cap Core Retirement Portfolio (“Large Cap Core Retirement”), BlackRock Large Cap Growth Retirement Portfolio (“Large Cap Growth Retirement”) and BlackRock Large Cap Value Retirement Portfolio (“Large Cap Value Retirement”) (collectively, the “Feeder Funds” or individually a “Feeder Fund”) are each a series of BlackRock Large Cap Series Funds, Inc. (the “Corporation”), which is registered under the Investment Company Act of 1940, as amended (the “1940 Act”), as an open-end management investment company. The Corporation is organized as a Maryland corporation. Each Feeder Fund is classified as diversified. The Feeder Funds seek to achieve their investment objectives by investing all of their assets in the corresponding master portfolios (individually, a “Portfolio” or collectively, the “Portfolios”) of Master Large Cap Series LLC (the “Master LLC”), an affiliate of the Feeder Funds. Large Cap Core and Large Cap Core Retirement invest all of their assets in Master Large Cap Core Portfolio. Large Cap Growth and Large Cap Growth Retirement invest all of their assets in Master Large Cap Growth Portfolio. Large Cap Value and Large Cap Value Retirement invest all of their assets in Master Large Cap Value Portfolio. Each Portfolio has the same investment objective and strategies as the corresponding Feeder Fund. The value of a Feeder Fund’s investment in the applicable Portfolio reflects the Feeder Fund’s proportionate interest in the net assets of such Portfolio. The performance of a Feeder Fund is directly affected by the performance of the applicable Portfolio. At September 30, 2013, the percentages of Master Large Cap Core Portfolio owned by Large Cap Core and Large Cap Core Retirement were 73.6% and 3.0%, respectively, the percentages of Master Large Cap Growth Portfolio owned by Large Cap Growth and Large Cap Growth Retirement were 95.9% and 0.1%, respectively, and the percentages of Master Large Cap Value Portfolio owned by Large Cap Value and Large Cap Value Retirement were 86.0% and 14.0%, respectively. The financial statements of the Portfolios, including the Schedules of Investments, are included elsewhere in this report and should be read in conjunction with the Feeder Funds’ financial statements. Large Cap Core, Large Cap Growth and Large Cap Value each offer multiple classes of shares. Institutional Shares are sold without a sales charge and only to certain eligible investors. Service Shares are sold without a sales charge. Investor A Shares are generally sold with an initial sales charge, but may be subject to a CDSC for certain redemptions where no initial sales charge was paid at the time of purchase. Investor B and Investor C Shares may be subject to a CDSC. Class R Shares are sold without a sales charge and only to certain employer-sponsored retirement plans. Large Cap Core Retirement, Large Cap Growth Retirement and Large Cap Value Retirement each offer Class K Shares. Class K Shares are not subject to any sales charge and are only available to eligible investors. All classes of shares have identical voting, dividend, liquidation and other rights and the same terms and conditions, except that Service, Investor A, Investor B, Investor C and Class R Shares bear certain expenses related to the shareholder servicing of such shares, and Investor B, Investor C and Class R Shares also bear certain expenses related to the distribution of such shares. Investor B Shares automatically convert to Investor A Shares after approximately eight years. Investor B Shares are only available through exchanges and dividend reinvestments by existing shareholders
and for purchase by certain employer-sponsored retirement plans. Each class has exclusive voting rights with respect to matters relating to its shareholder servicing and distribution expenditures (except that Investor B shareholders may vote on material changes to the Investor A distribution plan).
2. Significant Accounting Policies:
The Feeder Funds’ financial statements are prepared in conformity with accounting principles generally accepted in the United States of America (“US GAAP”), which may require management to make estimates and assumptions that affect the reported amounts of assets and liabilities in the financial statements and the reported amounts of increases and decreases in net assets from operations during the reported period. Actual results could differ from those estimates. The following is a summary of the significant accounting policies followed by the Feeder Funds:
Valuation: US GAAP defines fair value as the price the Feeder Funds would receive to sell an asset or pay to transfer a liability in an orderly transaction between market participants at the measurement date. Each Feeder Fund’s policy is to fair value its financial instruments at market value. Each Feeder Fund records its investments in the corresponding Portfolio at fair value based on the Feeder Fund’s proportionate interest in the net assets of the Portfolio. Valuation of securities held by a Portfolio is discussed in Note 2 of the Master LLC’s Notes to Financial Statements, which are included elsewhere in this report.
Investment Transactions and Investment Income: For financial reporting purposes, contributions to and withdrawals from the corresponding Portfolio are accounted for on a trade date basis. The Feeder Funds record daily their proportionate share of the corresponding Portfolio’s income, expenses and realized and unrealized gains and losses. In addition, each Feeder Fund accrues its own expenses. Income, expenses and realized and unrealized gains and losses are allocated daily to each class based on its relative net assets.
Dividends and Distributions: Dividends and distributions paid by the Feeder Funds are recorded on the ex-dividend dates. The portion of distributions that exceeds the Feeder Funds’ current and accumulated earnings and profits, which are measured on a tax basis, will constitute a nontaxable return of capital. Distributions in excess of the Feeder Funds’ taxable income and net capital gains, but not in excess of the Feeder Funds’ earnings and profits, will be taxable to shareholders as ordinary income and will not constitute a nontaxable return of capital. Capital losses carried forward from years beginning before 2011 do not reduce earnings and profits, even if such carried forward losses offset current year realized gains. The character and timing of dividends and distributions are determined in accordance with federal income tax regulations, which may differ from US GAAP.
Income Taxes: It is each Feeder Fund’s policy to comply with the requirements of the Internal Revenue Code of 1986, as amended, applicable to regulated investment companies and to distribute substantially all of its taxable income to its shareholders. Therefore, no federal income tax provision is required.
| | | | | | |
| 44 | | BLACKROCK LARGE CAP SERIES FUNDS, INC. | | SEPTEMBER 30, 2013 | | |
| | | | |
| Notes to Financial Statements (continued) | | | BlackRock Large Cap Series Funds, Inc. | |
Each Feeder Fund files US federal and various state and local tax returns. No income tax returns are currently under examination. The statute of limitations for each Feeder Fund’s US federal income tax returns remains open for each of the four years ended September 30, 2013. The statutes of limitations on each Feeder Fund’s state and local tax returns may remain open for an additional year depending upon the jurisdiction. Management does not believe there are any uncertain tax positions that require recognition of a tax liability.
Recent Accounting Standards: In December 2011, the Financial Accounting Standards Board (the “FASB”) issued guidance that will expand current disclosure requirements on the offsetting of certain assets and liabilities. The new disclosures will be required for investments and derivative financial instruments subject to master netting or similar agreements which are eligible for offset in the Statements of Assets and Liabilities and will require an entity to disclose both gross and net information about such investments and transactions in the financial statements. In January 2013, the FASB issued guidance that clarifies which investments and transactions are subject to the offsetting disclosure requirements. The scope of the disclosure requirements for offsetting will be limited to derivative instruments, repurchase agreements and reverse repurchase agreements, and securities borrowing and securities lending transactions. The guidance is effective for financial statements with fiscal years beginning on or after January 1, 2013, and interim periods within those fiscal years. Management is evaluating the impact of this guidance on each Feeder Fund’s financial statement disclosures.
Other: Expenses directly related to a Feeder Fund or its classes are charged to that Feeder Fund or class. Other operating expenses shared by several funds are pro rated among those funds on the basis of relative net assets or other appropriate methods. Expenses directly related to a Feeder Fund and other shared expenses pro-rated to a Feeder Fund are allocated daily to each class based on its relative net assets or other appropriate methods.
3. Administration Agreement and Other Transactions with Affiliates:
The PNC Financial Services Group, Inc. is the largest stockholder and an affiliate, for 1940 Act purposes, of BlackRock, Inc. (“BlackRock”).
The Corporation, on behalf of the Feeder Funds, entered into an Administration Agreement with BlackRock Advisors, LLC (the “Administrator”), an indirect, wholly owned subsidiary of BlackRock, to provide administrative services (other than investment advice and related portfolio activities). For such services, Large Cap Core, Large Cap Growth and Large Cap Value each pay the Administrator a monthly fee at an annual rate of 0.25% of the average daily value of such Feeder Fund’s net assets. The Feeder Funds do not pay an investment advisory fee or investment management fee. With respect to Large Cap Core Retirement, Large Cap Growth Retirement and Large Cap Value Retirement, the Administrator does not receive an administration fee.
With respect to Large Cap Core, Large Cap Core Retirement, Large Cap Growth Retirement and Large Cap Value Retirement, the Administrator contractually agreed to waive and/or reimburse fees or expenses in
order to limit expenses, excluding interest expense, dividend expense, income tax expense, acquired fund fees and expenses and certain other fund expenses, which constitute extraordinary expenses not incurred in the ordinary course of the Feeder Fund’s business. The expense limitations as a percentage of average daily net assets are as follows:
| | | | | | | | | | | | |
| | | Investor A | | | Investor B | | | Class K | |
Large Cap Core | | | 1.14 | % | | | 1.97 | % | | | — | |
Large Cap Core Retirement | | | — | | | | — | | | | 0.67 | % |
Large Cap Growth Retirement | | | — | | | | — | | | | 0.67 | % |
Large Cap Value Retirement | | | — | | | | — | | | | 0.67 | % |
The Administrator has agreed not to reduce or discontinue this contractual waiver or reimbursement prior to February 1, 2014, unless approved by the Board of Directors of the Corporation (the “Board”), including a majority of the independent directors. These amounts waived and/or reimbursed, if any, are shown as fees waived and/or reimbursed by administrator and transfer agent fees reimbursed — class specific, respectively, in the Statements of Operations.
With respect to Large Cap Value, the Administrator agreed to voluntarily waive 0.05%, as a percentage of average daily net assets, of the administration fee payable. This voluntary waiver may be reduced or discontinued at any time without notice. This amount waived, if any, is shown as fees waived and/or reimbursed by administrator, in the Statements of Operations.
The Corporation, on behalf of Large Cap Core, Large Cap Growth and Large Cap Value, entered into a Distribution Agreement and separate Distribution Plans with BlackRock Investments, LLC (“BRIL”), an affiliate of the Administrator. Pursuant to the Distribution Plans and in accordance with Rule 12b-1 under the 1940 Act, each Fund pays BRIL ongoing service and distribution fees. The fees are accrued daily and paid monthly at annual rates based upon the average daily net assets of the shares of each Fund as follows:
| | | | | | | | |
| | | Service
Fee | | | Distribution
Fee | |
Service | | | 0.25 | % | | | — | |
Investor A | | | 0.25 | % | | | — | |
Investor B | | | 0.25 | % | | | 0.75 | % |
Investor C | | | 0.25 | % | | | 0.75 | % |
Class R | | | 0.25 | % | | | 0.25 | % |
Pursuant to sub-agreements with BRIL, broker-dealers and BRIL provide shareholder servicing and distribution services to each of Large Cap Core, Large Cap Growth and Large Cap Value. The ongoing service and/or distribution fee compensates BRIL and each broker-dealer for providing shareholder servicing and/or distribution related services to Service, Investor A, Investor B, Investor C and Class R shareholders.
For the year ended September 30, 2013, affiliates earned underwriting discounts, direct commissions and dealer concessions on sales of the Feeder Funds’ Investor A Shares as follows:
| | | | |
| | | Investor A | |
Large Cap Core | | $ | 48,662 | |
Large Cap Growth | | $ | 65,629 | |
Large Cap Value | | $ | 14,062 | |
| | | | | | |
| | | BLACKROCK LARGE CAP SERIES FUNDS, INC. | | SEPTEMBER 30, 2013 | | 45 |
| | | | |
| Notes to Financial Statements (continued) | | | BlackRock Large Cap Series Funds, Inc. | |
For the year ended September 30, 2013, the affiliates received the following CDSCs as follows:
| | | | | | | | | | | | |
| | | Investor A | | | Investor B | | | Investor C | |
Large Cap Core | | $ | 805 | | | $ | 12,344 | | | $ | 16,042 | |
Large Cap Growth | | $ | 5,515 | | | $ | 6,034 | | | $ | 15,058 | |
Large Cap Value | | $ | 1,072 | | | $ | 7,130 | | | $ | 5,259 | |
Pursuant to written agreements, certain financial intermediaries, some of which may be affiliates, provide the Feeder Funds with sub-accounting, recordkeeping, sub-transfer agency and other administrative services with respect to sub-accounts they service. For these services, these entities receive an asset based fee or annual fee per shareholder account, which will vary depending on share class and/or net assets. For the year ended September 30, 2013, the Feeder Funds paid the following to affiliates in return for these services, which is included in transfer agent — class specific in the Statements of Operations:
| | | | | | | | | | | | |
| | | Large Cap
Core | | | Large Cap Growth | | | Large Cap
Value | |
Institutional | | $ | 140,741 | | | $ | 326,980 | | | $ | 70,514 | |
Service | | $ | 156 | | | $ | 307 | | | $ | 979 | |
Investor A | | $ | 1,423 | | | $ | 1,591 | | | $ | 18,395 | |
Investor C | | | — | | | | — | | | $ | 76 | |
The Administrator maintains a call center, which is responsible for providing certain shareholder services to the Feeder Funds, such as responding to shareholder inquiries and processing transactions based upon instructions from shareholders with respect to the subscription and redemption of Fund shares. For the year ended September 30, 2013, the Feeder Funds reimbursed the Administrator the following amounts for costs incurred in running the call center, which are included in transfer agent — class specific in the Statements of Operations:
| | | | | | | | | | | | |
| | | Large Cap
Core | | | Large Cap
Growth | | | Large Cap
Value | |
Institutional | | $ | 36,144 | | | $ | 1,687 | | | $ | 2,444 | |
Service | | $ | 38 | | | $ | 597 | | | $ | 4,580 | |
Investor A | | $ | 216,264 | | | $ | 8,601 | | | $ | 34,151 | |
Investor B | | $ | 17,733 | | | $ | 581 | | | $ | 2,370 | |
Investor C | | $ | 7,400 | | | $ | 3,162 | | | $ | 4,143 | |
Class R | | $ | 975 | | | $ | 743 | | | $ | 1,646 | |
| | | | | | | | | | | | |
| | | Large Cap
Core
Retirement | | | Large Cap
Growth
Retirement | | | Large Cap
Value
Retirement | |
Class K | | $ | 603 | | | $ | 25 | | | $ | 714 | |
Certain officers and/or directors of the Corporation are officers and/or directors of BlackRock or its affiliates. The Feeder Funds reimburse the Administrator for a portion of the compensation paid to the Corporation’s Chief Compliance Officer.
4. Income Tax Information:
US GAAP requires that certain components of net assets be adjusted to reflect permanent differences between financial and tax reporting. These reclassifications have no effect on net assets or net asset values per share. The following permanent differences as of September 30, 2013 attributable to the reclassification of distributions, income recognized
from partnership interests and distributions paid in excess of taxable income were reclassified to the following accounts:
| | | | | | | | | | | | |
| | | Large Cap
Core | | | Large Cap
Growth | | | Large Cap
Value | |
Paid-in capital | | $ | (6,059,703 | ) | | | — | | | $ | (154,722 | ) |
Undistributed net investment income | | $ | 1,292,079 | | | $ | 2,568,495 | | | $ | 146,832 | |
Accumulated net realized gain (loss) allocated from the Portfolio | | $ | 4,767,624 | | | $ | (2,568,495 | ) | | $ | 7,890 | |
| | | | | | | | | | | | |
| | | Large Cap
Core
Retirement | | | Large Cap
Growth
Retirement | | | Large Cap
Value
Retirement | |
Paid-in capital | | $ | (184,259 | ) | | | — | | | | — | |
Undistributed net investment income | | $ | 5,347 | | | $ | 3,522 | | | $ | (929 | ) |
Accumulated net realized gain (loss) allocated from the Portfolio | | $ | 178,912 | | | $ | (3,522 | ) | | $ | 929 | |
The tax character of distributions paid during the fiscal years ended September 30, 2013 and September 30, 2012 was as follows:
| | | | | | | | | | | | | | | | |
| | | | | | Large Cap
Core | | | Large Cap
Growth | | | Large Cap
Value | |
Ordinary income | | | 9/30/2013 | | | $ | 24,999,983 | | | $ | 31,213,798 | | | $ | 16,500,007 | |
| | | 9/30/2012 | | | | 7,202,527 | | | | 2,000,003 | | | | 7,500,061 | |
Long-term capital gains | | | 9/30/2013 | | | | — | | | | 34,737,432 | | | | — | |
| | | 9/30/2012 | | | | — | | | | — | | | | — | |
| | | | | | | | |
Total Distributions | | | 9/30/2013 | | | $ | 24,999,983 | | | $ | 65,951,230 | | | $ | 16,500,007 | |
| | | | | | | | |
| | | 9/30/2012 | | | $ | 7,202,527 | | | $ | 2,000,003 | | | $ | 7,500,061 | |
| | | | | | | | |
| | | | | | | | | | | | | | | | |
| | | | | | Large Cap
Core
Retirement | | | Large Cap
Growth
Retirement | | | Large Cap
Value
Retirement | |
Ordinary income | | | 9/30/2013 | | | $ | 1,900,001 | | | $ | 333,327 | | | $ | 2,300,006 | |
| | | 9/30/2012 | | | | 1,597,998 | | | | 950,003 | | | | 2,300,002 | |
Long-term capital gains | | | 9/30/2013 | | | | — | | | | 685,541 | | | | — | |
| | | 9/30/2012 | | | | — | | | | 1,907,705 | 1 | | | — | |
| | | | | | | | |
Total Distributions | | | 9/30/2013 | | | $ | 1,900,001 | | | $ | 1,018,868 | | | $ | 2,300,006 | |
| | | | | | | | |
| | | 9/30/2012 | | | $ | 1,597,998 | | | $ | 2,857,708 | | | $ | 2,300,002 | |
| | | | | | | | |
| | 1 | Distribution amount includes a portion of the proceeds from redeemed shares. |
As of September 30, 2013, the tax components of accumulated net earnings (losses) were as follows:
| | | | | | | | | | | | |
| | | Large Cap Core | | | Large Cap
Growth | | | Large Cap Value | |
Undistributed ordinary income | | | — | | | $ | 8,402,645 | | | | — | |
Undistributed long-term capital gains | | | — | | | | 59,210,379 | | | | — | |
Capital loss carryforwards | | $ | (337,276,620 | ) | | | — | | | $ | (720,206,511 | ) |
Net unrealized gains2 | | | 378,139,602 | | | | 184,018,697 | | | | 172,171,923 | |
| | | | |
Total | | $ | 40,862,982 | | | $ | 251,631,721 | | | $ | (548,034,588 | ) |
| | | | |
| | | | | | |
| 46 | | BLACKROCK LARGE CAP SERIES FUNDS, INC. | | SEPTEMBER 30, 2013 | | |
| | | | |
| Notes to Financial Statements (continued) | | | BlackRock Large Cap Series Funds, Inc. | |
| | | | | | | | | | | | |
| | | Large Cap
Core
Retirement | | | Large Cap
Growth
Retirement | | | Large Cap
Value
Retirement | |
Undistributed ordinary income | | | — | | | $ | 81,937 | | | $ | 558,987 | |
Undistributed long-term capital gains | | | — | | | | 623,597 | | | | 6,170,651 | |
Capital loss carryforwards | | $ | (20,134,017 | ) | | | — | | | | — | |
Net unrealized gains2 | | | 21,803,348 | | | | 954,513 | | | | 20,892,072 | |
| | | | |
Total | | $ | 1,669,331 | | | $ | 1,660,047 | | | $ | 27,621,710 | |
| | | | |
| | 2 | The differences between book-basis and tax-basis net unrealized gains were attributable primarily to the timing of income recognition of partnership interests. |
As of September 30, 2013, the Feeder Funds listed below had capital loss carryforwards available to offset future realized capital gains through the indicated expiration dates as follows:
| | | | | | | | | | | | |
| Expires September 30, | | Large Cap
Core | | | Large Cap
Value | | | Large Cap
Core
Retirement | |
2017 | | $ | 337,276,620 | | | $ | 720,206,511 | | | $ | 20,134,017 | |
| | | | |
During the year ended September 30, 2013, the Feeder Funds listed below utilized the following amounts of their respective capital loss carryforward:
| | | | |
Large Cap Core | | $ | 204,655,285 | |
Large Cap Value | | $ | 102,647,891 | |
Large Cap Core Retirement | | $ | 13,931,864 | |
Large Cap Value Retirement | | $ | 6,909,730 | |
5. Capital Share Transactions:
Transactions in capital shares for each class were as follows:
| | | | | | | | | | | | | | | | | | |
| | | Year Ended
September 30, 2013 | | | | | Year Ended
September 30, 2012 | |
| Large Cap Core | | Shares | | | Amount | | | | | Shares | | | Amount | |
Institutional | | | | | | | | | | | | | | | | | | |
Shares sold | | | 3,825,174 | | | $ | 51,665,555 | | | | | | 8,138,344 | | | $ | 92,670,541 | |
Shares issued in reinvestment of dividends | | | 578,770 | | | | 7,176,729 | | | | | | 273,969 | | | | 2,956,372 | |
Shares redeemed | | | (9,485,231 | ) | | | (129,930,526 | ) | | | | | (17,613,124 | ) | | | (206,593,570 | ) |
| | | | | | | | | | |
Net decrease | | | (5,081,287 | ) | | $ | (71,088,242 | ) | | | | | (9,200,811 | ) | | $ | (110,966,657 | ) |
| | | | | | | | | | |
| | | | | | | | | | | | | | | | | | |
Service | | | | | | | | | | | | | | | | | | |
Shares sold | | | 54,987 | | | $ | 824,189 | | | | | | 124,740 | | | $ | 1,392,412 | |
Shares issued in reinvestment of dividends | | | 9 | | | | 110 | | | | | | — | | | | — | |
Shares redeemed | | | (116,836 | ) | | | (1,459,084 | ) | | | | | (25,483 | ) | | | (291,347 | ) |
| | | | | | | | | | |
Net increase (decrease) | | | (61,840 | ) | | $ | (634,785 | ) | | | | | 99,257 | | | $ | 1,101,065 | |
| | | | | | | | | | |
| | | | | | | | | | | | | | | | | | |
Investor A | | | | | | | | | | | | | | | | | | |
Shares sold and automatic conversion of shares | | | 5,426,743 | | | $ | 72,779,606 | | | | | | 6,804,905 | | | $ | 78,385,318 | |
Shares issued in reinvestment of dividends | | | 849,124 | | | | 10,308,296 | | | | | | 242,472 | | | | 2,516,863 | |
Shares redeemed | | | (12,223,124 | ) | | | (160,624,974 | ) | | | | | (16,710,655 | ) | | | (191,010,119 | ) |
| | | | | | | | | | |
Net decrease | | | (5,947,257 | ) | | $ | (77,537,072 | ) | | | | | (9,663,278 | ) | | $ | (110,107,938 | ) |
| | | | | | | | | | |
| | | | | | | | | | | | | | | | | | |
Investor B | | | | | | | | | | | | | | | | | | |
Shares sold | | | 76,881 | | | $ | 933,266 | | | | | | 140,692 | | | $ | 1,493,635 | |
Shares issued in reinvestment of dividends | | | 7,023 | | | | 79,922 | | | | | | — | | | | — | |
Shares redeemed and automatic conversion of shares | | | (1,418,870 | ) | | | (17,506,158 | ) | | | | | (2,547,503 | ) | | | (27,235,842 | ) |
| | | | | | | | | | |
Net decrease | | | (1,334,966 | ) | | $ | (16,492,970 | ) | | | | | (2,406,811 | ) | | $ | (25,742,207 | ) |
| | | | | | | | | | |
| | | | | | | | | | | | | | | | | | |
Investor C | | | | | | | | | | | | | | | | | | |
Shares sold | | | 3,498,183 | | | $ | 42,916,687 | | | | | | 3,344,828 | | | $ | 35,082,126 | |
Shares issued in reinvestment of dividends | | | 182,100 | | | | 2,043,105 | | | | | | — | | | | — | |
Shares redeemed | | | (8,061,093 | ) | | | (97,934,634 | ) | | | | | (15,649,040 | ) | | | (162,374,990 | ) |
| | | | | | | | | | |
Net decrease | | | (4,380,810 | ) | | $ | (52,974,842 | ) | | | | | (12,304,212 | ) | | $ | (127,292,864 | ) |
| | | | | | | | | | |
| | | | | | |
| | | BLACKROCK LARGE CAP SERIES FUNDS, INC. | | SEPTEMBER 30, 2013 | | 47 |
| | | | |
| Notes to Financial Statements (continued) | | | BlackRock Large Cap Series Funds, Inc. | |
| | | | | | | | | | | | | | | | | | |
| | | Year Ended
September 30, 2013 | | | | | Year Ended
September 30, 2012 | |
| Large Cap Core (concluded) | | Shares | | | Amount | | | | | Shares | | | Amount | |
Class R | | | | | | | | | | | | | | | | | | |
Shares sold | | | 870,728 | | | $ | 11,067,187 | | | | | | 1,235,236 | | | $ | 13,503,539 | |
Shares issued in reinvestment of dividends | | | 48,400 | | | | 564,832 | | | | | | — | | | | — | |
Shares redeemed | | | (1,862,672 | ) | | | (23,502,625 | ) | | | | | (2,508,361 | ) | | | (27,360,638 | ) |
| | | | | | | | | | |
Net decrease | | | (943,544 | ) | | $ | (11,870,606 | ) | | | | | (1,273,125 | ) | | $ | (13,857,099 | ) |
| | | | | | | | | | |
| | | | | | | | | | | | | | | | | | |
Total Net Decrease | | | (17,749,704 | ) | | $ | (230,598,517 | ) | | | | | (34,748,980 | ) | | $ | (386,865,700 | ) |
| | | | | | | | | | |
| | | | | | | | | | |
| Large Cap Growth | | | | | | | | | | | | | | |
Institutional | | | | | | | | | | | | | | | | | | |
Shares sold | | | 10,805,639 | | | $ | 131,346,952 | | | | | | 9,400,619 | | | $ | 104,647,834 | |
Shares issued in reinvestment of dividends and distributions | | | 1,664,321 | | | | 18,706,967 | | | | | | 131,077 | | | | 1,335,674 | |
Shares redeemed | | | (10,471,771 | ) | | | (131,967,796 | ) | | | | | (19,512,594 | ) | | | (241,857,313 | ) |
| | | | | | | | | | |
Net increase (decrease) | | | 1,998,189 | | | $ | 18,086,123 | | | | | | (9,980,898 | ) | | $ | (135,873,805 | ) |
| | | | | | | | | | |
| | | | | | | | | | | | | | | | | | |
Service | | | | | | | | | | | | | | | | | | |
Shares sold | | | 42,572 | | | $ | 503,892 | | | | | | 166,361 | | | $ | 1,903,338 | |
Shares issued in reinvestment of dividends and distributions | | | 73,804 | | | | 822,914 | | | | | | 647 | | | | 6,547 | |
Shares redeemed | | | (951,630 | ) | | | (11,540,966 | ) | | | | | (340,751 | ) | | | (3,967,868 | ) |
| | | | | | | | | | |
Net decrease | | | (835,254 | ) | | $ | (10,214,160 | ) | | | | | (173,743 | ) | | $ | (2,057,983 | ) |
| | | | | | | | | | |
| | | | | | | | | | | | | | | | | | |
Investor A | | | | | | | | | | | | | | | | | | |
Shares sold and automatic conversion of shares | | | 7,585,195 | | | $ | 89,733,980 | | | | | | 7,483,172 | | | $ | 84,093,980 | |
Shares issued in reinvestment of dividends and distributions | | | 2,718,000 | | | | 29,490,188 | | | | | | 57,008 | | | | 563,246 | |
Shares redeemed | | | (8,746,475 | ) | | | (103,518,400 | ) | | | | | (8,388,045 | ) | | | (93,609,288 | ) |
| | | | | | | | | | |
Net increase (decrease) | | | 1,556,720 | | | $ | 15,705,768 | | | | | | (847,865 | ) | | $ | (8,952,062 | ) |
| | | | | | | | | | |
| | | | | | | | | | | | | | | | | | |
Investor B | | | | | | | | | | | | | | | | | | |
Shares sold | | | 23,228 | | | $ | 243,451 | | | | | | 82,116 | | | $ | 829,374 | |
Shares issued in reinvestment of dividends and distributions | | | 50,617 | | | | 498,575 | | | | | | — | | | | — | |
Shares redeemed and automatic conversion of shares | | | (385,246 | ) | | | (4,090,113 | ) | | | | | (594,894 | ) | | | (6,012,451 | ) |
| | | | | | | | | | |
Net decrease | | | (311,401 | ) | | $ | (3,348,087 | ) | | | | | (512,778 | ) | | $ | (5,183,077 | ) |
| | | | | | | | | | |
| | | | | | | | | | | | | | | | | | |
Investor C | | | | | | | | | | | | | | | | | | |
Shares sold | | | 2,634,380 | | | $ | 28,035,824 | | | | | | 3,920,550 | | | $ | 39,322,961 | |
Shares issued in reinvestment of dividends and distributions | | | 1,171,676 | | | | 11,505,760 | | | | | | — | | | | — | |
Shares redeemed | | | (4,225,520 | ) | | | (44,983,524 | ) | | | | | (3,928,882 | ) | | | (39,899,588 | ) |
| | | | | | | | | | |
Net decrease | | | (419,464 | ) | | $ | (5,441,940 | ) | | | | | (8,332 | ) | | $ | (576,627 | ) |
| | | | | | | | | | |
| | | | | | | | | | | | | | | | | | |
Class R | | | | | | | | | | | | | | | | | | |
Shares sold | | | 577,687 | | | $ | 6,517,657 | | | | | | 867,102 | | | $ | 9,247,451 | |
Shares issued in reinvestment of dividends and distributions | | | 197,805 | | | | 2,055,192 | | | | | | — | | | | — | |
Shares redeemed | | | (1,382,752 | ) | | | (15,671,908 | ) | | | | | (1,742,893 | ) | | | (18,591,354 | ) |
| | | | | | | | | | |
Net decrease | | | (607,260 | ) | | $ | (7,099,059 | ) | | | | | (875,791 | ) | | $ | (9,343,903 | ) |
| | | | | | | | | | |
| | | | | | | | | | | | | | | | | | |
Total Net Increase (Decrease) | | | 1,381,530 | | | $ | 7,688,645 | | | | | | (12,399,407 | ) | | $ | (161,987,457 | ) |
| | | | | | | | | | |
| | | | | | | | | | | | | | | | | | |
| Large Cap Value | | | | | | | | | | | | | | |
Institutional | | | | | | | | | | | | | | | | | | |
Shares sold | | | 1,508,305 | | | $ | 26,214,058 | | | | | | 3,729,269 | | | $ | 55,426,056 | |
Shares issued in reinvestment of dividends | | | 267,554 | | | | 4,221,978 | | | | | | 233,302 | | | | 3,198,578 | |
Shares redeemed | | | (7,658,472 | ) | | | (130,617,353 | ) | | | | | (16,590,308 | ) | | | (249,495,507 | ) |
| | | | | | | | | | |
Net decrease | | | (5,882,613 | ) | | $ | (100,181,317 | ) | | | | | (12,627,737 | ) | | $ | (190,870,873 | ) |
| | | | | | | | | | |
| | | | | | |
| 48 | | BLACKROCK LARGE CAP SERIES FUNDS, INC. | | SEPTEMBER 30, 2013 | | |
| | | | |
| Notes to Financial Statements (continued) | | | BlackRock Large Cap Series Funds, Inc. | |
| | | | | | | | | | | | | | | | | | |
| | | Year Ended
September 30, 2013 | | | | | Year Ended
September 30, 2012 | |
| Large Cap Value (concluded) | | Shares | | | Amount | | | | | Shares | | | Amount | |
Service | | | | | | | | | | | | | | | | | | |
Shares sold | | | 27,520 | | | $ | 454,505 | | | | | | 62,275 | | | $ | 886,931 | |
Shares issued in reinvestment of dividends | | | 33,961 | | | | 534,550 | | | | | | 20,001 | | | | 273,611 | |
Shares redeemed | | | (1,187,150 | ) | | | (20,760,395 | ) | | | | | (575,217 | ) | | | (8,540,400 | ) |
| | | | | | | | | | |
Net decrease | | | (1,125,669 | ) | | $ | (19,771,340 | ) | | | | | (492,941 | ) | | $ | (7,379,858 | ) |
| | | | | | | | | | |
| | | | | | | | | | | | | | | | | | |
Investor A | | | | | | | | | | | | | | | | | | |
Shares sold and automatic conversion of shares | | | 3,629,365 | | | $ | 62,380,714 | | | | | | 4,286,663 | | | $ | 62,540,744 | |
Shares issued in reinvestment of dividends | | | 457,873 | | | | 7,115,331 | | | | | | 231,251 | | | | 3,124,215 | |
Shares redeemed | | | (10,357,153 | ) | | | (177,458,344 | ) | | | | | (17,451,096 | ) | | | (254,087,923 | ) |
| | | | | | | | | | |
Net decrease | | | (6,269,915 | ) | | $ | (107,962,299 | ) | | | | | (12,933,182 | ) | | $ | (188,422,964 | ) |
| | | | | | | | | | |
| | | | | | | | | | | | | | | | | | |
Investor B | | | | | | | | | | | | | | | | | | |
Shares sold | | | 48,028 | | | $ | 764,369 | | | | | | 76,146 | | | $ | 1,045,404 | |
Shares issued in reinvestment of dividends | | | 6,247 | | | | 92,081 | | | | | | — | | | | — | |
Shares redeemed and automatic conversion of shares | | | (577,039 | ) | | | (9,248,584 | ) | | | | | (896,691 | ) | | | (12,483,717 | ) |
| | | | | | | | | | |
Net decrease | | | (522,764 | ) | | $ | (8,392,134 | ) | | | | | (820,545 | ) | | $ | (11,438,313 | ) |
| | | | | | | | | | |
| | | | | | | | | | | | | | | | | | |
Investor C | | | | | | | | | | | | | | | | | | |
Shares sold | | | 1,528,818 | | | $ | 24,527,105 | | | | | | 1,762,996 | | | $ | 24,136,262 | |
Shares issued in reinvestment of dividends | | | 148,147 | | | | 2,162,914 | | | | | | — | | | | — | |
Shares redeemed | | | (4,417,505 | ) | | | (69,751,702 | ) | | | | | (6,006,353 | ) | | | (82,289,406 | ) |
| | | | | | | | | | |
Net decrease | | | (2,740,540 | ) | | $ | (43,061,683 | ) | | | | | (4,243,357 | ) | | $ | (58,153,144 | ) |
| | | | | | | | | | |
| | | | | | | | | | | | | | | | | | |
Class R | | | | | | | | | | | | | | | | | | |
Shares sold | | | 858,935 | | | $ | 14,230,102 | | | | | | 1,089,126 | | | $ | 15,322,685 | |
Shares issued in reinvestment of dividends | | | 58,894 | | | | 884,592 | | | | | | 20,429 | | | | 266,800 | |
Shares redeemed | | | (2,176,588 | ) | | | (35,720,955 | ) | | | | | (2,696,522 | ) | | | (38,133,896 | ) |
| | | | | | | | | | |
Net decrease | | | (1,258,759 | ) | | $ | (20,606,261 | ) | | | | | (1,586,967 | ) | | $ | (22,544,411 | ) |
| | | | | | | | | | |
| | | | | | | | | | | | | | | | | | |
Total Net Decrease | | | (17,800,260 | ) | | $ | (299,975,034 | ) | | | | | (32,704,729 | ) | | $ | (478,809,563 | ) |
| | | | | | | | | | |
| | | | | | | | | | |
| Large Cap Core Retirement | | | | | | | | | | | | | | |
Class K | | | | | | | | | | | | | | | | | | |
Shares sold | | | 1,084,329 | | | $ | 14,503,776 | | | | | | 8,082,849 | | | $ | 90,932,022 | |
Shares issued in reinvestment of dividends | | | 153,337 | | | | 1,876,840 | | | | | | 146,850 | | | | 1,539,158 | |
Shares redeemed | | | (2,949,623 | ) | | | (38,395,734 | ) | | | | | (14,978,366 | ) | | | (179,156,312 | ) |
| | | | | | | | | | |
Net decrease | | | (1,711,957 | ) | | $ | (22,015,118 | ) | | | | | (6,748,667 | ) | | $ | (86,685,132 | ) |
| | | | | | | | | | |
| | | | | | | | | | | | | | | | | | |
| Large Cap Growth Retirement | | | | | | | | | | | | | | |
Class K | | | | | | | | | | | | | | | | | | |
Shares sold | | | 1,726 | | | $ | 12,358 | | | | | | 2,138,394 | | | $ | 24,055,829 | |
Shares issued in reinvestment of dividends and distributions | | | 19,105 | | | | 125,517 | | | | | | 88,991 | | | | 899,819 | |
Shares redeemed | | | (33,329 | ) | | | (248,351 | ) | | | | | (12,559,957 | ) | | | (151,950,634 | ) |
| | | | | | | | | | |
Net decrease | | | (12,498 | ) | | $ | (110,476 | ) | | | | | (10,332,572 | ) | | $ | (126,994,986 | ) |
| | | | | | | | | | |
| | | | | | | | | | | | | | | | | | |
| Large Cap Value Retirement | | | | | | | | | | | | | | |
Class K | | | | | | | | | | | | | | | | | | |
Shares sold | | | 1,483,186 | | | $ | 26,362,614 | | | | | | 1,811,314 | | | $ | 27,122,890 | |
Shares issued in reinvestment of dividends | | | 142,437 | | | | 2,276,143 | | | | | | 163,003 | | | | 2,254,488 | |
Shares redeemed | | | (1,125,067 | ) | | | (19,757,330 | ) | | | | | (6,698,808 | ) | | | (105,511,160 | ) |
| | | | | | | | | | |
Net increase (decrease) | | | 500,556 | | | $ | 8,881,427 | | | | | | (4,724,491 | ) | | $ | (76,133,782 | ) |
| | | | | | | | | | |
| | | | | | |
| | | BLACKROCK LARGE CAP SERIES FUNDS, INC. | | SEPTEMBER 30, 2013 | | 49 |
| | | | |
| Notes to Financial Statements (concluded) | | | BlackRock Large Cap Series Funds, Inc. | |
6. Subsequent Events:
Management’s evaluation of the impact of all subsequent events on the Feeder Funds’ financial statements was completed through the date the financial statements were issued and the following item was noted:
On November 4, 2013, an investor in Large Cap Core Retirement redeemed a substantial portion of their investment in the amount of $70,695,140.
| | | | | | |
| 50 | | BLACKROCK LARGE CAP SERIES FUNDS, INC. | | SEPTEMBER 30, 2013 | | |
| | | | |
| Report of Independent Registered Public Accounting Firm | | | BlackRock Large Cap Series Funds, Inc. | |
To the Shareholders of BlackRock Large Cap Core Fund, BlackRock Large Cap Growth Fund, BlackRock Large Cap Value Fund, BlackRock Large Cap Core Retirement Portfolio, BlackRock Large Cap Growth Retirement Portfolio and BlackRock Large Cap Value Retirement Portfolio and Board of Directors of BlackRock Large Cap Series Funds, Inc.:
We have audited the accompanying statements of assets and liabilities of BlackRock Large Cap Core Fund, BlackRock Large Cap Growth Fund, BlackRock Large Cap Value Fund, BlackRock Large Cap Core Retirement Portfolio, BlackRock Large Cap Growth Retirement Portfolio and BlackRock Large Cap Value Retirement Portfolio (collectively the “Funds”), each a series of BlackRock Large Cap Series Funds, Inc., as of September 30, 2013, and the related statements of operations for the year then ended, the statements of changes in net assets for each of the two years in the period then ended, and the financial highlights for each of the periods presented. These financial statements and financial highlights are the responsibility of the Funds’ management. Our responsibility is to express an opinion on these financial statements and financial highlights based on our audits.
We conducted our audits in accordance with the standards of the Public Company Accounting Oversight Board (United States). Those standards require that we plan and perform the audit to obtain reasonable assurance about whether the financial statements and financial highlights are free of material misstatement. The Funds are not required to have, nor were we engaged to perform, an audit of their internal control over financial
reporting. Our audits included consideration of internal control over financial reporting as a basis for designing audit procedures that are appropriate in the circumstances, but not for the purpose of expressing an opinion on the effectiveness of the Funds’ internal control over financial reporting. Accordingly, we express no such opinion. An audit also includes examining, on a test basis, evidence supporting the amounts and disclosures in the financial statements, assessing the accounting principles used and significant estimates made by management, as well as evaluating the overall financial statement presentation. We believe that our audits provide a reasonable basis for our opinion.
In our opinion, the financial statements and financial highlights referred to above present fairly, in all material respects, the financial positions of BlackRock Large Cap Core Fund, BlackRock Large Cap Growth Fund, BlackRock Large Cap Value Fund, BlackRock Large Cap Core Retirement Portfolio, BlackRock Large Cap Growth Retirement Portfolio and BlackRock Large Cap Value Retirement Portfolio as of September 30, 2013, the results of their operations for the year then ended, the changes in their net assets for each of the two years in the period then ended, and the financial highlights for each of the periods presented, in conformity with accounting principles generally accepted in the United States of America.
Deloitte & Touche LLP
Philadelphia, Pennsylvania
November 26, 2013
|
| Important Tax Information (Unaudited) |
The following information is provided with respect to the ordinary income distributions paid during the fiscal year ended September 30, 2013:
| | | | | | | | | | | | | | | | | | | | | | | | | | | | |
| | | Payable Date | | | BlackRock
Large Cap
Core | | | BlackRock
Large Cap
Growth | | | BlackRock
Large Cap
Value | | | BlackRock
Large Cap
Core
Retirement | | | BlackRock
Large Cap
Growth
Retirement | | | BlackRock
Large Cap
Value
Retirement | |
Qualified Dividend Income for Individuals1 | | | 12/18/2012 | | | | 100 | % | | | 73.26 | % | | | 100 | % | | | 100 | % | | | 75.25 | % | | | 100 | % |
Dividends Qualifying for the Dividends Received Deduction for Corporations1 | | | 12/18/2012 | | | | 100 | % | | | 63.73 | % | | | 100 | % | | | 100 | % | | | 74.93 | % | | | 100 | % |
Qualified Short-Term Capital Gains for Non-U.S. Residents2 | | | 12/18/2012 | | | | — | | | | 51.94 | % | | | — | | | | — | | | | 22.00 | % | | | — | |
| 1 | The Funds hereby designate the percentage indicated above or the maximum allowable by law. |
| 2 | Represents the portion of the taxable ordinary income dividend eligible for exemption from U.S. withholding tax for nonresident aliens and foreign corporations. |
Additionally, BlackRock Large Cap Growth Fund and BlackRock Large Cap Growth Retirement Portfolio distributed long-term capital gains of
$0.470178 and $3.960211 per share, respectively, to shareholders of record on December 14, 2012.
| | | | | | |
| | | BLACKROCK LARGE CAP SERIES FUNDS, INC. | | SEPTEMBER 30, 2013 | | 51 |
| | | | |
| Portfolio Information as of September 30, 2013 | | | Master Large Cap Series LLC | |
| | |
| Master Large Cap Core Portfolio | | Percent of
Long-Term Investments |
| | | | |
Google, Inc., Class A | | | 3 | % |
Mastercard, Inc., Class A | | | 3 | |
3M Co. | | | 3 | |
JPMorgan Chase & Co. | | | 3 | |
Bank of America Corp. | | | 3 | |
Lowe’s Cos., Inc. | | | 3 | |
Comcast Corp., Class A | | | 3 | |
Citigroup, Inc. | | | 3 | |
U.S. Bancorp | | | 3 | |
Pfizer, Inc. | | | 3 | |
| | |
| Master Large Cap Growth Portfolio | | Percent of
Long-Term Investments |
| | | | |
Google, Inc., Class A | | | 5 | % |
Microsoft Corp. | | | 4 | |
Mastercard, Inc., Class A | | | 3 | |
3M Co. | | | 3 | |
Apple, Inc. | | | 3 | |
Oracle Corp. | | | 3 | |
Comcast Corp., Class A | | | 3 | |
Lowe’s Cos., Inc. | | | 3 | |
McKesson Corp. | | | 2 | |
CVS Caremark Corp. | | | 2 | |
| | |
| Master Large Cap Value Portfolio | | Percent of
Long-Term Investments |
| | | | |
Chevron Corp. | | | 4 | % |
JPMorgan Chase & Co. | | | 4 | |
Pfizer, Inc. | | | 4 | |
Bank of America Corp. | | | 4 | |
Citigroup, Inc. | | | 4 | |
Exxon Mobil Corp. | | | 4 | |
Merck & Co., Inc. | | | 3 | |
U.S. Bancorp | | | 3 | |
CVS Caremark Corp. | | | 3 | |
American International Group, Inc. | | | 3 | |
| | |
| Master Large Cap Core Portfolio | | Percent of
Long-Term Investments |
| | | | |
Financials | | | 22 | % |
Information Technology | | | 21 | |
Health Care | | | 17 | |
Consumer Discretionary | | | 12 | |
Industrials | | | 11 | |
Energy | | | 11 | |
Materials | | | 3 | |
Consumer Staples | | | 3 | |
| | |
| Master Large Cap Growth Portfolio | | Percent of
Long-Term Investments |
| | | | |
Information Technology | | | 30 | % |
Health Care | | | 16 | |
Consumer Discretionary | | | 15 | |
Industrials | | | 13 | |
Energy | | | 8 | |
Consumer Staples | | | 7 | |
Financials | | | 6 | |
Materials | | | 5 | |
| | |
| Master Large Cap Value Portfolio | | Percent of
Long-Term Investments |
| | | | |
Financials | | | 32 | % |
Energy | | | 14 | |
Health Care | | | 14 | |
Industrials | | | 13 | |
Information Technology | | | 11 | |
Consumer Discretionary | | | 9 | |
Materials | | | 4 | |
Consumer Staples | | | 3 | |
For Portfolio compliance purposes, the Portfolios’ classifications refer to any one or more of the sub-classifications used by one or more widely recognized market indexes or ratings group indexes, and/or as defined by Portfolio management. These definitions may not apply for purposes of this report, which may combine sector sub-classifications for reporting ease.
| | | | | | |
| 52 | | BLACKROCK LARGE CAP SERIES FUNDS, INC. | | SEPTEMBER 30, 2013 | | |
| | | | |
| Schedule of Investments September 30, 2013 | | | Master Large Cap Core Portfolio | |
| | | (Percentages shown are based on Net Assets) | |
| | | | | | | | |
| Common Stocks | | Shares | | | Value | |
Aerospace & Defense — 1.5% | | | | | | | | |
The Boeing Co. | | | 246,900 | | | $ | 29,010,750 | |
Rockwell Collins, Inc. | | | 98,000 | | | | 6,650,280 | |
| | | | | | | | |
| | | | | | | | 35,661,030 | |
Airlines — 1.8% | | | | | | | | |
United Continental Holdings, Inc. (a) | | | 1,368,468 | | | | 42,025,652 | |
Auto Components — 2.2% | | | | | | | | |
BorgWarner, Inc. | | | 140,350 | | | | 14,230,087 | |
TRW Automotive Holdings Corp. (a) | | | 511,339 | | | | 36,463,584 | |
| | | | | | | | |
| | | | | | | | 50,693,671 | |
Biotechnology — 2.7% | | | | | | | | |
Amgen, Inc. | | | 217,100 | | | | 24,302,174 | |
Biogen Idec, Inc. (a) | | | 58,400 | | | | 14,060,384 | |
Celgene Corp. (a) | | | 109,700 | | | | 16,886,121 | |
Gilead Sciences, Inc. (a) | | | 107,300 | | | | 6,742,732 | |
| | | | | | | | |
| | | | | | | | 61,991,411 | |
Capital Markets — 1.6% | | | | | | | | |
The Goldman Sachs Group, Inc. | | | 227,131 | | | | 35,934,395 | |
Chemicals — 0.3% | | | | | | | | |
Cabot Corp. | | | 178,974 | | | | 7,643,980 | |
Commercial Banks — 4.1% | | | | | | | | |
Regions Financial Corp. | | | 810,500 | | | | 7,505,230 | |
SunTrust Banks, Inc. | | | 852,700 | | | | 27,644,534 | |
U.S. Bancorp | | | 1,650,775 | | | | 60,385,349 | |
| | | | | | | | |
| | | | | | | | 95,535,113 | |
Commercial Services & Supplies — 0.6% | | | | | | | | |
Tyco International Ltd. | | | 403,800 | | | | 14,124,924 | |
Communications Equipment — 2.0% | | | | | | | | |
Brocade Communications Systems, Inc. (a) | | | 1,122,800 | | | | 9,038,540 | |
Cisco Systems, Inc. | | | 1,578,600 | | | | 36,970,812 | |
| | | | | | | | |
| | | | | | | | 46,009,352 | |
Computers & Peripherals — 4.8% | | | | | | | | |
Apple, Inc. | | | 89,550 | | | | 42,692,963 | |
EMC Corp. | | | 1,631,500 | | | | 41,701,140 | |
NetApp, Inc. | | | 475,800 | | | | 20,278,596 | |
Western Digital Corp. | | | 106,695 | | | | 6,764,463 | |
| | | | | | | | |
| | | | | | | | 111,437,162 | |
Construction & Engineering — 0.9% | | | | | | | | |
KBR, Inc. | | | 648,800 | | | | 21,176,832 | |
Consumer Finance — 2.3% | | | | | | | | |
Discover Financial Services | | | 1,068,000 | | | | 53,976,720 | |
Containers & Packaging — 1.1% | | | | | | | | |
Packaging Corp. of America | | | 464,713 | | | | 26,530,465 | |
Diversified Financial Services — 8.3% | | | | | | | | |
Bank of America Corp. | | | 4,719,096 | | | | 65,123,525 | |
Citigroup, Inc. | | | 1,249,718 | | | | 60,623,820 | |
JPMorgan Chase & Co. | | | 1,289,624 | | | | 66,660,665 | |
| | | | | | | | |
| | | | | | | | 192,408,010 | |
Electronic Equipment, Instruments & Components — 1.1% | | | | | |
Avnet, Inc. | | | 365,000 | | | | 15,224,150 | |
TE Connectivity Ltd. | | | 175,300 | | | | 9,077,034 | |
| | | | | | | | |
| | | | | | | | 24,301,184 | |
Energy Equipment & Services — 3.1% | | | | | | | | |
Halliburton Co. | | | 396,600 | | | | 19,096,290 | |
Oceaneering International, Inc. | | | 223,800 | | | | 18,181,512 | |
Schlumberger Ltd. | | | 379,800 | | | | 33,559,128 | |
| | | | | | | | |
| | | | | | | | 70,836,930 | |
| | | | | | | | |
| Common Stocks | | Shares | | | Value | |
Food & Staples Retailing — 2.8% | | | | | | | | |
CVS Caremark Corp. | | | 1,056,825 | | | $ | 59,974,819 | |
Wal-Mart Stores, Inc. | | | 61,250 | | | | 4,530,050 | |
| | | | | | | | |
| | | | | | | | 64,504,869 | |
Health Care Equipment & Supplies — 2.1% | | | | | | | | |
Abbott Laboratories | | | 554,900 | | | | 18,417,131 | |
Medtronic, Inc. | | | 568,800 | | | | 30,288,600 | |
| | | | | | | | |
| | | | | | | | 48,705,731 | |
Health Care Providers & Services — 3.0% | | | | | | | | |
Aetna, Inc. | | | 312,100 | | | | 19,980,642 | |
Envision Healthcare Holdings, Inc. (a) | | | 55,500 | | | | 1,444,665 | |
McKesson Corp. | | | 294,425 | | | | 37,774,727 | |
Universal Health Services, Inc., Class B | | | 129,700 | | | | 9,726,203 | |
| | | | | | | | |
| | | | | | | | 68,926,237 | |
Industrial Conglomerates — 3.7% | | | | | | | | |
3M Co. | | | 585,975 | | | | 69,971,275 | |
General Electric Co. | | | 605,250 | | | | 14,459,423 | |
| | | | | | | | |
| | | | | | | | 84,430,698 | |
Insurance — 5.3% | | | | | | | | |
Allied World Assurance Co. Holdings AG | | | 75,500 | | | | 7,503,945 | |
American Financial Group, Inc. | | | 106,700 | | | | 5,768,202 | |
American International Group, Inc. | | | 1,231,300 | | | | 59,878,119 | |
The Chubb Corp. | | | 171,700 | | | | 15,325,942 | |
The Travelers Cos., Inc. | | | 405,900 | | | | 34,408,143 | |
| | | | | | | | |
| | | | | | | | 122,884,351 | |
Internet Software & Services — 3.6% | | | | | | | | |
AOL, Inc. (b) | | | 283,100 | | | | 9,789,598 | |
Google, Inc., Class A (a) | | | 82,615 | | | | 72,363,305 | |
| | | | | | | | |
| | | | | | | | 82,152,903 | |
IT Services — 3.9% | | | | | | | | |
Mastercard, Inc., Class A | | | 107,250 | | | | 72,155,655 | |
Teradata Corp. (a)(b) | | | 304,300 | | | | 16,870,392 | |
| | | | | | | | |
| | | | | | | | 89,026,047 | |
Life Sciences Tools & Services — 1.4% | | | | | | | | |
Agilent Technologies, Inc. | | | 628,800 | | | | 32,226,000 | |
Machinery — 2.3% | | | | | | | | |
Ingersoll-Rand PLC | | | 419,600 | | | | 27,248,824 | |
Oshkosh Corp. (a) | | | 246,500 | | | | 12,073,570 | |
WABCO Holdings, Inc. (a) | | | 151,600 | | | | 12,773,816 | |
| | | | | | | | |
| | | | | | | | 52,096,210 | |
Media — 4.1% | | | | | | | | |
Comcast Corp., Class A | | | 1,350,900 | | | | 60,993,135 | |
Twenty-First Century Fox, Inc. | | | 973,920 | | | | 32,626,320 | |
| | | | | | | | |
| | | | | | | | 93,619,455 | |
Multiline Retail — 1.0% | | | | | | | | |
Dillard’s, Inc., Class A | | | 139,865 | | | | 10,951,429 | |
Macy’s, Inc. | | | 283,300 | | | | 12,258,391 | |
| | | | | | | | |
| | | | | | | | 23,209,820 | |
Oil, Gas & Consumable Fuels — 7.6% | | | | | | | | |
Chevron Corp. | | | 359,275 | | | | 43,651,913 | |
Exxon Mobil Corp. | | | 306,600 | | | | 26,379,864 | |
Marathon Petroleum Corp. | | | 535,088 | | | | 34,416,860 | |
PBF Energy, Inc. | | | 555,238 | | | | 12,465,093 | |
Suncor Energy, Inc. | | | 1,310,040 | | | | 46,873,231 | |
Tesoro Corp. | | | 242,093 | | | | 10,647,250 | |
| | | | | | | | |
| | | | | | | | 174,434,211 | |
See Notes to Financial Statements.
| | | | | | |
| | | BLACKROCK LARGE CAP SERIES FUNDS, INC. | | SEPTEMBER 30, 2013 | | 53 |
| | | | |
| Schedule of Investments (continued) | | | Master Large Cap Core Portfolio | |
| | | (Percentages shown are based on Net Assets) | |
| | | | | | | | |
| Common Stocks | | Shares | | | Value | |
Paper & Forest Products — 1.5% | | | | | | | | |
Domtar Corp. | | | 243,200 | | | $ | 19,314,944 | |
International Paper Co. | | | 348,500 | | | | 15,612,800 | |
| | | | | | | | |
| | | | | | | | 34,927,744 | |
Pharmaceuticals — 7.2% | | | | | | | | |
AbbVie, Inc. | | | 532,900 | | | | 23,836,617 | |
Eli Lilly & Co. | | | 360,975 | | | | 18,167,872 | |
Johnson & Johnson | | | 124,225 | | | | 10,769,065 | |
Merck & Co., Inc. | | | 1,131,200 | | | | 53,856,432 | |
Pfizer, Inc. | | | 2,099,875 | | | | 60,287,411 | |
| | | | | | | | |
| | | | | | | | 166,917,397 | |
Semiconductors & Semiconductor Equipment — 1.7% | | | | | |
Applied Materials, Inc. | | | 1,759,780 | | | | 30,866,541 | |
Teradyne, Inc. (a) | | | 534,300 | | | | 8,826,636 | |
| | | | | | | | |
| | | | | | | | 39,693,177 | |
Software — 3.2% | | | | | | | | |
Activision Blizzard, Inc. | | | 415,100 | | | | 6,919,717 | |
Microsoft Corp. | | | 386,450 | | | | 12,872,649 | |
Oracle Corp. | | | 1,251,200 | | | | 41,502,304 | |
Symantec Corp. | | | 543,700 | | | | 13,456,575 | |
| | | | | | | | |
| | | | | | | | 74,751,245 | |
Specialty Retail — 4.7% | | | | | | | | |
Lowe’s Cos., Inc. | | | 1,283,800 | | | | 61,121,718 | |
Ross Stores, Inc. | | | 636,900 | | | | 46,366,320 | |
| | | | | | | | |
| | | | | | | | 107,488,038 | |
| | | | | | | | |
| Common Stocks | | Shares | | | Value | |
Tobacco — 0.1% | | | | | | | | |
Philip Morris International, Inc. | | | 26,675 | | | $ | 2,309,788 | |
Trading Companies & Distributors — 0.2% | | | | | | | | |
MRC Global, Inc. (a)(b) | | | 192,600 | | | | 5,161,680 | |
Total Long-Term Investments (Cost — $1,730,999,815) — 97.8% | | | | | | | 2,257,752,432 | |
| | | | | | | | |
| Short-Term Securities | | | | | | |
BlackRock Liquidity Funds, TempFund, Institutional Class, 0.03% (c)(d) | | | 47,573,194 | | | | 47,573,194 | |
| | | | | | | | |
| | |
| | | Beneficial
Interest
(000) | | | | |
BlackRock Liquidity Series, LLC, Money Market Series, 0.17% (c)(d)(e) | | $ | 18,692 | | | | 18,691,623 | |
Total Short-Term Securities (Cost — $66,264,817) — 2.9% | | | | | | | 66,264,817 | |
Total Investments (Cost — $1,797,264,632*) — 100.7% | | | | 2,324,017,249 | |
Liabilities in Excess of Other Assets — (0.7)% | | | | (15,120,854 | ) |
| | | | | | | | |
Net Assets — 100.0% | | | | | | $ | 2,308,896,395 | |
| | | | | | | | |
|
| Notes to Schedule of Investments |
| * | As of September 30, 2013, gross unrealized appreciation and gross unrealized depreciation based on cost for federal income tax purposes were as follows: |
| | | | |
Tax cost | | $ | 1,800,103,762 | |
| | | | |
Gross unrealized appreciation | | $ | 546,562,116 | |
Gross unrealized depreciation | | | (22,648,629 | ) |
| | | | |
Net unrealized appreciation | | $ | 523,913,487 | |
| | | | |
| (a) | Non-income producing security. |
| (b) | Security, or a portion of security, is on loan. |
| (c) | Investments in issuers considered to be an affiliate of the Portfolio during the year ended September 30, 2013, for purposes of Section 2(a)(3) of the Investment Company Act of 1940, as amended, were as follows: |
| | | | | | | | | | | | | | | | |
| Affiliate | | Shares/Beneficial
Interest Held at
September 30, 2012 | | | Net Activity | | | Shares/Beneficial
Interest Held at
September 30, 2013 | | | Income | |
BlackRock Liquidity Funds, TempFund, Institutional Class | | | 40,033,302 | | | | 7,539,892 | | | | 47,573,194 | | | $ | 22,452 | |
BlackRock Liquidity Series, LLC, Money Market Series | | $ | 22,802,709 | | | $ | (4,111,086 | ) | | $ | 18,691,623 | | | $ | 24,091 | |
| (d) | Represents the current yield as of report date. |
| (e) | Security was purchased with the cash collateral from loaned securities. The Portfolio may withdraw up to 25% of its investment daily, although the manager of the BlackRock Liquidity Series, LLC, Money Market Series, in its sole discretion, may permit an investor to withdraw more than 25% on any one day. |
| Ÿ | | For Portfolio compliance purposes, the Portfolio’s industry classifications refer to any one or more of the industry sub-classifications used by one or more widely recognized market indexes or ratings group indexes, and/or as defined by Portfolio management. These definitions may not apply for purposes of this report, which may combine such industry sub-classifications for reporting ease. |
See Notes to Financial Statements.
| | | | | | |
| 54 | | BLACKROCK LARGE CAP SERIES FUNDS, INC. | | SEPTEMBER 30, 2013 | | |
| | | | |
| Schedule of Investments (concluded) | | | Master Large Cap Core Portfolio | |
| Ÿ | | Fair Value Measurements — Various inputs are used in determining the fair value of investments. These inputs to valuation techniques are categorized into a disclosure hierarchy consisting of three broad levels for financial statement purposes as follows: |
| | Ÿ | | Level 1 — unadjusted price quotations in active markets/exchanges for identical assets or liabilities that the Portfolio has the ability to access |
| | Ÿ | | Level 2 — other observable inputs (including, but not limited to, quoted prices for similar assets or liabilities in markets that are active, quoted prices for identical or similar assets or liabilities in markets that are not active, inputs other than quoted prices that are observable for the assets or liabilities (such as interest rates, yield curves, volatilities, prepayment speeds, loss severities, credit risks and default rates) or other market–corroborated inputs) |
| | Ÿ | | Level 3 — unobservable inputs based on the best information available in the circumstances, to the extent observable inputs are not available (including the Portfolio’s own assumptions used in determining the fair value of investments) |
The hierarchy gives the highest priority to unadjusted quoted prices in active markets for identical assets or liabilities (Level 1 measurements) and the lowest priority to unobservable inputs (Level 3 measurements). Accordingly, the degree of judgment exercised in determining fair value is greatest for instruments categorized in Level 3. The inputs used to measure fair value may fall into different levels of the fair value hierarchy. In such cases, for disclosure purposes, the fair value hierarchy classification is determined based on the lowest level input that is significant to the fair value measurement in its entirety.
Changes in valuation techniques may result in transfers into or out of an assigned level within the disclosure hierarchy. In accordance with the Portfolio’s policy, transfers between different levels of the fair value disclosure hierarchy are deemed to have occurred as of the beginning of the reporting period. The categorization of a value determined for investments is based on the pricing transparency of the investment and is not necessarily an indication of the risks associated with investing in those securities. For information about the Portfolio’s policy regarding valuation of investments, please refer to Note 2 of the Notes to Financial Statements.
The following table summarizes the Portfolio’s investments categorized in the disclosure hierarchy as of September 30, 2013:
| | | | | | | | | | | | | | | | |
| | | Level 1 | | | Level 2 | | | Level 3 | | | Total | |
Assets: | | | | | | | | | | | | | | | | |
Investments: | | | | | | | | | | | | | | | | |
Long-Term Investments1 | | $ | 2,257,752,432 | | | | — | | | | — | | | $ | 2,257,752,432 | |
Short-Term Securities | | | 47,573,194 | | | $ | 18,691,623 | | | | — | | | | 66,264,817 | |
Total | | $ | 2,305,325,626 | | | $ | 18,691,623 | | | | — | | | $ | 2,324,017,249 | |
| | | | |
1 See above Schedule of Investments for values in each industry. | |
|
| Certain of the Portfolio’s liabilities are held at carrying amount, which approximates fair value for financial statement purposes. As of September 30, 2013, such liabilities are categorized within the disclosure hierarchy as follows: | |
| | | | | | | | | | | | | | | | |
| | | Level 1 | | | Level 2 | | | Level 3 | | | Total | |
Liabilities: | | | | | | | | | | | | | | | | |
Collateral on securities loaned at value | | | — | | | $ | (18,691,623 | ) | | | — | | | $ | (18,691,623 | ) |
Bank overdraft | | | — | | | | (117,784 | ) | | | — | | | | (117,784 | ) |
Total | | | — | | | $ | (18,809,407 | ) | | | — | | | $ | (18,809,407 | ) |
| | | | |
There were no transfers between levels during the year ended September 30, 2013.
See Notes to Financial Statements.
| | | | | | |
| | | BLACKROCK LARGE CAP SERIES FUNDS, INC. | | SEPTEMBER 30, 2013 | | 55 |
| | | | |
| Schedule of Investments September 30, 2013 | | | Master Large Cap Growth Portfolio | |
| | | (Percentages shown are based on Net Assets) | |
| | | | | | | | |
| Common Stocks | | Shares | | | Value | |
Aerospace & Defense — 2.7% | | | | | | | | |
The Boeing Co. | | | 182,775 | | | $ | 21,476,063 | |
Rockwell Collins, Inc. | | | 81,500 | | | | 5,530,590 | |
| | | | | | | | |
| | | | | | | | 27,006,653 | |
Airlines — 1.9% | | | | | | | | |
United Continental Holdings, Inc. (a) | | | 609,202 | | | | 18,708,593 | |
Auto Components — 0.9% | | | | | | | | |
BorgWarner, Inc. | | | 93,200 | | | | 9,449,548 | |
Beverages — 1.4% | | | | | | | | |
The Coca-Cola Co. | | | 367,400 | | | | 13,917,112 | |
Biotechnology — 4.7% | | | | | | | | |
Amgen, Inc. | | | 149,800 | | | | 16,768,612 | |
Biogen Idec, Inc. (a) | | | 40,700 | | | | 9,798,932 | |
Celgene Corp. (a) | | | 75,700 | | | | 11,652,501 | |
Gilead Sciences, Inc. (a) | | | 144,700 | | | | 9,092,948 | |
| | | | | | | | |
| | | | | | | | 47,312,993 | |
Chemicals — 2.3% | | | | | | | | |
CF Industries Holdings, Inc. | | | 25,350 | | | | 5,344,541 | |
PPG Industries, Inc. | | | 108,075 | | | | 18,055,009 | |
| | | | | | | | |
| | | | | | | | 23,399,550 | |
Commercial Banks — 2.1% | | | | | | | | |
U.S. Bancorp | | | 573,000 | | | | 20,960,340 | |
Communications Equipment — 0.5% | | | | | | | | |
QUALCOMM, Inc. | | | 75,600 | | | | 5,092,416 | |
Computers & Peripherals — 6.3% | | | | | | | | |
Apple, Inc. | | | 66,475 | | | | 31,691,956 | |
EMC Corp. | | | 817,500 | | | | 20,895,300 | |
NetApp, Inc. | | | 243,200 | | | | 10,365,184 | |
| | | | | | | | |
| | | | | | | | 62,952,440 | |
Construction & Engineering — 0.8% | | | | | | | | |
KBR, Inc. | | | 255,100 | | | | 8,326,464 | |
Consumer Finance — 2.2% | | | | | | | | |
Discover Financial Services | | | 430,425 | | | | 21,753,679 | |
Containers & Packaging — 2.1% | | | | | | | | |
Packaging Corp. of America | | | 365,910 | | | | 20,889,802 | |
Electronic Equipment, Instruments & Components — 0.4% | | | | | |
TE Connectivity Ltd. | | | 75,400 | | | | 3,904,212 | |
Energy Equipment & Services — 4.6% | | | | | | | | |
Halliburton Co. | | | 228,200 | | | | 10,987,830 | |
Oceaneering International, Inc. | | | 169,850 | | | | 13,798,614 | |
Schlumberger Ltd. | | | 240,000 | | | | 21,206,400 | |
| | | | | | | | |
| | | | | | | | 45,992,844 | |
Food & Staples Retailing — 4.3% | | | | | | | | |
CVS Caremark Corp. | | | 397,600 | | | | 22,563,800 | |
Wal-Mart Stores, Inc. | | | 276,500 | | | | 20,449,940 | |
| | | | | | | | |
| | | | | | | | 43,013,740 | |
Health Care Equipment & Supplies — 1.5% | | | | | | | | |
Abbott Laboratories | | | 452,350 | | | | 15,013,497 | |
Health Care Providers & Services — 3.9% | | | | | | | | |
Aetna, Inc. | | | 124,700 | | | | 7,983,294 | |
Envision Healthcare Holdings, Inc. (a) | | | 23,300 | | | | 606,499 | |
McKesson Corp. | | | 189,650 | | | | 24,332,095 | |
Patterson Cos., Inc. | | | 56,325 | | | | 2,264,265 | |
Universal Health Services, Inc., Class B | | | 58,200 | | | | 4,364,418 | |
| | | | | | | | |
| | | | | | | | 39,550,571 | |
Industrial Conglomerates — 3.3% | | | | | | | | |
3M Co. | | | 277,475 | | | | 33,133,290 | |
| | | | | | | | |
| Common Stocks | | Shares | | | Value | |
Insurance — 1.4% | | | | | | | | |
The Travelers Cos., Inc. | | | 168,950 | | | $ | 14,321,891 | |
Internet Software & Services — 4.5% | | | | | | | | |
Google, Inc., Class A (a) | | | 51,095 | | | | 44,754,621 | |
IT Services — 9.5% | | | | | | | | |
Alliance Data Systems Corp. (a) | | | 93,625 | | | | 19,798,879 | |
Cognizant Technology Solutions Corp., Class A (a) | | | 62,400 | | | | 5,124,288 | |
DST Systems, Inc. | | | 128,850 | | | | 9,716,579 | |
International Business Machines Corp. | | | 69,900 | | | | 12,944,082 | |
Mastercard, Inc., Class A | | | 50,550 | | | | 34,009,029 | |
Teradata Corp. (a)(b) | | | 140,600 | | | | 7,794,864 | |
Visa, Inc., Class A | | | 33,100 | | | | 6,325,410 | |
| | | | | | | | |
| | | | | | | | 95,713,131 | |
Life Sciences Tools & Services — 1.6% | | | | | | | | |
Agilent Technologies, Inc. | | | 323,850 | | | | 16,597,313 | |
Machinery — 4.1% | | | | | | | | |
Cummins, Inc. | | | 81,000 | | | | 10,762,470 | |
Ingersoll-Rand PLC | | | 220,900 | | | | 14,345,246 | |
Parker Hannifin Corp. | | | 78,350 | | | | 8,518,212 | |
WABCO Holdings, Inc. (a) | | | 92,900 | | | | 7,827,754 | |
| | | | | | | | |
| | | | | | | | 41,453,682 | |
Media — 6.0% | | | | | | | | |
Comcast Corp., Class A | | | 624,300 | | | | 28,187,145 | |
Twenty-First Century Fox, Inc. | | | 558,061 | | | | 18,695,043 | |
The Walt Disney Co. | | | 207,000 | | | | 13,349,430 | |
| | | | | | | | |
| | | | | | | | 60,231,618 | |
Oil, Gas & Consumable Fuels — 3.4% | | | | | | | | |
Marathon Petroleum Corp. | | | 125,500 | | | | 8,072,160 | |
PBF Energy, Inc. | | | 250,056 | | | | 5,613,757 | |
Suncor Energy, Inc. | | | 559,965 | | | | 20,035,548 | |
| | | | | | | | |
| | | | | | | | 33,721,465 | |
Paper & Forest Products — 0.7% | | | | | | | | |
International Paper Co. | | | 156,125 | | | | 6,994,400 | |
Pharmaceuticals — 4.1% | | | | | | | | |
AbbVie, Inc. | | | 339,150 | | | | 15,170,179 | |
Eli Lilly & Co. | | | 150,750 | | | | 7,587,247 | |
Merck & Co., Inc. | | | 234,000 | | | | 11,140,740 | |
Warner Chilcott PLC, Class A | | | 299,150 | | | | 6,835,577 | |
| | | | | | | | |
| | | | | | | | 40,733,743 | |
Semiconductors & Semiconductor Equipment — 1.0% | | | | | |
Applied Materials, Inc. | | | 358,000 | | | | 6,279,320 | |
Teradyne, Inc. (a)(b) | | | 250,600 | | | | 4,139,912 | |
| | | | | | | | |
| | | | | | | | 10,419,232 | |
Software — 6.9% | | | | | | | | |
Microsoft Corp. | | | 1,051,950 | | | | 35,040,455 | |
Oracle Corp. | | | 855,000 | | | | 28,360,350 | |
Symantec Corp. | | | 250,700 | | | | 6,204,825 | |
| | | | | | | | |
| | | | | | | | 69,605,630 | |
Specialty Retail — 7.4% | | | | | | | | |
The Home Depot, Inc. | | | 45,900 | | | | 3,481,515 | |
Lowe’s Cos., Inc. | | | 575,000 | | | | 27,375,750 | |
Ross Stores, Inc. | | | 292,700 | | | | 21,308,560 | |
TJX Cos., Inc. | | | 385,505 | | | | 21,738,627 | |
| | | | | | | | |
| | | | | | | | 73,904,452 | |
Textiles, Apparel & Luxury Goods — 0.5% | | | | | | | | |
VF Corp. (b) | | | 25,900 | | | | 5,155,395 | |
See Notes to Financial Statements.
| | | | | | |
| 56 | | BLACKROCK LARGE CAP SERIES FUNDS, INC. | | SEPTEMBER 30, 2013 | | |
| | | | |
| Schedule of Investments (continued) | | | Master Large Cap Growth Portfolio | |
| | | (Percentages shown are based on Net Assets) | |
| | | | | | | | |
| Common Stocks | | Shares | | | Value | |
Tobacco — 1.2% | | | | | | | | |
Philip Morris International, Inc. | | | 142,000 | | | $ | 12,295,780 | |
Trading Companies & Distributors — 0.3% | | | | | | | | |
MRC Global, Inc. (a) | | | 124,196 | | | | 3,328,453 | |
Total Long-Term Investments (Cost — $774,018,873) — 98.5% | | | | | | | 989,608,550 | |
| | | | | | | | |
| Short-Term Securities | | | | | | |
BlackRock Liquidity Funds, TempFund, Institutional Class, 0.03% (c)(d) | | | 12,806,801 | | | | 12,806,801 | |
| | | | | | | | |
| | | Beneficial
Interest
(000) | | | Value | |
BlackRock Liquidity Series, LLC, Money Market Series, 0.17% (c)(d)(e) | | $ | 13,291 | | | $ | 13,291,349 | |
Total Short-Term Securities (Cost — $26,098,150) — 2.6% | | | | | | | 26,098,150 | |
Total Investments (Cost — $800,117,023*) — 101.1% | | | | 1,015,706,700 | |
Liabilities in Excess of Other Assets — (1.1)% | | | | (10,698,377 | ) |
| | | | | | | | |
Net Assets — 100.0% | | | | | | $ | 1,005,008,323 | |
| | | | | | | | |
|
| Notes to Schedule of Investments |
| * | As of September 30, 2013, gross unrealized appreciation and gross unrealized depreciation based on cost for federal income tax purposes were as follows: |
| | | | |
Tax cost | | $ | 801,039,908 | |
| | | | |
Gross unrealized appreciation | | $ | 224,013,030 | |
Gross unrealized depreciation | | | (9,346,238 | ) |
| | | | |
Net unrealized appreciation | | $ | 214,666,792 | |
| | | | |
| (a) | Non-income producing security. |
| (b) | Security, or a portion of security, is on loan. |
| (c) | Investments in issuers considered to be an affiliate of the Portfolio during the year ended September 30, 2013, for purposes of Section 2(a)(3) of the Investment Company Act of 1940, as amended, were as follows: |
| | | | | | | | | | | | | | | | |
| Affiliate | | Shares/Beneficial
Interest Held at
September 30, 2012 | | | Net
Activity | | | Shares/Beneficial
Interest Held at
September 30, 2013 | | | Income | |
BlackRock Liquidity Funds, TempFund, Institutional Class | | | 16,880,866 | | | | (4,074,065 | ) | | | 12,806,801 | | | $ | 25,738 | |
BlackRock Liquidity Series, LLC, Money Market Series | | $ | 17,167,563 | | | $ | (3,876,214 | ) | | $ | 13,291,349 | | | $ | 211,227 | |
| (d) | Represents the current yield as of report date. |
| (e) | Security was purchased with the cash collateral from loaned securities. The Portfolio may withdraw up to 25% of its investment daily, although the manager of the BlackRock Liquidity Series, LLC, Money Market Series, in its sole discretion, may permit an investor to withdraw more than 25% on any one day. |
| Ÿ | | For Portfolio compliance purposes, the Portfolio’s industry classifications refer to any one or more of the industry sub-classifications used by one or more widely recognized market indexes or ratings group indexes, and/or as defined by Portfolio management. These definitions may not apply for purposes of this report, which may combine such industry sub-classifications for reporting ease. |
| Ÿ | | Fair Value Measurements — Various inputs are used in determining the fair value of investments. These inputs to valuation techniques are categorized into a disclosure hierarchy consisting of three broad levels for financial statement purposes as follows: |
| | Ÿ | | Level 1 — unadjusted price quotations in active markets/exchanges for identical assets or liabilities that the Portfolio has the ability to access |
| | Ÿ | | Level 2 — other observable inputs (including, but not limited to, quoted prices for similar assets or liabilities in markets that are active, quoted prices for identical or similar assets or liabilities in markets that are not active, inputs other than quoted prices that are observable for the assets or liabilities (such as interest rates, yield curves, volatilities, prepayment speeds, loss severities, credit risks and default rates) or other market–corroborated inputs) |
| | Ÿ | | Level 3 — unobservable inputs based on the best information available in the circumstances, to the extent observable inputs are not available (including the Portfolio’s own assumptions used in determining the fair value of investments) |
The hierarchy gives the highest priority to unadjusted quoted prices in active markets for identical assets or liabilities (Level 1 measurements) and the lowest priority to unobservable inputs (Level 3 measurements). Accordingly, the degree of judgment exercised in determining fair value is greatest for instruments categorized in Level 3. The inputs used to measure fair value may fall into different levels of the fair value hierarchy. In such cases, for disclosure purposes, the fair value hierarchy classification is determined based on the lowest level input that is significant to the fair value measurement in its entirety.
Changes in valuation techniques may result in transfers into or out of an assigned level within the disclosure hierarchy. In accordance with the Portfolio’s policy, transfers between different levels of the fair value disclosure hierarchy are deemed to have occurred as of the beginning of the reporting period. The categorization of a value determined for investments is based on the pricing transparency of the investment and is not necessarily an indication of the risks associated with investing in those securities. For information about the Portfolio’s policy regarding valuation of investments, please refer to Note 2 of the Notes to Financial Statements.
See Notes to Financial Statements.
| | | | | | |
| | | BLACKROCK LARGE CAP SERIES FUNDS, INC. | | SEPTEMBER 30, 2013 | | 57 |
| | | | |
| Schedule of Investments (concluded) | | | Master Large Cap Growth Portfolio | |
The following table summarizes the Portfolio’s investments categorized in the disclosure hierarchy as of September 30, 2013:
| | | | | | | | | | | | | | | | |
| | | Level 1 | | | Level 2 | | | Level 3 | | | Total | |
Assets: | | | | | | | | | | | | | | | | |
Investments: | | | | | | | | | | | | | | | | |
Long-Term Investments1 | | $ | 989,608,550 | | | | — | | | | — | | | $ | 989,608,550 | |
Short-Term Securities | | | 12,806,801 | | | $ | 13,291,349 | | | | — | | | | 26,098,150 | |
Total | | $ | 1,002,415,351 | | | $ | 13,291,349 | | | | — | | | $ | 1,015,706,700 | |
| | | | |
1 See above Schedule of Investments for values in each industry. | |
Certain of the Portfolio’s liabilities are held at carrying amount, which approximates fair value for financial statement purposes. As of September 30, 2013, collateral on securities loaned at value of $13,291,349 is categorized as Level 2 within the disclosure hierarchy.
There were no transfers between levels during the year ended September 30, 2013.
See Notes to Financial Statements.
| | | | | | |
| 58 | | BLACKROCK LARGE CAP SERIES FUNDS, INC. | | SEPTEMBER 30, 2013 | | |
| | | | |
| Schedule of Investments September 30, 2013 | | | Master Large Cap Value Portfolio | |
| | | (Percentages shown are based on Net Assets) | |
| | | | | | | | |
| Common Stocks | | Shares | | | Value | |
Aerospace & Defense — 2.4% | | | | | | | | |
The Boeing Co. | | | 92,900 | | | $ | 10,915,750 | |
Raytheon Co. | | | 126,550 | | | | 9,753,209 | |
Rockwell Collins, Inc. | | | 35,500 | | | | 2,409,030 | |
| | | | | | | | |
| | | | | | | | 23,077,989 | |
Airlines — 1.7% | | | | | | | | |
United Continental Holdings, Inc. (a) | | | 529,392 | | | | 16,257,628 | |
Auto Components — 1.7% | | | | | | | | |
TRW Automotive Holdings Corp. (a) | | | 229,222 | | | | 16,345,821 | |
Capital Markets — 2.2% | | | | | | | | |
The Goldman Sachs Group, Inc. | | | 131,578 | | | | 20,816,955 | |
Chemicals — 0.4% | | | | | | | | |
Cabot Corp. | | | 79,244 | | | | 3,384,511 | |
Commercial Banks — 5.4% | | | | | | | | |
Regions Financial Corp. | | | 416,900 | | | | 3,860,494 | |
SunTrust Banks, Inc. | | | 413,400 | | | | 13,402,428 | |
U.S. Bancorp | | | 822,175 | | | | 30,075,161 | |
Wells Fargo & Co. | | | 114,225 | | | | 4,719,777 | |
| | | | | | | | |
| | | | | | | | 52,057,860 | |
Commercial Services & Supplies — 0.9% | | | | | | | | |
Tyco International Ltd. | | | 256,025 | | | | 8,955,755 | |
Communications Equipment — 2.8% | | | | | | | | |
Brocade Communications Systems, Inc. (a) | | | 503,600 | | | | 4,053,980 | |
Cisco Systems, Inc. | | | 975,100 | | | | 22,836,842 | |
| | | | | | | | |
| | | | | | | | 26,890,822 | |
Computers & Peripherals — 2.2% | | | | | | | | |
Apple, Inc. | | | 10,100 | | | | 4,815,175 | |
EMC Corp. | | | 494,000 | | | | 12,626,640 | |
Western Digital Corp. | | | 55,338 | | | | 3,508,429 | |
| | | | | | | | |
| | | | | | | | 20,950,244 | |
Construction & Engineering — 0.9% | | | | | | | | |
KBR, Inc. | | | 251,400 | | | | 8,205,696 | |
Consumer Finance — 2.5% | | | | | | | | |
Discover Financial Services | | | 482,700 | | | | 24,395,658 | |
Containers & Packaging — 1.0% | | | | | | | | |
Packaging Corp. of America | | | 79,900 | | | | 4,561,491 | |
Rock-Tenn Co., Class A | | | 51,967 | | | | 5,262,698 | |
| | | | | | | | |
| | | | | | | | 9,824,189 | |
Diversified Financial Services — 12.0% | | | | | | | | |
Bank of America Corp. | | | 2,628,728 | | | | 36,276,446 | |
Berkshire Hathaway, Inc., Class B (a) | | | 46,700 | | | | 5,300,917 | |
Citigroup, Inc. | | | 701,826 | | | | 34,045,579 | |
JPMorgan Chase & Co. | | | 759,765 | | | | 39,272,253 | |
| | | | | | | | |
| | | | | | | | 114,895,195 | |
Diversified Telecommunication Services — 0.6% | | | | | |
AT&T, Inc. | | | 170,950 | | | | 5,781,529 | |
Electronic Equipment, Instruments & Components — 1.1% | | | | | |
Avnet, Inc. | | | 185,400 | | | | 7,733,034 | |
TE Connectivity Ltd. | | | 60,600 | | | | 3,137,868 | |
| | | | | | | | |
| | | | | | | | 10,870,902 | |
Energy Equipment & Services — 0.6% | | | | | | | | |
Halliburton Co. | | | 115,300 | | | | 5,551,695 | |
Food & Staples Retailing — 3.0% | | | | | | | | |
CVS Caremark Corp. | | | 497,750 | | | | 28,247,313 | |
| | | | | | | | |
| Common Stocks | | Shares | | | Value | |
Health Care Equipment & Supplies — 2.8% | | | | | | | | |
Abbott Laboratories | | | 322,200 | | | $ | 10,693,818 | |
Medtronic, Inc. | | | 298,300 | | | | 15,884,475 | |
| | | | | | | | |
| | | | | | | | 26,578,293 | |
Health Care Providers & Services — 1.4% | | | | | | | | |
Aetna, Inc. | | | 140,800 | | | | 9,014,016 | |
Universal Health Services, Inc., Class B | | | 52,900 | | | | 3,966,971 | |
| | | | | | | | |
| | | | | | | | 12,980,987 | |
Household Products — 0.6% | | | | | | | | |
The Procter & Gamble Co. | | | 78,400 | | | | 5,926,256 | |
Industrial Conglomerates — 4.0% | | | | | | | | |
3M Co. | | | 202,175 | | | | 24,141,717 | |
General Electric Co. | | | 601,775 | | | | 14,376,405 | |
| | | | | | | | |
| | | | | | | | 38,518,122 | |
Insurance — 9.4% | | | | | | | | |
Allied World Assurance Co. Holdings AG | | | 63,700 | | | | 6,331,143 | |
American Financial Group, Inc. | | | 257,025 | | | | 13,894,771 | |
American International Group, Inc. | | | 577,100 | | | | 28,064,373 | |
The Chubb Corp. | | | 213,075 | | | | 19,019,075 | |
HCC Insurance Holdings, Inc. | | | 71,900 | | | | 3,150,658 | |
The Travelers Cos., Inc. | | | 233,900 | | | | 19,827,703 | |
| | | | | | | | |
| | | | | | | | 90,287,723 | |
Internet Software & Services — 0.5% | | | | | | | | |
AOL, Inc. (a)(b) | | | 127,600 | | | | 4,412,408 | |
IT Services — 0.6% | | | | | | | | |
DST Systems, Inc. | | | 80,300 | | | | 6,055,423 | |
Machinery — 2.6% | | | | | | | | |
Ingersoll-Rand PLC | | | 290,400 | | | | 18,858,576 | |
Oshkosh Corp. (a) | | | 127,225 | | | | 6,231,481 | |
| | | | | | | | |
| | | | | | | | 25,090,057 | |
Media — 3.7% | | | | | | | | |
Comcast Corp., Class A | | | 517,700 | | | | 23,374,155 | |
Twenty-First Century Fox, Inc. | | | 354,611 | | | | 11,879,469 | |
| | | | | | | | |
| | | | | | | | 35,253,624 | |
Multiline Retail — 1.1% | | | | | | | | |
Dillard’s, Inc., Class A | | | 61,800 | | | | 4,838,940 | |
Macy’s, Inc. | | | 136,800 | | | | 5,919,336 | |
| | | | | | | | |
| | | | | | | | 10,758,276 | |
Oil, Gas & Consumable Fuels — 13.0% | | | | | | | | |
Chevron Corp. | | | 347,275 | | | | 42,193,913 | |
Exxon Mobil Corp. | | | 394,525 | | | | 33,944,931 | |
Marathon Petroleum Corp. | | | 249,940 | | | | 16,076,141 | |
PBF Energy, Inc. | | | 245,434 | | | | 5,509,993 | |
Suncor Energy, Inc. | | | 599,390 | | | | 21,446,174 | |
Tesoro Corp. | | | 114,627 | | | | 5,041,295 | |
| | | | | | | | |
| | | | | | | | 124,212,447 | |
Paper & Forest Products — 2.5% | | | | | | | | |
Domtar Corp. | | | 142,300 | | | | 11,301,466 | |
International Paper Co. | | | 274,700 | | | | 12,306,560 | |
| | | | | | | | |
| | | | | | | | 23,608,026 | |
Pharmaceuticals — 9.4% | | | | | | | | |
AbbVie, Inc. | | | 145,900 | | | | 6,526,107 | |
Eli Lilly & Co. | | | 194,275 | | | | 9,777,861 | |
Johnson & Johnson | | | 72,700 | | | | 6,302,363 | |
See Notes to Financial Statements.
| | | | | | |
| | | BLACKROCK LARGE CAP SERIES FUNDS, INC. | | SEPTEMBER 30, 2013 | | 59 |
| | | | |
| Schedule of Investments (continued) | | | Master Large Cap Value Portfolio | |
| | | (Percentages shown are based on Net Assets) | |
| | | | | | | | |
| Common Stocks | | Shares | | | Value | |
Pharmaceuticals (concluded) | | | | | | | | |
Merck & Co., Inc. | | | 643,790 | | | $ | 30,650,842 | |
Pfizer, Inc. | | | 1,267,325 | | | | 36,384,900 | |
| | | | | | | | |
| | | | | | | | 89,642,073 | |
Semiconductors & Semiconductor Equipment — 1.9% | | | | | |
Applied Materials, Inc. | | | 812,670 | | | | 14,254,232 | |
Teradyne, Inc. (a)(b) | | | 236,700 | | | | 3,910,284 | |
| | | | | | | | |
| | | | | | | | 18,164,516 | |
Software — 2.0% | | | | | | | | |
Activision Blizzard, Inc. | | | 194,900 | | | | 3,248,983 | |
Oracle Corp. | | | 310,300 | | | | 10,292,651 | |
Symantec Corp. | | | 211,200 | | | | 5,227,200 | |
| | | | | | | | |
| | | | | | | | 18,768,834 | |
Specialty Retail — 2.3% | | | | | | | | |
Lowe’s Cos., Inc. | | | 452,700 | | | | 21,553,047 | |
Total Long-Term Investments (Cost — $731,077,687) — 99.2% | | | | | | | 948,319,874 | |
| | | | | | | | |
| | | | | | | |
| | | | | | | | |
| Short-Term Securities | | Shares | | | Value | |
BlackRock Liquidity Funds, TempFund, Institutional Class, 0.03% (c)(d) | | | 7,755,119 | | | $ | 7,755,119 | |
| | | Beneficial
Interest
(000) | | | | |
BlackRock Liquidity Series, LLC, Money Market Series, 0.17% (c)(d)(e) | | $ | 5,176 | | | | 5,175,835 | |
Total Short-Term Securities (Cost — $12,930,954) — 1.4% | | | | | | | 12,930,954 | |
Total Investments (Cost — $744,008,641*) — 100.6% | | | | 961,250,828 | |
Liabilities in Excess of Other Assets — (0.6)% | | | | (5,703,999 | ) |
| | | | | | | | |
Net Assets — 100.0% | | | | | | $ | 955,546,829 | |
| | | | | | | | |
|
| Notes to Schedule of Investments |
| * | As of September 30, 2013, gross unrealized appreciation and gross unrealized depreciation based on cost for federal income tax purposes were as follows: |
| | | | |
Tax cost | | $ | 766,639,759 | |
| | | | |
Gross unrealized appreciation | | $ | 204,028,886 | |
Gross unrealized depreciation | | | (9,417,817 | ) |
| | | | |
Net unrealized appreciation | | $ | 194,611,069 | |
| | | | |
| (a) | Non-income producing security. |
| (b) | Security, or a portion of security, is on loan. |
| (c) | Investments in issuers considered to be an affiliate of the Portfolio during the year ended September 30, 2013, for purposes of Section 2(a)(3) of the Investment Company Act of 1940, as amended, were as follows: |
| | | | | | | | | | | | | | | | |
| Affiliate | | Shares/Beneficial
Interest Held at
September 30, 2012 | | | Net Activity | | | Shares/Beneficial
Interest Held at
September 30, 2013 | | | Income | |
BlackRock Liquidity Funds, TempFund, Institutional Class | | | 10,713,064 | | | | (2,957,945 | ) | | | 7,755,119 | | | $ | 11,916 | |
BlackRock Liquidity Series, LLC, Money Market Series | | $ | 9,360,700 | | | $ | (4,184,865 | ) | | $ | 5,175,835 | | | $ | 18,587 | |
| (d) | Represents the current yield as of report date. |
| (e) | Security was purchased with the cash collateral from loaned securities. The Portfolio may withdraw up to 25% of its investment daily, although the manager of the BlackRock Liquidity Series, LLC, Money Market Series, in its sole discretion, may permit an investor to withdraw more than 25% on any one day. |
| Ÿ | | For Portfolio compliance purposes, the Portfolio’s industry classifications refer to any one or more of the industry sub-classifications used by one or more widely recognized market indexes or ratings group indexes, and/or as defined by Portfolio management. These definitions may not apply for purposes of this report, which may combine such industry sub-classifications for reporting ease. |
| Ÿ | | Fair Value Measurements — Various inputs are used in determining the fair value of investments. These inputs to valuation techniques are categorized into a disclosure hierarchy consisting of three broad levels for financial statement purposes as follows: |
| | Ÿ | | Level 1 — unadjusted price quotations in active markets/exchanges for identical assets or liabilities that the Portfolio has the ability to access |
| | Ÿ | | Level 2 — other observable inputs (including, but not limited to, quoted prices for similar assets or liabilities in markets that are active, quoted prices for identical or similar assets or liabilities in markets that are not active, inputs other than quoted prices that are observable for the assets or liabilities (such as interest rates, yield curves, volatilities, prepayment speeds, loss severities, credit risks and default rates) or other market–corroborated inputs) |
| | Ÿ | | Level 3 — unobservable inputs based on the best information available in the circumstances, to the extent observable inputs are not available (including the Portfolio’s own assumptions used in determining the fair value of investments) |
See Notes to Financial Statements.
| | | | | | |
| 60 | | BLACKROCK LARGE CAP SERIES FUNDS, INC. | | SEPTEMBER 30, 2013 | | |
| | | | |
| Schedule of Investments (concluded) | | | Master Large Cap Value Portfolio | |
The hierarchy gives the highest priority to unadjusted quoted prices in active markets for identical assets or liabilities (Level 1 measurements) and the lowest priority to unobservable inputs (Level 3 measurements). Accordingly, the degree of judgment exercised in determining fair value is greatest for instruments categorized in Level 3. The inputs used to measure fair value may fall into different levels of the fair value hierarchy. In such cases, for disclosure purposes, the fair value hierarchy classification is determined based on the lowest level input that is significant to the fair value measurement in its entirety.
Changes in valuation techniques may result in transfers into or out of an assigned level within the disclosure hierarchy. In accordance with the Portfolio’s policy, transfers between different levels of the fair value disclosure hierarchy are deemed to have occurred as of the beginning of the reporting period. The categorization of a value determined for investments is based on the pricing transparency of the investment and is not necessarily an indication of the risks associated with investing in those securities. For information about the Portfolio’s policy regarding valuation of investments, please refer to Note 2 of the Notes to Financial Statements.
The following table summarizes the Portfolio’s investments categorized in the disclosure hierarchy as of September 30, 2013:
| | | | | | | | | | | | | | | | |
| | | Level 1 | | | Level 2 | | | Level 3 | | | Total | |
Assets: | | | | | | | | | | | | | | | | |
Investments: | | | | | | | | | | | | | | | | |
Long-Term Investments1 | | $ | 948,319,874 | | | | — | | | | — | | | $ | 948,319,874 | |
Short-Term Securities | | | 7,755,119 | | | $ | 5,175,835 | | | | — | | | | 12,930,954 | |
Total | | $ | 956,074,993 | | | $ | 5,175,835 | | | | — | | | $ | 961,250,828 | |
| | | | |
1 See above Schedule of Investments for values in each industry. | |
|
| Certain of the Portfolio’s liabilities are held at carrying amount, which approximates fair value for financial statement purposes. As of September 30, 2013, such liabilities are categorized within the disclosure hierarchy as follows: | |
| | | | | | | | | | | | | | | | |
| | | Level 1 | | | Level 2 | | | Level 3 | | | Total | |
Liabilities: | | | | | | | | | | | | | | | | |
Bank overdraft | | | — | | | $ | (52,061 | ) | | | — | | | $ | (52,061 | ) |
Collateral on securities loaned at value | | | — | | | | (5,175,835 | ) | | | — | | | | (5,175,835 | ) |
Total | | | — | | | $ | (5,227,896 | ) | | | — | | | $ | (5,227,896 | ) |
| | | | |
There were no transfers between levels during the year ended September 30, 2013.
See Notes to Financial Statements.
| | | | | | |
| | | BLACKROCK LARGE CAP SERIES FUNDS, INC. | | SEPTEMBER 30, 2013 | | 61 |
| | | | |
| Statements of Assets and Liabilities | | | Master Large Cap Series LLC | |
| | | | | | | | | | | | |
| September 30, 2013 | | Master Large
Cap Core
Portfolio | | | Master Large
Cap Growth
Portfolio | | | Master Large
Cap Value
Portfolio | |
| | | | | | | | | | | | |
| Assets | | | | | | | | | | | | |
Investments at value — unaffiliated1,2 | | $ | 2,257,752,432 | | | $ | 989,608,550 | | | $ | 948,319,874 | |
Investments at value — affiliated3 | | | 66,264,817 | | | | 26,098,150 | | | | 12,930,954 | |
Investments sold receivable | | | 13,282,024 | | | | 2,586,794 | | | | 6,341,904 | |
Contributions receivable from investors | | | 1,740,606 | | | | 1,242,716 | | | | 1,285,684 | |
Dividends receivable | | | 2,515,877 | | | | 1,065,385 | | | | 1,223,081 | |
Securities lending income receivable — affiliated | | | 2,238 | | | | 1,246 | | | | 393 | |
Prepaid expenses | | | 18,157 | | | | 4,182 | | | | 16,722 | |
| | | | |
Total assets | | | 2,341,576,151 | | | | 1,020,607,023 | | | | 970,118,612 | |
| | | | |
| | | | | | | | | | | | |
| Liabilities | | | | | | | | | | | | |
Bank overdraft | | | 117,784 | | | | — | | | | 52,061 | |
Collateral on securities loaned at value | | | 18,691,623 | | | | 13,291,349 | | | | 5,175,835 | |
Investments purchased payable | | | 10,062,851 | | | | — | | | | 5,186,809 | |
Withdrawals payable to investors | | | 2,779,472 | | | | 1,770,936 | | | | 3,664,059 | |
Investment advisory fees payable | | | 895,362 | | | | 436,919 | | | | 397,309 | |
Directors’ fees payable | | | 17,221 | | | | 7,853 | | | | 9,454 | |
Other affiliates payable | | | 5,957 | | | | 2,553 | | | | 2,620 | |
Other accrued expenses payable | | | 109,486 | | | | 89,090 | | | | 83,636 | |
| | | | |
Total liabilities | | | 32,679,756 | | | | 15,598,700 | | | | 14,571,783 | |
| | | | |
Net Assets | | $ | 2,308,896,395 | | | $ | 1,005,008,323 | | | $ | 955,546,829 | |
| | | | |
| | | | | | | | | | | | |
| Net Assets Consist of | | | | | | | | | | | | |
Investors’ capital | | $ | 1,782,143,778 | | | $ | 789,418,646 | | | $ | 738,304,642 | |
Net unrealized appreciation/depreciation | | | 526,752,617 | | | | 215,589,677 | | | | 217,242,187 | |
| | | | |
Net Assets | | $ | 2,308,896,395 | | | $ | 1,005,008,323 | | | $ | 955,546,829 | |
| | | | |
1 Investments at cost — unaffiliated | | $ | 1,730,999,815 | | | $ | 774,018,873 | | | $ | 731,077,687 | |
2 Securities loaned at value | | $ | 17,968,618 | | | $ | 12,711,153 | | | $ | 4,930,263 | |
3 Investments at cost — affiliated | | $ | 66,264,817 | | | $ | 26,098,150 | | | $ | 12,930,954 | |
See Notes to Financial Statements.
| | | | | | |
| 62 | | BLACKROCK LARGE CAP SERIES FUNDS, INC. | | SEPTEMBER 30, 2013 | | |
| | | | |
| Statements of Operations | | | Master Large Cap Series LLC | |
| | | | | | | | | | | | |
| Year Ended September 30, 2013 | | Master Large
Cap Core
Portfolio | | | Master Large
Cap Growth
Portfolio | | | Master Large
Cap Value
Portfolio | |
| | | | | | | | | | | | |
| Investment Income | | | | | | | | | | | | |
Dividends — unaffiliated | | $ | 40,993,765 | | | $ | 16,814,696 | | | $ | 21,476,733 | |
Foreign taxes withheld | | | (131,490 | ) | | | (56,987 | ) | | | (63,932 | ) |
Securities lending — affiliated | | | 24,091 | | | | 211,227 | | | | 18,587 | |
Dividends — affiliated | | | 22,452 | | | | 25,738 | | | | 11,916 | |
| | | | |
Total income | | | 40,908,818 | | | | 16,994,674 | | | | 21,443,304 | |
| | | | |
| | | | | | | | | | | | |
| Expenses | | | | | | | | | | | | |
Investment advisory | | | 10,773,589 | | | | 4,769,296 | | | | 5,065,988 | |
Accounting services | | | 385,897 | | | | 203,059 | | | | 207,408 | |
Custodian | | | 77,818 | | | | 39,140 | | | | 41,202 | |
Directors | | | 73,178 | | | | 31,787 | | | | 35,070 | |
Professional | | | 70,113 | | | | 61,620 | | | | 62,616 | |
Printing | | | 12,630 | | | | 10,572 | | | | 10,727 | |
Miscellaneous | | | 29,483 | | | | 23,265 | | | | 33,019 | |
| | | | |
Total expenses | | | 11,422,708 | | | | 5,138,739 | | | | 5,456,030 | |
Less fees waived by Manager | | | (19,256 | ) | | | (21,030 | ) | | | (9,300 | ) |
| | | | |
Total expenses after fees waived | | | 11,403,452 | | | | 5,117,709 | | | | 5,446,730 | |
| | | | |
Net investment income. | | | 29,505,366 | | | | 11,876,965 | | | | 15,996,574 | |
| | | | |
| | | | | | | | | | | | |
| Realized and Unrealized Gain (Loss) | | | | | | | | | | | | |
Net realized gain (loss) from: | | | | | | | | | | | | |
Investments | | | 284,666,969 | | | | 87,090,427 | | | | 121,265,542 | |
Financial futures contracts | | | — | | | | 1,675,029 | | | | — | |
Foreign currency transactions | | | (18,284 | ) | | | (7,681 | ) | | | (8,820 | ) |
| | | | |
| | | 284,648,685 | | | | 88,757,775 | | | | 121,256,722 | |
| | | | |
Net change in unrealized appreciation/depreciation on investments | | | 106,688,133 | | | | 43,418,789 | | | | 71,842,498 | |
| | | | |
Total realized and unrealized gain | | | 391,336,818 | | | | 132,176,564 | | | | 193,099,220 | |
| | | | |
Net Increase in Net Assets Resulting from Operations | | $ | 420,842,184 | | | $ | 144,053,529 | | | $ | 209,095,794 | |
| | | | |
See Notes to Financial Statements.
| | | | | | |
| | | BLACKROCK LARGE CAP SERIES FUNDS, INC. | | SEPTEMBER 30, 2013 | | 63 |
| | | | |
| Statements of Changes in Net Assets | | | Master Large Cap Series LLC | |
| | | | | | | | | | | | | | | | |
| | | Master Large Cap Core Portfolio | | | Master Large Cap Growth Portfolio | |
| | | Year Ended
September 30, | | | Year Ended
September 30, | |
| Increase (Decrease) in Net Assets: | | 2013 | | | 2012 | | | 2013 | | | 2012 | |
| | | | | | | | | | | | | | | | |
| Operations | | | | | | | | | | | | | | | | |
Net investment income | | $ | 29,505,366 | | | $ | 40,780,497 | | | $ | 11,876,965 | | | $ | 17,778,424 | |
Net realized gain | | | 284,648,685 | | | | 115,001,657 | | | | 88,757,775 | | | | 68,721,003 | |
Net change in unrealized appreciation/depreciation | | | 106,688,133 | | | | 492,381,340 | | | | 43,418,789 | | | | 224,038,951 | |
| | | | | | | | |
Net increase in net assets resulting from operations | | | 420,842,184 | | | | 648,163,494 | | | | 144,053,529 | | | | 310,538,378 | |
| | | | | | | | |
| | | | | | | | | | | | | | | | |
| Capital Share Transactions | | | | | | | | | | | | | | | | |
Proceeds from contributions | | | 195,011,707 | | | | 328,459,593 | | | | 279,421,776 | | | | 283,535,489 | |
Value of withdrawals | | | (625,808,249 | ) | | | (964,485,911 | ) | | | (332,098,730 | ) | | | (675,721,332 | ) |
| | | | | | | | |
Net decrease in net assets derived from capital share transactions | | | (430,796,542 | ) | | | (636,026,318 | ) | | | (52,676,954 | ) | | | (392,185,843 | ) |
| | | | | | | | |
| | | | | | | | | | | | | | | | |
| Net Assets | | | | | | | | | | | | | | | | |
Total increase (decrease) in net assets | | | (9,954,358 | ) | | | 12,137,176 | | | | 91,376,575 | | | | (81,647,465 | ) |
Beginning of year | | | 2,318,850,753 | | | | 2,306,713,577 | | | | 913,631,748 | | | | 995,279,213 | |
| | | | | | | | |
End of year | | $ | 2,308,896,395 | | | $ | 2,318,850,753 | | | $ | 1,005,008,323 | | | $ | 913,631,748 | |
| | | | | | | | |
| | | | | | | | |
| | | Master Large Cap Value Portfolio | |
| | | Year Ended
September 30, | |
| Increase (Decrease) in Net Assets: | | 2013 | | | 2012 | |
| | | | | | | | |
| Operations | | | | | | | | |
Net investment income | | $ | 15,996,574 | | | $ | 22,102,476 | |
Net realized gain | | | 121,256,722 | | | | 55,248,783 | |
Net change in unrealized appreciation/depreciation | | | 71,842,498 | | | | 230,561,018 | |
| | | | |
Net increase in net assets resulting from operations | | | 209,095,794 | | | | 307,912,277 | |
| | | | |
| | | | | | | | |
| Capital Share Transactions | | | | | | | | |
Proceeds from contributions | | | 154,966,835 | | | | 186,480,972 | |
Value of withdrawals | | | (472,339,324 | ) | | | (761,671,551 | ) |
| | | | |
Net decrease in net assets derived from capital share transactions | | | (317,372,489 | ) | | | (575,190,579 | ) |
| | | | |
| | | | | | | | |
| Net Assets | | | | | | | | |
Total decrease in net assets | | | (108,276,695 | ) | | | (267,278,302 | ) |
Beginning of year | | | 1,063,823,524 | | | | 1,331,101,826 | |
| | | | |
End of year | | $ | 955,546,829 | | | $ | 1,063,823,524 | |
| | | | |
See Notes to Financial Statements.
| | | | | | |
| 64 | | BLACKROCK LARGE CAP SERIES FUNDS, INC. | | SEPTEMBER 30, 2013 | | |
| | | | |
| Financial Highlights | | | Master Large Cap Series LLC | |
| | | | | | | | | | | | | | | | | | | | | | | | |
| | | Master Large Cap Core Portfolio | |
| | | | | | | | | | | | | | | Period | | | | |
| | | | | | | | | | | | | | | November 1, | | | | |
| | | | | | | | | | | | | | | 2008 to | | | Year Ended | |
| | | Year Ended September 30, | | | September 30, | | | October 31, | |
| | | 2013 | | | 2012 | | | 2011 | | | 2010 | | | 2009 | | | 2008 | |
| Total Investment Return | | | | | | | | | | | | | | | | | | | | | | | | |
Total investment return | | | 20.39 | % | | | 29.97 | % | | | (1.61 | )% | | | 6.16 | % | | | 12.63 | %1,2 | | | (38.84 | )% |
| | | | |
| | | | | | | | | | | | | | | | | | | | | | | | |
| Ratios to Average Net Assets | | | | | | | | | | | | | | | | | | | | | | | | |
Total expenses | | | 0.50 | % | | | 0.50 | % | | | 0.49 | % | | | 0.49 | % | | | 0.50 | %3 | | | 0.50 | % |
| | | | |
Net investment income | | | 1.29 | % | | | 1.67 | % | | | 1.13 | % | | | 1.11 | % | | | 1.56 | %3 | | | 0.93 | % |
| | | | |
| | | | | | | | | | | | | | | | | | | | | | | | |
| Supplemental Data | | | | | | | | | | | | | | | | | | | | | | | | |
Net assets, end of period (000) | | $ | 2,308,896 | | | $ | 2,318,851 | | | $ | 2,306,714 | | | $ | 3,209,486 | | | $ | 3,946,322 | | | $ | 2,843,515 | |
| | | | |
Portfolio turnover | | | 50 | % | | | 128 | % | | | 129 | % | | | 173 | % | | | 168 | % | | | 109 | % |
| | | | |
| | | | | | | | | | | | | | | | | | | | | | | | |
| | | Master Large Cap Growth Portfolio | |
| | | | | | | | | | | | | | | Period | | | | |
| | | | | | | | | | | | | | | November 1, | | | | |
| | | | | | | | | | | | | | | 2008 to | | | Year Ended | |
| | | Year Ended September 30, | | | September 30, | | | October 31, | |
| | | 2013 | | | 2012 | | | 2011 | | | 2010 | | | 2009 | | | 2008 | |
| Total Investment Return | | | | | | | | | | | | | | | | | | | | | | | | |
Total investment return | | | 15.76 | % | | | 31.61 | % | | | 0.72 | % | | | 7.68 | % | | | 20.49 | %2,4 | | | (37.96 | )% |
| | | | |
| | | | | | | | | | | | | | | | | | | | | | | | |
| Ratios to Average Net Assets | | | | | | | | | | | | | | | | | | | | | | | | |
Total expenses | | | 0.54 | % | | | 0.55 | % | | | 0.54 | % | | | 0.56 | % | | | 0.57 | %3 | | | 0.56 | % |
| | | | |
Net investment income | | | 1.25 | % | | | 1.61 | % | | | 0.93 | % | | | 0.73 | % | | | 0.81 | %3 | | | 0.54 | % |
| | | | |
| | | | | | | | | | | | | | | | | | | | | | | | |
| Supplemental Data | | | | | | | | | | | | | | | | | | | | | | | | |
Net assets, end of period (000) | | $ | 1,005,008 | | | $ | 913,632 | | | $ | 995,279 | | | $ | 671,834 | | | $ | 733,888 | | | $ | 665,963 | |
| | | | |
Portfolio turnover | | | 54 | % | | | 132 | % | | | 169 | % | | | 232 | % | | | 242 | % | | | 144 | % |
| | | | |
| | | | | | | | | | | | | | | | | | | | | | | | |
| | | Master Large Cap Value Portfolio | |
| | | | | | | | | | | | | | | Period | | | | |
| | | | | | | | | | | | | | | November 1, | | | | |
| | | | | | | | | | | | | | | 2008 to | | | Year Ended | |
| | | Year Ended September 30, | | | September 30, | | | October 31, | |
| | | 2013 | | | 2012 | | | 2011 | | | 2010 | | | 2009 | | | 2008 | |
| Total Investment Return | | | | | | | | | | | | | | | | | | | | | | | | |
Total investment return | | | 22.80 | % | | | 25.26 | % | | | (4.34 | )% | | | 4.36 | % | | | 9.03 | %2,5 | | | (36.54 | )% |
| | | | |
| | | | | | | | | | | | | | | | | | | | | | | | |
| Ratios to Average Net Assets | | | | | | | | | | | | | | | | | | | | | | | | |
Total expenses | | | 0.54 | % | | | 0.54 | % | | | 0.54 | % | | | 0.53 | % | | | 0.54 | %3 | | | 0.51 | % |
| | | | |
Net investment income | | | 1.58 | % | | | 1.71 | % | | | 1.28 | % | | | 1.35 | % | | | 1.88 | %3 | | | 1.22 | % |
| | | | |
| | | | | | | | | | | | | | | | | | | | | | | | |
| Supplemental Data | | | | | | | | | | | | | | | | | | | | | | | | |
Net assets, end of period (000) | | $ | 955,547 | | | $ | 1,063,824 | | | $ | 1,331,102 | | | $ | 2,173,142 | | | $ | 2,645,858 | | | $ | 3,063,116 | |
| | | | |
Portfolio turnover | | | 40 | % | | | 147 | % | | | 156 | % | | | 183 | % | | | 151 | % | | | 108 | % |
| | | | |
| | 1 | Includes proceeds received from a settlement of litigation, which impacted the Portfolio’s total investment return. Not including these proceeds, the Portfolio’s total investment return would have been 12.39%. |
| | 2 | Aggregate total investment return. |
| | 4 | Includes proceeds received from a settlement of litigation, which impacted the Portfolio’s total investment return. Not including these proceeds, the Portfolio’s total investment return would have been 20.23%. |
| | 5 | Includes proceeds received from a settlement of litigation, which impacted the Portfolio’s total investment return. Not including these proceeds, the Portfolio’s total investment return would have been 8.61%. |
See Notes to Financial Statements.
| | | | | | |
| | | BLACKROCK LARGE CAP SERIES FUNDS, INC. | | SEPTEMBER 30, 2013 | | 65 |
| | | | |
| Notes to Financial Statements | | | Master Large Cap Series LLC | |
1. Organization:
Master Large Cap Core Portfolio, Master Large Cap Growth Portfolio and Master Large Cap Value Portfolio (collectively the “Portfolios” or individually a “Portfolio”) are each a series of Master Large Cap Series LLC (the “Master LLC”). The Master LLC is registered under the Investment Company Act of 1940, as amended (the “1940 Act”), as an open-end management investment company and is organized as a Delaware limited liability company. Each Portfolio is classified as diversified. The Limited Liability Company Agreement of the Master LLC permits the Board of Directors of the Master LLC (the “Board”) to issue non-transferable interests in the Master LLC, subject to certain limitations.
2. Significant Accounting Policies:
The Portfolios’ financial statements are prepared in conformity with accounting principles generally accepted in the United States of America (“US GAAP”), which may require management to make estimates and assumptions that affect the reported amounts of assets and liabilities in the financial statements and the reported amount of increases and decreases in net assets from operations during the reporting period. Actual results could differ from those estimates. The following is a summary of significant accounting policies followed by the Portfolios:
Valuation: US GAAP defines fair value as the price the Portfolios would receive to sell an asset or pay to transfer a liability in an orderly transaction between market participants at the measurement date. The Portfolios determine the fair value of their financial instruments at market value using independent dealers or pricing services under policies approved by the Board. The BlackRock Global Valuation Methodologies Committee (the “Global Valuation Committee”) is the committee formed by management to develop global pricing policies and procedures and to provide oversight of the pricing function for the Portfolios for all financial instruments.
Equity investments traded on a recognized securities exchange or the NASDAQ Stock Market (“NASDAQ”) are valued at the last reported sale price that day or the NASDAQ official closing price, if applicable. For equity investments traded on more than one exchange, the last reported sale price on the exchange where the stock is primarily traded is used. Equity investments traded on a recognized exchange for which there were no sales on that day are valued at the last available bid (long positions) or ask (short positions) price. Investments in open-end registered investment companies are valued at NAV each business day. Short-term securities with remaining maturities of 60 days or less may be valued at amortized cost, which approximates fair value.
The Portfolios value their investments in BlackRock Liquidity Series, LLC, Money Market Series (the “Money Market Series”) at fair value, which is ordinarily based upon their pro rata ownership in the underlying fund’s net assets. The Money Market Series seeks current income consistent with maintaining liquidity and preserving capital. Although the Money Market Series is not registered under the 1940 Act, its investments will follow the parameters of investments by a money market fund that is subject to Rule 2a-7 under the 1940 Act. The Portfolios may withdraw up to 25% of their investment daily, although the manager of the Money Market Series, in its sole discretion, may permit an investor to withdraw more than 25% on any one day.
In the event that application of these methods of valuation results in a price for an investment which is deemed not to be representative of the market value of such investment or if a price is not available, the investment will be valued by the Global Valuation Committee, or its delegate, in accordance with a policy approved by the Board as reflecting fair value (“Fair Value Assets”). When determining the price for Fair Value Assets, the Global Valuation Committee, or its delegate, seeks to determine the price that the Portfolios might reasonably expect to receive from the current sale of that asset in an arm’s-length transaction. Fair value determinations shall be based upon all available factors that the Global Valuation Committee, or its delegate, deem relevant consistent with the principles of fair value measurement, which include the market approach, income approach and/or in the case of recent investments, the cost approach, as appropriate. The market approach generally consists of using comparable market transactions. The income approach generally is used to discount future cash flows to present value and adjusted for liquidity as appropriate. These factors include but are not limited to (i) attributes specific to the investment or asset; (ii) the principal market for the investment or asset; (iii) the customary participants in the principal market for the investment or asset; (iv) data assumptions by market participants for the investment or asset, if reasonably available; (v) quoted prices for similar investments or assets in active markets; and (vi) other factors, such as future cash flows, interest rates, yield curves, volatilities, prepayment speeds, loss severities, credit risks, recovery rates, liquidation amounts and/or default rates. Due to the inherent uncertainty of valuations of such investments, the fair values may differ from the values that would have been used had an active market existed. The Global Valuation Committee, or its delegate, employs various methods for calibrating valuation approaches for investments where an active market does not exist including regular due diligence of the Portfolios’ pricing vendors, regular reviews of key inputs and assumptions, transactional back-testing or disposition analysis to compare unrealized gains and losses to realized gains and losses, reviews of missing or stale prices and large movements in market values and reviews of any market related activity. The pricing of all Fair Value Assets is subsequently reported to the Board or a committee thereof on a quarterly basis.
Foreign Currency: The Portfolios’ books and records are maintained in US dollars. Purchases and sales of investment securities are recorded at the rates of exchange prevailing on the respective date of such transactions. Generally, when the US dollar rises in value against a foreign currency, the Portfolios’ investments denominated in that currency will lose value because that currency is worth fewer US dollars; the opposite effect occurs if the US dollar falls in relative value.
The Portfolios do not isolate the portion of the results of operations arising as a result of changes in the foreign exchange rates from the changes in the market prices of foreign-denominated equity and fixed income investments held for financial reporting purposes. Accordingly, the effects of changes in foreign currency exchange rates on those investments held are not segregated in the Statements of Operations from the effects of changes in market prices and are included as a component of net unrealized gain (loss) from investments. The Portfolios do not isolate the portion of the results of operations arising as a result of changes in the foreign exchange rates from the changes in the market
| | | | | | |
| 66 | | BLACKROCK LARGE CAP SERIES FUNDS, INC. | | SEPTEMBER 30, 2013 | | |
| | | | |
| Notes to Financial Statements (continued) | | | Master Large Cap Series LLC | |
prices upon the sale of foreign-denominated equity investments for financial reporting purposes and are included as a component of net realized gain (loss) from investments. However, the Portfolios do isolate the effect of fluctuations in foreign exchange rates when determining the realized gain (loss) upon the sale or maturity of foreign-denominated fixed income investments and are categorized as net realized gain (loss) from foreign currency transactions for financial reporting which may be treated as ordinary income for federal income tax purposes.
Segregation and Collateralization: In cases in which the 1940 Act and the interpretive positions of the Securities and Exchange Commission (“SEC”) require that the Portfolios either deliver collateral or segregate assets in connection with certain investments (e.g., foreign currency exchange contracts), the Portfolios will, consistent with SEC rules and/or certain interpretive letters issued by the SEC, segregate collateral or designate on their books and records cash or liquid securities having a market value at least equal to the amount that would otherwise be required to be physically segregated. Furthermore, based on requirements and agreements with certain exchanges and third party broker-dealers, a Portfolio engaging in such transactions may have requirements to deliver/deposit securities to/with an exchange or broker-dealer as collateral for certain investments.
Investment Transactions and Investment Income: For financial reporting purposes, investment transactions are recorded on the dates the transactions are entered into (the trade dates). Realized gains and losses on investment transactions are determined on the identified cost basis. Dividend income is recorded on the ex-dividend dates. Dividends from foreign securities where the ex-dividend date may have passed are subsequently recorded when the Portfolios are informed of the ex-dividend date. Under the applicable foreign tax laws, a withholding tax at various rates may be imposed on capital gains, dividends and interest. Upon notification from issuers, some of the dividend income received from a real estate investment trust may be redesignated as a reduction of cost of the related investment and/or realized gain.
Income Taxes: Each Portfolio is classified as a partnership for federal income tax purposes. As such, each investor in the Portfolios is treated as the owner of its proportionate share of net assets, income, expenses and realized and unrealized gains and losses of the Portfolios. Therefore, no federal income tax provision is required. It is intended that the Portfolios’ assets will be managed so an investor in the Portfolios can satisfy the requirements of Subchapter M of the Internal Revenue Code of 1986, as amended.
Each Portfolio files US federal and various state and local tax returns. No income tax returns are currently under examination. The statute of limitations on each Portfolio’s US federal tax returns remains open for each of the four years ended September 30, 2013. The statutes of limitations on each Portfolio’s state and local tax returns may remain open for an additional year depending upon the jurisdiction. Management does not believe there are any uncertain tax positions that require recognition of a tax liability.
Recent Accounting Standards: In December 2011, the Financial Accounting Standards Board (the “FASB”) issued guidance that will expand current disclosure requirements on the offsetting of certain assets and liabilities. The new disclosures will be required for investments and derivative financial instruments subject to master netting or similar agreements, which are eligible for offset in the Statements of Assets and Liabilities and will require an entity to disclose both gross and net information about such investments and transactions in the financial statements. In January 2013, the FASB issued guidance that clarifies which investments and transactions are subject to the offsetting disclosure requirements. The scope of the disclosure requirements for offsetting will be limited to derivative instruments, repurchase agreements and reverse repurchase agreements, and securities borrowing and securities lending transactions. The guidance is effective for financial statements with fiscal years beginning on or after January 1, 2013, and interim periods within those fiscal years. Management is evaluating the impact, if any, of this guidance on the Portfolios’ financial statement disclosures.
Other: Expenses directly related to one Portfolio are charged to that Portfolio. Other operating expenses shared by several funds are pro rated among those funds on the basis of relative net assets or other appropriate methods.
Each Portfolio has an arrangement with the custodian whereby fees may be reduced by credits earned on uninvested cash balances, which, if applicable, are shown as fees paid indirectly in the Statements of Operations. The custodian imposes fees on overdrawn cash balances, which can be offset by accumulated credits earned or may result in additional custody charges.
3. Securities and Other Investments:
Securities Lending: The Portfolios may lend securities to approved borrowers, such as banks, brokers and other financial institutions. The borrower pledges cash, securities issued or guaranteed by the US government or irrevocable letters of credit issued by a bank as collateral. The initial collateral received by each Portfolio should have a value of at least 102% of the current value of the loaned securities for securities traded on US exchanges and a value of at least 105% for all other securities. The collateral is maintained thereafter in an amount equal to at least 100% of the current market value of the loaned securities. The market value of the loaned securities is determined at the close of business of the Portfolios and any additional required collateral is delivered to the Portfolios on the next business day. Securities lending income, as disclosed in the Statements of Operations, represents the income earned from the investment of the cash collateral, net of rebates paid to, or fees paid by, borrowers and less the fees paid to the securities lending agent. During the term of the loan, the Portfolios earn dividend or interest income on the securities loaned but do not receive interest income on the securities received as collateral. Loans of securities are terminable at any time and the borrower, after notice, is required to return borrowed securities within the standard time period for settlement of securities transactions.
| | | | | | |
| | | BLACKROCK LARGE CAP SERIES FUNDS, INC. | | SEPTEMBER 30, 2013 | | 67 |
| | | | |
| Notes to Financial Statements (continued) | | | Master Large Cap Series LLC | |
The market value of securities on loan and the value of the related collateral are shown separately in the Statements of Assets and Liabilities as a component of investments at value, and collateral on securities loaned at value, respectively. The cash collateral invested by the securities lending agent, BlackRock Investment Management, LLC (“BIM”), if any, is disclosed in the Schedules of Investments.
Securities lending transactions are entered into by the Portfolios under Master Securities Lending Agreements (“MSLA”) which provide the right, in the event of default (including bankruptcy or insolvency) for the non-defaulting party to liquidate the collateral and calculate a net exposure to the defaulting party or request additional collateral. In the event that a borrower defaults, each Portfolio, as lender, would offset the market value of the collateral received against the market value of the securities loaned. The value of the collateral is typically greater than that of the market value of the securities loaned, leaving the lender with a net amount payable to the defaulting party. However, bankruptcy or insolvency laws of a particular jurisdiction may impose restrictions on or prohibitions against such a right of offset in the event of a MSLA counterparty’s bankruptcy or insolvency. Under the MSLA, the borrower can resell or re-pledge the loaned securities, and the Portfolios can reinvest cash collateral, or, upon the event of default, resell or re-pledge the collateral.
The risks of securities lending also include the risk that the borrower may not provide additional collateral when required or may not return the securities when due. To mitigate this risk, the Portfolios benefit from a borrower default indemnity provided by BlackRock, Inc. (“BlackRock”). BlackRock’s indemnity allows for full replacement of securities lent. The Portfolios also could suffer a loss if the value of an investment purchased with cash collateral falls below the market value of loaned securities or if the value of an investment purchased with cash collateral falls below the value of the original cash collateral received. During the year ended September 30, 2013, any securities on loan were collateralized by cash.
4. Derivative Financial Instruments:
The Portfolios engage in various portfolio investment strategies using derivative contracts both to increase the returns of the Portfolios and/or to economically hedge, or protect, their exposure to certain risks such as equity risk, interest rate risk and foreign currency exchange rate risk. These contracts may be transacted on an exchange or over-the-counter (“OTC”).
Financial Futures Contracts: The Portfolios purchase and/or sell financial futures contracts and options on financial futures contracts to gain exposure to, or economically hedge against, changes in interest rates (interest rate risk), changes in the value of equity securities (equity risk) or foreign currencies (foreign currency exchange rate risk). Financial futures contracts are agreements between the Portfolios and a counterparty to buy or sell a specific quantity of an underlying instrument at a specified price and at a specified date. Depending on the terms of the particular contract, financial futures contracts are settled
either through physical delivery of the underlying instrument on the settlement date or by payment of a cash settlement amount on the settlement date. Pursuant to the contract, the Portfolios agree to receive from or pay to the broker an amount of cash equal to the daily fluctuation in value of the contract. Such receipts or payments are known as variation margin. Variation margin is recorded by the Portfolios as unrealized appreciation or depreciation, and if applicable, as receivable or payable for variation margin in the Statements of Assets and Liabilities. When the contract is closed, the Portfolios record a realized gain or loss equal to the difference between the value of the contract at the time it was opened and the value at the time it was closed. The use of financial futures contracts involves the risk of an imperfect correlation in the movements in the price of financial futures contracts, interest or foreign currency exchange rates and the underlying assets.
Foreign Currency Exchange Contracts: The Portfolios enter into foreign currency exchange contracts as an economic hedge against either specific transactions or portfolio instruments or to obtain exposure to, or hedge exposure away from, foreign currencies (foreign currency exchange rate risk). A foreign currency exchange contract is an agreement between two parties to buy and sell a currency at a set exchange rate on a future date. Foreign currency exchange contracts, when used by the Portfolios, help to manage the overall exposure to the currencies in which some of the investments held by the Portfolios are denominated. The contract is marked-to-market daily and the change in market value is recorded by the Portfolios as an unrealized gain or loss. When the contract is closed, the Portfolios record a realized gain or loss equal to the difference between the value at the time it was opened and the value at the time it was closed. The use of foreign currency exchange contracts involves the risk that the value of a foreign currency exchange contract changes unfavorably due to movements in the value of the referenced foreign currencies.
The following is a summary of the Portfolios’ derivative financial instruments categorized by risk exposure:
| | | | | | | | | | | | |
The Effect of Derivative Financial Instruments in the Statements of Operations
Year Ended September 30, 2013 | |
| | | Net Realized Gain (Loss) From | |
| | | Master
Large Cap
Core
Portfolio | | | Master
Large Cap
Growth
Portfolio | | | Master
Large Cap
Value
Portfolio | |
Foreign currency exchange contracts: | | | | | | | | | | | | |
Foreign currency exchange contracts | | $ | (18,284 | ) | | $ | (7,681 | ) | | $ | (8,820 | ) |
Equity contracts: | |
Financial futures contracts | | | — | | | | 1,675,029 | | | | — | |
| | | | |
Total | | $ | (18,284 | ) | | $ | 1,667,348 | | | $ | (8,820 | ) |
| | | | | | |
| 68 | | BLACKROCK LARGE CAP SERIES FUNDS, INC. | | SEPTEMBER 30, 2013 | | |
| | | | |
| Notes to Financial Statements (continued) | | | Master Large Cap Series LLC | |
For the year ended September 30, 2013, the average quarterly balances of outstanding derivative financial instruments were as follows:
| | | | | | | | | | | | |
| | | Master
Large Cap
Core
Portfolio | | | Master
Large Cap
Growth
Portfolio | | | Master
Large Cap
Value
Portfolio | |
Financial futures contracts: | | | | | | | | | | | | |
Average number of contracts purchased | | | — | | | | 116 | | | | — | |
Average notional value of contracts purchased | | | — | | | $ | 9,162,938 | | | | — | |
Foreign currency exchange contracts: | | | | | | | | | | | | |
Average number of contracts - US dollars purchased | | | 1 | 1 | | | 1 | 1 | | | 1 | 1 |
Average US dollar amounts purchased | | $ | 134,532 | | | $ | 56,515 | | | $ | 64,894 | |
| | 1 | Actual contract amount shown due to limited activity. |
Counterparty Credit Risk: A derivative contract may suffer a mark to market loss if the value of the contract decreases due to an unfavorable change in the market rates or values of the underlying instrument. Losses can also occur if the counterparty does not perform under the contract.
With exchange traded futures, there is less counterparty credit risk to the Portfolios since the exchange or clearinghouse, as counterparty to such instruments, guarantees against a possible default. The clearinghouse stands between the buyer and the seller of the contract; therefore, the credit risk is limited to failure of the clearinghouse. Credit risk exists in exchange traded futures with respect to initial and variation margin that is held in a clearing broker’s customer accounts. While clearing brokers are required to segregate customer margin from their own assets, in the event that a clearing broker becomes insolvent or goes into bankruptcy and at that time there is a shortfall in the aggregate amount of margin held by the clearing broker for all its clients, typically the shortfall would be allocated on a pro rata basis across all the clearing broker’s customers, potentially resulting in losses to the Portfolios.
In order to better define its contractual rights and to secure rights that will help the Portfolios mitigate their counterparty risk, the Portfolios may enter into an International Swaps and Derivatives Association, Inc. Master Agreement (“ISDA Master Agreement”) or similar agreement with its derivative contract counterparties. An ISDA Master Agreement is a bilateral agreement between each Portfolio and a counterparty that governs OTC derivatives and foreign exchange contracts and typically contains, among other things, collateral posting terms and netting provisions in the event of a default and/or termination event. Under an ISDA Master Agreement, each Portfolio may, under certain circumstances, offset with the counterparty certain derivative financial instruments’ payables and/or receivables with collateral held and/or posted and create one single net payment. The provisions of the ISDA Master Agreement typically permit a single net payment in the event of default including the bankruptcy or insolvency of the counterparty. However, bankruptcy or insolvency laws of a particular jurisdiction may impose restrictions on or prohibitions against the right of offset in bankruptcy, insolvency or other events. In addition, certain ISDA Master Agreements allow counterparties to OTC derivatives to terminate derivative contracts prior to maturity in
the event a Portfolio’s net assets decline by a stated percentage or a Portfolio fails to meet the terms of its ISDA Master Agreements, which would cause the Portfolio to accelerate payment of any net liability owed to the counterparty.
5. Investment Advisory Agreement and Other Transactions with Affiliates:
The PNC Financial Services Group, Inc. is the largest stockholder and an affiliate, for 1940 Act purposes, of BlackRock.
The Master LLC, on behalf of each Portfolio, entered into an Investment Advisory Agreement with BlackRock Advisors, LLC (the “Manager”), the Portfolios’ investment advisor, an indirect, wholly owned subsidiary of BlackRock, to provide investment advisory and administration services. The Manager is responsible for the management of each Portfolio and provides the necessary personnel, facilities, equipment and certain other services necessary to the operations of each Portfolio. For such services, each Portfolio pays the Manager a monthly fee based on a percentage of each Portfolio’s average daily net assets at the following annual rates:
Master Large Cap Core Portfolio
| | | | |
| Average Daily Net Assets | | Rate | |
Not exceeding $1 Billion | | | 0.50 | % |
In excess of $1 Billion, but not exceeding $5 Billion | | | 0.45 | % |
In excess of $5 Billion | | | 0.40 | % |
Master Large Cap Growth Portfolio
| | | | |
| Average Daily Net Assets | | Rate | |
Not exceeding $5 Billion | | | 0.50 | % |
In excess of $5 Billion | | | 0.45 | % |
Master Large Cap Value Portfolio
| | | | |
| Average Daily Net Assets | | Rate | |
Not exceeding $3 Billion | | | 0.50 | % |
In excess of $3 Billion | | | 0.45 | % |
The Manager voluntarily agreed to waive its investment advisory fees by the amount of investment advisory fees each Portfolio pays to the Manager indirectly through its investment in affiliated money market funds. However, the Manager does not waive its investment advisory fees by the amount of investment advisory fees paid in connection with each Portfolio’s investment in other affiliated investment companies, if any. These amounts are shown as fees waived by Manager in the Statements of Operations. For the year ended September 30, 2013, the amounts waived were as follows:
| | | | |
Master Large Cap Core Portfolio | | $ | 19,256 | |
Master Large Cap Growth Portfolio | | $ | 21,030 | |
Master Large Cap Value Portfolio | | $ | 9,300 | |
The Manager entered into a sub-advisory agreement with BIM, an affiliate of the Manager. The Manager pays BIM, for services it provides, a monthly fee that is a percentage of the investment advisory fees paid by each Portfolio to the Manager.
| | | | | | |
| | | BLACKROCK LARGE CAP SERIES FUNDS, INC. | | SEPTEMBER 30, 2013 | | 69 |
| | | | |
| Notes to Financial Statements (continued) | | | Master Large Cap Series LLC | |
For the year ended September 30, 2013, the Portfolios reimbursed the Manager for certain accounting services, which is included in accounting services in the Statements of Operations. The reimbursements were as follows:
| | | | |
Master Large Cap Core Portfolio | | $ | 21,936 | |
Master Large Cap Growth Portfolio | | $ | 9,641 | |
Master Large Cap Value Portfolio | | $ | 8,374 | |
The Portfolios received an exemptive order from the SEC permitting them, among other things, to pay an affiliated securities lending agent a fee based on a share of the income derived from the securities lending activities and has retained BIM as the securities lending agent. BIM may, on behalf of the Portfolios, invest cash collateral received by the Portfolios for such loans in a private investment company managed by the Manager or in registered money market funds advised by the Manager or its affiliates. The market value of securities on loan and the value of the related collateral, if applicable, is shown in the Statements of Assets and Liabilities as securities loaned at value and collateral on securities loaned at value, respectively. The cash collateral invested by BIM, if any, is disclosed in the Schedules of Investments. Securities lending income is equal to the total of income earned from the reinvestment of cash collateral, net of rebates paid to, or fees paid by, borrowers of securities. The Portfolios retain 65% of securities lending income and pay a fee to BIM equal to 35% of such income. The Portfolios benefit from a borrower default indemnity provided by BlackRock. As a securities lending agent, BIM bears all operational costs directly related to securities lending as well as the cost of the borrower default indemnification. BIM does not receive any fees for managing cash collateral. The share of income earned by the Portfolios on the reinvestment of cash collateral is shown as securities lending — affiliated — net in the Statements of Operations. For the year ended September 30, 2013, BIM received the following in securities lending agent fees related to securities lending activities for the Portfolios:
| | | | |
Master Large Cap Core Portfolio | | $ | 9,630 | |
Master Large Cap Growth Portfolio | | $ | 109,565 | |
Master Large Cap Value Portfolio | | $ | 8,796 | |
Certain officers and/or directors of the Master LLC are officers and/or directors of BlackRock or its affiliates.
The Portfolios may purchase securities from, or sell securities to, an affiliated fund provided the affiliation is solely due to having a common investment adviser, common officers, or common trustees. For the year ended September 30, 2013, the sale transactions with an affiliated fund in compliance with Rule 17a-7 under the 1940 Act for Master Large Cap Growth was $5,001,432.
6. Purchases and Sales:
Purchases and sales of investments, excluding short-term securities, for the year ended September 30, 2013, were as follows:
| | | | | | | | |
| | | Purchases | | | Sales | |
Master Large Cap Core Portfolio | | $ | 1,116,175,493 | | | $ | 1,521,191,468 | |
Master Large Cap Growth Portfolio | | $ | 499,385,847 | | | $ | 533,169,146 | |
Master Large Cap Value Portfolio | | $ | 400,212,386 | | | $ | 698,508,490 | |
7. Bank Borrowings:
The Master LLC, on behalf of the Portfolios, along with certain other funds managed by the Manager and its affiliates (“Participating Funds”), is a party to a 364-day, $800 million credit agreement with a group of lenders, under which the Portfolios may borrow to fund shareholder redemptions. The agreement expires in April 2014. Excluding commitments designated for a certain individual fund, other Participating Funds, including the Portfolio, can borrow up to an aggregate commitment amount of $500 million, subject to asset coverage and other limitations as specified in the agreement. The credit agreement has the following terms: a fee of 0.065% per annum based on each Portfolio’s pro rata share of the unused commitment amounts and interest at a rate equal to the higher of (a) the one-month LIBOR plus 0.80% per annum or (b) the Fed Funds rate plus 0.80% per annum on amounts borrowed. Participating Funds paid administration and arrangement fees, which, along with commitment fees, were allocated among such funds based upon portions of the aggregate commitment available to them and relative net assets of Participating Funds. The Portfolios did not borrow under the credit agreement during the year ended September 30, 2013.
8. Concentration, Market and Credit Risk:
In the normal course of business, the Portfolios invest in securities and enter into transactions where risks exist due to fluctuations in the market (market risk) or failure of the issuer of a security to meet all its obligations (issuer credit risk). The value of securities held by the Portfolios may decline in response to certain events, including those directly involving the issuers whose securities are owned by the Portfolios; conditions affecting the general economy; overall market changes; local, regional or global political, social or economic instability; and currency and interest rate and price fluctuations. Similar to issuer credit risk, the Portfolios may be exposed to counterparty credit risk, or the risk that an entity with which the Portfolios have unsettled or open transactions may fail to or be unable to perform on its commitments. The Portfolios manage counterparty credit risk by entering into transactions only with counterparties that they believe have the financial resources to honor their obligations and by monitoring the financial stability of those counterparties. Financial assets, which potentially expose the Portfolios to market, issuer and counterparty credit risks, consist principally of financial instruments and receivables due from counterparties. The extent of the Portfolios’ exposure to market, issuer and counterparty credit risks with respect to these financial assets is generally approximated by their value recorded in the Statements of Assets and Liabilities, less any collateral held by the Portfolios.
| | | | | | |
| 70 | | BLACKROCK LARGE CAP SERIES FUNDS, INC. | | SEPTEMBER 30, 2013 | | |
| | | | |
| Notes to Financial Statements (concluded) | | | Master Large Cap Series LLC | |
As of September 30, 2013, Master Large Cap Core Portfolio and Master Large Cap Growth Portfolio invested a significant portion of their assets in securities in the Information Technology sector and Master Large Cap Core Portfolio and Master Large Cap Value Portfolio invested a significant portion of their assets in securities in the Financials sector. Changes in economic conditions affecting the Information Technology and Financials sectors would have a greater impact on the Portfolios and could affect the value, income and/or liquidity of positions in such securities.
9. Subsequent Events:
Management has evaluated the impact of all subsequent events on the Portfolios through the date the financial statements were issued and has determined that there were no subsequent events requiring adjustment or additional disclosure in the financial statements.
| | | | | | |
| | | BLACKROCK LARGE CAP SERIES FUNDS, INC. | | SEPTEMBER 30, 2013 | | 71 |
| | | | |
| Report of Independent Registered Public Accounting Firm | | | Master Large Cap Series LLC | |
To the Investors and Board of Directors of Master Large Cap Series LLC:
We have audited the accompanying statements of assets and liabilities, including the schedules of investments, of Master Large Cap Series LLC (the “Master LLC”), comprising Master Large Cap Core Portfolio, Master Large Cap Growth Portfolio and Master Large Cap Value Portfolio as of September 30, 2013, and the related statements of operations for the year then ended, the statements of changes in net assets for each of the two years in the period then ended, and the financial highlights for each of the periods presented. These financial statements and financial highlights are the responsibility of the Master LLC’s management. Our responsibility is to express an opinion on these financial statements and financial highlights based on our audits.
We conducted our audits in accordance with the standards of the Public Company Accounting Oversight Board (United States). Those standards require that we plan and perform the audit to obtain reasonable assurance about whether the financial statements and financial highlights are free of material misstatement. The Master LLC is not required to have, nor were we engaged to perform, an audit of its internal control over financial reporting. Our audits included consideration of internal control over financial reporting as a basis for designing audit procedures that are appropriate in the circumstances, but not for the purpose of expressing an opinion on the effectiveness of the Master LLC’s internal
control over financial reporting. Accordingly, we express no such opinion. An audit also includes examining, on a test basis, evidence supporting the amounts and disclosures in the financial statements, assessing the accounting principles used and significant estimates made by management, as well as evaluating the overall financial statement presentation. Our procedures included confirmation of securities owned as of September 30, 2013, by correspondence with the custodian and brokers; where replies were not received from brokers, we performed other auditing procedures. We believe that our audits provide a reasonable basis for our opinion.
In our opinion, the financial statements and financial highlights referred to above present fairly, in all material respects, the financial position of each of the portfolios constituting Master Large Cap Series LLC as of September 30, 2013, the results of their operations for the year then ended, the changes in their net assets for each of the two years in the period then ended, and the financial highlights for each of the of the periods presented, in conformity with accounting principles generally accepted in the United States of America.
Deloitte & Touche LLP
Philadelphia, Pennsylvania
November 26, 2013
| | | | | | |
| 72 | | BLACKROCK LARGE CAP SERIES FUNDS, INC. | | SEPTEMBER 30, 2013 | | |
| | |
| Disclosure of Investment Advisory Agreement and Sub-Advisory Agreement | | |
The Board of Directors of Master Large Cap Series LLC (the “Master LLC”) met in person on April 11, 2013 (the “April Meeting”) and May 20-22, 2013 (the “May Meeting”) to consider the approval of the Master LLC’s investment advisory agreement (the “Advisory Agreement”) with BlackRock Advisors, LLC (the “Manager”), the Master LLC’s investment advisor, on behalf of each of Master Large Cap Core Portfolio, Master Large Cap Growth Portfolio and Master Large Cap Value Portfolio (each a “Master Portfolio,” and together, the “Master Portfolios”), each a series of the Master LLC. The Board of Directors of the Master LLC also considered the approval of the sub-advisory agreement (the “Sub-Advisory Agreement”) between the Manager and BlackRock Investment Management, LLC (the “Sub-Advisor”), with respect to each Master Portfolio. Each of BlackRock Large Cap Core Fund, BlackRock Large Cap Core Retirement Portfolio, BlackRock Large Cap Growth Fund, BlackRock Large Cap Growth Retirement Portfolio, BlackRock Large Cap Value Fund and BlackRock Large Cap Value Retirement Portfolio (each, a “Feeder Fund,” and together, the “Feeder Funds”), each a series of BlackRock Large Cap Series Funds, Inc. (the “Corporation”), is a “feeder” fund that invests all of its investable assets in the corresponding Master Portfolio. Accordingly, the Board of Directors of the Corporation also considered the approval of the Advisory Agreement and the Sub-Advisory Agreement with respect to the Master Portfolios. The Manager and the Sub-Advisor are referred to herein as “BlackRock.” The Advisory Agreement and the Sub-Advisory Agreement are referred to herein as the “Agreements.” For simplicity, (a) the Board of Directors of the Master LLC and the Board of Directors of the Corporation are referred to herein collectively as the “Board,” and the members are referred to as “Board Members,” and (b) the shareholders of the Feeder Funds and the interest holders of the Master Portfolios are referred to as “shareholders.”
Activities and Composition of the Board
The Board consists of fourteen individuals, twelve of whom are not “interested persons” of the Master LLC or the Corporation as defined in the Investment Company Act of 1940, as amended (the “1940 Act”) (the “Independent Board Members”). The Board Members are responsible for the oversight of the operations of the Master LLC or the Corporation, as pertinent, and perform the various duties imposed on the directors of investment companies by the 1940 Act. The Independent Board Members have retained independent legal counsel to assist them in connection with their duties. The Co-Chairs of the Board are each Independent Board Members. The Board has established five standing committees: an Audit Committee, a Governance and Nominating Committee, a Compliance Committee, a Performance Oversight and Contract Committee and an Executive Committee, each of which is chaired by an Independent Board Member and composed of Independent Board Members (except for the Executive Committee, which also has one interested Board Member).
The Agreements
Pursuant to the 1940 Act, the Board is required to consider the continuation of the Agreements on an annual basis. The Board has four quarterly meetings per year, each extending over two or three days, and a fifth one-day meeting to consider specific information surrounding the consideration of renewing the Agreements. In connection with this process, the Board assessed, among other things, the nature, scope and quality of
the services provided to each Master Portfolio and Feeder Fund by BlackRock, its personnel and its affiliates, including investment management, administrative and shareholder services, oversight of fund accounting and custody, marketing services, risk oversight, compliance and assistance in meeting applicable legal and regulatory requirements.
The Board, acting directly and through its committees, considers at each of its meetings, and from time to time as appropriate, factors that are relevant to its annual consideration of the renewal of the Agreements, including the services and support provided by BlackRock to each Master Portfolio, each Feeder Fund and their respective shareholders. Among the matters the Board considered were: (a) investment performance for one-year, three-year, five-year and/or since inception periods, as applicable, against peer funds, and applicable benchmarks, if any, as well as senior management’s and portfolio managers’ analysis of the reasons for any over performance or underperformance against its peers and/or benchmark, as applicable; (b) fees, including advisory, administration, if applicable, and other amounts paid to BlackRock and its affiliates by each Master Portfolio and/or Feeder Fund for services, such as marketing and distribution, call center and fund accounting; (c) each Master Portfolio’s and/or Feeder Fund’s operating expenses and how BlackRock allocates expenses to the Master Portfolios and the Feeder Funds; (d) the resources devoted to, risk oversight of, and compliance reports relating to, implementation of each Master Portfolio’s and each Feeder Fund’s investment objective, policies and restrictions; (e) the Master LLC’s and the Corporation’s compliance with its respective Code of Ethics and other compliance policies and procedures; (f) the nature, cost and character of non-investment management services provided by BlackRock and its affiliates; (g) BlackRock’s and other service providers’ internal controls and risk and compliance oversight mechanisms; (h) BlackRock’s implementation of the proxy voting policies approved by the Board; (i) the use of brokerage commissions and execution quality of portfolio transactions; (j) BlackRock’s implementation of the Master LLC’s and/or the Corporation’s valuation and liquidity procedures; (k) an analysis of management fees for products with similar investment objectives across the open-end fund, exchange-traded fund (“ETF”), closed-end fund and institutional account product channels, as applicable; (l) BlackRock’s compensation methodology for its investment professionals and the incentives it creates; and (m) periodic updates on BlackRock’s business.
The Board has engaged in an ongoing strategic review with BlackRock of opportunities to consolidate funds and of BlackRock’s commitment to investment performance. In addition, the Board requested and BlackRock provided an analysis of fair valuation and stale pricing policies. BlackRock also furnished information to the Board in response to specific questions. These questions covered issues such as BlackRock’s profitability, investment performance and management fee levels. The Board further considered the importance of: (i) organizational and structural variables to investment performance; (ii) rates of portfolio turnover; (iii) BlackRock’s performance accountability for portfolio managers; (iv) marketing support for the funds; (v) services provided to the Master Portfolios and the Feeder Funds by BlackRock affiliates; and (vi) BlackRock’s oversight of relationships with third party service providers.
| | | | | | |
| | | BLACKROCK LARGE CAP SERIES FUNDS, INC. | | SEPTEMBER 30, 2013 | | 73 |
| | |
| Disclosure of Investment Advisory Agreement and Sub-Advisory Agreement (continued) | | |
Board Considerations in Approving the Agreements
The Approval Process: Prior to the April Meeting, the Board requested and received materials specifically relating to the Agreements. The Board is engaged in a process with its independent legal counsel and BlackRock to review the nature and scope of the information provided to better assist its deliberations. The materials provided in connection with the April Meeting included (a) information independently compiled and prepared by Lipper, Inc. (“Lipper”) on fees and expenses of each Master Portfolio and Feeder Fund, as applicable, as compared with a peer group of funds as determined by Lipper (“Expense Peers”) and the investment performance of each Feeder Fund as compared with a peer group of funds as determined by Lipper1; (b) information on the profits realized by BlackRock and its affiliates pursuant to the Agreements and a discussion of fall-out benefits to BlackRock and its affiliates; (c) a general analysis provided by BlackRock concerning investment management fees charged to other clients, such as institutional clients, ETFs and closed-end funds, under similar investment mandates, as well as the performance of such other clients, as applicable; (d) review of non-management fees; (e) the existence, impact and sharing of potential economies of scale; (f) a summary of aggregate amounts paid by each Master Portfolio and/or Feeder Fund to BlackRock; (g) sales and redemption data regarding each Feeder Fund’s shares; and (h) if applicable, a comparison of management fees to similar BlackRock open-end funds, as classified by Lipper.
At the April Meeting, the Board reviewed materials relating to its consideration of the Agreements. As a result of the discussions that occurred during the April Meeting, and as a culmination of the Board’s year-long deliberative process, the Board presented BlackRock with questions and requests for additional information. BlackRock responded to these requests with additional written information in advance of the May Meeting.
At the May Meeting, the Board of the Master LLC, including the Independent Board Members, unanimously approved the continuation of the Advisory Agreement between the Manager and the Master LLC with respect to each Master Portfolio and the Sub-Advisory Agreement between the Manager and the Sub-Advisor with respect to each Master Portfolio, each for a one-year term ending June 30, 2014. The Board of the Corporation, including the Independent Board Members, also considered the continuation of the Agreements with respect to each Master Portfolio and found the Agreements to be satisfactory. In approving the continuation of the Agreements, the Board of the Master LLC considered: (a) the nature, extent and quality of the services provided by BlackRock; (b) the investment performance of each Master Portfolio, each Feeder Fund and BlackRock; (c) the advisory fee and the cost of the services and profits to be realized by BlackRock and its affiliates from their relationship with each Master Portfolio and Feeder Fund; (d) each Feeder Fund’s costs to investors compared to the costs of its Expense Peers and each Feeder Fund’s performance compared to the relevant performance metric as previously discussed; (e) economies of scale; (f) fall-out benefits to BlackRock as a result of its relationship with the Master Portfolios
| 1 | Lipper ranks funds in quartiles, ranging from first to fourth, where first is the most desirable quartile position and fourth is the least desirable. |
and the Feeder Funds; and (g) other factors deemed relevant by the Board Members.
The Board also considered other matters it deemed important to the approval process, such as payments made to BlackRock or its affiliates relating to the distribution of Feeder Fund shares and securities lending, services related to the valuation and pricing of portfolio holdings of each Master Portfolio, direct and indirect benefits to BlackRock and its affiliates from their relationship with the Master Portfolios and the Feeder Funds and advice from independent legal counsel with respect to the review process and materials submitted for the Board’s review. The Board noted the willingness of BlackRock personnel to engage in open, candid discussions with the Board. The Board did not identify any particular information as determinative, and each Board Member may have attributed different weights to the various items considered.
A. Nature, Extent and Quality of the Services Provided by BlackRock The Board, including the Independent Board Members, reviewed the nature, extent and quality of services provided by BlackRock, including the investment advisory services and the resulting performance of each Feeder Fund. Throughout the year, the Board compared each Feeder Fund’s performance to the performance of a comparable group of mutual funds and/or the performance of a relevant benchmark, if any. The Board met with BlackRock’s senior management personnel responsible for investment operations, including the senior investment officers. The Board also reviewed the materials provided by each Master Portfolio’s portfolio management team discussing the Master Portfolio’s performance and the Master Portfolio’s investment objective, strategies and outlook.
The Board considered, among other factors, with respect to BlackRock: the number, education and experience of investment personnel generally and each Master Portfolio’s portfolio management team; investments by portfolio managers in the funds they manage; portfolio trading capabilities; use of technology; commitment to compliance; credit analysis capabilities; risk analysis and oversight capabilities; and the approach to training and retaining portfolio managers and other research, advisory and management personnel. The Board engaged in a review of BlackRock’s compensation structure with respect to each Master Portfolio’s portfolio management team and BlackRock’s ability to attract and retain high-quality talent and create performance incentives.
In addition to advisory services, the Board considered the quality of the administrative and other non-investment advisory services provided to each Master Portfolio and Feeder Fund. BlackRock and its affiliates provide each Master Portfolio and Feeder Fund with certain administrative, shareholder and other services (in addition to any such services provided to the Master Portfolio and Feeder Fund by third parties) and officers and other personnel as are necessary for the operations of the Master Portfolio and Feeder Fund. In particular, BlackRock and its affiliates provide each Master Portfolio and Feeder Fund with the following administrative services, including, among others: (i) preparing disclosure
| | | | | | |
| 74 | | BLACKROCK LARGE CAP SERIES FUNDS, INC. | | SEPTEMBER 30, 2013 | | |
| | |
| Disclosure of Investment Advisory Agreement and Sub-Advisory Agreement (continued) | | |
documents, such as the prospectus, the summary prospectus (as applicable), the statement of additional information and periodic shareholder reports; (ii) assisting with daily accounting and pricing; (iii) overseeing and coordinating the activities of other service providers; (iv) organizing Board meetings and preparing the materials for such Board meetings; (v) providing legal and compliance support; (vi) furnishing analytical and other support to assist the Board in its consideration of strategic issues such as the merger or consolidation of certain open-end funds; and (vii) performing other administrative functions necessary for the operation of the Master Portfolio and the Feeder Fund, such as tax reporting, fulfilling regulatory filing requirements and call center services. The Board reviewed the structure and duties of BlackRock’s fund administration, shareholder services, legal and compliance departments and considered BlackRock’s policies and procedures for assuring compliance with applicable laws and regulations.
B. The Investment Performance of the Master Portfolio, the Fund and BlackRock The Board, including the Independent Board Members, also reviewed and considered the performance history of each Master Portfolio and Feeder Fund, as applicable. The Board noted that each Feeder Fund’s investment results correspond directly to the investment results of the corresponding Master Portfolio. In preparation for the April Meeting, the Board worked with its independent legal counsel, BlackRock and Lipper to develop a template for, and was provided with, reports independently prepared by Lipper, which included a comprehensive analysis of each Feeder Fund’s performance. The Board also reviewed a narrative and statistical analysis of the Lipper data that was prepared by BlackRock, which analyzed various factors that affect Lipper’s rankings. In connection with its review, the Board received and reviewed information regarding the investment performance of each Feeder Fund as compared to other funds in its applicable Lipper category. The Board was provided with a description of the methodology used by Lipper to select peer funds and periodically meets with Lipper representatives to review its methodology. The Board and its Performance Oversight and Contract Committee regularly review, and meet with the management of each Master Portfolio to discuss, the performance of the Master Portfolio and corresponding Feeder Fund, as applicable, throughout the year.
The Board noted that BlackRock Large Cap Core Fund ranked in the third, third and fourth quartiles against its Lipper Performance Universe for the one-, three- and five-year periods reported, respectively. The Board and BlackRock reviewed and discussed the reasons for the Feeder Fund’s underperformance during these periods compared to its Lipper Performance Universe.
The Board noted that BlackRock Large Cap Core Retirement Portfolio ranked in the second, third and fourth quartiles against its Lipper Performance Universe for the one-year, three-year and since-inception periods reported, respectively. The Board noted the Feeder Fund’s improved performance, relative to its peers, during the one-year period. The Board and BlackRock reviewed and discussed the reasons for the Feeder Fund’s underperformance during the three-year and since-inception periods compared to its Lipper Performance Universe.
With respect to BlackRock Large Cap Core Fund and BlackRock Large Cap Core Retirement Portfolio, BlackRock informed the Board that the
underperformance during the periods noted was the result of, among other things, Master Large Cap Core Portfolio being positioned too aggressively for the tumultuous environment of the last few years and portfolio management’s belief that the market would break out of its long-standing trading range and continue moving to the upside. Unfortunately, the thesis did not materialize and the positioning proved to be a significant detractor from performance. At the core of the Master Portfolio’s positioning, three primary factors stand out as having disadvantaged the portfolio: size, volatility and momentum. Beyond those three elements, the Master Portfolio maintained a strong value bias due to the tilt of the quantitative models toward value factors, such as free cash flow yield, which underperformed relative to other factors in the period and therefore detracted from performance.
The Board noted that BlackRock Large Cap Growth Fund ranked in the third, third and second quartiles against its Lipper Performance Universe for the one-, three- and five-year periods reported, respectively. The Board and BlackRock reviewed and discussed the reasons for the Feeder Fund’s underperformance during the one- and three-year periods compared to its Lipper Performance Universe. BlackRock informed the Board that the underperformance was the result of, among other things, Master Large Cap Growth Portfolio being positioned too aggressively for the tumultuous environment of the last few years and portfolio management’s belief that the market would break out of its long-standing trading range and continue moving to the upside. Unfortunately, the thesis did not materialize and the positioning proved to be a significant detractor from performance. At the core of the Master Portfolio’s positioning, three primary factors stand out as having disadvantaged the portfolio: size, volatility and momentum. Beyond those three elements, the Master Portfolio maintained a strong value bias due to the tilt of the quantitative models toward value factors, such as free cash flow yield, which underperformed relative to other factors in the period and therefore detracted from performance.
The Board noted that BlackRock Large Cap Growth Retirement Portfolio ranked in the first, second and first quartiles against its Lipper Performance Universe for the one-year, three-year and since-inception periods reported, respectively.
The Board noted that BlackRock Large Cap Value Fund ranked in the third, fourth and fourth quartiles against its Lipper Performance Universe for the one-, three- and five-year periods reported, respectively.
The Board noted that BlackRock Large Cap Value Retirement Portfolio ranked in the third, fourth and fourth quartiles against its Lipper Performance Universe for the one-year, three-year and since-inception periods reported, respectively.
The Board and BlackRock reviewed and discussed the reasons for the underperformance of BlackRock Large Cap Value Fund and BlackRock Large Cap Value Retirement Portfolio during the periods noted compared to each Feeder Fund’s respective Lipper Performance Universe.
BlackRock informed the Board that the underperformance was the result of, among other things, Master Large Cap Value Portfolio being positioned too aggressively for the tumultuous environment of the last few years and portfolio management’s belief that the market would break out
| | | | | | |
| | | BLACKROCK LARGE CAP SERIES FUNDS, INC. | | SEPTEMBER 30, 2013 | | 75 |
| | |
| Disclosure of Investment Advisory Agreement and Sub-Advisory Agreement (continued) | | |
of its long-standing trading range and continue moving to the upside. Unfortunately, the thesis did not materialize and the positioning proved to be a significant detractor from performance. At the core of the Master Portfolio’s positioning, three primary factors stand out as having disadvantaged the portfolio: size, volatility and momentum. Beyond those three elements, the Master Portfolio maintained a strong value bias due to the tilt of the quantitative models toward value factors, such as free cash flow yield, which underperformed relative to other factors in the period and therefore detracted from performance.
The Board and BlackRock discussed BlackRock’s strategy for improving the performance of each Master Portfolio/Feeder Fund (other than BlackRock Large Cap Growth Retirement Portfolio) and BlackRock’s commitment to providing the resources necessary to assist the portfolio managers of the Master Portfolios and to improve the performance of the Master Portfolios/Feeder Funds (other than BlackRock Large Cap Growth Retirement Portfolio). Given the poor historical performance of the Master Portfolios/Feeder Funds (other than BlackRock Large Cap Growth Retirement Portfolio), BlackRock and the Board previously had concurred in making certain changes within the portfolio management team of each Master Portfolio. Both BlackRock and the Board are hopeful that these changes in portfolio management will result in improved performance going forward, although there can be no assurance that will be the case. The Board will continue to monitor each Feeder Fund’s performance.
The Board noted that BlackRock has recently made, and continues to make, changes to the organization of BlackRock’s overall portfolio management structure designed to result in strengthened leadership teams.
C. Consideration of the Advisory/Management Fees and the Cost of the Services and Profits to be Realized by BlackRock and its Affiliates from their Relationship with each Master Portfolio and Feeder Fund The Board, including the Independent Board Members, reviewed each Master Portfolio’s/Feeder Fund’s contractual management fee rate compared with the other funds in the Feeder Fund’s Lipper category. The contractual management fee rate represents a combination of the advisory fee and any administrative fees, before taking into account any reimbursements or fee waivers. The Board also compared each Feeder Fund’s total net operating expense ratio, as well as each Master Portfolio’s/Feeder Fund’s actual management fee rate, to those of other funds in the Feeder Fund’s Lipper category. The total net operating expense ratio and actual management fee rate both give effect to any expense reimbursements or fee waivers that benefit the funds. The Board considered the services provided and the fees charged by BlackRock to other types of clients with similar investment mandates, including institutional accounts.
The Board received and reviewed statements relating to BlackRock’s financial condition. The Board was also provided with a profitability analysis that detailed the revenues earned and the expenses incurred by BlackRock for services provided to each Master Portfolio and Feeder Fund. The Board reviewed BlackRock’s profitability with respect to each Master Portfolio and Feeder Fund, as applicable, and other funds the Board currently oversees for the year ended December 31, 2012 compared to available aggregate profitability data provided for the two prior
years. The Board reviewed BlackRock’s profitability with respect to certain other fund complexes managed by the Manager and/or its affiliates. The Board reviewed BlackRock’s assumptions and methodology of allocating expenses in the profitability analysis, noting the inherent limitations in allocating costs among various advisory products. The Board recognized that profitability may be affected by numerous factors including, among other things, fee waivers and expense reimbursements by the Manager, the types of funds managed, precision of expense allocations and business mix. As a result, comparing profitability is difficult.
The Board noted that, in general, individual fund or product line profitability of other advisors is not publicly available. The Board reviewed BlackRock’s overall operating margin, in general, compared to that of certain other publicly-traded asset management firms. The Board considered the differences between BlackRock and these other firms, including the contribution of technology at BlackRock, BlackRock’s expense management and the relative product mix.
In addition, the Board considered the cost of the services provided to each Master Portfolio and Feeder Fund by BlackRock, and BlackRock’s and its affiliates’ profits relating to the management and distribution of each Master Portfolio and Feeder Fund and the other funds advised by BlackRock and its affiliates. As part of its analysis, the Board reviewed BlackRock’s methodology in allocating its costs to the management of the Master Portfolios and the Feeder Funds. The Board also considered whether BlackRock has the financial resources necessary to attract and retain high quality investment management personnel to perform its obligations under the Agreements and to continue to provide the high quality of services that is expected by the Board.
The Board noted that Master Large Cap Core Portfolio’s/BlackRock Large Cap Core Fund’s contractual management fee rate ranked in the third quartile relative to the Feeder Fund’s Expense Peers. The Board determined that the Feeder Fund’s total net operating expense ratio, which ranked in the third quartile, was reasonable relative to the median total net operating expense ratio paid by the Feeder Fund’s Expense Peers. The Board also noted that BlackRock has contractually agreed to a cap on the Feeder Fund’s total net operating expenses as a percentage of the Feeder Fund’s average daily net assets on a class-by-class basis, as applicable.
The Board noted that Master Large Cap Core Portfolio’s/BlackRock Large Cap Core Retirement Portfolio’s contractual management fee rate ranked in the first quartile relative to the Feeder Fund’s Expense Peers. The Board also noted that BlackRock has contractually agreed to a cap on the Feeder Fund’s total net operating expenses as a percentage of the Feeder Fund’s average daily net assets.
The Board noted that Master Large Cap Growth Portfolio’s/BlackRock Large Cap Growth Fund’s contractual management fee rate ranked in the third quartile relative to the Feeder Fund’s Expense Peers. The Board determined that the Master Portfolio’s/Feeder Fund’s contractual management fee rate was reasonable relative to the median contractual management fee rate paid by the Feeder Fund’s Expense Peers.
The Board noted that Master Large Cap Growth Portfolio’s/BlackRock Large Cap Growth Retirement Portfolio’s contractual management fee
| | | | | | |
| 76 | | BLACKROCK LARGE CAP SERIES FUNDS, INC. | | SEPTEMBER 30, 2013 | | |
| | |
| Disclosure of Investment Advisory Agreement and Sub-Advisory Agreement (concluded) | | |
rate ranked in the first quartile relative to the Feeder Fund’s Expense Peers. The Board further noted that BlackRock has contractually agreed to a cap on the Feeder Fund’s total net operating expenses as a percentage of the Feeder Fund’s average daily net assets.
The Board noted that Master Large Cap Value Portfolio’s/BlackRock Large Cap Value Fund’s contractual management fee rate ranked in the fourth quartile relative to the Feeder Fund’s Expense Peers. The Board determined that the Feeder Fund’s total net operating expense ratio, which ranked in the third quartile, was reasonable relative to the median total net operating expense ratio paid by the Feeder Fund’s Expense Peers. After discussions between the Board, including the Independent Board Members, and BlackRock, BlackRock agreed to a continuation of the voluntary administration fee reduction with respect to the Feeder Fund that was implemented on June 1, 2012, which results in savings to shareholders.
The Board noted that Master Large Cap Value Portfolio’s/BlackRock Large Cap Value Retirement Portfolio’s contractual management fee rate ranked in the first quartile relative to the Feeder Fund’s Expense Peers. The Board further noted that BlackRock has contractually agreed to a cap on the Feeder Fund’s total net operating expenses as a percentage of the Feeder Fund’s average daily net assets.
The Board also noted that each Master Portfolio has an advisory fee arrangement that includes breakpoints that adjust the fee rate downward as the size of the Master Portfolio increases above certain contractually specified levels.
D. Economies of Scale The Board, including the Independent Board Members, considered the extent to which economies of scale might be realized as the assets of each Master Portfolio and Feeder Fund increase, as well as the existence of expense caps, as applicable. The Board also considered the extent to which each Master Portfolio and Feeder Fund benefit from such economies and whether there should be changes in the advisory fee rate or breakpoint structure in order to enable each Master Portfolio and Feeder Fund to participate in these economies of scale, for example through the use of revised breakpoints in the advisory fee based upon the asset level of the Master Portfolio. In its consideration, the Board took into account the existence of any expense caps and further considered the continuation and/or implementation, as applicable, of such caps.
E. Other Factors Deemed Relevant by the Board Members The Board, including the Independent Board Members, also took into account other ancillary or “fall-out” benefits that BlackRock or its affiliates may derive from their respective relationships with the Master Portfolios and the Feeder Funds, both tangible and intangible, such as BlackRock’s ability to leverage its investment professionals who manage other portfolios and risk management personnel, an increase in BlackRock’s profile in the investment advisory community, and the engagement of BlackRock’s
affiliates as service providers to the Master Portfolios and the Feeder Funds, including for administrative, distribution, securities lending and cash management services. The Board also considered BlackRock’s overall operations and its efforts to expand the scale of, and improve the quality of, its operations. The Board also noted that BlackRock may use and benefit from third party research obtained by soft dollars generated by certain registered fund transactions to assist in managing all or a number of its other client accounts. The Board further noted that it had considered the investment by BlackRock’s funds in ETFs without any offset against the management fees payable by the funds to BlackRock.
In connection with its consideration of the Agreements, the Board also received information regarding BlackRock’s brokerage and soft dollar practices. The Board received reports from BlackRock which included information on brokerage commissions and trade execution practices throughout the year.
The Board noted the competitive nature of the open-end fund marketplace, and that shareholders are able to redeem their Feeder Fund shares if they believe that the applicable Feeder Fund’s and/or Master Portfolio’s fees and expenses are too high or if they are dissatisfied with the performance of the Feeder Fund.
Conclusion
The Board of the Master LLC, including the Independent Board Members, unanimously approved the continuation of the Advisory Agreement between the Manager and the Master LLC with respect to each Master Portfolio for a one-year term ending June 30, 2014 and the Sub-Advisory Agreement between the Manager and the Sub-Advisor with respect to each Master Portfolio for a one-year term ending June 30, 2014. Based upon its evaluation of all of the aforementioned factors in their totality, the Board of the Master LLC, including the Independent Board Members, was satisfied that the terms of the Agreements were fair and reasonable and in the best interest of each Master Portfolio and its shareholders. The Board of the Corporation, including the Independent Board Members, also considered the continuation of the Agreements with respect to each Master Portfolio and found the Agreements to be satisfactory. In arriving at its decision to approve the Agreements, the Board of the Master LLC did not identify any single factor or group of factors as all-important or controlling, but considered all factors together, and different Board Members may have attributed different weights to the various factors considered. The Independent Board Members were also assisted by the advice of independent legal counsel in making this determination. The contractual fee arrangements for each Master Portfolio reflect the results of several years of review by the Board Members and predecessor Board Members, and discussions between such Board Members (and predecessor Board Members) and BlackRock. As a result, the Board Members’ conclusions may be based in part on their consideration of these arrangements in prior years.
| | | | | | |
| | | BLACKROCK LARGE CAP SERIES FUNDS, INC. | | SEPTEMBER 30, 2013 | | 77 |
| | | | | | | | | | |
Name, Address,
and Year of Birth | | Position(s)
Held with the
Corporation/
Master LLC | | Length
of Time
Served as
a Director2 | | Principal Occupation(s) During Past 5 Years | | Number of BlackRock-
Advised Registered
Investment Companies
(“RICs”) Consisting of
Investment Portfolios
(“Portfolios”) Overseen | | Public
Directorships |
| Independent Directors1 | | | | | | | | | | |
Ronald W. Forbes
55 East 52nd Street
New York, NY 10055
1940 | | Co-Chairman of the Board and Director | | Since
2007 | | Professor Emeritus of Finance, School of Business, State University of New York at Albany since 2000. | | 33 RICs consisting of
109 Portfolios | | None |
Rodney D. Johnson
55 East 52nd Street
New York, NY 10055
1941 | | Co-Chairman of the Board and Director | | Since
2007 | | President, Fairmount Capital Advisors, Inc. since 1987; Member of the Archdiocesan Investment Committee of the Archdiocese of Philadelphia from 2004 to 2012; Director, The Committee of Seventy (civic) from 2006 to 2012; Director, Fox Chase Cancer Center from 2004 to 2011. | | 33 RICs consisting of
109 Portfolios | | None |
David O. Beim
55 East 52nd Street
New York, NY 10055
1940 | | Director | | Since
2007 | | Professor of Professional Practice at the Columbia University Graduate School of Business since 1991; Trustee, Phillips Exeter Academy from 2002 to 2012; Chairman, Wave Hill, Inc. (public garden and cultural center) from 1990 to 2006. | | 33 RICs consisting of
109 Portfolios | | None |
Dr. Matina S. Horner
55 East 52nd Street
New York, NY 10055
1939 | | Director | | Since
2007 | | Executive Vice President of Teachers Insurance and Annuity Association and College Retirement Equities Fund from 1989 to 2003. | | 33 RICs consisting of
109 Portfolios | | NSTAR (electric and gas utility) |
Herbert I. London
55 East 52nd Street
New York, NY 10055
1939 | | Director | | Since
1999 | | Professor Emeritus, New York University since 2005; John M. Olin Professor of Humanities, New York University from 1993 to 2005 and Professor thereof from 1980 to 2005; President Emeritus, Hudson Institute (policy research organization) from 2011 to 2012, President thereof from 1997 to 2011 and Trustee from 1980 to 2012; Chairman of the Board of Trustees for Grantham University since 2006; Director, InnoCentive, Inc. since 2005; Director, Cerego, LLC (educational software) since 2005; Director, Cybersettle (online adjudication) since 2009; Director, AIMS Worldwide, Inc. from 2007 to 2012. | | 33 RICs consisting of
109 Portfolios | | None |
Ian A. MacKinnon
55 East 52nd Street
New York, NY 10055
1948 | | Director | | Since
2012 | | Director, Kennett Capital, Inc. (investments) since 2006; Director, Free Library of Philadelphia from 1999 to 2008. | | 33 RICs consisting of
109 Portfolios | | None |
Cynthia A. Montgomery
55 East 52nd Street
New York, NY 10055
1952 | | Director | | Since
2007 | | Professor, Harvard Business School since 1989; Director, McLean Hospital from 2005 to 2012; Director, Harvard Business School Publishing from 2005 to 2010 | | 33 RICs consisting of
109 Portfolios | | Newell Rubbermaid, Inc. (manufacturing) |
Joseph P. Platt
55 East 52nd Street
New York, NY 10055
1947 | | Director | | Since
2007 | | Director, Jones and Brown (Canadian insurance broker) since 1998; Director, The West Penn Allegheny Health System (a not-for-profit health system) since 2008; General Partner, Thorn Partners, LP (private investments) since 1998; Director, WQED Multi-Media (public broadcasting not-for-profit) since 2001; Partner, Amarna Corporation, LLC (private investment company) from 2002 to 2008. | | 33 RICs consisting of
109 Portfolios | | Greenlight Capital Re, Ltd. (reinsurance company) |
Robert C. Robb, Jr.
55 East 52nd Street
New York, NY 10055
1945 | | Director | | Since
2007 | | Partner, Lewis, Eckert, Robb and Company (management and financial consulting firm) since 1981. | | 33 RICs consisting of
109 Portfolios | | None |
Toby Rosenblatt
55 East 52nd Street
New York, NY 10055
1938 | | Director | | Since
2007 | | President, Founders Investments Ltd. (private investments) since 1999; Director, Forward Management, LLC since 2007; Director, College Access Foundation of California (philanthropic foundation) since 2009; Director, A.P. Pharma, Inc. (specialty pharmaceuticals) from 1983 to 2011; Director, The James Irvine Foundation (philanthropic foundation) from 1998 to 2008. | | 33 RICs consisting of
109 Portfolios | | None |
| | | | | | |
| 78 | | BLACKROCK LARGE CAP SERIES FUNDS, INC. | | SEPTEMBER 30, 2013 | | |
| | |
| Officers and Directors (continued) | | |
| | | | | | | | | | |
Name, Address,
and Year of Birth | | Position(s)
Held with the
Corporation/
Master LLC | | Length
of Time
Served as
a Director2 | | Principal Occupation(s) During Past 5 Years | | Number of BlackRock-
Advised Registered
Investment Companies
(“RICs”) Consisting of
Investment Portfolios
(“Portfolios”) Overseen | | Public
Directorships |
| Independent Directors1 (concluded) |
Kenneth L. Urish
55 East 52nd Street
New York, NY 10055
1951 | | Director | | Since
2007 | | Managing Partner, Urish Popeck & Co., LLC (certified public accountants and consultants) since 1976; Chairman of the Professional Ethics Committee of the Pennsylvania Institute of Certified Public Accountants since 2010 and Committee Member thereof since 2007; Member of External Advisory Board, The Pennsylvania State University Accounting Department since 2001; Trustee, The Holy Family Institute from 2001 to 2010; President and Trustee, Pittsburgh Catholic Publishing Associates from 2003 to 2008; Director, Inter-Tel from 2006 to 2007. | | 33 RICs consisting of
109 Portfolios | | None |
Frederick W. Winter
55 East 52nd Street
New York, NY 10055
1945 | | Director | | Since
2007 | | Professor and Dean Emeritus of the Joseph M. Katz School of Business, University of Pittsburgh since 2005 and Dean thereof from 1997 to 2005; Director, Alkon Corporation (pneumatics) since 1992; Director, Tippman Sports (recreation) since 2005; Director, Indotronix International (IT services) from 2004 to 2008. | | 33 RICs consisting of
109 Portfolios | | None |
| | 1 Directors serve until their resignation, removal or death, or until December 31 of the year in which they turn 72. The Board has approved one-year extensions in terms of Directors who turn 72 prior to December 31, 2013. 2 Date shown is the earliest date a person has served for the Corporation/Master LLC covered by this annual report. Following the combination of Merrill Lynch Investment Managers, L.P. (“MLIM”) and BlackRock in September 2006, the various legacy MLIM and legacy BlackRock Fund boards were realigned and consolidated into three new fund boards in 2007. As a result, although the chart shows certain Directors as joining the Corporation’s Board in 2007, those Directors first became members of the boards of other legacy MLIM or legacy BlackRock Funds as follows: David O. Beim, 1998; Ronald W. Forbes, 1977; Dr. Matina S. Horner, 2004; Rodney D. Johnson, 1995; Herbert I. London, 1987; Cynthia A. Montgomery, 1994; Joseph P. Platt, 1999; Robert C. Robb, Jr., 1998; Toby Rosenblatt, 2005; Kenneth L. Urish, 1999; and Frederick W. Winter, 1999. |
| Interested Directors3 | | | | | | | | | | |
Paul L. Audet
55 East 52nd Street
New York, NY 10055
1953 | | Director | | Since
2011 | | Senior Managing Director of BlackRock and Head of U.S. Mutual Funds since 2011; Chair of the U.S. Mutual Funds Committee reporting to the Global Executive Committee since 2011; Head of BlackRock’s Real Estate business from 2008 to 2011; Member of BlackRock’s Global Operating and Corporate Risk Management Committees and of the BlackRock Alternative Investors Executive Committee and Investment Committee for the Private Equity Fund of Funds business since 2008; Head of BlackRock’s Global Cash Management business from 2005 to 2010; Acting Chief Financial Officer of BlackRock from 2007 to 2008; Chief Financial Officer of BlackRock from 1998 to 2005. | | 155 RICs consisting of
283 Portfolios | | None |
Henry Gabbay
55 East 52nd Street
New York, NY 10055
1947 | | Director | | Since
2007 | | Consultant, BlackRock from 2007 to 2008; Managing Director, BlackRock from 1989 to 2007; Chief Administrative Officer, BlackRock Advisors, LLC from 1998 to 2007; President of BlackRock Funds and BlackRock Bond Allocation Target Shares from 2005 to 2007 and Treasurer of certain closed-end funds in the BlackRock fund complex from 1989 to 2006. | | 155 RICs consisting of
283 Portfolios | | None |
| | 3 Mr. Audet is an “interested person,” as defined in the 1940 Act, of the Corporation/Master LLC based on his position with BlackRock and its affiliates. Mr. Gabbay is an “interested person” of the Corporation/Master LLC based on his former positions with BlackRock and its affiliates as well as his ownership of BlackRock and The PNC Financial Services Group, Inc. securities. Mr. Audet and Mr. Gabbay are also Directors of the BlackRock registered closed-end funds and Directors of other BlackRock registered open-end funds. Directors serve until their resignation, removal or death, or until December 31 of the year in which they turn 72. |
| | | | | | |
| | | BLACKROCK LARGE CAP SERIES FUNDS, INC. | | SEPTEMBER 30, 2013 | | 79 |
| | |
| Officers and Directors (concluded) | | |
| | | | | | |
Name, Address, and Year of Birth | | Position(s)
Held with the
Corporation/
Master LLC | | Length of Time
Served | | Principal Occupation(s) During Past 5 Years |
| Officers1 | | | | | | |
John M. Perlowski
55 East 52nd Street
New York, NY 10055
1964 | | President and Chief Executive Officer | | Since
2010 | | Managing Director of BlackRock since 2009; Global Head of BlackRock Fund Services since 2009; Managing Director and Chief Operating Officer of the Global Product Group at Goldman Sachs Asset Management, L.P. from 2003 to 2009; Treasurer of Goldman Sachs Mutual Funds from 2003 to 2009 and Senior Vice President thereof from 2007 to 2009; Director of Goldman Sachs Offshore Funds from 2002 to 2009; Director of Family Resource Network (charitable foundation) since 2009. |
Brendan Kyne
55 East 52nd Street
New York, NY 10055
1977 | | Vice President | | Since
2009 | | Managing Director of BlackRock since 2010; Director of BlackRock from 2008 to 2009; Head of Product Development and Management for BlackRock’s U.S. Retail Group since 2009; and Co-head thereof from 2007 to 2009; Vice President of BlackRock from 2005 to 2008. |
Neal Andrews
55 East 52nd Street
New York, NY 10055
1966 | | Chief Financial Officer | | Since
2007 | | Managing Director of BlackRock since 2006; Senior Vice President and Line of Business Head of Fund Accounting and Administration at PNC Global Investment Servicing (U.S.) Inc. from 1992 to 2006. |
Jay Fife
55 East 52nd Street
New York, NY 10055
1970 | | Treasurer | | Since
2007 | | Managing Director of BlackRock since 2007; Director of BlackRock in 2006; Assistant Treasurer of the MLIM and Fund Asset Management, L.P. advised funds from 2005 to 2006; Director of MLIM Fund Services Group from 2001 to 2006. |
Brian Kindelan
55 East 52nd Street
New York, NY 10055
1959 | | Chief Compliance Officer and Anti-Money Laundering Officer | | Since
2007 | | Chief Compliance Officer of the BlackRock-advised funds since 2007; Managing Director and Senior Counsel of BlackRock since 2005. |
Benjamin Archibald
55 East 52nd Street
New York, NY 10055
1975 | | Secretary | | Since
2012 | | Director of BlackRock since 2010; Assistant Secretary to the funds from 2010 to 2012; General Counsel and Chief Operating Officer of Uhuru Capital Management from 2009 to 2010; Executive Director and Counsel of Goldman Sachs Asset Management from 2005 to 2009. |
| | 1 Officers of the Corporation/Master LLC serve at the pleasure of the Board. |
| | | Further information about the Officers and Directors is available in the Corporation’s Statement of Additional Information, which can be obtained without charge by calling 1-800-441-7762. |
| | | | | | |
| Investment Advisor | | Sub-Advisor | | Custodian | | Distributor |
| BlackRock Advisors, LLC | | BlackRock Investment | | Brown Brothers Harriman & Co. | | BlackRock Investments, LLC |
| Wilmington, DE 19809 | | Management, LLC | | Boston, MA 02109 | | New York, NY 10022 |
| | Princeton, NJ 08540 | | | | |
| | | | | | |
| Accounting Agent and | | Legal Counsel | | Independent Registered | | Address of the Corporation/ |
| Transfer Agent | | Sidley Austin LLP | | Public Accounting Firm | | Master LLC |
| BNY Mellon Investment | | New York, NY 10019 | | Deloitte & Touche LLP | | 100 Bellevue Parkway |
| Servicing (US) Inc. | | | | Philadelphia, PA 19103 | | Wilmington, DE 19809 |
| Wilmington, DE 19809 | | | | | | |
| | | | | | |
| 80 | | BLACKROCK LARGE CAP SERIES FUNDS, INC. | | SEPTEMBER 30, 2013 | | |
Electronic Delivery
Electronic copies of most financial reports and prospectuses are available on the Fund’s website or shareholders can sign up for e-mail notifications of quarterly statements, annual and semi-annual reports and prospectuses by enrolling in the Fund’s electronic delivery program.
To enroll:
Shareholders Who Hold Accounts with Investment Advisors, Banks or Brokerages
Please contact your financial advisor. Please note that not all investment advisors, banks or brokerages may offer this service.
Shareholders Who Hold Accounts Directly With BlackRock
| 1) | Access the BlackRock website at |
| | http://www.blackrock.com/ edelivery |
| 2) | Select “eDelivery” under the “More Information” section |
Householding
The Feeder Funds will mail only one copy of shareholder documents, including annual and semi-annual reports and proxy statements, to shareholders with multiple accounts at the same address. This practice is commonly called “householding” and is intended to reduce expenses and eliminate duplicate mailings of shareholder documents. Mailings of your shareholder documents may be householded indefinitely unless you instruct us otherwise. If you do not want the mailing of these documents to be combined with those for other members of your household, please call the Fund at (800) 441-7762.
Availability of Quarterly Schedule of Investments
The Feeder Funds/Portfolios files their complete schedule of portfolio holdings with the Securities and Exchange Commission (“SEC”) for the first and third quarters of each fiscal year on Form N-Q. The Feeder Funds’/Portfolios’ Form N-Q is available on the SEC’s website at http:// www.sec.gov and may also be reviewed and copied at the SEC’s Public Reference Room in Washington, D.C. Information on the operation of the Public Reference Room may be obtained by calling (800) SEC-0330. The Feeder Funds’/Portfolios’ Form N-Q may also be obtained upon request and without charge by calling (800) 441-7762.
Availability of Proxy Voting Policies and Procedures
A description of the policies and procedures that the Feeder Funds/ Portfolios use to determine how to vote proxies relating to portfolio securities is available (1) without charge, upon request, by calling (800) 441-7762; (2) at http://www.blackrock.com; and (3) on the SEC’s website at http://www.sec.gov.
Availability of Proxy Voting Record
Information about how the Feeder Funds/Portfolios voted proxies relating to securities held in the Portfolios’ portfolios during the most recent 12-month period ended June 30 is available upon request and without charge (1) at http://www.blackrock.com or by calling (800) 441-7762 and (2) on the SEC’s website at http://www.sec.gov.
Account Information
Call us at (800) 441-7762 from 8:00 AM to 6:00 PM EST on any business day to get information about your account balances, recent transactions and share prices. You can also reach us on the Web at http:// www.blackrock.com/funds.
Automatic Investment Plans
Investor Class shareholders who want to invest regularly can arrange to have $50 or more automatically deducted from their checking or savings account and invested in any of the BlackRock funds.
Systematic Withdrawal Plan
Investor Class shareholders can establish a systematic withdrawal plan and receive periodic payments of $50 or more from their BlackRock funds, as long as their account balance is at least $10,000.
Retirement Plans
Shareholders may make investments in conjunction with Traditional, Rollover, Roth, Coverdell, Simple IRAs, SEP IRAs and 403(b) Plans.
| | | | | | |
| | | BLACKROCK VALUE OPPORTUNITIES FUND, INC. | | SEPTEMBER 30, 2013 | | 81 |
| | |
| Additional Information (concluded) | | |
|
| BlackRock Privacy Principles |
BlackRock is committed to maintaining the privacy of its current and former fund investors and individual clients (collectively, “Clients”) and to safeguarding their non-public personal information. The following information is provided to help you understand what personal information BlackRock collects, how we protect that information and why in certain cases we share such information with select parties.
If you are located in a jurisdiction where specific laws, rules or regulations require BlackRock to provide you with additional or different privacy-related rights beyond what is set forth below, then BlackRock will comply with those specific laws, rules or regulations.
BlackRock obtains or verifies personal non-public information from and about you from different sources, including the following: (i) information we receive from you or, if applicable, your financial intermediary, on applications, forms or other documents; (ii) information about your transactions with us, our affiliates, or others; (iii) information we receive from a consumer reporting agency; and (iv) from visits to our websites.
BlackRock does not sell or disclose to non-affiliated third parties any non-public personal information about its Clients, except as permitted by law or as is necessary to respond to regulatory requests or to service Client accounts. These non-affiliated third parties are required to protect the confidentiality and security of this information and to use it only for its intended purpose.
We may share information with our affiliates to service your account or to provide you with information about other BlackRock products or services that may be of interest to you. In addition, BlackRock restricts access to non-public personal information about its Clients to those BlackRock employees with a legitimate business need for the information. BlackRock maintains physical, electronic and procedural safeguards that are designed to protect the non-public personal information of its Clients, including procedures relating to the proper storage and disposal of such information.
| | | | | | |
| 82 | | BLACKROCK VALUE OPPORTUNITIES FUND, INC. | | SEPTEMBER 30, 2013 | | |
| | |
| A World-Class Mutual Fund Family | | |
BlackRock offers a diverse lineup of open-end mutual funds crossing all investment styles and managed by experts in equity, fixed income and tax-exempt investing.
BlackRock ACWI ex-US Index Fund
BlackRock All-Cap Energy & Resources Portfolio
BlackRock Basic Value Fund
BlackRock Capital Appreciation Fund
BlackRock Commodity Strategies Fund
BlackRock Disciplined Small Cap Core Fund
BlackRock Emerging Markets Dividend Fund
BlackRock Emerging Markets Fund
BlackRock Emerging Markets Long/Short Equity Fund
BlackRock Energy & Resources Portfolio
BlackRock Equity Dividend Fund
BlackRock EuroFund
BlackRock Flexible Equity Fund
BlackRock Focus Growth Fund
BlackRock Global Dividend Portfolio
BlackRock Global Long/Short Equity Fund
BlackRock Global Opportunities Portfolio
BlackRock Global SmallCap Fund
BlackRock Health Sciences Opportunities Portfolio
BlackRock India Fund
BlackRock International Fund
BlackRock International Index Fund
BlackRock International Opportunities Portfolio
BlackRock Large Cap Core Fund
BlackRock Large Cap Core Plus Fund
BlackRock Large Cap Growth Fund
BlackRock Large Cap Value Fund
BlackRock Latin America Fund
BlackRock Long-Horizon Equity Fund
BlackRock Mid-Cap Growth Equity Portfolio
BlackRock Mid-Cap Value Opportunities Fund
BlackRock Natural Resources Trust
BlackRock Pacific Fund
BlackRock Real Estate Securities Fund
BlackRock Russell 1000 Index Fund
BlackRock Science & Technology Opportunities Portfolio
BlackRock Small Cap Growth Equity Portfolio
BlackRock Small Cap Growth Fund II
BlackRock Small Cap Index Fund
BlackRock S&P 500 Stock Fund
BlackRock U.S. Opportunities Portfolio
BlackRock Value Opportunities Fund
BlackRock World Gold Fund
|
| Taxable Fixed Income Funds |
BlackRock Bond Index Fund
BlackRock Core Bond Portfolio
BlackRock CoreAlpha Bond Fund
BlackRock Emerging Market Local Debt Portfolio
BlackRock Floating Rate Income Portfolio
BlackRock Global Long/Short Credit Fund
BlackRock GNMA Portfolio
BlackRock High Yield Bond Portfolio
BlackRock Inflation Protected Bond Portfolio
BlackRock International Bond Portfolio
BlackRock Investment Grade Bond Portfolio
BlackRock Low Duration Bond Portfolio
BlackRock Secured Credit Portfolio
BlackRock Short Obligations Fund
BlackRock Short-Term Treasury Fund
BlackRock Strategic Income Opportunities Portfolio
BlackRock Total Return Fund
BlackRock U.S. Government Bond Portfolio
BlackRock U.S. Mortgage Portfolio
BlackRock Ultra-Short Obligations Fund
BlackRock World Income Fund
|
| Municipal Fixed Income Funds |
BlackRock California Municipal Bond Fund
BlackRock High Yield Municipal Fund
BlackRock Intermediate Municipal Fund
BlackRock National Municipal Fund
BlackRock New Jersey Municipal Bond Fund
BlackRock New York Municipal Bond Fund
BlackRock Pennsylvania Municipal Bond Fund
BlackRock Short-Term Municipal Fund
| | | | | | | | | | | | | | |
| BlackRock Balanced Capital Fund | | LifePath Active Portfolios | | LifePath Index Portfolios |
| BlackRock Emerging Market Allocation Portfolio | | 2015 | | | 2040 | | | | | Retirement | | 2040 | | |
| BlackRock Global Allocation Fund | | 2020 | | | 2045 | | | | | 2020 | | 2045 | | |
| BlackRock Managed Volatility Portfolio | | 2025 | | | 2050 | | | | | 2025 | | 2050 | | |
| BlackRock Multi-Asset Income Portfolio | | 2030 | | | 2055 | | | | | 2030 | | 2055 | | |
| BlackRock Multi-Asset Real Return Fund | | 2035 | | | | | | | | 2035 | | | | |
| BlackRock Strategic Risk Allocation Fund | | | | | | | | | | | | | | |
| | | | | | |
| BlackRock Prepared Portfolios | | LifePath Portfolios | | | | | | | | | | | | |
Conservative Prepared Portfolio | | Retirement | | | 2040 | | | | | | | | | |
Moderate Prepared Portfolio | | 2020 | | | 2045 | | | | | | | | | |
Growth Prepared Portfolio | | 2025 | | | 2050 | | | | | | | | | |
Aggressive Growth Prepared Portfolio | | 2030 | | | 2055 | | | | | | | | | |
| | 2035 | | | | | | | | | | | | |
BlackRock mutual funds are currently distributed by BlackRock Investments, LLC. You should consider the investment objectives, risks, charges and expenses of the funds under consideration carefully before investing. Each fund’s prospectus contains this and other information and is available at www.blackrock.com or by calling (800) 441-7762 or from your financial advisor. The prospectus should be read carefully before investing.
| | | | | | |
| | | BLACKROCK FUNDS | | SEPTEMBER 30, 2013 | | 83 |
This report is transmitted to shareholders only. It is not authorized for use as an offer of sale or a solicitation of an offer to buy shares of a Fund unless accompanied or preceded by that Fund’s current prospectus. Past performance results shown in this report should not be considered a representation of future performance. Investment returns and principal value of shares will fluctuate so that shares, when redeemed, may be worth more or less than their original cost. Statements and other information herein are as dated and are subject to change.

| | |
| |
CAPSERIES-9/13-AR | |  |
| Item 2 – | Code of Ethics – Each registrant (or “Fund”) has adopted a code of ethics, as of the end of the period covered by this report, applicable to the registrant’s principal executive officer, principal financial officer, principal accounting officer or controller, or persons performing similar functions. During the period covered by this report, there have been no amendments to or waivers granted under the code of ethics. A copy of the code of ethics is available without charge at www.blackrock.com. |
| Item 3 – | Audit Committee Financial Expert – Each registrant’s board of directors (the “board of directors”), has determined that (i) the registrant has the following audit committee financial expert serving on its audit committee and (ii) each audit committee financial expert is independent: |
Kenneth L. Urish
Under applicable securities laws, a person determined to be an audit committee financial expert will not be deemed an “expert” for any purpose, including without limitation for the purposes of Section 11 of the Securities Act of 1933, as a result of being designated or identified as an audit committee financial expert. The designation or identification of a person as an audit committee financial expert does not impose on such person any duties, obligations, or liabilities greater than the duties, obligations, and liabilities imposed on such person as a member of the audit committee and board of directors in the absence of such designation or identification.
| Item 4 – | Principal Accountant Fees and Services |
The following table presents fees billed by Deloitte & Touche LLP (“D&T”) in each of the last two fiscal years for the services rendered to the Funds:
| | | | | | | | | | | | | | | | |
| | | (a) Audit Fees | | (b) Audit-Related Fees1 | | (c) Tax Fees2 | | (d) All Other Fees3 |
| Entity Name | | Current
Fiscal Year End | | Previous
Fiscal Year End | | Current
Fiscal Year End | | Previous
Fiscal Year End | | Current
Fiscal Year End | | Previous
Fiscal Year End | | Current
Fiscal Year End | | Previous
Fiscal Year End |
| BlackRock Large Cap Core Fund | | $7,363 | | $7,100 | | $0 | | $2,500 | | $12,850 | | $12,350 | | $0 | | $0 |
| BlackRock Large Cap Core Retirement Portfolio | | $7,363 | | $7,100 | | $0 | | $2,500 | | $11,900 | | $11,400 | | $0 | | $0 |
| BlackRock Large Cap Growth Fund | | $7,363 | | $7,100 | | $0 | | $2,500 | | $12,850 | | $12,350 | | $0 | | $0 |
| BlackRock Large Cap Growth Retirement Portfolio | | $7,363 | | $7,100 | | $0 | | $2,500 | | $10,500 | | $10,000 | | $0 | | $0 |
| BlackRock Large Cap Value Fund | | $7,363 | | $7,100 | | $0 | | $2,500 | | $12,850 | | $12,350 | | $0 | | $0 |
| BlackRock Large Cap Value Retirement Portfolio | | $7,363 | | $7,100 | | $0 | | $2,500 | | $12,850 | | $12,350 | | $0 | | $0 |
| Master Large Cap Core Portfolio | | $36,163 | | $35,900 | | $0 | | $2,500 | | $13,250 | | $13,250 | | $0 | | $0 |
| Master Large Cap Growth Portfolio | | $33,163 | | $32,900 | | $0 | | $2,500 | | $13,250 | | $13,250 | | $0 | | $0 |
| Master Large Cap Value Portfolio | | $33,163 | | $13,250 | | $0 | | $2,500 | | $13,250 | | $13,250 | | $0 | | $0 |
The following table presents fees billed by D&T that were required to be approved by each registrant’s audit committee (each a “Committee”) for services that relate directly to the operations or financial reporting of the Fund and that are rendered on behalf of BlackRock Advisors, LLC (“Investment Adviser” or “BlackRock”) and entities controlling, controlled by, or under common control with BlackRock (not including any sub-adviser whose role is primarily portfolio management and is subcontracted with or overseen by another investment adviser) that provide ongoing services to the Fund (“Fund Service Providers”):
2
| | | | |
| | | Current Fiscal Year End | | Previous Fiscal Year End |
| (b) Audit-Related Fees1 | | $0 | | $0 |
| (c) Tax Fees2 | | $0 | | $0 |
| (d) All Other Fees3 | | $2,865,000 | | $2,970,000 |
1 The nature of the services includes assurance and related services reasonably related to the performance of the audit of financial statements not included in Audit Fees.
2 The nature of the services includes tax compliance, tax advice and tax planning.
3 Aggregate fees borne by BlackRock in connection with the review of compliance procedures and attestation thereto performed by D&T with respect to all of the registered closed-end funds and some of the registered open-end funds advised by BlackRock.
(e)(1) Audit Committee Pre-Approval Policies and Procedures:
Each Committee has adopted policies and procedures with regard to the pre-approval of services. Audit, audit-related and tax compliance services provided to the registrant on an annual basis require specific pre-approval by the registrant’s Committee. The Committee also must approve other non-audit services provided to the registrant and those non-audit services provided to the Investment Adviser and Fund Service Providers that relate directly to the operations and the financial reporting of the registrant. Certain of these non-audit services that the Committee believes are (a) consistent with the SEC’s auditor independence rules and (b) routine and recurring services that will not impair the independence of the independent accountants may be approved by the Committee without consideration on a specific case-by-case basis (“general pre-approval”). The term of any general pre-approval is 12 months from the date of the pre-approval, unless the Committee provides for a different period. Tax or other non-audit services provided to the registrants which have a direct impact on the operations or financial reporting of the registrant will only be deemed pre-approved provided that any individual project does not exceed $10,000 attributable to the registrant or $50,000 per project. For this purpose, multiple projects will be aggregated to determine if they exceed the previously mentioned cost levels.
Any proposed services exceeding the pre-approved cost levels will require specific pre-approval by the registrant’s Committee, as will any other services not subject to general pre-approval (e.g., unanticipated but permissible services). The Committee is informed of each service approved subject to general pre-approval at the next regularly scheduled in-person board meeting. At this meeting, an analysis of such services is presented to the Committee for ratification. The Committee may delegate to the Committee Chairman the authority to approve the provision of and fees for any specific engagement of permitted non-audit services, including services exceeding pre-approved cost levels.
(e)(2) None of the services described in each of Items 4(b) through (d) were approved by either Committee pursuant to the de minimus exception in paragraph (c)(7)(i)(C) of Rule 2-01 of Regulation S-X.
(f) Not Applicable
(g) The aggregate non-audit fees paid to the accountant for services rendered by the accountant to the registrant, the Investment Adviser and the Fund Service Providers were:
| | | | |
| Entity Name | | Current Fiscal Year End | | Previous Fiscal Year End |
| BlackRock Large Cap Core Fund | | $12,850 | | $14,850 |
| BlackRock Large Cap Core Retirement Portfolio | | $11,900 | | $13,900 |
| BlackRock Large Cap Growth Fund | | $12,850 | | $14,850 |
| BlackRock Large Cap Growth Retirement Portfolio | | $10,500 | | $12,500 |
| BlackRock Large Cap Value Fund | | $12,850 | | $14,850 |
| BlackRock Large Cap Value Retirement Portfolio | | $12,850 | | $14,850 |
| Master Large Cap Core Portfolio | | $13,250 | | $15,750 |
| Master Large Cap Growth Portfolio | | $13,250 | | $15,750 |
| Master Large Cap Value Portfolio | | $13,250 | | $15,750 |
3
Additionally, SSAE 16 Review (Formerly, SAS No. 70) fees for the current and previous fiscal years of $2,865,000 and $2,970,000, respectively, were billed by D&T to the Investment Adviser.
(h) Each Committee has considered and determined that the provision of non-audit services that were rendered to the Investment Adviser and the Fund Service Providers that were not pre-approved pursuant to paragraph (c)(7)(ii) of Rule 2-01 of Regulation S-X is compatible with maintaining the principal accountant’s independence.
| Item 5 – | Audit Committee of Listed Registrants – Not Applicable |
(a) The registrants’ Schedules of Investments are included as part of the Report to Stockholders filed under Item 1 of this Form.
(b) Not Applicable due to no such divestments during the semi-annual period covered since the previous Form N-CSR filing.
| Item 7 – | Disclosure of Proxy Voting Policies and Procedures for Closed-End Management Investment Companies – Not Applicable |
| Item 8 – | Portfolio Managers of Closed-End Management Investment Companies – Not Applicable |
| Item 9 – | Purchases of Equity Securities by Closed-End Management Investment Company and Affiliated Purchasers – Not Applicable |
| Item 10 – | Submission of Matters to a Vote of Security Holders – There have been no material changes to these procedures. |
| Item 11 – | Controls and Procedures |
(a) The registrants’ principal executive and principal financial officers, or persons performing similar functions, have concluded that the registrants’ disclosure controls and procedures (as defined in Rule 30a-3(c) under the Investment Company Act of 1940, as amended (the “1940 Act”)) are effective as of a date within 90 days of the filing of this report based on the evaluation of these controls and procedures required by Rule 30a-3(b) under the 1940 Act and Rule 15(d)-15(b) under the Securities Exchange Act of 1934, as amended.
(b) There were no changes in the registrants’ internal control over financial reporting (as defined in Rule 30a-3(d) under the 1940 Act) that occurred during the second fiscal quarter of the period covered by this report that have materially affected, or are reasonably likely to materially affect, the registrants’ internal control over financial reporting.
| Item 12 – | Exhibits attached hereto |
(a)(1) Code of Ethics – See Item 2
4
(a)(2) Certifications – Attached hereto
(a)(3) Not Applicable
(b) Certifications – Attached hereto
5
Pursuant to the requirements of the Securities Exchange Act of 1934 and the Investment Company Act of 1940, each registrant has duly caused this report to be signed on its behalf by the undersigned, thereunto duly authorized.
BlackRock Large Cap Series Funds, Inc. and Master Large Cap Series LLC
| | |
| By: | | /s/ John M. Perlowski |
| | John M. Perlowski Chief Executive Officer (principal executive officer) of BlackRock Large Cap Series Funds, Inc. and Master Large Cap Series LLC |
Date: December 3, 2013
Pursuant to the requirements of the Securities Exchange Act of 1934 and the Investment Company Act of 1940, this report has been signed below by the following persons on behalf of each registrant and in the capacities and on the dates indicated.
| | |
| By: | | /s/ John M. Perlowski |
| | John M. Perlowski Chief Executive Officer (principal executive officer) of BlackRock Large Cap Series Funds, Inc. and Master Large Cap Series LLC |
|
| Date: December 3, 2013 |
| |
| By: | | /s/ Neal J. Andrews |
| | Neal J. Andrews Chief Financial Officer (principal financial officer) of BlackRock Large Cap Series Funds, Inc. and Master Large Cap Series LLC |
Date: December 3, 2013
6