UNITED STATES
SECURITIES AND EXCHANGE COMMISSION
Washington, D.C. 20549
FORM N-CSR
CERTIFIED SHAREHOLDER REPORT OF REGISTERED MANAGEMENT INVESTMENT COMPANIES
Investment Company Act file number: 811-09637 and 811-09739
Name of Fund: BlackRock Large Cap Series Funds, Inc.
BlackRock Advantage Large Cap Value Fund
Master Large Cap Series LLC
Master Advantage Large Cap Value Portfolio
Fund Address: 100 Bellevue Parkway, Wilmington, DE 19809
Name and address of agent for service: John M. Perlowski, Chief Executive Officer, BlackRock Large Cap Series Funds, Inc. and Master Large Cap Series LLC, 55 East 52nd Street, New York, NY 10055
Registrants’ telephone number, including area code: (800) 441-7762
Date of fiscal year end: 05/31/2020
Date of reporting period: 05/31/2020
Item 1 – Report to Stockholders
| | |
 | | MAY 31, 2020 |
BlackRock Large Cap Series Funds, Inc.
| · | | BlackRock Advantage Large Cap Value Fund |
Beginning on January 1, 2021, as permitted by regulations adopted by the Securities and Exchange Commission, paper copies of the Fund’s shareholder reports will no longer be sent by mail, unless you specifically request paper copies of the reports from BlackRock or from your financial intermediary, such as a broker-dealer or bank. Instead, the reports will be made available on a website, and you will be notified by mail each time a report is posted and provided with a website link to access the report.
You may elect to receive all future reports in paper free of charge. If you hold accounts directly with BlackRock, you can call (800) 441-7762 to inform BlackRock that you wish to continue receiving paper copies of your shareholder reports. If you hold accounts through a financial intermediary, you can follow the instructions included with this disclosure, if applicable, or contact your financial intermediary to request that you continue to receive paper copies of your shareholder reports. Please note that not all financial intermediaries may offer this service. Your election to receive reports in paper will apply to all funds advised by BlackRock Advisors, LLC, BlackRock Fund Advisors or their affiliates, or all funds held with your financial intermediary, as applicable.
If you already elected to receive shareholder reports electronically, you will not be affected by this change and you need not take any action. You may elect to receive electronic delivery of shareholder reports and other communications by: (i) accessing the BlackRock website at blackrock.com/edelivery and logging into your accounts, if you hold accounts directly with BlackRock, or (ii) contacting your financial intermediary, if you hold accounts through a financial intermediary. Please note that not all financial intermediaries may offer this service.
|
| Not FDIC Insured • May Lose Value • No Bank Guarantee |
The Markets in Review
Dear Shareholder,
The last 12 months have been a time of sudden change in global financial markets, as a long period of growth and positive returns was interrupted in early 2020 by the emergence and spread of the coronavirus. For the first part of the reporting period, U.S. equities and bonds both delivered impressive returns, despite fears and doubts about the economy that were ultimately laid to rest with unprecedented monetary stimulus and a sluggish yet resolute performance from the U.S. economy. But as the threat from the coronavirus became more apparent throughout February and March 2020, leading countries around the world took economically disruptive countermeasures, causing equity prices to fall sharply. While markets have since recovered some of these losses as countries around the world begin reopening, there is still significant uncertainty surrounding the long-term impact of the pandemic on the global economy.
Returns for most securities were robust for the first part of the reporting period, as investors began to realize that the U.S. economy was maintaining the modest yet steady growth that had characterized this economic cycle. However, once stay-at-home orders and closures of non-essential businesses became widespread, many workers were laid off and unemployment claims spiked. With large portions of the global economy on hold, all types of international equities ended the 12-month reporting period with negative performance, while in the United States large-capitalization stocks, which investors saw as more resilient than smaller companies, delivered solid returns.
The performance of different types of fixed-income securities diverged substantially due to a reduced investor appetite for risk. Treasuries benefited from the risk-off environment, and posted healthy returns, as the 10-year U.S. Treasury yield (which is inversely related to bond prices) fell to an all-time low. Investment-grade corporate bonds also delivered a solid return, while high-yield corporate returns were muted due to credit concerns.
The U.S. Federal Reserve (the “Fed”) reduced interest rates three times in 2019, to support slowing economic growth. After the coronavirus outbreak, the Fed instituted two emergency rate cuts, pushing short-term interest rates close to zero. To stabilize credit markets, the Fed also announced a new bond-buying program, as did several other central banks around the world, including the European Central Bank and the Bank of Japan.
Looking ahead, while coronavirus-related disruption is certain to hurt worldwide economic growth, the global expansion is likely to continue once the impact of the outbreak subsides. We are encouraged by the strong coordinated monetary and fiscal response that is underway, both in the United States and abroad. However, there remains a risk that policy fatigue and recent improvements in economic indicators could lead lawmakers to retreat from needed stimulus measures too soon.
Overall, we favor a neutral stance toward risk, given the uncertainty surrounding the path to recovery. Among equities, we see an advantage in U.S. stocks compared to other developed markets, given the diversity of the U.S. economy and the impressive scope of monetary and fiscal stimulus. In bonds, the swift action taken by the world’s central banks means there are attractive opportunities in credit, and we expect credit spreads to narrow as markets stabilize. Both U.S. Treasuries and sustainable investments can help provide portfolio resilience, and the disruption created by the coronavirus appears to be accelerating the shift toward sustainable investments.
In this environment, our view is that investors need to think globally, extend their scope across a broad array of asset classes, and be nimble as market conditions change. We encourage you to talk with your financial advisor and visit blackrock.com for further insight about investing in today’s markets.
Sincerely,

Rob Kapito
President, BlackRock Advisors, LLC

Rob Kapito
President, BlackRock Advisors, LLC
| | | | |
| Total Returns as of May 31, 2020 |
| | | | |
| | | 6-Month | | 12-Month |
U.S. large cap equities
(S&P 500® Index) | | (2.10)% | | 12.84% |
U.S. small cap equities
(Russell 2000® Index) | | (13.53) | | (3.44) |
International equities
(MSCI Europe, Australasia, Far East Index) | | (11.48) | | (2.81) |
Emerging market equities
(MSCI Emerging Markets Index) | | (9.69) | | (4.39) |
3-month Treasury bills
(ICE BofA 3-Month U.S. Treasury Bill Index) | | 0.73 | | 1.84 |
U.S. Treasury securities
(ICE BofA 10-Year U.S. Treasury Index) | | 11.55 | | 15.87 |
U.S. investment grade bonds
(Bloomberg Barclays U.S. Aggregate Bond Index) | | 5.40 | | 9.42 |
Tax-exempt municipal bonds
(S&P Municipal Bond Index) | | 1.52 | | 3.87 |
U.S. high yield bonds
(Bloomberg Barclays U.S. Corporate High Yield 2% Issuer Capped Index) | | (2.84) | | 1.31 |
| | | | |
| Past performance is no guarantee of future results. Index performance is shown for illustrative purposes only. You cannot invest directly in an index. |
| | |
| 2 | | THIS PAGEIS NOT PARTOF YOUR FUND REPORT |
Table of Contents

| | |
| Fund Summary as of May 31, 2020 | | BlackRock Advantage Large Cap Value Fund |
Investment Objective
BlackRock Advantage Large Cap Value Fund’s (the “Fund”) investment objective is to seek long-term capital growth. In other words, the Fund tries to choose investments that will increase in value.
On November 13, 2019, the Board of Directors of the Fund approved a change in the fiscal year-end of the Fund, effective as of May 31, 2020, from September 30 to May 31.
Portfolio Management Commentary
How did the Fund perform?
For the abbreviated annual reporting period from October 1, 2019 to May 31, 2020, the Fund’s Institutional, Service, Investor A, Investor C, Class K and Class R Shares returned (8.36)%, (8.51)%, (8.53)%, (9.00)%, (8.35)% and (8.65)%, respectively, outperforming its benchmark, the Russell 1000® Value Index, which returned (9.45)%. The Fund invests all of its assets in Master Advantage Large Cap Value Portfolio (the “Master Portfolio”).
What factors influenced performance?
The Fund performed well navigating a highly volatile market backdrop as equities experienced a sharp bifurcation with two distinct return environments. Initially, markets hit new highs in a strong risk-on rally through mid-February amid excitement for a phase one trade deal between the United States and China. However, the spread of coronavirus provided an inflection point, which prompted a steep market decline. Investor concerns mounted through broadly enforced economic shutdowns, as expectations of growth and employment were impacted. The speed of the selloff between mid-February and the last week of March resulted in one of the worst quarterly returns for U.S. equities on record as volatility hit levels last observed during the global financial crisis. As a result, policy makers stepped in with fiscal and monetary packages to support the market. With accommodative policies, expectations of gradual reopening and economic data that appeared to have troughed, equities rallied strongly in April and May.
Sentiment-based stock selection signals drove the Fund’s relative outperformance as trend-based measures were broadly able to successfully identify the evolving marketplace. Top-performing signals were sentiment measures that benefit from alternative data sources that were able to successfully identify the evolving economic landscape as traditional data sets struggled to keep pace. Signals that look toward bond market sentiment, non-obvious news, and supply chain disruptions were most additive to excess performance in the period. Additionally, there was continued strength from insights related to environmental, social and governance (“ESG”) factors, which tend to demonstrate resilience during market declines. A recently added insight that identifies investor flows into ESG-related positions was one of the top-performing signals after successfully capturing an evolving investor preference for sustainability. Elsewhere, other fundamental quality signals, such as those with a preference for lower volatility stocks and signals that evaluate the consistency of dividends, outperformed given the strong risk-off tone to the market.
Despite demonstrating resilience during the combined period, select insights struggled. Certain macro-thematic insights declined amid the highly evolving backdrop. Macro insights that look to job trends as well as those that evaluate import cost struggled during the period. Additionally, text-based analyses that capture trends across earnings expectations and fundamentals broadly declined as near-term economic challenges outweighed prior guidance. Within fundamental stock selection metrics, more contrarian or value-oriented insights detracted as investors focused on the long-term economic impact of shutdowns needed to stop the spread of the coronavirus. This brought into question the future earnings prospects of many value-oriented cyclicals. More traditional value signals, such as comparing valuations across earnings, struggled as well given the backdrop.
Describe recent portfolio activity.
Over the course of the period, the Master Portfolio maintained a balanced allocation of risk across all major return drivers. However, a number of new stock selection insights were added to the portfolio. Among these is a new signal that uses the investment adviser’s existing library of insights to create allocation models across individual stocks, building upon earlier machine-learned capabilities developed by the investment adviser. Additionally, a new insight that looks to identify trade crowding from broker concentration was added. Finally, given the dynamism of the current environment, the Master Portfolio has instituted enhanced signals constructed to identify emerging trends, such as “work from home.”
Describe portfolio positioning at period end.
Relative to the Russell 1000® Value Index, the Master Portfolio was positioned essentially neutrally from a sector perspective. The Master Portfolio had slight overweight positions in the consumer discretionary and consumer staples sectors and slight underweight positions in the real estate and communication services sectors.
The views expressed reflect the opinions of BlackRock as of the date of this report and are subject to change based on changes in market, economic or other conditions. These views are not intended to be a forecast of future events and are no guarantee of future results.
| | |
| 4 | | 2020 BLACKROCK ANNUAL REPORTTO SHAREHOLDERS |
| | |
| Fund Summary as of May 31, 2020 (continued) | | BlackRock Advantage Large Cap Value Fund |
TOTAL RETURN BASED ON $10,000 INVESTMENT
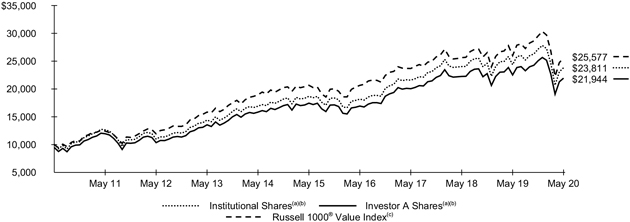
| | (a) | Assuming maximum sales charges, if any, transaction costs and other operating expenses, including administration fees, if any. Institutional Shares do not have a sales charge. |
| | (b) | The Fund invests all of its assets in the Master Portfolio, a series of the Master Large Cap Series LLC. Under normal circumstances, the Master Portfolio seeks to invest at least 80% of its net assets plus the amount of any borrowings for investment purposes in large cap equity securities of U.S. issuers and derivatives that have similar economic characteristics to such securities. The Fund’s total returns prior to June 12, 2017 are the returns of the Fund when it followed different investment strategies under the name BlackRock Large Cap Value Fund. |
| | (c) | An unmanaged index that is a subset of the Russell 1000® Index that consists of those Russell 1000® securities with lower price-to-book ratios and lower expected growth values. |
Performance Summary for the Period Ended May 31, 2020
| | | | | | | | | | | | | | | | | | | | | | | | | | | | | | | | | | | | | | | | |
| | | | | | | | | Average Annual Total Returns(a)(b) | |
| | | | | | | | | 1 Year | | | | | | 5 Years | | | | | | 10 Years | |
| | | 6-Month
Total
Returns | | | | | | Without
Sales
Charge | | | With
Sales
Charge | | | | | | Without
Sales
Charge | | | With
Sales
Charge | | | | | | Without
Sales
Charge | | | With
Sales
Charge | |
Institutional | | | (12.33 | )% | | | | | | | (2.31 | )% | | | N/A | | | | | | | | 4.97 | % | | | N/A | | | | | | | | 9.06 | % | | | N/A | |
Service | | | (12.45 | ) | | | | | | | (2.57 | ) | | | N/A | | | | | | | | 4.68 | | | | N/A | | | | | | | | 8.77 | | | | N/A | |
Investor A | | | (12.45 | ) | | | | | | | (2.56 | ) | | | (7.68 | )% | | | | | | | 4.69 | | | | 3.57 | % | | | | | | | 8.76 | | | | 8.18 | % |
Investor C | | | (12.78 | ) | | | | | | | (3.31 | ) | | | (4.24 | ) | | | | | | | 3.90 | | | | 3.90 | | | | | | | | 7.91 | | | | 7.91 | |
Class K | | | (12.30 | ) | | | | | | | (2.26 | ) | | | N/A | | | | | | | | 4.99 | | | | N/A | | | | | | | | 9.07 | | | | N/A | |
Class R | | | (12.53 | ) | | | | | | | (2.77 | ) | | | N/A | | | | | | | | 4.42 | | | | N/A | | | | | | | | 8.46 | | | | N/A | |
Russell 1000® Value Index | | | (13.38 | ) | | | | | | | (1.64 | ) | | | N/A | | | | | | | | 4.36 | | | | N/A | | | | | | | | 9.85 | | | | N/A | |
| | (a) | Assuming maximum sales charges, if any. Average annual total returns with and without sales charges reflect reductions for distribution and service fees. See “About Fund Performance” on page 7 for a detailed description of share classes, including any related sales charges and fees, and how performance was calculated for certain share classes. | |
| | (b) | The Fund invests all of its assets in the Master LLC. Under normal circumstances, the Master LLC seeks to invest at least 80% of its net assets plus the amount of any borrowings for investment purposes in large cap equity securities of U.S. issuers and derivatives that have similar economic characteristics to such securities. The Fund’s total returns prior to June 12, 2017 are the returns of the Fund when it followed different investment strategies under the name BlackRock Large Cap Value Fund. | |
N/A - Not applicable as share class and index do not have a sales charge.
Past performance is not indicative of future results.
Performance results may include adjustments made for financial reporting purposes in accordance with U.S. generally accepted accounting principles.
| | |
| Fund Summary as of May 31, 2020 (continued) | | BlackRock Advantage Large Cap Value Fund |
Expense Example
| | | | | | | | | | | | | | | | | | | | | | | | | | | | | | | | |
| | | Actual | | | | | | Hypothetical(a) | | | | |
| | | Beginning
Account Value
(12/01/19) | | | Ending
Account Value
(05/31/20) | | | Expenses Paid During the Period(b) | | | | | | Beginning
Account Value
(12/01/19) | | | Ending
Account Value
(05/31/20) | | | Expenses Paid During the Period(b) | | | Annualized
Expense
Ratio | |
Institutional | | | $1,000.00 | | | | $876.70 | | | | $2.53 | | | | | | | | $1,000.00 | | | | $1,022.30 | | | | $2.73 | | | | 0.54 | % |
Service | | | 1,000.00 | | | | 875.50 | | | | 3.70 | | | | | | | | 1,000.00 | | | | 1,021.05 | | | | 3.99 | | | | 0.79 | |
Investor A | | | 1,000.00 | | | | 875.50 | | | | 3.70 | | | | | | | | 1,000.00 | | | | 1,021.05 | | | | 3.99 | | | | 0.79 | |
Investor C | | | 1,000.00 | | | | 872.20 | | | | 7.21 | | | | | | | | 1,000.00 | | | | 1,017.30 | | | | 7.77 | | | | 1.54 | |
Class K | | | 1,000.00 | | | | 877.00 | | | | 2.30 | | | | | | | | 1,000.00 | | | | 1,022.55 | | | | 2.48 | | | | 0.49 | |
Class R | | | 1,000.00 | | | | 874.70 | | | | 4.87 | | | | | | | | 1,000.00 | | | | 1,019.80 | | | | 5.25 | | | | 1.04 | |
| | (a) | Hypothetical 5% annual return before expenses is calculated by prorating the number of days in the most recent six-months divided by 366. | |
| | (b) | For each class of the Fund, expenses are equal to the annualized expense ratio for the class, multiplied by the average account value over the period, multiplied by 183/366 (to reflect the six-month year period shown). Because the Fund invests all of its assets in the Master Portfolio the expense example reflects the net expenses of both the Fund and the Master Portfolio in which it invests. | |
See “Disclosure of Expenses” on page 7 for further information on how expenses were calculated.
| | |
| 6 | | 2020 BLACKROCK ANNUAL REPORTTO SHAREHOLDERS |
About Fund Performance
Institutional and Class K Shares are not subject to any sales charge. These shares bear no ongoing distribution or service fees and are available only to certain eligible investors. Class K Shares performance shown prior to the Class K Shares inception date of January 25, 2018 is that of Institutional Shares. The performance of the Fund’s Class K Shares would be substantially similar to Institutional Shares because Class K Shares and Institutional Shares invest in the same portfolio of securities and performance would only differ to the extent that Class K Shares and Institutional Shares have different expenses. The actual returns of Class K Shares would have been higher than those of the Institutional Shares because Class K Shares have lower expenses than the Institutional Shares.
Service Shares are not subject to any sales charge. These shares are subject to a service fee of 0.25% per year (but no distribution fee) and are only available to certain eligible investors.
Investor A Shares are subject to a maximum initial sales charge (front-end load) of 5.25% and a service fee of 0.25% per year (but no distribution fee). Certain redemptions of these shares may be subject to a contingent deferred sales charge (“CDSC”) where no initial sales charge was paid at the time of purchase. These shares are generally available through financial intermediaries.
Investor C Shares are subject to a 1.00% CDSC if redeemed within one year of purchase. In addition, these shares are subject to a distribution fee of 0.75% per year and a service fee of 0.25% per year. These shares are generally available through financial intermediaries. These shares automatically convert to Investor A Shares after approximately ten years.
Class R Shares are not subject to any sales charge. These shares are subject to a distribution fee of 0.25% per year and a service fee of 0.25% per year. These shares are available only to certain employer-sponsored retirement plans.
Performance information reflects past performance and does not guarantee future results. Current performance may be lower or higher than the performance data quoted. Refer to blackrock.com to obtain performance data current to the most recent month-end. Performance results do not reflect the deduction of taxes that a shareholder would pay on Fund distributions or the redemption of Fund shares. Figures shown in the performance tables on the previous pages assume reinvestment of all distributions, if any, at net asset value (“NAV”) on the ex-dividend date or payable date, as applicable. Investment return and principal value of shares will fluctuate so that shares, when redeemed, may be worth more or less than their original cost. Distributions paid to each class of shares will vary because of the different levels of service, distribution and transfer agency fees applicable to each class, which are deducted from the income available to be paid to shareholders.
BlackRock Advisors, LLC (the “Administrator”), the Fund’s administrator, has contractually agreed to waive and/or reimburse a portion of the Fund’s expenses. Without such waiver and/or reimbursement, the Fund’s performance would have been lower. With respect to the Fund’s contractual waiver, the Administrator is under no obligation to continue waiving and/or reimbursing its fees after the applicable termination date of such agreement. See Note 4 of the Notes to Financial Statements for additional information on waivers and/or reimbursements.
Disclosure of Expenses
Shareholders of the Fund may incur the following charges: (a) transactional expenses, such as sales charges; and (b) operating expenses, including administration fees, service and distribution fees, including 12b-1 fees, acquired fund fees and expenses, and other fund expenses. The expense example shown on the previous page (which is based on a hypothetical investment of $1,000 invested on December 1, 2019 and held through May 31, 2020) is intended to assist shareholders both in calculating expenses based on an investment in the Fund and in comparing these expenses with similar costs of investing in other mutual funds.
The expense example provides information about actual account values and actual expenses. In order to estimate the expenses a shareholder paid during the period covered by this report, shareholders can divide their account value by $1,000 and then multiply the result by the number corresponding to their share class under the heading entitled “Expenses Paid During the Period.”
The expense example also provides information about hypothetical account values and hypothetical expenses based on the Fund’s actual expense ratio and an assumed rate of return of 5% per year before expenses. In order to assist shareholders in comparing the ongoing expenses of investing in the Fund and other funds, compare the 5% hypothetical examples with the 5% hypothetical examples that appear in shareholder reports of other funds.
The expenses shown in the expense example are intended to highlight shareholders’ ongoing costs only and do not reflect transactional expenses, such as sales charges, if any. Therefore, the hypothetical example is useful in comparing ongoing expenses only, and will not help shareholders determine the relative total expenses of owning different funds. If these transactional expenses were included, shareholder expenses would have been higher.
Derivative Financial Instruments
The Master Portfolio may invest in various derivative financial instruments. These instruments are used to obtain exposure to a security, commodity, index, market, and/or other assets without owning or taking physical custody of securities, commodities and/or other referenced assets or to manage market, equity, credit, interest rate, foreign currency exchange rate, commodity and/or other risks. Derivative financial instruments may give rise to a form of economic leverage and involve risks, including the imperfect correlation between the value of a derivative financial instrument and the underlying asset, possible default of the counterparty to the transaction or illiquidity of the instrument. The Master Portfolio’s successful use of a derivative financial instrument depends on the investment adviser’s ability to predict pertinent market movements accurately, which cannot be assured. The use of these instruments may result in losses greater than if they had not been used, may limit the amount of appreciation the Master Portfolio can realize on an investment and/or may result in lower distributions paid to shareholders. The Master Portfolio’s investments in these instruments, if any, are discussed in detail in the Notes to Financial Statements.
Statement of Assets and Liabilities
May 31, 2020
| | | | |
| | | BlackRock
Advantage Large Cap
Value Fund | |
| |
ASSETS | | | | |
Investments at value — Master Portfolio | | $ | 497,398,150 | |
Receivables: | | | | |
Capital shares sold | | | 234,019 | |
From the Administrator | | | 34,986 | |
Withdrawals from the Master Portfolio | | | 863,872 | |
Prepaid expenses | | | 45,511 | |
| | | | |
Total assets | | | 498,576,538 | |
| | | | |
| |
LIABILITIES | | | | |
Payables: | | | | |
Capital shares redeemed | | | 1,097,891 | |
Officer’s fees | | | 156 | |
Other accrued expenses | | | 77,804 | |
Other affiliates | | | 8,636 | |
Service and distribution fees | | | 99,559 | |
Transfer agent fees | | | 113,138 | |
| | | | |
Total liabilities | | | 1,397,184 | |
| | | | |
NET ASSETS | | $ | 497,179,354 | |
| | | | |
| |
NET ASSETS CONSIST OF | | | | |
Paid-in capital | | $ | 514,504,090 | |
Accumulated loss | | | (17,324,736 | ) |
| | | | |
NET ASSETS | | $ | 497,179,354 | |
| | | | |
| | |
| 8 | | 2020 BLACKROCK ANNUAL REPORTTO SHAREHOLDERS |
Statement of Assets and Liabilities (continued)
May 31, 2020
| | | | |
| | | BlackRock
Advantage Large
Cap Value Fund | |
| |
NET ASSET VALUE | | | | |
| |
Institutional | | | | |
Net assets | | $ | 146,364,654 | |
| | | | |
Shares outstanding | | | 5,916,131 | |
| | | | |
Net asset value | | $ | 24.74 | |
| | | | |
Shares authorized | | | 400 million | |
| | | | |
Par value | | $ | 0.10 | |
| | | | |
Service | | | | |
Net assets | | $ | 11,180,527 | |
| | | | |
Shares outstanding | | | 455,411 | |
| | | | |
Net asset value | | $ | 24.55 | |
| | | | |
Shares authorized | | | 50 million | |
| | | | |
Par value | | $ | 0.10 | |
| | | | |
Investor A | | | | |
Net assets | | $ | 280,448,570 | |
| | | | |
Shares outstanding | | | 11,597,006 | |
| | | | |
Net asset value | | $ | 24.18 | |
| | | | |
Shares authorized | | | 400 million | |
| | | | |
Par value | | $ | 0.10 | |
| | | | |
Investor C | | | | |
Net assets | | $ | 43,394,668 | |
| | | | |
Shares outstanding | | | 1,944,657 | |
| | | | |
Net asset value | | $ | 22.31 | |
| | | | |
Shares authorized | | | 400 million | |
| | | | |
Par value | | $ | 0.10 | |
| | | | |
Class K | | | | |
Net assets | | $ | 4,971,231 | |
| | | | |
Shares outstanding | | | 200,908 | |
| | | | |
Net asset value | | $ | 24.74 | |
| | | | |
Shares authorized | | | 2 billion | |
| | | | |
Par value | | $ | 0.10 | |
| | | | |
Class R | | | | |
Net assets | | $ | 10,819,704 | |
| | | | |
Shares outstanding | | | 466,846 | |
| | | | |
Net asset value | | $ | 23.18 | |
| | | | |
Shares authorized | | | 200 million | |
| | | | |
Par value | | $ | 0.10 | |
| | | | |
See notes to financial statements.
Statements of Operations
| | | | | | | | |
| | | BlackRock Advantage Large Cap Value Fund | |
| | | Period from
10/01/19 to 05/31/20 | | | Year Ended
09/30/19 | |
| | |
INVESTMENT INCOME | | | | | | | | |
Net investment income allocated from the Master Portfolio: | | | | | | | | |
Dividends — unaffiliated | | $ | 10,483,554 | | | $ | 16,180,737 | |
Dividends — affiliated | | | 43,851 | | | | 138,886 | |
Interest — unaffiliated | | | 1,974 | | | | 5,873 | |
Securities lending income — affiliated — net | | | 40,780 | | | | 18,009 | |
Foreign taxes withheld | | | (26,852 | ) | | | (2,441 | ) |
Expenses | | | (2,085,213 | ) | | | (3,246,933 | ) |
Fees waived | | | 196,770 | | | | 204,651 | |
| | | | | | | | |
Total investment income | | | 8,654,864 | | | | 13,298,782 | |
| | | | | | | | |
| | |
FUND EXPENSES | | | | | | | | |
Administration | | | 963,321 | | | | 1,552,042 | |
Service and distribution — class specific | | | 955,285 | | | | 1,710,108 | |
Transfer agent — class specific | | | 432,074 | | | | 729,335 | |
Professional | | | 72,672 | | | | 63,741 | |
Registration | | | 70,839 | | | | 94,854 | |
Printing | | | 8,092 | | | | 9,995 | |
Accounting services | | | 4,680 | | | | 6,797 | |
Officer | | | 239 | | | | 224 | |
Offering | | | — | | | | 15,084 | |
Board realignment and consolidation | | | — | | | | 12,646 | |
Miscellaneous | | | 8,398 | | | | 17,767 | |
| | | | | | | | |
Total expenses | | | 2,515,600 | | | | 4,212,593 | |
Less: | | | | | | | | |
Fees waived and/or reimbursed by the Administrator | | | (1,128,394 | ) | | | (1,773,150 | ) |
Transfer agent fees waived and/or reimbursed — class specific | | | (241,357 | ) | | | (415,925 | ) |
| | | | | | | | |
Total expenses after fees waived and/or reimbursed | | | 1,145,849 | | | | 2,023,518 | |
| | | | | | | | |
Net investment income | | | 7,509,015 | | | | 11,275,264 | |
| | | | | | | | |
| | |
REALIZED AND UNREALIZED GAIN (LOSS) ALLOCATED FROM THE MASTER PORTFOLIO | | | | | | | | |
Net realized gain (loss) from investment, capital gains distributions received from affiliated investment companies and futures contracts | | | (18,115,497 | ) | | | 11,541,376 | |
Net change in unrealized appreciation (depreciation) on investments and futures contracts | | | (43,454,650 | ) | | | (12,032,524 | ) |
| | | | | | | | |
Total net realized and unrealized loss | | | (61,570,147 | ) | | | (491,148 | ) |
| | | | | | | | |
NET INCREASE (DECREASE) IN NET ASSETS RESULTING FROM OPERATIONS | | $ | (54,061,132 | ) | | $ | 10,784,116 | |
| | | | | | | | |
See notes to financial statements.
| | |
| 10 | | 2020 BLACKROCK ANNUAL REPORTTO SHAREHOLDERS |
Statement of Changes in Net Assets
| | | | | | | | | | | | | | | | |
| | | BlackRock Advantage Large Cap Value Fund | |
| | | Period from
10/01/19
to 05/31/20 | | | | | | Year Ended September 30, | |
| | | 2019 | | | 2018 | |
| | | | |
INCREASE (DECREASE) IN NET ASSETS | | | | | | | | | | | | | | | | |
| | | | |
OPERATIONS | | | | | | | | | | | | | | | | |
Net investment income | | $ | 7,509,015 | | | | | | | $ | 11,275,264 | | | $ | 10,179,715 | |
Net realized gain (loss) | | | (18,115,497 | ) | | | | | | | 11,541,376 | | | | 55,565,962 | |
Net change in unrealized appreciation (depreciation) | | | (43,454,650 | ) | | | | | | | (12,032,524 | ) | | | 2,449,896 | |
| | | | | | | | | | | | | | | | |
Net increase (decrease) in net assets resulting from operations | | | (54,061,132 | ) | | | | | | | 10,784,116 | | | | 68,195,573 | |
| | | | | | | | | | | | | | | | |
| | | | |
DISTRIBUTIONS TO SHAREHOLDERS(a) | | | | | | | | | | | | | | | | |
Institutional | | | (7,730,707 | ) | | | | | | | (16,952,117 | ) | | | (3,267,581 | ) |
Service | | | (489,569 | ) | | | | | | | (1,352,638 | ) | | | (222,244 | ) |
Investor A | | | (12,856,425 | ) | | | | | | | (35,506,493 | ) | | | (5,920,308 | ) |
Investor B | | | — | | | | | | | | — | | | | (4,759 | ) |
Investor C | | | (1,988,449 | ) | | | | | | | (7,376,749 | ) | | | (858,989 | ) |
Class K | | | (216,291 | ) | | | | | | | (557,361 | ) | | | — | |
Class R | | | (586,477 | ) | | | | | | | (2,853,812 | ) | | | (487,938 | ) |
| | | | | | | | | | | | | | | | |
Decrease in net assets resulting from distributions to shareholders | | | (23,867,918 | ) | | | | | | | (64,599,170 | ) | | | (10,761,819 | ) |
| | | | | | | | | | | | | | | | |
| | | | |
CAPITAL SHARE TRANSACTIONS | | | | | | | | | | | | | | | | |
Net increase (decrease) in net assets derived from capital share transactions | | | (54,934,748 | ) | | | | | | | 33,391,597 | | | | (71,782,542 | ) |
| | | | | | | | | | | | | | | | |
| | | | |
NET ASSETS | | | | | | | | | | | | | | | | |
Total decrease in net assets | | | (132,863,798 | ) | | | | | | | (20,423,457 | ) | | | (14,348,788 | ) |
Beginning of period | | | 630,043,152 | | | | | | | | 650,466,609 | | | | 664,815,397 | |
| | | | | | | | | | | | | | | | |
End of period | | $ | 497,179,354 | | | | | | | $ | 630,043,152 | | | $ | 650,466,609 | |
| | | | | | | | | | | | | | | | |
| (a) | Distributions for annual periods determined in accordance with U.S. federal income tax regulations. |
See notes to financial statements.
Financial Highlights
(For a share outstanding throughout each period)
| | | | | | | | | | | | | | | | | | | | | | | | | | | | |
| | | BlackRock Advantage Large Cap Value Fund | |
| |
| | | Institutional | |
| | | Period from
10/01/19 to 05/31/20 | | | | | | Year Ended September 30, | |
| | | | | | 2019 | | | 2018 | | | 2017 | | | 2016 | | | 2015 | |
| | | | | | | |
Net asset value, beginning of period | | $ | 28.08 | | | | | | | $ | 30.89 | | | $ | 28.32 | | | $ | 23.57 | | | $ | 21.58 | | | $ | 22.25 | |
| | | | | | | | | | | | | | | | | | | | | | | | | | | | |
Net investment income(a) | | | 0.39 | | | | | | | | 0.57 | | | | 0.55 | | | | 0.36 | | | | 0.26 | | | | 0.23 | |
Net realized and unrealized gain (loss) | | | (2.60 | ) | | | | | | | (0.26 | ) | | | 2.57 | | | | 4.74 | | | | 1.96 | | | | (0.65 | ) |
| | | | | | | | | | | | | | | | | | | | | | | | | | | | |
Net increase (decrease) from investment operations | | | (2.21 | ) | | | | | | | 0.31 | | | | 3.12 | | | | 5.10 | | | | 2.22 | | | | (0.42 | ) |
| | | | | | | | | | | | | | | | | | | | | | | | | | | | |
Distributions(b) | | | | | | | | | | | | | | | | | | | | | | | | | | | | |
From net investment income | | | (0.58 | ) | | | | | | | (0.59 | ) | | | (0.43 | ) | | | (0.35 | ) | | | (0.23 | ) | | | (0.25 | ) |
From net realized gain | | | (0.55 | ) | | | | | | | (2.53 | ) | | | (0.12 | ) | | | — | | | | — | | | | — | |
| | | | | | | | | | | | | | | | | | | | | | | | | | | | |
Total distributions | | | (1.13 | ) | | | | | | | (3.12 | ) | | | (0.55 | ) | | | (0.35 | ) | | | (0.23 | ) | | | (0.25 | ) |
| | | | | | | | | | | | | | | | | | | | | | | | | | | | |
| | | | | | | |
Net asset value, end of period | | $ | 24.74 | | | | | | | $ | 28.08 | | | $ | 30.89 | | | $ | 28.32 | | | $ | 23.57 | | | $ | 21.58 | |
| | | | | | | | | | | | | | | | | | | | | | | | | | | | |
| | | | | | | |
Total Return(c) | | | | | | | | | | | | | | | | | | | | | | | | | | | | |
Based on net asset value(d) | | | (8.36 | )%(e) | | | | | | | 1.80 | % | | | 11.16 | % | | | 21.79 | % | | | 10.35 | % | | | (1.94 | )% |
| | | | | | | | | | | | | | | | | | | | | | | | | | | | |
| | | | | | | |
Ratios to Average Net Assets(f) | | | | | | | | | | | | | | | | | | | | | | | | | | | | |
Total expenses(g) | | | 0.89 | %(h) | | | | | | | 0.87 | % | | | 0.92 | %(i) | | | 0.94 | %(i) | | | 0.92 | %(i) | | | 0.91 | %(i) |
| | | | | | | | | | | | | | | | | | | | | | | | | | | | |
Total expenses after fees waived and/or reimbursed(g) | | | 0.54 | %(h) | | | | | | | 0.54 | % | | | 0.54 | %(i) | | | 0.77 | %(i) | | | 0.87 | %(i) | | | 0.86 | %(i) |
| | | | | | | | | | | | | | | | | | | | | | | | | | | | |
Net investment income(g) | | | 2.20 | %(h) | | | | | | | 2.09 | % | | | 1.87 | %(i) | | | 1.37 | %(i) | | | 1.18 | %(i) | | | 1.01 | %(i) |
| | | | | | | | | | | | | | | | | | | | | | | | | | | | |
| | | | | | | |
Supplemental Data | | | | | | | | | | | | | | | | | | | | | | | | | | | | |
Net assets, end of period (000) | | $ | 146,365 | | | | | | | $ | 192,744 | | | $ | 169,089 | | | $ | 166,970 | | | $ | 143,113 | | | $ | 162,376 | |
| | | | | | | | | | | | | | | | | | | | | | | | | | | | |
Portfolio turnover rate of the Master Portfolio | | | 70 | % | | | | | | | 161 | % | | | 143 | % | | | 137 | % | | | 40 | % | | | 30 | % |
| | | | | | | | | | | | | | | | | | | | | | | | | | | | |
| (a) | Based on average shares outstanding. |
| (b) | Distributions for annual periods determined in accordance with U.S. federal income tax regulations. |
| (c) | Where applicable, assumes the reinvestment of distributions. |
| (d) | Includes payment received from a settlement of litigation, through its investment in the Master Portfolio, which impacted the Fund’s total return. Excluding the payment from a settlement of litigation, the Fund’s total return is as follows: |
| | | | | | | | | | | | | | | | | | | | | | | | | | | | |
| | | Period from
10/01/19 to 05/31/20 | | | | | | Year Ended September 30, | |
| | | | | | 2019 | | | 2018 | | | 2017 | | | 2016 | | | 2015 | |
Total return | | | — | % | | | | | | | — | % | | | — | % | | | 21.66 | % | | | 10.25 | % | | | — | % |
| | | | | | | | | | | | | | | | | | | | | | | | | | | | |
| (e) | Aggregate total return. |
| (f) | Includes the Fund’s share of the Master Portfolio’s allocated expenses and/or net investment income. |
| (g) | Includes the Fund’s share of the Master Portfolio’s allocated fees waived is as follows: |
| | | | | | | | | | | | | | | | | | | | | | | | | | | | |
| | | Period from
10/01/19 to 05/31/20 | | | | | | Year Ended September 30, | |
| | | | | | 2019 | | | 2018 | | | 2017 | | | 2016 | | | 2015 | |
Fees waived | | | 0.05 | % | | | | | | | 0.03 | % | | | — | % | | | — | % | | | — | % | | | — | % |
| | | | | | | | | | | | | | | | | | | | | | | | | | | | |
| (i) | Includes the Fund’s share of the Master Portfolio’s allocated fees waived of less than 0.01%. |
See notes to financial statements.
| | |
| 12 | | 2020 BLACKROCK ANNUAL REPORTTO SHAREHOLDERS |
Financial Highlights (continued)
(For a share outstanding throughout each period)
| | | | | | | | | | | | | | | | | | | | | | | | | | | | |
| | | BlackRock Advantage Large Cap Value Fund (continued) | |
| |
| | | Service | |
| | | Period from
10/01/19 to 05/31/20 | | | | | | Year Ended September 30, | |
| | | | | | 2019 | | | 2018 | | | 2017 | | | 2016 | | | 2015 | |
| | | | | | | |
Net asset value, beginning of period | | $ | 27.85 | | | | | | | $ | 30.65 | | | $ | 28.11 | | | $ | 23.38 | | | $ | 21.40 | | | $ | 22.07 | |
| | | | | | | | | | | | | | | | | | | | | | | | | | | | |
Net investment income(a) | | | 0.34 | | | | | | | | 0.50 | | | | 0.47 | | | | 0.28 | | | | 0.19 | | | | 0.16 | |
Net realized and unrealized gain (loss) | | | (2.58 | ) | | | | | | | (0.26 | ) | | | 2.54 | | | | 4.72 | | | | 1.95 | | | | (0.65 | ) |
| | | | | | | | | | | | | | | | | | | | | | | | | | | | |
Net increase (decrease) from investment operations | | | (2.24 | ) | | | | | | | 0.24 | | | | 3.01 | | | | 5.00 | | | | 2.14 | | | | (0.49 | ) |
| | | | | | | | | | | | | | | | | | | | | | | | | | | | |
Distributions(b) | | | | | | | | | | | | | | | | | | | | | | | | | | | | |
From net investment income | | | (0.51 | ) | | | | | | | (0.51 | ) | | | (0.35 | ) | | | (0.27 | ) | | | (0.16 | ) | | | (0.18 | ) |
From net realized gain | | | (0.55 | ) | | | | | | | (2.53 | ) | | | (0.12 | ) | | | — | | | | — | | | | — | |
| | | | | | | | | | | | | | | | | | | | | | | | | | | | |
Total distributions | | | (1.06 | ) | | | | | | | (3.04 | ) | | | (0.47 | ) | | | (0.27 | ) | | | (0.16 | ) | | | (0.18 | ) |
| | | | | | | | | | | | | | | | | | | | | | | | | | | | |
| | | | | | | |
Net asset value, end of period | | $ | 24.55 | | | | | | | $ | 27.85 | | | $ | 30.65 | | | $ | 28.11 | | | $ | 23.38 | | | $ | 21.40 | |
| | | | | | | | | | | | | | | | | | | | | | | | | | | | |
| | | | | | | |
Total Return(c) | | | | | | | | | | | | | | | | | | | | | | | | | | | | |
Based on net asset value(d) | | | (8.51 | )%(e) | | | | | | | 1.56 | % | | | 10.84 | % | | | 21.48 | % | | | 10.03 | % | | | (2.27 | )% |
| | | | | | | | | | | | | | | | | | | | | | | | | | | | |
| | | | | | | |
Ratios to Average Net Assets(f) | | | | | | | | | | | | | | | | | | | | | | | | | | | | |
Total expenses(g) | | | 1.15 | %(h) | | | | | | | 1.15 | % | | | 1.21 | %(i) | | | 1.24 | %(i) | | | 1.23 | %(i) | | | 1.20 | %(i) |
| | | | | | | | | | | | | | | | | | | | | | | | | | | | |
Total expenses after fees waived and/or reimbursed(g) | | | 0.79 | %(h) | | | | | | | 0.79 | % | | | 0.79 | %(i) | | | 1.06 | %(i) | | | 1.18 | %(i) | | | 1.15 | %(i) |
| | | | | | | | | | | | | | | | | | | | | | | | | | | | |
Net investment income(g) | | | 1.95 | %(h) | | | | | | | 1.84 | % | | | 1.62 | %(i) | | | 1.08 | %(i) | | | 0.87 | %(i) | | | 0.72 | %(i) |
| | | | | | | | | | | | | | | | | | | | | | | | | | | | |
| | | | | | | |
Supplemental Data | | | | | | | | | | | | | | | | | | | | | | | | | | | | |
Net assets, end of period (000) | | $ | 11,181 | | | | | | | $ | 13,055 | | | $ | 13,704 | | | $ | 13,313 | | | $ | 13,313 | | | $ | 11,931 | |
| | | | | | | | | | | | | | | | | | | | | | | | | | | | |
Portfolio turnover rate of the Master Portfolio | | | 70 | % | | | | | | | 161 | % | | | 143 | % | | | 137 | % | | | 40 | % | | | 30 | % |
| | | | | | | | | | | | | | | | | | | | | | | | | | | | |
| (a) | Based on average shares outstanding. |
| (b) | Distributions for annual periods determined in accordance with U.S. federal income tax regulations. |
| (c) | Where applicable, assumes the reinvestment of distributions. |
| (d) | Includes payment received from a settlement of litigation, through its investment in the Master Portfolio, which impacted the Fund’s total return. Excluding the payment from a settlement of litigation, the Fund’s total return is as follows: |
| | | | | | | | | | | | | | | | | | | | | | | | | | | | |
| | | Period from
10/01/19 to 05/31/20 | | | | | | Year Ended September 30, | |
| | | | | | 2019 | | | 2018 | | | 2017 | | | 2016 | | | 2015 | |
Total return | | | — | % | | | | | | | — | % | | | — | % | | | 21.35 | % | | | 9.93 | % | | | — | % |
| | | | | | | | | | | | | | | | | | | | | | | | | | | | |
| (e) | Aggregate total return. |
| (f) | Includes the Fund’s share of the Master Portfolio’s allocated expenses and/or net investment income. |
| (g) | Includes the Fund’s share of the Master Portfolio’s allocated fees waived is as follows: |
| | | | | | | | | | | | | | | | | | | | | | | | | | | | |
| | | Period from
10/01/19 to 05/31/20 | | | | | | Year Ended September 30, | |
| | | | | | 2019 | | | 2018 | | | 20 17 | | | 2016 | | | 2015 | |
Fees waived | | | 0.05 | % | | | | | | | 0.03 | % | | | — | % | | | — | % | | | — | % | | | — | % |
| | | | | | | | | | | | | | | | | | | | | | | | | | | | |
| (i) | Includes the Fund’s share of the Master Portfolio’s allocated fees waived of less than 0.01%. |
See notes to financial statements.
| | |
FUND FINANCIAL HIGHLIGHTS | | 13 |
Financial Highlights (continued)
(For a share outstanding throughout each period)
| | | | | | | | | | | | | | | | | | | | | | | | | | | | |
| | | BlackRock Advantage Large Cap Value Fund (continued) | |
| |
| | | Investor A | |
| | | Period from
10/01/19 to 05/31/20 | | | | | | Year Ended September 30, | |
| | | | | | 2019 | | | 2018 | | | 2017 | | | 2016 | | | 2015 | |
| | | | | | | |
Net asset value, beginning of period | | $ | 27.45 | | | | | | | $ | 30.26 | | | $ | 27.76 | | | $ | 23.09 | | | $ | 21.14 | | | $ | 21.79 | |
| | | | | | | | | | | | | | | | | | | | | | | | | | | | |
Net investment income(a) | | | 0.34 | | | | | | | | 0.49 | | | | 0.47 | | | | 0.28 | | | | 0.19 | | | | 0.16 | |
Net realized and unrealized gain (loss) | | | (2.55 | ) | | | | | | | (0.25 | ) | | | 2.51 | | | | 4.65 | | | | 1.92 | | | | (0.64 | ) |
| | | | | | | | | | | | | | | | | | | | | | | | | | | | |
Net increase (decrease) from investment operations | | | (2.21 | ) | | | | | | | 0.24 | | | | 2.98 | | | | 4.93 | | | | 2.11 | | | | (0.48 | ) |
| | | | | | | | | | | | | | | | | | | | | | | | | | | | |
Distributions(b) | | | | | | | | | | | | | | | | | | | | | | | | | | | | |
From net investment income | | | (0.51 | ) | | | | | | | (0.52 | ) | | | (0.36 | ) | | | (0.26 | ) | | | (0.16 | ) | | | (0.17 | ) |
From net realized gain | | | (0.55 | ) | | | | | | | (2.53 | ) | | | (0.12 | ) | | | — | | | | — | | | | — | |
| | | | | | | | | | | | | | | | | | | | | | | | | | | | |
Total distributions | | | (1.06 | ) | | | | | | | (3.05 | ) | | | (0.48 | ) | | | (0.26 | ) | | | (0.16 | ) | | | (0.17 | ) |
| | | | | | | | | | | | | | | | | | | | | | | | | | | | |
| | | | | | | |
Net asset value, end of period | | $ | 24.18 | | | | | | | $ | 27.45 | | | $ | 30.26 | | | $ | 27.76 | | | $ | 23.09 | | | $ | 21.14 | |
| | | | | | | | | | | | | | | | | | | | | | | | | | | | |
| | | | | | | |
Total Return(c) | | | | | | | | | | | | | | | | | | | | | | | | | | | | |
Based on net asset value(d) | | | (8.53 | )%(e) | | | | | | | 1.56 | % | | | 10.86 | % | | | 21.49 | % | | | 10.01 | % | | | (2.23 | )% |
| | | | | | | | | | | | | | | | | | | | | | | | | | | | |
| | | | | | | |
Ratios to Average Net Assets(f) | | | | | | | | | | | | | | | | | | | | | | | | | | | | |
Total expenses(g) | | | 1.15 | %(h) | | | | | | | 1.14 | % | | | 1.20 | %(i) | | | 1.22 | %(i) | | | 1.22 | %(i) | | | 1.22 | %(i) |
| | | | | | | | | | | | | | | | | | | | | | | | | | | | |
Total expenses after fees waived and/or reimbursed(g) | | | 0.79 | %(h) | | | | | | | 0.79 | % | | | 0.79 | %(i) | | | 1.04 | %(i) | | | 1.17 | %(i) | | | 1.17 | %(i) |
| | | | | | | | | | | | | | | | | | | | | | | | | | | | |
Net investment income(g) | | | 1.95 | %(h) | | | | | | | 1.84 | % | | | 1.61 | %(i) | | | 1.10 | %(i) | | | 0.88 | %(i) | | | 0.69 | %(i) |
| | | | | | | | | | | | | | | | | | | | | | | | | | | | |
| | | | | | | |
Supplemental Data | | | | | | | | | | | | | | | | | | | | | | | | | | | | |
Net assets, end of period (000) | | $ | 280,449 | | | | | | | $ | 336,565 | | | $ | 337,798 | | | $ | 346,128 | | | $ | 286,786 | | | $ | 297,653 | |
| | | | | | | | | | | | | | | | | | | | | | | | | | | | |
Portfolio turnover rate of the Master Portfolio | | | 70 | % | | | | | | | 161 | % | | | 143 | % | | | 137 | % | | | 40 | % | | | 30 | % |
| | | | | | | | | | | | | | | | | | | | | | | | | | | | |
| (a) | Based on average shares outstanding. |
| (b) | Distributions for annual periods determined in accordance with U.S. federal income tax regulations. |
| (c) | Where applicable, excludes the effects of any sales charges and assumes the reinvestment of distributions. |
| (d) | Includes payment received from a settlement of litigation, through its investment in the Master Portfolio, which impacted the Fund’s total return. Excluding the payment from a settlement of litigation, the Fund’s total return is as follows: |
| | | | | | | | | | | | | | | | | | | | | | | | | | | | |
| | | Period from
10/01/19 to 05/31/20 | | | | | | Year Ended September 30, | |
| | | | | | 2019 | | | 2018 | | | 2017 | | | 2016 | | | 2015 | |
Total return | | | — | % | | | | | | | — | % | | | — | % | | | 21.36 | % | | | 9.91 | % | | | — | % |
| | | | | | | | | | | | | | | | | | | | | | | | | | | | |
| (e) | Aggregate total return. |
| (f) | Includes the Fund’s share of the Master Portfolio’s allocated expenses and/or net investment income. |
| (g) | Includes the Fund’s share of the Master Portfolio’s allocated fees waived is as follows: |
| | | | | | | | | | | | | | | | | | | | | | | | | | | | |
| | | Period from
10/01/19 to 05/31/20 | | | | | | Year Ended September 30, | |
| | | | | | 2019 | | | 2018 | | | 2017 | | | 2016 | | | 2015 | |
Fees waived | | | 0.05 | % | | | | | | | 0.03 | % | | | — | % | | | — | % | | | — | % | | | — | % |
| | | | | | | | | | | | | | | | | | | | | | | | | | | | |
(h) Annualized.
(i) Includes the Fund’s share of the Master Portfolio’s allocated fees waived of less than 0.01%.
See notes to financial statements.
| | |
| 14 | | 2020 BLACKROCK ANNUAL REPORTTO SHAREHOLDERS |
Financial Highlights (continued)
(For a share outstanding throughout each period)
| | | | | | | | | | | | | | | | | | | | | | | | | | | | |
| | | BlackRock Advantage Large Cap Value Fund (continued) | |
| |
| | | Investor C | |
| | | Period from
10/01/19 to 05/31/20 | | | | | | Year Ended September 30, | |
| | | | | | 2019 | | | 2018 | | | 2017 | | | 2016 | | | 2015 | |
| | | | | | | |
Net asset value, beginning of period | | $ | 25.32 | | | | | | | $ | 28.06 | | | $ | 25.71 | | | $ | 21.36 | | | $ | 19.57 | | | $ | 20.19 | |
| | | | | | | | | | | | | | | | | | | | | | | | | | | | |
Net investment income (loss)(a) | | | 0.19 | | | | | | | | 0.27 | | | | 0.23 | | | | 0.07 | | | | 0.02 | | | | (0.01 | ) |
Net realized and unrealized gain (loss) | | | (2.36 | ) | | | | | | | (0.24 | ) | | | 2.33 | | | | 4.32 | | | | 1.78 | | | | (0.60 | ) |
| | | | | | | | | | | | | | | | | | | | | | | | | | | | |
Net increase (decrease) from investment operations | | | (2.17 | ) | | | | | | | 0.03 | | | | 2.56 | | | | 4.39 | | | | 1.80 | | | | (0.61 | ) |
| | | | | | | | | | | | | | | | | | | | | | | | | �� | | | |
Distributions(b) | | | | | | | | | | | | | | | | | | | | | | | | | | | | |
From net investment income | | | (0.29 | ) | | | | | | | (0.24 | ) | | | (0.09 | ) | | | (0.04 | ) | | | (0.01 | ) | | | (0.01 | ) |
From net realized gain | | | (0.55 | ) | | | | | | | (2.53 | ) | | | (0.12 | ) | | | — | | | | — | | | | — | |
| | | | | | | | | | | | | | | | | | | | | | | | | | | | |
Total distributions | | | (0.84 | ) | | | | | | | (2.77 | ) | | | (0.21 | ) | | | (0.04 | ) | | | (0.01 | ) | | | (0.01 | ) |
| | | | | | | | | | | | | | | | | | | | | | | | | | | | |
| | | | | | | |
Net asset value, end of period | | $ | 22.31 | | | | | | | $ | 25.32 | | | $ | 28.06 | | | $ | 25.71 | | | $ | 21.36 | | | $ | 19.57 | |
| | | | | | | | | | | | | | | | | | | | | | | | | | | | |
| | | | | | | |
Total Return(c) | | | | | | | | | | | | | | | | | | | | | | | | | | | | |
Based on net asset value(d) | | | (9.00 | )%(e) | | | | | | | 0.79 | % | | | 10.03 | % | | | 20.59 | % | | | 9.18 | % | | | (3.00 | )% |
| | | | | | | | | | | | | | | | | | | | | | | | | | | | |
| | | | | | | |
Ratios to Average Net Assets(f) | | | | | | | | | | | | | | | | | | | | | | | | | | | | |
Total expenses(g) | | | 1.91 | %(h) | | | | | | | 1.94 | % | | | 1.97 | %(i) | | | 1.98 | %(i) | | | 1.98 | %(i) | | | 1.98 | %(i) |
| | | | | | | | | | | | | | | | | | | | | | | | | | | | |
Total expenses after fees waived and/or reimbursed(g) | | | 1.54 | %(h) | | | | | | | 1.54 | % | | | 1.54 | %(i) | | | 1.84 | %(i) | | | 1.93 | %(i) | | | 1.93 | %(i) |
| | | | | | | | | | | | | | | | | | | | | | | | | | | | |
Net investment income (loss)(g) | | | 1.20 | %(h) | | | | | | | 1.08 | % | | | 0.87 | %(i) | | | 0.29 | %(i) | | | 0.12 | %(i) | | | (0.07 | )%(i) |
| | | | | | | | | | | | | | | | | | | | | | | | | | | | |
| | | | | | | |
Supplemental Data | | | | | | | | | | | | | | | | | | | | | | | | | | | | |
Net assets, end of period (000) | | $ | 43,395 | | | | | | | $ | 63,659 | | | $ | 94,919 | | | $ | 104,248 | | | $ | 156,999 | | | $ | 171,844 | |
| | | | | | | | | | | | | | | | | | | | | | | | | | | | |
Portfolio turnover rate of the Master Portfolio | | | 70 | % | | | | | | | 161 | % | | | 143 | % | | | 137 | % | | | 40 | % | | | 30 | % |
| | | | | | | | | | | | | | | | | | | | | | | | | | | | |
| (a) | Based on average shares outstanding. |
| (b) | Distributions for annual periods determined in accordance with U.S. federal income tax regulations. |
| (c) | Where applicable, excludes the effects of any sales charges and assumes the reinvestment of distributions. |
| (d) | Includes payment received from a settlement of litigation, through its investment in the Master Portfolio, which impacted the Fund’s total return. Excluding the payment from a settlement of litigation, the Fund’s total return is as follows: |
| | | | | | | | | | | | | | | | | | | | | | | | | | | | |
| | | Period from
10/01/19 to 05/31/20 | | | | | | Year Ended September 30, | |
| | | | | | 2019 | | | 2018 | | | 2017 | | | 2016 | | | 2015 | |
Total return | | | — | % | | | | | | | — | % | | | — | % | | | 20.44 | % | | | 9.08 | % | | | — | % |
| | | | | | | | | | | | | | | | | | | | | | | | | | | | |
| (e) | Aggregate total return. |
| (f) | Includes the Fund’s share of the Master Portfolio’s allocated expenses and/or net investment income. |
| (g) | Includes the Fund’s share of the Master Portfolio’s allocated fees waived is as follows: |
| | | | | | | | | | | | | | | | | | | | | | | | | | | | |
| | | Period from
10/01/19 to 05/31/20 | | | | | | Year Ended September 30, | |
| | | | | | 2019 | | | 2018 | | | 2017 | | | 2016 | | | 2015 | |
Fees waived | | | 0.05 | % | | | | | | | 0.03 | % | | | — | % | | | — | % | | | — | % | | | — | % |
| | | | | | | | | | | | | | | | | | | | | | | | | | | | |
| (i) | Includes the Fund’s share of the Master Portfolio’s allocated fees waived of less than 0.01%. |
See notes to financial statements.
| | |
FUND FINANCIAL HIGHLIGHTS | | 15 |
Financial Highlights (continued)
(For a share outstanding throughout each period)
| | | | | | | | | | | | |
| | | BlackRock Advantage Large Cap Value Fund (continued) | |
| | | | | | Class K | | | | |
| | | Period from
10/01/19
to 05/31/20 | | | Year Ended
09/30/19 | | | Period from 01/25/18(a) to 09/30/18 | |
| | | |
Net asset value, beginning of period | | $ | 28.09 | | | $ | 30.90 | | | $ | 30.90 | |
| | | | | | | | | | | | |
Net investment income(b) | | | 0.40 | | | | 0.58 | | | | 0.39 | |
Net realized and unrealized loss | | | (2.60 | ) | | | (0.26 | ) | | | (0.39 | ) |
| | | | | | | | | | | | |
Net increase (decrease) from investment operations | | | (2.20 | ) | | | 0.32 | | | | — | |
| | | | | | | | | | | | |
| | | |
Distributions(c) | | | | | | | | | | | | |
From net investment income | | | (0.60 | ) | | | (0.60 | ) | | | — | |
From net realized gain | | | (0.55 | ) | | | (2.53 | ) | | | — | |
| | | | | | | | | | | | |
Total distributions | | | (1.15 | ) | | | (3.13 | ) | | | — | |
| | | | | | | | | | | | |
| | | |
Net asset value, end of period | | $ | 24.74 | | | $ | 28.09 | | | $ | 30.90 | |
| | | | | | | | | | | | |
| | | |
Total Return(d) | | | | | | | | | | | | |
Based on net asset value | | | (8.35 | )%(e) | | | 1.85 | % | | | 0.00 | %(e) |
| | | | | | | | | | | | |
| | | |
Ratios to Average Net Assets(f) | | | | | | | | | | | | |
Total expenses(g) | | | 0.80 | %(h) | | | 0.79 | % | | | 0.83 | %(h)(i) |
| | | | | | | | | | | | |
Total expenses after fees waived and/or reimbursed(g) | | | 0.49 | %(h) | | | 0.49 | % | | | 0.49 | %(h)(i) |
| | | | | | | | | | | | |
Net investment income(g) | | | 2.24 | %(h) | | | 2.14 | % | | | 1.88 | %(h)(i) |
| | | | | | | | | | | | |
| | | |
Supplemental Data | | | | | | | | | | | | |
Net assets, end of period (000) | | $ | 4,971 | | | $ | 5,699 | | | $ | 5,459 | |
| | | | | | | | | | | | |
Portfolio turnover rate of the Master Portfolio | | | 70 | % | | | 161 | % | | | 143 | % |
| | | | | | | | | | | | |
| (a) | Commencement of operations. |
| (b) | Based on average shares outstanding. |
| (c) | Distributions for annual periods determined in accordance with U.S. federal income tax regulations. |
| (d) | Where applicable, assumes the reinvestment of distributions. |
| (e) | Aggregate total return. |
| (f) | Includes the Fund’s share of the Master Portfolio’s allocated expenses and/or net investment income. |
| (g) | Includes the Fund’s share of the Master LLC’s allocated fees waived as follows: |
| | | | | | | | | | | | |
| | | Period from
10/01/19
to 05/31/20 | | | Year Ended
09/30/19 | | | Period from
01/25/18(a)
to 09/30/18 | |
Fees waived | | | 0.05 | % | | | 0.03 | % | | | — | % |
| | | | | | | | | | | | |
| (i) | Includes the Fund’s share of the Master Portfolio’s allocated fees waived of less than 0.01%. |
See notes to financial statements.
| | |
| 16 | | 2020 BLACKROCK ANNUAL REPORTTO SHAREHOLDERS |
Financial Highlights (continued)
(For a share outstanding throughout each period)
| | | | | | | | | | | | | | | | | | | | | | | | | | | | |
| | | BlackRock Advantage Large Cap Value Fund (continued) | |
| |
| | | Class R | |
| | | Period from
10/01/19 to 05/31/20 | | | | | | Year Ended September 30, | |
| | | | | | 2019 | | | 2018 | | | 2017 | | | 2016 | | | 2015 | |
| | | | | | | |
Net asset value, beginning of period | | $ | 26.29 | | | | | | | $ | 29.10 | | | $ | 26.70 | | | $ | 22.21 | | | $ | 20.33 | | | $ | 20.96 | |
| | | | | | | | | | | | | | | | | | | | | | | | | | | | |
Net investment income(a) | | | 0.28 | | | | | | | | 0.41 | | | | 0.38 | | | | 0.20 | | | | 0.13 | | | | 0.09 | |
Net realized and unrealized gain (loss) | | | (2.43 | ) | | | | | | | (0.26 | ) | | | 2.42 | | | | 4.48 | | | | 1.84 | | | | (0.61 | ) |
| | | | | | | | | | | | | | | | | | | | | | | | | | | | |
Net increase (decrease) from investment operations | | | (2.15 | ) | | | | | | | 0.15 | | | | 2.80 | | | | 4.68 | | | | 1.97 | | | | (0.52 | ) |
| | | | | | | | | | | | | | | | | | | | | | | | | | | | |
Distributions(b) | | | | | | | | | | | | | | | | | | | | | | | | | | | | |
From net investment income | | | (0.41 | ) | | | | | | | (0.43 | ) | | | (0.28 | ) | | | (0.19 | ) | | | (0.09 | ) | | | (0.11 | ) |
From net realized gain | | | (0.55 | ) | | | | | | | (2.53 | ) | | | (0.12 | ) | | | — | | | | — | | | | — | |
| | | | | | | | | | | | | | | | | | | | | | | | | | | | |
Total distributions | | | (0.96 | ) | | | | | | | (2.96 | ) | | | (0.40 | ) | | | (0.19 | ) | | | (0.09 | ) | | | (0.11 | ) |
| | | | | | | | | | | | | | | | | | | | | | | | | | | | |
| | | | | | | |
Net asset value, end of period | | $ | 23.18 | | | | | | | $ | 26.29 | | | $ | 29.10 | | | $ | 26.70 | | | $ | 22.21 | | | $ | 20.33 | |
| | | | | | | | | | | | | | | | | | | | | | | | | | | | |
| | | | | | | |
Total Return(c) | | | | | | | | | | | | | | | | | | | | | | | | | | | | |
Based on net asset value(d) | | | (8.65 | )%(e) | | | | | | | 1.29 | % | | | 10.60 | % | | | 21.15 | % | | | 9.74 | % | | | (2.52 | )% |
| | | | | | | | | | | | | | | | | | | | | | | | | | | | |
| | | | | | | |
Ratios to Average Net Assets(f) | | | | | | | | | | | | | | | | | | | | | | | | | | | | |
Total expenses(g) | | | 1.43 | %(h) | | | | | | | 1.44 | % | | | 1.47 | %(i) | | | 1.50 | %(i) | | | 1.49 | %(i) | | | 1.48 | %(i) |
| | | | | | | | | | | | | | | | | | | | | | | | | | | | |
Total expenses after fees waived and/or reimbursed(g) | | | 1.04 | %(h) | | | | | | | 1.04 | % | | | 1.04 | %(i) | | | 1.33 | %(i) | | | 1.44 | %(i) | | | 1.43 | %(i) |
| | | | | | | | | | | | | | | | | | | | | | | | | | | | |
Net investment income(g) | | | 1.69 | %(h) | | | | | | | 1.59 | % | | | 1.37 | %(i) | | | 0.80 | %(i) | | | 0.61 | %(i) | | | 0.43 | %(i) |
| | | | | | | | | | | | | | | | | | | | | | | | | | | | |
| | | | | | | |
Supplemental Data | | | | | | | | | | | | | | | | | | | | | | | | | | | | |
Net assets, end of period (000) | | $ | 10,820 | | | | | | | $ | 18,321 | | | $ | 29,497 | | | $ | 33,484 | | | $ | 34,213 | | | $ | 34,551 | |
| | | | | | | | | | | | | | | | | | | | | | | | | | | | |
Portfolio turnover rate of the Master Portfolio | | | 70 | % | | | | | | | 161 | % | | | 143 | % | | | 137 | % | | | 40 | % | | | 30 | % |
| | | | | | | | | | | | | | | | | | | | | | | | | | | | |
| (a) | Based on average shares outstanding. |
| (b) | Distributions for annual periods determined in accordance with U.S. federal income tax regulations. |
| (c) | Where applicable, assumes the reinvestment of distributions. |
| (d) | Includes payment received from a settlement of litigation, through its investment in the Master Portfolio, which impacted the Fund’s total return. Excluding the payment from a settlement of litigation, the Fund’s total return is as follows: |
| | | | | | | | | | | | | | | | | | | | | | | | | | | | |
| | | Period from
10/01/19 to 05/31/20 | | | | | | Year Ended September 30, | |
| | | | | | 2019 | | | 2018 | | | 2017 | | | 2016 | | | 2015 | |
Total return | | | — | % | | | | | | | — | % | | | — | % | | | 21.01 | % | | | 9.64 | % | | | — | % |
| | | | | | | | | | | | | | | | | | | | | | | | | | | | |
| (e) | Aggregate total return. |
| (f) | Includes the Fund’s share of the Master Portfolio’s allocated expenses and/or net investment income. |
| (g) | Includes the Fund’s share of the Master Portfolio’s allocated fees waived is as follows: |
| | | | | | | | | | | | | | | | | | | | | | | | | | | | |
| | | Period from
10/01/19 to 05/31/20 | | | | | | Year Ended September 30, | |
| | | | | | 2019 | | | 2018 | | | 2017 | | | 2016 | | | 2015 | |
Fees waived | | | 0.05 | % | | | | | | | 0.03 | % | | | — | % | | | — | % | | | — | % | | | — | % |
| | | | | | | | | | | | | | | | | | | | | | | | | | | | |
(h) Annualized.
(i) Includes the Fund’s share of the Master Portfolio’s allocated fees waived of less than 0.01%.
See notes to financial statements.
| | |
FUND FINANCIAL HIGHLIGHTS | | 17 |
Notes to Financial Statements
BlackRock Large Cap Series Funds, Inc. (the “Corporation”) is registered under the Investment Company Act of 1940, as amended (the “1940 Act”), as an open-end management investment company. The Corporation is organized as a Maryland corporation. BlackRock Advantage Large Cap Value Fund (the “Fund”) is a series of the Corporation. The Fund is classified as diversified.
The Fund seeks to achieve its investment objective by investing all of its assets in Master Advantage Large Cap Value Portfolio (the “Master Portfolio”), a series of Master Large Cap Series LLC (the “Master LLC”), and an affiliate of the Corporation, which has the same investment objective and strategies as the Fund. The value of the Fund’s investment in the Master Portfolio reflects the Fund’s proportionate interest in the net assets of the Master Portfolio. The performance of the Fund is directly affected by the performance of the Master Portfolio. At May 31, 2020, the percentage of the Master Portfolio owned by the Fund was 99.9%. The financial statements of the Master Portfolio, including the Schedule of Investments, are included elsewhere in this report and should be read in conjunction with the Fund’s financial statements.
The Fund offers multiple classes of shares. All classes of shares have identical voting, dividend, liquidation and other rights and are subject to the same terms and conditions, except that certain classes bear expenses related to the shareholder servicing and distribution of such shares. Institutional, Service and Class K Shares are sold only to certain eligible investors. Service, Investor A, Investor C and Class R Shares bear certain expenses related to shareholder servicing of such shares, and Investor C and Class R Shares also bear certain expenses related to the distribution of such shares. Investor A and Investor C Shares are generally available through financial intermediaries. Class R Shares are sold only to certain employer-sponsored retirement plans. Each class has exclusive voting rights with respect to matters relating to its shareholder servicing and distribution expenditures (except that Investor C shareholders may vote on material changes to the Investor A Shares distribution and service plan). The Board of Directors of the Corporation and Board of Directors of the Master LLC are referred to throughout this report as the “Board” and the members are referred to as “Directors.”
| | | | | | | | | | | | |
| Share Class | | Initial Sales Charge | | | CDSC | | | Conversion Privilege | |
Institutional, Service, Class K and Class R Shares | | | No | | | | No | | | | None | |
Investor A Shares | | | Yes | | | | No | (a) | | | None | |
Investor C Shares | | | No | | | | Yes | (b) | | | To Investor A Shares after approximately 10 years | |
| | (a) | Investor A Shares may be subject to a contingent deferred sales charge (“CDSC”) for certain redemptions where no initial sales charge was paid at the time of purchase. | |
| | (b) | A CDSC of 1.00% is assessed on certain redemptions of Investor C Shares made within one year after purchase. | |
On November 13, 2019, the Board approved a change in the fiscal year-end of the Fund, effective as of May 31, 2020, from September 30 to May 31.
The Fund, together with certain other registered investment companies advised by BlackRock Advisors, LLC (the “Administrator”) or its affiliates, is included in a complex of equity, multi-asset, index and money market funds referred to as the BlackRock Multi-Asset Complex.
| 2. | SIGNIFICANT ACCOUNTING POLICIES |
The financial statements are prepared in conformity with accounting principles generally accepted in the United States of America (“U.S. GAAP”), which may require management to make estimates and assumptions that affect the reported amounts of assets and liabilities in the financial statements, disclosure of contingent assets and liabilities at the date of the financial statements and the reported amounts of increases and decreases in net assets from operations during the reporting period. Actual results could differ from those estimates. The Fund is considered an investment company under U.S. GAAP and follows the accounting and reporting guidance applicable to investment companies. Below is a summary of significant accounting policies:
Investment Transactions and Income Recognition: For financial reporting purposes, contributions to and withdrawals from the Master Portfolio are accounted for on a trade date basis. The Fund records its proportionate share of the Master Portfolio’s income, expenses and realized and unrealized gains and losses on a daily basis. Realized and unrealized gains and losses are adjusted utilizing partnership tax allocation rules. In addition, the Fund accrues its own expenses. Income, expenses and realized and unrealized gains and losses are allocated daily to each class based on its relative net assets.
Distributions: Distributions paid by the Fund are recorded on the ex-dividend date. Distributions of capital gains are recorded on the ex-dividend date and made at least annually. The character and timing of distributions are determined in accordance with U.S. federal income tax regulations, which may differ from U.S. GAAP.
Offering Costs: Offering costs are amortized over a 12-month period beginning with the commencement of operations of a class of shares.
Indemnifications: In the normal course of business, the Fund enters into contracts that contain a variety of representations that provide general indemnification. The Fund’s maximum exposure under these arrangements is unknown because it involves future potential claims against the Fund, which cannot be predicted with any certainty.
Other: Expenses directly related to the Fund or its classes are charged to the Fund or the applicable class. Other operating expenses shared by several funds, including other funds managed by the Administrator, are prorated among those funds on the basis of relative net assets or other appropriate methods. Expenses directly related to the Fund and other shared expenses prorated to the Fund are allocated daily to each class based on its relative net assets or other appropriate methods.
The Fund has an arrangement with its custodian whereby credits are earned on uninvested cash balances, which could be used to reduce custody fees and/or overdraft charges. The Fund may incur charges on overdrafts, subject to certain conditions.
| | |
| 18 | | 2020 BLACKROCK ANNUAL REPORTTO SHAREHOLDERS |
Notes to Financial Statements (continued)
| 3. | INVESTMENT VALUATION AND FAIR VALUE MEASUREMENTS |
The Fund’s policy is to value its financial instruments at fair value. The Fund records its investment in the Master Portfolio at fair value based on the Fund’s proportionate interest in the net assets of the Master Portfolio. Valuation of securities held by the Master Portfolio is discussed in Note 3 of the Master Portfolio’s Notes to Financial Statements, which are included elsewhere in this report.
| 4. | ADMINISTRATION AGREEMENT AND OTHER TRANSACTIONS WITH AFFILIATES |
Service and Distribution Fees: The Corporation, on behalf of the Fund, entered into a Distribution Agreement and a Distribution and Service Plan with BlackRock Investments, LLC (“BRIL”), an affiliate of the Administrator. Pursuant to the Distribution and Service Plan and in accordance with Rule 12b-1 under the 1940 Act, the Fund pays BRIL ongoing service and distribution fees. The fees are accrued daily and paid monthly at annual rates based upon the average daily net assets of the relevant share class of the Fund as follows:
| | | | | | | | |
| Share Class | | Service Fees | | | Distribution Fees | |
Service | | | 0.25 | % | | | N/A | |
Investor A | | | 0.25 | | | | N/A | |
Investor C | | | 0.25 | | | | 0.75 | % |
Class R | | | 0.25 | | | | 0.25 | |
BRIL and broker-dealers, pursuant to sub-agreements with BRIL, provide shareholder servicing and distribution services to the Fund. The ongoing service and/or distribution fee compensates BRIL and each broker-dealer for providing shareholder servicing and/or distribution related services to shareholders.
The following table shows the class specific service and distribution fees borne directly by each share class of the Fund:
| | | | | | | | |
| Share Class | | Period from
10/01/19 to 05/31/20 | | | Year Ended
09/30/19 | |
Service | | $ | 20,457 | | | $ | 32,037 | |
Investor A | | | 524,044 | | | | 831,473 | |
Investor C | | | 363,128 | | | | 728,558 | |
Class R | | | 47,656 | | | | 118,040 | |
| | | | | | | | |
| | $ | 955,285 | | | $ | 1,710,108 | |
| | | | | | | | |
Administration: The Corporation, on behalf of the Fund, entered into an Administration Agreement with the Administrator, an indirect, wholly-owned subsidiary of BlackRock, to provide administrative services (other than investment advice and related portfolio activities). For such services, the Fund pays the Administrator a monthly fee at an annual rate of 0.25% of the average daily net assets of the Fund. The Fund does not pay an investment advisory fee or investment management fee.
Transfer Agent: Pursuant to written agreements, certain financial intermediaries, some of which may be affiliates, provide the Fund with sub-accounting, recordkeeping, sub-transfer agency and other administrative services with respect to servicing of underlying investor accounts. For these services, these entities receive an asset-based fee or an annual fee per shareholder account, which will vary depending on share class and/or net assets. The Fund paid the following amounts to affiliates of BlackRock in return for these services, which are included in transfer agent — class specific in the Statements of Operations:
| | | | | | | | |
| Share Class | | Period from
10/01/19 to 05/31/20 | | | Year Ended
09/30/19 | |
Institutional | | $ | 1,451 | | | $ | 1,893 | |
Investor A | | | 643 | | | | 887 | |
| | | | | | | | |
| | $ | 2,094 | | | $ | 2,780 | |
| | | | | | | | |
The Administrator maintains a call center that is responsible for providing certain shareholder services to the Fund. Shareholder services include responding to inquiries and processing purchases and sales based upon instructions from shareholders. The Fund reimbursed the Administrator the following amounts for costs incurred in running the call center, which are included in transfer agent — class specific in the Statements of Operations:
| | | | | | | | |
| Share Class | | Period from
10/01/19 to 05/31/20 | | | Year Ended
09/30/19 | |
Institutional | | $ | 418 | | | $ | 904 | |
Service | | | 1,591 | | | | 2,808 | |
Investor A | | | 11,018 | | | | 20,368 | |
Investor C | | | 264 | | | | 1,149 | |
Class K | | | 13 | | | | 40 | |
Class R | | | 42 | | | | 168 | |
| | | | | | | | |
| | $ | 13,346 | | | $ | 25,437 | |
| | | | | | | | |
| | |
NOTESTO FINANCIAL STATEMENTS | | 19 |
Notes to Financial Statements (continued)
The following table shows the class specific transfer agent fees borne directly by each share class of the Fund:
| | | | | | | | |
| Share Class | | Period from
10/01/19 to 05/31/20 | | | Year Ended
09/30/19 | |
Institutional | | $ | 122,080 | | | $ | 170,476 | |
Service | | | 9,708 | | | | 15,820 | |
Investor A | | | 240,131 | | | | 383,678 | |
Investor C | | | 45,897 | | | | 120,364 | |
Class K | | | 431 | | | | 656 | |
Class R | | | 13,827 | | | | 38,341 | |
| | | | | | | | |
| | $ | 432,074 | | | $ | 729,335 | |
| | | | | | | | |
Other Fees: For the period ended May 31, 2020 and year ended September 30, 2019, affiliates earned underwriting discounts, direct commissions and dealer concessions on sales of the Fund’s Investor A Shares of $6,045 and $7,340, respectively.
Affiliates received CDSCs as follows:
| | | | | | | | |
| Share Class | | Period from
10/01/19 to 05/31/20 | | | Year Ended
09/30/19 | |
Investor A | | $ | 627 | | | $ | 624 | |
Investor C | | | 355 | | | | 1,114 | |
| | | | | | | | |
| | $ | 982 | | | $ | 1,738 | |
| | | | | | | | |
Expense Limitations, Waivers and Reimbursements: With respect to the Fund, the Administrator contractually agreed to waive and/or reimburse fees or expenses in order to limit expenses, excluding interest expense, dividend expense, tax expense, acquired fund fees and expenses, and certain other fund expenses, which constitute extraordinary expenses not incurred in the ordinary course of the Fund’s business (“expense limitation”). The expense limitation as a percentage of average daily net assets are as follows:
| | | | | | | | | | |
| Institutional | | Service | | Investor A | | Investor C | | Class K | | Class R |
0.54% | | 0.79% | | 0.79% | | 1.54% | | 0.49% | | 1.04% |
The Administrator has agreed not to reduce or discontinue these contractual expense limitations through January 31, 2021, unless approved by the Board, including a majority of the independent directors who are not “interested persons” of the Corporation, as defined in the 1940 Act (“Independent Directors”), or by a vote of a majority of the outstanding voting securities of the Fund. For the period ended May 31, 2020 and year ended September 30, 2019, the Administrator waived and/or reimbursed $1,128,394 and $1,760,504, respectively, which are included in fees waived and/or reimbursed by the Administrator in the Statements of Operations.
The Fund has incurred expenses in connection with the realignment and consolidation of the boards of directors of certain BlackRock-advised funds. The Administrator has voluntarily agreed to reimburse the Fund for all or a portion of such expenses, which amounts are included in fees waived and/or reimbursed by the Administrator in the Statements of Operations. For the year ended September 30, 2019, the amount reimbursed to the Fund was $12,646.
These amounts waived and/or reimbursed are included in transfer agent fees waived and/or reimbursed — class specific, in the Statements of Operations. Class specific expense waivers and/or reimbursements are as followed:
| | | | | | | | |
| | | Transfer Agent Fees Waived and/or Reimbursed | |
| Share Class | | Period from
10/01/19 to 05/31/20 | | | Year Ended
09/30/19 | |
Institutional | | $ | 62,916 | | | $ | 82,848 | |
Service | | | 5,637 | | | | 9,388 | |
Investor A | | | 135,998 | | | | 216,062 | |
Investor C | | | 27,302 | | | | 80,411 | |
Class K | | | 431 | | | | 656 | |
Class R | | | 9,073 | | | | 26,560 | |
| | | | | | | | |
| | $ | 241,357 | | | $ | 415,925 | |
| | | | | | | | |
Interfund Lending: In accordance with an exemptive order (the “Order”) from the U.S. Securities and Exchange Commission (“SEC”), the Fund may participate in a joint lending and borrowing facility for temporary purposes (the “Interfund Lending Program”), subject to compliance with the terms and conditions of the Order, and to the extent permitted by the Fund’s investment policies and restrictions. The Fund is currently permitted to borrow under the Interfund Lending Program.
A lending BlackRock fund may lend in aggregate up to 15% of its net assets, but may not lend more than 5% of its net assets to any one borrowing fund through the Interfund Lending Program. A borrowing BlackRock fund may not borrow through the Interfund Lending Program or from any other source more than 33 1/3% of its total assets (or any lower threshold provided for by the fund’s investment restrictions). If a borrowing BlackRock fund’s total outstanding borrowings exceed 10% of its total assets, each of its outstanding interfund loans will be subject to collateralization of at least 102% of the outstanding principal value of the loan. All interfund loans are for temporary or emergency
| | |
| 20 | | 2020 BLACKROCK ANNUAL REPORTTO SHAREHOLDERS |
Notes to Financial Statements (continued)
purposes and the interest rate to be charged will be the average of the highest current overnight repurchase agreement rate available to a lending fund and the bank loan rate, as calculated according to a formula established by the Board.
During the period ended May 31, 2020 the Fund did not participate in the Interfund Lending Program.
Directors and Officers: Certain directors and/or officers of the Fund are directors and/or officers of BlackRock or its affiliates. The Fund reimburses the Administrator for a portion of the compensation paid to the Fund’s Chief Compliance Officer, which is included in Officer in the Statements of Operations.
It is the Fund’s policy to comply with the requirements of the Internal Revenue Code of 1986, as amended, applicable to regulated investment companies, and to distribute substantially all of its taxable income to its shareholders. Therefore, no U.S. federal income tax provision is required.
The Fund files U.S. federal and various state and local tax returns. No income tax returns are currently under examination. The statute of limitations on the Fund’s U.S. federal tax returns generally remains open for the period ended May 31, 2020 and each of the four years ended September 30, 2019. The statutes of limitations on the Fund’s state and local tax returns may remain open for an additional year depending upon the jurisdiction.
Management has analyzed tax laws and regulations and their application to the Fund as of May 31, 2020, inclusive of the open tax return years, and does not believe that there are any uncertain tax positions that require recognition of a tax liability in the Fund’s financial statements.
The tax character of distributions paid was as follows:
| | | | | | | | |
| | | Period | | | Amounts | |
Ordinary income | | | 05/31/20 | | | $ | 11,505,408 | |
| | | 09/30/19 | | | | 41,522,750 | |
| | | 09/30/18 | | | | 10,102,352 | |
Long-term capital gains | | | 05/31/20 | | | | 12,362,510 | |
| | | 09/30/19 | | | | 23,076,420 | |
| | | 09/30/18 | | | | 659,467 | |
| | | | | | | | |
Total | | | 05/31/20 | | | $ | 23,867,918 | |
| | | | | | | | |
| | | 09/30/19 | | | $ | 64,599,170 | |
| | | | | | | | |
| | | 09/30/18 | | | $ | 10,761,819 | |
| | | | | | | | |
As of period end, the tax components of accumulated net earnings were as follows:
| | | | |
| | | Amounts | |
Undistributed ordinary income | | $ | 4,535,327 | |
Qualified late-year losses(a) | | | (13,167,817 | ) |
Net accumulated losses(b) | | | (8,692,246 | ) |
| | | | |
| | $ | (17,324,736 | ) |
| | | | |
| | (a) | The Fund has elected to defer certain qualified late-year losses and recognize such losses in the next taxable year. | |
| | (b) | The difference between book-basis and tax-basis net accumulated losses was attributable primarily to the timing of income recognition on partnership interests. | |
| 6. | CAPITAL SHARE TRANSACTIONS |
Transactions in capital shares for each class were as follows:
| | | | | | | | | | | | | | | | | | | | | | | | |
| | | Period from
10/01/19 to 05/31/20 | | | Year Ended 09/30/19 | | | Year Ended 09/30/18 | |
| Share Class | | Shares | | | Amounts | | | Shares | | | Amounts | | | Shares | | | Amounts | |
Institutional | | | | | | | | | | | | | | | | | | | | | | | | |
Shares sold | | | 764,140 | | | $ | 19,890,117 | | | | 2,069,862 | | | $ | 55,023,883 | | | | 1,059,653 | | | $ | 31,257,209 | |
Shares issued in reinvestment of distributions | | | 234,647 | | | | 6,624,080 | | | | 542,323 | | | | 14,116,583 | | | | 87,557 | | | | 2,538,269 | |
Shares redeemed | | | (1,947,475 | ) | | | (47,283,790 | ) | | | (1,221,734 | ) | | | (33,108,284 | ) | | | (1,568,081 | ) | | | (46,415,312 | ) |
| | | | | | | | | | | | | | | | | | | | | | | | |
| | | (948,688 | ) | | $ | (20,769,593 | ) | | | 1,390,451 | | | $ | 36,032,182 | | | | (420,871 | ) | | $ | (12,619,834 | ) |
| | | | | | | | | | | | | | | | | | | | | | | | |
| | |
NOTESTO FINANCIAL STATEMENTS | | 21 |
Notes to Financial Statements (continued)
| | | | | | | | | | | | | | | | | | | | | | | | |
| | | Period from
10/01/19 to 05/31/20 | | | Year Ended 09/30/19 | | | Year Ended 09/30/18 | |
| Share Class | | Shares | | | Amounts | | | Shares | | | Amounts | | | Shares | | | Amounts | |
Service | | | | | | | | | | | | | | | | | | | | | | | | |
Shares sold | | | 8,180 | | | $ | 187,151 | | | | 6,926 | | | $ | 180,272 | | | | 3,957 | | | $ | 116,093 | |
Shares issued in reinvestment of distributions | | | 17,186 | | | | 482,080 | | | | 51,384 | | | | 1,329,298 | | | | 7,572 | | | | 218,294 | |
Shares redeemed | | | (38,761 | ) | | | (1,010,702 | ) | | | (36,575 | ) | | | (971,826 | ) | | | (38,129 | ) | | | (1,116,157 | ) |
| | | | | | | | | | | | | | | | | | | | | | | | |
| | | (13,395 | ) | | $ | (341,471 | ) | | | 21,735 | | | $ | 537,744 | | | | (26,600 | ) | | $ | (781,770 | ) |
| | | | | | | | | | | | | | | | | | | | | | | | |
Investor A | | | | | | | | | | | | | | | | | | | | | | | | |
Shares sold and automatic conversion of shares | | | 928,048 | | | $ | 22,992,617 | | | | 2,050,103 | | | $ | 55,010,966 | | | | 807,835 | | | $ | 23,395,227 | |
Shares issued in reinvestment of distributions | | | 424,944 | | | | 11,741,222 | | | | 1,272,414 | | | | 32,446,320 | | | | 189,158 | | | | 5,383,558 | |
Shares issued from conversion(a) | | | — | | | | — | | | | — | | | | — | | | | 22,030 | | | | 634,485 | |
Shares redeemed | | | (2,018,382 | ) | | | (49,506,366 | ) | | | (2,222,761 | ) | | | (58,995,155 | ) | | | (2,325,072 | ) | | | (67,501,084 | ) |
| | | | | | | | | | | | | | | | | | | | | | | | |
| | | (665,390 | ) | | $ | (14,772,527 | ) | | | 1,099,756 | | | $ | 28,462,131 | | | | (1,306,049 | ) | | $ | (38,087,814 | ) |
| | | | | | | | | | | | | | | | | | | | | | | | |
Investor B | | | | | | | | | | | | | | | | | | | | | | | | |
Shares sold | | | — | | | $ | — | | | | — | | | $ | — | | | | — | | | $ | 62 | |
Shares issued in reinvestment of distributions | | | — | | | | — | | | | — | | | | — | | | | 178 | | | | 4,759 | |
Shares converted(a) | | | — | | | | — | | | | — | | | | — | | | | (23,439 | ) | | | (634,485 | ) |
Shares redeemed and automatic conversion of shares | | | — | | | | — | | | | — | | | | — | | | | (2,717 | ) | | | (71,805 | ) |
| | | | | | | | | | | | | | | | | | | | | | | | |
| | | — | | | $ | — | | | | — | | | $ | — | | | | (25,978 | ) | | $ | (701,469 | ) |
| | | | | | | | | | | | | | | | | | | | | | | | |
Investor C | | | | | | | | | | | | | | | | | | | | | | | | |
Shares sold | | | 229,022 | | | $ | 5,319,717 | | | | 663,647 | | | $ | 15,491,475 | | | | 302,147 | | | $ | 8,095,600 | |
Shares issued in reinvestment of distributions | | | 73,442 | | | | 1,879,380 | | | | 302,645 | | | | 7,162,846 | | | | 31,389 | | | | 833,387 | |
Shares redeemed and automatic conversion of shares | | | (872,430 | ) | | | (20,458,473 | ) | | | (1,834,830 | ) | | | (46,777,377 | ) | | | (1,005,844 | ) | | | (27,015,261 | ) |
| | | | | | | | | | | | | | | | | | | | | | | | |
| | | (569,966 | ) | | $ | (13,259,376 | ) | | | (868,538 | ) | | $ | (24,123,056 | ) | | | (672,308 | ) | | $ | (18,086,274 | ) |
| | | | | | | | | | | | | | | | | | | | | | | | |
Class K | | | | | | | | | | | | | | | | | | | | | | | | |
Shares sold | | | 31,567 | | | $ | 834,210 | | | | 37,651 | | | $ | 1,025,134 | | | | 184,129 | | | $ | 5,408,891 | (b) |
Shares issued in reinvestment of distributions | | | 7,399 | | | | 208,875 | | | | 20,633 | | | | 537,068 | | | | — | | | | — | |
Shares redeemed | | | (40,961 | ) | | | (1,116,011 | ) | | | (32,085 | ) | | | (855,766 | ) | | | (7,425 | ) | | | (222,141 | )(b) |
| | | | | | | | | | | | | | | | | | | | | | | | |
| | | (1,995 | ) | | $ | (72,926 | ) | | | 26,199 | | | $ | 706,436 | | | | 176,704 | | | $ | 5,186,750 | |
| | | | | | | | | | | | | | | | | | | | | | | | |
Class R | | | | | | | | | | | | | | | | | | | | | | | | |
Shares sold | | | 45,636 | | | $ | 1,110,835 | | | | 119,839 | | | $ | 3,059,723 | | | | 156,293 | | | $ | 4,347,232 | |
Shares issued in reinvestment of distributions | | | 22,107 | | | | 586,061 | | | | 116,572 | | | | 2,852,522 | | | | 17,789 | | | | 487,761 | |
Shares redeemed | | | (297,857 | ) | | | (7,415,751 | ) | | | (553,182 | ) | | | (14,136,085 | ) | | | (414,468 | ) | | | (11,527,124 | ) |
| | | | | | | | | | | | | | | | | | | | | | | | |
| | | (230,114 | ) | | $ | (5,718,855 | ) | | | (316,771 | ) | | $ | (8,223,840 | ) | | | (240,386 | ) | | $ | (6,692,131 | ) |
| | | | | | | | | | | | | | | | | | | | | | | | |
| | | (2,429,548 | ) | | $ | (54,934,748 | ) | | | 1,352,832 | | | $ | 33,391,597 | | | | (2,515,488 | ) | | $ | (71,782,542 | ) |
| | | | | | | | | | | | | | | | | | | | | | | | |
| | (a) | On December 27, 2017, the Fund’s Investor B Shares converted into Investor A Shares. | |
| | (b) | For the period from January 25, 2018 (commencement of operations) to September 30, 2018. | |
Management has evaluated the impact of all subsequent events on the Fund through the date the financial statements were issued and has determined that there were no subsequent events requiring adjustment or additional disclosure in the financial statements.
| | |
| 22 | | 2020 BLACKROCK ANNUAL REPORTTO SHAREHOLDERS |
| | |
| Report of Independent Registered Public Accounting Firm | | |
To the Shareholders of BlackRock Advantage Large Cap Value Fund and the Board of Directors of BlackRock Large Cap Series Funds, Inc.:
Opinion on the Financial Statements and Financial Highlights
We have audited the accompanying statement of assets and liabilities of BlackRock Advantage Large Cap Value Fund of BlackRock Large Cap Series Funds, Inc. (the “Fund”), as of May 31, 2020, the related statements of operations for the period from October 1, 2019 through May 31, 2020 and for the year ended September 30, 2019, the statements of changes in net assets for the period from October 1, 2019 through May 31, 2020 and for each of the two years in the period ended September 30, 2019, the financial highlights for the period from October 1, 2019 through May 31, 2020 and for each of the five years in the period ended September 30, 2019, and the related notes. In our opinion, the financial statements and financial highlights present fairly, in all material respects, the financial position of the Fund as of May 31, 2020, and the results of its operations for the period from October 1, 2019 through May 31, 2020 and for the year ended September 30, 2019, the changes in its net assets for the period from October 1, 2019 through May 31, 2020 and for each of the two years in the period ended September 30, 2019, and the financial highlights for the period from October 1, 2019 through May 31, 2020 and for each of the five years in the period ended September 30, 2019, in conformity with accounting principles generally accepted in the United States of America.
Basis for Opinion
These financial statements and financial highlights are the responsibility of the Fund’s management. Our responsibility is to express an opinion on the Fund’s financial statements and financial highlights based on our audits. We are a public accounting firm registered with the Public Company Accounting Oversight Board (United States) (PCAOB) and are required to be independent with respect to the Fund in accordance with the U.S. federal securities laws and the applicable rules and regulations of the Securities and Exchange Commission and the PCAOB.
We conducted our audits in accordance with the standards of the PCAOB. Those standards require that we plan and perform the audit to obtain reasonable assurance about whether the financial statements and financial highlights are free of material misstatement, whether due to error or fraud. The Fund is not required to have, nor were we engaged to perform, an audit of its internal control over financial reporting. As part of our audits we are required to obtain an understanding of internal control over financial reporting but not for the purpose of expressing an opinion on the effectiveness of the Fund’s internal control over financial reporting. Accordingly, we express no such opinion.
Our audits included performing procedures to assess the risks of material misstatement of the financial statements and financial highlights, whether due to error or fraud, and performing procedures that respond to those risks. Such procedures included examining, on a test basis, evidence regarding the amounts and disclosures in the financial statements and financial highlights. Our audits also included evaluating the accounting principles used and significant estimates made by management, as well as evaluating the overall presentation of the financial statements and financial highlights. We believe that our audits provide a reasonable basis for our opinion.
Deloitte & Touche LLP
Boston, Massachusetts
July 22, 2020
We have served as the auditor of one or more BlackRock investment companies since 1992.
| | |
REPORTOF INDEPENDENT REGISTERED PUBLIC ACCOUNTING FIRM | | 23 |
Important Tax Information (unaudited)
For corporate shareholders, the percentage of ordinary income distributions paid during the period ended May 31, 2020 that qualified for the dividends-received deduction were as follows:
| | | | |
| Fund Name | | Dividends-Received
Deduction | |
BlackRock Advantage Large Cap Value Fund | | | 100.00 | % |
The following maximum amounts are hereby designated as qualified dividend income for individuals for the period ended May 31, 2020:
| | | | |
| Fund Name | | Qualified Dividend
Income | |
BlackRock Advantage Large Cap Value Fund | | $ | 18,159,890 | |
For the period ended May 31, 2020, the Fund hereby designates the following maximum amounts allowable as interest-related dividends eligible for exemption from U.S. withholding tax for nonresident aliens and foreign corporations:
| | | | |
| Fund Name | | Interest-Related
Dividends | |
BlackRock Advantage Large Cap Value Fund | | $ | 5,393 | |
The law varies in each state as to whether and what percent of ordinary income dividends attribute to federal obligations is exempt from state income tax. Shareholders are advised to check with their tax advisers to determine if any portion of the dividends received is exempt from state income tax.
The following distribution amounts are hereby designated for the period ended May 31, 2020:
| | | | | | | | |
| Fund Name | | Short-Term
Capital Gain
Dividends | | | 20% Rate
Long-Term
Capital Gain
Dividends | |
BlackRock Advantage Large Cap Value Fund | | $ | 5,393 | | | $ | 12,362,510 | |
| | |
| 24 | | 2020 BLACKROCK ANNUAL REPORTTO SHAREHOLDERS |
| | |
| Portfolio Information as of May 31, 2020 | | Master Advantage Large Cap Value Portfolio |
| | | | |
TEN LARGEST HOLDINGS | |
| Security(a) | | Percent of
Net Assets | |
Berkshire Hathaway, Inc., Class B | | | 3 | % |
Procter & Gamble Co. | | | 3 | |
JPMorgan Chase & Co. | | | 3 | |
Intel Corp. | | | 2 | |
Johnson & Johnson | | | 2 | |
Pfizer, Inc. | | | 2 | |
Verizon Communications, Inc. | | | 2 | |
Wells Fargo & Co. | | | 2 | |
AT&T Inc. | | | 2 | |
Home Depot, Inc. | | | 2 | |
| | | | |
SECTOR ALLOCATION | |
| Sector(b) | | Percent of
Net Assets | |
Financials | | | 20 | % |
Health Care | | | 15 | |
Consumer Staples | | | 11 | |
Industrials | | | 9 | |
Communication Services | | | 7 | |
Information Technology | | | 7 | |
Utilities | | | 7 | |
Consumer Discretionary | | | 7 | |
Energy | | | 6 | |
Real Estate | | | 4 | |
Materials | | | 4 | |
Short-Term Securities | | | 3 | |
| | (a) | Excludes short-term securities. | |
| | (b) | For Master Portfolio compliance purposes, the Master Portfolio’s sector classifications refer to one or more of the sector sub-classifications used by one or more widely recognized market indexes or rating group indexes, and/or as defined by the investment adviser. These definitions may not apply for purposes of this report, which may combine such sector sub-classifications for reporting ease. | |
| | |
Schedule of Investments May 31, 2020 | | Master Advantage Large Cap Value Portfolio (Percentages shown are based on Net Assets) |
| | | | | | | | |
| Security | | Shares | | | Value | |
| | |
Common Stocks | | | | | | | | |
| | |
Aerospace & Defense — 0.9% | | | | | | | | |
Curtiss-Wright Corp. | | | 8,618 | | | $ | 864,385 | |
HEICO Corp. | | | 1,516 | | | | 152,752 | |
Hexcel Corp. | | | 7,649 | | | | 276,817 | |
L3Harris Technologies, Inc. | | | 4,637 | | | | 924,850 | |
Lockheed Martin Corp. | | | 326 | | | | 126,632 | |
Northrop Grumman Corp. | | | 266 | | | | 89,163 | |
Raytheon Technologies Corp. | | | 9,714 | | | | 626,747 | |
Teledyne Technologies, Inc.(a) | | | 4,075 | | | | 1,524,539 | |
| | | | | | | | |
| | | | | | | 4,585,885 | |
| | |
| Air Freight & Logistics — 0.2% | | | | | | |
FedEx Corp. | | | 6,284 | | | | 820,439 | |
United Parcel Service, Inc., Class B | | | 1,677 | | | | 167,214 | |
| | | | | | | | |
| | | | | | | 987,653 | |
| | |
| Airlines — 0.3% | | | | | | |
Alaska Air Group, Inc. | | | 8,330 | | | | 284,803 | |
Delta Air Lines, Inc. | | | 43,968 | | | | 1,108,433 | |
| | | | | | | | |
| | | | | | | 1,393,236 | |
| | |
| Auto Components — 0.3% | | | | | | |
Aptiv PLC | | | 7,714 | | | | 581,250 | |
Goodyear Tire & Rubber Co. | | | 111,723 | | | | 850,212 | |
| | | | | | | | |
| | | | | | | 1,431,462 | |
| | |
| Banks — 9.0% | | | | | | |
Bank of America Corp. | | | 312,307 | | | | 7,532,845 | |
Bank OZK | | | 10,389 | | | | 233,649 | |
Citigroup, Inc. | | | 79,241 | | | | 3,796,436 | |
Citizens Financial Group, Inc. | | | 51,768 | | | | 1,247,609 | |
Comerica, Inc. | | | 4,423 | | | | 160,776 | |
Credicorp Ltd. | | | 429 | | | | 59,125 | |
Cullen/Frost Bankers, Inc. | | | 16,840 | | | | 1,279,335 | |
East West Bancorp, Inc. | | | 4,122 | | | | 144,064 | |
Fifth Third Bancorp | | | 20,662 | | | | 400,636 | |
First Hawaiian, Inc. | | | 7,916 | | | | 136,551 | |
First Horizon National Corp. | | | 80,887 | | | | 756,293 | |
First Republic Bank | | | 3,812 | | | | 412,344 | |
JPMorgan Chase & Co. | | | 137,552 | | | | 13,385,185 | |
M&T Bank Corp. | | | 2,264 | | | | 239,214 | |
PacWest Bancorp | | | 4,790 | | | | 82,915 | |
PNC Financial Services Group, Inc. | | | 17,677 | | | | 2,015,885 | |
Regions Financial Corp. | | | 22,493 | | | | 254,396 | |
Truist Financial Corp. | | | 52,074 | | | | 1,915,282 | |
US Bancorp | | | 44,111 | | | | 1,568,587 | |
Webster Financial Corp. | | | 5,306 | | | | 150,160 | |
Wells Fargo & Co. | | | 309,819 | | | | 8,200,909 | |
Wintrust Financial Corp. | | | 3,203 | | | | 135,679 | |
Zions Bancorp NA | | | 24,421 | | | | 803,573 | |
| | | | | | | | |
| | | | | | | 44,911,448 | |
| | |
| Beverages — 1.8% | | | | | | |
Brown-Forman Corp., Class B | | | 764 | | | | 50,371 | |
Coca-Cola Co. | | | 57,942 | | | | 2,704,733 | |
Coca-Cola European Partners PLC | | | 4,623 | | | | 174,287 | |
Constellation Brands, Inc., Class A | | | 1,850 | | | | 319,495 | |
Keurig Dr Pepper, Inc. | | | 3,074 | | | | 85,826 | |
Molson Coors Beverage Co., Class B | | | 28,944 | | | | 1,098,714 | |
PepsiCo, Inc. | | | 33,595 | | | | 4,419,422 | |
| | | | | | | | |
| | | | | | | 8,852,848 | |
| | |
| Biotechnology — 3.3% | | | | | | |
AbbVie, Inc. | | | 46,973 | | | | 4,352,988 | |
Amgen, Inc. | | | 6,374 | | | | 1,464,108 | |
| | | | | | | | |
| Security | | Shares | | | Value | |
| | |
| Biotechnology (continued) | | | | | | |
Biogen, Inc.(a) | | | 5,315 | | | $ | 1,632,183 | |
Gilead Sciences, Inc. | | | 82,780 | | | | 6,442,768 | |
Moderna, Inc.(a) | | | 890 | | | | 54,735 | |
Regeneron Pharmaceuticals, Inc.(a) | | | 2,841 | | | | 1,740,993 | |
United Therapeutics Corp.(a) | | | 5,577 | | | | 657,807 | |
| | | | | | | | |
| | | | | | | 16,345,582 | |
| | |
| Building Products — 0.8% | | | | | | |
Allegion PLC | | | 30,437 | | | | 3,034,569 | |
Carrier Global Corp.(a) | | | 14,203 | | | | 290,735 | |
Owens Corning | | | 5,335 | | | | 280,088 | |
Resideo Technologies, Inc.(a) | | | 27,446 | | | | 193,769 | |
| | | | | | | | |
| | | | | | | 3,799,161 | |
| | |
| Capital Markets — 3.2% | | | | | | |
Affiliated Managers Group, Inc. | | | 12,877 | | | | 857,866 | |
Ameriprise Financial, Inc. | | | 3,674 | | | | 514,617 | |
Bank of New York Mellon Corp. | | | 44,215 | | | | 1,643,471 | |
Charles Schwab Corp. | | | 34,755 | | | | 1,248,052 | |
CME Group, Inc. | | | 16,652 | | | | 3,040,655 | |
FactSet Research Systems, Inc. | | | 2,094 | | | | 643,926 | |
Franklin Resources, Inc. | | | 13,667 | | | | 257,896 | |
Intercontinental Exchange, Inc. | | | 15,407 | | | | 1,498,331 | |
Invesco Ltd. | | | 31,969 | | | | 254,793 | |
Morgan Stanley | | | 52,560 | | | | 2,323,152 | |
Northern Trust Corp. | | | 7,450 | | | | 588,624 | |
S&P Global, Inc. | | | 3,161 | | | | 1,027,388 | |
State Street Corp. | | | 12,456 | | | | 759,318 | |
T Rowe Price Group, Inc. | | | 11,064 | | | | 1,337,638 | |
TD Ameritrade Holding Corp. | | | 1,432 | | | | 53,371 | |
| | | | | | | | |
| | | | | | | 16,049,098 | |
| | |
| Chemicals — 2.8% | | | | | | |
Air Products & Chemicals, Inc. | | | 12,352 | | | | 2,984,861 | |
Chemours Co. | | | 22,010 | | | | 288,551 | |
Corteva, Inc. | | | 5,889 | | | | 160,829 | |
Dow, Inc. | | | 35,802 | | | | 1,381,957 | |
DuPont de Nemours, Inc. | | | 17,276 | | | | 876,411 | |
Ecolab, Inc. | | | 4,111 | | | | 873,916 | |
FMC Corp. | | | 4,990 | | | | 491,066 | |
International Flavors & Fragrances, Inc. | | | 867 | | | | 115,476 | |
Linde PLC | | | 10,223 | | | | 2,068,522 | |
LyondellBasell Industries NV, Class A | | | 27,788 | | | | 1,771,763 | |
Mosaic Co. | | | 87,960 | | | | 1,063,436 | |
PPG Industries, Inc. | | | 19,089 | | | | 1,940,779 | |
| | | | | | | | |
| | | | | | | 14,017,567 | |
| | |
| Commercial Services & Supplies — 0.2% | | | | | | |
ADT, Inc. | | | 44,809 | | | | 317,248 | |
Cintas Corp. | | | 1,960 | | | | 486,001 | |
| | | | | | | | |
| | | | | | | 803,249 | |
| | |
| Communications Equipment — 0.5% | | | | | | |
Ciena Corp.(a) | | | 6,134 | | | | 338,965 | |
Cisco Systems, Inc. | | | 41,670 | | | | 1,992,659 | |
| | | | | | | | |
| | | | | | | 2,331,624 | |
| | |
| Construction & Engineering — 0.2% | | | | | | |
EMCOR Group, Inc. | | | 3,351 | | | | 212,956 | |
Fluor Corp. | | | 36,369 | | | | 422,244 | |
MasTec, Inc.(a) | | | 11,895 | | | | 465,689 | |
Quanta Services, Inc. | | | 3,543 | | | | 130,843 | |
| | | | | | | | |
| | | | | | | 1,231,732 | |
| | |
| Consumer Finance — 0.9% | | | | | | |
Ally Financial, Inc. | | | 63,690 | | | | 1,110,753 | |
| | |
| 26 | | 2020 BLACKROCK ANNUAL REPORTTO SHAREHOLDERS |
| | |
Schedule of Investments (continued) May 31, 2020 | | Master Advantage Large Cap Value Portfolio (Percentages shown are based on Net Assets) |
| | | | | | | | |
| Security | | Shares | | | Value | |
| Consumer Finance (continued) | | | | | | |
American Express Co. | | | 16,610 | | | $ | 1,579,113 | |
Capital One Financial Corp. | | | 19,346 | | | | 1,316,302 | |
LendingTree, Inc.(a) | | | 1,894 | | | | 492,478 | |
| | | | | | | | |
| | | | | | | 4,498,646 | |
| | |
| Containers & Packaging — 0.4% | | | | | | |
International Paper Co. | | | 11,169 | | | | 380,304 | |
Westrock Co. | | | 51,996 | | | | 1,459,008 | |
| | | | | | | | |
| | | | | | | 1,839,312 | |
| | |
| Diversified Consumer Services — 0.4% | | | | | | |
Bright Horizons Family Solutions, Inc.(a) | | | 518 | | | | 57,954 | |
frontdoor, Inc.(a) | | | 4,445 | | | | 202,914 | |
Graham Holdings Co., Class B | | | 498 | | | | 178,399 | |
Grand Canyon Education, Inc.(a) | | | 811 | | | | 79,145 | |
H&R Block, Inc. | | | 84,019 | | | | 1,428,323 | |
| | | | | | | | |
| | | | | | | 1,946,735 | |
| | |
| Diversified Financial Services — 3.3% | | | | | | |
Berkshire Hathaway, Inc., Class B(a) | | | 86,366 | | | | 16,027,802 | |
Equitable Holdings, Inc. | | | 19,033 | | | | 363,721 | |
| | | | | | | | |
| | | | | | | 16,391,523 | |
|
| Diversified Telecommunication Services — 3.4% | |
AT&T Inc. | | | 252,065 | | | | 7,778,726 | |
CenturyLink, Inc. | | | 76,056 | | | | 747,631 | |
Verizon Communications, Inc. | | | 144,316 | | | | 8,280,852 | |
| | | | | | | | |
| | | | | | | 16,807,209 | |
| | |
| Electric Utilities — 4.0% | | | | | | |
Alliant Energy Corp. | | | 70,993 | | | | 3,504,215 | |
Duke Energy Corp. | | | 1,138 | | | | 97,447 | |
Eversource Energy | | | 43,399 | | | | 3,632,496 | |
Exelon Corp. | | | 9,864 | | | | 377,890 | |
IDACORP, Inc. | | | 23,919 | | | | 2,229,968 | |
NextEra Energy, Inc. | | | 19,902 | | | | 5,086,155 | |
Pinnacle West Capital Corp. | | | 24,386 | | | | 1,899,670 | |
Xcel Energy, Inc. | | | 48,172 | | | | 3,132,625 | |
| | | | | | | | |
| | | | | | | 19,960,466 | |
| | |
| Electrical Equipment — 1.0% | | | | | | |
AMETEK, Inc. | | | 17,719 | | | | 1,625,009 | |
Hubbell, Inc. | | | 25,630 | | | | 3,137,625 | |
| | | | | | | | |
| | | | | | | 4,762,634 | |
|
| Electronic Equipment, Instruments & Components — 0.6% | |
Avnet, Inc. | | | 43,476 | | | | 1,184,286 | |
National Instruments Corp. | | | 52,956 | | | | 2,050,457 | |
| | | | | | | | |
| | | | | | | 3,234,743 | |
| | |
| Energy Equipment & Services — 0.5% | | | | | | |
Baker Hughes Co. | | | 52,088 | | | | 859,973 | |
Halliburton Co. | | | 21,715 | | | | 255,151 | |
Helmerich & Payne, Inc. | | | 7,412 | | | | 149,204 | |
National Oilwell Varco, Inc. | | | 17,916 | | | | 223,413 | |
Patterson-UTI Energy, Inc. | | | 49,893 | | | | 184,105 | |
Schlumberger Ltd. | | | 18,377 | | | | 339,423 | |
TechnipFMC PLC | | | 14,839 | | | | 109,809 | |
Transocean Ltd.(a) | | | 109,847 | | | | 146,096 | |
| | | | | | | | |
| | | | | | | 2,267,174 | |
| | |
| Entertainment — 1.3% | | | | | | |
Activision Blizzard, Inc. | | | 16,762 | | | | 1,206,529 | |
Cinemark Holdings, Inc. | | | 21,264 | | | | 319,598 | |
Walt Disney Co. | | | 43,045 | | | | 5,049,178 | |
| | | | | | | | |
| | | | | | | 6,575,305 | |
| | | | | | | | |
| Security | | Shares | | | Value | |
| Equity Real Estate Investment Trusts (REITs) — 4.2% | |
Alexandria Real Estate Equities, Inc. | | | 4,245 | | | $ | 652,541 | |
American Campus Communities, Inc. | | | 4,067 | | | | 131,364 | |
American Tower Corp. | | | 656 | | | | 169,360 | |
Apartment Investment & Management Co., Class A | | | 2 | | | | 74 | |
AvalonBay Communities, Inc. | | | 7,446 | | | | 1,161,650 | |
Boston Properties, Inc. | | | 38,483 | | | | 3,308,768 | |
Brandywine Realty Trust | | | 76,353 | | | | 736,806 | |
Camden Property Trust | | | 6,789 | | | | 621,669 | |
Douglas Emmett, Inc. | | | 9,665 | | | | 283,764 | |
Equity Residential | | | 41,658 | | | | 2,522,809 | |
Essex Property Trust, Inc. | | | 1,533 | | | | 372,166 | |
Healthpeak Properties, Inc. | | | 3,855 | | | | 94,987 | |
Host Hotels & Resorts, Inc. | | | 101,658 | | | | 1,213,797 | |
National Retail Properties, Inc. | | | 10,511 | | | | 329,940 | |
Outfront Media, Inc. | | | 20,714 | | | | 290,825 | |
Park Hotels & Resorts, Inc. | | | 103,780 | | | | 1,020,157 | |
Prologis, Inc. | | | 47,097 | | | | 4,309,376 | |
QTS Realty Trust, Inc., Class A | | | 1,033 | | | | 70,864 | |
Realty Income Corp. | | | 11,696 | | | | 646,906 | |
Regency Centers Corp. | | | 14,772 | | | | 632,094 | |
RLJ Lodging Trust | | | 60,145 | | | | 620,095 | |
Simon Property Group, Inc. | | | 3,924 | | | | 226,415 | |
UDR, Inc. | | | 3,988 | | | | 147,476 | |
Ventas, Inc | | | 9,699 | | | | 338,980 | |
VICI Properties, Inc. | | | 2,860 | | | | 56,113 | |
Welltower, Inc. | | | 17,279 | | | | 875,527 | |
| | | | | | | | |
| | | | | | | 20,834,523 | |
| | |
| Food & Staples Retailing — 2.6% | | | | | | |
Costco Wholesale Corp. | | | 13,083 | | | | 4,035,713 | |
Kroger Co. | | | 17,803 | | | | 580,734 | |
Performance Food Group Co.(a) | | | 2,653 | | | | 70,702 | |
Sprouts Farmers Market, Inc.(a) | | | 21,259 | | | | 534,239 | |
Walgreens Boots Alliance, Inc. | | | 21,218 | | | | 911,101 | |
Walmart, Inc. | | | 55,858 | | | | 6,929,743 | |
| | | | | | | | |
| | | | | | | 13,062,232 | |
| | |
| Food Products — 2.5% | | | | | | |
Campbell Soup Co. | | | 7,973 | | | | 406,464 | |
Conagra Brands, Inc. | | | 5,205 | | | | 181,082 | |
General Mills, Inc. | | | 90,832 | | | | 5,726,049 | |
Hershey Co. | | | 26,614 | | | | 3,610,987 | |
JM Smucker Co. | | | 3,097 | | | | 352,841 | |
Kellogg Co. | | | 3,846 | | | | 251,182 | |
Lamb Weston Holdings, Inc. | | | 10,852 | | | | 651,771 | |
Lancaster Colony Corp. | | | 384 | | | | 58,929 | |
Mondelez International, Inc., Class A | | | 24,974 | | | | 1,301,645 | |
| | | | | | | | |
| | | | | | | 12,540,950 | |
| | |
| Gas Utilities — 0.2% | | | | | | |
Southwest Gas Holdings, Inc. | | | 9,842 | | | | 747,500 | |
| | | | | | | | |
|
| Health Care Equipment & Supplies — 2.8% | |
Abbott Laboratories | | | 38,013 | | | | 3,608,194 | |
Danaher Corp. | | | 12,336 | | | | 2,055,301 | |
Edwards Lifesciences Corp.(a) | | | 6,269 | | | | 1,408,770 | |
Hologic, Inc.(a) | | | 17,106 | | | | 906,618 | |
IDEXX Laboratories, Inc.(a) | | | 1,091 | | | | 336,988 | |
Medtronic PLC | | | 39,192 | | | | 3,863,547 | |
STERIS PLC | | | 7,784 | | | | 1,291,288 | |
Stryker Corp. | | | 3,267 | | | | 639,450 | |
| | | | | | | | |
| | | | | | | 14,110,156 | |
| | |
| Health Care Providers & Services — 3.2% | | | | | | |
AMN Healthcare Services, Inc.(a) | | | 3,254 | | | | 144,347 | |
| | |
SCHEDULE OF INVESTMENTS | | 27 |
| | |
Schedule of Investments (continued) May 31, 2020 | | Master Advantage Large Cap Value Portfolio (Percentages shown are based on Net Assets) |
| | | | | | | | |
| Security | | Shares | | | Value | |
| Health Care Providers & Services (continued) | |
Anthem, Inc. | | | 12,153 | | | $ | 3,574,319 | |
Cardinal Health, Inc. | | | 12,185 | | | | 666,398 | |
Cigna Corp. | | | 10,050 | | | | 1,983,066 | |
CVS Health Corp. | | | 83,414 | | | | 5,469,456 | |
HCA Healthcare, Inc. | | | 8,760 | | | | 936,444 | |
McKesson Corp. | | | 14,917 | | | | 2,366,880 | |
UnitedHealth Group, Inc. | | | 1,786 | | | | 544,462 | |
| | | | | | | | |
| | | | | | | 15,685,372 | |
| | |
| Health Care Technology — 0.2% | | | | | | |
Teladoc Health, Inc.(a) | | | 2,982 | | | | 519,047 | |
Veeva Systems, Inc., Class A(a) | | | 2,403 | | | | 525,945 | |
| | | | | | | | |
| | | | | | | 1,044,992 | |
| | |
| Hotels, Restaurants & Leisure — 1.5% | | | | | | |
Choice Hotels International, Inc. | | | 745 | | | | 60,218 | |
Churchill Downs, Inc. | | | 795 | | | | 105,473 | |
Darden Restaurants, Inc. | | | 5,818 | | | | 447,172 | |
Domino’s Pizza, Inc. | | | 972 | | | | 375,036 | |
Extended Stay America, Inc. | | | 50,449 | | | | 580,164 | |
International Game Technology PLC | | | 41,075 | | | | 346,262 | |
Las Vegas Sands Corp. | | | 3,847 | | | | 184,425 | |
Marriott Vacations Worldwide Corp. | | | 1,071 | | | | 96,208 | |
McDonald’s Corp. | | | 20,180 | | | | 3,759,938 | |
MGM Resorts International | | | 15,958 | | | | 274,158 | |
Norwegian Cruise Line Holdings Ltd.(a) | | | 3,341 | | | | 52,320 | |
Penn National Gaming, Inc.(a) | | | 2,477 | | | | 81,270 | |
Royal Caribbean Cruises Ltd. | | | 8,498 | | | | 440,791 | |
Texas Roadhouse, Inc. | | | 3,932 | | | | 203,874 | |
Vail Resorts, Inc. | | | 524 | | | | 103,925 | |
Wingstop, Inc. | | | 2,308 | | | | 281,461 | |
Wyndham Hotels & Resorts, Inc. | | | 1,632 | | | | 74,958 | |
Yum! Brands, Inc. | | | 2,546 | | | | 228,453 | |
| | | | | | | | |
| | | | | | | 7,696,106 | |
| | |
| Household Durables — 0.1% | | | | | | |
DR Horton, Inc. | | | 12,922 | | | | 714,587 | |
| | | | | | | | |
| | |
| Household Products — 3.4% | | | | | | |
Church & Dwight Co., Inc. | | | 7,805 | | | | 585,921 | |
Clorox Co. | | | 10,056 | | | | 2,074,050 | |
Colgate-Palmolive Co. | | | 1,765 | | | | 127,663 | |
Procter & Gamble Co. | | | 121,051 | | | | 14,032,232 | |
| | | | | | | | |
| | | | | | | 16,819,866 | |
| | |
| Industrial Conglomerates — 1.5% | | | | | | |
Carlisle Cos., Inc. | | | 3,414 | | | | 409,202 | |
General Electric Co. | | | 123,070 | | | | 808,570 | |
Honeywell International, Inc. | | | 27,012 | | | | 3,939,700 | |
Roper Technologies, Inc. | | | 5,869 | | | | 2,311,212 | |
| | | | | | | | |
| | | | | | | 7,468,684 | |
| | |
| Insurance — 3.4% | | | | | | |
Allstate Corp. | | | 5,230 | | | | 511,546 | |
American International Group, Inc. | | | 8,036 | | | | 241,562 | |
Arthur J. Gallagher & Co. | | | 13,261 | | | | 1,250,247 | |
Brown & Brown, Inc. | | | 7,146 | | | | 287,269 | |
Cincinnati Financial Corp. | | | 27,570 | | | | 1,625,252 | |
First American Financial Corp. | | | 13,385 | | | | 675,809 | |
Globe Life, Inc. | | | 15,135 | | | | 1,165,698 | |
Hartford Financial Services Group, Inc. | | | 9,945 | | | | 380,794 | |
Lincoln National Corp. | | | 22,125 | | | | 839,201 | |
Marsh & McLennan Cos., Inc. | | | 9,133 | | | | 967,367 | |
MetLife, Inc. | | | 41,084 | | | | 1,479,435 | |
Progressive Corp. | | | 6,144 | | | | 477,266 | |
Prudential Financial, Inc. | | | 65,094 | | | | 3,968,130 | |
| | | | | | | | |
| Security | | Shares | | | Value | |
| Insurance (continued) | | | | | | |
Reinsurance Group of America, Inc. | | | 3,109 | | | $ | 282,142 | |
Travelers Cos., Inc. | | | 7,803 | | | | 834,765 | |
Unum Group | | | 32,823 | | | | 497,268 | |
Willis Towers Watson PLC | | | 5,186 | | | | 1,052,239 | |
WR Berkley Corp. | | | 10,087 | | | | 584,542 | |
| | | | | | | | |
| | | | | | | 17,120,532 | |
| | |
| Interactive Media & Services — 0.3% | | | | | | |
Alphabet, Inc., Class A(a) | | | 791 | | | | 1,133,914 | |
Cargurus, Inc.(a) | | | 8 | | | | 208 | |
Twitter, Inc.(a) | | | 16,466 | | | | 509,952 | |
| | | | | | | | |
| | | | | | | 1,644,074 | |
| | |
| Internet & Direct Marketing Retail — 1.2% | | | | | | |
Amazon.com, Inc.(a) | | | 1,987 | | | | 4,852,989 | |
eBay, Inc. | | | 10,771 | | | | 490,512 | |
Grubhub, Inc.(a) | | | 8,319 | | | | 472,020 | |
| | | | | | | | |
| | | | | | | 5,815,521 | |
| | |
| IT Services — 0.9% | | | | | | |
Automatic Data Processing, Inc. | | | 14,789 | | | | 2,166,441 | |
DXC Technology Co. | | | 8,737 | | | | 124,153 | |
Paychex, Inc. | | | 13,216 | | | | 955,252 | |
PayPal Holdings, Inc. | | | 9,445 | | | | 1,464,069 | |
| | | | | | | | |
| | | | | | | 4,709,915 | |
| | |
| Machinery — 2.8% | | | | | | |
AGCO Corp. | | | 14,911 | | | | 823,534 | |
Caterpillar, Inc. | | | 9,877 | | | | 1,186,524 | |
Deere & Co. | | | 13,914 | | | | 2,116,598 | |
Fortive Corp. | | | 4,445 | | | | 271,056 | |
Illinois Tool Works, Inc. | | | 9,189 | | | | 1,584,735 | |
Middleby Corp.(a) | | | 707 | | | | 48,147 | |
Oshkosh Corp. | | | 36,049 | | | | 2,589,039 | |
Otis Worldwide Corp. | | | 7,101 | | | | 373,868 | |
PACCAR, Inc. | | | 36,416 | | | | 2,689,686 | |
Parker-Hannifin Corp. | | | 630 | | | | 113,381 | |
Snap-on, Inc. | | | 11,587 | | | | 1,502,718 | |
Stanley Black & Decker, Inc. | | | 846 | | | | 106,131 | |
Toro Co. | | | 2,350 | | | | 167,014 | |
Xylem, Inc. | | | 3,557 | | | | 235,971 | |
| | | | | | | | |
| | | | | | | 13,808,402 | |
| | |
| Media — 1.9% | | | | | | |
AMC Networks, Inc., Class A(a) | | | 16,226 | | | | 458,709 | |
Comcast Corp., Class A | | | 74,056 | | | | 2,932,617 | |
Discovery, Inc., Class A(a)(b) | | | 51,316 | | | | 1,116,123 | |
Interpublic Group of Cos., Inc. | | | 156,027 | | | | 2,669,622 | |
Liberty Media Corp. - Liberty SiriusXM, Class A(a) | | | 3,418 | | | | 124,757 | |
Sirius XM Holdings, Inc. | | | 284,834 | | | | 1,657,734 | |
ViacomCBS, Inc., Class A | | | 8,277 | | | | 203,035 | |
ViacomCBS, Inc., Class B | | | 3,836 | | | | 79,559 | |
| | | | | | | | |
| | | | | | | 9,242,156 | |
| | |
| Metals & Mining — 0.8% | | | | | | |
Alcoa Corp.(a) | | | 60,545 | | | | 557,619 | |
Freeport-McMoRan, Inc. | | | 24,410 | | | | 221,399 | |
Newmont Corp. | | | 11,002 | | | | 643,287 | |
Reliance Steel & Aluminum Co. | | | 13,497 | | | | 1,309,209 | |
Royal Gold, Inc. | | | 1,005 | | | | 133,866 | |
Southern Copper Corp. | | | 14,671 | | | | 532,557 | |
Steel Dynamics, Inc. | | | 20,523 | | | | 545,091 | |
| | | | | | | | |
| | | | | | | 3,943,028 | |
| | |
| 28 | | 2020 BLACKROCK ANNUAL REPORTTO SHAREHOLDERS |
| | |
Schedule of Investments (continued) May 31, 2020 | | Master Advantage Large Cap Value Portfolio (Percentages shown are based on Net Assets) |
| | | | | | | | |
| Security | | Shares | | | Value | |
| Multiline Retail — 0.7% | | | | | | |
Dollar General Corp. | | | 3,053 | | | $ | 584,680 | |
Target Corp. | | | 22,562 | | | | 2,760,010 | |
| | | | | | | | |
| | | | | | | 3,344,690 | |
| | |
| Multi-Utilities — 1.9% | | | | | | |
Ameren Corp. | | | 47,363 | | | | 3,539,437 | |
CMS Energy Corp. | | | 5,515 | | | | 323,069 | |
Consolidated Edison, Inc. | | | 36,703 | | | | 2,754,927 | |
DTE Energy Co. | | | 22,200 | | | | 2,388,054 | |
Public Service Enterprise Group, Inc. | | | 6,833 | | | | 348,756 | |
| | | | | | | | |
| | | | | | | 9,354,243 | |
| | |
| Oil, Gas & Consumable Fuels — 5.4% | | | | | | |
Apache Corp. | | | 14,640 | | | | 157,966 | |
Chevron Corp. | | | 63,153 | | | | 5,791,130 | |
Concho Resources, Inc. | | | 5,903 | | | | 321,832 | |
ConocoPhillips | | | 59,611 | | | | 2,514,392 | |
Continental Resources, Inc.(b) | | | 45,178 | | | | 552,527 | |
Devon Energy Corp. | | | 31,471 | | | | 340,202 | |
EOG Resources, Inc. | | | 48,769 | | | | 2,485,756 | |
Exxon Mobil Corp. | | | 167,290 | | | | 7,606,676 | |
Kinder Morgan, Inc. | | | 68,636 | | | | 1,084,449 | |
Marathon Oil Corp. | | | 149,277 | | | | 797,139 | |
Marathon Petroleum Corp. | | | 25,988 | | | | 913,218 | |
Noble Energy, Inc. | | | 14,765 | | | | 128,898 | |
ONEOK, Inc. | | | 4,715 | | | | 172,993 | |
Phillips 66 | | | 5,220 | | | | 408,517 | |
Suncor Energy, Inc. | | | 11,927 | | | | 204,190 | |
Valero Energy Corp. | | | 27,997 | | | | 1,865,720 | |
Williams Cos., Inc. | | | 84,032 | | | | 1,716,774 | |
| | | | | | | | |
| | | | | | | 27,062,379 | |
| | |
| Paper & Forest Products — 0.2% | | | | | | |
Domtar Corp. | | | 41,064 | | | | 837,706 | |
| | | | | | | | |
| | |
| Pharmaceuticals — 5.1% | | | | | | |
Bristol-Myers Squibb Co. | | | 30,015 | | | | 1,792,496 | |
Catalent, Inc.(a) | | | 2 | | | | 156 | |
Johnson & Johnson | | | 80,043 | | | | 11,906,396 | |
Merck & Co., Inc. | | | 17,871 | | | | 1,442,547 | |
Mylan NV(a) | | | 52,476 | | | | 895,765 | |
Pfizer, Inc. | | | 219,295 | | | | 8,374,876 | |
Zoetis, Inc. | | | 5,337 | | | | 743,924 | |
| | | | | | | | |
| | | | | | | 25,156,160 | |
| | |
| Professional Services — 0.2% | | | | | | |
IHS Markit Ltd. | | | 4,195 | | | | 291,385 | |
Robert Half International, Inc. | | | 12,021 | | | | 609,945 | |
| | | | | | | | |
| | | | | | | 901,330 | |
|
| Real Estate Management & Development — 0.0% | |
CBRE Group, Inc., Class A(a) | | | 2,503 | | | | 110,082 | |
| | | | | | | | |
| | |
| Road & Rail — 1.0% | | | | | | |
AMERCO | | | 1,926 | | | | 621,135 | |
CSX Corp. | | | 15,033 | | | | 1,076,062 | |
Landstar System, Inc. | | | 3,789 | | | | 440,509 | |
Lyft, Inc., Class A(a) | | | 5,108 | | | | 159,676 | |
Norfolk Southern Corp. | | | 11,241 | | | | 2,004,158 | |
Ryder System, Inc. | | | 10,055 | | | | 344,484 | |
Uber Technologies, Inc.(a) | | | 9,512 | | | | 345,476 | |
Union Pacific Corp. | | | 795 | | | | 135,039 | |
| | | | | | | | |
| | | | | | | 5,126,539 | |
|
| Semiconductors & Semiconductor Equipment — 3.5% | |
Applied Materials, Inc. | | | 27,991 | | | | 1,572,534 | |
Cirrus Logic, Inc.(a) | | | 12,804 | | | | 928,034 | |
| | | | | | | | |
| Security | | Shares | | | Value | |
| Semiconductors & Semiconductor Equipment (continued) | |
Intel Corp. | | | 192,773 | | | $ | 12,131,205 | |
Lam Research Corp. | | | 3,436 | | | | 940,330 | |
Maxim Integrated Products, Inc. | | | 1,820 | | | | 104,978 | |
NVIDIA Corp. | | | 1,856 | | | | 658,917 | |
Skyworks Solutions, Inc. | | | 11,128 | | | | 1,319,113 | |
| | | | | | | | |
| | | | | | | 17,655,111 | |
| | |
| Software — 1.3% | | | | | | |
Atlassian Corp. PLC, Class A(a) | | | 2,536 | | | | 469,921 | |
Citrix Systems, Inc. | | | 4,001 | | | | 592,628 | |
Cloudflare, Inc., Class A(a) | | | 15,713 | | | | 456,777 | |
DocuSign, Inc.(a) | | | 3,552 | | | | 496,356 | |
HubSpot, Inc.(a) | | | 2,418 | | | | 483,455 | |
Microsoft Corp. | | | 5,462 | | | | 1,000,912 | |
RingCentral, Inc., Class A(a) | | | 1,771 | | | | 485,697 | |
Slack Technologies, Inc., Class A(a) | | | 14,945 | | | | 523,822 | |
Smartsheet, Inc., Class A(a) | | | 8,503 | | | | 490,283 | |
Zendesk, Inc.(a) | | | 5,631 | | | | 482,858 | |
Zoom Video Communications, Inc., Class A(a) | | | 2,997 | | | | 537,902 | |
Zscaler, Inc.(a) | | | 5,999 | | | | 588,442 | |
| | | | | | | | |
| | | | | | | 6,609,053 | |
| | |
| Specialty Retail — 2.2% | | | | | | |
Best Buy Co., Inc. | | | 12,473 | | | | 974,017 | |
Home Depot, Inc. | | | 30,756 | | | | 7,642,251 | |
Lowe’s Cos., Inc. | | | 10,689 | | | | 1,393,311 | |
Williams-Sonoma, Inc. | | | 9,366 | | | | 779,345 | |
| | | | | | | | |
| | | | | | | 10,788,924 | |
|
| Technology Hardware, Storage & Peripherals — 0.3% | |
Apple Inc. | | | 1,466 | | | | 466,100 | |
HP, Inc. | | | 56,515 | | | | 855,637 | |
| | | | | | | | |
| | | | | | | 1,321,737 | |
| | |
| Textiles, Apparel & Luxury Goods — 0.2% | | | | | | |
Lululemon Athletica, Inc.(a) | | | 937 | | | | 281,189 | |
NIKE, Inc., Class B | | | 4,196 | | | | 413,642 | |
VF Corp. | | | 1,824 | | | | 102,326 | |
| | | | | | | | |
| | | | | | | 797,157 | |
| | |
| Thrifts & Mortgage Finance — 0.0% | | | | | | |
MGIC Investment Corp. | | | 29,343 | | | | 240,906 | |
| | | | | | | | |
| | |
| Tobacco — 0.3% | | | | | | |
Philip Morris International, Inc. | | | 20,498 | | | | 1,503,733 | |
| | | | | | | | |
| | |
| Trading Companies & Distributors — 0.3% | | | | | | |
GATX Corp. | | | 19,463 | | | | 1,221,109 | |
SiteOne Landscape Supply, Inc.(a) | | | 615 | | | | 65,381 | |
WESCO International, Inc.(a) | | | 1,446 | | | | 48,152 | |
WW Grainger, Inc. | | | 241 | | | | 74,618 | |
| | | | | | | | |
| | | | | | | 1,409,260 | |
| | |
| Water Utilities — 0.9% | | | | | | |
American Water Works Co., Inc. | | | 36,888 | | | | 4,684,776 | |
| | | | | | | | |
Wireless Telecommunication Services — 0.4% | | | | | | | | |
.Telephone & Data Systems, Inc. | | | 60,324 | | | | 1,236,039 | |
United States Cellular Corp.(a) | | | 29,546 | | | | 930,994 | |
| | | | | | | | |
| | | | | | | 2,167,033 | |
| | | | | | | | |
| | |
| Total Common Stocks — 96.7% | | | | | | |
(Cost: $471,952,584) | | | | | | | 481,103,707 | |
| | | | | | | | |
| | |
SCHEDULE OF INVESTMENTS | | 29 |
| | |
Schedule of Investments (continued) May 31, 2020 | | Master Advantage Large Cap Value Portfolio (Percentages shown are based on Net Assets) |
| | | | | | | | |
| Security | | Shares | | | Value | |
| | |
Rights | | | | | | | | |
| | |
| Media — 0.0% | | | | | | |
Liberty Media Corp. - Liberty SiriusXM(a) | | | 1 | | | $ | 11 | |
| | | | | | | | |
| | |
| Total Rights — 0.0% | | | | | | |
(Cost: $ —) | | | | | | | 11 | |
| | | | | | | | |
| | |
| Total Long-Term Investments — 96.7% | | | | | | |
(Cost: $471,952,584) | | | | | | | 481,103,718 | |
| | | | | | | | |
| | |
Short-Term Securities(c)(d) | | | | | | | | |
| | |
| Money Market Funds — 3.1% | | | | | | |
BlackRock Liquidity Funds, T-Fund, Institutional Class, 0.11% | | | 14,191,241 | | | | 14,191,241 | |
SL Liquidity Series, LLC, Money Market Series, 0.63%(e) | | | 1,283,292 | | | | 1,284,575 | |
| | | | | | | | |
| | |
| Total Short-Term Securities — 3.1% | | | | | | |
(Cost: $15,473,506) | | | | | | | 15,475,816 | |
| | | | | | | | |
| | |
| Total Investments — 99.8% | | | | | | |
(Cost: $487,426,090) | | | | | | | 496,579,534 | |
| | |
| Other Assets Less Liabilities — 0.2% | | | | | 870,291 | |
| | | | | | | | |
| | |
| Net Assets — 100.0% | | | | | $ 497,449,825 | |
| | | | | | | | |
| (a) | Non-income producing security. |
| (b) | All or a portion of this security is on loan. |
| (c) | Affiliate of the Fund. |
| (d) | Annualized 7-day yield as of period end. |
| (e) | All or a portion of this security was purchased with the cash collateral from loaned securities. |
Affiliates
Investments in issuers considered to be an affiliate/affiliates of the Master Portfolio during the period ended May 31, 2020 for purposes of Section 2(a)(3) of the Investment Company Act of 1940, as amended, were as follows:
| | | | | | | | | | | | | | | | | | | | | | | | | | | | | | | | |
| Affiliated Issuer | | Shares
Held at
09/30/19 | | | Shares
Purchased | | | Shares
Sold | | | Shares
Held at
05/31/20 | | | Value at
05/31/20 | | | Income | | | Net Realized Gain (Loss)(a) | | | Change in
Unrealized
Appreciation (Depreciation) | |
BlackRock Liquidity Funds, T-Fund, Institutional Class | | | 7,376,795 | | | | 6,814,446 | (b) | | | — | | | | 14,191,241 | | | $ | 14,191,241 | | | $ | 43,855 | | | $ | 11 | | | $ | — | |
SL Liquidity Series, LLC, Money Market Series | | | 2,979,961 | | | | — | | | | (1,696,669 | )(b) | | | 1,283,292 | | | | 1,284,575 | | | | 40,783 | (c) | | | 3,584 | | | | 2,301 | |
| | | | | | | | | | | | | | | | | | | | | | | | | | | | | | | | |
| | | | | | | | | | | | | | | | | | $ | 15,475,816 | | | $ | 84,638 | | | $ | 3,595 | | | $ | 2,301 | |
| | | | | | | | | | | | | | | | | | | | | | | | | | | | | | | | |
| | (a) | Includes net capital gain distributions, if applicable. | |
| | (b) | Represents net shares purchased (sold). | |
| | (c) | Represents securities lending income earned from the reinvestment of cash collateral from loaned securities, net of fees and collateral investment expenses, and other payments to and from borrowers of securities. | |
For Master Portfolio compliance purposes, the Master Portfolio’s sector classifications refer to one or more of the sector sub-classifications used by one or more widely recognized market indexes or rating group indexes, and/or as defined by the investment adviser. These definitions may not apply for purposes of this report, which may combine such sector sub-classifications for reporting ease.
Derivative Financial Instruments Outstanding as of Period End
Futures Contracts
| | | | | | | | | | | | | | | | |
| Description | | Number of
Contracts | | | Expiration
Date | | | Notional
Amount
(000) | | | Value/
Unrealized
Appreciation
(Depreciation) | |
Long Contracts | | | | | | | | | | | | | | | | |
S&P 500 E-Mini Index | | | 113 | | | | 06/19/20 | | | $ | 17,187 | | | $ | 1,606,884 | |
| | | | | | | | | | | | | | | | |
| | |
| 30 | | 2020 BLACKROCK ANNUAL REPORTTO SHAREHOLDERS |
| | |
Schedule of Investments (continued) May 31, 2020 | | Master Advantage Large Cap Value Portfolio |
Derivative Financial Instruments Categorized by Risk Exposure
As of period end, the fair values of derivative financial instruments located in the Statement of Assets and Liabilities were as follows:
| | | | | | | | | | | | | | | | | | | | | | | | | | | | |
| | | Commodity
Contracts | | | Credit
Contracts | | | Equity
Contracts | | | Foreign
Currency
Exchange
Contracts | | | Interest
Rate
Contracts | | | Other
Contracts | | | Total | |
Assets — Derivative Financial Instruments | | | | | | | | | | | | | | | | | | | | | | | | | | | | |
Futures contracts | | | | | | | | | | | | | | | | | | | | | | | | | | | | |
Unrealized appreciation(a) | | $ | — | | | $ | — | | | $ | 1,606,884 | | | $ | — | | | $ | — | | | $ | — | | | $ | 1,606,884 | |
| | | | | | | | | | | | | | | | | | | | | | | | | | | | |
| | (a) | Net cumulative unrealized appreciation (depreciation) on futures contracts, if any, as reported in the Schedule of Investments. In the Statement of Assets and Liabilities, only current day’s variation margin is reported in receivables or payables and the net cumulative unrealized appreciation (depreciation) is included in accumulated earnings (loss). | |
For the period ended May 31, 2020, the effect of derivative financial instruments in the Statements of Operations was as follows:
| | | | | | | | | | | | | | | | | | | | | | | | | | | | |
| | | Commodity
Contracts | | | Credit
Contracts | | | Equity
Contracts | | | Foreign
Currency
Exchange
Contracts | | | Interest
Rate
Contracts | | | Other
Contracts | | | Total | |
Net Realized Gain (Loss) from | | | | | | | | | | | | | | | | | | | | | | | | | | | | |
Futures contracts | | $ | — | | | $ | — | | | $ | (567,847 | ) | | $ | — | | | $ | — | | | $ | — | | | $ | (567,847 | ) |
| | | | | | | | | | | | | | | | | | | | | | | | | | | | |
Net Change in Unrealized Appreciation (Depreciation) on | | | | | | | | | | | | | | | | | | | | | | | | | | | | |
Futures contracts | | $ | — | | | $ | — | | | $ | 1,679,433 | | | $ | — | | | $ | — | | | $ | — | | | $ | 1,679,433 | |
| | | | | | | | | | | | | | | | | | | | | | | | | | | | |
Average Quarterly Balances of Outstanding Derivative Financial Instruments
| | | | |
Futures contracts | | | | |
Average notional value of contracts — long | | $ | 12,775,355 | |
For more information about the Master Portfolio’s investment risks regarding derivative financial instruments, refer to the Notes to Financial Statements.
Fair Value Hierarchy as of Period End
Various inputs are used in determining the fair value of investments and derivative financial instruments. For information about the Master Portfolio’s policy regarding valuation of investments and derivative financial instruments, refer to the Notes to Financial Statements.
The following tables summarize the Master Portfolio’s investments and derivative financial instruments categorized in the disclosure hierarchy:
| | | | | | | | | | | | | | | | |
| | | Level 1 | | | Level 2 | | | Level 3 | | | Total | |
Assets | | | | | | | | | | | | | | | | |
Investments | | | | | | | | | | | | | | | | |
Long-Term Investments | | | | | | | | | | | | | | | | |
Common Stocks(a) | | $ | 481,103,707 | | | $ | — | | | $ | — | | | $ | 481,103,707 | |
Rights(a) | | | 11 | | | | — | | | | — | | | | 11 | |
Short-Term Securities | | | | | | | | | | | | | | | | |
Money Market Funds | | | 14,191,241 | | | | — | | | | — | | | | 14,191,241 | |
| | | | | | | | | | | | | | | | |
| | $ | 495,294,959 | | | $ | — | | | $ | — | | | | 495,294,959 | |
| | | | | | | | | | | | | | | | |
Investments Valued at NAV(b) | | | | | | | | | | | | | | | 1,284,575 | |
| | | | | | | | | | | | | | | | |
| | | | | | | | | | | | | | $ | 496,579,534 | |
| | | | | | | | | | | | | | | | |
Derivative Financial Instruments(c) | | | | | | | | | | | | | | | | |
Assets | | | | | | | | | | | | | | | | |
Equity Contracts | | $ | 1,606,884 | | | $ | — | | | $ | — | | | $ | 1,606,884 | |
| | | | | | | | | | | | | | | | |
| | (a) | See above Schedule of Investments for values in each industry. | |
| | (b) | Certain investments of the Master Portfolio were fair valued using NAV per share as no quoted market value is available and therefore have been excluded from the fair value hierarchy. | |
| | (c) | Derivative financial instruments are financial futures contracts. Financial futures contracts are valued at the unrealized appreciation (depreciation) on the instrument. | |
| | |
SCHEDULE OF INVESTMENTS | | 31 |
| | |
Statement of Assets and Liabilities May 31, 2020 | | |
| | | | |
| | | Master Advantage
Large Cap
Value Portfolio | |
| |
ASSETS | | | | |
Investments at value — unaffiliated(a)(b) | | $ | 481,103,718 | |
Investments at value — affiliated(c) | | | 15,475,816 | |
Cash pledged for futures contracts | | | 1,354,006 | |
Receivables: | | | | |
Investments sold | | | 8,777,879 | |
Securities lending income — affiliated | | | 1,901 | |
Dividends — affiliated | | | 4,435 | |
Dividends — unaffiliated | | | 1,355,340 | |
Variation margin on futures contracts | | | 21,087 | |
Prepaid expenses | | | 2,935 | |
| | | | |
Total assets | | | 508,097,117 | |
| | | | |
| |
LIABILITIES | | | | |
Cash collateral on securities loaned at value | | | 1,277,356 | |
Payables: | | | | |
Investments purchased | | | 8,216,373 | |
Investment advisory fees | | | 169,728 | |
Directors’ fees | | | 2,530 | |
Other accrued expenses | | | 112,249 | |
Other affiliates | | | 3,821 | |
Withdrawals to investors | | | 865,235 | |
| | | | |
Total liabilities | | | 10,647,292 | |
| | | | |
NET ASSETS | | $ | 497,449,825 | |
| | | | |
| |
NET ASSETS CONSIST OF | | | | |
Investors’ capital | | $ | 486,689,497 | |
Net unrealized appreciation (depreciation) | | | 10,760,328 | |
| | | | |
NET ASSETS | | $ | 497,449,825 | |
| | | | |
(a) Investments at cost — unaffiliated | | $ | 471,952,584 | |
(b) Securities loaned at value | | $ | 1,227,769 | |
(c) Investments at cost — affiliated | | $ | 15,473,506 | |
See notes to financial statements.
| | |
| 32 | | 2020 BLACKROCK ANNUAL REPORTTO SHAREHOLDERS |
Statements of Operations
| | | | | | | | |
| | | Master Advantage Large Cap Value Portfolio | |
| | | Period from
10/01/19 to 05/31/20 | | | Year Ended
09/30/19 | |
| | |
INVESTMENT INCOME | | | | | | | | |
Dividends — unaffiliated | | $ | 10,484,548 | | | $ | 16,182,139 | |
Dividends — affiliated | | | 43,855 | | | | 138,898 | |
Interest — unaffiliated | | | 1,974 | | | | 5,874 | |
Securities lending income — affiliated — net | | | 40,783 | | | | 18,010 | |
Foreign taxes withheld | | | (26,854 | ) | | | (2,441 | ) |
| | | | | | | | |
Total investment income | | | 10,544,306 | | | | 16,342,480 | |
| | | | | | | | |
| | |
EXPENSES | | | | | | | | |
Investment advisory | | | 1,888,973 | | | | 3,043,098 | |
Professional | | | 59,935 | | | | 47,339 | |
Accounting services | | | 51,630 | | | | 77,929 | |
Custodian | | | 39,160 | | | | 50,835 | |
Printing | | | 26,340 | | | | 5,158 | |
Directors | | | 14,171 | | | | 14,978 | |
Miscellaneous | | | 5,201 | | | | 7,877 | |
| | | | | | | | |
Total expenses | | | 2,085,410 | | | | 3,247,214 | |
Less: | | | | | | | | |
Fees waived and/or reimbursed by the Manager | | | (196,788 | ) | | | (204,661 | ) |
| | | | | | | | |
Total expenses after fees waived and/or reimbursed | | | 1,888,622 | | | | 3,042,553 | |
| | | | | | | | |
Net investment income | | | 8,655,684 | | | | 13,299,927 | |
| | | | | | | | |
| | |
REALIZED AND UNREALIZED GAIN (LOSS) | | | | | | | | |
Net realized gain (loss) from: | | | | | | | | |
Investments — unaffiliated | | | (17,553,328 | ) | | | 11,400,289 | |
Investments — affiliated | | | 3,584 | | | | 556 | |
Capital gain distributions from investment companies — affiliated | | | 11 | | | | — | |
Futures contracts | | | (567,847 | ) | | | 139,386 | |
Foreign currency transactions | | | — | | | | (5 | ) |
| | | | | | | | |
| | | (18,117,580 | ) | | | 11,540,226 | |
| | | | | | | | |
| | |
Net change in unrealized appreciation (depreciation) on: | | | | | | | | |
Investments — unaffiliated | | | (45,139,809 | ) | | | (11,950,569 | ) |
Investments — affiliated | | | 2,301 | | | | 49 | |
Futures contracts | | | 1,679,433 | | | | (80,982 | ) |
| | | | | | | | |
| | | (43,458,075 | ) | | | (12,031,502 | ) |
| | | | | | | | |
Net realized and unrealized loss | | | (61,575,655 | ) | | | (491,276 | ) |
| | | | | | | | |
NET INCREASE (DECREASE) IN NET ASSETS RESULTING FROM OPERATIONS | | $ | (52,919,971 | ) | | $ | 12,808,651 | |
| | | | | | | | |
See notes to financial statements.
Statements of Changes in Net Assets
| | | | | | | | | | | | |
| | | Master Advantage Large Cap Value Portfolio | |
| | | Period from 10/01/19 to 05/31/20 | | | | | | | |
| | | Year Ended September 30, | |
| | | 2019 | | | 2018 | |
| | | |
INCREASE (DECREASE) IN NET ASSETS | | | | | | | | | | | | |
| | | |
OPERATIONS | | | | | | | | | | | | |
Net investment income | | $ | 8,655,684 | | | $ | 13,299,927 | | | $ | 12,923,276 | |
Net realized gain (loss) | | | (18,117,580 | ) | | | 11,540,226 | | | | 64,757,548 | |
Net change in unrealized appreciation (depreciation) | | | (43,458,075 | ) | | | (12,031,502 | ) | | | (2,289,277 | ) |
| | | | | | | | | | | | |
Net increase (decrease) in net assets resulting from operations | | | (52,919,971 | ) | | | 12,808,651 | | | | 75,391,547 | |
| | | | | | | | | | | | |
| | | |
CAPITAL TRANSACTIONS | | | | | | | | | | | | |
Proceeds from contributions | | | 50,240,095 | | | | 130,015,027 | | | | 79,285,811 | |
Value of withdrawals | | | (130,354,124 | ) | | | (163,237,143 | ) | | | (369,098,894 | ) |
| | | | | | | | | | | | |
Net decrease in net assets derived from capital transactions | | | (80,114,029 | ) | | | (33,222,116 | ) | | | (289,813,083 | ) |
| | | | | | | | | | | | |
| | | |
NET ASSETS | | | | | | | | | | | | |
Total decrease in net assets | | | (133,034,000 | ) | | | (20,413,465 | ) | | | (214,421,536 | ) |
Beginning of period | | | 630,483,825 | | | | 650,897,290 | | | | 865,318,826 | |
| | | | | | | | | | | | |
End of period | | $ | 497,449,825 | | | $ | 630,483,825 | | | $ | 650,897,290 | |
| | | | | | | | | | | | |
See notes to financial statements.
| | |
| 34 | | 2020 BLACKROCK ANNUAL REPORTTO SHAREHOLDERS |
Financial Highlights
(For a share outstanding throughout each period)
| | | | | | | | | | | | | | | | | | | | | | | | |
| | | Master Advantage Large Cap Value Portfolio | |
| | | Period from 10/01/19 to 05/31/20 | | | | | | | |
| | | Year Ended September 30, | |
| | | 2019 | | | 2018 | | | 2017 | | | 2016 | | | 2015 | |
| | | | | | |
Total Return | | | | | | | | | | | | | | | | | | | | | | | | |
Total Return(a) | | | (8.35 | )%(b) | | | 1.83 | % | | | 11.18 | % | | | 22.05 | % | | | 10.68 | % | | | (1.63 | )% |
| | | | | | | | | | | | | | | | | | | | | | | | |
| | | | | | |
Ratios to Average Net Assets | | | | | | | | | | | | | | | | | | | | | | | | |
Total expenses | | | 0.54 | %(c) | | | 0.52 | % | | | 0.52 | % | | | 0.53 | % | | | 0.54 | % | | | 0.54 | % |
| | | | | | | | | | | | | | | | | | | | | | | | |
Total expenses after fees waived and/or reimbursed | | | 0.49 | %(c) | | | 0.49 | % | | | 0.52 | % | | | 0.53 | % | | | 0.54 | % | | | 0.54 | % |
| | | | | | | | | | | | | | | | | | | | | | | | |
Net investment income | | | 2.23 | %(c) | | | 2.14 | % | | | 1.87 | % | | | 1.60 | % | | | 1.51 | % | | | 1.33 | % |
| | | | | | | | | | | | | | | | | | | | | | | | |
| | | | | | |
Supplemental Data | | | | | | | | | | | | | | | | | | | | | | | | |
Net assets, end of period (000) | | $ | 497,450 | | | $ | 630,484 | | | $ | 650,897 | | | $ | 865,319 | | | $ | 801,963 | | | $ | 837,065 | |
| | | | | | | | | | | | | | | | | | | | | | | | |
Portfolio turnover rate | | | 70 | % | | | 161 | % | | | 143 | % | | | 137 | % | | | 40 | % | | | 30 | % |
| | | | | | | | | | | | | | | | | | | | | | | | |
| (a) | Includes payment received from a settlement of litigation, through its investment in the Master Portfolio, which impacted the Fund’s total return. Excluding the payment from a settlement of litigation, the Fund’s total return is as follows: |
| | | | | | | | | | | | | | | | | | | | | | | | |
| | | Period from 10/01/19 to 05/31/20 | | | | | | | | | | | | | | | | |
| | | Year Ended September 30, | |
| | | 2019 | | | 2018 | | | 2017 | | | 2016 | | | 2015 | |
Total return | | | — | % | | | — | % | | | — | % | | | 21.92 | % | | | 10.58 | % | | | — | % |
| | | | | | | | | | | | | | | | | | | | | | | | |
| (b) | Aggregate total return. |
See notes to financial statements.
Notes to Financial Statements
Master Advantage Large Cap Value Portfolio (the “Master Portfolio) is a series of Master Large Cap Series LLC (the “Master LLC”). The Master LLC is registered under the Investment Company Act of 1940, as amended (the “1940 Act”), as an open-end management investment company and is organized as a Delaware limited liability company. The Master Portfolio is classified as diversified. The Limited Liability Company Agreement of the Master LLC permits the Board of Directors of the Master LLC (the “Board” and the members are referred to as “Directors”) to issue non-transferable interests in the Master LLC, subject to certain limitations.
On November 13, 2019, the Board approved a change in the fiscal year-end of the Master Portfolio, effective as of May 31, 2020, from September 30 to May 31.
The Master Portfolio, together with certain other registered investment companies advised by BlackRock Advisors, LLC (the “Manager”) or its affiliates, is included in a complex of equity, multi-asset, index and money market funds referred to as the BlackRock Multi-Asset Complex.
| 2. | SIGNIFICANT ACCOUNTING POLICIES |
The financial statements are prepared in conformity with accounting principles generally accepted in the United States of America (“U.S. GAAP”), which may require management to make estimates and assumptions that affect the reported amounts of assets and liabilities in the financial statements, disclosure of contingent assets and liabilities at the date of the financial statements and the reported amounts of increases and decreases in net assets from operations during the reporting period. Actual results could differ from those estimates. The Master Portfolio is considered an investment company under U.S. GAAP and follows the accounting and reporting guidance applicable to investment companies. Below is a summary of significant accounting policies:
Investment Transactions and Income Recognition: For financial reporting purposes, investment transactions are recorded on the dates the transactions are executed. Realized gains and losses on investment transactions are determined on the identified cost basis. Dividend income and non-cash dividend income, if any, are recorded on the ex-dividend date. Dividends from foreign securities where the ex-dividend date may have passed are subsequently recorded when the Master Portfolio is informed of the ex-dividend date. Under the applicable foreign tax laws, a withholding tax at various rates may be imposed on capital gains, dividends and interest. Upon notification from issuers, a portion of the dividend income received from a real estate investment trust may be redesignated as a reduction of cost of the related investment and/or realized gain. Interest income, including amortization and accretion of premiums and discounts on debt securities is recognized on an accrual basis.
Segregation and Collateralization: In cases where the Master Portfolio enters into certain investments (e.g., futures contracts) that would be treated as “senior securities” for 1940 Act purposes, the Master Portfolio may segregate or designate on its books and records cash or liquid assets having a market value at least equal to the amount of its future obligations under such investments. Doing so allows the investment to be excluded from treatment as a “senior security.” Furthermore, if required by an exchange or counterparty agreement, the Master Portfolio may be required to deliver/deposit cash and/or securities to/with an exchange, or broker-dealer or custodian as collateral for certain investments or obligations.
Indemnifications: In the normal course of business, the Master Portfolio enters into contracts that contain a variety of representations that provide general indemnification. The Master Portfolio’s maximum exposure under these arrangements is unknown because it involves future potential claims against the Master Portfolio, which cannot be predicted with any certainty.
Other: Expenses directly related to the Master Portfolio are charged to the Master Portfolio. Other operating expenses shared by several funds, including other funds managed by the Manager, are prorated among those funds on the basis of relative net assets or other appropriate methods.
The Master Portfolio has an arrangement with its custodian whereby credits are earned on uninvested cash balances, which could be used to reduce custody fees and/or overdraft charges. The Master Portfolio may incur charges on overdrafts, subject to certain conditions.
| 3. | INVESTMENT VALUATION AND FAIR VALUE MEASUREMENTS |
Investment Valuation Policies: The Master Portfolio’s investments are valued at fair value (also referred to as “market value” within the financial statements) as of the close of trading on the New York Stock Exchange (“NYSE”) (generally 4:00 p.m., Eastern time) (or if the reporting date falls on a day the NYSE is closed, investments are valued at fair value as of the period end). U.S. GAAP defines fair value as the price the Master Portfolio would receive to sell an asset or pay to transfer a liability in an orderly transaction between market participants at the measurement date. The Master Portfolio determines the fair values of its financial instruments using various independent dealers or pricing services under policies approved by the Board. If a security’s market price is not readily available or does not otherwise accurately represent the fair value of the security, the security will be valued in accordance with a policy approved by the Board as reflecting fair value. The BlackRock Global Valuation Methodologies Committee (the “Global Valuation Committee”) is the committee formed by management to develop global pricing policies and procedures and to oversee the pricing function for all financial instruments.
Fair Value Inputs and Methodologies: The following methods and inputs are used to establish the fair value of the Master Portfolio’s assets and liabilities:
| | • | | Equity investments traded on a recognized securities exchange are valued at the official closing price each day, if available. For equity investments traded on more than one exchange, the official closing price on the exchange where the stock is primarily traded is used. Equity investments traded on a recognized exchange for which there were no sales on that day may be valued at the last available bid (long positions) or ask (short positions) price. |
Generally, trading in foreign instruments is substantially completed each day at various times prior to the close of trading on the NYSE. Occasionally, events affecting the values of such instruments may occur between the foreign market close and the close of trading on the NYSE that may not be reflected in the computation of the Master Portfolio’s net assets. Each business day, the Master Portfolio uses a pricing service to assist with the valuation of certain foreign exchange-traded equity securities and foreign exchange-traded and over-the-counter (“OTC”) options (the “Systematic Fair Value Price”). Using current market factors, the Systematic Fair Value Price is designed to value such foreign securities and foreign options at fair value as of the close of trading on the NYSE, which follows the close of the local markets.
| | |
| 36 | | 2020 BLACKROCK ANNUAL REPORTTO SHAREHOLDERS |
Notes to Financial Statements (continued)
| | • | | Investments in open-end U.S. mutual funds are valued at NAV each business day. |
| | • | | The Master Portfolio values its investment in SL Liquidity Series, LLC, Money Market Series (the “Money Market Series”) at fair value, which is ordinarily based upon its pro rata ownership in the underlying fund’s net assets. The Money Market Series seeks current income consistent with maintaining liquidity and preserving capital. Although the Money Market Series is not registered under the 1940 Act, its investments may follow the parameters of investments by a money market fund that is subject to Rule 2a-7 under the 1940 Act. |
| | • | | Futures contracts traded on exchanges are valued at their last sale price. |
If events (e.g., a company announcement, market volatility or a natural disaster) occur that are expected to materially affect the value of such investments, or in the event that the application of these methods of valuation results in a price for an investment that is deemed not to be representative of the market value of such investment, or if a price is not available, the investment will be valued by the Global Valuation Committee, or its delegate, in accordance with a policy approved by the Board as reflecting fair value (“Fair Valued Investments”). The fair valuation approaches that may be used by the Global Valuation Committee will include market approach, income approach and cost approach. Valuation techniques such as discounted cash flow, use of market comparables and matrix pricing are types of valuation approaches and are typically used in determining fair value. When determining the price for Fair Valued Investments, the Global Valuation Committee, or its delegate, seeks to determine the price that the Master Portfolio might reasonably expect to receive or pay from the current sale or purchase of that asset or liability in an arm’s-length transaction. Fair value determinations shall be based upon all available factors that the Global Valuation Committee, or its delegate, deems relevant and consistent with the principles of fair value measurement. The pricing of all Fair Valued Investments is subsequently reported to the Board or a committee thereof on a quarterly basis.
Fair Value Hierarchy: Various inputs are used in determining the fair value of investments. These inputs to valuation techniques are categorized into a fair value hierarchy consisting of three broad levels for financial statement purposes as follows:
| | • | | Level 1 — Unadjusted price quotations in active markets/exchanges for identical assets or liabilities that the Master Portfolio has the ability to access |
| | • | | Level 2 — Other observable inputs (including, but not limited to, quoted prices for similar assets or liabilities in markets that are active, quoted prices for identical or similar assets or liabilities in markets that are not active, inputs other than quoted prices that are observable for the assets or liabilities (such as interest rates, yield curves, volatilities, prepayment speeds, loss severities, credit risks and default rates) or other market–corroborated inputs) |
| | • | | Level 3 — Unobservable inputs based on the best information available in the circumstances, to the extent observable inputs are not available (including the Global Valuation Committee’s assumptions used in determining the fair value of investments) |
The hierarchy gives the highest priority to unadjusted quoted prices in active markets for identical assets or liabilities (Level 1 measurements) and the lowest priority to unobservable inputs (Level 3 measurements). Accordingly, the degree of judgment exercised in determining fair value is greatest for instruments categorized in Level 3. The inputs used to measure fair value may fall into different levels of the fair value hierarchy. In such cases, for disclosure purposes, the fair value hierarchy classification is determined based on the lowest level input that is significant to the fair value measurement in its entirety. Investments classified within Level 3 have significant unobservable inputs used by the Global Valuation Committee in determining the price for Fair Valued Investments. Level 3 investments include equity or debt issued by privately held companies or funds. There may not be a secondary market, and/or there are a limited number of investors. The categorization of a value determined for investments is based on the pricing transparency of the investments and is not necessarily an indication of the risks associated with investing in those securities.
As of May 31, 2020, certain investments of the Master Portfolio were fair valued using NAV per share as no quoted market value is available and therefore have been excluded from the fair value hierarchy.
| 4. | SECURITIES AND OTHER INVESTMENTS |
Securities Lending: The Master Portfolio may lend its securities to approved borrowers, such as brokers, dealers and other financial institutions. The borrower pledges and maintains with the Master Portfolio collateral consisting of cash, an irrevocable letter of credit issued by a bank, or securities issued or guaranteed by the U.S. Government. The initial collateral received by the Master Portfolio is required to have a value of at least 102% of the current value of the loaned securities for securities traded on U.S. exchanges and a value of at least 105% for all other securities. The collateral is maintained thereafter at a value equal to at least 100% of the current market value of the securities on loan. The market value of the loaned securities is determined at the close of each business day of the Master Portfolio and any additional required collateral is delivered to the Master Portfolio, or excess collateral returned by the Master Portfolio, on the next business day. During the term of the loan, the Master Portfolio is entitled to all distributions made on or in respect of the loaned securities, but does not receive interest income on securities received as collateral. Loans of securities are terminable at any time and the borrower, after notice, is required to return borrowed securities within the standard time period for settlement of securities transactions.
The market value of any securities on loan, all of which were classified as common stocks in the Master Portfolio’s Schedule of Investments, and the value of any related collateral are shown separately in the Statement of Assets and Liabilities as a component of investments at value – unaffiliated, and collateral on securities loaned at value, respectively. As of period end, any securities on loan were collateralized by cash and/or U.S. Government obligations. Cash collateral invested by the securities lending agent, BlackRock Investment Management, LLC (“BIM”), if any, is disclosed in the Schedule of Investments.
Securities lending transactions are entered into by the Master Portfolio under Master Securities Lending Agreements (each, an “MSLA”), which provide the right, in the event of default (including bankruptcy or insolvency), for the non-defaulting party to liquidate the collateral and calculate a net exposure to the defaulting party or request additional collateral. In the event that a borrower defaults, the Master Portfolio, as lender, would offset the market value of the collateral received against the market value of the securities loaned. When the value of the collateral is greater than that of the market value of the securities loaned, the lender is left with a net amount payable to the defaulting party. However, bankruptcy or insolvency laws of a particular jurisdiction may impose restrictions on or prohibitions against such a right of offset in the event of an MSLA counterparty’s bankruptcy or insolvency. Under the MSLA, absent an event of default, the borrower can resell or re-pledge the loaned securities, and the Master Portfolio can reinvest cash collateral received in connection with loaned securities. Upon an event of default, the parties’ obligations to return the securities or collateral to the other party are
| | |
NOTESTO FINANCIAL STATEMENTS | | 37 |
Notes to Financial Statements (continued)
extinguished, and the parties can resell or re-pledge the loaned securities or the collateral received in connection with the loaned securities in order to satisfy the defaulting party’s net payment obligation for all transactions under the MSLA. The defaulting party remains liable for any deficiency.
As of period end, the following table is a summary of the Master Portfolio’s securities lending agreements by counterparty which are subject to offset under an MSLA:
| | | | | | | | | | | | |
| Counterparty | | Securities
Loaned at Value | | | Cash
Collateral Received (a) | | | Net
Amount | |
Citigroup Global Markets, Inc. | | $ | 122,826 | | | $ | (122,826 | ) | | $ | — | |
Goldman Sachs & Co. | | | 1,104,943 | | | | (1,104,943 | ) | | | — | |
| | | | | | | | | | | | |
| | $ | 1,227,769 | | | $ | (1,227,769 | ) | | $ | — | |
| | | | | | | | | | | | |
| | (a) | Collateral received in excess of the market value of securities on loan is not presented in this table. The total cash collateral received by the Fund is disclosed in the Master Portfolio’s Statement of Assets and Liabilities. | |
The risks of securities lending include the risk that the borrower may not provide additional collateral when required or may not return the securities when due. To mitigate these risks, the Master Portfolio benefits from a borrower default indemnity provided by BIM. BIM’s indemnity allows for full replacement of the securities loaned to the extent the collateral received does not cover the value on the securities loaned in the event of borrower default. The Master Portfolio could incur a loss if the value of an investment purchased with cash collateral falls below the market value of loaned securities or if the value of an investment purchased with cash collateral falls below the value of the original cash collateral received. Such losses are borne entirely by the Master Portfolio.
| 5. | DERIVATIVE FINANCIAL INSTRUMENTS |
The Master Portfolio engages in various portfolio investment strategies using derivative contracts both to increase the returns of the Master Portfolio and/or to manage its exposure to certain risks such as credit risk, equity risk, interest rate risk, foreign currency exchange rate risk, commodity price risk or other risks (e.g., inflation risk). Derivative financial instruments categorized by risk exposure are included in the Schedule of Investments. These contracts may be transacted on an exchange or OTC.
Futures Contracts: Futures contracts are purchased or sold to gain exposure to, or manage exposure to, changes in interest rates (interest rate risk) and changes in the value of equity securities (equity risk) or foreign currencies (foreign currency exchange rate risk).
Futures contracts are agreements between the Master Portfolio and a counterparty to buy or sell a specific quantity of an underlying instrument at a specified price and on a specified date. Depending on the terms of a contract, it is settled either through physical delivery of the underlying instrument on the settlement date or by payment of a cash amount on the settlement date. Upon entering into a futures contract, the Master Portfolio is required to deposit initial margin with the broker in the form of cash or securities in an amount that varies depending on a contract’s size and risk profile. The initial margin deposit must then be maintained at an established level over the life of the contract. Amounts pledged, which are considered restricted, are included in cash pledged for futures contracts in the Statement of Assets and Liabilities.
Securities deposited as initial margin are designated in the Schedule of Investments and cash deposited, if any, are shown as cash pledged for futures contracts in the Statement of Assets and Liabilities. Pursuant to the contract, the Master Portfolio agrees to receive from or pay to the broker an amount of cash equal to the daily fluctuation in market value of the contract (“variation margin”). Variation margin is recorded as unrealized appreciation (depreciation) and, if any, shown as variation margin receivable (or payable) on futures contracts in the Statement of Assets and Liabilities. When the contract is closed, a realized gain or loss is recorded in the Statement of Operations equal to the difference between the notional amount of the contract at the time it was opened and the notional amount at the time it was closed. The use of futures contracts involves the risk of an imperfect correlation in the movements in the price of futures contracts and interest, foreign currency exchange rates or underlying assets.
| 6. | INVESTMENT ADVISORY AGREEMENT AND OTHER TRANSACTIONS WITH AFFILIATES |
Investment Advisory: The Master LLC, on behalf of the Master Portfolio, entered into an Investment Advisory Agreement with the Manager, the Master Portfolio’s investment adviser and an indirect, wholly-owned subsidiary of BlackRock, Inc. (“BlackRock”), to provide investment advisory and administrative services. The Manager is responsible for the management of the Master Portfolio’s portfolio and provides the personnel, facilities, equipment and certain other services necessary to the operations of the Master Portfolio.
For such services, the Master Portfolio pays the Manager a monthly fee at an annual rate equal to the following percentages of the average daily value of the Master Portfolio’s net assets:
| | | | |
| Average Daily Net Assets | | Investment Advisory Fees | |
First $1 billion | | | 0.49 | % |
$1 billion - $3 billion | | | 0.46 | |
$3 billion - $5 billion | | | 0.44 | |
$5 billion - $10 billion | | | 0.43 | |
Greater than $10 billion | | | 0.42 | |
Expense Limitations, Waivers and Reimbursements: With respect to the Master Portfolio, the Manager contractually agreed to waive its investment advisory fees by the amount of investment advisory fees the Master Portfolio pays to the Manager indirectly through its investment in affiliated money market funds (the “affiliated money market fund waiver”) through January 31, 2021. The contractual agreement may be terminated upon 90 days’ notice by a majority of the independent directors who are not “interested persons” of the Master LLC, as defined in the 1940 Act (“Independent Directors”), or by a vote of a majority of the outstanding voting securities of the Master Portfolio. Prior to
| | |
| 38 | | 2020 BLACKROCK ANNUAL REPORTTO SHAREHOLDERS |
Notes to Financial Statements (continued)
January 28, 2020, this waiver was voluntary. These amounts are included in fees waived and/or reimbursed by the Manager in the Statements of Operations. For the period ended May 31, 2020 and year ended September 30, 2019, the amounts waived were $3,810 and $4,376, respectively.
The Manager has contractually agreed to waive its investment advisory fee with respect to any portion of the Master Portfolio’s assets invested in affiliated equity and fixed-income mutual funds and affiliated exchange-traded funds that have a contractual management fee through January 31, 2021. The contractual agreement may be terminated upon 90 days’ notice by a majority of Independent Directors, or by a vote of a majority of the outstanding voting securities of the Master Portfolio. For the period ended May 31, 2020 and year ended September 30, 2019, there were no fees waived and/or reimbursed by the Manager pursuant to this arrangement.
The Manager has also voluntarily agreed to waive its investment advisory fees to enable the feeder that invests in the Master Portfolio to limit expenses, if applicable. The Manager may discontinue this voluntary waiver at any time. The amount waived is included in fees waived and/or reimbursed by the Manager in the Statements of Operations. For the period ended May 31, 2020 and year ended September 30, 2019, the amounts waived and/or reimbursed were $192,978 and $200,285, respectively.
For the period ended May 31, 2020 and year ended September 30, 2019, the Master Portfolio reimbursed the Manager $5,641 and $6,945, respectively, for certain accounting services, which is included in accounting services in the Statements of Operations.
Securities Lending: The U.S. Securities and Exchange Commission (“SEC”) has issued an exemptive order which permits BIM, an affiliate of the Manager, to serve as securities lending agent for the Master Portfolio, subject to applicable conditions. As securities lending agent, BIM bears all operational costs directly related to securities lending. The Master Portfolio is responsible for expenses in connection with the investment of cash collateral received for securities on loan (the “collateral investment expenses”). The cash collateral is invested in a private investment company managed by the Manager or its affiliates. However, BIM has agreed to cap the collateral investment expenses of the private investment company to an annual rate of 0.04%. The investment adviser to the private investment company will not charge any advisory fees with respect to shares purchased by the Master Portfolio. The private investment company in which the cash collateral has been invested may, under certain circumstances, impose a liquidity fee of up to 2% of the value withdrawn or temporarily restrict withdrawals for up to 10 business days during a 90 day period, in the event that the private investment company’s weekly liquid assets fall below certain thresholds.
Securities lending income is equal to the total of income earned from the reinvestment of cash collateral, net of fees and other payments to and from borrowers of securities, and less the collateral investment expenses. The Master Portfolio retains a portion of securities lending income and remits a remaining portion to BIM as compensation for its services as securities lending agent.
Pursuant to the current securities lending agreement, the Master Portfolio retains 75% of securities lending income (which excludes collateral investment expenses), and this amount retained can never be less than 70% of the total of securities lending income plus the collateral investment expenses.
In addition, commencing the business day following the date that the aggregate securities lending income earned across the BlackRock Multi-Asset Complex in a calendar year exceeds a specified threshold, the Master Portfolio, pursuant to the securities lending agreement, will retain for the remainder of that calendar year securities lending income in an amount equal to 80% of securities lending income (which excludes collateral investment expenses), and this amount retained can never be less than 70% of the total of securities lending income plus the collateral investment expenses.
Prior to January 1, 2020, each Portfolio retained 73.5% of securities lending income (which excluded collateral investment expenses) and the amount retained could never be less than 70% of the total of securities lending income plus the collateral investment expenses. In addition, commencing the business day following the date that the aggregate securities lending income earned across the BlackRock Multi-Asset Complex in a calendar year exceeded a specified threshold, the Master Portfolio would retain for the remainder of that calendar year 80% of securities lending income (which excluded collateral investment expenses), and the amount retained could never be less than 70% of the total of securities lending income plus the collateral investment expenses.
The share of securities lending income earned by the Master Portfolio is shown as securities lending income — affiliated — net in the Statements of Operations. For the period ended May 31, 2020 and year ended September 30, 2019, the Master Portfolio paid BIM $11,714 and $6,451, respectively, for securities lending agent services.
Interfund Lending: In accordance with an exemptive order (the “Order”) from the SEC, the Master Portfolio may participate in a joint lending and borrowing facility for temporary purposes (the “Interfund Lending Program”), subject to compliance with the terms and conditions of the Order, and to the extent permitted by the Master Portfolio’s investment policies and restrictions. The Master Portfolio is currently permitted to borrow under the Interfund Lending Program.
A lending BlackRock fund may lend in aggregate up to 15% of its net assets, but may not lend more than 5% of its net assets to any one borrowing fund through the Interfund Lending Program. A borrowing BlackRock fund may not borrow through the Interfund Lending Program or from any other source more than 33 1/3% of its total assets (or any lower threshold provided for by the fund’s investment restrictions). If a borrowing BlackRock fund’s total outstanding borrowings exceed 10% of its total assets, each of its outstanding interfund loans will be subject to collateralization of at least 102% of the outstanding principal value of the loan. All interfund loans are for temporary or emergency purposes and the interest rate to be charged will be the average of the highest current overnight repurchase agreement rate available to a lending fund and the bank loan rate, as calculated according to a formula established by the Board.
During the period ended May 31, 2020, the Master Portfolio did not participate in the Interfund Lending Program.
Directors and Officers: Certain directors and/or officers of the Master LLC are directors and/or officers of BlackRock or its affiliates.
For the period ended May 31, 2020, purchases and sales of investments, excluding short-term securities, were $398,768,679 and $477,114,127, respectively.
| | |
NOTESTO FINANCIAL STATEMENTS | | 39 |
Notes to Financial Statements (continued)
It is the Master Portfolio’s policy to comply with the requirements of the Internal Revenue Code of 1986, as amended, applicable to regulated investment companies, and to distribute substantially all of its taxable income to its shareholders. Therefore, no U.S. federal income tax provision is required.
The Master Portfolio is classified as a partnership for U.S. federal income tax purposes. As such, each investor in the Master Portfolio is treated as the owner of its proportionate share of net assets, income, expenses and realized and unrealized gains and losses of the Master Portfolio. Therefore, no U.S. federal income tax provision is required. It is intended that the Master Portfolio’s assets will be managed so an investor in the Master Portfolio can satisfy the requirements of Subchapter M of the Internal Revenue Code of 1986, as amended.
The Master Portfolio files U.S. federal and various state and local tax returns. No income tax returns are currently under examination. The statute of limitations on the Master Portfolio’s U.S. federal tax returns generally remains open for the period ending May 31, 2020 and each of the four years ended September 30, 2019. The statutes of limitations on the Master Portfolio’s state and local tax returns may remain open for an additional year depending upon the jurisdiction.
Management has analyzed tax laws and regulations and their application to the Master Portfolio as of May 31, 2020, inclusive of the open tax return years, and does not believe that there are any uncertain tax positions that require recognition of a tax liability in the Master Portfolio’s financial statements.
As of May 31, 2020, gross unrealized appreciation and depreciation for investments based on cost for U.S. federal income tax purposes were as follows:
| | | | |
| | | Amounts | |
Tax cost | | $ | 495,009,583 | |
| | | | |
Gross unrealized appreciation | | $ | 50,291,681 | |
Gross unrealized depreciation | | | (48,721,730 | ) |
| | | | |
Net unrealized appreciation (depreciation) | | $ | 1,569,951 | |
| | | | |
The Master LLC, on behalf of the Master Portfolio, along with certain other funds managed by the Manager and its affiliates (“Participating Funds”), is a party to a 364-day, $2.25 billion credit agreement with a group of lenders. Under this agreement, the Master Portfolio may borrow to fund shareholder redemptions. Excluding commitments designated for certain individual funds, the Participating Funds, including the Master Portfolio, can borrow up to an aggregate commitment amount of $1.75 billion at any time outstanding, subject to asset coverage and other limitations as specified in the agreement. The credit agreement has the following terms: a fee of 0.10% per annum on unused commitment amounts and interest at a rate equal to the higher of (a) one-month LIBOR (but, in any event, not less than 0.00%) on the date the loan is made plus 0.80% per annum or (b) the Fed Funds rate (but, in any event, not less than 0.00%) in effect from time to time plus 0.80% per annum on amounts borrowed. The agreement expires in April 2021 unless extended or renewed. These fees were allocated among such funds based upon portions of the aggregate commitment available to them and relative net assets of Participating Funds. During the period ended May 31, 2020 and year ended September 30, 2019, the Master Portfolio did not borrow under the credit agreement.
In the normal course of business, the Master Portfolio invests in securities or other instruments and may enter into certain transactions, and such activities subject the Master Portfolio to various risks, including among others, fluctuations in the market (market risk) or failure of an issuer to meet all of its obligations. The value of securities or other instruments may also be affected by various factors, including, without limitation: (i) the general economy; (ii) the overall market as well as local, regional or global political and/or social instability; (iii) regulation, taxation or international tax treaties between various countries; or (iv) currency, interest rate and price fluctuations. Local, regional or global events such as war, acts of terrorism, the spread of infectious illness or other public health issues, recessions, or other events could have a significant impact on the Master Portfolio and its investments. The Master Portfolio’s prospectus provides details of the risks to which the Master Portfolio is subject.
The Master Portfolio may be exposed to additional risks when reinvesting cash collateral in money market funds that do not seek to maintain a stable NAV per share of $1.00, which may be subject to redemption gates or liquidity fees under certain circumstances.
Valuation Risk: The market values of equities, such as common stocks and preferred securities or equity related investments, such as futures and options, may decline due to general market conditions which are not specifically related to a particular company. They may also decline due to factors which affect a particular industry or industries. The Master Portfolio may invest in illiquid investments. An illiquid investment is any investment that the Master Portfolio reasonably expects cannot be sold or disposed of in current market conditions in seven calendar days or less without the sale or disposition significantly changing the market value of the investment. The Master Portfolio may experience difficulty in selling illiquid investments in a timely manner at the price that it believes the investments are worth. Prices may fluctuate widely over short or extended periods in response to company, market or economic news. Markets also tend to move in cycles, with periods of rising and falling prices. This volatility may cause the Master Portfolio’s NAV to experience significant increases or decreases over short periods of time. If there is a general decline in the securities and other markets, the NAV of the Master Portfolio may lose value, regardless of the individual results of the securities and other instruments in which the Master Portfolio invests.
An outbreak of respiratory disease caused by a novel coronavirus has developed into a global pandemic and has resulted in closing borders, quarantines, disruptions to supply chains and customer activity, as well as general concern and uncertainty. The impact of this pandemic, and other global health crises that may arise in the future, could affect the economies of many nations, individual companies and the market in general in ways that cannot necessarily be foreseen at the present time. This pandemic may result in substantial market volatility and may adversely impact the prices and liquidity of a fund’s investments. The duration of this pandemic and its effects cannot be determined with certainty.
| | |
| 40 | | 2020 BLACKROCK ANNUAL REPORTTO SHAREHOLDERS |
Notes to Financial Statements (continued)
Counterparty Credit Risk: The Master Portfolio may be exposed to counterparty credit risk, or the risk that an entity may fail to or be unable to perform on its commitments related to unsettled or open transactions. The Master Portfolio manages counterparty credit risk by entering into transactions only with counterparties that the Manager believes have the financial resources to honor their obligations and by monitoring the financial stability of those counterparties. Financial assets, which potentially expose the Master Portfolio to market, issuer and counterparty credit risks, consist principally of financial instruments and receivables due from counterparties. The extent of the Master Portfolio’s exposure to market, issuer and counterparty credit risks with respect to these financial assets is approximately their value recorded in the Statement of Assets and Liabilities, less any collateral held by the Master Portfolio.
A derivative contract may suffer a mark-to-market loss if the value of the contract decreases due to an unfavorable change in the market rates or values of the underlying instrument. Losses can also occur if the counterparty does not perform under the contract.
With exchange-traded futures there is less counterparty credit risk to the Master Portfolio since the exchange or clearinghouse, as counterparty to such instruments, guarantees against a possible default. The clearinghouse stands between the buyer and the seller of the contract; therefore, credit risk is limited to failure of the clearinghouse. While offset rights may exist under applicable law, the Master Portfolio does not have a contractual right of offset against a clearing broker or clearinghouse in the event of a default (including the bankruptcy or insolvency). Additionally, credit risk exists in exchange-traded futures with respect to initial and variation margin that is held in a clearing broker’s customer accounts. While clearing brokers are required to segregate customer margin from their own assets, in the event that a clearing broker becomes insolvent or goes into bankruptcy and at that time there is a shortfall in the aggregate amount of margin held by the clearing broker for all its clients, typically the shortfall would be allocated on a pro rata basis across all the clearing broker’s customers, potentially resulting in losses to the Master Portfolio.
Management has evaluated the impact of all subsequent events on the Master Portfolio through the date the financial statements were issued and has determined that there were no subsequent events requiring adjustment or additional disclosure in the financial statements.
| | |
NOTESTO FINANCIAL STATEMENTS | | 41 |
|
| Report of Independent Registered Public Accounting Firm |
To the Investors of Master Advantage Large Cap Value Portfolio and the Board of Directors of Master Large Cap Series LLC:
Opinion on the Financial Statements and Financial Highlights
We have audited the accompanying statement of assets and liabilities of Master Advantage Large Cap Value Portfolio of Master Large Cap Series LLC (the “Fund”), including the schedule of investments, as of May 31, 2020, the related statements of operations for the period from October 1, 2019 through May 31, 2020 and for the year ended September 30, 2019, the statements of changes in net assets for the period from October 1, 2019 through May 31, 2020 and for each of the two years in the period ended September 30, 2019, the financial highlights for the period from October 1, 2019 through May 31, 2020 and for each of the five years in the period ended September 30, 2019, and the related notes. In our opinion, the financial statements and financial highlights present fairly, in all material respects, the financial position of the Fund as of May 31, 2020, and the results of its operations for the period from October 1, 2019 through May 31, 2020 and for the year ended September 30, 2019, the changes in its net assets for the period from October 1, 2019 through May 31, 2020 and for each of the two years in the period ended September 30, 2019, and the financial highlights for the period from October 1, 2019 through May 31, 2020 and for each of the five years in the period ended September 30, 2019, in conformity with accounting principles generally accepted in the United States of America.
Basis for Opinion
These financial statements and financial highlights are the responsibility of the Fund’s management. Our responsibility is to express an opinion on the Fund’s financial statements and financial highlights based on our audits. We are a public accounting firm registered with the Public Company Accounting Oversight Board (United States) (PCAOB) and are required to be independent with respect to the Fund in accordance with the U.S. federal securities laws and the applicable rules and regulations of the Securities and Exchange Commission and the PCAOB.
We conducted our audits in accordance with the standards of the PCAOB. Those standards require that we plan and perform the audit to obtain reasonable assurance about whether the financial statements and financial highlights are free of material misstatement, whether due to error or fraud. The Fund is not required to have, nor were we engaged to perform, an audit of its internal control over financial reporting. As part of our audits we are required to obtain an understanding of internal control over financial reporting but not for the purpose of expressing an opinion on the effectiveness of the Fund’s internal control over financial reporting. Accordingly, we express no such opinion.
Our audits included performing procedures to assess the risks of material misstatement of the financial statements and financial highlights, whether due to error or fraud, and performing procedures that respond to those risks. Such procedures included examining, on a test basis, evidence regarding the amounts and disclosures in the financial statements and financial highlights. Our audits also included evaluating the accounting principles used and significant estimates made by management, as well as evaluating the overall presentation of the financial statements and financial highlights. Our procedures included confirmation of securities owned as of May 31, 2020, by correspondence with the custodian and brokers; when replies were not received from brokers, we performed other auditing procedures. We believe that our audits provide a reasonable basis for our opinion.
Deloitte & Touche LLP
Boston, Massachusetts
July 22, 2020
We have served as the auditor of one or more BlackRock investment companies since 1992.
| | |
| 42 | | 2020 BLACKROCK ANNUAL REPORTTO SHAREHOLDERS |
Disclosure of Investment Advisory Agreement
The Board of Directors of Master Large Cap Series LLC (the “Master LLC”) met on April 7, 2020 (the “April Meeting”) and May 11-13, 2020 (the “May Meeting”) to consider the approval of the investment advisory agreement (the “Agreement”) between the Master LLC, on behalf of Master Advantage Large Cap Value Portfolio (the “Master Portfolio”), a series of the Master LLC, and BlackRock Advisors, LLC (the “Manager” or “BlackRock”), the Master LLC’s investment advisor. BlackRock Advantage Large Cap Value Fund (the “Fund”), a series of BlackRock Large Cap Series Funds, Inc. (the “Corporation”), is a “feeder” fund that invests all of its investable assets in the Master Portfolio. Accordingly, the Board of Directors of the Corporation also considered the approval of the Agreement with respect to the Master Portfolio. For simplicity: (a) the Board of Directors of the Master LLC and the Board of Directors of the Corporation are referred to herein collectively as the “Board,” and the members are referred to as “Board Members;” and (b) the shareholders of the Fund and the interest holders of the Master Portfolio are referred to as “shareholders.”
Activities and Composition of the Board
On the date of the May Meeting, the Board consisted of fourteen individuals, twelve of whom were not “interested persons” of the Master LLC or the Corporation as defined in the Investment Company Act of 1940, as amended (the “1940 Act”) (the “Independent Board Members”). The Board Members are responsible for the oversight of the operations of the Master LLC or the Corporation, as pertinent, and perform the various duties imposed on the directors of investment companies by the 1940 Act. The Independent Board Members have retained independent legal counsel to assist them in connection with their duties. The Chair of the Board is an Independent Board Member. The Board has established five standing committees: an Audit Committee, a Governance and Nominating Committee, a Compliance Committee, a Performance Oversight Committee and an Ad Hoc Topics Committee, each of which is chaired by an Independent Board Member and composed of Independent Board Members (except for the Ad Hoc Topics Committee, which also has one interested Board Member).
The Agreement
Consistent with the requirements of the 1940 Act, the Board considers the continuation of the Agreement on an annual basis. The Board has four quarterly meetings per year, each typically extending for two days, and additional in-person and telephonic meetings throughout the year, as needed. While the Board also has a fifth one-day meeting to consider specific information surrounding the renewals of the Agreement, the Board’s consideration entails a year-long deliberative process whereby the Board and its committees assess BlackRock’s services to the Fund. In particular, the Board assessed, among other things, the nature, extent and quality of the services provided to the Master Portfolio and the Fund by BlackRock, BlackRock’s personnel and affiliates, including (as applicable) investment management services; accounting oversight; administrative and shareholder services; oversight of the Master Portfolio and Fund service providers; risk management and oversight; and legal, regulatory and compliance services;. Throughout the year, including during the contract renewal process, the Independent Board Members were advised by independent legal counsel, and met with independent legal counsel in various executive sessions outside of the presence of BlackRock’s management.
During the year, the Board, acting directly and through its committees, considers information that is relevant to its annual consideration of the renewal of the Agreement, including the services and support provided by BlackRock to the Master Portfolio, the Fund and their shareholders. BlackRock also furnished additional information to the Board in response to specific questions from the Board. This additional information is discussed further in the section titled “Board Considerations in Approving the Agreement.” Among the matters the Board considered were: (a) investment performance for one-year, three-year, five-year, and/or since inception periods, as applicable, against peer funds, an applicable benchmark, and other performance metrics, as applicable, as well as BlackRock senior management’s and portfolio managers’ analyses of the reasons for any outperformance or underperformance relative to its peers, benchmarks, and other performance metrics, as applicable; (b) fees, including advisory, administration, if applicable, and other amounts paid to BlackRock and its affiliates by the Master Portfolio and/or the Fund for services; (c) the Master Portfolio’s and/or Fund’s operating expenses and how BlackRock allocates expenses to the Master Portfolio and the Fund; (d) the resources devoted to risk oversight of, and compliance reports relating to, implementation of the Master Portfolio’s and the Fund’s investment objective(s), policies and restrictions, and meeting regulatory requirements; (e) BlackRock’s and the Master LLC’s and the Corporation’s adherence to applicable compliance policies and procedures; (f) the nature, character and scope of non-investment management services provided by BlackRock and its affiliates and the estimated cost of such services; (g) BlackRock’s and other service providers’ internal controls and risk and compliance oversight mechanisms; (h) BlackRock’s implementation of the proxy voting policies approved by the Board; (i) the use of brokerage commissions and execution quality of portfolio transactions; (j) BlackRock’s implementation of the Master LLC’s and/or the Corporation’s valuation and liquidity procedures; (k) an analysis of management fees for products with similar investment mandates across the open-end fund, exchange-traded fund (“ETF”), closed-end fund, sub-advised mutual fund, separately managed account, collective investment trust, and institutional separate account product channels, as applicable, and the similarities and differences between these products and the services provided as compared to the Master Portfolio and/or the Fund; (l) BlackRock’s compensation methodology for its investment professionals and the incentives and accountability it creates, along with investment professionals’ investments in the fund(s) they manage; and (m) periodic updates on BlackRock’s business.
Board Considerations in Approving the Agreement
The Approval Process: Prior to the April Meeting, the Board requested and received materials specifically relating to the Agreement. The Independent Board Members are continuously engaged in a process with their independent legal counsel and BlackRock to review the nature and scope of the information provided to better assist its deliberations. The materials provided in connection with the April Meeting included, among other things: (a) information independently compiled and prepared by Broadridge Financial Solutions, Inc. (“Broadridge”) based on either a Lipper Classification or Morningstar category, regarding the fees and expenses of the Master Portfolio and Fund, as applicable, as compared with a peer group of funds as determined by Broadridge (“Expense Peers”) and the investment performance of the Fund as compared with a peer group of funds (“Performance Peers”); (b) information on the composition of the Expense Peers and Performance Peers, and a description of Broadridge’s methodology; (c) information on the estimated profits realized by BlackRock and its affiliates pursuant to the Agreement and a discussion of fall-out benefits to BlackRock and its affiliates; (d) a general analysis provided by BlackRock concerning investment management fees received in connection with other types of investment products, such as institutional accounts, sub-advised mutual funds, ETFs, closed-end funds, open-end funds and separately managed accounts under similar investment mandates, as well as the performance of such other products, as applicable; (e) a review of non-management fees; (f) the existence, impact and sharing of potential economies of scale, if any, with the Master Portfolio and the Fund; (g) a summary of aggregate amounts paid by the Master Portfolio and/or Fund to BlackRock; (h) sales and redemption data regarding the Fund’s shares; and (i) various additional information requested by the Board as appropriate regarding BlackRock’s, the Master Portfolio’s and the Fund’s operations.
| | |
DISCLOSURE OF INVESTMENT ADVISORY AGREEMENT | | 43 |
Disclosure of Investment Advisory Agreement (continued)
At the April Meeting, the Board reviewed materials relating to its consideration of the Agreement. As a result of the discussions that occurred during the April Meeting, and as a culmination of the Board’s year-long deliberative process, the Board presented BlackRock with questions and requests for additional information. BlackRock responded to these questions and requests with additional written information in advance of the May Meeting.
At the May Meeting, the Board concluded its assessment of, among other things: (a) the nature, extent and quality of the services provided by BlackRock; (b) the investment performance of the Master Portfolio and the Fund as compared to its Performance Peers and to other metrics, as applicable; (c) the advisory fee and the estimated cost of the services and estimated profits realized by BlackRock and its affiliates from their relationship with the Master Portfolio and the Fund; (d) the Fund’s fees and expenses compared to its Expense Peers; (e) the existence and sharing of potential economies of scale; (f) any fall-out benefits to BlackRock and its affiliates as a result of BlackRock’s relationship with the Master Portfolio and the Fund; and (g) other factors deemed relevant by the Board Members.
The Board also considered other matters it deemed important to the approval process, such as other payments made to BlackRock or its affiliates relating to securities lending and cash management, and BlackRock’s services related to the valuation and pricing of portfolio holdings of the Master Portfolio. The Board noted the willingness of BlackRock’s personnel to engage in open, candid discussions with the Board. The Board did not identify any particular information as determinative, and each Board Member may have attributed different weights to the various items considered.
A. Nature, Extent and Quality of the Services Provided by BlackRock: The Board, including the Independent Board Members, reviewed the nature, extent and quality of services provided by BlackRock, including the investment advisory services, and the resulting performance of the Fund. Throughout the year, the Board compared the Fund’s performance to the performance of a comparable group of mutual funds, relevant benchmark, and performance metrics, as applicable. The Board met with BlackRock’s senior management personnel responsible for investment activities, including the senior investment officers. The Board also reviewed the materials provided by the Master Portfolio’s portfolio management team discussing the Master Portfolio’s performance, investment strategies and outlook.
The Board considered, among other factors, with respect to BlackRock: the number, education and experience of investment personnel generally and the Master Portfolio’s portfolio management team; research capabilities; investments by portfolio managers in the funds they manage; portfolio trading capabilities; use of technology; commitment to compliance; credit analysis capabilities; risk analysis and oversight capabilities; and the approach to training and retaining portfolio managers and other research, advisory and management personnel. The Board also considered BlackRock’s overall risk management program, including the continued efforts of BlackRock and its affiliates to address cybersecurity risks and the role of BlackRock’s Risk & Quantitative Analysis Group. The Board engaged in a review of BlackRock’s compensation structure with respect to the Master Portfolio’s portfolio management team and BlackRock’s ability to attract and retain high-quality talent and create performance incentives.
In addition to investment advisory services, the Board considered the nature and quality of the administrative and other non-investment advisory services provided to the Master Portfolio and Fund. BlackRock and its affiliates provide the Master Portfolio and the Fund with certain administrative, shareholder and other services (in addition to any such services provided to the Master Portfolio and the Fund by third parties) and officers and other personnel as are necessary for the operations of the Master Portfolio and the Fund. In particular, BlackRock and its affiliates provide the Master Portfolio and the Fund with administrative services including, among others: (i) responsibility for disclosure documents, such as the prospectus, the summary prospectus (as applicable), the statement of additional information and periodic shareholder reports; (ii) oversight of daily accounting and pricing; (iii) responsibility for periodic filings with regulators; (iv) overseeing and coordinating the activities of third-party service providers, including, among others, the custodian, fund accountant, transfer agent, and auditor for the Master Portfolio and the Fund, as applicable; (v) organizing Board meetings and preparing the materials for such Board meetings; (vi) providing legal and compliance support; (vii) furnishing analytical and other support to assist the Board in its consideration of strategic issues such as the merger, consolidation or repurposing of certain open-end funds; and (viii) performing or managing administrative functions necessary for the operation of the Master Portfolio and the Fund, such as tax reporting, expense management, fulfilling regulatory filing requirements, overseeing the Fund’s distribution partners, and shareholder call center and other services. The Board reviewed the structure and duties of BlackRock’s fund administration, shareholder services, and legal & compliance departments and considered BlackRock’s policies and procedures for assuring compliance with applicable laws and regulations.
B. The Investment Performance of the Master Portfolio, the Fund and BlackRock: The Board, including the Independent Board Members, also reviewed and considered the performance history of the Master Portfolio and Fund, as applicable. The Board noted that the Fund’s investment results correspond directly to the investment results of the Master Portfolio. In preparation for the April Meeting, the Board was provided with reports independently prepared by Broadridge, which included an analysis of the Fund’s performance as of December 31, 2019, as compared to its Performance Peers. Broadridge ranks funds in quartiles, ranging from first to fourth, where first is the most desirable quartile position and fourth is the least desirable. In connection with its review, the Board received and reviewed information regarding the investment performance of the Fund as compared to its Performance Peers. The Board and its Performance Oversight Committee regularly review, and meet with Master Portfolio management to discuss, the performance of the Master Portfolio and the Fund, as applicable, throughout the year.
In evaluating performance, the Board focused particular attention on funds with less favorable performance records. The Board also noted that while it found the data provided by Broadridge generally useful, it recognized the limitations of such data, including in particular, that notable differences may exist between a fund and its Performance Peers (for example, the investment objectives and strategies). Further, the Board recognized that the performance data reflects a snapshot of a period as of a particular date and that selecting a different performance period could produce significantly different results. The Board also acknowledged that long-term performance could be impacted by even one period of significant outperformance or underperformance, and that a single investment theme could have the ability to disproportionately affect long-term performance.
The Board noted that for the one-, three- and five-year periods reported, the Fund ranked in the third, second and second quartile, respectively, against its Performance Peers. The Board and BlackRock reviewed the Fund’s underperformance relative to its Performance Peers during the applicable periods.
C. Consideration of the Advisory/Management Fees and the Estimated Cost of the Services and Estimated Profits Realized by BlackRock and its Affiliates from their Relationship with the Master Portfolio and the Fund: The Board, including the Independent Board Members, reviewed the Master Portfolio’s/Fund’s contractual management fee rate compared with those of the Fund’s Expense Peers. The contractual management fee rate represents a combination of the advisory fee and any administrative fees, before taking into account any reimbursements or fee waivers. The Board also compared the Fund’s total expense ratio, as well as the Master Portfolio’s/Fund’s actual management fee rate, to those of the Fund’s Expense Peers. The total expense ratio represents a fund’s total net operating expenses, including any 12b-1 or non 12b-1 service fees. The total expense ratio gives effect to any expense reimbursements or fee waivers, and the actual management fee rate gives effect to any management fee reimbursements or waivers. The Board considered the services provided and the fees charged by BlackRock and its affiliates to other types of clients with similar investment mandates, as applicable, including institutional accounts and sub-advised mutual funds (including mutual funds sponsored by third parties).
| | |
| 44 | | 2020 BLACKROCK ANNUAL REPORTTO SHAREHOLDERS |
Disclosure of Investment Advisory Agreement (continued)
The Board received and reviewed statements relating to BlackRock’s financial condition. The Board reviewed BlackRock’s profitability methodology and was also provided with an estimated profitability analysis that detailed the revenues earned and the expenses incurred by BlackRock for services provided to the Master Portfolio and the Fund. The Board reviewed BlackRock’s estimated profitability with respect to the relevant Master Portfolio and Fund, as applicable, and other funds the Board currently oversees for the year ended December 31, 2019 compared to available aggregate estimated profitability data provided for the prior two years. The Board reviewed BlackRock’s estimated profitability with respect to certain other U.S. fund complexes managed by BlackRock and/or its affiliates. The Board reviewed BlackRock’s assumptions and methodology of allocating expenses in the estimated profitability analysis, noting the inherent limitations in allocating costs among various advisory products. The Board recognized that profitability may be affected by numerous factors including, among other things, fee waivers and expense reimbursements by BlackRock, the types of funds managed, precision of expense allocations and business mix. The Board thus recognized that calculating and comparing profitability at the individual fund levels is difficult.
The Board noted that, in general, individual fund or product line profitability of other advisors is not publicly available. The Board reviewed BlackRock’s overall operating margin, in general, compared to that of certain other publicly-traded asset management firms. The Board considered the differences between BlackRock and these other firms, including the contribution of technology at BlackRock, BlackRock’s expense management, and the relative product mix.
The Board considered whether BlackRock has the financial resources necessary to attract and retain high quality investment management personnel to perform its obligations under the Agreement and to continue to provide the high quality of services that is expected by the Board. The Board further considered factors including but not limited to BlackRock’s commitment of time, assumption of risk and liability profile in servicing the Master Portfolio and the Fund in contrast to what is required of BlackRock with respect to other products with similar investment mandates across the open-end fund, ETF, closed-end fund, sub-advised mutual fund, separately managed account, collective investment trust, and institutional separate account product channels, as applicable.
The Board noted that the Master Portfolio’s/Fund’s contractual management fee rate ranked in the third quartile, and that the actual management fee rate and the Fund’s total expense ratio each ranked in the first quartile relative to the Fund’s Expense Peers. The Board also noted that the Master Portfolio has an advisory fee arrangement that includes breakpoints that adjust the fee rate downward as the size of the Master Portfolio increases above certain contractually specified levels. The Board noted that if the size of the Fund were to decrease, the Fund could lose the benefit of one or more breakpoints. In addition, the Board noted that BlackRock and the Board have contractually agreed to a cap on the Fund’s total expenses as a percentage of the Fund’s average daily net assets on a class-by-class basis.
D. Economies of Scale: The Board, including the Independent Board Members, considered the extent to which economies of scale might be realized as the assets of the Master Portfolio and the Fund increase, including the existence of fee waivers and/or expense caps, as applicable, noting that any contractual fee waivers and expense caps had been approved by the Board. In its consideration, the Board further Members took into account the existence of any expense caps and further considered the continuation/implementation, of fee waivers and/or expense caps, as applicable. The Board also considered the extent to which the Master Portfolio and the Fund benefit from such economies of scale in a variety of ways and whether there should be changes in the advisory fee rate or breakpoint structure in order to enable the Master Portfolio and the Fund to more fully participate in these economies of scale. The Board considered the Master Portfolio’s asset levels and whether the current fee schedule was appropriate.
E. Other Factors Deemed Relevant by the Board Members: The Board, including the Independent Board Members, also took into account other ancillary or “fall-out” benefits that BlackRock or its affiliates may derive from BlackRock’s respective relationships with the Master Portfolio and the Fund, both tangible and intangible, such as BlackRock’s ability to leverage its investment professionals who manage other portfolios and its risk management personnel, an increase in BlackRock’s profile in the investment advisory community, and the engagement of BlackRock’s affiliates as service providers to the Master Portfolio and the Fund, including for administrative, distribution, securities lending and cash management services. The Board also considered BlackRock’s overall operations and its efforts to expand the scale of, and improve the quality of, its operations. The Board also noted that, subject to applicable law, BlackRock may use and benefit from third party research obtained by soft dollars generated by certain registered fund transactions to assist in managing all or a number of its other client accounts.
In connection with its consideration of the Agreement, the Board also received information regarding BlackRock’s brokerage and soft dollar practices. The Board received reports from BlackRock which included information on brokerage commissions and trade execution practices throughout the year.
The Board noted the competitive nature of the open-end fund marketplace, and that shareholders are able to redeem their Fund shares if they believe that the Fund’s and/or Master Portfolio’s fees and expenses are too high or if they are dissatisfied with the performance of the Fund.
Conclusion
The Board of the Master LLC, including the Independent Board Members, unanimously approved the continuation of the Agreement between the Manager and the Master LLC, on behalf of the Master Portfolio, for a one-year term ending June 30, 2021. Based upon its evaluation of all of the aforementioned factors in their totality, as well as other information, the Board of the Master LLC, including the Independent Board Members, was satisfied that the terms of the Agreement were fair and reasonable and in the best interest of the Master Portfolio and its shareholders. The Board of the Corporation, including the Independent Board Members, also considered the continuation of the Agreement with respect to the Master Portfolio and found the Agreement to be satisfactory. In arriving at its decision to approve the Agreement, the Board of the Master LLC did not identify any single factor or group of factors as all-important or controlling, but considered all factors together, and different Board Members may have attributed different weights to the various factors considered. The Independent Board Members were also assisted by the advice of independent legal counsel in making this determination.
| | |
DISCLOSURE OF INVESTMENT ADVISORY AGREEMENT | | 45 |
Director and Officer Information
| | | | | | | | |
| Independent Directors (a) |
| | | | | |
Name Year of Birth (b) | | Position(s) Held (Length of Service) (c) | | Principal Occupation(s) During Past Five Years | | Number of BlackRock-Advised
Registered Investment Companies
(“RICs”) Consisting of Investment
Portfolios (“Portfolios”) Overseen | | Public Company
and Other
Investment
Company
Directorships
Held During Past Five Years |
Mark Stalnecker 1951 | | Chair of the Board (Since 2019) and Director (Since 2015) | | Chief Investment Officer, University of Delaware from 1999 to 2013; Trustee and Chair of the Finance and Investment Committees, Winterthur Museum and Country Estate from 2005 to 2016; Member of the Investment Committee, Delaware Public Employees’ Retirement System since 2002; Member of the Investment Committee, Christiana Care Health System from 2009 to 2017; Member of the Investment Committee, Delaware Community Foundation from 2013 to 2014; Director and Chair of the Audit Committee, SEI Private Trust Co. from 2001 to 2014. | | 36 RICs consisting of 153 Portfolios | | None |
Bruce R. Bond 1946 | | Director (Since 2019) | | Board Member, Amsphere Limited (software) since 2018; Trustee and Member of the Governance Committee, State Street Research Mutual Funds from 1997 to 2005; Board Member of Governance, Audit and Finance Committee, Avaya Inc. (computer equipment) from 2003 to 2007. | | 36 RICs consisting of 153 Portfolios | | None |
Susan J. Carter 1956 | | Director (Since 2016) | | Director, Pacific Pension Institute from 2014 to 2018; Advisory Board Member, Center for Private Equity and Entrepreneurship at Tuck School of Business since 1997; Senior Advisor, Commonfund Capital, Inc. (“CCI”) (investment adviser) in 2015; Chief Executive Officer, CCI from 2013 to 2014; President & Chief Executive Officer, CCI from 1997 to 2013; Advisory Board Member, Girls Who Invest from 2015 to 2018 and Board Member thereof since 2018; Advisory Board Member, Bridges Fund Management since 2016; Trustee, Financial Accounting Foundation since 2017; Practitioner Advisory Board Member, Private Capital Research Institute (“PCRI”) since 2017; Lecturer in the Practice of Management, Yale School of Management since 2019. | | 36 RICs consisting of 153 Portfolios | | None |
Collette Chilton 1958 | | Director (Since 2015) | | Chief Investment Officer, Williams College since 2006; Chief Investment Officer, Lucent Asset Management Corporation from 1998 to 2006. | | 36 RICs consisting of 153 Portfolios | | None |
Neil A. Cotty 1954 | | Director (Since 2016) | | Bank of America Corporation from 1996 to 2015, serving in various senior finance leadership roles, including Chief Accounting Officer, from 2009 to 2015, Chief Financial Officer of Global Banking, Markets and Wealth Management from 2008 to 2009, Chief Accounting Officer from 2004 to 2008, Chief Financial Officer of Consumer Bank from 2003 to 2004, Chief Financial Officer of Global Corporate Investment Bank from 1999 to 2002. | | 36 RICs consisting of 153 Portfolios | | None |
Lena G. Goldberg 1949 | | Director (Since 2019) | | Senior Lecturer, Harvard Business School, since 2008; Director, Charles Stark Draper Laboratory, Inc. since 2013; FMR LLC/Fidelity Investments (financial services) from 1996 to 2008, serving in various senior roles including Executive Vice President—Strategic Corporate Initiatives and Executive Vice President and General Counsel; Partner, Sullivan & Worcester LLP from 1985 to 1996 and Associate thereof from 1979 to 1985. | | 36 RICs consisting of 153 Portfolios | | None |
Henry R. Keizer 1956 | | Director (Since 2019) | | Director, Park Indemnity Ltd. (captive insurer) since 2010; Director, MUFG Americas Holdings Corporation and MUFG Union Bank, N.A. (financial and bank holding company) from 2014 to 2016; Director, American Institute of Certified Public Accountants from 2009 to 2011; Director, KPMG LLP (audit, tax and advisory services) from 2004 to 2005 and 2010 to 2012; Director, KPMG International in 2012, Deputy Chairman and Chief Operating Officer thereof from 2010 to 2012 and U.S. Vice Chairman of Audit thereof from 2005 to 2010; Global Head of Audit, KPMGI (consortium of KPMG firms) from 2006 to 2010; Director, YMCA of Greater New York from 2006 to 2010. | | 36 RICs consisting of 153 Portfolios | | Hertz Global Holdings (car rental); Montpelier Re Holdings, Ltd. (publicly held property and casualty reinsurance) from 2013 until 2015; WABCO (commercial vehicle safety systems); Sealed Air Corp. (packaging) |
| | |
| 46 | | 2020 BLACKROCK ANNUAL REPORTTO SHAREHOLDERS |
Director and Officer Information (continued)
| | | | | | | | |
| Independent Directors (a) |
| | | | | |
Name Year of Birth(b) | | Position(s) Held (Length of Service) (c) | | Principal Occupation(s) During Past Five Years | | Number of BlackRock-Advised
Registered Investment Companies
(“RICs”) Consisting of Investment
Portfolios (“Portfolios”) Overseen | | Public Company
and Other
Investment
Company
Directorships
Held During Past Five Years |
Cynthia A. Montgomery 1952 | | Director (Since 2007) | | Professor, Harvard Business School since 1989. | | 36 RICs consisting of 153 Portfolios | | Newell Rubbermaid, Inc. (manufacturing) |
Donald C. Opatrny 1952 | | Director (Since 2019) | | Trustee, Vice Chair, Member of the Executive Committee and Chair of the Investment Committee, Cornell University since 2004; President, Trustee and Member of the Investment Committee, The Aldrich Contemporary Art Museum from 2007 to 2014; Member of the Board and Investment Committee, University School from 2007 to 2018; Member of the Investment Committee, Mellon Foundation from 2009 to 2015; Trustee, Artstor (a Mellon Foundation affiliate) from 2010 to 2015; President and Trustee, the Center for the Arts, Jackson Hole from 2011 to 2018; Director, Athena Capital Advisors LLC (investment management firm) since 2013; Trustee and Chair of the Investment Committee, Community Foundation of Jackson Hole since 2014; Member of Affordable Housing Supply Board of Jackson, Wyoming since 2018; Member, Investment Funds Committee, State of Wyoming since 2017; Trustee, Phoenix Art Museum since 2018;Trustee, Arizona Community Foundation and Member of Investment Committee since 2020. | | 36 RICs consisting of 153 Portfolios | | None |
Joseph P. Platt 1947 | | Director (Since 2007) | | General Partner, Thorn Partners, LP (private investments) since 1998; Director, WQED Multi-Media (public broadcasting not-for-profit) since 2001; Chair, Basic Health International (non-profit) since 2015. | | 36 RICs consisting of 153 Portfolios | | Greenlight Capital Re, Ltd. (reinsurance company); Consol Energy Inc. |
Kenneth L. Urish 1951 | | Director (Since 2007) | | Managing Partner, Urish Popeck & Co., LLC (certified public accountants and consultants) since 1976; Past-Chairman of the Professional Ethics Committee of the Pennsylvania Institute of Certified Public Accountants and Committee Member thereof since 2007; Member of External Advisory Board, The Pennsylvania State University Accounting Department since founding in 2001; Principal, UP Strategic Wealth Investment Advisors, LLC since 2013; Trustee, The Holy Family Institute from 2001 to 2010; President and Trustee, Pittsburgh Catholic Publishing Associates from 2003 to 2008; Director, Inter-Tel from 2006 to 2007. | | 36 RICs consisting of 153 Portfolios | | None |
Claire A. Walton 1957 | | Director (Since 2016) | | Chief Operating Officer and Chief Financial Officer of Liberty Square Asset Management, LP from 1998 to 2015; General Partner of Neon Liberty Capital Management, LLC since 2003; Director, Boston Hedge Fund Group from 2009 to 2018; Director, Woodstock Ski Runners since 2013; Director, Massachusetts Council on Economic Education from 2013 to 2015. | | 36 RICs consisting of 153 Portfolios | | None |
| | |
DIRECTORAND OFFICER INFORMATION | | 47 |
Director and Officer Information (continued)
| | | | | | | | |
| Interested Directors (a)(d) |
| | | | | |
Name Year of Birth (b) | | Position(s) Held (Length of Service) (c) | | Principal Occupation(s) During Past Five Years | | Number of BlackRock-Advised
Registered Investment Companies
(“RICs”) Consisting of Investment
Portfolios (“Portfolios”) Overseen | | Public Company
and Other
Investment
Company
Directorships
Held During Past
Five Years |
Robert Fairbairn 1965 | | Director (Since 2018) | | Vice Chairman of BlackRock, Inc. since 2019; Member of BlackRock’s Global Executive and Global Operating Committees; Co-Chair of BlackRock’s Human Capital Committee; Senior Managing Director of BlackRock, Inc. from 2010 to 2019; oversaw BlackRock’s Strategic Partner Program and Strategic Product Management Group from 2012 to 2019; Member of the Board of Managers of BlackRock Investments, LLC from 2011 to 2018; Global Head of BlackRock’s Retail and iShares® businesses from 2012 to 2016. | | 123 RICs consisting of 264 Portfolios | | None |
John M. Perlowski(e) 1964 | | Director (since 2015), President and Chief Executive Officer (Since 2010) | | Managing Director of BlackRock, Inc. since 2009; Head of BlackRock Global Accounting and Product Services since 2009; Advisory Director of Family Resource Network (charitable foundation) since 2009. | | 124 RICs consisting of 265 Portfolios | | None |
| (a) | The address of each Director is c/o BlackRock, Inc., 55 East 52nd Street, New York, New York 10055. |
| (b) | Independent Directors serve until their resignation, retirement, removal or death, or until December 31 of the year in which they turn 75. The Board may determine to extend the terms of Independent Directors on a case-by-case basis, as appropriate. |
| (c) | Following the combination of MLIM and BlackRock, Inc. in September 2006, the various legacy MLIM and legacy BlackRock fund boards were realigned and consolidated into three new fund boards in 2007. Furthermore, effective January 1, 2019, three BlackRock Fund Complexes were realigned and consolidated into two BlackRock Fund Complexes. As a result, although the chart shows the year that each Independent Director joined the Board, certain Independent Directors first became members of the boards of other BlackRock-advised Funds, legacy MLIM funds or legacy BlackRock funds as follows: Bruce R. Bond, 2005; Cynthia A. Montgomery, 1994; Joseph P. Platt, 1999; Kenneth L. Urish, 1999; Lena G. Goldberg, 2016; Henry R. Keizer, 2016; Donald C. Opatrny, 2015. |
| (d) | Mr. Fairbairn and Mr. Perlowski are both “interested persons,” as defined in the 1940 Act, of the Corporation/Master LLC based on their positions with BlackRock, Inc. and its affiliates. Mr. Fairbairn and Mr. Perlowski are also board members of the BlackRock Fixed-Income Complex. |
| (e) | Mr. Perlowski is also a trustee of the BlackRock Credit Strategies Fund. |
| | |
| 48 | | 2020 BLACKROCK ANNUAL REPORTTO SHAREHOLDERS |
Director and Officer Information (continued)
| | | | |
| Officers Who Are Not Directors (a) |
| | | |
| Name Year of Birth (b) | | Position(s) Held (Length of Service) | | Principal Occupation(s) During Past Five Years |
Jennifer McGovern 1977 | | Vice President (Since 2014) | | Managing Director of BlackRock, Inc. since 2016; Director of BlackRock, Inc. from 2011 to 2015; Head of Americas Product Development and Governance for BlackRock’s Global Product Group since 2019; Head of Product Structure and Oversight for BlackRock’s U.S. Wealth Advisory Group from 2013 to 2019. |
Neal J. Andrews 1966 | | Chief Financial Officer (Since 2007) | | Chief Financial Officer of the iShares® exchange traded funds from 2019 to 2020; Managing Director of BlackRock, Inc. since 2006. |
Jay M. Fife 1970 | | Treasurer (Since 2007) | | Managing Director of BlackRock, Inc. since 2007. |
Charles Park 1967 | | Chief Compliance Officer (Since 2014) | | Anti-Money Laundering Compliance Officer for certain BlackRock-advised Funds from 2014 to 2015; Chief Compliance Officer of BlackRock Advisors, LLC and the BlackRock-advised Funds in the BlackRock Multi-Asset Complex and the BlackRock Fixed-Income Complex since 2014; Principal of and Chief Compliance Officer for iShares® Delaware Trust Sponsor LLC since 2012 and BlackRock Fund Advisors (“BFA”) since 2006; Chief Compliance Officer for the BFA-advised iShares® exchange traded funds since 2006; Chief Compliance Officer for BlackRock Asset Management International Inc. since 2012. |
Lisa Belle 1968 | | Anti-Money Laundering Compliance Officer (Since 2019) | | Managing Director of BlackRock, Inc. since 2019; Global Financial Crime Head for Asset and Wealth Management of JP Morgan from 2013 to 2019; Managing Director of RBS Securities from 2012 to 2013; Head of Financial Crimes for Barclays Wealth Americas from 2010 to 2012. |
Janey Ahn 1975 | | Secretary (Since 2019) | | Managing Director of BlackRock, Inc. since 2018; Director of BlackRock, Inc. from 2009 to 2017. |
| (a) | The address of each Officer is c/o BlackRock, Inc., 55 East 52nd Street, New York, New York 10055. |
| (b) | Officers of the Corporation/Master LLC serve at the pleasure of the Board. |
Further information about the Corporation’s/Master LLC’s Directors and Officers is available in the Corporation’s Statement of Additional Information, which can be obtained without charge by calling (800) 441-7762.
Effective December 31, 2019, Robert M. Hernandez retired as Director of the Corporation/Master LLC.
Investment Adviser and Administrator
BlackRock Advisors, LLC
Wilmington, DE 19809
Accounting Agent and Transfer Agent
BNY Mellon Investment Servicing (US) Inc.
Wilmington, DE 19809
Custodian
Brown Brothers Harriman & Co.
Boston, MA 02109
Distributor
BlackRock Investments, LLC
New York, NY 10022
Independent Registered Public Accounting Firm
Deloitte & Touche LLP
Boston, MA 02116
Legal Counsel
Sidley Austin LLP
New York, NY 10019
Address of the Corporation/Master LLC
100 Bellevue Parkway
Wilmington, DE 19809
| | |
DIRECTORAND OFFICER INFORMATION | | 49 |
Additional Information
General Information
Householding
The Fund will mail only one copy of shareholder documents, including prospectuses, annual and semi-annual reports and proxy statements, to shareholders with multiple accounts at the same address. This practice is commonly called “householding” and is intended to reduce expenses and eliminate duplicate mailings of shareholder documents. Mailings of your shareholder documents may be householded indefinitely unless you instruct us otherwise. If you do not want the mailing of these documents to be combined with those for other members of your household, please call the Fund at (800) 441-7762.
Availability of Quarterly Schedule of Investments
The Fund/Master LLC files its complete schedule of portfolio holdings with the SEC for the first and third quarters of each fiscal year as an exhibit to its reports on Form N-PORT. The Fund’s/Master LLC’s Forms N-PORT are available on the SEC’s website at sec.gov.
Availability of Proxy Voting Policies and Procedures
A description of the policies and procedures that the Fund/Master LLC uses to determine how to vote proxies relating to portfolio securities is available upon request and without charge (1) by calling (800) 441-7762; (2) at blackrock.com; and (3) on the SEC’s website at sec.gov.
Availability of Proxy Voting Record
Information about how the Fund/Master LLC voted proxies relating to securities held in the Fund’s/Master LLC’s portfolio during the most recent 12-month period ended June 30 is available upon request and without charge (1) at blackrock.com; or by calling (800) 441-7762 and (2) on the SEC’s website at sec.gov.
BlackRock’s Mutual Fund Family
BlackRock offers a diverse lineup of open-end mutual funds crossing all investment styles and managed by experts in equity, fixed-income and tax-exempt investing. Visit blackrock.com for more information.
Shareholder Privileges
Account Information
Call us at (800) 441-7762 from 8:00 AM to 6:00 PM ET on any business day to get information about your account balances, recent transactions and share prices. You can also visit blackrock.com for more information.
Automatic Investment Plans
Investor class shareholders who want to invest regularly can arrange to have $50 or more automatically deducted from their checking or savings account and invested in any of the BlackRock funds.
Systematic Withdrawal Plans
Investor class shareholders can establish a systematic withdrawal plan and receive periodic payments of $50 or more from their BlackRock funds, as long as their account balance is at least $10,000.
Retirement Plans
Shareholders may make investments in conjunction with Traditional, Rollover, Roth, Coverdell, Simple IRAs, SEP IRAs and 403(b) Plans.
| | |
| 50 | | 2020 BLACKROCK ANNUAL REPORTTO SHAREHOLDERS |
Additional Information (continued)
BlackRock Privacy Principles
BlackRock is committed to maintaining the privacy of its current and former fund investors and individual clients (collectively, “Clients”) and to safeguarding their non-public personal information. The following information is provided to help you understand what personal information BlackRock collects, how we protect that information and why in certain cases we share such information with select parties.
If you are located in a jurisdiction where specific laws, rules or regulations require BlackRock to provide you with additional or different privacy-related rights beyond what is set forth below, then BlackRock will comply with those specific laws, rules or regulations.
BlackRock obtains or verifies personal non-public information from and about you from different sources, including the following: (i) information we receive from you or, if applicable, your financial intermediary, on applications, forms or other documents; (ii) information about your transactions with us, our affiliates, or others; (iii) information we receive from a consumer reporting agency; and (iv) from visits to our websites.
BlackRock does not sell or disclose to non-affiliated third parties any non-public personal information about its Clients, except as permitted by law or as is necessary to respond to regulatory requests or to service Client accounts. These non-affiliated third parties are required to protect the confidentiality and security of this information and to use it only for its intended purpose.
We may share information with our affiliates to service your account or to provide you with information about other BlackRock products or services that may be of interest to you. In addition, BlackRock restricts access to non-public personal information about its Clients to those BlackRock employees with a legitimate business need for the information. BlackRock maintains physical, electronic and procedural safeguards that are designed to protect the non-public personal information of its Clients, including procedures relating to the proper storage and disposal of such information.
| | |
ADDITIONAL INFORMATION | | 51 |
Glossary of Terms Used in this Report
| | |
| Portfolio Abbreviation |
| |
| S&P | | Standard & Poor’s |
| | |
| 52 | | 2020 BLACKROCK ANNUAL REPORTTO SHAREHOLDERS |
Want to know more?
blackrock.com | 800-441-7762
This report is intended for current holders. It is not authorized for use as an offer of sale or a solicitation of an offer to buy shares of the Fund unless preceded or accompanied by the Fund’s current prospectus. Past performance results shown in this report should not be considered a representation of future performance. Investment returns and principal value of shares will fluctuate so that shares, when redeemed, may be worth more or less than their original cost. Statements and other information herein are as dated and are subject to change.
ALCV-5/20-AR
| Item 2 – | Code of Ethics – Each registrant (or each, a “Fund”) has adopted a code of ethics, as of the end of the period covered by this report, applicable to the registrants’ principal executive officer, principal financial officer, principal accounting officer or controller, or persons performing similar functions. During the period covered by this report, the code of ethics was amended to update certain information and to make other non-material changes. During the period covered by this report, there have been no waivers granted under the code of ethics. The registrants undertake to provide a copy of the code of ethics to any person upon request, without charge, who calls 1-800-441-7762. |
| Item 3 – | Audit Committee Financial Expert – The registrants’ board of directors (the “board of directors”), has determined that (i) the registrants have the following audit committee financial experts serving on its audit committee and (ii) each audit committee financial expert is independent: |
Neil A. Cotty
Henry R. Keizer
Kenneth L. Urish
Under applicable securities laws, a person determined to be an audit committee financial expert will not be deemed an “expert” for any purpose, including without limitation for the purposes of Section 11 of the Securities Act of 1933, as a result of being designated or identified as an audit committee financial expert. The designation or identification of a person as an audit committee financial expert does not impose on such person any duties, obligations, or liabilities greater than the duties, obligations, and liabilities imposed on such person as a member of the audit committee and board of directors in the absence of such designation or identification. The designation or identification of a person as an audit committee financial expert does not affect the duties, obligations, or liability of any other member of the audit committee or board of directors.
| Item 4 – | Principal Accountant Fees and Services |
The following table presents fees billed by Deloitte & Touche LLP (“D&T”) in each of the last two fiscal years for the services rendered to the Funds:
| | | | | | | | | | | | | | | | |
| | | (a) Audit Fees | | (b) Audit-Related Fees1 | | (c) Tax Fees2 | | (d) All Other Fees |
| Entity Name | | Current Fiscal
Year End3 | | Previous Fiscal Year End | | Current Fiscal Year End3 | | Previous Fiscal Year End | | Current Fiscal Year End3 | | Previous Fiscal Year End | | Current Fiscal Year End3 | | Previous Fiscal Year End |
| BlackRock Advantage Large Cap Value Fund | | $8,160 | | $8,160 | | $0 | | $0 | | $13,900 | | $15,200 | | $0 | | $0 |
| Master Advantage Large Cap Value Portfolio | | $30,600 | | $33,150 | | $0 | | $0 | | $13,100 | | $13,500 | | $0 | | $0 |
The following table presents fees billed by D&T that were required to be approved by each registrant’s audit committee (each a “Committee”) for services that relate directly to the operations or financial reporting of the Funds and that are rendered on behalf of BlackRock Advisors, LLC (the “Investment Adviser” or “BlackRock”) and entities controlling, controlled by, or under common control with BlackRock (not including any sub-adviser whose role is primarily portfolio management and is subcontracted with or
2
overseen by another investment adviser) that provide ongoing services to the Funds (“Affiliated Service Providers”):
| | | | |
| | | Current Fiscal Year End3 | | Previous Fiscal Year End |
(b) Audit-Related Fees1 | | $0 | | $0 |
(c) Tax Fees2 | | $0 | | $0 |
(d) All Other Fees4 | | $1,984,000 | | $2,050,500 |
1 The nature of the services includes assurance and related services reasonably related to the performance of the audit or review of financial statements not included in Audit Fees, including accounting consultations, agreed-upon procedure reports, attestation reports, comfort letters, out-of-pocket expenses and internal control reviews not required by regulators.
2 The nature of the services includes tax compliance and/or tax preparation, including services relating to the filing or amendment of federal, state or local income tax returns, regulated investment company qualification reviews, taxable income and tax distribution calculations.
3The registrants changed their fiscal year end from September 30 to May 31 effective May 31, 2020 whereby this fiscal year consists of the eight months ended May 31, 2020.
4 Non-audit fees of $1,984,000 and $2,050,500 for the current fiscal year and previous fiscal year, respectively, were paid to each Fund’s principal accountant in their entirety by BlackRock, in connection with services provided to the Affiliated Service Providers of each Fund and of certain other funds sponsored and advised by BlackRock or its affiliates for a service organization review and an accounting research tool subscription. These amounts represent aggregate fees paid by BlackRock and were not allocated on a per fund basis.
(e)(1) Audit Committee Pre-Approval Policies and Procedures:
Each Committee has adopted policies and procedures with regard to the pre-approval of services. Audit, audit-related and tax compliance services provided to the registrants on an annual basis require specific pre-approval by the registrants’ Committee. The Committee also must approve other non-audit services provided to the registrants and those non-audit services provided to the Investment Adviser and Affiliated Service Providers that relate directly to the operations and the financial reporting of the registrants. Certain of these non-audit services that the Committee believes are (a) consistent with the SEC’s auditor independence rules and (b) routine and recurring services that will not impair the independence of the independent accountants may be approved by the Committee without consideration on a specific case-by-case basis (“general pre-approval”). The term of any general pre-approval is 12 months from the date of the pre-approval, unless the Committee provides for a different period. Tax or other non-audit services provided to the registrants which have a direct impact on the operations or financial reporting of the registrants will only be deemed pre-approved provided that any individual project does not exceed $10,000 attributable to the registrants or $50,000 per project. For this purpose, multiple projects will be aggregated to determine if they exceed the previously mentioned cost levels.
Any proposed services exceeding the pre-approved cost levels will require specific pre-approval by the registrants’ Committee, as will any other services not subject to general pre-approval (e.g., unanticipated but permissible services). The Committee is informed of each service approved subject to general pre-approval at the next regularly scheduled in-person board meeting. At this meeting, an analysis of such services is presented to the Committee for ratification. The Committee may delegate to the Committee Chairman the authority to approve the provision of and fees for any specific engagement of permitted non-audit services, including services exceeding pre-approved cost levels. (e)(2) None of the services described in each of Items 4(b) through (d) were approved by either Committee pursuant to the de minimis exception in paragraph (c)(7)(i)(C) of Rule 2-01 of Regulation S-X.
(f) Not Applicable
3
(g) The aggregate non-audit fees, defined as the sum of the fees shown under “Audit-Related Fees,” “Tax Fees” and “All Other Fees,” paid to the accountant for services rendered by the accountant to the registrants, the Investment Adviser and the Affiliated Service Providers were:
| | | | | | |
| | | Entity Name | | Current Fiscal Year End1 | | Previous Fiscal Year
End |
| | BlackRock Advantage Large Cap Value Fund | | $13,900 | | $15,200 |
| | Master Advantage Large Cap Value Fund | | $13,100 | | $13,500 |
| | 1 | The registrants changed their fiscal year end from September 30 to May 31 effective May 31, 2020 whereby this fiscal year consists of the eight months ended May 31, 2020. |
Additionally, the amounts billed by D&T in connection with services provided to the Affiliated Service Providers of the Funds and of other funds sponsored and advised by BlackRock or its affiliates during the current and previous fiscal years for a service organization review and an accounting research tool subscription were:
| | |
Current Fiscal Year End 1 | | Previous Fiscal Year End |
$1,984,000 | | $2,050,500 |
| | 1 | The registrant changed its fiscal year end from September 30 to May 31 effective May 31, 2020 whereby this fiscal year consists of the eight months ended May 31, 2020. |
These amounts represent aggregate fees paid by BlackRock and were not allocated on a per fund basis.
(h) The Committee has considered and determined that the provision of non-audit services that were rendered to the Investment Adviser and the Affiliated Service Providers that were not pre-approved pursuant to paragraph (c)(7)(ii) of Rule 2-01 of Regulation S-X is compatible with maintaining the principal accountant’s independence.
| Item 5 – | Audit Committee of Listed Registrants – Not Applicable |
(a) The registrants’ Schedules of Investments are included as part of the Report to Stockholders filed under Item 1 of this Form.
(b) Not Applicable due to no such divestments during the semi-annual period covered since the previous Form N-CSR filing.
| Item 7 – | Disclosure of Proxy Voting Policies and Procedures for Closed-End Management Investment Companies – Not Applicable |
| Item 8 – | Portfolio Managers of Closed-End Management Investment Companies – Not Applicable |
| Item 9 – | Purchases of Equity Securities by Closed-End Management Investment Company and Affiliated Purchasers – Not Applicable |
4
| Item 10 – | Submission of Matters to a Vote of Security Holders – There have been no material changes to these procedures. |
| Item 11 – | Controls and Procedures |
(a) The registrants’ principal executive and principal financial officers, or persons performing similar functions, have concluded that the registrants’ disclosure controls and procedures (as defined in Rule 30a-3(c) under the Investment Company Act of 1940, as amended (the “1940 Act”)) are effective as of a date within 90 days of the filing of this report based on the evaluation of these controls and procedures required by Rule 30a-3(b) under the 1940 Act and Rule 15d-15(b) under the Securities Exchange Act of 1934, as amended.
(b) There were no changes in the registrants’ internal control over financial reporting (as defined in Rule 30a-3(d) under the 1940 Act) that occurred during the period covered by this report that have materially affected, or are reasonably likely to materially affect, the registrants’ internal control over financial reporting.
| Item 12 – | Disclosure of Securities Lending Activities for Closed-End Management Investment Companies – Not Applicable |
| Item 13 – | Exhibits attached hereto |
(a)(1) – Code of Ethics – See Item 2
(a)(2) – Section 302 Certifications are attached
(a)(3) – Not Applicable
(a)(4) – Not Applicable
(b) – Section 906 Certifications are attached
5
Pursuant to the requirements of the Securities Exchange Act of 1934 and the Investment Company Act of 1940, each registrant has duly caused this report to be signed on its behalf by the undersigned, thereunto duly authorized.
BlackRock Large Cap Series Funds, Inc. and Master Large Cap Series LLC
| | | | |
| By: | | /s/ John M. Perlowski | | |
| | John M. Perlowski | | |
| | Chief Executive Officer (principal executive officer) of | | |
| | BlackRock Large Cap Series Funds, Inc. and Master Large Cap Series LLC | | |
| | |
| Date: | | August 4, 2020 | | |
Pursuant to the requirements of the Securities Exchange Act of 1934 and the Investment Company Act of 1940, this report has been signed below by the following persons on behalf of each registrant and in the capacities and on the dates indicated.
| | | | |
| By: | | /s/ John M. Perlowski | | |
| | John M. Perlowski | | |
| | Chief Executive Officer (principal executive officer) of | | |
| | BlackRock Large Cap Series Funds, Inc. and Master Large Cap Series LLC | | |
| | |
| Date: | | August 4, 2020 | | |
| | |
| By: | | /s/ Neal J. Andrews | | |
| | Neal J. Andrews | | |
| | Chief Financial Officer (principal financial officer) of | | |
| | BlackRock Large Cap Series Funds, Inc. and Master Large Cap Series LLC | | |
| | |
| Date: | | August 4, 2020 | | |
6