UNITED STATES
SECURITIES AND EXCHANGE COMMISSION
Washington, D.C. 20549
FORM N-CSR
CERTIFIED SHAREHOLDER REPORT OF REGISTERED MANAGEMENT INVESTMENT COMPANIES
Investment Company Act file number: 811-09651 and 811-09735
Name of Fund: BlackRock Focus Growth Fund, Inc. and Master Focus Growth LLC
Fund Address: 100 Bellevue Parkway, Wilmington, DE 19809
Name and address of agent for service: John M. Perlowski, Chief Executive Officer, BlackRock Focus Growth Fund, Inc. and Master Focus
Growth LLC, 55 East 52nd Street, New York, NY 10055
Registrants’ telephone number, including area code: (800) 441-7762
Date of fiscal year end: 08/31/2014
Date of reporting period: 02/28/2014
Item 1 – Report to Stockholders
FEBRUARY 28, 2014
| | | | |
SEMI-ANNUAL REPORT (UNAUDITED) | | | | BLACKROCK® |
BlackRock Focus Growth Fund, Inc.
| | |
| Not FDIC Insured ¡ May Lose Value ¡ No Bank Guarantee | | |
| | | | | | |
| 2 | | BLACKROCK FOCUS GROWTH FUND, INC. | | FEBRUARY 28, 2014 | | |
Dear Shareholder
One year ago, US financial markets were improving despite a sluggish global economy, as easy monetary policy gave investors enough conviction to take on more risk in their portfolios. Slow but positive growth in the US was sufficient to support corporate earnings, while uncomfortably high unemployment reinforced expectations that the Federal Reserve would continue its aggressive monetary stimulus programs. International markets were more volatile given uneven growth rates and more direct exposure to macro risks such as the banking crisis in Cyprus and a generally poor outlook for European economies. Emerging markets significantly lagged the rest of the world amid fears over slowing growth and debt problems.
Global financial markets were rattled in May when then-Fed Chairman Bernanke mentioned the possibility of reducing (or “tapering”) the central bank’s asset purchase programs — comments that were widely misinterpreted as signaling an end to the Fed’s zero-interest-rate policy. US Treasury yields rose sharply, triggering a steep sell-off across fixed income markets. (Bond prices move in the opposite direction of yields.) Equity prices also suffered as investors feared the implications of a potential end of a program that had greatly supported the markets. Markets rebounded in late June, however, when the Fed’s tone turned more dovish, and improving economic indicators and better corporate earnings helped extend gains through most of the summer.
Although autumn brought mixed events, it was a surprisingly positive period for most asset classes. Early on, the Fed defied market expectations with its decision to delay tapering, but higher volatility returned in late September when the US Treasury Department warned that the national debt would soon breach its statutory maximum. The ensuing political brinksmanship led to a partial government shutdown, roiling global financial markets through the first half of October. Equities and other so-called “risk assets” managed to resume their rally when politicians engineered a compromise to reopen the government and extend the debt ceiling, at least temporarily.
The remainder of 2013 was generally positive for stock markets in the developed world, although investors continued to grapple with uncertainty about when and how much the Fed would scale back on stimulus. When the long-awaited taper announcement ultimately came in mid-December, the Fed reduced the amount of its monthly asset purchases but at the same time reaffirmed its commitment to maintaining low short-term interest rates. Markets reacted positively, as the taper signaled the Fed’s perception of real improvement in the economy, and investors were finally relieved from the anxiety that had gripped them for quite some time.
The start of the new year brought another turn in sentiment, as heightened volatility in emerging markets and mixed US economic data caused global equities to weaken in January while bond markets found renewed strength. Although these headwinds persisted, equities were back on the rise in February thanks to positive developments in Washington, DC. For one, Congress extended the nation’s debt ceiling through mid-March 2015, thereby reducing some degree of fiscal uncertainty for the next year. Additionally, investors were encouraged by market-friendly comments in new Fed Chair Janet Yellen’s Congressional testimony, giving further assurance that short-term rates would remain low for a prolonged period.
While accommodative monetary policy was the main driver behind positive market performance over the period, it was also a key cause of investor uncertainty. Developed market stocks were the strongest performers for the six- and 12-month periods ended February 28. In contrast, emerging markets were weighed down by uneven growth, high levels of debt and severe currency weakness, in addition to the broader concern about reduced global liquidity. The anticipation of Fed tapering during 2013 pressured US Treasury bonds and other high-quality fixed income sectors, including tax-exempt municipals and investment grade corporate bonds. High yield bonds, to the contrary, benefited from income-oriented investors’ search for yield in the low-rate environment. Short-term interest rates remained near zero, keeping yields on money market securities close to historic lows.
At BlackRock, we believe investors need to think globally, extend their scope across a broad array of asset classes and be prepared to move freely as market conditions change over time. We encourage you to talk with your financial advisor and visit www.blackrock.com for further insight about investing in today’s world.
Sincerely,

Rob Kapito
President, BlackRock Advisors, LLC

“While accommodative monetary policy was the main driver behind positive market performance over the period, it was also a key cause of investor uncertainty.”
Rob Kapito
President, BlackRock Advisors, LLC
| | | | | | | | |
| Total Returns as of February 28, 2014 | |
| | | 6-month | | | 12-month | |
US large cap equities
(S&P 500® Index) | | | 15.07 | % | | | 25.37 | % |
US small cap equities
(Russell 2000® Index) | | | 17.75 | | | | 31.56 | |
International equities
(MSCI Europe, Australasia,
Far East Index) | | | 15.01 | | | | 19.28 | |
Emerging market equities
(MSCI Emerging Markets
Index) | | | 4.77 | | | | (6.01 | ) |
3-month Treasury bill
(BofA Merrill Lynch
3-Month US Treasury
Bill Index) | | | 0.03 | | | | 0.08 | |
US Treasury securities
(BofA Merrill Lynch
10- Year US Treasury
Index) | | | 2.61 | | | | (3.65 | ) |
US investment grade
bonds (Barclays US
Aggregate Bond Index) | | | 2.84 | | | | 0.15 | |
Tax-exempt municipal
bonds (S&P Municipal
Bond Index) | | | 6.08 | | | | (0.27 | ) |
US high yield bonds
(Barclays US Corporate
High Yield 2% Issuer
Capped Index) | | | 7.46 | | | | 8.36 | |
|
| Past performance is no guarantee of future results. Index performance is shown for illustrative purposes only. You cannot invest directly in an index. | |
| | | | | | |
| | | THIS PAGE NOT PART OF YOUR FUND REPORT | | | | 3 |
| | | | |
| Fund Summary as of February 28, 2014 | | | BlackRock Focus Growth Fund, Inc. | |
BlackRock Focus Growth Fund, Inc.’s (the “Fund”) investment objective is long-term capital appreciation.
|
| Portfolio Management Commentary |
How did the Fund perform?
| Ÿ | | For the six-month period ended February 28, 2014, through its investment in Master Focus Growth LLC (the “Master LLC”), the Fund outperformed its benchmark, the Russell 1000® Growth Index. |
What factors influenced performance?
| Ÿ | | Contributing positively to performance was stock selection in consumer discretionary, information technology (“IT”) and industrials. Casino operators Wynn Resorts Ltd. and Melco Crown Entertainment Ltd. drove outperformance in the consumer discretionary sector. Shares of Wynn Resorts surged as the Macau gaming market continued its rapid growth and third-party data suggested the company’s casinos began to gain market share. Shares of Melco Crown Entertainment also posted strong gains amid expanding growth in the mass market in China, where the company increased its market share. Elsewhere in the sector, internet & catalog retail holdings priceline.com, Inc. and Amazon.com, Inc. added value. |
| Ÿ | | In the IT sector, the Master LLC’s top-performing holding was Yahoo!, Inc. driven by investors’ growing appreciation for the value of the company’s stake in Chinese e-commerce giant Alibaba Group, a private company that is expected to hold an initial public offering this year. Also during the period, Yahoo!, Inc. successfully raised zero-coupon convertible debt capital and management consequently boosted its share buyback program. Other strong contributors in the IT sector included online review company Yelp, Inc. and software holding Splunk, Inc. |
| Ÿ | | Benefiting performance in the industrials sector were positions in Spirit Airlines, Inc. and solar power company SolarCity Corp. |
| Ÿ | | Detracting from performance relative to the benchmark index was the Master LLC’s overweight in professional networking firm LinkedIn Corp. After reporting strong earnings results for the second half of 2013, LinkedIn Corp. shares fell on lower-than-expected revenue guidance for the fourth quarter, followed by a weak 2014 first-quarter outlook. Of note, the company proceeded to handily beat the lower-than-expected guidance for the fourth quarter. The Master LLC continued to maintain the overweight in LinkedIn Corp. given conviction in the company’s high |
| | incremental margin business model, strong network effects and long-term growth potential relative to the current valuation. Also detracting from performance for the period was the Master LLC’s positioning within the energy sector. |
Describe recent portfolio activity.
| Ÿ | | During the six-month period, the Master LLC increased exposure to the diversified and wireless telecommunications segments in the telecommunication services sector. The Master LLC also added to chemical holdings in materials, and increased exposure to the health care sector. Conversely, the Master LLC reduced exposure to the financials sector, notably in the insurance and consumer finance industries. In consumer discretionary, the Master LLC trimmed positions mainly in the textiles, apparel & luxury goods and media segments, while in the industrials sector, the Master LLC trimmed exposure to the electrical equipment industry. |
Describe portfolio positioning at period end.
| Ÿ | | As of period end, the Master LLC maintained a diversified mix of Durable Growth¹ holdings (sustainable business models more mature in their life cycle) and Superior Growth¹ holdings (industry leaders taking share, with long-term persistent advantages and untapped growth opportunities), supplemented by a small number of Periodic Growth¹ names (businesses that thrive in expanding economies, but where margins are volatile). |
| Ÿ | | Relative to the Russell 1000® Growth Index, the Master LLC’s largest overweight continued to be consumer discretionary driven by the investment advisor’s favorable view on companies that continue to take share in the expanding growth of consumer wealth globally and, in particular, the rise of e-commerce. The most notable underweight continued to be consumer staples. |
| | ¹ | The terms Superior, Durable and Periodic Growth are used, in this context, to denote three distinct categories of growth stocks as viewed by the investment advisor. They are not indicators of individual security performance or that of the strategy. |
The views expressed reflect the opinions of BlackRock as of the date of this report and are subject to change based on changes in market, economic or other conditions. These views are not intended to be a forecast of future events and are no guarantee of future results.
| | | | | | |
| 4 | | BLACKROCK FOCUS GROWTH FUND, INC. | | FEBRUARY 28, 2014 | | |
| | | | |
| Fund Summary as of February 28, 2014 | | | BlackRock Focus Growth Fund, Inc. | |
|
| Total Return Based on a $10,000 Investment |
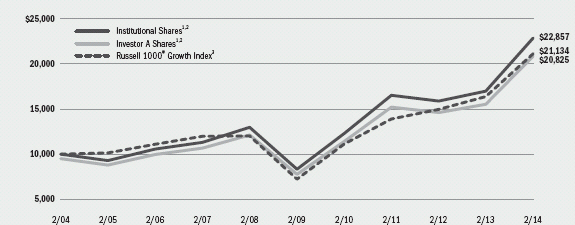
| | 1 | Assuming maximum sales charges, if any, transaction costs and other operating expenses, including administration fees. Institutional Shares do not have a sales charge. |
| | 2 | The Fund invests all of its assets in the Master LLC. The Master LLC invests primarily in the common stock of not less than 25 to not more than 45 companies that Master LLC management believes have strong earnings and revenue growth and capital appreciation potential. |
| | 3 | This unmanaged index measures the performance of the large cap growth segment of the US equity universe and includes those Russell 1000® Index companies with higher price-to-book ratios and higher forecasted growth values. |
| | | | | | | | | | | | | | | | | | | | | | | | | | | | |
| Performance Summary for the Period Ended February 28, 2014 | |
| | | | | | Average Annual Total Returns4 | |
| | | | | | 1 Year | | | 5 Years | | | 10 Years | |
| | | 6-Month
Total Returns | | | w/o sales
charge | | | w/ sales
charge | | | w/o sales
charge | | | w/ sales
charge | | | w/o sales
charge | | | w/ sales
charge | |
Institutional | | | 25.80 | % | | | 34.57 | % | | | N/A | | | | 22.41 | % | | | N/A | | | | 8.62 | % | | | N/A | |
Investor A | | | 25.43 | | | | 34.17 | | | | 27.12 | % | | | 21.85 | | | | 20.54 | % | | | 8.19 | | | | 7.61 | % |
Investor C | | | 25.20 | | | | 32.96 | | | | 31.96 | | | | 20.99 | | | | 20.99 | | | | 7.33 | | | | 7.33 | |
Russell 1000® Growth Index | | | 17.84 | | | | 29.14 | | | | N/A | | | | 24.02 | | | | N/A | | | | 7.77 | | | | N/A | |
| | 4 | Assuming maximum sales charges, if any. Average annual total returns with and without sales charges reflect reductions for distribution and service fees. See “About Fund Performance” on page 6 for a detailed description of share classes, including any related sales charges and fees. |
| | | N/A - Not applicable as share class and index do not have a sales charge. |
| | | Past performance is not indicative of future results. |
| | | | | | | | | | | | | | |
| Expense Example |
| | | Actual | | Hypothetical6 | | |
| | | Beginning Account Value
September 1, 2013 | | Ending Account Value
February 28, 2014 | | Expenses Paid
During the Period5 | | Beginning Account Value
September 1, 2013 | | Ending Account Value
February 28, 2014 | | Expenses Paid
During the Period5 | | Annualized Expense Ratio |
Institutional | | $1,000.00 | | $1,258.00 | | $6.49 | | $1,000.00 | | $1,019.04 | | $5.81 | | 1.16% |
Investor A | | $1,000.00 | | $1,254.30 | | $8.61 | | $1,000.00 | | $1,017.16 | | $7.70 | | 1.54% |
Investor C | | $1,000.00 | | $1,252.00 | | $12.79 | | $1,000.00 | | $1,013.44 | | $11.43 | | 2.29% |
| | 5 | For each class of the Fund, expenses are equal to the annualized expense ratio for the class, multiplied by the average account value over the period, multiplied by 181/365 (to reflect the one-half year period shown). Because the Fund invests significantly in the Master LLC, the expense example reflects the net expenses of both the Fund and the Master LLC in which it invests. |
| | 6 | Hypothetical 5% annual return before expenses is calculated by pro rating the number of days in the most recent fiscal half year divided by 365. |
| | | See “Disclosure of Expenses” on page 6 for further information on how expenses were calculated. |
| | | | | | |
| | | BLACKROCK FOCUS GROWTH FUND, INC. | | FEBRUARY 28, 2014 | | 5 |
| Ÿ | | Institutional Shares are not subject to any sales charge. These shares bear no ongoing distribution or service fees and are available only to eligible investors. |
| Ÿ | | Investor A Shares are subject to a maximum initial sales charge (front-end load) of 5.25% and a service fee of 0.25% per year (but no distribution fee). Certain redemptions of these shares may be subject to a contingent deferred sales charge (“CDSC”) where no initial sales charge was paid at the time of purchase. |
| Ÿ | | Investor C Shares are subject to a 1.00% CDSC if redeemed within one year of purchase. In addition, these shares are subject to a distribution fee of 0.75% per year and a service fee of 0.25% per year. |
Performance information reflects past performance and does not guarantee future results. Current performance may be lower or higher than the performance data quoted. Refer to www.blackrock.com/funds to obtain performance data current to the most recent month end. Performance results do not reflect the deduction of taxes that a shareholder
would pay on fund distributions or the redemption of fund shares. Figures shown in the performance table on the previous page assume reinvestment of all dividends and distributions, if any, at net asset value (“NAV”) on the ex-dividend/payable dates. Investment return and principal value of shares will fluctuate so that shares, when redeemed, may be worth more or less than their original cost. Dividends paid to each class of shares will vary because of the different levels of service, distribution and transfer agency fees applicable to each class, which are deducted from the income available to be paid to shareholders.
BlackRock Advisors, LLC (the “Administrator”), the Fund’s administrator, waived and/or reimbursed a portion of the Fund’s expenses. Without such waiver and/or reimbursement, the Fund’s performance would have been lower. The Administrator is under no obligation to waive or reimburse or to continue waiving or reimbursing its fees after the applicable termination date. See Note 3 of the Notes to Financial Statements for additional information on waivers and reimbursements.
Shareholders of the Fund may incur the following charges: (a) transactional expenses, such as sales charges; and (b) operating expenses, including administration fees, service and distribution fees, including 12b-1 fees, acquired fund fees and expenses and other Fund expenses. The expense example shown on the previous page (which is based on a hypothetical investment of $1,000 invested on September 1, 2013 and held through February 28, 2014) is intended to assist shareholders both in calculating expenses based on an investment in the Fund and in comparing these expenses with similar costs of investing in other mutual funds.
The expense example provides information about actual account values and actual expenses. In order to estimate the expenses a shareholder paid during the period covered by this report, shareholders can divide their account value by $1,000 and then multiply the result by the number corresponding to their share class under the heading entitled “Expenses Paid During the Period.”
The expense example also provides information about hypothetical account values and hypothetical expenses based on the Fund’s actual expense ratio and an assumed rate of return of 5% per year before expenses. In order to assist shareholders in comparing the ongoing expenses of investing in the Fund and other funds, compare the 5% hypothetical example with the 5% hypothetical examples that appear in other funds’ shareholder reports.
The expenses shown in the expense example are intended to highlight shareholders’ ongoing costs only and do not reflect any transactional expenses, such as sales charges, if any. Therefore, the hypothetical example is useful in comparing ongoing expenses only, and will not help shareholders determine the relative total expenses of owning different funds. If these transactional expenses were included, shareholder expenses would have been higher.
| | | | | | |
| 6 | | BLACKROCK FOCUS GROWTH FUND, INC. | | FEBRUARY 28, 2014 | | |
| | |
| Derivative Financial Instruments | | |
The Master LLC may invest in various derivative financial instruments, including foreign currency exchange contracts, as specified in Note 4 of the Master LLC’s Notes to Financial Statements, which may constitute forms of economic leverage. Such derivative financial instruments are used to obtain exposure to a security, index and/or market without owning or taking physical custody of securities or to hedge market, and/or foreign currency exchange rate risks. Derivative financial instruments involve risks, including the imperfect correlation between the value of a derivative financial instrument and the underlying asset, possible default of the counterparty to the transaction or illiquidity of the derivative financial instrument. The Master LLC’s ability to use a derivative financial
instrument successfully depends on the investment advisor’s ability to predict pertinent market movements accurately, which cannot be assured. The use of derivative financial instruments may result in losses greater than if they had not been used, may require the Master LLC to sell or purchase portfolio investments at inopportune times or for distressed values, may limit the amount of appreciation the Master LLC can realize on an investment, may result in lower dividends paid to shareholders and/or may cause the Master LLC to hold an investment that it might otherwise sell. The Master LLC’s investments in these instruments are discussed in detail in the Master LLC’s Notes to Financial Statements.
| | | | | | |
| | | BLACKROCK FOCUS GROWTH FUND, INC. | | FEBRUARY 28, 2014 | | 7 |
| | | | |
| Statement of Assets and Liabilities | | | BlackRock Focus Growth Fund, Inc. | |
| | | | |
| February 28, 2014 (Unaudited) | | | |
| | | | |
| Assets | | | | |
Investments at value — Master LLC (cost — $63,723,864) | | $ | 83,049,270 | |
Withdrawals receivable from the Master LLC | | | 166,811 | |
Capital shares sold receivable | | | 106,953 | |
Prepaid expenses | | | 29,694 | |
| | | | |
Total assets | | | 83,352,728 | |
| | | | |
| | | | |
| Liabilities | | | | |
Capital shares redeemed payable | | | 273,764 | |
Service and distribution fees payable | | | 27,414 | |
Administration fees payable | | | 14,373 | |
Transfer agent fees payable | | | 62,310 | |
Professional fees payable | | | 26,815 | |
Printing fees payable | | | 26,638 | |
Other affiliates payable | | | 2,753 | |
Officer’s fees payable | | | 29 | |
Other accrued expenses payable | | | 3,143 | |
| | | | |
Total liabilities | | | 437,239 | |
| | | | |
Net Assets | | $ | 82,915,489 | |
| | | | |
| | | | |
| Net Assets Consist of | | | | |
Paid-in capital | | $ | 59,818,752 | |
Undistributed net investment loss | | | (87,993 | ) |
Undistributed net realized gain allocated from the Master LLC | | | 3,859,324 | |
Net unrealized appreciation/depreciation allocated from the Master LLC | | | 19,325,406 | |
| | | | |
Net Assets | | $ | 82,915,489 | |
| | | | |
| | | | |
| Net Asset Value | | | | |
Institutional — Based on net assets of $15,612,664 and 4,573,092 shares outstanding, 100 million shares authorized, $0.10 par value | | $ | 3.41 | |
| | | | |
Investor A — Based on net assets of $40,909,610 and 12,650,767 shares outstanding, 100 million shares authorized, $0.10 par value | | $ | 3.23 | |
| | | | |
Investor C — Based on net assets of $26,393,215 and 9,293,811 shares outstanding, 300 million shares authorized, $0.10 par value | | $ | 2.84 | |
| | | | |
See Notes to Financial Statements.
| | | | | | |
| 8 | | BLACKROCK FOCUS GROWTH FUND, INC. | | FEBRUARY 28, 2014 | | |
| | | | |
| Statement of Operations | | | BlackRock Focus Growth Fund, Inc. | |
| | | | |
| Six Months Ended February 28, 2014 (Unaudited) | | | |
| | | | |
| Investment Income | | | | |
Net investment income allocated from the Master LLC: | | | | |
Dividends — unaffiliated | | $ | 190,996 | |
Other Income — affiliated | | | 381,578 | |
Dividends — affiliated | | | 162 | |
Foreign taxes withheld | | | (403 | ) |
Expenses | | | (289,079 | ) |
Fees waived | | | 77,593 | |
| | | | |
Total income | | | 360,847 | |
| | | | |
| | | | |
| Fund Expenses | | | | |
Administration | | | 96,469 | |
Service — Investor A | | | 47,040 | |
Service and distribution — Investor C | | | 125,838 | |
Transfer agent — Institutional | | | 11,039 | |
Transfer agent — Investor A | | | 53,946 | |
Transfer agent — Investor C | | | 35,616 | |
Registration | | | 27,030 | |
Professional | | | 26,700 | |
Printing | | | 15,490 | |
Officer | | | 30 | |
Miscellaneous | | | 9,649 | |
| | | | |
Total expenses | | | 448,847 | |
| | | | |
Net investment loss | | | (88,000 | ) |
| | | | |
| | | | |
| Realized and Unrealized Gain Allocated from the Master LLC | | | | |
Net realized gain from investments | | | 5,896,702 | |
Net change in unrealized appreciation/depreciation on investments | | | 11,490,946 | |
| | | | |
Total realized and unrealized gain | | | 17,387,648 | |
| | | | |
Net Increase in Net Assets Resulting from Operations | | $ | 17,299,648 | |
| | | | |
See Notes to Financial Statements.
| | | | | | |
| | | BLACKROCK FOCUS GROWTH FUND, INC. | | FEBRUARY 28, 2014 | | 9 |
| | | | |
| Statements of Changes in Net Assets | | | BlackRock Focus Growth Fund, Inc. | |
| | | | | | | | |
| Increase (Decrease) in Net Assets: | | Six Months
Ended
February 28,
2014
(Unaudited) | | | Year Ended
August 31,
2013 | |
| | | | | | | | |
| Operations | | | | | | | | |
Net investment loss | | $ | (88,000 | ) | | $ | (439,391 | ) |
Net realized gain | | | 5,896,702 | | | | 13,544,824 | |
Net change in unrealized appreciation/depreciation | | | 11,490,946 | | | | (4,952,831 | ) |
| | | | |
Net increase in net assets resulting from operations | | | 17,299,648 | | | | 8,152,602 | |
| | | | |
| | | | | | | | |
| Distributions to Shareholders From | | | | | | | | |
Net realized gain: | | | | | | | | |
Institutional | | | (2,288,797 | ) | | | — | |
Investor A | | | (6,154,373 | ) | | | — | |
Investor C | | | (4,404,994 | ) | | | — | |
| | | | |
Decrease in net assets resulting from distributions to shareholders | | | (12,848,164 | ) | | | — | |
| | | | |
| | | | | | | | |
| Capital Share Transactions | | | | | | | | |
Net increase (decrease) in net assets derived from capital share transactions | | | 8,734,972 | | | | (17,116,899 | ) |
| | | | |
| | | | | | | | |
| Net Assets | | | | | | | | |
Total increase (decrease) in net assets | | | 13,186,456 | | | | (8,964,297 | ) |
Beginning of period | | | 69,729,033 | | | | 78,693,330 | |
| | | | |
End of period | | $ | 82,915,489 | | | $ | 69,729,033 | |
| | | | |
Accumulated net investment income (loss), end of period | | $ | (87,993 | ) | | $ | 7 | |
| | | | |
See Notes to Financial Statements.
| | | | | | |
| 10 | | BLACKROCK FOCUS GROWTH FUND, INC. | | FEBRUARY 28, 2014 | | |
| | | | |
| Financial Highlights | | | BlackRock Focus Growth Fund, Inc. | |
| | | | | | | | | | | | | | | | | | | | | | | | |
| | | Institutional | |
| | | Six Months Ended February 28, 2014 (Unaudited) | | | Year Ended August 31, | |
| | | | 2013 | | | 2012 | | | 2011 | | | 2010 | | | 2009 | |
| | | | | | | | | | | | | | | | | | | | | | | | |
| Per Share Operating Performance | | | | | | | | | | | | | | | | | | | | | | | | |
Net asset value, beginning of period | | $ | 3.22 | | | $ | 2.88 | | | $ | 2.65 | | | $ | 2.13 | | | $ | 1.96 | | | $ | 2.34 | |
| | | | |
Net investment income (loss)1 | | | 0.01 | | | | 0.00 | 2 | | | (0.01 | ) | | | (0.00 | )3 | | | 0.01 | | | | (0.01 | ) |
Net realized and unrealized gain (loss) | | | 0.77 | | | | 0.34 | | | | 0.25 | | | | 0.52 | | | | 0.16 | | | | (0.37 | ) |
| | | | |
Net increase (decrease) from investment operations | | | 0.78 | | | | 0.34 | | | | 0.24 | | | | 0.52 | | | | 0.17 | | | | (0.38 | ) |
| | | | |
Distributions from net realized gain | | | (0.59 | ) | | | — | | | | (0.01 | )4 | | | — | | | | — | | | | — | |
| | | | |
Net asset value, end of period | | $ | 3.41 | | | $ | 3.22 | | | $ | 2.88 | | | $ | 2.65 | | | $ | 2.13 | | | $ | 1.96 | |
| | | | |
| | | | | | | | | | | | | | | | | | | | | | | | |
| Total Investment Return5 | | | | | | | | | | | | | | | | | | | | | | | | |
Based on net asset value | | | 25.80 | %6,7 | | | 11.81 | % | | | 9.16 | %8 | | | 24.41 | %9 | | | 8.67 | %10 | | | (16.24 | )%11 |
| | | | |
| | | | | | | | | | | | | | | | | | | | | | | | |
| Ratios to Average Net Assets12 | | | | | | | | | | | | | | | | | | | | | | | | |
Total expenses | | | 1.36 | %13,14 | | | 1.20 | %13 | | | 1.22 | %13 | | | 0.96 | %13 | | | 1.45 | % | | | 1.78 | % |
| | | | |
Total expenses after fees waived and/or reimbursed | | | 1.16 | %13,14 | | | 1.20 | %13 | | | 1.22 | %13 | | | 0.96 | %13 | | | 1.45 | % | | | 1.78 | % |
| | | | |
Net investment income (loss) | | | 0.34 | %13,14 | | | 0.00 | %13,15 | | | (0.28 | )%13 | | | (0.02 | )%13,16 | | | 0.39 | %16 | | | (0.82 | )% |
| | | | |
| | | | | | | | | | | | | | | | | | | | | | | | |
| Supplemental Data | | | | | | | | | | | | | | | | | | | | | | | | |
Net assets, end of period (000) | | $ | 15,613 | | | $ | 13,276 | | | $ | 15,780 | | | $ | 32,783 | | | $ | 6,739 | | | $ | 9,673 | |
| | | | |
Portfolio turnover of the Master LLC | | | 58 | % | | | 178 | % | | | 78 | % | | | 97 | % | | | 86 | % | | | 185 | % |
| | | | |
| | 1 | Based on average shares outstanding. |
| | 2 | Amount is less than $0.005 per share. |
| | 3 | Amount is greater than $(0.005) per share. |
| | 4 | Determined in accordance with federal income tax regulations. |
| | 5 | Where applicable, assumes the reinvestment of dividends and distributions. |
| | 6 | Includes a payment from an affiliate to compensate for foregone securities lending revenue which impacted the Fund’s total return. Not including this payment, the Fund’s total return would have been 25.06%. |
| | 7 | Aggregate total investment return. |
| | 8 | Includes proceeds received from a settlement of litigation, through its investment in the Master LLC, which impacted the Fund’s total return. Not including these proceeds the total return would have been 8.02%. |
| | 9 | Includes proceeds received from a settlement of litigation, through its investment in the Master LLC, which impacted the Fund’s total return. Not including these proceeds the total return would have been 23.00%. |
| | 10 | Includes proceeds received from a settlement of litigation, through its investment in the Master LLC, which impacted the Fund’s total return. Not including these proceeds the total return would have been 6.12%. |
| | 11 | Includes proceeds received from a settlement of litigation, through its investment in the Master LLC, which impacted the Fund’s total return. Not including these proceeds the total return would have been (28.21)%. |
| | 12 | Includes the Fund’s share of the Master LLC’s allocated net expenses and/or net investment income. |
| | 13 | Includes the Fund’s share of the Master LLC’s allocated fees waived of 0.20%. |
| | 16 | Includes interest on the proceeds received from a settlement of litigation, through its investment in the Master LLC, which impacted the Fund’s ratio of net investment income (loss) to average net assets. Not including this interest, the ratio of net investment income (loss) to average net assets would have been (0.14)% for the year ended August 31, 2011 and (0.47)% for the year ended August 31, 2010. |
See Notes to Financial Statements.
| | | | | | |
| | | BLACKROCK FOCUS GROWTH FUND, INC. | | FEBRUARY 28, 2014 | | 11 |
| | | | |
| Financial Highlights (continued) | | | BlackRock Focus Growth Fund, Inc. | |
| | | | | | | | | | | | | | | | | | | | | | | | |
| | | Investor A | |
| | | Six Months
Ended
February 28,
2014)
(Unaudited | | | Year Ended August 31, | |
| | | | 2013 | | | 2012 | | | 2011 | | | 2010 | | | 2009 | |
| | | | | | | | | | | | | | | | | | | | | | | | |
| Per Share Operating Performance | | | | | | | | | | | | | | | | | | | | | | | | |
Net asset value, beginning of period | | $ | 3.07 | | | $ | 2.75 | | | $ | 2.54 | | | $ | 2.06 | | | $ | 1.90 | | | $ | 2.28 | |
| | | | |
Net investment loss1 | | | (0.00 | )2 | | | (0.01 | ) | | | (0.02 | ) | | | (0.01 | ) | | | (0.00 | )2 | | | (0.01 | ) |
Net realized and unrealized gain (loss) | | | 0.73 | | | | 0.33 | | | | 0.24 | | | | 0.49 | | | | 0.16 | | | | (0.37 | ) |
| | | | |
Net increase (decrease) from investment operations | | | 0.73 | | | | 0.32 | | | | 0.22 | | | | 0.48 | | | | 0.16 | | | | (0.38 | ) |
| | | | |
Distributions from net realized gain | | | (0.57 | ) | | | — | | | | (0.01 | )3 | | | — | | | | — | | | | — | |
| | | | |
Net asset value, end of period | | $ | 3.23 | | | $ | 3.07 | | | $ | 2.75 | | | $ | 2.54 | | | $ | 2.06 | | | $ | 1.90 | |
| | | | |
| | | | | | | | | | | | | | | | | | | | | | | | |
| Total Investment Return4 | | | | | | | | | | | | | | | | | | | | | | | | |
Based on net asset value | | | 25.43 | %5,6 | | | 11.64 | % | | | 8.76 | %7 | | | 23.30 | %8 | | | 8.42 | %9 | | | (16.67 | )%10 |
| | | | |
| | | | | | | | | | | | | | | | | | | | | | | | |
| Ratios to Average Net Assets11 | | | | | | | | | | | | | | | | | | | | | | | | |
Total expenses | | | 1.74 | %12,13 | | | 1.63 | %12 | | | 1.65 | %12 | | | 1.45 | %12 | | | 1.94 | % | | | 2.49 | % |
| | | | |
Total expenses after fees waived and/or reimbursed | | | 1.54 | %12,13 | | | 1.63 | %12 | | | 1.65 | %12 | | | 1.45 | %12 | | | 1.94 | % | | | 2.22 | % |
| | | | |
Net investment loss | | | (0.06 | )%12,13 | | | (0.43 | )%12 | | | (0.71 | )%12 | | | (0.54 | )%12,14 | | | (0.18 | )%14 | | | (1.26 | )% |
| | | | |
| | | | | | | | | | | | | | | | | | | | | | | | |
| Supplemental Data | | | | | | | | | | | | | | | | | | | | | | | | |
Net assets, end of period (000) | | $ | 40,910 | | | $ | 33,622 | | | $ | 36,614 | | | $ | 45,871 | | | $ | 27,003 | | | $ | 23,042 | |
| | | | |
Portfolio turnover of the Master LLC | | | 58 | % | | | 178 | % | | | 78 | % | | | 97 | % | | | 86 | % | | | 185 | % |
| | | | |
| | 1 | Based on average shares outstanding. |
| | 2 | Amount is greater than $(0.005) per share. |
| | 3 | Determined in accordance with federal income tax regulations. |
| | 4 | Where applicable, excludes the effects of any sales charges and assumes the reinvestment of dividends and distributions. |
| | 5 | Includes a payment from an affiliate to compensate for foregone securities lending revenue which impacted the Fund’s total return. Not including this payment, the Fund’s total return would have been 24.65%. |
| | 6 | Aggregate total investment return. |
| | 7 | Includes proceeds received from a settlement of litigation, through its investment in the Master LLC, which impacted the Fund’s total return. Not including these proceeds the total return would have been 7.58%. |
| | 8 | Includes proceeds received from a settlement of litigation, through its investment in the Master LLC, which impacted the Fund’s total return. Not including these proceeds the total return would have been 21.36%. |
| | 9 | Includes proceeds received from a settlement of litigation, through its investment in the Master LLC, which impacted the Fund’s total return. Not including these proceeds the total return would have been 5.79%. |
| | 10 | Includes proceeds received from a settlement of litigation, through its investment in the Master LLC, which impacted the Fund’s total return. Not including these proceeds the total return would have been (28.51)%. |
| | 11 | Includes the Fund’s share of the Master LLC’s allocated net expenses and/or net investment loss. |
| | 12 | Includes the Fund’s share of the Master LLC’s allocated fees waived of 0.20%. |
| | 14 | Includes interest on the proceeds received from a settlement of litigation, through its investment in the Master LLC, which impacted the Fund’s ratio of net investment income (loss) to average net assets. Not including this interest, the ratio of net investment income (loss) to average net assets would have been (0.63)% for the year ended August 31, 2011 and (1.00)% for the year ended August 31, 2010. |
See Notes to Financial Statements.
| | | | | | |
| 12 | | BLACKROCK FOCUS GROWTH FUND, INC. | | FEBRUARY 28, 2014 | | |
| | | | |
| Financial Highlights (concluded) | | | BlackRock Focus Growth Fund, Inc. | |
| | | | | | | | | | | | | | | | | | | | | | | | |
| | | Investor C | |
| | | Six Months
Ended
February
28, 2014 (Unaudited) | | | Year Ended August 31, | |
| | | | 2013 | | | 2012 | | | 2011 | | | 2010 | | | 2009 | |
| | | | | | | | | | | | | | | | | | | | | | | | |
| Per Share Operating Performance | | | | | | | | | | | | | | | | | | | | | | | | |
Net asset value, beginning of period | | $ | 2.74 | | | $ | 2.48 | | | $ | 2.31 | | | $ | 1.88 | | | $ | 1.75 | | | $ | 2.12 | |
| | | | |
Net investment loss1 | | | (0.01 | ) | | | (0.03 | ) | | | (0.03 | ) | | | (0.03 | ) | | | (0.02 | ) | | | (0.02 | ) |
Net realized and unrealized gain (loss) | | | 0.66 | | | | 0.29 | | | | 0.21 | | | | 0.46 | | | | 0.15 | | | | (0.35 | ) |
| | | | |
Net increase (decrease) from investment operations | | | 0.65 | | | | 0.26 | | | | 0.18 | | | | 0.43 | | | | 0.13 | | | | (0.37 | ) |
| | | | |
Distributions from net realized gain | | | (0.55 | ) | | | — | | | | (0.01 | )2 | | | — | | | | — | | | | — | |
| | | | |
Net asset value, end of period | | $ | 2.84 | | | $ | 2.74 | | | $ | 2.48 | | | $ | 2.31 | | | $ | 1.88 | | | $ | 1.75 | |
| | | | |
| | | | | | | | | | | | | | | | | | | | | | | | |
| Total Investment Return3 | | | | | | | | | | | | | | | | | | | | | | | | |
Based on net asset value | | | 25.20 | %4,5 | | | 10.48 | % | | | 7.90 | %6 | | | 22.87 | %7 | | | 7.43 | %8 | | | (17.45 | )%9 |
| | | | |
| | | | | | | | | | | | | | | | | | | | | | | | |
| Ratios to Average Net Assets10 | | | | | | | | | | | | | | | | | | | | | | | | |
Total expenses | | | 2.49 | %11,12 | | | 2.37 | %11 | | | 2.40 | %11 | | | 2.23 | %11 | | | 2.78 | % | | | 3.27 | % |
| | | | |
Total expenses after fees waived and/or reimbursed | | | 2.29 | %11,12 | | | 2.37 | %11 | | | 2.40 | %11 | | | 2.23 | %11 | | | 2.78 | % | | | 2.98 | % |
| | | | |
Net investment loss | | | (0.80 | )%11,12 | | | (1.17 | )%11 | | | (1.47 | )%11 | | | (1.33 | )%11,13 | | | (1.02 | )%13 | | | (2.02 | )% |
| | | | |
| | | | | | | | | | | | | | | | | | | | | | | | |
| Supplemental Data | | | | | | | | | | | | | | | | | | | | | | | | |
Net assets, end of period (000) | | $ | 26,393 | | | $ | 22,831 | | | $ | 25,554 | | | $ | 28,132 | | | $ | 15,758 | | | $ | 13,681 | |
| | | | |
Portfolio turnover of the Master LLC | | | 58 | % | | | 178 | % | | | 78 | % | | | 97 | % | | | 86 | % | | | 185 | % |
| | | | |
| | 1 | Based on average shares outstanding. |
| | 2 | Determined in accordance with federal income tax regulations. |
| | 3 | Where applicable, excludes the effects of any sales charges and assumes the reinvestment of dividends and distributions. |
| | 4 | Includes a payment from an affiliate to compensate for foregone securities lending revenue which impacted the Fund’s total return. Not including this payment, the Fund’s total return would have been 24.32%. |
| | 5 | Aggregate total investment return. |
| | 6 | Includes proceeds received from a settlement of litigation, through its investment in the Master LLC, which impacted the Fund’s total return. Not including these proceeds the total return would have been 6.60%. |
| | 7 | Includes proceeds received from a settlement of litigation, through its investment in the Master LLC, which impacted the Fund’s total return. Not including these proceeds the total return would have been 20.74%. |
| | 8 | Includes proceeds received from a settlement of litigation, through its investment in the Master LLC, which impacted the Fund’s total return. Not including these proceeds the total return would have been 4.57%. |
| | 9 | Includes proceeds received from a settlement of litigation, through its investment in the Master LLC, which impacted the Fund’s total return. Not including these proceeds the total return would have been (28.77)%. |
| | 10 | Includes the Fund’s share of the Master LLC’s allocated net expenses and/or net investment income. |
| | 11 | Includes the Fund’s share of the Master LLC’s allocated fees waived of 0.20%. |
| | 13 | Includes interest on the proceeds received from a settlement of litigation, through its investment in the Master LLC, which impacted the Fund’s ratio of net investment income (loss) to average net assets. Not including this interest, the ratio of net investment income (loss) to average net assets would have been (1.42)% for the year ended August 31, 2011 and (1.84)% for the year ended August 31, 2010. |
See Notes to Financial Statements.
| | | | | | |
| | | BLACKROCK FOCUS GROWTH FUND, INC. | | FEBRUARY 28, 2014 | | 13 |
| | | | |
| Notes to Financial Statements (Unaudited) | | | BlackRock Focus Growth Fund, Inc. | |
1. Organization:
BlackRock Focus Growth Fund Inc. (the “Fund”) is registered under the Investment Company Act of 1940, as amended (the “1940 Act”), as a non-diversified, open-end management investment company. The Fund is organized as a Maryland corporation. The Fund seeks to achieve its investment objective by investing all of its assets in BlackRock Master Focus Growth LLC (the “Master LLC”), an affiliate of the Fund, which has the same investment objective and strategies as the Fund. The value of the Fund’s investment in the Master LLC reflects the Fund’s proportionate interest in the net assets of the Master LLC. The performance of the Fund is directly affected by the performance of the Master LLC. The percentage of the Master LLC owned by the Fund at February 28, 2014 was 100%. As such, the financial statements of the Master LLC, including the Schedule of Investments, are included elsewhere in this report and should be read in conjunction with the Fund’s financial statements. The Fund offers multiple classes of shares. Institutional Shares are sold without a sales charge and only to certain eligible investors. Investor A Shares are generally sold with an initial sales charge, but may be subject to a CDSC for certain redemptions where no initial sales charge was paid at the time of purchase. Investor C Shares may be subject to a CDSC. All classes of shares have identical voting, dividend, liquidation and other rights and are subject to the same terms and conditions, except that Investor A and Investor C Shares bear certain expenses related to the shareholder servicing of such shares, and Investor C Shares also bear certain expenses related to the distribution of such shares.
2. Significant Accounting Policies:
The Fund’s financial statements are prepared in conformity with accounting principles generally accepted in the United States of America (“US GAAP”), which may require management to make estimates and assumptions that affect the reported amounts of assets and liabilities in the financial statements and the reported amounts of increases and decreases in net assets from operations during the reporting period. Actual results could differ from those estimates. The following is a summary of the significant accounting policies followed by the Fund:
Valuation: US GAAP defines fair value as the price the Fund would receive to sell an asset or pay to transfer a liability in an orderly transaction between market participants at the measurement date. The Fund’s policy is to fair value its financial instruments at market value. The Fund records its investment in the Master LLC at fair value based on the Fund’s proportionate interest in the net assets of the Master LLC. Valuation of securities held by the Master LLC is discussed in Note 2 of the Master LLC’s Notes to Financial Statements, which are included elsewhere in this report.
Investment Transactions and Investment Income: For financial reporting purposes, contributions to and withdrawals from the Master LLC are accounted on a trade date basis. The Fund records daily its proportionate share of the Master LLC’s income, expenses and realized and unrealized gains and losses. In addition, the Fund accrues its own
expenses. Income, expenses and realized and unrealized gains and losses are allocated daily to each class based on its relative net assets.
Dividends and Distributions: Dividends and distributions paid by the Fund are recorded on the ex-dividend dates. The character and timing of dividends and distributions are determined in accordance with federal income tax regulations, which may differ from US GAAP.
Income Taxes: It is the Fund’s policy to comply with the requirements of the Internal Revenue Code of 1986, as amended, applicable to regulated investment companies, and to distribute substantially all of its taxable income to its shareholders. Therefore, no federal income tax provision is required.
The Fund files US federal and various state and local tax returns. No income tax returns are currently under examination. The statute of limitations on the Fund’s US federal tax returns remains open for each of the four years ended August 31, 2013. The statutes of limitations on the Fund’s state and local tax returns may remain open for an additional year depending upon the jurisdiction.
Management has analyzed tax laws and regulations and their application to the Fund’s facts and circumstances and does not believe there are any uncertain tax positions that require recognition of a tax liability.
Other: Expenses directly related to the Fund or its classes are charged to the Fund or class. Other operating expenses shared by several funds are pro rated among those funds on the basis of relative net assets or other appropriate methods. Expenses directly related to the Fund and other shared expenses pro rated to the Fund are allocated daily to each class based on its relative net assets or other appropriate methods.
3. Administration Agreement and Other Transactions with Affiliates:
The PNC Financial Services Group, Inc. is the largest stockholder and an affiliate, for 1940 Act purposes, of BlackRock Inc. (“BlackRock”).
The Fund entered into an Administration Agreement with the Administrator, an indirect, wholly owned subsidiary of BlackRock, to provide administrative services (other than investment advice and related portfolio activities). For such services, the Fund pays the Administrator a monthly fee at an annual rate of 0.25% of the average daily value of the Fund’s net assets. The Fund does not pay an investment advisory fee or investment management fee. The Administrator contractually agreed to waive the administration fees of the Fund and/or the investment advisory fees of the Master LLC, as necessary, to reduce the sum of the administration fee (as a percentage of the average daily net assets of the Fund) and the investment advisory fee (as a percentage of the daily net assets of the Master LLC) by 0.20%. The Administrator has agreed not to reduce or discontinue this contractual waiver or reimbursement prior to January 1, 2015 unless approved by the Board of Directors of the Fund (the “Board”), including a majority of the independent directors.
| | | | | | |
| 14 | | BLACKROCK FOCUS GROWTH FUND, INC. | | FEBRUARY 28, 2014 | | |
| | | | |
| Notes to Financial Statements (continued) | | | BlackRock Focus Growth Fund, Inc. | |
The Fund entered into a Distribution Agreement and a Distribution and Service Plan with BlackRock Investments, LLC (“BRIL”), an affiliate of the Administrator. Pursuant to the Distribution and Service Plan and in accordance with Rule 12b-1 under the 1940 Act, the Fund pays BRIL ongoing service and distribution fees. The fees are accrued daily and paid monthly at annual rates based upon the average daily net assets of the shares of the Fund as follows:
| | | | | | | | |
| | | Service
Fee | | | Distribution
Fee | |
Investor A | | | 0.25 | % | | | — | |
Investor C | | | 0.25 | % | | | 0.75 | % |
Pursuant to sub-agreements with BRIL, broker-dealers and BRIL provide shareholder servicing and distribution services to the Fund. The ongoing service and/or distribution fee compensates BRIL and each broker-dealer for providing shareholder servicing and/or distribution related services to Investor A and Investor C shareholders.
The Administrator maintains a call center, which is responsible for providing certain shareholder services to the Fund, such as responding to shareholder inquiries and processing transactions based upon instructions from shareholders with respect to the subscription and redemption of Fund shares. For the six months ended February 28, 2014, the Fund reimbursed the Administrator the following amounts for costs incurred in running the call center, which are included in transfer agent — class specific in the Statement of Operations:
| | | | |
Institutional | | $ | 75 | |
Investor A | | $ | 1,133 | |
Investor C | | $ | 610 | |
The Administrator contractually agreed to waive or reimburse fees or expenses in order to limit expenses, excluding interest expense, dividend expense, acquired fund fees and expenses and certain other fund expenses, which constitute extraordinary expenses not incurred in the ordinary course of the Fund’s business. The expense limitation as a percentage of daily net assets is as follows: 2.00% for Institutional, 2.25% for Investor A, and 3.00% for Investor C. The Administrator has agreed not to reduce or discontinue this contractual waiver or reimbursement prior to January 1, 2015 unless approved by the Board, including a majority of the independent directors.
For the six months ended February 28, 2014, affiliates earned underwriting discounts, direct commissions and dealer concessions on sales of the Fund’s Investor A Shares which totaled $2,922.
For the six months ended February 28, 2014, affiliates received CDSCs as follows:
| | | | |
Investor A | | $ | 1,432 | |
Investor C | | $ | 895 | |
Certain officers and/or directors of the Fund are officers and/or directors of BlackRock or its affiliates. The Fund reimburses the Administrator for a portion of the compensation paid to the Fund’s Chief Compliance Officer, which is included in officer in the Statement of Operations.
4. Capital Share Transactions:
Transactions in capital shares for each class were as follows:
| | | | | | | | | | | | | | | | |
| | | Six Months Ended
February 28, 2014 | | | Year Ended
August 31, 2013 | |
| | | Shares | | | Amount | | | Shares | | | Amount | |
Institutional | | | | | | | | | | | | | | | | |
Shares sold | | | 436,652 | | | $ | 1,469,483 | | | | 1,004,309 | | | $ | 3,025,793 | |
Shares issued in reinvestment of distributions | | | 638,167 | | | | 2,010,225 | | | | — | | | | — | |
Shares redeemed | | | (625,582 | ) | | | (2,146,131 | ) | | | (2,364,399 | ) | | | (7,284,794 | ) |
| | | | | | | | |
Net increase (decrease) | | | 449,237 | | | $ | 1,333,577 | | | | (1,360,090 | ) | | $ | (4,259,001 | ) |
| | | | | | | | |
| | | | | | | | | | | | | | | | |
Investor A | | | | | | | | | | | | | | | | |
Shares received from conversion* | | | — | | | | — | | | | 150,027 | | | $ | 454,581 | |
Shares sold and automatic conversion of shares | | | 1,322,847 | | | $ | 4,260,931 | | | | 1,806,613 | | | | 5,175,232 | |
Shares issued in reinvestment of distributions | | | 1,866,388 | | | | 5,580,456 | | | | — | | | | — | |
Shares redeemed | | | (1,502,356 | ) | | | (4,836,306 | ) | | | (4,295,187 | ) | | | (12,451,454 | ) |
| | | | | | | | |
Net increase (decrease) | | | 1,686,879 | | | $ | 5,005,081 | | | | (2,338,547 | ) | | $ | (6,821,641 | ) |
| | | | | | | | |
| | | | | | |
| | | BLACKROCK FOCUS GROWTH FUND, INC. | | FEBRUARY 28, 2014 | | 15 |
| | | | |
| Notes to Financial Statements (concluded) | | | BlackRock Focus Growth Fund, Inc. | |
| | | | | | | | | | | | | | | | |
| | | Six Months Ended
February 28, 2014 | | | Year Ended
August 31, 2013 | |
| | | Shares | | | Amount | | | Shares | | | Amount | |
Investor B | | | | | | | | | | | | | | | | |
Shares sold | | | — | | | | — | | | | 18,886 | | | $ | 46,433 | |
Shares converted* | | | — | | | | — | | | | (165,905 | ) | | | (454,581 | ) |
Shares redeemed and automatic conversion of shares | | | — | | | | — | | | | (150,885 | ) | | | (392,689 | ) |
| | | | | | | | |
Net decrease | | | — | | | | — | | | | (297,904 | ) | | $ | (800,837 | ) |
| | | | | | | | |
| | | | | | | | | | | | | | | | |
Investor C | | | | | | | | | | | | | | | | |
Shares sold | | | 695,611 | | | $ | 1,989,794 | | | | 771,490 | | | $ | 2,009,858 | |
Shares issued in reinvestment of distributions. | | | 1,510,387 | | | | 3,972,278 | | | | — | | | | — | |
Shares redeemed | | | (1,249,156 | ) | | | (3,565,758 | ) | | | (2,757,592 | ) | | | (7,245,278 | ) |
| | | | | | | | |
Net increase (decrease) | | | 956,842 | | | $ | 2,396,314 | | | | (1,986,102 | ) | | $ | (5,235,420 | ) |
| | | | | | | | |
Total Net Increase (Decrease) | | | 3,092,958 | | | $ | 8,734,972 | | | | (5,982,643 | ) | | $ | (17,116,899 | ) |
| | | | | | | | |
| | * | On June 10, 2013, Investor B Shares converted to Investor A Shares. |
5. Subsequent Events:
Management has evaluated the impact of all subsequent events on the Fund through the date the financial statements were issued and has determined that there were no subsequent events requiring adjustment or additional disclosure in the financial statements.
| | | | | | |
| 16 | | BLACKROCK FOCUS GROWTH FUND, INC. | | FEBRUARY 28, 2014 | | |
| | | | |
| Portfolio Information | | | Master Focus Growth LLC | |
| | |
| Ten Largest Holdings | | Percent of
Long-Term
Investments |
| | | | | |
Google, Inc., Class A | | | | 5 | % |
Union Pacific Corp. | | | | 5 | |
Amazon.com, Inc. | | | | 4 | |
Visa, Inc., Class A | | | | 4 | |
AbbVie, Inc. | | | | 4 | |
Precision Castparts Corp. | | | | 4 | |
Wynn Resorts Ltd. | | | | 4 | |
Yahoo!, Inc. | | | | 4 | |
Comcast Corp., Class A | | | | 4 | |
priceline.com, Inc. | | | | 4 | |
| | |
| Sector Allocation | | Percent of
Long-Term
Investments |
| | | | | |
Consumer Discretionary | | | | 29 | % |
Information Technology | | | | 28 | |
Health Care | | | | 19 | |
Industrials | | | | 13 | |
Telecommunication Services | | | | 3 | |
Materials | | | | 3 | |
Financials | | | | 3 | |
Energy | | | | 2 | |
| | | For Master LLC compliance purposes, the Master LLC’s sector classifications refer to any one or more of the sector sub-classifications used by one or more widely recognized market indexes or ratings group indexes, and/or as defined by the investment advisor. These definitions may not apply for purposes of this report, which may combine sector sub-classifications for reporting ease. |
| | | | | | |
| | | BLACKROCK FOCUS GROWTH FUND, INC. | | FEBRUARY 28, 2014 | | 17 |
| | | | |
| Schedule of Investments February 28, 2014 (Unaudited) | | | Master Focus Growth LLC | |
| | | (Percentages shown are based on Net Assets) | |
| | | | | | | | |
| Common Stocks | | Shares | | | Value | |
Aerospace & Defense — 4.0% | | | | | | | | |
Precision Castparts Corp. | | | 13,021 | | | $ | 3,357,855 | |
Airlines — 1.7% | | | | | | | | |
American Airlines Group, Inc. (a) | | | 37,757 | | | | 1,394,366 | |
Biotechnology — 8.9% | | | | | | | | |
Gilead Sciences, Inc. (a) | | | 30,416 | | | | 2,518,141 | |
Regeneron Pharmaceuticals, Inc. (a) | | | 6,976 | | | | 2,319,520 | |
United Therapeutics Corp. (a) | | | 24,805 | | | | 2,515,723 | |
| | | | | | | | |
| | | | | | | | 7,353,384 | |
Chemicals — 3.0% | | | | | | | | |
Eastman Chemical Co. | | | 15,302 | | | | 1,337,854 | |
Monsanto Co. | | | 10,622 | | | | 1,168,632 | |
| | | | | | | | |
| | | | | | | | 2,506,486 | |
Diversified Financial Services — 2.0% | | | | | | | | |
IntercontinentalExchange Group, Inc. | | | 7,962 | | | | 1,662,784 | |
Diversified Telecommunication Services — 2.3% | | | | | | | | |
Vivendi SA | | | 67,667 | | | | 1,929,569 | |
Electrical Equipment — 3.0% | | | | | | | | |
Eaton Corp. PLC | | | 21,254 | | | | 1,587,886 | |
SolarCity Corp. (a) | | | 10,718 | | | | 910,601 | |
| | | | | | | | |
| | | | | | | | 2,498,487 | |
Health Care Equipment & Supplies — 1.8% | | | | | | | | |
Intuitive Surgical, Inc. (a) | | | 3,278 | | | | 1,458,153 | |
Hotels, Restaurants & Leisure — 4.0% | | | | | | | | |
Wynn Resorts Ltd. | | | 13,829 | | | | 3,353,394 | |
Internet & Catalog Retail — 7.8% | | | | | | | | |
Amazon.com, Inc. (a) | | | 9,423 | | | | 3,412,068 | |
priceline.com, Inc. (a) | | | 2,252 | | | | 3,037,588 | |
| | | | | | | | |
| | | | | | | | 6,449,656 | |
Internet Software & Services — 17.8% | | | | | | | | |
AOL, Inc. (a) | | | 24,833 | | | | 1,087,189 | |
Google, Inc., Class A (a) | | | 3,269 | | | | 3,973,960 | |
LinkedIn Corp., Class A (a) | | | 8,707 | | | | 1,776,576 | |
SINA Corp. (a) | | | 17,358 | | | | 1,186,072 | |
Twitter, Inc. (a) | | | 11,235 | | | | 616,914 | |
Yahoo!, Inc. (a) | | | 83,861 | | | | 3,242,905 | |
Yandex NV, Class A (a) | | | 11,064 | | | | 414,900 | |
Yelp, Inc. (a) | | | 18,460 | | | | 1,742,993 | |
Youku Tudou, Inc. — ADR (a) | | | 22,453 | | | | 745,215 | |
| | | | | | | | |
| | | | | | | | 14,786,724 | |
IT Services — 4.1% | | | | | | | | |
Visa, Inc., Class A | | | 15,097 | | | | 3,411,016 | |
Media — 12.6% | | | | | | | | |
Comcast Corp., Class A | | | 62,616 | | | | 3,236,621 | |
Liberty Global PLC, Class A (a) | | | 23,783 | | | | 2,058,419 | |
Madison Square Garden Co., Class A (a) | | | 17,186 | | | | 979,774 | |
Time Warner, Inc. | | | 44,299 | | | | 2,973,792 | |
| | | | | | | | |
| Common Stocks | | Shares | | | Value | |
Media (concluded) | | | | | | | | |
Twenty-First Century Fox, Inc., Class A | | | 37,388 | | | $ | 1,253,994 | |
| | | | | | | | |
| | | | | | | | 10,502,600 | |
Oil, Gas & Consumable Fuels — 1.6% | | | | | | | | |
Laredo Petroleum, Inc. (a) | | | 50,576 | | | | 1,319,528 | |
Pharmaceuticals — 7.8% | | | | | | | | |
AbbVie, Inc. | | | 66,404 | | | | 3,380,628 | |
Allergan, Inc. | | | 7,312 | | | | 928,624 | |
Valeant Pharmaceuticals International, Inc. (a) | | | 14,946 | | | | 2,165,078 | |
| | | | | | | | |
| | | | | | | | 6,474,330 | |
Road & Rail — 4.5% | | | | | | | | |
Union Pacific Corp. | | | 20,813 | | | | 3,754,249 | |
Software — 6.9% | | | | | | | | |
Autodesk, Inc. (a) | | | 39,892 | | | | 2,092,734 | |
Palantir Technologies, Inc. (Acquired 2/07/14,
cost $598,061) (a)(b) | | | 97,563 | | | | 598,061 | |
Splunk, Inc. (a) | | | 14,867 | | | | 1,378,914 | |
VMware, Inc., Class A (a) | | | 16,954 | | | | 1,628,432 | |
| | | | | | | | |
| | | | | | | | 5,698,141 | |
Textiles, Apparel & Luxury Goods — 2.6% | | | | | | | | |
NIKE, Inc., Class B | | | 27,228 | | | | 2,131,952 | |
Wireless Telecommunication Services — 3.2% | | | | | | | | |
SoftBank Corp. | | | 35,100 | | | | 2,659,995 | |
Total Long-Term Investments (Cost — $63,368,196) — 99.6% | | | | 82,702,669 | |
| | | | | | | | |
| Short-Term Securities | | | | | | |
BlackRock Liquidity Funds, TempFund, Institutional Class, 0.03% (c)(d) | | | 1,192,919 | | | | 1,192,919 | |
Total Short-Term Securities (Cost — $1,192,919) — 1.4% | | | | 1,192,919 | |
Total Investments (Cost — $64,561,115*) — 101.0% | | | | | | | 83,895,588 | |
Liabilities in Excess of Other Assets — (1.0)% | | | | | | | (846,318 | ) |
| | | | | | | | |
Net Assets — 100.0% | | | | | | $ | 83,049,270 | |
| | | | | | | | |
ADR American Depositary Receipts
See Notes to Financial Statements.
| | | | | | |
| 18 | | BLACKROCK FOCUS GROWTH FUND, INC. | | FEBRUARY 28, 2014 | | |
| | | | |
| Schedule of Investments (continued) | | | Master Focus Growth LLC | |
|
| Notes to Schedule of Investments |
| * | As of February 28, 2014, gross unrealized appreciation and depreciation based on cost for federal income tax purposes were as follows: |
| | | | |
Tax cost | | $ | 64,568,161 | |
| | | | |
Gross unrealized appreciation | | $ | 19,478,851 | |
Gross unrealized depreciation | | | (151,424 | ) |
| | | | |
Net unrealized appreciation | | $ | 19,327,427 | |
| | | | |
| (a) | Non-income producing security. |
| (b) | Restricted security as to resale. As of report date the Fund held 0.7% of its net assets, with a current value of $598,061 and an original cost of $598,061, in this security. |
| (c) | Represents the current yield as of report date. |
| (d) | Investments in issuers considered to be an affiliate of the Master LLC during the six months ended February 28, 2014, for purposes of Section 2(a)(3) of the Investment Company Act of 1940, as amended, were as follows: |
| | | | | | | | | | | | | | | | |
| Affiliate | | Shares Held at
August 31, 2013 | | | Net Activity | | | Shares Held at
February 28, 2014 | | | Income | |
BlackRock Liquidity Funds, TempFund, Institutional Class | | | — | | | | 1,192,919 | | | | 1,192,919 | | | $ | 162 | |
| Ÿ | | Foreign currency exchange contracts outstanding as of February 28, 2014 were as follows: |
| | | | | | | | | | | | | | | | | | | | | | |
Currency Purchased | | | Currency
Sold | | | Counterparty | | Settlement
Date | | | Unrealized
Depreciation | |
| USD | | | 1,749,904 | | | | JPY | | | | 178,927,317 | | | Royal Bank of Scotland PLC | | | 5/28/14 | | | $ | (9,080 | ) |
| Ÿ | | For Master LLC compliance purposes, the Master LLC’s industry classifications refer to any one or more of the industry sub-classifications used by one or more widely recognized market indexes or ratings group indexes, and/or as defined by investment advisor. These definitions may not apply for purposes of this report, which may combine such industry sub-classifications for reporting ease. |
| Ÿ | | Fair Value Measurements — Various inputs are used in determining the fair value of investments and derivative financial instruments. These inputs to valuation techniques are categorized into a disclosure hierarchy consisting of three broad levels for financial statement purposes as follows: |
| | Ÿ | | Level 1 — unadjusted price quotations in active markets/exchanges for identical assets or liabilities that the Master LLC has the ability to access |
| | Ÿ | | Level 2 — other observable inputs (including, but not limited to, quoted prices for similar assets or liabilities in markets that are active, quoted prices for identical or similar assets or liabilities in markets that are not active, inputs other than quoted prices that are observable for the assets or liabilities (such as interest rates, yield curves, volatilities, prepayment speeds, loss severities, credit risks and default rates) or other market–corroborated inputs) |
| | Ÿ | | Level 3 — unobservable inputs based on the best information available in the circumstances, to the extent observable inputs are not available (including the Master LLC’s own assumptions used in determining the fair value of investments and derivative financial instruments) |
The hierarchy gives the highest priority to unadjusted quoted prices in active markets for identical assets or liabilities (Level 1 measurements) and the lowest priority to unobservable inputs (Level 3 measurements). Accordingly, the degree of judgment exercised in determining fair value is greatest for instruments categorized in Level 3. The inputs used to measure fair value may fall into different levels of the fair value hierarchy. In such cases, for disclosure purposes, the fair value hierarchy classification is determined based on the lowest level input that is significant to the fair value measurement in its entirety.
Changes in valuation techniques may result in transfers into or out of an assigned level within the disclosure hierarchy. In accordance with the Master LLC’s policy, transfers between different levels of the fair value disclosure hierarchy are deemed to have occurred as of the beginning of the reporting period. The categorization of a value determined for investments and derivative financial instruments is based on the pricing transparency of the investment and derivative financial instruments and is not necessarily an indication of the risks associated with investing in those securities. For information about the Master LLC’s policy regarding valuation of investments and derivative financial instruments, please refer to Note 2 of the Notes to Financial Statements.
See Notes to Financial Statements.
| | | | | | |
| | | BLACKROCK FOCUS GROWTH FUND, INC. | | FEBRUARY 28, 2014 | | 19 |
| | | | |
| Schedule of Investments (concluded) | | | Master Focus Growth LLC | |
The following tables summarize the Master LLC’s investments and derivative financial instruments categorized in the disclosure hierarchy as of February 28, 2014:
| | | | | | | | | | | | | | | | |
| | | Level 1 | | | Level 2 | | | Level 3 | | | Total | |
Assets: | | | | | | | | | | | | | | | | |
Investments: | | | | | | | | | | | | | | | | |
Common Stocks: | | | | | | | | | | | | | | | | |
Aerospace & Defense | | $ | 3,357,855 | | | | — | | | | — | | | $ | 3,357,855 | |
Airlines | | | 1,394,366 | | | | — | | | | — | | | | 1,394,366 | |
Biotechnology | | | 7,353,384 | | | | — | | | | — | | | | 7,353,384 | |
Chemicals | | | 2,506,486 | | | | — | | | | — | | | | 2,506,486 | |
Diversified Financial Services | | | 1,662,784 | | | | — | | | | — | | | | 1,662,784 | |
Diversified Telecommunication Services | | | — | | | $ | 1,929,569 | | | | — | | | | 1,929,569 | |
Electrical Equipment | | | 2,498,487 | | | | — | | | | — | | | | 2,498,487 | |
Health Care Equipment & Supplies | | | 1,458,153 | | | | — | | | | — | | | | 1,458,153 | |
Hotels, Restaurants & Leisure | | | 3,353,394 | | | | — | | | | — | | | | 3,353,394 | |
Internet & Catalog Retail | | | 6,449,656 | | | | — | | | | — | | | | 6,449,656 | |
Internet Software & Services | | | 14,786,724 | | | | — | | | | — | | | | 14,786,724 | |
IT Services | | | 3,411,016 | | | | — | | | | — | | | | 3,411,016 | |
Media | | | 10,502,600 | | | | — | | | | — | | | | 10,502,600 | |
Oil, Gas & Consumable Fuels | | | 1,319,528 | | | | — | | | | — | | | | 1,319,528 | |
Pharmaceuticals | | | 6,474,330 | | | | — | | | | — | | | | 6,474,330 | |
Road & Rail | | | 3,754,249 | | | | — | | | | — | | | | 3,754,249 | |
Software | | | 5,100,080 | | | | — | | | $ | 598,061 | | | | 5,698,141 | |
Textiles, Apparel & Luxury Goods | | | 2,131,952 | | | | — | | | | — | | | | 2,131,952 | |
Wireless Telecommunication Services | | | — | | | | 2,659,995 | | | | — | | | | 2,659,995 | |
Short-Term Securities | | | 1,192,919 | | | | — | | | | — | | | | 1,192,919 | |
Total | | $ | 78,707,963 | | | $ | 4,589,564 | | | $ | 598,061 | | | $ | 83,895,588 | |
| | | | |
| | | | | | | | | | | | | | | | |
| | | Level 1 | | | Level 2 | | | Level 3 | | | Total | |
Derivative Financial Instruments1 | | | | | | | | | | | | | | | | |
Liabilities: | | | | | | | | | | | | | | | | |
Foreign currency exchange contracts | | | — | | | $ | (9,080 | ) | | | — | | | $ | (9,080 | ) |
| 1 | Derivative financial instruments are foreign currency exchange contracts which are valued at the unrealized appreciation/depreciation on the instrument. |
The carrying amount for certain of the Master LLC’s liabilities approximates fair value for financial statement purposes. As of February 28, 2014, a bank overdraft of $17,286 is categorized as Level 2 within the disclosure hierarchy.
There were no transfers between levels during the six months ended February 28, 2014.
See Notes to Financial Statements.
| | | | | | |
| 20 | | BLACKROCK FOCUS GROWTH FUND, INC. | | FEBRUARY 28, 2014 | | |
| | | | |
| Statement of Assets and Liabilities | | | Master Focus Growth LLC | |
| | | | |
| February 28, 2014 (Unaudited) | | | |
| | | | |
| Assets | | | | |
Investments at value (cost — $63,368,196) | | $ | 82,702,669 | |
Investments at value — affiliated (cost — $1,192,919) | | | 1,192,919 | |
Dividends receivable — unaffiliated | | | 46,847 | |
Dividends receivable — affiliated | | | 61 | |
Prepaid expenses | | | 254 | |
| | | | |
Total assets | | | 83,942,750 | |
| | | | |
| | | | |
| Liabilities | | | | |
Bank overdraft | | | 17,286 | |
Investments purchased payable | | | 631,040 | |
Unrealized depreciation on foreign currency exchange contracts | | | 9,080 | |
Withdrawals payable to investors | | | 166,811 | |
Investment advisory fees payable | | | 26,031 | |
Directors’ fees payable | | | 4,028 | |
Other affiliates payable | | | 282 | |
Other accrued expenses payable | | | 38,922 | |
| | | | |
Total liabilities | | | 893,480 | |
| | | | |
Net Assets | | $ | 83,049,270 | |
| | | | |
| | | | |
| Net Assets Consist of | | | | |
Investors’ capital | | $ | 63,723,864 | |
Net unrealized appreciation/depreciation | | | 19,325,406 | |
| | | | |
Net Assets | | $ | 83,049,270 | |
| | | | |
See Notes to Financial Statements.
| | | | | | |
| | | BLACKROCK FOCUS GROWTH FUND, INC. | | FEBRUARY 28, 2014 | | 21 |
| | | | |
| Statement of Operations | | | Master Focus Growth LLC | |
| | | | |
| Six Months Ended February 28, 2014 (Unaudited) | | | |
| | | | |
| Investment Income | | | | |
Dividends — unaffiliated | | $ | 190,996 | |
Other income — affiliated | | | 381,578 | |
Dividends — affiliated | | | 162 | |
Foreign taxes withheld | | | (403 | ) |
| | | | |
Total income | | | 572,333 | |
| | | | |
| | | | |
| Expenses | | | | |
Investment advisory | | | 231,915 | |
Professional | | | 18,397 | |
Accounting services | | | 13,110 | |
Directors | | | 9,382 | |
Custodian | | | 9,205 | |
Miscellaneous | | | 7,070 | |
| | | | |
Total expenses | | | 289,079 | |
Less fees waived by Manager | | | (77,593 | ) |
| | | | |
Total expenses after fees waived | | | 211,486 | |
| | | | |
Net investment income | | | 360,847 | |
| | | | |
| | | | |
| Realized and Unrealized Gain (Loss) | | | | |
Net realized gain from: | | | | |
Investments | | | 5,930,721 | |
Foreign currency transactions | | | (34,019 | ) |
| | | | |
| | | 5,896,702 | |
| | | | |
Net change in unrealized appreciation/depreciation on: | | | | |
Investments | | | 11,499,096 | |
Foreign currency translations | | | (8,150 | ) |
| | | | |
| | | 11,490,946 | |
| | | | |
Total realized and unrealized gain | | | 17,387,648 | |
| | | | |
Net Increase in Net Assets Resulting from Operations | | $ | 17,748,495 | |
| | | | |
See Notes to Financial Statements.
| | | | | | |
| 22 | | BLACKROCK FOCUS GROWTH FUND, INC. | | FEBRUARY 28, 2014 | | |
| | | | |
| Statements of Changes in Net Assets | | | Master Focus Growth LLC | |
| | | | | | | | |
| Increase (Decrease) in Net Assets: | | Six Months
Ended
February 28,
2014
(Unaudited) | | | Year Ended
August 31,
2013 | |
| | | | | | | | |
| Operations | | | | | | | | |
Net investment income | | $ | 360,847 | | | $ | 484,599 | |
Net realized gain | | | 5,896,702 | | | | 13,544,824 | |
Net change in unrealized appreciation/depreciation | | | 11,490,946 | | | | (4,952,831 | ) |
| | | | |
Net increase in net assets resulting from operations | | | 17,748,495 | | | | 9,076,592 | |
| | | | |
| | | | | | | | |
| Capital Transactions | | | | | | | | |
Proceeds from contributions | | | 7,720,208 | | | | 10,710,350 | |
Value of withdrawals | | | (12,287,726 | ) | | | (28,733,466 | ) |
| | | | |
Net decrease in net assets derived from capital transactions | | | (4,567,518 | ) | | | (18,023,116 | ) |
| | | | |
| | | | | | | | |
| Net Assets | | | | | | | | |
Total increase (decrease) in net assets | | | 13,180,977 | | | | (8,946,524 | ) |
Beginning of period | | | 69,868,293 | | | | 78,814,817 | |
| | | | |
End of period | | $ | 83,049,270 | | | $ | 69,868,293 | |
| | | | |
| | | | |
| Financial Highlights | | | Master Focus Growth LLC | |
| | | | | | | | | | | | | | | | | | | | | | | | |
| | | Six Months Ended February 28, 2014 (Unaudited) | | | | | | | | | | | | | | | | |
| | | | | | | | | | | | | | | | | |
| | | | | | | | | | | | | | | | | |
| | | | Year Ended August 31, | |
| | | | 2013 | | | 2012 | | | 2011 | | | 2010 | | | 2009 | |
| | | | | | | | | | | | | | | | | | | | | | | | |
| Total Investment Return | | | | | | | | | | | | | | | | | | | | | | | | |
Total investment return | | | 26.13 | %1,2 | | | 12.45 | % | | | 9.80 | %3 | | | 24.90 | %3 | | | 9.45 | %3 | | | (15.36 | )%3 |
| | | | |
| | | | | | | | | | | | | | | | | | | | | | | | |
| Ratios to Average Net Assets | | | | | | | | | | | | | | | | | | | | | | | | |
Total expenses | | | 0.75 | %4 | | | 0.76 | % | | | 0.76 | % | | | 0.68 | % | | | 0.86 | % | | | 1.01 | % |
| | | | |
Total expenses after fees waived | | | 0.55 | %4 | | | 0.56 | % | | | 0.56 | % | | | 0.48 | % | | | 0.66 | % | | | 0.81 | % |
| | | | |
Net investment income | | | 0.93 | %4 | | | 0.65 | % | | | 0.38 | % | | | 0.44 | %5 | | | 1.12 | %5 | | | 0.15 | % |
| | | | |
| | | | | | | | | | | | | | | | | | | | | | | | |
| Supplemental Data | | | | | | | | | | | | | | | | | | | | | | | | |
Net assets, end of period (000) | | $ | 83,049 | | | $ | 69,868 | | | $ | 78,815 | | | $ | 108,508 | | | $ | 51,525 | | | $ | 49,782 | |
| | | | |
Portfolio turnover | | | 58 | % | | | 178 | % | | | 78 | % | | | 97 | % | | | 86 | % | | | 185 | % |
| | | | |
| | 1 | Includes a payment from an affiliate to compensate for foregone securities lending revenue which impacted the Master LLC’s total return. Not including this payment, the Master LLC’s total return would have been 25.39%. |
| | 2 | Aggregate total investment return. |
| | 3 | Includes proceeds received from a settlement of litigation, which impacted the Master LLC’s total return. Not including these proceeds, the Master LLC’s total return would have been 8.66% for the year ended August 31, 2012, 23.49% for the year ended August 31, 2011, 6.90% for the year ended August 31, 2010 and (27.33)% for the year ended August 31, 2009. |
| | 5 | Includes interest on the proceeds received from a settlement of litigation, which impacted the Master LLC’s ratio of net investment income (loss) to average net assets. Not including this interest, the Master LLC’s ratio of net investment income (loss) to average net assets would have been 0.34% for the year ended August 31, 2011 and 0.29% for the year ended August 31, 2010. |
See Notes to Financial Statements.
| | | | | | |
| | | BLACKROCK FOCUS GROWTH FUND, INC. | | FEBRUARY 28, 2014 | | 23 |
| | | | |
| Notes to Financial Statements (Unaudited) | | | Master Focus Growth LLC | |
1. Organization:
Master Focus Growth LLC (the “Master LLC”) is registered under the Investment Company Act of 1940, as amended (the “1940 Act”), as a non-diversified, open-end management investment company. The Master LLC is organized as a Delaware limited liability company. The Limited Liability Company Agreement of the Master LLC permits the Board of Directors of the Master LLC (the “Board”) to issue non-transferable interests in the Master LLC, subject to certain limitations.
2. Significant Accounting Policies:
The Master LLC’s financial statements are prepared in conformity with accounting principles generally accepted in the United States of America (“US GAAP”), which may require management to make estimates and assumptions that affect the reported amounts of assets and liabilities in the financial statements and the reported amounts of increases and decreases in net assets from operations during the reporting period. Actual results could differ from those estimates. The following is a summary of significant accounting policies followed by the Master LLC:
Valuation: US GAAP defines fair value as the price the Master LLC would receive to sell an asset or pay to transfer a liability in an orderly transaction between market participants at the measurement date. The Master LLC determines the fair values of its financial instruments at market value using independent dealers or pricing services under policies approved by the Board. The BlackRock Global Valuation Methodologies Committee (the “Global Valuation Committee”) is the committee formed by management to develop global pricing policies and procedures and to provide oversight of the pricing function for the Master LLC for all financial instruments.
Equity investments traded on a recognized securities exchange or the NASDAQ Stock Market (“NASDAQ”) are valued at the last reported sale price that day or the NASDAQ official closing price, if applicable. For equity investments traded on more than one exchange, the last reported sale price on the exchange where the stock is primarily traded is used. Equity investments traded on a recognized exchange for which there were no sales on that day are valued at the last available bid (long positions) or ask (short positions) price. Investments in open-end registered investment companies are valued at NAV each business day.
Securities and other assets and liabilities denominated in foreign currencies are translated into US dollars using exchange rates determined as of the close of business on the New York Stock Exchange (“NYSE”). Foreign currency exchange contracts are valued at the mean between the bid and ask prices and are determined as of the close of business on the NYSE. Interpolated values are derived when the settlement date of the contract is an interim date for which quotations are not available.
In the event that the application of these methods of valuation results in a price for an investment that is deemed not to be representative of the market value of such investment, or if a price is not available, the investment will be valued by the Global Valuation Committee, or its delegate,
in accordance with a policy approved by the Board as reflecting fair value (“Fair Value Assets”). When determining the price for Fair Value Assets, the Global Valuation Committee, or its delegate, seeks to determine the price that the Master LLC might reasonably expect to receive from the current sale of that asset in an arm’s-length transaction. Fair value determinations shall be based upon all available factors that the Global Valuation Committee, or its delegate, deems relevant consistent with the principles of fair value measurement, which include the market approach, income approach and/or in the case of recent investments, the cost approach, as appropriate. The market approach generally consists of using comparable market transactions. The income approach generally is used to discount future cash flows to present value and is adjusted for liquidity as appropriate. These factors include but are not limited to: (i) attributes specific to the investment or asset; (ii) the principal market for the investment or asset; (iii) the customary participants in the principal market for the investment or asset; (iv) data assumptions by market participants for the investment or asset, if reasonably available; (v) quoted prices for similar investments or assets in active markets; and (vi) other factors, such as future cash flows, interest rates, yield curves, volatilities, prepayment speeds, loss severities, credit risks, recovery rates, liquidation amounts and/or default rates. Due to the inherent uncertainty of valuations of such investments, the fair values may differ from the values that would have been used had an active market existed. The Global Valuation Committee, or its delegate, employs various methods for calibrating valuation approaches for investments where an active market does not exist, including regular due diligence of the Master LLC’s pricing vendors, regular reviews of key inputs and assumptions, transactional back-testing or disposition analysis to compare unrealized gains and losses to realized gains and losses, reviews of missing or stale prices and large movements in market values and reviews of any market related activity. The pricing of all Fair Value Assets is subsequently reported to the Board or a committee thereof on a quarterly basis.
Generally, trading in foreign instruments is substantially completed each day at various times prior to the close of business on the NYSE. Occasionally, events affecting the values of such instruments may occur between the foreign market close and the close of business on the NYSE that may not be reflected in the computation of the Fund’s net assets. If events (e.g., a company announcement, market volatility or a natural disaster) occur during such periods that are expected to materially affect the value of such instruments, those instruments may be Fair Value Assets and valued at their fair value, as determined in good faith by the Global Valuation Committee, or its delegate, using a pricing service and/or policies approved by the Board. Each business day, the Fund uses a pricing service to assist with the valuation of certain foreign exchange-traded equity securities and foreign exchange-traded and over-the-counter (“OTC”) options (the “Systematic Fair Value Price”). Using current market factors, the Systematic Fair Value Price is designed to value such foreign securities and foreign options at fair value as of the close of business on the NYSE, which follows the close of the local markets.
| | | | | | |
| 24 | | BLACKROCK FOCUS GROWTH FUND, INC. | | FEBRUARY 28, 2014 | | |
| | | | |
| Notes to Financial Statements (continued) | | | Master Focus Growth LLC | |
Foreign Currency: The Master LLC’s books and records are maintained in US dollars. Purchases and sales of investment securities are recorded at the rates of exchange prevailing on the respective date of such transactions. Generally, when the US dollar rises in value against a foreign currency, the Master LLC’s investments denominated in that currency will lose value because that currency is worth fewer US dollars; the opposite effect occurs if the US dollar falls in relative value.
The Master LLC does not isolate the portion of the results of operations arising as a result of changes in the foreign exchange rates from the changes in the market prices of investments held or sold for financial reporting purposes. Accordingly, the effects of changes in foreign currency exchange rates on investments are not segregated in the Statement of Operations from the effects of changes in market prices of those investments but are included as a component of net realized and unrealized gain (loss) from investments. The Master LLC reports realized currency gains (losses) on foreign currency related transactions as components of net realized gain (loss) for financial reporting purposes, whereas such components may be treated as ordinary income for federal income tax purposes.
Segregation and Collateralization: In cases where the Master LLC enters into certain investments (e.g., foreign currency exchange contracts) that would be “senior securities” for 1940 Act purposes, the Master LLC may segregate or designate on its books and records cash or liquid securities having a market value at least equal to the amount of the Master LLC’s future obligations under such investments. Doing so allows the investment to be excluded from treatment as a “senior security.” Furthermore, if required by an exchange or counterparty agreement, the Master LLC may be required to deliver/deposit cash and/or securities to/with an exchange, or broker-dealer or custodian as collateral for certain investments or obligations.
Investment Transactions and Investment Income: For financial reporting purposes, investment transactions are recorded on the dates the transactions are entered into (the trade dates). Realized gains and losses on investment transactions are determined on the identified cost basis. Dividend income is recorded on the ex-dividend dates. Dividends from foreign securities where the ex-dividend date may have passed are subsequently recorded when the Master LLC is informed of the ex-dividend date. Under the applicable foreign tax laws, a withholding tax at various rates may be imposed on capital gains, dividends and interest.
Income Taxes: The Master LLC is disregarded as an entity separate from its owner for tax purposes. As such, the owner of the Master LLC is treated as the owner of the net assets, income, expenses and realized and unrealized gains and losses of the Master LLC. Therefore, no federal income tax provision is required. It is intended that the Master LLC’s assets will be managed so the owner of the Master LLC can satisfy the requirements of Subchapter M of the Internal Revenue Code of 1986, as amended.
Other: Expenses directly related to the Master LLC are charged to the Master LLC. Other operating expenses shared by several funds are pro rated among those funds on the basis of relative net assets or other appropriate methods.
The Master LLC has an arrangement with the custodian whereby fees may be reduced by credits earned on uninvested cash balances, which, if applicable, are shown as fees paid indirectly in the Statement of Operations. The custodian imposes fees on overdrawn cash balances, which can be offset by accumulated credits earned or may result in additional custody charges.
3. Derivative Financial Instruments:
The Master LLC engages in various portfolio investment strategies using derivative contracts both to increase the returns of the Master LLC and/or to economically hedge its exposure to certain risks such as foreign currency exchange rate risk. These contracts may be transacted on an exchange or OTC.
Foreign Currency Exchange Contracts: The Master LLC enters into foreign currency exchange contracts as an economic hedge against either specific transactions or portfolio instruments or to obtain exposure to, or hedge exposure away from, foreign currencies (foreign currency exchange rate risk). A foreign currency exchange contract is an agreement between two parties to buy and sell a currency at a set exchange rate on a future date. Foreign currency exchange contracts, when used by the Master LLC, help to manage the overall exposure to the currencies in which some of the investments held by the Master LLC are denominated. The contract is marked-to-market daily and the change in market value is recorded by the Master LLC as an unrealized gain or loss. When the contract is closed, the Master LLC records a realized gain or loss equal to the difference between the value at the time it was opened and the value at the time it was closed. The use of foreign currency exchange contracts involves the risk that the value of a foreign currency exchange contract changes unfavorably due to movements in the value of the referenced foreign currencies.
The following is a summary of the Master LLC’s derivative financial instruments categorized by risk exposure:
| | | | | | |
| Fair Value of Derivative Financial Instruments as of February 28, 2014 | |
| | | Derivative Liabilities | |
| | | Statement of Assets and Liabilities Location | | Value | |
Foreign currency exchange contracts | | Unrealized depreciation on foreign currency exchange contracts | | $ | 9,080 | |
| | | | | | |
| | | BLACKROCK FOCUS GROWTH FUND, INC. | | FEBRUARY 28, 2014 | | 25 |
| | | | |
| Notes to Financial Statements (continued) | | | Master Focus Growth LLC | |
| | | | |
The Effect of Derivative Financial Instruments in the Statement of Operations
Six Months Ended February 28, 2014 | |
| Net Realized Loss From | | | |
Foreign currency exchange contracts: | | | | |
Foreign currency transactions | | $ | (40,206 | ) |
| | | | |
| Net Change in Unrealized Appreciation/Depreciation on | | | |
Foreign currency exchange contracts: | | | | |
Foreign currency translations | | $ | (9,073 | ) |
For the six months ended February 28, 2014, the average quarterly
balances of outstanding derivative financial instruments were as follows: | |
Foreign currency exchange contracts: | | | | |
Average number of contracts - US dollars purchased | | | 1 | |
Average number of contracts - US dollars sold | | | 16 | 1 |
Average US dollar amounts purchased | | $ | 1,598,060 | |
Average US dollar amounts sold | | $ | 8,663,041 | 1 |
| | 1 | Actual contract amounts for the period are shown due to limited outstanding derivative financial instruments as of each quarter end. |
Counterparty Credit Risk: A derivative contract may suffer a mark-to-market loss if the value of the contract decreases due to an unfavorable change in the market rates or values of the underlying instrument. Losses can also occur if the counterparty does not perform under the contract.
The Master LLC’s risk of loss from counterparty credit risk on OTC derivatives is generally limited to the aggregate unrealized gain netted against any collateral held by the Master LLC.
In order to better define its contractual rights and to secure rights that will help the Master LLC mitigate its counterparty risk, the Master LLC may enter into an International Swaps and Derivatives Association, Inc. Master Agreement (“ISDA Master Agreement”) or similar agreement with its derivative contract counterparties. An ISDA Master Agreement is a bilateral agreement between the Master LLC and a counterparty that governs certain OTC derivatives and typically contains, among other things, collateral posting terms and netting provisions in the event of a default and/or termination event. Under an ISDA Master Agreement, the Master LLC may, under certain circumstances, offset with the counterparty certain derivative financial instruments’ payables and/or receivables with collateral held and/or posted and create one single net
payment. The provisions of the ISDA Master Agreement typically permit a single net payment in the event of default including the bankruptcy or insolvency of the counterparty. However, bankruptcy or insolvency laws of a particular jurisdiction may impose restrictions on or prohibitions against the right of offset in bankruptcy, insolvency or other events. In addition, certain ISDA Master Agreements allow counterparties to OTC derivatives to terminate derivative contracts prior to maturity in the event the Master LLC’s net assets decline by a stated percentage or the Master LLC fails to meet the terms of its ISDA Master Agreements, which would cause the Master LLC to accelerate payment of any net liability owed to the counterparty.
Collateral Requirements: For derivatives traded under an ISDA Master Agreement, the collateral requirements are typically calculated by netting the mark-to-market amount for each transaction under such agreement and comparing that amount to the value of any collateral currently pledged by the Master LLC and the counterparty.
Cash collateral that has been pledged to cover obligations of the Master LLC and cash collateral received from the counterparty, if any, is reported separately on the Statement of Assets and Liabilities as cash pledged as collateral and cash received as collateral, respectively. Non-cash collateral pledged by the Master LLC, if any, is noted in the Schedule of Investments. Generally, the amount of collateral due from or to a party has to exceed a minimum transfer amount threshold (e.g. $500,000) before a transfer is required, which is determined at the close of business of the Master LLC and any additional required collateral is delivered to/pledged by the Master LLC on the next business day. Typically, the Master LLC and counterparties are not permitted to sell, re-pledge or use the collateral they receive. To the extent amounts due to the Master LLC from its counterparties are not fully collateralized, contractually or otherwise, the Master LLC bears the risk of loss from counterparty non-performance. The Master LLC attempts to mitigate counterparty risk by entering into agreements only with counterparties that it believes have the financial resources to honor their obligations and by monitoring the financial stability of those counterparties.
For financial reporting purposes, the Master LLC does not offset derivative assets and derivative liabilities that are subject to netting arrangements, if any, in the Statement of Assets and Liabilities.
| | | | | | | | |
| At February 28, 2014, the Master LLC’s derivative assets and liabilities (by type) are as follows: | | | | | | |
| | | Assets | | | Liabilities | |
Derivatives Financial Instruments: | | | | | | | | |
Foreign currency exchange contracts | | | — | | | $ | 9,080 | |
| | | | |
Total derivative assets and liabilities in the Statement of Assets and Liabilities | | | — | | | | 9,080 | |
| | | | |
Derivatives not subject to a master netting agreement or similar agreement (“MNA”) | | | — | | | | — | |
| | | | |
Total derivative assets and liabilities subject to an MNA | | | — | | | $ | 9,080 | |
| | | | |
| | | | | | |
| 26 | | BLACKROCK FOCUS GROWTH FUND, INC. | | FEBRUARY 28, 2014 | | |
| | | | |
| Notes to Financial Statements (continued) | | | Master Focus Growth LLC | |
The following table presents the Master LLC’s derivative liabilities by counterparty net of amounts available for offset under an MNA and net of the related collateral pledged by the Master LLC as of February 28, 2014:
| | | | | | | | | | | | | | | | | | | | |
| Counterparty | | Derivative Liabilities
Subject to an MNA
by Counterparty | | | Derivatives
Available for Offset | | | Non-cash Collateral
Pledged | | | Cash Collateral
Pledged | | | Net Amount of
Derivative
Liabilities1 | |
Royal Bank of Scotland PLC | | $ | 9,080 | | | | — | | | | — | | | | — | | | $ | 9,080 | |
| | | | |
| | 1 | Net amount represents the net amount payable due to the counterparty in the event of default. |
4. Investment Advisory Agreement and Other Transactions with Affiliates:
The PNC Financial Services Group, Inc. is the largest stockholder and an affiliate, for 1940 Act purposes, of BlackRock.
The Master LLC entered into an Investment Advisory Agreement with BlackRock Advisors, LLC (the “Manager”), the Master LLC’s investment advisor, an indirect, wholly owned subsidiary of BlackRock, to provide investment advisory and administration services. The Manager is responsible for the management of the Master LLC’s portfolio and provides the necessary personnel, facilities, equipment and certain other services necessary to the operations of the Master LLC. For such services, the Master LLC pays the Manager a monthly fee based on a percentage of the Master LLC’s average daily net assets at the following annual rates:
| | |
| Average Daily Net Assets | | Investment
Advisory Fee |
First $1 Billion | | 0.60% |
$1 Billion - $3 Billion | | 0.56% |
$3 Billion - $5 Billion | | 0.54% |
$5 Billion - $10 Billion | | 0.52% |
Greater than $10 Billion | | 0.51% |
The Manager voluntarily agreed to waive its investment advisory fees by the amount of investment advisory fees the Master LLC pays to the Manager indirectly through its investment in affiliated money market funds. However, the Manager does not waive its investment advisory fees by the amount of investment advisory fees paid in connection with the Master LLC’s investment in other affiliated investment companies, if any. This amount is included in fees waived by Manager in the Statement of Operations. For the six months ended February 28, 2014, the amount waived was $288.
The Manager entered into a sub-advisory agreement with BIM, an affiliate of the Manager. The Manager pays BIM, for services it provides, a monthly fee that is a percentage of the investment advisory fees paid by the Master LLC to the Manager.
For the six months ended February 28, 2014, the Master LLC reimbursed the Manager $370 for certain accounting services, which is included in accounting services in the Statement of Operations.
The Manager contractually agreed to waive the administration fees of BlackRock Focus Growth Fund, Inc. (“Focus Growth”) and/or the investment advisory fees of the Master LLC, as necessary to reduce the sum of the administration fee (as a percentage of the average daily net assets of Focus Growth) and investment advisory fee (as a percentage of the
average daily net assets of the Master LLC) by 0.20%. The Manager has agreed not to reduce or discontinue this contractual waiver or reimbursement prior to January 1, 2015 unless approved by the Board, including a majority of the independent directors. For the six months ended February 28, 2014, the Master LLC waived $77,305, which is included in fees waived by Manager in the Statement of Operations.
The Manager contractually agreed to waive or reimburse fees or expenses of Focus Growth and/or the Master LLC in order to limit expenses, excluding interest expense, dividend expense, acquired fund fees and expenses and certain other fund expenses, which constitute extraordinary expenses not incurred in the ordinary course of the Fund’s business. The expense limitation as a percentage of daily net assets is as follows: 2.00% for Institutional, 2.25% for Investor A, and 3.00% for Investor C. The Administrator has agreed not to reduce or discontinue this contractual waiver or reimbursement prior to January 1, 2015 unless approved by the Board, including a majority of the independent directors. For the six months ended February 28, 2014, the Master LLC had no fees waived or reimbursed to limit the expenses of Focus Growth.
The Master LLC recorded a payment from an affiliate to compensate for foregone securities lending revenue in the amount of $381,578, which is shown as Other income — affiliated in the Statement of Operations.
Certain officers and/or directors of the Master LLC are officers and/or directors of BlackRock or its affiliates.
5. Purchases and Sales:
Purchases and sales of investments, excluding short-term securities, for the six months ended February 28, 2014, were $44,595,965 and $49,353,012, respectively.
6. Bank Borrowings:
The Master LLC, along with certain other funds managed by the Manager and its affiliates (“Participating Funds”), is a party to a 364-day, $800 million credit agreement with a group of lenders, under which the Master LLC may borrow to fund shareholder redemptions. The agreement expires in April 2014. Excluding commitments designated for a certain individual fund, other Participating Funds, including the Master LLC, can borrow up to an aggregate commitment amount of $500 million, subject to asset coverage and other limitations as specified in the agreement. The credit agreement has the following terms: a fee of 0.065% per annum on unused commitment amounts and interest at a rate equal to the higher of (a) the one-month LIBOR plus 0.80% per annum or (b) the
| | | | | | |
| | | BLACKROCK FOCUS GROWTH FUND, INC. | | FEBRUARY 28, 2014 | | 27 |
| | | | |
| Notes to Financial Statements (concluded) | | | Master Focus Growth LLC | |
Fed Funds rate plus 0.80% per annum on amounts borrowed. Participating Funds paid administration and arrangement fees, which, along with commitment fees, were allocated among such funds based upon portions of the aggregate commitment available to them and relative net assets of Participating Funds. The Master LLC did not borrow under the credit agreement during the six months ended February 28, 2014.
7. Concentration, Market and Credit Risk:
In the normal course of business, the Master LLC invests in securities and enters into transactions where risks exist due to fluctuations in the market (market risk) or failure of the issuer of a security to meet all its obligations (issuer credit risk). The value of securities held by the Master LLC may decline in response to certain events, including those directly involving the issuers whose securities are owned by the Master LLC; conditions affecting the general economy; overall market changes; local, regional or global political, social or economic instability; and currency and interest rate and price fluctuations. Similar to issuer credit risk, the Master LLC may be exposed to counterparty credit risk, or the risk that an entity with which the Master LLC has unsettled or open transactions may fail to or be unable to perform on its commitments. The Master LLC manages counterparty credit risk by entering into transactions only with counterparties that it believes have the financial resources to honor their
obligations and by monitoring the financial stability of those counterparties. Financial assets, which potentially expose the Master LLC to market, issuer and counterparty credit risks, consist principally of financial instruments and receivables due from counterparties. The extent of the Master LLC’s exposure to market, issuer and counterparty credit risks with respect to these financial assets is generally approximated by their value recorded in the Statement of Assets and Liabilities, less any collateral held by the Master LLC.
As of February 28, 2014, the Master LLC invested a significant portion of its assets in securities in the consumer discretionary and information technology sectors. Changes in economic conditions affecting the consumer discretionary and information technology sectors would have a greater impact on the Master LLC and could affect the value, income and/or liquidity of positions in such securities.
8. Subsequent Events:
Management has evaluated the impact of all subsequent events on the Master LLC through the date the financial statements were issued and has determined that there were no subsequent events requiring adjustment or additional disclosure in the financial statements.
| | | | | | |
| 28 | | BLACKROCK FOCUS GROWTH FUND, INC. | | FEBRUARY 28, 2014 | | |
Robert M. Hernandez, Chairman of the Board and Director
Fred G. Weiss, Vice Chairman of the Board and Director
Paul L. Audet, Director
James H. Bodurtha, Director
Bruce R. Bond, Director
Donald W. Burton, Director
Honorable Stuart E. Eizenstat, Director
Laurence D. Fink, Director
Kenneth A. Froot, Director
Henry Gabbay, Director
John F. O’Brien, Director
Roberta Cooper Ramo, Director
David H. Walsh, Director
John M. Perlowski, President and Chief Executive Officer
Brendan Kyne, Vice President
Neal Andrews, Chief Financial Officer
Jay Fife, Treasurer
Brian Kindelan, Chief Compliance Officer and Anti-Money Laundering Officer
Benjamin Archibald, Secretary
Investment Advisor and Administrator
BlackRock Advisors, LLC
Wilmington, DE 19809
Sub-Advisor
BlackRock Investment Management, LLC
Princeton, NJ 08540
Accounting Agent and Transfer Agent
BNY Mellon Investment Servicing (US) Inc.
Wilmington, DE 19809
Custodian
The Bank of New York Mellon
New York, NY 10286
Distributor
BlackRock Investments, LLC
New York, NY 10022
Legal Counsel
Willkie Farr & Gallagher LLP
New York, NY 10019
Independent Registered Public Accounting Firm
Deloitte & Touche LLP
Philadelphia, PA 19103
Address of the Fund
100 Bellevue Parkway
Wilmington, DE 19809
| | | | | | |
| | | BLACKROCK FOCUS GROWTH FUND, INC. | | FEBRUARY 28, 2014 | | 29 |
Electronic Delivery
Electronic copies of most financial reports and prospectuses are available on the Fund’s website or shareholders can sign up for e-mail notifications of quarterly statements, annual and semi-annual reports and prospectuses by enrolling in the Fund’s electronic delivery program.
To enroll:
Shareholders Who Hold Accounts with Investment Advisors, Banks or Brokerages:
Please contact your financial advisor. Please note that not all investment advisors, banks or brokerages may offer this service.
Shareholders Who Hold Accounts Directly with BlackRock:
| 1) | Access the BlackRock website at |
| | http://www.blackrock.com/ edelivery |
| 2) | Select “eDelivery” under the “More Information” section |
Householding
The Fund will mail only one copy of shareholder documents, including prospectuses, annual and semi-annual reports and proxy statements, to shareholders with multiple accounts at the same address. This practice is commonly called “householding” and is intended to reduce expenses and eliminate duplicate mailings of shareholder documents. Mailings of your shareholder documents may be householded indefinitely unless you instruct us otherwise. If you do not want the mailing of these documents to be combined with those for other members of your household, please contact the Fund at (800) 441-7762.
Availability of Quarterly Schedule of Investments
The Fund/Master LLC files its complete schedule of portfolio holdings with the SEC for the first and third quarters of each fiscal year on Form N-Q. The Fund’s/Master LLC’s Forms N-Q are available on the SEC’s website at http://www.sec.gov and may also be reviewed and copied at the SEC’s Public Reference Room in Washington, D.C. Information on how to access documents on the SEC’s website without charge may be obtained by calling (800) SEC-0330. The Fund’s/Master LLC’s Forms N-Q may also be obtained upon request and without charge by calling (800) 441-7762.
Availability of Proxy Voting Policies and Procedures
A description of the policies and procedures that the Fund/Master LLC use to determine how to vote proxies relating to portfolio securities is available (1) without charge, upon request, by calling (800) 441-7762; (2) at http://www.blackrock.com; and (3) on the SEC’s website at http://www.sec.gov.
Availability of Proxy Voting Record
Information about how the Fund/Master LLC voted proxies relating to securities held in the Fund’s/Master LLC’s portfolios during the most recent 12-month period ended June 30 is available, upon request and without charge (1) at http://www.blackrock.com or by calling (800) 441-7762 and (2) on the SEC’s website at http://www.sec.gov.
Account Information
Call us at (800) 441-7762 from 8:00 AM to 6:00 PM EST on any business day to get information about your account balances, recent transactions and share prices. You can also reach us on the Web at http:// www.blackrock.com/funds.
Automatic Investment Plans
Investor Class shareholders who want to invest regularly can arrange to have $50 or more automatically deducted from their checking or savings account and invested in any of the BlackRock funds.
Systematic Withdrawal Plans
Investor Class shareholders can establish a systematic withdrawal plan and receive periodic payments of $50 or more from their BlackRock portfolios, as long as their account balance is at least $10,000.
Retirement Plans
Shareholders may make investments in conjunction with Traditional, Rollover, Roth, Coverdell, Simple IRAs, SEP IRAs and 403(b) Plans.
| | | | | | |
| 30 | | BLACKROCK FOCUS GROWTH FUND, INC. | | FEBRUARY 28, 2014 | | |
| | |
| Additional Information (concluded) | | |
|
| BlackRock Privacy Principles |
BlackRock is committed to maintaining the privacy of its current and former fund investors and individual clients (collectively, “Clients”) and to safeguarding their non-public personal information. The following information is provided to help you understand what personal information BlackRock collects, how we protect that information and why in certain cases we share such information with select parties.
If you are located in a jurisdiction where specific laws, rules or regulations require BlackRock to provide you with additional or different privacy-related rights beyond what is set forth below, then BlackRock will comply with those specific laws, rules or regulations.
BlackRock obtains or verifies personal non-public information from and about you from different sources, including the following: (i) information we receive from you or, if applicable, your financial intermediary, on applications, forms or other documents; (ii) information about your transactions with us, our affiliates, or others; (iii) information we receive from a consumer reporting agency; and (iv) from visits to our websites.
BlackRock does not sell or disclose to non-affiliated third parties any non-public personal information about its Clients, except as permitted by law or as is necessary to respond to regulatory requests or to service Client accounts. These non-affiliated third parties are required to protect the confidentiality and security of this information and to use it only for its intended purpose.
We may share information with our affiliates to service your account or to provide you with information about other BlackRock products or services that may be of interest to you. In addition, BlackRock restricts access to non-public personal information about its Clients to those BlackRock employees with a legitimate business need for the information. BlackRock maintains physical, electronic and procedural safeguards that are designed to protect the non-public personal information of its Clients, including procedures relating to the proper storage and disposal of such information.
| | | | | | |
| | | BLACKROCK FOCUS GROWTH FUND, INC. | | FEBRUARY 28, 2014 | | 31 |
| | |
| A World-Class Mutual Fund Family | | |
BlackRock offers a diverse lineup of open-end mutual funds crossing all investment styles and managed by experts in equity, fixed income and tax-exempt investing.
| | | | |
| BlackRock ACWI ex-US Index Fund | | BlackRock Global Dividend Portfolio | | BlackRock Mid-Cap Value Opportunities Fund |
| BlackRock All-Cap Energy & Resources Portfolio | | BlackRock Global Long/Short Equity Fund | | BlackRock Natural Resources Trust |
| BlackRock Basic Value Fund | | BlackRock Global Opportunities Portfolio | | BlackRock Pacific Fund |
| BlackRock Capital Appreciation Fund | | BlackRock Global SmallCap Fund | | BlackRock Real Estate Securities Fund |
| BlackRock Commodity Strategies Fund | | BlackRock Health Sciences Opportunities Portfolio | | BlackRock Russell 1000® Index Fund |
| BlackRock Disciplined Small Cap Core Fund | | BlackRock International Fund | | BlackRock Science & Technology |
| BlackRock Emerging Markets Dividend Fund | | BlackRock International Index Fund | | Opportunities Portfolio |
| BlackRock Emerging Markets Fund | | BlackRock International Opportunities Portfolio | | BlackRock Small Cap Growth Equity Portfolio |
| BlackRock Emerging Markets Long/Short | | BlackRock Large Cap Core Fund | | BlackRock Small Cap Growth Fund II |
| Equity Fund | | BlackRock Large Cap Core Plus Fund | | BlackRock Small Cap Index Fund |
| BlackRock Energy & Resources Portfolio | | BlackRock Large Cap Growth Fund | | BlackRock S&P 500 Stock Fund |
| BlackRock Equity Dividend Fund | | BlackRock Large Cap Value Fund | | BlackRock U.S. Opportunities Portfolio |
| BlackRock EuroFund | | BlackRock Latin America Fund | | BlackRock Value Opportunities Fund |
| BlackRock Flexible Equity Fund | | BlackRock Long-Horizon Equity Fund | | |
| BlackRock Focus Growth Fund | | BlackRock Mid-Cap Growth Equity Portfolio | | |
|
| Taxable Fixed Income Funds |
| | | | |
| BlackRock Bond Index Fund | | BlackRock Emerging Markets Flexible Dynamic | | BlackRock Short Obligations Fund |
| BlackRock Core Bond Portfolio | | Bond Portfolio | | BlackRock Short-Term Treasury Fund |
| BlackRock CoreAlpha Bond Fund | | BlackRock Floating Rate Income Portfolio | | BlackRock Strategic Income |
| BlackRock CoRI Funds | | BlackRock Global Long/Short Credit Fund | | Opportunities Portfolio |
| 2015 | | BlackRock GNMA Portfolio | | BlackRock Total Return Fund |
| 2017 | | BlackRock High Yield Bond Portfolio | | BlackRock U.S. Government Bond Portfolio |
| 2019 | | BlackRock Inflation Protected Bond Portfolio | | BlackRock U.S. Mortgage Portfolio |
| 2021 | | BlackRock Investment Grade Bond Portfolio | | BlackRock Ultra-Short Obligations Fund |
| 2023 | | BlackRock Low Duration Bond Portfolio | | BlackRock World Income Fund |
| | BlackRock Secured Credit Portfolio | | |
|
| Municipal Fixed Income Funds |
| | | | |
| BlackRock California Municipal Bond Fund | | BlackRock New Jersey Municipal Bond Fund | | BlackRock Short-Term Municipal Fund |
| BlackRock High Yield Municipal Fund | | BlackRock New York Municipal Bond Fund | | BlackRock Strategic Municipal |
| BlackRock National Municipal Fund | | BlackRock Pennsylvania Municipal Bond Fund | | Opportunities Fund |
| | | | | | | | | | | | | | |
| BlackRock Balanced Capital Fund | | LifePath Active Portfolios | | LifePath Index Portfolios |
| BlackRock Emerging Market Allocation Portfolio | | 2015 | | | 2040 | | | | | Retirement | | 2040 | | |
| BlackRock Global Allocation Fund | | 2020 | | | 2045 | | | | | 2020 | | 2045 | | |
| BlackRock Managed Volatility Portfolio | | 2025 | | | 2050 | | | | | 2025 | | 2050 | | |
| BlackRock Multi-Asset Income Portfolio | | 2030 | | | 2055 | | | | | 2030 | | 2055 | | |
| BlackRock Multi-Asset Real Return Fund | | 2035 | | | | | | | | 2035 | | | | |
| BlackRock Strategic Risk Allocation Fund | | | | | | | | | | | | | | |
| | | | | | |
BlackRock Prepared Portfolios | | LifePath Portfolios | | | | | | | | | | | | |
Conservative Prepared Portfolio | | Retirement | | | 2040 | | | | | | | | | |
Moderate Prepared Portfolio | | 2020 | | | 2045 | | | | | | | | | |
Growth Prepared Portfolio | | 2025 | | | 2050 | | | | | | | | | |
Aggressive Growth Prepared Portfolio | | 2030 | | | 2055 | | | | | | | | | |
| | 2035 | | | | | | | | | | | | |
BlackRock mutual funds are currently distributed by BlackRock Investments, LLC. You should consider the investment objectives, risks, charges and expenses of the funds under consideration carefully before investing. Each fund’s prospectus contains this and other information and is available at www.blackrock.com or by calling (800) 441-7762 or from your financial advisor. The prospectus should be read carefully before investing.
| | | | | | |
| 32 | | BLACKROCK FOCUS GROWTH FUND, INC. | | FEBRUARY 28, 2014 | | |
| | |
| This report is transmitted to shareholders only. It is not authorized for use as an offer of sale or a solicitation of an offer to buy shares of the Fund unless accompanied or preceded by the Fund’s current prospectus. Past performance results shown in this report should not be considered a representation of future performance. Investment returns and principal value of shares will fluctuate so that shares, when redeemed, may be worth more or less than their original cost. Statements and other information herein are as dated and are subject to change. | |  |
| | |
| FG-2/14-SAR | |  |
| | |
| |
| Item 2 – | | Code of Ethics – Not Applicable to this semi-annual report |
| |
| Item 3 – | | Audit Committee Financial Expert – Not Applicable to this semi-annual report |
| |
| Item 4 – | | Principal Accountant Fees and Services – Not Applicable to this semi-annual report |
| |
| Item 5 – | | Audit Committee of Listed Registrants – Not Applicable |
| |
| Item 6 – | | Investments |
| | (a) The registrants’ Schedules of Investments are included as part of the Report to Stockholders filed under Item 1 of this Form. |
| | (b) Not Applicable due to no such divestments during the semi-annual period covered since the previous Form N-CSR filing. |
| |
| Item 7 – | | Disclosure of Proxy Voting Policies and Procedures for Closed-End Management Investment Companies – Not Applicable |
| |
| Item 8 – | | Portfolio Managers of Closed-End Management Investment Companies – Not Applicable |
| |
| Item 9 – | | Purchases of Equity Securities by Closed-End Management Investment Company and Affiliated Purchasers – Not Applicable |
| |
| Item 10 – | | Submission of Matters to a Vote of Security Holders – There have been no material changes to these procedures. |
| |
| Item 11 – | | Controls and Procedures |
| |
| | (a) – The registrants’ principal executive and principal financial officers, or persons performing similar functions, have concluded that the registrants’ disclosure controls and procedures (as defined in Rule 30a-3(c) under the Investment Company Act of 1940, as amended (the “1940 Act”)) are effective as of a date within 90 days of the filing of this report based on the evaluation of these controls and procedures required by Rule 30a-3(b) under the 1940 Act and Rule 15d-15(b) under the Securities Exchange Act of 1934, as amended. |
| |
| | (b) – There were no changes in the registrants’ internal control over financial reporting (as defined in Rule 30a-3(d) under the 1940 Act) that occurred during the second fiscal quarter of the period covered by this report that have materially affected, or are reasonably likely to materially affect, the registrants’ internal control over financial reporting. |
| |
| Item 12 – | | Exhibits attached hereto |
| |
| | (a)(1) – Code of Ethics – Not Applicable to this semi-annual report |
| |
| | (a)(2) – Certifications – Attached hereto |
| |
| | (a)(3) – Not Applicable |
| |
| | (b) – Certifications – Attached hereto |
2
Pursuant to the requirements of the Securities Exchange Act of 1934 and the Investment Company Act of 1940, each registrant has duly caused this report to be signed on its behalf by the undersigned, thereunto duly authorized.
BlackRock Focus Growth Fund, Inc. and Master Focus Growth LLC
| | |
| By: | | /s/ John M. Perlowski |
| | John M. Perlowski |
| | Chief Executive Officer (principal executive officer) of |
| | BlackRock Focus Growth Fund, Inc. and Master Focus Growth LLC |
| |
| Date: | | May 1, 2014 |
Pursuant to the requirements of the Securities Exchange Act of 1934 and the Investment Company Act of 1940, this report has been signed below by the following persons on behalf of each registrant and in the capacities and on the dates indicated.
| | |
| By: | | /s/ John M. Perlowski |
| | John M. Perlowski |
| | Chief Executive Officer (principal executive officer) of |
| | BlackRock Focus Growth Fund, Inc. and Master Focus Growth LLC |
| |
| Date: | | May 1, 2014 |
| |
| By: | | /s/ Neal J. Andrews |
| | Neal J. Andrews |
| | Chief Financial Officer (principal financial officer) of |
| | BlackRock Focus Growth Fund, Inc. and Master Focus Growth LLC |
| |
| Date: | | May 1, 2014 |
3