UNITED STATES
SECURITIES AND EXCHANGE COMMISSION
Washington, D.C. 20549
FORM N-CSR
CERTIFIED SHAREHOLDER REPORT OF REGISTERED MANAGEMENT
INVESTMENT COMPANIES
Investment Company Act file number: 811-09651
| Name of Fund: | BlackRock Large Cap Focus Growth Fund, Inc. |
| Fund Address: | 100 Bellevue Parkway, Wilmington, DE 19809 |
Name and address of agent for service: John M. Perlowski, Chief Executive Officer, BlackRock Large Cap Focus Growth Fund, Inc., 50 Hudson Yards, New York, NY 10001
Registrant’s telephone number, including area code: (800) 441-7762
Date of fiscal year end: 05/31/2023
Date of reporting period: 05/31/2023
Item 1 – Report to Stockholders
(a) The Report to Shareholders is attached herewith.
| MAY 31, 2023 |

| 2023 Annual Report
| |
BlackRock Large Cap Focus Growth Fund, Inc.
| Not FDIC Insured • May Lose Value • No Bank Guarantee |
Dear Shareholder,
Investors faced an uncertain economic landscape during the 12-month reporting period ended May 31, 2023, amid mixed indicators and rapidly changing market conditions. The U.S. economy returned to modest growth beginning in the third quarter of 2022, although the pace of growth slowed thereafter. Inflation was elevated, reaching a 40-year high as labor costs grew rapidly and unemployment rates reached the lowest levels in decades. However, inflation moderated as the period continued, while continued strength in consumer spending backstopped the economy.
Equity returns varied substantially, as large-capitalization U.S. stocks gained for the period amid a rebound in big tech stocks, whereas small-capitalization U.S. stocks declined. International equities from developed markets advanced, while emerging market stocks declined substantially, pressured by higher interest rates and falling commodities prices.
The 10-year U.S. Treasury yield rose during the reporting period, driving its price down, as investors reacted to elevated inflation and attempted to anticipate future interest rate changes. The corporate bond market also faced inflationary headwinds, although high-yield corporate bond prices fared better than investment-grade bonds as demand from yield-seeking investors remained strong.
The U.S. Federal Reserve (the “Fed”), acknowledging that inflation has been more persistent than expected, raised interest rates eight times. Furthermore, the Fed wound down its bond-buying programs and incrementally reduced its balance sheet by not replacing securities that reach maturity. In addition, the Fed added liquidity to markets amid the failure of prominent regional banks.
Restricted labor supply kept inflation elevated even as other inflation drivers, such as goods prices and energy costs, moderated. While economic growth was modest in the last year, we believe that stickiness in services inflation and continued wage growth will keep inflation above central bank targets for some time. Although the Fed has decelerated the pace of interest rate hikes and most recently opted for a pause, we believe that the Fed is likely to keep rates high for an extended period to get inflation under control. With this in mind, we believe the possibility of a U.S. recession in the near term is high, but the dimming economic outlook has not yet been fully reflected in current market prices. We believe investors should expect a period of higher volatility as markets adjust to the new economic reality and policymakers attempt to adapt. Resolution of the debt ceiling standoff late in the period eliminated one source of uncertainty, but the relatively modest spending cuts won’t move the needle on the government’s substantial debt burden.
While we favor an overweight to equities in the long term, we prefer an underweight stance on equities overall in the near term. Expectations for corporate earnings remain elevated, which seems inconsistent with the possibility of a recession. Nevertheless, we are overweight on emerging market stocks as we believe a weakening U.S. dollar could provide a supportive backdrop. While we are neutral on credit overall amid tightening credit and financial conditions, there are selective opportunities in the near term. For fixed income investing with a six- to twelve-month horizon, we see the most attractive investments in short-term U.S. Treasuries, global inflation-linked bonds, and emerging market bonds denominated in local currency.
Overall, our view is that investors need to think globally, position themselves to be prepared for a decarbonizing economy, and be nimble as market conditions change. We encourage you to talk with your financial advisor and visit blackrock.com for further insight about investing in today’s markets.
Sincerely,

Rob Kapito
President, BlackRock Advisors, LLC

Rob Kapito
President, BlackRock Advisors, LLC
| Total Returns as of May 31, 2023 | ||||
| 6-Month | 12-Month | |||
U.S. large cap equities | 3.33% | 2.92% | ||
U.S. small cap equities | (6.53) | (4.68) | ||
International equities | 6.89 | 3.06 | ||
Emerging market equities | (0.37) | (8.49) | ||
3-month Treasury bills | 2.16 | 3.16 | ||
U.S. Treasury securities | 1.78 | (3.65) | ||
U.S. investment grade bonds (Bloomberg U.S. Aggregate Bond Index) | 2.00 | (2.14) | ||
Tax-exempt municipal bonds (Bloomberg Municipal Bond Index) | 1.94 | 0.49 | ||
U.S. high yield bonds (Bloomberg U.S. Corporate High Yield 2% Issuer Capped Index) | 3.01 | 0.05 | ||
Past performance is not an indication of future results. Index performance is shown for illustrative purposes only. You cannot invest directly in an index. | ||||
| 2 | T H I S P A G E I S N O T P A R T O F Y O U R F U N D R E P O R T |
| Page | ||||
| 2 | ||||
Annual Report: | ||||
| 4 | ||||
| 7 | ||||
| 7 | ||||
Financial Statements: | ||||
| 8 | ||||
| 11 | ||||
| 13 | ||||
| 14 | ||||
| 15 | ||||
| 19 | ||||
| 27 | ||||
| 28 | ||||
| 29 | ||||
| 32 | ||||
| 37 | ||||
| 39 | ||||

| 3 |
| Fund Summary as of May 31, 2023 | BlackRock Large Cap Focus Growth Fund, Inc. |
Investment Objective
BlackRock Large Cap Focus Growth Fund, Inc.’s (the “Fund”) investment objective is long-term capital appreciation.
Portfolio Management Commentary
How did the Fund perform?
For the 12-month period ending May 31, 2023, all of the Fund’s share classes underperformed its benchmark, the Russell 1000® Growth Index.
What factors influenced performance?
The largest contributors to the Fund’s relative performance were security selection in the consumer discretionary and industrials sectors, along with positioning in consumer staples. In consumer discretionary, overweight positioning in the hotels, restaurants and leisure sub-sector contributed to performance, most notably positions in Chipotle Mexican Grill, Inc. and Evolution AB. An overweight to Copart, Inc. led positive contributions within industrials. Lastly, an absence of exposure to the consumer staples sector proved additive.
The largest detractors from the Fund’s performance relative to the benchmark were stock selection in the communication services, information technology and energy sectors. Within communication services, overweight positioning in interactive media and services, specifically Match Group, Inc., detracted the most from performance. Within information technology, an underweight position in Apple, Inc. detracted the most from performance. Lastly, within energy, overweight positions in Cheniere Energy, Inc. and Pioneer Natural Resources Company within the oil, gas and consumable fuels sub-sector detracted from relative performance.
Describe recent portfolio activity.
During the period, exposure to information technology increased with allocation to the technology hardware, storage and peripherals industry. Exposure to the healthcare sector increased as well. Conversely, exposure to consumer discretionary decreased the most due to decreased allocation to textiles, apparel and luxury goods. Exposure to the communication services sector decreased as well. The Fund’s cash position slightly decreased as well over the period.
Describe portfolio positioning at period end.
As of period end, the Fund’s largest overweight position relative to the Russell 1000® Growth Index was in the financials sector, followed by consumer discretionary and healthcare. Conversely, the consumer staples sector was the largest underweight, followed by industrials and real estate.
The views expressed reflect the opinions of BlackRock as of the date of this report and are subject to change based on changes in market, economic or other conditions. These views are not intended to be a forecast of future events and are no guarantee of future results.
| 4 | 2 0 2 3 B L A C K R O C K A N N U A L R E P O R T T O S H A R E H O L D E R S |
| Fund Summary as of May 31, 2023 (continued) | BlackRock Large Cap Focus Growth Fund, Inc. |
GROWTH OF $10,000 INVESTMENT
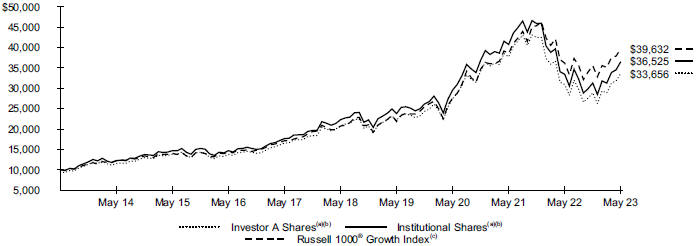
| (a) | Assuming maximum sales charges, if any, transaction costs and other operating expenses, including investment advisory fees and administration fees, if any. Institutional Shares do not have a sales charge. |
| (b) | The Fund is an aggressive growth fund that invests primarily in common stock of not less than 25 to not more than 45 companies that Fund management believes have strong earnings and revenue growth and capital appreciation potential (also known as “aggressive growth companies”). Under normal circumstances, the Fund seeks to invest at least 80% of its net assets plus the amount of any borrowings for investment purposes in large cap equity securities and derivatives that have similar economic characteristics to such securities. |
| (c) | An index that measures the performance of the large-cap growth segment of the U.S. equity universe. It includes those Russell 1000® companies with higher price-to-book ratios and higher forecasted growth values. |
Performance
| Average Annual Total Returns(a) | ||||||||||||||||||||||||||||||||
| 1 Year | 5 Years | 10 Years | ||||||||||||||||||||||||||||||
| Without Sales Charge | With Sales Charge | Without Sales Charge | With Sales Charge | Without Sales Charge | With Sales Charge | |||||||||||||||||||||||||||
Institutional | 9.31 | % | N/A | 10.39 | % | N/A | 13.83 | % | N/A | |||||||||||||||||||||||
Investor A | 8.95 | 3.23 | % | 10.09 | 8.90 | % | 13.51 | 12.90 | % | |||||||||||||||||||||||
Investor C | 8.15 | 7.15 | 9.28 | 9.28 | 12.86 | 12.86 | ||||||||||||||||||||||||||
Class K | 9.29 | N/A | 10.43 | N/A | 13.85 | N/A | ||||||||||||||||||||||||||
Russell 1000® Growth Index | 9.55 | N/A | 13.84 | N/A | 14.76 | N/A | ||||||||||||||||||||||||||
| (a) | Assuming maximum sales charges, if any. Average annual total returns with and without sales charges reflect reductions for distribution and service fees. See “About Fund Performance” for a detailed description of share classes, including any related sales charges and fees, and how performance was calculated for certain share classes. |
N/A - Not applicable as share class and index do not have a sales charge.
Past performance is not an indication of future results.
Performance results may include adjustments made for financial reporting purposes in accordance with U.S. generally accepted accounting principles.
Expense Example
| Actual | Hypothetical 5% Return | |||||||||||||||||||||||||||||||
| | Beginning Account Value (12/01/22) | | | Ending Account Value (05/31/23) | | | Expenses Paid During the Period( | a) | | Beginning Account Value (12/01/22) | | | Ending Account Value (05/31/23) | | | Expenses Paid During the Period( | a) | | Annualized Expense Ratio | | ||||||||||||
Institutional | $ | 1,000.00 | $ | 1,167.50 | $ | 3.62 | $ | 1,000.00 | $ | 1,021.59 | $ | 3.38 | 0.67 | % | ||||||||||||||||||
Investor A | 1,000.00 | 1,167.60 | 4.97 | 1,000.00 | 1,020.34 | 4.63 | 0.92 | |||||||||||||||||||||||||
Investor C | 1,000.00 | 1,163.10 | 9.01 | 1,000.00 | 1,016.60 | 8.40 | 1.67 | |||||||||||||||||||||||||
Class K | 1,000.00 | 1,167.20 | 3.35 | 1,000.00 | 1,021.84 | 3.13 | 0.62 | |||||||||||||||||||||||||
| (a) | For each class of the Fund, expenses are equal to the annualized expense ratio for the class, multiplied by the average account value over the period, multiplied by 182/365 (to reflect the one-half year period shown). |
See “Disclosure of Expenses” for further information on how expenses were calculated.
F U N D S U M M A R Y | 5 |
| Fund Summary as of May 31, 2023 (continued) | BlackRock Large Cap Focus Growth Fund, Inc. |
Portfolio Information
TEN LARGEST HOLDINGS
Security(a) | Percent of Net Assets | |||
Microsoft Corp. | 10.1 | % | ||
Apple Inc. | 9.5 | |||
Amazon.com, Inc. | 7.9 | |||
Alphabet, Inc., Class A | 5.6 | |||
NVIDIA Corp. | 5.6 | |||
Visa, Inc., Class A | 4.6 | |||
ASML Holding NV, Registered Shares | 4.4 | |||
Intuit, Inc. | 4.3 | |||
Cadence Design Systems, Inc. | 3.5 | |||
Copart, Inc. | 3.4 | |||
SECTOR ALLOCATION
| Sector(b) | Percent of Net Assets | |||
Information Technology | 42.9 | % | ||
Consumer Discretionary | 17.0 | |||
Health Care | 14.0 | |||
Financials | 10.1 | |||
Communication Services | 8.9 | |||
Industrials | 6.1 | |||
Energy | 1.1 | |||
Short-Term Securities | 0.8 | |||
Liabilities in Excess of Other Assets | (0.9 | ) | ||
| (a) | Excludes short-term securities. |
| (b) | For Fund compliance purposes, the Fund’s sector classifications refer to one or more of the sector sub-classifications used by one or more widely recognized market indexes or ratings group indexes, and/or as defined by the investment adviser. These definitions may not apply for purposes of this report, which may combine such sector sub-classifications for reporting ease. |
| 6 | 2 0 2 3 B L A C K R O C K A N N U A L R E P O R T T O S H A R E H O L D E R S |
Institutional and Class K Shares are not subject to any sales charge. These shares bear no ongoing distribution or service fees and are available only to certain eligible investors. Class K Shares performance shown prior to the Class K Shares inception date of November 25, 2019 is that of Institutional Shares. The performance of the Fund’s Class K Shares would be substantially similar to Institutional Shares because Class K Shares and Institutional Shares invest in the same portfolio of securities and performance would only differ to the extent that Class K Shares and Institutional Shares have different expenses. The actual returns of Class K Shares would have been higher than those of the Institutional Shares because Class K Shares have lower expenses than the Institutional Shares.
Investor A Shares are subject to a maximum initial sales charge (front-end load) of 5.25% and a service fee of 0.25% per year (but no distribution fee). Certain redemptions of these shares may be subject to a contingent deferred sales charge (“CDSC”) where no initial sales charge was paid at the time of purchase. These shares are generally available through financial intermediaries.
Investor C Shares are subject to a 1.00% CDSC if redeemed within one year of purchase. In addition, these shares are subject to a distribution fee of 0.75% per year and a service fee of 0.25% per year. These shares are generally available through financial intermediaries. These shares automatically convert to Investor A Shares after approximately eight years.
Past performance is not an indication of future results. Financial markets have experienced extreme volatility and trading in many instruments has been disrupted. These circumstances may continue for an extended period of time and may continue to affect adversely the value and liquidity of the Fund’s investments. As a result, current performance may be lower or higher than the performance data quoted. Refer to blackrock.com to obtain performance data current to the most recent month-end. Performance results do not reflect the deduction of taxes that a shareholder would pay on Fund distributions or the redemption of Fund shares. Figures shown in the performance table assume reinvestment of all distributions, if any, at net asset value (“NAV”) on the ex-dividend date or payable date, as applicable. Investment return and principal value of shares will fluctuate so that shares, when redeemed, may be worth more or less than their original cost. Distributions paid to each class of shares will vary because of the different levels of service, distribution and transfer agency fees applicable to each class, which are deducted from the income available to be paid to shareholders.
BlackRock Advisors, LLC (the “Manager”), the Fund’s investment adviser, has contractually and/or voluntarily agreed to waive and/or reimburse a portion of the Fund’s expenses. Without such waiver(s) and/or reimbursement(s), the Fund’s performance would have been lower. With respect to the Fund’s voluntary waiver(s), if any, the Manager is under no obligation to waive and/or reimburse or to continue waiving and/or reimbursing its fees and such voluntary waiver(s) may be reduced or discontinued at any time. With respect to the Fund’s contractual waiver(s), if any, the Manager is under no obligation to continue waiving and/or reimbursing its fees after the applicable termination date of such agreement. See the Notes to Financial Statements for additional information on waivers and/or reimbursements.
Shareholders of the Fund may incur the following charges: (a) transactional expenses, such as sales charges; and (b) operating expenses, including investment advisory fees, administration fees, service and distribution fees, including 12b-1 fees, acquired fund fees and expenses, and other fund expenses. The expense example shown (which is based on a hypothetical investment of $1,000 invested at the beginning of the period and held through the end of the period) is intended to assist shareholders both in calculating expenses based on an investment in the Fund and in comparing these expenses with similar costs of investing in other mutual funds.
The expense example provides information about actual account values and actual expenses. Annualized expense ratios reflect contractual and voluntary fee waivers, if any. In order to estimate the expenses a shareholder paid during the period covered by this report, shareholders can divide their account value by $1,000 and then multiply the result by the number corresponding to their share class under the heading entitled “Expenses Paid During the Period.”
The expense example also provides information about hypothetical account values and hypothetical expenses based on the Fund’s actual expense ratio and an assumed rate of return of 5% per year before expenses. In order to assist shareholders in comparing the ongoing expenses of investing in the Fund and other funds, compare the 5% hypothetical example with the 5% hypothetical examples that appear in shareholder reports of other funds.
The expenses shown in the expense example are intended to highlight shareholders’ ongoing costs only and do not reflect transactional expenses, such as sales charges, if any. Therefore, the hypothetical example is useful in comparing ongoing expenses only and will not help shareholders determine the relative total expenses of owning different funds. If these transactional expenses were included, shareholder expenses would have been higher.
A B O U T F U N D P E R F O R M A N C E / D I S C L O S U R E O F E X P E N S E S | 7 |
May 31, 2023 | BlackRock Large Cap Focus Growth Fund, Inc. (Percentages shown are based on Net Assets) |
| Security | Shares | Value | ||||||
| ||||||||
Common Stocks | ||||||||
Aerospace & Defense — 2.8% | ||||||||
TransDigm Group, Inc. | 46,862 | $ | 36,254,786 | |||||
|
| |||||||
| Automobiles — 2.8% | ||||||||
Tesla, Inc.(a) | 178,654 | 36,432,910 | ||||||
|
| |||||||
| Broadline Retail — 7.9% | ||||||||
Amazon.com, Inc.(a) | 860,180 | 103,720,504 | ||||||
|
| |||||||
| Capital Markets — 4.5% | ||||||||
Blackstone, Inc., Class A, NVS | 172,315 | 14,757,057 | ||||||
S&P Global, Inc. | 118,775 | 43,641,498 | ||||||
|
| |||||||
| 58,398,555 | ||||||||
| Commercial Services & Supplies — 3.4% | ||||||||
Copart, Inc.(a) | 503,310 | 44,084,923 | ||||||
|
| |||||||
| Entertainment — 0.5% | ||||||||
Netflix, Inc.(a) | 16,556 | 6,543,428 | ||||||
|
| |||||||
| Financial Services — 5.6% | ||||||||
Mastercard, Inc., Class A | 34,629 | 12,640,278 | ||||||
Visa, Inc., Class A | 274,638 | 60,703,237 | ||||||
|
| |||||||
| 73,343,515 | ||||||||
| Health Care Equipment & Supplies — 4.5% | ||||||||
Boston Scientific Corp.(a) | 355,881 | 18,320,754 | ||||||
Intuitive Surgical, Inc.(a) | 131,500 | 40,480,960 | ||||||
|
| |||||||
| 58,801,714 | ||||||||
| Health Care Providers & Services — 2.9% | ||||||||
UnitedHealth Group, Inc. | 78,872 | 38,429,593 | ||||||
|
| |||||||
| Hotels, Restaurants & Leisure — 3.9% | ||||||||
Chipotle Mexican Grill, Inc.(a) | 12,139 | 25,206,512 | ||||||
Evolution AB(b) | 192,805 | 25,451,912 | ||||||
|
| |||||||
| 50,658,424 | ||||||||
| Interactive Media & Services — 6.8% | ||||||||
Alphabet, Inc., Class A(a) | 593,622 | 72,938,335 | ||||||
Match Group, Inc.(a) | 458,178 | 15,807,141 | ||||||
|
| |||||||
| 88,745,476 | ||||||||
| Life Sciences Tools & Services — 3.4% | ||||||||
Danaher Corp. | 137,242 | 31,513,508 | ||||||
Lonza Group AG, Registered Shares | 20,618 | 12,931,730 | ||||||
|
| |||||||
| 44,445,238 | ||||||||
| Oil, Gas & Consumable Fuels — 1.1% | ||||||||
Cheniere Energy, Inc. | 100,671 | 14,070,786 | ||||||
|
| |||||||
| Pharmaceuticals — 3.1% | ||||||||
Eli Lilly & Co. | 60,312 | 25,901,592 | ||||||
Zoetis, Inc., Class A | 94,941 | 15,476,332 | ||||||
|
| |||||||
| 41,377,924 | ||||||||
| Semiconductors & Semiconductor Equipment — 11.0% | ||||||||
ASML Holding NV, Registered Shares | 80,259 | 58,021,639 | ||||||
Broadcom, Inc. | 15,715 | 12,697,091 | ||||||
NVIDIA Corp. | 192,309 | 72,758,187 | ||||||
|
| |||||||
| 143,476,917 | ||||||||
| Security | Shares | Value | ||||||
| ||||||||
| Software — 22.5% | ||||||||
Cadence Design Systems, Inc.(a) | 197,705 | $ | 45,652,062 | |||||
Intuit, Inc. | 134,458 | 56,354,037 | ||||||
Microsoft Corp. | 401,401 | 131,816,074 | ||||||
Roper Technologies, Inc. | 54,109 | 24,577,390 | ||||||
ServiceNow, Inc.(a) | 66,978 | 36,488,275 | ||||||
|
| |||||||
| 294,887,838 | ||||||||
| Technology Hardware, Storage & Peripherals — 9.4% | ||||||||
Apple Inc. | 698,250 | 123,764,812 | ||||||
|
| |||||||
| Textiles, Apparel & Luxury Goods — 2.4% | ||||||||
LVMH Moet Hennessy Louis Vuitton SE | 24,162 | 21,125,518 | ||||||
NIKE, Inc., Class B | 104,238 | 10,972,092 | ||||||
|
| |||||||
| 32,097,610 | ||||||||
|
| |||||||
| Total Common Stocks — 98.5% (Cost: $765,098,972) | 1,289,534,953 | |||||||
|
| |||||||
Preferred Securities | ||||||||
Preferred Stocks — 1.6% | ||||||||
| IT Services — 1.6% | ||||||||
Bytedance Ltd., Series E-1 (Acquired 11/11/20, cost $13,153,942)(a)(c)(d) | 120,046 | 20,830,298 | ||||||
|
| |||||||
| Total Long-Term Investments — 100.1% (Cost: $778,252,914) | 1,310,365,251 | |||||||
|
| |||||||
Short-Term Securities | ||||||||
| Money Market Funds — 0.8% | ||||||||
BlackRock Liquidity Funds, T-Fund, Institutional Class, 5.00%(e)(f) | 9,919,349 | 9,919,349 | ||||||
|
| |||||||
Total Short-Term Securities — 0.8% | 9,919,349 | |||||||
|
| |||||||
Total Investments — 100.9% | 1,320,284,600 | |||||||
Liabilities in Excess of Other Assets — (0.9)% |
| (11,571,501 | ) | |||||
|
| |||||||
Net Assets — 100.0% | $ | 1,308,713,099 | ||||||
|
| |||||||
| (a) | Non-income producing security. |
| (b) | Security exempt from registration pursuant to Rule 144A under the Securities Act of 1933, as amended. These securities may be resold in transactions exempt from registration to qualified institutional investors. |
| (c) | Security is valued using significant unobservable inputs and is classified as Level 3 in the fair value hierarchy. |
| (d) | Restricted security as to resale, excluding 144A securities. The Fund held restricted securities with a current value of $20,830,298, representing 1.6% of its net assets as of period end, and an original cost of $13,153,942. |
| (e) | Affiliate of the Fund. |
| (f) | Annualized 7-day yield as of period end. |
| 8 | 2 0 2 3 B L A C K R O C K A N N U A L R E P O R T T O S H A R E H O L D E R S |
Schedule of Investments (continued) May 31, 2023 | BlackRock Large Cap Focus Growth Fund, Inc. |
Affiliates
Investments in issuers considered to be affiliate(s) of the Fund during the year ended May 31, 2023 for purposes of Section 2(a)(3) of the Investment Company Act of 1940, as amended, were as follows:
| Affiliated Issuer | Value at 05/31/22 | Purchases at Cost | Proceeds from Sale | Net Realized Gain (Loss) | Change in Unrealized Appreciation (Depreciation) | Value at 05/31/23 | Shares Held at 05/31/23 | Income | Capital Gain Distributions from Underlying Funds | |||||||||||||||||||||||||||
BlackRock Liquidity Funds, T-Fund, Institutional Class | $ | 45,864,137 | $ | — | $ | (35,944,788 | )(a) | $ | — | $ | — | $ | 9,919,349 | 9,919,349 | $ | 248,686 | $ | — | | |||||||||||||||||
SL Liquidity Series, LLC, Money Market Series(b) | 321,232 | — | (340,043 | )(a) | 18,923 | (112 | ) | — | — | 23,185 | (c) | — | ||||||||||||||||||||||||
|
|
|
|
|
|
|
|
|
| |||||||||||||||||||||||||||
| $ | 18,923 | $ | (112 | ) | $ | 9,919,349 | $ | 271,871 | $ | — | ||||||||||||||||||||||||||
|
|
|
|
|
|
|
|
|
| |||||||||||||||||||||||||||
| (a) | Represents net amount purchased (sold). |
| (b) | As of period end, the entity is no longer held. |
| (c) | All or a portion represents securities lending income earned from the reinvestment of cash collateral from loaned securities, net of fees and collateral investment expenses, and other payments to and from borrowers of securities. |
For Fund compliance purposes, the Fund’s industry classifications refer to one or more of the industry sub-classifications used by one or more widely recognized market indexes or rating group indexes, and/or as defined by the investment adviser. These definitions may not apply for purposes of this report, which may combine such industry sub-classifications for reporting ease.
Fair Value Hierarchy as of Period End
Various inputs are used in determining the fair value of financial instruments. For a description of the input levels and information about the Fund’s policy regarding valuation of financial instruments, refer to the Notes to Financial Statements.
The following table summarizes the Fund’s financial instruments categorized in the fair value hierarchy. The breakdown of the Fund’s financial instruments into major categories is disclosed in the Schedule of Investments above.
| Level 1 | Level 2 | Level 3 | Total | |||||||||||||
Assets | ||||||||||||||||
Investments | ||||||||||||||||
Long-Term Investments | ||||||||||||||||
Common Stocks | ||||||||||||||||
Aerospace & Defense | $ | 36,254,786 | $ | — | $ | — | $ | 36,254,786 | ||||||||
Automobiles | 36,432,910 | — | — | 36,432,910 | ||||||||||||
Broadline Retail | 103,720,504 | — | — | 103,720,504 | ||||||||||||
Capital Markets | 58,398,555 | — | — | 58,398,555 | ||||||||||||
Commercial Services & Supplies | 44,084,923 | — | — | 44,084,923 | ||||||||||||
Entertainment | 6,543,428 | — | — | 6,543,428 | ||||||||||||
Financial Services | 73,343,515 | — | — | 73,343,515 | ||||||||||||
Health Care Equipment & Supplies | 58,801,714 | — | — | 58,801,714 | ||||||||||||
Health Care Providers & Services | 38,429,593 | — | — | 38,429,593 | ||||||||||||
Hotels, Restaurants & Leisure | 25,206,512 | 25,451,912 | — | 50,658,424 | ||||||||||||
Interactive Media & Services | 88,745,476 | — | — | 88,745,476 | ||||||||||||
Life Sciences Tools & Services | 31,513,508 | 12,931,730 | — | 44,445,238 | ||||||||||||
Oil, Gas & Consumable Fuels | 14,070,786 | — | — | 14,070,786 | ||||||||||||
Pharmaceuticals | 41,377,924 | — | — | 41,377,924 | ||||||||||||
Semiconductors & Semiconductor Equipment | 143,476,917 | — | — | 143,476,917 | ||||||||||||
Software | 294,887,838 | — | — | 294,887,838 | ||||||||||||
Technology Hardware, Storage & Peripherals | 123,764,812 | — | — | 123,764,812 | ||||||||||||
Textiles, Apparel & Luxury Goods | 10,972,092 | 21,125,518 | — | 32,097,610 | ||||||||||||
Preferred Securities | — | — | 20,830,298 | 20,830,298 | ||||||||||||
Short-Term Securities | ||||||||||||||||
Money Market Funds | 9,919,349 | — | — | 9,919,349 | ||||||||||||
|
|
|
|
|
|
|
| |||||||||
| $ | 1,239,945,142 | $ | 59,509,160 | $ | 20,830,298 | $ | 1,320,284,600 | |||||||||
|
|
|
|
|
|
|
| |||||||||
S C H E D U L E O F I N V E S T M E N T S | 9 |
Schedule of Investments (continued) May 31, 2023 | BlackRock Large Cap Focus Growth Fund, Inc. |
A reconciliation of Level 3 financial instruments is presented when the Fund had a significant amount of Level 3 investments at the beginning and/or end of the year in relation to net assets. The following table is a reconciliation of Level 3 investments for which significant unobservable inputs were used in determining fair value:
| ||||
| Preferred Securities | ||||
| ||||
Assets | ||||
Opening Balance, as of May 31, 2022 | $ | 20,588,697 | ||
Transfers into Level 3 | — | |||
Transfers out of Level 3 | — | |||
Accrued discounts/premiums | — | |||
Net realized gain (loss) | 230,151 | |||
Net change in unrealized appreciation (depreciation)(a)(b) | 717,700 | |||
Purchases | — | |||
Sales | (706,250 | ) | ||
|
| |||
Closing Balance, as of May 31, 2023 | $ | 20,830,298 | ||
|
| |||
Net change in unrealized appreciation (depreciation) on investments still held at May 31, 2023(a) | $ | 717,700 | ||
|
| |||
| (a) | Any difference between net change in unrealized appreciation (depreciation) and net change in unrealized appreciation (depreciation) on investments still held at May 31, 2023, is generally due to investments no longer held or categorized as Level 3 at period end. |
| (b) | Included in the related net change in unrealized appreciation (depreciation) in the Statement of Operations. |
The following table summarizes the valuation approaches used and unobservable inputs utilized by the Valuation Committee to determine the value of certain of the Fund’s Level 3 investments as of period end.
| ||||||||||||||||||||
| Value | Valuation Approach | Unobservable Inputs | Range of Unobservable Inputs Utilized(a) | Weighted Average of Unobservable Inputs Based on Fair Value | ||||||||||||||||
| ||||||||||||||||||||
Assets | ||||||||||||||||||||
Preferred Securities(b) | $ | 20,830,298 | Market | Revenue Multiple | 2.20x-3.40x | 2.80x | ||||||||||||||
|
| |||||||||||||||||||
| (a) | A significant change in unobservable input would have resulted in a correlated (inverse) significant change to value. |
| (b) | The fund valued certain of its Level 3 investments using recent prior transaction prices as the best approximation of fair value. The value of Level 3 investments obtained using recent prior transactions, for which inputs are unobservable, is $20,830,298 as of May 31, 2023. |
See notes to financial statements.
| 10 | 2 0 2 3 B L A C K R O C K A N N U A L R E P O R T T O S H A R E H O L D E R S |
Statement of Assets and Liabilities
May 31, 2023
BlackRock Large Cap Focus Growth Fund, Inc. | ||||
ASSETS | ||||
Investments, at value — unaffiliated(a) | $ | 1,310,365,251 | ||
Investments, at value — affiliated(b) | 9,919,349 | |||
Cash | 360,209 | |||
Receivables: | ||||
Investments sold | 9,279,687 | |||
Capital shares sold | 1,671,041 | |||
Dividends — unaffiliated | 813,028 | |||
Dividends — affiliated | 36,539 | |||
From the Manager | 141,408 | |||
Prepaid expenses | 54,209 | |||
|
| |||
Total assets | 1,332,640,721 | |||
|
| |||
LIABILITIES | ||||
Payables: | ||||
Investments purchased | 19,587,605 | |||
Administration fees | 250,066 | |||
Capital shares redeemed | 2,437,638 | |||
Investment advisory fees | 965,952 | |||
Directors’ and Officer’s fees | 2,898 | |||
Other accrued expenses | 329,761 | |||
Other affiliate fees | 2,084 | |||
Professional fees | 82,950 | |||
Registration fees | 48,035 | |||
Service and distribution fees | 220,633 | |||
|
| |||
Total liabilities | 23,927,622 | |||
|
| |||
NET ASSETS | $ | 1,308,713,099 | ||
|
| |||
NET ASSETS CONSIST OF: | ||||
Paid-in capital | $ | 762,697,287 | ||
Accumulated earnings | 546,015,812 | |||
|
| |||
NET ASSETS | $ | 1,308,713,099 | ||
|
| |||
(a) Investments, at cost — unaffiliated | $ | 778,252,914 | ||
(b) Investments, at cost — affiliated | $ | 9,919,349 | ||
F I N A N C I A L S T A T E M E N T S | 11 |
Statement of Assets and Liabilities (continued)
May 31, 2023
BlackRock Large Cap Focus Growth Fund, Inc. | ||||
NET ASSET VALUE | ||||
Institutional | ||||
Net assets | $ | 387,345,878 | ||
|
| |||
Shares outstanding | 64,264,701 | |||
|
| |||
Net asset value | $ | 6.03 | ||
|
| |||
Shares authorized | 200 million | |||
|
| |||
Par value | $ | 0.10 | ||
|
| |||
| Investor A | ||||
Net assets | $ | 793,559,503 | ||
|
| |||
Shares outstanding | 146,938,626 | |||
|
| |||
Net asset value | $ | 5.40 | ||
|
| |||
Shares authorized | 250 million | |||
|
| |||
Par value | $ | 0.10 | ||
|
| |||
| Investor C | ||||
Net assets | $ | 68,563,792 | ||
|
| |||
Shares outstanding | 17,014,122 | |||
|
| |||
Net asset value | $ | 4.03 | ||
|
| |||
Shares authorized | 50 million | |||
|
| |||
Par value | $ | 0.10 | ||
|
| |||
| Class K | ||||
Net assets | $ | 59,243,926 | ||
|
| |||
Shares outstanding | 9,807,183 | |||
|
| |||
Net asset value | $ | 6.04 | ||
|
| |||
Shares authorized | 100 million | |||
|
| |||
Par value | $ | 0.10 | ||
|
| |||
See notes to financial statements.
| 12 | 2 0 2 3 B L A C K R O C K A N N U A L R E P O R T T O S H A R E H O L D E R S |
Year Ended May 31, 2023
BlackRock Large Cap Focus Growth Fund, Inc. | ||||
INVESTMENT INCOME | ||||
Dividends — unaffiliated | $ | 8,284,837 | ||
Dividends — affiliated | 248,686 | |||
Securities lending income — affiliated — net | 23,185 | |||
Foreign taxes withheld | (234,487 | ) | ||
|
| |||
Total investment income | 8,322,221 | |||
|
| |||
EXPENSES | ||||
Investment advisory | 6,253,058 | |||
Service and distribution — class specific | 2,522,055 | |||
Administration | 1,500,734 | |||
Transfer agent — class specific | 1,349,278 | |||
Professional | 133,812 | |||
Registration | 110,432 | |||
Accounting services | 104,298 | |||
Printing and postage | 32,845 | |||
Custodian | 24,523 | |||
Directors and Officer | 17,400 | |||
Miscellaneous | 35,189 | |||
|
| |||
Total expenses | 12,083,624 | |||
Less: | ||||
Fees waived and/or reimbursed by the Manager | (458,510 | ) | ||
Transfer agent fees waived and/or reimbursed by the Manager — class specific | (749,996 | ) | ||
|
| |||
Total expenses after fees waived and/or reimbursed | 10,875,118 | |||
|
| |||
Net investment loss | (2,552,897 | ) | ||
|
| |||
REALIZED AND UNREALIZED GAIN (LOSS) | ||||
Net realized gain (loss) from: | ||||
Investments — unaffiliated | 28,944,178 | |||
Investments — affiliated | 18,923 | |||
Foreign currency transactions | (29,742 | ) | ||
|
| |||
| 28,933,359 | ||||
|
| |||
Net change in unrealized appreciation (depreciation) on: | ||||
Investments — unaffiliated | 63,955,015 | |||
Investments — affiliated | (112 | ) | ||
Foreign currency translations | (8,849 | ) | ||
|
| |||
| 63,946,054 | ||||
|
| |||
Net realized and unrealized gain | 92,879,413 | |||
|
| |||
NET INCREASE IN NET ASSETS RESULTING FROM OPERATIONS | $ | 90,326,516 | ||
|
| |||
See notes to financial statements.
F I N A N C I A L S T A T E M E N T S | 13 |
Statement of Changes in Net Assets
| BlackRock Large Cap Focus Growth Fund, Inc. | ||||||||||
Year Ended 05/31/23 | Year Ended 05/31/22 | |||||||||
INCREASE (DECREASE) IN NET ASSETS |
| |||||||||
OPERATIONS | ||||||||||
Net investment loss | $ | (2,552,897 | ) | $ | (8,460,788 | ) | ||||
Net realized gain | 28,933,359 | 92,082,983 | ||||||||
Net change in unrealized appreciation (depreciation) | 63,946,054 | (414,745,609 | ) | |||||||
|
|
|
| |||||||
Net increase (decrease) in net assets resulting from operations | 90,326,516 | (331,123,414 | ) | |||||||
|
|
|
| |||||||
DISTRIBUTIONS TO SHAREHOLDERS(a) | ||||||||||
Institutional | (7,561,472 | ) | (82,688,338 | ) | ||||||
Investor A | (15,306,911 | ) | (137,014,148 | ) | ||||||
Investor C | (1,831,622 | ) | (17,842,022 | ) | ||||||
Class K | (954,124 | ) | (8,699,251 | ) | ||||||
|
|
|
| |||||||
Decrease in net assets resulting from distributions to shareholders | (25,654,129 | ) | (246,243,759 | ) | ||||||
|
|
|
| |||||||
CAPITAL SHARE TRANSACTIONS | ||||||||||
Net increase (decrease) in net assets derived from capital share transactions | (248,268,058 | ) | 42,184,846 | |||||||
|
|
|
| |||||||
NET ASSETS |
| |||||||||
Total decrease in net assets | (183,595,671 | ) | (535,182,327 | ) | ||||||
Beginning of year | 1,492,308,770 | 2,027,491,097 | ||||||||
|
|
|
| |||||||
End of year | $ | 1,308,713,099 | $ | 1,492,308,770 | ||||||
|
|
|
| |||||||
| (a) | Distributions for annual periods determined in accordance with U.S. federal income tax regulations. |
See notes to financial statements.
| 14 | 2 0 2 3 B L A C K R O C K A N N U A L R E P O R T T O S H A R E H O L D E R S |
(For a share outstanding throughout each period)
| BlackRock Large Cap Focus Growth Fund, Inc. | ||||||||||||||||||||||||
| Institutional | ||||||||||||||||||||||||
| Year Ended 05/31/23 | Year Ended 05/31/22 | Year Ended 05/31/21 | Period from 09/01/19 to 05/31/20 | Year Ended 08/31/19 | Year Ended 08/31/18 | |||||||||||||||||||
Net asset value, beginning of period | $ | 5.62 | $ | 7.64 | $ | 5.57 | $ | 5.00 | $ | 4.97 | $ | 4.01 | ||||||||||||
|
|
|
|
|
|
|
|
|
|
|
| |||||||||||||
Net investment loss(a) | (0.00 | )(b) | (0.02 | ) | (0.02 | ) | (0.00 | )(b) | (0.01 | ) | (0.02 | ) | ||||||||||||
Net realized and unrealized gain (loss) | 0.50 | (1.13 | ) | 2.13 | 0.84 | 0.22 | 1.15 | |||||||||||||||||
|
|
|
|
|
|
|
|
|
|
|
| |||||||||||||
Net increase (decrease) from investment operations | 0.50 | (1.15 | ) | 2.11 | 0.84 | 0.21 | 1.13 | |||||||||||||||||
|
|
|
|
|
|
|
|
|
|
|
| |||||||||||||
Distributions from net realized gain(c) | (0.09 | ) | (0.87 | ) | (0.04 | ) | (0.27 | ) | (0.18 | ) | (0.17 | ) | ||||||||||||
|
|
|
|
|
|
|
|
|
|
|
| |||||||||||||
Net asset value, end of period | $ | 6.03 | $ | 5.62 | $ | 7.64 | $ | 5.57 | $ | 5.00 | $ | 4.97 | ||||||||||||
|
|
|
|
|
|
|
|
|
|
|
| |||||||||||||
Total Return(d) | ||||||||||||||||||||||||
Based on net asset value | 9.31 | % | (18.00 | )% | 37.92 | % | 17.68 | %(e) | 4.75 | % | 29.10 | % | ||||||||||||
|
|
|
|
|
|
|
|
|
|
|
| |||||||||||||
Ratios to Average Net Assets(f) | ||||||||||||||||||||||||
Total expenses | 0.77 | % | 0.74 | % | 0.75 | %(g) | 0.84 | %(h)(i) | 0.90 | %(i) | 0.93 | %(i) | ||||||||||||
|
|
|
|
|
|
|
|
|
|
|
| |||||||||||||
Total expenses after fees waived and/or reimbursed | 0.67 | % | 0.67 | % | 0.67 | %(g) | 0.67 | %(h)(i) | 0.83 | %(i) | 0.93 | %(i) | ||||||||||||
|
|
|
|
|
|
|
|
|
|
|
| |||||||||||||
Net investment loss | (0.00 | )%(j) | (0.23 | )% | (0.26 | )%(g) | (0.11 | )%(h)(i) | (0.29 | )%(i) | (0.34 | )%(i) | ||||||||||||
|
|
|
|
|
|
|
|
|
|
|
| |||||||||||||
Supplemental Data | ||||||||||||||||||||||||
Net assets, end of period (000) | $ | 387,346 | $ | 516,205 | $ | 726,623 | $ | 492,250 | $ | 78,749 | $ | 67,688 | ||||||||||||
|
|
|
|
|
|
|
|
|
|
|
| |||||||||||||
Portfolio turnover rate | 33 | % | 53 | % | 47 | %(k) | 47 | % | 54 | % | 51 | % | ||||||||||||
|
|
|
|
|
|
|
|
|
|
|
| |||||||||||||
| (a) | Based on average shares outstanding. |
| (b) | Amount is greater than $(0.005) per share. |
| (c) | Distributions for annual periods determined in accordance with U.S. federal income tax regulations. |
| (d) | Where applicable, assumes the reinvestment of distributions. |
| (e) | Not annualized. |
| (f) | Excludes fees and expenses incurred indirectly as a result of investments in underlying funds. |
| (g) | From June 1, 2020 through February 28, 2021, the Fund invested in the Master Focus Growth LLC (the “Master LLC”) as part of a master-feeder structure and received its corresponding allocated fees waived and expenses and/or net investment income from the Master LLC. Includes the Fund’s share of the Master LLC’s allocated fees waived of less than 0.01%. |
| (h) | Annualized. |
| (i) | Includes the Fund’s share of the Master LLC’s allocated fees waived as follows: |
| Year Ended 05/31/23 | Year Ended 05/31/22 | Year Ended 05/31/21 | Period from 09/01/19 to 05/31/20 | Year Ended 08/31/19 | Year Ended 08/31/18 | |||||||||||||||||||||||||||||||||||||||
Fees waived | N/A | N/A | N/A | 0.00 | % | 0.07 | % | 0.11 | % | |||||||||||||||||||||||||||||||||||
|
|
|
|
|
|
|
|
|
|
|
| |||||||||||||||||||||||||||||||||
| (j) | Amount is greater than (0.005)%. |
| (k) | Portfolio turnover rate includes transactions from the Master LLC prior to March 1, 2021. |
See notes to financial statements.
FINANCIAL HIGHLIGHTS | 15 |
Financial Highlights (continued)
(For a share outstanding throughout each period)
| BlackRock Large Cap Focus Growth Fund, Inc. (continued) | ||||||||||||||||||||||||
| Investor A | ||||||||||||||||||||||||
| Year Ended 05/31/23 | Year Ended 05/31/22 | Year Ended 05/31/21 | Period from 09/01/19 to 05/31/20 | Year Ended 08/31/19 | Year Ended 08/31/18 | |||||||||||||||||||
Net asset value, beginning of period | $ | 5.06 | $ | 6.95 | $ | 5.09 | $ | 4.60 | $ | 4.59 | $ | 3.73 | ||||||||||||
|
|
|
|
|
|
|
|
|
|
|
| |||||||||||||
Net investment loss(a) | (0.01 | ) | (0.03 | ) | (0.03 | ) | (0.01 | ) | (0.02 | ) | (0.03 | ) | ||||||||||||
Net realized and unrealized gain (loss) | 0.44 | (1.01 | ) | 1.93 | 0.77 | 0.21 | 1.06 | |||||||||||||||||
|
|
|
|
|
|
|
|
|
|
|
| |||||||||||||
Net increase (decrease) from investment operations | 0.43 | (1.04 | ) | 1.90 | 0.76 | 0.19 | 1.03 | |||||||||||||||||
|
|
|
|
|
|
|
|
|
|
|
| |||||||||||||
Distributions from net realized gain(b) | (0.09 | ) | (0.85 | ) | (0.04 | ) | (0.27 | ) | (0.18 | ) | (0.17 | ) | ||||||||||||
|
|
|
|
|
|
|
|
|
|
|
| |||||||||||||
Net asset value, end of period | $ | 5.40 | $ | 5.06 | $ | 6.95 | $ | 5.09 | $ | 4.60 | $ | 4.59 | ||||||||||||
|
|
|
|
|
|
|
|
|
|
|
| |||||||||||||
Total Return(c) | ||||||||||||||||||||||||
Based on net asset value | 8.95 | % | (18.10 | )% | 37.37 | % | 17.48 | %(d) | 4.69 | % | 28.59 | % | ||||||||||||
|
|
|
|
|
|
|
|
|
|
|
| |||||||||||||
Ratios to Average Net Assets(e) | ||||||||||||||||||||||||
Total expenses | 1.02 | % | 0.98 | % | 1.01 | %(f) | 1.11 | %(g)(h) | 1.18 | %(h) | 1.27 | %(h) | ||||||||||||
|
|
|
|
|
|
|
|
|
|
|
| |||||||||||||
Total expenses after fees waived and/or reimbursed | 0.92 | % | 0.92 | % | 0.92 | %(f) | 0.92 | %(g)(h) | 1.11 | %(h) | 1.26 | %(h) | ||||||||||||
|
|
|
|
|
|
|
|
|
|
|
| |||||||||||||
Net investment loss | (0.25 | )% | (0.48 | )% | (0.51 | )%(f) | (0.36 | )%(g)(h) | (0.57 | )%(h) | (0.67 | )%(h) | ||||||||||||
|
|
|
|
|
|
|
|
|
|
|
| |||||||||||||
Supplemental Data | ||||||||||||||||||||||||
Net assets, end of period (000) | $ | 793,560 | $ | 839,188 | $ | 1,104,764 | $ | 760,726 | $ | 115,307 | $ | 90,524 | ||||||||||||
|
|
|
|
|
|
|
|
|
|
|
| |||||||||||||
Portfolio turnover rate | 33 | % | 53 | % | 47 | %(i) | 47 | % | 54 | % | 51 | % | ||||||||||||
|
|
|
|
|
|
|
|
|
|
|
| |||||||||||||
| (a) | Based on average shares outstanding. |
| (b) | Distributions for annual periods determined in accordance with U.S. federal income tax regulations. |
| (c) | Where applicable, excludes the effects of any sales charges and assumes the reinvestment of distributions. |
| (d) | Not annualized. |
| (e) | Excludes fees and expenses incurred indirectly as a result of investments in underlying funds. |
| (f) | From June 1, 2020 through February 28, 2021, the Fund invested in the Master Focus Growth LLC (the “Master LLC”) as part of a master-feeder structure and received its corresponding allocated fees waived and expenses and/or net investment income from the Master LLC. Includes the Fund’s share of the Master LLC’s allocated fees waived of less than 0.01%. |
| (g) | Annualized. |
| (h) | Includes the Fund’s share of the Master LLC’s allocated fees waived as follows: |
| Year Ended 05/31/23 | Year Ended 05/31/22 | Year Ended 05/31/21 | Period from 09/01/19 to 05/31/20 | Year Ended 08/31/19 | Year Ended 08/31/18 | |||||||||||||||||||||||||||||||||||||||
Fees waived | N/A | N/A | N/A | 0.00 | % | 0.07 | % | 0.11 | % | |||||||||||||||||||||||||||||||||||
|
|
|
|
|
|
|
|
|
|
|
| |||||||||||||||||||||||||||||||||
| (i) | Portfolio turnover rate includes transactions from the Master LLC prior to March 1, 2021. |
See notes to financial statements.
| 16 | 2 0 2 3 BLACK ROCK ANNUAL REPORT TO SHAREHOLDERS |
Financial Highlights (continued)
(For a share outstanding throughout each period)
| BlackRock Large Cap Focus Growth Fund, Inc. (continued) | ||||||||||||||||||||||||
| Investor C | ||||||||||||||||||||||||
| Year Ended 05/31/23 | Year Ended 05/31/22 | Year Ended 05/31/21 | Period from 09/01/19 to 05/31/20 | Year Ended 08/31/19 | Year Ended 08/31/18 | |||||||||||||||||||
Net asset value, beginning of period | $ | 3.83 | $ | 5.45 | $ | 4.03 | $ | 3.71 | $ | 3.77 | $ | 3.11 | ||||||||||||
|
|
|
|
|
|
|
|
|
|
|
| |||||||||||||
Net investment loss(a) | (0.04 | ) | (0.06 | ) | (0.06 | ) | (0.03 | ) | (0.05 | ) | (0.05 | ) | ||||||||||||
Net realized and unrealized gain (loss) | 0.33 | (0.75 | ) | 1.52 | 0.62 | 0.17 | 0.88 | |||||||||||||||||
|
|
|
|
|
|
|
|
|
|
|
| |||||||||||||
Net increase (decrease) from investment operations | 0.29 | (0.81 | ) | 1.46 | 0.59 | 0.12 | 0.83 | |||||||||||||||||
|
|
|
|
|
|
|
|
|
|
|
| |||||||||||||
Distributions from net realized gain(b) | (0.09 | ) | (0.81 | ) | (0.04 | ) | (0.27 | ) | (0.18 | ) | (0.17 | ) | ||||||||||||
|
|
|
|
|
|
|
|
|
|
|
| |||||||||||||
Net asset value, end of period | $ | 4.03 | $ | 3.83 | $ | 5.45 | $ | 4.03 | $ | 3.71 | $ | 3.77 | ||||||||||||
|
|
|
|
|
|
|
|
|
|
|
| |||||||||||||
Total Return(c) | ||||||||||||||||||||||||
Based on net asset value | 8.15 | % | (18.77 | )% | 36.28 | % | 17.08 | %(d) | 3.83 | % | 27.81 | % | ||||||||||||
|
|
|
|
|
|
|
|
|
|
|
| |||||||||||||
Ratios to Average Net Assets(e) | ||||||||||||||||||||||||
Total expenses | 1.80 | % | 1.76 | % | 1.79 | %(f) | 1.89 | %(g)(h) | 1.93 | %(h) | 1.97 | %(h) | ||||||||||||
|
|
|
|
|
|
|
|
|
|
|
| |||||||||||||
Total expenses after fees waived and/or reimbursed | 1.67 | % | 1.67 | % | 1.67 | %(f) | 1.67 | %(g)(h) | 1.86 | %(h) | 1.96 | %(h) | ||||||||||||
|
|
|
|
|
|
|
|
|
|
|
| |||||||||||||
Net investment loss | (1.00 | )% | (1.24 | )% | (1.27 | )%(f) | (1.12 | )%(g)(h) | (1.33 | )%(h) | (1.38 | )%(h) | ||||||||||||
|
|
|
|
|
|
|
|
|
|
|
| |||||||||||||
Supplemental Data | ||||||||||||||||||||||||
Net assets, end of period (000) | $ | 68,564 | $ | 77,295 | $ | 121,731 | $ | 135,414 | $ | 26,285 | $ | 29,828 | ||||||||||||
|
|
|
|
|
|
|
|
|
|
|
| |||||||||||||
Portfolio turnover rate | 33 | % | 53 | % | 47 | %(i) | 47 | % | 54 | % | 51 | % | ||||||||||||
|
|
|
|
|
|
|
|
|
|
|
| |||||||||||||
| (a) | Based on average shares outstanding. |
| (b) | Distributions for annual periods determined in accordance with U.S. federal income tax regulations. |
| (c) | Where applicable, excludes the effects of any sales charges and assumes the reinvestment of distributions. |
| (d) | Not annualized. |
| (e) | Excludes fees and expenses incurred indirectly as a result of investments in underlying funds. |
| (f) | From June 1, 2020 through February 28, 2021, the Fund invested in the Master Focus Growth LLC (the “Master LLC”) as part of a master-feeder structure and received its corresponding allocated fees waived and expenses and/or net investment income from the Master LLC. Includes the Fund’s share of the Master LLC’s allocated fees waived of less than 0.01%. |
| (g) | Annualized. |
| (h) | Includes the Fund’s share of the Master LLC’s allocated fees waived as follows: |
| Year Ended 05/31/23 | Year Ended 05/31/22 | Year Ended 05/31/21 | Period from 09/01/19 to 05/31/20 | Year Ended 08/31/19 | Year Ended 08/31/18 | |||||||||||||||||||||||||||||||||||||||
Fees waived | N/A | N/A | N/A | 0.00 | % | 0.07 | % | 0.11 | % | |||||||||||||||||||||||||||||||||||
|
|
|
|
|
|
|
|
|
|
|
| |||||||||||||||||||||||||||||||||
| (i) | Portfolio turnover rate includes transactions from the Master LLC prior to March 1, 2021. |
See notes to financial statements.
FINANCIAL HIGHLIGHTS | 17 |
Financial Highlights (continued)
(For a share outstanding throughout each period)
| BlackRock Large Cap Focus Growth Fund, Inc. (continued) | ||||||||||||||||
| Class K | ||||||||||||||||
| Year Ended 05/31/23 | Year Ended 05/31/22 | Year Ended 05/31/21 | Period from to 05/31/20 | |||||||||||||
Net asset value, beginning of period | $ | 5.63 | $ | 7.65 | $ | 5.58 | $ | 5.17 | ||||||||
|
|
|
|
|
|
|
| |||||||||
Net investment income (loss)(b) | 0.00 | (c) | (0.01 | ) | (0.01 | ) | (0.00 | )(d) | ||||||||
Net realized and unrealized gain (loss) | 0.50 | (1.14 | ) | 2.12 | 0.68 | |||||||||||
|
|
|
|
|
|
|
| |||||||||
Net increase (decrease) from investment operations | 0.50 | (1.15 | ) | 2.11 | 0.68 | |||||||||||
|
|
|
|
|
|
|
| |||||||||
Distributions from net realized gain(e) | (0.09 | ) | (0.87 | ) | (0.04 | ) | (0.27 | ) | ||||||||
|
|
|
|
|
|
|
| |||||||||
Net asset value, end of period | $ | 6.04 | $ | 5.63 | $ | 7.65 | $ | 5.58 | ||||||||
|
|
|
|
|
|
|
| |||||||||
Total Return(f) | ||||||||||||||||
Based on net asset value | 9.29 | % | (17.94 | )% | 37.86 | % | 14.02 | %(g) | ||||||||
|
|
|
|
|
|
|
| |||||||||
Ratios to Average Net Assets(h) | ||||||||||||||||
Total expenses | 0.67 | % | 0.66 | % | 0.68 | %(i) | 0.74 | %(j)(k) | ||||||||
|
|
|
|
|
|
|
| |||||||||
Total expenses after fees waived and/or reimbursed | 0.62 | % | 0.62 | % | 0.62 | %(i) | 0.62 | %(j)(k) | ||||||||
|
|
|
|
|
|
|
| |||||||||
Net investment income (loss) | 0.05 | % | (0.17 | )% | (0.21 | )%(i) | (0.05 | )%(j)(k) | ||||||||
|
|
|
|
|
|
|
| |||||||||
Supplemental Data | ||||||||||||||||
Net assets, end of period (000) | $ | 59,244 | $ | 59,620 | $ | 74,374 | $ | 51,187 | ||||||||
|
|
|
|
|
|
|
| |||||||||
Portfolio turnover rate | 33 | % | 53 | % | 47 | %(l) | 47 | %(m) | ||||||||
|
|
|
|
|
|
|
| |||||||||
| (a) | Commencement of operations. |
| (b) | Based on average shares outstanding. |
| (c) | Amount is less than $0.005 per share. |
| (d) | Amount is greater than $(0.005) per share. |
| (e) | Distributions for annual periods determined in accordance with U.S. federal income tax regulations. |
| (f) | Where applicable, assumes the reinvestment of distributions. |
| (g) | Not annualized. |
| (h) | Excludes fees and expenses incurred indirectly as a result of investments in underlying funds. |
| (i) | From June 1, 2020 through February 28, 2021, the Fund invested in the Master Focus Growth LLC (the “Master LLC”) as part of a master-feeder structure and received its corresponding allocated fees waived and expenses and/or net investment income from the Master LLC. Includes the Fund’s share of the Master LLC’s allocated fees waived of less than 0.01%. |
| (j) | Annualized. |
| (k) | Includes the Fund’s share of the Master LLC’s allocated expenses and/or net investment income. Includes the Fund’s share of the Master LLC’s allocated fees waived of less than 0.01%. |
| (l) | Portfolio turnover rate includes transactions from the Master LLC prior to March 1, 2021. |
| (m) | Portfolio turnover is representative of the Fund for the entire year. |
See notes to financial statements.
| 18 | 2 0 2 3 BLACK ROCK ANNUAL REPORT TO SHAREHOLDERS |
| 1. | ORGANIZATION |
BlackRock Large Cap Focus Growth Fund, Inc. (the “Fund”) is registered under the Investment Company Act of 1940, as amended (the “1940 Act”), as an open-end management investment company. The Fund is organized as a Maryland corporation. The Fund is classified as diversified.
The Fund offers multiple classes of shares. All classes of shares have identical voting, dividend, liquidation and other rights and are subject to the same terms and conditions, except that certain classes bear expenses related to the shareholder servicing and distribution of such shares. Institutional and Class K Shares are sold only to certain eligible investors. Investor A and Investor C Shares bear certain expenses related to shareholder servicing of such shares, and Investor C Shares also bear certain expenses related to the distribution of such shares. Investor A and Investor C Shares are generally available through financial intermediaries. Each class has exclusive voting rights with respect to matters relating to its shareholder servicing and distribution expenditures (except that Investor C shareholders may vote on material changes to the Investor A Shares distribution and service plan).
| Share Class | Initial Sales Charge | CDSC | Conversion Privilege | |||
Institutional and Class K Shares | No | No | None | |||
Investor A Shares | Yes | No(a) | None | |||
Investor C Shares | No | Yes(b) | To Investor A Shares after approximately 8 years |
| (a) | Investor A Shares may be subject to a contingent deferred sales charge (“CDSC”) for certain redemptions where no initial sales charge was paid at the time of purchase. |
| (b) | A CDSC of 1.00% is assessed on certain redemptions of Investor C Shares made within one year after purchase. |
The Fund, together with certain other registered investment companies advised by BlackRock Advisors, LLC (the “Manager”), or its affiliates, is included in a complex of funds referred to as the BlackRock Multi-Asset Complex.
| 2. | SIGNIFICANT ACCOUNTING POLICIES |
The financial statements are prepared in conformity with accounting principles generally accepted in the United States of America (“U.S. GAAP”), which may require management to make estimates and assumptions that affect the reported amounts of assets and liabilities in the financial statements, disclosure of contingent assets and liabilities at the date of the financial statements and the reported amounts of increases and decreases in net assets from operations during the reporting period. Actual results could differ from those estimates. The Fund is considered an investment company under U.S. GAAP and follows the accounting and reporting guidance applicable to investment companies. Below is a summary of significant accounting policies:
Investment Transactions and Income Recognition: For financial reporting purposes, investment transactions are recorded on the dates the transactions are executed. Realized gains and losses on investment transactions are determined using the specific identification method. Dividend income and capital gain distributions, if any, are recorded on the ex-dividend dates. Non-cash dividends, if any, are recorded on the ex-dividend dates at fair value. Dividends from foreign securities where the ex-dividend dates may have passed are subsequently recorded when the Fund is informed of the ex-dividend dates. Under the applicable foreign tax laws, a withholding tax at various rates may be imposed on capital gains, dividends and interest. Income, expenses and realized and unrealized gains and losses are allocated daily to each class based on its relative net assets.
Foreign Currency Translation: The Fund’s books and records are maintained in U.S. dollars. Securities and other assets and liabilities denominated in foreign currencies are translated into U.S. dollars using exchange rates determined as of the close of trading on the New York Stock Exchange (“NYSE”). Purchases and sales of investments are recorded at the rates of exchange prevailing on the respective dates of such transactions. Generally, when the U.S. dollar rises in value against a foreign currency, the investments denominated in that currency will lose value; the opposite effect occurs if the U.S. dollar falls in relative value.
The Fund does not isolate the effect of fluctuations in foreign exchange rates from the effect of fluctuations in the market prices of investments for financial reporting purposes. Accordingly, the effects of changes in exchange rates on investments are not segregated in the Statement of Operations from the effects of changes in market prices of those investments, but are included as a component of net realized and unrealized gain (loss) from investments. The Fund reports realized currency gains (losses) on foreign currency related transactions as components of net realized gain (loss) for financial reporting purposes, whereas such components are generally treated as ordinary income for U.S. federal income tax purposes.
Foreign Taxes: The Fund may be subject to foreign taxes (a portion of which may be reclaimable) on income, stock dividends, capital gains on investments, or certain foreign currency transactions. All foreign taxes are recorded in accordance with the applicable foreign tax regulations and rates that exist in the foreign jurisdictions in which the Fund invests. These foreign taxes, if any, are paid by the Fund and are reflected in its Statement of Operations as follows: foreign taxes withheld at source are presented as a reduction of income, foreign taxes on securities lending income are presented as a reduction of securities lending income, foreign taxes on stock dividends are presented as “Foreign taxes withheld”, and foreign taxes on capital gains from sales of investments and foreign taxes on foreign currency transactions are included in their respective net realized gain (loss) categories. Foreign taxes payable or deferred as of May 31, 2023, if any, are disclosed in the Statement of Assets and Liabilities.
The Fund files withholding tax reclaims in certain jurisdictions to recover a portion of amounts previously withheld. The Fund may record a reclaim receivable based on collectability, which includes factors such as the jurisdiction’s applicable laws, payment history and market convention. The Statement of Operations includes tax reclaims recorded as well as professional and other fees, if any, associated with recovery of foreign withholding taxes.
Collateralization: If required by an exchange or counterparty agreement, the Fund may be required to deliver/deposit cash and/or securities to/with an exchange, or broker-dealer or custodian as collateral for certain investments.
Distributions: Distributions paid by the Fund are recorded on the ex-dividend dates. The character and timing of distributions are determined in accordance with U.S. federal income tax regulations, which may differ from U.S. GAAP.
N O T E S T O F I N A N C I A L S T A T E M E N T S | 19 |
Notes to Financial Statements (continued)
Indemnifications: In the normal course of business, the Fund enters into contracts that contain a variety of representations that provide general indemnification. The Fund’s maximum exposure under these arrangements is unknown because it involves future potential claims against the Fund, which cannot be predicted with any certainty.
Other: Expenses directly related to the Fund or its classes are charged to the Fund or the applicable class. Expenses directly related to the Fund and other shared expenses prorated to the Fund are allocated daily to each class based on its relative net assets or other appropriate methods. Other operating expenses shared by several funds, including other funds managed by the Manager, are prorated among those funds on the basis of relative net assets or other appropriate methods.
The Fund has an arrangement with its custodian whereby credits are earned on uninvested cash balances, which could be used to reduce custody fees and/or overdraft charges. The Fund may incur charges on overdrafts, subject to certain conditions.
| 3. | INVESTMENT VALUATION AND FAIR VALUE MEASUREMENTS |
Investment Valuation Policies: The Fund’s investments are valued at fair value (also referred to as “market value” within the financial statements) each day that the Fund is open for business and, for financial reporting purposes, as of the report date. U.S. GAAP defines fair value as the price a fund would receive to sell an asset or pay to transfer a liability in an orderly transaction between market participants at the measurement date. The Board of Directors of the Fund (the “Board”) has approved the designation of the Fund’s Manager as the valuation designee for the Fund. The Fund determines the fair values of its financial instruments using various independent dealers or pricing services under the Manager’s policies. If a security’s market price is not readily available or does not otherwise accurately represent the fair value of the security, the security will be valued in accordance with the Manager’s policies and procedures as reflecting fair value. The Manager has formed a committee (the “Valuation Committee”) to develop pricing policies and procedures and to oversee the pricing function for all financial instruments, with assistance from other BlackRock pricing committees.
Fair Value Inputs and Methodologies: The following methods and inputs are used to establish the fair value of the Fund’s assets and liabilities:
| • | Equity investments traded on a recognized securities exchange are valued at that day’s official closing price, as applicable, on the exchange where the stock is primarily traded. Equity investments traded on a recognized exchange for which there were no sales on that day may be valued at the last available bid (long positions) or ask (short positions) price. |
| • | Investments in open-end U.S. mutual funds (including money market funds) are valued at that day’s published net asset value (“NAV”). |
| • | The Fund values its investment in SL Liquidity Series, LLC, Money Market Series (the “Money Market Series”) at fair value, which is ordinarily based upon its pro rata ownership in the underlying fund’s net assets. |
Generally, trading in foreign instruments is substantially completed each day at various times prior to the close of trading on the NYSE. Each business day, the Fund uses current market factors supplied by independent pricing services to value certain foreign instruments (“Systematic Fair Value Price”). The Systematic Fair Value Price is designed to value such foreign securities at fair value as of the close of trading on the NYSE, which follows the close of the local markets.
If events (e.g., market volatility, company announcement or a natural disaster) occur that are expected to materially affect the value of such investment, or in the event that application of these methods of valuation results in a price for an investment that is deemed not to be representative of the market value of such investment, or if a price is not available, the investment will be valued by the Valuation Committee in accordance with the Manager’s policies and procedures as reflecting fair value (“Fair Valued Investments”). The fair valuation approaches that may be used by the Valuation Committee include market approach, income approach and cost approach. Valuation techniques such as discounted cash flow, use of market comparables and matrix pricing are types of valuation approaches and are typically used in determining fair value. When determining the price for Fair Valued Investments, the Valuation Committee seeks to determine the price that the Fund might reasonably expect to receive or pay from the current sale or purchase of that asset or liability in an arm’s-length transaction. Fair value determinations shall be based upon all available factors that the Valuation Committee deems relevant and consistent with the principles of fair value measurement.
For investments in equity or debt issued by privately held companies or funds (“Private Company” or collectively, the “Private Companies”) and other Fair Valued Investments, the fair valuation approaches that are used by the Valuation Committee and third-party pricing services utilized by the Valuation Committee include one or a combination of, but not limited to, the following inputs.
| Standard Inputs Generally Considered By The Valuation Committee And Third-Party Pricing Services | ||
Market approach | (i) recent market transactions, including subsequent rounds of financing, in the underlying investment or comparable issuers; (ii) recapitalizations and other transactions across the capital structure; and (iii) market multiples of comparable issuers. | |
Income approach | (i) future cash flows discounted to present and adjusted as appropriate for liquidity, credit, and/or market risks; (ii) quoted prices for similar investments or assets in active markets; and (iii) other risk factors, such as interest rates, yield curves, volatilities, prepayment speeds, loss severities, credit risks, recovery rates, liquidation amounts and/or default rates. | |
Cost approach | (i) audited or unaudited financial statements, investor communications and financial or operational metrics issued by the Private Company; (ii) changes in the valuation of relevant indices or publicly traded companies comparable to the Private Company; (iii)��� relevant news and other public sources; and (iv) known secondary market transactions in the Private Company’s interests and merger or acquisition activity in companies comparable to the Private Company. | |
Investments in series of preferred stock issued by Private Companies are typically valued utilizing market approach in determining the enterprise value of the company. Such investments often contain rights and preferences that differ from other series of preferred and common stock of the same issuer. Enterprise valuation techniques such as an option pricing model (“OPM”), a probability weighted expected return model (“PWERM”), current value method or a hybrid of those techniques are used as deemed appropriate
| 20 | 2 0 2 3 B L A C K R O C K A N N U A L R E P O R T T O S H A R E H O L D E R S |
Notes to Financial Statements (continued)
under the circumstances. The use of these valuation techniques involve a determination of the exit scenarios of the investment in order to appropriately allocate the enterprise value of the company among the various parts of its capital structure.
The Private Companies are not subject to the public company disclosure, timing, and reporting standards applicable to other investments held by the Fund. Typically, the most recently available information by a Private Company is as of a date that is earlier than the date the Fund is calculating its NAV. This factor may result in a difference between the value of the investment and the price the Fund could receive upon the sale of the investment.
Fair Value Hierarchy: Various inputs are used in determining the fair value of financial instruments. These inputs to valuation techniques are categorized into a fair value hierarchy consisting of three broad levels for financial reporting purposes as follows:
| • | Level 1 – Unadjusted price quotations in active markets/exchanges for identical assets or liabilities that the Fund has the ability to access; |
| • | Level 2 – Other observable inputs (including, but not limited to, quoted prices for similar assets or liabilities in markets that are active, quoted prices for identical or similar assets or liabilities in markets that are not active, inputs other than quoted prices that are observable for the assets or liabilities (such as interest rates, yield curves, volatilities, prepayment speeds, loss severities, credit risks and default rates) or other market–corroborated inputs); and |
| • | Level 3 – Unobservable inputs based on the best information available in the circumstances, to the extent observable inputs are not available (including the Valuation Committee’s assumptions used in determining the fair value of financial instruments). |
The hierarchy gives the highest priority to unadjusted quoted prices in active markets for identical assets or liabilities (Level 1 measurements) and the lowest priority to unobservable inputs (Level 3 measurements). Accordingly, the degree of judgment exercised in determining fair value is greatest for instruments categorized in Level 3. The inputs used to measure fair value may fall into different levels of the fair value hierarchy. In such cases, for disclosure purposes, the fair value hierarchy classification is determined based on the lowest level input that is significant to the fair value measurement in its entirety. Investments classified within Level 3 have significant unobservable inputs used by the Valuation Committee in determining the price for Fair Valued Investments. Level 3 investments include equity or debt issued by Private Companies that may not have a secondary market and/or may have a limited number of investors. The categorization of a value determined for financial instruments is based on the pricing transparency of the financial instruments and is not necessarily an indication of the risks associated with investing in those securities.
| 4. | SECURITIES AND OTHER INVESTMENTS |
Preferred Stocks: Preferred stock has a preference over common stock in liquidation (and generally in receiving dividends as well), but is subordinated to the liabilities of the issuer in all respects. As a general rule, the market value of preferred stock with a fixed dividend rate and no conversion element varies inversely with interest rates and perceived credit risk, while the market price of convertible preferred stock generally also reflects some element of conversion value. Because preferred stock is junior to debt securities and other obligations of the issuer, deterioration in the credit quality of the issuer will cause greater changes in the value of a preferred stock than in a more senior debt security with similar stated yield characteristics. Unlike interest payments on debt securities, preferred stock dividends are payable only if declared by the issuer’s board of directors. Preferred stock also may be subject to optional or mandatory redemption provisions.
Securities Lending: The Fund may lend its securities to approved borrowers, such as brokers, dealers and other financial institutions. The borrower pledges and maintains with the Fund collateral consisting of cash, an irrevocable letter of credit issued by a bank, or securities issued or guaranteed by the U.S. Government. The initial collateral received by the Fund is required to have a value of at least 102% of the current value of the loaned securities for securities traded on U.S. exchanges and a value of at least 105% for all other securities. The collateral is maintained thereafter at a value equal to at least 100% of the current market value of the securities on loan. The market value of the loaned securities is determined at the close of each business day of the Fund and any additional required collateral is delivered to the Fund, or excess collateral returned by the Fund, on the next business day. During the term of the loan, the Fund is entitled to all distributions made on or in respect of the loaned securities, but does not receive interest income on securities received as collateral. Loans of securities are terminable at any time and the borrower, after notice, is required to return borrowed securities within the standard time period for settlement of securities transactions.
As of period end, any securities on loan were collateralized by cash and/or U.S. Government obligations. Cash collateral invested by the securities lending agent, BlackRock Investment Management, LLC (“BIM”), if any, is disclosed in the Schedule of Investments. Any non-cash collateral received cannot be sold, re-invested or pledged by the Fund, except in the event of borrower default. The securities on loan, if any, are disclosed in the Fund’s Schedule of Investments. The market value of any securities on loan and the value of related collateral, if any, are shown separately in the Statement of Assets and Liabilities as a component of investments at value – unaffiliated and collateral on securities loaned, respectively.
Securities lending transactions are entered into by the Fund under Master Securities Lending Agreements (each, an “MSLA”), which provide the right, in the event of default (including bankruptcy or insolvency), for the non-defaulting party to liquidate the collateral and calculate a net exposure to the defaulting party or request additional collateral. In the event that a borrower defaults, the Fund, as lender, would offset the market value of the collateral received against the market value of the securities loaned. When the value of the collateral is greater than that of the market value of the securities loaned, the lender is left with a net amount payable to the defaulting party. However, bankruptcy or insolvency laws of a particular jurisdiction may impose restrictions on or prohibitions against such a right of offset in the event of an MSLA counterparty’s bankruptcy or insolvency. Under the MSLA, absent an event of default, the borrower can resell or re-pledge the loaned securities, and the Fund can reinvest cash collateral received in connection with loaned securities. Upon an event of default, the parties’ obligations to return the securities or collateral to the other party are extinguished, and the parties can resell or re-pledge the loaned securities or the collateral received in connection with the loaned securities in order to satisfy the defaulting party’s net payment obligation for all transactions under the MSLA. The defaulting party remains liable for any deficiency.
The risks of securities lending include the risk that the borrower may not provide additional collateral when required or may not return the securities when due. To mitigate these risks, the Fund benefits from a borrower default indemnity provided by BIM. BIM’s indemnity allows for full replacement of the securities loaned to the extent the collateral received does not cover the value on the securities loaned in the event of borrower default. The Fund could incur a loss if the value of an investment purchased with cash
N O T E S T O F I N A N C I A L S T A T E M E N T S | 21 |
Notes to Financial Statements (continued)
collateral falls below the market value of loaned securities or if the value of an investment purchased with cash collateral falls below the value of the original cash collateral received. Such losses are borne entirely by the Fund.
| 5. | INVESTMENT ADVISORY AGREEMENT AND OTHER TRANSACTIONS WITH AFFILIATES |
Investment Advisory: The Fund entered into an Investment Advisory Agreement with the Manager, the Fund’s investment adviser and an indirect, wholly-owned subsidiary of BlackRock, Inc. (“BlackRock”), to provide investment advisory and administrative services. The Manager is responsible for the management of the Fund’s portfolio and provides the personnel, facilities, equipment and certain other services necessary to the operations of the Fund.
For such services, the Fund pays the Manager a monthly fee at an annual rate equal to the following percentages of the average daily value of the Fund’s net assets:
| Average Daily Net Assets | Investment Advisory Fees | |||
Not exceeding $5 billion | 0.50 | % | ||
In excess of $5 billion | 0.45 | |||
Service and Distribution Fees: The Fund entered into a Distribution Agreement and Distribution Plans with BlackRock Investments, LLC (“BRIL���), an affiliate of the Manager. Pursuant to the Distribution Plans and in accordance with Rule 12b-1 under the 1940 Act, the Fund pays BRIL ongoing service and distribution fees. The fees are accrued daily and paid monthly at annual rates based upon the average daily net assets of the relevant share class of the Fund as follows:
| Share Class | Service Fees | Distribution Fees | ||||||
Investor A | 0.25 | % | N/A | |||||
Investor C | 0.25 | 0.75 | % | |||||
BRIL and broker-dealers, pursuant to sub-agreements with BRIL, provide shareholder servicing and distribution services to the Fund. The ongoing service and/or distribution fee compensates BRIL and each broker-dealer for providing shareholder servicing and/or distribution related services to shareholders.
For the year ended May 31, 2023, the following table shows the class specific service and distribution fees borne directly by each share class of the Fund:
| Investor A | Investor C | Total | ||||||||||||||||||
Service and distribution — class specific | $ | 1,860,936 | $ | 661,119 | $ | 2,522,055 | ||||||||||||||
Administration: The Fund entered into an Administration Agreement with the Manager, an indirect, wholly-owned subsidiary of BlackRock, to provide administrative services. For these services, the Fund pays the Manager a monthly fee at an annual rate of 0.12% of the average daily net assets of the Fund. This fee is shown as administration in the Statement of Operations.
Transfer Agent: Pursuant to written agreements, certain financial intermediaries, some of which may be affiliates, provide the Fund with sub-accounting, recordkeeping, sub-transfer agency and other administrative services with respect to servicing of underlying investor accounts. For these services, these entities receive an asset-based fee or an annual fee per shareholder account, which will vary depending on share class and/or net assets. For the year ended May 31, 2023, the Fund did not pay any amounts to affiliates in return for these services.
The Manager maintains a call center that is responsible for providing certain shareholder services to the Fund. Shareholder services include responding to inquiries and processing purchases and sales based upon instructions from shareholders. For the year ended May 31, 2023, the Fund reimbursed the Manager the following amounts for costs incurred in running the call center, which are included in transfer agent — class specific in the Statement of Operations:
| Institutional | Investor A | Investor C | Class K | Total | ||||||||||||||||||||||||||||||||
Reimbursed amounts | $ | 3,834 | $ | 37,635 | $ | 7,898 | $ | 447 | $ | 49,814 | ||||||||||||||||||||||||||
For the year ended May 31, 2023, the following table shows the class specific transfer agent fees borne directly by each share class of the Fund:
| Institutional | Investor A | Investor C | Class K | Total | ||||||||||||||||||||||||||||||||
Transfer agent — class specific | $ | 430,911 | $ | 819,891 | $ | 93,232 | $ | 5,244 | $ | 1,349,278 | ||||||||||||||||||||||||||
Other Fees: For the year ended May 31, 2023, affiliates earned underwriting discounts, direct commissions and dealer concessions on sales of the Fund’s Investor A Shares for a total of $28,560.
For the year ended May 31, 2023, affiliates received CDSCs as follows:
| Share Class | Amounts | |||
Investor A | $ | 11,501 | ||
Investor C | 6,352 | |||
Expense Limitations, Waivers and Reimbursements: The Manager contractually agreed to waive its investment advisory fees by the amount of investment advisory fees the Fund pays to the Manager indirectly through its investment in affiliated money market funds (the “affiliated money market fund waiver”) through June 30, 2024. The contractual agreement may be terminated upon 90 days’ notice by a majority of the directors who are not “interested persons” of the Fund, as defined in the 1940 Act (“Independent Directors”), or by a vote of a majority of the outstanding voting securities of the Fund. The amount of waivers and/or reimbursements of fees and expenses made
| 22 | 2 0 2 3 B L A C K R O C K A N N U A L R E P O R T T O S H A R E H O L D E R S |
Notes to Financial Statements (continued)
pursuant to the expense limitation described below will be reduced by the amount of the affiliated money market fund waiver. This amount is included in fees waived and/or reimbursed by the Manager in the Statement of Operations. For the year ended May 31, 2023, the amount waived was $6,827.
The Manager has contractually agreed to waive its investment advisory fee with respect to any portion of the Fund’s assets invested in affiliated equity and fixed-income mutual funds and affiliated exchange-traded funds that have a contractual management fee through June 30, 2024. The contractual agreement may be terminated upon 90 days’ notice by a majority of the Independent Directors, or by a vote of a majority of the outstanding voting securities of the Fund. For the year ended May 31, 2023, there were no fees waived by the Manager pursuant to this arrangement.
The Manager contractually agreed to waive and/or reimburse fees or expenses in order to limit expenses, excluding interest expense, dividend expense, tax expense, acquired fund fees and expenses, and certain other fund expenses, which constitute extraordinary expenses not incurred in the ordinary course of the Fund’s business (“expense limitation”). The expense limitations as a percentage of average daily net assets are as follows:
| Institutional | Investor A | Investor C | Class K | |||||||||
0.67% | 0.92 | % | 1.67 | % | 0.62 | % | ||||||
The Manager has agreed not to reduce or discontinue the contractual expense limitations through June 30, 2024, unless approved by the Board, including a majority of the Independent Directors, or by a vote of a majority of the outstanding voting securities of the Fund. For the year ended May 31, 2023, the Manager waived and/or reimbursed $451,683, which is included in fees waived and/or reimbursed by the Manager in the Statement of Operations.
In addition, these amounts waived and/or reimbursed by the Manager are included in transfer agent fees waived and/or reimbursed by the Manager — class specific, in the Statement of Operations. For the year ended May 31, 2023, class specific expense waivers and/or reimbursements were as follows:
| Institutional | Investor A | Investor C | Class K | Total | ||||||||||||||||||||||||||||||||
Transfer agent fees waived and/or reimbursed by the Manager — class specific | $ | 236,388 | $ | 448,464 | $ | 59,900 | $ | 5,244 | $ | 749,996 | ||||||||||||||||||||||||||
Securities Lending: The U.S. Securities and Exchange Commission (“SEC”) has issued an exemptive order which permits BIM, an affiliate of the Manager, to serve as securities lending agent for the Fund, subject to applicable conditions. As securities lending agent, BIM bears all operational costs directly related to securities lending. The Fund is responsible for expenses in connection with the investment of cash collateral received for securities on loan (the “collateral investment expenses”). The cash collateral is invested in a private investment company, Money Market Series, managed by the Manager or its affiliates. However, BIM has agreed to cap the collateral investment expenses of the Money Market Series to an annual rate of 0.04%. The investment adviser to the Money Market Series will not charge any advisory fees with respect to shares purchased by the Fund. The Money Market Series may, under certain circumstances, impose a liquidity fee of up to 2% of the value withdrawn or temporarily restrict withdrawals for up to 10 business days during a 90 day period, in the event that the private investment company’s weekly liquid assets fall below certain thresholds. The Money Market Series seeks current income consistent with maintaining liquidity and preserving capital. Although the Money Market Series is not registered under the 1940 Act, its investments may follow the parameters of investments by a money market fund that is subject to Rule 2a-7 under the 1940 Act.
Securities lending income is equal to the total of income earned from the reinvestment of cash collateral, net of fees and other payments to and from borrowers of securities, and less the collateral investment expenses. The Fund retains a portion of securities lending income and remits a remaining portion to BIM as compensation for its services as securities lending agent.
Pursuant to the current securities lending agreement, the Fund retains 81% of securities lending income (which excludes collateral investment expenses), and this amount retained can never be less than 70% of the total of securities lending income plus the collateral investment expenses.
In addition, commencing the business day following the date that the aggregate securities lending income earned across the BlackRock Multi-Asset Complex in a calendar year exceeds a specified threshold, the Fund, pursuant to the securities lending agreement, will retain for the remainder of that calendar year securities lending income in an amount equal to 81% of securities lending income (which excludes collateral investment expenses), and this amount retained can never be less than 70% of the total of securities lending income plus the collateral investment expenses.
The share of securities lending income earned by the Fund is shown as securities lending income — affiliated — net in the Statement of Operations. For the year ended May 31, 2023, the Fund paid BIM $5,183 for securities lending agent services.
Interfund Lending: In accordance with an exemptive order (the “Order”) from the SEC, the Fund may participate in a joint lending and borrowing facility for temporary purposes (the “Interfund Lending Program”), subject to compliance with the terms and conditions of the Order, and to the extent permitted by the Fund’s investment policies and restrictions. The Fund is currently permitted to borrow under the Interfund Lending Program.
A lending BlackRock fund may lend in aggregate up to 15% of its net assets but may not lend more than 5% of its net assets to any one borrowing fund through the Interfund Lending Program. A borrowing BlackRock fund may not borrow through the Interfund Lending Program or from any other source more than 33 1/3% of its total assets (or any lower threshold provided for by the fund’s investment restrictions). If a borrowing BlackRock fund’s total outstanding borrowings exceed 10% of its total assets, each of its outstanding interfund loans will be subject to collateralization of at least 102% of the outstanding principal value of the loan. All interfund loans are for temporary or emergency purposes and the interest rate to be charged will be the average of the highest current overnight repurchase agreement rate available to a lending fund and the bank loan rate, as calculated according to a formula established by the Board.
During the year ended May 31, 2023, the Fund did not participate in the Interfund Lending Program.
N O T E S T O F I N A N C I A L S T A T E M E N T S | 23 |
Notes to Financial Statements (continued)
Directors and Officers: Certain directors and/or officers of the Fund are directors and/or officers of BlackRock or its affiliates. The Fund reimburses the Manager for a portion of the compensation paid to the Fund’s Chief Compliance Officer, which is included in Directors and Officer in the Statement of Operations.
| 6. | PURCHASES AND SALES |
For the year ended May 31, 2023, purchases and sales of investments, excluding short-term securities, were $413,466,073 and $644,438,319, respectively.
| 7. | INCOME TAX INFORMATION |
It is the Fund’s policy to comply with the requirements of the Internal Revenue Code of 1986, as amended, applicable to regulated investment companies, and to distribute substantially all of its taxable income to its shareholders. Therefore, no U.S. federal income tax provision is required.
The Fund files U.S. federal and various state and local tax returns. No income tax returns are currently under examination. The statute of limitations on the Fund’s U.S. federal tax returns generally remains open for a period of three years after they are filed. The statutes of limitations on the Fund’s state and local tax returns may remain open for an additional year depending upon the jurisdiction.
Management has analyzed tax laws and regulations and their application to the Fund as of May 31, 2023, inclusive of the open tax return years, and does not believe that there are any uncertain tax positions that require recognition of a tax liability in the Fund’s financial statements.
U.S. GAAP requires that certain components of net assets be adjusted to reflect permanent differences between financial and tax reporting. These reclassifications have no effect on net assets or NAVs per share. As of period end, permanent differences attributable to net operating losses and the sale of contributed securities were reclassified to the following accounts:
| ||||
| Amounts | ||||
| ||||
Paid-in capital | $ | (916,450) | ||
Accumulated earnings (loss) | 916,450 | |||
| ||||
The tax character of distributions paid was as follows:
Year Ended 05/31/23 | Year Ended 05/31/22 | |||||||||||
Ordinary income | $ | — | $ | 55,096,876 | ||||||||
Long-term capital gains | 25,654,129 | 191,146,883 | ||||||||||
|
|
|
| |||||||||
| $ | 25,654,129 | $ | 246,243,759 | |||||||||
|
|
|
| |||||||||
| ||||||||||||
As of May 31, 2023, the tax components of accumulated net earnings (loss) were as follows:
| Fund Name | Undistributed long-term capital gains | Net Unrealized Gains (Losses)(a) | Qualified late-year losses(b) | Total | ||||||||||||
BlackRock Large Cap Focus Growth Fund, Inc. | $ | 17,136,416 | $ | 530,117,378 | $ | (1,237,982 | ) | $ | 546,015,812 | |||||||
| (a) | The difference between book-basis and tax-basis net unrealized gains were attributable primarily to the tax deferral of losses on wash sales and the timing and recognition of partnership income. |
| (b) | The Fund has elected to defer certain qualified late-year losses and recognize such losses in the next taxable year. |
As of May 31, 2023, gross unrealized appreciation and depreciation based on cost of investments (including short positions and derivatives, if any) for U.S. federal income tax purposes were as follows:
| ||||||||||||||||||||||||||||
| Fund Name | Tax Cost | Gross Unrealized Appreciation | Gross Unrealized Depreciation | Net Unrealized Appreciation (Depreciation) | ||||||||||||||||||||||||
| ||||||||||||||||||||||||||||
BlackRock Large Cap Focus Growth Fund, Inc | $ | 790,515,524 | $ | 586,334,718 | $ | (56,565,642) | $ | 529,769,076 | ||||||||||||||||||||
| ||||||||||||||||||||||||||||
| 8. | BANK BORROWINGS |
The Fund, along with certain other funds managed by the Manager and its affiliates (“Participating Funds”), is party to a 364-day, $2.50 billion credit agreement with a group of lenders. Under this agreement, the Fund may borrow to fund shareholder redemptions. Excluding commitments designated for certain individual funds, the Participating Funds, including the Fund, can borrow up to an aggregate commitment amount of $1.75 billion at any time outstanding, subject to asset coverage and other limitations as specified in the agreement. The credit agreement has the following terms: a fee of 0.10% per annum on unused commitment amounts and interest at a rate equal to the higher of (a) Overnight Bank Funding Rate (“OBFR”) (but, in any event, not less than 0.00%) on the date the loan is made plus 0.80% per annum, (b) the Fed Funds rate (but, in any event, not less than 0.00%) in effect from time to time plus 0.80% per annum on amounts borrowed or (c) the sum of (x) Daily Simple Secured Overnight Financing Rate (“SOFR”) (but, in any event, not less than 0.00%) on the date the loan is made plus 0.10% and (y) 0.80% per annum. The agreement expires in April 2024 unless extended or
| 24 | 2 0 2 3 B L A C K R O C K A N N U A L R E P O R T T O S H A R E H O L D E R S |
Notes to Financial Statements (continued)
renewed. These fees were allocated among such funds based upon portions of the aggregate commitment available to them and relative net assets of Participating Funds. During the year ended May 31, 2023, the Fund did not borrow under the credit agreement.
| 9. | PRINCIPAL RISKS |
In the normal course of business, the Fund invests in securities or other instruments and may enter into certain transactions, and such activities subject the Fund to various risks, including among others, fluctuations in the market (market risk) or failure of an issuer to meet all of its obligations. The value of securities or other instruments may also be affected by various factors, including, without limitation: (i) the general economy; (ii) the overall market as well as local, regional or global political and/or social instability; (iii) regulation, taxation or international tax treaties between various countries; or (iv) currency, interest rate and price fluctuations. Local, regional or global events such as war, acts of terrorism, the spread of infectious illness or other public health issues, recessions, or other events could have a significant impact on the Fund and its investments. The Fund’s prospectus provides details of the risks to which the Fund is subject.
The Fund may be exposed to additional risks when reinvesting cash collateral in money market funds that do not seek to maintain a stable NAV per share of $1.00, which may be subject to redemption gates or liquidity fees under certain circumstances.
Infectious Illness Risk: An outbreak of an infectious illness, such as the COVID-19 pandemic, may adversely impact the economies of many nations and the global economy, and may impact individual issuers and capital markets in ways that cannot be foreseen. An infectious illness outbreak may result in, among other things, closed international borders, prolonged quarantines, supply chain disruptions, market volatility or disruptions and other significant economic, social and political impacts.
Valuation Risk: The market values of equities, such as common stocks and preferred securities or equity related investments, such as futures and options, may decline due to general market conditions which are not specifically related to a particular company. They may also decline due to factors which affect a particular industry or industries. The Fund may invest in illiquid investments. An illiquid investment is any investment that the Fund reasonably expects cannot be sold or disposed of in current market conditions in seven calendar days or less without the sale or disposition significantly changing the market value of the investment. The Fund may experience difficulty in selling illiquid investments in a timely manner at the price that it believes the investments are worth. Prices may fluctuate widely over short or extended periods in response to company, market or economic news. Markets also tend to move in cycles, with periods of rising and falling prices. This volatility may cause the Fund’s NAV to experience significant increases or decreases over short periods of time. If there is a general decline in the securities and other markets, the NAV of the Fund may lose value, regardless of the individual results of the securities and other instruments in which the Fund invests.
The price the Fund could receive upon the sale of any particular portfolio investment may differ from the Fund’s valuation of the investment, particularly for securities that trade in thin or volatile markets or that are valued using a fair valuation technique or a price provided by an independent pricing service. Changes to significant unobservable inputs and assumptions (i.e., publicly traded company multiples, growth rate, time to exit) due to the lack of observable inputs may significantly impact the resulting fair value and therefore the Fund’s results of operations. As a result, the price received upon the sale of an investment may be less than the value ascribed by the Fund, and the Fund could realize a greater than expected loss or lesser than expected gain upon the sale of the investment. The Fund’s ability to value its investments may also be impacted by technological issues and/or errors by pricing services or other third-party service providers.
Counterparty Credit Risk: The Fund may be exposed to counterparty credit risk, or the risk that an entity may fail to or be unable to perform on its commitments related to unsettled or open transactions, including making timely interest and/or principal payments or otherwise honoring its obligations. The Fund manages counterparty credit risk by entering into transactions only with counterparties that the Manager believes have the financial resources to honor their obligations and by monitoring the financial stability of those counterparties. Financial assets, which potentially expose the Fund to market, issuer and counterparty credit risks, consist principally of financial instruments and receivables due from counterparties. The extent of the Fund’s exposure to market, issuer and counterparty credit risks with respect to these financial assets is approximately their value recorded in the Statement of Assets and Liabilities, less any collateral held by the Fund.
Concentration Risk: A diversified portfolio, where this is appropriate and consistent with a fund’s objectives, minimizes the risk that a price change of a particular investment will have a material impact on the NAV of a fund. The investment concentrations within the Fund’s portfolio are disclosed in its Schedule of Investments.
The Fund invests a significant portion of its assets in securities within a single or limited number of market sectors. When a fund concentrates its investments in this manner, it assumes the risk that economic, regulatory, political and social conditions affecting such sectors may have a significant impact on the Fund and could affect the income from, or the value or liquidity of, the Fund’s portfolio. Investment percentages in specific sectors are presented in the Schedule of Investments.
The Fund invests a significant portion of its assets in securities of issuers located in the United States. A decrease in imports or exports, changes in trade regulations, inflation and/or an economic recession in the United States may have a material adverse effect on the U.S. economy and the securities listed on U.S. exchanges. Proposed and adopted policy and legislative changes in the United States may also have a significant effect on U.S. markets generally, as well as on the value of certain securities. Governmental agencies project that the United States will continue to maintain elevated public debt levels for the foreseeable future which may constrain future economic growth. Circumstances could arise that could prevent the timely payment of interest or principal on U.S. government debt, such as reaching the legislative “debt ceiling.” Such non-payment would result in substantial negative consequences for the U.S. economy and the global financial system. If U.S. relations with certain countries deteriorate, it could adversely affect issuers that rely on the United States for trade. The United States has also experienced increased internal unrest and discord. If these trends were to continue, they may have an adverse impact on the U.S. economy and the issuers in which the the Fund invests.
Significant Shareholder Redemption Risk: Certain shareholders may own or manage a substantial amount of fund shares and/or hold their fund investments for a limited period of time. Large redemptions of fund shares by these shareholders may force a fund to sell portfolio securities, which may negatively impact the fund’s NAV, increase the fund’s brokerage costs, and/or accelerate the realization of taxable income/gains and cause the fund to make additional taxable distributions to shareholders.
N O T E S T O F I N A N C I A L S T A T E M E N T S | 25 |
Notes to Financial Statements (continued)
| 10. | CAPITAL SHARE TRANSACTIONS |
Transactions in capital shares for each class were as follows:
| Year Ended 05/31/23 | Year Ended 05/31/22 | |||||||||||||||||||||
| Share Class | Shares | Amount | Shares | Amount | ||||||||||||||||||
Institutional | ||||||||||||||||||||||
Shares sold | 14,317,203 | $ | 75,956,494 | 25,253,091 | $ | 177,601,605 | ||||||||||||||||
Shares issued in reinvestment of distributions | 1,374,767 | 6,947,150 | 9,504,350 | 73,240,034 | ||||||||||||||||||
Shares redeemed | (43,275,703 | ) | (228,194,498 | ) | (38,073,836 | ) | (266,354,448 | ) | ||||||||||||||
|
|
|
|
|
|
|
| |||||||||||||||
| (27,583,733 | ) | $ | (145,290,854 | ) | (3,316,395 | ) | $ | (15,512,809 | ) | |||||||||||||
|
|
|
|
|
|
|
| |||||||||||||||
Investor A | ||||||||||||||||||||||
Shares sold and automatic conversion of shares | 11,435,794 | $ | 53,950,098 | 19,473,867 | $ | 129,105,079 | ||||||||||||||||
Shares issued in reinvestment of distributions | 3,222,113 | 14,611,848 | 16,686,168 | 116,249,565 | ||||||||||||||||||
Shares redeemed | (33,605,562 | ) | (156,839,377 | ) | (29,171,021 | ) | (185,447,866 | ) | ||||||||||||||
|
|
|
|
|
|
|
| |||||||||||||||
| (18,947,655 | ) | $ | (88,277,431 | ) | 6,989,014 | $ | 59,906,778 | |||||||||||||||
|
|
|
|
|
|
|
| |||||||||||||||
Investor C | ||||||||||||||||||||||
Shares sold | 2,267,090 | $ | 7,987,938 | 3,009,432 | $ | 15,325,417 | ||||||||||||||||
Shares issued in reinvestment of distributions | 528,684 | 1,801,406 | 3,191,941 | 17,072,049 | ||||||||||||||||||
Shares redeemed and automatic conversion of shares | (5,967,539 | ) | (20,953,795 | ) | (8,355,776 | ) | (41,395,334 | ) | ||||||||||||||
|
|
|
|
|
|
|
| |||||||||||||||
| (3,171,765 | ) | $ | (11,164,451 | ) | (2,154,403 | ) | $ | (8,997,868 | ) | |||||||||||||
|
|
|
|
|
|
|
| |||||||||||||||
Class K | ||||||||||||||||||||||
Shares sold | 3,620,084 | $ | 19,646,871 | 2,756,371 | $ | 19,751,332 | ||||||||||||||||
Shares issued in reinvestment of distributions | 188,689 | 954,081 | 1,126,413 | 8,699,251 | ||||||||||||||||||
Shares redeemed | (4,591,771 | ) | (24,136,274 | ) | (3,018,656 | ) | (21,661,838 | ) | ||||||||||||||
|
|
|
|
|
|
|
| |||||||||||||||
| (782,998 | ) | $ | (3,535,322 | ) | 864,128 | $ | 6,788,745 | |||||||||||||||
|
|
|
|
|
|
|
| |||||||||||||||
| (50,486,151 | ) | $ | (248,268,058 | ) | 2,382,344 | $ | 42,184,846 | |||||||||||||||
|
|
|
|
|
|
|
| |||||||||||||||
| 11. | SUBSEQUENT EVENTS |
Management has evaluated the impact of all subsequent events on the Fund through the date the financial statements were issued and has determined that there were no subsequent events requiring adjustment or additional disclosure in the financial statements.
| 26 | 2 0 2 3 B L A C K R O C K A N N U A L R E P O R T T O S H A R E H O L D E R S |
Report of Independent Registered Public Accounting Firm
To the Shareholders and the Board of Directors of BlackRock Large Cap Focus Growth Fund, Inc.:
Opinion on the Financial Statements and Financial Highlights
We have audited the accompanying statement of assets and liabilities of BlackRock Large Cap Focus Growth Fund, Inc. (the “Fund”), including the schedule of investments, as of May 31, 2023, the related statement of operations for the year then ended, the statements of changes in net assets for each of the two years in the period then ended, the financial highlights for each of the three years in the period then ended, for the period from September 1, 2019 through May 31, 2020, and for each of the two years in the period ended August 31, 2019, and the related notes.
In our opinion, the financial statements and financial highlights present fairly, in all material respects, the financial position of the Fund as of May 31, 2023, and the results of its operations for the year then ended, the changes in its net assets for each of the two years in the period then ended, and the financial highlights for each of the three years in the period then ended, for the period from September 1, 2019 through May 31, 2020, and for each of the two years in the period ended August 31, 2019, in conformity with accounting principles generally accepted in the United States of America.
Basis for Opinion
These financial statements and financial highlights are the responsibility of the Fund’s management. Our responsibility is to express an opinion on the Fund’s financial statements and financial highlights based on our audits. We are a public accounting firm registered with the Public Company Accounting Oversight Board (United States) (PCAOB) and are required to be independent with respect to the Fund in accordance with the U.S. federal securities laws and the applicable rules and regulations of the Securities and Exchange Commission and the PCAOB.
We conducted our audits in accordance with the standards of the PCAOB. Those standards require that we plan and perform the audit to obtain reasonable assurance about whether the financial statements and financial highlights are free of material misstatement, whether due to error or fraud. The Fund is not required to have, nor were we engaged to perform, an audit of its internal control over financial reporting. As part of our audits we are required to obtain an understanding of internal control over financial reporting but not for the purpose of expressing an opinion on the effectiveness of the Fund’s internal control over financial reporting. Accordingly, we express no such opinion.
Our audits included performing procedures to assess the risks of material misstatement of the financial statements and financial highlights, whether due to error or fraud, and performing procedures that respond to those risks. Such procedures included examining, on a test basis, evidence regarding the amounts and disclosures in the financial statements and financial highlights. Our audits also included evaluating the accounting principles used and significant estimates made by management, as well as evaluating the overall presentation of the financial statements and financial highlights. Our procedures included confirmation of securities owned as of May 31, 2023, by correspondence with custodians or counterparties; when replies were not received, we performed other auditing procedures. We believe that our audits provide a reasonable basis for our opinion.
Deloitte & Touche LLP
Boston, Massachusetts
July 21, 2023
We have served as the auditor of one or more BlackRock investment companies since 1992.
R E P O R T O F I N D E P E N D E N T R E G I S T E R E D P U B L I C A C C O U N T I N G F I R M | 27 |
| Important Tax Information (unaudited) |
The Fund hereby designates the following amount, or maximum amount allowable by law, as capital gain dividends, subject to a long-term capital gains tax rate as noted below, for the fiscal year ended May 31, 2023:
| ||||
| Fund Name | 20% Rate Long-Term Capital Gain Dividends | |||
| ||||
BlackRock Large Cap Focus Growth Fund, Inc. | $ | 25,654,129 | ||
| ||||
| 28 | 2 0 2 3 B L A C K R O C K A N N U A L R E P O R T T O S H A R E H O L D E R S |
Disclosure of Investment Advisory Agreement
The Board of Directors (the “Board,” the members of which are referred to as “Board Members”) of BlackRock Large Cap Focus Growth Fund, Inc. (the “Fund”) met on April 18, 2023 (the “April Meeting”) and May 23-24, 2023 (the “May Meeting”) to consider the approval to continue the investment advisory agreement (the “Agreement”) between the Fund and BlackRock Advisors, LLC (the “Manager” or “BlackRock”), the Fund’s investment advisor.
The Approval Process
Consistent with the requirements of the Investment Company Act of 1940 (the “1940 Act”), the Board considers the approval of the continuation of the Agreement for the Fund on an annual basis. The Board members who are not “interested persons” of the Fund, as defined in the 1940 Act, are considered independent Board members (the “Independent Board Members”). The Board’s consideration entailed a year-long deliberative process during which the Board and its committees assessed BlackRock’s various services to the Fund, including through the review of written materials and oral presentations, and the review of additional information provided in response to requests from the Independent Board Members. The Board had four quarterly meetings per year, each of which extended over a two-day period, as well as additional ad hoc meetings and executive sessions throughout the year, as needed. The committees of the Board similarly met throughout the year. The Board also had an additional one-day meeting to consider specific information regarding the renewal of the Agreement. In considering the renewal of the Agreement, the Board assessed, among other things, the nature, extent and quality of the services provided to the Fund by BlackRock, BlackRock’s personnel and affiliates, including (as applicable): investment management services; accounting oversight; administrative and shareholder services; oversight of the Fund’s service providers; risk management and oversight; and legal, regulatory and compliance services. Throughout the year, including during the contract renewal process, the Independent Board Members were advised by independent legal counsel, and met with independent legal counsel in various executive sessions outside of the presence of BlackRock’s management.
During the year, the Board, acting directly and through its committees, considered information that was relevant to its annual consideration of the renewal of the Agreement, including the services and support provided by BlackRock to the Fund and its shareholders. BlackRock also furnished additional information to the Board in response to specific questions from the Board. Among the matters the Board considered were: (a) investment performance for one-year, three-year, five-year, and/or since inception periods, as applicable, against peer funds, relevant benchmarks, and other performance metrics, as applicable, as well as BlackRock senior management’s and portfolio managers’ analyses of the reasons for any outperformance or underperformance relative to its peers, benchmarks, and other performance metrics, as applicable; (b) fees, including advisory, administration, if applicable, and other amounts paid to BlackRock and its affiliates by the Fund for services; (c) Fund operating expenses and how BlackRock allocates expenses to the Fund; (d) the resources devoted to, risk oversight of, and compliance reports relating to, implementation of the Fund’s investment objective, policies and restrictions, and meeting regulatory requirements; (e) BlackRock’s and the Fund’s adherence to applicable compliance policies and procedures; (f) the nature, character and scope of non-investment management services provided by BlackRock and its affiliates and the estimated cost of such services, as available; (g) BlackRock’s and other service providers’ internal controls and risk and compliance oversight mechanisms; (h) BlackRock’s implementation of the proxy voting policies approved by the Board; (i) the use of brokerage commissions and execution quality of portfolio transactions; (j) BlackRock’s implementation of the Fund’s valuation and liquidity procedures; (k) an analysis of management fees paid to BlackRock for products with similar investment mandates across the open-end fund, exchange-traded fund (“ETF”), closed-end fund, sub-advised mutual fund, separately managed account, collective investment trust, and institutional separate account product channels, as applicable, and the similarities and differences between these products and the services provided as compared to the Fund; (l) BlackRock’s compensation methodology for its investment professionals and the incentives and accountability it creates, along with investment professionals’ investments in the fund(s) they manage; and (m) periodic updates on BlackRock’s business.
Prior to and in preparation for the April Meeting, the Board received and reviewed materials specifically relating to the renewal of the Agreement. The Independent Board Members are continuously engaged in a process with their independent legal counsel and BlackRock to review the nature and scope of the information provided to the Board to better assist its deliberations. The materials provided in connection with the April Meeting included, among other things: (a) information independently compiled and prepared by Broadridge Financial Solutions, Inc. (“Broadridge”), based on either a Lipper classification or Morningstar category, regarding the Fund’s fees and expenses as compared with a peer group of funds as determined by Broadridge (“Expense Peers”) and the investment performance of the Fund as compared with a peer group of funds (“Performance Peers”); (b) information on the composition of the Expense Peers and Performance Peers and a description of Broadridge’s methodology; (c) information on the estimated profits realized by BlackRock and its affiliates pursuant to the Agreement and a discussion of fall-out benefits to BlackRock and its affiliates; (d) a general analysis provided by BlackRock concerning investment management fees received in connection with other types of investment products, such as institutional accounts, sub-advised mutual funds, ETFs, closed-end funds, open-end funds, and separately managed accounts, under similar investment mandates, as well as the performance of such other products, as applicable; (e) a review of non-management fees; (f) the existence, impact and sharing of potential economies of scale, if any, with the Fund; (g) a summary of aggregate amounts paid by the Fund to BlackRock; (h) sales and redemption data regarding the Fund’s shares; and (i) various additional information requested by the Board as appropriate regarding BlackRock’s and the Fund’s operations.
At the April Meeting, the Board reviewed materials relating to its consideration of the Agreement and the Independent Board Members presented BlackRock with questions and requests for additional information. BlackRock responded to these questions and requests with additional written information in advance of the May Meeting.
At the May Meeting, the Board concluded its assessment of, among other things: (a) the nature, extent and quality of the services provided by BlackRock; (b) the investment performance of the Fund as compared to its Performance Peers and to other metrics, as applicable; (c) the advisory fee and the estimated cost of the services and estimated profits realized by BlackRock and its affiliates from their relationship with the Fund; (d) the Fund’s fees and expenses compared to its Expense Peers; (e) the existence and sharing of potential economies of scale; (f) any fall-out benefits to BlackRock and its affiliates as a result of BlackRock’s relationship with the Fund; and (g) other factors deemed relevant by the Board Members.
The Board also considered other matters it deemed important to the approval process, such as other payments made to BlackRock or its affiliates relating to securities lending and cash management, and BlackRock’s services related to the valuation and pricing of Fund portfolio holdings. The Board noted the willingness of BlackRock’s personnel to engage in open, candid discussions with the Board. The Board Members evaluated the information available to it on a fund-by-fund basis. The following paragraphs provide more information about some of the primary factors that were relevant to the Board’s decision. The Board Members did not identify any particular information, or any single factor as determinative, and each Board Member may have attributed different weights to the various items and factors considered.
D I S C L O S U R E O F I N V E S T M E N T A D V I S O R Y A G R E E M E N T | 29 |
Disclosure of Investment Advisory Agreement (continued)
A: Nature, Extent and Quality of the Services Provided by BlackRock
The Board, including the Independent Board Members, reviewed the nature, extent and quality of services provided by BlackRock, including the investment advisory services, and the resulting performance of the Fund. Throughout the year, the Board compared Fund performance to the performance of a comparable group of mutual funds, relevant benchmarks, and performance metrics, as applicable. The Board met with BlackRock’s senior management personnel responsible for investment activities, including the senior investment officers. The Board also reviewed the materials provided by the Fund’s portfolio management team discussing the Fund’s performance, investment strategies and outlook.
The Board considered, among other factors, with respect to BlackRock: the experience of investment personnel generally and the Fund’s portfolio management team; research capabilities; investments by portfolio managers in the funds they manage; portfolio trading capabilities; use of technology; commitment to compliance; credit analysis capabilities; risk analysis and oversight capabilities; and the approach to training and retaining portfolio managers and other research, advisory and management personnel. The Board also considered BlackRock’s overall risk management program, including the continued efforts of BlackRock and its affiliates to address cybersecurity risks and the role of BlackRock’s Risk & Quantitative Analysis Group. The Board engaged in a review of BlackRock’s compensation structure with respect to the Fund’s portfolio management team and BlackRock’s ability to attract and retain high-quality talent and create performance incentives.
In addition to investment advisory services, the Board considered the nature and quality of the administrative and other non-investment advisory services provided to the Fund. BlackRock and its affiliates provide the Fund with certain administrative, shareholder and other services (in addition to any such services provided to the Fund by third parties) and officers and other personnel as are necessary for the operations of the Fund. In particular, BlackRock and its affiliates provide the Fund with administrative services including, among others: (i) responsibility for disclosure documents, such as the prospectus, the summary prospectus (as applicable), the statement of additional information and periodic shareholder reports; (ii) oversight of daily accounting and pricing; (iii) responsibility for periodic filings with regulators; (iv) overseeing and coordinating the activities of third-party service providers including, among others, the Fund’s custodian, fund accountant, transfer agent, and auditor; (v) organizing Board meetings and preparing the materials for such Board meetings; (vi) providing legal and compliance support; (vii) furnishing analytical and other support to assist the Board in its consideration of strategic issues such as the merger, consolidation or repurposing of certain open-end funds; and (viii) performing or managing administrative functions necessary for the operation of the Fund, such as tax reporting, expense management, fulfilling regulatory filing requirements, overseeing the Fund’s distribution partners, and shareholder call center and other services. The Board reviewed the structure and duties of BlackRock’s fund administration, shareholder services, and legal and compliance departments and considered BlackRock’s policies and procedures for assuring compliance with applicable laws and regulations. The Board considered the operation of BlackRock’s business continuity plans.
B: The Investment Performance of the Fund and BlackRock
The Board, including the Independent Board Members, reviewed and considered the performance history of the Fund throughout the year and at the April Meeting. In preparation for the April Meeting, the Board was provided with reports independently prepared by Broadridge, which included an analysis of the Fund’s performance as of December 31, 2022, as compared to its Performance Peers. Broadridge ranks funds in quartiles, ranging from first to fourth, where first is the most desirable quartile position and fourth is the least desirable. In connection with its review, the Board received and reviewed information regarding the investment performance of the Fund as compared to its Performance Peers and the respective Morningstar Category (“Morningstar Category”). The Board and its Performance Oversight Committee regularly review and meet with Fund management to discuss the performance of the Fund throughout the year.
In evaluating performance, the Board focused particular attention on funds with less favorable performance records. The Board also noted that while it found the data provided by Broadridge generally useful, it recognized the limitations of such data, including in particular, that notable differences may exist between a fund and its Performance Peers (for example, the investment objectives and strategies). Further, the Board recognized that the performance data reflects a snapshot of a period as of a particular date and that selecting a different performance period could produce significantly different results. The Board also acknowledged that long-term performance could be impacted by even one period of significant outperformance or underperformance, and that a single investment theme could have the ability to disproportionately affect long-term performance.
The Board noted that for the one-, three- and five-year periods reported, the Fund ranked in the fourth, fourth and third quartiles, respectively, against its Morningstar Category. The Board noted that BlackRock believes that the Morningstar Category is an appropriate performance metric for the Fund, and that BlackRock has explained its rationale for this belief to the Board. The Board and BlackRock reviewed the Fund’s underperformance relative to its Morningstar Category during the applicable periods. The Board was informed that, among other things, underperformance was driven by significant style factor rotation in 2021 and early 2022 out of growth and momentum and into value.
The Board and BlackRock discussed BlackRock’s strategy for improving the Fund’s investment performance. Discussions covered topics such as performance attribution, the Fund’s investment personnel, and the resources appropriate to support the Fund’s investment processes.
C: Consideration of the Advisory/Management Fees and the Estimated Cost of the Services and Estimated Profits Realized by BlackRock and its Affiliates from their Relationship with the Fund
The Board, including the Independent Board Members, reviewed the Fund’s contractual management fee rate compared with those of its Expense Peers. The contractual management fee rate represents a combination of the advisory fee and any administrative fees, before taking into account any reimbursements or fee waivers. The Board also compared the Fund’s total expense ratio, as well as its actual management fee rate, to those of its Expense Peers. The total expense ratio represents a fund’s total net operating expenses, including any 12b-1 or non-12b-1 service fees. The total expense ratio gives effect to any expense reimbursements or fee waivers, and the actual management fee rate gives effect to any management fee reimbursements or waivers. The Board considered that the fee and expense information in the Broadridge report for the Fund reflected information for a specific period and that historical asset levels and expenses may differ from current levels, particularly in a period of market volatility. The Board considered the services provided and the fees charged by BlackRock and its affiliates to other types of clients with similar investment mandates, as applicable, including institutional accounts and sub-advised mutual funds (including mutual funds sponsored by third parties).
The Board received and reviewed statements relating to BlackRock’s financial condition. The Board reviewed BlackRock’s profitability methodology and was also provided with an estimated profitability analysis that detailed the revenues earned and the expenses incurred by BlackRock for services provided to the Fund. The Board reviewed
| 30 | 2 0 2 3 B L A C K R O C K A N N U A L R E P O R T T O S H A R E H O L D E R S |
Disclosure of Investment Advisory Agreement (continued)
BlackRock’s estimated profitability with respect to the Fund and other funds the Board currently oversees for the year ended December 31, 2022 compared to available aggregate estimated profitability data provided for the prior two years. The Board reviewed BlackRock’s estimated profitability with respect to certain other U.S. fund complexes managed by the Manager and/or its affiliates. The Board reviewed BlackRock’s assumptions and methodology of allocating expenses in the estimated profitability analysis, noting the inherent limitations in allocating costs among various advisory products. The Board recognized that profitability may be affected by numerous factors including, among other things, fee waivers and expense reimbursements by the Manager, the types of funds managed, precision of expense allocations and business mix. The Board thus recognized that calculating and comparing profitability at the individual fund level is difficult.
The Board noted that, in general, individual fund or product line profitability of other advisors is not publicly available. The Board reviewed BlackRock’s overall operating margin, in general, compared to that of certain other publicly traded asset management firms. The Board considered the differences between BlackRock and these other firms, including the contribution of technology at BlackRock, BlackRock’s expense management, and the relative product mix.
The Board considered whether BlackRock has the financial resources necessary to attract and retain high quality investment management personnel to perform its obligations under the Agreement and to continue to provide the high quality of services that is expected by the Board. The Board further considered factors including but not limited to BlackRock’s commitment of time and resources, assumption of risk, and liability profile in servicing the Fund, including in contrast to what is required of BlackRock with respect to other products with similar investment mandates across the open-end fund, ETF, closed-end fund, sub-advised mutual fund, separately managed account, collective investment trust, and institutional separate account product channels, as applicable.
The Board noted that the Fund’s contractual management fee rate ranked in the second quartile, and that the actual management fee rate and the total expense ratio each ranked in the first quartile relative to the Fund’s Expense Peers. The Board additionally noted that the Fund has an advisory fee arrangement that includes a breakpoint that adjusts the fee rate downward as the size of the Fund increases above a certain contractually specified level. The Board additionally noted that the breakpoint can, conversely, adjust the advisory fee rate upward as the size of the Fund decreases below the contractually specified level. The Board further noted that BlackRock and the Board have contractually agreed to a cap on the Fund’s total expenses as a percentage of the Fund’s average daily net assets on a class-by-class basis.
D: Economies of Scale
The Board, including the Independent Board Members, considered the extent to which economies of scale might be realized as the assets of the Fund increase, including the existence of fee waivers and/or expense caps, as applicable, noting that any contractual fee waivers and contractual expense caps had been approved by the Board. In its consideration, the Board further considered the continuation and/or implementation of fee waivers and/or expense caps, as applicable. The Board also considered the extent to which the Fund benefits from such economies of scale in a variety of ways, and whether there should be changes in the advisory fee rate or breakpoint structure in order to enable the Fund to more fully participate in these economies of scale. The Board considered the Fund’s asset levels and whether the current fee schedule was appropriate.
E: Other Factors Deemed Relevant by the Board Members
The Board, including the Independent Board Members, also took into account other ancillary or “fall-out” benefits that BlackRock or its affiliates may derive from BlackRock’s respective relationships with the Fund, both tangible and intangible, such as BlackRock’s ability to leverage its investment professionals who manage other portfolios and its risk management personnel, an increase in BlackRock’s profile in the investment advisory community, and the engagement of BlackRock’s affiliates as service providers to the Fund, including for administrative, distribution, securities lending and cash management services. With respect to securities lending, during the year the Board also considered information provided by independent third-party consultants related to the performance of each BlackRock affiliate as securities lending agent. The Board also considered BlackRock’s overall operations and its efforts to expand the scale of, and improve the quality of, its operations. The Board also noted that, subject to applicable law, BlackRock may use and benefit from third-party research obtained by soft dollars generated by certain registered fund transactions to assist in managing all or a number of its other client accounts.
In connection with its consideration of the Agreement, the Board also received information regarding BlackRock’s brokerage and soft dollar practices. The Board received reports from BlackRock which included information on brokerage commissions and trade execution practices throughout the year.
The Board noted the competitive nature of the open-end fund marketplace, and that shareholders are able to redeem their Fund shares if they believe that the Fund’s fees and expenses are too high or if they are dissatisfied with the performance of the Fund.
Conclusion
At the May Meeting, in a continuation of the discussions that occurred during the April Meeting, and as a culmination of the Board’s year-long deliberative process, the Board, including the Independent Board Members, unanimously approved the continuation of the Agreement between the Manager and the Fund for a one-year term ending June 30, 2024. Based upon its evaluation of all of the aforementioned factors in their totality, as well as other information, the Board, including the Independent Board Members, was satisfied that the terms of the Agreement were fair and reasonable and in the best interest of the Fund and its shareholders. In arriving at its decision to approve the Agreement, the Board did not identify any single factor or group of factors as all-important or controlling, but considered all factors together, and different Board Members may have attributed different weights to the various factors considered. The Independent Board Members were advised by independent legal counsel throughout the deliberative process.
D I S C L O S U R E O F I N V E S T M E N T A D V I S O R Y A G R E E M E N T | 31 |
Director and Officer Information
| Independent Directors(a) | ||||||||
Name Year of Birth(b) | Position(s) Held (Length of Service)(c) | Principal Occupation(s) During Past 5 Years | Number of BlackRock-Advised Registered Investment Companies (“RICs”) Consisting of Investment Portfolios (“Portfolios”) Overseen | Public Company and Other Investment Directorships Held During Past 5 Years | ||||
Mark Stalnecker 1951 | Chair of the Board and Director (Since 2019) | Chief Investment Officer, University of Delaware from 1999 to 2013; Trustee and Chair of the Finance and Investment Committees, Winterthur Museum and Country Estate from 2005 to 2016; Member of the Investment Committee, Delaware Public Employees’ Retirement System since 2002; Member of the Investment Committee, Christiana Care Health System from 2009 to 2017; Member of the Investment Committee, Delaware Community Foundation from 2013 to 2014; Director and Chair of the Audit Committee, SEI Private Trust Co. from 2001 to 2014. | 28 RICs consisting of 167 Portfolios | None | ||||
Susan J. Carter 1956 | Director (Since 2019) | Trustee, Financial Accounting Foundation from 2017 to 2021; Advisory Board Member, Center for Private Equity and Entrepreneurship at Tuck School of Business from 1997 to 2021; Director, Pacific Pension Institute from 2014 to 2018; Senior Advisor, Commonfund Capital, Inc. (“CCI”) (investment adviser) in 2015; Chief Executive Officer, CCI from 2013 to 2014; President & Chief Executive Officer, CCI from 1997 to 2013; Advisory Board Member, Girls Who Invest from 2015 to 2018 and Board Member thereof from 2018 to 2022; Advisory Board Member, Bridges Fund Management since 2016; Practitioner Advisory Board Member, Private Capital Research Institute (“PCRI”) since 2017; Lecturer in the Practice of Management, Yale School of Management since 2019; Advisor to Finance Committee, Altman Foundation since 2020; Investment Committee Member, Tostan since 2021; Member of the President’s Counsel, Commonfund since 2023. | 28 RICs consisting of 167 Portfolios | None | ||||
Collette Chilton 1958 | Director (Since 2019) | Chief Investment Officer, Williams College since 2006; Chief Investment Officer, Lucent Asset Management Corporation from 1998 to 2006; Director, Boys and Girls Club of Boston since 2017; Director, B1 Capital since 2018; Director, David and Lucile Packard Foundation since 2020. | 28 RICs consisting of 167 Portfolios | None | ||||
Neil A. Cotty 1954 | Director (Since 2019) | Bank of America Corporation from 1996 to 2015, serving in various senior finance leadership roles, including Chief Accounting Officer from 2009 to 2015, Chief Financial Officer of Global Banking, Markets and Wealth Management from 2008 to 2009, Chief Accounting Officer from 2004 to 2008, Chief Financial Officer of Consumer Bank from 2003 to 2004, Chief Financial Officer of Global Corporate Investment Bank from 1999 to 2002. | 28 RICs consisting of 167 Portfolios | None | ||||
Lena G. Goldberg 1949 | Director (Since 2016) | Director, Pioneer Legal Institute since 2023; Director, Charles Stark Draper Laboratory, Inc. since 2013; Senior Lecturer, Harvard Business School, from 2008 to 2021; FMR LLC/Fidelity Investments (financial services) from 1996 to 2008, serving in various senior roles including Executive Vice President - Strategic Corporate Initiatives and Executive Vice President and General Counsel; Partner, Sullivan & Worcester LLP from 1985 to 1996 and Associate thereof from 1979 to 1985. | 28 RICs consisting of 167 Portfolios | None | ||||
| 32 | 2 0 2 3 B L A C K R O C K A N N U A L R E P O R T T O S H A R E H O L D E R S |
Director and Officer Information (continued)
| Independent Directors(a) | ||||||||
Name Year of Birth(b) | Position(s) Held (Length of Service)(c) | Principal Occupation(s) During Past 5 Years | Number of BlackRock-Advised Registered Investment Companies (“RICs”) Consisting of Investment Portfolios (“Portfolios”) Overseen | Public Company and Other Investment Directorships Held During Past 5 Years | ||||
Henry R. Keizer 1956 | Director (Since 2016) | Director, Park Indemnity Ltd. (captive insurer) from 2010 to 2022. | 28 RICs consisting of 167 Portfolios | GrafTech International Ltd. (materials manufacturing); Sealed Air Corp. (packaging); WABCO (commercial vehicle safety systems) from 2015 to 2020; Hertz Global Holdings (car rental) from 2015 to 2021. | ||||
Cynthia A. Montgomery 1952 | Director (Since 2019) | Professor, Harvard Business School since 1989. | 28 RICs consisting of 167 Portfolios | None | ||||
Donald C. Opatrny 1952 | Director (Since 2015) | Chair of the Board of Phoenix Art Museum since 2022 and Trustee thereof since 2018; Chair of the Investment Committee of The Arizona Community Foundation since 2022 and trustee thereof since 2020; Director, Athena Capital Advisors LLC (investment management firm) from 2013 to 2020; Trustee, Vice Chair, Member of the Executive Committee and Chair of the Investment Committee, Cornell University from 2004 to 2019; President and Trustee, the Center for the Arts, Jackson Hole from 2011 to 2018; Member of the Board and Investment Committee, University School from 2007 to 2018; Member of Affordable Housing Supply Board of Jackson, Wyoming since 2017; Member, Investment Funds Committee, State of Wyoming since 2017; Trustee, Artstor (a Mellon Foundation affiliate) from 2010 to 2015; Member of the Investment Committee, Mellon Foundation from 2009 to 2015; President, Trustee and Member of the Investment Committee, The Aldrich Contemporary Art Museum from 2007 to 2014; Trustee and Chair of the Investment Committee, Community Foundation of Jackson Hole since 2014. | 28 RICs consisting of 167 Portfolios | None | ||||
Kenneth L. Urish 1951 | Director (Since 2019) | Managing Partner, Urish Popeck & Co., LLC (certified public accountants and consultants) since 1976; Past-Chairman of the Professional Ethics Committee of the Pennsylvania Institute of Certified Public Accountants and Committee Member thereof since 2007; Member of External Advisory Board, The Pennsylvania State University Accounting Department since 2001, Emeritus since 2022; Principal, UP Strategic Wealth Investment Advisors, LLC since 2013; Trustee, The Holy Family Institute from 2001 to 2010; President and Trustee, Pittsburgh Catholic Publishing Associates from 2003 to 2008; Director, Inter-Tel from 2006 to 2007; Member, Advisory Board, ESG Competent Boards since 2020. | 28 RICs consisting of 167 Portfolios | None | ||||
D I R E C T O R A N D O F F I C E R I N F O R M A T I O N | 33 |
Director and Officer Information (continued)
| Independent Directors(a) | ||||||||
Name Year of Birth(b) | Position(s) Held (Length of Service)(c) | Principal Occupation(s) During Past 5 Years | Number of BlackRock-Advised Registered Investment Companies (“RICs”) Consisting of Investment Portfolios (“Portfolios”) Overseen | Public Company and Other Investment Directorships Held During Past 5 Years | ||||
Claire A. Walton 1957 | Director (Since 2019) | Advisory Board Member, Grossman School of Business at the University of Vermont since 2023; Advisory Board Member, Scientific Financial Systems since 2022; General Partner of Neon Liberty Capital Management, LLC since 2003; Chief Operating Officer and Chief Financial Officer of Liberty Square Asset Management, LP from 1998 to 2015; Director, Boston Hedge Fund Group from 2009 to 2018; Director, Massachusetts Council on Economic Education from 2013 to 2015; Director, Woodstock Ski Runners from 2013 to 2022. | 28 RICs consisting of 167 Portfolios | None | ||||
| 34 | 2 0 2 3 B L A C K R O C K A N N U A L R E P O R T T O S H A R E H O L D E R S |
Director and Officer Information (continued)
| Interested Directors(a)(d) | ||||||||
Name Year of Birth(b) | Position(s) Held (Length of Service)(c) | Principal Occupation(s) During Past 5 Years | Number of BlackRock-Advised Registered Investment Companies (“RICs”) Consisting of Investment Portfolios (“Portfolios”) Overseen | Public Company and Other Investment Company Directorships Held During Past 5 Years | ||||
Robert Fairbairn 1965 | Director (Since 2015) | Vice Chairman of BlackRock, Inc. since 2019; Member of BlackRock’s Global Executive and Global Operating Committees; Co-Chair of BlackRock’s Human Capital Committee; Senior Managing Director of BlackRock, Inc. from 2010 to 2019; oversaw BlackRock’s Strategic Partner Program and Strategic Product Management Group from 2012 to 2019; Member of the Board of Managers of BlackRock Investments, LLC from 2011 to 2018; Global Head of BlackRock’s Retail and iShares® businesses from 2012 to 2016. | 98 RICs consisting of 268 Portfolios | None | ||||
John M. Perlowski(e) 1964 | Director (Since 2015) President and Chief Executive Officer (Since 2010) | Managing Director of BlackRock, Inc. since 2009; Head of BlackRock Global Accounting and Product Services since 2009; Advisory Director of Family Resource Network (charitable foundation) since 2009. | 100 RICs consisting of 270 Portfolios | None | ||||
| (a) | The address of each Director is c/o BlackRock, Inc., 50 Hudson Yards, New York, New York 10001. |
| (b) | Each Independent Director holds office until his or her successor is duly elected and qualifies or until his or her earlier death, resignation, retirement or removal as provided by the Fund’s by-laws or charter or statute, or until December 31 of the year in which he or she turns 75. Directors who are “interested persons,” as defined in the 1940 Act, serve until their successor is duly elected and qualifies or until their earlier death, resignation, retirement or removal as provided by the Fund’s by-laws or statute, or until December 31 of the year in which they turn 72. The Board may determine to extend the terms of Independent Directors on a case-by-case basis, as appropriate. |
| (c) | Following the combination of Merrill Lynch Investment Managers, L.P. (“MLIM”) and BlackRock, Inc. in September 2006, the various legacy MLIM and legacy BlackRock fund boards were realigned and consolidated into three new fund boards in 2007. In addition, effective January 1, 2019, three BlackRock Fund Complexes were realigned and consolidated into two BlackRock Fund Complexes. As a result, although the chart shows the year that each Independent Director joined the Board, certain Independent Directors first became members of the boards of other BlackRock-advised Funds, legacy MLIM funds or legacy BlackRock funds as follows: Susan J. Carter, 2016; Collette Chilton, 2015; Neil A. Cotty, 2016; Cynthia A. Montgomery, 1994; Mark Stalnecker, 2015; Kenneth L. Urish, 1999; Claire A. Walton, 2016. |
| (d) | Mr. Fairbairn and Mr. Perlowski are both “interested persons,” as defined in the 1940 Act, of the Fund based on their positions with BlackRock, Inc. and its affiliates. Mr. Fairbairn and Mr. Perlowski are also board members of the BlackRock Fixed-Income Complex. |
| (e) | Mr. Perlowski is also a trustee of the BlackRock Credit Strategies Fund and BlackRock Private Investments Fund. |
D I R E C T O R A N D O F F I C E R I N F O R M A T I O N | 35 |
Director and Officer Information (continued)
| Officers Who Are Not Directors(a) | ||||
Name Year of Birth(b) | Position(s) Held (Length of Service) | Principal Occupation(s) During Past 5 Years | ||
Jennifer McGovern 1977 | Vice President (Since 2014) | Managing Director of BlackRock, Inc. since 2016; Director of BlackRock, Inc. from 2011 to 2015; Head of Americas Product Development and Governance for BlackRock’s Global Product Group since 2019; Head of Product Structure and Oversight for BlackRock’s U.S. Wealth Advisory Group from 2013 to 2019. | ||
Trent Walker 1974 | Chief Financial Officer (Since 2021) | Managing Director of BlackRock, Inc. since September 2019; Executive Vice President of PIMCO from 2016 to 2019; Senior Vice President of PIMCO from 2008 to 2015; Treasurer from 2013 to 2019 and Assistant Treasurer from 2007 to 2017 of PIMCO Funds, PIMCO Variable Insurance Trust, PIMCO ETF Trust, PIMCO Equity Series, PIMCO Equity Series VIT, PIMCO Managed Accounts Trust, 2 PIMCO-sponsored interval funds and 21 PIMCO-sponsored closed-end funds. | ||
Jay M. Fife 1970 | Treasurer (Since 2007) | Managing Director of BlackRock, Inc. since 2007. | ||
Charles Park 1967 | Chief Compliance Officer (Since 2014) | Anti-Money Laundering Compliance Officer for certain BlackRock-advised Funds from 2014 to 2015; Chief Compliance Officer of BlackRock Advisors, LLC and the BlackRock-advised Funds in the BlackRock Multi-Asset Complex and the BlackRock Fixed-Income Complex since 2014; Principal of and Chief Compliance Officer for iShares® Delaware Trust Sponsor LLC since 2012 and BlackRock Fund Advisors (“BFA”) since 2006; Chief Compliance Officer for the BFA-advised iShares® exchange traded funds since 2006; Chief Compliance Officer for BlackRock Asset Management International Inc. since 2012. | ||
Lisa Belle 1968 | Anti-Money Laundering Compliance Officer (Since 2019) | Managing Director of BlackRock, Inc. since 2019; Global Financial Crime Head for Asset and Wealth Management of JP Morgan from 2013 to 2019; Managing Director of RBS Securities from 2012 to 2013; Head of Financial Crimes for Barclays Wealth Americas from 2010 to 2012. | ||
Janey Ahn 1975 | Secretary (Since 2019) | Managing Director of BlackRock, Inc. since 2018; Director of BlackRock, Inc. from 2009 to 2017. | ||
| (a) | The address of each Officer is c/o BlackRock, Inc., 50 Hudson Yards, New York, NY 10001. |
| (b) | Officers of the Fund serve at the pleasure of the Board. |
Further information about the Fund’s Directors and Officers is available in the Fund’s Statement of Additional Information, which can be obtained without charge by calling (800) 441-7762.
Effective December 31, 2022, Joseph P. Platt retired as a Director of the Fund.
Effective July 1, 2023, Aaron Wasserman replaced Charles Park as Chief Compliance Officer of the Fund.
| 36 | 2 0 2 3 B L A C K R O C K A N N U A L R E P O R T T O S H A R E H O L D E R S |
Tailored Shareholder Reports for Mutual Funds and ETFs
Effective January 24, 2023, the SEC adopted rule and form amendments to require mutual funds and ETFs to transmit concise and visually engaging streamlined annual and semiannual reports to shareholders that highlight key information. Other information, including financial statements, will no longer appear in a streamlined shareholder report but must be available online, delivered free of charge upon request, and filed on a semiannual basis on Form N-CSR. The rule and form amendments have a compliance date of July 24, 2024. At this time, management is evaluating the impact of these amendments on the shareholder reports for the Fund.
General Information
Quarterly performance, semi-annual and annual reports, current net asset value and other information regarding the Fund may be found on BlackRock’s website, which can be accessed at blackrock.com. Any reference to BlackRock’s website in this report is intended to allow investors public access to information regarding the Fund and does not, and is not intended to, incorporate BlackRock’s website in this report.
Householding
The Fund will mail only one copy of shareholder documents, including prospectuses, annual and semi-annual reports, Rule 30e-3 notices and proxy statements, to shareholders with multiple accounts at the same address. This practice is commonly called “householding” and is intended to reduce expenses and eliminate duplicate mailings of shareholder documents. Mailings of your shareholder documents may be householded indefinitely unless you instruct us otherwise. If you do not want the mailing of these documents to be combined with those for other members of your household, please call the Fund at (800) 441-7762.
Availability of Quarterly Schedule of Investments
The Fund files its complete schedule of portfolio holdings with the SEC for the first and third quarters of each fiscal year as an exhibit to its reports on Form N-PORT. The Fund’s Form N-PORT is available on the SEC’s website at sec.gov. Additionally, the Fund makes its portfolio holdings for the first and third quarters of each fiscal year available at blackrock.com/fundreports.
Availability of Proxy Voting Policies, Procedures and Voting Records
A description of the policies and procedures that the Fund uses to determine how to vote proxies relating to portfolio securities and information about how the Fund voted proxies relating to securities held in the Fund’s portfolio during the most recent 12-month period ended June 30 is available without charge, upon request (1) by calling (800) 441-7762; (2) on the BlackRock website at blackrock.com; and (3) on the SEC’s website at sec.gov.
BlackRock’s Mutual Fund Family
BlackRock offers a diverse lineup of open-end mutual funds crossing all investment styles and managed by experts in equity, fixed-income and tax-exempt investing. Visit blackrock.com for more information.
Shareholder Privileges
Account Information
Call us at (800) 441-7762 from 8:00 AM to 6:00 PM ET on any business day to get information about your account balances, recent transactions and share prices. You can also visit blackrock.com for more information.
Automatic Investment Plans
Investor class shareholders who want to invest regularly can arrange to have $50 or more automatically deducted from their checking or savings account and invested in any of the BlackRock funds.
Systematic Withdrawal Plans
Investor class shareholders can establish a systematic withdrawal plan and receive periodic payments of $50 or more from their BlackRock funds, as long as their account balance is at least $10,000.
Retirement Plans
Shareholders may make investments in conjunction with Traditional, Rollover, Roth, Coverdell, Simple IRAs, SEP IRAs and 403(b) Plans.
BlackRock Privacy Principles
BlackRock is committed to maintaining the privacy of its current and former fund investors and individual clients (collectively, “Clients”) and to safeguarding their non-public personal information. The following information is provided to help you understand what personal information BlackRock collects, how we protect that information and why in certain cases we share such information with select parties.
A D D I T I O N A L I N F O R M A T I O N | 37 |
Additional Information (continued)
If you are located in a jurisdiction where specific laws, rules or regulations require BlackRock to provide you with additional or different privacy-related rights beyond what is set forth below, then BlackRock will comply with those specific laws, rules or regulations.
BlackRock obtains or verifies personal non-public information from and about you from different sources, including the following: (i) information we receive from you or, if applicable, your financial intermediary, on applications, forms or other documents; (ii) information about your transactions with us, our affiliates, or others; (iii) information we receive from a consumer reporting agency; and (iv) from visits to our websites.
BlackRock does not sell or disclose to non-affiliated third parties any non-public personal information about its Clients, except as permitted by law or as is necessary to respond to regulatory requests or to service Client accounts. These non-affiliated third parties are required to protect the confidentiality and security of this information and to use it only for its intended purpose.
We may share information with our affiliates to service your account or to provide you with information about other BlackRock products or services that may be of interest to you. In addition, BlackRock restricts access to non-public personal information about its Clients to those BlackRock employees with a legitimate business need for the information. BlackRock maintains physical, electronic and procedural safeguards that are designed to protect the non-public personal information of its Clients, including procedures relating to the proper storage and disposal of such information.
Fund and Service Providers | ||
Investment Adviser and Administrator | Independent Registered Public Accounting Firm | |
BlackRock Advisors, LLC | Deloitte & Touche LLP | |
Wilmington, DE 19809 | Boston, MA 02116 | |
Accounting Agent and Transfer Agent | Legal Counsel | |
BNY Mellon Investment Servicing (US) Inc. | Sidley Austin LLP | |
Wilmington, DE 19809 | New York, NY 10019 | |
Custodian | Address of the Fund | |
The Bank of New York Mellon | 100 Bellevue Parkway | |
New York, NY 10286 | Wilmington, DE 19809 | |
Distributor | ||
BlackRock Investments, LLC | ||
New York, NY 10001 | ||
| 38 | 2 0 2 3 B L A C K R O C K A N N U A L R E P O R T T O S H A R E H O L D E R S |
Glossary of Terms Used in this Report
| Portfolio Abbreviation | ||
| NVS | Non-Voting Shares | |
G L O S S A R Y O F T E R M S U S E D I N T H I S R E P O R T | 39 |
Want to know more?
blackrock.com | 800-441-7762
This report is intended for current holders. It is not authorized for use as an offer of sale or a solicitation of an offer to buy shares of the Fund unless preceded or accompanied by the Fund’s current prospectus. Past performance results shown in this report should not be considered a representation of future performance. Investment returns and principal value of shares will fluctuate so that shares, when redeemed, may be worth more or less than their original cost. Statements and other information herein are as dated and are subject to change.
FG-5/23-AR
|  |

(b) Not Applicable
| Item 3 – | Audit Committee Financial Expert – The registrant’s board of directors (the “board of directors”) has determined that (i) the registrant has the following audit committee financial experts serving on its audit committee and (ii) each audit committee financial expert is independent: |
Neil A. Cotty
Henry R. Keizer
Kenneth L. Urish
Under applicable securities laws, a person determined to be an audit committee financial expert will not be deemed an “expert” for any purpose, including without limitation for the purposes of Section 11 of the Securities Act of 1933, as a result of being designated or identified as an audit committee financial expert. The designation or identification of a person as an audit committee financial expert does not impose on such person any duties, obligations, or liabilities greater than the duties, obligations, and liabilities imposed on such person as a member of the audit committee and board of directors in the absence of such designation or identification. The designation or identification of a person as an audit committee financial expert does not affect the duties, obligations, or liability of any other member of the audit committee or board of directors.
| Item 4 – | Principal Accountant Fees and Services |
The following table presents fees billed by Deloitte & Touche LLP (“D&T”) in each of the last two fiscal years for the services rendered to the Fund:
| (a) Audit Fees | (b) Audit-Related Fees1 | (c) Tax Fees2 | (d) All Other Fees | |||||||||||||
| Entity Name | Current Fiscal Year End | Previous Fiscal Year End | Current Fiscal Year End | Previous Fiscal Year End | Current Fiscal Year End | Previous Fiscal Year End | Current Fiscal Year End | Previous Fiscal Year End | ||||||||
| BlackRock Large Cap Focus Growth Fund, Inc. | $25,602 | $24,582 | $0 | $213 | $18,400 | $17,800 | $218 | $0 | ||||||||
The following table presents fees billed by D&T that were required to be approved by the registrant’s audit committee (the “Committee”) for services that relate directly to the operations or financial reporting of the Fund and that are rendered on behalf of BlackRock Advisors, LLC (the “Investment Adviser” or “BlackRock”) and entities controlling, controlled by, or under common control with BlackRock (not including any sub-adviser whose role is primarily portfolio management and is subcontracted with or overseen by another investment adviser) that provide ongoing services to the Fund (“Affiliated Service Providers”):
2
| Current Fiscal Year End | Previous Fiscal Year End | |||
(b) Audit-Related Fees1 | $0 | $0 | ||
(c) Tax Fees2 | $0 | $0 | ||
(d) All Other Fees3 | $2,154,000 | $2,098,000 |
1 The nature of the services includes assurance and related services reasonably related to the performance of the audit or review of financial statements not included in Audit Fees, including accounting consultations, agreed-upon procedure reports, attestation reports, comfort letters, out-of-pocket expenses and internal control reviews not required by regulators.
2 The nature of the services includes tax compliance and/or tax preparation, including services relating to the filing or amendment of federal, state or local income tax returns, regulated investment company qualification reviews, taxable income and tax distribution calculations.
3 Non-audit fees of $2,154,000 and $2,098,000 for the current fiscal year and previous fiscal year, respectively, were paid to each Fund’s principal accountant in their entirety by BlackRock, in connection with services provided to the Affiliated Service Providers of each Fund and of certain other funds sponsored and advised by BlackRock or its affiliates for a service organization review and an accounting research tool subscription. These amounts represent aggregate fees paid by BlackRock and were not allocated on a per fund basis.
(e)(1) Audit Committee Pre-Approval Policies and Procedures:
The Committee has adopted policies and procedures with regard to the pre-approval of services. Audit, audit-related and tax compliance services provided to the registrant on an annual basis require specific pre-approval by the Committee. The Committee also must approve other non-audit services provided to the registrant and those non-audit services provided to the Investment Adviser and Affiliated Service Providers that relate directly to the operations and the financial reporting of the registrant. Certain of these non-audit services that the Committee believes are (a) consistent with the SEC’s auditor independence rules and (b) routine and recurring services that will not impair the independence of the independent accountants may be approved by the Committee without consideration on a specific case-by-case basis (“general pre-approval”). The term of any general pre-approval is 12 months from the date of the pre-approval, unless the Committee provides for a different period. Tax or other non-audit services provided to the registrant which have a direct impact on the operations or financial reporting of the registrant will only be deemed pre-approved provided that any individual project does not exceed $10,000 attributable to the registrant or $50,000 per project. For this purpose, multiple projects will be aggregated to determine if they exceed the previously mentioned cost levels.
Any proposed services exceeding the pre-approved cost levels will require specific pre-approval by the Committee, as will any other services not subject to general pre-approval (e.g., unanticipated but permissible services). The Committee is informed of each service approved subject to general pre-approval at the next regularly scheduled in-person board meeting. At this meeting, an analysis of such services is presented to the Committee for ratification. The Committee may delegate to the Committee Chairman the authority to approve the provision of and fees for any specific engagement of permitted non-audit services, including services exceeding pre-approved cost levels.
(e)(2) None of the services described in each of Items 4(b) through (d) were approved by the Committee pursuant to the de minimis exception in paragraph (c)(7)(i)(C) of Rule 2-01 of Regulation S-X.
(f) Not Applicable
(g) The aggregate non-audit fees, defined as the sum of the fees shown under “Audit-Related Fees,” “Tax
3
Fees” and “All Other Fees,” paid to the accountant for services rendered by the accountant to the registrant, the Investment Adviser and the Affiliated Service Providers were:
| Entity Name | Current Fiscal Year End | Previous Fiscal Year End | ||||
| BlackRock Large Cap Focus Growth Fund, Inc. | $18,618 | $18,013 |
Additionally, the amounts billed by D&T in connection with services provided to the Affiliated Service Providers of the Fund and of other funds sponsored and advised by BlackRock or its affiliates during the current and previous fiscal years for a service organization review and an accounting research tool subscription were:
Current Fiscal Year End | Previous Fiscal Year End | |
$2,154,000 | $2,098,000 |
These amounts represent aggregate fees paid by BlackRock and were not allocated on a per fund basis.
(h) The Committee has considered and determined that the provision of non-audit services that were rendered to the Investment Adviser and the Affiliated Service Providers that were not pre-approved pursuant to paragraph (c)(7)(ii) of Rule 2-01 of Regulation S-X is compatible with maintaining the principal accountant’s independence.
(i) – Not Applicable
(j) – Not Applicable
| Item 5 – | Audit Committee of Listed Registrant – Not Applicable |
| Item 6 – | Investments |
(a) The registrant’s Schedule of Investments is included as part of the Report to Stockholders filed under Item 1(a) of this Form.
(b) Not Applicable due to no such divestments during the semi-annual period covered since the previous Form N-CSR filing.
| Item 7 – | Disclosure of Proxy Voting Policies and Procedures for Closed-End Management Investment Companies – Not Applicable |
| Item 8 – | Portfolio Managers of Closed-End Management Investment Companies – Not Applicable |
| Item 9 – | Purchases of Equity Securities by Closed-End Management Investment Company and Affiliated Purchasers – Not Applicable |
| Item 10 – | Submission of Matters to a Vote of Security Holders – There have been no material changes to these procedures. |
4
| Item 11 – | Controls and Procedures |
(a) The registrant’s principal executive and principal financial officers, or persons performing similar functions, have concluded that the registrant’s disclosure controls and procedures (as defined in Rule 30a-3(c) under the Investment Company Act of 1940, as amended (the “1940 Act”)) are effective as of a date within 90 days of the filing of this report based on the evaluation of these controls and procedures required by Rule 30a-3(b) under the 1940 Act and Rule 15d-15(b) under the Securities Exchange Act of 1934, as amended.
(b) There were no changes in the registrant’s internal control over financial reporting (as defined in Rule 30a-3(d) under the 1940 Act) that occurred during the period covered by this report that have materially affected, or are reasonably likely to materially affect, the registrant’s internal control over financial reporting.
| Item 12 – | Disclosure of Securities Lending Activities for Closed-End Management Investment Companies – Not Applicable |
| Item 13 – | Exhibits attached hereto |
(a)(1) Code of Ethics – See Item 2
(a)(2) Section 302 Certifications are attached
(a)(3) Any written solicitation to purchase securities under Rule 23c-1 – Not Applicable
(a)(4) Change in Registrant’s independent public accountant – Not Applicable
(b) Section 906 Certifications are attached
5
Pursuant to the requirements of the Securities Exchange Act of 1934 and the Investment Company Act of 1940, the registrant has duly caused this report to be signed on its behalf by the undersigned, thereunto duly authorized.
BlackRock Large Cap Focus Growth Fund, Inc
| By: | /s/ John M. Perlowski | |||
| John M. Perlowski | ||||
| Chief Executive Officer (principal executive officer) of | ||||
| BlackRock Large Cap Focus Growth Fund, Inc. |
Date: July 21, 2023
Pursuant to the requirements of the Securities Exchange Act of 1934 and the Investment Company Act of 1940, this report has been signed below by the following persons on behalf of the registrant and in the capacities and on the dates indicated.
| By: | /s/ John M. Perlowski | |||
| John M. Perlowski | ||||
| Chief Executive Officer (principal executive officer) of | ||||
| BlackRock Large Cap Focus Growth Fund, Inc. |
Date: July 21, 2023
| By: | /s/ Trent Walker | |||
| Trent Walker | ||||
| Chief Financial Officer (principal financial officer) of | ||||
| BlackRock Large Cap Focus Growth Fund, Inc. |
Date: July 21, 2023
6