EXHIBIT 1
Management’s
Discussion
and Analysis
| 19 | Overview | |||||||||||
| 19 | Enterprise Mission, Vision, Values and Strategy | |||||||||||
| 20 | Business Profile | |||||||||||
| 21 | Financial Highlights | |||||||||||
| 22 | Corporate Developments | |||||||||||
| 22 | Outlook | |||||||||||
| 22 | Financial Objectives | |||||||||||
| 23 | Accounting and Control Matters | |||||||||||
| 23 | Critical Accounting Policies and Estimates | |||||||||||
| 28 | Changes in Accounting Policies | |||||||||||
| 35 | Disclosure Controls and Procedures | |||||||||||
| 35 | Management’s Report on Internal Control over Financial Reporting | |||||||||||
| 35 | Changes in Internal Control over Financial Reporting | |||||||||||
| 35 | Non-GAAP Financial Measures | |||||||||||
| 36 | Financial Performance | |||||||||||
| 36 | 2010 Consolidated Results of Operations | |||||||||||
| 40 | Fourth Quarter 2010 Performance | |||||||||||
| 43 | Business Segment Results | |||||||||||
| 43 | SLF Canada | |||||||||||
| 45 | SLF U.S. | |||||||||||
| 47 | MFS Investment Management | |||||||||||
| 49 | SLF Asia | |||||||||||
| 51 | Corporate | |||||||||||
| 52 | Investments | |||||||||||||||
| 58 | Risk Management | |||||||||||||||
| | 58 | | | Risk Management Framework | ||||||||||||
| 58 | Risk Philosophy and Principles | |||||||||||||||
| 59 | Accountability | |||||||||||||||
| 60 | Risk Management Policies | |||||||||||||||
| 60 | Risk Categories | |||||||||||||||
| 60 | Credit Risk | |||||||||||||||
| 60 | Market Risk | |||||||||||||||
| 65 | Insurance Risk | |||||||||||||||
| 65 | Operational Risk | |||||||||||||||
| 67 | Strategic Risk | |||||||||||||||
| 67 | Capital and Liquidity Management | |||||||||||||||
| 67 | Principal Sources of Funds | |||||||||||||||
| 68 | Liquidity | |||||||||||||||
| 68 | Capital | |||||||||||||||
| 71 | Shareholder Dividends | |||||||||||||||
| 71 | Capital Adequacy | |||||||||||||||
| 72 | Financial Strength Ratings | |||||||||||||||
| 73 | Off-Balance Sheet Arrangements | |||||||||||||||
| 73 | Commitments, Guarantees, Contingencies and Reinsurance Matters | |||||||||||||||
| 74 | Legal and Regulatory Proceedings | |||||||||||||||
| Management’s Discussion and Analysis Sun Life Financial Inc. Annual Report 2010 | 17 |
Management’s Discussion and Analysis
February 16, 2011
The following table provides a list of abbreviations frequently used throughout this document.
| Abbreviation | Description | Abbreviation | Description | |||
AIF
AFS
AUM
EPS
GAAP
HFT
IFRS
OSFI | Annual Information Form
Available-for-sale
Assets Under Management
Earnings Per Share
Generally Accepted Accounting Principles
Held-for-trading
International Financial Reporting Standards
Office of the Superintendent of Financial Institutions, Canada | MCCSR
MD&A
OCI
ROE
SEC
Sun Life Assurance
SLF Inc.
Sun Life (U.S.) | Minimum Continuing Capital and Surplus Requirements
Management’s Discussion and Analysis
Other Comprehensive Income
Return on Equity
United States Securities and Exchange Commission
Sun Life Assurance Company of Canada
Sun Life Financial Inc.
Sun Life Assurance Company of Canada (U.S.) |
In this MD&A, SLF Inc. and its consolidated subsidiaries, significant equity investments and joint ventures are collectively referred to as “Sun Life Financial”, the “Company”, “we”, “our” or “us”. Unless otherwise indicated, all information in this MD&A is presented as at and for the year ended December 31, 2010, and amounts are expressed in Canadian dollars. Where information at and for the year ended December 31, 2010, is not available, information available for the latest period before December 31, 2010, is used. Financial information, except where otherwise noted, is presented in accordance with Canadian GAAP, and the accounting requirements of OSFI. Additional information relating to the Company can be found in SLF Inc.’s Consolidated Financial Statements and accompanying notes (“Consolidated Financial Statements”) and AIF for the year ended December 31, 2010, and other documents filed with securities regulators in Canada, which may be accessed at www.sedar.com, and with the SEC, which may be accessed at www.sec.gov.
Use of Non-GAAP Financial Measures
We evaluate our performance on the basis of financial measures prepared in accordance with GAAP and certain non-GAAP financial measures. We believe that these non-GAAP financial measures provide information useful to investors in understanding our performance and facilitate the comparison of the quarterly and full-year results of our ongoing operations. These non-GAAP financial measures do not have any standardized meaning and may not be comparable with similar measures used by other companies. They should not be viewed as an alternative to measures of financial performance determined in accordance with GAAP. Additional information concerning these non-GAAP financial measures and reconciliations to GAAP measures are included in this MD&A under the heading “Non-GAAP Financial Measures”.
Forward-looking Information
Certain statements contained or incorporated by reference in this MD&A, including those relating to our strategies and other statements that are predictive in nature, that depend upon or refer to future events or conditions, or that include words such as “expects”, “anticipates”, “intends”, “plans”, “believes”, “estimates” or similar expressions, are forward-looking information within the meaning of securities laws. Forward-looking information includes the information concerning possible or assumed future results of operations of Sun Life Financial including those set out in this MD&A under Enterprise Mission, Vision, Values and Strategy, Business Profile, Outlook, Financial Objectives, Critical Accounting Policies and Estimates, Changes in Accounting Policies, Financial Performance, SLF Canada, SLF U.S., MFS Investment Management, SLF Asia, Corporate, Investments, Risk Management and Capital and Liquidity Management. These statements represent our expectations, estimates and projections regarding future events and are not historical facts. The forward-looking information contained or incorporated by reference in this MD&A are stated as of the date hereof, are not guarantees of future performance and involve risks and uncertainties that are difficult to predict. Future results and shareholder value may differ materially from those expressed in the forward-looking statements contained or incorporated by reference in this MD&A due to, among other factors, the matters set out under Critical Accounting Policies and Estimates and Risk Management of this MD&A and the factors detailed in its other filings with Canadian and U.S. securities regulators, including its annual and interim financial statements and the notes thereto, which are available for review at www.sedar.com and www.sec.gov.
Factors that could cause actual results to differ materially from expectations include, but are not limited to, changes in legislation and regulations including capital requirements and tax laws; investment losses and defaults and changes to investment valuations; the performance of equity markets; the cost, effectiveness and availability of risk-mitigating hedging programs; losses relating to real estate investments; the creditworthiness of guarantors and counterparties to derivatives; changes and volatility in interest rates and credit/swap spreads; other market risks including movement in credit spreads; risks relating to product design and pricing; market conditions that adversely affect the Company’s capital position or its ability to raise capital; possible sustained economic downturn; regulatory investigations and proceedings and private legal proceedings and class actions relating to practices in the mutual fund, insurance, annuity and financial product distribution industries; risks related to market liquidity; downgrades in financial strength or credit ratings; the ability to attract and retain employees; risks relating to financial modelling errors; the performance of the Company’s investments and investment portfolios managed for clients such as segregated and mutual funds; the impact of mergers and acquisitions; insurance risks including mortality, morbidity, including the occurrence of natural or man-made disasters, pandemic diseases and acts of terrorism; adverse mortality and morbidity experience; uncertainty in the rate of mortality improvement; risks relating to policyholder behaviour; the inability to maintain strong distribution channels and risks relating to market conduct by intermediaries and agents; risks relating to operations in Asia including risks relating to joint ventures; the impact of competition; currency exchange rate fluctuations; business continuity risks; failure of information systems and Internet-enabled technology; breaches of computer security and privacy; dependence on third-party relationships including outsourcing arrangements; the impact of adverse results in the closed block of business; the potential for financial loss related to changes in the environment; the availability, cost and effectiveness of reinsurance; the ineffectiveness of risk management policies and procedures; the impact of higher-than-expected future expense cash flows; and the risks relating to the significant estimates and judgment in calculating taxes. The Company does not undertake any obligation to update or revise its forward-looking information to reflect events or circumstances after the date of this report or to reflect the occurrence of unanticipated events, except as required by law.
| 18 | Sun Life Financial Inc. Annual Report 2010 Management’s Discussion and Analysis |
Overview
| Enterprise Mission, Vision, Values and Strategy | ||||||||
Mission To help customers achieve lifetime financial security. | Vision To be an international leader in protection and wealth management. | |||||||
Values These values guide us in achieving our strategy:
Integrity We are committed to the highest standards of business ethics and good governance.
Engagement We value our diverse, talented workforce and encourage, support and reward them for contributing to the full extent of their potential.
Customer Focus We provide sound financial solutions for our customers and always work with their interests in mind.
Excellence We pursue operational excellence through our dedicated people, our quality products and services, and our value-based risk management.
Value We deliver value to the customers and shareholders we serve and to the communities in which we operate. | ||||||||
Strategy We will leverage our strengths around the world to help our customers achieve lifetime financial security and create value for our shareholders. We will work to achieve our strategy through focused execution of the following six enterprise priorities:
Generate value-building growth Expand distribution capabilities and enhance products and services to sustain profitable top-line growth.
Intensify customer focus Satisfy customer needs by delivering top quality products and services that are grounded in consumer insight.
Enhance productivity and efficiency Continuously improve productivity and efficiency to reduce costs and increase competitiveness.
Strengthen risk management Continue to build a strong risk management culture and practices to maximize shareholder value.
Foster innovation Embed innovation throughout Sun Life to create customer value, improve business results and gain competitive advantage.
Talent management Attract, develop and engage highly talented employees, ready and able to contribute to the full extent of their potential. | ||||||||
| Management’s Discussion and Analysis Sun Life Financial Inc. Annual Report 2010 | 19 |
Business Profile
Sun Life Financial is a leading international financial services organization, offering a diverse range of life and health insurance, savings, investment management, retirement, and pension products and services to both individual and corporate customers. We manage our operations and report our financial results in five business segments: Sun Life Financial Canada (“SLF Canada”), Sun Life Financial United States (“SLF U.S.”), MFS Investment Management (“MFS”), Sun Life Financial Asia (“SLF Asia”), and Corporate. The Corporate segment includes the operations of our United Kingdom business unit (“SLF U.K.”) and Corporate Support operations. Our Corporate Support operations include our life reinsurance business, which we sold on December 31, 2010, and our run-off reinsurance business as well as investment income, expenses, capital and other items not allocated to other business segments. Our functional currency is the Canadian dollar. Certain financial information for SLF U.S. and MFS is presented in this MD&A in both Canadian and U.S. dollars.
| Business Segment | Business Units | |
SLF Canada | Individual Insurance & Investments Group Benefits Group Wealth | |
SLF U.S. | Annuities Individual Insurance Employee Benefits Group | |
MFS Investment Management | – | |
SLF Asia | – | |
Corporate | SLF U.K. Corporate Support |
Our business model is one of balance as we strive to establish scale and scope in each of the diversified markets in which we choose to compete. Our model weighs the higher growth prospects of operations in emerging markets against the more established businesses in mature markets. In a similar way, our protection business balances the relatively more volatile wealth management business. It also ensures that our customers have access to complementary insurance, retirement and savings products that meet their specific needs at every stage of their lives. In response to the changing economic and regulatory landscape, we have increased our focus on product designs that provide greater flexibility around pricing and benefits, lower capital requirements and improved longer-term opportunities for sustainable profitable growth. The following table shows our products by business segment.
| Products | SLF Canada | SLF U.S. | MFS | SLF Asia | Corporate | |||||
Individual life insurance | — | — | — | — | ||||||
Individual health insurance | — | — | ||||||||
Individual annuity and savings | — | — | — | — | ||||||
Group life and health | — | — | — | |||||||
Group pension and retirement | — | — | ||||||||
Mutual funds | — | — | — | |||||||
Asset management | — | — | — | — |
Our focus on multi-channel distribution offers customers choices as to how and when they purchase products and access services.
| Distribution Channels | SLF Canada | SLF U.S. | MFS | SLF Asia | ||||||
Sun Life sales agents | — | — | ||||||||
Independent and managing general agents | — | — | — | |||||||
Financial intermediaries (e.g., brokers) | — | — | — | — | ||||||
Banks | — | — | — | |||||||
Pension and benefit consultants | — | — | — | — | ||||||
Direct sales (including Internet and telemarketing) | — | — |
| 20 | Sun Life Financial Inc. Annual Report 2010 Management’s Discussion and Analysis |
Financial Highlights
| ($ millions, unless otherwise noted) | 2010 | 2009 | 2008 | |||||||||||
Common shareholders’ net income (loss) | Operating(1) | 1,583 | 561 | (40 | ) | |||||||||
| Reported | 1,583 | 534 | 785 | |||||||||||
Basic reported EPS ($) | 2.79 | 0.95 | 1.40 | |||||||||||
Diluted EPS(1) | Operating(1) | 2.76 | 0.99 | (0.10 | ) | |||||||||
| Reported | 2.76 | 0.94 | 1.37 | |||||||||||
ROE (%) | Operating(1) | 9.9% | 3.5% | -0.3% | ||||||||||
| Reported | 9.9% | 3.4% | 5.1% | |||||||||||
Dividends per common share ($) | 1.44 | 1.44 | 1.44 | |||||||||||
Dividend payout ratio(2) (%) | 52% | 152% | 103% | |||||||||||
Dividend yield(3) (%) | 5.0% | 5.4% | 3.8% | |||||||||||
MCCSR ratio(4) | 228% | 221% | 232% | |||||||||||
Total Revenue | 24,640 | 27,572 | 15,563 | |||||||||||
Premiums, deposits and fund sales | ||||||||||||||
Premium revenue, including administration services only premium equivalents | 17,768 | 20,004 | 18,613 | |||||||||||
Segregated fund deposits | 10,554 | 11,060 | 10,919 | |||||||||||
Mutual fund sales | 28,468 | 24,642 | 19,327 | |||||||||||
Managed fund sales | 29,641 | 33,525 | 20,944 | |||||||||||
Total premiums, deposits and fund sales | 86,431 | 89,231 | 69,803 | |||||||||||
Assets under management (as at December 31)(5) | ||||||||||||||
General fund assets | 120,859 | 120,091 | 119,842 | |||||||||||
Segregated fund assets | 88,911 | 81,305 | 65,762 | |||||||||||
Mutual fund assets(5) | 107,263 | 96,077 | 83,602 | |||||||||||
Managed fund assets(5) | 146,486 | 134,121 | 110,405 | |||||||||||
Other AUM(5) | 729 | 1,046 | 1,490 | |||||||||||
Total AUM(5) | 464,248 | 432,640 | 381,101 | |||||||||||
Capital (as at December 31) | ||||||||||||||
Subordinated debt and other capital(6) | 4,385 | 4,692 | 3,726 | |||||||||||
Participating policyholders’ equity | 114 | 107 | 106 | |||||||||||
Total shareholders’ equity | 18,245 | 17,230 | 17,226 | |||||||||||
Total capital | 22,744 | 22,029 | 21,058 | |||||||||||
(1) All EPS measures refer to diluted EPS, unless otherwise stated. Operating earnings, operating EPS and operating ROE are non-GAAP measures and exclude certain items described under the heading Non-GAAP Financial Measures. (2) The dividend payout ratio represents the ratio of common shareholders’ dividends to reported common shareholders’ net income. (3) The dividend yield represents the common dividend per share as a percentage of the average of the high and low share price. (4) Represents the MCCSR ratio of Sun Life Assurance. (5) AUM, mutual fund assets, managed fund assets, other AUM and total AUM are non-GAAP financial measures. For additional information, see the section under the heading Non-GAAP Financial Measures. (6) Other capital refers to Sun Life ExchangEable Capital Securities (“SLEECS”), which qualify as capital for Canadian regulatory purposes. Additional information is available in the section Capital and Liquidity Management under the heading Capital. |
| Management’s Discussion and Analysis Sun Life Financial Inc. Annual Report 2010 | 21 |
Corporate Developments
The following developments occurred in 2010.
Sale of Reinsurance Business
On December 31, 2010, we completed the sale our life reinsurance business. The transaction is part of our strategy to deploy capital to parts of our business that can best achieve strong sustainable growth. The sale increased Sun Life Assurance’s MCCSR by 14 points, and did not have a material impact on net income in 2010.
Other Developments
On December 31, 2010, Sun Life Assurance entered into an external reinsurance agreement for the insured business in SLF Canada’s Group Benefits operations. The implementation of this agreement resulted in an increase in Sun Life Assurance’s MCCSR ratio by 12 points and had no impact on net income in 2010.
On July 20, 2010, Sun Life Everbright Life Insurance Company Limited (“Sun Life Everbright”) was restructured as a domestic insurance company. Under the restructuring of our joint venture with China Everbright Group Company (“China Everbright Group”), additional strategic investors were introduced, which reduced our ownership in Sun Life Everbright from 50% to 24.99%.
Common Share Activity
In 2010, SLF Inc. paid common shareholder dividends of $1.44 per common share. This was the same level of dividends paid in 2009. In 2010, SLF Inc. issued approximately 9 million shares from treasury under its Canadian Dividend Reinvestment and Share Plan.
Financing Arrangements
On October 12, 2010, Sun Life Assurance redeemed all of the outstanding $300 million principal amount of 6.65% Debentures, Series 3, due October 12, 2015, issued by Clarica Life Insurance Company (“Clarica”).
On May 25, 2010, SLF Inc. issued $280 million of Class A Non-Cumulative Rate Reset Preferred Shares Series 8R at a price of $25.00 per share and yielding 4.35% annually.
Outlook
Equity markets recorded a second consecutive year of positive returns in 2010. In North America, the economic recovery remained fragile as high unemployment, reduced spending and weakness in the housing market moderated economic growth in the United States, putting downward pressure on interest rates. The growing influence and strong performance of emerging markets such as China and India contributed positively to global economic growth in 2010.
According to the Organization for Economic Development and Cooperation, emerging economies are expected to continue to be the growth engines for the world in 2011. The emerging economies of China, India and Indonesia are expected to achieve growth rates ranging from 6% - 9% in 2011. GDP growth in North America is expected to be moderate, with both the United States and Canada expected to grow at approximately 2%. In the United States the Federal Reserve is expected to maintain its federal funds rate in the range of 0% - 0.25% throughout 2011 to stimulate the economy. In Canada, the economy has fared better than its G7 counterparts, causing the Bank of Canada to raise interest rates three times in 2010 before a pause to further action. However, the Bank of Canada has indicated that any further reduction in monetary policy stimulus would need to be carefully considered.
As we emerge from the financial crisis we are faced with challenges and opportunities. The regulatory environment is evolving as governments and regulators develop enhanced requirements for capital, liquidity and risk management practices to help financial institutions better withstand periods of substantial volatility. For consumers, the financial crisis highlighted the need for greater security and protection of retirement savings. We see several trends that will drive growth in the insurance industry. The aging of the population in North America, the rise of the middle class in the emerging markets of China and India, as well the shifting responsibility from governments and employers to individuals are all expected to increase the demand for private solutions for pension, savings and health care needs.
Financial Objectives
Financial objectives areestablished for the Companyeach year based on our view of future financial performance and the evolving economic and regulatory conditions. In 2010, the following financialobjectives were established:
| • | to achieve an operating ROE in the 12% – 14% range over a three-to-five year period(1), while maintaining a strong capital position and effective capital deployment |
We made progress toward our operating ROE objective in 2010, but remain below our three-to-five year target range. In 2010, the Company generated an operating ROE of 9.9%, which was below our three-to-five year objective, but was higher than our 2009 operating ROE of 3.5%. The improvement in our ROE over 2009 was primarily the result of operating earnings of $1,583 million for the full-year 2010, compared to $561 in 2009. Results for the full year 2010 included $173 million related to improvements in equity markets in excess of assumed levels, the favourable impact of asset liability re-balancing and the favourable impact of the purchase of the United Kingdom operations of Lincoln National Corporation (“Lincoln U.K. acquisition”) in the fourth quarter of 2009. Movements in interest rates contributed $34 million to net income in 2010 as interest rate swap movements more than offset the adverse impact of lower interest rates. These favourable impacts were partially offset by increased expense levels from business initiatives in 2010 and $49 million of unfavourable credit impacts.
(1) Operating ROE is a non-GAAP measure. For additional information, see the section under the heading Non-GAAP Financial Measures. |
| 22 | Sun Life Financial Inc. Annual Report 2010 Management’s Discussion and Analysis |
The operating ROE objective that was established in 2010 was based on the assumptions described below relating to equity market performance, interest rates and credit markets and the Company’s economic and business outlook at the time. The following table summarizes the differences between the assumptions used in establishing our operating ROE objective and the actual experience in 2010.
| Factor | Assumptions | 2010 Experience | ||
Equity Markets | A steady rise in the annual level of equity market indices, primarily the S&P 500, by approximately 7% – 8% | The S&P 500 increased by 13%, while the S&P/TSX Composite Index increased by 14% | ||
Interest Rates | Near-term stability in North American interest rates across the yield curve and over the longer term; interest rates that are generally higher than statutory or contractual minimums required on certain guaranteed products offered by the Company | Interest rates were volatile in 2010 with interest rates on government securities that were generally lower than the prior year | ||
Credit | A credit environment within historical norms, which reflects the Company’s best estimates on credit | Credit conditions improved in 2010 relative to the prior year, however certain asset classes such as commercial mortgages remained under pressure | ||
Currency | Stability in exchange rates between the Canadian dollar and foreign currencies, primarily the U.S. dollar and the British pound sterling | The Canadian dollar appreciated by $0.05 against both the U.S. dollar and British pound in 2010 |
During 2010, we maintained a capital level commensurate with our risk profile, while maintaining a capital efficient structure to optimize shareholder returns. Sun Life Assurance, our principal operating subsidiary in Canada, ended the year with an MCCSR ratio of 228%, well in excess of OSFI’s capital target for life insurance companies.
Our operating ROE objective for 2011 is unchanged from last year. This objective reflects the impact of a low interest rate environment, higher risk management costs and uncertainty in capital markets, expected higher levels of capital required by regulators, as well as the adoption of IFRS.
| • | to achieve an operating ROE in the 12% – 14% range over a three-to-five year period, while maintaining a strong capital position and effective capital deployment |
Our three-to-five year operating ROE objective remains based on the assumptions with respect to equity markets, interest rates, credit and currency described in the table above. It is based on business mix and best estimate actuarial assumptions as at December 31, 2010. In addition, this objective reflects the adoption of IFRS (including a reduction in shareholders equity of $2.2 billion) and revised criteria for variable annuity and segregated fund capital requirements on new business, both of which became effective January 1, 2011. Our operating ROE objective is significantly dependent on business written in the past and reflects economic conditions, capital requirements, pricing and other assumptions in effect at that time.
We expect to maintain the current level of dividends on SLF Inc.’s common shares, which are subject to the approval of the Board of Directors each quarter, provided that economic conditions and the Company’s results allow it to do so while maintaining a strong capital position. The information concerning future dividends is forward-looking information and is based on the assumptions set out above and is subject to the risk factors described under Forward-looking Information. Additional information is provided under the heading Shareholders Dividends.
Accounting and Control Matters
Critical Accounting Policies and Estimates
Our significant accounting and actuarial policies are described in Notes 1, 2, 5 and 9 of our 2010 Consolidated Financial Statements. Management must make judgments involving assumptions and estimates, some of which may relate to matters that are inherently uncertain, under these policies. The estimates described below are considered particularly significant to understanding our financial performance. As part of our financial control and reporting, judgments involving assumptions and estimates are reviewed by the independent auditor and by other independent advisors on a periodic basis. Accounting policies requiring estimates are applied consistently in the determination of our financial results. Unless indicated otherwise, the discussion of Critical Accounting Policies and Estimates is based on Canadian GAAP. Effective January 1, 2011, we adopted IFRS. Additional information regarding IFRS can be found in this section of the document under the heading International Financial Reporting Standards.
Benefits to Policyholders
Our benefit payment obligations are estimated over the life of our annuity and insurance products based on internal valuation models and are recorded in our financial statements, primarily in the form of actuarial liabilities. The determination of these obligations is fundamental to our financial results and requires management to make assumptions about equity market performance, interest rates, asset default, mortality and morbidity rates, policy terminations, expenses and inflation, and other factors over the life of our products.
We use best estimate assumptions for expected future experience. Some assumptions relate to events that are anticipated to occur many years in the future and are likely to require subsequent revision. Additional provisions are included in our actuarial liabilities to provide for possible adverse deviations from the best estimates. If an assumption is more susceptible to volatility or if there is uncertainty about an underlying best estimate assumption, a correspondingly larger provision is included in our actuarial liabilities.
| Management’s Discussion and Analysis Sun Life Financial Inc. Annual Report 2010 | 23 |
In determining these provisions, we ensure that:
| • | when taken one at a time, each provision is reasonable with respect to the underlying best estimate assumption and the extent of uncertainty present in making that assumption; and |
| • | in total, the cumulative effect of all provisions is reasonable with respect to the total actuarial liabilities. |
With the passage of time and the resulting reduction in estimation risk, excess provisions are released into income. In recognition of the long-term nature of policy liabilities, the margin for possible deviations generally increases for contingencies further in the future. The best estimate assumptions and margins for adverse deviations are reviewed annually, and revisions are made where deemed necessary and prudent.
Significant factors affecting the determination of policyholders’ benefits, the methodology by which they are determined, their significance to the Company’s financial condition and results of operations are described below.
Equity Market Movements
The determination of our actuarial liabilities requires that we make estimates about equity market movements.We are exposed to equity markets through our segregated fund and annuity products that provide guarantees linked to underlying fund performance. We have implemented hedging programs involving the use of derivative instruments, in order to help mitigate a portion of the equity market-related volatility in the cost of providing these guarantees to reduce our exposure to this particular class of equity market risk. For these blocks we use stochastic modelling techniques, which test a large number of different scenarios of future market returns, to estimate the actuarial liability for the various guarantees.
In addition, thevalue of our policyholder obligations for certain insurance products is dependent on assumptions about the future level of equity markets. The calculation of actuarial liabilities for equity market-sensitive products includes provisions for moderate changes in rates of equity market return with provisions determined using scenario testing under the standards established by the Canadian Institute of Actuaries. The majority of equities which are designated as HFT support our participating and universal life products where investment returns are passed through to policyholders through routine changes in the amount of dividends declared or in the rate of interest credited. In these cases changes in equity values are largely offset by changes in actuarial liabilities.
Interest Rates
The determination of our actuarial liabilities requires that make estimates about interest rate movements. The value of our policyholder obligations for all policies is sensitive to changes in interest rates. The calculation of actuarial liabilities for all policies includes provisions for moderate changes in interest rates with provisions determined using scenario testing under the standards established by the Canadian Institute of Actuaries. The major part of this sensitivity is offset with a similar sensitivity in the value of the Company’s assets held to support actuarial liabilities.
For certain products, including participating insurance and certain forms of universal life policies and annuities, policyholders share investment performance through routine changes in the amount of dividends declared or in the rate of interest credited. These products generally have minimum interest rate guarantees. Hedging programs are in place to help mitigate the impact of interest rate movements.
Mortality
Our actuarial liabilities include estimates for mortality. Mortality refers to the rates at which death occurs for defined groups of people. Insurance mortality assumptions are generally based on our five-year average experience. For annuities, our experience is generally combined with industry experience, since our own experience is not sufficient to be statistically valid. In general, assumed mortality rates for life insurance contracts do not reflect any future expected improvement, except in some instances where the net effect of reflecting future improvement increases the policy liabilities. For annuities where lower mortality rates result in an increase in liabilities, assumed future mortality rates are adjusted to reflect estimated future improvements.
Morbidity
Our actuarial liabilities include estimates for morbidity. Morbidity refers to both the rates of accident or sickness and the rates of recovery therefrom. Most of our disability insurance is marketed on a group basis. In Canada and in Asia, we offer critical illness policies on an individual basis, and in Canada, we offer long-term care on an individual basis. Medical stop-loss insurance is offered on a group basis in the United States and Canada. In Canada, group morbidity assumptions are based on our five-year average experience, modified to reflect the trend in recovery rates. For long-term care and critical illness insurance, assumptions are developed in collaboration with our reinsurers and are largely based on their experience. In the United States, our experience is used for both medical stop-loss and disability assumptions, with some consideration for industry experience. Larger provisions for adverse deviation are used for those benefits where experience is limited.
Policy Termination Rates
Our actuarial liabilities include estimates for policy termination rates. Policy termination rates refer to the rate at which policies terminate prior to the end of the contractual coverage period. Policyholders may allow their policies to terminate prior to the end of the contractual coverage period by choosing not to continue to pay premiums or by exercising a surrender option in the contract. Assumptions for termination experience on life insurance are generally based on our five-year average experience. Termination rates may vary by plan, age at issue, method of premium payment, and policy duration. For universal life contracts, it is also necessary to set assumptions about premium cessation occurring prior to termination of the policy. Industry experience is considered for certain products where our experience is not sufficient to be statistically valid.
Operating Expenses and Inflation
Actuarial liabilities include estimates for future policy-related expenses. These include the costs of premium collection, claims adjudication and processing, actuarial calculations, preparation and mailing of policy statements and related indirect expenses and overheads. Expense assumptions are mainly based on our recent experience using an internal expense allocation methodology. Future expense assumptions reflect inflation and are consistent with the future interest rates used in the scenario testing under the standards established by the Canadian Institute of Actuaries.
| 24 | Sun Life Financial Inc. Annual Report 2010 Management’s Discussion and Analysis |
Asset Default
Asset default provisions are included in actuarial liabilities for possible future asset defaults over the lifetime of our actuarial liabilities. The amount included in actuarial liabilities is based on possible reductions in the expected future investment yield depending on the creditworthiness of the asset. The underlying asset default assumptions for bonds and mortgages are derived from long-term studies. The bond assumptions are based on total U.S. market experience. The mortgage assumptions are based on the Company’s experience. We have provided $2.9 billion for possible future asset defaults over the lifetime of ouractuarial liabilities as at December 31, 2010. The amount excludes defaults that can be passed through to participating policyholders and excludes provisions for loss in the value of equity and real estate assets supporting actuarial liabilities.
Sensitivities to Best Estimate Assumptions
Our sensitivities relative to our best estimate assumptions are included in the table below. The sensitivities presented below are forward-looking information. They are measures of our estimated net income sensitivity to changes in the best estimate assumptions in our actuarial liabilities based on a starting point and business mix as of December 31, 2010. They reflect the update of actuarial method and assumption changes described in this MD&A under the heading Management Actions and Assumption Changes. Where appropriate, these sensitivities take into account hedging programs in place as at December 31, 2010. A description of these hedging programs can be found in this MD&A under the heading Market Risk. The sensitivity to changes in our accounting estimates in the table below represents the Company’s estimate of changes in market conditions or best estimate assumptions that are reasonably likely based on the Company’s and/or the industry’s historical experience and industry standards and best practices as at December 31, 2010.
Changes to the starting point for interest rates, equity market prices and business mix will result in different estimated sensitivities. Additional information regarding equity and interest rate sensitivities, including key assumptions, can be found in the Risk Management section of this document under the heading Market Risk Sensitivities.
| Critical Accounting Estimate | Sensitivity | Impact on Net Income ($ millions) | ||||
Interest Rates | 1% parallel increase in interest rates across the entire yield curve | 50 – 150 | ||||
1% parallel decrease in interest rates across the entire yield curve | (150) – (250) | |||||
Equity Markets | 10% increase across all equity markets | 25 – 75 | ||||
10% decrease across all equity markets | (125) – (175) | |||||
25% increase across all equity markets | 50 – 150 | |||||
25% decrease across all equity markets | (475) – (575) | |||||
1% reduction in assumed future equity and real estate returns | (350) – (450) | |||||
Mortality | 2% increase in the best estimate assumption – insurance products | (40) | ||||
2% decrease in the best estimate assumption – annuity products | (85) | |||||
Morbidity | 5% adverse change in the best estimate assumption | (110) | ||||
Policy Termination Rates | 10% decrease in the termination rate – where fewer terminations would be financially adverse | (225) | ||||
10% increase in the termination rate – where more terminations would be financially adverse | (80) | |||||
Operating Expenses and Inflation | 5% increase in unit maintenance expenses | (140) | ||||
Fair Value of Investments
HFT and AFS bonds and stocks are recorded at fair value. Changes in fair value of HFT assets are recorded in income, while changes in fair value of AFS assets are recorded in OCI, a component of equity. The fair value of publicly traded fixed maturity and equity securities is determined using quoted market bid prices in active markets that are readily and regularly obtainable, when available. When quoted prices in active markets are not available, the determination of fair value is based on market standard valuation methodologies, which include matrix-pricing, consensus pricing from various broker dealers that are typically the market makers, discounted cash flows or other similar techniques. The assumptions and valuation inputs in applying these market standard valuation methodologies are determined primarily using observable market inputs, which include, but are not limited to, benchmark yields, issuer spreads, reported trades of identical or similar instruments and prepayment speeds. Prices obtained from independent pricing services are validated through back-testing to trade data, comparisons to observable market inputs or other economic indicators, and other qualitative analysis to ensure that the fair value is reasonable. For securities in which the fair value is based solely on non-binding broker quotes that cannot be validated to observable market data, we typically consider the fair value to be based on unobservable inputs, due to a general lack of transparency in the process that the brokers use to develop the prices. Where pricing services or broker dealers are used in determining fair value, generally one quote or price is obtained per security. Quotes and prices obtained from third parties are adjusted in very limited circumstances, such as where there is an error in the information obtained from the pricing service. Stocks that do not have a quoted market price on an active market and are designated as AFS are reported at cost and are not material to our Consolidated Financial Statements.
The fair value of non-publicly traded bonds is determined using a discounted cash flow approach that includes provisions for credit risk, liquidity premium, and the expected maturities of the securities. Since quoted market prices are not readily and regularly obtainable, management judgment is required to estimate the fair value of these bonds. The valuation techniques used are based primarily on observable market prices or rates.
Derivative financial instruments are recorded at fair value with changes in fair value recorded to income unless the derivative is part of a qualifying hedging relationship. The fair value of derivative financial instruments depends upon the type of derivative and is determined primarily using observable market inputs. Fair values of exchange-traded futures are based on quoted market prices. When quoted market prices are not readily available, management estimates fair value using valuation models dependent on the type of
| Management’s Discussion and Analysis Sun Life Financial Inc. Annual Report 2010 | 25 |
derivative. The fair value of interest rate and cross-currency swaps and forward contracts is determined by discounting expected future cash flows using current market interest and exchange rates for similar instruments. Fair value of common stock index swaps and options is determined using the value of underlying securities or indices and option pricing models using index prices, projected dividends and volatility surfaces.
In 2009, we adopted amendments to CICA Handbook Section 3862, Financial Instruments – Disclosures. The amendments include enhanced disclosures related to the fair value of financial instruments and the liquidity risk associated with financial instruments. Specifically, assets and liabilities are categorized based on a three level hierarchy as follows:
Level 1: Fair value is based on unadjusted quoted prices for identical assets or liabilities in an active market. The types of assets and liabilities classified as Level 1 generally include U.S. Treasury and agency securities, cash and cash equivalents, and exchange-traded equities.
Level 2: Fair value is based on quoted prices for similar assets or liabilities in active markets. Valuation is based on significant observable inputs or inputs that are derived principally from or corroborated with observable market data through correlation or other means. The types of assets and liabilities classified as Level 2 generally include government bonds, certain corporate and private bonds, certain asset-backed securities and derivatives.
Level 3: Fair value is based on valuation techniques that require one or more significant inputs that are not based on observable market inputs. These unobservable inputs reflect the Company’s estimates about the assumptions market participants would use in pricing the asset or liability. The types of assets and liabilities classified as Level 3 generally include commercial mortgage-backed securities (“CMBS”), residential mortgage backed securities (“RMBS”), certain structured products and certain corporate bonds.
As pricing inputs become more or less observable, assets are transferred between levels in the hierarchy. For a financial instrument that transfers into Level 3 during the reporting period, the entire change in fair value for the period is included in the Level 3 reconciliation schedule in Note 5.A.iii to our 2010 Consolidated Financial Statements. For transfers out of Level 3 during the reporting period, the change in fair value for the period is excluded from the Level 3 reconciliation schedule in Note 5.A.iii to our 2010 Consolidated Financial Statements. Transfers into Level 3 occur when the inputs used to price the financial instrument lack observable market data and as a result, no longer meet the Level 1 or 2 definition at the reporting date. During the current reporting period, transfers into Level 3 were primarily related to a significant reduction in the trading activity of certain types of securities, which resulted in a change to the pricing source. Transfers out of Level 3 occur when the pricing inputs become more transparent and satisfy the Level 1 or 2 definition at the reporting date. During the current reporting period, transfers out of Level 3 were primarily related to observable market data being available at the reporting date, thus removing the requirement to rely on inputs that lack observability. If a financial instrument is transferred into and out of Level 3 during the same period, it is not included in the Level 3 reconciliation schedule in Note 5.A.iii to our 2010 Consolidated Financial Statements. Total gains and losses in earnings and OCI (loss) are calculated assuming transfers into or out of Level 3 occur at the beginning of the period.
Transfers into and out of Level 3 were $319 million and $442 million, respectively, for the year ended December 31, 2010. The total amount of the net realized/unrealized gains/ (losses) related to securities transferred out of Level 3 during the period, which were excluded from the Level 3 reconciliation, was approximately $54 million.
Real estate held for investment is initially recorded at cost and the carrying value is adjusted towards fair value each quarter by 3% of the difference between fair value and carrying value. The fair value of real estate is based on external appraisals, using expected future net cash flows discounted at current market interest rates.
Mortgages and corporate loans are recorded at amortized cost. The fair value of mortgages and corporate loans is determined by discounting the expected future cash flows using current market interest rates with similar credit risks and terms to maturity.
Due to their nature, the fair values of policy loans and cash are assumed to be equal to their carrying values, which is the amount these items are recorded on the balance sheet. Cash equivalents and short-term securities are recorded at fair value, which is determined based on market yields.
Other invested assets designated as HFT and AFS are primarily investments in segregated funds and mutual funds. These are reported on the Consolidated Balance Sheets at fair value, which is determined by reference to quoted market prices. Other invested assets designated as AFS also include investments in limited partnerships, which are accounted for at cost.
Other-than-Temporary Impairment of Financial Assets and Allowance for Investment Losses
Changes in the fair value of AFS bonds and stocks are recorded as unrealized gains and (losses) in OCI.
AFS bonds are tested for impairment on a quarterly basis. Objective evidence of impairment includes financial difficulty of the issuer, bankruptcy or defaults and delinquency in payments of interest or principal. Where there is objective evidence that an AFS bond is impaired and the decline in value is considered to be other-than-temporary, the loss accumulated in OCI is reclassified to net gains (losses) on AFS assets in the Company’s Consolidated Statement of Operations. If the fair value of an AFS bond recovers after an impairment loss is recognized and the recovery can be objectively related to an event occurring after the impairment loss is recognized in net income, the impairment loss is reversed, and the amount of the impairment loss reversal is recorded in net income. During the year ended December 31, 2010, we did not have any impairment loss reversals on AFS bonds. Following impairment loss recognition or reversal, AFS bonds continue to be recorded at fair value with changes in fair value recorded in OCI and tested quarterly for further impairment loss or reversal. Interest is recognized on previously impaired AFS bonds in accordance with the effective interest rate method.
AFS stocks are tested for impairment on a quarterly basis. All equity instruments in an unrealized loss position are reviewed quarterly to determine if objective evidence of impairment exists. Objective evidence of impairment for an investment in an equity instrument includes, but is not limited to, the financial condition and near-term prospects of the issuer, including information about significant changes with adverse effects that have taken place in the technological, market, economic or legal environment in which the issuer operates that may indicate that the carrying amount will not be recovered, and a significant or prolonged decline in the fair value of an
| 26 | Sun Life Financial Inc. Annual Report 2010 Management’s Discussion and Analysis |
equity instrument below its cost. If, as a result of this review, the security is determined to be other-than-temporarily impaired, it is written down to its fair value. When this occurs, the loss accumulated in OCI is reclassified to net gains (losses) on AFS assets in the Company’s Consolidated Statement of Operations.
For the twelve months ended December 31, 2010, we wrote down $39 million of impaired AFS assets compared to $185 million in 2009. These assets were written down since the length of time that the fair value was less than the cost or the extent and nature of the loss indicated that the fair value would not recover. These write-downs are included in net gains (losses) on AFS assets in the Company’s Consolidated Statement of Operations. There were no write-downs during 2010 ($3 million in 2009) relating to impaired AFS bonds that were part of fair value hedging relationships as described in Note 5.D. to our 2010 Consolidated Financial Statements.
Mortgages and corporate loans are carried at amortized cost, net of allowances for losses. A mortgage or loan is classified as impaired when there is no longer assurance of the timely collection of the full amount of principal and interest. When mortgages or corporate loans are classified as impaired, allowances for losses are established to adjust the carrying value of the asset to its net recoverable amount. The use of different methodologies and assumptions may have a material effect on the estimates of net recoverable amount. We consider various factors when identifying the potential impairment of mortgages and corporate loans. In addition to our ability and intent to hold these invested assets to maturity or until a recovery in value occurs, consideration is given to general economic and business conditions, industry trends, specific developments with regard to security issuers, and available market values. Increases in the allowances are charged against net investment income. Once the conditions causing the impairment improve and future payments are reasonably assured, allowances are reduced and the invested asset is no longer classified as impaired.
As at December 31, 2010, we had net allowances for losses of $216 million on impaired mortgages and corporate loans compared to $116 million as at December 31, 2009. These allowances for losses were recognized since there was no longer reasonable assurance of collection of the estimated future cash flows. The change in allowances for losses is included in the other net investment income in the Company’s Consolidated Statement of Operations.
Goodwill and Other Intangibles
Goodwill represents the excess of the cost of businesses acquired over the fair value of the net identifiable tangible and intangible assets. Goodwill is not amortized, but is assessed for impairment by comparing the carrying values of the appropriate reporting units to their respective fair values. Goodwill is assessed for impairment annually. Goodwill assessment may occur between annual periods if events or circumstances occur that may result in the fair value of a reporting unit falling below its carrying amount. If a potential impairment is identified, it is quantified by comparing the carrying value of the respective goodwill to its fair value. The fair value of the business and subsidiary segments is determined using various valuation models which require management to make judgments and assumptions that could affect the fair value estimates and result in impairment write-downs. During 2010, no goodwill was written down due to impairment.
We had a carrying value of $6.0 billion in goodwill as at December 31, 2010. The goodwill consisted primarily of $3.4 billion arising from the acquisition of Clarica Life Insurance Company in 2002, which decreased by $309 million during 2010 due to the sale of our life reinsurance business, $1.2 billion arising from the acquisition of Keyport Life Insurance Company in the United States in 2001, $437 million arising from the acquisition of CMG Asia Limited (“CMG Asia”) in Hong Kong in 2005, $302 million arising from the acquisition of the Genworth EBG business in the United States in 2007, and $169 million from the Lincoln U.K. acquisition in the United Kingdom in 2009.
Information concerning goodwill under IFRS can be found in this MD&A under the heading, International Financial Reporting Standards.
Other identifiable intangible assets consist of finite-life and indefinite-life intangible assets. Finite-life intangible assets are amortized on a straight-line basis over varying periods of up to 40 years. The useful life of finite-life intangible assets are reviewed annually, and the amortization is adjusted as necessary. Indefinite-life intangibles are not amortized; instead they are assessed for impairment annually or more frequently if events or changes in circumstances indicate that the asset may be impaired. Impairment is determined by comparing the indefinite-life intangible assets’ carrying values to their fair values. If the carrying values of the assets exceed their fair values, these assets are considered impaired and a charge for impairment is recognized. The fair value of intangible assets is determined using various valuation models, which require management to make certain judgments and assumptions that could affect the fair value estimates and result in impairment write-downs. During 2010, none of our indefinite-life intangible assets were written down due to impairment.
As at December 31, 2010, our finite-life intangible assets had a carrying value of $657 million, which reflected the value of the field force and asset administration contracts acquired as part of the Clarica, CMG Asia, and Genworth EBG acquisitions, as well as software costs. Our indefinite-life intangible assets had a carrying value of $241 million as at December 31, 2010. The value of the indefinite-life intangible assets reflected fund management contracts and state licenses.
Income Taxes
Sun Life Financial’s provision for income taxes is calculated based on the expected tax rules of a particular fiscal period. The determination of the required provision for current and future income taxes requires that we interpret tax legislation in the jurisdictions in which we operate and that we make assumptions about the expected timing of realization of future tax assets and liabilities. To the extent that our interpretations differ from those of tax authorities or the timing of realization is not as expected, the provision for income taxes may increase or decrease in future periods to reflect actual experience. The amount of any increase or decrease cannot be reasonably estimated.
Future tax assets are recognized to the extent that the benefits of tax losses and tax deductions are more likely than not to be realized; if it is apparent that it is more likely than not that the benefit of tax losses and tax deductions will not be realized, a future income tax asset is not recognized. At each reporting period, we assess all available evidence, both positive and negative, to determine the amount of future tax assets to be recorded. The assessment requires significant estimates and judgment about future events based on the information available at the reporting date.
| Management’s Discussion and Analysis Sun Life Financial Inc. Annual Report 2010 | 27 |
Pension Plans and Other Post-Retirement Benefits
The Company offers defined benefit pension plans and defined contribution plans for eligible employees. Since January 1, 2009, all new employees in Canada participate in a defined contribution plan, while existing employees continue to accrue future benefits in the prior defined benefit plan. In general, all of our material defined benefit plans worldwide are closed to new entrants and defined contribution plans are provided to new hires. Our defined benefit pension plans offer benefits based on length of service and final average earnings and certain plans offer some indexation of benefits. In addition, in some countries we provide certain post-retirement medical, dental and life insurance benefits to eligible qualifying employees and their dependents upon meeting certain requirements.
Due to the long-term nature of these plans, the calculation of benefit expenses and accrued benefit obligations depends on various assumptions, including discount rates, expected long-term rates of return on assets, rates of compensation increases, medical cost rates, retirement ages, mortality rates and termination rates. Based upon consultation with external pension actuaries, management determines the assumptions used for these plans on an annual basis. Actual experience may differ from the assumed rates, which would impact the pension benefit expenses and accrued benefit obligations in future years. Details of our pension and post-retirement benefit plans and the key assumptions used for these plans are included in Note 22 to our 2010 Consolidated Financial Statements.
The following table provides the potential sensitivity of the benefit obligation and expense for pension and post-retirement benefits to changes in certain key assumptions based on pension and post-retirement obligations as at December 31, 2010. These sensitivities are hypothetical and should be used with caution. The impact of changes in each key assumption may result in greater than proportional changes in sensitivities. The sensitivities are forward-looking information and are based on the assumptions set out and subject to the risk factors described under Forward-looking Information.
Sensitivity of Key Assumptions
| ($ millions) | Pension | Other post- retirement | ||||||||||||||
| Obligation | Expense | Obligation | Expense | |||||||||||||
Impact of a 1% change in key assumptions | ||||||||||||||||
Discount rate | ||||||||||||||||
Decrease in assumption | 362 | 35 | 33 | 2 | ||||||||||||
Increase in assumption | (313 | ) | (33 | ) | (30 | ) | (2 | ) | ||||||||
Expected long-term rate of return on plan assets | ||||||||||||||||
Decrease in assumption | – | 21 | – | – | ||||||||||||
Increase in assumption | – | (21 | ) | – | – | |||||||||||
Rate of compensation increase | ||||||||||||||||
Decrease in assumption | (47 | ) | (10 | ) | – | – | ||||||||||
Increase in assumption | 49 | 11 | – | – | ||||||||||||
Changes in Accounting Policies
Changes in Accounting Policies in 2010
There were no significant changes in accounting policies in 2010.
International Financial Reporting Standards
In accordance with the requirements of the Canadian Accounting Standards Board, we adopted IFRS as of January 1, 2011, and we will begin reporting our results on an IFRS basis in the first quarter of 2011. This section includes the following information and updates:
| • | Status of the key elements of our IFRS changeover plan; |
| • | Impact of the conversion to IFRS on our opening balance sheet and total equity as at January 1, 2010 (“Transition Date”); |
| • | Key impacts on net income; and |
| • | Future IFRS accounting standard changes. |
IFRS Changeover Plan Status
| Key elements and milestones | Status | |||||
Education and training
| ||||||
Ÿ | Provide technical training to staff and management responsible for the production and interpretation of financial statements by Q4 2009 and on-going training on new IFRS developments
| Ÿ | Technical training of staff and management was completed by Q4 2009 and on-going training on new IFRS developments continued throughout 2010 | |||
Ÿ | Training sessions and regular project updates have been provided to the Board of Directors and its Audit Committee since Q2 2008, and will continue | |||||
Ÿ | Provide regular IFRS training sessions and periodic project updates to the Board of Directors and its Audit Committee
| |||||
Ÿ | Determine communications requirements for external stakeholders by Q2 2010 | Ÿ | An education program on the impact of IFRS was developed for external stakeholders and information sessions occurred in the second half of 2010 | |||
| 28 | Sun Life Financial Inc. Annual Report 2010 Management’s Discussion and Analysis |
| Key elements and milestones | Status | |||||
Accounting policy changes and financial reporting
| ||||||
Ÿ | Identify and document policy differences between Canadian GAAP and IFRS by Q4 2009
| Ÿ | Key accounting policy differences between Canadian GAAP and IFRS have been identified and documented | |||
Ÿ | Assess the presentation and disclosure requirements under IFRS and develop pro forma financial statements and key note requirements by Q2 2010
| Ÿ | As new IFRS standards are finalized we will continue to assess the impact on our accounting policies | |||
Ÿ | Pro forma financial statements including major notes requirements have been developed
| |||||
Ÿ | Address interim and annual MD&A disclosure requirements for IFRS
| |||||
Ÿ | Periodic external disclosures are now complete
| |||||
Ÿ | Prepare an opening balance sheet under IFRS as at January 1, 2010, and quarterly 2010 comparatives for reporting commencing in 2011 | Ÿ | We have prepared our opening balance sheet and our 2010 quarterly comparative financial statements are in progress with earlier quarters substantially complete | |||
Information technology and data systems
| ||||||
Ÿ | Identify the impacts on our general ledger and accounting feeder systems as a result of the accounting policy and presentation changes under IFRS by Q4 2009
| Ÿ | Changes to existing systems have been developed, tested and implemented | |||
Ÿ | Process and system controls that apply in the current Canadian GAAP production environment remain in place, and where applicable controls have been modified or added to manage the IFRS conversion and ongoing production of IFRS-based financial statements | |||||
Ÿ | Ensure that IFRS systems remain compliant throughout the transition and implementation phase
| |||||
Ÿ | Assess the impact, and make modifications where necessary to data systems and reporting and analysis tools outside the general ledger and accounting feeder systems | |||||
Ÿ | Accounting and general ledger systems and development of systems outside the general ledger and accounting feeder systems that are critical for interim reporting in 2011 were completed in 2010 | |||||
Impact on business activities
| ||||||
Ÿ | Review products and lines of business impacted by the conversion to IFRS for profitability, pricing, product design and asset-liability management by Q3 2009
| Ÿ | We have completed our review of the impact of IFRS on products and lines of business. The implementation of IFRS on January 1, 2011 is not expected to have a material impact on our business activities. We are monitoring developments with respect to future accounting changes, which are expected to have a more significant impact on our business activities | |||
Ÿ | Review all loan and credit facility documents to ensure compliance under IFRS by Q3 2010
| |||||
Ÿ | Determine the impact of IFRS changes on capital requirements | |||||
Ÿ | Covenants within existing credit facilities have been reviewed internally with no breaches identified | |||||
Ÿ | The impact of conversion on capital requirements is not expected to be material due to the phase-in provisions | |||||
Disclosure Controls and Procedures and Internal Control over Financial Reporting
| ||||||
Ÿ | Identify IFRS policy and related process changes for 2011 reporting (and 2010 comparatives) and assess necessary modifications to our processes and reports
| Ÿ | Our existing ICFR and DC&P have been maintained and additional controls and sign-off processes have been established for the preparation of 2010 comparative financial statements and MD&A disclosure
| |||
Ÿ | Review all key controls and processes in our internal control over financial reporting (“ICFR”) and our disclosure controls and procedures (“DC&P”) under IFRS to ensure the integrity of reporting by Q4 2010 | |||||
Ÿ | Our ICFR and DC&P have been reviewed in light of IFRS policy and related process changes. The required impacts and changes to our ICFR and DC&P have been identified and will be implemented in conjunction with 2011 reporting. The impacts are not significant to our existing ICFR and DC&P | |||||
| Management’s Discussion and Analysis Sun Life Financial Inc. Annual Report 2010 | 29 |
Opening Consolidated Balance Sheet Reconciliation
The following table reconciles the Canadian GAAP Consolidated Balance Sheet to the IFRS Consolidated Balance Sheet as at January 1, 2010. The Canadian GAAP balances have been presented in a format that is consistent with the presentation under IFRS. This includes:
| • | HFT and AFS bonds and stocks have been renamed as debt securities and equity securities, respectively; |
| • | Policy loans, which were previously included in other invested assets, are presented separately; |
| • | Property and equipment and deferred tax assets are presented as distinct line items; and |
| • | Actuarial liabilities and other policy liabilities and amounts on deposit are presented as investment contracts and insurance contracts |
The adjustments to our opening balance sheet have been identified, analyzed and represent our estimate of the impacts to our opening balance sheet position based on current policy choices. These estimates and current policy choices may be subject to change until the issuance of our 2011 Annual Consolidated Financial Statements.
| IFRS ADJUSTMENTS | ||||||||||||||||||||||||
($ millions) As at January 1, 2010 | Canadian GAAP | Reclass(1) | Consolidation(2) | Asset & Contract Remeasurement(3) | IFRS 1 Exemptions & Other(4) | Estimated | ||||||||||||||||||
Assets | ||||||||||||||||||||||||
Cash, cash equivalents and short-term securities | 11,868 | 19 | 47 | – | – | 11,934 | ||||||||||||||||||
Debt securities(1) | 61,307 | – | 288 | (7,680 | ) | – | 53,915 | |||||||||||||||||
Equity securities(1) | 4,966 | – | (11 | ) | 14 | – | 4,969 | |||||||||||||||||
Mortgage and loans | 19,449 | – | 405 | 7,067 | – | 26,921 | ||||||||||||||||||
Derivative assets | 1,382 | – | 65 | 8 | – | 1,455 | ||||||||||||||||||
Other invested assets(1) | 1,077 | – | 19 | 30 | – | 1,126 | ||||||||||||||||||
Policy loans(1) | 3,303 | – | (1 | ) | – | – | 3,302 | |||||||||||||||||
Investment property | 4,877 | (402 | ) | – | 71 | – | 4,546 | |||||||||||||||||
Other assets(1) | 3,307 | 34 | (21 | ) | (12 | ) | (392 | ) | 2,916 | |||||||||||||||
Reinsurance assets | – | 3,334 | – | 9 | – | 3,343 | ||||||||||||||||||
Deferred tax asset(1) (2) | 1,054 | – | (12 | ) | 127 | 143 | 1,312 | |||||||||||||||||
Property and equipment(1) | 156 | 523 | – | (180 | ) | – | 499 | |||||||||||||||||
Intangible assets | 926 | – | – | – | – | 926 | ||||||||||||||||||
Goodwill | 6,419 | – | – | – | (1,829 | ) | 4,590 | |||||||||||||||||
Investments for account of segregated fund holders(1) | – | 81,302 | (754 | ) | – | – | 80,548 | |||||||||||||||||
Total Assets | 120,091 | 84,810 | 25 | (546 | ) | (2,078 | ) | 202,302 | ||||||||||||||||
Liabilities and Equity Liabilities | ||||||||||||||||||||||||
Insurance contracts(1) | 88,939 | (1,649 | ) | (60 | ) | (374 | ) | – | 86,856 | |||||||||||||||
Investment contracts(1) | – | 4,899 | – | 16 | – | 4,915 | ||||||||||||||||||
Derivative liabilities | 1,257 | – | 26 | 11 | – | 1,294 | ||||||||||||||||||
Deferred tax liabilities(2) | 58 | – | – | (2 | ) | (44 | ) | 12 | ||||||||||||||||
Other liabilities(1) | 5,374 | 258 | 808 | 44 | 209 | 6,693 | ||||||||||||||||||
Senior debentures | 3,811 | – | (1,660 | ) | – | – | 2,151 | |||||||||||||||||
Innovative capital instruments | – | – | 1,644 | – | – | 1,644 | ||||||||||||||||||
Subordinated debt | 3,048 | – | – | – | – | 3,048 | ||||||||||||||||||
Deferred net realized gains | 225 | – | – | (225 | ) | – | – | |||||||||||||||||
Insurance contracts for account of segregated fund holders(1) | – | 75,047 | (754 | ) | – | – | 74,293 | |||||||||||||||||
Investment contracts for account of segregated fund holders(1) | – | 6,255 | – | – | – | 6,255 | ||||||||||||||||||
Total Liabilities | 102,712 | 84,810 | 4 | (530 | ) | 165 | 187,161 | |||||||||||||||||
Non-controlling interests | 42 | (24 | ) | – | – | (18 | ) | – | ||||||||||||||||
Total Equity(2) | 17,337 | 24 | 21 | (16 | ) | (2,225 | ) | 15,141 | ||||||||||||||||
Total Equity and Liabilities | 120,091 | 84,810 | 25 | (546 | ) | (2,078 | ) | 202,302 | ||||||||||||||||
(1) These balances have been presented in a format consistent with the presentation under IFRS. (2) Adjustments are shown on a gross basis with the related tax expense (recovery) recorded in the Deferred tax liabilities or Deferred tax asset lines. Changes to the Total Equity line are on a net of tax basis. |
| 30 | Sun Life Financial Inc. Annual Report 2010 Management’s Discussion and Analysis |
Explanation of Significant Adjustments from Canadian GAAP to IFRS
1. Reclassification
These adjustments represent changes in presentation in the Consolidated Balance Sheets as prescribed by IFRS. The significant changes include:
| (i) | Reinsurance assets and insurance contracts |
Canadian GAAP allows reinsurance assets, representing the portion of the insurance contract liabilities covered by reinsurance arrangements, to be netted against actuarial and other policy liabilities. Under IFRS, this netting is not permitted, resulting in the establishment of a reinsurance asset and an increase in the insurance contract liability.
| (ii) | Investments for account of segregated fund holders, and Insurance contracts and Investment contracts for account of segregated fund holders |
Under Canadian GAAP, assets held to cover liabilities related to segregated funds are required to be reported separately from the general fund assets and liabilities of the Company. IFRS requires these balances be included in total assets and total liabilities. Segregated fund liabilities that are classified as investment contracts are presented separately from insurance contract liabilities.
2. Consolidation
We have changed our accounting and measurement for certain investments in joint ventures and special purpose entities under IFRS. Under Canadian GAAP, our investments in joint ventures are reported using the proportionate consolidation method. Under IFRS we have chosen to account for these investments using the equity method. In addition, under IFRS, we are required to consolidate certain special purpose entities (“SPEs”) where we have a controlling interest, based on the substance of the relationship between the Company and the SPE. We have also consolidated the innovative capital instruments, SLEECS, which were issued through Sun Life Capital Trust. These adjustments do not have a significant impact on our total equity or net income on a go forward basis.
3. Assets and Contract Remeasurement
These adjustments reflect differences in measurement and classification under IFRS, which are primarily related to assets, insurance contracts and investment contracts. The most significant change relates to debt instruments not quoted in an active market that are designed as HFT or AFS and measured at fair value under Canadian GAAP. These instruments are classified as loans and receivables under IFRS and as a result have been recorded as mortgages and loans and measured at amortized cost. The impact from this measurement difference in retained earnings is significantly offset as these assets support insurance contract liabilities.
4. IFRS 1 Exemptions and Other
IFRS 1,First time adoption, (“IFRS 1”) is a financial reporting standard that stipulates the requirements for an entity that is preparing IFRS compliant statements for the first time, and applies at the time of changeover. Adjustments in this column reflect the optional exemptions and mandatory exceptions available under IFRS 1and other differences in measurement, which include adjustments related to employee benefits, goodwill impairment, share based payments and the related income tax amounts.
Opening Equity Reconciliation
The following table provides a reconciliation between the total equity reported under Canadian GAAP as at the Transition Date to opening equity under IFRS. The adjustments are presented net of tax and relate to optional elections made under IFRS 1, mandatory accounting policy differences and certain policy choices made upon transition to IFRS. The adjustments to our opening equity position have been identified, analyzed and represent our estimate of the impacts to our opening equity position based on current policy choices. These estimates and current policy choices may be subject to change until the issuance of our 2011 Annual Consolidated Financial Statements.
IFRS Opening Equity Reconciliation – January 1, 2010
| ($ millions) | Item | Capital, Non-controlling Interests and Contributed Surplus | Accumulated OCI | Retained Earnings | Estimated Total | |||||||||||||||
Total as reported under Canadian GAAP | 9,000 | (2,545 | ) | 10,882 | 17,337 | |||||||||||||||
Adjustments to total equity (net of tax): | ||||||||||||||||||||
IFRS 1 Optional Exemptions | ||||||||||||||||||||
Cumulative foreign currency translation adjustments | 1 | – | 2,637 | (2,637 | ) | – | ||||||||||||||
Recognition of deferred actuarial losses on defined benefit plans | 1 | – | – | (329 | ) | (329 | ) | |||||||||||||
Accounting Policy Differences | ||||||||||||||||||||
Impairment of goodwill | 2 | – | – | (1,768 | ) | (1,768 | ) | |||||||||||||
Share-based compensation | (52 | ) | – | (76 | ) | (128 | ) | |||||||||||||
Remeasurement of assets | 3 | – | – | (234 | ) | (234 | ) | |||||||||||||
Remeasurement of insurance contracts | 4 | – | – | 254 | 254 | |||||||||||||||
Remeasurement of investment contracts | – | – | (36 | ) | (36 | ) | ||||||||||||||
Consolidation of special purpose entities | 5 | – | – | 21 | 21 | |||||||||||||||
Derivatives and hedge accounting | – | 40 | (40 | ) | – | |||||||||||||||
Reclassification of non-controlling interests | 24 | – | – | 24 | ||||||||||||||||
Total adjustments to equity under IFRS | (28 | ) | 2,677 | (4,845 | ) | (2,196 | ) | |||||||||||||
Total as reported under IFRS | 8,972 | 132 | 6,037 | 15,141 | ||||||||||||||||
| Management’s Discussion and Analysis Sun Life Financial Inc. Annual Report 2010 | 31 |
Explanation of Significant Adjustments from Canadian GAAP to IFRS
1. IFRS 1 Optional Exemptions(Choice)
IFRS 1 requires retrospective application of all IFRS standards with certain optional exemptions and mandatory exceptions. Where the information for retrospective application of a standard is not readily available, impractical or is cost prohibitive, we have elected to take the following optional exemptions available under IFRS 1.
| (i) | The option to reset all cumulative foreign currency translation differences recorded in accumulated OCI to zero through retained earnings |
| (ii) | The option to recognize all cumulative unrecognized actuarial gains and losses on defined benefit plans under Canadian GAAP. The cumulative amount of actuarial losses recorded on our defined benefit pension plans and other benefits plans has been recognized in retained earnings. |
| (iii) | We have taken the option not to restate the accounting for business combinations or acquisitions made prior to the Transition Date. As a result no adjustments were required to retained earnings or other balances as a result of the adoption of IFRS. |
Other IFRS standards contain mandatory accounting rules for classification and measurement as well as some choices. The explanations for the key remaining adjustments identify the nature of the policy difference.
2. Impairment of Goodwill(Mandatory)
| Canadian GAAP | IFRS | |
| Goodwill is assessed for impairment annually by comparing the carrying values of the appropriate reporting units to their respective fair values. Our reporting units align substantially with our reportable segments – SLF Canada, SLF U.S., MFS, SLF Asia, and Corporate. | Goodwill is assessed for impairment at a more granular level than under Canadian GAAP. The more granular units under IFRS are referred to as cash generating units (“CGUs”), which is the smallest identifiable group of assets that generate cash inflows that are largely independent of the cash inflows from other assets or groups of assets. Reporting units such as SLF Canada and SLF U.S, now consist of a number of CGU’s. Goodwill acquired on prior business combinations has been allocated to the CGU’s expected to benefit from the combination at the time of the acquisition. |
As a result of this accounting policy difference, we have recorded a goodwill impairment charge to opening equity which relates to substantially all of the goodwill recorded on the acquisition of Keyport Life Insurance Company in the United States in 2001 ($1.1 billion) allocated to the Fixed Annuity CGU within SLF U.S. and a portion of the goodwill recorded on the acquisition of Clarica in Canada in 2002 ($0.6 billion) allocated to the Individual business in SLF Canada. This impairment charge reflects the application of IFRS standards based on the economic environment at the Transition Date.
3. Remeasurement of Assets(Choice/Mandatory)
The table below highlights the measurement differences upon transition to IFRS on invested assets and property and equipment. These assets support insurance contracts, investment contracts or surplus.
| Canadian GAAP | IFRS | |
a) Real estate Properties held to earn rental income or capital appreciation, whether or not any part of the property is owner occupied, are measured using the moving average market method where the carrying value is adjusted towards fair value at 3% of the difference each quarter. Similarly, any realized gains or losses are deferred and amortized into income at the rate of 3% of the unamortized balance each quarter. | Investment property (Choice) Properties held predominantly to earn rental income or capital appreciation are classified as investment property and can be measured using either the fair value or cost model. We have chosen to measure these properties using the fair value model at each reporting period with the change reported in income. Realized gains or losses are recorded in income at the time of sale. | |
Property and equipment (Choice) The remaining properties with significant owner occupancy are classified as property and equipment under IFRS and can be measured using the cost model or revaluation model We have chosen to measure these properties using the cost model, which measures the property at cost less accumulated depreciation. Realized gains or losses are recorded in income at the time of sale. | ||
Deferred net realized gains (Mandatory) The unamortized balance of realized gains or losses under Canadian GAAP has been reversed on transition to IFRS. | ||
b) Private debt instruments Private debt Instruments not quoted in an active market are measured at fair value | (Mandatory) Private debt instruments not quoted in an active market are considered loans and receivables and are recorded at amortized cost under IFRS | |
c) Limited partnerships and private equities Investments in limited partnerships and private equities that are not quoted in an active market are measured at cost. | (Mandatory) Under IFRS the measurement of these investments has changed to fair value, where the fair value can be reliably measured. For those investments where fair value cannot be reliably measured, they continue to be measured at cost. |
| 32 | Sun Life Financial Inc. Annual Report 2010 Management’s Discussion and Analysis |
In reporting periods after the Transition Date, the change in investment income on these invested assets and property and equipment will consist of rental income, depreciation expense, mark to market gains or losses and realized gains or losses. This change in income will be substantially offset by the change in insurance contract liabilities where the assets support those liabilities.
4. Remeasurement of Insurance Contracts(Mandatory)
| Canadian GAAP | IFRS | |
| Insurance contracts are determined in accordance with accepted actuarial practice and any requirements of OSFI. The valuation of these contract liabilities is consistent with the Canadian Asset Liability Method (“CALM”). | Under IFRS, contract classification determines the accounting and measurement basis. Our existing life, health and annuity policies will be classified as either insurance contracts, investment contracts or service contracts under IFRS. The majority of our general fund contracts will retain their classification as insurance contracts under IFRS (representing more than 90% of the Canadian GAAP insurance liabilities). The CALM method of valuation of insurance contracts satisfies the IFRS 4 requirements until the adoption of a comprehensive new standard on insurance contracts, which is expected to be applicable no earlier than 2013. |
Under Canadian accepted actuarial practice, the value of the insurance contract liabilities is determined by reference to the carrying value of the assets supporting those liabilities. As a result, for assets supporting insurance contracts, the impact to equity from asset measurement differences between Canadian GAAP and IFRS, as noted in 3 above, is significantly offset by the associated adjustment to insurance contract liabilities.
5. Consolidation of Special Purpose Entities(Mandatory)
| Canadian GAAP | IFRS | |
| Consolidation of an entity is based on one of two models, the variable interests model and the voting interests model. Under the variable interests model, entities are evaluated as variable interest entities based on their equity investment at risk. If an entity is not within the scope of the variable interests model, then it is analyzed using the voting interests model, being the continuing power to govern the financial and operating policies of an entity. | Consolidation under IFRS is based on control which is defined as the power to govern the financial and operating policies of an entity so as to obtain benefits from its activities. A special purpose entity (“SPE”) is an entity created to accomplish a narrow and well-defined objective. The determination of control includes an analysis of the risks and rewards associated with an SPE. |
IFRS requires the consolidation of certain securitized off-balance sheet structures, which were not consolidated under Canadian GAAP. These include collateralized mortgage obligations, collateralized debt obligations and synthetic collateralized debt obligations, which have been recorded as assets on the balance sheet, with an offsetting liability. The retained interest in these special purpose entities was recorded at fair value under Canadian GAAP whereas certain consolidated balances under IFRS are measured at amortized cost, resulting in an adjustment to equity.
Reported Net Income
The key impacts on our net income under IFRS is set out below. These items do not represent a complete list of all changes that will occur as a result of our transition to IFRS. These items have been identified, analyzed and represent our estimate of the impacts to our net income based on current policy choices. These estimates and current policy choices may be subject to change until the issuance of our 2011 Annual Consolidated Financial Statements.
Share-based Compensation
| Canadian GAAP | IFRS | |
| Share-based payment awards issued by MFS that are based on their own shares are accounted for as equity-settled share-based payments. Compensation expense is determined based on the fair value of the awards at the date of grant. Employees are only able to request the repurchase of their shares by MFS after a specified holding period, the length of which was sufficient for the awards to be accounted for as equity settled share-based payment awards. | Share-based payment awards issued by MFS that are based on their own shares are required to be accounted for as cash settled share-based payment awards under IFRS 2, Share-based Payments. The vested and unvested awards, as well as the shares that have been issued under these plans, are recognized as liabilities because employees have the right to request the repurchase of their shares by MFS. The liabilities are measured at fair value at each reporting period until they are vested, exercised and repurchased by MFS. |
The current Canadian GAAP basis provides a comparable compensation expense between reporting periods because the expense is fixed at the date a grant is made. The expense under IFRS will vary with the change in fair value, if any, of the share-based awards and underlying shares, thereby increasing net income volatility. The movement in fair value of both the underlying shares and the share-based payment awards at MFS are influenced by a number of factors including the number of share-based awards outstanding, the financial performance of MFS and changes in option values of MFS shares as determined by a Black-Scholes option-pricing model. Based on the number of awards granted, exercised and vested, as well as an appreciation of MFS shares of 4% per quarter, the additional compensation expense that would be recorded under IFRS would be approximately $20 – $25 million per quarter.
| Management’s Discussion and Analysis Sun Life Financial Inc. Annual Report 2010 | 33 |
Remeasurement of Investment Contracts
| Canadian GAAP | IFRS | |
| Contracts that do not transfer significant insurance risk but do transfer financial risk are not distinguished from insurance contracts and are measured consistently with the Canadian Asset Liability Method (“CALM”). | Contracts, classified as investment contracts, are financial liabilities and measured at fair value through profit or loss or at amortized cost. |
More than 90% of the current Canadian GAAP insurance liabilities will retain their classification as insurance contracts under IFRS. A significant component of our general fund investment contract balance under IFRS at the Transition Date of January 1, 2010 relates to the following series of medium-term notes (“MTNs”):
| MTN Series | Maturity | Status as at December 31, 2010 | Amount (US$ millions) | |||||||||
Series 1 | July 6, 2010 | Redeemed | 900 | |||||||||
Series 2 | July 6, 2011 | Outstanding | 900 | |||||||||
Series 3 | October 6, 2013 | Outstanding | 900 | |||||||||
Under IFRS, these liabilitiesclassified as investment contracts are no longer valued using CALM. Instead, both the liabilities and the supporting assets on these contracts are fair valued, with the difference between the asset and liability movement reflected in net income. Until the MTNs mature in 2013, wemay experience quarterly earnings volatility as the fair value of the assets and the fair value of the liabilities in a particular reporting period may not fully offset.This potential volatility could result in a favourable or unfavourable impact on net income in a reporting period.
Derivatives and Hedge Accounting
| Canadian GAAP | IFRS | |
| Hedge accounting can be applied, if certain conditions are met using the critical terms matching method for both assessing effectiveness and measuring ineffectiveness. | IFRS does not permit the use of the critical terms matching method for the assessment and measurement of effectiveness in a hedging relationship. |
Certain hedging strategies accounted for using hedge accounting under Canadian GAAP do not qualify for hedge accounting under IFRS. For example, we use cross-currency swaps to hedge the foreign currency exposure related to a portion of SLF Canada surplus assets held in U.S. dollar denominated bonds. Under IFRS, a divergence in movement between Canadian and U.S. swap curves will result in income volatility. A parallel increase/(decrease) of 25 basis points in the differential between the Canadian and U.S. swap curve will result in a negative/(positive) earnings impact of approximately $30 million, based on the current size of the investment portfolio and the related cross-currency swaps. While we will not apply hedge accounting under IFRS on this portfolio, the investment strategy and the related hedges continue to be economically viable.This potential volatility could result in a favourable or unfavourable impact on net income in a reporting period.
Earnings per Share
Certain innovative Tier 1 instruments issued by the Company (SLEECS Series A and SLEECS Series B) contain features which enable the holders to convert their securities into preferred shares of Sun Life Assurance. Immediately following this conversion, we have the option to settle the preferred shares with cash or common shares of SLF Inc. Under Canadian GAAP, the potential for dilution is evaluated based on our past experience and expectation that these securities would be settled in cash rather than shares. Under IFRS, diluted EPS must be based on the presumption that these innovative Tier 1 instruments will result in the ultimate issuance of SLF Inc. common shares. The level of dilution to EPS is dependent on the Company’s earnings and share price and the number of convertible instruments outstanding. If these instruments were converted into preferred shares of Sun Life Assurance, 46 million preferred shares of Sun Life Assurance valued at $25 per share would be issued, and these preferred shares would be convertible into Sun Life Financial common shares based on trading price at that time. If the SLEECS Series A are redeemed at their first par call date in 2011, the number of Sun Life Assurance preferred shares issued, if converted, would be reduced to 8 million. Based on a level of earnings consistent with the full year 2010 earnings under Canadian GAAP and a SLF Inc. common share price of $30, the dilution impact on full year EPS, in a year where both SLEECS A and B are outstanding, would be $0.10 per share. If the SLEECS Series A are redeemed, the full year dilution would be reduced to $0.02 per share.
In addition, the diluted EPS under IFRS excludes the impact of stock-based compensation equity awards of MFS, which are accounted for as cash-settled liabilities under IFRS. These awards result in an adjustment to the net income used in the diluted EPS calculation under Canadian GAAP.
Future Accounting Standards
On July 30, 2010, the International Accounting Standards Board (“IASB”) issued an exposure draft for comment, which sets out recognition, measurement and disclosure principles for insurance contracts. The insurance contracts standard under IFRS, as currently drafted, proposes that liabilities be discounted at a rate that is independent of the assets used to support those liabilities. This is in contrast to current rules under Canadian GAAP, where changes in the measurement of assets supporting actuarial liabilities are largely offset by a corresponding change in the measurement of the liabilities.
We have reviewed the exposure draft and submitted a response to the IASB on November 30, 2010. A number of Canadian industry members, groups and associations along with professional services firms also submitted responses to the IASB on this exposure draft. It is expected that measurement changes on insurance contracts, if implemented as drafted, will result in fundamental differences from current provisions in Canadian GAAP, which will likely have a significant impact on our business activities. In addition, the IASB has a project on accounting for financial instruments, with changes to classification, measurement, impairment and hedging. It is expected the mandatory implementation of both these standards will be no earlier than 2013.
| 34 | Sun Life Financial Inc. Annual Report 2010 Management’s Discussion and Analysis |
The IASB continues to make changes to other IFRSs and has a number of ongoing projects. We continue to monitor all of the IASB projects that are in progress to ensure timely implementation and accounting.
Disclosure Controls and Procedures
The Company has established disclosure controls and procedures that are designed to provide reasonable assurance that all relevant information is gathered and reported to senior management, including the Company’s Chief Executive Officer (“CEO”), Executive Vice-President and Chief Financial Officer (“CFO”) and Executive Vice-President, Business Development and General Counsel, on a timely basis so that appropriate decisions can be made regarding public disclosure.
An evaluation of the effectiveness of our disclosure controls and procedures, as defined under rules adopted by the Canadian securities regulatory authorities and the SEC, as of December 31, 2010, was carried out under the supervision of and with the participation of the Company’s management, including the CEO and the CFO. Based on that evaluation, the CEO and the CFO concluded that the design and operation of these disclosure controls and procedures were effective as of December 31, 2010.
Management’s Report on Internal Control over Financial Reporting
Management is responsible for establishing and maintaining adequate internal control over financial reporting to provide reasonable assurance regarding the reliability of our financial reporting and the preparation of our financial statements in accordance with GAAP.
Due to its inherent limitations, internal control over financial reporting may not prevent or detect misstatements on a timely basis. Projections of any evaluation of the effectiveness of internal control over financial reporting to future periods are subject to the risk that the controls may become inadequate because of changes in conditions, or that the degree of compliance with the policies or procedures may deteriorate.
We conducted an assessment of the effectiveness of our internal control over financial reporting, as of December 31, 2010, based on the framework and criteria established in Internal Control – Integrated Framework, issued by the Committee of Sponsoring Organizations of the Treadway Commission. Based on that assessment, we have concluded that our internal control over financial reporting was effective as of December 31, 2010.
Our internal control over financial reporting, as of December 31, 2010, has been audited by Deloitte & Touche LLP, the Company’s Independent Registered Chartered Accountants, who also audited our Consolidated Financial Statements for the year ended December 31, 2010. As stated in the Report of Independent Registered Chartered Accountants, they have expressed an unqualified opinion on our internal control over financial reporting as of December 31, 2010.
Changes in Internal Control over Financial Reporting
No changes were made in our internal control over financial reporting for the period beginning January 1, 2010, and ended December 31, 2010 that have materially affected or are reasonably likely to materially affect our internal control over financial reporting.
Non-GAAP Financial Measures
Management evaluates the Company’s performance on the basis of financial measures prepared in accordance with GAAP and certain non-GAAP financial measures. We believe that these non-GAAP financial measures provide information useful to investors in understanding our performance and facilitate the comparison of the quarterly and full-year results of our ongoing operations. These non-GAAP financial measures do not have any standardized meaning and may not be comparable with similar measures used by other companies. They should not be viewed as an alternative to measures of financial performance determined in accordance with GAAP. Additional information concerning these non-GAAP financial measures and reconciliations to GAAP measures are included in SLF Inc.’s annual and interim MD&A and the Supplementary Financial Information packages that are available on www.sunlife.com under Investors – Financial Results & Reports.
Management measures the Company’s performance based on operating earnings and financial measures based on operating earnings, including operating EPS and operating ROE, that exclude certain items that are not operational or ongoing in nature. Other non-GAAP measures that we use include:
| (i) | financial performance measures that are prepared on a constant currency basis, which exclude the impact of currency fluctuations; |
| (ii) | adjusted revenue, which excludes the impact of currency and fair value changes in HFT assets and derivative instruments from total revenue; |
| (iii) | pre-tax operating profit margin ratios for MFS, the denominator of which excludes certain investment income and includes certain commission expenses, as a means of measuring the underlying profitability of MFS; |
| (iv) | assets under management, mutual fund assets, managed fund assets and other AUM; and |
| (v) | the value of new business is used to measure overall profitability, which is based on actuarial amounts for which there are no comparable amounts under GAAP. |
The following amounts were not included in the Company’s operating earnings in the prior three years.
In the first quarter of 2009, the Company incurred an after-tax charge of $27 million for restructuring costs taken as part of the Company’s actions to reduce expense levels and improve operational efficiency.
In the fourth quarter of 2008, the Company sold its 37% interest in CI Financial for $2.2 billion. The after-tax gain of $825 million was not included in the 2008 operating earnings.
| Management’s Discussion and Analysis Sun Life Financial Inc. Annual Report 2010 | 35 |
The impact of the items described above on the Company’s operating earnings and operating EPS is shown in the following tables.
Reconciliation of Operating Earnings
| ($ millions) | 2010 | 2009 | 2008 | |||||||||
Reported Earnings (GAAP) | 1,583 | 534 | 785 | |||||||||
After-tax gain (loss) on special items | ||||||||||||
Gain on sale of interest in CI Financial | – | – | 825 | |||||||||
Restructuring costs to reduce expense levels | – | (27 | ) | – | ||||||||
Total special items | – | (27 | ) | 825 | ||||||||
Operating earnings | 1,583 | 561 | (40 | ) | ||||||||
Impact of Special Items on Diluted Operating EPS
| ($ per share) | 2010 | 2009 | 2008 | |||||||||
EPS – Reported (GAAP) | 2.76 | 0.94 | 1.37 | |||||||||
Net gains (losses) on special items | – | (0.05 | ) | 1.47 | ||||||||
EPS – Operating | 2.76 | 0.99 | (0.10 | ) | ||||||||
Our MCCSR sensitivities are forward-looking non-GAAP financial measures, for which there are no directly comparable measures under GAAP. It is not possible to provide a reconciliation for our market sensitivities as they are forward-looking information. We believe it is only possible to provide ranges of the assumptions used in determining those non-GAAP measures, as actual results can fluctuate significantly inside or outside those ranges and from period to period.
Financial Performance
2010 Consolidated Results of Operations
Common Shareholders’ Net Income
Common shareholders’ net income for the twelve months ended December 31, 2010 was $1,583 million, compared to $534 million for the same period in 2009. Operating earnings for the twelve months ended December 31, 2010 were $1,583 million, compared to operating earnings of $561 million for the same period in 2009. In 2010, there was no difference between reported and operating earnings. Operating earnings for the full-year 2009 excluded after-tax charges of $27 million for restructuring costs taken as part of the Company’s efforts to reduce expense levels and improve operational efficiency. Operating earnings for the full-year 2008 excluded an after-tax gain of $825 million related to the sale of the Company’s interest in CI Financial.
| ($ millions, unless otherwise noted) | 2010 | 2009 | 2008 | |||||||||
Total net income | 1,685 | 622 | 857 | |||||||||
Less: | ||||||||||||
Participating policyholders’ net income | 9 | 9 | 2 | |||||||||
Dividends paid to preferred shareholders | 93 | 79 | 70 | |||||||||
Common shareholders’ net income | 1,583 | 534 | 785 | |||||||||
Adjusted for special items(1) | – | 27 | (825 | ) | ||||||||
Operating earnings (loss) | 1,583 | 561 | (40 | ) | ||||||||
Basic EPS ($) from: | ||||||||||||
Common shareholders’ net income | 2.79 | 0.95 | 1.40 | |||||||||
Operating earnings (loss)(1) | 2.79 | 1.00 | (0.07 | ) | ||||||||
Diluted EPS ($) from: | ||||||||||||
Common shareholders’ net income | 2.76 | 0.94 | 1.37 | |||||||||
Operating earnings (loss)(1) | 2.76 | 0.99 | (0.10 | ) | ||||||||
Common shareholders’ net income (loss) by segment | ||||||||||||
SLF Canada | 828 | 866 | 645 | |||||||||
SLF U.S. | 301 | (465 | ) | (1,016 | ) | |||||||
MFS | 208 | 152 | 194 | |||||||||
SLF Asia | 92 | 76 | 33 | |||||||||
Corporate | 154 | (95 | ) | 929 | ||||||||
Total | 1,583 | 534 | 785 | |||||||||
(1) The items not included in operating earnings are described under the heading Non-GAAP Financial Measures. |
Results for the full year 2010 included $173 million related to improvements in equity markets, the favourable impact of asset-liability re-balancing and the favourable impact of the Lincoln U.K. acquisition in the fourth quarter of 2009. Movements in interest rates contributed $34 million to net income in 2010 as interest rate swap movements more than offset the adverse impact of lower interest rates. These favourable impacts were partially offset by increased expense levels from business initiatives in 2010 and $49 million of unfavourable credit impacts.
| 36 | Sun Life Financial Inc. Annual Report 2010 Management’s Discussion and Analysis |
Net income for the twelve months ended December 31, 2009 was impacted primarily by downgrades of $670 million on our investment portfolio, the negative impact of the implementation of equity- and interest rate-related actuarial assumption updates of $513 million and net impairments of $431 million. These adverse impacts were partially offset by the favourable impact of improved equity markets of $306 million and increased interest rates of $206 million.
Return on Equity
ROE based on common shareholders’ net income was 9.9% in 2010, up from 3.4% in 2009 primarily as a result of higher earnings. There was no difference between reported and operating ROE in 2010. Operating ROE in 2009, which does not include after-tax charges of $27 million for restructuring costs taken as part of the Company’s efforts to reduce expense levels and improve operational efficiency, was 3.5%.
Assets Under Management
AUM consist of general funds, segregated funds and other AUM(1). Other AUM includes mutual and managed funds which include institutional and other third-party assets managed by the Company.
Total AUM were $464.2 billion as at December 31, 2010, compared to $432.6 billion as at December 31, 2009. The increase of $31.6 billion between December 31, 2008 and December 31, 2009 resulted primarily from:
| (i) | positive market movements of $29.7 billion; |
| (ii) | net sales of mutual, managed and segregated funds of $14.9 billion; |
| (iii) | an increase of $2.6 billion from the change in value of HFT assets and non-hedging derivatives; |
| (iv) | business growth of $2.2 billion, mostly in the wealth businesses; partially offset by |
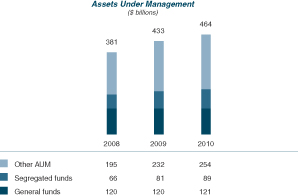
| (v) | a decrease of $17.2 billion from a strengthening Canadian dollar against foreign currencies compared to the prior period exchange rates; and |
| (vi) | a reduction of $631 million from the sale of our life reinsurance business in the fourth quarter of 2010. |
General fund assets were $120.9 billion at December 31, 2010, up $0.8 billion, from the December 31, 2009 level. The increase in general fund assets resulted primarily from:
| (i) | an increase of $2.7 billion from the change in value of HFT assets; and |
| (ii) | business growth of $2.2 billion; partly offset by |
| (iii) | a decrease of $3.4 billion from a strengthening Canadian dollar against foreign currencies compared to the prior period exchange rates; and |
| (iv) | a reduction of $631 million arising from the sale of our life reinsurance business in the fourth quarter of 2010 |
Segregated fund assets were $88.9 billion as at December 31, 2010, compared to $81.3 billion as at December 31, 2009. The increase in segregated fund assets was due to an increase of $7.5 billion from equity market improvements and $2.6 billion from net sales, partially offset by the unfavourable impact of currency of $2.5 billion.
Other AUM, which includes MFS assets under management of $221.3 billion, grew to $254.5 billion, $23.2 billion higher than as at December 31, 2009. Improved market conditions increased values by $22.2 billion and net sales for the year further increased other AUM by $12.3 billion. These increases were partially offset by the unfavourable impact of currency of $11.3 billion.
Revenue
Under Canadian GAAP, revenues include (i) regular premiums received on life and health insurance policies and fixed annuity products, net of premiums ceded to reinsurers; (ii) net investment income comprised of income earned on general fund assets, realized gains and losses on AFS assets and changes in the value of HFT assets and derivative instruments; and (iii) fee income received for services provided. Under Canadian GAAP, segregated fund deposits, mutual fund deposits and managed fund deposits are not included in revenues. As a result, revenue does not fully represent sales taking place during the respective periods.
Net investment income can experience volatility arising from quarterly fluctuation in the value of HFT assets. The bonds and stocks which support actuarial liabilities are designated as HFT and, consequently, changes in fair values of these assets are recorded in net investment income in our Consolidated Statement of Operations. Changes in the fair values of assets supporting actuarial liabilities are largely offset by a corresponding movement of the liabilities. We perform cash flow testing whereby asset and liability cash flows are projected under various scenarios. When assets backing liabilities are written down in value to reflect impairment or default, we conduct actuarial assessments of the amount of assets required to support our actuarial liabilities. Additional detail on the Company’s accounting policies can be found in this MD&A under the heading, Critical Accounting Policies and Estimates.
(1) AUM, mutual fund assets, managed fund assets, other AUM and total AUM are Non-GAAP Financial Measures. See the section under the heading Non-GAAP Financial Measures. |
| Management’s Discussion and Analysis Sun Life Financial Inc. Annual Report 2010 | 37 |
Total Revenue
| ($ millions) | 2010 | 2009 | 2008 | |||||||||
Premiums | ||||||||||||
Annuities | 2,836 | 4,795 | 3,592 | |||||||||
Life insurance | 6,255 | 6,380 | 5,928 | |||||||||
Health insurance | 4,407 | 4,335 | 4,067 | |||||||||
Total premiums | 13,498 | 15,510 | 13,587 | |||||||||
Net investment income (loss) | 7,999 | 9,392 | (767 | ) | ||||||||
Fee Income | 3,143 | 2,670 | 2,743 | |||||||||
Total | 24,640 | 27,572 | 15,563 | |||||||||
Our total revenue for the year ended December 31, 2010 decreased to $24.6 billion, down $2.9 billion from 2009. The strengthening of the Canadian dollar relative to average exchange rates for the twelve months of 2009 reduced reported revenues by $1.4 billion. Other impacts on revenue, which exclude the impact of currency, included:
| (i) | a decrease of $1.3 billion in premium revenue, primarily due to lower fixed annuity premiums in SLF U.S as a result of our decision to de-emphasize this product, partially offset by higher life and health insurance premiums; |
| (ii) | a decrease in net investment income of $970 million primarily from a reduction in net gains on the fair value of HFT assets; partially offset by; |
| (iii) | an increase in fee income of $725 million, due to higher average net asset levels at MFS and growth in fee based businesses in SLF Canada and SLF U.S. |
The following table presents the revenue of the Company based on our five business segments. We have also included a line item below labelled “adjusted revenue”, which excludes the impact of changes in currency and mark-to-market impact on HFT assets and derivative instruments, as we believe this provides a more meaningful view of our revenue.
Revenue by Segment
| ($ millions) | 2010 | 2009 | ||||||
SLF Canada | 11,449 | 11,407 | ||||||
SLF U.S. | 8,104 | 11,714 | ||||||
MFS | 1,449 | 1,251 | ||||||
SLF Asia | 1,709 | 1,813 | ||||||
Corporate | 1,929 | 1,387 | ||||||
Total as reported | 24,640 | 27,572 | ||||||
Impact of currency changes and changes in the value of HFT assets and derivative instruments | 2,333 | 4,963 | ||||||
Total adjusted revenue(1) | 22,307 | 22,609 | ||||||
(1) Adjusted revenue is a non-GAAP Measure. |
After adjusting for the impact of currency and fair value changes in HFT assets, 2010 adjusted revenue of $22.3 billion was $302 million lower than in 2009. This decrease was primarily attributable to a reduction in premium income of $1.3 billion, partially offset by increased fee income of $725 million, higher AFS gains of $124 million and a pre-tax gain of $130 million associated with the sale of our life reinsurance business in the fourth quarter of 2010.
Policy Benefits
We have a diverse range of current and future benefit payment obligations that affect overall earnings, such as payments to policyholders, beneficiaries and depositors, net transfers to segregated funds and the increase to actuarial liabilities.
Policy Benefits
| ($ millions) | 2010 | 2009 | 2008 | |||||||||
Payments to policyholders, beneficiaries and depositors | 13,078 | 13,457 | 13,775 | |||||||||
Net transfers to segregated funds | 921 | 860 | 539 | |||||||||
Increase (decrease) in actuarial liabilities | 2,909 | 7,697 | (4,429 | ) | ||||||||
Total | 16,908 | 22,014 | 9,885 | |||||||||
Payments to policyholders, beneficiaries and depositors in 2010 were $13.1 billion, down $379 million from 2009, primarily due to lower death and disability payments.
Changes in actuarial liabilities reflected an increase of $2.9 billion in 2010 compared to $7.7 billion in 2009. The change of $4.8 billion included:
| (i) | a decrease of $2.4 billion related to a decrease in liabilities on in-force business; |
| (ii) | a decrease of $1.4 billion from a lower level of liabilities arising from new policies; and |
| (iii) | a decrease of $1.0 billion from a lower level of assumption changes relative to 2009 |
Additional information on changes to our actuarial liabilities can be found in Note 9 to our 2010 Consolidated Financial Statements.
| 38 | Sun Life Financial Inc. Annual Report 2010 Management’s Discussion and Analysis |
Management Actions and Assumption Changes
We make judgments involving assumptions and estimates relating to our obligations to policyholders, some of which relate to matters that are inherently uncertain. The determination of these obligations is fundamental to our financial results and requires us to make assumptions about equity market performance, interest rates, asset default, mortality and morbidity rates, policy terminations, expenses and inflation, and other factors over the life of our products. Our benefit payment obligations are estimated over the life of our annuity and insurance products, based on internal valuation models, and are recorded in its financial statements, primarily in the form of actuarial liabilities. We review these assumptions each year, generally in the third and fourth quarters, and revise these assumptions, if appropriate.
Management actions (included with changes in valuation method and assumption) are items that affect reported earnings in the period by changing the valuation of policy liabilities in ways other than changes to actuarial methods and assumptions. Examples include changes to investment policies, changes to contractually adjustable product features, and changes to existing reinsurance arrangements or reinsurance terms.
In 2010, the net impact of management actions and the review and update of actuarial method and assumption changes resulted in an increase in net income of $31 million. Details of changes in assumptions made in 2010 by major category are provided below.
Management Actions | Increase/(Decrease) in net income | Comments | ||||
($ millions) | ||||||
Mortality/Morbidity | 173 | Largely due to favourable changes to the mortality basis in Individual Insurance in SLF U.S., Reinsurance in Corporate, and mortality/morbidity in the Company’s Group businesses in SLF Canada and SLF U.S. | ||||
| Lapse and other policyholder behaviour | (223 | ) | Reflects the impact of higher persistency as a result of low interest rates in Individual Insurance in SLF U.S., as well as higher lapse rates on term insurance renewals in SLF Canada | |||
Expense | (55 | ) | Impact of reflecting recent experience studies across the Company | |||
Investment returns | 16 | Primarily from refinements related to re-investment strategies and the impact of Company wide revisions to equity and interest rate return assumptions | ||||
Other | 120 | Primarily model refinements to improve the projection of future cash flows and the restructuring of Sun Life Everbright in SLF Asia | ||||
Total | 31 | |||||
Additional information on estimates relating to our obligation to policyholders, including the methodology and assumptions used in their determination, can be found in the Accounting and Control Matters section of this MD&A under the heading Critical Accounting Policies and Estimates and in Note 9 to our 2010 Consolidated Financial Statements.
Expenses and Other
Expenses & Other
| ($ millions) | 2010 | 2009 | 2008 | |||||||||
Commissions | 1,591 | 1,662 | 1,545 | |||||||||
Operating expenses | 3,357 | 3,142 | 2,979 | |||||||||
Intangibles amortization | 47 | 34 | 24 | |||||||||
Premium taxes | 218 | 222 | 227 | |||||||||
Interest expenses | 440 | 403 | 366 | |||||||||
Income taxes | 371 | (542 | ) | (343 | ) | |||||||
Non-controlling interests in net income of subsidiaries | 23 | 15 | 23 | |||||||||
Participating policyholders’ net income | 9 | 9 | 2 | |||||||||
Dividends to preferred shareholders | 93 | 79 | 70 | |||||||||
Total | 6,149 | 5,024 | 4,893 | |||||||||
Commission expenses decreased by $71 million in 2010 from the 2009 amount of $1.7 billion mainly from lower sales of fixed annuities in SLF U.S.
Operating expenses of $3.4 billion in 2010 were $214 million higher than 2009. The strengthening of the Canadian dollar relative to the foreign currencies reduced 2010 expenses by $206 million compared to 2009 rates. Excluding the impact of currency, expenses increased by $434 million primarily as a result of higher business volumes and project costs for strategic initiatives in SLF Canada, increased incentive compensation at MFS based on improved performance and higher costs from the Lincoln U.K. acquisition in the fourth quarter of 2009 along with integration and new business restructuring costs in SLF U.K.
Interest expense rose by $37 million over 2009 to $440 million in 2010, reflecting the full year cost of debt and preferred share issuances in 2009, as well as the incremental cost of preferred shares issued in May, 2010.
Income Taxes
The Company has a statutory tax rate of 30.5%, which is reduced by various tax benefits such as lower taxes on income subject to tax in foreign jurisdictions, a range of tax exempt investment income sources and other sustainable tax benefit streams that, in combination with a normal level of pre-tax income, decrease the Company’s effective tax rate to an expected range of 18% to 22%.
| Management’s Discussion and Analysis Sun Life Financial Inc. Annual Report 2010 | 39 |
During 2010, we reported a tax expense of $371 million on income before taxes and non-controlling interests of $2,079 million, resulting in an effective tax rate of 17.8%. This compares to a tax recovery of $542 million on income before taxes and non-controlling interests of $95 million in 2009, resulting in a negative effective tax rate of 571%.
In 2010, our tax expense included significant non-recurring items. In the second quarter of 2010 we recorded a tax benefit of $76 million in relation to a favourable judgment received by the Company in a United Kingdom tax litigation case allowing us to carry forward tax losses incurred before 2002 to reduce taxes payable for 2002 and subsequent years. This tax benefit was partially offset by a valuation allowance of $23 million which resulted in a net tax benefit of $53 million representing the portion of the future tax asset that is considered to be more likely than not to be realized.
Further, in December 2010, we sold our life reinsurance business. As a result, our income tax expense was higher than expected as the goodwill associated with this business was not deductible for tax purposes.
The net unfavourable impact of the above items on our tax expense in 2010 was reduced by a higher than expected tax benefit from lower-taxed investment income due to improved market conditions during the year, as well as the favourable resolution of uncertain tax positions, resulting in the overall effective tax rate of 17.8%.
In 2009 we recorded a tax benefit of $174 million as a result of the enactment of the Canadian tax rules relating to CICA Handbook Section 3855 Financial Instruments – Recognition and Measurement. We also released a valuation allowance on future tax assets in the amount of $101 million relating to investment impairment losses previously recorded in SLF U.S. The impact of the above items, combined with losses in higher tax jurisdictions, such as the United States, contributed to the income tax recovery in 2009.
Impact of Currency
We have operations in key markets worldwide, including the United States, the United Kingdom, Ireland, Hong Kong, the Philippines, Indonesia, India, China and Bermuda, and generate earnings in local currencies in these jurisdictions, which are translated into Canadian dollars. The bulk of our exposure to movements in foreign exchange rates is to the U.S. dollar. Items impacting our Consolidated Statement of Operations are translated back to Canadian dollars using average exchange rates for the respective period. For items impacting the Consolidated Balance Sheet, period end rates are used for currency translation purposes.
In general, our net income benefits from a weakening Canadian dollar and is adversely affected by a strengthening Canadian dollar as net income from the Company’s international operations is translated back to Canadian dollars. In a period of net losses, the weakening of the Canadian dollar can exacerbate losses. The relative impact of currency in any given period is driven by the movement of currency rates as well as the proportion of earnings generated in our foreign operations. We generally express the impact of currency on net income on a year-over-year basis. During the fourth quarter of 20010 and for the full year 2010, our overall reported net income decreased by $16 million and by $77 million, respectively, as a result of movements in foreign exchange rates.
Fourth Quarter 2010 Performance
Net income attributable to common shareholders was $508 million for the quarter ended December 31, 2010, compared to net income of $296 million in the fourth quarter of 2009. Net income in the fourth quarter of 2010 was favourably impacted by $181 million from improvements in equity markets and $113 million from increased interest rates. This was partially offset by the impact of changes to actuarial estimates and assumptions of $58 million related primarily to mortality, higher levels of expenses, which included several non-recurring items, and the unfavourable impact of currency movements.
Results in the fourth quarter of 2009 benefited from the positive impact of asset-liability re-balancing, improvements in equity markets, increased interest rates and an overall tax recovery. These impacts were partially offset by net impairments, downgrades on the investment portfolio and lower asset reinvestment gains from changes in credit spreads.
Return on equity (ROE) for the fourth quarter of 2010 was 12.4%, compared with 7.6% for the fourth quarter of 2009. The increase in ROE was primarily the result of higher earnings, which increased to $0.88 per share in the fourth quarter of 2010 from $0.52 per share in the fourth quarter of 2009.
Performance by Business Group
SLF Canada had net income of $182 million in the fourth quarter of 2010 compared to $243 million in the fourth quarter of 2009. Earnings in the fourth quarter of 2010 reflected the net unfavourable impact of interest rate movements, including swap spreads, changes to actuarial estimates and assumptions related primarily to mortality and the unfavourable impact of asset-liability re-balancing. This was partially offset by improved equity markets and related tax impacts. Earnings in the fourth quarter of 2009 reflected improvements in equity markets, the favourable impact of asset-liability re-balancing, increased interest rates, and various tax-related items, including a one-time benefit of the tax rate reductions enacted in Ontario.
SLF U.S. had net income of US$263 million in the fourth quarter of 2010 compared to a loss of US$8 million in the fourth quarter of 2009. Results in the fourth quarter of 2010 reflected the favourable impact of improved equity markets, increased interest rates and lower credit impairments and downgrades. The loss in the fourth quarter of 2009 was primarily attributable to net credit impairments, reserve increases for downgrades on the investment portfolio, and lower asset reinvestment gains from changes in credit spreads. This was partially offset by the favourable impact of asset-liability re-balancing, equity markets and increased interest rates
MFS had net income of US$56 million in the fourth quarter of 2010 compared to earnings of US$47 million in the fourth quarter of 2009. The increase in earnings from the fourth quarter of 2009 was primarily due to higher net average assets, which increased to US$214 billion in the fourth quarter of 2010 from US$181 billion in the fourth quarter of 2009 as a result of improved performance in financial markets and strong net sales driven by record gross sales of US$53 billion in 2010.
SLF Asia had net income of $28 million in the fourth quarter of 2010 compared to earnings of $27 million in the fourth quarter of 2009. Earnings in the fourth quarter of 2010 reflected improved results in India as a lower level of sales resulted in reduced levels of new
| 40 | Sun Life Financial Inc. Annual Report 2010 Management’s Discussion and Analysis |
business strain, which was partially offset by lower earnings in Hong Kong from higher new business strain. The net impact of these items resulted in a level of earnings in the fourth quarter of 2010 that was relatively unchanged from the same period one year ago as earnings in the fourth quarter of 2009 included favourable mortality and credit experience.
The Corporate segment had a net loss of $26 million in the fourth quarter of 2010 compared to a loss of $14 million in the fourth quarter of 2009. SLF U.K. reported a loss of $11 million in the fourth quarter of 2010, compared to net income of $9 million in the fourth quarter of 2009. Results were lower primarily as a result of downgrades on the investment portfolio and increased expense levels related to increased regulatory costs and other business restructuring. Results in the fourth quarter of 2009 in SLF U.K. reflected the adverse impact of changes in interest rates and equity values, including hedge impacts. In Corporate Support, the loss in the fourth quarter of 2010 was $15 million, compared to a loss of $23 million one year earlier. The improvement year-over-year was primarily attributable to improved results in the life reinsurance business, partially offset by increased expense levels in Corporate Support and lower income tax benefits relative to the prior year. On December 31, 2010, we completed the sale of our life reinsurance business. The net gain on sale was approximately $1 million.
Additional Financial Disclosure
Revenues for the fourth quarter of 2010 were $4.0 billion, down $959 million from the comparable period a year ago. The overall decrease in revenue included a reduction of $59 million from the strengthening of the Canadian dollar relative to average exchange rates in the fourth quarter of 2009. Other impacts on revenue, which exclude the impact of currency, included:
| (i) | a decrease in net investment income of $1.0 billion. This was primarily due to a reduction in the change in fair value of HFT assets and non-hedging derivatives of $1.2 billion, which was partially offset by a pre-tax gain of $130 million associated with the sale of our life reinsurance business recorded in investment income and reduced asset provisions; partially offset by |
| (ii) | an increase of $44 million in premium revenue. Reduced annuity premiums in SLF U.S. were more than offset by higher annuity premiums in SLF Canada and growth in health premiums; and |
| (iii) | an increase in fee income of $120 million on growth in fee-based businesses, including MFS, SLF Canada and SLF U.S. |
AUM increased $9.5 billion between September 30, 2010 and December 31, 2010. The increase in AUM related primarily to:
| (i) | positive market movements of mutual, managed and segregated funds totalling $17.4 billion; and |
| (ii) | net sales of mutual, managed and segregated funds of $5.2 billion; partially offset by |
| (iii) | a decrease of $10.4 billion from the strengthening of the Canadian dollar against foreign currencies; |
| (iv) | a decrease of $1.7 billion from the change in fair value of HFT assets and non-hedging derivatives; and |
| (v) | a reduction of $881 million, which included $309 million in goodwill, arising from the sale of our life reinsurance business. |
Quarterly Information
The following table provides a summary of our results for the eight most recently completed quarters. A more complete discussion of our historical quarterly results can be found our interim MD&A’s.
| ($ millions, unless otherwise noted) | 2010 | 2009 | ||||||||||||||||||||||||||||||
| Q4 | Q3 | Q2 | Q1 | Q4 | Q3 | Q2 | Q1 | |||||||||||||||||||||||||
Common shareholders’ net income (loss) | ||||||||||||||||||||||||||||||||
Operating(1) | 508 | 453 | 213 | 409 | 296 | (140 | ) | 591 | (186 | ) | ||||||||||||||||||||||
Reported | 508 | 453 | 213 | 409 | 296 | (140 | ) | 591 | (213 | ) | ||||||||||||||||||||||
Diluted EPS (in dollars) | ||||||||||||||||||||||||||||||||
Operating(1) | 0.88 | 0.79 | 0.37 | 0.72 | 0.52 | (0.25 | ) | 1.05 | (0.33 | ) | ||||||||||||||||||||||
Reported | 0.88 | 0.79 | 0.37 | 0.72 | 0.52 | (0.25 | ) | 1.05 | (0.38 | ) | ||||||||||||||||||||||
Basic Reported EPS (in dollars) | 0.89 | 0.80 | 0.38 | 0.72 | 0.53 | (0.25 | ) | 1.06 | (0.38 | ) | ||||||||||||||||||||||
ROE annualized | ||||||||||||||||||||||||||||||||
Operating(1) | 12.4% | 11.2% | 5.4% | 10.5% | 7.6% | -3.5% | 14.9% | -4.7% | ||||||||||||||||||||||||
Reported | 12.4% | 11.2% | 5.4% | 10.5% | 7.6% | -3.5% | 14.9% | -5.5% | ||||||||||||||||||||||||
Common shareholders’ net income (loss) by segment | ||||||||||||||||||||||||||||||||
SLF Canada | 182 | 262 | 146 | 238 | 243 | 219 | 210 | 194 | ||||||||||||||||||||||||
SLF U.S. | 267 | 41 | (95 | ) | 88 | (9 | ) | (413 | ) | 364 | (407 | ) | ||||||||||||||||||||
MFS | 57 | 55 | 47 | 49 | 49 | 43 | 32 | 28 | ||||||||||||||||||||||||
SLF Asia | 28 | 37 | 23 | 4 | 27 | 13 | 19 | 17 | ||||||||||||||||||||||||
Corporate | (26 | ) | 58 | 92 | 30 | (14 | ) | (2 | ) | (34 | ) | (45 | ) | |||||||||||||||||||
Total | 508 | 453 | 213 | 409 | 296 | (140 | ) | 591 | (213 | ) | ||||||||||||||||||||||
Total revenue | 4,034 | 7,745 | 6,806 | 6,055 | 4,993 | 8,831 | 8,720 | 5,028 | ||||||||||||||||||||||||
Total AUM ($ billions) | 464 | 455 | 434 | 435 | 433 | 412 | 397 | 375 | ||||||||||||||||||||||||
(1) Operating earnings, diluted operating EPS and operating ROE are non-GAAP measures and exclude the items described under the heading Non-GAAP Financial Measures. |
Third Quarter 2010
Net income of $453 million in the third quarter of 2010 was favourably impacted by improved equity market conditions, and assumption changes and management actions. We increased our mortgage sectoral allowance in anticipation of continued pressure in the U.S. commercial mortgage market, however overall credit experience continued to show improvement over the prior year. The net impact from interest rates on third quarter results was not material as the unfavourable impact of lower interest rates was largely offset by favourable movement in interest rate swaps used for asset-liability management.
| Management’s Discussion and Analysis Sun Life Financial Inc. Annual Report 2010 | 41 |
Second Quarter 2010
Net income of $213 million in the second quarter of 2010 was adversely impacted by declining equity markets and unfavourable interest rate movements. These adverse impacts were partially offset by the favourable impact of fixed income investing activities on policy liabilities, and an overall tax recovery during the quarter.
First Quarter 2010
Net income of $409 million in the first quarter of 2010 benefited from positive equity market performance, favourable movements in interest rates and the positive impact of asset-liability re-balancing. Our acquisition in the fourth quarter of 2009 in the U.K. contributed to the improved performance in our U.K. operations. Higher costs associated with writing increased volumes of new business offset some of the gains from improved economic conditions.
Fourth Quarter 2009
Net income of $296 million for the fourth quarter of 2009 reflected a return to more favourable market conditions, including the positive impact of asset-liability re-balancing, improvements in equity markets and increased interest rates, and benefited from an overall tax recovery. These impacts were partially offset by net impairments, downgrades on our investment portfolio and lower asset reinvestment gains from changes in credit spreads.
Third Quarter 2009
The loss of $140 million for the third quarter of 2009 was largely as a result of the implementation of equity- and interest rate-related actuarial assumption updates of $513 million and reserve increases of $194 million for downgrades on our investment portfolio, partially offset by reserve releases of $161 million as a result of favourable equity markets.
Second Quarter 2009
Net income of $591 million in the second quarter of 2009 was favourably impacted by reserve releases as a result of higher equity markets, increased interest rates and the positive impact of narrowing credit spreads. Strong results from improvements in capital markets in the quarter were partially offset by increased reserves for downgrades on our investment portfolio, changes in asset default assumptions in anticipation of future credit-related losses, and credit impairments.
First Quarter 2009
The loss of $213 million in the first quarter of 2009 was due to reserve strengthening, net of hedging, related to equity market declines; reserve increases for downgrades on our investment portfolio; and credit and equity impairments. Excluding after-tax charges of $27 million for restructuring costs taken as part of our actions to reduce expense levels and improve operational efficiency, we reported an operating loss of $186 million.
| 42 | Sun Life Financial Inc. Annual Report 2010 Management’s Discussion and Analysis |
Business Segment Results
We manage our operations and report our financial results in five business segments as described in the Overview section of this MD&A. The following section describes the operations and financial performance of SLF Canada, SLF U.S., MFS, SLF Asia and Corporate.
SLF Canada
Business Profile
SLF Canada is a market leader with a client base representing one in five Canadians. Our distribution breadth, strong service and technology infrastructure and brand recognition provide an excellent platform for growth. SLF Canada’s three business units – Individual Insurance & Investments, Group Benefits and Group Wealth (which includes our Group Retirement Services business) – offer a full range of protection and wealth accumulation products and services to individuals and corporate clients.
Strategy
We help clients achieve lifetime financial security throughout their life stages by providing products and advice on insurance and investments through multiple distribution touch points. We strengthen our sponsor and advisor partnerships with value-added insight, service and advice to offer increased value to these partners. Additional value is created by enhancing productivity and client service.
We will grow our business organically by leveraging our strong brand recognition and client base of eight million to offer additional value added products and services. We will continue to build strategic partnerships to rapidly build capabilities to capitalize on opportunities.
2010 Business Highlights
| • | Individual life and health insurance sales grew by 20% to $201 million and reflected a more profitable product mix driven by strong sales of term life insurance and a successful re-entry into the participating insurance market. Sales of individual fixed interest investment products, including accumulation annuities (“AA”), guaranteed investment certificates (“GICs”) and payout annuities, grew by 15% to $1.2 billion for the full year 2010 over 2009 due, in part, to a well-received AA/GIC launch into the independent channel as well as a shift in investors’ preferences. |
| • | Group Benefits delivered strong sales results, with sales up 33% to $433 million for 2010. Group Benefits was also successful in installing a number of important administrative changes to the federal Public Service Health Care Plan, the largest group plan in Canada, enhancing the service we provide to over 1.2 million members and dependents. Business in-force increased by 6% from December 31, 2009, to $7.3 billion as at December 31, 2010. |
| • | In Group Retirement Services (“GRS”), we continued to build on our leadership position in the Defined Contribution (“DC”) industry capturing 55% of the total DC market activity in the first nine months of 2010, as recently reported by LIMRA. Pension rollover sales increased by 22% to a record $1 billion, and a four-quarter average retention rate of 50%. GRS continued to deliver strong results, with overall sales increasing to $4.3 billion, an increase of 3% over 2009. |
| • | In October 2010, Sun Life Global Investments (Canada) Inc. (“SLGI”) launched a new line-up of mutual funds, featuring funds managed by MFS, Sun Capital Advisers and McLean Budden. |
| • | SLF Canada continued to focus on innovation and product re-design to meet the needs of customers and strengthen our risk management profile. In Individual Insurance & Investments we launched a new segregated fund product, SunWise Essential SeriesTM. GRS announced the industry’s first wireless mobile enrollment using the new BlackBerry® PlayBook™, and Group Benefits continues to lead in innovation with the implementation of scanning technology for group health and dental claims processing, resulting in increased speed, accuracy and fraud prevention capabilities. |
Financial and Business Results
Summary Statement of Operations
| ($ millions) | 2010 | 2009 | 2008 | |||||||||
Premiums | 6,890 | 6,952 | 6,273 | |||||||||
Net investment income | 3,758 | 3,757 | 966 | |||||||||
Fee income | 801 | 698 | 688 | |||||||||
Total revenue | 11,449 | 11,407 | 7,927 | |||||||||
Client disbursements and change in actuarial liabilities | 8,504 | 8,777 | 4,986 | |||||||||
Commissions and other expenses | 2,004 | 1,803 | 1,846 | |||||||||
Income taxes | 94 | (54 | ) | 435 | ||||||||
Non-controlling interests in net income of subsidiaries and par policyholders’ income | 19 | 15 | 15 | |||||||||
Common shareholders’ net income(1) | 828 | 866 | 645 | |||||||||
(1) Earnings in 2008 included income of $117 million from Sun Life’s 37% ownership interest in CI Financial, which the Company sold in the fourth quarter of 2008. |
Full year 2010 earnings were $828 million compared to $866 million for the same period last year. Net income decreased primarily from less favourable equity market impacts, less favourable mortality and morbidity and policyholder experience and lower impacts of asset-liability re-balancing. This decrease was partially offset by more favourable interest rate impacts, credit experience and favourable changes to actuarial estimates and assumptions.
Revenue for 2010 was $11.4 billion, an increase of $42 million from 2009, primarily due to an increase in fee income of $103 million from higher asset levels, which was partially offset by lower premiums.
| Management’s Discussion and Analysis Sun Life Financial Inc. Annual Report 2010 | 43 |
SLF Canada had assets under management of $133.8 billion as at December 31, 2010; a record level and an increase of 7% from 2009 levels. Positive cash flows and favourable equity market performance were the primary contributors to the growth in AUM.
Results by Business Unit
Individual Insurance & Investments
Individual Insurance & Investments strategy is to service lifetime financial security needs through holistic advice and solutions supported by a leading suite of profitable products and a focus on being easy to do business with for both our clients and our advisors.
Individual Insurance & Investments’ principal insurance products include universal life, term life, permanent life, participating life, critical illness, long-term care and personal health insurance. We offer savings and retirement products, which include accumulation annuities, payout annuities, mutual funds and segregated funds. Our products are marketed through a distinctive, multi-channel distribution model consisting of our exclusive Sun Life Financial Advisor Sales Force and wholesale distribution channels. Certain products including accidental death insurance and personal health insurance are marketed directly to the Individual client base in partnership with our advice channels.
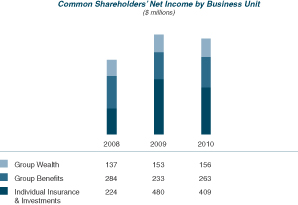
Individual Insurance & Investments’ earnings decreased to $409 million in 2010 from $480 million in 2009 primarily as a result of a lower level of equity market impacts and reduced gains from asset liability re-balancing. This was partially offset by favourable interest rate impacts, improved credit experience, the favourable impact of updates to actuarial estimates and assumptions, and certain tax related benefits.
Sales of individual life and health insurance products increased by 20% to $201 million for the year ended December 31, 2010. The Sun Life Financial Advisor Sales Force grew to over 3,600 advisors, managers, and specialists.
Sales of individual Wealth products increased by $87 million, or 2%, to $4.1 billion in 2010. Mutual fund sales increased by $301 million, or 35% over 2009, and sales of guaranteed interest products (payout annuities, accumulation annuities, GIC’s) increased by $155 million or 15% over 2009. These increases were offset by lower segregated fund sales, which decreased by $369 million, or 18%, over 2009.
Group Benefits
Our Group Benefits business unit is a leading provider of group life and health insurance products in Canada, with a market share of 22%(1). We provide life, dental, drug, extended health care, disability and critical illness benefit programs to employers of all sizes. In addition, voluntary benefits solutions are offered directly to individual plan members, including post-employment life and health plans to plan members exiting their plan. We are an innovation leader, competing on the strength of an industry-leading technology platform, a unique Total Benefits offering and integrated health, wellness and disability management capabilities. Our products are marketed and distributed across Canada by experienced sales representatives in collaboration with independent advisors and benefits consultants.
Group Benefits 2010 net income of $263 million increased by $30 million over 2009 primarily due to favourable asset liability re-balancing, growth in in-force business and improved credit experience, partially offset by less favourable morbidity experience. Group Benefits retained the number two market share position for overall business in-force(1) in Canada and continues to focus on customer service and productivity.
New annualized premiums and premium equivalents, increased by $107 million to $433 million in 2010. Client retention remained strong, with industry-leading cancellation rates at 3% of premium and premium equivalents.
Group Wealth
Our Group Wealth business unit consists of the GRS operation as well as our 67% economic interest in McLean Budden Limited, a premier institutional provider of investment management services in Canada. With a 35% market share(2), GRS is the leading provider of DC plans in Canada, serving over one million plan participants at the end of 2010. We also offer other group retirement services and products, including investment-only segregated funds and fixed rate annuities, stock plans, group life annuities, pensioner payroll services, guaranteed minimum withdrawal benefits and solutions for de-risking defined benefit pension plans.
Our GRS solutions meet the complex plan and service requirements of medium to large organizations, while providing cost-effective solutions to the small employer market. We continue to launch innovative solutions to meet the emerging needs of the pension market to further enhance our leadership position. We distribute our products and services through a multi-channel distribution network of pension consultants, advisors and teams dedicated to the rollover sector and defined benefit solutions.
Group Wealth net income increased to $156 million in 2010 from $153 million in 2009 primarily as a result of favourable credit experience and improved mortality experience, partially offset by the lower interest rate environment. GRS sales increased 3% in 2010, to $4.3 billion primarily from increased sales in the small to mid-case market.
GRS sales also continued to benefit from the offering of rollover products to members leaving defined contribution plans. In 2010, sales exceeded $1 billion, leading to a four-quarter average retention rate of 50%.
(1) 2009 Fraser Study, based on in-force premiums and premium equivalents for the year ended December 31, 2009 (2) As measured by Benefits Canada magazine’s 2009 Defined Contribution Plan Survey released in December 2009
|
| 44 | Sun Life Financial Inc. Annual Report 2010 Management’s Discussion and Analysis |
GRS assets under administration of $48 billion in 2010 grew by 10% over 2009, with strong sales results, ongoing member contributions and continued improvement in equity markets.
2011 Outlook and Priorities
The three largest Canadian insurers, including SLF Canada, account for over 60% of the life, health and annuity segments in Canada as measured by premiums. Our key differentiators in today’s market include a strong capital position and brand profile, strong distribution capabilities and economies of scale to support investment in technology, product innovation and client service.
Improvements in equity markets with continued volatility as well as narrower credit spreads and continuing low interest rates characterized the business environment in 2010. Ongoing financial market volatility, historically low interest rates and continued high unemployment rates will create a challenging operating environment in 2011.
In 2011, we will continue to focus on improving profitability through product mix, strengthening distribution capabilities and providing value added products and services to our diverse client base.
In Individual Insurance & Investments, we will increase profitable sales through the Sun Life Financial Advisor Sales Force and Wholesale distribution partners with a focus on lifetime relationships, holistic advice and product development. We will also focus on leveraging SLGI, our new mutual fund company, in wealth accumulation and retirement strategies.
Our group businesses will grow profitability by increasing sales, particularly in the small- and medium-sized case markets and by creating additional revenue opportunities by developing and offering innovative product and service solutions to larger accounts.
Additional sales growth will be achieved by leveraging product and service capabilities and the relationships with individual clients and group plan members through voluntary benefit offerings and building on the success of the rollover business in both GRS and Group Benefits.
We will continue to emphasize risk management including re-pricing of products such as Universal Life as a result of the continued historically low interest rate environment and by actively managing our segregated funds risk profile and our group disability income business. We will continue to focus on improvements in productivity through disciplined expense management while maintaining a high level of client satisfaction.
SLF U.S.
Business Profile
SLF U.S. provides wealth accumulation, retirement income and protection solutions to help our customers achieve financial security through its three business units – Annuities, Individual Insurance and Employee Benefits Group (“EBG”). For individuals at or nearing retirement, our Annuity products provide customers with the security of not out living their savings. Our Individual Insurance business offers life insurance solutions for wealth protection, wealth transfer and executive benefits. EBG offers group life, disability, medical stop-loss and dental insurance solutions for employers and their employees.
Strategy
Our strategy is to deliver sustainable and profitable growth by focusing on markets and customers that value financial strength and prudent risk management. These markets include baby boomers, small-to-mid size businesses and their employees and affluent individuals. We continue to grow in our selected markets with customer-centric product solutions, strong distribution relationships, brand development and focused execution.
Our comprehensive risk management program is central to our strategy. We leverage this core discipline to design solutions that balance customer and shareholder value while driving sustainable growth.
Building industry-leading distribution capabilities is also central to our strategy. We partner with independent financial advisors and brokers to deliver our solutions to their clients. We support these financial intermediaries through a team of over 300 sales professionals located across the United States.
We have aligned our business model to leverage shared services for Information Technology, Operations, Finance, Risk Management, Marketing, Human Resources and Legal to drive operational efficiency and to develop centers of excellence.
2010 Business Highlights
| • | In EBG, we reorganized our distribution model to increase specialization and better align with key segments such as the small-to-mid sized and voluntary markets. EBG reported record sales of US$612 million in 2010 |
| • | We continued to launch innovative variable annuity products that help customers reach their retirement goals while improving our risk profile |
| • | In Individual Insurance, our distribution model was expanded to increase focus on direct-to-producer capabilities to drive growth. We doubled the number of external life wholesalers and shifted resources to relationship management to increase shelf space directly with key distribution partners |
| • | In Individual Insurance, we exited the no-lapse guarantee (“NLG”) universal life business to focus on product lines which have greater potential for sustainable and profitable growth |
| • | SLF U.S. announced the sponsorship of Sun Life Financial Stadium, home of the Miami Dolphins, helping to increase aided consumer awareness to 18% from 6% in just 5 months. We also implemented the Rising Star Awards program in 7 cities, a philanthropic initiative in the field of education |
| • | We continued to focus on expense management and improve operational efficiency, while maintaining a high level of customer satisfaction. Overall expenses were relatively flat from 2009 levels as a result of productivity improvements |
| Management’s Discussion and Analysis Sun Life Financial Inc. Annual Report 2010 | 45 |
Financial and Business Results
Summary Statement of Operations
| (US$ millions) | 2010 | 2009 | 2008 | |||||||||
Premiums | 4,759 | 5,989 | 5,395 | |||||||||
Net investment income | 2,431 | 3,773 | (2,279 | ) | ||||||||
Fee income | 650 | 508 | 522 | |||||||||
Total revenue | 7,840 | 10,270 | 3,638 | |||||||||
Client disbursements and change in actuarial liabilities | 5,721 | 9,397 | 3,404 | |||||||||
Commissions and other expenses | 1,713 | 1,745 | 1,678 | |||||||||
Income taxes | 108 | (435 | ) | (561 | ) | |||||||
Non-controlling interests in net income of subsidiaries and par policyholders’ income | 1 | 3 | – | |||||||||
Common shareholders’ net income | 297 | (440 | ) | (883 | ) | |||||||
Selected financial information in Canadian dollars | ||||||||||||
Total revenue | 8,104 | 11,714 | 3,817 | |||||||||
Common shareholders’ net income (loss) | 301 | (465 | ) | (1,016 | ) | |||||||
For the year ended December 31, 2010, SLF U.S. reported net income of $301 million, compared to a loss of $465 million in 2009.
On a U.S. dollar basis, SLF U.S. recorded income of US$297 million in 2010 compared to a loss of US$440 million in 2009. The earnings improvement in 2010 was primarily driven by more favourable credit experience and the reduced adverse impact of updates to actuarial estimates and assumptions compared to 2009. These improvements were partially offset by unfavourable policyholder experience in Individual Insurance and Employee Benefits Group and less favourable impacts from equity market and interest rate movements compared to 2009.
Total revenue for the year ended December 31, 2010 was US$7.8 billion, a decrease of US$2.4 billion from 2009 primarily due to decreases in net investment income and premiums. The reduction in net investment income was largely due to lower fair value gains on HFT assets and non-hedging derivatives of US$0.7 billion in 2010, compared to gains of US$2.1 billion in 2009. The decrease in premiums was predominantly due to lower fixed annuity sales, as a result of our decision to de-emphasize this product line.
Total assets under management were US$70.8 billion as at December 31, 2010, up 6% from 2009 reflecting equity market improvements and positive net sales.
Results by Business Unit
Annuities
The SLF U.S. Annuities business unit provides variable and fixed annuity products and investment management services. We are focused on balancing consumer and shareholder value to deliver sustainable growth in this business. We expect to achieve this growth by increasing wholesaler productivity with a de-risked, simplified product portfolio. We distribute our products through 79 wholesalers who, in addition to our complement of 52 internal wholesalers, interact with over 8,500 independent advisors and brokers in the wirehouse, regional broker dealers and banking distribution channels.
Annuities recorded net income of US$272 million for the year ended December 31, 2010 compared to a loss of US$403 million for the full year 2009. Earnings in 2010 were driven by favourable credit markets relative to the prior year and the unfavourable implementation of equity and interest rate-related assumption updates in the third quarter of 2009.
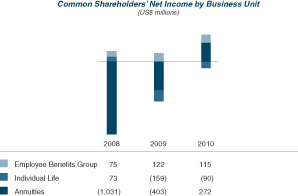
Annuity sales were US$4.6 billion during 2010 compared to US$5.5 billion in 2009. Variable annuity sales increased 8% to $4.4 billion reflecting improved wholesaler productivity. This was offset by a decrease in fixed annuity sales, as a result of our decision to de-emphasize this product. In Q4 2010, SLF U.S. introduced three new variable annuity riders, designed to help clients maximize their retirement income and protect against rising costs with a guaranteed annual increase to lifetime income. These new riders allow us to adjust the charges for new and in-force business, improving the company’s risk profile.
Individual Insurance
SLF U.S.’s Individual Insurance business unit offers protection products to affluent individuals and small to mid-sized business owners, including single and joint universal life and variable universal life. In addition to these core products, we offer corporate-owned life insurance. Late in 2010, we exited the NLG universal life business to focus on specialized, solutions-based offerings, which have greater potential for sustainable and profitable growth. We have adjusted our distribution model to better align with these products and our key markets, including small business owners and executive benefits. To that end, we are expanding our distribution capabilities to increase direct access to independent financial advisors and leverage our EBG capabilities and relationships.
| 46 | Sun Life Financial Inc. Annual Report 2010 Management’s Discussion and Analysis |
Individual Insurance reported a loss of US$90 million in 2010 compared to a loss of US$159 million in 2009. Losses in 2010 reflected reserve increases related to the decreasing interest rate environment relative to 2009 and policyholder behavior assumption updates. Losses in 2009 were higher due to the implementation of equity and interest rate-related assumption updates and updates to policyholder behaviour assumptions.
Overall sales in 2010 and 2009 were US$212 million and US$238 million, respectively. Sales of Individual Insurance domestic core products of US$128 million were consistent with prior year. This includes a 42% decrease in NLG universal life sales, reflecting our decision to exit this product line. NLG sales were replaced by growth in our other core universal life products, including a 39% increase in sales of our small business solution.
Employee Benefits Group
SLF U.S.’s EBG business unit leverages its strong underwriting expertise and extensive distribution capabilities to provide group life, long-term and short-term disability, medical stop-loss, and dental insurance to over 10 million group plan members. We currently provide customer-focused products and services to meet the group insurance needs of small to medium-sized employers and their employees. Our group insurance products are sold through independent brokers and benefit consultants. We support these brokers and consultants through 34 regional group offices across the United States and more than 170 Sun Life sales representatives. These representatives maintain close relationships with independent brokers and consultants who work directly with employers. In the first quarter of 2010, we realigned the EBG sales force to create a more specialized distribution model and increase our focus on key markets.
EBG earnings were US$115 million in 2010 compared to earnings of US$122 million in 2009. The decrease was primarily due to less favourable claims experience.
Despite a challenging competitive environment, sales in 2010 were a record US$612 million, up 2% compared to 2009. Business in-force of US$2.2 billion as at December 31, 2010 increased 5% over the prior year despite difficult economic conditions including low wage rates and high unemployment.
2011 Outlook and Priorities
SLF U.S. competes in the sophisticated and highly competitive U.S. life insurance industry, in which the top companies have gained unprecedented market share. Although there are encouraging signs that the U.S. economy has started to recover, high unemployment, low interest rates, stressed commercial real estate markets and volatile financial markets will likely persist through 2011. In this environment, the advantages of operational scale and growth have to be balanced with the risk profile of the business.
Several key trends provide opportunities for us to grow our core businesses. First, 78 million baby boomers are in or nearing retirement, increasing the demand for retirement income security. Second, as the responsibility for retirement income shifts to the individual and market volatility and uncertainty increases, the Annuities business can offer a unique value proposition through guaranteed lifetime income. Third, the longer-term needs of baby boomers to transfer wealth to their children in a tax efficient manner will provide growth opportunities for Individual Insurance. Fourth, longer life expectancy combined with rising medical expenses is increasing demand for innovative solutions. Finally, as businesses try to stem rising health care expenses by shifting the cost of benefits to employees, EBG has an opportunity to increase its voluntary benefits business.
To capitalize on the current business environment and trends, we will drive sustainable and profitable organic growth by developing new solutions that satisfy consumer needs while effectively managing risk. SLF U.S. will maintain its focus on strengthening its distribution capabilities and investing in marketing and brand development to support growth in each business. Effective risk management and continuous improvements in operational efficiency remain top priorities.
MFS Investment Management
Business Profile
MFS is a global asset management company which offers products and services that address the varying needs of investors over time. Individual investors have access to MFS advisory services through a broad selection of financial products including mutual funds, variable annuities, separately managed accounts, college and retirement savings plans, and offshore products. Financial intermediaries that provide sales support, product administration and client services distribute these products. MFS services institutional clients by providing asset management services for corporate retirement plans, separate accounts, public or government funds and insurance company assets. Institutional clients are serviced through a direct sales force and a network of independent consultants.
Strategy
MFS’s strategy is to grow its business by continually exceeding clients’ expectations with superior investment performance. As distribution of retail funds continues to move toward platform-driven sales, long-term investment performance has become even more important. We will continue to challenge the structure of our investment process and add research talent to ensure that high investment performance is maintained across a universe of securities that is becoming more geographically dispersed.
The expansion of institutional products and sales is also an important element of our strategy. We have launched a number of institutionally-focused investment products that are designed to better meet the market separation of investment performance linked to an index and investment performance based on active management of investment products. We have and will continue to add investment talent to support the expanded product set and wholesalers to expand distribution capabilities geographically.
| Management’s Discussion and Analysis Sun Life Financial Inc. Annual Report 2010 | 47 |
2010 Business Highlights
| • | MFS’s assets under management increased by 19% to end the year at a record high of US$222.0 billion. |
| • | Gross sales also reached a record high of US$53 billion. |
| • | Effective July 1, 2010, Robert J. Manning became chairman of MFS Investment Management. Mr. Manning also continues in his role as chief executive officer, and succeeds Robert C. Pozen, who became chairman emeritus. |
| • | U.S. retail investment performance continued to be strong during 2010, with 85% of MFS’s fund assets ranking in the top half of their respective three-year Lipper categories at December 31, 2010. |
Financial and Business Results
Summary Statement of Operations
| (US$ millions) | 2010 | 2009 | 2008 | |||||||||
Total revenue | 1,407 | 1,106 | 1,308 | |||||||||
Commissions and other expenses | 1,061 | 875 | 985 | |||||||||
Income taxes | 133 | 89 | 128 | |||||||||
Non-controlling interests in net income of subsidiaries | 11 | 6 | 9 | |||||||||
Common shareholders’ net income | 202 | 136 | 186 | |||||||||
Sales (US$ billions) | ||||||||||||
Gross | 53.0 | 48.5 | 36.0 | |||||||||
Net | 14.2 | 18.9 | (5.8 | ) | ||||||||
Pre-tax operating profit margin ratio | 30 | % | 26 | % | 30 | % | ||||||
Average net assets (US$ billions) | 197 | 153 | 172 | |||||||||
Selected financial information in Canadian dollars | ||||||||||||
Total revenue | 1,449 | 1,251 | 1,381 | |||||||||
Common shareholders’ net income | 208 | 152 | 194 | |||||||||
MFS’s common shareholders’ net income of $208 million for 2010 increased $56 million, or 37%, from $152 million in 2009.
On a U.S. dollar basis, MFS’s earnings increased by US$66 million, or 49%, to US$202 million in 2010 primarily due to higher average net assets (“ANA”), which increased to US$197 billion during the twelve months ended December 31, 2010, from US$153 billion in 2009. Total revenue of US$1,407 million in 2010 increased US$301 million from 2009 levels on higher ANA. The advisory revenue portion of MFS’s total revenue increased by 32% to US$992 million, consistent with the percentage increase in ANA during 2010. Other sales and servicing revenues increased, primarily due to the impact of both a higher distribution effective fee rate and higher ANA.
Under IFRS, share-based compensation awards at MFS will be accounted for as cash settled liabilities. Additional information concerning share-based compensation can be found in this MD&A under the heading, International Financial Reporting Standards.
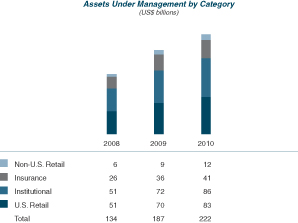
AUM ended 2010 at US$222 billion, an increase of 19% for the year mainly due to favourable market performance of US$20.3 billion and net inflows of US$14.2 billion. Net inflows were strong for both retail mutual funds and managed funds, which were US$7.6 and US$6.6, respectively, for 2010.
2011 Outlook and Priorities
Sovereign risk and currency-related issues around the world brought new investing challenges in 2010. While the U.S. Federal Reserve’s quantitative easing measures helped stimulate domestic markets, broader uncertainty kept investors largely in a defensive mindset. While we expect this dynamic to moderate in 2011, it will likely be slow and gradual until we see a sustained period of muted volatility.
Within the institutional market, investors continue to re-evaluate their asset allocation strategies – with defined benefit plans focused on de-risking and defined contribution plans focused on target-risk type products. Global equity, international equity, and alternative product strategies continue to lead search activity. Within retail, the ongoing migration to intermediary platforms continues to amplify the importance of investment performance and service quality. The increase in platform sales reduces traditional distribution fees, further pressuring the smaller participants in the retail market.
In 2011, we will deepen our existing alpha-generating resource capabilities and expand our global research platform by adding equity analysts in key regions. Our institutional business will seek to expand relationships with global and top tier consultants, further penetrate the defined contribution markets in the U.S. and United Kingdom, and continue to focus on growing our sovereign wealth business across the world. Our retail distribution efforts will revolve around continuing to emphasize our quality, risk management, and product breadth stories with advisors, including our multi-asset class capabilities. We will also be focused on strengthening relationships within the increasingly important professional buyer segment. Finally, 2011 will be the “Year of the Client” for MFS, as we plan to develop and begin to execute on a major service improvement initiative that will touch all clients and channels.
| 48 | Sun Life Financial Inc. Annual Report 2010 Management’s Discussion and Analysis |
SLF Asia
Business Profile
SLF Asia operates through subsidiaries in the Philippines, Hong Kong and Indonesia and through joint ventures with local partners in Indonesia, India and China. These five markets account for approximately 70% of the total Asian population. Our Regional Office in Hong Kong facilitates the sharing of best practices and resources throughout the SLF Asia operations.
Individual life and health insurance as well as group life insurance products are offered in all five markets. Pension and retirement products are offered in Hong Kong and India, and mutual funds are sold in the Philippines and India. These protection and wealth products are distributed to middle- and upper-income individuals, groups and affinity clients through multi-distribution channels, with agency remaining the largest distribution channel.
Strategy
Our strategy is to gain scale in each of the markets where we operate and develop into a significant long-term revenue and earnings growth operation. As such, we are increasing the speed to market for new and innovative products, developing alternative distribution channels such as bancassurance and telemarketing as well as leveraging the Company’s existing asset management capability in Asia and globally. The local initiatives will complement the leveraging of Sun Life Financial’s worldwide resources to bring industry-leading products, services and best practices to Asia.
2010 Business Highlights
| • | On July 20, 2010, Sun Life Everbright was restructured as a domestic insurance company. Under the restructuring of the joint venture with the China Everbright Group, additional strategic investors were introduced, which reduced our ownership in Sun Life Everbright from 50% to 24.99%. The repositioning provides an opportunity for Sun Life Everbright to capture a larger share of China’s growing financial services sector. |
| • | In August 2010, CIMB Sun Life, Sun Life’s joint venture in Indonesia with P.T. Bank CIMB Niaga, was named “Best New Company of the Year” by the International Business Awards. This premier international business award honours companies and their employees for outstanding performance. |
| • | Sun Life Hong Kong increased its mandatory provident fund and pension administration assets under administration by 53% over 2009. |
| • | In the Philippines, we are ranked number one in new business with a 16% market share, based on adjusted first year premium. |
| • | In India, Birla Sun Life Asset Management Company Limited has been recognized as “The Asset Management Company of the Year” in India by Hong Kong’sThe Asset Magazine. The award acknowledges the company’s comprehensive and innovative offerings, its significant efforts to reach new investors and above-benchmark performance. |
Financial and Business Results
Summary Statement of Operations
| ($ millions) | 2010 | 2009 | 2008 | |||||||||
Premiums | 861 | 848 | 726 | |||||||||
Net investment income | 710 | 846 | (318 | ) | ||||||||
Fee income | 138 | 119 | 90 | |||||||||
Total revenue | 1,709 | 1,813 | 498 | |||||||||
Client disbursements and change in actuarial liabilities | 1,189 | 1,314 | 64 | |||||||||
Commissions and other expenses | 394 | 402 | 379 | |||||||||
Income taxes | 34 | 21 | 22 | |||||||||
Common shareholders’ net income | 92 | 76 | 33 | |||||||||
SLF Asia’s full year 2010 earnings were $92 million compared to $76 million in 2009. The increase in earnings was mainly due to improved results in India as a decline in sales resulted in lower levels of new business strain, and a net gain of $19 million from the restructuring of Sun Life Everbright in China, partially offset by lower earnings in Hong Kong from higher levels of new business strain in 2010 and favourable mortality and credit experience in 2009.
SLF Asia’s total revenue decreased by 6% to $1,709 million in 2010 compared to $1,813 million in 2009, reflecting the unfavourable impact from fair value changes on HFT assets and non-hedging derivatives in 2010.
Individual life insurance sales for 2010, measured in Canadian dollars, were down by 18% over 2009, mainly due to lower sales in India, which have been impacted by major industry-wide regulatory changes to unit-linked products. Excluding India, individual life sales were up 43% driven by sales growth in all other markets. In 2010, we continued to build alternate distribution channels, leverage a more balanced product portfolio, and increase efficiency and productivity while maintaining customer focus.
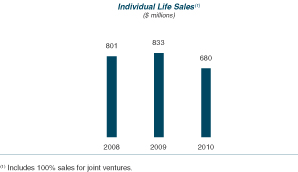
| Management’s Discussion and Analysis Sun Life Financial Inc. Annual Report 2010 | 49 |
Results by Business Unit
Hong Kong
Our Hong Kong operations have been building a strong presence in the region by offering a full range of products to address protection and savings needs. Individual life and health insurance, mandatory provident funds (the government-legislated pension plan) and pension administration are offered to individuals and businesses through a multi-channel distribution system that includes a career agency force, bancassurance and independent financial advisors.
We continue to expand our alternative distribution channels in Hong Kong, which contributed 35% of total individual life sales in 2010. In particular, sales from bancassurance and telemarketing channels were up 10% and 94%, respectively, in 2010 compared to 2009. Total individual life sales were up 15% in 2010 compared to 2009, on a local currency basis.
The mandatory provident fund and pension administration gross sales increased significantly by 167% over 2009 and total assets under administration grew by 53% over 2009, resulting from further expansion of the pension administration business.
Philippines
Our Philippines operations, established in 1895, distribute a diverse range of protection and savings products largely through their proprietary career agency sales force. We offer individual and group life and health insurance products, as well as mutual funds, to individuals and institutions.
With 31 branches, 41 sales offices and five financial stores nationwide, our operations in the Philippines are considered one of the strongest and most stable insurance companies in the market.
Individual insurance sales were up by 35% compared to 2009, on a local currency basis, as demand for investment-linked products increased following the return of investor confidence. Mutual fund gross sales increased by 158% over 2009 and assets under management grew by 29% over 2009.
Indonesia
In Indonesia, we offer individual life and health insurance as well as creditor life insurance through our wholly-owned subsidiary, PT Sun Life Financial Indonesia, and our joint venture with PT Bank CIMB Niaga. Both operations follow a multi-channel distribution strategy. CIMB Sun Life serves CIMB Niaga’s customers on an exclusive basis for most insurance products.
Individual life Insurance sales in Indonesia were up 41% in 2010 compared to 2009, on a local currency basis due to an increase of agency sales force and continued growth of CIMB Sun Life.
India
Birla Sun Life Insurance Company Limited (Birla Sun Life Insurance), our insurance joint venture with the Aditya Birla Group in India, provides a full range of individual and group protection, savings and retirement products through a multi-channel distribution network, including a career agency sales force, bancassurance distribution, brokers and worksite marketing.
In addition, Birla Sun Life Asset Management Company Limited, the Company’s asset management joint venture in India, offers a full range of mutual fund products to both individual and institutional investors. Independent financial advisors and banks distribute Birla Sun Life’s mutual funds to the retail sector, while the direct distribution capabilities serve corporate clients.
Birla Sun Life Insurance’s individual insurance sales were impacted by major industry-wide regulatory changes to unit-linked products and down 31% in 2010 compared to 2009, on a local currency basis. The gross inflows of Birla Sun Life Asset Management Company Limited were up by 16% over last year.
China
Sun Life Everbright operates a multi-distribution model that combines a direct career agency, financial consultants, telemarketing and several bancassurance alliances to sell individual life and health insurance and savings products.
In July 2010, the China Insurance Regulatory Commission approved the restructuring of Sun Life Everbright as a domestic insurance company. We have a 24.99% interest in the restructured company. The repositioning allows Sun Life Everbright to capture a larger share of China’s growing financial services sector.
In 2010, sales of individual insurance products by Sun Life Everbright were up 135% compared to 2009 on a local currency basis, driven by strong sales of participating products in the bancassurance channel. In the fourth quarter of 2010, Sun Life Everbright received approval to open three new branches in China, bringing the total number of cities in which Sun Life Everbright operates to 36.
2011 Outlook and Priorities
The life insurance markets in which we operate in Asia range from the developing and increasingly competitive markets, such as India and China, to the more mature markets of the Philippines and Hong Kong. Overall, the life industry at both the regional and country level continued to evolve rapidly, with a number of players exiting selected markets, but many more increasing their investment and commitment to the region, including Sun Life. While agency continued to be the primary distribution channel in Asia, the bancassurance channel has been increasingly gaining market share with strong growth potential.
After the global financial crisis, regulatory oversight on consumer protection has increased primarily related to investment-linked products and related sales practices, as well as capital adequacy. While the market significantly recovered during 2010, we continue to expect a challenging operating environment in 2011, but with opportunities for prepared and quality players to significantly outperform their peers.
| 50 | Sun Life Financial Inc. Annual Report 2010 Management’s Discussion and Analysis |
In 2011, we will continue to launch innovative and customer focused products reflecting each market’s specific and evolving needs over time. We will also enhance and diversify distribution management, implementing best practices in such areas as agency recruitment and training, and further expanding alternative channels such as bancassurance and telemarketing. Continued enhancement of risk management and operational efficiency will also remain a priority to further streamline the operations and enhance the platform that supports future growth across the region.
Corporate
Our Corporate segment includes the results of SLF U.K. and Corporate Support operations that include the Company’s reinsurance businesses as well as investment income, expenses, capital and other items not allocated to Sun Life Financial’s other business segments.
Our reinsurance businesses consist of life reinsurance and run-off reinsurance. On December 31, 2010, we sold our life reinsurance business. This business consisted primarily of reinsurance of individual life, with additional coverage including critical illness, group, corporate-owned life insurance, and longevity. Our run-off reinsurance business is a closed block of reinsurance assumed from other insurers. Coverage includes individual disability income, long-term care, group long-term disability and personal accident & medical on the health side, as well as guaranteed minimum income and death benefit coverage.
Financial and Business Results
Summary Statement of Operations
| ($ millions) | 2010 | 2009 | 2008 | |||||||||
Premiums | 841 | 849 | 851 | |||||||||
Net investment income | 995 | 504 | 1,056 | |||||||||
Fee income | 93 | 34 | 33 | |||||||||
Total revenue(1) | 1,929 | 1,387 | 1,940 | |||||||||
Client disbursements and change in actuarial liabilities | 1,288 | 1,231 | 1,138 | |||||||||
Commissions and other expenses | 398 | 280 | 87 | |||||||||
Income taxes | (5 | ) | (108 | ) | (285 | ) | ||||||
Non-controlling interests in net income of subsidiaries | 1 | – | 1 | |||||||||
Dividends paid to preferred shareholders | 93 | 79 | 70 | |||||||||
Common shareholders’ net income | 154 | (95 | ) | 929 | ||||||||
Special items(2) | – | 27 | (825 | ) | ||||||||
Operating earnings | 154 | (68 | ) | 104 | ||||||||
(1) Including consolidation adjustments related to activities between segments. (2) See Non-GAAP Financial Measures. |
Net income for the twelve months ended December 31, 2010 in the Corporate segment was $154 million compared to a loss of $95 million for the same period last year. In Corporate Support, losses for 2010 were $37 million, compared to $64 million in 2009. Losses were lower in 2010 primarily due to improved results in the run-off reinsurance business and the favourable impact of tax benefits in Corporate Support, partially offset by investment gains which favourably impacted results in 2009. Results for 2009 also included restructuring charges to improve operational efficiency.
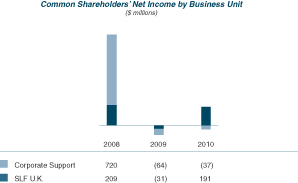
SLF U.K.
SLF U.K. has approximately 1 million in-force life and pension policies, which constitute a run-off block of business. While our U.K. operations supported the capability to sell new business, we refocused our approach in 2010 to focus solely on providing products and services to existing customers. Most administrative functions have been outsourced to external service providers, which are managed by an in-house management team.
For the year ended December 31, 2010, SLF U.K. reported net income of $191 million compared with a loss of $31 million in 2009. Earnings in SLF U.K. were higher in 2010 largely as a result of the favourable impact of the Lincoln U.K. acquisition and a tax benefit associated with a favourable judgment received by the Company.
| Management’s Discussion and Analysis Sun Life Financial Inc. Annual Report 2010 | 51 |
Investments
The Company strives to ensure that all general fund investments are properly aligned with business objectives, meeting policyholder obligations, and that adequate liquidity is maintained at all times. The Risk Review Committee of the Board of Directors approves policies that contain prudent standards and procedures for the investment of our general fund assets. These policies include requirements, restrictions and limitations for interest rate, credit, equity market, real estate market, liquidity, concentration, currency and derivative risks. Compliance with these policies is monitored on a regular basis and reported annually to the Risk Review Committee. The Investment Oversight Committee of the Board of Directors oversees investment policies, practices, procedures and controls related to management of the general fund investments portfolio, the approval and monitoring of the annual Investment Plan and monitoring of the investment performance of enterprise pension and savings plans.
| The shaded text and tables in the following section of this MD&A represent our disclosure on Credit Risk – Asset Quality in accordance with CICA Handbook Section 3862,Financial Instruments – Disclosures.Therefore, the shaded text and tables represent an integral part of our audited 2010 Annual Consolidated Financial Statements for the years ended December 31, 2010 and December 31, 2009. The shading in this section does not imply that these disclosures are of any greater importance than non-shaded tables and text, and the Investments disclosure should be read in its entirety. |
Investment Profile
The Company had total general fund invested assets of $110 billion as at December 31, 2010. The majority of our general fund is invested in medium- to long-term fixed income instruments, such as bonds and mortgages. Our portfolio composition is conservative, with 86% of the general fund in cash and fixed income investments. Stocks and real estate comprised 5% and 4% of the portfolio, respectively. The remaining 5% of the portfolio is comprised of policy loans, derivative assets and other invested assets.
Additional detail on our investments is provided in Notes 5 and 6 to our 2010 Consolidated Financial Statements.
| Investments | 2010 | 2009 | ||||||||||||||||||||||
| ($ millions) | Carrying Value | Fair Value | % of total carrying value | Carrying Value | Fair Value | % of total carrying value | ||||||||||||||||||
HFT bonds | 54,753 | 54,753 | 50 | 51,634 | 51,634 | 48 | ||||||||||||||||||
AFS bonds | 10,752 | 10,752 | 10 | 9,673 | 9,673 | 9 | ||||||||||||||||||
Mortgages and corporate loans | 19,511 | 20,430 | 18 | 19,449 | 19,941 | 18 | ||||||||||||||||||
HFT stocks | 4,424 | 4,424 | 4 | 4,331 | 4,331 | 4 | ||||||||||||||||||
AFS stocks | 808 | 809 | 1 | 635 | 649 | 1 | ||||||||||||||||||
Real estate | 4,919 | 5,125 | 4 | 4,877 | 5,124 | 5 | ||||||||||||||||||
Policy loans and other invested assets | 3,525 | 3,525 | 3 | 3,503 | 3,503 | 3 | ||||||||||||||||||
Cash, cash equivalents and short-term securities | 8,487 | 8,487 | 8 | 11,868 | 11,868 | 11 | ||||||||||||||||||
Derivative assets | 1,629 | 1,629 | 2 | 1,382 | 1,382 | 1 | ||||||||||||||||||
Other invested assets - HFT | 419 | 419 | - | 425 | 425 | - | ||||||||||||||||||
other invested assets - AFS | 454 | 492 | - | 452 | 484 | - | ||||||||||||||||||
Total invested assets | 109,681 | 110,845 | 100 | 108,229 | 109,014 | 100 | ||||||||||||||||||
Bonds
Our bond portfolio is actively managed through a regular program of purchases and sales aimed at optimizing yield, quality and liquidity, while ensuring that the asset portfolio remains diversified and well matched to actuarial liabilities by duration. As at December 31, 2010, we held $65.5 billion of bonds, which constituted 60% of our overall investment portfolio. Bonds with an investment grade of “A” or higher represented 68% of the total bond portfolio as at December 31, 2010, compared to 67% as at December 31, 2009. Bonds rated “BBB” or higher represented 96% of the total bond portfolio as at December 31, 2010, unchanged from December 31, 2009.
Included in the $65.5 billion of bonds were $13.4 billion of non-public bonds, which constituted 20% of our overall bond portfolio, compared with $13.2 billion, or 22%, as at December 31, 2009. Corporate bonds that are not issued or guaranteed by sovereign, regional and municipal governments represented 70% of the total bond portfolio as at December 31, 2010, compared to 73% as at December 31, 2009. Total government issued or guaranteed bonds as at December 31, 2010 were $19.8 billion, compared to $16.8 billion as at December 31, 2009. We have an immaterial amount of direct exposure to eurozone sovereign credits.
| 52 | Sun Life Financial Inc. Annual Report 2010 Management’s Discussion and Analysis |
The carrying value of bonds by issuer and industry sector as at December 31 is shown in the following table:
| 2010 | 2009 | |||||||||||||||||||||||
| HFT Bonds | AFS Bonds | Total | HFT Bonds | AFS Bonds | Total | |||||||||||||||||||
Bonds issued or guaranteed by: | ||||||||||||||||||||||||
Canadian federal government | 2,271 | 1,314 | 3,585 | 2,707 | 397 | 3,104 | ||||||||||||||||||
Canadian provincial and municipal governments | 7,760 | 176 | 7,936 | 6,787 | 80 | 6,867 | ||||||||||||||||||
U.S. Treasury and other U.S. agencies | 1,901 | 1,200 | 3,101 | 1,441 | 470 | 1,911 | ||||||||||||||||||
Other foreign governments | 4,732 | 449 | 5,181 | 4,372 | 519 | 4,891 | ||||||||||||||||||
Total government issued or guaranteed bonds | 16,664 | 3,139 | 19,803 | 15,307 | 1,466 | 16,773 | ||||||||||||||||||
Corporate bonds by industry sector: | ||||||||||||||||||||||||
Financials | 10,350 | 2,899 | 13,249 | 11,050 | 3,403 | 14,453 | ||||||||||||||||||
Utilities and energy | 9,605 | 1,011 | 10,616 | 8,816 | 1,050 | 9,866 | ||||||||||||||||||
Telecom | 2,076 | 606 | 2,682 | 2,453 | 797 | 3,250 | ||||||||||||||||||
Consumer staples and discretionary | 6,569 | 1,367 | 7,936 | 5,487 | 1,337 | 6,824 | ||||||||||||||||||
Industrials | 2,948 | 558 | 3,506 | 2,669 | 523 | 3,192 | ||||||||||||||||||
Other | 2,911 | 622 | 3,533 | 2,288 | 495 | 2,783 | ||||||||||||||||||
Total corporate | 34,459 | 7,063 | 41,522 | 32,763 | 7,605 | 40,368 | ||||||||||||||||||
Asset-backed securities | 3,630 | 550 | 4,180 | 3,564 | 602 | 4,166 | ||||||||||||||||||
Total bonds | 54,753 | 10,752 | 65,505 | 51,634 | 9,673 | 61,307 | ||||||||||||||||||
Our bond portfolio as at December 31, 2010, included $13.3 billion in the financial sector, representing approximately 20% of the bond portfolio, or 12% of our total invested assets. This compares to $14.5 billion, or 24% of the bond portfolio as at December 31, 2009. The $1.2 billion decrease in the value of financial sector bond holdings was primarily due to planned reductions of our larger exposures.
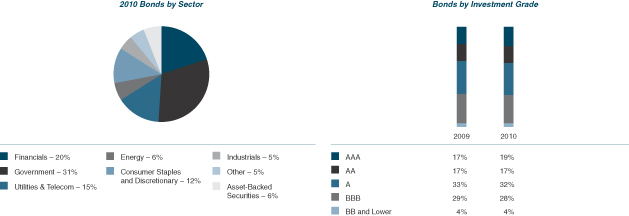
| The carrying value of bonds by issuer country as at December 31 is shown in the following table. |
| 2010 | 2009 | |||||||||||||||||||||||
| ($ millions) | HFT Bonds | AFS Bonds | Total | HFT Bonds | AFS Bonds | Total | ||||||||||||||||||
Bonds | ||||||||||||||||||||||||
Canada | 21,293 | 1,964 | 23,257 | 20,167 | 980 | 21,147 | ||||||||||||||||||
United States | 20,817 | 6,940 | 27,757 | 19,037 | 6,662 | 25,699 | ||||||||||||||||||
United Kingdom | 5,080 | 392 | 5,472 | 5,229 | 614 | 5,843 | ||||||||||||||||||
Other | 7,563 | 1,456 | 9,019 | 7,201 | 1,417 | 8,618 | ||||||||||||||||||
Total Bonds | 54,753 | 10,752 | 65,505 | 51,634 | 9,673 | 61,307 | ||||||||||||||||||
| Management’s Discussion and Analysis Sun Life Financial Inc. Annual Report 2010 | 53 |
Our bond portfolio as at December 31, 2010, included $4.2 billion of asset-backed securities reported at fair value, representing approximately 6% of the bond portfolio, or 4% of our total invested assets. This was unchanged from the level reported as at December 31, 2009. While the credit quality of our asset-backed securities deteriorated in 2010, previously established reserves based on the lifetime expected losses of these assets mitigated substantially all of the changes in the asset quality of the portfolio.
| Asset-backed securities | 2010 | 2009 | ||||||||||||||||||||||
| ($ millions) | Amortized cost | Fair value | BBB and higher | Amortized cost | Fair value | BBB and higher | ||||||||||||||||||
Commercial mortgage-backed securities | 1,962 | 1,870 | 87.1 | % | 2,219 | 1,772 | 92.9 | % | ||||||||||||||||
Residential mortgage-backed securities | ||||||||||||||||||||||||
Agency | 654 | 685 | 100.0 | % | 735 | 768 | 100.0 | % | ||||||||||||||||
Non-agency | 1,000 | 731 | 65.4 | % | 1,318 | 886 | 80.2 | % | ||||||||||||||||
Collateralized debt obligations | 183 | 135 | 26.1 | % | 243 | 169 | 34.9 | % | ||||||||||||||||
Other* | 873 | 759 | 83.0 | % | 729 | 571 | 80.6 | % | ||||||||||||||||
Total | 4,672 | 4,180 | 82.7 | % | 5,244 | 4,166 | 87.5 | % | ||||||||||||||||
* Other includes sub-prime, a portion of the Company’s exposure to Alternative –A (“Alt-A”) and other asset-backed securities. |
We determine impairments on asset-backed securities by using discounted cash flow models that consider losses under current and expected economic conditions, and a set of assumed default rates and loss-given-default expectations for the underlying collateral pools. Assumptions used include macroeconomic factors, such as commercial and residential property values and unemployment rates. Assumed default rates and loss-given-default expectations for the underlying collateral pool are assessed on a security-by-security basis based on factors such as the seasoning and geography of the underlying assets, whether the underlying assets are fixed or adjustable rate loans and the likelihood of refinancing at reset dates. If the cash flow modelling projects an economic loss and we believe the loss is more likely than not to occur, an impairment is recorded.
Due to the complexity of these securities, different sets of assumptions regarding economic conditions and the performance of the underlying collateral pools can fall into a reasonable range but lead to significantly different loss estimates. Our asset-backed portfolio is highly sensitive to fluctuations in macroeconomic factors, assumed default rates for the underlying collateral pool and loss-given-default expectations. In addition, our asset-backed portfolio has exposure to lower-rated securities that are highly leveraged, with relatively small amounts of subordination available below our securities to absorb losses in the underlying collateral pool. For these securities, if a relatively small percentage of the underlying collateral pool defaults, we may lose all of our principal investment in the security.
Further write downs of our asset-backed securities may result from continued deterioration in economic factors, such as property values and unemployment rates, or changes in the assumed default rate of the collateral pool or loss-given-default expectations. In addition, foreclosure proceedings and the sale of foreclosed homes have been delayed at certain U.S. financial institutions. It is difficult to estimate the impact of these delays, but they could have an adverse impact on our residential mortgage-backed portfolio depending on their magnitude.
As at December 31, 2010, we had indirect exposure to residential sub-prime and Alternative-A (“Alt-A”) loans of $132 million and $100 million, respectively, together representing approximately 0.2% of our total invested assets. Of these investments, 89% either were issued before 2006 or have an “AAA” rating. Alt-A loans generally are residential loans made to borrowers with credit profiles that are stronger than sub-prime but weaker than prime.
Mortgages and Corporate Loans
As at December 31, 2010, our mortgage portfolio consisted mainly of commercial mortgages with a carrying value of $12.8 billion, spread across approximately 3,800 loans, an amount consistent with the December 31, 2009 level. Commercial mortgages include retail, office, multi-family, industrial and land properties. Our commercial portfolio has a weighted average loan-to-value of approximately 60%. While we generally require a maximum loan-to-value ratio of 75%, we may invest in mortgages with a higher loan-to-value ratio in Canada if the mortgage is insured. The estimated weighted average debt service coverage is 1.6 times, consistent with prior year-end levels. The Canada Mortgage and Housing Corporation insures 23% of the Canadian commercial mortgage portfolio. As at December 31, 2010, the mix of the mortgage portfolio was 81% non-residential and 19% residential, and approximately 43% of mortgage loans will mature by December 31, 2015.
| 54 | Sun Life Financial Inc. Annual Report 2010 Management’s Discussion and Analysis |
As at December 31, 2010, we held $6.5 billion in corporate loans compared to $5.7 billion in 2009. The carrying values of mortgages and corporate loans by geographic location as at December 31 is shown in the following table. Residential mortgages include mortgages for both single and multiple family dwellings.
| Mortgages by Type and Location | ||||||||||||
| ($ millions) | Residential | Non-residential | Total | |||||||||
December 31, 2010 | ||||||||||||
Canada | 2,270 | 5,154 | 7,424 | |||||||||
United States | 216 | 5,333 | 5,549 | |||||||||
United Kingdom | – | 48 | 48 | |||||||||
Total mortgages | 2,486 | 10,535 | 13,021 | |||||||||
Corporate loans | 6,490 | |||||||||||
Total mortgages and corporate loans | 19,511 | |||||||||||
December 31, 2009 | ||||||||||||
Canada | 2,341 | 5,193 | 7,534 | |||||||||
United States | 280 | 5,905 | 6,185 | |||||||||
United Kingdom | – | 57 | 57 | |||||||||
Total mortgages | 2,621 | 11,155 | 13,776 | |||||||||
Corporate loans | 5,673 | |||||||||||
Total mortgages and corporate loans | 19,449 | |||||||||||
In the United States, a gradual recovery of the commercial real estate market has begun, but is fractured with a disparity between stabilized “core” properties within primary markets and lower quality assets or those located in secondary markets. Capitalization rates continue to decline for quality properties that are both well located and leased. Despite the improvement in the overall economy, a prolonged increase in real estate demand will be dependent upon job creation, which continues to lag. Due to the length of the downturn, many borrowers have exhausted their financial resources, resulting in an increase in defaults and problem loans. These troubled loans have become more widespread across property types and geographic locations.
The distribution of mortgages and corporate loans by credit quality as at December 31 is shown in the following table.
| December 31, 2010 | ||||||||||||||||||||||||
| ($ millions) | Gross Carrying Value | Allowance for losses | ||||||||||||||||||||||
| Mortgages | Corporate loans | Total | Mortgages | Corporate loans | Total | |||||||||||||||||||
Not past due | 12,553 | 6,460 | 19,013 | - | - | - | ||||||||||||||||||
Past due: | ||||||||||||||||||||||||
Past due less than 90 days | 73 | 73 | - | - | - | |||||||||||||||||||
Past due 90 to 179 days | - | - | - | - | - | - | ||||||||||||||||||
Past due 180 days or more | - | - | - | - | - | - | ||||||||||||||||||
Impaired | 583 | 58 | 641 | 188 | (1) | 28 | 216 | |||||||||||||||||
Balance, December 31, 2010 | 13,209 | 6,518 | 19,727 | 188 | 28 | 216 | ||||||||||||||||||
(1) Includes $76 million of sectoral provisions |
| December 31, 2009 | ||||||||||||||||||||||||
| ($ millions) | Gross Carrying Value | Allowance for losses | ||||||||||||||||||||||
| Mortgages | Corporate loans | Total | Mortgages | Corporate loans | Total | |||||||||||||||||||
Not past due | 13,600 | 5,649 | 19,249 | – | – | – | ||||||||||||||||||
Past due: | ||||||||||||||||||||||||
Past due less than 90 days | 30 | 30 | – | – | – | |||||||||||||||||||
Past due 90 to 179 days | – | – | – | – | – | – | ||||||||||||||||||
Past due 180 days or more | – | 1 | 1 | – | – | – | ||||||||||||||||||
Impaired | 252 | 33 | 285 | 106 | (2) | 10 | 116 | |||||||||||||||||
Balance, December 31, 2009 | 13,882 | 5,683 | 19,565 | 106 | 10 | 116 | ||||||||||||||||||
(2) Includes $55 million of sectoral provisions |
Net impaired assets for mortgages and corporate loans, net of allowances for losses, amounted to $425 million as at December 31, 2010, $256 million higher than the December 31, 2009 level for these assets. The gross carrying value of impaired mortgages rose by $331 million to $583 million at December 31, 2010. The majority of this increase related to mortgages for which a specific provision was recorded. The remainder of this increase related to mortgages considered to be impaired because the terms of the loan were modified, but for which a full recovery of principal is expected. The allowance for losses related to mortgages rose to $188 million at December 31, 2010 from $106 million as at December 31, 2009. The addition of new provisions on specific mortgages was partly offset by adjustments to provisions previously recorded, realized losses charged against this allowance and currency movements. The sectoral provision related to mortgages included in the allowance increased by $21 million to $76 million, which reflects our anticipation of continued pressure in the commercial mortgage market. Approximately 89% of the impaired mortgage loans are in the United States.
| Management’s Discussion and Analysis Sun Life Financial Inc. Annual Report 2010 | 55 |
Stocks
Our equity portfolio is diversified, and approximately 60% of this portfolio is invested in exchange-traded funds (“ETFs”). The main ETF holdings are in the S&P/TSX 60 Index Fund, Standard & Poor’s Depository Receipts and MSCI EAFE Index Funds.
| The carrying value of stocks by issuer country as at December 31 is shown in the following table. |
| 2010 | 2009 | |||||||||||||||||||||||
Stocks by Issuer Country ($ millions) | HFT Stocks | AFS Stocks | Total | HFT Stocks | AFS Stocks | Total | ||||||||||||||||||
Canada | 2,637 | 121 | 2,758 | 2,301 | 115 | 2,416 | ||||||||||||||||||
United States | 1,161 | 486 | 1,647 | 1,110 | 460 | 1,570 | ||||||||||||||||||
United Kingdom | 241 | 51 | 292 | 495 | 16 | 511 | ||||||||||||||||||
Other | 385 | 150 | 535 | 425 | 44 | 469 | ||||||||||||||||||
Total Stocks | 4,424 | 808 | 5,232 | 4,331 | 635 | 4,966 | ||||||||||||||||||
As at December 31, 2010, $2.8 billion, or 53%, of our equity portfolio consisted of Canadian issuers; $1.6 billion, or 31%, of U.S. issuers; $292 million, or 6%, of U.K. issuers; and $535 million, or 10%, of issuers from other jurisdictions. Excluding ETF funds, mutual funds and the equity investment in The Bank of Nova Scotia received as a result of the sale of CI Financial ($278 million of preferred shares, or 5.3%), only one issuer exceeded 1% of the equity portfolio as at December 31, 2010.
Real Estate
Commercial properties, which consist primarily of office, retail and industrial properties, are the major component of our real estate portfolio, representing approximately 86% of real estate investments as at December 31, 2010. Our real estate investments are diversified by country, with 68% of the portfolio located in Canada, 27% in the United States and the remaining 5% are in the United Kingdom and the Philippines as at December 31, 2010.
The carrying value of real estate by issuer country as at December 31 is shown in the following table.
Real Estate by Issuer Country ($ millions) | 2010 | 2009 | ||||||
Canada | 3,370 | 3,246 | ||||||
United States | 1,323 | 1,373 | ||||||
United Kingdom | 225 | 257 | ||||||
Other | 1 | 1 | ||||||
Total Real Estate | 4,919 | 4,877 |
Gains on the sale of real estate remain on our balance sheet, and are deferred and amortized into future investment income at a quarterly rate of 3% of the unamortized balance. We had $219 million in deferred net realized gains on real estate as at December 31, 2010.
Derivative Financial Instruments and Risk Mitigation
The fair value of derivative assets held by the Company was $1.6 billion, while the fair value of derivative liabilities was $0.7 billion as at December 31, 2010. Derivatives designated as hedges for accounting purposes and those not designated as hedges represented 13% and 87%, respectively, on a total notional basis.
Derivatives designated as hedges for accounting purposes are designed to minimize balance sheet and income statement mismatches. These derivatives are documented at inception and hedge effectiveness is assessed on a quarterly basis.
We use derivative instruments to manage risks related to interest rate, equity market and currency fluctuations and in replication strategies to reproduce permissible investments. We use certain cross-currency interest rate swaps designated as fair value hedges to manage foreign currency associated with AFS assets. Certain interest rate swaps are used to hedge interest rate exposure of associated liabilities. Certain equity forwards are designated as cash flow hedges of the anticipated payments of awards under certain stock-based compensation plans. We also use currency swaps and forwards designated as net investment hedges to reduce foreign exchange fluctuations associated with certain foreign currency investment financing activities. Our hedging strategy does not hedge all risks; rather, it is intended to keep us within our risk appetite.
| 56 | Sun Life Financial Inc. Annual Report 2010 Management’s Discussion and Analysis |
The primary uses of derivatives in 2010 are summarized in the table below.
| Products/Application | Uses of Derivative | Derivative Used | ||
| U.S. universal life contracts and U.K. unit-linked pension products with guaranteed annuity rate options | To limit potential financial losses from significant reductions in asset earned rates relative to contract guarantees | Swaptions, swaps and spread locks on interest rates | ||
| Interest rate exposure in relation to asset-liability management | To manage the sensitivity of the duration gap between assets and liabilities to interest rate changes | Interest rate swaps and options | ||
| U.S. variable annuities, Canadian segregated funds and reinsurance on variable annuity guarantees offered by other insurance companies | To manage the exposure to product guarantees sensitive to movement in equity market and interest rate levels | Put and call options on equity indices; futures on equity indices, government bonds and interest rates; interest rate swaps | ||
| U.S. fixed index annuities | To manage the exposure to product guarantees related to equity market performance | Futures and options on equity indices; swaps and futures on government bonds | ||
| Currency exposure in relation to asset-liability management | To reduce the sensitivity to currency fluctuations by matching the value and cash flows of specific assets denominated in one currency with the value and cash flows of the corresponding liabilities denominated in another currency | Currency swaps and forwards |
In addition to the general policies and monitoring, we use a variety of tools in counterparty risk management. Over-the-counter derivative transactions are performed under International Swaps and Derivatives Association, Inc. (“ISDA”) Master Agreements. Most of the ISDAs are accompanied by a Credit Support Annex, which requires daily collateral posting.
The values of our derivative instruments are summarized in the following table. The use of derivatives is measured in terms of notional amounts, which serve as the basis for calculating payments and are generally not actual amounts that are exchanged.
The total notional amount of derivatives in our portfolio decreased to $43.7 billion as at December 31, 2010, from $47.3 billion at the end of 2009, primarily due to a decrease in interest rate and equity contracts partially offset by an increase in foreign exchange contracts. The net fair value increased to $929 million in 2010 from the 2009 year-end amount of $125 million. The change was primarily due to the unwinding and maturity of some contracts which were in a loss position a year ago, as well as an increase in the market value of interest rate and foreign exchange contracts resulting from increases in interest rates and the strengthening of the Canadian dollar relative to foreign currencies.
| ($ millions) | 2010 | 2009 | ||||||
As at December 31 | ||||||||
Net fair value | 929 | 125 | ||||||
Total notional amount | 43,717 | 47,260 | ||||||
Credit equivalent amount | 1,231 | 1,010 | ||||||
Risk-weighted credit equivalent amount | 9 | 7 | ||||||
As the regulator of the Canadian insurance industry, OSFI provides guidelines to quantify the use of derivatives. The credit equivalent amount, a measure used to approximate the potential credit exposure, is determined as the replacement cost of the derivative contracts having a positive fair value plus an amount representing the potential future credit exposure.
The risk-weighted credit equivalent amount is a measure used to determine the amount of capital necessary to support derivative transactions for certain Canadian regulatory purposes. It is determined by weighting the credit equivalent amount according to the nature of the derivative and the creditworthiness of the counterparties.
As at December 31, 2010, the credit equivalent amounts for interest rate contracts, foreign exchange contracts, and equity and other contracts were $336 million, $803 million and $92 million, respectively. The corresponding risk-weighted credit equivalent amounts were $2 million, $6 million and $1 million, respectively. Additional details in respect of derivatives are included in Notes 5 and 6 to our 2010 Consolidated Financial Statements.
Impaired Assets
Financial assets that are classified as HFT, which represented 59% of our 2010 invested assets, do not have allowances for losses since changes in the fair value of these assets are recorded to income and the assets are recorded at fair value on the balance sheet. The invested asset values and ratios presented in this section are based on the carrying value of the respective asset categories. Carrying values for AFS and HFT invested assets are generally equal to fair value. In the event of default, if the amounts recovered are insufficient to satisfy the related actuarial liability cash flows that the assets are intended to support, credit exposure may be greater than the carrying value of the asset.
Net impaired assets for mortgages and corporate loans, net of allowances, amounted to $425 million as at December 31, 2010, $256 million higher than the December 31, 2009 level for these assets.
| Management’s Discussion and Analysis Sun Life Financial Inc. Annual Report 2010 | 57 |
In addition to allowances reflected in the carrying value of mortgages and corporate loans, we have provided $2.9 billion for possible future asset defaults over the lifetime of our actuarial liabilities as at December 31, 2010. To the extent an asset is written off or disposed of, any amounts set aside for possible future asset defaults in actuarial liabilities in respect of that asset will be released into income. The $2.9 billion for possible future asset defaults excludes the portion of the provision that can be passed through to participating policyholders and provisions for possible reductions in the value of equity and real estate assets supporting actuarial liabilities.
AFS bonds, stocks and other invested assets are generally identified as temporarily impaired if their amortized cost is greater than their fair value, resulting in an unrealized loss. Unrealized losses may be due to interest rate fluctuations or depressed fair values in sectors which have experienced unusually strong negative market reactions. The fair value of temporarily impaired financial assets represented $3.1 billion and the associated unrealized losses amounted to $0.2 billion as at December 31, 2010. Our gross unrealized losses as at December 31, 2010, for AFS and HFT bonds were $0.1 billion and $1.2 billion, respectively, compared with $0.4 billion and $2.4 billion, respectively, as at December 31, 2009. The decrease in gross unrealized losses was largely due to decreases in interest rates and a narrowing of credit spreads, which had a positive impact on the fair value of bonds.
Additional details concerning impaired assets can be found in Note 6 to our 2010 Consolidated Financial Statements.
Risk Management
Risk Management Framework
We have a comprehensive framework for the management of enterprise risk. This framework highlights five major categories of risk (credit risk, market risk, insurance risk, operational risk and strategic risk) and sets out key processes for their management in the areas of risk appetite articulation, risk identification, measurement and assessment, risk response development, monitoring and control, and risk reporting and communication.
The framework recognizes the important role that risk culture plays in the effective management of enterprise risk. Our risk culture is supported by a strong “tone from the top”, which is reinforced and emanates from the Board of Directors and cascades through the Board Committees, our executive officers, line management and staff. A key premise of our enterprise risk management culture is that all employees and distributors have an important role to play in managing enterprise risks, and collectively form part of our extended risk management team.
Our enterprise risk management framework is rooted in a corporate risk philosophy that reflects the understanding that we are in the business of taking risk for appropriate return. This is core to our corporate vision, mission and customer value proposition. Effective risk-taking and risk management are critical to the overall profitability, competitive market positioning and long-term financial viability of the Company. We seek to instill a disciplined approach to optimizing the inherent tradeoffs between risk and return in all our risk management practices.
Risk Philosophy and Principles
Our risk philosophy reflects a number of core principles that embody our overall risk appetite and values. These principles are outlined below:
Strategic Alignment
Our risk appetite is aligned with the Company’s overall vision, mission and business goals. This alignment is obtained by the consideration of which risks are deemed core, non-core or collateral risks.
Core risks are those risks that we are willing to accept in order to achieve return expectations and successfully achieve our stated mission to “help customers achieve lifetime financial security”, and our business objectives. These core risks include equity, interest rate, mortality, morbidity, asset-liability management and credit risks. We have established a range of explicit risk appetite limits and operational control points for these core risks.
Non-core risks are those associated with activities outside of our risk appetite and approved business strategies and are therefore generally avoided, regardless of expected returns.
Collateral risks are those that are incurred as a by-product or are collateral to the pursuit of the risk and return optimization of core risks. Operational risks often fall into this category. We endeavour to mitigate collateral risks to the extent that the benefit of risk reduction is commensurate with the cost of mitigation.
Stakeholder Interests
Our risk framework considers the interests of a large number of key stakeholder groups, including policyholders, shareholders, debt-holders, employees, regulators, rating agencies and other capital market participants. Our risk framework endeavours to appropriately balance the needs, expectations, risk and reward perspectives and investment horizons of these stakeholders. In particular, our risk appetite framework is established to support the pursuit of shareholder value while ensuring that our ability to pay claims and fulfill long-term policyholder commitments is not compromised. Our risk management approach is designed to support long-term credit and financial strength ratings, strong capital levels, ongoing favourable access to capital markets and the continuing enhancement of our overall franchise value and brand.
| 58 | Sun Life Financial Inc. Annual Report 2010 Management’s Discussion and Analysis |
Our executive compensation philosophy recognizes the importance and contribution of a highly effective and motivated leadership team in pursuing sustainable growth in shareholder value. We remain committed to ensuring that the design and governance of overall compensation practices are aligned with our risk philosophy, principles and policies.
Capability Alignment
Our risk appetite is aligned with our inherent risk management capabilities. Our ability to perform robust risk assessments, the quality of our risk governance and control environment and the depth and quality of our innovative risk response and pricing strategies are particularly important capabilities in this regard. We proactively seek out profitable risk-taking opportunities in those areas where we have established risk management skills and capabilities. Conversely, we endeavour to avoid risks that are beyond our risk-taking capability.
Risk Budgeting
We seek to allocate our risk-taking capacity in a manner that optimizes the overall level of risk-adjusted returns and stakeholder value creation. Budgeting of risk-taking capacity is managed through the application of prescribed risk tolerance limits and the embedding of strong risk management discipline into a wide range of key management decision-making processes.
Portfolio Perspective
Risk/return trade-offs are assessed and managed not only based on the intrinsic merits of a particular opportunity, but also relative to their marginal contribution to our overall risk profile and business portfolio. This perspective is extended to the development of risk mitigation and pricing strategies, recognizing that often the most cost-effective way of managing risk involves utilizing available diversification relationships already inherent in our business model and risk portfolio.
Risk to Reputation
A financial institution’s reputation is one of its most important assets. We recognize the increasingly important and high profile role that a strong enterprise-wide risk management discipline can play in this regard. A key objective of our enterprise risk management framework is to help ensure that it continues to operate under standards that support its ability to maintain and build upon a sound corporate reputation and brand.
Accountability
Our enterprise-wide risk management framework sets out lines of responsibility and authority for risk-taking, governance and control.
The Company’s Board of Directors is ultimately responsible for ensuring that risk management policies and practices are in place. Through approval of our risk appetite and ongoing oversight, the Board of Directors ensures that our principal risks are appropriately identified and managed. The Board of Directors has delegated this function to its Risk Review Committee, which is a standing committee of the Board of Directors. That Committee is comprised of independent directors, whose primary functions are to assist the Board of Directors with its oversight role with respect to the review and approval of risk management policies, ensuring the identification of major areas of risk facing the Company and the development of strategies to manage those risks, and to review compliance with risk management policies implemented by the Company.
The Board of Directors has delegated the approval of investment risk management policies to its Investment Oversight Committee. This committee, also composed of independent directors, is responsible for the oversight of investment policies, practices, procedures and controls related to the management of the general fund investment portfolio, the approval and monitoring of the annual Investment Plan and monitoring the investment performance of enterprise pension and savings plans.
The Board of Directors has delegated the approval of compliance risk management policies to its Governance and Conduct Review Committee. This committee is also composed of independent directors. Its primary functions are to assist the Board of Directors with its oversight role by developing effective corporate governance guidelines and processes; reviewing policies and processes to sustain ethical behaviour; reviewing reports related to compliance with legal and regulatory matters; assessing the effectiveness of the Board of Directors and its Committees as well as the contributions of individual Directors; and identifying and recommending for election as Directors those individuals with Board-determined competencies, skills and qualities who are best suited to complement the current Board composition.
Primary accountability for risk management is delegated by the Board of Directors to the Company’s CEO, and the CEO further delegates responsibilities throughout the Company through a framework of management authorities and responsibilities. The CEO delegates line accountability for the various classes of risk management to our executive officers, who are accountable for ensuring the day-to-day management of enterprise risk in their scope of business accountability in accordance with Board approved risk policies and this framework. In particular, business segment leaders have overall, front line accountability for managing the risks in their operations and are supported by a network of business segment compliance and risk officers.
Our governance model for risk management also includes oversight from the various functional heads in the Corporate Office. There are functional heads for all key business oversight functions such as the Chief Compliance Officer, the Chief Privacy Officer and the Chief Internal Auditor. The Internal Audit function supports our risk management activities through ongoing assessments of the effectiveness of, and adherence to, internal controls. All of the functional heads support the Chief Risk Officer (the “CRO”) in the development and communication of the Company’s enterprise risk management function. The responsibilities of the CRO role include developing and implementing enterprise-wide risk management strategies aimed at optimizing our global risk/return profile and providing independent functional oversight of our enterprise-wide risk management programs by ensuring that effective risk management processes are in place for risk identification, risk measurement and assessment, risk response development, risk monitoring and control, and reporting and communication of risks inherent in our activities.
| Management’s Discussion and Analysis Sun Life Financial Inc. Annual Report 2010 | 59 |
Risk Management Policies
In order to support the effective communication, implementation and governance of our enterprise risk framework, we have codified our processes and operational requirements in a comprehensive series of risk management policies and operating guidelines. These polices and guidelines promote the application of a consistent approach to managing risk exposures across our global business platform. These risk management policies are reviewed and approved annually by the Risk Review Committee, Investment Oversight Committee and Governance and Conduct Review Committee. These Committees also receive an annual report summarizing management’s attestation of compliance to these policies.
Risk Categories
| The shaded text and tables in the following section of this MD&A represent our disclosure on credit, market and liquidity risks in accordance with CICA Handbook Section 3862,Financial Instruments – Disclosures,and includes discussion on how we measure risk and our objectives, policies and methodologies for managing these risks. Therefore, the shaded text and tables represent an integral part of our audited 2010 Annual Consolidated Financial Statements for the years ended December 31, 2010, and December 31, 2009. The shading in this section does not imply that these disclosures are of any greater importance than non-shaded tables and text, and the Risk Management disclosure should be read in its entirety. |
Our Enterprise Risk Management Framework highlights five major risk categories – Credit Risk, Market Risk, Insurance Risk, Operational Risk and Strategic Risk.
Credit Risk
|
| Risk Description |
| Credit risk is the risk of loss from not receiving amounts owed by our financial counterparties. We are subject to credit risk in connection with issuers of securities held in our investment portfolio, debtors (e.g., mortgagors), structured securities, reinsurers, derivative counterparties, other financial institutions (e.g., amounts held on deposit) and other entities. Losses may occur when a counterparty fails to make timely payments pursuant to the terms of the underlying contractual arrangement or when the counterparty’s credit rating or risk profile otherwise deteriorates. Credit risk can also arise in connection with deterioration in the value of or ability to realize on any underlying security that may be used to collateralize the debt obligation (e.g., real estate property values in the case of mortgage obligations). Credit risk can occur at multiple levels, as a result of broad economic conditions, challenges within specific sectors of the economy, or from issues affecting individual companies. Events that result in defaults, impairments or downgrades of the securities in our investment portfolio would cause the Company to record realized or unrealized losses and increase our provisions for asset default, adversely impacting earnings. |
Credit Risk Management Governance and Control |
Our core principles of credit risk management include asset diversification, fundamental research and analysis of cash flows, proactive and continuous monitoring, active management and relative value assessment, with the objective of optimizing risk adjusted returns, with due consideration for the impacts of capital and taxation.
| Key controls utilized in the management and measurement of credit risk are outlined below: |
• Enterprise-wide risk appetite and tolerance limits have been established for credit risk |
• Ongoing monitoring and reporting of credit risk sensitivities against pre-established risk tolerance limits |
• Detailed credit risk management policies, guidelines and procedures |
• Specific investment diversification requirements such as investing by asset class, geography and industry |
• Risk based credit portfolio, counterparty and sector exposure limits |
• Mandatory use of credit quality ratings for portfolio investments which are established and reviewed regularly |
• Comprehensive due diligence processes and ongoing credit analysis |
• Regulatory solvency requirements that include risk based capital requirements |
• Comprehensive compliance monitoring practices and procedures including reporting against pre-established investment limits |
• Reinsurance exposures are monitored to ensure that no single reinsurer represents an undue level of credit risk |
• Stress-testing techniques, such as Dynamic Capital Adequacy Testing, are used to measure the effects of large and sustained adverse credit developments |
• Reserve provisions are established in accordance with standards set forth by the Canadian Institute of Actuaries |
• Target capital levels that exceed regulatory minimums |
• Active credit risk governance including independent monitoring and review and reporting to senior management and the Board |
Additional information concerning credit risk can be found in Note 6A to our 2010 Consolidated Financial Statements.
Market Risk
|
| Risk Description |
| We are exposed to significant financial and capital market risk – the risk that the fair value or future cash flows of an insurance contract or financial instrument will fluctuate because of changes in market prices. Market risk includes the following types of risk: (i) equity market risk, resulting from changes in equity market prices; (ii) interest rate risk, resulting from changes in interest rates or credit/swap spreads; (iii) currency risk, resulting from changes in foreign exchange rates; and (iv) real estate risk. In addition, we are subject to other price risk resulting from changes in market prices other than those arising from equity risk, interest rate risk, currency risk or real estate risk, whether those changes are caused by factors specific to the individual insurance contract, financial instrument or its issuer, or factors affecting all similar financial instruments traded in the market. |
| 60 | Sun Life Financial Inc. Annual Report 2010 Management’s Discussion and Analysis |
These factors can also give rise to liquidity risk if we are forced to sell assets at depressed market prices in order to fund our commitments. Market changes and volatility could be the result of general capital market conditions or specific social, political or economic events.
| Market Risk Management Governance and Control |
| We employ a wide range of market risk management practices and controls, as outlined below: |
• Enterprise-wide risk appetite and tolerance limits have been established for market risk |
• Ongoing monitoring and reporting of market risk sensitivities against pre-established risk tolerance limits |
• Detailed asset-liability/market risk management policies, guidelines and procedures are in place |
• Management and governance of market risks is achieved through various asset-liability management committees that oversee key market risk strategies and tactics, review compliance with applicable policies and standards, and review investment and hedging performance |
• Hedging and asset-liability management programs are maintained in respect of key selected market risks |
• Product development and pricing policies that require a detailed risk assessment and pricing provisions for material market risks |
• Stress-testing techniques, such as Dynamic Capital Adequacy Testing, are used to measure the effects of large and sustained adverse market movements |
• Reserve provisions are established in accordance with standards set forth by the Canadian Institute of Actuaries |
• Target capital levels that exceed regulatory minimums. |
| Equity Market Risk |
| We are exposed to equity risk from a number of sources. Our primary exposure to equity risk arises, in connection with the underwriting of benefit guarantees on variable annuity and segregated fund annuity contracts (i.e., segregated fund products in SLF Canada, variable annuities in SLF U.S. and run-off reinsurance in our Corporate segment). These benefit guarantees are linked to underlying fund performance and may be triggered upon death, maturity, withdrawal or annuitization. |
| We also derive a portion of our revenue from fee income generated by our asset management businesses and from certain insurance and annuity contracts where fee income is levied on account balances that generally move in line with equity market levels. Accordingly, adverse fluctuations in the market value of such assets would result in corresponding adverse impacts on our revenue and net income. In addition, declining and volatile equity markets may have a negative impact on sales and redemptions (surrenders) for this business, resulting in further adverse impacts on our net income and financial position. |
| We also have direct exposure to equity markets from the investments supporting other general account liabilities, surplus and employee benefit plans. These exposures generally fall within our risk-taking philosophy and appetite and are therefore generally not hedged. |
| Interest Rate Risk |
| Interest rate risk is the potential for financial loss arising from changes or volatility in interest rates or credit/swap spreads when assets and liability cash flows do not coincide. We are exposed to interest rate risk when the cash flows from assets and the policy obligations they support are significantly mismatched, as this may result in the need to either sell assets to meet policy payments and expenses or reinvest excess asset cash flows in unfavourable interest rate environments. The impact of changes or volatility in interest rates or credit/swap spreads are reflected in the valuation of our financial assets and liabilities for insurance contracts in respect of insurance and annuity products. |
| Certain products have explicit or implicit interest rate guarantees in the form of settlement options, minimum guaranteed crediting rates and guaranteed premium rates. If investment returns fall below those guaranteed levels, we may be required to increase liabilities or capital in respect of these insurance contracts. The guarantees attached to these products may be applicable to both past premiums collected and future premiums not yet received. Our primary residual exposure to interest rate risk arises from certain insurance products with guaranteed premium rates or minimum interest guarantees. These products are included in our asset-liability management program and the residual interest rate exposure is managed within risk tolerance limits. |
Declines in interest rates or narrowing credit/swap spreads can result in compression of the net spread between interest earned on investments and interest credited to policyholders. Declines in interest rates or narrowing credit/swap spreads may also result in increased asset calls, mortgage prepayments and net reinvestment of positive cash flows at lower yields, and therefore adversely impact our profitability and financial position. In contrast, increases in interest rates or a widening of credit/swap spreads may have a material impact on the value of fixed income assets, resulting in depressed market values, and may lead to losses in the event of the liquidation of assets prior to maturity.
| Significant changes or volatility in interest rates, or credit/swap spreads could have a negative impact on sales of certain insurance and annuity products, and adversely impact the expected pattern of redemptions (surrenders) on existing policies. Increases in interest rates or widening credit/swap spreads may increase the risk that policyholders will surrender their contracts, forcing us to liquidate investment assets at a loss and accelerate recognition of certain acquisition expenses. While we have established hedging programs in place and our insurance and annuity products often contain surrender mitigation features, these may not be sufficient to fully offset the adverse impact of the underlying losses on asset sales. |
We also have direct exposure to interest rates and credit/swap spreads from investments supporting other general account liabilities, surplus and employee benefit plans. Lower interest rates or a narrowing of credit/swap spreads will result in reduced investment income on new fixed income asset purchases. Conversely, higher interest rates or wider credit/swap spreads will reduce the value of our existing assets. These exposures generally fall within our risk-taking philosophy and appetite and are therefore generally not hedged.
| Management’s Discussion and Analysis Sun Life Financial Inc. Annual Report 2010 | 61 |
| We have implemented ongoing asset-liability management and hedging programs involving regular monitoring and adjustment of risk exposures using financial assets, derivative instruments and repurchase agreements to maintain interest rate exposures within our risk tolerances. The general availability and cost of these hedging instruments may be adversely impacted by changes in interest rate levels and volatility, and in addition, these programs may themselves expose us to other risks. |
A sustained low interest rate environment may adversely impact the primary demand for a number of our core insurance offerings requiring a significant repositioning of the product portfolio, and also increase the likelihood of higher surrenders (redemptions) and insurance claims (for example, increased incidence and reduced termination rates in respect of disability related claims). This may contribute to adverse developments in revenues and cost trends and our overall profitability.
| Market Risk Sensitivities |
| We utilize a variety of methods and measures to quantify our market risk exposures. These include duration management, key rate duration techniques, convexity measures, cash flow gaps, scenario testing, and sensitivity testing of earnings and regulatory capital ratios versus risk tolerance limits which are calibrated to our risk appetite. |
| Our earnings are affected by the determination of policyholder obligations under our annuity and insurance contracts. These amounts are determined using internal valuation models and are recorded in the Company’s Consolidated Financial Statements, primarily as actuarial liabilities. The determination of these obligations requires that we make assumptions about the future level of equity market performance, interest rates and other factors over the life of our products. Differences between our actual experience and our best estimate assumptions are reflected in the financial statements. Debt securities and equities designated as AFS generally do not support liabilities. Changes in the fair value of AFS debt securities and equities are recorded to OCI. The following table sets out the estimated immediate impact or sensitivity of our net income and OCI to certain instantaneous changes in interest rates and equity market prices as at December 31, 2010, independently, assuming all other variables remain constant. In addition, we have provided the estimated impact on our MCCSR ratio using the same instantaneous changes in interest rates and equity market prices. |
Market Risk Sensitivities
| as at December 31, 2010 | ||||||||||
| Changes in interest rates(1) | Net income(3) ($ millions) | Increase (decrease) in after-tax OCI ($ millions) | MCCSR(4) | |||||||
1% increase | $50 to $150 | $(300) to $(400) | Up to 8 percentage points increase | |||||||
1% decrease | $(150) to $(250) | $325 to $425 | Up to 10 percentage points decrease | |||||||
| Changes in equity markets(2) | ||||||||||
10% increase | $25 to $75 | $25 to $75 | Up to 5 percentage points increase | |||||||
10% decrease | $(125) to $(175) | $(25) to $(75) | Up to 5 percentage points decrease | |||||||
25% increase | $50 to $150 | $100 to $200 | Up to 5 percentage points increase | |||||||
25% decrease | $(475) to $(575) | $(100) to $(200) | Up to 10 percentage points decrease | |||||||
| as at December 31, 2009 | ||||||||||
| Changes in interest rates(1) | Net income(3) ($ millions) | Increase/(decrease) in after-tax OCI ($ millions) | MCCSR(4) | |||||||
1% increase | $(50) to $50 | $(375) to $(425) | Up to 8 percentage points increase | |||||||
1% decrease | $(150) to $(250) | $375 to $425 | Up to 12 percentage points decrease | |||||||
| Changes in equity markets(2) | ||||||||||
10% increase | $75 to $125 | $25 to $75 | Up to 5 percentage points increase | |||||||
10% decrease | $(150) to $(200) | $(25) to $(75) | Up to 5 percentage points decrease | |||||||
25% increase | $150 to $250 | n/a | Up to 5 percentage points increase | |||||||
25% decrease | $(475) to $(575) | n/a | Up to 15 percentage points decrease | |||||||
(1) Represents a 1% parallel shift in assumed interest rates across the entire yield curve as at December 31. Variations in realized yields based on different terms to maturity, asset class types, credit spreads and ratings may result in realized sensitivities being significantly different from those illustrated above. (2) Represents the respective change across all equity markets as at December 31. Assumes that actual equity exposures consistently and precisely track the broader equity markets. Since in actual practice equity-related exposures generally differ from broad market indices (due to the impact of active management, basis risk and other factors), realized sensitivities may differ significantly from those illustrated above. (3) The market risk sensitivities include the expected mitigation impact of our hedging programs in effect as at December 31 and include new business added and product changes implemented during the year. | ||||||
| (4) | The MCCSR sensitivities illustrate the impact on the MCCSR ratio for Sun Life Assurance as at December 31. This excludes the impact on assets and liabilities that are included in Sun Life Financial but not included in Sun Life Assurance. |
| We used a 1% increase (decrease) in interest rates and a 10% increase (decrease) in our equity markets to determine the above sensitivities because we believe that these market shocks were reasonably possible as at December 31, 2010. We have also disclosed the impact of a 25% increase or decrease in our equity market sensitivity to illustrate that changes in equity markets in excess of 10% may result in other than proportionate impacts. |
Variable Annuity and Segregated Fund Guarantees
Approximately 80% to 90% of our sensitivity to equity market risk is derived from segregated fund products in SLF Canada, variable annuities in SLF U.S. and run-off reinsurance in our Corporate business segment. These products provide benefit guarantees, which are linked to underlying fund performance and may be triggered upon death, maturity, withdrawal or annuitizations.
| 62 | Sun Life Financial Inc. Annual Report 2010 Management’s Discussion and Analysis |
The following table provides information with respect to the guarantees provided in the Company’s variable annuity and segregated fund businesses.
Variable Annuity and Segregated Fund Risk Exposures
| ($ millions) | December 31, 2010 | |||||||||||||||
| Fund value | Amount at risk(1) | Value of guarantees(2) | Actuarial liabilities(3) | |||||||||||||
SLF Canada | 12,494 | 300 | 11,347 | 116 | ||||||||||||
SLF U.S. | 23,923 | 2,064 | 25,697 | 221 | ||||||||||||
Run-off reinsurance(4) | 3,070 | 642 | 2,614 | 403 | ||||||||||||
Total | 39,487 | 3,006 | 39,658 | 740 | ||||||||||||
| December 31, 2009 | ||||||||||||||||
| Fund value | Amount at risk(1) | Value of guarantees(2) | Actuarial liabilities(3) | |||||||||||||
SLF Canada | 10,796 | 539 | 10,380 | 215 | ||||||||||||
SLF U.S. | 21,069 | 3,006 | 23,944 | 675 | ||||||||||||
Run-off reinsurance(4) | 3,049 | 811 | 2,930 | 452 | ||||||||||||
Total | 34,915 | 4,356 | 37,254 | 1,342 | ||||||||||||
(1) The “amount at risk” represents the excess of the value of the guarantees over fund values on all policies where the value of the guarantees exceeds the fund value. The amount at risk is not currently payable as the guarantees are only payable upon death, maturity, withdrawal or annuitization if fund values remain below guaranteed values. (2) For guaranteed lifetime withdrawal benefits, the “value of guarantees” is calculated as the present value of the maximum future withdrawals assuming market conditions remain unchanged from current levels. For all other benefits, the value of guarantees is determined assuming 100% of the claims are made at the valuation date. (3) The “actuarial liabilities” represent management’s provision for future costs associated with these guarantees in accordance with accounting guidelines and include a provision for adverse deviation in accordance with valuation standards. (4) The run-off reinsurance business includes risks assumed through reinsurance of variable annuity products issued by various North American insurance companies between 1997 and 2001. This line of business has been discontinued and is part of a closed block of reinsurance which is included in our Corporate business segment. |
The movement of the items in the table above from December 31, 2009 to December 31, 2010 was primarily as a result of:
| (i) | fund value increased due to favourable equity market movements and new business written in 2010. This was partially offset by the strengthening of the Canadian dollar against foreign currencies relative to prior period end exchange rates |
| (ii) | the amount at risk decreased due to favourable equity market movements and the strengthening of the Canadian dollar against foreign currencies relative to prior period end exchange rates |
| (iii) | the value of guarantees has increased as a result of net sales during the year and the associated increase in fund values, partially offset by the impact ofthe strengthening of the Canadian dollar relative to the prior period |
| (iv) | actuarial liabilities decreased due to favourable equity market movements and the strengthening of the Canadian dollar against foreign currencies relative to prior period end exchange rates |
The ultimate cost of providing for the guarantees in respect of the Company’s variable annuity and segregated fund contracts is uncertain and will depend upon a number of factors including general capital market conditions, policyholder behaviour and mortality experience, each of which may result in negative impacts on net income and capital.
Variable Annuity and Segregated Fund Equity Hedging
We have implemented hedging programs, involving the use of derivative instruments, to mitigate a portion of the equity market-related volatility in the cost of providing for these guarantees, thereby reducing our exposure to this particular class of equity market risk. As at December 31, 2010, over 90% of our total variable annuity and segregated fund contracts, as measured by associated fund values, were included in an equity hedging program. This hedging program reduces our net income sensitivity to equity market declines from variable annuity and segregated fund contracts by approximately 55% to 65%. While a large percentage of contracts are included in the equity hedging program, not all of our equity exposure related to these contracts is hedged. For those variable annuity and segregated fund contracts included in the equity hedging program, we generally hedge the fair value of expected future net claims costs and a portion of the policy fees as we are primarily focused on hedging the expected economic costs associated with providing segregated fund and variable annuity guarantees. The following table illustrates the impact of our hedging program related to our sensitivity to a 10% and 25% decrease in equity markets for variable annuity and segregated fund contracts.
Impact of Variable Annuity and Segregated Fund Equity Hedging
| December 31, 2010 | ||||||||
Net income(1) | 10% decrease(2) | 25% decrease(2) | ||||||
Before hedging | (350) – (400) | (1,075) – (1,175) | ||||||
Equity hedging impact | 225 – 275 | 600 – 700 | ||||||
Net of equity hedging | (100) – (150) | (425) – (525) | ||||||
(1) Since the fair value of benefits being hedged will generally differ from the financial statement value (due to different valuation methods and the inclusion of valuation margins in respect of financial statement values), this approach will result in residual volatility to equity market shocks in reported income and capital. The general availability and cost of these hedging instruments may be adversely impacted by a number of factors, including volatile and declining equity and interest rate market conditions. (2) Represents the respective change across all equity markets as at December 31, 2010. Assumes that actual equity exposures consistently and precisely track the broader equity markets. Since in actual practice equity-related exposures generally differ from broad market indices (due to the impact of active management, basis risk and other factors), realized sensitivities may differ significantly from those illustrated above. |
Our hedging strategy is applied both at the line of business/product level and enterprise level using a combination of static (i.e., purchasing of longer dated equity put options) and dynamic (i.e. frequent re-balancing of short-dated equity derivative contracts) hedging techniques. We actively monitor our overall market exposure and may implement tactical hedge overlay strategies (primarily in the form of equity futures contracts) in order to align expected earnings sensitivities with enterprise risk management objectives.
| Management’s Discussion and Analysis Sun Life Financial Inc. Annual Report 2010 | 63 |
| Market Risk Sensitivities and Hedging – Additional Cautionary Language and Key Assumptions |
Our market risk sensitivities are forward-looking information. These are measures of our estimated net income and capital sensitivities to the changes in interest rate and equity market levels described above, based on interest rates, equity market prices and business mix in place as at December 31. These sensitivities are calculated independently for each risk factor, generally assuming that all other risk variables stay constant. Actual results can differ materially from these estimates for a variety of reasons, including differences in the pattern or distribution of the market shocks, the interaction between these risk factors, model error or changes in other assumptions such as business mix, effective tax rates, policyholder behaviour, currency exchange rates and other market variables relative to those underlying the December 31 calculation dates for these sensitivities. These sensitivities also assume that a change to the current valuation allowance on future tax assets is not required. In addition, the MCCSR sensitivities are non-GAAP financial measures.
|
The sensitivities reflect the composition of our assets and liabilities as at December 31. Changes in these positions due to new sales or maturities, asset purchases/sales or other management actions could result in material changes to these reported sensitivities. In particular, these sensitivities reflect the expected impact of hedging activities based on the hedge assets and programs in place as at the December 31 calculation date. The actual impact of these hedging activities can differ materially from that assumed in the determination of these indicative sensitivities due to ongoing hedge re-balancing activities, changes in the scale or scope of hedging activities, changes in the cost or general availability of hedging instruments, basis risk (the risk that hedges do not exactly replicate the underlying portfolio experience), model risk and other operational risks in the ongoing management of the hedge programs or the potential failure of hedge counterparties to perform in accordance with expectations.
|
The sensitivities are based on financial reporting methods and assumptions in effect as at December 31. Changes in the regulatory environment, accounting or actuarial valuation methods, models or assumptions after this date could result in material changes to these reported sensitivities. Changes in interest rates and equity market prices in excess of the ranges illustrated may result in other- than-proportionate impacts.
|
Our hedging programs may themselves expose us to other risks such as basis risk (the risk that hedges do not exactly replicate the underlying portfolio experience), derivative counterparty credit risk, and increased levels of liquidity risk, model risk, and other operational risks as described in the Risk Factors section in our 2010 AIF. These factors may adversely impact the net effectiveness, costs and financial viability of maintaining these hedging programs and therefore adversely impact our profitability and financial position. While our hedging programs include various elements aimed at mitigating these effects (for example, hedge counterparty credit risk is managed by maintaining broad diversification, dealing primarily with highly rated counterparties and transacting through ISDA agreements that generally include applicable credit support annexes), residual risk and potential reported earnings and capital volatility remain.
|
For the reasons outlined above, these sensitivities should only be viewed as directional estimates of the underlying sensitivities of each factor under these specialized assumptions, and should not be viewed as predictors of the Company’s future net income and capital sensitivities. Given the nature of these calculations, we cannot provide assurance that actual earnings and capital impacts will be within the indicated ranges.
|
Information related to market risk sensitivities and guarantees related to variable annuity and segregated fund products should be read in conjunction with the information contained in the Outlook, Critical Accounting Policies and Estimates and Risk Management sections in our 2010 annual MD&A and Risk Factors and Regulatory Matters in our AIF for the year ended December 31, 2010.
|
| Currency Risk |
Currency risk is the result of mismatches in the currency of our assets and liabilities (inclusive of capital), and cash flows. This risk may arise from a variety of sources such as foreign currency transactions and services, foreign exchange hedging, investments denominated in foreign currencies, investments in foreign subsidiaries and net income from foreign operations.
|
As an international provider of financial services, we operate in a number of countries, with revenues and expenses denominated in several local currencies. In each country in which we operate, we generally maintain the currency profile of assets so as to match the currency of aggregate liabilities and required surplus. This approach provides an operational hedge against disruptions in local operations caused by currency fluctuations. Foreign exchange derivative contracts such as currency swaps and forwards are used as a risk management tool to manage the currency exposure in accordance with our asset-liability risk management policy. As at December 31, 2010, and December 31, 2009, the Company did not have a material currency risk exposure on a functional currency basis.
|
Changes in exchange rates can however affect our net income and surplus when results in functional currencies are translated into Canadian dollars. Net income earned outside of Canada is generally not currency hedged and a weakening in the local currency of our foreign operations relative to the Canadian dollar can have a negative impact on our net income reported in Canadian currency, and vice versa.
|
| Real Estate Price Risk |
| Real estate price risk is the potential for financial loss arising from fluctuations in the fair value or future cash flows of these asset types, and results from the ownership of, or fixed income investments secured by real estate property, leasehold interests, ground rents and purchase and leaseback transactions. Real estate price risk may arise from external market conditions, inadequate property analysis, inadequate insurance coverage, inappropriate real estate appraisals or from environmental risk exposures. We hold direct equity real estate investments supporting general account liabilities and surplus, and fluctuations in the value of these asset types will impact our profitability and financial position. |
| 64 | Sun Life Financial Inc. Annual Report 2010 Management’s Discussion and Analysis |
Insurance Risk
Risk Description
Insurance risk is the uncertainty of product performance due to differences between the actual experience and expected assumptions affecting amounts of claims, benefits payments, expenses and the cost of embedded options and guarantees related to insurance risks. This risk class includes risk factors relating to product development and pricing, mortality, morbidity, longevity, policyholder behaviour and reinsurance.
Insurance Risk Management Governance and Control
Insurance risk is managed through a number of enterprise-wide controls addressing a wide range of insurance risk factors, as follows:
| • | Enterprise-wide insurance underwriting and claims, product development and pricing, and reinsurance risk management policies |
| • | Product development and pricing policies require detailed risk assessment and provision for material insurance risks |
| • | Reserve provisions are established in accordance with standards set forth by the Canadian Institute of Actuaries |
| • | Target capital levels established that exceed regulatory minimums |
| • | Board-approved maximum retention limits (amounts issued in excess of these limits are reinsured) |
| • | Various limits, restrictions and fee structures may be introduced into plan designs in order to establish more homogeneous policy risk profile and limit potential for anti-selection |
| • | Enterprise underwriting and risk selection standards with oversight by corporate underwriting and claims risk management function |
| • | Diversification and risk pooling is managed by aggregation of broad exposures across product lines, geography, distribution channels, etc. |
| • | Experience studies (both Company specific and industry level) and Source of Earnings analysis are periodically monitored and factored into ongoing valuation, renewal and new business pricing processes |
| • | Stress-testing techniques, such as Dynamic Capital Adequacy Testing, are used to measure the effects of large and sustained adverse movements in insurance risk factors |
| • | We have established a reinsurance ceded policy to set acceptance criteria and protocols to monitor the level of reinsurance ceded to any single reinsurer or group of reinsurers. Our reinsurance counterparty risk profile is monitored closely, including through regular reporting to the Risk Review Committee of the Board of Directors |
As part of our governance and control procedures, we review our global retention limits from time to time. Effective January 1, 2011, we increased our global mortality retention limit for individual life insurance from US$15 million to US$ 25 million, for business sold in Canada the new limit is $25 million. The limit for survivorship life insurance has increased from US$20 million to US$30 million, for business sold in Canada the new limit is $30 million. The changes in limits are not expected to have a material impact on our risk exposure.
Operational Risk
Risk Description
Operational risk is the uncertainty arising from larger than expected losses or damage to finances or reputation resulting from inadequate or failed internal processes, controls, people, systems, or from external events. This risk class encompasses a wide range of risks, including those pertaining to legal and regulatory, business continuity, model risk, information system security and privacy, outsourcing, fraud, environmental risk, human resource management and liquidity risk. Operational risk is also embedded in the practices utilized to manage other risks therefore, if not managed effectively, it can impact our ability to manage other key risks such as credit risk, market and insurance risk.
Operational Risk Management Governance and Control
Our governance practices, corporate values and Code of Conduct set the foundation for mitigation of operational risks. We perform ongoing monitoring and reporting of all significant operational risks, including regular briefings to senior management and Board Committees. We have established enterprise-wide policies and controls for all significant operational risks, including:
| • | Compliance: An enterprise-wide compliance framework has been established consisting of policies and operating guidelines and is supported by a network of compliance officers. Enterprise oversight is provided by the Chief Compliance Officer. |
| • | Privacy: Privacy policies, privacy officers and processes have been established to provide guidance on handling private and confidential information and for reporting privacy issues to appropriate management for response and resolution. Enterprise oversight is provided by the Chief Privacy Officer. |
| • | Financial Models: An enterprise-wide Management of Financial Models Policy and Business Segment Operating Guidelines have been established. These policies include a requirement that each business segment maintain an inventory of significant models and sets out expectations for associated documentation, review and testing. Risk assessments are conducted on significant models, and plans are developed to address identified sources of risk. |
| • | Business Interruption: An enterprise-wide Business Continuity Policy has been established. Business continuity, crisis management and disaster recovery programs have been designed and implemented to ensure to the extent practically possible that key business functions can continue and normal operations can resume effectively and efficiently in the event of a major disruption. These programs are periodically tested, and each business unit maintains its own business continuity plans under the oversight of the global business continuity program. |
| • | Information Security: An enterprise-wide security program has been established, consisting of policies, standards and processes. The program is aligned to appropriate industry standards and is compliant with applicable laws and regulations. Enterprise oversight is provided through the Chief Information Officer. |
| • | Outsourcing: An enterprise-wide Outsourcing Policy and operating guidelines have been established to manage the risks associated with the outsourcing of business activities, functions or processes to a third-party provider. |
| Management’s Discussion And Analysis Sun Life Financial Inc. Annual Report 2010 | 65 |
| • | Human Resources: Human resources policies and standards have been developed and implemented. We are committed to employee training and development, and our compensation program is designed to attract, motivate and retain high-performing employees and to encourage sound risk management by all employees. We endeavour to assess talent through leadership review processes and build leadership bench strength and depth to succession options through enterprise leadership development programs. Employee engagement is monitored through enterprise-wide employee engagement surveys and strategies are implemented to address any issues. |
| • | Environment: An environmental risk management program, which reflects our commitment to conducting all business activities in a manner that recognizes the need to preserve the quality of the environment, is maintained to help protect investment assets (primarily real estate, mortgage and structured finance portfolios) from losses due to environmental issues and to help ensure compliance with applicable laws. |
Liquidity Risk
We generally maintain a conservative liquidity position and employ a wide range of liquidity risk management practices and controls, which are described below:
| • | Liquidity is managed in accordance with our liquidity policies and operating guidelines |
| • | Stress testing of our liquidity is performed by comparing liquidity coverage ratios under 1-month and 1-year stress scenarios to our policy thresholds. These liquidity ratios are measured and managed at the business segment level, and the total Company level. |
| • | Cash management and asset-liability management programs support our ability to maintain our financial position by ensuring that sufficient cash flow and liquid assets are available to cover potential funding requirements. We invest in various types of assets with a view of matching them to our liabilities of various durations. |
| • | Target capital levels exceed regulatory minimums. We actively manage and monitor our capital and asset levels, and the diversification and credit quality of our investments |
| • | We maintain various credit facilities for general corporate purposes |
| • | We also maintain liquidity contingency plans for the management of liquidity in the event of a liquidity crisis |
| The following table summarizes the contractual maturities of our significant financial liabilities and contractual commitments as at December 31, 2010. |
| Financial Liabilities and Contractual Obligations |
December 31, 2010 ($ millions) | Within 1 year | 1 year to 3 years | 3 years to 5 years | Over 5 years | Total | |||||||||||||||
General fund policy liabilities(1) | 11,800 | 10,321 | 10,029 | 151,820 | 183,970 | |||||||||||||||
Senior debentures and unsecured financing(2) | 231 | 462 | 462 | 9,454 | 10,609 | |||||||||||||||
Subordinated debt(2) | 171 | 343 | 500 | 3,908 | 4,922 | |||||||||||||||
Bond repurchase agreements | 1,270 | – | – | – | 1,270 | |||||||||||||||
Accounts payable and accrued expenses | 2,678 | – | – | – | 2,678 | |||||||||||||||
Borrowed funds(2) | 94 | 120 | 56 | 60 | 330 | |||||||||||||||
Total liabilities | 16,244 | 11,246 | 11,047 | 165,242 | 203,779 | |||||||||||||||
Contractual commitments(3) | ||||||||||||||||||||
Contractual loan, equity and real estate | 420 | 310 | 138 | 100 | 968 | |||||||||||||||
Operating leases | 88 | 146 | 93 | 196 | 523 | |||||||||||||||
Total contractual commitments | 508 | 456 | 231 | 296 | 1,491 | |||||||||||||||
December 31, 2009 ($ millions) | Within 1 year | 1 year to 3 years | 3 years to 5 years | Over 5 years | Total | |||||||||||||||
General fund policy liabilities(1) | 12,365 | 11,504 | 11,543 | 161,351 | 196,763 | |||||||||||||||
Senior debentures and unsecured financing(2) | 233 | 459 | 459 | 9,654 | 10,805 | |||||||||||||||
Subordinated debt(2) | 191 | 383 | 383 | 4,553 | 5,510 | |||||||||||||||
Bond repurchase agreements | 1,266 | – | – | – | 1,266 | |||||||||||||||
Accounts payable and accrued expenses | 1,927 | – | – | – | 1,927 | |||||||||||||||
Borrowed funds(2) | 98 | 142 | 83 | 62 | 385 | |||||||||||||||
Total liabilities | 16,080 | 12,488 | 12,468 | 175,620 | 216,656 | |||||||||||||||
Contractual commitments:(3) | ||||||||||||||||||||
Contractual loan, equity and real estate | 419 | 197 | 119 | 69 | 804 | |||||||||||||||
Operating leases | 90 | 138 | 65 | 39 | 332 | |||||||||||||||
Total contractual commitments | 509 | 335 | 184 | 108 | 1,136 | |||||||||||||||
(1) General fund policyholder liability cash flows include estimates related to the timing and payment of death and disability claims, policy maturities, annuity payments, minimum guarantees on segregated fund products, policyholder dividends, amounts on deposits, commissions and premium taxes offset by contractual future premiums and fees on in-force contracts. These estimated cash flows are based on the best estimate assumptions used in the determination of policyholder liabilities. These amounts are undiscounted and do not reflect recoveries from reinsurance agreements. The actuarial and other policy liability amounts included in SLF Inc.’s 2010 Consolidated Financial Statements are based on the present value of the estimated cash flows and are net of reinsured amounts. Due to the use of assumptions, actual cash flows will differ from these estimates. (2) Payments due based on maturity dates and includes expected interest payments. Actual redemption of certain securities may occur sooner as some include an option for the issuer to call the security at an earlier date. (3) Contractual commitments and operating lease commitments are not reported on the Consolidated Balance Sheets. |
| 66 | Sun Life Financial Inc. Annual Report 2010 Management’s Discussion and Analysis |
Strategic Risk
Risk Description
Strategic risk is the risk to future earnings and capital arising from structural or other large changes in the competitive, economic, legal or political environment, changing customer behaviour, or a failure to achieve our strategic or long-term business plans, either through incorrect choices or improper implementation of those choices.
Strategic Risk Management Governance and Control
The strategic risks for each of our Business Groups and for the Company as a whole are developed as part of the annual risk identification process through which we develop and maintain a register of enterprise key risks. These risks are then included as one of the key inputs into the development of the strategic plans as part of our integrated planning process. Our business plans, which include the business initiatives to achieve our plan objectives, are then developed from these strategic plans.
Strategic risk is managed through our formal strategic and business planning process. Our strategic plans are reviewed and discussed by our Executive Team and then the key themes, issues and risks emerging are discussed by the Board of Directors. Our business plans are subject to approval by the Board of Directors, which also receive regular reviews of implementation progress against key business plan objectives. Appropriate Board committees receive regular updates of the enterprise key risks.
Merger and acquisition transactions are governed by a Board-approved risk management policy and significant transactions require the approval of the Board of Directors.
Capital and Liquidity Management
Our asset-liability management practices allow us to maintain a strong financial position by ensuring that sufficient liquid assets are available to cover our potential funding requirements. We invest in various types of assets with a view to matching them with its liabilities of various durations.
The regulatory environments in which we operate are expected to evolve as governments and regulators work to develop the appropriate level of financial regulation required to ensure that capital, liquidity and risk management practices are sufficient to withstand severe economic downturns. In Canada, OSFI is considering a number of changes to the insurance company capital rules, including new guidelines that would establish stand-alone capital adequacy requirements for operating life insurance companies, such as Sun Life Assurance, and that would update OSFI’s regulatory guidance for non-operating insurance companies acting as holding companies, such as SLF Inc. OSFI is also reviewing the use of internally modelled capital requirements for variable annuity and segregated fund guarantees. In addition, it is expected that OSFI may align some insurance regulations with those that emerge for banks under the proposed new Basel Capital Accord. The outcome of these initiatives is uncertain and may impact our position relative to that of other Canadian and international financial institutions with which we compete for business and capital.
Principal Sources of Funds
Our primary source of funds is cash provided by operating activities, including premiums, investment management fees and net investment income. These funds are used primarily to pay policy benefits, dividends to policyholders, claims, commissions, operating expenses, interest expenses and shareholder dividends. Cash flows generated from operating activities are generally invested to support future payment requirements, including the payment of dividends to shareholders. We also raise funds from time to time, through borrowing and issuing of securities, to finance growth, acquisitions or other needs.
As at December 31, 2010, we maintained cash, cash equivalents and short-term securities totalling $8.5 billion, of which 2% were held in relation to certain derivative strategies and bond repurchase agreements. In addition to providing for near-term funding commitments, cash, cash equivalents and short-term securities include amounts that support short-term liabilities.
Net cash, cash equivalents and short-term securities decreased by $3.4 billion in 2010. Cash flows generated by operating activities decreased by $684 million in 2010 from 2009 mainly from lower premiums of $2.0 billion, partly offset by increased fee income, lower policyholder payments and a lower level of current income taxes. Financing activities used $591 million of cash in 2010 and provided $1.1 billion in 2009. The decrease was mainly due to higher levels of debt and preferred shares issued during 2009 and redemption of subordinated debt for $300 million in 2010, partially offset by a lower level of common share dividends paid in cash due to a change in timing of dividend payouts and a higher participation rate in the dividend reinvestment plan. Investing activities decreased cash by $4.4 billion during 2010 compared to $3.5 billion in 2009. The increased investing activities arose mainly from higher levels of investment in long-term securities. The strengthening of the Canadian dollar against the U.S. dollar decreased cash balances by $85 million in 2010 compared to a decrease of $802 million in 2009.
| ($ millions) | 2010 | 2009 | 2008 | |||||||||
Net cash provided by operating activities | 2,864 | 3,548 | 1,737 | |||||||||
Net cash provided by (used in) financing activities | (591 | ) | 1,052 | (499 | ) | |||||||
Net cash provided by (used in) investing activities | (4,444 | ) | (3,451 | ) | 35 | |||||||
Changes due to fluctuations in exchange rates | (85 | ) | (802 | ) | 642 | |||||||
Increase (decrease) in cash and cash equivalents | (2,256 | ) | 347 | 1,915 | ||||||||
Cash and cash equivalents, beginning of year | 5,865 | 5,518 | 3,603 | |||||||||
Cash and cash equivalents, end of year | 3,609 | 5,865 | 5,518 | |||||||||
Short-term securities, end of year | 4,878 | 6,003 | 3,361 | |||||||||
Cash, cash equivalents and short-term securities, end of year | 8,487 | 11,868 | 8,879 | |||||||||
| Management’s Discussion and Analysis Sun Life Financial Inc. Annual Report 2010 | 67 |
Liquidity
| The shaded text in the following section of this MD&A represent our disclosures on liquidity and funding risk in accordance with CICA Handbook Section 3862,Financial Instruments – Disclosures,and includes discussion on how we measure our risk and our objectives, policies and methodologies for managing this risk. Therefore, this shaded text represents an integral part of our audited 2010 Annual Consolidated Financial Statements for the years ended December 31, 2010, and December 31, 2009. The shading in this section does not imply that these disclosures are of any greater importance than non-shaded text, and the Capital and Liquidity Management disclosure should be read in its entirety. |
We generally maintain an overall asset liquidity profile that exceeds requirements to fund potential demand liabilities under prescribed adverse liability demand scenarios. To strengthen our liquidity further, we actively manage and monitor our:
| • | capital levels |
| • | asset levels |
| • | matching position |
| • | diversification and credit quality of investments |
| • | cash forecasts and actual amounts against established targets. |
| We are subject to various regulations in the jurisdictions in which we operate. The ability of SLF Inc.’s subsidiaries to pay dividends and transfer funds is regulated in certain jurisdictions and may require local regulatory approvals and the satisfaction of specific conditions in certain circumstances. Through effective cash management and capital planning, SLF Inc. ensures that its subsidiaries, as a whole and on a stand-alone basis, are appropriately funded and maintain adequate liquidity to meet obligations, both individually and in aggregate. |
We maintain various credit facilities for general corporate purposes. As at December 31, 2010, we had two U.S. dollar denominated committed credit facilities totalling US$1.5 billion, of which US$519 million was utilized. In addition, we had uncommitted credit facilities (denominated in Canadian dollars) totalling $185 million, of which $60 million was utilized. As at December 31, 2009, we had three committed credit facilities totalling US$1.7 billion, of which US$596 million was utilized, and uncommitted credit facilities for $185 million, of which $76 million was utilized. All utilization of these facilities was in respect of letters of credit. As at December 31, 2010, the maturity of these credit facilities ranged from one and a half to two years.
The agreements relating to our committed credit facilities contain typical covenants for investment grade companies regarding solvency, credit ratings and financial strength, all of which were met as at December 31, 2010. These covenants include but are not limited to the maintenance of total equity by SLF Inc. of at least $12 billion, tested as of the last day of each fiscal quarter. SLF Inc.’s total equity was $18.4 billion as at December 31, 2010.
Our failure to comply with the covenants under the committed credit facilities would, subject to grace periods in the case of certain covenants, result in an event of default. This could require us to repay any outstanding borrowings or to cash collateralize letters of credit under such facility. A failure by SLF Inc. (or any of its subsidiaries) to pay an obligation due for an amount exceeding $250 million would also result in an event of default under the committed credit facilities described above.
| Based on our historical cash flows, and liquidity management processes, we believe that the cash flow from our operating activities will continue to provide sufficient liquidity for us to satisfy debt service obligations and to pay other expenses as they fall due. |
Capital
We have a capital risk policy designed to maintain a strong capital position and to provide the flexibility necessary to take advantage of growth opportunities, to support the risk associated with its businesses and optimize shareholder return. Our capital risk policy is also intended to provide an appropriate level of risk management over capital adequacy risk, which is defined as the risk that capital is not or will not be sufficient to withstand adverse economic conditions, to maintain financial strength or to allow the Company and its subsidiaries to take advantage of opportunities for expansion. Our capital base is structured to exceed regulatory and internal capital targets and maintain strong credit ratings, while maintaining a capital-efficient structure and desired capital ratios. Capital is managed both on a consolidated basis under principles that consider all the risks associated with the business as well as at the business group level under the principles appropriate to the jurisdictions in which we operate. We manage capital for all of our subsidiaries in a manner commensurate with their individual risk profiles.
Sun Life Financial, including all of its business groups, engages in a capital planning process annually in which capital options, fundraising alternatives and dividend policies are presented to the Risk Review Committee of the Board. Capital reviews are regularly conducted which consider the potential impacts under various business, interest rate and equity market scenarios. Relevant components of the capital reviews are presented to the Risk Review Committee of the Board on a quarterly basis. The Board of Directors is responsible for the annual review and approval of our capital plan.
The Company’s capital risk policy establishes policies, operating guidelines and procedures that govern the management of capital. The Risk Review Committee of the Board reviews and approves SLF Inc.’s capital risk policy annually. Our Corporate Treasury and Risk Management functions are responsible for the design and implementation of the capital risk policy.
The Company’s capital base consists mainly of common shareholders’ equity and retained earnings. Other sources of capital include preferred shareholders’ equity and subordinated debt issued by SLF Inc., Sun Life Assurance and Sun Canada Financial Co. For Canadian regulatory purposes, our capital also includes innovative capital instruments issued by Sun Life Capital Trust and Sun Life Capital Trust II.
| 68 | Sun Life Financial Inc. Annual Report 2010 Management’s Discussion and Analysis |
Notes 10, 11, 13 and 15 to our 2010 Consolidated Financial Statements include additional details on our capital. The following table summarizes the sources of our capital and capital position over the past three years.
Source of Capital
| ($ millions) | 2010 | 2009 | 2008 | |||||||||
Subordinated debt | 2,741 | 3,048 | 2,576 | |||||||||
Trust Securities(1) | 1,644 | 1,644 | 1,150 | |||||||||
Equity | ||||||||||||
Participating policyholders’ equity | 114 | 107 | 106 | |||||||||
Preferred shareholders’ equity | 2,015 | 1,741 | 1,495 | |||||||||
Common shareholders’ equity(2) | 16,230 | 15,489 | 15,731 | |||||||||
Total Equity | 18,359 | 17,337 | 17,332 | |||||||||
Total Capital | 22,744 | 22,029 | 21,058 | |||||||||
Ratio of debt to total capital(3) | 19.3% | 21.3% | 17.7% | |||||||||
Ratio of debt plus preferred shares to total capital(3) | 28.1% | 29.2% | 24.8% | |||||||||
(1) SLEECS net of associated transaction costs. (2) Unrealized gain and losses on cash flow hedges and AFS debt securities are excluded from regulatory capital. (3) Debt includes all short-term and long-term obligations. Total capital includes debt, preferred shares and common stock. |
Common shareholders’ equity was $16.2 billion, as at December 31, 2010, compared with $15.5 billion as at December 31, 2009, an increase of $0.7 billion reflecting stronger income from improved equity and credit markets.
On May 25, 2010, SLF Inc. issued $280 million of 4.35% Class A Non-Cumulative 5-Year Rate Reset Preferred Shares Series 8R (Series 8R Shares) yielding 4.35% annually until June 30, 2015. On June 30, 2015, and every five years thereafter, the annual dividend rate will reset to an annual rate equal to the 5-year Government of Canada bond yield plus 1.41%. Holders of the Series 8R Shares will have the right, at their option, to convert their Series 8R Shares into Class A Non-Cumulative Floating Rate Preferred Shares Series 9QR (Series 9QR Shares) on June 30, 2015 and on June 30 every five years thereafter. Holders of Series 9QR Shares will be entitled to receive fixed non-cumulative quarterly dividends at an annual rate equal to the then 3-month Government of Canada Treasury bill yield plus 1.41%.
On October 12, 2010, Sun Life Assurance redeemed all the outstanding $300 million principal amount of 6.65% Subordinated Debentures, Series 3, due October 12, 2015.
As at December 31, 2010, our debt capital consisted of $2.7 billion in subordinated debentures with maturity dates between 2015 and 2052 and $1.6 billion of SLEECS with maturity dates between 2031 and 2108. The maturity dates of our long-term debt are well distributed over the medium- to long-term horizon to maximize our financial flexibility and to minimize refinancing requirements within a given year. The table below provides the first call and maturity dates for our subordinated debt, SLEECS and preferred shares.
| Management’s Discussion and Analysis Sun Life Financial Inc. Annual Report 2010 | 69 |
We strive to achieve an optimal capital structure by balancing the use of debt and equity financing. The debt-to-capital ratio for SLF Inc., which includes the SLEECS and preferred shares issued by SLF Inc. as part of debt for the purposes of this calculation declined to 28.1% as at December 31, 2010, compared with 29.2% as at December 31, 2009.
| Description | Interest Rate | Earliest Par Call Date/Redemption Date(1) | Maturity | Principal/Face ($ millions) | ||||
Subordinated Debt Issued by Sun Life Assurance | ||||||||
6.30% Debentures, Series 2 | 6.30% | n/a | 2028 | 150 | ||||
6.15% Debentures | 6.15% | June 30, 2012 | 2022 | 800 | ||||
Subordinated Debt Issued by SLF Inc. | ||||||||
Series 2007-1 | 5.40% | May 29, 2037 | 2042 | 400 | ||||
Series 2008-1 | 5.59% | January 30, 2018 | 2023 | 400 | ||||
Series 2008-2 | 5.12% | June 26, 2013 | 2018 | 350 | ||||
Series 2009-1 | 7.90% | March 31, 2014 | 2019 | 500 | ||||
Subordinated Debt Issued by Sun Canada Financial Co. | ||||||||
7.25% Subordinated Notes (US denominated) | 7.25% | n/a | 2015 | 150 | ||||
Trust Units Issued by Sun Life Capital Trust | ||||||||
SLEECS – Series A | 6.865% | December 31, 2011 | 2031 | 950 | ||||
SLEECS – Series B | 7.093% | June 30, 2032 | 2052 | 200 | ||||
Debt Securities Issued by Sun Life Capital Trust II | ||||||||
SLEECS – Series 2009-1 | 5.863% | December 31, 2019 | 2108 | 500 | ||||
Class A Preferred Shares Issued by SLF Inc. | ||||||||
Series 1 | 4.75% | March 31, 2010 | Perpetual | 400 | ||||
Series 2 | 4.80% | September 30, 2010 | Perpetual | 325 | ||||
Series 3 | 4.45% | March 31, 2011 | Perpetual | 250 | ||||
Series 4 | 4.45% | December 31, 2011 | Perpetual | 300 | ||||
Series 5 | 4.50% | March 31, 2012 | Perpetual | 250 | ||||
Series 6R(2) | 6.00% | June 30, 2014 | Perpetual | 250 | ||||
Series 8R(3) | 4.35% | June 30, 2015 | Perpetual | 280 | ||||
(1) The earliest date on which the Company has the option, but not the obligation, to call securities for redemption at their par value. (2) On June 30, 2014, and every five years thereafter, the annual dividend rate will reset to an annual rate equal to the 5-year Government of Canada bond yield plus 3.79%. Holders of the Series 6R Shares will have the right, at their option, to convert their Series 6R Shares into Class A Non-Cumulative Floating Rate Preferred Shares Series 7QR (Series 7QR Shares) on June 30, 2014 and every five years thereafter. Holders of Series 7QR Shares will be entitled to receive fixed non-cumulative quarterly dividends at an annual rate equal to the then 3-month Government of Canada treasury bill yield plus 3.79%. (3) On June 30, 2015, and every five years thereafter, the annual dividend rate will reset to an annual rate equal to the 5-year Government of Canada bond yield plus 1.41%. Holders of the Series 8R Shares will have the right, at their option, to convert their Series 8R Shares into Class A Non-Cumulative Floating Rate Preferred Shares Series 9QR (Series 9QR Shares) on June 30, 2015 and every five years thereafter. Holders of Series 9QR Shares will be entitled to receive fixed non-cumulative quarterly dividends at an annual rate equal to the then 3-month Government of Canada treasury bill yield plus 1.41%.
|
In addition to the above long-term debt, we have issued $2.2 billion of senior debentures and $1.4 billion of senior financings in connection with financing arrangements to address U.S. statutory reserve requirements for certain universal life contracts.
The following table shows the number of common shares and stock options outstanding of SLF Inc. for the last three years.
Number of Common Shares Outstanding
| (in millions) | 2010 | 2009 | 2008 | |||||||||
Balance, beginning of year | 564.4 | 559.7 | 564.1 | |||||||||
Stock options exercised | 9.9 | 4.7 | 0.4 | |||||||||
Shares repurchased | – | – | (4.8 | ) | ||||||||
Balance, end of year | 574.3 | 564.4 | 559.7 | |||||||||
| Number of Stock Options Outstanding | ||||||||||||
| (in millions) | 2010 | 2009 | 2008 | |||||||||
Balance, beginning of year | 13.2 | 10.0 | 8.2 | |||||||||
Options issued | 2.8 | 4.3 | 2.3 | |||||||||
Options exercised or cancelled | (1.8 | ) | (1.1 | ) | (0.5 | ) | ||||||
Balance, end of year | 14.2 | 13.2 | 10.0 | |||||||||
In 2010, we did not repurchase or cancel any of our common shares.
The Company grants stock options to certain employees and directors. These options are granted at the closing price of SLF Inc.’s common shares on the TSX on the grant date for stock options granted after January 1, 2007, and the closing price of the trading day preceding the grant date for stock options granted before January 1, 2007. As at February 10, 2011, 13.9 million options to acquire SLF Inc. common shares and 574.4 million common shares of SLF Inc. were outstanding.
| 70 | Sun Life Financial Inc. Annual Report 2010 Management’s Discussion and Analysis |
Shareholder Dividends
The declaration, amount and payment of dividends by SLF Inc. is subject to the approval of our Board of Directors and is dependent on our results of operations, financial condition, cash requirements, regulatory and contractual restrictions and other factors considered by the Board of Directors. The Board of Directors reviews the level of dividends on a quarterly basis.
SLF Inc. maintained its quarterly common shareholders’ dividend at $0.36 per share throughout 2010. Total common shareholder dividends declared in 2010 were $1.44 per share, consistent with 2009 levels.
Dividends Declared in 2010
| Amount per share | ||||||||
Common shares | $ | 1.44 | ||||||
| Class A preferred shares | Coupon rate | Amount per share | ||||||
Series 1 | 4.75% | $ | 1.187500 | |||||
Series 2 | 4.80% | $ | 1.200000 | |||||
Series 3 | 4.45% | $ | 1.112500 | |||||
Series 4 | 4.45% | $ | 1.112500 | |||||
Series 5 | 4.50% | $ | 1.125000 | |||||
Series 6R | 6.00% | $ | 1.500000 | |||||
Series 8R | 4.35% | $ | 0.653200 | |||||
Under our Canadian Dividend Reinvestment and Share Purchase Plan (the “Plan”), Canadian-resident common and preferred shareholders may choose to have their dividends automatically reinvested in additional common shares and may also purchase common shares through the Plan. For dividend reinvestments, we may, at our option, issue common shares from treasury at a discount of up to 5% to the volume weighted average trading price or direct that common shares be purchased on behalf of participants through the TSX at the market price. Common shares acquired by participants through optional cash purchases may also be issued from treasury or purchased through the TSX at SLF Inc.’s option, in either case at no discount.
Capital Adequacy
SLF Inc. is subject to the guidelines regarding capital for regulated insurance holding companies and non-operating life insurance companies (collectively, Insurance Holding Companies) issued by OSFI. As an Insurance Holding Company, SLF Inc. is expected to manage its capital in a manner commensurate with its risk profile and control environment. For purposes of determining required capital under the capital risk metrics, the risk component factors for significant foreign life subsidiaries are not included in the Insurance Holding Company’s total capital required. OSFI may intervene and assume control of an Insurance Holding Company or a Canadian life insurance company if it deems the amount of available capital insufficient. Capital requirements may be adjusted by OSFI in the future, as experience develops or the risk profile of Canadian life insurers changes or to reflect other risks OSFI deems necessary. SLF Inc. was well above its minimum internal targets as at December 31, 2010.
Sun Life Assurance is subject to the MCCSR capital rules for a life insurance company in Canada. The Company generally expects to maintain an MCCSR ratio for Sun Life Assurance at or above 200%. From time to time, during adverse economic conditions and periods of high market volatility, Sun Life Assurance may maintain an MCCSR ratio in the range of 180% – 200%. With an MCCSR ratio of 228%, Sun Life Assurance exceeded minimum regulatory levels as at December 31, 2010. The MCCSR calculation involves using qualifying models or applying quantitative factors to specific assets and liabilities based on a number of risk components to arrive at required capital and comparing this requirement to available capital to assess capital adequacy. Certain of these risk components, along with available capital, are sensitive to changes in equity markets and interest rates as outlined in the Risk Management section of this document.
A key risk component is asset default risk, also referred to as C-1 risk, which covers losses resulting from asset defaults, loss of market value of equities, and related reductions in income. To compute the C-1 component, factors are applied to the balance sheet value of our assets (on-balance sheet) or exposure amount (off-balance sheet). The factors used to compute required capital are based on the nature of the asset in combination with its use or the rating assigned to the asset or obligor. The charts below summarize the split of the Sun Life Assurance’s C-1 risk by type of asset. In addition, a second chart splits the C-1 risk associated with the bond portfolio by rating. While over 70% of Sun Life Assurance’s bonds are rated A or higher, such bonds account for just over 20% of C-1 risk reflecting the relatively low factors attributed to bonds rated A or higher. Bonds rated A or higher also include the obligations of certain qualifying entities, including the Canadian government and other OECD countries, that are eligible for a 0% factor.
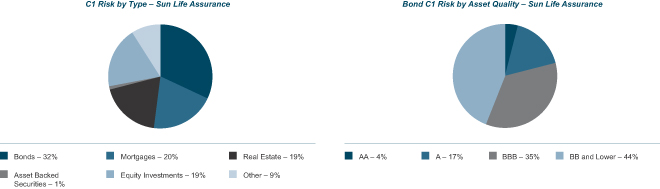
| Management’s Discussion and Analysis Sun Life Financial Inc. Annual Report 2010 | 71 |
The following table shows the components of Sun Life Assurance’s MCCSR ratio for the last three years.
Sun Life Assurance MCCSR
| ($ millions) | 2010 | 2009 | 2008 | |||||||||
Capital available | ||||||||||||
Retained earnings and contributed surplus | 10,079 | 9,733 | 10,117 | |||||||||
Other comprehensive income | (1,752 | ) | (1,510 | ) | (841 | ) | ||||||
Common and preferred shares | 2,996 | 2,596 | 1,996 | |||||||||
Innovative instruments and subordinated debt | 2,794 | 3,094 | 2,600 | |||||||||
Other | 247 | 269 | 219 | |||||||||
Less: | ||||||||||||
Goodwill and intangibles in excess of limit | 1,777 | 1,859 | 1,893 | |||||||||
Non-life investments and other | 1,696 | 1,660 | 1,585 | |||||||||
Total capital available | 10,891 | 10,663 | 10,613 | |||||||||
Required capital | ||||||||||||
Asset default and market risks | 2,967 | 2,699 | 2,620 | |||||||||
Insurance risks | 1,046 | 1,397 | 1,279 | |||||||||
Interest rate risks | 765 | 735 | 683 | |||||||||
Total capital required | 4,778 | 4,831 | 4,582 | |||||||||
MCCSR ratio | 228% | 221% | 232% | |||||||||
Sun Life Assurance’s MCCSR ratio increased from 221% as at December 31, 2009, to 228% as at December 31, 2010. The MCCSR ratio was favourably impacted by 14 points by the sale of the Company’s life reinsurance business and by 12 points from an external reinsurance agreement in SLF Canada’s Group Benefits operation. This was partially offset by a 6 point reduction from the redemption of $300 million 6.65% Debentures, Series 3, along with unfavourable impacts from 2010 MCCSR guideline changes, lower interest rates and business growth. Available capital remained relatively flat as increased earnings and the issuance of $280 million of preferred shares were substantively offset by the unfavourable impact of the strengthening of the Canadian dollar relative to foreign currencies, the redemption of $300 million subordinated debt and dividends paid to SLF Inc. Additional details concerning the calculation of available capital and MCCSR are included in SLF Inc.’s 2010 AIF under the heading Regulatory Matters.
Sun Life Financial adopted International Financial Reporting Standards as of January 1, 2011. The adoption of IFRS will impact the level of available regulatory capital. The net impact to retained earnings from conversion to IFRS is recognized in available capital. OSFI’s Advisory onConversion to International Financial Reporting Standards by Federally Regulated Entities allows companies to elect to phase-in the impact on adjusted net Tier 1 capital on a straight-line basis over eight quarters ending December 31, 2012. The impact of IFRS conversion on Sun Life Assurance’s MCCSR ratio, in the initial reporting period, is not expected to be material as we have elected the phase-in provision.
In December 2010, OSFI issued revised guidelines for segregated fund capital requirements for business written on or after January 1, 2011. The existing capital requirements will continue to apply to business written prior to January 1, 2011, until a new approach is developed. OSFI expects the review of the new approach to take several years, likely into 2013. It is premature to draw conclusions about the impact this process will have on capital requirements for Canadian life insurance companies.
Significant foreign life subsidiaries that are not subject to the MCCSR rules are required to comply with the capital adequacy requirements imposed in the foreign jurisdictions in which they operate. Our principal operating life insurance subsidiary in the United States, Sun Life (U.S.), is subject to the risk-based capital (“RBC”) rules issued by the National Association of Insurance Commissioners, which measures the ratio of the company’s total adjusted capital to the minimum capital required by the RBC formula. The RBC formula for life insurance companies’ measures exposures to investment risk, insurance risk, interest rate and other market risks and general business risk. A company’s RBC is normally expressed in terms of the company action level (“CAL”). If a life insurance company’s total adjusted capital is less than or equal to the CAL (100% of CAL or less), a comprehensive financial plan must be submitted to its state regulator. Sun Life (U.S.) has established an internal target range for its RBC ratio of 300% – 350% of the CAL.
The investment, interest rate and market risk components of Sun Life (U.S.)’s statutory and risk based capital are sensitive to equity and interest rate levels as well as the overall economic environment. Declining interest rates and unfavourable credit experience, coupled with changes in equity markets, will negatively impact its RBC ratio. The insurance and business risk components of Sun Life (U.S.)’s statutory and risk based capital are sensitive to policyholder experience. Unfavourable experience could also negatively impact the RBC ratio.
In addition, other foreign operations and foreign subsidiaries of SLF Inc. must comply with local capital or solvency requirements in the jurisdictions in which they operate. The Company maintained capital levels above the minimum local regulatory requirements as at December 31, 2010.
Financial Strength Ratings
Independent rating agencies assign credit ratings to securities issued by companies, as well as financial strength ratings. The credit ratings assigned to the securities issued by SLF Inc. and its subsidiaries are described in SLF Inc.’s 2010 AIF under the heading Security Ratings.
| 72 | Sun Life Financial Inc. Annual Report 2010 Management’s Discussion and Analysis |
The financial strength ratings assigned are intended to provide an independent view of the creditworthiness and financial strength of an organization. Each rating agency has developed its own methodology for the assessment and subsequent rating of life insurance companies. The following table summarizes the financial strength ratings/claims paying ability for the two main operating subsidiaries of SLF Inc. as at December 31, 2010.
| Standard & Poor’s | Moody’s | AM Best | DBRS | |||||||||||||
Sun Life Assurance Company of Canada | AA- | Aa3 | A+ | IC-1 | ||||||||||||
Sun Life Assurance Company of Canada (U.S.) | AA- | Aa3 | A+ | |||||||||||||
During 2010, Standard & Poor’s lowered its rating of Sun Life Assurance and Sun Life (U.S.) to AA- from AA. In doing so, Standard & Poor’s removed its negative outlook on these subsidiaries and replaced it with a stable outlook. All of the rating agencies listed in the table above have a stable outlook on the financial strength ratings of the operating companies above, with the exception of Moody’s which has a negative outlook on Sun Life (U.S.).
Off-Balance Sheet Arrangements
In the normal course of business, we are engaged in a variety of financial arrangements. The principal purposes of these arrangements are to:
| • | earn management fees and additional spread on a matched book of business |
| • | reduce financing costs |
While most of these activities are reflected on our balance sheet with respect to assets and liabilities, certain of them are either not recorded or are recorded on the balance sheet in amounts that differ from the full contract or notional amounts. The types of off-balance sheet activities we undertake primarily include:
| • | asset securitizations |
| • | securities lending |
Asset Securitizations
We engage in asset securitization activities primarily to earn origination or management fees by leveraging our investment expertise to source and manage assets for the investors. In the past, we have sold mortgage or bond assets to a non-consolidated SPE, which may also purchase investment assets from third parties. The SPE funds the asset purchase by selling securities to investors. As part of the SPE arrangement, we may subscribe to a subordinated investment interest in the issued securities.
($ millions) | 2010 | 2009 | ||||||
As at December 31 | ||||||||
Securitized assets under management | 1,252 | 1,882 | ||||||
The Company’s retained interest | 27 | 35 | ||||||
For the year ended December 31 | ||||||||
Cash flow received on retained interests and servicing fees | 8 | 11 | ||||||
We are generally retained to manage the assets in the SPE on a fee-for-service basis. All of the asset securitization transactions we undertake are structured on a non-recourse basis so that we have no exposure to the default risks associated with the assets in the SPEs other than through any of our retained interests. The table summarizes our asset securitization program.
Securities Lending
We lend securities in our investment portfolio to other institutions for short periods to generate additional fee income. We conduct our program only with well-established, reputable banking institutions that carry a minimum credit rating of “AA”. We monitor the fair value of the loaned securities on a daily basis with additional collateral obtained or refunded as the fair value fluctuates. It is our practice to obtain a guarantee from the lending agent against counterparty default, including non-cash collateral deficiency, in securities lending transactions. Additional information on securities lending is available in Note 5 to our 2010 Consolidated Financial Statements.
Commitments, Guarantees, Contingencies and Reinsurance Matters
In the normal course of business, we enter into leasing agreements, outsourcing arrangements and agreements involving indemnities to third parties. We are also engaged in arbitration proceedings in the U.S. and U.K. with certain companies that have contracts to provide reinsurance to the Company. Details regarding our commitments, guarantees and contingencies are summarized in Notes 6 and 21 to our 2010 Consolidated Financial Statements. A table summarizing our financial liabilities and contractual obligations can be found in the Risk Management section of this document under the heading Operational Risk.
| Management’s Discussion and Analysis Sun Life Financial Inc. Annual Report 2010 | 73 |
Legal and Regulatory Proceedings
SLF Inc. and its subsidiaries are regularly involved in legal actions, both as a defendant and as a plaintiff. In addition, government and regulatory bodies in Canada, the United States, the United Kingdom and Asia, including federal, provincial and state, securities and insurance regulators in Canada, the United States and other jurisdictions, the SEC, the United States Financial Industry Regulatory Authority and state attorney generals in the United States, from time to time, make inquiries and require the production of information or conduct examinations or investigations concerning compliance by SLF Inc. and its subsidiaries with insurance, securities and other laws. Management does not believe that the conclusion of any current legal or regulatory matters, either individually or in the aggregate, will have a material adverse effect on the Company’s financial condition or results of operations.
| 74 | Sun Life Financial Inc. Annual Report 2010 Management’s Discussion and Analysis |