UNITED STATES
SECURITIES AND EXCHANGE COMMISSION
FORM N-CSR
CERTIFIED SHAREHOLDER REPORT OF REGISTERED MANAGEMENT INVESTMENT COMPANIES
Investment Company Act file number811-09645
Columbia Funds Series Trust
(Exact name of registrant as specified in charter)
290 Congress Street
Boston, MA 02210
(Address of principal executive offices) (Zip code)
Daniel J. Beckman
c/o Columbia Management Investment Advisers, LLC
290 Congress Street
Boston, MA 02210
Ryan C. Larrenaga, Esq.
c/o Columbia Management Investment Advisers, LLC
290 Congress Street
Boston, MA 02210
(Name and address of agent for service)
Registrant's telephone number, including area code: (800) 345-6611
Date of fiscal year end: February 28
Date of reporting period: February 28, 2022
Form N-CSR is to be used by management investment companies to file reports with the Commission not later than 10 days after the transmission to stockholders of any report that is required to be transmitted to stockholders under Rule 30e-1 under the Investment Company Act of 1940 (17 CFR 270.30e-1). The Commission may use the information provided on Form N-CSR in its regulatory, disclosure review, inspection, and policymaking roles.
A registrant is required to disclose the information specified by Form N-CSR, and the Commission will make this information public. A registrant is not required to respond to the collection of information contained in Form N-CSR unless the Form displays a currently valid Office of Management and Budget ("OMB") control number. Please direct comments concerning the accuracy of the information collection burden estimate and any suggestions for reducing the burden to Secretary, Securities and Exchange Commission, 100 F Street, NE, Washington, DC 20549. The OMB has reviewed this collection of information under the clearance requirements of 44 U.S.C. § 3507.
Item 1. Reports to Stockholders.

Annual Report
February 28, 2022
Columbia Convertible Securities Fund
Not Federally Insured • No Financial Institution Guarantee • May Lose Value
If you elect to receive the shareholder report for Columbia Convertible Securities Fund (the Fund) in paper, mailed to you, the Fund mails one shareholder report to each shareholder address, unless such shareholder elects to receive shareholder reports from the Fund electronically via e-mail or by having a paper notice mailed to you (Postcard Notice) that your Fund’s shareholder report is available at the Columbia funds’ website (columbiathreadneedleus.com/investor/). If you would like more than one report in paper to be mailed to you, or would like to elect to receive reports via e-mail or access them through Postcard Notice, please call shareholder services at 800.345.6611 and additional reports will be sent to you.
Proxy voting policies and procedures
The policy of the Board of Trustees is to vote the proxies of the companies in which the Fund holds investments consistent with the procedures as stated in the Statement of Additional Information (SAI). You may obtain a copy of the SAI without charge by calling 800.345.6611; contacting your financial intermediary; visiting columbiathreadneedleus.com/investor/; or searching the website of the Securities and Exchange Commission (SEC) at sec.gov. Information regarding how the Fund voted proxies relating to portfolio securities is filed with the SEC by August 31st for the most recent 12-month period ending June 30th of that year, and is available without charge by visiting columbiathreadneedleus.com/investor/, or searching the website of the SEC at sec.gov.
Quarterly schedule of investments
The Fund files a complete schedule of portfolio holdings with the SEC for the first and third quarters of each fiscal year on Form N-PORT. The Fund’s Form N-PORT filings are available on the SEC’s website at sec.gov. The Fund’s complete schedule of portfolio holdings, as filed on Form N-PORT, can also be obtained without charge, upon request, by calling 800.345.6611.
Additional Fund information
For more information about the Fund, please visit columbiathreadneedleus.com/investor/ or call 800.345.6611. Customer Service Representatives are available to answer your questions Monday through Friday from 8 a.m. to 7 p.m. Eastern time.
Fund investment manager
Columbia Management Investment Advisers, LLC (the Investment Manager)
290 Congress Street
Boston, MA 02210
Fund distributor
Columbia Management Investment Distributors, Inc.
290 Congress Street
Boston, MA 02210
Fund transfer agent
Columbia Management Investment Services Corp.
P.O. Box 219104
Kansas City, MO 64121-9104
Columbia Convertible Securities Fund | Annual Report 2022
Investment objective
The Fund seeks total return, consisting of capital appreciation and current income.
Portfolio management
David King, CFA
Co-Portfolio Manager
Managed Fund since 2010
Yan Jin
Co-Portfolio Manager
Managed Fund since 2006
Grace Lee, CAIA
Co-Portfolio Manager
Managed Fund since October 2020
| Average annual total returns (%) (for the period ended February 28, 2022) |
| | | Inception | 1 Year | 5 Years | 10 Years |
| Class A | Excluding sales charges | 09/25/87 | -9.04 | 14.49 | 11.73 |
| | Including sales charges | | -14.26 | 13.14 | 11.07 |
| Advisor Class* | 11/08/12 | -8.82 | 14.77 | 12.00 |
| Class C | Excluding sales charges | 10/21/96 | -9.76 | 13.63 | 10.89 |
| | Including sales charges | | -10.50 | 13.63 | 10.89 |
| Institutional Class | 05/21/99 | -8.84 | 14.77 | 12.01 |
| Institutional 2 Class* | 11/08/12 | -8.77 | 14.85 | 12.09 |
| Institutional 3 Class* | 10/01/14 | -8.74 | 14.90 | 12.04 |
| Class R | 11/16/11 | -9.32 | 14.20 | 11.44 |
| ICE BofA All Convertibles All Qualities Index | | -6.41 | 14.27 | 12.14 |
Returns for Class A shares are shown with and without the maximum initial sales charge of 5.75%. Returns for Class C shares are shown with and without the 1.00% contingent deferred sales charge for the first year only. The Fund’s other share classes are not subject to sales charges and have limited eligibility. Please see the Fund’s prospectus for details. Performance for different share classes will vary based on differences in sales charges and fees associated with each share class. All results shown assume reinvestment of distributions during the period. Returns do not reflect the deduction of taxes that a shareholder may pay on Fund distributions or on the redemption of Fund shares. Performance results reflect the effect of any fee waivers or reimbursements of Fund expenses by Columbia Management Investment Advisers, LLC and/or any of its affiliates. Absent these fee waivers or expense reimbursement arrangements, performance results would have been lower.
The performance information shown represents past performance and is not a guarantee of future results. The investment return and principal value of your investment will fluctuate so that your shares, when redeemed, may be worth more or less than their original cost. Current performance may be lower or higher than the performance information shown. You may obtain performance information current to the most recent month-end by contacting your financial intermediary, visiting columbiathreadneedleus.com/investor/ or calling 800.345.6611.
| * | The returns shown for periods prior to the share class inception date (including returns for the Life of the Fund, if shown, which are since Fund inception) include the returns of the Fund’s oldest share class. These returns are adjusted to reflect any higher class-related operating expenses of the newer share classes, as applicable. Please visit columbiathreadneedleus.com/investor/investment-products/mutual-funds/appended-performance for more information. |
The ICE BofA All Convertibles All Qualities Index measures the performance of U.S. dollar-denominated convertible securities not currently in bankruptcy with a total market value greater than $50 million at issuance.
Indices are not available for investment, are not professionally managed and do not reflect sales charges, fees, brokerage commissions, taxes or other expenses of investing. Securities in the Fund may not match those in an index.
Fund performance may be significantly negatively impacted by the economic impact of the COVID-19 pandemic. The COVID-19 pandemic has adversely impacted economies and capital markets around the world in ways that will likely continue and may change in unforeseen ways for an indeterminate period. The COVID-19 pandemic may exacerbate pre-existing political, social and economic risks in certain countries and globally.
Columbia Convertible Securities Fund | Annual Report 2022
| 3 |
Fund at a Glance (continued)
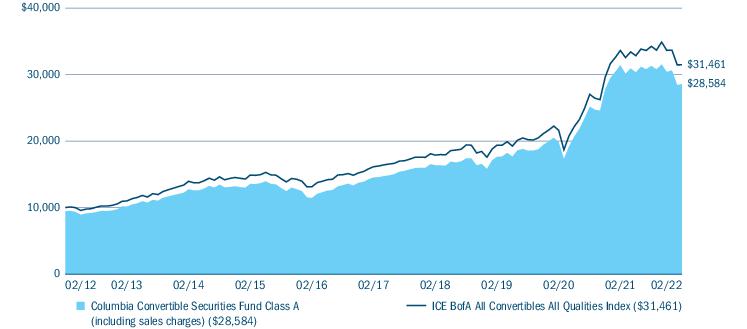
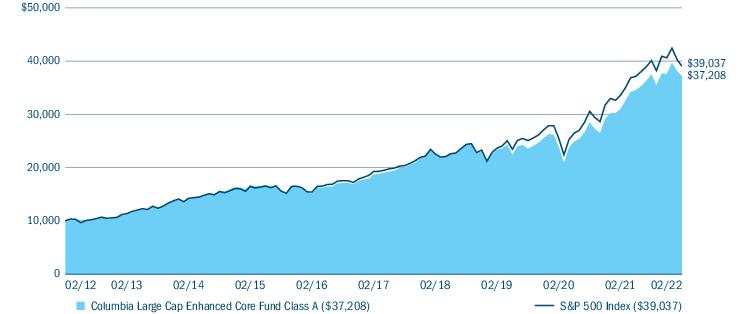
Performance of a hypothetical $10,000 investment (February 29, 2012 — February 28, 2022)
The chart above shows the change in value of a hypothetical $10,000 investment in Class A shares of Columbia Convertible Securities Fund during the stated time period, and does not reflect the deduction of taxes that a shareholder may pay on Fund distributions or on the redemption of Fund shares.
| Portfolio breakdown (%) (at February 28, 2022) |
| Common Stocks | 5.9 |
| Convertible Bonds | 76.3 |
| Convertible Preferred Stocks | 17.8 |
| Money Market Funds | 0.0(a) |
| Warrants | 0.0(a) |
| Total | 100.0 |
Percentages indicated are based upon total investments excluding investments in derivatives, if any. The Fund’s portfolio composition is subject to change.
| Equity sector breakdown (%) (at February 28, 2022) |
| Communication Services | 4.9 |
| Consumer Discretionary | 7.4 |
| Consumer Staples | 3.9 |
| Energy | 5.6 |
| Financials | 3.6 |
| Health Care | 26.0 |
| Industrials | 6.4 |
| Information Technology | 20.1 |
| Utilities | 22.1 |
| Total | 100.0 |
Percentages indicated are based upon total equity investments. The Fund’s portfolio composition is subject to change.
| 4 | Columbia Convertible Securities Fund | Annual Report 2022 |
Manager Discussion of Fund Performance
For the 12-month period that ended February 28, 2022, Class A shares of Columbia Convertible Securities Fund returned -9.04% excluding sales charges. The Fund underperformed its benchmark, the ICE BofA All Convertibles All Qualities Index, which returned -6.41% for the same time period.
Market overview
U.S. equities posted gains through much of the 12-month period that ended February 28, 2022. As pandemic-related restrictions were eased, robust economic growth and corporate earnings drove gains for stocks. Both U.S. monetary and fiscal policy were highly supportive, as Congress approved massive spending packages that included direct payments to citizens and the U.S. Federal Reserve (Fed) maintained its benchmark overnight lending rate near zero while engaging in bond market purchases to keep longer term borrowing costs low. The fourth quarter of 2021 saw the Fed adopt a more hawkish tone in response to persistently high inflation, driven in large part by supply chain constraints and rising commodity prices, which led to increased market volatility. The first two months of 2022 brought a rocky start, with most major indices returning in negative territory as markets grappled with individual stock volatility, the number and timing of interest rate hikes by the Fed, inflation and geopolitical tensions. Of most significance, tensions between Russia and Ukraine near the end of the period, and the subsequent invasion of Ukraine by Russia on February 24, 2022, roiled global markets and drove significant sell-offs.
The convertible market grew more challenged in the latter half of the period, hurt by COVID-19 Omicron variant-driven weakness in late 2021 in travel-related issuers, such as cruise ships and airlines. The universe of convertible issuers tends to be tilted more toward faster-growing companies due to its high weighting in technology and healthcare companies. Companies in these areas raised capital in early 2020 in response to pressures from COVID-19, increasing their representation in the index. The growth style, after having outperformed for much of 2021, began to lag in the fourth quarter of 2021 amid increasing odds that the U.S. Federal Reserve would begin to raise interest rates in the year ahead. The underperformance of growth versus value continued through the first two months of 2022.
The Fund’s notable detractors during the period
| • | Within convertible securities, the consumer discretionary, information technology, communication services, health care and real estate sectors detracted overall from Fund performance during the period. |
| • | Online real estate company Zillow Group, Inc. was the Fund’s top individual detractor during the period. |
| • | E-commerce retailer Wayfair, Inc. and education technology company Chegg, within the consumer discretionary sector, detracted from Fund performance during the period. The Fund’s position in Chegg was eliminated. |
| • | Within the communication services sector, camera and social media company Snap, Inc., communications platform-as-a-service company Bandwidth, Inc. and internet media and services company Match Group FinanceCo 3, Inc. were among the Fund’s top detractors. |
| • | Coupa Software, Inc., which provides a cloud-based platform for business spend management, and digital payments company Block, Inc. (formerly Square), within the information technology sector, delivered disappointing results for the Fund. |
| • | Health care company Teladoc Health, Inc., a telemedicine and virtual healthcare company, was also a leading detractor. We sold the position in Teledoc. |
The Fund’s notable contributors during the period
| • | Within the Fund’s convertible securities allocations, the materials, utilities and financials sectors contributed to results. |
| • | Within these sectors, metals and mining companies Ivanhoe Mines Ltd. and Allegheny Technologies Inc., utility companies DTE Energy Co. and American Electric Power Co., Inc., and a private equity and real estate investment firm KKR & Co., Inc. delivered gains for the Fund. |
| • | Cybersecurity firm Palo Alto Networks, within the information technology sector, was the Fund’s largest individual contributor to results during the period. Other names within the sector that aided Fund performance included Datadog, Inc., Atlassian, Inc. and Bill.com Holdings, Inc. |
Columbia Convertible Securities Fund | Annual Report 2022
| 5 |
Manager Discussion of Fund Performance (continued)
| • | Several of the Fund’s health care convertibles that benefited Fund performance during the period included healthcare products and services companies Danaher Corp. and Avantor, Inc., medical devices company Dexcom, Inc. and pharmaceutical company Kadmon Holdings, Inc. |
| • | Live Nation Entertainment, Inc., a global entertainment company that promotes, operates, and manages ticket sales for live entertainment within the communication services sector, also contributed to results during the period. |
| • | Equity holdings within the information technology and energy sectors contributed to Fund results during the period, most notably semiconductor company Broadcom, Inc. and oil and gas provider Pioneer Natural Resources Co. |
Market risk may affect a single issuer, sector of the economy, industry or the market as a whole. Convertible securities are subject to issuer default risk. A rise in interest rates may result in a price decline of fixed-income instruments held by the Fund, negatively impacting its performance and NAV. Falling rates may result in the Fund investing in lower yielding debt instruments, lowering the Fund’s income and yield. These risks may be heightened for longer maturity and duration securities. The Fund may also be forced to convert a convertible security at an inopportune time, which may decrease the Fund’s return. Non-investment-grade (high-yield or junk) securities present greater price volatility and more risk to principal and income than higher rated securities. Foreign investments subject the Fund to risks, including political, economic, market, social and others within a particular country, as well as to currency instabilities and less stringent financial and accounting standards generally applicable to U.S. issuers. Short positions (where the underlying asset is not owned) can create unlimited risk. Market or other (e.g., interest rate) environments may adversely affect the liquidity of Fund investments, negatively impacting their price. Generally, the less liquid the market at the time the Fund sells a holding, the greater the risk of loss or decline of value to the Fund.
The views expressed in this report reflect the current views of the respective parties who have contributed to this report. These views are not guarantees of future performance and involve certain risks, uncertainties and assumptions that are difficult to predict, so actual outcomes and results may differ significantly from the views expressed. These views are subject to change at any time based upon economic, market or other conditions and the respective parties disclaim any responsibility to update such views. These views may not be relied on as investment advice and, because investment decisions for a Columbia fund are based on numerous factors, may not be relied on as an indication of trading intent on behalf of any particular Columbia fund. References to specific securities should not be construed as a recommendation or investment advice.
| 6 | Columbia Convertible Securities Fund | Annual Report 2022 |
Understanding Your Fund’s Expenses
(Unaudited)
As an investor, you incur two types of costs. There are shareholder transaction costs, which generally include sales charges on purchases and may include redemption fees. There are also ongoing fund costs, which generally include management fees, distribution and/or service fees, and other fund expenses. The following information is intended to help you understand your ongoing costs (in dollars) of investing in the Fund and to help you compare these costs with the ongoing costs of investing in other mutual funds.
Analyzing your Fund’s expenses
To illustrate these ongoing costs, we have provided examples and calculated the expenses paid by investors in each share class of the Fund during the period. The actual and hypothetical information in the table is based on an initial investment of $1,000 at the beginning of the period indicated and held for the entire period. Expense information is calculated two ways and each method provides you with different information. The amount listed in the “Actual” column is calculated using the Fund’s actual operating expenses and total return for the period. You may use the Actual information, together with the amount invested, to estimate the expenses that you paid over the period. Simply divide your account value by $1,000 (for example, an $8,600 account value divided by $1,000 = 8.6), then multiply the results by the expenses paid during the period under the “Actual” column. The amount listed in the “Hypothetical” column assumes a 5% annual rate of return before expenses (which is not the Fund’s actual return) and then applies the Fund’s actual expense ratio for the period to the hypothetical return. You should not use the hypothetical account values and expenses to estimate either your actual account balance at the end of the period or the expenses you paid during the period. See “Compare with other funds” below for details on how to use the hypothetical data.
Compare with other funds
Since all mutual funds are required to include the same hypothetical calculations about expenses in shareholder reports, you can use this information to compare the ongoing cost of investing in the Fund with other funds. To do so, compare the hypothetical example with the 5% hypothetical examples that appear in the shareholder reports of other funds. As you compare hypothetical examples of other funds, it is important to note that hypothetical examples are meant to highlight the ongoing costs of investing in a fund only and do not reflect any transaction costs, such as sales charges, or redemption or exchange fees. Therefore, the hypothetical calculations are useful in comparing ongoing costs only, and will not help you determine the relative total costs of owning different funds. If transaction costs were included in these calculations, your costs would be higher.
| September 1, 2021 — February 28, 2022 |
| | Account value at the
beginning of the
period ($) | Account value at the
end of the
period ($) | Expenses paid during
the period ($) | Fund’s annualized
expense ratio (%) |
| | Actual | Hypothetical | Actual | Hypothetical | Actual | Hypothetical | Actual |
| Class A | 1,000.00 | 1,000.00 | 913.00 | 1,019.34 | 5.22 | 5.51 | 1.10 |
| Advisor Class | 1,000.00 | 1,000.00 | 914.30 | 1,020.58 | 4.03 | 4.26 | 0.85 |
| Class C | 1,000.00 | 1,000.00 | 909.20 | 1,015.62 | 8.76 | 9.25 | 1.85 |
| Institutional Class | 1,000.00 | 1,000.00 | 914.00 | 1,020.58 | 4.03 | 4.26 | 0.85 |
| Institutional 2 Class | 1,000.00 | 1,000.00 | 914.50 | 1,020.88 | 3.75 | 3.96 | 0.79 |
| Institutional 3 Class | 1,000.00 | 1,000.00 | 914.50 | 1,021.08 | 3.56 | 3.76 | 0.75 |
| Class R | 1,000.00 | 1,000.00 | 911.60 | 1,018.10 | 6.40 | 6.76 | 1.35 |
Expenses paid during the period are equal to the annualized expense ratio for each class as indicated above, multiplied by the average account value over the period and then multiplied by the number of days in the Fund’s most recent fiscal half year and divided by 365.
Expenses do not include fees and expenses incurred indirectly by the Fund from its investment in underlying funds, including affiliated and non-affiliated pooled investment vehicles, such as mutual funds and exchange-traded funds.
Had Columbia Management Investment Advisers, LLC and/or certain of its affiliates not waived/reimbursed certain fees and expenses, account value at the end of the period would have been reduced.
Columbia Convertible Securities Fund | Annual Report 2022
| 7 |
Portfolio of Investments
February 28, 2022
(Percentages represent value of investments compared to net assets)
Investments in securities
| Common Stocks 5.9% |
| Issuer | Shares | Value ($) |
| Consumer Discretionary 0.5% |
| Automobiles 0.5% |
| Tesla Motors, Inc.(a) | 11,850 | 10,314,596 |
| Total Consumer Discretionary | 10,314,596 |
| Energy 1.3% |
| Oil, Gas & Consumable Fuels 1.3% |
| Ascent Resources, Class B(a),(b),(c),(d) | 10,248,729 | 2,295,715 |
| Chesapeake Energy Corp. | 5,104 | 394,314 |
| Pioneer Natural Resources Co. | 100,000 | 23,960,000 |
| Total | | 26,650,029 |
| Total Energy | 26,650,029 |
| Health Care 0.8% |
| Health Care Providers & Services 0.8% |
| Anthem, Inc. | 35,000 | 15,814,750 |
| Total Health Care | 15,814,750 |
| Information Technology 3.3% |
| Semiconductors & Semiconductor Equipment 3.3% |
| Broadcom, Inc. | 92,500 | 54,338,200 |
| Microchip Technology, Inc. | 180,000 | 12,659,400 |
| Total | | 66,997,600 |
| Total Information Technology | 66,997,600 |
Total Common Stocks
(Cost $74,755,334) | 119,776,975 |
| Convertible Bonds(e) 76.2% |
| Issuer | Coupon
Rate | | Principal
Amount ($) | Value ($) |
| Airlines 1.8% |
| American Airlines Group, Inc. |
| 07/01/2025 | 6.500% | | 11,850,000 | 15,932,325 |
| Southwest Airlines Co. |
| 05/01/2025 | 1.250% | | 15,470,000 | 20,675,655 |
| Total | 36,607,980 |
| Automotive 1.3% |
| Arrival SA(f) |
| 12/01/2026 | 3.500% | | 14,800,000 | 9,223,649 |
| Ford Motor Co.(f),(g) |
| 03/15/2026 | 0.000% | | 13,800,000 | 16,839,925 |
| Total | 26,063,574 |
| Convertible Bonds(e) (continued) |
| Issuer | Coupon
Rate | | Principal
Amount ($) | Value ($) |
| Building Materials 0.6% |
| Patrick Industries, Inc.(f) |
| 12/01/2028 | 1.750% | | 12,850,000 | 12,472,531 |
| Cable and Satellite 3.6% |
| Cable One, Inc.(f) |
| 03/15/2028 | 1.125% | | 12,000,000 | 10,722,000 |
| DISH Network Corp.(g) |
| 12/15/2025 | 0.000% | | 20,000,000 | 19,562,000 |
| DISH Network Corp. |
| Subordinated |
| 08/15/2026 | 3.375% | | 21,000,000 | 19,047,000 |
| Liberty Broadband Corp.(f) |
| 09/30/2050 | 2.750% | | 23,700,000 | 23,812,835 |
| Total | 73,143,835 |
| Consumer Cyclical Services 6.2% |
| Airbnb, Inc.(f),(g) |
| 03/15/2026 | 0.000% | | 25,950,000 | 24,365,608 |
| Alarm.com Holdings, Inc.(g) |
| 01/15/2026 | 0.000% | | 15,000,000 | 12,622,500 |
| Etsy, Inc.(f) |
| 06/15/2028 | 0.250% | | 27,050,000 | 26,468,425 |
| Lyft, Inc. |
| 05/15/2025 | 1.500% | | 15,800,000 | 19,797,400 |
| Match Group FinanceCo 3, Inc.(f) |
| 01/15/2030 | 2.000% | | 15,000,000 | 23,055,000 |
| Zillow Group, Inc. |
| 05/15/2025 | 2.750% | | 16,780,000 | 20,345,750 |
| Total | 126,654,683 |
| Consumer Products 1.7% |
| Beauty Health Co. (The)(f) |
| 10/01/2026 | 1.250% | | 13,850,000 | 13,199,050 |
| Callaway Golf Co. |
| 05/01/2026 | 2.750% | | 7,000,000 | 11,060,000 |
| LCI Industries |
| 05/15/2026 | 1.125% | | 10,350,000 | 10,194,750 |
| Total | 34,453,800 |
| Diversified Manufacturing 2.4% |
| Array Technologies, Inc.(f) |
| 12/01/2028 | 1.000% | | 13,850,000 | 10,602,175 |
| Bloom Energy Corp. |
| 08/15/2025 | 2.500% | | 7,900,000 | 12,390,306 |
The accompanying Notes to Financial Statements are an integral part of this statement.
| 8 | Columbia Convertible Securities Fund | Annual Report 2022 |
Portfolio of Investments (continued)
February 28, 2022
| Convertible Bonds(e) (continued) |
| Issuer | Coupon
Rate | | Principal
Amount ($) | Value ($) |
| Enphase Energy, Inc.(f),(g) |
| 03/01/2028 | 0.000% | | 17,000,000 | 16,277,500 |
| Greenbrier Companies, Inc. (The)(f) |
| 04/15/2028 | 2.875% | | 9,518,000 | 10,211,420 |
| Total | 49,481,401 |
| Food and Beverage 1.3% |
| Chefs’ Warehouse, Inc. (The) |
| 12/01/2024 | 1.875% | | 11,000,000 | 11,598,125 |
| MGP Ingredients, Inc.(f) |
| 11/15/2041 | 1.875% | | 12,820,000 | 13,980,991 |
| Total | 25,579,116 |
| Health Care 5.8% |
| Accolade, Inc.(f) |
| 04/01/2026 | 0.500% | | 18,500,000 | 14,430,000 |
| CONMED Corp. |
| 02/01/2024 | 2.625% | | 7,000,000 | 11,910,500 |
| Dexcom, Inc. |
| 11/15/2025 | 0.250% | | 29,650,000 | 31,021,313 |
| Exact Sciences Corp. |
| 03/01/2028 | 0.375% | | 22,000,000 | 20,735,000 |
| Insulet Corp. |
| 09/01/2026 | 0.375% | | 10,850,000 | 14,419,650 |
| Invacare Corp. |
| 11/15/2024 | 5.000% | | 2,257,000 | 1,982,097 |
| NeoGenomics, Inc. |
| 05/01/2025 | 1.250% | | 10,850,000 | 10,558,406 |
| Tandem Diabetes Care, Inc.(f) |
| 05/01/2025 | 1.500% | | 10,850,000 | 13,383,475 |
| Total | 118,440,441 |
| Independent Energy 0.6% |
| EQT Corp. |
| 05/01/2026 | 1.750% | | 6,600,000 | 11,196,900 |
| Leisure 3.8% |
| Live Nation Entertainment, Inc. |
| 03/15/2023 | 2.500% | | 11,850,000 | 21,455,610 |
| NCL Corp Ltd. |
| 08/01/2025 | 5.375% | | 14,800,000 | 20,036,240 |
| NCL Corp Ltd.(f) |
| 02/15/2027 | 2.500% | | 10,850,000 | 10,047,100 |
| Royal Caribbean Cruises Ltd. |
| 06/15/2023 | 4.250% | | 20,630,000 | 26,433,219 |
| Total | 77,972,169 |
| Convertible Bonds(e) (continued) |
| Issuer | Coupon
Rate | | Principal
Amount ($) | Value ($) |
| Media and Entertainment 3.6% |
| Bilibili, Inc.(f) |
| 12/01/2026 | 0.500% | | 20,750,000 | 15,624,750 |
| fuboTV, Inc.(f) |
| 02/15/2026 | 3.250% | | 18,000,000 | 13,572,000 |
| Snap, Inc. |
| 08/01/2026 | 0.750% | | 7,150,000 | 13,595,725 |
| Snap, Inc.(f) |
| 03/01/2028 | 0.125% | | 14,800,000 | 15,155,200 |
| Zynga, Inc. |
| 06/01/2024 | 0.250% | | 12,800,000 | 15,552,000 |
| Total | 73,499,675 |
| Metals and Mining 2.6% |
| Allegheny Technologies, Inc. |
| 06/15/2025 | 3.500% | | 5,920,000 | 10,681,900 |
| Ivanhoe Mines Ltd.(f) |
| 04/15/2026 | 2.500% | | 10,530,000 | 15,879,240 |
| Lithium Americas Corp.(f) |
| 01/15/2027 | 1.750% | | 16,780,000 | 15,672,520 |
| Peabody Energy Corp.(f),(h) |
| 03/01/2028 | 3.250% | | 9,850,000 | 11,041,850 |
| Total | 53,275,510 |
| Other Financial Institutions 2.0% |
| MP Materials Corp.(f) |
| 04/01/2026 | 0.250% | | 12,820,000 | 15,871,160 |
| Opendoor Technologies, Inc.(f) |
| 08/15/2026 | 0.250% | | 17,750,000 | 13,543,250 |
| Virgin Galactic Holdings, Inc.(f) |
| 02/01/2027 | 2.500% | | 11,850,000 | 11,319,662 |
| Total | 40,734,072 |
| Other Industry 1.2% |
| KBR, Inc. |
| 11/01/2023 | 2.500% | | 6,500,000 | 12,837,500 |
| Stride, Inc. |
| 09/01/2027 | 1.125% | | 11,850,000 | 11,553,750 |
| Total | 24,391,250 |
| Other REIT 0.7% |
| Pebblebrook Hotel Trust |
| 12/15/2026 | 1.750% | | 13,000,000 | 14,410,500 |
| Pharmaceuticals 7.2% |
| Aerie Pharmaceuticals, Inc. |
| 10/01/2024 | 1.500% | | 14,000,000 | 12,189,633 |
The accompanying Notes to Financial Statements are an integral part of this statement.
Columbia Convertible Securities Fund | Annual Report 2022
| 9 |
Portfolio of Investments (continued)
February 28, 2022
| Convertible Bonds(e) (continued) |
| Issuer | Coupon
Rate | | Principal
Amount ($) | Value ($) |
| BridgeBio Pharma, Inc. |
| 02/01/2029 | 2.250% | | 20,700,000 | 9,863,550 |
| Canopy Growth Corp.(f) |
| 07/15/2023 | 4.250% | CAD | 13,000,000 | 9,293,836 |
| Clovis Oncology, Inc. |
| 05/01/2025 | 1.250% | | 21,000,000 | 14,490,418 |
| Esperion Therapeutics, Inc. |
| 11/15/2025 | 4.000% | | 15,900,000 | 7,979,813 |
| Guardant Health, Inc.(g) |
| 11/15/2027 | 0.000% | | 12,850,000 | 10,741,315 |
| Insmed, Inc. |
| 06/01/2028 | 0.750% | | 23,000,000 | 22,471,000 |
| Intercept Pharmaceuticals, Inc.(f) |
| 02/15/2026 | 3.500% | | 14,684,000 | 14,750,051 |
| Ionis Pharmaceuticals, Inc.(f),(g) |
| 04/01/2026 | 0.000% | | 15,800,000 | 14,182,080 |
| Jazz Investments I Ltd. |
| 06/15/2026 | 2.000% | | 17,000,000 | 19,624,375 |
| Radius Health, Inc. |
| 09/01/2024 | 3.000% | | 12,000,000 | 11,730,000 |
| Total | 147,316,071 |
| Retail REIT 0.6% |
| Kite Realty Group LP(f) |
| 04/01/2027 | 0.750% | | 12,500,000 | 13,062,500 |
| Retailers 2.6% |
| Burlington Stores, Inc. |
| 04/15/2025 | 2.250% | | 16,780,000 | 21,216,212 |
| Dick’s Sporting Goods, Inc. |
| 04/15/2025 | 3.250% | | 4,490,000 | 14,589,694 |
| Wayfair, Inc. |
| 08/15/2026 | 1.000% | | 14,000,000 | 17,185,000 |
| Total | 52,990,906 |
| Technology 26.1% |
| 2U, Inc. |
| 05/01/2025 | 2.250% | | 13,800,000 | 10,695,000 |
| 3D Systems Corp.(f),(g) |
| 11/15/2026 | 0.000% | | 12,850,000 | 10,994,781 |
| Akamai Technologies, Inc. |
| 09/01/2027 | 0.375% | | 22,700,000 | 24,905,632 |
| Avalara, Inc.(f) |
| 08/01/2026 | 0.250% | | 18,750,000 | 16,256,250 |
| Bandwidth, Inc. |
| 03/01/2026 | 0.250% | | 16,800,000 | 12,547,164 |
| Convertible Bonds(e) (continued) |
| Issuer | Coupon
Rate | | Principal
Amount ($) | Value ($) |
| Bentley Systems, Inc.(f) |
| 07/01/2027 | 0.375% | | 13,800,000 | 11,578,200 |
| BigCommerce Holdings, Inc.(f) |
| 10/01/2026 | 0.250% | | 19,750,000 | 15,602,500 |
| Bill.com Holdings, Inc.(g) |
| 12/01/2025 | 0.000% | | 10,550,000 | 17,423,325 |
| Bill.com Holdings, Inc.(f),(g) |
| 04/01/2027 | 0.000% | | 15,980,000 | 15,500,600 |
| Blackline, Inc.(f),(g) |
| 03/15/2026 | 0.000% | | 20,000,000 | 16,850,000 |
| Coupa Software, Inc. |
| 06/15/2025 | 0.125% | | 11,850,000 | 12,578,775 |
| Datadog, Inc. |
| 06/15/2025 | 0.125% | | 6,070,000 | 11,293,235 |
| Dropbox, Inc.(f),(g) |
| 03/01/2028 | 0.000% | | 23,500,000 | 22,134,650 |
| Everbridge, Inc. |
| 12/15/2024 | 0.125% | | 10,850,000 | 9,466,625 |
| IMAX Corp.(f) |
| 04/01/2026 | 0.500% | | 14,900,000 | 14,877,650 |
| Lumentum Holdings, Inc. |
| 12/15/2026 | 0.500% | | 18,950,000 | 22,479,524 |
| MACOM Technology Solutions Holdings, Inc.(f) |
| 03/15/2026 | 0.250% | | 19,864,000 | 20,360,600 |
| Marathon Digital Holdings, Inc.(f) |
| 12/01/2026 | 1.000% | | 17,780,000 | 12,081,510 |
| MongoDB, Inc. |
| 01/15/2026 | 0.250% | | 7,900,000 | 15,085,050 |
| Okta, Inc. |
| 06/15/2026 | 0.375% | | 29,000,000 | 30,848,750 |
| ON Semiconductor Corp.(f),(g) |
| 05/01/2027 | 0.000% | | 12,820,000 | 17,492,890 |
| Palo Alto Networks, Inc. |
| 06/01/2025 | 0.375% | | 30,000,000 | 60,645,000 |
| ServiceNow, Inc.(g) |
| 06/01/2022 | 0.000% | | 2,020,000 | 8,678,930 |
| Shift4 Payments, Inc.(f) |
| 08/01/2027 | 0.500% | | 28,650,000 | 24,031,620 |
| SMART Global Holdings, Inc. |
| 02/15/2026 | 2.250% | | 7,000,000 | 10,550,046 |
| Square, Inc. |
| 03/01/2025 | 0.125% | | 19,730,000 | 25,168,081 |
| Teradyne, Inc. |
| 12/15/2023 | 1.250% | | 2,500,000 | 9,318,973 |
| Tyler Technologies, Inc.(f) |
| 03/15/2026 | 0.250% | | 10,850,000 | 11,642,050 |
The accompanying Notes to Financial Statements are an integral part of this statement.
| 10 | Columbia Convertible Securities Fund | Annual Report 2022 |
Portfolio of Investments (continued)
February 28, 2022
| Convertible Bonds(e) (continued) |
| Issuer | Coupon
Rate | | Principal
Amount ($) | Value ($) |
| Wolfspeed, Inc.(f) |
| 02/15/2028 | 0.250% | | 9,350,000 | 10,057,094 |
| Zendesk, Inc. |
| 06/15/2025 | 0.625% | | 16,770,000 | 20,878,650 |
| Zscaler, Inc. |
| 07/01/2025 | 0.125% | | 7,400,000 | 12,598,500 |
| Total | 534,621,655 |
| Transportation Services 0.5% |
| CryoPort, Inc.(f) |
| 12/01/2026 | 0.750% | | 13,850,000 | 10,837,625 |
Total Convertible Bonds
(Cost $1,525,626,529) | 1,557,206,194 |
| Convertible Preferred Stocks 17.7% |
| Issuer | | Shares | Value ($) |
| Communication Services 1.2% |
| Diversified Telecommunication Services 1.2% |
| 2020 Cash Mandatory Exchangeable Trust(f) | 5.250% | 22,000 | 23,793,000 |
| Total Communication Services | 23,793,000 |
| Consumer Discretionary 1.2% |
| Auto Components 0.7% |
| Aptiv PLC | 5.500% | 100,850 | 14,695,862 |
| Internet & Direct Marketing Retail 0.5% |
| 2020 Mandatory Exchangeable Trust(f) | 6.500% | 9,850 | 10,896,070 |
| Total Consumer Discretionary | 25,591,932 |
| Consumer Staples 0.9% |
| Food Products 0.9% |
| Bunge Ltd. | 4.875% | 140,000 | 18,855,200 |
| Total Consumer Staples | 18,855,200 |
| Financials 0.8% |
| Capital Markets 0.8% |
| KKR & Co., Inc. | 6.000% | 230,000 | 17,491,500 |
| Total Financials | 17,491,500 |
| Health Care 5.4% |
| Health Care Equipment & Supplies 4.0% |
| Becton Dickinson and Co. | 6.000% | 375,000 | 20,122,500 |
| Boston Scientific Corp. | 5.500% | 150,000 | 17,323,500 |
| Danaher Corp. | 5.000% | 30,000 | 44,677,240 |
| Total | | | 82,123,240 |
| Convertible Preferred Stocks (continued) |
| Issuer | | Shares | Value ($) |
| Health Care Technology 0.7% |
| Change Healthcare, Inc. | 6.000% | 187,700 | 13,172,786 |
| Life Sciences Tools & Services 0.7% |
| Avantor, Inc. | 6.250% | 135,000 | 14,296,500 |
| Total Health Care | 109,592,526 |
| Industrials 1.5% |
| Construction & Engineering 0.5% |
| Fluor Corp. | 6.500% | 8,880 | 10,381,608 |
| Machinery 0.5% |
| Stanley Black & Decker, Inc. | 5.250% | 110,000 | 10,587,500 |
| Professional Services 0.5% |
| Clarivate PLC | 5.250% | 160,000 | 9,801,600 |
| Total Industrials | 30,770,708 |
| Information Technology 1.5% |
| Electronic Equipment, Instruments & Components 0.9% |
| II-VI, Inc. | 6.000% | 65,000 | 18,658,900 |
| IT Services 0.6% |
| Sabre Corp. | 6.500% | 80,300 | 11,223,531 |
| Total Information Technology | 29,882,431 |
| Utilities 5.2% |
| Electric Utilities 2.9% |
| American Electric Power Co., Inc. | 6.125% | 350,000 | 18,410,000 |
| NextEra Energy, Inc. | 6.219% | 810,000 | 40,581,000 |
| Total | | | 58,991,000 |
| Multi-Utilities 2.3% |
| DTE Energy Co. | 6.250% | 500,000 | 25,330,000 |
| NiSource, Inc. | 7.750% | 200,000 | 22,198,000 |
| Total | | | 47,528,000 |
| Total Utilities | 106,519,000 |
Total Convertible Preferred Stocks
(Cost $336,442,657) | 362,496,297 |
The accompanying Notes to Financial Statements are an integral part of this statement.
Columbia Convertible Securities Fund | Annual Report 2022
| 11 |
Portfolio of Investments (continued)
February 28, 2022
| Warrants 0.0% |
| Issuer | Shares | Value ($) |
| Energy 0.0% |
| Oil, Gas & Consumable Fuels 0.0% |
| Chesapeake Energy Corp.(a) | 9,631 | 418,932 |
| Total Energy | 418,932 |
Total Warrants
(Cost $132,383) | 418,932 |
|
| Money Market Funds 0.0% |
| | Shares | Value ($) |
| Columbia Short-Term Cash Fund, 0.168%(i),(j) | 666,024 | 665,824 |
Total Money Market Funds
(Cost $665,757) | 665,824 |
Total Investments in Securities
(Cost: $1,937,622,660) | 2,040,564,222 |
| Other Assets & Liabilities, Net | | 4,697,399 |
| Net Assets | 2,045,261,621 |
Notes to Portfolio of Investments
| (a) | Non-income producing investment. |
| (b) | Represents fair value as determined in good faith under procedures approved by the Board of Trustees. At February 28, 2022, the total value of these securities amounted to $2,295,715, which represents 0.11% of total net assets. |
| (c) | Denotes a restricted security, which is subject to legal or contractual restrictions on resale under federal securities laws. Disposal of a restricted investment may involve time-consuming negotiations and expenses, and prompt sale at an acceptable price may be difficult to achieve. Private placement securities are generally considered to be restricted, although certain of those securities may be traded between qualified institutional investors under the provisions of Section 4(a)(2) and Rule 144A. The Fund will not incur any registration costs upon such a trade. These securities are valued at fair value determined in good faith under consistently applied procedures established by the Fund’s Board of Trustees. At February 28, 2022, the total market value of these securities amounted to $2,295,715, which represents 0.11% of total net assets. Additional information on these securities is as follows: |
| Security | Acquisition
Dates | Shares | Cost ($) | Value ($) |
| Ascent Resources, Class B | 02/20/2014-11/15/2016 | 10,248,729 | 358,011 | 2,295,715 |
| (d) | Valuation based on significant unobservable inputs. |
| (e) | Principal amounts are denominated in United States Dollars unless otherwise noted. |
| (f) | Represents privately placed and other securities and instruments exempt from Securities and Exchange Commission registration (collectively, private placements), such as Section 4(a)(2) and Rule 144A eligible securities, which are often sold only to qualified institutional buyers. At February 28, 2022, the total value of these securities amounted to $693,046,873, which represents 33.89% of total net assets. |
| (g) | Zero coupon bond. |
| (h) | Represents a security purchased on a when-issued basis. |
| (i) | The rate shown is the seven-day current annualized yield at February 28, 2022. |
| (j) | As defined in the Investment Company Act of 1940, as amended, an affiliated company is one in which the Fund owns 5% or more of the company’s outstanding voting securities, or a company which is under common ownership or control with the Fund. The value of the holdings and transactions in these affiliated companies during the year ended February 28, 2022 are as follows: |
| Affiliated issuers | Beginning
of period($) | Purchases($) | Sales($) | Net change in
unrealized
appreciation
(depreciation)($) | End of
period($) | Realized gain
(loss)($) | Dividends($) | End of
period shares |
| Columbia Short-Term Cash Fund, 0.168% |
| | 37,266,947 | 838,873,646 | (875,474,826) | 57 | 665,824 | (1,902) | 16,863 | 666,024 |
The accompanying Notes to Financial Statements are an integral part of this statement.
| 12 | Columbia Convertible Securities Fund | Annual Report 2022 |
Portfolio of Investments (continued)
February 28, 2022
Currency Legend
Fair value measurements
The Fund categorizes its fair value measurements according to a three-level hierarchy that maximizes the use of observable inputs and minimizes the use of unobservable inputs by prioritizing that the most observable input be used when available. Observable inputs are those that market participants would use in pricing an investment based on market data obtained from sources independent of the reporting entity. Unobservable inputs are those that reflect the Fund’s assumptions about the information market participants would use in pricing an investment. An investment’s level within the fair value hierarchy is based on the lowest level of any input that is deemed significant to the asset’s or liability’s fair value measurement. The input levels are not necessarily an indication of the risk or liquidity associated with investments at that level. For example, certain U.S. government securities are generally high quality and liquid, however, they are reflected as Level 2 because the inputs used to determine fair value may not always be quoted prices in an active market.
Fair value inputs are summarized in the three broad levels listed below:
| ■ | Level 1 — Valuations based on quoted prices for investments in active markets that the Fund has the ability to access at the measurement date. Valuation adjustments are not applied to Level 1 investments. |
| ■ | Level 2 — Valuations based on other significant observable inputs (including quoted prices for similar securities, interest rates, prepayment speeds, credit risks, etc.). |
| ■ | Level 3 — Valuations based on significant unobservable inputs (including the Fund’s own assumptions and judgment in determining the fair value of investments). |
Inputs that are used in determining fair value of an investment may include price information, credit data, volatility statistics, and other factors. These inputs can be either observable or unobservable. The availability of observable inputs can vary between investments, and is affected by various factors such as the type of investment, and the volume and level of activity for that investment or similar investments in the marketplace. The inputs will be considered by the Investment Manager, along with any other relevant factors in the calculation of an investment’s fair value. The Fund uses prices and inputs that are current as of the measurement date, which may include periods of market dislocations. During these periods, the availability of prices and inputs may be reduced for many investments. This condition could cause an investment to be reclassified between the various levels within the hierarchy.
Investments falling into the Level 3 category are primarily supported by quoted prices from brokers and dealers participating in the market for those investments. However, these may be classified as Level 3 investments due to lack of market transparency and corroboration to support these quoted prices. Additionally, valuation models may be used as the pricing source for any remaining investments classified as Level 3. These models may rely on one or more significant unobservable inputs and/or significant assumptions by the Investment Manager. Inputs used in valuations may include, but are not limited to, financial statement analysis, capital account balances, discount rates and estimated cash flows, and comparable company data.
Under the direction of the Fund’s Board of Trustees (the Board), the Investment Manager’s Valuation Committee (the Committee) is responsible for overseeing the valuation procedures approved by the Board. The Committee consists of voting and non-voting members from various groups within the Investment Manager’s organization, including operations and accounting, trading and investments, compliance, risk management and legal.
The Committee meets at least monthly to review and approve valuation matters, which may include a description of specific valuation determinations, data regarding pricing information received from approved pricing vendors and brokers and the results of Board-approved valuation control policies and procedures (the Policies). The Policies address, among other things, instances when market quotations are or are not readily available, including recommendations of third party pricing vendors and a determination of appropriate pricing methodologies; events that require specific valuation determinations and assessment of fair value techniques; securities with a potential for stale pricing, including those that are illiquid, restricted, or in default; and the effectiveness of third party pricing vendors, including periodic reviews of vendors. The Committee meets more frequently, as needed, to discuss additional valuation matters, which may include the need to review back-testing results, review time-sensitive information or approve related valuation actions. The Committee reports to the Board, with members of the Committee meeting with the Board at each of its regularly scheduled meetings to discuss valuation matters and actions during the period, similar to those described earlier.
The following table is a summary of the inputs used to value the Fund’s investments at February 28, 2022:
| | Level 1 ($) | Level 2 ($) | Level 3 ($) | Total ($) |
| Investments in Securities | | | | |
| Common Stocks | | | | |
| Consumer Discretionary | 10,314,596 | — | — | 10,314,596 |
| Energy | 24,354,314 | — | 2,295,715 | 26,650,029 |
| Health Care | 15,814,750 | — | — | 15,814,750 |
| Information Technology | 66,997,600 | — | — | 66,997,600 |
| Total Common Stocks | 117,481,260 | — | 2,295,715 | 119,776,975 |
| Convertible Bonds | — | 1,557,206,194 | — | 1,557,206,194 |
| Convertible Preferred Stocks | | | | |
| Communication Services | — | 23,793,000 | — | 23,793,000 |
| Consumer Discretionary | — | 25,591,932 | — | 25,591,932 |
| Consumer Staples | — | 18,855,200 | — | 18,855,200 |
| Financials | — | 17,491,500 | — | 17,491,500 |
| Health Care | — | 109,592,526 | — | 109,592,526 |
| Industrials | — | 30,770,708 | — | 30,770,708 |
| Information Technology | — | 29,882,431 | — | 29,882,431 |
| Utilities | — | 106,519,000 | — | 106,519,000 |
| Total Convertible Preferred Stocks | — | 362,496,297 | — | 362,496,297 |
The accompanying Notes to Financial Statements are an integral part of this statement.
Columbia Convertible Securities Fund | Annual Report 2022
| 13 |
Portfolio of Investments (continued)
February 28, 2022
Fair value measurements (continued)
| | Level 1 ($) | Level 2 ($) | Level 3 ($) | Total ($) |
| Warrants | | | | |
| Energy | 418,932 | — | — | 418,932 |
| Total Warrants | 418,932 | — | — | 418,932 |
| Money Market Funds | 665,824 | — | — | 665,824 |
| Total Investments in Securities | 118,566,016 | 1,919,702,491 | 2,295,715 | 2,040,564,222 |
See the Portfolio of Investments for all investment classifications not indicated in the table.
The Fund’s assets assigned to the Level 2 input category are generally valued using the market approach, in which a security’s value is determined through reference to prices and information from market transactions for similar or identical assets.
The Fund does not hold any significant investments (greater than one percent of net assets) categorized as Level 3.
The accompanying Notes to Financial Statements are an integral part of this statement.
| 14 | Columbia Convertible Securities Fund | Annual Report 2022 |
Statement of Assets and Liabilities
February 28, 2022
| Assets | |
| Investments in securities, at value | |
| Unaffiliated issuers (cost $1,936,956,903) | $2,039,898,398 |
| Affiliated issuers (cost $665,757) | 665,824 |
| Receivable for: | |
| Investments sold | 22,825,574 |
| Capital shares sold | 1,649,422 |
| Dividends | 2,966,780 |
| Interest | 4,012,146 |
| Prepaid expenses | 20,962 |
| Total assets | 2,072,039,106 |
| Liabilities | |
| Due to custodian | 56,425 |
| Payable for: | |
| Investments purchased | 12,810,462 |
| Investments purchased on a delayed delivery basis | 9,850,000 |
| Capital shares purchased | 3,519,100 |
| Management services fees | 124,746 |
| Distribution and/or service fees | 14,949 |
| Transfer agent fees | 172,059 |
| Compensation of board members | 178,682 |
| Compensation of chief compliance officer | 381 |
| Other expenses | 50,681 |
| Total liabilities | 26,777,485 |
| Net assets applicable to outstanding capital stock | $2,045,261,621 |
| Represented by | |
| Paid in capital | 1,857,396,879 |
| Total distributable earnings (loss) | 187,864,742 |
| Total - representing net assets applicable to outstanding capital stock | $2,045,261,621 |
The accompanying Notes to Financial Statements are an integral part of this statement.
Columbia Convertible Securities Fund | Annual Report 2022
| 15 |
Statement of Assets and Liabilities (continued)
February 28, 2022
| Class A | |
| Net assets | $413,074,066 |
| Shares outstanding | 17,402,384 |
| Net asset value per share | $23.74 |
| Maximum sales charge | 5.75% |
| Maximum offering price per share (calculated by dividing the net asset value per share by 1.0 minus the maximum sales charge for Class A shares) | $25.19 |
| Advisor Class | |
| Net assets | $176,880,144 |
| Shares outstanding | 7,343,883 |
| Net asset value per share | $24.09 |
| Class C | |
| Net assets | $77,910,403 |
| Shares outstanding | 3,300,608 |
| Net asset value per share | $23.60 |
| Institutional Class | |
| Net assets | $1,094,311,818 |
| Shares outstanding | 45,996,372 |
| Net asset value per share | $23.79 |
| Institutional 2 Class | |
| Net assets | $180,150,235 |
| Shares outstanding | 7,491,383 |
| Net asset value per share | $24.05 |
| Institutional 3 Class | |
| Net assets | $101,658,381 |
| Shares outstanding | 4,180,235 |
| Net asset value per share | $24.32 |
| Class R | |
| Net assets | $1,276,574 |
| Shares outstanding | 53,855 |
| Net asset value per share | $23.70 |
The accompanying Notes to Financial Statements are an integral part of this statement.
| 16 | Columbia Convertible Securities Fund | Annual Report 2022 |
Statement of Operations
Year Ended February 28, 2022
| Net investment income | |
| Income: | |
| Dividends — unaffiliated issuers | $23,047,298 |
| Dividends — affiliated issuers | 16,863 |
| Interest | 26,079,527 |
| Interfund lending | 4 |
| Foreign taxes withheld | (94,169) |
| Total income | 49,049,523 |
| Expenses: | |
| Management services fees | 18,506,296 |
| Distribution and/or service fees | |
| Class A | 1,307,706 |
| Class C | 936,648 |
| Class R | 8,620 |
| Transfer agent fees | |
| Class A | 521,258 |
| Advisor Class | 222,864 |
| Class C | 93,335 |
| Institutional Class | 1,331,463 |
| Institutional 2 Class | 130,382 |
| Institutional 3 Class | 8,090 |
| Class R | 1,717 |
| Compensation of board members | 68,256 |
| Custodian fees | 16,344 |
| Printing and postage fees | 108,095 |
| Registration fees | 169,970 |
| Audit fees | 29,500 |
| Legal fees | 37,774 |
| Interest on interfund lending | 267 |
| Compensation of chief compliance officer | 364 |
| Other | 42,778 |
| Total expenses | 23,541,727 |
| Fees waived by transfer agent | |
| Institutional 2 Class | (37,559) |
| Institutional 3 Class | (8,091) |
| Expense reduction | (380) |
| Total net expenses | 23,495,697 |
| Net investment income | 25,553,826 |
| Realized and unrealized gain (loss) — net | |
| Net realized gain (loss) on: | |
| Investments — unaffiliated issuers | 347,913,679 |
| Investments — affiliated issuers | (1,902) |
| Foreign currency translations | (907) |
| Net realized gain | 347,910,870 |
| Net change in unrealized appreciation (depreciation) on: | |
| Investments — unaffiliated issuers | (597,684,548) |
| Investments — affiliated issuers | 57 |
| Foreign currency translations | 75 |
| Net change in unrealized appreciation (depreciation) | (597,684,416) |
| Net realized and unrealized loss | (249,773,546) |
| Net decrease in net assets resulting from operations | $(224,219,720) |
The accompanying Notes to Financial Statements are an integral part of this statement.
Columbia Convertible Securities Fund | Annual Report 2022
| 17 |
Statement of Changes in Net Assets
| | Year Ended
February 28, 2022 | Year Ended
February 28, 2021 |
| Operations | | |
| Net investment income | $25,553,826 | $28,349,296 |
| Net realized gain | 347,910,870 | 300,282,162 |
| Net change in unrealized appreciation (depreciation) | (597,684,416) | 587,265,821 |
| Net increase (decrease) in net assets resulting from operations | (224,219,720) | 915,897,279 |
| Distributions to shareholders | | |
| Net investment income and net realized gains | | |
| Class A | (99,541,078) | (38,032,859) |
| Advisor Class | (42,828,942) | (13,691,173) |
| Class C | (17,238,856) | (6,282,964) |
| Institutional Class | (257,850,064) | (89,500,632) |
| Institutional 2 Class | (45,510,274) | (15,028,718) |
| Institutional 3 Class | (24,603,005) | (11,719,287) |
| Class R | (316,475) | (148,888) |
| Total distributions to shareholders | (487,888,694) | (174,404,521) |
| Increase in net assets from capital stock activity | 64,917,630 | 520,485,072 |
| Total increase (decrease) in net assets | (647,190,784) | 1,261,977,830 |
| Net assets at beginning of year | 2,692,452,405 | 1,430,474,575 |
| Net assets at end of year | $2,045,261,621 | $2,692,452,405 |
The accompanying Notes to Financial Statements are an integral part of this statement.
| 18 | Columbia Convertible Securities Fund | Annual Report 2022 |
Statement of Changes in Net Assets (continued)
| | Year Ended | Year Ended |
| | February 28, 2022 | February 28, 2021 |
| | Shares | Dollars ($) | Shares | Dollars ($) |
| Capital stock activity |
| Class A | | | | |
| Subscriptions | 3,228,830 | 92,003,782 | 6,543,092 | 173,145,914 |
| Distributions reinvested | 2,846,504 | 75,156,224 | 1,082,242 | 28,390,322 |
| Redemptions | (6,914,880) | (191,621,486) | (3,750,317) | (94,419,226) |
| Net increase (decrease) | (839,546) | (24,461,480) | 3,875,017 | 107,117,010 |
| Advisor Class | | | | |
| Subscriptions | 3,734,410 | 109,600,435 | 6,386,815 | 165,750,916 |
| Distributions reinvested | 1,602,315 | 42,763,655 | 516,718 | 13,673,496 |
| Redemptions | (5,156,959) | (145,063,892) | (3,990,143) | (105,096,614) |
| Net increase | 179,766 | 7,300,198 | 2,913,390 | 74,327,798 |
| Class C | | | | |
| Subscriptions | 539,063 | 15,538,783 | 872,680 | 23,594,239 |
| Distributions reinvested | 592,034 | 15,484,137 | 212,100 | 5,561,428 |
| Redemptions | (970,376) | (26,782,063) | (777,420) | (20,202,251) |
| Net increase | 160,721 | 4,240,857 | 307,360 | 8,953,416 |
| Institutional Class | | | | |
| Subscriptions | 13,759,425 | 391,569,803 | 22,020,514 | 567,098,429 |
| Distributions reinvested | 8,000,005 | 211,130,201 | 2,774,980 | 72,707,106 |
| Redemptions | (19,464,113) | (535,994,990) | (14,229,664) | (342,844,211) |
| Net increase | 2,295,317 | 66,705,014 | 10,565,830 | 296,961,324 |
| Institutional 2 Class | | | | |
| Subscriptions | 3,662,138 | 106,043,960 | 5,669,172 | 137,402,149 |
| Distributions reinvested | 1,571,227 | 41,882,441 | 541,539 | 14,289,446 |
| Redemptions | (5,017,678) | (137,042,082) | (3,068,757) | (78,794,981) |
| Net increase | 215,687 | 10,884,319 | 3,141,954 | 72,896,614 |
| Institutional 3 Class | | | | |
| Subscriptions | 1,091,018 | 31,642,676 | 1,211,550 | 33,087,799 |
| Distributions reinvested | 904,559 | 24,378,433 | 454,489 | 11,715,180 |
| Redemptions | (2,002,471) | (55,368,594) | (3,182,103) | (84,192,126) |
| Net increase (decrease) | (6,894) | 652,515 | (1,516,064) | (39,389,147) |
| Class R | | | | |
| Subscriptions | 24,002 | 659,851 | 33,070 | 829,134 |
| Distributions reinvested | 8,976 | 236,924 | 4,052 | 105,544 |
| Redemptions | (45,984) | (1,300,568) | (56,385) | (1,316,621) |
| Net decrease | (13,006) | (403,793) | (19,263) | (381,943) |
| Total net increase | 1,992,045 | 64,917,630 | 19,268,224 | 520,485,072 |
The accompanying Notes to Financial Statements are an integral part of this statement.
Columbia Convertible Securities Fund | Annual Report 2022
| 19 |
The following table is intended to help you understand the Fund’s financial performance. Certain information reflects financial results for a single share of a class held for the periods shown. Per share net investment income (loss) amounts are calculated based on average shares outstanding during the period. Total return assumes reinvestment of all dividends and distributions, if any. Total return does not reflect payment of sales charges, if any. Total return and portfolio turnover are not annualized for periods of less than one year. The portfolio turnover rate is calculated without regard to purchase and sales transactions of short-term instruments and certain derivatives, if any. If such transactions were included, the Fund’s portfolio turnover rate may be higher.
| | Net asset value,
beginning of
period | Net
investment
income | Net
realized
and
unrealized
gain (loss) | Total from
investment
operations | Distributions
from net
investment
income | Distributions
from net
realized
gains | Total
distributions to
shareholders |
| Class A |
| Year Ended 2/28/2022 | $32.01 | 0.24 | (2.84) | (2.60) | (0.22) | (5.45) | (5.67) |
| Year Ended 2/28/2021 | $22.09 | 0.34 | 11.92 | 12.26 | (0.44) | (1.90) | (2.34) |
| Year Ended 2/29/2020 | $20.92 | 0.39 | 2.18 | 2.57 | (0.50) | (0.90) | (1.40) |
| Year Ended 2/28/2019 | $20.41 | 0.39 | 1.11 | 1.50 | (0.40) | (0.59) | (0.99) |
| Year Ended 2/28/2018 | $18.64 | 0.43 | 1.89 | 2.32 | (0.55) | — | (0.55) |
| Advisor Class |
| Year Ended 2/28/2022 | $32.40 | 0.32 | (2.89) | (2.57) | (0.29) | (5.45) | (5.74) |
| Year Ended 2/28/2021 | $22.34 | 0.41 | 12.06 | 12.47 | (0.51) | (1.90) | (2.41) |
| Year Ended 2/29/2020 | $21.14 | 0.45 | 2.20 | 2.65 | (0.55) | (0.90) | (1.45) |
| Year Ended 2/28/2019 | $20.61 | 0.44 | 1.13 | 1.57 | (0.45) | (0.59) | (1.04) |
| Year Ended 2/28/2018 | $18.82 | 0.48 | 1.90 | 2.38 | (0.59) | — | (0.59) |
| Class C |
| Year Ended 2/28/2022 | $31.88 | 0.03 | (2.85) | (2.82) | (0.01) | (5.45) | (5.46) |
| Year Ended 2/28/2021 | $22.00 | 0.15 | 11.89 | 12.04 | (0.26) | (1.90) | (2.16) |
| Year Ended 2/29/2020 | $20.84 | 0.23 | 2.17 | 2.40 | (0.34) | (0.90) | (1.24) |
| Year Ended 2/28/2019 | $20.33 | 0.23 | 1.12 | 1.35 | (0.25) | (0.59) | (0.84) |
| Year Ended 2/28/2018 | $18.57 | 0.29 | 1.87 | 2.16 | (0.40) | — | (0.40) |
| Institutional Class |
| Year Ended 2/28/2022 | $32.08 | 0.31 | (2.86) | (2.55) | (0.29) | (5.45) | (5.74) |
| Year Ended 2/28/2021 | $22.13 | 0.41 | 11.95 | 12.36 | (0.51) | (1.90) | (2.41) |
| Year Ended 2/29/2020 | $20.96 | 0.45 | 2.17 | 2.62 | (0.55) | (0.90) | (1.45) |
| Year Ended 2/28/2019 | $20.44 | 0.44 | 1.12 | 1.56 | (0.45) | (0.59) | (1.04) |
| Year Ended 2/28/2018 | $18.67 | 0.48 | 1.88 | 2.36 | (0.59) | — | (0.59) |
| Institutional 2 Class |
| Year Ended 2/28/2022 | $32.36 | 0.33 | (2.88) | (2.55) | (0.31) | (5.45) | (5.76) |
| Year Ended 2/28/2021 | $22.31 | 0.43 | 12.04 | 12.47 | (0.52) | (1.90) | (2.42) |
| Year Ended 2/29/2020 | $21.12 | 0.47 | 2.18 | 2.65 | (0.56) | (0.90) | (1.46) |
| Year Ended 2/28/2019 | $20.59 | 0.45 | 1.14 | 1.59 | (0.47) | (0.59) | (1.06) |
| Year Ended 2/28/2018 | $18.80 | 0.50 | 1.90 | 2.40 | (0.61) | — | (0.61) |
The accompanying Notes to Financial Statements are an integral part of this statement.
| 20 | Columbia Convertible Securities Fund | Annual Report 2022 |
Financial Highlights (continued)
| | Net
asset
value,
end of
period | Total
return | Total gross
expense
ratio to
average
net assets(a) | Total net
expense
ratio to
average
net assets(a),(b) | Net investment
income
ratio to
average
net assets | Portfolio
turnover | Net
assets,
end of
period
(000’s) |
| Class A |
| Year Ended 2/28/2022 | $23.74 | (9.04%) | 1.10%(c) | 1.10%(c),(d) | 0.83% | 92% | $413,074 |
| Year Ended 2/28/2021 | $32.01 | 58.37% | 1.12%(c) | 1.12%(c),(d) | 1.32% | 98% | $584,015 |
| Year Ended 2/29/2020 | $22.09 | 12.55% | 1.17%(c) | 1.12%(c),(d) | 1.81% | 74% | $317,365 |
| Year Ended 2/28/2019 | $20.92 | 7.70% | 1.20%(c) | 1.13%(c),(d) | 1.88% | 60% | $286,075 |
| Year Ended 2/28/2018 | $20.41 | 12.65% | 1.22% | 1.12%(d) | 2.21% | 67% | $248,052 |
| Advisor Class |
| Year Ended 2/28/2022 | $24.09 | (8.82%) | 0.85%(c) | 0.85%(c),(d) | 1.08% | 92% | $176,880 |
| Year Ended 2/28/2021 | $32.40 | 58.75% | 0.88%(c) | 0.88%(c),(d) | 1.55% | 98% | $232,118 |
| Year Ended 2/29/2020 | $22.34 | 12.84% | 0.92%(c) | 0.87%(c),(d) | 2.06% | 74% | $94,945 |
| Year Ended 2/28/2019 | $21.14 | 7.99% | 0.95%(c) | 0.88%(c),(d) | 2.15% | 60% | $51,487 |
| Year Ended 2/28/2018 | $20.61 | 12.91% | 0.97% | 0.87%(d) | 2.43% | 67% | $18,432 |
| Class C |
| Year Ended 2/28/2022 | $23.60 | (9.76%) | 1.85%(c) | 1.85%(c),(d) | 0.09% | 92% | $77,910 |
| Year Ended 2/28/2021 | $31.88 | 57.20% | 1.87%(c) | 1.87%(c),(d) | 0.59% | 98% | $100,101 |
| Year Ended 2/29/2020 | $22.00 | 11.71% | 1.92%(c) | 1.87%(c),(d) | 1.06% | 74% | $62,313 |
| Year Ended 2/28/2019 | $20.84 | 6.92% | 1.95%(c) | 1.88%(c),(d) | 1.14% | 60% | $44,035 |
| Year Ended 2/28/2018 | $20.33 | 11.80% | 1.97% | 1.87%(d) | 1.47% | 67% | $40,419 |
| Institutional Class |
| Year Ended 2/28/2022 | $23.79 | (8.84%) | 0.85%(c) | 0.85%(c),(d) | 1.09% | 92% | $1,094,312 |
| Year Ended 2/28/2021 | $32.08 | 58.81% | 0.88%(c) | 0.88%(c),(d) | 1.57% | 98% | $1,401,886 |
| Year Ended 2/29/2020 | $22.13 | 12.81% | 0.92%(c) | 0.87%(c),(d) | 2.06% | 74% | $733,400 |
| Year Ended 2/28/2019 | $20.96 | 8.00% | 0.95%(c) | 0.88%(c),(d) | 2.13% | 60% | $544,140 |
| Year Ended 2/28/2018 | $20.44 | 12.91% | 0.97% | 0.87%(d) | 2.49% | 67% | $393,240 |
| Institutional 2 Class |
| Year Ended 2/28/2022 | $24.05 | (8.77%) | 0.80%(c) | 0.79%(c) | 1.14% | 92% | $180,150 |
| Year Ended 2/28/2021 | $32.36 | 58.89% | 0.83%(c) | 0.81%(c) | 1.62% | 98% | $235,448 |
| Year Ended 2/29/2020 | $22.31 | 12.88% | 0.87%(c) | 0.81%(c) | 2.13% | 74% | $92,233 |
| Year Ended 2/28/2019 | $21.12 | 8.07% | 0.89%(c) | 0.81%(c) | 2.19% | 60% | $80,367 |
| Year Ended 2/28/2018 | $20.59 | 13.02% | 0.90% | 0.80% | 2.54% | 67% | $49,709 |
The accompanying Notes to Financial Statements are an integral part of this statement.
Columbia Convertible Securities Fund | Annual Report 2022
| 21 |
Financial Highlights (continued)
| | Net asset value,
beginning of
period | Net
investment
income | Net
realized
and
unrealized
gain (loss) | Total from
investment
operations | Distributions
from net
investment
income | Distributions
from net
realized
gains | Total
distributions to
shareholders |
| Institutional 3 Class |
| Year Ended 2/28/2022 | $32.66 | 0.35 | (2.92) | (2.57) | (0.32) | (5.45) | (5.77) |
| Year Ended 2/28/2021 | $22.50 | 0.45 | 12.14 | 12.59 | (0.53) | (1.90) | (2.43) |
| Year Ended 2/29/2020 | $21.28 | 0.48 | 2.21 | 2.69 | (0.57) | (0.90) | (1.47) |
| Year Ended 2/28/2019 | $20.74 | 0.47 | 1.14 | 1.61 | (0.48) | (0.59) | (1.07) |
| Year Ended 2/28/2018 | $18.94 | 0.51 | 1.91 | 2.42 | (0.62) | — | (0.62) |
| Class R |
| Year Ended 2/28/2022 | $31.98 | 0.16 | (2.85) | (2.69) | (0.14) | (5.45) | (5.59) |
| Year Ended 2/28/2021 | $22.06 | 0.29 | 11.91 | 12.20 | (0.38) | (1.90) | (2.28) |
| Year Ended 2/29/2020 | $20.90 | 0.34 | 2.16 | 2.50 | (0.44) | (0.90) | (1.34) |
| Year Ended 2/28/2019 | $20.39 | 0.33 | 1.12 | 1.45 | (0.35) | (0.59) | (0.94) |
| Year Ended 2/28/2018 | $18.62 | 0.38 | 1.89 | 2.27 | (0.50) | — | (0.50) |
| Notes to Financial Highlights |
| (a) | In addition to the fees and expenses that the Fund bears directly, the Fund indirectly bears a pro rata share of the fees and expenses of any other funds in which it invests. Such indirect expenses are not included in the Fund’s reported expense ratios. |
| (b) | Total net expenses include the impact of certain fee waivers/expense reimbursements made by the Investment Manager and certain of its affiliates, if applicable. |
| (c) | Ratios include interfund lending expense which is less than 0.01%. |
| (d) | The benefits derived from expense reductions had an impact of less than 0.01%. |
The accompanying Notes to Financial Statements are an integral part of this statement.
| 22 | Columbia Convertible Securities Fund | Annual Report 2022 |
Financial Highlights (continued)
| | Net
asset
value,
end of
period | Total
return | Total gross
expense
ratio to
average
net assets(a) | Total net
expense
ratio to
average
net assets(a),(b) | Net investment
income
ratio to
average
net assets | Portfolio
turnover | Net
assets,
end of
period
(000’s) |
| Institutional 3 Class |
| Year Ended 2/28/2022 | $24.32 | (8.74%) | 0.75%(c) | 0.75%(c) | 1.18% | 92% | $101,658 |
| Year Ended 2/28/2021 | $32.66 | 58.95% | 0.78%(c) | 0.77%(c) | 1.74% | 98% | $136,747 |
| Year Ended 2/29/2020 | $22.50 | 12.97% | 0.82%(c) | 0.77%(c) | 2.17% | 74% | $128,319 |
| Year Ended 2/28/2019 | $21.28 | 8.11% | 0.84%(c) | 0.76%(c) | 2.25% | 60% | $100,142 |
| Year Ended 2/28/2018 | $20.74 | 13.03% | 0.85% | 0.75% | 2.58% | 67% | $90,655 |
| Class R |
| Year Ended 2/28/2022 | $23.70 | (9.32%) | 1.35%(c) | 1.35%(c),(d) | 0.57% | 92% | $1,277 |
| Year Ended 2/28/2021 | $31.98 | 58.04% | 1.37%(c) | 1.37%(c),(d) | 1.13% | 98% | $2,138 |
| Year Ended 2/29/2020 | $22.06 | 12.23% | 1.42%(c) | 1.37%(c),(d) | 1.56% | 74% | $1,900 |
| Year Ended 2/28/2019 | $20.90 | 7.44% | 1.45%(c) | 1.38%(c),(d) | 1.63% | 60% | $2,337 |
| Year Ended 2/28/2018 | $20.39 | 12.38% | 1.47% | 1.37%(d) | 1.97% | 67% | $3,031 |
The accompanying Notes to Financial Statements are an integral part of this statement.
Columbia Convertible Securities Fund | Annual Report 2022
| 23 |
Notes to Financial Statements
February 28, 2022
Note 1. Organization
Columbia Convertible Securities Fund (the Fund), a series of Columbia Funds Series Trust (the Trust), is a diversified fund. The Trust is registered under the Investment Company Act of 1940, as amended (the 1940 Act), as an open-end management investment company organized as a Delaware statutory trust.
Fund shares
The Trust may issue an unlimited number of shares (without par value). The Fund offers each of the share classes listed in the Statement of Assets and Liabilities. Although all share classes generally have identical voting, dividend and liquidation rights, each share class votes separately when required by the Trust’s organizational documents or by law. Each share class has its own expense and sales charge structure. Different share classes may have different minimum initial investment amounts and pay different net investment income distribution amounts to the extent the expenses of distributing such share classes vary. Distributions to shareholders in a liquidation will be proportional to the net asset value of each share class.
As described in the Fund’s prospectus, Class A and Class C shares are offered to the general public for investment. Effective April 1, 2021, Class C shares automatically convert to Class A shares after 8 years. Prior to April 1, 2021, Class C shares automatically converted to Class A shares after 10 years. Advisor Class, Institutional Class, Institutional 2 Class, Institutional 3 Class and Class R shares are available for purchase through authorized investment professionals to omnibus retirement plans or to institutional investors and to certain other investors as also described in the Fund’s prospectus.
Note 2. Summary of significant accounting policies
Basis of preparation
The Fund is an investment company that applies the accounting and reporting guidance in the Financial Accounting Standards Board (FASB) Accounting Standards Codification Topic 946, Financial Services - Investment Companies (ASC 946). The financial statements are prepared in accordance with U.S. generally accepted accounting principles (GAAP), which requires management to make certain estimates and assumptions that affect the reported amounts of assets and liabilities, the disclosure of contingent assets and liabilities at the date of the financial statements and the reported amounts of income and expenses during the reporting period. Actual results could differ from those estimates.
The following is a summary of significant accounting policies followed by the Fund in the preparation of its financial statements.
Security valuation
Equity securities listed on an exchange are valued at the closing price or last trade price on their primary exchange at the close of business of the New York Stock Exchange. Securities with a closing price not readily available or not listed on any exchange are valued at the mean between the closing bid and ask prices. Listed preferred stocks convertible into common stocks are valued using an evaluated price from a pricing service.
Debt securities generally are valued by pricing services approved by the Board of Trustees based upon market transactions for normal, institutional-size trading units of similar securities. The services may use various pricing techniques that take into account, as applicable, factors such as yield, quality, coupon rate, maturity, type of issue, trading characteristics and other data, as well as approved independent broker-dealer quotes. Debt securities for which quotations are not readily available or not believed to be reflective of market value may also be valued based upon a bid quote from an approved independent broker-dealer. Debt securities maturing in 60 days or less are valued primarily at amortized market value, unless this method results in a valuation that management believes does not approximate fair value.
Foreign equity securities are valued based on the closing price or last trade price on their primary exchange at the close of business of the New York Stock Exchange. If any foreign equity security closing prices are not readily available, the securities are valued at the mean of the latest quoted bid and ask prices on such exchanges or markets. Foreign currency exchange rates are determined at the scheduled closing time of the New York Stock Exchange. Many securities markets and exchanges outside the U.S. close prior to the close of the New York Stock Exchange; therefore, the closing prices for securities in such markets or on such exchanges may not fully reflect events that occur after such close but before the close of the New York Stock Exchange. In those situations, foreign securities will be fair valued pursuant to a policy adopted by the
| 24 | Columbia Convertible Securities Fund | Annual Report 2022 |
Notes to Financial Statements (continued)
February 28, 2022
Board of Trustees. Under the policy, the Fund may utilize a third-party pricing service to determine these fair values. The third-party pricing service takes into account multiple factors, including, but not limited to, movements in the U.S. securities markets, certain depositary receipts, futures contracts and foreign exchange rates that have occurred subsequent to the close of the foreign exchange or market, to determine a good faith estimate that reasonably reflects the current market conditions as of the close of the New York Stock Exchange. The fair value of a security is likely to be different from the quoted or published price, if available.
Investments in open-end investment companies (other than exchange-traded funds (ETFs)), are valued at the latest net asset value reported by those companies as of the valuation time.
Investments for which market quotations are not readily available, or that have quotations which management believes are not reflective of market value or reliable, are valued at fair value as determined in good faith under procedures approved by and under the general supervision of the Board of Trustees. If a security or class of securities (such as foreign securities) is valued at fair value, such value is likely to be different from the quoted or published price for the security, if available.
The determination of fair value often requires significant judgment. To determine fair value, management may use assumptions including but not limited to future cash flows and estimated risk premiums. Multiple inputs from various sources may be used to determine fair value.
GAAP requires disclosure regarding the inputs and valuation techniques used to measure fair value and any changes in valuation inputs or techniques. In addition, investments shall be disclosed by major category. This information is disclosed following the Fund’s Portfolio of Investments.
Foreign currency transactions and translations
The values of all assets and liabilities denominated in foreign currencies are generally translated into U.S. dollars at exchange rates determined at the close of regular trading on the New York Stock Exchange. Net realized and unrealized gains (losses) on foreign currency transactions and translations include gains (losses) arising from the fluctuation in exchange rates between trade and settlement dates on securities transactions, gains (losses) arising from the disposition of foreign currency and currency gains (losses) between the accrual and payment dates on dividends, interest income and foreign withholding taxes.
For financial statement purposes, the Fund does not distinguish that portion of gains (losses) on investments which is due to changes in foreign exchange rates from that which is due to changes in market prices of the investments. Such fluctuations are included with the net realized and unrealized gains (losses) on investments in the Statement of Operations.
Delayed delivery securities
The Fund may trade securities on other than normal settlement terms, including securities purchased or sold on a “when-issued” or "forward commitment" basis. This may increase risk to the Fund since the other party to the transaction may fail to deliver, which could cause the Fund to subsequently invest at less advantageous prices. The Fund designates cash or liquid securities in an amount equal to the delayed delivery commitment.
Security transactions
Security transactions are accounted for on the trade date. Cost is determined and gains (losses) are based upon the specific identification method for both financial statement and federal income tax purposes.
Income recognition
Interest income is recorded on an accrual basis. Market premiums and discounts, including original issue discounts, are amortized and accreted, respectively, over the expected life of the security on all debt securities, unless otherwise noted. For convertible securities, premiums attributable to the conversion feature are not amortized.
Columbia Convertible Securities Fund | Annual Report 2022
| 25 |
Notes to Financial Statements (continued)
February 28, 2022
The Fund may place a debt security on non-accrual status and reduce related interest income when it becomes probable that the interest will not be collected and the amount of uncollectible interest can be reasonably estimated. A defaulted debt security is removed from non-accrual status when the issuer resumes interest payments or when collectability of interest is reasonably assured.
Corporate actions and dividend income are recorded on the ex-dividend date.
The Fund may receive distributions from holdings in equity securities, business development companies (BDCs), exchange-traded funds (ETFs), limited partnerships (LPs), other regulated investment companies (RICs), and real estate investment trusts (REITs), which report information as to the tax character of their distributions annually. These distributions are allocated to dividend income, capital gain and return of capital based on actual information reported. Return of capital is recorded as a reduction of the cost basis of securities held. If the Fund no longer owns the applicable securities, return of capital is recorded as a realized gain. With respect to REITs, to the extent actual information has not yet been reported, estimates for return of capital are made by Columbia Management Investment Advisers, LLC (the Investment Manager), a wholly-owned subsidiary of Ameriprise Financial, Inc. (Ameriprise Financial). The Investment Manager’s estimates are subsequently adjusted when the actual character of the distributions is disclosed by the REITs, which could result in a proportionate change in return of capital to shareholders.
Awards from class action litigation are recorded as a reduction of cost basis if the Fund still owns the applicable securities on the payment date. If the Fund no longer owns the applicable securities on the payment date, the proceeds are recorded as realized gains.
Expenses
General expenses of the Trust are allocated to the Fund and other funds of the Trust based upon relative net assets or other expense allocation methodologies determined by the nature of the expense. Expenses directly attributable to the Fund are charged to the Fund. Expenses directly attributable to a specific class of shares are charged to that share class.
Determination of class net asset value
All income, expenses (other than class-specific expenses, which are charged to that share class, as shown in the Statement of Operations) and realized and unrealized gains (losses) are allocated to each class of the Fund on a daily basis, based on the relative net assets of each class, for purposes of determining the net asset value of each class.
Federal income tax status
The Fund intends to qualify each year as a regulated investment company under Subchapter M of the Internal Revenue Code, as amended, and will distribute substantially all of its investment company taxable income and net capital gain, if any, for its tax year, and as such will not be subject to federal income taxes. In addition, the Fund intends to distribute in each calendar year substantially all of its ordinary income, capital gain net income and certain other amounts, if any, such that the Fund should not be subject to federal excise tax. Therefore, no federal income or excise tax provision is recorded.
Foreign taxes
The Fund may be subject to foreign taxes on income, gains on investments or currency repatriation, a portion of which may be recoverable. The Fund will accrue such taxes and recoveries, as applicable, based upon its current interpretation of tax rules and regulations that exist in the markets in which it invests.
Realized gains in certain countries may be subject to foreign taxes at the Fund level, based on statutory rates. The Fund accrues for such foreign taxes on realized and unrealized gains at the appropriate rate for each jurisdiction, as applicable. The amount, if any, is disclosed as a liability on the Statement of Assets and Liabilities.
Distributions to shareholders
Distributions from net investment income, if any, are declared and paid each calendar quarter. Net realized capital gains, if any, are distributed at least annually. Income distributions and capital gain distributions are determined in accordance with federal income tax regulations, which may differ from GAAP.
| 26 | Columbia Convertible Securities Fund | Annual Report 2022 |
Notes to Financial Statements (continued)
February 28, 2022
Guarantees and indemnifications
Under the Trust’s organizational documents and, in some cases, by contract, its officers and trustees are indemnified against certain liabilities arising out of the performance of their duties to the Trust or its funds. In addition, certain of the Fund’s contracts with its service providers contain general indemnification clauses. The Fund’s maximum exposure under these arrangements is unknown since the amount of any future claims that may be made against the Fund cannot be determined, and the Fund has no historical basis for predicting the likelihood of any such claims.
Note 3. Fees and other transactions with affiliates
Management services fees
The Fund has entered into a Management Agreement with Columbia Management Investment Advisers, LLC (the Investment Manager), a wholly-owned subsidiary of Ameriprise Financial, Inc. (Ameriprise Financial). Under the Management Agreement, the Investment Manager provides the Fund with investment research and advice, as well as administrative and accounting services. Effective July 1, 2021, the management services fee is an annual fee that is equal to a percentage of the Fund’s daily net assets that declines from 0.82% to 0.65% as the Fund’s net assets increase. Prior to July 1, 2021, the management services fee was equal to a percentage of the Fund’s daily net assets that declined from 0.82% to 0.67% as the Fund’s net assets increased. The effective management services fee rate for the year ended February 28, 2022 was 0.73% of the Fund’s average daily net assets.
Compensation of board members
Members of the Board of Trustees who are not officers or employees of the Investment Manager or Ameriprise Financial are compensated for their services to the Fund as disclosed in the Statement of Operations. Under a Deferred Compensation Plan (the Deferred Plan), these members of the Board of Trustees may elect to defer payment of up to 100% of their compensation. Deferred amounts are treated as though equivalent dollar amounts had been invested in shares of certain funds managed by the Investment Manager. The Fund’s liability for these amounts is adjusted for market value changes and remains in the Fund until distributed in accordance with the Deferred Plan. All amounts payable under the Deferred Plan constitute a general unsecured obligation of the Fund. The expense for the Deferred Plan, which includes Trustees’ fees deferred during the current period as well as any gains or losses on the Trustees’ deferred compensation balances as a result of market fluctuations, is included in "Compensation of board members" on the Statement of Operations.
Compensation of Chief Compliance Officer
The Board of Trustees has appointed a Chief Compliance Officer for the Fund in accordance with federal securities regulations. As disclosed in the Statement of Operations, a portion of the Chief Compliance Officer’s total compensation is allocated to the Fund, along with other allocations to affiliated registered investment companies managed by the Investment Manager and its affiliates, based on relative net assets.
Transfer agency fees
Under a Transfer and Dividend Disbursing Agent Agreement, Columbia Management Investment Services Corp. (the Transfer Agent), an affiliate of the Investment Manager and a wholly-owned subsidiary of Ameriprise Financial, is responsible for providing transfer agency services to the Fund. The Transfer Agent has contracted with DST Asset Manager Solutions, Inc. (DST) to serve as sub-transfer agent. The Transfer Agent pays the fees of DST for services as sub-transfer agent and DST is not entitled to reimbursement for such fees from the Fund (with the exception of out-of-pocket fees).
The Fund pays the Transfer Agent a monthly transfer agency fee based on the number or the average value of accounts, depending on the type of account. In addition, the Fund pays the Transfer Agent a fee for shareholder services based on the number of accounts or on a percentage of the average aggregate value of the Fund’s shares maintained in omnibus accounts up to the lesser of the amount charged by the financial intermediary or a cap established by the Board of Trustees from time to time.
The Transfer Agent also receives compensation from the Fund for various shareholder services and reimbursements for certain out-of-pocket fees. Total transfer agency fees for Institutional 2 Class and Institutional 3 Class shares are subject to an annual limitation of not more than 0.07% and 0.02%, respectively, of the average daily net assets attributable to each
Columbia Convertible Securities Fund | Annual Report 2022
| 27 |
Notes to Financial Statements (continued)
February 28, 2022
share class. In addition, effective through June 30, 2022, Institutional 2 Class shares are subject to a contractual transfer agency fee annual limitation of not more than 0.04% and Institutional 3 Class shares are subject to a contractual transfer agency fee annual limitation of not more than 0.00% of the average daily net assets attributable to each share class.
For the year ended February 28, 2022, the Fund’s effective transfer agency fee rates as a percentage of average daily net assets of each class were as follows:
| | Effective rate (%) |
| Class A | 0.10 |
| Advisor Class | 0.10 |
| Class C | 0.10 |
| Institutional Class | 0.10 |
| Institutional 2 Class | 0.04 |
| Institutional 3 Class | 0.00 |
| Class R | 0.10 |
An annual minimum account balance fee of $20 may apply to certain accounts with a value below the applicable share class’s initial minimum investment requirements to reduce the impact of small accounts on transfer agency fees. These minimum account balance fees are remitted to the Fund and recorded as part of expense reductions in the Statement of Operations. For the year ended February 28, 2022, these minimum account balance fees reduced total expenses of the Fund by $380.
Distribution and service fees
The Fund has entered into an agreement with Columbia Management Investment Distributors, Inc. (the Distributor), an affiliate of the Investment Manager and a wholly-owned subsidiary of Ameriprise Financial, for distribution and shareholder services. The Board of Trustees has approved, and the Fund has adopted, distribution and shareholder service plans (the Plans) applicable to certain share classes, which set the distribution and service fees for the Fund. These fees are calculated daily and are intended to compensate the Distributor and/or eligible selling and/or servicing agents for selling shares of the Fund and providing services to investors.
Under the Plans, the Fund pays a monthly combined distribution and service fee to the Distributor at the maximum annual rate of 0.25% of the average daily net assets attributable to Class A shares of the Fund. Also under the Plans, the Fund pays a monthly service fee to the Distributor at the maximum annual rate of 0.25% of the average daily net assets attributable to Class C shares of the Fund and a monthly distribution fee to the Distributor at the maximum annual rates of 0.75% and 0.50% of the average daily net assets attributable to Class C and Class R shares of the Fund, respectively.
Sales charges (unaudited)
Sales charges, including front-end charges and contingent deferred sales charges (CDSCs), received by the Distributor for distributing Fund shares for the year ended February 28, 2022, if any, are listed below:
| | Front End (%) | CDSC (%) | Amount ($) |
| Class A | 5.75 | 0.50 - 1.00(a) | 618,045 |
| Class C | — | 1.00(b) | 7,768 |
| (a) | This charge is imposed on certain investments of between $1 million and $50 million redeemed within 18 months after purchase, as follows: 1.00% if redeemed within 12 months after purchase, and 0.50% if redeemed more than 12, but less than 18, months after purchase, with certain limited exceptions. |
| (b) | This charge applies to redemptions within 12 months after purchase, with certain limited exceptions. |
The Fund’s other share classes are not subject to sales charges.
| 28 | Columbia Convertible Securities Fund | Annual Report 2022 |
Notes to Financial Statements (continued)
February 28, 2022
Expenses waived/reimbursed by the Investment Manager and its affiliates
The Investment Manager and certain of its affiliates have contractually agreed to waive fees and/or reimburse expenses (excluding certain fees and expenses described below) for the period(s) disclosed below, unless sooner terminated at the sole discretion of the Board of Trustees, so that the Fund’s net operating expenses, after giving effect to fees waived/expenses reimbursed and any balance credits and/or overdraft charges from the Fund’s custodian, do not exceed the following annual rate(s) as a percentage of the classes’ average daily net assets:
| | July 1, 2021
through
June 30, 2022 | Prior to
July 1, 2021 |
| Class A | 1.12% | 1.13% |
| Advisor Class | 0.87 | 0.88 |
| Class C | 1.87 | 1.88 |
| Institutional Class | 0.87 | 0.88 |
| Institutional 2 Class | 0.81 | 0.81 |
| Institutional 3 Class | 0.77 | 0.77 |
| Class R | 1.37 | 1.38 |
Under the agreement governing these fee waivers and/or expense reimbursement arrangements, the following fees and expenses are excluded from the waiver/reimbursement commitment, and therefore will be paid by the Fund, if applicable: taxes (including foreign transaction taxes), expenses associated with investments in affiliated and non-affiliated pooled investment vehicles (including mutual funds and exchange-traded funds), transaction costs and brokerage commissions, costs related to any securities lending program, dividend expenses associated with securities sold short, inverse floater program fees and expenses, transaction charges and interest on borrowed money, interest, costs associated with shareholder meetings, infrequent and/or unusual expenses and any other expenses the exclusion of which is specifically approved by the Board of Trustees. This agreement may be modified or amended only with approval from the Investment Manager, certain of its affiliates and the Fund. Reflected in the contractual cap commitments, effective through June 30, 2022, is the Transfer Agent’s contractual agreement to limit total transfer agency fees to an annual rate of not more than 0.04% for Institutional 2 Class and 0.00% for Institutional 3 Class of the average daily net assets attributable to each share class, unless sooner terminated at the sole discretion of the Board of Trustees. Any fees waived and/or expenses reimbursed under the expense reimbursement arrangements described above are not recoverable by the Investment Manager or its affiliates in future periods.
Note 4. Federal tax information
The timing and character of income and capital gain distributions are determined in accordance with income tax regulations, which may differ from GAAP because of temporary or permanent book to tax differences.
At February 28, 2022, these differences were primarily due to differing treatment for deferral/reversal of wash sale losses, trustees’ deferred compensation, post-October capital losses, re-characterization of distributions for investments, principal and/or interest of fixed income securities, foreign currency transactions, amortization/accretion on certain convertible securities and deemed distributions. To the extent these differences were permanent, reclassifications were made among the components of the Fund’s net assets. Temporary differences do not require reclassifications.
The following reclassifications were made:
Undistributed net
investment
income ($) | Accumulated
net realized
gain ($) | Paid in
capital ($) |
| (1,240,738) | 1,240,738 | — |
Net investment income (loss) and net realized gains (losses), as disclosed in the Statement of Operations, and net assets were not affected by this reclassification.
Columbia Convertible Securities Fund | Annual Report 2022
| 29 |
Notes to Financial Statements (continued)
February 28, 2022
The tax character of distributions paid during the years indicated was as follows:
| Year Ended February 28, 2022 | Year Ended February 28, 2021 |
Ordinary
income ($) | Long-term
capital gains ($) | Total ($) | Ordinary
income ($) | Long-term
capital gains ($) | Total ($) |
| 92,206,745 | 395,681,950 | 487,888,695 | 79,779,025 | 94,625,496 | 174,404,521 |
Short-term capital gain distributions, if any, are considered ordinary income distributions for tax purposes.
At February 28, 2022, the components of distributable earnings on a tax basis were as follows:
Undistributed
ordinary income ($) | Undistributed
long-term
capital gains ($) | Capital loss
carryforwards ($) | Net unrealized
appreciation ($) |
| 5,200,735 | 110,939,132 | — | 98,863,923 |
At February 28, 2022, the cost of all investments for federal income tax purposes along with the aggregate gross unrealized appreciation and depreciation based on that cost was:
Federal
tax cost ($) | Gross unrealized
appreciation ($) | Gross unrealized
(depreciation) ($) | Net unrealized
appreciation ($) |
| 1,941,700,299 | 237,298,905 | (138,434,982) | 98,863,923 |
Tax cost of investments and unrealized appreciation/(depreciation) may also include timing differences that do not constitute adjustments to tax basis.
Under current tax rules, regulated investment companies can elect to treat certain late-year ordinary losses incurred and post-October capital losses (capital losses realized after October 31) as arising on the first day of the following taxable year. As of February 28, 2022, the Fund will elect to treat the following late-year ordinary losses and post-October capital losses as arising on March 1, 2022.
Late year
ordinary losses ($) | Post-October
capital losses ($) |
| — | 26,962,597 |
Management of the Fund has concluded that there are no significant uncertain tax positions in the Fund that would require recognition in the financial statements. However, management’s conclusion may be subject to review and adjustment at a later date based on factors including, but not limited to, new tax laws, regulations, and administrative interpretations (including relevant court decisions). Generally, the Fund’s federal tax returns for the prior three fiscal years remain subject to examination by the Internal Revenue Service.
Note 5. Portfolio information
The cost of purchases and proceeds from sales of securities, excluding short-term investments and derivatives, if any, aggregated to $2,297,514,434 and $2,705,244,664, respectively, for the year ended February 28, 2022. The amount of purchase and sale activity impacts the portfolio turnover rate reported in the Financial Highlights.
Note 6. Affiliated money market fund
The Fund invests in Columbia Short-Term Cash Fund, an affiliated money market fund established for the exclusive use by the Fund and other affiliated funds (the Affiliated MMF). The income earned by the Fund from such investments is included as Dividends - affiliated issuers in the Statement of Operations. As an investing fund, the Fund indirectly bears its proportionate share of the expenses of the Affiliated MMF. The Affiliated MMF prices its shares with a floating net asset value. In addition, the Board of Trustees of the Affiliated MMF may impose a fee on redemptions (sometimes referred to as a liquidity fee) or temporarily suspend redemptions (sometimes referred to as imposing a redemption gate) in the event its liquidity falls below regulatory limits.
| 30 | Columbia Convertible Securities Fund | Annual Report 2022 |
Notes to Financial Statements (continued)
February 28, 2022
Note 7. Interfund lending
Pursuant to an exemptive order granted by the Securities and Exchange Commission, the Fund participates in a program (the Interfund Program) allowing each participating Columbia Fund (each, a Participating Fund) to lend money directly to and, except for closed-end funds and money market funds, borrow money directly from other Participating Funds for temporary purposes. The amounts eligible for borrowing and lending under the Interfund Program are subject to certain restrictions.
Interfund loans are subject to the risk that the borrowing fund could be unable to repay the loan when due, and a delay in repayment to the lending fund could result in lost opportunities and/or additional lending costs. The exemptive order is subject to conditions intended to mitigate conflicts of interest arising from the Investment Manager’s relationship with each Participating Fund.
The Fund’s activity in the Interfund Program during the year ended February 28, 2022 was as follows:
| Borrower or lender | Average loan
balance ($) | Weighted average
interest rate (%) | Number of days
with outstanding loans |
| Borrower | 3,140,000 | 0.63 | 5 |
| Lender | 200,000 | 0.69 | 1 |
Interest income earned by the Fund is recorded as Interfund lending in the Statement of Operations. The Fund had no outstanding interfund loans at February 28, 2022.
Note 8. Line of credit
The Fund has access to a revolving credit facility with a syndicate of banks led by JPMorgan Chase Bank, N.A., Citibank, N.A. and Wells Fargo Bank, N.A. whereby the Fund may borrow for the temporary funding of shareholder redemptions or for other temporary or emergency purposes. Pursuant to an October 28, 2021 amendment and restatement, the credit facility, which is an agreement between the Fund and certain other funds managed by the Investment Manager or an affiliated investment manager, severally and not jointly, permits aggregate borrowings up to $950 million. Interest is currently charged to each participating fund based on its borrowings at a rate equal to the higher of (i) the federal funds effective rate, (ii) the secured overnight financing rate plus 0.11448% and (iii) the overnight bank funding rate, plus in each case, 1.00%. Each borrowing under the credit facility matures no later than 60 days after the date of borrowing. The Fund also pays a commitment fee equal to its pro rata share of the unused amount of the credit facility at a rate of 0.15% per annum. The commitment fee is included in other expenses in the Statement of Operations. This agreement expires annually in October unless extended or renewed. Prior to the October 28, 2021 amendment and restatement, the Fund had access to a revolving credit facility with a syndicate of banks led by JPMorgan Chase Bank, N.A., Citibank, N.A. and Wells Fargo Bank, N.A. which permitted collective borrowings up to $950 million. Interest was charged to each participating fund based on its borrowings at a rate equal to the higher of (i) the federal funds effective rate, (ii) the one-month London Interbank Offered Rate (LIBOR) rate and (iii) the overnight bank funding rate, plus in each case, 1.25%.
The Fund had no borrowings during the year ended February 28, 2022.
Note 9. Significant risks
Convertible securities risk
Convertible securities are subject to the usual risks associated with debt instruments, such as interest rate risk and credit risk. Convertible securities also react to changes in the value of the common stock into which they convert, and are thus subject to market risk. The Fund may also be forced to convert a convertible security at an inopportune time, which may decrease the Fund’s return.
Columbia Convertible Securities Fund | Annual Report 2022
| 31 |
Notes to Financial Statements (continued)
February 28, 2022
Credit risk
Credit risk is the risk that the value of debt instruments in the Fund’s portfolio may decline because the issuer defaults or otherwise becomes unable or unwilling, or is perceived to be unable or unwilling, to honor its financial obligations, such as making payments to the Fund when due. Credit rating agencies assign credit ratings to certain debt instruments to indicate their credit risk. Lower-rated or unrated debt instruments held by the Fund may present increased credit risk as compared to higher-rated debt instruments.
Interest rate risk
Interest rate risk is the risk of losses attributable to changes in interest rates. In general, if prevailing interest rates rise, the values of debt instruments tend to fall, and if interest rates fall, the values of debt instruments tend to rise. Actions by governments and central banking authorities can result in increases or decreases in interest rates. Higher periods of inflation could lead such authorities to raise interest rates. Increasing interest rates may negatively affect the value of debt securities held by the Fund, resulting in a negative impact on the Fund’s performance and net asset value per share. In general, the longer the maturity or duration of a debt security, the greater its sensitivity to changes in interest rates. The Fund is subject to the risk that the income generated by its investments may not keep pace with inflation.
Liquidity risk
Liquidity risk is the risk associated with a lack of marketability of investments which may make it difficult to sell the investment at a desirable time or price. Changing regulatory, market or other conditions or environments (for example, the interest rate or credit environments) may adversely affect the liquidity of the Fund’s investments. The Fund may have to accept a lower selling price for the holding, sell other investments, or forego another, more appealing investment opportunity. Generally, the less liquid the market at the time the Fund sells a portfolio investment, the greater the risk of loss or decline of value to the Fund. A less liquid market can lead to an increase in Fund redemptions, which may negatively impact Fund performance and net asset value per share, including, for example, if the Fund is forced to sell securities in a down market.
Market risk
The Fund may incur losses due to declines in the value of one or more securities in which it invests. These declines may be due to factors affecting a particular issuer, or the result of, among other things, political, regulatory, market, economic or social developments affecting the relevant market(s) more generally. In addition, turbulence in financial markets and reduced liquidity in equity, credit and/or fixed income markets may negatively affect many issuers, which could adversely affect the Fund, including causing difficulty in assigning prices to hard-to-value assets in thinly traded and closed markets, significant redemptions and operational challenges. Global economies and financial markets are increasingly interconnected, and conditions and events in one country, region or financial market may adversely impact issuers in a different country, region or financial market. These risks may be magnified if certain events or developments adversely interrupt the global supply chain; in these and other circumstances, such risks might affect companies worldwide. As a result, local, regional or global events such as terrorism, war, natural disasters, disease/virus outbreaks and epidemics or other public health issues, recessions, depressions or other events – or the potential for such events – could have a significant negative impact on global economic and market conditions.
The large-scale invasion of Ukraine by Russia in February 2022 has resulted in sanctions and market disruptions, including declines in regional and global stock and commodity markets and significant devaluations of Russian currency. The extent and duration of the military action are impossible to predict but could be significant. Market disruption caused by the Russian military action, and any counter measures or responses thereto (including international sanctions, a downgrade in the country’s credit rating, purchasing and financing restrictions, boycotts, tariffs, changes in consumer or purchaser preferences, cyberattacks and espionage) could have a severe adverse impact on regional and/or global securities and commodities markets, including markets for oil and natural gas. These and other related events could have a negative impact on Fund performance and the value of an investment in the Fund.
The pandemic caused by coronavirus disease 2019 and its variants (COVID-19) has resulted in, and may continue to result in, significant global economic and societal disruption and market volatility due to disruptions in market access, resource availability, facilities operations, imposition of tariffs, export controls and supply chain disruption, among others. Such disruptions may be caused, or exacerbated by, quarantines and travel restrictions, workforce displacement and loss in
| 32 | Columbia Convertible Securities Fund | Annual Report 2022 |
Notes to Financial Statements (continued)
February 28, 2022
human and other resources. The uncertainty surrounding the magnitude, duration, reach, costs and effects of the global pandemic, as well as actions that have been or could be taken by governmental authorities or other third parties, present unknowns that are yet to unfold. The impacts, as well as the uncertainty over impacts to come, of COVID-19 – and any other infectious illness outbreaks, epidemics and pandemics that may arise in the future – could negatively affect global economies and markets in ways that cannot necessarily be foreseen. In addition, the impact of infectious illness outbreaks and epidemics in emerging market countries may be greater due to generally less established healthcare systems, governments and financial markets. Public health crises caused by the COVID-19 outbreak may exacerbate other pre-existing political, social and economic risks in certain countries or globally. The disruptions caused by COVID-19 could prevent the Fund from executing advantageous investment decisions in a timely manner and negatively impact the Fund’s ability to achieve its investment objectives. Any such event(s) could have a significant adverse impact on the value and risk profile of the Fund.
Shareholder concentration risk
At February 28, 2022, one unaffiliated shareholder of record owned 14.8% of the outstanding shares of the Fund in one or more accounts. The Fund has no knowledge about whether any portion of those shares was owned beneficially. Affiliated shareholders of record owned 25.0% of the outstanding shares of the Fund in one or more accounts. Subscription and redemption activity by concentrated accounts may have a significant effect on the operations of the Fund. In the case of a large redemption, the Fund may be forced to sell investments at inopportune times, including its liquid positions, which may result in Fund losses and the Fund holding a higher percentage of less liquid positions. Large redemptions could result in decreased economies of scale and increased operating expenses for non-redeeming Fund shareholders.
Note 10. Subsequent events
Management has evaluated the events and transactions that have occurred through the date the financial statements were issued and noted no items requiring adjustment of the financial statements or additional disclosure.
Note 11. Information regarding pending and settled legal proceedings
Ameriprise Financial and certain of its affiliates are involved in the normal course of business in legal proceedings which include regulatory inquiries, arbitration and litigation, including class actions concerning matters arising in connection with the conduct of its activities as a diversified financial services firm. Ameriprise Financial believes that the Fund is not currently the subject of, and that neither Ameriprise Financial nor any of its affiliates are the subject of, any pending legal, arbitration or regulatory proceedings that are likely to have a material adverse effect on the Fund or the ability of Ameriprise Financial or its affiliates to perform under their contracts with the Fund. Ameriprise Financial is required to make quarterly (10-Q), annual (10-K) and, as necessary, 8-K filings with the Securities and Exchange Commission (SEC) on legal and regulatory matters that relate to Ameriprise Financial and its affiliates. Copies of these filings may be obtained by accessing the SEC website at www.sec.gov.
There can be no assurance that these matters, or the adverse publicity associated with them, will not result in increased Fund redemptions, reduced sale of Fund shares or other adverse consequences to the Fund. Further, although we believe proceedings are not likely to have a material adverse effect on the Fund or the ability of Ameriprise Financial or its affiliates to perform under their contracts with the Fund, these proceedings are subject to uncertainties and, as such, we are unable to estimate the possible loss or range of loss that may result. An adverse outcome in one or more of these proceedings could result in adverse judgments, settlements, fines, penalties or other relief that could have a material adverse effect on the consolidated financial condition or results of operations of Ameriprise Financial or one or more of its affiliates that provides services to the Fund.
Columbia Convertible Securities Fund | Annual Report 2022
| 33 |
Report of Independent Registered Public Accounting Firm
To the Board of Trustees of Columbia Funds Series Trust and Shareholders of Columbia Convertible Securities Fund
Opinion on the Financial Statements
We have audited the accompanying statement of assets and liabilities, including the portfolio of investments, of Columbia Convertible Securities Fund (one of the funds constituting Columbia Funds Series Trust, referred to hereafter as the "Fund") as of February 28, 2022, the related statement of operations for the year ended February 28, 2022, the statement of changes in net assets for each of the two years in the period ended February 28, 2022, including the related notes, and the financial highlights for each of the five years in the period ended February 28, 2022 (collectively referred to as the "financial statements"). In our opinion, the financial statements present fairly, in all material respects, the financial position of the Fund as of February 28, 2022, the results of its operations for the year then ended, the changes in its net assets for each of the two years in the period ended February 28, 2022 and the financial highlights for each of the five years in the period ended February 28, 2022 in conformity with accounting principles generally accepted in the United States of America.
Basis for Opinion
These financial statements are the responsibility of the Fund’s management. Our responsibility is to express an opinion on the Fund’s financial statements based on our audits. We are a public accounting firm registered with the Public Company Accounting Oversight Board (United States) (PCAOB) and are required to be independent with respect to the Fund in accordance with the U.S. federal securities laws and the applicable rules and regulations of the Securities and Exchange Commission and the PCAOB.
We conducted our audits of these financial statements in accordance with the standards of the PCAOB. Those standards require that we plan and perform the audit to obtain reasonable assurance about whether the financial statements are free of material misstatement, whether due to error or fraud.
Our audits included performing procedures to assess the risks of material misstatement of the financial statements, whether due to error or fraud, and performing procedures that respond to those risks. Such procedures included examining, on a test basis, evidence regarding the amounts and disclosures in the financial statements. Our audits also included evaluating the accounting principles used and significant estimates made by management, as well as evaluating the overall presentation of the financial statements. Our procedures included confirmation of securities owned as of February 28, 2022 by correspondence with the custodian, transfer agent and brokers; when replies were not received from brokers, we performed other auditing procedures. We believe that our audits provide a reasonable basis for our opinion.
/s/PricewaterhouseCoopers LLP
Minneapolis, Minnesota
April 21, 2022
We have served as the auditor of one or more investment companies within the Columbia Funds Complex since 1977.
| 34 | Columbia Convertible Securities Fund | Annual Report 2022 |
Federal Income Tax Information
(Unaudited)
The Fund hereby designates the following tax attributes for the fiscal year ended February 28, 2022. Shareholders will be notified in early 2023 of the amounts for use in preparing 2022 income tax returns.
Qualified
dividend
income | Dividends
received
deduction | Section
199A
dividends | Capital
gain
dividend |
| 17.11% | 17.17% | 0.12% | $388,417,477 |
Qualified dividend income. For taxable, non-corporate shareholders, the percentage of ordinary income distributed during the fiscal year that represents qualified dividend income subject to reduced tax rates.
Dividends received deduction. The percentage of ordinary income distributed during the fiscal year that qualifies for the corporate dividends received deduction.
Section 199A dividends. For taxable, non-corporate shareholders, the percentage of ordinary income distributed during the fiscal year that represents Section 199A dividends potentially eligible for a 20% deduction.
Capital gain dividend. The Fund designates as a capital gain dividend the amount reflected above, or if subsequently determined to be different, the net capital gain of such fiscal period.
TRUSTEES AND OFFICERS
The Board oversees the Fund’s operations and appoints officers who are responsible for day-to-day business decisions based on policies set by the Board. The following table provides basic biographical information about the Fund’s Trustees as of the printing of this report, including their principal occupations during the past five years, although specific titles for individuals may have varied over the period. The year set forth beneath Length of Service in the table below is the year in which the Trustee was first appointed or elected as Trustee to any Fund currently in the Columbia Funds Complex or a predecessor thereof. Under current Board policy, each Trustee generally serves until December 31 of the year such Trustee turns seventy-five (75).
Independent trustees
Name,
address,
year of birth | Position held
with the Columbia Funds and
length of service | Principal occupation(s)
during past five years
and other relevant
professional experience | Number of
Funds in the
Columbia Funds
Complex*
overseen | Other directorships
held by Trustee
during the past
five years |
George S. Batejan
c/o Columbia Management
Investment Advisers, LLC
290 Congress Street
Boston, MA 02210
1953 | Trustee since 2017 | Executive Vice President, Global Head of Technology and Operations, Janus Capital Group, Inc., 2010-2016 | 177 | Former Chairman of the Board, NICSA (National Investment Company Services Association) (Executive Committee, Nominating Committee and Governance Committee), 2014-2016; former Director, Intech Investment Management, 2011-2016; former Board Member, Metro Denver Chamber of Commerce, 2015-2016; former Advisory Board Member, University of Colorado Business School, 2015-2018 |
Columbia Convertible Securities Fund | Annual Report 2022
| 35 |
TRUSTEES AND OFFICERS (continued)
Independent trustees (continued)
Name,
address,
year of birth | Position held
with the Columbia Funds and
length of service | Principal occupation(s)
during past five years
and other relevant
professional experience | Number of
Funds in the
Columbia Funds
Complex*
overseen | Other directorships
held by Trustee
during the past
five years |
Kathleen Blatz
c/o Columbia Management
Investment Advisers, LLC
290 Congress Street
Boston, MA 02210
1954 | Trustee since 2006 | Attorney, specializing in arbitration and mediation; Chief Justice, Minnesota Supreme Court, 1998-2006; Associate Justice, Minnesota Supreme Court, 1996-1998; Fourth Judicial District Court Judge, Hennepin County, 1994-1996; Attorney in private practice and public service, 1984-1993; State Representative, Minnesota House of Representatives, 1979-1993, which included service on the Tax and Financial Institutions and Insurance Committees; Member and Interim Chair, Minnesota Sports Facilities Authority, January 2017-July 2017; Interim President and Chief Executive Officer, Blue Cross and Blue Shield of Minnesota (health care insurance), February-July 2018, April-October 2021 | 177 | Former Trustee, Blue Cross and Blue Shield of Minnesota, 2009-2021 (Chair of the Business Development Committee, 2014-2017; Chair of the Governance Committee, 2017-2019); former Member and Chair of the Board, Minnesota Sports Facilities Authority, January 2017-July 2017; former Director, Robina Foundation, 2009-2020 (Chair, 2014-2020); Director, Schulze Family Foundation, since 2021 |
Pamela G. Carlton
c/o Columbia Management
Investment Advisers, LLC
290 Congress Street
Boston, MA 02210
1954 | Trustee since 2007 | President, Springboard — Partners in Cross Cultural Leadership (consulting company) since 2003; Managing Director of US Equity Research, JP Morgan Chase, 1999-2003; Director of US Equity Research, Chase Asset Management, 1996-1999; Co-Director Latin America Research, 1993-1996, COO Global Research, 1992-1996, Co-Director of US Research, 1991-1992, Investment Banker, Morgan Stanley, 1982-1991, Morgan Stanley; Attorney, Cleary Gottlieb Steen & Hamilton LLP, 1980-1982 | 177 | Trustee, New York Presbyterian Hospital Board (Executive Committee and Chair of People Committee) since 1996; Director, DR Bank (Audit Committee) since 2017; Director, Evercore Inc. (Audit Committee) since 2019; Director, Apollo Commercial Real Estate Finance, Inc. since 2021; the Governing Council of the Independent Directors Council (IDC), since 2021 |
Janet Langford Carrig
c/o Columbia Management
Investment Advisers, LLC
290 Congress Street
Boston, MA 02210
1957 | Trustee since 1996 | Senior Vice President, General Counsel and Corporate Secretary, ConocoPhillips (independent energy company), September 2007-October 2018 | 175 | Director, EQT Corporation (natural gas producer) since 2019; Director, Whiting Petroleum Corporation (independent oil and gas company) since 2020 |
J. Kevin Connaughton
c/o Columbia Management
Investment Advisers, LLC
290 Congress Street
Boston, MA 02210
1964 | Trustee since 2020 | Member, FINRA National Adjudicatory Council since January 2020; Adjunct Professor of Finance, Bentley University since January 2018; Consultant to Independent Trustees of CFVIT and CFST I from March 2016 to June 2020 with respect to CFVIT and to December 2020 with respect to CFST I; Managing Director and General Manager of Mutual Fund Products, Columbia Management Investment Advisers, LLC, May 2010-February 2015; President, Columbia Funds, 2008-2015; and senior officer of Columbia Funds and affiliated funds, 2003-2015 | 175 | Former Director, The Autism Project, March 2015-December 2021; former Member of the Investment Committee, St. Michael’s College, November 2015-February 2020; former Trustee, St. Michael’s College, June 2017-September 2019; former Trustee, New Century Portfolios, January 2015-December 2017 |
| 36 | Columbia Convertible Securities Fund | Annual Report 2022 |
TRUSTEES AND OFFICERS (continued)
Independent trustees (continued)
Name,
address,
year of birth | Position held
with the Columbia Funds and
length of service | Principal occupation(s)
during past five years
and other relevant
professional experience | Number of
Funds in the
Columbia Funds
Complex*
overseen | Other directorships
held by Trustee
during the past
five years |
Olive M. Darragh
c/o Columbia Management
Investment Advisers, LLC
290 Congress Street
Boston, MA 02210
1962 | Trustee since 2020 | Managing Director of Darragh Inc. (strategy and talent management consulting firm) since 2010; Founder and CEO, Zolio, Inc. (investment management talent identification platform) since 2004; Consultant to Independent Trustees of CFVIT and CFST I from June 2019 to June 2020 with respect to CFVIT and to December 2020 with respect to CFST I; Partner, Tudor Investments, 2004-2010; Senior Partner, McKinsey & Company (consulting), 1990-2004; Touche Ross CPA, 1985-1988 | 175 | Former Director, University of Edinburgh Business School (Member of US Board); former Director, Boston Public Library Foundation |
Patricia M. Flynn
c/o Columbia Management
Investment Advisers, LLC
290 Congress Street
Boston, MA 02210
1950 | Trustee since 2004 | Trustee Professor of Economics and Management, Bentley University since 1976 (also teaches and conducts research on corporate governance); Dean, McCallum Graduate School of Business, Bentley University, 1992-2002 | 177 | Trustee, MA Taxpayers Foundation since 1997; Board of Governors, Innovation Institute, MA Technology Collaborative, 2010-2020; former Board of Directors, The MA Business Roundtable, 2003-2019 |
Brian J. Gallagher
c/o Columbia Management
Investment Advisers, LLC
290 Congress Street
Boston, MA 02210
1954 | Trustee since 2017 | Retired; Partner with Deloitte & Touche LLP and its predecessors, 1977-2016 | 177 | Trustee, Catholic Schools Foundation since 2004 |
Douglas A. Hacker
c/o Columbia Management
Investment Advisers, LLC
290 Congress Street
Boston, MA 02210
1955 | Co-Chair since 2021; Chair of CFST I and CFVIT since 2014; Trustee of CFST I and CFVIT since 1996 and CFST, CFST II, CFVST II, CET I and CET II since 2021 | Independent business executive since May 2006; Executive Vice President – Strategy of United Airlines, December 2002 - May 2006; President of UAL Loyalty Services (airline marketing company), September 2001-December 2002; Executive Vice President and Chief Financial Officer of United Airlines, July 1999-September 2001 | 177 | Director, Spartan Nash Company (food distributor); Director, Aircastle Limited (Chair of Audit Committee) (aircraft leasing); former Director, Nash Finch Company (food distributor), 2005-2013; former Director, SeaCube Container Leasing Ltd. (container leasing), 2010-2013; and former Director, Travelport Worldwide Limited (travel information technology), 2014-2019 |
Nancy T. Lukitsh
c/o Columbia Management
Investment Advisers, LLC
290 Congress Street
Boston, MA 02210
1956 | Trustee since 2011 | Senior Vice President, Partner and Director of Marketing, Wellington Management Company, LLP (investment adviser), 1997-2010; Chair, Wellington Management Portfolios (commingled non-U.S. investment pools), 2007 -2010; Director, Wellington Trust Company, NA and other Wellington affiliates, 1997-2010 | 175 | None |
Columbia Convertible Securities Fund | Annual Report 2022
| 37 |
TRUSTEES AND OFFICERS (continued)
Independent trustees (continued)
Name,
address,
year of birth | Position held
with the Columbia Funds and
length of service | Principal occupation(s)
during past five years
and other relevant
professional experience | Number of
Funds in the
Columbia Funds
Complex*
overseen | Other directorships
held by Trustee
during the past
five years |
David M. Moffett
c/o Columbia Management
Investment Advisers, LLC
290 Congress Street
Boston, MA 02210
1952 | Trustee since 2011 | Retired; Consultant to Bridgewater and Associates | 175 | Director, CSX Corporation (transportation suppliers); Director, Genworth Financial, Inc. (financial and insurance products and services); Director, PayPal Holdings Inc. (payment and data processing services); Trustee, University of Oklahoma Foundation; former Director, eBay Inc. (online trading community), 2007-2015; and former Director, CIT Bank, CIT Group Inc. (commercial and consumer finance), 2010-2016 |
Catherine James Paglia
c/o Columbia Management
Investment Advisers, LLC
290 Congress Street
Boston, MA 02210
1952 | Co-Chair since 2021; Chair of CFST, CFST II, CFVST II, CET I and CET II since 2020; Trustee of CFST, CFST II and CFVST II since 2004 and CFST I and CFVIT since 2021 | Director, Enterprise Asset Management, Inc. (private real estate and asset management company) since September 1998; Managing Director and Partner, Interlaken Capital, Inc., 1989-1997; Vice President, 1982-1985, Principal, 1985-1987, Managing Director, 1987-1989, Morgan Stanley; Vice President, Investment Banking, 1980-1982, Associate, Investment Banking, 1976-1980, Dean Witter Reynolds, Inc. | 177 | Director, Valmont Industries, Inc. (irrigation systems manufacturer) since 2012; Trustee, Carleton College (on the Investment Committee); Trustee, Carnegie Endowment for International Peace (on the Investment Committee) |
Minor M. Shaw
c/o Columbia Management
Investment Advisers, LLC
290 Congress Street
Boston, MA 02210
1947 | Trustee since 2003 | President, Micco LLC (private investments) since 2011; President, Micco Corp. (family investment business), 1998-2011 | 177 | Director, Blue Cross Blue Shield of South Carolina (Chair of Compensation Committee) since April 2008; Trustee, Hollingsworth Funds (on the Investment Committee) since 2016 (previously Board Chair from 2016-2019); Former Advisory Board member, Duke Energy Corp., 2016-2020; Chair of the Duke Endowment; Chair of Greenville – Spartanburg Airport Commission; former Trustee, BofA Funds Series Trust (11 funds), 2003-2011; former Director, Piedmont Natural Gas, 2004-2016; former Director, National Association of Corporate Directors, Carolinas Chapter, 2013-2018; Chair, Daniel-Mickel Foundation since 1998 |
| 38 | Columbia Convertible Securities Fund | Annual Report 2022 |
TRUSTEES AND OFFICERS (continued)
Independent trustees (continued)
Name,
address,
year of birth | Position held
with the Columbia Funds and
length of service | Principal occupation(s)
during past five years
and other relevant
professional experience | Number of
Funds in the
Columbia Funds
Complex*
overseen | Other directorships
held by Trustee
during the past
five years |
Natalie A. Trunow
c/o Columbia Management
Investment Advisers, LLC
290 Congress Street
Boston, MA 02210
1967 | Trustee since 2020 | Chief Executive Officer, Millennial Portfolio Solutions LLC (asset management and consulting services), January 2016-January 2021; Non-executive Member of the Investment Committee and Valuation Committee, Sarona Asset Management Inc. (private equity firm) since September 2019; Advisor, Horizon Investments (asset management and consulting services), August 2018-January 2021; Advisor, Paradigm Asset Management, November 2016-December 2021; Consultant to Independent Trustees of CFVIT and CFST I from September 2016 to June 2020 with respect to CFVIT and to December 2020 with respect to CFST I; Director of Investments/Consultant, Casey Family Programs, April 2016-November 2016; Senior Vice President and Chief Investment Officer, Calvert Investments, August 2008-January 2016; Section Head and Portfolio Manager, General Motors Asset Management, June 1997-August 2008 | 175 | Former Director, Investment Committee, Health Services for Children with Special Needs, Inc., 2012-2019; Director, Chair of Audit Committee, Consumer Credit Counseling Services (formerly Guidewell Financial Solutions), since 2019; Independent Director, Investment Committee and Valuation Committee, Sarona Asset Management, since 2019 |
Sandra Yeager
c/o Columbia Management
Investment Advisers, LLC
290 Congress Street
Boston, MA 02210
1964 | Trustee since 2017 | Retired; President and founder, Hanoverian Capital, LLC (SEC registered investment advisor firm), 2008-2016; Managing Director, DuPont Capital, 2006-2008; Managing Director, Morgan Stanley Investment Management, 2004-2006; Senior Vice President, Alliance Bernstein, 1990-2004 | 177 | Former Director, NAPE Education Foundation, October 2016-October 2020 |
| * | The term “Columbia Funds Complex” as used herein includes Columbia Seligman Premium Technology Growth Fund, Tri-Continental Corporation and each series of Columbia Fund Series Trust (CFST), Columbia Funds Series Trust I (CFST I), Columbia Funds Series Trust II (CFST II), Columbia ETF Trust I (CET I), Columbia ETF Trust II (CET II), Columbia Funds Variable Insurance Trust (CFVIT) and Columbia Funds Variable Series Trust II (CFVST II). Messrs. Batejan, Beckman, Gallagher and Hacker and Mses. Blatz, Carlton, Flynn, Paglia, Shaw and Yeager serve as Directors of Columbia Seligman Premium Technology Growth Fund and Tri-Continental Corporation. |
Interested trustee affiliated with Investment Manager*
Name,
address,
year of birth | Position held with the Columbia Funds and length of service | Principal occupation(s) during the
past five years and other relevant
professional experience | Number of
Funds in the
Columbia Funds
Complex overseen | Other directorships
held by Trustee
during the past
five years |
Daniel J. Beckman
c/o Columbia Management
Investment Advisers, LLC
290 Congress Street
Boston, MA 02210
1962 | Trustee since November 2021 and President since June 2021 | Vice President – Head of North America Product, Columbia Management Investment Advisers, LLC since April 2015; President and Principal Executive Officer of the Columbia Funds since June 2021; officer of Columbia Funds and affiliated funds, 2020-2021 | 177 | Director, Ameriprise Trust Company, since October 2016; Director, Columbia Management Investment Distributors, Inc. since November 2018; Board of Governors, Columbia Wanger Asset Management, LLC since January 2022 |
| * | Interested person (as defined under the 1940 Act) by reason of being an officer, director, security holder and/or employee of the Investment Manager or Ameriprise Financial. |
The Statement of Additional Information has additional information about the Fund’s Board members and is available, without charge, upon request by calling 800.345.6611, visiting columbiathreadneedleus.com/investor/ or contacting your financial intermediary.
Columbia Convertible Securities Fund | Annual Report 2022
| 39 |
TRUSTEES AND OFFICERS (continued)
The Board has appointed officers who are responsible for day-to-day business decisions based on policies it has established. The officers serve at the pleasure of the Board. The following table provides basic information about the Officers of the Fund as of the printing of this report, including principal occupations during the past five years, although their specific titles may have varied over the period. In addition to Mr. Beckman, who is President and Principal Executive Officer, the Fund’s other officers are:
Fund officers
Name,
address and
year of birth | Position and year
first appointed to
position for any Fund
in the Columbia
Funds Complex or a
predecessor thereof | Principal occupation(s) during past five years |
Michael G. Clarke
290 Congress Street
Boston, MA 02210
1969 | Chief Financial Officer and Principal Financial Officer (2009) and Senior Vice President (2019) | Senior Vice President and Head of Global Operations & Investor Services, Columbia Management Investment Advisers, LLC, since March 2022 (previously Vice President, Head of North American Operations, and Co-Head of Global Operations, June 2019 to February 2022 and Vice President – Accounting and Tax, May 2010 - May 2019); senior officer of Columbia Funds and affiliated funds since 2002. |
Joseph Beranek
5890 Ameriprise
Financial Center
Minneapolis, MN 55474
1965 | Treasurer and Chief Accounting Officer (Principal Accounting Officer) (2019) and Principal Financial Officer (2020), CFST, CFST I, CFST II, CFVIT and CFVST II; Assistant Treasurer, CET I and CET II | Vice President – Mutual Fund Accounting and Financial Reporting, Columbia Management Investment Advisers, LLC, since December 2018 and March 2017, respectively (previously Vice President – Pricing and Corporate Actions, May 2010 - March 2017). |
Marybeth Pilat
290 Congress Street
Boston, MA 02210
1968 | Treasurer and Chief Accounting Officer (Principal Accounting Officer) and Principal Financial Officer (2020) for CET I and CET II; Assistant Treasurer, CFST, CFST I, CFST II, CFVIT and CFVST II | Vice President – Product Pricing and Administration, Columbia Management Investment Advisers, LLC, since May 2017; Director - Fund Administration, Calvert Investments, August 2015 – March 2017; Vice President - Fund Administration, Legg Mason, May 2015 - July 2015; Vice President - Fund Administration, Columbia Management Investment Advisers, LLC, May 2010 - April 2015. |
William F. Truscott
290 Congress Street
Boston, MA 02210
1960 | Senior Vice President (2001) | Formerly, Trustee/Director of Columbia Funds Complex or legacy funds, November 2001-January 1, 2021; Chief Executive Officer, Global Asset Management, Ameriprise Financial, Inc. since September 2012; Chairman of the Board and President, Columbia Management Investment Advisers, LLC since July 2004 and February 2012, respectively; Chairman of the Board and Chief Executive Officer, Columbia Management Investment Distributors, Inc. since November 2008 and February 2012, respectively; Chairman of the Board and Director, Threadneedle Asset Management Holdings, Sàrl since March 2013 and December 2008, respectively; senior executive of various entities affiliated with Columbia Threadneedle. |
Christopher O. Petersen
5228 Ameriprise Financial Center
Minneapolis, MN 55474
1970 | Senior Vice President and Assistant Secretary | Formerly, Trustee/Director of funds within the Columbia Funds Complex, July 1, 2020 - November 22, 2021; Senior Vice President and Assistant General Counsel, Ameriprise Financial, Inc. since September 2021 (previously Vice President and Lead Chief Counsel, January 2015 - September 2021); President and Principal Executive Officer of the Columbia Funds, 2015 - 2021; officer of Columbia Funds and affiliated funds since 2007. |
Thomas P. McGuire
290 Congress Street
Boston, MA 02210
1972 | Senior Vice President and Chief Compliance Officer (2012) | Vice President – Asset Management Compliance, Ameriprise Financial, Inc., since May 2010; Chief Compliance Officer, Columbia Acorn/Wanger Funds since December 2015; Chief Compliance Officer, Ameriprise Certificate Company, September 2010 – September 2020. |
Ryan C. Larrenaga
290 Congress Street
Boston, MA 02210
1970 | Senior Vice President (2017), Chief Legal Officer (2017), and Secretary (2015) | Vice President and Chief Counsel, Ameriprise Financial, Inc. since August 2018 (previously Vice President and Group Counsel, August 2011 - August 2018); Chief Legal Officer, Columbia Acorn/Wanger Funds, since September 2020; officer of Columbia Funds and affiliated funds since 2005. |
| 40 | Columbia Convertible Securities Fund | Annual Report 2022 |
TRUSTEES AND OFFICERS (continued)
Fund officers (continued)
Name,
address and
year of birth | Position and year
first appointed to
position for any Fund
in the Columbia
Funds Complex or a
predecessor thereof | Principal occupation(s) during past five years |
Michael E. DeFao
290 Congress Street
Boston, MA 02210
1968 | Vice President (2011) and Assistant Secretary (2010) | Vice President and Chief Counsel, Ameriprise Financial, Inc. since May 2010; Vice President, Chief Legal Officer and Assistant Secretary, Columbia Management Investment Advisers, LLC since October 2021 (previously Vice President and Assistant Secretary, May 2010 – September 2021). |
Lyn Kephart-Strong
5228 Ameriprise
Financial Center
Minneapolis, MN 55474
1960 | Vice President (2015) | President, Columbia Management Investment Services Corp. since October 2014; Vice President & Resolution Officer, Ameriprise Trust Company since August 2009. |
Columbia Convertible Securities Fund | Annual Report 2022
| 41 |
[THIS PAGE INTENTIONALLY LEFT BLANK]
[THIS PAGE INTENTIONALLY LEFT BLANK]
Columbia Convertible Securities Fund
P.O. Box 219104
Kansas City, MO 64121-9104
Please read and consider the investment objectives, risks, charges and expenses for any fund carefully before investing. For a prospectus and summary prospectus, which contains this and other important information about the Fund, go to
columbiathreadneedleus.com/investor/. The Fund is distributed by Columbia Management Investment Distributors, Inc., member FINRA, and managed by Columbia Management Investment Advisers, LLC.
Columbia Threadneedle Investments (Columbia Threadneedle) is the global brand name of the Columbia and Threadneedle group of companies. All rights reserved.
© 2022 Columbia Management Investment Advisers, LLC.
columbiathreadneedleus.com/investor/

Annual Report
February 28, 2022
Columbia Select Large Cap Equity Fund
Not Federally Insured • No Financial Institution Guarantee • May Lose Value
If you elect to receive the shareholder report for Columbia Select Large Cap Equity Fund (the Fund) in paper, mailed to you, the Fund mails one shareholder report to each shareholder address, unless such shareholder elects to receive shareholder reports from the Fund electronically via e-mail or by having a paper notice mailed to you (Postcard Notice) that your Fund’s shareholder report is available at the Columbia funds’ website (columbiathreadneedleus.com/investor/). If you would like more than one report in paper to be mailed to you, or would like to elect to receive reports via e-mail or access them through Postcard Notice, please call shareholder services at 800.345.6611 and additional reports will be sent to you.
Proxy voting policies and procedures
The policy of the Board of Trustees is to vote the proxies of the companies in which the Fund holds investments consistent with the procedures as stated in the Statement of Additional Information (SAI). You may obtain a copy of the SAI without charge by calling 800.345.6611; contacting your financial intermediary; visiting columbiathreadneedleus.com/investor/; or searching the website of the Securities and Exchange Commission (SEC) at sec.gov. Information regarding how the Fund voted proxies relating to portfolio securities is filed with the SEC by August 31st for the most recent 12-month period ending June 30th of that year, and is available without charge by visiting columbiathreadneedleus.com/investor/, or searching the website of the SEC at sec.gov.
Quarterly schedule of investments
The Fund files a complete schedule of portfolio holdings with the SEC for the first and third quarters of each fiscal year on Form N-PORT. The Fund’s Form N-PORT filings are available on the SEC’s website at sec.gov. The Fund’s complete schedule of portfolio holdings, as filed on Form N-PORT, can also be obtained without charge, upon request, by calling 800.345.6611.
Additional Fund information
For more information about the Fund, please visit columbiathreadneedleus.com/investor/ or call 800.345.6611. Customer Service Representatives are available to answer your questions Monday through Friday from 8 a.m. to 7 p.m. Eastern time.
Fund investment manager
Columbia Management Investment Advisers, LLC (the Investment Manager)
290 Congress Street
Boston, MA 02210
Fund distributor
Columbia Management Investment Distributors, Inc.
290 Congress Street
Boston, MA 02210
Fund transfer agent
Columbia Management Investment Services Corp.
P.O. Box 219104
Kansas City, MO 64121-9104
Columbia Select Large Cap Equity Fund | Annual Report 2022
Investment objective
The Fund seeks long-term capital appreciation.
Portfolio management
Melda Mergen, CFA, CAIA
Co-Portfolio Manager
Managed Fund since 2014
Tiffany Wade
Co-Portfolio Manager
Managed Fund since 2019
Morningstar style boxTM
The Morningstar Style Box is based on a fund’s portfolio holdings. For equity funds, the vertical axis shows the market capitalization of the stocks owned, and the horizontal axis shows investment style (value, blend, or growth). Information shown is based on the most recent data provided by Morningstar.
© 2022 Morningstar, Inc. All rights reserved. The Morningstar information contained herein: (1) is proprietary to Morningstar and/or its content providers; (2) may not be copied or distributed; and (3) is not warranted to be accurate, complete or timely. Neither Morningstar nor its content providers are responsible for any damages or losses arising from any use of this information.
| Average annual total returns (%) (for the period ended February 28, 2022) |
| | | Inception | 1 Year | 5 Years | 10 Years |
| Class A | Excluding sales charges | 08/02/99 | 17.04 | 15.11 | 14.22 |
| | Including sales charges | | 10.34 | 13.76 | 13.54 |
| Advisor Class* | 07/05/17 | 17.31 | 15.39 | 14.49 |
| Class C | Excluding sales charges | 08/02/99 | 16.13 | 14.27 | 13.36 |
| | Including sales charges | | 15.13 | 14.27 | 13.36 |
| Institutional Class | 10/02/98 | 17.28 | 15.41 | 14.50 |
| Institutional 2 Class* | 11/08/12 | 17.45 | 15.49 | 14.60 |
| Institutional 3 Class* | 03/01/17 | 17.40 | 15.56 | 14.57 |
| S&P 500 Index | | 16.39 | 15.17 | 14.59 |
Returns for Class A shares are shown with and without the maximum initial sales charge of 5.75%. Returns for Class C shares are shown with and without the 1.00% contingent deferred sales charge for the first year only. The Fund’s other share classes are not subject to sales charges and have limited eligibility. Please see the Fund’s prospectus for details. Performance for different share classes will vary based on differences in sales charges and fees associated with each share class. All results shown assume reinvestment of distributions during the period. Returns do not reflect the deduction of taxes that a shareholder may pay on Fund distributions or on the redemption of Fund shares. Performance results reflect the effect of any fee waivers or reimbursements of Fund expenses by Columbia Management Investment Advisers, LLC and/or any of its affiliates. Absent these fee waivers or expense reimbursement arrangements, performance results would have been lower.
The performance information shown represents past performance and is not a guarantee of future results. The investment return and principal value of your investment will fluctuate so that your shares, when redeemed, may be worth more or less than their original cost. Current performance may be lower or higher than the performance information shown. You may obtain performance information current to the most recent month-end by contacting your financial intermediary, visiting columbiathreadneedleus.com/investor/ or calling 800.345.6611.
| * | The returns shown for periods prior to the share class inception date (including returns for the Life of the Fund, if shown, which are since Fund inception) include the returns of the Fund’s oldest share class. These returns are adjusted to reflect any higher class-related operating expenses of the newer share classes, as applicable. Please visit columbiathreadneedleus.com/investor/investment-products/mutual-funds/appended-performance for more information. |
The S&P 500 Index, an unmanaged index, measures the performance of 500 widely held, large-capitalization U.S. stocks and is frequently used as a general measure of market performance.
Indices are not available for investment, are not professionally managed and do not reflect sales charges, fees, brokerage commissions, taxes or other expenses of investing. Securities in the Fund may not match those in an index.
Fund performance may be significantly negatively impacted by the economic impact of the COVID-19 pandemic. The COVID-19 pandemic has adversely impacted economies and capital markets around the world in ways that will likely continue and may change in unforeseen ways for an indeterminate period. The COVID-19 pandemic may exacerbate pre-existing political, social and economic risks in certain countries and globally.
Columbia Select Large Cap Equity Fund | Annual Report 2022
| 3 |
Fund at a Glance (continued)
Performance of a hypothetical $10,000 investment (February 29, 2012 — February 28, 2022)
The chart above shows the change in value of a hypothetical $10,000 investment in Class A shares of Columbia Select Large Cap Equity Fund during the stated time period, and does not reflect the deduction of taxes that a shareholder may pay on Fund distributions or on the redemption of Fund shares.
| Portfolio breakdown (%) (at February 28, 2022) |
| Common Stocks | 99.0 |
| Money Market Funds | 1.0 |
| Total | 100.0 |
Percentages indicated are based upon total investments excluding investments in derivatives, if any. The Fund’s portfolio composition is subject to change.
| Equity sector breakdown (%) (at February 28, 2022) |
| Communication Services | 8.9 |
| Consumer Discretionary | 12.5 |
| Consumer Staples | 5.7 |
| Energy | 2.5 |
| Financials | 11.2 |
| Health Care | 13.6 |
| Industrials | 10.0 |
| Information Technology | 30.7 |
| Real Estate | 2.0 |
| Utilities | 2.9 |
| Total | 100.0 |
Percentages indicated are based upon total equity investments. The Fund’s portfolio composition is subject to change.
| 4 | Columbia Select Large Cap Equity Fund | Annual Report 2022 |
Manager Discussion of Fund Performance
At February 28, 2022, approximately 48.49% of the Fund’s shares were owned in the aggregate by affiliated funds-of-funds managed by Columbia Management Investment Advisers, LLC (the Investment Manager). As a result of asset allocation decisions by the Investment Manager, it is possible that the Fund may experience relatively large purchases or redemptions from affiliated funds-of-funds. The Investment Manager seeks to minimize the impact of these transactions by structuring them over a reasonable period of time. The Fund may experience increased expenses as it buys and sells securities as a result of purchases or redemptions by affiliated funds-of-funds.
For the 12-month period that ended February 28, 2022, Class A shares of Columbia Select Large Cap Equity Fund returned 17.04% excluding sales charges. The Fund outperformed its benchmark, the S&P 500 Index, which returned 16.39% for the same time period.
Market overview
U.S. equities posted gains through much of the 12-month period that ended February 28, 2022. As pandemic-related restrictions were eased, robust economic growth and corporate earnings drove gains for stocks. Both U.S. monetary and fiscal policy were highly supportive, as Congress approved massive spending packages that included direct payments to citizens and the U.S. Federal Reserve (Fed) maintained its benchmark overnight lending rate near zero while engaging in bond market purchases to keep longer term borrowing costs low. The fourth quarter of 2021 saw the Fed adopt a more hawkish tone in response to persistently high inflation, driven in large part by supply chain constraints and rising commodity prices, which led to increased market volatility. The first two months of 2022 brought a rocky start, with most major indices returning in negative territory as markets grappled with individual stock volatility, the number and timing of interest rate hikes by the Fed, inflation and geopolitical tensions. Of most significance, tensions between Russia and Ukraine near the end of the period, and the subsequent invasion of Ukraine by Russia on February 24, 2022, roiled global markets and drove significant sell-offs.
All eleven sectors within the benchmark delivered positive gains for the 12-month period. The energy, real estate, consumer staples, financials, utilities, information technology and health care sectors delivered the strongest gains, outperforming the overall benchmark’s return for the period. The communication services sector lagged most for the benchmark, followed by the consumer discretionary, industrials and materials sectors.
The Fund’s notable contributors during the period
| • | Stock selection drove the Fund’s outperformance of its benchmark during the period, particularly within the information technology and communication services sectors. |
| • | Within information technology, Fund positions in semiconductor manufacturer NVIDIA Corp., cybersecurity company Palo Alto Networks, Inc., software giant Microsoft Corp. and networking firm Cisco Systems, Inc. contributed most to results. Not owning benchmark constituents PayPal Holdings and Intel also contributed to relative returns, as both companies experienced negative total returns for the period. |
| • | Within communication services, which was the weakest performing sector in the benchmark during the period, the Fund benefited from its position in Google parent Alphabet, Inc., which posted strong returns as well as not owning several names that weighed on the benchmark, including Meta Platforms, Walt Disney and Netflix. |
| • | Other individual top contributors included oil and gas company ConocoPhillips Co., aerospace and defense company Raytheon Technologies Corp. and health benefits company Anthem, Inc. |
The Fund’s notable detractors during the period
| • | Stock selection within the consumer discretionary and health care sectors detracted the most relative to the benchmark during the period, with the Fund underperforming the benchmark in both areas. |
| • | Within consumer discretionary, the Fund’s holding in retailer Gap, Inc. and the Fund’s underweight in electric vehicle company Tesla Motors, Inc. were among the Fund’s top individual detractors during the period. We exited its position in Gap in the second half of the period. |
Columbia Select Large Cap Equity Fund | Annual Report 2022
| 5 |
Manager Discussion of Fund Performance (continued)
| • | Medical devices company Medtronic PLC and medical diagnostics company Exact Sciences Corp. were among the Fund’s top detractors within the health care sector. Both positions were sold during the period. |
| • | Southwest Airlines Co., in the industrials sector, also weighed on results versus the benchmark. The Fund’s position was sold. |
| • | Within the communication services sector, media and communications company Comcast Corp. delivered negative results for the Fund. |
Market risk may affect a single issuer, sector of the economy, industry or the market as a whole. Growth securities, at times, may not perform as well as value securities or the stock market in general and may be out of favor with investors. Value securities may be unprofitable if the market fails to recognize their intrinsic worth or the portfolio manager misgauged that worth. Foreign investments subject the Fund to risks, including political, economic, market, social and others within a particular country, as well as to currency instabilities and less stringent financial and accounting standards generally applicable to U.S. issuers. Investments in a limited number of companies or sectors subject the Fund to greater risk of loss. The Fund may invest significantly in issuers within a particular sector, which may be negatively affected by market, economic or other conditions, making the Fund more vulnerable to unfavorable developments in the sector. Investing in derivatives is a specialized activity that involves special risks, which may result in significant losses. See the Fund’s prospectus for more information on these and other risks.
The views expressed in this report reflect the current views of the respective parties who have contributed to this report. These views are not guarantees of future performance and involve certain risks, uncertainties and assumptions that are difficult to predict, so actual outcomes and results may differ significantly from the views expressed. These views are subject to change at any time based upon economic, market or other conditions and the respective parties disclaim any responsibility to update such views. These views may not be relied on as investment advice and, because investment decisions for a Columbia fund are based on numerous factors, may not be relied on as an indication of trading intent on behalf of any particular Columbia fund. References to specific securities should not be construed as a recommendation or investment advice.
| 6 | Columbia Select Large Cap Equity Fund | Annual Report 2022 |
Understanding Your Fund’s Expenses
(Unaudited)
As an investor, you incur two types of costs. There are shareholder transaction costs, which generally include sales charges on purchases and may include redemption fees. There are also ongoing fund costs, which generally include management fees, distribution and/or service fees, and other fund expenses. The following information is intended to help you understand your ongoing costs (in dollars) of investing in the Fund and to help you compare these costs with the ongoing costs of investing in other mutual funds.
Analyzing your Fund’s expenses
To illustrate these ongoing costs, we have provided examples and calculated the expenses paid by investors in each share class of the Fund during the period. The actual and hypothetical information in the table is based on an initial investment of $1,000 at the beginning of the period indicated and held for the entire period. Expense information is calculated two ways and each method provides you with different information. The amount listed in the “Actual” column is calculated using the Fund’s actual operating expenses and total return for the period. You may use the Actual information, together with the amount invested, to estimate the expenses that you paid over the period. Simply divide your account value by $1,000 (for example, an $8,600 account value divided by $1,000 = 8.6), then multiply the results by the expenses paid during the period under the “Actual” column. The amount listed in the “Hypothetical” column assumes a 5% annual rate of return before expenses (which is not the Fund’s actual return) and then applies the Fund’s actual expense ratio for the period to the hypothetical return. You should not use the hypothetical account values and expenses to estimate either your actual account balance at the end of the period or the expenses you paid during the period. See “Compare with other funds” below for details on how to use the hypothetical data.
Compare with other funds
Since all mutual funds are required to include the same hypothetical calculations about expenses in shareholder reports, you can use this information to compare the ongoing cost of investing in the Fund with other funds. To do so, compare the hypothetical example with the 5% hypothetical examples that appear in the shareholder reports of other funds. As you compare hypothetical examples of other funds, it is important to note that hypothetical examples are meant to highlight the ongoing costs of investing in a fund only and do not reflect any transaction costs, such as sales charges, or redemption or exchange fees. Therefore, the hypothetical calculations are useful in comparing ongoing costs only, and will not help you determine the relative total costs of owning different funds. If transaction costs were included in these calculations, your costs would be higher.
| September 1, 2021 — February 28, 2022 |
| | Account value at the
beginning of the
period ($) | Account value at the
end of the
period ($) | Expenses paid during
the period ($) | Fund’s annualized
expense ratio (%) |
| | Actual | Hypothetical | Actual | Hypothetical | Actual | Hypothetical | Actual |
| Class A | 1,000.00 | 1,000.00 | 973.10 | 1,020.83 | 3.91 | 4.01 | 0.80 |
| Advisor Class | 1,000.00 | 1,000.00 | 974.10 | 1,022.07 | 2.69 | 2.76 | 0.55 |
| Class C | 1,000.00 | 1,000.00 | 969.60 | 1,017.11 | 7.57 | 7.75 | 1.55 |
| Institutional Class | 1,000.00 | 1,000.00 | 973.70 | 1,022.07 | 2.69 | 2.76 | 0.55 |
| Institutional 2 Class | 1,000.00 | 1,000.00 | 974.70 | 1,022.46 | 2.30 | 2.36 | 0.47 |
| Institutional 3 Class | 1,000.00 | 1,000.00 | 974.70 | 1,022.66 | 2.11 | 2.16 | 0.43 |
Expenses paid during the period are equal to the annualized expense ratio for each class as indicated above, multiplied by the average account value over the period and then multiplied by the number of days in the Fund’s most recent fiscal half year and divided by 365.
Expenses do not include fees and expenses incurred indirectly by the Fund from its investment in underlying funds, including affiliated and non-affiliated pooled investment vehicles, such as mutual funds and exchange-traded funds.
Had Columbia Management Investment Advisers, LLC and/or certain of its affiliates not waived/reimbursed certain fees and expenses, account value at the end of the period would have been reduced.
Columbia Select Large Cap Equity Fund | Annual Report 2022
| 7 |
Portfolio of Investments
February 28, 2022
(Percentages represent value of investments compared to net assets)
Investments in securities
| Common Stocks 98.3% |
| Issuer | Shares | Value ($) |
| Communication Services 8.8% |
| Entertainment 1.3% |
| Electronic Arts, Inc. | 133,503 | 17,367,405 |
| Interactive Media & Services 5.6% |
| Alphabet, Inc., Class C(a) | 28,322 | 76,407,658 |
| Media 1.9% |
| Comcast Corp., Class A | 550,980 | 25,763,825 |
| Total Communication Services | 119,538,888 |
| Consumer Discretionary 12.2% |
| Auto Components 0.5% |
| Aptiv PLC(a) | 52,400 | 6,782,656 |
| Automobiles 1.6% |
| General Motors Co.(a) | 337,984 | 15,790,613 |
| Tesla Motors, Inc.(a) | 6,556 | 5,706,539 |
| Total | | 21,497,152 |
| Hotels, Restaurants & Leisure 1.1% |
| Hilton Worldwide Holdings, Inc.(a) | 106,322 | 15,827,093 |
| Internet & Direct Marketing Retail 4.7% |
| Amazon.com, Inc.(a) | 20,935 | 64,296,828 |
| Multiline Retail 1.3% |
| Target Corp. | 86,685 | 17,317,062 |
| Specialty Retail 3.0% |
| Home Depot, Inc. (The) | 77,339 | 24,425,976 |
| TJX Companies, Inc. (The) | 246,789 | 16,312,753 |
| Total | | 40,738,729 |
| Total Consumer Discretionary | 166,459,520 |
| Consumer Staples 5.6% |
| Food Products 1.6% |
| Mondelez International, Inc., Class A | 335,535 | 21,970,832 |
| Household Products 2.3% |
| Procter & Gamble Co. (The) | 197,372 | 30,768,321 |
| Tobacco 1.7% |
| Philip Morris International, Inc. | 228,214 | 23,065,589 |
| Total Consumer Staples | 75,804,742 |
| Common Stocks (continued) |
| Issuer | Shares | Value ($) |
| Energy 2.5% |
| Oil, Gas & Consumable Fuels 2.5% |
| ConocoPhillips Co. | 204,343 | 19,383,977 |
| Valero Energy Corp. | 174,742 | 14,592,704 |
| Total | | 33,976,681 |
| Total Energy | 33,976,681 |
| Financials 11.0% |
| Banks 3.1% |
| Bank of America Corp. | 721,493 | 31,889,991 |
| Popular, Inc. | 119,512 | 10,977,177 |
| Total | | 42,867,168 |
| Capital Markets 6.2% |
| Charles Schwab Corp. (The) | 209,809 | 17,720,468 |
| Morgan Stanley | 263,078 | 23,871,698 |
| S&P Global, Inc. | 55,535 | 20,864,499 |
| State Street Corp. | 249,631 | 21,301,013 |
| Total | | 83,757,678 |
| Insurance 1.7% |
| MetLife, Inc. | 340,452 | 22,997,533 |
| Total Financials | 149,622,379 |
| Health Care 13.4% |
| Biotechnology 3.0% |
| AbbVie, Inc. | 167,547 | 24,758,420 |
| BioMarin Pharmaceutical, Inc.(a) | 89,937 | 7,025,879 |
| Vertex Pharmaceuticals, Inc.(a) | 40,958 | 9,421,159 |
| Total | | 41,205,458 |
| Health Care Equipment & Supplies 1.7% |
| Stryker Corp. | 86,579 | 22,800,579 |
| Health Care Providers & Services 1.9% |
| Anthem, Inc. | 56,499 | 25,529,073 |
| Life Sciences Tools & Services 2.7% |
| Danaher Corp. | 68,255 | 18,729,855 |
| IQVIA Holdings, Inc.(a) | 77,943 | 17,936,243 |
| Total | | 36,666,098 |
The accompanying Notes to Financial Statements are an integral part of this statement.
| 8 | Columbia Select Large Cap Equity Fund | Annual Report 2022 |
Portfolio of Investments (continued)
February 28, 2022
| Common Stocks (continued) |
| Issuer | Shares | Value ($) |
| Pharmaceuticals 4.1% |
| Eli Lilly & Co. | 88,945 | 22,231,803 |
| Johnson & Johnson | 206,614 | 34,002,466 |
| Total | | 56,234,269 |
| Total Health Care | 182,435,477 |
| Industrials 9.8% |
| Aerospace & Defense 1.7% |
| Raytheon Technologies Corp. | 220,317 | 22,626,556 |
| Air Freight & Logistics 1.4% |
| United Parcel Service, Inc., Class B | 92,617 | 19,488,469 |
| Building Products 1.1% |
| Trane Technologies PLC | 98,198 | 15,115,618 |
| Commercial Services & Supplies 1.1% |
| Cintas Corp. | 39,388 | 14,783,104 |
| Construction & Engineering 0.7% |
| MasTec, Inc.(a) | 123,983 | 9,764,901 |
| Electrical Equipment 1.2% |
| AMETEK, Inc. | 123,283 | 16,000,901 |
| Machinery 1.1% |
| Parker-Hannifin Corp. | 51,133 | 15,155,310 |
| Road & Rail 1.5% |
| Union Pacific Corp. | 83,975 | 20,653,651 |
| Total Industrials | 133,588,510 |
| Information Technology 30.2% |
| Communications Equipment 1.8% |
| Cisco Systems, Inc. | 447,122 | 24,935,994 |
| Electronic Equipment, Instruments & Components 1.2% |
| TE Connectivity Ltd. | 114,891 | 16,363,925 |
| IT Services 2.3% |
| MasterCard, Inc., Class A | 84,644 | 30,541,248 |
| Semiconductors & Semiconductor Equipment 6.7% |
| Applied Materials, Inc. | 130,931 | 17,570,940 |
| Broadcom, Inc. | 40,990 | 24,079,166 |
| NVIDIA Corp. | 114,052 | 27,811,580 |
| QUALCOMM, Inc. | 124,655 | 21,439,414 |
| Total | | 90,901,100 |
| Common Stocks (continued) |
| Issuer | Shares | Value ($) |
| Software 12.9% |
| Adobe, Inc.(a) | 49,158 | 22,990,213 |
| Intuit, Inc. | 34,659 | 16,441,190 |
| Microsoft Corp. | 331,272 | 98,980,761 |
| Palo Alto Networks, Inc.(a) | 30,862 | 18,339,743 |
| ServiceNow, Inc.(a) | 33,079 | 19,183,174 |
| Total | | 175,935,081 |
| Technology Hardware, Storage & Peripherals 5.3% |
| Apple, Inc.(b) | 437,404 | 72,224,149 |
| Total Information Technology | 410,901,497 |
| Real Estate 2.0% |
| Equity Real Estate Investment Trusts (REITS) 2.0% |
| Extra Space Storage, Inc. | 75,905 | 14,281,526 |
| Invitation Homes, Inc. | 333,831 | 12,618,812 |
| Total | | 26,900,338 |
| Total Real Estate | 26,900,338 |
| Utilities 2.8% |
| Multi-Utilities 2.8% |
| Ameren Corp. | 213,833 | 18,378,947 |
| DTE Energy Co. | 161,875 | 19,682,381 |
| Total | | 38,061,328 |
| Total Utilities | 38,061,328 |
Total Common Stocks
(Cost $916,552,157) | 1,337,289,360 |
|
| Money Market Funds 1.0% |
| | Shares | Value ($) |
| Columbia Short-Term Cash Fund, 0.168%(c),(d) | 13,303,601 | 13,299,610 |
Total Money Market Funds
(Cost $13,298,446) | 13,299,610 |
Total Investments in Securities
(Cost: $929,850,603) | 1,350,588,970 |
| Other Assets & Liabilities, Net | | 8,960,366 |
| Net Assets | 1,359,549,336 |
The accompanying Notes to Financial Statements are an integral part of this statement.
Columbia Select Large Cap Equity Fund | Annual Report 2022
| 9 |
Portfolio of Investments (continued)
February 28, 2022
At February 28, 2022, securities and/or cash totaling $1,073,280 were pledged as collateral.
Investments in derivatives
| Long futures contracts |
| Description | Number of
contracts | Expiration
date | Trading
currency | Notional
amount | Value/Unrealized
appreciation ($) | Value/Unrealized
depreciation ($) |
| S&P 500 Index E-mini | 50 | 03/2022 | USD | 10,920,000 | — | (177,632) |
Notes to Portfolio of Investments
| (a) | Non-income producing investment. |
| (b) | This security or a portion of this security has been pledged as collateral in connection with derivative contracts. |
| (c) | The rate shown is the seven-day current annualized yield at February 28, 2022. |
| (d) | As defined in the Investment Company Act of 1940, as amended, an affiliated company is one in which the Fund owns 5% or more of the company’s outstanding voting securities, or a company which is under common ownership or control with the Fund. The value of the holdings and transactions in these affiliated companies during the year ended February 28, 2022 are as follows: |
| Affiliated issuers | Beginning
of period($) | Purchases($) | Sales($) | Net change in
unrealized
appreciation
(depreciation)($) | End of
period($) | Realized gain
(loss)($) | Dividends($) | End of
period shares |
| Columbia Short-Term Cash Fund, 0.168% |
| | 28,706,905 | 313,579,677 | (328,987,885) | 913 | 13,299,610 | (5,285) | 11,782 | 13,303,601 |
Currency Legend
Fair value measurements
The Fund categorizes its fair value measurements according to a three-level hierarchy that maximizes the use of observable inputs and minimizes the use of unobservable inputs by prioritizing that the most observable input be used when available. Observable inputs are those that market participants would use in pricing an investment based on market data obtained from sources independent of the reporting entity. Unobservable inputs are those that reflect the Fund’s assumptions about the information market participants would use in pricing an investment. An investment’s level within the fair value hierarchy is based on the lowest level of any input that is deemed significant to the asset’s or liability’s fair value measurement. The input levels are not necessarily an indication of the risk or liquidity associated with investments at that level. For example, certain U.S. government securities are generally high quality and liquid, however, they are reflected as Level 2 because the inputs used to determine fair value may not always be quoted prices in an active market.
Fair value inputs are summarized in the three broad levels listed below:
| ■ | Level 1 — Valuations based on quoted prices for investments in active markets that the Fund has the ability to access at the measurement date. Valuation adjustments are not applied to Level 1 investments. |
| ■ | Level 2 — Valuations based on other significant observable inputs (including quoted prices for similar securities, interest rates, prepayment speeds, credit risks, etc.). |
| ■ | Level 3 — Valuations based on significant unobservable inputs (including the Fund’s own assumptions and judgment in determining the fair value of investments). |
Inputs that are used in determining fair value of an investment may include price information, credit data, volatility statistics, and other factors. These inputs can be either observable or unobservable. The availability of observable inputs can vary between investments, and is affected by various factors such as the type of investment, and the volume and level of activity for that investment or similar investments in the marketplace. The inputs will be considered by the Investment Manager, along with any other relevant factors in the calculation of an investment’s fair value. The Fund uses prices and inputs that are current as of the measurement date, which may include periods of market dislocations. During these periods, the availability of prices and inputs may be reduced for many investments. This condition could cause an investment to be reclassified between the various levels within the hierarchy.
Investments falling into the Level 3 category are primarily supported by quoted prices from brokers and dealers participating in the market for those investments. However, these may be classified as Level 3 investments due to lack of market transparency and corroboration to support these quoted prices. Additionally, valuation models may be used as the pricing source for any remaining investments classified as Level 3. These models may rely on one or more significant unobservable inputs and/or significant assumptions by the Investment Manager. Inputs used in valuations may include, but are not limited to, financial statement analysis, capital account balances, discount rates and estimated cash flows, and comparable company data.
Under the direction of the Fund’s Board of Trustees (the Board), the Investment Manager’s Valuation Committee (the Committee) is responsible for overseeing the valuation procedures approved by the Board. The Committee consists of voting and non-voting members from various groups within the Investment Manager’s organization, including operations and accounting, trading and investments, compliance, risk management and legal.
The Committee meets at least monthly to review and approve valuation matters, which may include a description of specific valuation determinations, data regarding pricing information received from approved pricing vendors and brokers and the results of Board-approved valuation control policies and procedures (the Policies). The Policies address, among other things, instances when market quotations are or are not readily available, including recommendations of third party pricing vendors and a determination of appropriate pricing methodologies; events that require specific valuation determinations and assessment of fair value techniques; securities with a potential for stale pricing, including those that are illiquid, restricted, or in default; and the effectiveness of third party pricing vendors, including periodic reviews of vendors. The Committee meets more frequently, as needed, to discuss
The accompanying Notes to Financial Statements are an integral part of this statement.
| 10 | Columbia Select Large Cap Equity Fund | Annual Report 2022 |
Portfolio of Investments (continued)
February 28, 2022
Fair value measurements (continued)
additional valuation matters, which may include the need to review back-testing results, review time-sensitive information or approve related valuation actions. The Committee reports to the Board, with members of the Committee meeting with the Board at each of its regularly scheduled meetings to discuss valuation matters and actions during the period, similar to those described earlier.
The following table is a summary of the inputs used to value the Fund’s investments at February 28, 2022:
| | Level 1 ($) | Level 2 ($) | Level 3 ($) | Total ($) |
| Investments in Securities | | | | |
| Common Stocks | | | | |
| Communication Services | 119,538,888 | — | — | 119,538,888 |
| Consumer Discretionary | 166,459,520 | — | — | 166,459,520 |
| Consumer Staples | 75,804,742 | — | — | 75,804,742 |
| Energy | 33,976,681 | — | — | 33,976,681 |
| Financials | 149,622,379 | — | — | 149,622,379 |
| Health Care | 182,435,477 | — | — | 182,435,477 |
| Industrials | 133,588,510 | — | — | 133,588,510 |
| Information Technology | 410,901,497 | — | — | 410,901,497 |
| Real Estate | 26,900,338 | — | — | 26,900,338 |
| Utilities | 38,061,328 | — | — | 38,061,328 |
| Total Common Stocks | 1,337,289,360 | — | — | 1,337,289,360 |
| Money Market Funds | 13,299,610 | — | — | 13,299,610 |
| Total Investments in Securities | 1,350,588,970 | — | — | 1,350,588,970 |
| Investments in Derivatives | | | | |
| Liability | | | | |
| Futures Contracts | (177,632) | — | — | (177,632) |
| Total | 1,350,411,338 | — | — | 1,350,411,338 |
See the Portfolio of Investments for all investment classifications not indicated in the table.
Derivative instruments are valued at unrealized appreciation (depreciation).
The accompanying Notes to Financial Statements are an integral part of this statement.
Columbia Select Large Cap Equity Fund | Annual Report 2022
| 11 |
Statement of Assets and Liabilities
February 28, 2022
| Assets | |
| Investments in securities, at value | |
| Unaffiliated issuers (cost $916,552,157) | $1,337,289,360 |
| Affiliated issuers (cost $13,298,446) | 13,299,610 |
| Receivable for: | |
| Investments sold | 7,848,988 |
| Capital shares sold | 301,885 |
| Dividends | 1,493,604 |
| Expense reimbursement due from Investment Manager | 36,380 |
| Prepaid expenses | 13,150 |
| Total assets | 1,360,282,977 |
| Liabilities | |
| Payable for: | |
| Capital shares purchased | 347,796 |
| Variation margin for futures contracts | 30,000 |
| Management services fees | 81,452 |
| Distribution and/or service fees | 5,583 |
| Transfer agent fees | 66,232 |
| Compensation of board members | 174,233 |
| Compensation of chief compliance officer | 223 |
| Other expenses | 28,122 |
| Total liabilities | 733,641 |
| Net assets applicable to outstanding capital stock | $1,359,549,336 |
| Represented by | |
| Paid in capital | 878,189,026 |
| Total distributable earnings (loss) | 481,360,310 |
| Total - representing net assets applicable to outstanding capital stock | $1,359,549,336 |
| Class A | |
| Net assets | $235,275,831 |
| Shares outstanding | 12,509,450 |
| Net asset value per share | $18.81 |
| Maximum sales charge | 5.75% |
| Maximum offering price per share (calculated by dividing the net asset value per share by 1.0 minus the maximum sales charge for Class A shares) | $19.96 |
| Advisor Class | |
| Net assets | $1,932,163 |
| Shares outstanding | 104,248 |
| Net asset value per share | $18.53 |
| Class C | |
| Net assets | $8,739,142 |
| Shares outstanding | 520,862 |
| Net asset value per share | $16.78 |
| Institutional Class | |
| Net assets | $214,099,604 |
| Shares outstanding | 11,489,175 |
| Net asset value per share | $18.63 |
| Institutional 2 Class | |
| Net assets | $198,954,965 |
| Shares outstanding | 10,284,259 |
| Net asset value per share | $19.35 |
| Institutional 3 Class | |
| Net assets | $700,547,631 |
| Shares outstanding | 38,276,309 |
| Net asset value per share | $18.30 |
The accompanying Notes to Financial Statements are an integral part of this statement.
| 12 | Columbia Select Large Cap Equity Fund | Annual Report 2022 |
Statement of Operations
Year Ended February 28, 2022
| Net investment income | |
| Income: | |
| Dividends — unaffiliated issuers | $18,484,591 |
| Dividends — affiliated issuers | 11,782 |
| Interfund lending | 167 |
| Foreign taxes withheld | (54,801) |
| Total income | 18,441,739 |
| Expenses: | |
| Management services fees | 10,024,393 |
| Distribution and/or service fees | |
| Class A | 607,933 |
| Class C | 85,054 |
| Transfer agent fees | |
| Class A | 313,807 |
| Advisor Class | 2,854 |
| Class C | 10,973 |
| Institutional Class | 275,676 |
| Institutional 2 Class | 89,463 |
| Institutional 3 Class | 40,388 |
| Compensation of board members | 54,347 |
| Custodian fees | 11,371 |
| Printing and postage fees | 31,992 |
| Registration fees | 103,159 |
| Audit fees | 29,500 |
| Legal fees | 25,731 |
| Interest on collateral | 345 |
| Compensation of chief compliance officer | 216 |
| Other | 26,367 |
| Total expenses | 11,733,569 |
| Fees waived or expenses reimbursed by Investment Manager and its affiliates | (4,584,489) |
| Expense reduction | (560) |
| Total net expenses | 7,148,520 |
| Net investment income | 11,293,219 |
| Realized and unrealized gain (loss) — net | |
| Net realized gain (loss) on: | |
| Investments — unaffiliated issuers | 113,608,409 |
| Investments — affiliated issuers | (5,285) |
| Futures contracts | 2,792,280 |
| Net realized gain | 116,395,404 |
| Net change in unrealized appreciation (depreciation) on: | |
| Investments — unaffiliated issuers | 84,088,288 |
| Investments — affiliated issuers | 913 |
| Futures contracts | 309,490 |
| Net change in unrealized appreciation (depreciation) | 84,398,691 |
| Net realized and unrealized gain | 200,794,095 |
| Net increase in net assets resulting from operations | $212,087,314 |
The accompanying Notes to Financial Statements are an integral part of this statement.
Columbia Select Large Cap Equity Fund | Annual Report 2022
| 13 |
Statement of Changes in Net Assets
| | Year Ended
February 28, 2022 | Year Ended
February 28, 2021 |
| Operations | | |
| Net investment income | $11,293,219 | $10,317,430 |
| Net realized gain | 116,395,404 | 66,723,980 |
| Net change in unrealized appreciation (depreciation) | 84,398,691 | 166,814,171 |
| Net increase in net assets resulting from operations | 212,087,314 | 243,855,581 |
| Distributions to shareholders | | |
| Net investment income and net realized gains | | |
| Class A | (17,789,878) | (13,886,746) |
| Advisor Class | (174,654) | (98,725) |
| Class C | (637,088) | (537,915) |
| Institutional Class | (16,826,301) | (11,261,374) |
| Institutional 2 Class | (12,046,628) | (5,423,544) |
| Institutional 3 Class | (57,623,422) | (34,366,164) |
| Total distributions to shareholders | (105,097,971) | (65,574,468) |
| Increase in net assets from capital stock activity | 31,469,851 | 365,045,971 |
| Total increase in net assets | 138,459,194 | 543,327,084 |
| Net assets at beginning of year | 1,221,090,142 | 677,763,058 |
| Net assets at end of year | $1,359,549,336 | $1,221,090,142 |
The accompanying Notes to Financial Statements are an integral part of this statement.
| 14 | Columbia Select Large Cap Equity Fund | Annual Report 2022 |
Statement of Changes in Net Assets (continued)
| | Year Ended | Year Ended |
| | February 28, 2022 | February 28, 2021 |
| | Shares | Dollars ($) | Shares | Dollars ($) |
| Capital stock activity |
| Class A | | | | |
| Subscriptions | 1,275,138 | 24,825,167 | 2,634,765 | 39,435,220 |
| Distributions reinvested | 338,444 | 6,673,124 | 322,834 | 5,048,030 |
| Redemptions | (1,605,606) | (31,071,032) | (1,408,709) | (21,385,270) |
| Net increase | 7,976 | 427,259 | 1,548,890 | 23,097,980 |
| Advisor Class | | | | |
| Subscriptions | 57,976 | 1,077,177 | 87,383 | 1,328,743 |
| Distributions reinvested | 8,984 | 174,378 | 6,288 | 98,506 |
| Redemptions | (61,135) | (1,178,243) | (229,948) | (3,191,942) |
| Net increase (decrease) | 5,825 | 73,312 | (136,277) | (1,764,693) |
| Class C | | | | |
| Subscriptions | 105,380 | 1,870,662 | 133,822 | 1,686,630 |
| Distributions reinvested | 31,956 | 563,770 | 33,333 | 469,014 |
| Redemptions | (110,967) | (1,935,215) | (140,027) | (1,887,046) |
| Net increase | 26,369 | 499,217 | 27,128 | 268,598 |
| Institutional Class | | | | |
| Subscriptions | 2,429,962 | 46,730,851 | 1,941,261 | 29,312,136 |
| Distributions reinvested | 807,948 | 15,787,253 | 665,332 | 10,341,642 |
| Redemptions | (1,642,468) | (31,747,662) | (1,624,633) | (24,722,844) |
| Net increase | 1,595,442 | 30,770,442 | 981,960 | 14,930,934 |
| Institutional 2 Class | | | | |
| Subscriptions | 5,530,357 | 109,586,321 | 6,299,742 | 104,004,042 |
| Distributions reinvested | 592,170 | 12,046,628 | 327,061 | 5,423,544 |
| Redemptions | (1,597,524) | (32,564,052) | (2,425,693) | (40,064,935) |
| Net increase | 4,525,003 | 89,068,897 | 4,201,110 | 69,362,651 |
| Institutional 3 Class | | | | |
| Subscriptions | 2,765,887 | 53,592,290 | 20,553,142 | 316,958,657 |
| Distributions reinvested | 2,732,037 | 52,418,462 | 1,835,143 | 27,989,030 |
| Redemptions | (10,204,800) | (195,380,028) | (5,667,507) | (85,797,186) |
| Net increase (decrease) | (4,706,876) | (89,369,276) | 16,720,778 | 259,150,501 |
| Total net increase | 1,453,739 | 31,469,851 | 23,343,589 | 365,045,971 |
The accompanying Notes to Financial Statements are an integral part of this statement.
Columbia Select Large Cap Equity Fund | Annual Report 2022
| 15 |
The following table is intended to help you understand the Fund’s financial performance. Certain information reflects financial results for a single share of a class held for the periods shown. Per share net investment income (loss) amounts are calculated based on average shares outstanding during the period. Total return assumes reinvestment of all dividends and distributions, if any. Total return does not reflect payment of sales charges, if any. Total return and portfolio turnover are not annualized for periods of less than one year. The portfolio turnover rate is calculated without regard to purchase and sales transactions of short-term instruments and certain derivatives, if any. If such transactions were included, the Fund’s portfolio turnover rate may be higher.
| | Net asset value,
beginning of
period | Net
investment
income
(loss) | Net
realized
and
unrealized
gain | Total from
investment
operations | Distributions
from net
investment
income | Distributions
from net
realized
gains | Total
distributions to
shareholders |
| Class A |
| Year Ended 2/28/2022 | $17.28 | 0.11 | 2.88 | 2.99 | (0.15) | (1.31) | (1.46) |
| Year Ended 2/28/2021 | $14.22 | 0.14 | 4.08 | 4.22 | (0.21) | (0.95) | (1.16) |
| Year Ended 2/29/2020 | $13.95 | 0.24 | 0.77 | 1.01 | (0.12) | (0.62) | (0.74) |
| Year Ended 2/28/2019 | $14.82 | 0.16 | 0.33 | 0.49 | (0.14) | (1.22) | (1.36) |
| Year Ended 2/28/2018 | $13.16 | 0.09 | 2.36 | 2.45 | (0.08) | (0.71) | (0.79) |
| Advisor Class |
| Year Ended 2/28/2022 | $17.04 | 0.15 | 2.84 | 2.99 | (0.19) | (1.31) | (1.50) |
| Year Ended 2/28/2021 | $14.04 | 0.18 | 4.02 | 4.20 | (0.25) | (0.95) | (1.20) |
| Year Ended 2/29/2020 | $13.78 | 0.26 | 0.78 | 1.04 | (0.16) | (0.62) | (0.78) |
| Year Ended 2/28/2019 | $14.66 | 0.20 | 0.33 | 0.53 | (0.19) | (1.22) | (1.41) |
| Year Ended 2/28/2018(e) | $13.61 | 0.11 | 1.63 | 1.74 | (0.10) | (0.59) | (0.69) |
| Class C |
| Year Ended 2/28/2022 | $15.58 | (0.04) | 2.60 | 2.56 | (0.05) | (1.31) | (1.36) |
| Year Ended 2/28/2021 | $12.92 | 0.03 | 3.69 | 3.72 | (0.11) | (0.95) | (1.06) |
| Year Ended 2/29/2020 | $12.74 | 0.11 | 0.71 | 0.82 | (0.02) | (0.62) | (0.64) |
| Year Ended 2/28/2019 | $13.64 | 0.05 | 0.31 | 0.36 | (0.04) | (1.22) | (1.26) |
| Year Ended 2/28/2018 | $12.18 | (0.02) | 2.19 | 2.17 | — | (0.71) | (0.71) |
| Institutional Class |
| Year Ended 2/28/2022 | $17.13 | 0.15 | 2.85 | 3.00 | (0.19) | (1.31) | (1.50) |
| Year Ended 2/28/2021 | $14.10 | 0.18 | 4.05 | 4.23 | (0.25) | (0.95) | (1.20) |
| Year Ended 2/29/2020 | $13.84 | 0.26 | 0.78 | 1.04 | (0.16) | (0.62) | (0.78) |
| Year Ended 2/28/2019 | $14.71 | 0.19 | 0.34 | 0.53 | (0.18) | (1.22) | (1.40) |
| Year Ended 2/28/2018 | $13.06 | 0.12 | 2.35 | 2.47 | (0.11) | (0.71) | (0.82) |
| Institutional 2 Class |
| Year Ended 2/28/2022 | $17.73 | 0.17 | 2.97 | 3.14 | (0.21) | (1.31) | (1.52) |
| Year Ended 2/28/2021 | $14.55 | 0.21 | 4.18 | 4.39 | (0.26) | (0.95) | (1.21) |
| Year Ended 2/29/2020 | $14.26 | 0.29 | 0.79 | 1.08 | (0.17) | (0.62) | (0.79) |
| Year Ended 2/28/2019 | $15.11 | 0.22 | 0.34 | 0.56 | (0.19) | (1.22) | (1.41) |
| Year Ended 2/28/2018 | $13.41 | 0.13 | 2.40 | 2.53 | (0.12) | (0.71) | (0.83) |
The accompanying Notes to Financial Statements are an integral part of this statement.
| 16 | Columbia Select Large Cap Equity Fund | Annual Report 2022 |
Financial Highlights (continued)
| | Net
asset
value,
end of
period | Total
return | Total gross
expense
ratio to
average
net assets(a) | Total net
expense
ratio to
average
net assets(a),(b) | Net investment
income (loss)
ratio to
average
net assets | Portfolio
turnover | Net
assets,
end of
period
(000’s) |
| Class A |
| Year Ended 2/28/2022 | $18.81 | 17.04% | 1.12%(c) | 0.79%(c),(d) | 0.54% | 58% | $235,276 |
| Year Ended 2/28/2021 | $17.28 | 30.70% | 1.16%(c) | 0.79%(c),(d) | 0.92% | 64% | $216,047 |
| Year Ended 2/29/2020 | $14.22 | 7.30% | 1.18% | 0.80%(d) | 1.63% | 46% | $155,699 |
| Year Ended 2/28/2019 | $13.95 | 3.61% | 1.19% | 0.80%(d) | 1.10% | 62% | $151,703 |
| Year Ended 2/28/2018 | $14.82 | 18.87% | 1.19% | 1.13%(d) | 0.61% | 45% | $149,489 |
| Advisor Class |
| Year Ended 2/28/2022 | $18.53 | 17.31% | 0.87%(c) | 0.54%(c),(d) | 0.79% | 58% | $1,932 |
| Year Ended 2/28/2021 | $17.04 | 30.96% | 0.91%(c) | 0.54%(c),(d) | 1.18% | 64% | $1,678 |
| Year Ended 2/29/2020 | $14.04 | 7.58% | 0.93% | 0.55%(d) | 1.81% | 46% | $3,294 |
| Year Ended 2/28/2019 | $13.78 | 3.88% | 0.94% | 0.55%(d) | 1.45% | 62% | $3,143 |
| Year Ended 2/28/2018(e) | $14.66 | 12.96% | 0.97%(f) | 0.69%(d),(f) | 1.17%(f) | 45% | $240 |
| Class C |
| Year Ended 2/28/2022 | $16.78 | 16.13% | 1.87%(c) | 1.54%(c),(d) | (0.21%) | 58% | $8,739 |
| Year Ended 2/28/2021 | $15.58 | 29.82% | 1.91%(c) | 1.54%(c),(d) | 0.18% | 64% | $7,703 |
| Year Ended 2/29/2020 | $12.92 | 6.45% | 1.93% | 1.55%(d) | 0.83% | 46% | $6,040 |
| Year Ended 2/28/2019 | $12.74 | 2.85% | 1.94% | 1.55%(d) | 0.34% | 62% | $7,783 |
| Year Ended 2/28/2018 | $13.64 | 18.03% | 1.94% | 1.87%(d) | (0.15%) | 45% | $8,199 |
| Institutional Class |
| Year Ended 2/28/2022 | $18.63 | 17.28% | 0.87%(c) | 0.54%(c),(d) | 0.79% | 58% | $214,100 |
| Year Ended 2/28/2021 | $17.13 | 31.04% | 0.91%(c) | 0.54%(c),(d) | 1.18% | 64% | $169,476 |
| Year Ended 2/29/2020 | $14.10 | 7.54% | 0.93% | 0.55%(d) | 1.76% | 46% | $125,623 |
| Year Ended 2/28/2019 | $13.84 | 3.90% | 0.94% | 0.55%(d) | 1.34% | 62% | $158,057 |
| Year Ended 2/28/2018 | $14.71 | 19.21% | 0.94% | 0.88%(d) | 0.86% | 45% | $170,394 |
| Institutional 2 Class |
| Year Ended 2/28/2022 | $19.35 | 17.45% | 0.80%(c) | 0.47%(c) | 0.85% | 58% | $198,955 |
| Year Ended 2/28/2021 | $17.73 | 31.20% | 0.83%(c) | 0.46%(c) | 1.26% | 64% | $102,131 |
| Year Ended 2/29/2020 | $14.55 | 7.61% | 0.85% | 0.46% | 1.97% | 46% | $22,676 |
| Year Ended 2/28/2019 | $14.26 | 4.01% | 0.84% | 0.46% | 1.53% | 62% | $19,466 |
| Year Ended 2/28/2018 | $15.11 | 19.15% | 0.86% | 0.80% | 0.90% | 45% | $10,777 |
The accompanying Notes to Financial Statements are an integral part of this statement.
Columbia Select Large Cap Equity Fund | Annual Report 2022
| 17 |
Financial Highlights (continued)
| | Net asset value,
beginning of
period | Net
investment
income
(loss) | Net
realized
and
unrealized
gain | Total from
investment
operations | Distributions
from net
investment
income | Distributions
from net
realized
gains | Total
distributions to
shareholders |
| Institutional 3 Class |
| Year Ended 2/28/2022 | $16.85 | 0.17 | 2.81 | 2.98 | (0.22) | (1.31) | (1.53) |
| Year Ended 2/28/2021 | $13.88 | 0.20 | 3.98 | 4.18 | (0.26) | (0.95) | (1.21) |
| Year Ended 2/29/2020 | $13.63 | 0.29 | 0.76 | 1.05 | (0.18) | (0.62) | (0.80) |
| Year Ended 2/28/2019 | $14.51 | 0.21 | 0.33 | 0.54 | (0.20) | (1.22) | (1.42) |
| Year Ended 2/28/2018(g) | $13.08 | 0.14 | 2.13 | 2.27 | (0.13) | (0.71) | (0.84) |
| Notes to Financial Highlights |
| (a) | In addition to the fees and expenses that the Fund bears directly, the Fund indirectly bears a pro rata share of the fees and expenses of any other funds in which it invests. Such indirect expenses are not included in the Fund’s reported expense ratios. |
| (b) | Total net expenses include the impact of certain fee waivers/expense reimbursements made by the Investment Manager and certain of its affiliates, if applicable. |
| (c) | Ratios include interest on collateral expense which is less than 0.01%. |
| (d) | The benefits derived from expense reductions had an impact of less than 0.01%. |
| (e) | Advisor Class shares commenced operations on July 5, 2017. Per share data and total return reflect activity from that date. |
| (f) | Annualized. |
| (g) | Institutional 3 Class shares commenced operations on March 1, 2017. Per share data and total return reflect activity from that date. |
The accompanying Notes to Financial Statements are an integral part of this statement.
| 18 | Columbia Select Large Cap Equity Fund | Annual Report 2022 |
Financial Highlights (continued)
| | Net
asset
value,
end of
period | Total
return | Total gross
expense
ratio to
average
net assets(a) | Total net
expense
ratio to
average
net assets(a),(b) | Net investment
income (loss)
ratio to
average
net assets | Portfolio
turnover | Net
assets,
end of
period
(000’s) |
| Institutional 3 Class |
| Year Ended 2/28/2022 | $18.30 | 17.40% | 0.75%(c) | 0.42%(c) | 0.92% | 58% | $700,548 |
| Year Ended 2/28/2021 | $16.85 | 31.26% | 0.78%(c) | 0.41%(c) | 1.29% | 64% | $724,055 |
| Year Ended 2/29/2020 | $13.88 | 7.72% | 0.80% | 0.42% | 2.04% | 46% | $364,432 |
| Year Ended 2/28/2019 | $13.63 | 4.02% | 0.80% | 0.43% | 1.48% | 62% | $340,760 |
| Year Ended 2/28/2018(g) | $14.51 | 17.63% | 0.81% | 0.76% | 0.98% | 45% | $330,311 |
The accompanying Notes to Financial Statements are an integral part of this statement.
Columbia Select Large Cap Equity Fund | Annual Report 2022
| 19 |
Notes to Financial Statements
February 28, 2022
Note 1. Organization
Columbia Select Large Cap Equity Fund (the Fund), a series of Columbia Funds Series Trust (the Trust), is a diversified fund. The Trust is registered under the Investment Company Act of 1940, as amended (the 1940 Act), as an open-end management investment company organized as a Delaware statutory trust.
Fund shares
The Trust may issue an unlimited number of shares (without par value). The Fund offers each of the share classes listed in the Statement of Assets and Liabilities. Although all share classes generally have identical voting, dividend and liquidation rights, each share class votes separately when required by the Trust’s organizational documents or by law. Each share class has its own expense and sales charge structure. Different share classes may have different minimum initial investment amounts and pay different net investment income distribution amounts to the extent the expenses of distributing such share classes vary. Distributions to shareholders in a liquidation will be proportional to the net asset value of each share class.
As described in the Fund’s prospectus, Class A and Class C shares are offered to the general public for investment. Effective April 1, 2021, Class C shares automatically convert to Class A shares after 8 years. Prior to April 1, 2021, Class C shares automatically converted to Class A shares after 10 years. Advisor Class, Institutional Class, Institutional 2 Class and Institutional 3 Class shares are available for purchase through authorized investment professionals to omnibus retirement plans or to institutional investors and to certain other investors as also described in the Fund’s prospectus.
Note 2. Summary of significant accounting policies
Basis of preparation
The Fund is an investment company that applies the accounting and reporting guidance in the Financial Accounting Standards Board (FASB) Accounting Standards Codification Topic 946, Financial Services - Investment Companies (ASC 946). The financial statements are prepared in accordance with U.S. generally accepted accounting principles (GAAP), which requires management to make certain estimates and assumptions that affect the reported amounts of assets and liabilities, the disclosure of contingent assets and liabilities at the date of the financial statements and the reported amounts of income and expenses during the reporting period. Actual results could differ from those estimates.
The following is a summary of significant accounting policies followed by the Fund in the preparation of its financial statements.
Security valuation
Equity securities listed on an exchange are valued at the closing price or last trade price on their primary exchange at the close of business of the New York Stock Exchange. Securities with a closing price not readily available or not listed on any exchange are valued at the mean between the closing bid and ask prices. Listed preferred stocks convertible into common stocks are valued using an evaluated price from a pricing service.
Foreign equity securities are valued based on the closing price or last trade price on their primary exchange at the close of business of the New York Stock Exchange. If any foreign equity security closing prices are not readily available, the securities are valued at the mean of the latest quoted bid and ask prices on such exchanges or markets. Foreign currency exchange rates are determined at the scheduled closing time of the New York Stock Exchange. Many securities markets and exchanges outside the U.S. close prior to the close of the New York Stock Exchange; therefore, the closing prices for securities in such markets or on such exchanges may not fully reflect events that occur after such close but before the close of the New York Stock Exchange. In those situations, foreign securities will be fair valued pursuant to a policy adopted by the Board of Trustees. Under the policy, the Fund may utilize a third-party pricing service to determine these fair values. The third-party pricing service takes into account multiple factors, including, but not limited to, movements in the U.S. securities markets, certain depositary receipts, futures contracts and foreign exchange rates that have occurred subsequent to the close of the foreign exchange or market, to determine a good faith estimate that reasonably reflects the current market conditions as of the close of the New York Stock Exchange. The fair value of a security is likely to be different from the quoted or published price, if available.
| 20 | Columbia Select Large Cap Equity Fund | Annual Report 2022 |
Notes to Financial Statements (continued)
February 28, 2022
Investments in open-end investment companies (other than exchange-traded funds (ETFs)), are valued at the latest net asset value reported by those companies as of the valuation time.
Futures and options on futures contracts are valued based upon the settlement price at the close of regular trading on their principal exchanges or, in the absence of a settlement price, at the mean of the latest quoted bid and ask prices.
Investments for which market quotations are not readily available, or that have quotations which management believes are not reflective of market value or reliable, are valued at fair value as determined in good faith under procedures approved by and under the general supervision of the Board of Trustees. If a security or class of securities (such as foreign securities) is valued at fair value, such value is likely to be different from the quoted or published price for the security, if available.
The determination of fair value often requires significant judgment. To determine fair value, management may use assumptions including but not limited to future cash flows and estimated risk premiums. Multiple inputs from various sources may be used to determine fair value.
GAAP requires disclosure regarding the inputs and valuation techniques used to measure fair value and any changes in valuation inputs or techniques. In addition, investments shall be disclosed by major category. This information is disclosed following the Fund’s Portfolio of Investments.
Derivative instruments
The Fund invests in certain derivative instruments, as detailed below, in seeking to meet its investment objectives. Derivatives are instruments whose values depend on, or are derived from, in whole or in part, the value of one or more securities, currencies, commodities, indices, or other assets or instruments. Derivatives may be used to increase investment flexibility (including to maintain cash reserves while maintaining desired exposure to certain assets), for risk management (hedging) purposes, to facilitate trading, to reduce transaction costs and to pursue higher investment returns. The Fund may also use derivative instruments to mitigate certain investment risks, such as foreign currency exchange rate risk, interest rate risk and credit risk. Derivatives may involve various risks, including the potential inability of the counterparty to fulfill its obligations under the terms of the contract, the potential for an illiquid secondary market (making it difficult for the Fund to sell or terminate, including at favorable prices) and the potential for market movements which may expose the Fund to gains or losses in excess of the amount shown in the Statement of Assets and Liabilities. The notional amounts of derivative instruments, if applicable, are not recorded in the financial statements.
A derivative instrument may suffer a marked-to-market loss if the value of the contract decreases due to an unfavorable change in the market rates or values of the underlying instrument. Losses can also occur if the counterparty does not perform its obligations under the contract. The Fund’s risk of loss from counterparty credit risk on over-the-counter derivatives is generally limited to the aggregate unrealized gain netted against any collateral held by the Fund and the amount of any variation margin held by the counterparty, plus any replacement costs or related amounts. With exchange-traded or centrally cleared derivatives, there is reduced counterparty credit risk to the Fund since the clearinghouse or central counterparty (CCP) provides some protection in the case of clearing member default. The clearinghouse or CCP stands between the buyer and the seller of the contract; therefore, failure of the clearinghouse or CCP may pose additional counterparty credit risk. However, credit risk still exists in exchange-traded or centrally cleared derivatives with respect to initial and variation margin that is held in a broker’s customer account. While clearing brokers are required to segregate customer margin from their own assets, in the event that a clearing broker becomes insolvent or goes into bankruptcy and at that time there is a shortfall in the aggregate amount of margin held by the clearing broker for all its clients and such shortfall is remedied by the CCP or otherwise, U.S. bankruptcy laws will typically allocate that shortfall on a pro-rata basis across all the clearing broker’s customers (including the Fund), potentially resulting in losses to the Fund.
In order to better define its contractual rights and to secure rights that will help the Fund mitigate its counterparty risk, the Fund may enter into an International Swaps and Derivatives Association, Inc. Master Agreement (ISDA Master Agreement) or similar agreement with its derivatives counterparties. An ISDA Master Agreement is an agreement between the Fund and a counterparty that governs over-the-counter derivatives and foreign exchange forward contracts and contains, among other things, collateral posting terms and netting provisions in the event of a default and/or termination event. Under an ISDA Master Agreement, the Fund may, under certain circumstances, offset with the counterparty certain derivative instruments’ payables and/or receivables with collateral held and/or posted and create one single net payment. The provisions of the
Columbia Select Large Cap Equity Fund | Annual Report 2022
| 21 |
Notes to Financial Statements (continued)
February 28, 2022
ISDA Master Agreement typically permit a single net payment in the event of default (close-out netting), including the bankruptcy or insolvency of the counterparty. Note, however, that bankruptcy or insolvency laws of a particular jurisdiction may impose restrictions on or prohibitions against the right of offset or netting in bankruptcy, insolvency or other events.
Collateral (margin) requirements differ by type of derivative. Margin requirements are established by the clearinghouse or CCP for exchange-traded and centrally cleared derivatives. Brokers can ask for margin in excess of the minimum in certain circumstances. Collateral terms for most over-the-counter derivatives are subject to regulatory requirements to exchange variation margin with trading counterparties and may have contract specific margin terms as well. For over-the-counter derivatives traded under an ISDA Master Agreement, the collateral requirements are typically calculated by netting the marked-to-market amount for each transaction under such agreement and comparing that amount to the value of any variation margin currently pledged by the Fund and/or the counterparty. Generally, the amount of collateral due from or to a party has to exceed a minimum transfer amount threshold (e.g., $250,000) before a transfer has to be made. To the extent amounts due to the Fund from its counterparties are not fully collateralized, contractually or otherwise, the Fund bears the risk of loss from counterparty nonperformance. The Fund may also pay interest expense on cash collateral received from the broker. Any interest expense paid by the Fund is shown on the Statement of Operations. The Fund attempts to mitigate counterparty risk by only entering into agreements with counterparties that it believes have the financial resources to honor their obligations and by monitoring the financial stability of those counterparties.
Certain ISDA Master Agreements allow counterparties of over-the-counter derivatives transactions to terminate derivatives contracts prior to maturity in the event the Fund’s net asset value declines by a stated percentage over a specified time period or if the Fund fails to meet certain terms of the ISDA Master Agreement, which would cause the Fund to accelerate payment of any net liability owed to the counterparty. The Fund also has termination rights if the counterparty fails to meet certain terms of the ISDA Master Agreement. In determining whether to exercise such termination rights, the Fund would consider, in addition to counterparty credit risk, whether termination would result in a net liability owed from the counterparty.
For financial reporting purposes, the Fund does not offset derivative assets and derivative liabilities that are subject to netting arrangements in the Statement of Assets and Liabilities.
Futures contracts
Futures contracts are exchange-traded and represent commitments for the future purchase or sale of an asset at a specified price on a specified date. The Fund bought and sold futures contracts to maintain appropriate equity market exposure while keeping sufficient cash to accommodate daily redemptions. These instruments may be used for other purposes in future periods. Upon entering into futures contracts, the Fund bears risks that it may not achieve the anticipated benefits of the futures contracts and may realize a loss. Additional risks include counterparty credit risk, the possibility of an illiquid market, and that a change in the value of the contract or option may not correlate with changes in the value of the underlying asset.
Upon entering into a futures contract, the Fund deposits cash or securities with the broker, known as a futures commission merchant (FCM), in an amount sufficient to meet the initial margin requirement. The initial margin deposit must be maintained at an established level over the life of the contract. Cash deposited as initial margin is recorded in the Statement of Assets and Liabilities as margin deposits. Securities deposited as initial margin are designated in the Portfolio of Investments. Subsequent payments (variation margin) are made or received by the Fund each day. The variation margin payments are equal to the daily change in the contract value and are recorded as variation margin receivable or payable and are offset in unrealized gains or losses. The Fund generally expects to earn interest income on its margin deposits. The Fund recognizes a realized gain or loss when the contract is closed or expires. Futures contracts involve, to varying degrees, risk of loss in excess of the variation margin disclosed in the Statement of Assets and Liabilities.
Effects of derivative transactions in the financial statements
The following tables are intended to provide additional information about the effect of derivatives on the financial statements of the Fund, including: the fair value of derivatives by risk category and the location of those fair values in the Statement of Assets and Liabilities; and the impact of derivative transactions over the period in the Statement of Operations, including realized and unrealized gains (losses). The derivative instrument schedules following the Portfolio of Investments present additional information regarding derivative instruments outstanding at the end of the period, if any.
| 22 | Columbia Select Large Cap Equity Fund | Annual Report 2022 |
Notes to Financial Statements (continued)
February 28, 2022
The following table is a summary of the fair value of derivative instruments (not considered to be hedging instruments for accounting disclosure purposes) at February 28, 2022:
| | Liability derivatives | |
Risk exposure
category | Statement
of assets and liabilities
location | Fair value ($) |
| Equity risk | Component of total distributable earnings (loss) — unrealized depreciation on futures contracts | 177,632* |
| * | Includes cumulative appreciation (depreciation) as reported in the tables following the Portfolio of Investments. Only the current day’s variation margin is reported in receivables or payables in the Statement of Assets and Liabilities. |
The following table indicates the effect of derivative instruments (not considered to be hedging instruments for accounting disclosure purposes) in the Statement of Operations for the year ended February 28, 2022:
| Amount of realized gain (loss) on derivatives recognized in income |
| Risk exposure category | Futures
contracts
($) |
| Equity risk | 2,792,280 |
| |
| Change in unrealized appreciation (depreciation) on derivatives recognized in income |
| Risk exposure category | Futures
contracts
($) |
| Equity risk | 309,490 |
The following table is a summary of the average outstanding volume by derivative instrument for the year ended February 28, 2022:
| Derivative instrument | Average notional
amounts ($)* |
| Futures contracts — long | 9,581,345 |
| * | Based on the ending quarterly outstanding amounts for the year ended February 28, 2022. |
Security transactions
Security transactions are accounted for on the trade date. Cost is determined and gains (losses) are based upon the specific identification method for both financial statement and federal income tax purposes.
Income recognition
Corporate actions and dividend income are generally recorded net of any non-reclaimable tax withholdings, on the ex-dividend date or upon receipt of an ex-dividend notification in the case of certain foreign securities.
The Fund may receive distributions from holdings in equity securities, business development companies (BDCs), exchange-traded funds (ETFs), limited partnerships (LPs), other regulated investment companies (RICs), and real estate investment trusts (REITs), which report information as to the tax character of their distributions annually. These distributions are allocated to dividend income, capital gain and return of capital based on actual information reported. Return of capital is recorded as a reduction of the cost basis of securities held. If the Fund no longer owns the applicable securities, return of capital is recorded as a realized gain. With respect to REITs, to the extent actual information has not yet been reported, estimates for return of capital are made by Columbia Management Investment Advisers, LLC (the Investment Manager), a wholly-owned subsidiary of Ameriprise Financial, Inc. (Ameriprise Financial). The Investment Manager’s estimates are subsequently adjusted when the actual character of the distributions is disclosed by the REITs, which could result in a proportionate change in return of capital to shareholders.
Columbia Select Large Cap Equity Fund | Annual Report 2022
| 23 |
Notes to Financial Statements (continued)
February 28, 2022
Awards from class action litigation are recorded as a reduction of cost basis if the Fund still owns the applicable securities on the payment date. If the Fund no longer owns the applicable securities on the payment date, the proceeds are recorded as realized gains.
Expenses
General expenses of the Trust are allocated to the Fund and other funds of the Trust based upon relative net assets or other expense allocation methodologies determined by the nature of the expense. Expenses directly attributable to the Fund are charged to the Fund. Expenses directly attributable to a specific class of shares are charged to that share class.
Determination of class net asset value
All income, expenses (other than class-specific expenses, which are charged to that share class, as shown in the Statement of Operations) and realized and unrealized gains (losses) are allocated to each class of the Fund on a daily basis, based on the relative net assets of each class, for purposes of determining the net asset value of each class.
Federal income tax status
The Fund intends to qualify each year as a regulated investment company under Subchapter M of the Internal Revenue Code, as amended, and will distribute substantially all of its investment company taxable income and net capital gain, if any, for its tax year, and as such will not be subject to federal income taxes. In addition, the Fund intends to distribute in each calendar year substantially all of its ordinary income, capital gain net income and certain other amounts, if any, such that the Fund should not be subject to federal excise tax. Therefore, no federal income or excise tax provision is recorded.
Foreign taxes
The Fund may be subject to foreign taxes on income, gains on investments or currency repatriation, a portion of which may be recoverable. The Fund will accrue such taxes and recoveries, as applicable, based upon its current interpretation of tax rules and regulations that exist in the markets in which it invests.
Realized gains in certain countries may be subject to foreign taxes at the Fund level, based on statutory rates. The Fund accrues for such foreign taxes on realized and unrealized gains at the appropriate rate for each jurisdiction, as applicable. The amount, if any, is disclosed as a liability on the Statement of Assets and Liabilities.
Distributions to shareholders
Distributions from net investment income, if any, are declared and paid semi-annually. Net realized capital gains, if any, are distributed at least annually. Income distributions and capital gain distributions are determined in accordance with federal income tax regulations, which may differ from GAAP.
Guarantees and indemnifications
Under the Trust’s organizational documents and, in some cases, by contract, its officers and trustees are indemnified against certain liabilities arising out of the performance of their duties to the Trust or its funds. In addition, certain of the Fund’s contracts with its service providers contain general indemnification clauses. The Fund’s maximum exposure under these arrangements is unknown since the amount of any future claims that may be made against the Fund cannot be determined, and the Fund has no historical basis for predicting the likelihood of any such claims.
Note 3. Fees and other transactions with affiliates
Management services fees
The Fund has entered into a Management Agreement with Columbia Management Investment Advisers, LLC (the Investment Manager), a wholly-owned subsidiary of Ameriprise Financial, Inc. (Ameriprise Financial). Under the Management Agreement, the Investment Manager provides the Fund with investment research and advice, as well as administrative and accounting services. The management services fee is an annual fee that is equal to a percentage of the Fund’s daily net assets that declines from 0.77% to 0.57% as the Fund’s net assets increase. The effective management services fee rate for the year ended February 28, 2022 was 0.72% of the Fund’s average daily net assets.
| 24 | Columbia Select Large Cap Equity Fund | Annual Report 2022 |
Notes to Financial Statements (continued)
February 28, 2022
Compensation of board members
Members of the Board of Trustees who are not officers or employees of the Investment Manager or Ameriprise Financial are compensated for their services to the Fund as disclosed in the Statement of Operations. Under a Deferred Compensation Plan (the Deferred Plan), these members of the Board of Trustees may elect to defer payment of up to 100% of their compensation. Deferred amounts are treated as though equivalent dollar amounts had been invested in shares of certain funds managed by the Investment Manager. The Fund’s liability for these amounts is adjusted for market value changes and remains in the Fund until distributed in accordance with the Deferred Plan. All amounts payable under the Deferred Plan constitute a general unsecured obligation of the Fund. The expense for the Deferred Plan, which includes Trustees’ fees deferred during the current period as well as any gains or losses on the Trustees’ deferred compensation balances as a result of market fluctuations, is included in "Compensation of board members" on the Statement of Operations.
Compensation of Chief Compliance Officer
The Board of Trustees has appointed a Chief Compliance Officer for the Fund in accordance with federal securities regulations. As disclosed in the Statement of Operations, a portion of the Chief Compliance Officer’s total compensation is allocated to the Fund, along with other allocations to affiliated registered investment companies managed by the Investment Manager and its affiliates, based on relative net assets.
Transactions with affiliates
The Fund is permitted to engage in purchase and/or sale transactions with affiliates and/or accounts that have a common investment manager (or affiliated investment managers), common directors/trustees, and/or common officers under specified conditions outlined in a policy adopted by the Board, pursuant to Rule 17a-7 under the 1940 Act (cross-trades). The Board relies on quarterly written representation from the Fund’s Chief Compliance Officer that cross-trades complied with approved policy.
For the year ended February 28, 2022, the Fund engaged in cross-trades as follows:
| Purchases ($) | Sales ($) | Net realized gain (loss) ($) |
| 9,038,802 | — | — |
Transfer agency fees
Under a Transfer and Dividend Disbursing Agent Agreement, Columbia Management Investment Services Corp. (the Transfer Agent), an affiliate of the Investment Manager and a wholly-owned subsidiary of Ameriprise Financial, is responsible for providing transfer agency services to the Fund. The Transfer Agent has contracted with DST Asset Manager Solutions, Inc. (DST) to serve as sub-transfer agent. The Transfer Agent pays the fees of DST for services as sub-transfer agent and DST is not entitled to reimbursement for such fees from the Fund (with the exception of out-of-pocket fees).
The Fund pays the Transfer Agent a monthly transfer agency fee based on the number or the average value of accounts, depending on the type of account. In addition, the Fund pays the Transfer Agent a fee for shareholder services based on the number of accounts or on a percentage of the average aggregate value of the Fund’s shares maintained in omnibus accounts up to the lesser of the amount charged by the financial intermediary or a cap established by the Board of Trustees from time to time.
The Transfer Agent also receives compensation from the Fund for various shareholder services and reimbursements for certain out-of-pocket fees. Total transfer agency fees for Institutional 2 Class and Institutional 3 Class shares are subject to an annual limitation of not more than 0.07% and 0.02%, respectively, of the average daily net assets attributable to each share class.
Columbia Select Large Cap Equity Fund | Annual Report 2022
| 25 |
Notes to Financial Statements (continued)
February 28, 2022
For the year ended February 28, 2022, the Fund’s effective transfer agency fee rates as a percentage of average daily net assets of each class were as follows:
| | Effective rate (%) |
| Class A | 0.13 |
| Advisor Class | 0.13 |
| Class C | 0.13 |
| Institutional Class | 0.13 |
| Institutional 2 Class | 0.06 |
| Institutional 3 Class | 0.01 |
An annual minimum account balance fee of $20 may apply to certain accounts with a value below the applicable share class’s initial minimum investment requirements to reduce the impact of small accounts on transfer agency fees. These minimum account balance fees are remitted to the Fund and recorded as part of expense reductions in the Statement of Operations. For the year ended February 28, 2022, these minimum account balance fees reduced total expenses of the Fund by $560.
Distribution and service fees
The Fund has entered into an agreement with Columbia Management Investment Distributors, Inc. (the Distributor), an affiliate of the Investment Manager and a wholly-owned subsidiary of Ameriprise Financial, for distribution and shareholder services. The Board of Trustees has approved, and the Fund has adopted, distribution and shareholder service plans (the Plans) applicable to certain share classes, which set the distribution and service fees for the Fund. These fees are calculated daily and are intended to compensate the Distributor and/or eligible selling and/or servicing agents for selling shares of the Fund and providing services to investors.
Under the Plans, the Fund pays a monthly combined distribution and service fee to the Distributor at the maximum annual rate of 0.25% of the average daily net assets attributable to Class A shares of the Fund. Also under the Plans, the Fund pays a monthly service fee to the Distributor at the maximum annual rate of 0.25% of the average daily net assets attributable to Class C shares of the Fund and a monthly distribution fee to the Distributor at the maximum annual rate of 0.75% of the average daily net assets attributable to Class C shares of the Fund.
Sales charges (unaudited)
Sales charges, including front-end charges and contingent deferred sales charges (CDSCs), received by the Distributor for distributing Fund shares for the year ended February 28, 2022, if any, are listed below:
| | Front End (%) | CDSC (%) | Amount ($) |
| Class A | 5.75 | 0.50 - 1.00(a) | 106,862 |
| Class C | — | 1.00(b) | 23 |
| (a) | This charge is imposed on certain investments of between $1 million and $50 million redeemed within 18 months after purchase, as follows: 1.00% if redeemed within 12 months after purchase, and 0.50% if redeemed more than 12, but less than 18, months after purchase, with certain limited exceptions. |
| (b) | This charge applies to redemptions within 12 months after purchase, with certain limited exceptions. |
The Fund’s other share classes are not subject to sales charges.
| 26 | Columbia Select Large Cap Equity Fund | Annual Report 2022 |
Notes to Financial Statements (continued)
February 28, 2022
Expenses waived/reimbursed by the Investment Manager and its affiliates
The Investment Manager and certain of its affiliates have contractually agreed to waive fees and/or reimburse expenses (excluding certain fees and expenses described below) for the period(s) disclosed below, unless sooner terminated at the sole discretion of the Board of Trustees, so that the Fund’s net operating expenses, after giving effect to fees waived/expenses reimbursed and any balance credits and/or overdraft charges from the Fund’s custodian, do not exceed the following annual rate(s) as a percentage of the classes’ average daily net assets:
| | July 1, 2021
through
June 30, 2022 | Prior to
July 1, 2021 |
| Class A | 0.80% | 0.80% |
| Advisor Class | 0.55 | 0.55 |
| Class C | 1.55 | 1.55 |
| Institutional Class | 0.55 | 0.55 |
| Institutional 2 Class | 0.48 | 0.46 |
| Institutional 3 Class | 0.43 | 0.41 |
Under the agreement governing these fee waivers and/or expense reimbursement arrangements, the following fees and expenses are excluded from the waiver/reimbursement commitment, and therefore will be paid by the Fund, if applicable: taxes (including foreign transaction taxes), expenses associated with investments in affiliated and non-affiliated pooled investment vehicles (including mutual funds and exchange-traded funds), transaction costs and brokerage commissions, costs related to any securities lending program, dividend expenses associated with securities sold short, inverse floater program fees and expenses, transaction charges and interest on borrowed money, interest, costs associated with shareholder meetings, infrequent and/or unusual expenses and any other expenses the exclusion of which is specifically approved by the Board of Trustees. This agreement may be modified or amended only with approval from the Investment Manager, certain of its affiliates and the Fund. In addition to the contractual agreement, the Investment Manager and certain of its affiliates have voluntarily agreed to waive fees and/or reimburse Fund expenses (excluding certain fees and expenses described above) so that Fund level expenses (expenses directly attributable to the Fund and not to a specific share class) are waived proportionately across all share classes. This arrangement may be revised or discontinued at any time. Any fees waived and/or expenses reimbursed under the expense reimbursement arrangements described above are not recoverable by the Investment Manager or its affiliates in future periods.
Note 4. Federal tax information
The timing and character of income and capital gain distributions are determined in accordance with income tax regulations, which may differ from GAAP because of temporary or permanent book to tax differences.
At February 28, 2022, these differences were primarily due to differing treatment for deferral/reversal of wash sale losses, trustees’ deferred compensation, derivative investments and re-characterization of distributions for investments. To the extent these differences were permanent, reclassifications were made among the components of the Fund’s net assets. Temporary differences do not require reclassifications.
The following reclassifications were made:
Undistributed net
investment
income ($) | Accumulated
net realized
gain ($) | Paid in
capital ($) |
| (15,061) | 15,061 | — |
Net investment income (loss) and net realized gains (losses), as disclosed in the Statement of Operations, and net assets were not affected by this reclassification.
Columbia Select Large Cap Equity Fund | Annual Report 2022
| 27 |
Notes to Financial Statements (continued)
February 28, 2022
The tax character of distributions paid during the years indicated was as follows:
| Year Ended February 28, 2022 | Year Ended February 28, 2021 |
Ordinary
income ($) | Long-term
capital gains ($) | Total ($) | Ordinary
income ($) | Long-term
capital gains ($) | Total ($) |
| 54,145,783 | 50,952,188 | 105,097,971 | 13,508,359 | 52,066,109 | 65,574,468 |
Short-term capital gain distributions, if any, are considered ordinary income distributions for tax purposes.
At February 28, 2022, the components of distributable earnings on a tax basis were as follows:
Undistributed
ordinary income ($) | Undistributed
long-term
capital gains ($) | Capital loss
carryforwards ($) | Net unrealized
appreciation ($) |
| 16,325,955 | 46,201,948 | — | 419,004,708 |
At February 28, 2022, the cost of all investments for federal income tax purposes along with the aggregate gross unrealized appreciation and depreciation based on that cost was:
Federal
tax cost ($) | Gross unrealized
appreciation ($) | Gross unrealized
(depreciation) ($) | Net unrealized
appreciation ($) |
| 931,406,630 | 444,887,804 | (25,883,096) | 419,004,708 |
Tax cost of investments and unrealized appreciation/(depreciation) may also include timing differences that do not constitute adjustments to tax basis.
Management of the Fund has concluded that there are no significant uncertain tax positions in the Fund that would require recognition in the financial statements. However, management’s conclusion may be subject to review and adjustment at a later date based on factors including, but not limited to, new tax laws, regulations, and administrative interpretations (including relevant court decisions). Generally, the Fund’s federal tax returns for the prior three fiscal years remain subject to examination by the Internal Revenue Service.
Note 5. Portfolio information
The cost of purchases and proceeds from sales of securities, excluding short-term investments and derivatives, if any, aggregated to $786,985,965 and $838,400,401, respectively, for the year ended February 28, 2022. The amount of purchase and sale activity impacts the portfolio turnover rate reported in the Financial Highlights.
Note 6. Affiliated money market fund
The Fund invests in Columbia Short-Term Cash Fund, an affiliated money market fund established for the exclusive use by the Fund and other affiliated funds (the Affiliated MMF). The income earned by the Fund from such investments is included as Dividends - affiliated issuers in the Statement of Operations. As an investing fund, the Fund indirectly bears its proportionate share of the expenses of the Affiliated MMF. The Affiliated MMF prices its shares with a floating net asset value. In addition, the Board of Trustees of the Affiliated MMF may impose a fee on redemptions (sometimes referred to as a liquidity fee) or temporarily suspend redemptions (sometimes referred to as imposing a redemption gate) in the event its liquidity falls below regulatory limits.
Note 7. Interfund lending
Pursuant to an exemptive order granted by the Securities and Exchange Commission, the Fund participates in a program (the Interfund Program) allowing each participating Columbia Fund (each, a Participating Fund) to lend money directly to and, except for closed-end funds and money market funds, borrow money directly from other Participating Funds for temporary purposes. The amounts eligible for borrowing and lending under the Interfund Program are subject to certain restrictions.
| 28 | Columbia Select Large Cap Equity Fund | Annual Report 2022 |
Notes to Financial Statements (continued)
February 28, 2022
Interfund loans are subject to the risk that the borrowing fund could be unable to repay the loan when due, and a delay in repayment to the lending fund could result in lost opportunities and/or additional lending costs. The exemptive order is subject to conditions intended to mitigate conflicts of interest arising from the Investment Manager’s relationship with each Participating Fund.
The Fund’s activity in the Interfund Program during the year ended February 28, 2022 was as follows:
| Borrower or lender | Average loan
balance ($) | Weighted average
interest rate (%) | Number of days
with outstanding loans |
| Lender | 3,066,667 | 0.66 | 3 |
Interest income earned by the Fund is recorded as Interfund lending in the Statement of Operations. The Fund had no outstanding interfund loans at February 28, 2022.
Note 8. Line of credit
The Fund has access to a revolving credit facility with a syndicate of banks led by JPMorgan Chase Bank, N.A., Citibank, N.A. and Wells Fargo Bank, N.A. whereby the Fund may borrow for the temporary funding of shareholder redemptions or for other temporary or emergency purposes. Pursuant to an October 28, 2021 amendment and restatement, the credit facility, which is an agreement between the Fund and certain other funds managed by the Investment Manager or an affiliated investment manager, severally and not jointly, permits aggregate borrowings up to $950 million. Interest is currently charged to each participating fund based on its borrowings at a rate equal to the higher of (i) the federal funds effective rate, (ii) the secured overnight financing rate plus 0.11448% and (iii) the overnight bank funding rate, plus in each case, 1.00%. Each borrowing under the credit facility matures no later than 60 days after the date of borrowing. The Fund also pays a commitment fee equal to its pro rata share of the unused amount of the credit facility at a rate of 0.15% per annum. The commitment fee is included in other expenses in the Statement of Operations. This agreement expires annually in October unless extended or renewed. Prior to the October 28, 2021 amendment and restatement, the Fund had access to a revolving credit facility with a syndicate of banks led by JPMorgan Chase Bank, N.A., Citibank, N.A. and Wells Fargo Bank, N.A. which permitted collective borrowings up to $950 million. Interest was charged to each participating fund based on its borrowings at a rate equal to the higher of (i) the federal funds effective rate, (ii) the one-month London Interbank Offered Rate (LIBOR) rate and (iii) the overnight bank funding rate, plus in each case, 1.25%.
The Fund had no borrowings during the year ended February 28, 2022.
Note 9. Significant risks
Information technology sector risk
The Fund is more susceptible to the particular risks that may affect companies in the information technology sector than if it were invested in a wider variety of companies in unrelated sectors. Companies in the information technology sector are subject to certain risks, including the risk that new services, equipment or technologies will not be accepted by consumers and businesses or will become rapidly obsolete. Performance of such companies may be affected by factors including obtaining and protecting patents (or the failure to do so) and significant competitive pressures, including aggressive pricing of their products or services, new market entrants, competition for market share and short product cycles due to an accelerated rate of technological developments. Such competitive pressures may lead to limited earnings and/or falling profit margins. As a result, the value of their securities may fall or fail to rise. In addition, many information technology sector companies have limited operating histories and prices of these companies’ securities historically have been more volatile than other securities, especially over the short term. Some companies in the information technology sector are facing increased government and regulatory scrutiny and may be subject to adverse government or regulatory action, which could negatively impact the value of their securities.
Market risk
The Fund may incur losses due to declines in the value of one or more securities in which it invests. These declines may be due to factors affecting a particular issuer, or the result of, among other things, political, regulatory, market, economic or social developments affecting the relevant market(s) more generally. In addition, turbulence in financial markets and reduced
Columbia Select Large Cap Equity Fund | Annual Report 2022
| 29 |
Notes to Financial Statements (continued)
February 28, 2022
liquidity in equity, credit and/or fixed income markets may negatively affect many issuers, which could adversely affect the Fund, including causing difficulty in assigning prices to hard-to-value assets in thinly traded and closed markets, significant redemptions and operational challenges. Global economies and financial markets are increasingly interconnected, and conditions and events in one country, region or financial market may adversely impact issuers in a different country, region or financial market. These risks may be magnified if certain events or developments adversely interrupt the global supply chain; in these and other circumstances, such risks might affect companies worldwide. As a result, local, regional or global events such as terrorism, war, natural disasters, disease/virus outbreaks and epidemics or other public health issues, recessions, depressions or other events – or the potential for such events – could have a significant negative impact on global economic and market conditions.
The large-scale invasion of Ukraine by Russia in February 2022 has resulted in sanctions and market disruptions, including declines in regional and global stock and commodity markets and significant devaluations of Russian currency. The extent and duration of the military action are impossible to predict but could be significant. Market disruption caused by the Russian military action, and any counter measures or responses thereto (including international sanctions, a downgrade in the country’s credit rating, purchasing and financing restrictions, boycotts, tariffs, changes in consumer or purchaser preferences, cyberattacks and espionage) could have a severe adverse impact on regional and/or global securities and commodities markets, including markets for oil and natural gas. These and other related events could have a negative impact on Fund performance and the value of an investment in the Fund.
The pandemic caused by coronavirus disease 2019 and its variants (COVID-19) has resulted in, and may continue to result in, significant global economic and societal disruption and market volatility due to disruptions in market access, resource availability, facilities operations, imposition of tariffs, export controls and supply chain disruption, among others. Such disruptions may be caused, or exacerbated by, quarantines and travel restrictions, workforce displacement and loss in human and other resources. The uncertainty surrounding the magnitude, duration, reach, costs and effects of the global pandemic, as well as actions that have been or could be taken by governmental authorities or other third parties, present unknowns that are yet to unfold. The impacts, as well as the uncertainty over impacts to come, of COVID-19 – and any other infectious illness outbreaks, epidemics and pandemics that may arise in the future – could negatively affect global economies and markets in ways that cannot necessarily be foreseen. In addition, the impact of infectious illness outbreaks and epidemics in emerging market countries may be greater due to generally less established healthcare systems, governments and financial markets. Public health crises caused by the COVID-19 outbreak may exacerbate other pre-existing political, social and economic risks in certain countries or globally. The disruptions caused by COVID-19 could prevent the Fund from executing advantageous investment decisions in a timely manner and negatively impact the Fund’s ability to achieve its investment objectives. Any such event(s) could have a significant adverse impact on the value and risk profile of the Fund.
Shareholder concentration risk
At February 28, 2022, two unaffiliated shareholders of record owned 25.1% of the outstanding shares of the Fund in one or more accounts. The Fund has no knowledge about whether any portion of those shares was owned beneficially. Affiliated shareholders of record owned 53.4% of the outstanding shares of the Fund in one or more accounts. Subscription and redemption activity by concentrated accounts may have a significant effect on the operations of the Fund. In the case of a large redemption, the Fund may be forced to sell investments at inopportune times, including its liquid positions, which may result in Fund losses and the Fund holding a higher percentage of less liquid positions. Large redemptions could result in decreased economies of scale and increased operating expenses for non-redeeming Fund shareholders.
Note 10. Subsequent events
Management has evaluated the events and transactions that have occurred through the date the financial statements were issued and noted no items requiring adjustment of the financial statements or additional disclosure.
Note 11. Information regarding pending and settled legal proceedings
Ameriprise Financial and certain of its affiliates are involved in the normal course of business in legal proceedings which include regulatory inquiries, arbitration and litigation, including class actions concerning matters arising in connection with the conduct of its activities as a diversified financial services firm. Ameriprise Financial believes that the Fund is not currently
| 30 | Columbia Select Large Cap Equity Fund | Annual Report 2022 |
Notes to Financial Statements (continued)
February 28, 2022
the subject of, and that neither Ameriprise Financial nor any of its affiliates are the subject of, any pending legal, arbitration or regulatory proceedings that are likely to have a material adverse effect on the Fund or the ability of Ameriprise Financial or its affiliates to perform under their contracts with the Fund. Ameriprise Financial is required to make quarterly (10-Q), annual (10-K) and, as necessary, 8-K filings with the Securities and Exchange Commission (SEC) on legal and regulatory matters that relate to Ameriprise Financial and its affiliates. Copies of these filings may be obtained by accessing the SEC website at www.sec.gov.
There can be no assurance that these matters, or the adverse publicity associated with them, will not result in increased Fund redemptions, reduced sale of Fund shares or other adverse consequences to the Fund. Further, although we believe proceedings are not likely to have a material adverse effect on the Fund or the ability of Ameriprise Financial or its affiliates to perform under their contracts with the Fund, these proceedings are subject to uncertainties and, as such, we are unable to estimate the possible loss or range of loss that may result. An adverse outcome in one or more of these proceedings could result in adverse judgments, settlements, fines, penalties or other relief that could have a material adverse effect on the consolidated financial condition or results of operations of Ameriprise Financial or one or more of its affiliates that provides services to the Fund.
Columbia Select Large Cap Equity Fund | Annual Report 2022
| 31 |
Report of Independent Registered Public Accounting Firm
To the Board of Trustees of Columbia Funds Series Trust and Shareholders of Columbia Select Large Cap Equity Fund
Opinion on the Financial Statements
We have audited the accompanying statement of assets and liabilities, including the portfolio of investments, of Columbia Select Large Cap Equity Fund (one of the funds constituting Columbia Funds Series Trust, referred to hereafter as the "Fund") as of February 28, 2022, the related statement of operations for the year ended February 28, 2022, the statement of changes in net assets for each of the two years in the period ended February 28, 2022, including the related notes, and the financial highlights for each of the periods indicated therein (collectively referred to as the "financial statements"). In our opinion, the financial statements present fairly, in all material respects, the financial position of the Fund as of February 28, 2022, the results of its operations for the year then ended, the changes in its net assets for each of the two years in the period ended February 28, 2022 and the financial highlights for each of the periods indicated therein in conformity with accounting principles generally accepted in the United States of America.
Basis for Opinion
These financial statements are the responsibility of the Fund’s management. Our responsibility is to express an opinion on the Fund’s financial statements based on our audits. We are a public accounting firm registered with the Public Company Accounting Oversight Board (United States) (PCAOB) and are required to be independent with respect to the Fund in accordance with the U.S. federal securities laws and the applicable rules and regulations of the Securities and Exchange Commission and the PCAOB.
We conducted our audits of these financial statements in accordance with the standards of the PCAOB. Those standards require that we plan and perform the audit to obtain reasonable assurance about whether the financial statements are free of material misstatement, whether due to error or fraud.
Our audits included performing procedures to assess the risks of material misstatement of the financial statements, whether due to error or fraud, and performing procedures that respond to those risks. Such procedures included examining, on a test basis, evidence regarding the amounts and disclosures in the financial statements. Our audits also included evaluating the accounting principles used and significant estimates made by management, as well as evaluating the overall presentation of the financial statements. Our procedures included confirmation of securities owned as of February 28, 2022 by correspondence with the custodian, transfer agent and broker. We believe that our audits provide a reasonable basis for our opinion.
/s/PricewaterhouseCoopers LLP
Minneapolis, Minnesota
April 21, 2022
We have served as the auditor of one or more investment companies within the Columbia Funds Complex since 1977.
| 32 | Columbia Select Large Cap Equity Fund | Annual Report 2022 |
Federal Income Tax Information
(Unaudited)
The Fund hereby designates the following tax attributes for the fiscal year ended February 28, 2022. Shareholders will be notified in early 2023 of the amounts for use in preparing 2022 income tax returns.
Qualified
dividend
income | Dividends
received
deduction | Section
199A
dividends | Capital
gain
dividend |
| 41.90% | 39.08% | 0.82% | $80,239,839 |
Qualified dividend income. For taxable, non-corporate shareholders, the percentage of ordinary income distributed during the fiscal year that represents qualified dividend income subject to reduced tax rates.
Dividends received deduction. The percentage of ordinary income distributed during the fiscal year that qualifies for the corporate dividends received deduction.
Section 199A dividends. For taxable, non-corporate shareholders, the percentage of ordinary income distributed during the fiscal year that represents Section 199A dividends potentially eligible for a 20% deduction.
Capital gain dividend. The Fund designates as a capital gain dividend the amount reflected above, or if subsequently determined to be different, the net capital gain of such fiscal period.
TRUSTEES AND OFFICERS
The Board oversees the Fund’s operations and appoints officers who are responsible for day-to-day business decisions based on policies set by the Board. The following table provides basic biographical information about the Fund’s Trustees as of the printing of this report, including their principal occupations during the past five years, although specific titles for individuals may have varied over the period. The year set forth beneath Length of Service in the table below is the year in which the Trustee was first appointed or elected as Trustee to any Fund currently in the Columbia Funds Complex or a predecessor thereof. Under current Board policy, each Trustee generally serves until December 31 of the year such Trustee turns seventy-five (75).
Independent trustees
Name,
address,
year of birth | Position held
with the Columbia Funds and
length of service | Principal occupation(s)
during past five years
and other relevant
professional experience | Number of
Funds in the
Columbia Funds
Complex*
overseen | Other directorships
held by Trustee
during the past
five years |
George S. Batejan
c/o Columbia Management
Investment Advisers, LLC
290 Congress Street
Boston, MA 02210
1953 | Trustee since 2017 | Executive Vice President, Global Head of Technology and Operations, Janus Capital Group, Inc., 2010-2016 | 177 | Former Chairman of the Board, NICSA (National Investment Company Services Association) (Executive Committee, Nominating Committee and Governance Committee), 2014-2016; former Director, Intech Investment Management, 2011-2016; former Board Member, Metro Denver Chamber of Commerce, 2015-2016; former Advisory Board Member, University of Colorado Business School, 2015-2018 |
Columbia Select Large Cap Equity Fund | Annual Report 2022
| 33 |
TRUSTEES AND OFFICERS (continued)
Independent trustees (continued)
Name,
address,
year of birth | Position held
with the Columbia Funds and
length of service | Principal occupation(s)
during past five years
and other relevant
professional experience | Number of
Funds in the
Columbia Funds
Complex*
overseen | Other directorships
held by Trustee
during the past
five years |
Kathleen Blatz
c/o Columbia Management
Investment Advisers, LLC
290 Congress Street
Boston, MA 02210
1954 | Trustee since 2006 | Attorney, specializing in arbitration and mediation; Chief Justice, Minnesota Supreme Court, 1998-2006; Associate Justice, Minnesota Supreme Court, 1996-1998; Fourth Judicial District Court Judge, Hennepin County, 1994-1996; Attorney in private practice and public service, 1984-1993; State Representative, Minnesota House of Representatives, 1979-1993, which included service on the Tax and Financial Institutions and Insurance Committees; Member and Interim Chair, Minnesota Sports Facilities Authority, January 2017-July 2017; Interim President and Chief Executive Officer, Blue Cross and Blue Shield of Minnesota (health care insurance), February-July 2018, April-October 2021 | 177 | Former Trustee, Blue Cross and Blue Shield of Minnesota, 2009-2021 (Chair of the Business Development Committee, 2014-2017; Chair of the Governance Committee, 2017-2019); former Member and Chair of the Board, Minnesota Sports Facilities Authority, January 2017-July 2017; former Director, Robina Foundation, 2009-2020 (Chair, 2014-2020); Director, Schulze Family Foundation, since 2021 |
Pamela G. Carlton
c/o Columbia Management
Investment Advisers, LLC
290 Congress Street
Boston, MA 02210
1954 | Trustee since 2007 | President, Springboard — Partners in Cross Cultural Leadership (consulting company) since 2003; Managing Director of US Equity Research, JP Morgan Chase, 1999-2003; Director of US Equity Research, Chase Asset Management, 1996-1999; Co-Director Latin America Research, 1993-1996, COO Global Research, 1992-1996, Co-Director of US Research, 1991-1992, Investment Banker, Morgan Stanley, 1982-1991, Morgan Stanley; Attorney, Cleary Gottlieb Steen & Hamilton LLP, 1980-1982 | 177 | Trustee, New York Presbyterian Hospital Board (Executive Committee and Chair of People Committee) since 1996; Director, DR Bank (Audit Committee) since 2017; Director, Evercore Inc. (Audit Committee) since 2019; Director, Apollo Commercial Real Estate Finance, Inc. since 2021; the Governing Council of the Independent Directors Council (IDC), since 2021 |
Janet Langford Carrig
c/o Columbia Management
Investment Advisers, LLC
290 Congress Street
Boston, MA 02210
1957 | Trustee since 1996 | Senior Vice President, General Counsel and Corporate Secretary, ConocoPhillips (independent energy company), September 2007-October 2018 | 175 | Director, EQT Corporation (natural gas producer) since 2019; Director, Whiting Petroleum Corporation (independent oil and gas company) since 2020 |
J. Kevin Connaughton
c/o Columbia Management
Investment Advisers, LLC
290 Congress Street
Boston, MA 02210
1964 | Trustee since 2020 | Member, FINRA National Adjudicatory Council since January 2020; Adjunct Professor of Finance, Bentley University since January 2018; Consultant to Independent Trustees of CFVIT and CFST I from March 2016 to June 2020 with respect to CFVIT and to December 2020 with respect to CFST I; Managing Director and General Manager of Mutual Fund Products, Columbia Management Investment Advisers, LLC, May 2010-February 2015; President, Columbia Funds, 2008-2015; and senior officer of Columbia Funds and affiliated funds, 2003-2015 | 175 | Former Director, The Autism Project, March 2015-December 2021; former Member of the Investment Committee, St. Michael’s College, November 2015-February 2020; former Trustee, St. Michael’s College, June 2017-September 2019; former Trustee, New Century Portfolios, January 2015-December 2017 |
| 34 | Columbia Select Large Cap Equity Fund | Annual Report 2022 |
TRUSTEES AND OFFICERS (continued)
Independent trustees (continued)
Name,
address,
year of birth | Position held
with the Columbia Funds and
length of service | Principal occupation(s)
during past five years
and other relevant
professional experience | Number of
Funds in the
Columbia Funds
Complex*
overseen | Other directorships
held by Trustee
during the past
five years |
Olive M. Darragh
c/o Columbia Management
Investment Advisers, LLC
290 Congress Street
Boston, MA 02210
1962 | Trustee since 2020 | Managing Director of Darragh Inc. (strategy and talent management consulting firm) since 2010; Founder and CEO, Zolio, Inc. (investment management talent identification platform) since 2004; Consultant to Independent Trustees of CFVIT and CFST I from June 2019 to June 2020 with respect to CFVIT and to December 2020 with respect to CFST I; Partner, Tudor Investments, 2004-2010; Senior Partner, McKinsey & Company (consulting), 1990-2004; Touche Ross CPA, 1985-1988 | 175 | Former Director, University of Edinburgh Business School (Member of US Board); former Director, Boston Public Library Foundation |
Patricia M. Flynn
c/o Columbia Management
Investment Advisers, LLC
290 Congress Street
Boston, MA 02210
1950 | Trustee since 2004 | Trustee Professor of Economics and Management, Bentley University since 1976 (also teaches and conducts research on corporate governance); Dean, McCallum Graduate School of Business, Bentley University, 1992-2002 | 177 | Trustee, MA Taxpayers Foundation since 1997; Board of Governors, Innovation Institute, MA Technology Collaborative, 2010-2020; former Board of Directors, The MA Business Roundtable, 2003-2019 |
Brian J. Gallagher
c/o Columbia Management
Investment Advisers, LLC
290 Congress Street
Boston, MA 02210
1954 | Trustee since 2017 | Retired; Partner with Deloitte & Touche LLP and its predecessors, 1977-2016 | 177 | Trustee, Catholic Schools Foundation since 2004 |
Douglas A. Hacker
c/o Columbia Management
Investment Advisers, LLC
290 Congress Street
Boston, MA 02210
1955 | Co-Chair since 2021; Chair of CFST I and CFVIT since 2014; Trustee of CFST I and CFVIT since 1996 and CFST, CFST II, CFVST II, CET I and CET II since 2021 | Independent business executive since May 2006; Executive Vice President – Strategy of United Airlines, December 2002 - May 2006; President of UAL Loyalty Services (airline marketing company), September 2001-December 2002; Executive Vice President and Chief Financial Officer of United Airlines, July 1999-September 2001 | 177 | Director, Spartan Nash Company (food distributor); Director, Aircastle Limited (Chair of Audit Committee) (aircraft leasing); former Director, Nash Finch Company (food distributor), 2005-2013; former Director, SeaCube Container Leasing Ltd. (container leasing), 2010-2013; and former Director, Travelport Worldwide Limited (travel information technology), 2014-2019 |
Nancy T. Lukitsh
c/o Columbia Management
Investment Advisers, LLC
290 Congress Street
Boston, MA 02210
1956 | Trustee since 2011 | Senior Vice President, Partner and Director of Marketing, Wellington Management Company, LLP (investment adviser), 1997-2010; Chair, Wellington Management Portfolios (commingled non-U.S. investment pools), 2007 -2010; Director, Wellington Trust Company, NA and other Wellington affiliates, 1997-2010 | 175 | None |
Columbia Select Large Cap Equity Fund | Annual Report 2022
| 35 |
TRUSTEES AND OFFICERS (continued)
Independent trustees (continued)
Name,
address,
year of birth | Position held
with the Columbia Funds and
length of service | Principal occupation(s)
during past five years
and other relevant
professional experience | Number of
Funds in the
Columbia Funds
Complex*
overseen | Other directorships
held by Trustee
during the past
five years |
David M. Moffett
c/o Columbia Management
Investment Advisers, LLC
290 Congress Street
Boston, MA 02210
1952 | Trustee since 2011 | Retired; Consultant to Bridgewater and Associates | 175 | Director, CSX Corporation (transportation suppliers); Director, Genworth Financial, Inc. (financial and insurance products and services); Director, PayPal Holdings Inc. (payment and data processing services); Trustee, University of Oklahoma Foundation; former Director, eBay Inc. (online trading community), 2007-2015; and former Director, CIT Bank, CIT Group Inc. (commercial and consumer finance), 2010-2016 |
Catherine James Paglia
c/o Columbia Management
Investment Advisers, LLC
290 Congress Street
Boston, MA 02210
1952 | Co-Chair since 2021; Chair of CFST, CFST II, CFVST II, CET I and CET II since 2020; Trustee of CFST, CFST II and CFVST II since 2004 and CFST I and CFVIT since 2021 | Director, Enterprise Asset Management, Inc. (private real estate and asset management company) since September 1998; Managing Director and Partner, Interlaken Capital, Inc., 1989-1997; Vice President, 1982-1985, Principal, 1985-1987, Managing Director, 1987-1989, Morgan Stanley; Vice President, Investment Banking, 1980-1982, Associate, Investment Banking, 1976-1980, Dean Witter Reynolds, Inc. | 177 | Director, Valmont Industries, Inc. (irrigation systems manufacturer) since 2012; Trustee, Carleton College (on the Investment Committee); Trustee, Carnegie Endowment for International Peace (on the Investment Committee) |
Minor M. Shaw
c/o Columbia Management
Investment Advisers, LLC
290 Congress Street
Boston, MA 02210
1947 | Trustee since 2003 | President, Micco LLC (private investments) since 2011; President, Micco Corp. (family investment business), 1998-2011 | 177 | Director, Blue Cross Blue Shield of South Carolina (Chair of Compensation Committee) since April 2008; Trustee, Hollingsworth Funds (on the Investment Committee) since 2016 (previously Board Chair from 2016-2019); Former Advisory Board member, Duke Energy Corp., 2016-2020; Chair of the Duke Endowment; Chair of Greenville – Spartanburg Airport Commission; former Trustee, BofA Funds Series Trust (11 funds), 2003-2011; former Director, Piedmont Natural Gas, 2004-2016; former Director, National Association of Corporate Directors, Carolinas Chapter, 2013-2018; Chair, Daniel-Mickel Foundation since 1998 |
| 36 | Columbia Select Large Cap Equity Fund | Annual Report 2022 |
TRUSTEES AND OFFICERS (continued)
Independent trustees (continued)
Name,
address,
year of birth | Position held
with the Columbia Funds and
length of service | Principal occupation(s)
during past five years
and other relevant
professional experience | Number of
Funds in the
Columbia Funds
Complex*
overseen | Other directorships
held by Trustee
during the past
five years |
Natalie A. Trunow
c/o Columbia Management
Investment Advisers, LLC
290 Congress Street
Boston, MA 02210
1967 | Trustee since 2020 | Chief Executive Officer, Millennial Portfolio Solutions LLC (asset management and consulting services), January 2016-January 2021; Non-executive Member of the Investment Committee and Valuation Committee, Sarona Asset Management Inc. (private equity firm) since September 2019; Advisor, Horizon Investments (asset management and consulting services), August 2018-January 2021; Advisor, Paradigm Asset Management, November 2016-December 2021; Consultant to Independent Trustees of CFVIT and CFST I from September 2016 to June 2020 with respect to CFVIT and to December 2020 with respect to CFST I; Director of Investments/Consultant, Casey Family Programs, April 2016-November 2016; Senior Vice President and Chief Investment Officer, Calvert Investments, August 2008-January 2016; Section Head and Portfolio Manager, General Motors Asset Management, June 1997-August 2008 | 175 | Former Director, Investment Committee, Health Services for Children with Special Needs, Inc., 2012-2019; Director, Chair of Audit Committee, Consumer Credit Counseling Services (formerly Guidewell Financial Solutions), since 2019; Independent Director, Investment Committee and Valuation Committee, Sarona Asset Management, since 2019 |
Sandra Yeager
c/o Columbia Management
Investment Advisers, LLC
290 Congress Street
Boston, MA 02210
1964 | Trustee since 2017 | Retired; President and founder, Hanoverian Capital, LLC (SEC registered investment advisor firm), 2008-2016; Managing Director, DuPont Capital, 2006-2008; Managing Director, Morgan Stanley Investment Management, 2004-2006; Senior Vice President, Alliance Bernstein, 1990-2004 | 177 | Former Director, NAPE Education Foundation, October 2016-October 2020 |
| * | The term “Columbia Funds Complex” as used herein includes Columbia Seligman Premium Technology Growth Fund, Tri-Continental Corporation and each series of Columbia Fund Series Trust (CFST), Columbia Funds Series Trust I (CFST I), Columbia Funds Series Trust II (CFST II), Columbia ETF Trust I (CET I), Columbia ETF Trust II (CET II), Columbia Funds Variable Insurance Trust (CFVIT) and Columbia Funds Variable Series Trust II (CFVST II). Messrs. Batejan, Beckman, Gallagher and Hacker and Mses. Blatz, Carlton, Flynn, Paglia, Shaw and Yeager serve as Directors of Columbia Seligman Premium Technology Growth Fund and Tri-Continental Corporation. |
Interested trustee affiliated with Investment Manager*
Name,
address,
year of birth | Position held with the Columbia Funds and length of service | Principal occupation(s) during the
past five years and other relevant
professional experience | Number of
Funds in the
Columbia Funds
Complex overseen | Other directorships
held by Trustee
during the past
five years |
Daniel J. Beckman
c/o Columbia Management
Investment Advisers, LLC
290 Congress Street
Boston, MA 02210
1962 | Trustee since November 2021 and President since June 2021 | Vice President – Head of North America Product, Columbia Management Investment Advisers, LLC since April 2015; President and Principal Executive Officer of the Columbia Funds since June 2021; officer of Columbia Funds and affiliated funds, 2020-2021 | 177 | Director, Ameriprise Trust Company, since October 2016; Director, Columbia Management Investment Distributors, Inc. since November 2018; Board of Governors, Columbia Wanger Asset Management, LLC since January 2022 |
| * | Interested person (as defined under the 1940 Act) by reason of being an officer, director, security holder and/or employee of the Investment Manager or Ameriprise Financial. |
The Statement of Additional Information has additional information about the Fund’s Board members and is available, without charge, upon request by calling 800.345.6611, visiting columbiathreadneedleus.com/investor/ or contacting your financial intermediary.
Columbia Select Large Cap Equity Fund | Annual Report 2022
| 37 |
TRUSTEES AND OFFICERS (continued)
The Board has appointed officers who are responsible for day-to-day business decisions based on policies it has established. The officers serve at the pleasure of the Board. The following table provides basic information about the Officers of the Fund as of the printing of this report, including principal occupations during the past five years, although their specific titles may have varied over the period. In addition to Mr. Beckman, who is President and Principal Executive Officer, the Fund’s other officers are:
Fund officers
Name,
address and
year of birth | Position and year
first appointed to
position for any Fund
in the Columbia
Funds Complex or a
predecessor thereof | Principal occupation(s) during past five years |
Michael G. Clarke
290 Congress Street
Boston, MA 02210
1969 | Chief Financial Officer and Principal Financial Officer (2009) and Senior Vice President (2019) | Senior Vice President and Head of Global Operations & Investor Services, Columbia Management Investment Advisers, LLC, since March 2022 (previously Vice President, Head of North American Operations, and Co-Head of Global Operations, June 2019 to February 2022 and Vice President – Accounting and Tax, May 2010 - May 2019); senior officer of Columbia Funds and affiliated funds since 2002. |
Joseph Beranek
5890 Ameriprise
Financial Center
Minneapolis, MN 55474
1965 | Treasurer and Chief Accounting Officer (Principal Accounting Officer) (2019) and Principal Financial Officer (2020), CFST, CFST I, CFST II, CFVIT and CFVST II; Assistant Treasurer, CET I and CET II | Vice President – Mutual Fund Accounting and Financial Reporting, Columbia Management Investment Advisers, LLC, since December 2018 and March 2017, respectively (previously Vice President – Pricing and Corporate Actions, May 2010 - March 2017). |
Marybeth Pilat
290 Congress Street
Boston, MA 02210
1968 | Treasurer and Chief Accounting Officer (Principal Accounting Officer) and Principal Financial Officer (2020) for CET I and CET II; Assistant Treasurer, CFST, CFST I, CFST II, CFVIT and CFVST II | Vice President – Product Pricing and Administration, Columbia Management Investment Advisers, LLC, since May 2017; Director - Fund Administration, Calvert Investments, August 2015 – March 2017; Vice President - Fund Administration, Legg Mason, May 2015 - July 2015; Vice President - Fund Administration, Columbia Management Investment Advisers, LLC, May 2010 - April 2015. |
William F. Truscott
290 Congress Street
Boston, MA 02210
1960 | Senior Vice President (2001) | Formerly, Trustee/Director of Columbia Funds Complex or legacy funds, November 2001-January 1, 2021; Chief Executive Officer, Global Asset Management, Ameriprise Financial, Inc. since September 2012; Chairman of the Board and President, Columbia Management Investment Advisers, LLC since July 2004 and February 2012, respectively; Chairman of the Board and Chief Executive Officer, Columbia Management Investment Distributors, Inc. since November 2008 and February 2012, respectively; Chairman of the Board and Director, Threadneedle Asset Management Holdings, Sàrl since March 2013 and December 2008, respectively; senior executive of various entities affiliated with Columbia Threadneedle. |
Christopher O. Petersen
5228 Ameriprise Financial Center
Minneapolis, MN 55474
1970 | Senior Vice President and Assistant Secretary | Formerly, Trustee/Director of funds within the Columbia Funds Complex, July 1, 2020 - November 22, 2021; Senior Vice President and Assistant General Counsel, Ameriprise Financial, Inc. since September 2021 (previously Vice President and Lead Chief Counsel, January 2015 - September 2021); President and Principal Executive Officer of the Columbia Funds, 2015 - 2021; officer of Columbia Funds and affiliated funds since 2007. |
Thomas P. McGuire
290 Congress Street
Boston, MA 02210
1972 | Senior Vice President and Chief Compliance Officer (2012) | Vice President – Asset Management Compliance, Ameriprise Financial, Inc., since May 2010; Chief Compliance Officer, Columbia Acorn/Wanger Funds since December 2015; Chief Compliance Officer, Ameriprise Certificate Company, September 2010 – September 2020. |
Ryan C. Larrenaga
290 Congress Street
Boston, MA 02210
1970 | Senior Vice President (2017), Chief Legal Officer (2017), and Secretary (2015) | Vice President and Chief Counsel, Ameriprise Financial, Inc. since August 2018 (previously Vice President and Group Counsel, August 2011 - August 2018); Chief Legal Officer, Columbia Acorn/Wanger Funds, since September 2020; officer of Columbia Funds and affiliated funds since 2005. |
| 38 | Columbia Select Large Cap Equity Fund | Annual Report 2022 |
TRUSTEES AND OFFICERS (continued)
Fund officers (continued)
Name,
address and
year of birth | Position and year
first appointed to
position for any Fund
in the Columbia
Funds Complex or a
predecessor thereof | Principal occupation(s) during past five years |
Michael E. DeFao
290 Congress Street
Boston, MA 02210
1968 | Vice President (2011) and Assistant Secretary (2010) | Vice President and Chief Counsel, Ameriprise Financial, Inc. since May 2010; Vice President, Chief Legal Officer and Assistant Secretary, Columbia Management Investment Advisers, LLC since October 2021 (previously Vice President and Assistant Secretary, May 2010 – September 2021). |
Lyn Kephart-Strong
5228 Ameriprise
Financial Center
Minneapolis, MN 55474
1960 | Vice President (2015) | President, Columbia Management Investment Services Corp. since October 2014; Vice President & Resolution Officer, Ameriprise Trust Company since August 2009. |
Columbia Select Large Cap Equity Fund | Annual Report 2022
| 39 |
Columbia Select Large Cap Equity Fund
P.O. Box 219104
Kansas City, MO 64121-9104
Please read and consider the investment objectives, risks, charges and expenses for any fund carefully before investing. For a prospectus and summary prospectus, which contains this and other important information about the Fund, go to
columbiathreadneedleus.com/investor/. The Fund is distributed by Columbia Management Investment Distributors, Inc., member FINRA, and managed by Columbia Management Investment Advisers, LLC.
Columbia Threadneedle Investments (Columbia Threadneedle) is the global brand name of the Columbia and Threadneedle group of companies. All rights reserved.
© 2022 Columbia Management Investment Advisers, LLC.
columbiathreadneedleus.com/investor/

Annual Report
February 28, 2022
Columbia Large Cap Index Fund
Not Federally Insured • No Financial Institution Guarantee • May Lose Value
If you elect to receive the shareholder report for Columbia Large Cap Index Fund (the Fund) in paper, mailed to you, the Fund mails one shareholder report to each shareholder address, unless such shareholder elects to receive shareholder reports from the Fund electronically via e-mail or by having a paper notice mailed to you (Postcard Notice) that your Fund’s shareholder report is available at the Columbia funds’ website (columbiathreadneedleus.com/investor/). If you would like more than one report in paper to be mailed to you, or would like to elect to receive reports via e-mail or access them through Postcard Notice, please call shareholder services at 800.345.6611 and additional reports will be sent to you.
Proxy voting policies and procedures
The policy of the Board of Trustees is to vote the proxies of the companies in which the Fund holds investments consistent with the procedures as stated in the Statement of Additional Information (SAI). You may obtain a copy of the SAI without charge by calling 800.345.6611; contacting your financial intermediary; visiting columbiathreadneedleus.com/investor/; or searching the website of the Securities and Exchange Commission (SEC) at sec.gov. Information regarding how the Fund voted proxies relating to portfolio securities is filed with the SEC by August 31st for the most recent 12-month period ending June 30th of that year, and is available without charge by visiting columbiathreadneedleus.com/investor/, or searching the website of the SEC at sec.gov.
Quarterly schedule of investments
The Fund files a complete schedule of portfolio holdings with the SEC for the first and third quarters of each fiscal year on Form N-PORT. The Fund’s Form N-PORT filings are available on the SEC’s website at sec.gov. The Fund’s complete schedule of portfolio holdings, as filed on Form N-PORT, can also be obtained without charge, upon request, by calling 800.345.6611.
Additional Fund information
For more information about the Fund, please visit columbiathreadneedleus.com/investor/ or call 800.345.6611. Customer Service Representatives are available to answer your questions Monday through Friday from 8 a.m. to 7 p.m. Eastern time.
Fund investment manager
Columbia Management Investment Advisers, LLC (the Investment Manager)
290 Congress Street
Boston, MA 02210
Fund distributor
Columbia Management Investment Distributors, Inc.
290 Congress Street
Boston, MA 02210
Fund transfer agent
Columbia Management Investment Services Corp.
P.O. Box 219104
Kansas City, MO 64121-9104
Columbia Large Cap Index Fund | Annual Report 2022
Investment objective
The Fund seeks total return before fees and expenses that corresponds to the total return of the Standard & Poor’s (S&P) 500 Index.
Portfolio management
Christopher Lo, CFA
Lead Portfolio Manager
Managed Fund since 2014
Kaiyu Zhao
Portfolio Manager
Managed Fund since 2020
Christopher Rowe
Portfolio Manager
Managed Fund since 2020
Morningstar style boxTM
The Morningstar Style Box is based on a fund’s portfolio holdings. For equity funds, the vertical axis shows the market capitalization of the stocks owned, and the horizontal axis shows investment style (value, blend, or growth). Information shown is based on the most recent data provided by Morningstar.
© 2022 Morningstar, Inc. All rights reserved. The Morningstar information contained herein: (1) is proprietary to Morningstar and/or its content providers; (2) may not be copied or distributed; and (3) is not warranted to be accurate, complete or timely. Neither Morningstar nor its content providers are responsible for any damages or losses arising from any use of this information.
| Average annual total returns (%) (for the period ended February 28, 2022) |
| | | Inception | 1 Year | 5 Years | 10 Years |
| Class A | 10/10/95 | 15.86 | 14.65 | 14.08 |
| Institutional Class | 12/15/93 | 16.15 | 14.94 | 14.36 |
| Institutional 2 Class* | 11/08/12 | 16.15 | 14.94 | 14.36 |
| Institutional 3 Class* | 03/01/17 | 16.17 | 14.95 | 14.37 |
| S&P 500 Index | | 16.39 | 15.17 | 14.59 |
All results shown assume reinvestment of distributions during the period. Returns do not reflect the deduction of taxes that a shareholder may pay on Fund distributions or on the redemption of Fund shares. Performance results reflect the effect of any fee waivers or reimbursements of Fund expenses by Columbia Management Investment Advisers, LLC and/or any of its affiliates. Absent these fee waivers or expense reimbursement arrangements, performance results would have been lower.
The performance information shown represents past performance and is not a guarantee of future results. The investment return and principal value of your investment will fluctuate so that your shares, when redeemed, may be worth more or less than their original cost. Current performance may be lower or higher than the performance information shown. You may obtain performance information current to the most recent month-end by contacting your financial intermediary, visiting columbiathreadneedleus.com/investor/ or calling 800.345.6611.
| * | The returns shown for periods prior to the share class inception date (including returns for the Life of the Fund, if shown, which are since Fund inception) include the returns of the Fund’s oldest share class. These returns are adjusted to reflect any higher class-related operating expenses of the newer share classes, as applicable. Please visit columbiathreadneedleus.com/investor/investment-products/mutual-funds/appended-performance for more information. |
The S&P 500 Index, an unmanaged index, measures the performance of 500 widely held, large-capitalization U.S. stocks and is frequently used as a general measure of market performance.
Indices are not available for investment, are not professionally managed and do not reflect sales charges, fees, brokerage commissions, taxes or other expenses of investing. Securities in the Fund may not match those in an index.
Fund performance may be significantly negatively impacted by the economic impact of the COVID-19 pandemic. The COVID-19 pandemic has adversely impacted economies and capital markets around the world in ways that will likely continue and may change in unforeseen ways for an indeterminate period. The COVID-19 pandemic may exacerbate pre-existing political, social and economic risks in certain countries and globally.
Columbia Large Cap Index Fund | Annual Report 2022
| 3 |
Fund at a Glance (continued)
Performance of a hypothetical $10,000 investment (February 29, 2012 — February 28, 2022)
The chart above shows the change in value of a hypothetical $10,000 investment in Class A shares of Columbia Large Cap Index Fund during the stated time period, and does not reflect the deduction of taxes that a shareholder may pay on Fund distributions or on the redemption of Fund shares.
| Portfolio breakdown (%) (at February 28, 2022) |
| Common Stocks | 98.6 |
| Money Market Funds | 1.4 |
| Total | 100.0 |
Percentages indicated are based upon total investments excluding investments in derivatives, if any. The Fund’s portfolio composition is subject to change.
| Equity sector breakdown (%) (at February 28, 2022) |
| Communication Services | 9.6 |
| Consumer Discretionary | 11.8 |
| Consumer Staples | 6.2 |
| Energy | 3.7 |
| Financials | 11.6 |
| Health Care | 13.3 |
| Industrials | 7.9 |
| Information Technology | 28.1 |
| Materials | 2.6 |
| Real Estate | 2.6 |
| Utilities | 2.6 |
| Total | 100.0 |
Percentages indicated are based upon total equity investments. The Fund’s portfolio composition is subject to change.
| 4 | Columbia Large Cap Index Fund | Annual Report 2022 |
Manager Discussion of Fund Performance
At February 28, 2022, approximately 27.93% of the Fund’s shares were owned in the aggregate by affiliated funds-of-funds managed by Columbia Management Investment Advisers, LLC (the Investment Manager). As a result of asset allocation decisions by the Investment Manager, it is possible that the Fund may experience relatively large purchases or redemptions from affiliated funds-of-funds. The Investment Manager seeks to minimize the impact of these transactions by structuring them over a reasonable period of time. The Fund may experience increased expenses as it buys and sells securities as a result of purchases or redemptions by affiliated funds-of-funds.
For the 12-month period that ended February 28, 2022, Class A shares of Columbia Large Cap Index Fund returned 15.86%. The Fund closely tracked its benchmark, the unmanaged S&P 500 Index, which returned 16.39% for the same period. Mutual funds, unlike unmanaged indices, incur operating expenses.
Market overview
COVID-19 vaccinations allowed for greater economic reopening during the annual period. In turn, the U.S. equity market, as measured by the S&P 500 Index, achieved double-digit gains, even as volatility remained heightened throughout.
As the annual period began in March 2021, U.S. equities produced healthy gains, boosted by both the passage of a fiscal stimulus package and by investor confidence the U.S. Federal Reserve (Fed) would maintain its highly accommodative monetary policy. Stocks were then well supported during the second quarter of 2021 by a combination of strong economic growth, gradual rollbacks of COVID-19 lockdowns and robust corporate earnings. Although concerns about rising inflation led to a brief stretch of volatility mid-way through the quarter, the Fed reassured the markets that monetary policy would remain accommodative for an extended period. As a result, most major U.S. equity indices finished June 2021 at or near their then-all-time highs.
U.S. equities posted mixed results in the third quarter, reflecting an increasingly challenging environment. The market performed reasonably well in July and August, during which the prospects of improving economic growth and rising corporate profits outweighed concerns about the COVID-19 Delta variant. The backdrop became less favorable in September, however, fueling a downturn that erased almost all of the advance of the prior two months. The markets were contending with a persistent increase in inflation, worsening supply-chain bottlenecks, instability in China’s property market and the Fed indicating it was likely to announce a tapering of its quantitative easing program before year end. In the fourth quarter, U.S. equities displayed remarkable resilience despite potential headwinds. Investors faced the emergence of the COVID-19 Omicron variant, which was contagious enough to raise concerns about a possible new wave of lockdowns. Also, the Fed had previously viewed rising inflation as “transitory,” but continued price pressures drove the central bank to announce the tapering of its stimulative quantitative easing program and to prepare the financial markets for the likelihood of multiple interest rate increases in 2022. Still, the S&P 500 Index finished the calendar year with a solid gain on the strength of robust investment inflows and the lack of compelling total return potential in bonds.
U.S. equities fell in January and February 2022. The S&P 500 Index experienced its worst month in January since the COVID-19-induced sell-off of March 2020. Hawkish commentary from the Fed was perhaps the most significant driver of the market’s decline. Heightened inflation concerns also weighed on investor sentiment, more than offsetting the positive news that the Omicron variant appeared to be milder than previous COVID-19 variants. In February, Russia’s invasion of Ukraine, stunning in its magnitude, rattled equity markets, while inflation and shifting Fed policy remained overhangs. Notably, the growing sense that COVID-19 is transitioning from pandemic to endemic in the U.S. supported U.S. small-cap stocks, which significantly outpaced their large-cap peers in a reversal of the recent performance trend.
For the annual period overall, large-cap stocks within the U.S. equity market performed best, followed by mid-cap stocks and then small-cap stocks, each generating a positive total return. From a style perspective, there was a sharp reversal from the prior annual period, as value-oriented stocks significantly outperformed growth-oriented stocks across the capitalization spectrum of the U.S. equity market for the 12 months ended February 28, 2022. Ten of the eleven sectors of the S&P 500 Index posted a positive return during the 12 months ended February 28, 2022.
Columbia Large Cap Index Fund | Annual Report 2022
| 5 |
Manager Discussion of Fund Performance (continued)
The Fund’s notable detractors during the period
| • | Communication services was the only sector in the S&P 500 Index to post a negative total return during the annual period. The consumer discretionary and industrials sectors were also weak, but each generated a single-digit positive total return during the annual period. |
| • | On the basis of impact, communication services, materials and utilities were the weakest sectors. |
| • | The worst performing industries for the annual period on the basis of total return were entertainment; airlines; independent power and renewable electricity producers; auto components; and media. |
| • | Top individual detractors were digital payments technology platform PayPal Holdings, Inc.; social media giant formerly known as Facebook, Meta Platforms, Inc.-Class A; diversified media and entertainment company The Walt Disney Co.; entertainment content streaming service Netflix, Inc.; and semiconductor bellwether Intel Corp. |
The Fund’s notable contributors during the period
| • | In terms of total return, the energy sector was the best relative performer, followed at some distance by the real estate and consumer staples sectors. |
| • | On the basis of impact, which takes weighting and total returns into account, the information technology sector was the biggest contributor to the Index’s return, followed by health care and financials. |
| • | The top performing industries for the annual period on the basis of total return were oil, gas and consumable fuels; metals and mining; health care providers and services; energy equipment and services; and health care technology. |
| • | Top individual contributors within the S&P 500 Index during the annual period included information technology giants Apple Inc., Microsoft Corp. and Alphabet Inc.; semiconductor producer NVIDIA Corp.; and health care plan provider UnitedHealth Group Inc. |
| • | Information technology remained the largest sector by weighting in the S&P 500 Index as of February 28, 2022, with a weighting of 28.12%. |
| • | As always, each sector and stock in the S&P 500 Index was represented in the Fund with approximately the same weighting as in the Index and therefore had a similar effect. |
Market risk may affect a single issuer, sector of the economy, industry or the market as a whole. Investing in derivatives is a specialized activity that involves special risks, which may result in significant losses. The Fund’s net value will generally decline when the performance of its targeted index declines. See the Fund’s prospectus for more information on these and other risks.
The views expressed in this report reflect the current views of the respective parties who have contributed to this report. These views are not guarantees of future performance and involve certain risks, uncertainties and assumptions that are difficult to predict, so actual outcomes and results may differ significantly from the views expressed. These views are subject to change at any time based upon economic, market or other conditions and the respective parties disclaim any responsibility to update such views. These views may not be relied on as investment advice and, because investment decisions for a Columbia fund are based on numerous factors, may not be relied on as an indication of trading intent on behalf of any particular Columbia fund. References to specific securities should not be construed as a recommendation or investment advice.
| 6 | Columbia Large Cap Index Fund | Annual Report 2022 |
Understanding Your Fund’s Expenses
(Unaudited)
As an investor, you incur two types of costs. There are shareholder transaction costs, which may include redemption fees. There are also ongoing fund costs, which generally include management fees, distribution and/or service fees, and other fund expenses. The following information is intended to help you understand your ongoing costs (in dollars) of investing in the Fund and to help you compare these costs with the ongoing costs of investing in other mutual funds.
Analyzing your Fund’s expenses
To illustrate these ongoing costs, we have provided examples and calculated the expenses paid by investors in each share class of the Fund during the period. The actual and hypothetical information in the table is based on an initial investment of $1,000 at the beginning of the period indicated and held for the entire period. Expense information is calculated two ways and each method provides you with different information. The amount listed in the “Actual” column is calculated using the Fund’s actual operating expenses and total return for the period. You may use the Actual information, together with the amount invested, to estimate the expenses that you paid over the period. Simply divide your account value by $1,000 (for example, an $8,600 account value divided by $1,000 = 8.6), then multiply the results by the expenses paid during the period under the “Actual” column. The amount listed in the “Hypothetical” column assumes a 5% annual rate of return before expenses (which is not the Fund’s actual return) and then applies the Fund’s actual expense ratio for the period to the hypothetical return. You should not use the hypothetical account values and expenses to estimate either your actual account balance at the end of the period or the expenses you paid during the period. See “Compare with other funds” below for details on how to use the hypothetical data.
Compare with other funds
Since all mutual funds are required to include the same hypothetical calculations about expenses in shareholder reports, you can use this information to compare the ongoing cost of investing in the Fund with other funds. To do so, compare the hypothetical example with the 5% hypothetical examples that appear in the shareholder reports of other funds. As you compare hypothetical examples of other funds, it is important to note that hypothetical examples are meant to highlight the ongoing costs of investing in a fund only and do not reflect any transaction costs, such as redemption or exchange fees. Therefore, the hypothetical calculations are useful in comparing ongoing costs only, and will not help you determine the relative total costs of owning different funds. If transaction costs were included in these calculations, your costs would be higher.
| September 1, 2021 — February 28, 2022 |
| | Account value at the
beginning of the
period ($) | Account value at the
end of the
period ($) | Expenses paid during
the period ($) | Fund’s annualized
expense ratio (%) |
| | Actual | Hypothetical | Actual | Hypothetical | Actual | Hypothetical | Actual |
| Class A | 1,000.00 | 1,000.00 | 971.70 | 1,022.56 | 2.20 | 2.26 | 0.45 |
| Institutional Class | 1,000.00 | 1,000.00 | 972.80 | 1,023.80 | 0.98 | 1.00 | 0.20 |
| Institutional 2 Class | 1,000.00 | 1,000.00 | 972.70 | 1,023.80 | 0.98 | 1.00 | 0.20 |
| Institutional 3 Class | 1,000.00 | 1,000.00 | 972.90 | 1,023.80 | 0.98 | 1.00 | 0.20 |
Expenses paid during the period are equal to the annualized expense ratio for each class as indicated above, multiplied by the average account value over the period and then multiplied by the number of days in the Fund’s most recent fiscal half year and divided by 365.
Expenses do not include fees and expenses incurred indirectly by the Fund from its investment in underlying funds, including affiliated and non-affiliated pooled investment vehicles, such as mutual funds and exchange-traded funds.
Had Columbia Management Investment Advisers, LLC and/or certain of its affiliates not waived/reimbursed certain fees and expenses, account value at the end of the period would have been reduced.
Columbia Large Cap Index Fund | Annual Report 2022
| 7 |
Portfolio of Investments
February 28, 2022
(Percentages represent value of investments compared to net assets)
Investments in securities
| Common Stocks 98.6% |
| Issuer | Shares | Value ($) |
| Communication Services 9.5% |
| Diversified Telecommunication Services 1.1% |
| AT&T, Inc. | 661,356 | 15,667,523 |
| Lumen Technologies, Inc. | 85,344 | 884,164 |
| Verizon Communications, Inc. | 383,437 | 20,579,064 |
| Total | | 37,130,751 |
| Entertainment 1.5% |
| Activision Blizzard, Inc. | 72,136 | 5,879,084 |
| Electronic Arts, Inc. | 26,192 | 3,407,317 |
| Live Nation Entertainment, Inc.(a) | 12,511 | 1,511,579 |
| Netflix, Inc.(a) | 41,024 | 16,184,789 |
| Take-Two Interactive Software, Inc.(a) | 10,678 | 1,729,836 |
| Walt Disney Co. (The)(a) | 168,291 | 24,984,482 |
| Total | | 53,697,087 |
| Interactive Media & Services 5.7% |
| Alphabet, Inc., Class A(a) | 27,859 | 75,251,059 |
| Alphabet, Inc., Class C(a) | 25,896 | 69,862,747 |
| Match Group, Inc.(a) | 26,218 | 2,923,045 |
| Meta Platforms, Inc., Class A(a) | 219,150 | 46,247,225 |
| Twitter, Inc.(a) | 74,055 | 2,632,655 |
| Total | | 196,916,731 |
| Media 1.0% |
| Charter Communications, Inc., Class A(a) | 11,457 | 6,894,593 |
| Comcast Corp., Class A | 422,271 | 19,745,392 |
| Discovery, Inc., Class A(a) | 15,671 | 439,572 |
| Discovery, Inc., Class C(a) | 28,130 | 786,796 |
| DISH Network Corp., Class A(a) | 23,126 | 739,107 |
| Fox Corp., Class A | 29,669 | 1,241,054 |
| Fox Corp., Class B | 13,619 | 521,063 |
| Interpublic Group of Companies, Inc. (The) | 36,467 | 1,341,986 |
| News Corp., Class A | 36,401 | 812,470 |
| News Corp., Class B | 11,278 | 252,966 |
| Omnicom Group, Inc. | 19,686 | 1,651,458 |
| Paramount Global, Class B | 56,189 | 1,719,945 |
| Total | | 36,146,402 |
| Common Stocks (continued) |
| Issuer | Shares | Value ($) |
| Wireless Telecommunication Services 0.2% |
| T-Mobile USA, Inc.(a) | 54,369 | 6,698,804 |
| Total Communication Services | 330,589,775 |
| Consumer Discretionary 11.7% |
| Auto Components 0.1% |
| Aptiv PLC(a) | 25,053 | 3,242,860 |
| BorgWarner, Inc. | 22,206 | 910,668 |
| Total | | 4,153,528 |
| Automobiles 2.3% |
| Ford Motor Co. | 363,545 | 6,383,850 |
| General Motors Co.(a) | 134,462 | 6,282,065 |
| Tesla Motors, Inc.(a) | 75,337 | 65,575,585 |
| Total | | 78,241,500 |
| Distributors 0.1% |
| Genuine Parts Co. | 13,190 | 1,611,290 |
| LKQ Corp. | 24,836 | 1,166,050 |
| Pool Corp. | 3,713 | 1,702,708 |
| Total | | 4,480,048 |
| Hotels, Restaurants & Leisure 1.9% |
| Booking Holdings, Inc.(a) | 3,803 | 8,261,067 |
| Caesars Entertainment, Inc.(a) | 19,798 | 1,666,794 |
| Carnival Corp.(a) | 74,504 | 1,514,666 |
| Chipotle Mexican Grill, Inc.(a) | 2,606 | 3,969,850 |
| Darden Restaurants, Inc. | 12,020 | 1,745,544 |
| Domino’s Pizza, Inc. | 3,370 | 1,456,548 |
| Expedia Group, Inc.(a) | 13,522 | 2,651,800 |
| Hilton Worldwide Holdings, Inc.(a) | 25,814 | 3,842,672 |
| Las Vegas Sands Corp.(a) | 31,840 | 1,364,662 |
| Marriott International, Inc., Class A(a) | 25,337 | 4,310,837 |
| McDonald’s Corp. | 69,205 | 16,939,308 |
| MGM Resorts International | 36,049 | 1,596,610 |
| Norwegian Cruise Line Holdings Ltd.(a) | 34,270 | 667,922 |
| Penn National Gaming, Inc.(a) | 15,385 | 790,020 |
| Royal Caribbean Cruises Ltd.(a) | 20,765 | 1,676,151 |
| Starbucks Corp. | 109,284 | 10,031,178 |
The accompanying Notes to Financial Statements are an integral part of this statement.
| 8 | Columbia Large Cap Index Fund | Annual Report 2022 |
Portfolio of Investments (continued)
February 28, 2022
| Common Stocks (continued) |
| Issuer | Shares | Value ($) |
| Wynn Resorts Ltd.(a) | 9,747 | 843,311 |
| Yum! Brands, Inc. | 27,148 | 3,327,802 |
| Total | | 66,656,742 |
| Household Durables 0.4% |
| D.R. Horton, Inc. | 30,187 | 2,577,970 |
| Garmin Ltd. | 14,071 | 1,554,001 |
| Lennar Corp., Class A | 25,177 | 2,262,909 |
| Mohawk Industries, Inc.(a) | 5,081 | 715,303 |
| Newell Brands, Inc. | 35,064 | 832,770 |
| NVR, Inc.(a) | 303 | 1,502,407 |
| PulteGroup, Inc. | 23,449 | 1,164,478 |
| Whirlpool Corp. | 5,626 | 1,132,345 |
| Total | | 11,742,183 |
| Internet & Direct Marketing Retail 3.7% |
| Amazon.com, Inc.(a) | 40,393 | 124,057,405 |
| eBay, Inc. | 57,977 | 3,164,965 |
| Etsy, Inc.(a) | 11,742 | 1,818,718 |
| Total | | 129,041,088 |
| Leisure Products 0.0% |
| Hasbro, Inc. | 12,009 | 1,165,473 |
| Multiline Retail 0.5% |
| Dollar General Corp. | 21,608 | 4,285,731 |
| Dollar Tree, Inc.(a) | 20,830 | 2,959,526 |
| Target Corp. | 45,199 | 9,029,404 |
| Total | | 16,274,661 |
| Specialty Retail 2.1% |
| Advance Auto Parts, Inc. | 5,835 | 1,193,141 |
| AutoZone, Inc.(a) | 1,942 | 3,618,703 |
| Bath & Body Works, Inc. | 24,485 | 1,306,764 |
| Best Buy Co., Inc. | 20,502 | 1,981,313 |
| CarMax, Inc.(a) | 15,014 | 1,641,481 |
| Home Depot, Inc. (The) | 97,741 | 30,869,540 |
| Lowe’s Companies, Inc. | 64,129 | 14,176,357 |
| O’Reilly Automotive, Inc.(a) | 6,240 | 4,051,258 |
| Ross Stores, Inc. | 32,912 | 3,007,828 |
| TJX Companies, Inc. (The) | 111,372 | 7,361,689 |
| Common Stocks (continued) |
| Issuer | Shares | Value ($) |
| Tractor Supply Co. | 10,541 | 2,148,150 |
| Ulta Beauty, Inc.(a) | 5,034 | 1,885,233 |
| Total | | 73,241,457 |
| Textiles, Apparel & Luxury Goods 0.6% |
| NIKE, Inc., Class B | 118,343 | 16,159,737 |
| PVH Corp. | 6,580 | 644,116 |
| Ralph Lauren Corp. | 4,514 | 596,029 |
| Tapestry, Inc. | 25,482 | 1,042,214 |
| Under Armour, Inc., Class A(a) | 17,471 | 312,556 |
| Under Armour, Inc., Class C(a) | 19,918 | 311,318 |
| VF Corp. | 30,193 | 1,751,798 |
| Total | | 20,817,768 |
| Total Consumer Discretionary | 405,814,448 |
| Consumer Staples 6.1% |
| Beverages 1.5% |
| Brown-Forman Corp., Class B | 16,924 | 1,103,952 |
| Coca-Cola Co. (The) | 360,034 | 22,408,516 |
| Constellation Brands, Inc., Class A | 15,213 | 3,280,227 |
| Molson Coors Beverage Co., Class B | 17,449 | 910,489 |
| Monster Beverage Corp.(a) | 34,794 | 2,936,614 |
| PepsiCo, Inc. | 128,053 | 20,967,398 |
| Total | | 51,607,196 |
| Food & Staples Retailing 1.4% |
| Costco Wholesale Corp. | 40,919 | 21,247,191 |
| Kroger Co. (The) | 62,673 | 2,933,096 |
| Sysco Corp. | 47,479 | 4,135,421 |
| Walgreens Boots Alliance, Inc. | 66,539 | 3,066,783 |
| Walmart, Inc. | 131,709 | 17,801,788 |
| Total | | 49,184,279 |
| Food Products 1.0% |
| Archer-Daniels-Midland Co. | 51,812 | 4,064,651 |
| Campbell Soup Co. | 18,746 | 843,008 |
| ConAgra Foods, Inc. | 44,426 | 1,553,577 |
| General Mills, Inc. | 56,095 | 3,782,486 |
| Hershey Co. (The) | 13,465 | 2,723,431 |
| Hormel Foods Corp. | 26,129 | 1,244,786 |
| JM Smucker Co. (The) | 10,036 | 1,352,351 |
| Kellogg Co. | 23,695 | 1,515,058 |
The accompanying Notes to Financial Statements are an integral part of this statement.
Columbia Large Cap Index Fund | Annual Report 2022
| 9 |
Portfolio of Investments (continued)
February 28, 2022
| Common Stocks (continued) |
| Issuer | Shares | Value ($) |
| Kraft Heinz Co. (The) | 65,751 | 2,578,754 |
| Lamb Weston Holdings, Inc. | 13,528 | 898,665 |
| McCormick & Co., Inc. | 23,093 | 2,197,761 |
| Mondelez International, Inc., Class A | 129,194 | 8,459,623 |
| Tyson Foods, Inc., Class A | 27,304 | 2,529,989 |
| Total | | 33,744,140 |
| Household Products 1.4% |
| Church & Dwight Co., Inc. | 22,611 | 2,212,486 |
| Clorox Co. (The) | 11,379 | 1,658,944 |
| Colgate-Palmolive Co. | 78,060 | 6,006,717 |
| Kimberly-Clark Corp. | 31,185 | 4,058,728 |
| Procter & Gamble Co. (The) | 224,121 | 34,938,223 |
| Total | | 48,875,098 |
| Personal Products 0.2% |
| Estee Lauder Companies, Inc. (The), Class A | 21,459 | 6,358,946 |
| Tobacco 0.6% |
| Altria Group, Inc. | 170,131 | 8,726,019 |
| Philip Morris International, Inc. | 144,184 | 14,572,677 |
| Total | | 23,298,696 |
| Total Consumer Staples | 213,068,355 |
| Energy 3.6% |
| Energy Equipment & Services 0.3% |
| Baker Hughes Co. | 80,950 | 2,378,311 |
| Halliburton Co. | 82,900 | 2,779,637 |
| Schlumberger NV | 129,903 | 5,097,394 |
| Total | | 10,255,342 |
| Oil, Gas & Consumable Fuels 3.3% |
| APA Corp. | 33,644 | 1,198,736 |
| Chevron Corp. | 178,530 | 25,708,320 |
| ConocoPhillips Co. | 122,153 | 11,587,434 |
| Coterra Energy, Inc. | 75,349 | 1,757,892 |
| Devon Energy Corp. | 58,311 | 3,472,420 |
| Diamondback Energy, Inc. | 15,773 | 2,178,251 |
| EOG Resources, Inc. | 54,187 | 6,227,170 |
| Exxon Mobil Corp.(b) | 392,087 | 30,747,463 |
| Hess Corp. | 25,530 | 2,580,062 |
| Kinder Morgan, Inc. | 180,596 | 3,142,370 |
| Marathon Oil Corp. | 72,103 | 1,626,644 |
| Common Stocks (continued) |
| Issuer | Shares | Value ($) |
| Marathon Petroleum Corp. | 57,012 | 4,439,524 |
| Occidental Petroleum Corp. | 82,175 | 3,593,513 |
| ONEOK, Inc. | 41,300 | 2,696,890 |
| Phillips 66 | 40,581 | 3,418,543 |
| Pioneer Natural Resources Co. | 21,027 | 5,038,069 |
| Valero Energy Corp. | 37,864 | 3,162,023 |
| Williams Companies, Inc. (The) | 112,529 | 3,519,907 |
| Total | | 116,095,231 |
| Total Energy | 126,350,573 |
| Financials 11.4% |
| Banks 4.2% |
| Bank of America Corp. | 667,005 | 29,481,621 |
| Citigroup, Inc. | 183,771 | 10,884,756 |
| Citizens Financial Group, Inc. | 39,472 | 2,069,122 |
| Comerica, Inc. | 12,146 | 1,159,822 |
| Fifth Third Bancorp | 63,325 | 3,029,468 |
| First Republic Bank | 16,602 | 2,876,463 |
| Huntington Bancshares, Inc. | 133,962 | 2,079,090 |
| JPMorgan Chase & Co. | 273,699 | 38,810,518 |
| KeyCorp | 86,229 | 2,161,761 |
| M&T Bank Corp. | 11,918 | 2,171,817 |
| People’s United Financial, Inc. | 39,641 | 835,632 |
| PNC Financial Services Group, Inc. (The) | 39,142 | 7,799,043 |
| Regions Financial Corp. | 88,287 | 2,135,663 |
| Signature Bank | 5,615 | 1,936,557 |
| SVB Financial Group(a) | 5,435 | 3,293,610 |
| Truist Financial Corp. | 123,630 | 7,692,259 |
| U.S. Bancorp | 124,968 | 7,065,691 |
| Wells Fargo & Co. | 369,273 | 19,708,100 |
| Zions Bancorp | 14,491 | 1,027,267 |
| Total | | 146,218,260 |
| Capital Markets 3.0% |
| Ameriprise Financial, Inc.(c) | 10,363 | 3,106,724 |
| Bank of New York Mellon Corp. (The) | 70,364 | 3,739,847 |
| BlackRock, Inc. | 13,225 | 9,837,945 |
| Cboe Global Markets, Inc. | 9,877 | 1,158,473 |
| Charles Schwab Corp. (The) | 139,234 | 11,759,704 |
| CME Group, Inc. | 33,285 | 7,872,901 |
| Factset Research Systems, Inc. | 3,486 | 1,415,630 |
The accompanying Notes to Financial Statements are an integral part of this statement.
| 10 | Columbia Large Cap Index Fund | Annual Report 2022 |
Portfolio of Investments (continued)
February 28, 2022
| Common Stocks (continued) |
| Issuer | Shares | Value ($) |
| Franklin Resources, Inc. | 26,025 | 773,723 |
| Goldman Sachs Group, Inc. (The) | 31,439 | 10,729,816 |
| Intercontinental Exchange, Inc. | 52,179 | 6,685,174 |
| Invesco Ltd. | 31,608 | 671,354 |
| MarketAxess Holdings, Inc. | 3,522 | 1,343,396 |
| Moody’s Corp. | 14,979 | 4,823,687 |
| Morgan Stanley | 132,950 | 12,063,883 |
| MSCI, Inc. | 7,636 | 3,830,905 |
| Nasdaq, Inc. | 10,841 | 1,855,437 |
| Northern Trust Corp. | 19,232 | 2,190,525 |
| Raymond James Financial, Inc. | 17,153 | 1,880,826 |
| S&P Global, Inc. | 32,803 | 12,324,089 |
| State Street Corp. | 33,862 | 2,889,445 |
| T. Rowe Price Group, Inc. | 20,815 | 3,009,016 |
| Total | | 103,962,500 |
| Consumer Finance 0.6% |
| American Express Co. | 58,105 | 11,303,747 |
| Capital One Financial Corp. | 39,419 | 6,041,750 |
| Discover Financial Services | 27,143 | 3,350,532 |
| Synchrony Financial | 50,684 | 2,168,262 |
| Total | | 22,864,291 |
| Diversified Financial Services 1.6% |
| Berkshire Hathaway, Inc., Class B(a) | 169,611 | 54,521,456 |
| Insurance 2.0% |
| Aflac, Inc. | 56,365 | 3,443,337 |
| Allstate Corp. (The) | 26,550 | 3,248,658 |
| American International Group, Inc. | 76,897 | 4,709,172 |
| Aon PLC, Class A | 20,406 | 5,961,409 |
| Arthur J Gallagher & Co. | 19,197 | 3,036,773 |
| Assurant, Inc. | 5,277 | 895,560 |
| Brown & Brown, Inc. | 21,710 | 1,467,813 |
| Chubb Ltd. | 39,893 | 8,123,811 |
| Cincinnati Financial Corp. | 13,879 | 1,704,202 |
| Everest Re Group Ltd. | 3,646 | 1,087,310 |
| Globe Life, Inc. | 8,604 | 868,660 |
| Hartford Financial Services Group, Inc. (The) | 31,521 | 2,190,079 |
| Lincoln National Corp. | 15,732 | 1,060,651 |
| Loews Corp. | 18,561 | 1,138,532 |
| Common Stocks (continued) |
| Issuer | Shares | Value ($) |
| Marsh & McLennan Companies, Inc. | 46,760 | 7,266,972 |
| MetLife, Inc. | 66,218 | 4,473,026 |
| Principal Financial Group, Inc. | 22,831 | 1,612,782 |
| Progressive Corp. (The) | 54,185 | 5,739,817 |
| Prudential Financial, Inc. | 35,008 | 3,908,993 |
| Travelers Companies, Inc. (The) | 22,784 | 3,914,975 |
| Willis Towers Watson PLC | 11,540 | 2,565,342 |
| WR Berkley Corp. | 12,924 | 1,167,037 |
| Total | | 69,584,911 |
| Total Financials | 397,151,418 |
| Health Care 13.2% |
| Biotechnology 1.8% |
| AbbVie, Inc. | 163,730 | 24,194,382 |
| Amgen, Inc. | 52,166 | 11,814,556 |
| Biogen, Inc.(a) | 13,604 | 2,870,580 |
| Gilead Sciences, Inc. | 116,173 | 7,016,849 |
| Incyte Corp.(a) | 17,389 | 1,187,669 |
| Moderna, Inc.(a) | 32,669 | 5,017,958 |
| Regeneron Pharmaceuticals, Inc.(a) | 9,791 | 6,054,363 |
| Vertex Pharmaceuticals, Inc.(a) | 23,547 | 5,416,281 |
| Total | | 63,572,638 |
| Health Care Equipment & Supplies 3.0% |
| Abbott Laboratories | 163,768 | 19,753,696 |
| ABIOMED, Inc.(a) | 4,214 | 1,309,458 |
| Align Technology, Inc.(a) | 6,792 | 3,473,836 |
| Baxter International, Inc. | 46,371 | 3,940,144 |
| Becton Dickinson and Co. | 26,598 | 7,215,506 |
| Boston Scientific Corp.(a) | 131,974 | 5,829,292 |
| Cooper Companies, Inc. (The) | 4,566 | 1,867,585 |
| Dentsply Sirona, Inc. | 20,246 | 1,096,118 |
| DexCom, Inc.(a) | 8,976 | 3,715,256 |
| Edwards Lifesciences Corp.(a) | 57,822 | 6,497,458 |
| Hologic, Inc.(a) | 23,476 | 1,670,787 |
| IDEXX Laboratories, Inc.(a) | 7,853 | 4,180,545 |
| Intuitive Surgical, Inc.(a) | 33,061 | 9,598,600 |
| Medtronic PLC | 124,641 | 13,086,059 |
| ResMed, Inc. | 13,496 | 3,330,138 |
| STERIS PLC | 9,264 | 2,223,360 |
| Stryker Corp. | 31,095 | 8,188,868 |
The accompanying Notes to Financial Statements are an integral part of this statement.
Columbia Large Cap Index Fund | Annual Report 2022
| 11 |
Portfolio of Investments (continued)
February 28, 2022
| Common Stocks (continued) |
| Issuer | Shares | Value ($) |
| Teleflex, Inc. | 4,338 | 1,458,913 |
| West Pharmaceutical Services, Inc. | 6,861 | 2,655,756 |
| Zimmer Biomet Holdings, Inc. | 19,348 | 2,460,872 |
| Total | | 103,552,247 |
| Health Care Providers & Services 2.9% |
| AmerisourceBergen Corp. | 13,856 | 1,974,896 |
| Anthem, Inc. | 22,479 | 10,157,136 |
| Cardinal Health, Inc. | 26,097 | 1,409,499 |
| Centene Corp.(a) | 54,040 | 4,464,785 |
| Cigna Corp. | 30,695 | 7,298,657 |
| CVS Health Corp. | 122,256 | 12,671,835 |
| DaVita, Inc.(a) | 6,040 | 681,131 |
| HCA Healthcare, Inc. | 22,180 | 5,551,876 |
| Henry Schein, Inc.(a) | 12,843 | 1,109,378 |
| Humana, Inc. | 11,904 | 5,170,145 |
| Laboratory Corp. of America Holdings(a) | 8,863 | 2,404,177 |
| McKesson Corp. | 14,140 | 3,887,934 |
| Quest Diagnostics, Inc. | 11,361 | 1,491,359 |
| UnitedHealth Group, Inc. | 87,228 | 41,509,188 |
| Universal Health Services, Inc., Class B | 6,772 | 974,694 |
| Total | | 100,756,690 |
| Health Care Technology 0.1% |
| Cerner Corp. | 27,249 | 2,540,969 |
| Life Sciences Tools & Services 1.7% |
| Agilent Technologies, Inc. | 28,036 | 3,654,773 |
| Bio-Rad Laboratories, Inc., Class A(a) | 2,001 | 1,252,546 |
| Bio-Techne Corp. | 3,639 | 1,526,233 |
| Charles River Laboratories International, Inc.(a) | 4,674 | 1,360,882 |
| Danaher Corp. | 58,900 | 16,162,749 |
| Illumina, Inc.(a) | 14,476 | 4,727,861 |
| IQVIA Holdings, Inc.(a) | 17,693 | 4,071,513 |
| Mettler-Toledo International, Inc.(a) | 2,129 | 2,999,207 |
| PerkinElmer, Inc. | 11,688 | 2,099,282 |
| Thermo Fisher Scientific, Inc. | 36,494 | 19,852,736 |
| Waters Corp.(a) | 5,653 | 1,790,475 |
| Total | | 59,498,257 |
| Common Stocks (continued) |
| Issuer | Shares | Value ($) |
| Pharmaceuticals 3.7% |
| Bristol-Myers Squibb Co. | 205,570 | 14,116,492 |
| Catalent, Inc.(a) | 15,854 | 1,617,742 |
| Eli Lilly & Co. | 73,533 | 18,379,573 |
| Johnson & Johnson | 243,815 | 40,124,635 |
| Merck & Co., Inc. | 233,937 | 17,914,896 |
| Organon & Co. | 23,482 | 876,583 |
| Pfizer, Inc. | 519,829 | 24,400,773 |
| Viatris, Inc. | 112,007 | 1,233,197 |
| Zoetis, Inc. | 43,818 | 8,485,356 |
| Total | | 127,149,247 |
| Total Health Care | 457,070,048 |
| Industrials 7.8% |
| Aerospace & Defense 1.6% |
| Boeing Co. (The)(a) | 51,163 | 10,505,810 |
| General Dynamics Corp. | 21,464 | 5,032,235 |
| Howmet Aerospace, Inc. | 35,610 | 1,279,111 |
| Huntington Ingalls Industries, Inc. | 3,710 | 758,324 |
| L3Harris Technologies, Inc. | 18,173 | 4,585,230 |
| Lockheed Martin Corp. | 22,732 | 9,861,142 |
| Northrop Grumman Corp. | 13,802 | 6,102,416 |
| Raytheon Technologies Corp. | 138,622 | 14,236,479 |
| Textron, Inc. | 20,414 | 1,492,876 |
| TransDigm Group, Inc.(a) | 4,849 | 3,232,295 |
| Total | | 57,085,918 |
| Air Freight & Logistics 0.6% |
| CH Robinson Worldwide, Inc. | 12,039 | 1,163,930 |
| Expeditors International of Washington, Inc. | 15,689 | 1,621,615 |
| FedEx Corp. | 22,635 | 5,031,081 |
| United Parcel Service, Inc., Class B | 67,530 | 14,209,663 |
| Total | | 22,026,289 |
| Airlines 0.2% |
| Alaska Air Group, Inc.(a) | 11,605 | 651,505 |
| American Airlines Group, Inc.(a) | 59,969 | 1,034,465 |
| Delta Air Lines, Inc.(a) | 59,274 | 2,366,218 |
| Southwest Airlines Co.(a) | 54,820 | 2,401,116 |
| United Airlines Holdings, Inc.(a) | 29,989 | 1,331,512 |
| Total | | 7,784,816 |
The accompanying Notes to Financial Statements are an integral part of this statement.
| 12 | Columbia Large Cap Index Fund | Annual Report 2022 |
Portfolio of Investments (continued)
February 28, 2022
| Common Stocks (continued) |
| Issuer | Shares | Value ($) |
| Building Products 0.5% |
| Allegion PLC | 8,307 | 951,318 |
| AO Smith Corp. | 12,335 | 845,934 |
| Carrier Global Corp. | 80,258 | 3,601,979 |
| Fortune Brands Home & Security, Inc. | 12,571 | 1,092,420 |
| Johnson Controls International PLC | 65,635 | 4,263,650 |
| Masco Corp. | 22,606 | 1,266,840 |
| Trane Technologies PLC | 22,000 | 3,386,460 |
| Total | | 15,408,601 |
| Commercial Services & Supplies 0.4% |
| Cintas Corp. | 8,140 | 3,055,105 |
| Copart, Inc.(a) | 19,763 | 2,428,477 |
| Republic Services, Inc. | 19,382 | 2,331,267 |
| Rollins, Inc. | 20,962 | 683,990 |
| Waste Management, Inc. | 35,643 | 5,146,849 |
| Total | | 13,645,688 |
| Construction & Engineering 0.1% |
| Quanta Services, Inc. | 13,197 | 1,437,681 |
| Electrical Equipment 0.5% |
| AMETEK, Inc. | 21,424 | 2,780,621 |
| Eaton Corp. PLC | 36,916 | 5,695,770 |
| Emerson Electric Co. | 55,365 | 5,144,516 |
| Generac Holdings, Inc.(a) | 5,843 | 1,843,291 |
| Rockwell Automation, Inc. | 10,742 | 2,863,602 |
| Total | | 18,327,800 |
| Industrial Conglomerates 1.0% |
| 3M Co. | 53,369 | 7,933,302 |
| General Electric Co. | 101,703 | 9,713,654 |
| Honeywell International, Inc. | 63,758 | 12,098,080 |
| Roper Technologies, Inc. | 9,769 | 4,378,661 |
| Total | | 34,123,697 |
| Machinery 1.5% |
| Caterpillar, Inc. | 50,099 | 9,397,570 |
| Cummins, Inc. | 13,247 | 2,703,978 |
| Deere & Co. | 26,132 | 9,408,042 |
| Dover Corp. | 13,335 | 2,091,728 |
| Fortive Corp. | 33,209 | 2,150,283 |
| IDEX Corp. | 7,042 | 1,351,360 |
| Common Stocks (continued) |
| Issuer | Shares | Value ($) |
| Illinois Tool Works, Inc. | 26,453 | 5,722,842 |
| Ingersoll Rand, Inc. | 37,748 | 1,907,029 |
| Nordson Corp. | 5,004 | 1,133,356 |
| Otis Worldwide Corp. | 39,340 | 3,081,502 |
| PACCAR, Inc. | 32,153 | 2,951,967 |
| Parker-Hannifin Corp. | 11,957 | 3,543,935 |
| Pentair PLC | 15,326 | 887,529 |
| Snap-On, Inc. | 4,976 | 1,045,856 |
| Stanley Black & Decker, Inc. | 15,099 | 2,456,607 |
| Westinghouse Air Brake Technologies Corp. | 17,302 | 1,605,972 |
| Xylem, Inc. | 16,701 | 1,485,554 |
| Total | | 52,925,110 |
| Professional Services 0.3% |
| Equifax, Inc. | 11,299 | 2,467,024 |
| Jacobs Engineering Group, Inc. | 12,069 | 1,484,487 |
| Leidos Holdings, Inc. | 12,997 | 1,323,614 |
| Nielsen Holdings PLC | 33,230 | 578,867 |
| Robert Half International, Inc. | 10,311 | 1,240,310 |
| Verisk Analytics, Inc. | 14,926 | 2,646,977 |
| Total | | 9,741,279 |
| Road & Rail 0.9% |
| CSX Corp. | 205,416 | 6,965,657 |
| JB Hunt Transport Services, Inc. | 7,781 | 1,578,998 |
| Norfolk Southern Corp. | 22,537 | 5,781,191 |
| Old Dominion Freight Line, Inc. | 8,628 | 2,709,451 |
| Union Pacific Corp. | 59,539 | 14,643,617 |
| Total | | 31,678,914 |
| Trading Companies & Distributors 0.2% |
| Fastenal Co. | 53,268 | 2,741,171 |
| United Rentals, Inc.(a) | 6,705 | 2,156,462 |
| W.W. Grainger, Inc. | 4,008 | 1,912,057 |
| Total | | 6,809,690 |
| Total Industrials | 270,995,483 |
The accompanying Notes to Financial Statements are an integral part of this statement.
Columbia Large Cap Index Fund | Annual Report 2022
| 13 |
Portfolio of Investments (continued)
February 28, 2022
| Common Stocks (continued) |
| Issuer | Shares | Value ($) |
| Information Technology 27.7% |
| Communications Equipment 0.9% |
| Arista Networks, Inc.(a) | 20,775 | 2,549,716 |
| Cisco Systems, Inc. | 390,611 | 21,784,375 |
| F5, Inc.(a) | 5,586 | 1,121,948 |
| Juniper Networks, Inc. | 30,116 | 1,017,620 |
| Motorola Solutions, Inc. | 15,642 | 3,447,966 |
| Total | | 29,921,625 |
| Electronic Equipment, Instruments & Components 0.6% |
| Amphenol Corp., Class A | 55,386 | 4,209,890 |
| CDW Corp. | 12,570 | 2,167,822 |
| Corning, Inc. | 71,134 | 2,873,813 |
| IPG Photonics Corp.(a) | 3,308 | 431,198 |
| Keysight Technologies, Inc.(a) | 17,059 | 2,684,575 |
| TE Connectivity Ltd. | 30,221 | 4,304,377 |
| Teledyne Technologies, Inc.(a) | 4,321 | 1,855,351 |
| Trimble Navigation Ltd.(a) | 23,247 | 1,621,478 |
| Zebra Technologies Corp., Class A(a) | 4,949 | 2,045,620 |
| Total | | 22,194,124 |
| IT Services 4.2% |
| Accenture PLC, Class A | 58,499 | 18,486,854 |
| Akamai Technologies, Inc.(a) | 15,048 | 1,629,097 |
| Automatic Data Processing, Inc. | 39,026 | 7,978,475 |
| Broadridge Financial Solutions, Inc. | 10,797 | 1,578,629 |
| Cognizant Technology Solutions Corp., Class A | 48,646 | 4,189,880 |
| DXC Technology Co.(a) | 23,361 | 794,975 |
| EPAM Systems, Inc.(a) | 5,253 | 1,091,311 |
| Fidelity National Information Services, Inc. | 56,396 | 5,370,591 |
| Fiserv, Inc.(a) | 55,032 | 5,374,975 |
| FleetCor Technologies, Inc.(a) | 7,520 | 1,761,184 |
| Gartner, Inc.(a) | 7,616 | 2,135,679 |
| Global Payments, Inc. | 26,872 | 3,584,187 |
| International Business Machines Corp. | 83,056 | 10,175,191 |
| Jack Henry & Associates, Inc. | 6,857 | 1,212,318 |
| MasterCard, Inc., Class A | 80,342 | 28,989,000 |
| Paychex, Inc. | 29,722 | 3,538,701 |
| PayPal Holdings, Inc.(a) | 108,815 | 12,179,663 |
| Common Stocks (continued) |
| Issuer | Shares | Value ($) |
| VeriSign, Inc.(a) | 8,950 | 1,912,794 |
| Visa, Inc., Class A | 155,313 | 33,566,246 |
| Total | | 145,549,750 |
| Semiconductors & Semiconductor Equipment 6.0% |
| Advanced Micro Devices, Inc.(a) | 151,405 | 18,674,293 |
| Analog Devices, Inc. | 49,772 | 7,977,954 |
| Applied Materials, Inc. | 83,624 | 11,222,341 |
| Broadcom, Inc. | 38,121 | 22,393,800 |
| Enphase Energy, Inc.(a) | 12,495 | 2,082,916 |
| Intel Corp. | 376,661 | 17,966,730 |
| KLA Corp. | 14,042 | 4,893,637 |
| Lam Research Corp. | 13,040 | 7,320,004 |
| Microchip Technology, Inc. | 51,389 | 3,614,188 |
| Micron Technology, Inc. | 103,600 | 9,205,896 |
| Monolithic Power Systems, Inc. | 4,013 | 1,840,763 |
| NVIDIA Corp. | 231,535 | 56,459,810 |
| NXP Semiconductors NV | 24,629 | 4,682,465 |
| Qorvo, Inc.(a) | 10,208 | 1,396,250 |
| QUALCOMM, Inc. | 103,728 | 17,840,179 |
| Skyworks Solutions, Inc. | 15,295 | 2,113,310 |
| SolarEdge Technologies, Inc.(a) | 4,864 | 1,553,659 |
| Teradyne, Inc. | 15,096 | 1,780,120 |
| Texas Instruments, Inc. | 85,531 | 14,539,415 |
| Total | | 207,557,730 |
| Software 8.9% |
| Adobe, Inc.(a) | 44,066 | 20,608,787 |
| ANSYS, Inc.(a) | 8,081 | 2,619,779 |
| Autodesk, Inc.(a) | 20,361 | 4,484,103 |
| Cadence Design Systems, Inc.(a) | 25,667 | 3,886,754 |
| Ceridian HCM Holding, Inc.(a) | 12,614 | 919,687 |
| Citrix Systems, Inc. | 11,551 | 1,183,977 |
| Fortinet, Inc.(a) | 12,568 | 4,329,927 |
| Intuit, Inc. | 26,225 | 12,440,353 |
| Microsoft Corp. | 695,343 | 207,761,535 |
| NortonLifeLock, Inc. | 53,879 | 1,561,413 |
| Oracle Corp. | 149,375 | 11,348,019 |
| Paycom Software, Inc.(a) | 4,458 | 1,512,198 |
| PTC, Inc.(a) | 9,784 | 1,088,764 |
| Salesforce.com, Inc.(a) | 90,669 | 19,088,545 |
The accompanying Notes to Financial Statements are an integral part of this statement.
| 14 | Columbia Large Cap Index Fund | Annual Report 2022 |
Portfolio of Investments (continued)
February 28, 2022
| Common Stocks (continued) |
| Issuer | Shares | Value ($) |
| ServiceNow, Inc.(a) | 18,430 | 10,687,926 |
| Synopsys, Inc.(a) | 14,124 | 4,412,196 |
| Tyler Technologies, Inc.(a) | 3,795 | 1,625,247 |
| Total | | 309,559,210 |
| Technology Hardware, Storage & Peripherals 7.1% |
| Apple, Inc. | 1,443,487 | 238,348,574 |
| Hewlett Packard Enterprise Co. | 121,144 | 1,928,613 |
| HP, Inc. | 106,739 | 3,667,552 |
| NetApp, Inc. | 20,711 | 1,623,328 |
| Seagate Technology Holdings PLC | 18,970 | 1,956,945 |
| Western Digital Corp.(a) | 28,861 | 1,470,179 |
| Total | | 248,995,191 |
| Total Information Technology | 963,777,630 |
| Materials 2.5% |
| Chemicals 1.7% |
| Air Products & Chemicals, Inc. | 20,501 | 4,844,387 |
| Albemarle Corp. | 10,834 | 2,122,272 |
| Celanese Corp., Class A | 10,083 | 1,404,360 |
| CF Industries Holdings, Inc. | 19,863 | 1,612,677 |
| Corteva, Inc. | 67,507 | 3,512,389 |
| Dow, Inc. | 68,499 | 4,038,701 |
| DuPont de Nemours, Inc. | 47,984 | 3,712,522 |
| Eastman Chemical Co. | 12,451 | 1,475,070 |
| Ecolab, Inc. | 23,090 | 4,069,844 |
| FMC Corp. | 11,739 | 1,376,398 |
| International Flavors & Fragrances, Inc. | 23,573 | 3,135,209 |
| Linde PLC | 47,470 | 13,920,103 |
| LyondellBasell Industries NV, Class A | 24,348 | 2,367,356 |
| Mosaic Co. (The) | 34,305 | 1,798,611 |
| PPG Industries, Inc. | 21,987 | 2,934,165 |
| Sherwin-Williams Co. (The) | 22,340 | 5,878,324 |
| Total | | 58,202,388 |
| Construction Materials 0.1% |
| Martin Marietta Materials, Inc. | 5,777 | 2,191,794 |
| Vulcan Materials Co. | 12,290 | 2,230,020 |
| Total | | 4,421,814 |
| Common Stocks (continued) |
| Issuer | Shares | Value ($) |
| Containers & Packaging 0.3% |
| Amcor PLC | 141,993 | 1,651,379 |
| Avery Dennison Corp. | 7,668 | 1,351,102 |
| Ball Corp. | 29,997 | 2,691,931 |
| International Paper Co. | 35,866 | 1,561,247 |
| Packaging Corp. of America | 8,797 | 1,294,830 |
| Sealed Air Corp. | 13,721 | 921,091 |
| WestRock Co. | 24,728 | 1,119,436 |
| Total | | 10,591,016 |
| Metals & Mining 0.4% |
| Freeport-McMoRan, Inc. | 136,001 | 6,385,247 |
| Newmont Corp. | 73,854 | 4,889,135 |
| Nucor Corp. | 26,469 | 3,483,849 |
| Total | | 14,758,231 |
| Total Materials | 87,973,449 |
| Real Estate 2.6% |
| Equity Real Estate Investment Trusts (REITS) 2.5% |
| Alexandria Real Estate Equities, Inc. | 13,060 | 2,473,564 |
| American Tower Corp. | 42,178 | 9,568,923 |
| AvalonBay Communities, Inc. | 12,942 | 3,087,832 |
| Boston Properties, Inc. | 13,165 | 1,610,211 |
| Crown Castle International Corp. | 40,028 | 6,668,264 |
| Digital Realty Trust, Inc. | 26,283 | 3,546,102 |
| Duke Realty Corp. | 35,272 | 1,869,416 |
| Equinix, Inc. | 8,339 | 5,918,438 |
| Equity Residential | 31,606 | 2,695,992 |
| Essex Property Trust, Inc. | 6,028 | 1,911,901 |
| Extra Space Storage, Inc. | 12,400 | 2,333,060 |
| Federal Realty Investment Trust(a) | 6,484 | 762,389 |
| Healthpeak Properties, Inc. | 49,926 | 1,550,702 |
| Host Hotels & Resorts, Inc.(a) | 66,130 | 1,208,195 |
| Iron Mountain, Inc. | 26,816 | 1,318,811 |
| Kimco Realty Corp. | 57,090 | 1,343,328 |
| Mid-America Apartment Communities, Inc. | 10,663 | 2,181,756 |
| Prologis, Inc. | 68,472 | 9,986,641 |
| Public Storage | 14,129 | 5,016,078 |
| Realty Income Corp. | 52,398 | 3,462,984 |
| Regency Centers Corp. | 14,271 | 940,316 |
The accompanying Notes to Financial Statements are an integral part of this statement.
Columbia Large Cap Index Fund | Annual Report 2022
| 15 |
Portfolio of Investments (continued)
February 28, 2022
| Common Stocks (continued) |
| Issuer | Shares | Value ($) |
| SBA Communications Corp. | 10,075 | 3,056,654 |
| Simon Property Group, Inc. | 30,434 | 4,186,501 |
| UDR, Inc. | 26,917 | 1,476,936 |
| Ventas, Inc. | 36,969 | 1,996,326 |
| Vornado Realty Trust | 14,725 | 637,298 |
| Welltower, Inc. | 40,313 | 3,357,670 |
| Weyerhaeuser Co. | 69,372 | 2,697,183 |
| Total | | 86,863,471 |
| Real Estate Management & Development 0.1% |
| CBRE Group, Inc., Class A(a) | 30,995 | 3,001,866 |
| Total Real Estate | 89,865,337 |
| Utilities 2.5% |
| Electric Utilities 1.6% |
| Alliant Energy Corp. | 23,187 | 1,354,121 |
| American Electric Power Co., Inc. | 46,645 | 4,228,369 |
| Constellation Energy Corp. | 30,202 | 1,388,688 |
| Duke Energy Corp. | 71,240 | 7,153,208 |
| Edison International | 35,185 | 2,231,433 |
| Entergy Corp. | 18,614 | 1,958,379 |
| Evergy, Inc. | 21,237 | 1,325,401 |
| Eversource Energy | 31,841 | 2,604,594 |
| Exelon Corp. | 90,606 | 3,856,191 |
| FirstEnergy Corp. | 50,421 | 2,110,119 |
| NextEra Energy, Inc. | 181,721 | 14,223,303 |
| NRG Energy, Inc. | 22,675 | 858,022 |
| Pinnacle West Capital Corp. | 10,449 | 740,103 |
| PPL Corp. | 69,527 | 1,819,521 |
| Southern Co. (The) | 98,153 | 6,357,370 |
| Xcel Energy, Inc. | 49,889 | 3,359,026 |
| Total | | 55,567,848 |
| Common Stocks (continued) |
| Issuer | Shares | Value ($) |
| Gas Utilities 0.0% |
| Atmos Energy Corp. | 12,264 | 1,346,710 |
| Independent Power and Renewable Electricity Producers 0.0% |
| AES Corp. (The) | 61,747 | 1,310,889 |
| Multi-Utilities 0.8% |
| Ameren Corp. | 23,858 | 2,050,595 |
| CenterPoint Energy, Inc. | 58,242 | 1,592,919 |
| CMS Energy Corp. | 26,830 | 1,717,388 |
| Consolidated Edison, Inc. | 32,762 | 2,809,997 |
| Dominion Energy, Inc. | 75,009 | 5,965,466 |
| DTE Energy Co. | 17,942 | 2,181,568 |
| NiSource, Inc. | 36,370 | 1,052,184 |
| Public Service Enterprise Group, Inc. | 46,832 | 3,036,119 |
| Sempra Energy | 29,575 | 4,265,306 |
| WEC Energy Group, Inc. | 29,214 | 2,654,968 |
| Total | | 27,326,510 |
| Water Utilities 0.1% |
| American Water Works Co., Inc. | 16,813 | 2,540,276 |
| Total Utilities | 88,092,233 |
Total Common Stocks
(Cost $899,557,501) | 3,430,748,749 |
|
| Money Market Funds 1.4% |
| | Shares | Value ($) |
| Columbia Short-Term Cash Fund, 0.168%(c),(d) | 48,502,422 | 48,487,871 |
Total Money Market Funds
(Cost $48,490,231) | 48,487,871 |
Total Investments in Securities
(Cost: $948,047,732) | 3,479,236,620 |
| Other Assets & Liabilities, Net | | (180,992) |
| Net Assets | 3,479,055,628 |
At February 28, 2022, securities and/or cash totaling $4,273,890 were pledged as collateral.
Investments in derivatives
| Long futures contracts |
| Description | Number of
contracts | Expiration
date | Trading
currency | Notional
amount | Value/Unrealized
appreciation ($) | Value/Unrealized
depreciation ($) |
| S&P 500 Index E-mini | 224 | 03/2022 | USD | 48,921,600 | — | (599,077) |
The accompanying Notes to Financial Statements are an integral part of this statement.
| 16 | Columbia Large Cap Index Fund | Annual Report 2022 |
Portfolio of Investments (continued)
February 28, 2022
Notes to Portfolio of Investments
| (a) | Non-income producing investment. |
| (b) | This security or a portion of this security has been pledged as collateral in connection with derivative contracts. |
| (c) | As defined in the Investment Company Act of 1940, as amended, an affiliated company is one in which the Fund owns 5% or more of the company’s outstanding voting securities, or a company which is under common ownership or control with the Fund. The value of the holdings and transactions in these affiliated companies during the year ended February 28, 2022 are as follows: |
| Affiliated issuers | Beginning
of period($) | Purchases($) | Sales($) | Net change in
unrealized
appreciation
(depreciation)($) | End of
period($) | Realized gain
(loss)($) | Dividends($) | End of
period shares |
| Ameriprise Financial, Inc. |
| | 2,984,085 | — | (67,257) | 189,896 | 3,106,724 | 763,979 | 51,394 | 10,363 |
| Columbia Short-Term Cash Fund, 0.168% |
| | 17,686,035 | 484,271,430 | (453,463,199) | (6,395) | 48,487,871 | (5,926) | 26,815 | 48,502,422 |
| Total | 20,670,120 | | | 183,501 | 51,594,595 | 758,053 | 78,209 | |
| (d) | The rate shown is the seven-day current annualized yield at February 28, 2022. |
Currency Legend
Fair value measurements
The Fund categorizes its fair value measurements according to a three-level hierarchy that maximizes the use of observable inputs and minimizes the use of unobservable inputs by prioritizing that the most observable input be used when available. Observable inputs are those that market participants would use in pricing an investment based on market data obtained from sources independent of the reporting entity. Unobservable inputs are those that reflect the Fund’s assumptions about the information market participants would use in pricing an investment. An investment’s level within the fair value hierarchy is based on the lowest level of any input that is deemed significant to the asset’s or liability’s fair value measurement. The input levels are not necessarily an indication of the risk or liquidity associated with investments at that level. For example, certain U.S. government securities are generally high quality and liquid, however, they are reflected as Level 2 because the inputs used to determine fair value may not always be quoted prices in an active market.
Fair value inputs are summarized in the three broad levels listed below:
| ■ | Level 1 — Valuations based on quoted prices for investments in active markets that the Fund has the ability to access at the measurement date. Valuation adjustments are not applied to Level 1 investments. |
| ■ | Level 2 — Valuations based on other significant observable inputs (including quoted prices for similar securities, interest rates, prepayment speeds, credit risks, etc.). |
| ■ | Level 3 — Valuations based on significant unobservable inputs (including the Fund’s own assumptions and judgment in determining the fair value of investments). |
Inputs that are used in determining fair value of an investment may include price information, credit data, volatility statistics, and other factors. These inputs can be either observable or unobservable. The availability of observable inputs can vary between investments, and is affected by various factors such as the type of investment, and the volume and level of activity for that investment or similar investments in the marketplace. The inputs will be considered by the Investment Manager, along with any other relevant factors in the calculation of an investment’s fair value. The Fund uses prices and inputs that are current as of the measurement date, which may include periods of market dislocations. During these periods, the availability of prices and inputs may be reduced for many investments. This condition could cause an investment to be reclassified between the various levels within the hierarchy.
Investments falling into the Level 3 category are primarily supported by quoted prices from brokers and dealers participating in the market for those investments. However, these may be classified as Level 3 investments due to lack of market transparency and corroboration to support these quoted prices. Additionally, valuation models may be used as the pricing source for any remaining investments classified as Level 3. These models may rely on one or more significant unobservable inputs and/or significant assumptions by the Investment Manager. Inputs used in valuations may include, but are not limited to, financial statement analysis, capital account balances, discount rates and estimated cash flows, and comparable company data.
Under the direction of the Fund’s Board of Trustees (the Board), the Investment Manager’s Valuation Committee (the Committee) is responsible for overseeing the valuation procedures approved by the Board. The Committee consists of voting and non-voting members from various groups within the Investment Manager’s organization, including operations and accounting, trading and investments, compliance, risk management and legal.
The Committee meets at least monthly to review and approve valuation matters, which may include a description of specific valuation determinations, data regarding pricing information received from approved pricing vendors and brokers and the results of Board-approved valuation control policies and procedures (the Policies). The Policies address, among other things, instances when market quotations are or are not readily available, including recommendations of third party pricing vendors and a determination of appropriate pricing methodologies; events that require specific valuation determinations and assessment of fair value techniques; securities with a potential for stale pricing, including those that are illiquid, restricted, or in default; and the effectiveness of third party pricing vendors, including periodic reviews of vendors. The Committee meets more frequently, as needed, to discuss additional valuation matters, which may include the need to review back-testing results, review time-sensitive information or approve related valuation actions. The Committee reports to the Board, with members of the Committee meeting with the Board at each of its regularly scheduled meetings to discuss valuation matters and actions during the period, similar to those described earlier.
The accompanying Notes to Financial Statements are an integral part of this statement.
Columbia Large Cap Index Fund | Annual Report 2022
| 17 |
Portfolio of Investments (continued)
February 28, 2022
Fair value measurements (continued)
The following table is a summary of the inputs used to value the Fund’s investments at February 28, 2022:
| | Level 1 ($) | Level 2 ($) | Level 3 ($) | Total ($) |
| Investments in Securities | | | | |
| Common Stocks | | | | |
| Communication Services | 330,589,775 | — | — | 330,589,775 |
| Consumer Discretionary | 405,814,448 | — | — | 405,814,448 |
| Consumer Staples | 213,068,355 | — | — | 213,068,355 |
| Energy | 126,350,573 | — | — | 126,350,573 |
| Financials | 397,151,418 | — | — | 397,151,418 |
| Health Care | 457,070,048 | — | — | 457,070,048 |
| Industrials | 270,995,483 | — | — | 270,995,483 |
| Information Technology | 963,777,630 | — | — | 963,777,630 |
| Materials | 87,973,449 | — | — | 87,973,449 |
| Real Estate | 89,865,337 | — | — | 89,865,337 |
| Utilities | 88,092,233 | — | — | 88,092,233 |
| Total Common Stocks | 3,430,748,749 | — | — | 3,430,748,749 |
| Money Market Funds | 48,487,871 | — | — | 48,487,871 |
| Total Investments in Securities | 3,479,236,620 | — | — | 3,479,236,620 |
| Investments in Derivatives | | | | |
| Liability | | | | |
| Futures Contracts | (599,077) | — | — | (599,077) |
| Total | 3,478,637,543 | — | — | 3,478,637,543 |
See the Portfolio of Investments for all investment classifications not indicated in the table.
Derivative instruments are valued at unrealized appreciation (depreciation).
The accompanying Notes to Financial Statements are an integral part of this statement.
| 18 | Columbia Large Cap Index Fund | Annual Report 2022 |
Statement of Assets and Liabilities
February 28, 2022
| Assets | |
| Investments in securities, at value | |
| Unaffiliated issuers (cost $899,342,258) | $3,427,642,025 |
| Affiliated issuers (cost $48,705,474) | 51,594,595 |
| Cash | 6,278 |
| Receivable for: | |
| Capital shares sold | 1,902,065 |
| Dividends | 4,551,828 |
| Foreign tax reclaims | 996 |
| Variation margin for futures contracts | 770 |
| Expense reimbursement due from Investment Manager | 310 |
| Total assets | 3,485,698,867 |
| Liabilities | |
| Payable for: | |
| Capital shares purchased | 6,116,486 |
| Variation margin for futures contracts | 147,600 |
| Management services fees | 57,402 |
| Distribution and/or service fees | 10,989 |
| Compensation of board members | 310,762 |
| Total liabilities | 6,643,239 |
| Net assets applicable to outstanding capital stock | $3,479,055,628 |
| Represented by | |
| Paid in capital | 818,043,064 |
| Total distributable earnings (loss) | 2,661,012,564 |
| Total - representing net assets applicable to outstanding capital stock | $3,479,055,628 |
| Class A | |
| Net assets | $529,310,427 |
| Shares outstanding | 9,394,937 |
| Net asset value per share | $56.34 |
| Institutional Class | |
| Net assets | $2,497,279,469 |
| Shares outstanding | 43,951,254 |
| Net asset value per share | $56.82 |
| Institutional 2 Class | |
| Net assets | $379,871,978 |
| Shares outstanding | 6,546,830 |
| Net asset value per share | $58.02 |
| Institutional 3 Class | |
| Net assets | $72,593,754 |
| Shares outstanding | 1,305,981 |
| Net asset value per share | $55.59 |
The accompanying Notes to Financial Statements are an integral part of this statement.
Columbia Large Cap Index Fund | Annual Report 2022
| 19 |
Statement of Operations
Year Ended February 28, 2022
| Net investment income | |
| Income: | |
| Dividends — unaffiliated issuers | $51,896,913 |
| Dividends — affiliated issuers | 78,209 |
| Foreign taxes withheld | (6,853) |
| Total income | 51,968,269 |
| Expenses: | |
| Management services fees | 7,592,485 |
| Distribution and/or service fees | |
| Class A | 1,500,439 |
| Compensation of board members | 100,581 |
| Interest on collateral | 967 |
| Total expenses | 9,194,472 |
| Fees waived or expenses reimbursed by Investment Manager and its affiliates | (100,580) |
| Expense reduction | (1,599) |
| Total net expenses | 9,092,293 |
| Net investment income | 42,875,976 |
| Realized and unrealized gain (loss) — net | |
| Net realized gain (loss) on: | |
| Investments — unaffiliated issuers | 562,367,854 |
| Investments — affiliated issuers | 758,053 |
| Futures contracts | 7,822,328 |
| Net realized gain | 570,948,235 |
| Net change in unrealized appreciation (depreciation) on: | |
| Investments — unaffiliated issuers | (27,223,093) |
| Investments — affiliated issuers | 183,501 |
| Futures contracts | (1,088,533) |
| Net change in unrealized appreciation (depreciation) | (28,128,125) |
| Net realized and unrealized gain | 542,820,110 |
| Net increase in net assets resulting from operations | $585,696,086 |
The accompanying Notes to Financial Statements are an integral part of this statement.
| 20 | Columbia Large Cap Index Fund | Annual Report 2022 |
Statement of Changes in Net Assets
| | Year Ended
February 28, 2022 | Year Ended
February 28, 2021 |
| Operations | | |
| Net investment income | $42,875,976 | $54,810,752 |
| Net realized gain | 570,948,235 | 213,190,861 |
| Net change in unrealized appreciation (depreciation) | (28,128,125) | 679,378,208 |
| Net increase in net assets resulting from operations | 585,696,086 | 947,379,821 |
| Distributions to shareholders | | |
| Net investment income and net realized gains | | |
| Class A | (91,728,044) | (43,630,444) |
| Institutional Class | (419,937,711) | (175,685,793) |
| Institutional 2 Class | (64,117,563) | (26,445,019) |
| Institutional 3 Class | (12,469,784) | (16,609,539) |
| Total distributions to shareholders | (588,253,102) | (262,370,795) |
| Decrease in net assets from capital stock activity | (217,347,737) | (65,602,628) |
| Total increase (decrease) in net assets | (219,904,753) | 619,406,398 |
| Net assets at beginning of year | 3,698,960,381 | 3,079,553,983 |
| Net assets at end of year | $3,479,055,628 | $3,698,960,381 |
| | Year Ended | Year Ended |
| | February 28, 2022 | February 28, 2021 |
| | Shares | Dollars ($) | Shares | Dollars ($) |
| Capital stock activity |
| Class A | | | | |
| Subscriptions | 1,943,795 | 118,991,557 | 2,406,919 | 119,240,592 |
| Distributions reinvested | 1,396,652 | 84,972,068 | 791,433 | 40,464,807 |
| Redemptions | (4,258,462) | (263,267,391) | (5,182,455) | (258,573,583) |
| Net decrease | (918,015) | (59,303,766) | (1,984,103) | (98,868,184) |
| Institutional Class | | | | |
| Subscriptions | 4,162,816 | 257,012,616 | 7,620,149 | 384,230,990 |
| Distributions reinvested | 5,816,571 | 356,591,794 | 2,868,850 | 148,454,404 |
| Redemptions | (8,482,728) | (535,721,305) | (13,074,721) | (664,658,369) |
| Net increase (decrease) | 1,496,659 | 77,883,105 | (2,585,722) | (131,972,975) |
| Institutional 2 Class | | | | |
| Subscriptions | 1,169,174 | 75,340,440 | 1,761,647 | 88,895,172 |
| Distributions reinvested | 1,010,920 | 63,261,083 | 494,119 | 26,039,449 |
| Redemptions | (2,185,803) | (141,189,263) | (2,164,828) | (113,594,354) |
| Net increase (decrease) | (5,709) | (2,587,740) | 90,938 | 1,340,267 |
| Institutional 3 Class | | | | |
| Subscriptions | 224,600 | 13,353,125 | 7,103,264 | 302,417,230 |
| Distributions reinvested | 201,551 | 12,095,264 | 323,937 | 16,596,829 |
| Redemptions | (4,160,725) | (258,787,725) | (3,485,931) | (155,115,795) |
| Net increase (decrease) | (3,734,574) | (233,339,336) | 3,941,270 | 163,898,264 |
| Total net decrease | (3,161,639) | (217,347,737) | (537,617) | (65,602,628) |
The accompanying Notes to Financial Statements are an integral part of this statement.
Columbia Large Cap Index Fund | Annual Report 2022
| 21 |
The following table is intended to help you understand the Fund’s financial performance. Certain information reflects financial results for a single share of a class held for the periods shown. Per share net investment income (loss) amounts are calculated based on average shares outstanding during the period. Total return assumes reinvestment of all dividends and distributions, if any. Total return does not reflect payment of sales charges, if any. Total return and portfolio turnover are not annualized for periods of less than one year. The portfolio turnover rate is calculated without regard to purchase and sales transactions of short-term instruments and certain derivatives, if any. If such transactions were included, the Fund’s portfolio turnover rate may be higher.
| | Net asset value,
beginning of
period | Net
investment
income | Net
realized
and
unrealized
gain | Total from
investment
operations | Distributions
from net
investment
income | Distributions
from net
realized
gains | Total
distributions to
shareholders |
| Class A |
| Year Ended 2/28/2022 | $57.11 | 0.58 | 8.97 | 9.55 | (0.62) | (9.70) | (10.32) |
| Year Ended 2/28/2021 | $47.14 | 0.73 | 13.20 | 13.93 | (0.78) | (3.18) | (3.96) |
| Year Ended 2/29/2020 | $48.30 | 0.84 | 2.97 | 3.81 | (0.88) | (4.09) | (4.97) |
| Year Ended 2/28/2019 | $50.42 | 0.81 | 1.18 | 1.99 | (0.83) | (3.28) | (4.11) |
| Year Ended 2/28/2018 | $45.16 | 0.73 | 6.65 | 7.38 | (0.77) | (1.35) | (2.12) |
| Institutional Class |
| Year Ended 2/28/2022 | $57.52 | 0.74 | 9.04 | 9.78 | (0.78) | (9.70) | (10.48) |
| Year Ended 2/28/2021 | $47.44 | 0.86 | 13.31 | 14.17 | (0.91) | (3.18) | (4.09) |
| Year Ended 2/29/2020 | $48.57 | 0.98 | 2.98 | 3.96 | (1.00) | (4.09) | (5.09) |
| Year Ended 2/28/2019 | $50.68 | 0.94 | 1.18 | 2.12 | (0.95) | (3.28) | (4.23) |
| Year Ended 2/28/2018 | $45.38 | 0.85 | 6.69 | 7.54 | (0.89) | (1.35) | (2.24) |
| Institutional 2 Class |
| Year Ended 2/28/2022 | $58.55 | 0.75 | 9.20 | 9.95 | (0.78) | (9.70) | (10.48) |
| Year Ended 2/28/2021 | $48.23 | 0.88 | 13.53 | 14.41 | (0.91) | (3.18) | (4.09) |
| Year Ended 2/29/2020 | $49.30 | 0.99 | 3.03 | 4.02 | (1.00) | (4.09) | (5.09) |
| Year Ended 2/28/2019 | $51.38 | 0.95 | 1.20 | 2.15 | (0.95) | (3.28) | (4.23) |
| Year Ended 2/28/2018 | $45.98 | 0.87 | 6.77 | 7.64 | (0.89) | (1.35) | (2.24) |
| Institutional 3 Class |
| Year Ended 2/28/2022 | $56.45 | 0.68 | 8.94 | 9.62 | (0.78) | (9.70) | (10.48) |
| Year Ended 2/28/2021 | $46.63 | 0.83 | 13.08 | 13.91 | (0.91) | (3.18) | (4.09) |
| Year Ended 2/29/2020 | $47.81 | 0.98 | 2.93 | 3.91 | (1.00) | (4.09) | (5.09) |
| Year Ended 2/28/2019 | $49.95 | 0.92 | 1.17 | 2.09 | (0.95) | (3.28) | (4.23) |
| Year Ended 2/28/2018(f) | $45.37 | 0.98 | 5.84 | 6.82 | (0.89) | (1.35) | (2.24) |
| Notes to Financial Highlights |
| (a) | In addition to the fees and expenses that the Fund bears directly, the Fund indirectly bears a pro rata share of the fees and expenses of any other funds in which it invests. Such indirect expenses are not included in the Fund’s reported expense ratios. |
| (b) | Total net expenses include the impact of certain fee waivers/expense reimbursements made by the Investment Manager and certain of its affiliates, if applicable. |
| (c) | Ratios include interest on collateral expense which is less than 0.01%. |
| (d) | The benefits derived from expense reductions had an impact of less than 0.01%. |
| (e) | Ratios include interfund lending expense which is less than 0.01%. |
| (f) | Institutional 3 Class shares commenced operations on March 1, 2017. Per share data and total return reflect activity from that date. |
The accompanying Notes to Financial Statements are an integral part of this statement.
| 22 | Columbia Large Cap Index Fund | Annual Report 2022 |
Financial Highlights (continued)
| | Net
asset
value,
end of
period | Total
return | Total gross
expense
ratio to
average
net assets(a) | Total net
expense
ratio to
average
net assets(a),(b) | Net investment
income
ratio to
average
net assets | Portfolio
turnover | Net
assets,
end of
period
(000’s) |
| Class A |
| Year Ended 2/28/2022 | $56.34 | 15.86% | 0.45%(c) | 0.45%(c),(d) | 0.92% | 2% | $529,310 |
| Year Ended 2/28/2021 | $57.11 | 30.69% | 0.45%(c) | 0.45%(c),(d) | 1.43% | 11% | $588,972 |
| Year Ended 2/29/2020 | $47.14 | 7.70% | 0.45% | 0.45%(d) | 1.68% | 7% | $579,726 |
| Year Ended 2/28/2019 | $48.30 | 4.19% | 0.45%(e) | 0.45%(d),(e) | 1.64% | 6% | $726,445 |
| Year Ended 2/28/2018 | $50.42 | 16.59% | 0.45% | 0.45%(d) | 1.53% | 2% | $954,529 |
| Institutional Class |
| Year Ended 2/28/2022 | $56.82 | 16.15% | 0.20%(c) | 0.20%(c),(d) | 1.17% | 2% | $2,497,279 |
| Year Ended 2/28/2021 | $57.52 | 31.02% | 0.20%(c) | 0.20%(c),(d) | 1.67% | 11% | $2,441,779 |
| Year Ended 2/29/2020 | $47.44 | 7.97% | 0.20% | 0.20%(d) | 1.94% | 7% | $2,136,890 |
| Year Ended 2/28/2019 | $48.57 | 4.46% | 0.20%(e) | 0.20%(d),(e) | 1.89% | 6% | $2,134,512 |
| Year Ended 2/28/2018 | $50.68 | 16.88% | 0.20% | 0.20%(d) | 1.78% | 2% | $2,390,677 |
| Institutional 2 Class |
| Year Ended 2/28/2022 | $58.02 | 16.15% | 0.20%(c) | 0.20%(c) | 1.17% | 2% | $379,872 |
| Year Ended 2/28/2021 | $58.55 | 31.01% | 0.20%(c) | 0.20%(c) | 1.67% | 11% | $383,658 |
| Year Ended 2/29/2020 | $48.23 | 7.97% | 0.20% | 0.20% | 1.93% | 7% | $311,674 |
| Year Ended 2/28/2019 | $49.30 | 4.45% | 0.20%(e) | 0.20%(e) | 1.89% | 6% | $336,271 |
| Year Ended 2/28/2018 | $51.38 | 16.87% | 0.20% | 0.20% | 1.78% | 2% | $372,379 |
| Institutional 3 Class |
| Year Ended 2/28/2022 | $55.59 | 16.17% | 0.20%(c) | 0.20%(c) | 1.10% | 2% | $72,594 |
| Year Ended 2/28/2021 | $56.45 | 31.00% | 0.20%(c) | 0.20%(c) | 1.63% | 11% | $284,552 |
| Year Ended 2/29/2020 | $46.63 | 7.99% | 0.20% | 0.20% | 1.98% | 7% | $51,264 |
| Year Ended 2/28/2019 | $47.81 | 4.46% | 0.20%(e) | 0.20%(e) | 1.91% | 6% | $45,493 |
| Year Ended 2/28/2018(f) | $49.95 | 15.29% | 0.21% | 0.20% | 2.01% | 2% | $552 |
The accompanying Notes to Financial Statements are an integral part of this statement.
Columbia Large Cap Index Fund | Annual Report 2022
| 23 |
Notes to Financial Statements
February 28, 2022
Note 1. Organization
Columbia Large Cap Index Fund (the Fund), a series of Columbia Funds Series Trust (the Trust), is a diversified fund. The Trust is registered under the Investment Company Act of 1940, as amended (the 1940 Act), as an open-end management investment company organized as a Delaware statutory trust.
Fund shares
The Trust may issue an unlimited number of shares (without par value). The Fund offers each of the share classes listed in the Statement of Assets and Liabilities. Although all share classes generally have identical voting, dividend and liquidation rights, each share class votes separately when required by the Trust’s organizational documents or by law. Each share class has its own expense and sales charge structure. Different share classes may have different minimum initial investment amounts and pay different net investment income distribution amounts to the extent the expenses of distributing such share classes vary. Distributions to shareholders in a liquidation will be proportional to the net asset value of each share class.
As described in the Fund’s prospectus, Class A shares are offered to the general public for investment. Institutional Class, Institutional 2 Class and Institutional 3 Class shares are available for purchase through authorized investment professionals to omnibus retirement plans or to institutional investors and to certain other investors as also described in the Fund’s prospectus.
Note 2. Summary of significant accounting policies
Basis of preparation
The Fund is an investment company that applies the accounting and reporting guidance in the Financial Accounting Standards Board (FASB) Accounting Standards Codification Topic 946, Financial Services - Investment Companies (ASC 946). The financial statements are prepared in accordance with U.S. generally accepted accounting principles (GAAP), which requires management to make certain estimates and assumptions that affect the reported amounts of assets and liabilities, the disclosure of contingent assets and liabilities at the date of the financial statements and the reported amounts of income and expenses during the reporting period. Actual results could differ from those estimates.
The following is a summary of significant accounting policies followed by the Fund in the preparation of its financial statements.
Security valuation
Equity securities listed on an exchange are valued at the closing price or last trade price on their primary exchange at the close of business of the New York Stock Exchange. Securities with a closing price not readily available or not listed on any exchange are valued at the mean between the closing bid and ask prices. Listed preferred stocks convertible into common stocks are valued using an evaluated price from a pricing service.
Foreign equity securities are valued based on the closing price or last trade price on their primary exchange at the close of business of the New York Stock Exchange. If any foreign equity security closing prices are not readily available, the securities are valued at the mean of the latest quoted bid and ask prices on such exchanges or markets. Foreign currency exchange rates are determined at the scheduled closing time of the New York Stock Exchange. Many securities markets and exchanges outside the U.S. close prior to the close of the New York Stock Exchange; therefore, the closing prices for securities in such markets or on such exchanges may not fully reflect events that occur after such close but before the close of the New York Stock Exchange. In those situations, foreign securities will be fair valued pursuant to a policy adopted by the Board of Trustees. Under the policy, the Fund may utilize a third-party pricing service to determine these fair values. The third-party pricing service takes into account multiple factors, including, but not limited to, movements in the U.S. securities markets, certain depositary receipts, futures contracts and foreign exchange rates that have occurred subsequent to the close of the foreign exchange or market, to determine a good faith estimate that reasonably reflects the current market conditions as of the close of the New York Stock Exchange. The fair value of a security is likely to be different from the quoted or published price, if available.
Investments in open-end investment companies (other than exchange-traded funds (ETFs)), are valued at the latest net asset value reported by those companies as of the valuation time.
| 24 | Columbia Large Cap Index Fund | Annual Report 2022 |
Notes to Financial Statements (continued)
February 28, 2022
Futures and options on futures contracts are valued based upon the settlement price at the close of regular trading on their principal exchanges or, in the absence of a settlement price, at the mean of the latest quoted bid and ask prices.
Investments for which market quotations are not readily available, or that have quotations which management believes are not reflective of market value or reliable, are valued at fair value as determined in good faith under procedures approved by and under the general supervision of the Board of Trustees. If a security or class of securities (such as foreign securities) is valued at fair value, such value is likely to be different from the quoted or published price for the security, if available.
The determination of fair value often requires significant judgment. To determine fair value, management may use assumptions including but not limited to future cash flows and estimated risk premiums. Multiple inputs from various sources may be used to determine fair value.
GAAP requires disclosure regarding the inputs and valuation techniques used to measure fair value and any changes in valuation inputs or techniques. In addition, investments shall be disclosed by major category. This information is disclosed following the Fund’s Portfolio of Investments.
Derivative instruments
The Fund invests in certain derivative instruments, as detailed below, in seeking to meet its investment objectives. Derivatives are instruments whose values depend on, or are derived from, in whole or in part, the value of one or more securities, currencies, commodities, indices, or other assets or instruments. Derivatives may be used to increase investment flexibility (including to maintain cash reserves while maintaining desired exposure to certain assets), for risk management (hedging) purposes, to facilitate trading, to reduce transaction costs and to pursue higher investment returns. The Fund may also use derivative instruments to mitigate certain investment risks, such as foreign currency exchange rate risk, interest rate risk and credit risk. Derivatives may involve various risks, including the potential inability of the counterparty to fulfill its obligations under the terms of the contract, the potential for an illiquid secondary market (making it difficult for the Fund to sell or terminate, including at favorable prices) and the potential for market movements which may expose the Fund to gains or losses in excess of the amount shown in the Statement of Assets and Liabilities. The notional amounts of derivative instruments, if applicable, are not recorded in the financial statements.
A derivative instrument may suffer a marked-to-market loss if the value of the contract decreases due to an unfavorable change in the market rates or values of the underlying instrument. Losses can also occur if the counterparty does not perform its obligations under the contract. The Fund’s risk of loss from counterparty credit risk on over-the-counter derivatives is generally limited to the aggregate unrealized gain netted against any collateral held by the Fund and the amount of any variation margin held by the counterparty, plus any replacement costs or related amounts. With exchange-traded or centrally cleared derivatives, there is reduced counterparty credit risk to the Fund since the clearinghouse or central counterparty (CCP) provides some protection in the case of clearing member default. The clearinghouse or CCP stands between the buyer and the seller of the contract; therefore, failure of the clearinghouse or CCP may pose additional counterparty credit risk. However, credit risk still exists in exchange-traded or centrally cleared derivatives with respect to initial and variation margin that is held in a broker’s customer account. While clearing brokers are required to segregate customer margin from their own assets, in the event that a clearing broker becomes insolvent or goes into bankruptcy and at that time there is a shortfall in the aggregate amount of margin held by the clearing broker for all its clients and such shortfall is remedied by the CCP or otherwise, U.S. bankruptcy laws will typically allocate that shortfall on a pro-rata basis across all the clearing broker’s customers (including the Fund), potentially resulting in losses to the Fund.
In order to better define its contractual rights and to secure rights that will help the Fund mitigate its counterparty risk, the Fund may enter into an International Swaps and Derivatives Association, Inc. Master Agreement (ISDA Master Agreement) or similar agreement with its derivatives counterparties. An ISDA Master Agreement is an agreement between the Fund and a counterparty that governs over-the-counter derivatives and foreign exchange forward contracts and contains, among other things, collateral posting terms and netting provisions in the event of a default and/or termination event. Under an ISDA Master Agreement, the Fund may, under certain circumstances, offset with the counterparty certain derivative instruments’ payables and/or receivables with collateral held and/or posted and create one single net payment. The provisions of the ISDA Master Agreement typically permit a single net payment in the event of default (close-out netting), including the bankruptcy or insolvency of the counterparty. Note, however, that bankruptcy or insolvency laws of a particular jurisdiction may impose restrictions on or prohibitions against the right of offset or netting in bankruptcy, insolvency or other events.
Columbia Large Cap Index Fund | Annual Report 2022
| 25 |
Notes to Financial Statements (continued)
February 28, 2022
Collateral (margin) requirements differ by type of derivative. Margin requirements are established by the clearinghouse or CCP for exchange-traded and centrally cleared derivatives. Brokers can ask for margin in excess of the minimum in certain circumstances. Collateral terms for most over-the-counter derivatives are subject to regulatory requirements to exchange variation margin with trading counterparties and may have contract specific margin terms as well. For over-the-counter derivatives traded under an ISDA Master Agreement, the collateral requirements are typically calculated by netting the marked-to-market amount for each transaction under such agreement and comparing that amount to the value of any variation margin currently pledged by the Fund and/or the counterparty. Generally, the amount of collateral due from or to a party has to exceed a minimum transfer amount threshold (e.g., $250,000) before a transfer has to be made. To the extent amounts due to the Fund from its counterparties are not fully collateralized, contractually or otherwise, the Fund bears the risk of loss from counterparty nonperformance. The Fund may also pay interest expense on cash collateral received from the broker. Any interest expense paid by the Fund is shown on the Statement of Operations. The Fund attempts to mitigate counterparty risk by only entering into agreements with counterparties that it believes have the financial resources to honor their obligations and by monitoring the financial stability of those counterparties.
Certain ISDA Master Agreements allow counterparties of over-the-counter derivatives transactions to terminate derivatives contracts prior to maturity in the event the Fund’s net asset value declines by a stated percentage over a specified time period or if the Fund fails to meet certain terms of the ISDA Master Agreement, which would cause the Fund to accelerate payment of any net liability owed to the counterparty. The Fund also has termination rights if the counterparty fails to meet certain terms of the ISDA Master Agreement. In determining whether to exercise such termination rights, the Fund would consider, in addition to counterparty credit risk, whether termination would result in a net liability owed from the counterparty.
For financial reporting purposes, the Fund does not offset derivative assets and derivative liabilities that are subject to netting arrangements in the Statement of Assets and Liabilities.
Futures contracts
Futures contracts are exchange-traded and represent commitments for the future purchase or sale of an asset at a specified price on a specified date. The Fund bought and sold futures contracts to maintain appropriate equity market exposure while keeping sufficient cash to accommodate daily redemptions. These instruments may be used for other purposes in future periods. Upon entering into futures contracts, the Fund bears risks that it may not achieve the anticipated benefits of the futures contracts and may realize a loss. Additional risks include counterparty credit risk, the possibility of an illiquid market, and that a change in the value of the contract or option may not correlate with changes in the value of the underlying asset.
Upon entering into a futures contract, the Fund deposits cash or securities with the broker, known as a futures commission merchant (FCM), in an amount sufficient to meet the initial margin requirement. The initial margin deposit must be maintained at an established level over the life of the contract. Cash deposited as initial margin is recorded in the Statement of Assets and Liabilities as margin deposits. Securities deposited as initial margin are designated in the Portfolio of Investments. Subsequent payments (variation margin) are made or received by the Fund each day. The variation margin payments are equal to the daily change in the contract value and are recorded as variation margin receivable or payable and are offset in unrealized gains or losses. The Fund generally expects to earn interest income on its margin deposits. The Fund recognizes a realized gain or loss when the contract is closed or expires. Futures contracts involve, to varying degrees, risk of loss in excess of the variation margin disclosed in the Statement of Assets and Liabilities.
Effects of derivative transactions in the financial statements
The following tables are intended to provide additional information about the effect of derivatives on the financial statements of the Fund, including: the fair value of derivatives by risk category and the location of those fair values in the Statement of Assets and Liabilities; and the impact of derivative transactions over the period in the Statement of Operations, including realized and unrealized gains (losses). The derivative instrument schedules following the Portfolio of Investments present additional information regarding derivative instruments outstanding at the end of the period, if any.
| 26 | Columbia Large Cap Index Fund | Annual Report 2022 |
Notes to Financial Statements (continued)
February 28, 2022
The following table is a summary of the fair value of derivative instruments (not considered to be hedging instruments for accounting disclosure purposes) at February 28, 2022:
| | Liability derivatives | |
Risk exposure
category | Statement
of assets and liabilities
location | Fair value ($) |
| Equity risk | Component of total distributable earnings (loss) — unrealized depreciation on futures contracts | 599,077* |
| * | Includes cumulative appreciation (depreciation) as reported in the tables following the Portfolio of Investments. Only the current day’s variation margin is reported in receivables or payables in the Statement of Assets and Liabilities. |
The following table indicates the effect of derivative instruments (not considered to be hedging instruments for accounting disclosure purposes) in the Statement of Operations for the year ended February 28, 2022:
| Amount of realized gain (loss) on derivatives recognized in income |
| Risk exposure category | Futures
contracts
($) |
| Equity risk | 7,822,328 |
| |
| Change in unrealized appreciation (depreciation) on derivatives recognized in income |
| Risk exposure category | Futures
contracts
($) |
| Equity risk | (1,088,533) |
The following table is a summary of the average outstanding volume by derivative instrument for the year ended February 28, 2022:
| Derivative instrument | Average notional
amounts ($)* |
| Futures contracts — long | 50,845,525 |
| * | Based on the ending quarterly outstanding amounts for the year ended February 28, 2022. |
Security transactions
Security transactions are accounted for on the trade date. Cost is determined and gains (losses) are based upon the specific identification method for both financial statement and federal income tax purposes.
Income recognition
Corporate actions and dividend income are generally recorded net of any non-reclaimable tax withholdings, on the ex-dividend date or upon receipt of an ex-dividend notification in the case of certain foreign securities.
The Fund may receive distributions from holdings in equity securities, business development companies (BDCs), exchange-traded funds (ETFs), limited partnerships (LPs), other regulated investment companies (RICs), and real estate investment trusts (REITs), which report information as to the tax character of their distributions annually. These distributions are allocated to dividend income, capital gain and return of capital based on actual information reported. Return of capital is recorded as a reduction of the cost basis of securities held. If the Fund no longer owns the applicable securities, return of capital is recorded as a realized gain. With respect to REITs, to the extent actual information has not yet been reported, estimates for return of capital are made by Columbia Management Investment Advisers, LLC (the Investment Manager), a wholly-owned subsidiary of Ameriprise Financial, Inc. (Ameriprise Financial). The Investment Manager’s estimates are subsequently adjusted when the actual character of the distributions is disclosed by the REITs, which could result in a proportionate change in return of capital to shareholders.
Columbia Large Cap Index Fund | Annual Report 2022
| 27 |
Notes to Financial Statements (continued)
February 28, 2022
Awards from class action litigation are recorded as a reduction of cost basis if the Fund still owns the applicable securities on the payment date. If the Fund no longer owns the applicable securities on the payment date, the proceeds are recorded as realized gains.
Expenses
General expenses of the Trust are allocated to the Fund and other funds of the Trust based upon relative net assets or other expense allocation methodologies determined by the nature of the expense. Expenses directly attributable to the Fund are charged to the Fund. Expenses directly attributable to a specific class of shares are charged to that share class.
Determination of class net asset value
All income, expenses (other than class-specific expenses, which are charged to that share class, as shown in the Statement of Operations) and realized and unrealized gains (losses) are allocated to each class of the Fund on a daily basis, based on the relative net assets of each class, for purposes of determining the net asset value of each class.
Federal income tax status
The Fund intends to qualify each year as a regulated investment company under Subchapter M of the Internal Revenue Code, as amended, and will distribute substantially all of its investment company taxable income and net capital gain, if any, for its tax year, and as such will not be subject to federal income taxes. In addition, the Fund intends to distribute in each calendar year substantially all of its ordinary income, capital gain net income and certain other amounts, if any, such that the Fund should not be subject to federal excise tax. Therefore, no federal income or excise tax provision is recorded.
Foreign taxes
The Fund may be subject to foreign taxes on income, gains on investments or currency repatriation, a portion of which may be recoverable. The Fund will accrue such taxes and recoveries, as applicable, based upon its current interpretation of tax rules and regulations that exist in the markets in which it invests.
Realized gains in certain countries may be subject to foreign taxes at the Fund level, based on statutory rates. The Fund accrues for such foreign taxes on realized and unrealized gains at the appropriate rate for each jurisdiction, as applicable. The amount, if any, is disclosed as a liability on the Statement of Assets and Liabilities.
Distributions to shareholders
Distributions from net investment income, if any, are declared and paid semi-annually. Net realized capital gains, if any, are distributed at least annually. Income distributions and capital gain distributions are determined in accordance with federal income tax regulations, which may differ from GAAP.
Guarantees and indemnifications
Under the Trust’s organizational documents and, in some cases, by contract, its officers and trustees are indemnified against certain liabilities arising out of the performance of their duties to the Trust or its funds. In addition, certain of the Fund’s contracts with its service providers contain general indemnification clauses. The Fund’s maximum exposure under these arrangements is unknown since the amount of any future claims that may be made against the Fund cannot be determined, and the Fund has no historical basis for predicting the likelihood of any such claims.
Note 3. Fees and other transactions with affiliates
Management services fees
The Fund has entered into a Management Agreement with Columbia Management Investment Advisers, LLC (the Investment Manager), a wholly-owned subsidiary of Ameriprise Financial, Inc. (Ameriprise Financial). Under the Management Agreement, the Investment Manager provides the Fund with investment research and advice, as well as administrative and accounting services. The management services fee is an annual fee that is equal to 0.20% of the Fund’s daily net assets.
| 28 | Columbia Large Cap Index Fund | Annual Report 2022 |
Notes to Financial Statements (continued)
February 28, 2022
The Investment Manager, from the management services fee it receives from the Fund, pays all operating expenses of the Fund, with the exception of brokerage fees and commissions, taxes, interest, fees and expenses of Board of Trustees who are not officers, directors or employees of the Investment Manager or its affiliates, distribution and/or shareholder servicing and any extraordinary non-recurring expenses that may arise, including litigation fees.
Compensation of board members
Members of the Board of Trustees who are not officers or employees of the Investment Manager or Ameriprise Financial are compensated for their services to the Fund as disclosed in the Statement of Operations. Under a Deferred Compensation Plan (the Deferred Plan), these members of the Board of Trustees may elect to defer payment of up to 100% of their compensation. Deferred amounts are treated as though equivalent dollar amounts had been invested in shares of certain funds managed by the Investment Manager. The Fund’s liability for these amounts is adjusted for market value changes and remains in the Fund until distributed in accordance with the Deferred Plan. All amounts payable under the Deferred Plan constitute a general unsecured obligation of the Fund. The expense for the Deferred Plan, which includes Trustees’ fees deferred during the current period as well as any gains or losses on the Trustees’ deferred compensation balances as a result of market fluctuations, is included in "Compensation of board members" on the Statement of Operations.
Compensation of Chief Compliance Officer
The Board of Trustees has appointed a Chief Compliance Officer for the Fund in accordance with federal securities regulations. A portion of the Chief Compliance Officer’s total compensation is allocated to the Fund, along with other allocations to affiliated registered investment companies managed by the Investment Manager and its affiliates, based on relative net assets. The expenses of the Chief Compliance Officer allocated to the Fund are payable by the Investment Manager.
Transfer agency fees
Under a Transfer and Dividend Disbursing Agent Agreement, Columbia Management Investment Services Corp. (the Transfer Agent), an affiliate of the Investment Manager and a wholly-owned subsidiary of Ameriprise Financial, is responsible for providing transfer agency services to the Fund. The Transfer Agent has contracted with DST Asset Manager Solutions, Inc. (DST) to serve as sub-transfer agent.
The transfer agency fees are payable by the Investment Manager. The Transfer Agent pays the fees of DST for services as sub-transfer agent and DST is not entitled to reimbursement for such fees from the Fund. The Transfer Agent also receives compensation from the Investment Manager for various shareholder services and reimbursements for certain out-of-pocket expenses.
An annual minimum account balance fee of $20 may apply to certain accounts with a value below the applicable share class’s initial minimum investment requirements to reduce the impact of small accounts on transfer agency fees. These minimum account balance fees are remitted to the Fund and recorded as part of expense reductions in the Statement of Operations. For the year ended February 28, 2022, these minimum account balance fees reduced total expenses of the Fund by $1,599.
Distribution and service fees
The Fund has entered into an agreement with Columbia Management Investment Distributors, Inc. (the Distributor), an affiliate of the Investment Manager and a wholly-owned subsidiary of Ameriprise Financial, for distribution and shareholder services. The Board of Trustees has approved, and the Fund has adopted, distribution and shareholder service plans (the Plans) applicable to certain share classes, which set the distribution and service fees for the Fund. These fees are calculated daily and are intended to compensate the Distributor and/or eligible selling and/or servicing agents for selling shares of the Fund and providing services to investors.
Under the Plans, the Fund pays a monthly combined distribution and service fee to the Distributor at the maximum annual rate of 0.25% of the average daily net assets attributable to Class A shares of the Fund.
Columbia Large Cap Index Fund | Annual Report 2022
| 29 |
Notes to Financial Statements (continued)
February 28, 2022
Expenses waived/reimbursed by the Investment Manager and its affiliates
The Investment Manager and certain of its affiliates have contractually agreed to waive fees and/or reimburse expenses (excluding certain fees and expenses described below) for the period(s) disclosed below, unless sooner terminated at the sole discretion of the Board of Trustees, so that the Fund’s net operating expenses, after giving effect to fees waived/expenses reimbursed and any balance credits and/or overdraft charges from the Fund’s custodian, do not exceed the following annual rate(s) as a percentage of the classes’ average daily net assets:
| | Fee rate(s) contractual
through
June 30, 2022 |
| Class A | 0.45% |
| Institutional Class | 0.20 |
| Institutional 2 Class | 0.20 |
| Institutional 3 Class | 0.20 |
Under the agreement governing these fee waivers and/or expense reimbursement arrangements, the following fees and expenses are excluded from the waiver/reimbursement commitment, and therefore will be paid by the Fund, if applicable: taxes (including foreign transaction taxes), expenses associated with investments in affiliated and non-affiliated pooled investment vehicles (including mutual funds and exchange-traded funds), transaction costs and brokerage commissions, costs related to any securities lending program, dividend expenses associated with securities sold short, inverse floater program fees and expenses, transaction charges and interest on borrowed money, interest, costs associated with shareholder meetings, infrequent and/or unusual expenses and any other expenses the exclusion of which is specifically approved by the Board of Trustees. This agreement may be modified or amended only with approval from the Investment Manager, certain of its affiliates and the Fund. Any fees waived and/or expenses reimbursed under the expense reimbursement arrangements described above are not recoverable by the Investment Manager or its affiliates in future periods.
Note 4. Federal tax information
The timing and character of income and capital gain distributions are determined in accordance with income tax regulations, which may differ from GAAP because of temporary or permanent book to tax differences.
At February 28, 2022, these differences were primarily due to differing treatment for deferral/reversal of wash sale losses, trustees’ deferred compensation, derivative investments and re-characterization of distributions for investments. To the extent these differences were permanent, reclassifications were made among the components of the Fund’s net assets. Temporary differences do not require reclassifications.
The following reclassifications were made:
Undistributed net
investment
income ($) | Accumulated
net realized
gain ($) | Paid in
capital ($) |
| (551,849) | 551,849 | — |
Net investment income (loss) and net realized gains (losses), as disclosed in the Statement of Operations, and net assets were not affected by this reclassification.
The tax character of distributions paid during the years indicated was as follows:
| Year Ended February 28, 2022 | Year Ended February 28, 2021 |
Ordinary
income ($) | Long-term
capital gains ($) | Total ($) | Ordinary
income ($) | Long-term
capital gains ($) | Total ($) |
| 49,452,878 | 538,800,224 | 588,253,102 | 77,313,814 | 185,056,981 | 262,370,795 |
Short-term capital gain distributions, if any, are considered ordinary income distributions for tax purposes.
| 30 | Columbia Large Cap Index Fund | Annual Report 2022 |
Notes to Financial Statements (continued)
February 28, 2022
At February 28, 2022, the components of distributable earnings on a tax basis were as follows:
Undistributed
ordinary income ($) | Undistributed
long-term
capital gains ($) | Capital loss
carryforwards ($) | Net unrealized
appreciation ($) |
| 6,949,262 | 143,466,419 | — | 2,510,904,817 |
At February 28, 2022, the cost of all investments for federal income tax purposes along with the aggregate gross unrealized appreciation and depreciation based on that cost was:
Federal
tax cost ($) | Gross unrealized
appreciation ($) | Gross unrealized
(depreciation) ($) | Net unrealized
appreciation ($) |
| 967,732,726 | 2,545,367,904 | (34,463,087) | 2,510,904,817 |
Tax cost of investments and unrealized appreciation/(depreciation) may also include timing differences that do not constitute adjustments to tax basis.
Management of the Fund has concluded that there are no significant uncertain tax positions in the Fund that would require recognition in the financial statements. However, management’s conclusion may be subject to review and adjustment at a later date based on factors including, but not limited to, new tax laws, regulations, and administrative interpretations (including relevant court decisions). Generally, the Fund’s federal tax returns for the prior three fiscal years remain subject to examination by the Internal Revenue Service.
Note 5. Portfolio information
The cost of purchases and proceeds from sales of securities, excluding short-term investments and derivatives, if any, aggregated to $74,850,176 and $859,078,153, respectively, for the year ended February 28, 2022. The amount of purchase and sale activity impacts the portfolio turnover rate reported in the Financial Highlights.
Note 6. Affiliated money market fund
The Fund invests in Columbia Short-Term Cash Fund, an affiliated money market fund established for the exclusive use by the Fund and other affiliated funds (the Affiliated MMF). The income earned by the Fund from such investments is included as Dividends - affiliated issuers in the Statement of Operations. As an investing fund, the Fund indirectly bears its proportionate share of the expenses of the Affiliated MMF. The Affiliated MMF prices its shares with a floating net asset value. In addition, the Board of Trustees of the Affiliated MMF may impose a fee on redemptions (sometimes referred to as a liquidity fee) or temporarily suspend redemptions (sometimes referred to as imposing a redemption gate) in the event its liquidity falls below regulatory limits.
Note 7. Interfund lending
Pursuant to an exemptive order granted by the Securities and Exchange Commission, the Fund participates in a program (the Interfund Program) allowing each participating Columbia Fund (each, a Participating Fund) to lend money directly to and, except for closed-end funds and money market funds, borrow money directly from other Participating Funds for temporary purposes. The amounts eligible for borrowing and lending under the Interfund Program are subject to certain restrictions.
Interfund loans are subject to the risk that the borrowing fund could be unable to repay the loan when due, and a delay in repayment to the lending fund could result in lost opportunities and/or additional lending costs. The exemptive order is subject to conditions intended to mitigate conflicts of interest arising from the Investment Manager’s relationship with each Participating Fund.
The Fund did not borrow or lend money under the Interfund Program during the year ended February 28, 2022.
Columbia Large Cap Index Fund | Annual Report 2022
| 31 |
Notes to Financial Statements (continued)
February 28, 2022
Note 8. Line of credit
The Fund has access to a revolving credit facility with a syndicate of banks led by JPMorgan Chase Bank, N.A., Citibank, N.A. and Wells Fargo Bank, N.A. whereby the Fund may borrow for the temporary funding of shareholder redemptions or for other temporary or emergency purposes. Pursuant to an October 28, 2021 amendment and restatement, the credit facility, which is an agreement between the Fund and certain other funds managed by the Investment Manager or an affiliated investment manager, severally and not jointly, permits aggregate borrowings up to $950 million. Interest is currently charged to each participating fund based on its borrowings at a rate equal to the higher of (i) the federal funds effective rate, (ii) the secured overnight financing rate plus 0.11448% and (iii) the overnight bank funding rate, plus in each case, 1.00%. Each borrowing under the credit facility matures no later than 60 days after the date of borrowing. The Fund also pays a commitment fee equal to its pro rata share of the unused amount of the credit facility at a rate of 0.15% per annum. The commitment fee is included in other expenses in the Statement of Operations. This agreement expires annually in October unless extended or renewed. Prior to the October 28, 2021 amendment and restatement, the Fund had access to a revolving credit facility with a syndicate of banks led by JPMorgan Chase Bank, N.A., Citibank, N.A. and Wells Fargo Bank, N.A. which permitted collective borrowings up to $950 million. Interest was charged to each participating fund based on its borrowings at a rate equal to the higher of (i) the federal funds effective rate, (ii) the one-month London Interbank Offered Rate (LIBOR) rate and (iii) the overnight bank funding rate, plus in each case, 1.25%.
The Fund had no borrowings during the year ended February 28, 2022.
Note 9. Significant risks
Information technology sector risk
The Fund is more susceptible to the particular risks that may affect companies in the information technology sector than if it were invested in a wider variety of companies in unrelated sectors. Companies in the information technology sector are subject to certain risks, including the risk that new services, equipment or technologies will not be accepted by consumers and businesses or will become rapidly obsolete. Performance of such companies may be affected by factors including obtaining and protecting patents (or the failure to do so) and significant competitive pressures, including aggressive pricing of their products or services, new market entrants, competition for market share and short product cycles due to an accelerated rate of technological developments. Such competitive pressures may lead to limited earnings and/or falling profit margins. As a result, the value of their securities may fall or fail to rise. In addition, many information technology sector companies have limited operating histories and prices of these companies’ securities historically have been more volatile than other securities, especially over the short term. Some companies in the information technology sector are facing increased government and regulatory scrutiny and may be subject to adverse government or regulatory action, which could negatively impact the value of their securities.
Market risk
The Fund may incur losses due to declines in the value of one or more securities in which it invests. These declines may be due to factors affecting a particular issuer, or the result of, among other things, political, regulatory, market, economic or social developments affecting the relevant market(s) more generally. In addition, turbulence in financial markets and reduced liquidity in equity, credit and/or fixed income markets may negatively affect many issuers, which could adversely affect the Fund, including causing difficulty in assigning prices to hard-to-value assets in thinly traded and closed markets, significant redemptions and operational challenges. Global economies and financial markets are increasingly interconnected, and conditions and events in one country, region or financial market may adversely impact issuers in a different country, region or financial market. These risks may be magnified if certain events or developments adversely interrupt the global supply chain; in these and other circumstances, such risks might affect companies worldwide. As a result, local, regional or global events such as terrorism, war, natural disasters, disease/virus outbreaks and epidemics or other public health issues, recessions, depressions or other events – or the potential for such events – could have a significant negative impact on global economic and market conditions.
The large-scale invasion of Ukraine by Russia in February 2022 has resulted in sanctions and market disruptions, including declines in regional and global stock and commodity markets and significant devaluations of Russian currency. The extent and duration of the military action are impossible to predict but could be significant. Market disruption caused by the Russian
| 32 | Columbia Large Cap Index Fund | Annual Report 2022 |
Notes to Financial Statements (continued)
February 28, 2022
military action, and any counter measures or responses thereto (including international sanctions, a downgrade in the country’s credit rating, purchasing and financing restrictions, boycotts, tariffs, changes in consumer or purchaser preferences, cyberattacks and espionage) could have a severe adverse impact on regional and/or global securities and commodities markets, including markets for oil and natural gas. These and other related events could have a negative impact on Fund performance and the value of an investment in the Fund.
The pandemic caused by coronavirus disease 2019 and its variants (COVID-19) has resulted in, and may continue to result in, significant global economic and societal disruption and market volatility due to disruptions in market access, resource availability, facilities operations, imposition of tariffs, export controls and supply chain disruption, among others. Such disruptions may be caused, or exacerbated by, quarantines and travel restrictions, workforce displacement and loss in human and other resources. The uncertainty surrounding the magnitude, duration, reach, costs and effects of the global pandemic, as well as actions that have been or could be taken by governmental authorities or other third parties, present unknowns that are yet to unfold. The impacts, as well as the uncertainty over impacts to come, of COVID-19 – and any other infectious illness outbreaks, epidemics and pandemics that may arise in the future – could negatively affect global economies and markets in ways that cannot necessarily be foreseen. In addition, the impact of infectious illness outbreaks and epidemics in emerging market countries may be greater due to generally less established healthcare systems, governments and financial markets. Public health crises caused by the COVID-19 outbreak may exacerbate other pre-existing political, social and economic risks in certain countries or globally. The disruptions caused by COVID-19 could prevent the Fund from executing advantageous investment decisions in a timely manner and negatively impact the Fund’s ability to achieve its investment objectives. Any such event(s) could have a significant adverse impact on the value and risk profile of the Fund.
Passive investment risk
The Fund is not “actively” managed and may be affected by a general decline in market segments related to its tracking index. The Fund invests in securities or instruments included in, or believed by the Investment Manager to be representative of, its tracking index, regardless of their investment merits. The Fund does not seek temporary defensive positions when markets decline or appear overvalued. The decision of whether to remove a security from the tracking index is made by an independent index provider who is not affiliated with the Fund or the Investment Manager.
Shareholder concentration risk
At February 28, 2022, affiliated shareholders of record owned 32.0% of the outstanding shares of the Fund in one or more accounts. Subscription and redemption activity by concentrated accounts may have a significant effect on the operations of the Fund. In the case of a large redemption, the Fund may be forced to sell investments at inopportune times, including its liquid positions, which may result in Fund losses and the Fund holding a higher percentage of less liquid positions. Large redemptions could result in decreased economies of scale and increased operating expenses for non-redeeming Fund shareholders.
Note 10. Subsequent events
Management has evaluated the events and transactions that have occurred through the date the financial statements were issued and noted no items requiring adjustment of the financial statements or additional disclosure.
Note 11. Information regarding pending and settled legal proceedings
Ameriprise Financial and certain of its affiliates are involved in the normal course of business in legal proceedings which include regulatory inquiries, arbitration and litigation, including class actions concerning matters arising in connection with the conduct of its activities as a diversified financial services firm. Ameriprise Financial believes that the Fund is not currently the subject of, and that neither Ameriprise Financial nor any of its affiliates are the subject of, any pending legal, arbitration or regulatory proceedings that are likely to have a material adverse effect on the Fund or the ability of Ameriprise Financial or its affiliates to perform under their contracts with the Fund. Ameriprise Financial is required to make quarterly (10-Q), annual (10-K) and, as necessary, 8-K filings with the Securities and Exchange Commission (SEC) on legal and regulatory matters that relate to Ameriprise Financial and its affiliates. Copies of these filings may be obtained by accessing the SEC website at www.sec.gov.
Columbia Large Cap Index Fund | Annual Report 2022
| 33 |
Notes to Financial Statements (continued)
February 28, 2022
There can be no assurance that these matters, or the adverse publicity associated with them, will not result in increased Fund redemptions, reduced sale of Fund shares or other adverse consequences to the Fund. Further, although we believe proceedings are not likely to have a material adverse effect on the Fund or the ability of Ameriprise Financial or its affiliates to perform under their contracts with the Fund, these proceedings are subject to uncertainties and, as such, we are unable to estimate the possible loss or range of loss that may result. An adverse outcome in one or more of these proceedings could result in adverse judgments, settlements, fines, penalties or other relief that could have a material adverse effect on the consolidated financial condition or results of operations of Ameriprise Financial or one or more of its affiliates that provides services to the Fund.
| 34 | Columbia Large Cap Index Fund | Annual Report 2022 |
Report of Independent Registered Public Accounting Firm
To the Board of Trustees of Columbia Funds Series Trust and Shareholders of Columbia Large Cap Index Fund
Opinion on the Financial Statements
We have audited the accompanying statement of assets and liabilities, including the portfolio of investments, of Columbia Large Cap Index Fund (one of the funds constituting Columbia Funds Series Trust, referred to hereafter as the "Fund") as of February 28, 2022, the related statement of operations for the year ended February 28, 2022, the statement of changes in net assets for each of the two years in the period ended February 28, 2022, including the related notes, and the financial highlights for each of the five years in the period ended February 28, 2022 (collectively referred to as the "financial statements"). In our opinion, the financial statements present fairly, in all material respects, the financial position of the Fund as of February 28, 2022, the results of its operations for the year then ended, the changes in its net assets for each of the two years in the period ended February 28, 2022 and the financial highlights for each of the five years in the period ended February 28, 2022 in conformity with accounting principles generally accepted in the United States of America.
Basis for Opinion
These financial statements are the responsibility of the Fund’s management. Our responsibility is to express an opinion on the Fund’s financial statements based on our audits. We are a public accounting firm registered with the Public Company Accounting Oversight Board (United States) (PCAOB) and are required to be independent with respect to the Fund in accordance with the U.S. federal securities laws and the applicable rules and regulations of the Securities and Exchange Commission and the PCAOB.
We conducted our audits of these financial statements in accordance with the standards of the PCAOB. Those standards require that we plan and perform the audit to obtain reasonable assurance about whether the financial statements are free of material misstatement, whether due to error or fraud.
Our audits included performing procedures to assess the risks of material misstatement of the financial statements, whether due to error or fraud, and performing procedures that respond to those risks. Such procedures included examining, on a test basis, evidence regarding the amounts and disclosures in the financial statements. Our audits also included evaluating the accounting principles used and significant estimates made by management, as well as evaluating the overall presentation of the financial statements. Our procedures included confirmation of securities owned as of February 28, 2022 by correspondence with the custodian, transfer agent and broker. We believe that our audits provide a reasonable basis for our opinion.
/s/PricewaterhouseCoopers LLP
Minneapolis, Minnesota
April 21, 2022
We have served as the auditor of one or more investment companies within the Columbia Funds Complex since 1977.
Columbia Large Cap Index Fund | Annual Report 2022
| 35 |
Federal Income Tax Information
(Unaudited)
The Fund hereby designates the following tax attributes for the fiscal year ended February 28, 2022. Shareholders will be notified in early 2023 of the amounts for use in preparing 2022 income tax returns.
Qualified
dividend
income | Dividends
received
deduction | Capital
gain
dividend |
| 94.62% | 94.11% | $590,748,128 |
Qualified dividend income. For taxable, non-corporate shareholders, the percentage of ordinary income distributed during the fiscal year that represents qualified dividend income subject to reduced tax rates.
Dividends received deduction. The percentage of ordinary income distributed during the fiscal year that qualifies for the corporate dividends received deduction.
Capital gain dividend. The Fund designates as a capital gain dividend the amount reflected above, or if subsequently determined to be different, the net capital gain of such fiscal period.
TRUSTEES AND OFFICERS
The Board oversees the Fund’s operations and appoints officers who are responsible for day-to-day business decisions based on policies set by the Board. The following table provides basic biographical information about the Fund’s Trustees as of the printing of this report, including their principal occupations during the past five years, although specific titles for individuals may have varied over the period. The year set forth beneath Length of Service in the table below is the year in which the Trustee was first appointed or elected as Trustee to any Fund currently in the Columbia Funds Complex or a predecessor thereof. Under current Board policy, each Trustee generally serves until December 31 of the year such Trustee turns seventy-five (75).
Independent trustees
Name,
address,
year of birth | Position held
with the Columbia Funds and
length of service | Principal occupation(s)
during past five years
and other relevant
professional experience | Number of
Funds in the
Columbia Funds
Complex*
overseen | Other directorships
held by Trustee
during the past
five years |
George S. Batejan
c/o Columbia Management
Investment Advisers, LLC
290 Congress Street
Boston, MA 02210
1953 | Trustee since 2017 | Executive Vice President, Global Head of Technology and Operations, Janus Capital Group, Inc., 2010-2016 | 177 | Former Chairman of the Board, NICSA (National Investment Company Services Association) (Executive Committee, Nominating Committee and Governance Committee), 2014-2016; former Director, Intech Investment Management, 2011-2016; former Board Member, Metro Denver Chamber of Commerce, 2015-2016; former Advisory Board Member, University of Colorado Business School, 2015-2018 |
| 36 | Columbia Large Cap Index Fund | Annual Report 2022 |
TRUSTEES AND OFFICERS (continued)
Independent trustees (continued)
Name,
address,
year of birth | Position held
with the Columbia Funds and
length of service | Principal occupation(s)
during past five years
and other relevant
professional experience | Number of
Funds in the
Columbia Funds
Complex*
overseen | Other directorships
held by Trustee
during the past
five years |
Kathleen Blatz
c/o Columbia Management
Investment Advisers, LLC
290 Congress Street
Boston, MA 02210
1954 | Trustee since 2006 | Attorney, specializing in arbitration and mediation; Chief Justice, Minnesota Supreme Court, 1998-2006; Associate Justice, Minnesota Supreme Court, 1996-1998; Fourth Judicial District Court Judge, Hennepin County, 1994-1996; Attorney in private practice and public service, 1984-1993; State Representative, Minnesota House of Representatives, 1979-1993, which included service on the Tax and Financial Institutions and Insurance Committees; Member and Interim Chair, Minnesota Sports Facilities Authority, January 2017-July 2017; Interim President and Chief Executive Officer, Blue Cross and Blue Shield of Minnesota (health care insurance), February-July 2018, April-October 2021 | 177 | Former Trustee, Blue Cross and Blue Shield of Minnesota, 2009-2021 (Chair of the Business Development Committee, 2014-2017; Chair of the Governance Committee, 2017-2019); former Member and Chair of the Board, Minnesota Sports Facilities Authority, January 2017-July 2017; former Director, Robina Foundation, 2009-2020 (Chair, 2014-2020); Director, Schulze Family Foundation, since 2021 |
Pamela G. Carlton
c/o Columbia Management
Investment Advisers, LLC
290 Congress Street
Boston, MA 02210
1954 | Trustee since 2007 | President, Springboard — Partners in Cross Cultural Leadership (consulting company) since 2003; Managing Director of US Equity Research, JP Morgan Chase, 1999-2003; Director of US Equity Research, Chase Asset Management, 1996-1999; Co-Director Latin America Research, 1993-1996, COO Global Research, 1992-1996, Co-Director of US Research, 1991-1992, Investment Banker, Morgan Stanley, 1982-1991, Morgan Stanley; Attorney, Cleary Gottlieb Steen & Hamilton LLP, 1980-1982 | 177 | Trustee, New York Presbyterian Hospital Board (Executive Committee and Chair of People Committee) since 1996; Director, DR Bank (Audit Committee) since 2017; Director, Evercore Inc. (Audit Committee) since 2019; Director, Apollo Commercial Real Estate Finance, Inc. since 2021; the Governing Council of the Independent Directors Council (IDC), since 2021 |
Janet Langford Carrig
c/o Columbia Management
Investment Advisers, LLC
290 Congress Street
Boston, MA 02210
1957 | Trustee since 1996 | Senior Vice President, General Counsel and Corporate Secretary, ConocoPhillips (independent energy company), September 2007-October 2018 | 175 | Director, EQT Corporation (natural gas producer) since 2019; Director, Whiting Petroleum Corporation (independent oil and gas company) since 2020 |
J. Kevin Connaughton
c/o Columbia Management
Investment Advisers, LLC
290 Congress Street
Boston, MA 02210
1964 | Trustee since 2020 | Member, FINRA National Adjudicatory Council since January 2020; Adjunct Professor of Finance, Bentley University since January 2018; Consultant to Independent Trustees of CFVIT and CFST I from March 2016 to June 2020 with respect to CFVIT and to December 2020 with respect to CFST I; Managing Director and General Manager of Mutual Fund Products, Columbia Management Investment Advisers, LLC, May 2010-February 2015; President, Columbia Funds, 2008-2015; and senior officer of Columbia Funds and affiliated funds, 2003-2015 | 175 | Former Director, The Autism Project, March 2015-December 2021; former Member of the Investment Committee, St. Michael’s College, November 2015-February 2020; former Trustee, St. Michael’s College, June 2017-September 2019; former Trustee, New Century Portfolios, January 2015-December 2017 |
Columbia Large Cap Index Fund | Annual Report 2022
| 37 |
TRUSTEES AND OFFICERS (continued)
Independent trustees (continued)
Name,
address,
year of birth | Position held
with the Columbia Funds and
length of service | Principal occupation(s)
during past five years
and other relevant
professional experience | Number of
Funds in the
Columbia Funds
Complex*
overseen | Other directorships
held by Trustee
during the past
five years |
Olive M. Darragh
c/o Columbia Management
Investment Advisers, LLC
290 Congress Street
Boston, MA 02210
1962 | Trustee since 2020 | Managing Director of Darragh Inc. (strategy and talent management consulting firm) since 2010; Founder and CEO, Zolio, Inc. (investment management talent identification platform) since 2004; Consultant to Independent Trustees of CFVIT and CFST I from June 2019 to June 2020 with respect to CFVIT and to December 2020 with respect to CFST I; Partner, Tudor Investments, 2004-2010; Senior Partner, McKinsey & Company (consulting), 1990-2004; Touche Ross CPA, 1985-1988 | 175 | Former Director, University of Edinburgh Business School (Member of US Board); former Director, Boston Public Library Foundation |
Patricia M. Flynn
c/o Columbia Management
Investment Advisers, LLC
290 Congress Street
Boston, MA 02210
1950 | Trustee since 2004 | Trustee Professor of Economics and Management, Bentley University since 1976 (also teaches and conducts research on corporate governance); Dean, McCallum Graduate School of Business, Bentley University, 1992-2002 | 177 | Trustee, MA Taxpayers Foundation since 1997; Board of Governors, Innovation Institute, MA Technology Collaborative, 2010-2020; former Board of Directors, The MA Business Roundtable, 2003-2019 |
Brian J. Gallagher
c/o Columbia Management
Investment Advisers, LLC
290 Congress Street
Boston, MA 02210
1954 | Trustee since 2017 | Retired; Partner with Deloitte & Touche LLP and its predecessors, 1977-2016 | 177 | Trustee, Catholic Schools Foundation since 2004 |
Douglas A. Hacker
c/o Columbia Management
Investment Advisers, LLC
290 Congress Street
Boston, MA 02210
1955 | Co-Chair since 2021; Chair of CFST I and CFVIT since 2014; Trustee of CFST I and CFVIT since 1996 and CFST, CFST II, CFVST II, CET I and CET II since 2021 | Independent business executive since May 2006; Executive Vice President – Strategy of United Airlines, December 2002 - May 2006; President of UAL Loyalty Services (airline marketing company), September 2001-December 2002; Executive Vice President and Chief Financial Officer of United Airlines, July 1999-September 2001 | 177 | Director, Spartan Nash Company (food distributor); Director, Aircastle Limited (Chair of Audit Committee) (aircraft leasing); former Director, Nash Finch Company (food distributor), 2005-2013; former Director, SeaCube Container Leasing Ltd. (container leasing), 2010-2013; and former Director, Travelport Worldwide Limited (travel information technology), 2014-2019 |
Nancy T. Lukitsh
c/o Columbia Management
Investment Advisers, LLC
290 Congress Street
Boston, MA 02210
1956 | Trustee since 2011 | Senior Vice President, Partner and Director of Marketing, Wellington Management Company, LLP (investment adviser), 1997-2010; Chair, Wellington Management Portfolios (commingled non-U.S. investment pools), 2007 -2010; Director, Wellington Trust Company, NA and other Wellington affiliates, 1997-2010 | 175 | None |
| 38 | Columbia Large Cap Index Fund | Annual Report 2022 |
TRUSTEES AND OFFICERS (continued)
Independent trustees (continued)
Name,
address,
year of birth | Position held
with the Columbia Funds and
length of service | Principal occupation(s)
during past five years
and other relevant
professional experience | Number of
Funds in the
Columbia Funds
Complex*
overseen | Other directorships
held by Trustee
during the past
five years |
David M. Moffett
c/o Columbia Management
Investment Advisers, LLC
290 Congress Street
Boston, MA 02210
1952 | Trustee since 2011 | Retired; Consultant to Bridgewater and Associates | 175 | Director, CSX Corporation (transportation suppliers); Director, Genworth Financial, Inc. (financial and insurance products and services); Director, PayPal Holdings Inc. (payment and data processing services); Trustee, University of Oklahoma Foundation; former Director, eBay Inc. (online trading community), 2007-2015; and former Director, CIT Bank, CIT Group Inc. (commercial and consumer finance), 2010-2016 |
Catherine James Paglia
c/o Columbia Management
Investment Advisers, LLC
290 Congress Street
Boston, MA 02210
1952 | Co-Chair since 2021; Chair of CFST, CFST II, CFVST II, CET I and CET II since 2020; Trustee of CFST, CFST II and CFVST II since 2004 and CFST I and CFVIT since 2021 | Director, Enterprise Asset Management, Inc. (private real estate and asset management company) since September 1998; Managing Director and Partner, Interlaken Capital, Inc., 1989-1997; Vice President, 1982-1985, Principal, 1985-1987, Managing Director, 1987-1989, Morgan Stanley; Vice President, Investment Banking, 1980-1982, Associate, Investment Banking, 1976-1980, Dean Witter Reynolds, Inc. | 177 | Director, Valmont Industries, Inc. (irrigation systems manufacturer) since 2012; Trustee, Carleton College (on the Investment Committee); Trustee, Carnegie Endowment for International Peace (on the Investment Committee) |
Minor M. Shaw
c/o Columbia Management
Investment Advisers, LLC
290 Congress Street
Boston, MA 02210
1947 | Trustee since 2003 | President, Micco LLC (private investments) since 2011; President, Micco Corp. (family investment business), 1998-2011 | 177 | Director, Blue Cross Blue Shield of South Carolina (Chair of Compensation Committee) since April 2008; Trustee, Hollingsworth Funds (on the Investment Committee) since 2016 (previously Board Chair from 2016-2019); Former Advisory Board member, Duke Energy Corp., 2016-2020; Chair of the Duke Endowment; Chair of Greenville – Spartanburg Airport Commission; former Trustee, BofA Funds Series Trust (11 funds), 2003-2011; former Director, Piedmont Natural Gas, 2004-2016; former Director, National Association of Corporate Directors, Carolinas Chapter, 2013-2018; Chair, Daniel-Mickel Foundation since 1998 |
Columbia Large Cap Index Fund | Annual Report 2022
| 39 |
TRUSTEES AND OFFICERS (continued)
Independent trustees (continued)
Name,
address,
year of birth | Position held
with the Columbia Funds and
length of service | Principal occupation(s)
during past five years
and other relevant
professional experience | Number of
Funds in the
Columbia Funds
Complex*
overseen | Other directorships
held by Trustee
during the past
five years |
Natalie A. Trunow
c/o Columbia Management
Investment Advisers, LLC
290 Congress Street
Boston, MA 02210
1967 | Trustee since 2020 | Chief Executive Officer, Millennial Portfolio Solutions LLC (asset management and consulting services), January 2016-January 2021; Non-executive Member of the Investment Committee and Valuation Committee, Sarona Asset Management Inc. (private equity firm) since September 2019; Advisor, Horizon Investments (asset management and consulting services), August 2018-January 2021; Advisor, Paradigm Asset Management, November 2016-December 2021; Consultant to Independent Trustees of CFVIT and CFST I from September 2016 to June 2020 with respect to CFVIT and to December 2020 with respect to CFST I; Director of Investments/Consultant, Casey Family Programs, April 2016-November 2016; Senior Vice President and Chief Investment Officer, Calvert Investments, August 2008-January 2016; Section Head and Portfolio Manager, General Motors Asset Management, June 1997-August 2008 | 175 | Former Director, Investment Committee, Health Services for Children with Special Needs, Inc., 2012-2019; Director, Chair of Audit Committee, Consumer Credit Counseling Services (formerly Guidewell Financial Solutions), since 2019; Independent Director, Investment Committee and Valuation Committee, Sarona Asset Management, since 2019 |
Sandra Yeager
c/o Columbia Management
Investment Advisers, LLC
290 Congress Street
Boston, MA 02210
1964 | Trustee since 2017 | Retired; President and founder, Hanoverian Capital, LLC (SEC registered investment advisor firm), 2008-2016; Managing Director, DuPont Capital, 2006-2008; Managing Director, Morgan Stanley Investment Management, 2004-2006; Senior Vice President, Alliance Bernstein, 1990-2004 | 177 | Former Director, NAPE Education Foundation, October 2016-October 2020 |
| * | The term “Columbia Funds Complex” as used herein includes Columbia Seligman Premium Technology Growth Fund, Tri-Continental Corporation and each series of Columbia Fund Series Trust (CFST), Columbia Funds Series Trust I (CFST I), Columbia Funds Series Trust II (CFST II), Columbia ETF Trust I (CET I), Columbia ETF Trust II (CET II), Columbia Funds Variable Insurance Trust (CFVIT) and Columbia Funds Variable Series Trust II (CFVST II). Messrs. Batejan, Beckman, Gallagher and Hacker and Mses. Blatz, Carlton, Flynn, Paglia, Shaw and Yeager serve as Directors of Columbia Seligman Premium Technology Growth Fund and Tri-Continental Corporation. |
Interested trustee affiliated with Investment Manager*
Name,
address,
year of birth | Position held with the Columbia Funds and length of service | Principal occupation(s) during the
past five years and other relevant
professional experience | Number of
Funds in the
Columbia Funds
Complex overseen | Other directorships
held by Trustee
during the past
five years |
Daniel J. Beckman
c/o Columbia Management
Investment Advisers, LLC
290 Congress Street
Boston, MA 02210
1962 | Trustee since November 2021 and President since June 2021 | Vice President – Head of North America Product, Columbia Management Investment Advisers, LLC since April 2015; President and Principal Executive Officer of the Columbia Funds since June 2021; officer of Columbia Funds and affiliated funds, 2020-2021 | 177 | Director, Ameriprise Trust Company, since October 2016; Director, Columbia Management Investment Distributors, Inc. since November 2018; Board of Governors, Columbia Wanger Asset Management, LLC since January 2022 |
| * | Interested person (as defined under the 1940 Act) by reason of being an officer, director, security holder and/or employee of the Investment Manager or Ameriprise Financial. |
The Statement of Additional Information has additional information about the Fund’s Board members and is available, without charge, upon request by calling 800.345.6611, visiting columbiathreadneedleus.com/investor/ or contacting your financial intermediary.
| 40 | Columbia Large Cap Index Fund | Annual Report 2022 |
TRUSTEES AND OFFICERS (continued)
The Board has appointed officers who are responsible for day-to-day business decisions based on policies it has established. The officers serve at the pleasure of the Board. The following table provides basic information about the Officers of the Fund as of the printing of this report, including principal occupations during the past five years, although their specific titles may have varied over the period. In addition to Mr. Beckman, who is President and Principal Executive Officer, the Fund’s other officers are:
Fund officers
Name,
address and
year of birth | Position and year
first appointed to
position for any Fund
in the Columbia
Funds Complex or a
predecessor thereof | Principal occupation(s) during past five years |
Michael G. Clarke
290 Congress Street
Boston, MA 02210
1969 | Chief Financial Officer and Principal Financial Officer (2009) and Senior Vice President (2019) | Senior Vice President and Head of Global Operations & Investor Services, Columbia Management Investment Advisers, LLC, since March 2022 (previously Vice President, Head of North American Operations, and Co-Head of Global Operations, June 2019 to February 2022 and Vice President – Accounting and Tax, May 2010 - May 2019); senior officer of Columbia Funds and affiliated funds since 2002. |
Joseph Beranek
5890 Ameriprise
Financial Center
Minneapolis, MN 55474
1965 | Treasurer and Chief Accounting Officer (Principal Accounting Officer) (2019) and Principal Financial Officer (2020), CFST, CFST I, CFST II, CFVIT and CFVST II; Assistant Treasurer, CET I and CET II | Vice President – Mutual Fund Accounting and Financial Reporting, Columbia Management Investment Advisers, LLC, since December 2018 and March 2017, respectively (previously Vice President – Pricing and Corporate Actions, May 2010 - March 2017). |
Marybeth Pilat
290 Congress Street
Boston, MA 02210
1968 | Treasurer and Chief Accounting Officer (Principal Accounting Officer) and Principal Financial Officer (2020) for CET I and CET II; Assistant Treasurer, CFST, CFST I, CFST II, CFVIT and CFVST II | Vice President – Product Pricing and Administration, Columbia Management Investment Advisers, LLC, since May 2017; Director - Fund Administration, Calvert Investments, August 2015 – March 2017; Vice President - Fund Administration, Legg Mason, May 2015 - July 2015; Vice President - Fund Administration, Columbia Management Investment Advisers, LLC, May 2010 - April 2015. |
William F. Truscott
290 Congress Street
Boston, MA 02210
1960 | Senior Vice President (2001) | Formerly, Trustee/Director of Columbia Funds Complex or legacy funds, November 2001-January 1, 2021; Chief Executive Officer, Global Asset Management, Ameriprise Financial, Inc. since September 2012; Chairman of the Board and President, Columbia Management Investment Advisers, LLC since July 2004 and February 2012, respectively; Chairman of the Board and Chief Executive Officer, Columbia Management Investment Distributors, Inc. since November 2008 and February 2012, respectively; Chairman of the Board and Director, Threadneedle Asset Management Holdings, Sàrl since March 2013 and December 2008, respectively; senior executive of various entities affiliated with Columbia Threadneedle. |
Christopher O. Petersen
5228 Ameriprise Financial Center
Minneapolis, MN 55474
1970 | Senior Vice President and Assistant Secretary | Formerly, Trustee/Director of funds within the Columbia Funds Complex, July 1, 2020 - November 22, 2021; Senior Vice President and Assistant General Counsel, Ameriprise Financial, Inc. since September 2021 (previously Vice President and Lead Chief Counsel, January 2015 - September 2021); President and Principal Executive Officer of the Columbia Funds, 2015 - 2021; officer of Columbia Funds and affiliated funds since 2007. |
Thomas P. McGuire
290 Congress Street
Boston, MA 02210
1972 | Senior Vice President and Chief Compliance Officer (2012) | Vice President – Asset Management Compliance, Ameriprise Financial, Inc., since May 2010; Chief Compliance Officer, Columbia Acorn/Wanger Funds since December 2015; Chief Compliance Officer, Ameriprise Certificate Company, September 2010 – September 2020. |
Ryan C. Larrenaga
290 Congress Street
Boston, MA 02210
1970 | Senior Vice President (2017), Chief Legal Officer (2017), and Secretary (2015) | Vice President and Chief Counsel, Ameriprise Financial, Inc. since August 2018 (previously Vice President and Group Counsel, August 2011 - August 2018); Chief Legal Officer, Columbia Acorn/Wanger Funds, since September 2020; officer of Columbia Funds and affiliated funds since 2005. |
Columbia Large Cap Index Fund | Annual Report 2022
| 41 |
TRUSTEES AND OFFICERS (continued)
Fund officers (continued)
Name,
address and
year of birth | Position and year
first appointed to
position for any Fund
in the Columbia
Funds Complex or a
predecessor thereof | Principal occupation(s) during past five years |
Michael E. DeFao
290 Congress Street
Boston, MA 02210
1968 | Vice President (2011) and Assistant Secretary (2010) | Vice President and Chief Counsel, Ameriprise Financial, Inc. since May 2010; Vice President, Chief Legal Officer and Assistant Secretary, Columbia Management Investment Advisers, LLC since October 2021 (previously Vice President and Assistant Secretary, May 2010 – September 2021). |
Lyn Kephart-Strong
5228 Ameriprise
Financial Center
Minneapolis, MN 55474
1960 | Vice President (2015) | President, Columbia Management Investment Services Corp. since October 2014; Vice President & Resolution Officer, Ameriprise Trust Company since August 2009. |
| 42 | Columbia Large Cap Index Fund | Annual Report 2022 |
[THIS PAGE INTENTIONALLY LEFT BLANK]
Columbia Large Cap Index Fund
P.O. Box 219104
Kansas City, MO 64121-9104
Please read and consider the investment objectives, risks, charges and expenses for any fund carefully before investing. For a prospectus and summary prospectus, which contains this and other important information about the Fund, go to
columbiathreadneedleus.com/investor/. The Fund is distributed by Columbia Management Investment Distributors, Inc., member FINRA, and managed by Columbia Management Investment Advisers, LLC.
Columbia Threadneedle Investments (Columbia Threadneedle) is the global brand name of the Columbia and Threadneedle group of companies. All rights reserved.
© 2022 Columbia Management Investment Advisers, LLC.
columbiathreadneedleus.com/investor/

Annual Report
February 28, 2022
Columbia Large Cap Growth Opportunity Fund
Not Federally Insured • No Financial Institution Guarantee • May Lose Value
If you elect to receive the shareholder report for Columbia Large Cap Growth Opportunity Fund (the Fund) in paper, mailed to you, the Fund mails one shareholder report to each shareholder address, unless such shareholder elects to receive shareholder reports from the Fund electronically via e-mail or by having a paper notice mailed to you (Postcard Notice) that your Fund’s shareholder report is available at the Columbia funds’ website (columbiathreadneedleus.com/investor/). If you would like more than one report in paper to be mailed to you, or would like to elect to receive reports via e-mail or access them through Postcard Notice, please call shareholder services at 800.345.6611 and additional reports will be sent to you.
Proxy voting policies and procedures
The policy of the Board of Trustees is to vote the proxies of the companies in which the Fund holds investments consistent with the procedures as stated in the Statement of Additional Information (SAI). You may obtain a copy of the SAI without charge by calling 800.345.6611; contacting your financial intermediary; visiting columbiathreadneedleus.com/investor/; or searching the website of the Securities and Exchange Commission (SEC) at sec.gov. Information regarding how the Fund voted proxies relating to portfolio securities is filed with the SEC by August 31st for the most recent 12-month period ending June 30th of that year, and is available without charge by visiting columbiathreadneedleus.com/investor/, or searching the website of the SEC at sec.gov.
Quarterly schedule of investments
The Fund files a complete schedule of portfolio holdings with the SEC for the first and third quarters of each fiscal year on Form N-PORT. The Fund’s Form N-PORT filings are available on the SEC’s website at sec.gov. The Fund’s complete schedule of portfolio holdings, as filed on Form N-PORT, can also be obtained without charge, upon request, by calling 800.345.6611.
Additional Fund information
For more information about the Fund, please visit columbiathreadneedleus.com/investor/ or call 800.345.6611. Customer Service Representatives are available to answer your questions Monday through Friday from 8 a.m. to 7 p.m. Eastern time.
Fund investment manager
Columbia Management Investment Advisers, LLC (the Investment Manager)
290 Congress Street
Boston, MA 02210
Fund distributor
Columbia Management Investment Distributors, Inc.
290 Congress Street
Boston, MA 02210
Fund transfer agent
Columbia Management Investment Services Corp.
P.O. Box 219104
Kansas City, MO 64121-9104
Columbia Large Cap Growth Opportunity Fund | Annual Report 2022
Investment objective
The Fund seeks long-term growth of capital.
Portfolio management
Nicolas Janvier, CFA
Portfolio Manager
Managed Fund since 2020
Morningstar style boxTM
The Morningstar Style Box is based on a fund’s portfolio holdings. For equity funds, the vertical axis shows the market capitalization of the stocks owned, and the horizontal axis shows investment style (value, blend, or growth). Information shown is based on the most recent data provided by Morningstar.
© 2022 Morningstar, Inc. All rights reserved. The Morningstar information contained herein: (1) is proprietary to Morningstar and/or its content providers; (2) may not be copied or distributed; and (3) is not warranted to be accurate, complete or timely. Neither Morningstar nor its content providers are responsible for any damages or losses arising from any use of this information.
| Average annual total returns (%) (for the period ended February 28, 2022) |
| | | Inception | 1 Year | 5 Years | 10 Years |
| Class A | Excluding sales charges | 12/31/97 | 2.77 | 17.80 | 14.70 |
| | Including sales charges | | -3.15 | 16.41 | 14.02 |
| Advisor Class* | 11/08/12 | 3.00 | 18.09 | 14.96 |
| Class C | Excluding sales charges | 12/31/97 | 1.97 | 16.92 | 13.84 |
| | Including sales charges | | 1.45 | 16.92 | 13.84 |
| Institutional Class | 12/31/97 | 2.99 | 18.09 | 14.99 |
| Institutional 2 Class* | 12/11/13 | 3.09 | 18.18 | 15.03 |
| Institutional 3 Class* | 03/01/17 | 3.14 | 18.23 | 14.91 |
| Class R* | 10/26/16 | 2.50 | 17.51 | 14.42 |
| Russell 1000 Growth Index | | 12.55 | 20.24 | 16.97 |
Returns for Class A shares are shown with and without the maximum initial sales charge of 5.75%. Returns for Class C shares are shown with and without the 1.00% contingent deferred sales charge for the first year only. The Fund’s other share classes are not subject to sales charges and have limited eligibility. Please see the Fund’s prospectus for details. Performance for different share classes will vary based on differences in sales charges and fees associated with each share class. All results shown assume reinvestment of distributions during the period. Returns do not reflect the deduction of taxes that a shareholder may pay on Fund distributions or on the redemption of Fund shares. Performance results reflect the effect of any fee waivers or reimbursements of Fund expenses by Columbia Management Investment Advisers, LLC and/or any of its affiliates. Absent these fee waivers or expense reimbursement arrangements, performance results would have been lower.
The performance information shown represents past performance and is not a guarantee of future results. The investment return and principal value of your investment will fluctuate so that your shares, when redeemed, may be worth more or less than their original cost. Current performance may be lower or higher than the performance information shown. You may obtain performance information current to the most recent month-end by contacting your financial intermediary, visiting columbiathreadneedleus.com/investor/ or calling 800.345.6611.
The Fund’s performance prior to November 2015, when the Investment Manager assumed day-to-day portfolio management responsibilities over the Fund, reflects returns achieved by a subadviser that managed the Fund according to different principal investment strategies. If the Fund’s current strategies had been in place for the prior periods, results shown may have been different.
| * | The returns shown for periods prior to the share class inception date (including returns for the Life of the Fund, if shown, which are since Fund inception) include the returns of the Fund’s oldest share class. Since the Fund launched more than one class of shares at its inception, Class A shares were used. These returns are adjusted to reflect any higher class-related operating expenses of the newer share classes, as applicable. Please visit columbiathreadneedleus.com/investor/investment-products/mutual-funds/appended-performance for more information. |
The Russell 1000 Growth Index, an unmanaged index, measures the performance of those Russell 1000 Index companies with higher price-to-book ratios and higher forecasted growth values.
Indices are not available for investment, are not professionally managed and do not reflect sales charges, fees, brokerage commissions, taxes or other expenses of investing. Securities in the Fund may not match those in an index.
Fund performance may be significantly negatively impacted by the economic impact of the COVID-19 pandemic. The COVID-19 pandemic has adversely impacted economies and capital markets around the world in ways that will likely continue and may change in unforeseen ways for an indeterminate period. The COVID-19 pandemic may exacerbate pre-existing political, social and economic risks in certain countries and globally.
Columbia Large Cap Growth Opportunity Fund | Annual Report 2022
| 3 |
Fund at a Glance (continued)
Performance of a hypothetical $10,000 investment (February 29, 2012 — February 28, 2022)
The chart above shows the change in value of a hypothetical $10,000 investment in Class A shares of Columbia Large Cap Growth Opportunity Fund during the stated time period, and does not reflect the deduction of taxes that a shareholder may pay on Fund distributions or on the redemption of Fund shares.
| Portfolio breakdown (%) (at February 28, 2022) |
| Common Stocks | 99.1 |
| Money Market Funds | 0.9 |
| Total | 100.0 |
Percentages indicated are based upon total investments excluding investments in derivatives, if any. The Fund’s portfolio composition is subject to change.
| Equity sector breakdown (%) (at February 28, 2022) |
| Communication Services | 13.2 |
| Consumer Discretionary | 13.9 |
| Consumer Staples | 6.1 |
| Financials | 2.5 |
| Health Care | 9.7 |
| Industrials | 8.8 |
| Information Technology | 44.3 |
| Materials | 1.5 |
| Total | 100.0 |
Percentages indicated are based upon total equity investments. The Fund’s portfolio composition is subject to change.
| Equity sub-industry breakdown (%) (at February 28, 2022) |
| Information Technology | |
| Application Software | 14.0 |
| Data Processing & Outsourced Services | 3.2 |
| Electronic Equipment & Instruments | 3.9 |
| Electronic Manufacturing Services | 3.6 |
| Internet Services & Infrastructure | 0.3 |
| Semiconductor Equipment | 5.3 |
| Semiconductors | 9.3 |
| Systems Software | 4.7 |
| Total | 44.3 |
Percentages indicated are based upon total equity investments. The Fund’s portfolio composition is subject to change.
| 4 | Columbia Large Cap Growth Opportunity Fund | Annual Report 2022 |
Manager Discussion of Fund Performance
For the 12-month period that ended February 28, 2022, Class A shares of Columbia Large Cap Growth Opportunity Fund returned 2.77% excluding sales charges. The Fund underperformed its benchmark, the Russell 1000 Growth Index, which returned 12.55% for the same time period. The Fund experienced increased portfolio turnover during the 12-month period as a result of prevailing market conditions.
Market overview
U.S. equities posted gains through much of the 12-month period that ended February 28, 2022. As pandemic-related restrictions were eased, robust economic growth and corporate earnings drove gains for stocks. Both U.S. monetary and fiscal policy were highly supportive, as Congress approved massive spending packages that included direct payments to citizens and the U.S. Federal Reserve (Fed) maintained its benchmark overnight lending rate near zero while engaging in bond market purchases to keep longer term borrowing costs low. The fourth quarter of 2021 saw the Fed adopt a more hawkish tone in response to persistently high inflation, driven in large part by supply chain constraints and rising commodity prices, which led to increased market volatility. The first two months of 2022 brought a rocky start, with most major indices returning in negative territory as markets grappled with individual stock volatility, the number and timing of interest rate hikes by the Fed, inflation and geopolitical tensions. Of significance, tensions between Russia and Ukraine near the end of the period, and the subsequent invasion of Ukraine by Russia on February 24, 2022, roiled global markets and drove significant sell-offs.
All eleven sectors within the benchmark delivered positive gains for the 12-month period. The energy, consumer staples, financials, information technology and real estate sectors delivered the strongest gains, outperforming the overall benchmark’s return for the period. The communication services sector lagged most within the benchmark, followed by the consumer discretionary, materials, utilities and health care sectors.
The Fund’s notable detractors during the period
| • | The Fund’s underperformance of its benchmark during the period was driven primarily by stock selection, particularly within the information technology, consumer discretionary, health care, financials and industrials sectors. |
| • | The top individual detractors to Fund performance versus its benchmark during the period all were in the technology sector and included an underweight position in Apple, Inc., a consumer electronics company, Fidelity National Information Services, Inc., a financial technology company offering processing and payment services, Zebra Technologies Corp., a mobile computing company, MasterCard, Inc., a financial services and payment processing company, and Microsoft Corp., a software and application developer. |
The Fund’s notable contributors during the period
| • | Stock selection was beneficial to Fund results in the communication services and materials sectors. |
| • | Individual stocks that contributed most to the Fund’s performance relative to its benchmark during the period included an underweight to Meta Platforms, Inc., the social media giant formerly known as Facebook, Alphabet, Inc., the parent company of search engine Google, both within the communication services sector and Zendesk, Inc., a software development company, Bill.com Holdings, Inc., a cloud-based billing software company and Cadence Design Systems, Inc., a circuit design software company, all within the technology sector. |
Market risk may affect a single issuer, sector of the economy, industry or the market as a whole. Growth securities, at times, may not perform as well as value securities or the stock market in general and may be out of favor with investors. Foreign investments subject the Fund to risks, including political, economic, market, social and others within a particular country, as well as to currency instabilities and less stringent financial and accounting standards generally applicable to U.S. issuers. The Fund may invest significantly in issuers within a particular sector, which may be negatively affected by market, economic or other conditions, making the Fund more vulnerable to unfavorable developments in the sector. See the Fund’s prospectus for more information on these and other risks.
The views expressed in this report reflect the current views of the respective parties who have contributed to this report. These views are not guarantees of future performance and involve certain risks, uncertainties and assumptions that are difficult to predict, so actual outcomes and results may differ significantly from the views expressed. These views are subject to change at any time based upon economic, market or other conditions and the respective
Columbia Large Cap Growth Opportunity Fund | Annual Report 2022
| 5 |
Manager Discussion of Fund Performance (continued)
parties disclaim any responsibility to update such views. These views may not be relied on as investment advice and, because investment decisions for a Columbia fund are based on numerous factors, may not be relied on as an indication of trading intent on behalf of any particular Columbia fund. References to specific securities should not be construed as a recommendation or investment advice.
| 6 | Columbia Large Cap Growth Opportunity Fund | Annual Report 2022 |
Understanding Your Fund’s Expenses
(Unaudited)
As an investor, you incur two types of costs. There are shareholder transaction costs, which generally include sales charges on purchases and may include redemption fees. There are also ongoing fund costs, which generally include management fees, distribution and/or service fees, and other fund expenses. The following information is intended to help you understand your ongoing costs (in dollars) of investing in the Fund and to help you compare these costs with the ongoing costs of investing in other mutual funds.
Analyzing your Fund’s expenses
To illustrate these ongoing costs, we have provided examples and calculated the expenses paid by investors in each share class of the Fund during the period. The actual and hypothetical information in the table is based on an initial investment of $1,000 at the beginning of the period indicated and held for the entire period. Expense information is calculated two ways and each method provides you with different information. The amount listed in the “Actual” column is calculated using the Fund’s actual operating expenses and total return for the period. You may use the Actual information, together with the amount invested, to estimate the expenses that you paid over the period. Simply divide your account value by $1,000 (for example, an $8,600 account value divided by $1,000 = 8.6), then multiply the results by the expenses paid during the period under the “Actual” column. The amount listed in the “Hypothetical” column assumes a 5% annual rate of return before expenses (which is not the Fund’s actual return) and then applies the Fund’s actual expense ratio for the period to the hypothetical return. You should not use the hypothetical account values and expenses to estimate either your actual account balance at the end of the period or the expenses you paid during the period. See “Compare with other funds” below for details on how to use the hypothetical data.
Compare with other funds
Since all mutual funds are required to include the same hypothetical calculations about expenses in shareholder reports, you can use this information to compare the ongoing cost of investing in the Fund with other funds. To do so, compare the hypothetical example with the 5% hypothetical examples that appear in the shareholder reports of other funds. As you compare hypothetical examples of other funds, it is important to note that hypothetical examples are meant to highlight the ongoing costs of investing in a fund only and do not reflect any transaction costs, such as sales charges, or redemption or exchange fees. Therefore, the hypothetical calculations are useful in comparing ongoing costs only, and will not help you determine the relative total costs of owning different funds. If transaction costs were included in these calculations, your costs would be higher.
| September 1, 2021 — February 28, 2022 |
| | Account value at the
beginning of the
period ($) | Account value at the
end of the
period ($) | Expenses paid during
the period ($) | Fund’s annualized
expense ratio (%) |
| | Actual | Hypothetical | Actual | Hypothetical | Actual | Hypothetical | Actual |
| Class A | 1,000.00 | 1,000.00 | 884.60 | 1,019.59 | 4.91 | 5.26 | 1.05 |
| Advisor Class | 1,000.00 | 1,000.00 | 885.40 | 1,020.83 | 3.74 | 4.01 | 0.80 |
| Class C | 1,000.00 | 1,000.00 | 881.20 | 1,015.87 | 8.40 | 9.00 | 1.80 |
| Institutional Class | 1,000.00 | 1,000.00 | 885.40 | 1,020.83 | 3.74 | 4.01 | 0.80 |
| Institutional 2 Class | 1,000.00 | 1,000.00 | 885.90 | 1,021.12 | 3.46 | 3.71 | 0.74 |
| Institutional 3 Class | 1,000.00 | 1,000.00 | 886.20 | 1,021.32 | 3.27 | 3.51 | 0.70 |
| Class R | 1,000.00 | 1,000.00 | 883.60 | 1,018.35 | 6.07 | 6.51 | 1.30 |
Expenses paid during the period are equal to the annualized expense ratio for each class as indicated above, multiplied by the average account value over the period and then multiplied by the number of days in the Fund’s most recent fiscal half year and divided by 365.
Expenses do not include fees and expenses incurred indirectly by the Fund from its investment in underlying funds, including affiliated and non-affiliated pooled investment vehicles, such as mutual funds and exchange-traded funds.
Had Columbia Management Investment Advisers, LLC and/or certain of its affiliates not waived/reimbursed certain fees and expenses, account value at the end of the period would have been reduced.
Columbia Large Cap Growth Opportunity Fund | Annual Report 2022
| 7 |
Portfolio of Investments
February 28, 2022
(Percentages represent value of investments compared to net assets)
Investments in securities
| Common Stocks 98.2% |
| Issuer | Shares | Value ($) |
| Communication Services 12.9% |
| Entertainment 6.6% |
| Electronic Arts, Inc. | 567,053 | 73,767,925 |
| Endeavor Group Holdings, Inc., Class A(a) | 594,191 | 17,902,975 |
| Take-Two Interactive Software, Inc.(a) | 109,016 | 17,660,592 |
| Total | | 109,331,492 |
| Interactive Media & Services 6.3% |
| Alphabet, Inc., Class A(a) | 38,601 | 104,266,705 |
| Total Communication Services | 213,598,197 |
| Consumer Discretionary 13.6% |
| Automobiles 2.0% |
| General Motors Co.(a) | 719,694 | 33,624,104 |
| Diversified Consumer Services 0.8% |
| Bright Horizons Family Solutions, Inc.(a) | 100,180 | 13,087,515 |
| Hotels, Restaurants & Leisure 2.5% |
| Hilton Worldwide Holdings, Inc.(a) | 171,343 | 25,506,119 |
| Starbucks Corp. | 177,887 | 16,328,248 |
| Total | | 41,834,367 |
| Internet & Direct Marketing Retail 2.5% |
| Amazon.com, Inc.(a) | 10,220 | 31,388,277 |
| DoorDash, Inc., Class A(a) | 88,371 | 9,274,536 |
| Total | | 40,662,813 |
| Multiline Retail 4.1% |
| Target Corp. | 339,740 | 67,869,860 |
| Specialty Retail 1.7% |
| TJX Companies, Inc. (The) | 424,778 | 28,077,826 |
| Total Consumer Discretionary | 225,156,485 |
| Consumer Staples 6.0% |
| Beverages 2.7% |
| Coca-Cola Co. (The) | 730,683 | 45,477,710 |
| Food Products 0.4% |
| Darling Ingredients, Inc.(a) | 87,386 | 6,333,737 |
| Personal Products 2.9% |
| Estee Lauder Companies, Inc. (The), Class A | 159,420 | 47,240,929 |
| Total Consumer Staples | 99,052,376 |
| Common Stocks (continued) |
| Issuer | Shares | Value ($) |
| Financials 2.5% |
| Banks 1.0% |
| SVB Financial Group(a) | 27,828 | 16,863,768 |
| Capital Markets 1.5% |
| Morgan Stanley | 131,529 | 11,934,942 |
| Northern Trust Corp. | 110,078 | 12,537,884 |
| Total | | 24,472,826 |
| Total Financials | 41,336,594 |
| Health Care 9.5% |
| Biotechnology 4.1% |
| Allogene Therapeutics, Inc.(a) | 302,285 | 2,765,908 |
| Exact Sciences Corp.(a) | 152,206 | 11,881,200 |
| Mirati Therapeutics, Inc.(a) | 179,397 | 15,838,961 |
| Vertex Pharmaceuticals, Inc.(a) | 163,016 | 37,496,940 |
| Total | | 67,983,009 |
| Health Care Technology 1.0% |
| Doximity, Inc., Class A(a) | 273,892 | 16,803,274 |
| Pharmaceuticals 4.4% |
| Eli Lilly & Co. | 123,147 | 30,780,593 |
| Horizon Therapeutics PLC(a) | 197,062 | 17,966,143 |
| Zoetis, Inc. | 122,536 | 23,729,096 |
| Total | | 72,475,832 |
| Total Health Care | 157,262,115 |
| Industrials 8.7% |
| Aerospace & Defense 1.0% |
| Howmet Aerospace, Inc. | 463,465 | 16,647,663 |
| Air Freight & Logistics 5.3% |
| United Parcel Service, Inc., Class B | 412,258 | 86,747,328 |
| Electrical Equipment 0.6% |
| Generac Holdings, Inc.(a) | 33,082 | 10,436,379 |
| Machinery 1.1% |
| AGCO Corp. | 145,358 | 17,466,217 |
| Professional Services 0.7% |
| Equifax, Inc. | 54,822 | 11,969,835 |
| Total Industrials | 143,267,422 |
The accompanying Notes to Financial Statements are an integral part of this statement.
| 8 | Columbia Large Cap Growth Opportunity Fund | Annual Report 2022 |
Portfolio of Investments (continued)
February 28, 2022
| Common Stocks (continued) |
| Issuer | Shares | Value ($) |
| Information Technology 43.5% |
| Electronic Equipment, Instruments & Components 7.3% |
| TE Connectivity Ltd. | 403,901 | 57,527,620 |
| Zebra Technologies Corp., Class A(a) | 154,874 | 64,015,619 |
| Total | | 121,543,239 |
| IT Services 3.5% |
| Block, Inc., Class A(a) | 38,850 | 4,953,375 |
| MasterCard, Inc., Class A | 115,151 | 41,548,784 |
| Shopify, Inc., Class A(a) | 6,906 | 4,794,559 |
| Toast, Inc., Class A(a) | 296,906 | 6,092,511 |
| Total | | 57,389,229 |
| Semiconductors & Semiconductor Equipment 14.3% |
| Cirrus Logic, Inc.(a) | 200,242 | 17,395,023 |
| GlobalFoundries, Inc.(a) | 344,973 | 20,967,459 |
| Lam Research Corp. | 135,996 | 76,341,355 |
| NVIDIA Corp. | 132,884 | 32,403,763 |
| QUALCOMM, Inc. | 465,949 | 80,138,568 |
| Teradyne, Inc. | 75,738 | 8,931,025 |
| Total | | 236,177,193 |
| Software 18.4% |
| Adobe, Inc.(a) | 139,260 | 65,129,117 |
| Aspen Technology, Inc.(a) | 166,054 | 25,308,290 |
| Atlassian Corp. PLC, Class A(a) | 94,354 | 28,845,905 |
| Bill.com Holdings, Inc.(a) | 71,521 | 17,013,415 |
| Cadence Design Systems, Inc.(a) | 132,597 | 20,079,164 |
| Common Stocks (continued) |
| Issuer | Shares | Value ($) |
| Microsoft Corp. | 57,621 | 17,216,579 |
| Salesforce.com, Inc.(a) | 97,469 | 20,520,148 |
| ServiceNow, Inc.(a) | 65,727 | 38,116,402 |
| Teradata Corp.(a) | 420,738 | 21,032,693 |
| Tyler Technologies, Inc.(a) | 39,249 | 16,808,777 |
| Zendesk, Inc.(a) | 287,081 | 33,493,740 |
| Total | | 303,564,230 |
| Total Information Technology | 718,673,891 |
| Materials 1.5% |
| Chemicals 1.0% |
| Albemarle Corp. | 86,667 | 16,977,198 |
| Containers & Packaging 0.5% |
| Ranpak Holdings Corp.(a) | 306,799 | 7,424,536 |
| Total Materials | 24,401,734 |
Total Common Stocks
(Cost $1,357,727,352) | 1,622,748,814 |
|
| Money Market Funds 0.9% |
| | Shares | Value ($) |
| Columbia Short-Term Cash Fund, 0.168%(b),(c) | 15,282,246 | 15,277,661 |
Total Money Market Funds
(Cost $15,277,640) | 15,277,661 |
Total Investments in Securities
(Cost: $1,373,004,992) | 1,638,026,475 |
| Other Assets & Liabilities, Net | | 15,163,948 |
| Net Assets | 1,653,190,423 |
Notes to Portfolio of Investments
| (a) | Non-income producing investment. |
| (b) | The rate shown is the seven-day current annualized yield at February 28, 2022. |
| (c) | As defined in the Investment Company Act of 1940, as amended, an affiliated company is one in which the Fund owns 5% or more of the company’s outstanding voting securities, or a company which is under common ownership or control with the Fund. The value of the holdings and transactions in these affiliated companies during the year ended February 28, 2022 are as follows: |
| Affiliated issuers | Beginning
of period($) | Purchases($) | Sales($) | Net change in
unrealized
appreciation
(depreciation)($) | End of
period($) | Realized gain
(loss)($) | Dividends($) | End of
period shares |
| Columbia Short-Term Cash Fund, 0.168% |
| | 22,806,514 | 534,148,664 | (541,677,513) | (4) | 15,277,661 | (1,826) | 6,146 | 15,282,246 |
The accompanying Notes to Financial Statements are an integral part of this statement.
Columbia Large Cap Growth Opportunity Fund | Annual Report 2022
| 9 |
Portfolio of Investments (continued)
February 28, 2022
Fair value measurements
The Fund categorizes its fair value measurements according to a three-level hierarchy that maximizes the use of observable inputs and minimizes the use of unobservable inputs by prioritizing that the most observable input be used when available. Observable inputs are those that market participants would use in pricing an investment based on market data obtained from sources independent of the reporting entity. Unobservable inputs are those that reflect the Fund’s assumptions about the information market participants would use in pricing an investment. An investment’s level within the fair value hierarchy is based on the lowest level of any input that is deemed significant to the asset’s or liability’s fair value measurement. The input levels are not necessarily an indication of the risk or liquidity associated with investments at that level. For example, certain U.S. government securities are generally high quality and liquid, however, they are reflected as Level 2 because the inputs used to determine fair value may not always be quoted prices in an active market.
Fair value inputs are summarized in the three broad levels listed below:
| ■ | Level 1 — Valuations based on quoted prices for investments in active markets that the Fund has the ability to access at the measurement date. Valuation adjustments are not applied to Level 1 investments. |
| ■ | Level 2 — Valuations based on other significant observable inputs (including quoted prices for similar securities, interest rates, prepayment speeds, credit risks, etc.). |
| ■ | Level 3 — Valuations based on significant unobservable inputs (including the Fund’s own assumptions and judgment in determining the fair value of investments). |
Inputs that are used in determining fair value of an investment may include price information, credit data, volatility statistics, and other factors. These inputs can be either observable or unobservable. The availability of observable inputs can vary between investments, and is affected by various factors such as the type of investment, and the volume and level of activity for that investment or similar investments in the marketplace. The inputs will be considered by the Investment Manager, along with any other relevant factors in the calculation of an investment’s fair value. The Fund uses prices and inputs that are current as of the measurement date, which may include periods of market dislocations. During these periods, the availability of prices and inputs may be reduced for many investments. This condition could cause an investment to be reclassified between the various levels within the hierarchy.
Investments falling into the Level 3 category are primarily supported by quoted prices from brokers and dealers participating in the market for those investments. However, these may be classified as Level 3 investments due to lack of market transparency and corroboration to support these quoted prices. Additionally, valuation models may be used as the pricing source for any remaining investments classified as Level 3. These models may rely on one or more significant unobservable inputs and/or significant assumptions by the Investment Manager. Inputs used in valuations may include, but are not limited to, financial statement analysis, capital account balances, discount rates and estimated cash flows, and comparable company data.
Under the direction of the Fund’s Board of Trustees (the Board), the Investment Manager’s Valuation Committee (the Committee) is responsible for overseeing the valuation procedures approved by the Board. The Committee consists of voting and non-voting members from various groups within the Investment Manager’s organization, including operations and accounting, trading and investments, compliance, risk management and legal.
The Committee meets at least monthly to review and approve valuation matters, which may include a description of specific valuation determinations, data regarding pricing information received from approved pricing vendors and brokers and the results of Board-approved valuation control policies and procedures (the Policies). The Policies address, among other things, instances when market quotations are or are not readily available, including recommendations of third party pricing vendors and a determination of appropriate pricing methodologies; events that require specific valuation determinations and assessment of fair value techniques; securities with a potential for stale pricing, including those that are illiquid, restricted, or in default; and the effectiveness of third party pricing vendors, including periodic reviews of vendors. The Committee meets more frequently, as needed, to discuss additional valuation matters, which may include the need to review back-testing results, review time-sensitive information or approve related valuation actions. The Committee reports to the Board, with members of the Committee meeting with the Board at each of its regularly scheduled meetings to discuss valuation matters and actions during the period, similar to those described earlier.
The following table is a summary of the inputs used to value the Fund’s investments at February 28, 2022:
| | Level 1 ($) | Level 2 ($) | Level 3 ($) | Total ($) |
| Investments in Securities | | | | |
| Common Stocks | | | | |
| Communication Services | 213,598,197 | — | — | 213,598,197 |
| Consumer Discretionary | 225,156,485 | — | — | 225,156,485 |
| Consumer Staples | 99,052,376 | — | — | 99,052,376 |
| Financials | 41,336,594 | — | — | 41,336,594 |
| Health Care | 157,262,115 | — | — | 157,262,115 |
| Industrials | 143,267,422 | — | — | 143,267,422 |
| Information Technology | 718,673,891 | — | — | 718,673,891 |
| Materials | 24,401,734 | — | — | 24,401,734 |
| Total Common Stocks | 1,622,748,814 | — | — | 1,622,748,814 |
| Money Market Funds | 15,277,661 | — | — | 15,277,661 |
| Total Investments in Securities | 1,638,026,475 | — | — | 1,638,026,475 |
See the Portfolio of Investments for all investment classifications not indicated in the table.
The accompanying Notes to Financial Statements are an integral part of this statement.
| 10 | Columbia Large Cap Growth Opportunity Fund | Annual Report 2022 |
Statement of Assets and Liabilities
February 28, 2022
| Assets | |
| Investments in securities, at value | |
| Unaffiliated issuers (cost $1,357,727,352) | $1,622,748,814 |
| Affiliated issuers (cost $15,277,640) | 15,277,661 |
| Receivable for: | |
| Investments sold | 20,773,716 |
| Capital shares sold | 326,648 |
| Dividends | 1,617,151 |
| Expense reimbursement due from Investment Manager | 5,547 |
| Prepaid expenses | 16,882 |
| Total assets | 1,660,766,419 |
| Liabilities | |
| Payable for: | |
| Investments purchased | 5,705,668 |
| Capital shares purchased | 972,519 |
| Management services fees | 96,765 |
| Distribution and/or service fees | 24,548 |
| Transfer agent fees | 178,258 |
| Compensation of board members | 552,201 |
| Compensation of chief compliance officer | 301 |
| Other expenses | 45,736 |
| Total liabilities | 7,575,996 |
| Net assets applicable to outstanding capital stock | $1,653,190,423 |
| Represented by | |
| Paid in capital | 1,187,423,261 |
| Total distributable earnings (loss) | 465,767,162 |
| Total - representing net assets applicable to outstanding capital stock | $1,653,190,423 |
The accompanying Notes to Financial Statements are an integral part of this statement.
Columbia Large Cap Growth Opportunity Fund | Annual Report 2022
| 11 |
Statement of Assets and Liabilities (continued)
February 28, 2022
| Class A | |
| Net assets | $1,094,509,395 |
| Shares outstanding | 65,381,117 |
| Net asset value per share | $16.74 |
| Maximum sales charge | 5.75% |
| Maximum offering price per share (calculated by dividing the net asset value per share by 1.0 minus the maximum sales charge for Class A shares) | $17.76 |
| Advisor Class | |
| Net assets | $22,973,789 |
| Shares outstanding | 1,120,074 |
| Net asset value per share | $20.51 |
| Class C | |
| Net assets | $14,134,753 |
| Shares outstanding | 2,013,567 |
| Net asset value per share | $7.02 |
| Institutional Class | |
| Net assets | $468,669,862 |
| Shares outstanding | 24,090,341 |
| Net asset value per share | $19.45 |
| Institutional 2 Class | |
| Net assets | $31,012,426 |
| Shares outstanding | 1,484,146 |
| Net asset value per share | $20.90 |
| Institutional 3 Class | |
| Net assets | $1,405,701 |
| Shares outstanding | 71,481 |
| Net asset value per share | $19.67 |
| Class R | |
| Net assets | $20,484,497 |
| Shares outstanding | 1,215,947 |
| Net asset value per share | $16.85 |
The accompanying Notes to Financial Statements are an integral part of this statement.
| 12 | Columbia Large Cap Growth Opportunity Fund | Annual Report 2022 |
Statement of Operations
Year Ended February 28, 2022
| Net investment income | |
| Income: | |
| Dividends — unaffiliated issuers | $12,651,645 |
| Dividends — affiliated issuers | 6,146 |
| Total income | 12,657,791 |
| Expenses: | |
| Management services fees | 13,400,347 |
| Distribution and/or service fees | |
| Class A | 3,136,823 |
| Class C | 213,843 |
| Class R | 124,945 |
| Transfer agent fees | |
| Class A | 1,415,539 |
| Advisor Class | 29,575 |
| Class C | 24,173 |
| Institutional Class | 623,849 |
| Institutional 2 Class | 19,068 |
| Institutional 3 Class | 186 |
| Class R | 28,200 |
| Compensation of board members | 117,944 |
| Custodian fees | 14,504 |
| Printing and postage fees | 79,701 |
| Registration fees | 125,462 |
| Audit fees | 29,596 |
| Legal fees | 32,005 |
| Interest on interfund lending | 102 |
| Compensation of chief compliance officer | 288 |
| Other | 28,241 |
| Total expenses | 19,444,391 |
| Fees waived or expenses reimbursed by Investment Manager and its affiliates | (745,606) |
| Expense reduction | (851) |
| Total net expenses | 18,697,934 |
| Net investment loss | (6,040,143) |
| Realized and unrealized gain (loss) — net | |
| Net realized gain (loss) on: | |
| Investments — unaffiliated issuers | 667,651,934 |
| Investments — affiliated issuers | (1,826) |
| Net realized gain | 667,650,108 |
| Net change in unrealized appreciation (depreciation) on: | |
| Investments — unaffiliated issuers | (590,491,983) |
| Investments — affiliated issuers | (4) |
| Net change in unrealized appreciation (depreciation) | (590,491,987) |
| Net realized and unrealized gain | 77,158,121 |
| Net increase in net assets resulting from operations | $71,117,978 |
The accompanying Notes to Financial Statements are an integral part of this statement.
Columbia Large Cap Growth Opportunity Fund | Annual Report 2022
| 13 |
Statement of Changes in Net Assets
| | Year Ended
February 28, 2022 | Year Ended
February 28, 2021 |
| Operations | | |
| Net investment loss | $(6,040,143) | $(1,452,611) |
| Net realized gain | 667,650,108 | 280,519,044 |
| Net change in unrealized appreciation (depreciation) | (590,491,987) | 388,546,029 |
| Net increase in net assets resulting from operations | 71,117,978 | 667,612,462 |
| Distributions to shareholders | | |
| Net investment income and net realized gains | | |
| Class A | (421,064,836) | (139,067,738) |
| Advisor Class | (7,670,849) | (2,393,609) |
| Class C | (10,858,622) | (7,102,003) |
| Institutional Class | (167,409,437) | (56,589,107) |
| Institutional 2 Class | (10,606,828) | (2,823,471) |
| Institutional 3 Class | (503,226) | (148,617) |
| Class R | (8,113,395) | (2,936,930) |
| Total distributions to shareholders | (626,227,193) | (211,061,475) |
| Increase (decrease) in net assets from capital stock activity | 359,328,810 | (28,132,733) |
| Total increase (decrease) in net assets | (195,780,405) | 428,418,254 |
| Net assets at beginning of year | 1,848,970,828 | 1,420,552,574 |
| Net assets at end of year | $1,653,190,423 | $1,848,970,828 |
The accompanying Notes to Financial Statements are an integral part of this statement.
| 14 | Columbia Large Cap Growth Opportunity Fund | Annual Report 2022 |
Statement of Changes in Net Assets (continued)
| | Year Ended | Year Ended |
| | February 28, 2022 | February 28, 2021 |
| | Shares | Dollars ($) | Shares | Dollars ($) |
| Capital stock activity |
| Class A | | | | |
| Subscriptions | 6,956,448 | 143,180,568 | 3,422,730 | 70,474,490 |
| Distributions reinvested | 14,401,962 | 288,079,087 | 4,639,656 | 95,516,492 |
| Redemptions | (7,191,823) | (156,275,823) | (8,579,194) | (176,910,830) |
| Net increase (decrease) | 14,166,587 | 274,983,832 | (516,808) | (10,919,848) |
| Advisor Class | | | | |
| Subscriptions | 110,541 | 2,961,031 | 165,478 | 4,086,134 |
| Distributions reinvested | 315,936 | 7,659,342 | 100,397 | 2,391,082 |
| Redemptions | (221,140) | (5,635,233) | (238,356) | (5,336,921) |
| Net increase | 205,337 | 4,985,140 | 27,519 | 1,140,295 |
| Class C | | | | |
| Subscriptions | 146,191 | 1,648,532 | 234,359 | 2,963,551 |
| Distributions reinvested | 1,170,598 | 10,506,512 | 516,051 | 6,379,511 |
| Redemptions | (1,479,921) | (18,661,446) | (1,834,992) | (23,330,991) |
| Net decrease | (163,132) | (6,506,402) | (1,084,582) | (13,987,929) |
| Institutional Class | | | | |
| Subscriptions | 1,926,649 | 46,905,979 | 2,082,903 | 49,431,380 |
| Distributions reinvested | 6,036,812 | 139,332,423 | 2,026,959 | 46,394,110 |
| Redemptions | (4,471,485) | (109,509,867) | (4,660,306) | (105,713,887) |
| Net increase (decrease) | 3,491,976 | 76,728,535 | (550,444) | (9,888,397) |
| Institutional 2 Class | | | | |
| Subscriptions | 152,604 | 4,255,802 | 386,942 | 9,958,955 |
| Distributions reinvested | 429,597 | 10,606,828 | 116,706 | 2,823,471 |
| Redemptions | (340,250) | (8,709,668) | (236,211) | (5,413,625) |
| Net increase | 241,951 | 6,152,962 | 267,437 | 7,368,801 |
| Institutional 3 Class | | | | |
| Subscriptions | 3,546 | 94,111 | 16,456 | 405,374 |
| Distributions reinvested | 19,395 | 453,005 | 5,773 | 133,915 |
| Redemptions | (13,037) | (329,525) | (5,468) | (136,117) |
| Net increase | 9,904 | 217,591 | 16,761 | 403,172 |
| Class R | | | | |
| Subscriptions | 144,845 | 3,261,279 | 225,630 | 4,581,580 |
| Distributions reinvested | 402,512 | 8,113,395 | 141,690 | 2,923,196 |
| Redemptions | (393,500) | (8,607,522) | (488,697) | (9,753,603) |
| Net increase (decrease) | 153,857 | 2,767,152 | (121,377) | (2,248,827) |
| Total net increase (decrease) | 18,106,480 | 359,328,810 | (1,961,494) | (28,132,733) |
The accompanying Notes to Financial Statements are an integral part of this statement.
Columbia Large Cap Growth Opportunity Fund | Annual Report 2022
| 15 |
The following table is intended to help you understand the Fund’s financial performance. Certain information reflects financial results for a single share of a class held for the periods shown. Per share net investment income (loss) amounts are calculated based on average shares outstanding during the period. Total return assumes reinvestment of all dividends and distributions, if any. Total return does not reflect payment of sales charges, if any. Total return and portfolio turnover are not annualized for periods of less than one year. The portfolio turnover rate is calculated without regard to purchase and sales transactions of short-term instruments and certain derivatives, if any. If such transactions were included, the Fund’s portfolio turnover rate may be higher.
| | Net asset value,
beginning of
period | Net
investment
income
(loss) | Net
realized
and
unrealized
gain | Total from
investment
operations | Distributions
from net
realized
gains | Total
distributions to
shareholders |
| Class A |
| Year Ended 2/28/2022 | $23.37 | (0.09) | 1.57 | 1.48 | (8.11) | (8.11) |
| Year Ended 2/28/2021 | $17.67 | (0.03) | 8.53 | 8.50 | (2.80) | (2.80) |
| Year Ended 2/29/2020 | $17.18 | (0.03) | 2.34 | 2.31 | (1.82) | (1.82) |
| Year Ended 2/28/2019 | $18.33 | (0.03) | 0.75 | 0.72 | (1.87) | (1.87) |
| Year Ended 2/28/2018 | $15.74 | (0.01) | 3.66 | 3.65 | (1.06) | (1.06) |
| Advisor Class |
| Year Ended 2/28/2022 | $27.08 | (0.04) | 1.69 | 1.65 | (8.22) | (8.22) |
| Year Ended 2/28/2021 | $20.07 | 0.02 | 9.79 | 9.81 | (2.80) | (2.80) |
| Year Ended 2/29/2020 | $19.26 | 0.02 | 2.61 | 2.63 | (1.82) | (1.82) |
| Year Ended 2/28/2019 | $20.27 | 0.02 | 0.85 | 0.87 | (1.88) | (1.88) |
| Year Ended 2/28/2018 | $17.30 | 0.03 | 4.03 | 4.06 | (1.09) | (1.09) |
| Class C |
| Year Ended 2/28/2022 | $13.72 | (0.14) | 1.24 | 1.10 | (7.80) | (7.80) |
| Year Ended 2/28/2021 | $11.35 | (0.11) | 5.28 | 5.17 | (2.80) | (2.80) |
| Year Ended 2/29/2020 | $11.70 | (0.11) | 1.58 | 1.47 | (1.82) | (1.82) |
| Year Ended 2/28/2019 | $13.14 | (0.12) | 0.53 | 0.41 | (1.85) | (1.85) |
| Year Ended 2/28/2018 | $11.58 | (0.10) | 2.66 | 2.56 | (1.00) | (1.00) |
| Institutional Class |
| Year Ended 2/28/2022 | $26.05 | (0.03) | 1.65 | 1.62 | (8.22) | (8.22) |
| Year Ended 2/28/2021 | $19.39 | 0.02 | 9.44 | 9.46 | (2.80) | (2.80) |
| Year Ended 2/29/2020 | $18.66 | 0.02 | 2.53 | 2.55 | (1.82) | (1.82) |
| Year Ended 2/28/2019 | $19.70 | 0.02 | 0.82 | 0.84 | (1.88) | (1.88) |
| Year Ended 2/28/2018 | $16.84 | 0.03 | 3.92 | 3.95 | (1.09) | (1.09) |
| Institutional 2 Class |
| Year Ended 2/28/2022 | $27.46 | (0.02) | 1.70 | 1.68 | (8.24) | (8.24) |
| Year Ended 2/28/2021 | $20.31 | 0.04 | 9.91 | 9.95 | (2.80) | (2.80) |
| Year Ended 2/29/2020 | $19.46 | 0.03 | 2.64 | 2.67 | (1.82) | (1.82) |
| Year Ended 2/28/2019 | $20.45 | 0.03 | 0.86 | 0.89 | (1.88) | (1.88) |
| Year Ended 2/28/2018 | $17.44 | 0.05 | 4.06 | 4.11 | (1.10) | (1.10) |
The accompanying Notes to Financial Statements are an integral part of this statement.
| 16 | Columbia Large Cap Growth Opportunity Fund | Annual Report 2022 |
Financial Highlights (continued)
| | Net
asset
value,
end of
period | Total
return | Total gross
expense
ratio to
average
net assets(a) | Total net
expense
ratio to
average
net assets(a),(b) | Net investment
income (loss)
ratio to
average
net assets | Portfolio
turnover | Net
assets,
end of
period
(000’s) |
| Class A |
| Year Ended 2/28/2022 | $16.74 | 2.77% | 1.08%(c) | 1.04%(c),(d) | (0.38%) | 93% | $1,094,509 |
| Year Ended 2/28/2021 | $23.37 | 50.88% | 1.11%(c) | 1.04%(c),(d) | (0.15%) | 44% | $1,197,121 |
| Year Ended 2/29/2020 | $17.67 | 13.54% | 1.12% | 1.04%(d) | (0.16%) | 42% | $913,905 |
| Year Ended 2/28/2019 | $17.18 | 4.19% | 1.12% | 1.08%(d) | (0.16%) | 23% | $929,808 |
| Year Ended 2/28/2018 | $18.33 | 23.65% | 1.12% | 1.12%(d) | (0.07%) | 37% | $850,411 |
| Advisor Class |
| Year Ended 2/28/2022 | $20.51 | 3.00% | 0.83%(c) | 0.79%(c),(d) | (0.13%) | 93% | $22,974 |
| Year Ended 2/28/2021 | $27.08 | 51.34% | 0.86%(c) | 0.79%(c),(d) | 0.10% | 44% | $24,768 |
| Year Ended 2/29/2020 | $20.07 | 13.75% | 0.87% | 0.79%(d) | 0.09% | 42% | $17,809 |
| Year Ended 2/28/2019 | $19.26 | 4.53% | 0.87% | 0.83%(d) | 0.09% | 23% | $26,286 |
| Year Ended 2/28/2018 | $20.27 | 23.93% | 0.87% | 0.87%(d) | 0.18% | 37% | $27,793 |
| Class C |
| Year Ended 2/28/2022 | $7.02 | 1.97% | 1.83%(c) | 1.79%(c),(d) | (1.14%) | 93% | $14,135 |
| Year Ended 2/28/2021 | $13.72 | 49.77% | 1.86%(c) | 1.79%(c),(d) | (0.90%) | 44% | $29,863 |
| Year Ended 2/29/2020 | $11.35 | 12.66% | 1.87% | 1.80%(d) | (0.91%) | 42% | $37,004 |
| Year Ended 2/28/2019 | $11.70 | 3.46% | 1.86% | 1.84%(d) | (0.96%) | 23% | $57,316 |
| Year Ended 2/28/2018 | $13.14 | 22.74% | 1.87% | 1.87%(d) | (0.79%) | 37% | $291,221 |
| Institutional Class |
| Year Ended 2/28/2022 | $19.45 | 2.99% | 0.83%(c) | 0.79%(c),(d) | (0.14%) | 93% | $468,670 |
| Year Ended 2/28/2021 | $26.05 | 51.34% | 0.86%(c) | 0.79%(c),(d) | 0.10% | 44% | $536,602 |
| Year Ended 2/29/2020 | $19.39 | 13.76% | 0.87% | 0.79%(d) | 0.09% | 42% | $410,156 |
| Year Ended 2/28/2019 | $18.66 | 4.51% | 0.87% | 0.83%(d) | 0.09% | 23% | $472,922 |
| Year Ended 2/28/2018 | $19.70 | 23.93% | 0.87% | 0.87%(d) | 0.19% | 37% | $537,229 |
| Institutional 2 Class |
| Year Ended 2/28/2022 | $20.90 | 3.09% | 0.77%(c) | 0.74%(c) | (0.08%) | 93% | $31,012 |
| Year Ended 2/28/2021 | $27.46 | 51.43% | 0.79%(c) | 0.73%(c) | 0.15% | 44% | $34,108 |
| Year Ended 2/29/2020 | $20.31 | 13.81% | 0.80% | 0.73% | 0.16% | 42% | $19,798 |
| Year Ended 2/28/2019 | $19.46 | 4.60% | 0.80% | 0.76% | 0.17% | 23% | $12,349 |
| Year Ended 2/28/2018 | $20.45 | 24.04% | 0.80% | 0.80% | 0.26% | 37% | $9,310 |
The accompanying Notes to Financial Statements are an integral part of this statement.
Columbia Large Cap Growth Opportunity Fund | Annual Report 2022
| 17 |
Financial Highlights (continued)
| | Net asset value,
beginning of
period | Net
investment
income
(loss) | Net
realized
and
unrealized
gain | Total from
investment
operations | Distributions
from net
realized
gains | Total
distributions to
shareholders |
| Institutional 3 Class |
| Year Ended 2/28/2022 | $26.27 | (0.01) | 1.67 | 1.66 | (8.26) | (8.26) |
| Year Ended 2/28/2021 | $19.52 | 0.05 | 9.50 | 9.55 | (2.80) | (2.80) |
| Year Ended 2/29/2020 | $18.75 | 0.04 | 2.55 | 2.59 | (1.82) | (1.82) |
| Year Ended 2/28/2019 | $19.77 | 0.04 | 0.82 | 0.86 | (1.88) | (1.88) |
| Year Ended 2/28/2018(e) | $17.10 | 0.04 | 3.74 | 3.78 | (1.11) | (1.11) |
| Class R |
| Year Ended 2/28/2022 | $23.44 | (0.15) | 1.57 | 1.42 | (8.01) | (8.01) |
| Year Ended 2/28/2021 | $17.75 | (0.08) | 8.57 | 8.49 | (2.80) | (2.80) |
| Year Ended 2/29/2020 | $17.30 | (0.07) | 2.34 | 2.27 | (1.82) | (1.82) |
| Year Ended 2/28/2019 | $18.47 | (0.07) | 0.76 | 0.69 | (1.86) | (1.86) |
| Year Ended 2/28/2018 | $15.87 | (0.05) | 3.67 | 3.62 | (1.02) | (1.02) |
| Notes to Financial Highlights |
| (a) | In addition to the fees and expenses that the Fund bears directly, the Fund indirectly bears a pro rata share of the fees and expenses of any other funds in which it invests. Such indirect expenses are not included in the Fund’s reported expense ratios. |
| (b) | Total net expenses include the impact of certain fee waivers/expense reimbursements made by the Investment Manager and certain of its affiliates, if applicable. |
| (c) | Ratios include interfund lending expense which is less than 0.01%. |
| (d) | The benefits derived from expense reductions had an impact of less than 0.01%. |
| (e) | Institutional 3 Class shares commenced operations on March 1, 2017. Per share data and total return reflect activity from that date. |
The accompanying Notes to Financial Statements are an integral part of this statement.
| 18 | Columbia Large Cap Growth Opportunity Fund | Annual Report 2022 |
Financial Highlights (continued)
| | Net
asset
value,
end of
period | Total
return | Total gross
expense
ratio to
average
net assets(a) | Total net
expense
ratio to
average
net assets(a),(b) | Net investment
income (loss)
ratio to
average
net assets | Portfolio
turnover | Net
assets,
end of
period
(000’s) |
| Institutional 3 Class |
| Year Ended 2/28/2022 | $19.67 | 3.14% | 0.73%(c) | 0.69%(c) | (0.03%) | 93% | $1,406 |
| Year Ended 2/28/2021 | $26.27 | 51.47% | 0.75%(c) | 0.69%(c) | 0.20% | 44% | $1,618 |
| Year Ended 2/29/2020 | $19.52 | 13.91% | 0.76% | 0.69% | 0.20% | 42% | $875 |
| Year Ended 2/28/2019 | $18.75 | 4.61% | 0.77% | 0.71% | 0.24% | 23% | $780 |
| Year Ended 2/28/2018(e) | $19.77 | 22.55% | 0.76% | 0.76% | 0.19% | 37% | $262 |
| Class R |
| Year Ended 2/28/2022 | $16.85 | 2.50% | 1.33%(c) | 1.29%(c),(d) | (0.64%) | 93% | $20,484 |
| Year Ended 2/28/2021 | $23.44 | 50.57% | 1.36%(c) | 1.29%(c),(d) | (0.40%) | 44% | $24,892 |
| Year Ended 2/29/2020 | $17.75 | 13.20% | 1.37% | 1.30%(d) | (0.41%) | 42% | $21,006 |
| Year Ended 2/28/2019 | $17.30 | 4.00% | 1.37% | 1.33%(d) | (0.41%) | 23% | $24,324 |
| Year Ended 2/28/2018 | $18.47 | 23.28% | 1.37% | 1.37%(d) | (0.31%) | 37% | $24,453 |
The accompanying Notes to Financial Statements are an integral part of this statement.
Columbia Large Cap Growth Opportunity Fund | Annual Report 2022
| 19 |
Notes to Financial Statements
February 28, 2022
Note 1. Organization
Columbia Large Cap Growth Opportunity Fund (the Fund), a series of Columbia Funds Series Trust (the Trust), is a diversified fund. The Trust is registered under the Investment Company Act of 1940, as amended (the 1940 Act), as an open-end management investment company organized as a Delaware statutory trust.
Fund shares
The Trust may issue an unlimited number of shares (without par value). The Fund offers each of the share classes listed in the Statement of Assets and Liabilities. Although all share classes generally have identical voting, dividend and liquidation rights, each share class votes separately when required by the Trust’s organizational documents or by law. Each share class has its own expense and sales charge structure. Different share classes may have different minimum initial investment amounts and pay different net investment income distribution amounts to the extent the expenses of distributing such share classes vary. Distributions to shareholders in a liquidation will be proportional to the net asset value of each share class.
As described in the Fund’s prospectus, Class A and Class C shares are offered to the general public for investment. Effective April 1, 2021, Class C shares automatically convert to Class A shares after 8 years. Prior to April 1, 2021, Class C shares automatically converted to Class A shares after 10 years. Advisor Class, Institutional Class, Institutional 2 Class, Institutional 3 Class and Class R shares are available for purchase through authorized investment professionals to omnibus retirement plans or to institutional investors and to certain other investors as also described in the Fund’s prospectus.
Note 2. Summary of significant accounting policies
Basis of preparation
The Fund is an investment company that applies the accounting and reporting guidance in the Financial Accounting Standards Board (FASB) Accounting Standards Codification Topic 946, Financial Services - Investment Companies (ASC 946). The financial statements are prepared in accordance with U.S. generally accepted accounting principles (GAAP), which requires management to make certain estimates and assumptions that affect the reported amounts of assets and liabilities, the disclosure of contingent assets and liabilities at the date of the financial statements and the reported amounts of income and expenses during the reporting period. Actual results could differ from those estimates.
The following is a summary of significant accounting policies followed by the Fund in the preparation of its financial statements.
Security valuation
Equity securities listed on an exchange are valued at the closing price or last trade price on their primary exchange at the close of business of the New York Stock Exchange. Securities with a closing price not readily available or not listed on any exchange are valued at the mean between the closing bid and ask prices. Listed preferred stocks convertible into common stocks are valued using an evaluated price from a pricing service.
Foreign equity securities are valued based on the closing price or last trade price on their primary exchange at the close of business of the New York Stock Exchange. If any foreign equity security closing prices are not readily available, the securities are valued at the mean of the latest quoted bid and ask prices on such exchanges or markets. Foreign currency exchange rates are determined at the scheduled closing time of the New York Stock Exchange. Many securities markets and exchanges outside the U.S. close prior to the close of the New York Stock Exchange; therefore, the closing prices for securities in such markets or on such exchanges may not fully reflect events that occur after such close but before the close of the New York Stock Exchange. In those situations, foreign securities will be fair valued pursuant to a policy adopted by the Board of Trustees. Under the policy, the Fund may utilize a third-party pricing service to determine these fair values. The third-party pricing service takes into account multiple factors, including, but not limited to, movements in the U.S. securities markets, certain depositary receipts, futures contracts and foreign exchange rates that have occurred subsequent to the close of the foreign exchange or market, to determine a good faith estimate that reasonably reflects the current market conditions as of the close of the New York Stock Exchange. The fair value of a security is likely to be different from the quoted or published price, if available.
| 20 | Columbia Large Cap Growth Opportunity Fund | Annual Report 2022 |
Notes to Financial Statements (continued)
February 28, 2022
Investments in open-end investment companies (other than exchange-traded funds (ETFs)), are valued at the latest net asset value reported by those companies as of the valuation time.
Investments for which market quotations are not readily available, or that have quotations which management believes are not reflective of market value or reliable, are valued at fair value as determined in good faith under procedures approved by and under the general supervision of the Board of Trustees. If a security or class of securities (such as foreign securities) is valued at fair value, such value is likely to be different from the quoted or published price for the security, if available.
The determination of fair value often requires significant judgment. To determine fair value, management may use assumptions including but not limited to future cash flows and estimated risk premiums. Multiple inputs from various sources may be used to determine fair value.
GAAP requires disclosure regarding the inputs and valuation techniques used to measure fair value and any changes in valuation inputs or techniques. In addition, investments shall be disclosed by major category. This information is disclosed following the Fund’s Portfolio of Investments.
Security transactions
Security transactions are accounted for on the trade date. Cost is determined and gains (losses) are based upon the specific identification method for both financial statement and federal income tax purposes.
Income recognition
Corporate actions and dividend income are generally recorded net of any non-reclaimable tax withholdings, on the ex-dividend date or upon receipt of an ex-dividend notification in the case of certain foreign securities.
The Fund may receive distributions from holdings in equity securities, business development companies (BDCs), exchange-traded funds (ETFs), limited partnerships (LPs), other regulated investment companies (RICs), and real estate investment trusts (REITs), which report information as to the tax character of their distributions annually. These distributions are allocated to dividend income, capital gain and return of capital based on actual information reported. Return of capital is recorded as a reduction of the cost basis of securities held. If the Fund no longer owns the applicable securities, return of capital is recorded as a realized gain. With respect to REITs, to the extent actual information has not yet been reported, estimates for return of capital are made by Columbia Management Investment Advisers, LLC (the Investment Manager), a wholly-owned subsidiary of Ameriprise Financial, Inc. (Ameriprise Financial). The Investment Manager’s estimates are subsequently adjusted when the actual character of the distributions is disclosed by the REITs, which could result in a proportionate change in return of capital to shareholders.
Awards from class action litigation are recorded as a reduction of cost basis if the Fund still owns the applicable securities on the payment date. If the Fund no longer owns the applicable securities on the payment date, the proceeds are recorded as realized gains.
Expenses
General expenses of the Trust are allocated to the Fund and other funds of the Trust based upon relative net assets or other expense allocation methodologies determined by the nature of the expense. Expenses directly attributable to the Fund are charged to the Fund. Expenses directly attributable to a specific class of shares are charged to that share class.
Determination of class net asset value
All income, expenses (other than class-specific expenses, which are charged to that share class, as shown in the Statement of Operations) and realized and unrealized gains (losses) are allocated to each class of the Fund on a daily basis, based on the relative net assets of each class, for purposes of determining the net asset value of each class.
Columbia Large Cap Growth Opportunity Fund | Annual Report 2022
| 21 |
Notes to Financial Statements (continued)
February 28, 2022
Federal income tax status
The Fund intends to qualify each year as a regulated investment company under Subchapter M of the Internal Revenue Code, as amended, and will distribute substantially all of its investment company taxable income and net capital gain, if any, for its tax year, and as such will not be subject to federal income taxes. In addition, the Fund intends to distribute in each calendar year substantially all of its ordinary income, capital gain net income and certain other amounts, if any, such that the Fund should not be subject to federal excise tax. Therefore, no federal income or excise tax provision is recorded.
Distributions to shareholders
Distributions from net investment income, if any, are declared and paid semi-annually. Net realized capital gains, if any, are distributed at least annually. Income distributions and capital gain distributions are determined in accordance with federal income tax regulations, which may differ from GAAP.
Guarantees and indemnifications
Under the Trust’s organizational documents and, in some cases, by contract, its officers and trustees are indemnified against certain liabilities arising out of the performance of their duties to the Trust or its funds. In addition, certain of the Fund’s contracts with its service providers contain general indemnification clauses. The Fund’s maximum exposure under these arrangements is unknown since the amount of any future claims that may be made against the Fund cannot be determined, and the Fund has no historical basis for predicting the likelihood of any such claims.
Note 3. Fees and other transactions with affiliates
Management services fees
The Fund has entered into a Management Agreement with Columbia Management Investment Advisers, LLC (the Investment Manager), a wholly-owned subsidiary of Ameriprise Financial, Inc. (Ameriprise Financial). Under the Management Agreement, the Investment Manager provides the Fund with investment research and advice, as well as administrative and accounting services. The management services fee is an annual fee that is equal to a percentage of the Fund’s daily net assets that declines from 0.77% to 0.57% as the Fund’s net assets increase. The effective management services fee rate for the year ended February 28, 2022 was 0.70% of the Fund’s average daily net assets.
Participating Affiliates
The Investment Manager and its investment advisory affiliates (Participating Affiliates) around the world may coordinate in providing services to their clients. From time to time the Investment Manager (or any affiliated investment subadviser to the Fund, as the case may be) may engage its Participating Affiliates to provide a variety of services such as investment research, investment monitoring, trading and discretionary investment management (including portfolio management) to certain accounts managed by the Investment Manager, including the Fund. These Participating Affiliates provide services to the Investment Manager (or any affiliated investment subadviser to the Fund, as the case may be) either pursuant to subadvisory agreements, personnel-sharing agreements or other inter-company arrangements, and the Fund pays no additional fees and expenses as a result of any such arrangements.
These Participating Affiliates, like the Investment Manager, are direct or indirect subsidiaries of Ameriprise Financial and are registered, as appropriate, with respective regulators in their home jurisdictions and, where required, the Securities and Exchange Commission and the Commodity Futures Trading Commission in the United States.
Pursuant to some of these arrangements, certain employees of these Participating Affiliates may serve as "associated persons" of the Investment Manager and, in this capacity, subject to the oversight and supervision of the Investment Manager and consistent with the investment objectives, policies and limitations set forth in the Fund’s prospectus and Statement of Additional Information (SAI), may provide such services to the Fund on behalf of the Investment Manager.
Compensation of board members
Members of the Board of Trustees who are not officers or employees of the Investment Manager or Ameriprise Financial are compensated for their services to the Fund as disclosed in the Statement of Operations. Under a Deferred Compensation Plan (the Deferred Plan), these members of the Board of Trustees may elect to defer payment of up to 100% of their
| 22 | Columbia Large Cap Growth Opportunity Fund | Annual Report 2022 |
Notes to Financial Statements (continued)
February 28, 2022
compensation. Deferred amounts are treated as though equivalent dollar amounts had been invested in shares of certain funds managed by the Investment Manager. The Fund’s liability for these amounts is adjusted for market value changes and remains in the Fund until distributed in accordance with the Deferred Plan. All amounts payable under the Deferred Plan constitute a general unsecured obligation of the Fund. The expense for the Deferred Plan, which includes Trustees’ fees deferred during the current period as well as any gains or losses on the Trustees’ deferred compensation balances as a result of market fluctuations, is included in "Compensation of board members" on the Statement of Operations.
Compensation of Chief Compliance Officer
The Board of Trustees has appointed a Chief Compliance Officer for the Fund in accordance with federal securities regulations. As disclosed in the Statement of Operations, a portion of the Chief Compliance Officer’s total compensation is allocated to the Fund, along with other allocations to affiliated registered investment companies managed by the Investment Manager and its affiliates, based on relative net assets.
Transfer agency fees
Under a Transfer and Dividend Disbursing Agent Agreement, Columbia Management Investment Services Corp. (the Transfer Agent), an affiliate of the Investment Manager and a wholly-owned subsidiary of Ameriprise Financial, is responsible for providing transfer agency services to the Fund. The Transfer Agent has contracted with DST Asset Manager Solutions, Inc. (DST) to serve as sub-transfer agent. The Transfer Agent pays the fees of DST for services as sub-transfer agent and DST is not entitled to reimbursement for such fees from the Fund (with the exception of out-of-pocket fees).
The Fund pays the Transfer Agent a monthly transfer agency fee based on the number or the average value of accounts, depending on the type of account. In addition, the Fund pays the Transfer Agent a fee for shareholder services based on the number of accounts or on a percentage of the average aggregate value of the Fund’s shares maintained in omnibus accounts up to the lesser of the amount charged by the financial intermediary or a cap established by the Board of Trustees from time to time.
The Transfer Agent also receives compensation from the Fund for various shareholder services and reimbursements for certain out-of-pocket fees. Total transfer agency fees for Institutional 2 Class and Institutional 3 Class shares are subject to an annual limitation of not more than 0.07% and 0.02%, respectively, of the average daily net assets attributable to each share class.
For the year ended February 28, 2022, the Fund’s effective transfer agency fee rates as a percentage of average daily net assets of each class were as follows:
| | Effective rate (%) |
| Class A | 0.11 |
| Advisor Class | 0.11 |
| Class C | 0.11 |
| Institutional Class | 0.11 |
| Institutional 2 Class | 0.05 |
| Institutional 3 Class | 0.01 |
| Class R | 0.11 |
An annual minimum account balance fee of $20 may apply to certain accounts with a value below the applicable share class’s initial minimum investment requirements to reduce the impact of small accounts on transfer agency fees. These minimum account balance fees are remitted to the Fund and recorded as part of expense reductions in the Statement of Operations. For the year ended February 28, 2022, these minimum account balance fees reduced total expenses of the Fund by $851.
Distribution and service fees
The Fund has entered into an agreement with Columbia Management Investment Distributors, Inc. (the Distributor), an affiliate of the Investment Manager and a wholly-owned subsidiary of Ameriprise Financial, for distribution and shareholder services. The Board of Trustees has approved, and the Fund has adopted, distribution and shareholder service plans (the
Columbia Large Cap Growth Opportunity Fund | Annual Report 2022
| 23 |
Notes to Financial Statements (continued)
February 28, 2022
Plans) applicable to certain share classes, which set the distribution and service fees for the Fund. These fees are calculated daily and are intended to compensate the Distributor and/or eligible selling and/or servicing agents for selling shares of the Fund and providing services to investors.
Under the Plans, the Fund pays a monthly combined distribution and service fee to the Distributor at the maximum annual rate of 0.25% of the average daily net assets attributable to Class A shares of the Fund. Also under the Plans, the Fund pays a monthly service fee to the Distributor at the maximum annual rate of 0.25% of the average daily net assets attributable to Class C shares of the Fund and a monthly distribution fee to the Distributor at the maximum annual rates of 0.75% and 0.50% of the average daily net assets attributable to Class C and Class R shares of the Fund, respectively.
Sales charges (unaudited)
Sales charges, including front-end charges and contingent deferred sales charges (CDSCs), received by the Distributor for distributing Fund shares for the year ended February 28, 2022, if any, are listed below:
| | Front End (%) | CDSC (%) | Amount ($) |
| Class A | 5.75 | 0.50 - 1.00(a) | 89,006 |
| Class C | — | 1.00(b) | 456 |
| (a) | This charge is imposed on certain investments of between $1 million and $50 million redeemed within 18 months after purchase, as follows: 1.00% if redeemed within 12 months after purchase, and 0.50% if redeemed more than 12, but less than 18, months after purchase, with certain limited exceptions. |
| (b) | This charge applies to redemptions within 12 months after purchase, with certain limited exceptions. |
The Fund’s other share classes are not subject to sales charges.
Expenses waived/reimbursed by the Investment Manager and its affiliates
The Investment Manager and certain of its affiliates have contractually agreed to waive fees and/or reimburse expenses (excluding certain fees and expenses described below) for the period(s) disclosed below, unless sooner terminated at the sole discretion of the Board of Trustees, so that the Fund’s net operating expenses, after giving effect to fees waived/expenses reimbursed and any balance credits and/or overdraft charges from the Fund’s custodian, do not exceed the following annual rate(s) as a percentage of the classes’ average daily net assets:
| | July 1, 2021
through
June 30, 2022 | Prior to
July 1, 2021 |
| Class A | 1.05% | 1.05% |
| Advisor Class | 0.80 | 0.80 |
| Class C | 1.80 | 1.80 |
| Institutional Class | 0.80 | 0.80 |
| Institutional 2 Class | 0.75 | 0.73 |
| Institutional 3 Class | 0.70 | 0.69 |
| Class R | 1.30 | 1.30 |
Under the agreement governing these fee waivers and/or expense reimbursement arrangements, the following fees and expenses are excluded from the waiver/reimbursement commitment, and therefore will be paid by the Fund, if applicable: taxes (including foreign transaction taxes), expenses associated with investments in affiliated and non-affiliated pooled investment vehicles (including mutual funds and exchange-traded funds), transaction costs and brokerage commissions, costs related to any securities lending program, dividend expenses associated with securities sold short, inverse floater program fees and expenses, transaction charges and interest on borrowed money, interest, costs associated with shareholder meetings, infrequent and/or unusual expenses and any other expenses the exclusion of which is specifically approved by the Board of Trustees. This agreement may be modified or amended only with approval from the Investment Manager, certain of its affiliates and the Fund. In addition to the contractual agreement, the Investment Manager and certain of its affiliates have voluntarily agreed to waive fees and/or reimburse Fund expenses (excluding certain fees and expenses described above) so that Fund level expenses (expenses directly attributable to the Fund and not to a specific
| 24 | Columbia Large Cap Growth Opportunity Fund | Annual Report 2022 |
Notes to Financial Statements (continued)
February 28, 2022
share class) are waived proportionately across all share classes. This arrangement may be revised or discontinued at any time. Any fees waived and/or expenses reimbursed under the expense reimbursement arrangements described above are not recoverable by the Investment Manager or its affiliates in future periods.
Note 4. Federal tax information
The timing and character of income and capital gain distributions are determined in accordance with income tax regulations, which may differ from GAAP because of temporary or permanent book to tax differences.
At February 28, 2022, these differences were primarily due to differing treatment for deferral/reversal of wash sale losses, trustees’ deferred compensation, post-October capital losses, late-year ordinary losses and net operating loss reclassification. To the extent these differences were permanent, reclassifications were made among the components of the Fund’s net assets. Temporary differences do not require reclassifications.
The following reclassifications were made:
Excess of distributions
over net investment
income ($) | Accumulated
net realized
gain ($) | Paid in
capital ($) |
| 5,231,303 | (5,231,303) | — |
Net investment income (loss) and net realized gains (losses), as disclosed in the Statement of Operations, and net assets were not affected by this reclassification.
The tax character of distributions paid during the years indicated was as follows:
| Year Ended February 28, 2022 | Year Ended February 28, 2021 |
Ordinary
income ($) | Long-term
capital gains ($) | Total ($) | Ordinary
income ($) | Long-term
capital gains ($) | Total ($) |
| 126,375,304 | 499,851,889 | 626,227,193 | — | 211,061,475 | 211,061,475 |
Short-term capital gain distributions, if any, are considered ordinary income distributions for tax purposes.
At February 28, 2022, the components of distributable earnings on a tax basis were as follows:
Undistributed
ordinary income ($) | Undistributed
long-term
capital gains ($) | Capital loss
carryforwards ($) | Net unrealized
appreciation ($) |
| — | 231,194,603 | — | 263,497,015 |
At February 28, 2022, the cost of all investments for federal income tax purposes along with the aggregate gross unrealized appreciation and depreciation based on that cost was:
Federal
tax cost ($) | Gross unrealized
appreciation ($) | Gross unrealized
(depreciation) ($) | Net unrealized
appreciation ($) |
| 1,374,529,460 | 343,783,489 | (80,286,474) | 263,497,015 |
Tax cost of investments and unrealized appreciation/(depreciation) may also include timing differences that do not constitute adjustments to tax basis.
Under current tax rules, regulated investment companies can elect to treat certain late-year ordinary losses incurred and post-October capital losses (capital losses realized after October 31) as arising on the first day of the following taxable year. As of February 28, 2022, the Fund will elect to treat the following late-year ordinary losses and post-October capital losses as arising on March 1, 2022.
Late year
ordinary losses ($) | Post-October
capital losses ($) |
| 796,496 | 27,577,812 |
Columbia Large Cap Growth Opportunity Fund | Annual Report 2022
| 25 |
Notes to Financial Statements (continued)
February 28, 2022
Management of the Fund has concluded that there are no significant uncertain tax positions in the Fund that would require recognition in the financial statements. However, management’s conclusion may be subject to review and adjustment at a later date based on factors including, but not limited to, new tax laws, regulations, and administrative interpretations (including relevant court decisions). Generally, the Fund’s federal tax returns for the prior three fiscal years remain subject to examination by the Internal Revenue Service.
Note 5. Portfolio information
The cost of purchases and proceeds from sales of securities, excluding short-term investments and derivatives, if any, aggregated to $1,751,619,505 and $2,036,507,722, respectively, for the year ended February 28, 2022. The amount of purchase and sale activity impacts the portfolio turnover rate reported in the Financial Highlights.
Note 6. Affiliated money market fund
The Fund invests in Columbia Short-Term Cash Fund, an affiliated money market fund established for the exclusive use by the Fund and other affiliated funds (the Affiliated MMF). The income earned by the Fund from such investments is included as Dividends - affiliated issuers in the Statement of Operations. As an investing fund, the Fund indirectly bears its proportionate share of the expenses of the Affiliated MMF. The Affiliated MMF prices its shares with a floating net asset value. In addition, the Board of Trustees of the Affiliated MMF may impose a fee on redemptions (sometimes referred to as a liquidity fee) or temporarily suspend redemptions (sometimes referred to as imposing a redemption gate) in the event its liquidity falls below regulatory limits.
Note 7. Interfund lending
Pursuant to an exemptive order granted by the Securities and Exchange Commission, the Fund participates in a program (the Interfund Program) allowing each participating Columbia Fund (each, a Participating Fund) to lend money directly to and, except for closed-end funds and money market funds, borrow money directly from other Participating Funds for temporary purposes. The amounts eligible for borrowing and lending under the Interfund Program are subject to certain restrictions.
Interfund loans are subject to the risk that the borrowing fund could be unable to repay the loan when due, and a delay in repayment to the lending fund could result in lost opportunities and/or additional lending costs. The exemptive order is subject to conditions intended to mitigate conflicts of interest arising from the Investment Manager’s relationship with each Participating Fund.
The Fund’s activity in the Interfund Program during the year ended February 28, 2022 was as follows:
| Borrower or lender | Average loan
balance ($) | Weighted average
interest rate (%) | Number of days
with outstanding loans |
| Borrower | 1,180,000 | 0.64 | 5 |
Interest expense incurred by the Fund is recorded as Interfund lending in the Statement of Operations. The Fund had no outstanding interfund loans at February 28, 2022.
Note 8. Line of credit
The Fund has access to a revolving credit facility with a syndicate of banks led by JPMorgan Chase Bank, N.A., Citibank, N.A. and Wells Fargo Bank, N.A. whereby the Fund may borrow for the temporary funding of shareholder redemptions or for other temporary or emergency purposes. Pursuant to an October 28, 2021 amendment and restatement, the credit facility, which is an agreement between the Fund and certain other funds managed by the Investment Manager or an affiliated investment manager, severally and not jointly, permits aggregate borrowings up to $950 million. Interest is currently charged to each participating fund based on its borrowings at a rate equal to the higher of (i) the federal funds effective rate, (ii) the secured overnight financing rate plus 0.11448% and (iii) the overnight bank funding rate, plus in each case, 1.00%. Each borrowing under the credit facility matures no later than 60 days after the date of borrowing. The Fund also pays a commitment fee equal to its pro rata share of the unused amount of the credit facility at a rate of 0.15% per annum. The commitment fee is included in other expenses in the Statement of Operations. This agreement expires annually in October unless extended or renewed. Prior to the October 28, 2021 amendment and restatement, the Fund had access to a revolving credit facility with a
| 26 | Columbia Large Cap Growth Opportunity Fund | Annual Report 2022 |
Notes to Financial Statements (continued)
February 28, 2022
syndicate of banks led by JPMorgan Chase Bank, N.A., Citibank, N.A. and Wells Fargo Bank, N.A. which permitted collective borrowings up to $950 million. Interest was charged to each participating fund based on its borrowings at a rate equal to the higher of (i) the federal funds effective rate, (ii) the one-month London Interbank Offered Rate (LIBOR) rate and (iii) the overnight bank funding rate, plus in each case, 1.25%.
The Fund had no borrowings during the year ended February 28, 2022.
Note 9. Significant risks
Information technology sector risk
The Fund is more susceptible to the particular risks that may affect companies in the information technology sector than if it were invested in a wider variety of companies in unrelated sectors. Companies in the information technology sector are subject to certain risks, including the risk that new services, equipment or technologies will not be accepted by consumers and businesses or will become rapidly obsolete. Performance of such companies may be affected by factors including obtaining and protecting patents (or the failure to do so) and significant competitive pressures, including aggressive pricing of their products or services, new market entrants, competition for market share and short product cycles due to an accelerated rate of technological developments. Such competitive pressures may lead to limited earnings and/or falling profit margins. As a result, the value of their securities may fall or fail to rise. In addition, many information technology sector companies have limited operating histories and prices of these companies’ securities historically have been more volatile than other securities, especially over the short term. Some companies in the information technology sector are facing increased government and regulatory scrutiny and may be subject to adverse government or regulatory action, which could negatively impact the value of their securities.
Market risk
The Fund may incur losses due to declines in the value of one or more securities in which it invests. These declines may be due to factors affecting a particular issuer, or the result of, among other things, political, regulatory, market, economic or social developments affecting the relevant market(s) more generally. In addition, turbulence in financial markets and reduced liquidity in equity, credit and/or fixed income markets may negatively affect many issuers, which could adversely affect the Fund, including causing difficulty in assigning prices to hard-to-value assets in thinly traded and closed markets, significant redemptions and operational challenges. Global economies and financial markets are increasingly interconnected, and conditions and events in one country, region or financial market may adversely impact issuers in a different country, region or financial market. These risks may be magnified if certain events or developments adversely interrupt the global supply chain; in these and other circumstances, such risks might affect companies worldwide. As a result, local, regional or global events such as terrorism, war, natural disasters, disease/virus outbreaks and epidemics or other public health issues, recessions, depressions or other events – or the potential for such events – could have a significant negative impact on global economic and market conditions.
The large-scale invasion of Ukraine by Russia in February 2022 has resulted in sanctions and market disruptions, including declines in regional and global stock and commodity markets and significant devaluations of Russian currency. The extent and duration of the military action are impossible to predict but could be significant. Market disruption caused by the Russian military action, and any counter measures or responses thereto (including international sanctions, a downgrade in the country’s credit rating, purchasing and financing restrictions, boycotts, tariffs, changes in consumer or purchaser preferences, cyberattacks and espionage) could have a severe adverse impact on regional and/or global securities and commodities markets, including markets for oil and natural gas. These and other related events could have a negative impact on Fund performance and the value of an investment in the Fund.
The pandemic caused by coronavirus disease 2019 and its variants (COVID-19) has resulted in, and may continue to result in, significant global economic and societal disruption and market volatility due to disruptions in market access, resource availability, facilities operations, imposition of tariffs, export controls and supply chain disruption, among others. Such disruptions may be caused, or exacerbated by, quarantines and travel restrictions, workforce displacement and loss in human and other resources. The uncertainty surrounding the magnitude, duration, reach, costs and effects of the global pandemic, as well as actions that have been or could be taken by governmental authorities or other third parties, present unknowns that are yet to unfold. The impacts, as well as the uncertainty over impacts to come, of COVID-19 – and any other
Columbia Large Cap Growth Opportunity Fund | Annual Report 2022
| 27 |
Notes to Financial Statements (continued)
February 28, 2022
infectious illness outbreaks, epidemics and pandemics that may arise in the future – could negatively affect global economies and markets in ways that cannot necessarily be foreseen. In addition, the impact of infectious illness outbreaks and epidemics in emerging market countries may be greater due to generally less established healthcare systems, governments and financial markets. Public health crises caused by the COVID-19 outbreak may exacerbate other pre-existing political, social and economic risks in certain countries or globally. The disruptions caused by COVID-19 could prevent the Fund from executing advantageous investment decisions in a timely manner and negatively impact the Fund’s ability to achieve its investment objectives. Any such event(s) could have a significant adverse impact on the value and risk profile of the Fund.
Shareholder concentration risk
At February 28, 2022, one unaffiliated shareholder of record owned 25.2% of the outstanding shares of the Fund in one or more accounts. The Fund has no knowledge about whether any portion of those shares was owned beneficially. Subscription and redemption activity by concentrated accounts may have a significant effect on the operations of the Fund. In the case of a large redemption, the Fund may be forced to sell investments at inopportune times, including its liquid positions, which may result in Fund losses and the Fund holding a higher percentage of less liquid positions. Large redemptions could result in decreased economies of scale and increased operating expenses for non-redeeming Fund shareholders.
Note 10. Subsequent events
Management has evaluated the events and transactions that have occurred through the date the financial statements were issued and noted no items requiring adjustment of the financial statements or additional disclosure.
Note 11. Information regarding pending and settled legal proceedings
Ameriprise Financial and certain of its affiliates are involved in the normal course of business in legal proceedings which include regulatory inquiries, arbitration and litigation, including class actions concerning matters arising in connection with the conduct of its activities as a diversified financial services firm. Ameriprise Financial believes that the Fund is not currently the subject of, and that neither Ameriprise Financial nor any of its affiliates are the subject of, any pending legal, arbitration or regulatory proceedings that are likely to have a material adverse effect on the Fund or the ability of Ameriprise Financial or its affiliates to perform under their contracts with the Fund. Ameriprise Financial is required to make quarterly (10-Q), annual (10-K) and, as necessary, 8-K filings with the Securities and Exchange Commission (SEC) on legal and regulatory matters that relate to Ameriprise Financial and its affiliates. Copies of these filings may be obtained by accessing the SEC website at www.sec.gov.
There can be no assurance that these matters, or the adverse publicity associated with them, will not result in increased Fund redemptions, reduced sale of Fund shares or other adverse consequences to the Fund. Further, although we believe proceedings are not likely to have a material adverse effect on the Fund or the ability of Ameriprise Financial or its affiliates to perform under their contracts with the Fund, these proceedings are subject to uncertainties and, as such, we are unable to estimate the possible loss or range of loss that may result. An adverse outcome in one or more of these proceedings could result in adverse judgments, settlements, fines, penalties or other relief that could have a material adverse effect on the consolidated financial condition or results of operations of Ameriprise Financial or one or more of its affiliates that provides services to the Fund.
| 28 | Columbia Large Cap Growth Opportunity Fund | Annual Report 2022 |
Report of Independent Registered Public Accounting Firm
To the Board of Trustees of Columbia Funds Series Trust and Shareholders of Columbia Large Cap Growth Opportunity Fund
Opinion on the Financial Statements
We have audited the accompanying statement of assets and liabilities, including the portfolio of investments, of Columbia Large Cap Growth Opportunity Fund (one of the funds constituting Columbia Funds Series Trust, referred to hereafter as the "Fund") as of February 28, 2022, the related statement of operations for the year ended February 28, 2022, the statement of changes in net assets for each of the two years in the period ended February 28, 2022, including the related notes, and the financial highlights for each of the five years in the period ended February 28, 2022 (collectively referred to as the "financial statements"). In our opinion, the financial statements present fairly, in all material respects, the financial position of the Fund as of February 28, 2022, the results of its operations for the year then ended, the changes in its net assets for each of the two years in the period ended February 28, 2022 and the financial highlights for each of the five years in the period ended February 28, 2022 in conformity with accounting principles generally accepted in the United States of America.
Basis for Opinion
These financial statements are the responsibility of the Fund’s management. Our responsibility is to express an opinion on the Fund’s financial statements based on our audits. We are a public accounting firm registered with the Public Company Accounting Oversight Board (United States) (PCAOB) and are required to be independent with respect to the Fund in accordance with the U.S. federal securities laws and the applicable rules and regulations of the Securities and Exchange Commission and the PCAOB.
We conducted our audits of these financial statements in accordance with the standards of the PCAOB. Those standards require that we plan and perform the audit to obtain reasonable assurance about whether the financial statements are free of material misstatement, whether due to error or fraud.
Our audits included performing procedures to assess the risks of material misstatement of the financial statements, whether due to error or fraud, and performing procedures that respond to those risks. Such procedures included examining, on a test basis, evidence regarding the amounts and disclosures in the financial statements. Our audits also included evaluating the accounting principles used and significant estimates made by management, as well as evaluating the overall presentation of the financial statements. Our procedures included confirmation of securities owned as of February 28, 2022 by correspondence with the custodian, transfer agent and brokers; when replies were not received from brokers, we performed other auditing procedures. We believe that our audits provide a reasonable basis for our opinion.
/s/PricewaterhouseCoopers LLP
Minneapolis, Minnesota
April 21, 2022
We have served as the auditor of one or more investment companies within the Columbia Funds Complex since 1977.
Columbia Large Cap Growth Opportunity Fund | Annual Report 2022
| 29 |
Federal Income Tax Information
(Unaudited)
The Fund hereby designates the following tax attributes for the fiscal year ended February 28, 2022. Shareholders will be notified in early 2023 of the amounts for use in preparing 2022 income tax returns.
Qualified
dividend
income | Dividends
received
deduction | Section
199A
dividends | Capital
gain
dividend |
| 21.21% | 20.07% | 0.06% | $680,689,862 |
Qualified dividend income. For taxable, non-corporate shareholders, the percentage of ordinary income distributed during the fiscal year that represents qualified dividend income subject to reduced tax rates.
Dividends received deduction. The percentage of ordinary income distributed during the fiscal year that qualifies for the corporate dividends received deduction.
Section 199A dividends. For taxable, non-corporate shareholders, the percentage of ordinary income distributed during the fiscal year that represents Section 199A dividends potentially eligible for a 20% deduction.
Capital gain dividend. The Fund designates as a capital gain dividend the amount reflected above, or if subsequently determined to be different, the net capital gain of such fiscal period.
TRUSTEES AND OFFICERS
The Board oversees the Fund’s operations and appoints officers who are responsible for day-to-day business decisions based on policies set by the Board. The following table provides basic biographical information about the Fund’s Trustees as of the printing of this report, including their principal occupations during the past five years, although specific titles for individuals may have varied over the period. The year set forth beneath Length of Service in the table below is the year in which the Trustee was first appointed or elected as Trustee to any Fund currently in the Columbia Funds Complex or a predecessor thereof. Under current Board policy, each Trustee generally serves until December 31 of the year such Trustee turns seventy-five (75).
Independent trustees
Name,
address,
year of birth | Position held
with the Columbia Funds and
length of service | Principal occupation(s)
during past five years
and other relevant
professional experience | Number of
Funds in the
Columbia Funds
Complex*
overseen | Other directorships
held by Trustee
during the past
five years |
George S. Batejan
c/o Columbia Management
Investment Advisers, LLC
290 Congress Street
Boston, MA 02210
1953 | Trustee since 2017 | Executive Vice President, Global Head of Technology and Operations, Janus Capital Group, Inc., 2010-2016 | 177 | Former Chairman of the Board, NICSA (National Investment Company Services Association) (Executive Committee, Nominating Committee and Governance Committee), 2014-2016; former Director, Intech Investment Management, 2011-2016; former Board Member, Metro Denver Chamber of Commerce, 2015-2016; former Advisory Board Member, University of Colorado Business School, 2015-2018 |
| 30 | Columbia Large Cap Growth Opportunity Fund | Annual Report 2022 |
TRUSTEES AND OFFICERS (continued)
Independent trustees (continued)
Name,
address,
year of birth | Position held
with the Columbia Funds and
length of service | Principal occupation(s)
during past five years
and other relevant
professional experience | Number of
Funds in the
Columbia Funds
Complex*
overseen | Other directorships
held by Trustee
during the past
five years |
Kathleen Blatz
c/o Columbia Management
Investment Advisers, LLC
290 Congress Street
Boston, MA 02210
1954 | Trustee since 2006 | Attorney, specializing in arbitration and mediation; Chief Justice, Minnesota Supreme Court, 1998-2006; Associate Justice, Minnesota Supreme Court, 1996-1998; Fourth Judicial District Court Judge, Hennepin County, 1994-1996; Attorney in private practice and public service, 1984-1993; State Representative, Minnesota House of Representatives, 1979-1993, which included service on the Tax and Financial Institutions and Insurance Committees; Member and Interim Chair, Minnesota Sports Facilities Authority, January 2017-July 2017; Interim President and Chief Executive Officer, Blue Cross and Blue Shield of Minnesota (health care insurance), February-July 2018, April-October 2021 | 177 | Former Trustee, Blue Cross and Blue Shield of Minnesota, 2009-2021 (Chair of the Business Development Committee, 2014-2017; Chair of the Governance Committee, 2017-2019); former Member and Chair of the Board, Minnesota Sports Facilities Authority, January 2017-July 2017; former Director, Robina Foundation, 2009-2020 (Chair, 2014-2020); Director, Schulze Family Foundation, since 2021 |
Pamela G. Carlton
c/o Columbia Management
Investment Advisers, LLC
290 Congress Street
Boston, MA 02210
1954 | Trustee since 2007 | President, Springboard — Partners in Cross Cultural Leadership (consulting company) since 2003; Managing Director of US Equity Research, JP Morgan Chase, 1999-2003; Director of US Equity Research, Chase Asset Management, 1996-1999; Co-Director Latin America Research, 1993-1996, COO Global Research, 1992-1996, Co-Director of US Research, 1991-1992, Investment Banker, Morgan Stanley, 1982-1991, Morgan Stanley; Attorney, Cleary Gottlieb Steen & Hamilton LLP, 1980-1982 | 177 | Trustee, New York Presbyterian Hospital Board (Executive Committee and Chair of People Committee) since 1996; Director, DR Bank (Audit Committee) since 2017; Director, Evercore Inc. (Audit Committee) since 2019; Director, Apollo Commercial Real Estate Finance, Inc. since 2021; the Governing Council of the Independent Directors Council (IDC), since 2021 |
Janet Langford Carrig
c/o Columbia Management
Investment Advisers, LLC
290 Congress Street
Boston, MA 02210
1957 | Trustee since 1996 | Senior Vice President, General Counsel and Corporate Secretary, ConocoPhillips (independent energy company), September 2007-October 2018 | 175 | Director, EQT Corporation (natural gas producer) since 2019; Director, Whiting Petroleum Corporation (independent oil and gas company) since 2020 |
J. Kevin Connaughton
c/o Columbia Management
Investment Advisers, LLC
290 Congress Street
Boston, MA 02210
1964 | Trustee since 2020 | Member, FINRA National Adjudicatory Council since January 2020; Adjunct Professor of Finance, Bentley University since January 2018; Consultant to Independent Trustees of CFVIT and CFST I from March 2016 to June 2020 with respect to CFVIT and to December 2020 with respect to CFST I; Managing Director and General Manager of Mutual Fund Products, Columbia Management Investment Advisers, LLC, May 2010-February 2015; President, Columbia Funds, 2008-2015; and senior officer of Columbia Funds and affiliated funds, 2003-2015 | 175 | Former Director, The Autism Project, March 2015-December 2021; former Member of the Investment Committee, St. Michael’s College, November 2015-February 2020; former Trustee, St. Michael’s College, June 2017-September 2019; former Trustee, New Century Portfolios, January 2015-December 2017 |
Columbia Large Cap Growth Opportunity Fund | Annual Report 2022
| 31 |
TRUSTEES AND OFFICERS (continued)
Independent trustees (continued)
Name,
address,
year of birth | Position held
with the Columbia Funds and
length of service | Principal occupation(s)
during past five years
and other relevant
professional experience | Number of
Funds in the
Columbia Funds
Complex*
overseen | Other directorships
held by Trustee
during the past
five years |
Olive M. Darragh
c/o Columbia Management
Investment Advisers, LLC
290 Congress Street
Boston, MA 02210
1962 | Trustee since 2020 | Managing Director of Darragh Inc. (strategy and talent management consulting firm) since 2010; Founder and CEO, Zolio, Inc. (investment management talent identification platform) since 2004; Consultant to Independent Trustees of CFVIT and CFST I from June 2019 to June 2020 with respect to CFVIT and to December 2020 with respect to CFST I; Partner, Tudor Investments, 2004-2010; Senior Partner, McKinsey & Company (consulting), 1990-2004; Touche Ross CPA, 1985-1988 | 175 | Former Director, University of Edinburgh Business School (Member of US Board); former Director, Boston Public Library Foundation |
Patricia M. Flynn
c/o Columbia Management
Investment Advisers, LLC
290 Congress Street
Boston, MA 02210
1950 | Trustee since 2004 | Trustee Professor of Economics and Management, Bentley University since 1976 (also teaches and conducts research on corporate governance); Dean, McCallum Graduate School of Business, Bentley University, 1992-2002 | 177 | Trustee, MA Taxpayers Foundation since 1997; Board of Governors, Innovation Institute, MA Technology Collaborative, 2010-2020; former Board of Directors, The MA Business Roundtable, 2003-2019 |
Brian J. Gallagher
c/o Columbia Management
Investment Advisers, LLC
290 Congress Street
Boston, MA 02210
1954 | Trustee since 2017 | Retired; Partner with Deloitte & Touche LLP and its predecessors, 1977-2016 | 177 | Trustee, Catholic Schools Foundation since 2004 |
Douglas A. Hacker
c/o Columbia Management
Investment Advisers, LLC
290 Congress Street
Boston, MA 02210
1955 | Co-Chair since 2021; Chair of CFST I and CFVIT since 2014; Trustee of CFST I and CFVIT since 1996 and CFST, CFST II, CFVST II, CET I and CET II since 2021 | Independent business executive since May 2006; Executive Vice President – Strategy of United Airlines, December 2002 - May 2006; President of UAL Loyalty Services (airline marketing company), September 2001-December 2002; Executive Vice President and Chief Financial Officer of United Airlines, July 1999-September 2001 | 177 | Director, Spartan Nash Company (food distributor); Director, Aircastle Limited (Chair of Audit Committee) (aircraft leasing); former Director, Nash Finch Company (food distributor), 2005-2013; former Director, SeaCube Container Leasing Ltd. (container leasing), 2010-2013; and former Director, Travelport Worldwide Limited (travel information technology), 2014-2019 |
Nancy T. Lukitsh
c/o Columbia Management
Investment Advisers, LLC
290 Congress Street
Boston, MA 02210
1956 | Trustee since 2011 | Senior Vice President, Partner and Director of Marketing, Wellington Management Company, LLP (investment adviser), 1997-2010; Chair, Wellington Management Portfolios (commingled non-U.S. investment pools), 2007 -2010; Director, Wellington Trust Company, NA and other Wellington affiliates, 1997-2010 | 175 | None |
| 32 | Columbia Large Cap Growth Opportunity Fund | Annual Report 2022 |
TRUSTEES AND OFFICERS (continued)
Independent trustees (continued)
Name,
address,
year of birth | Position held
with the Columbia Funds and
length of service | Principal occupation(s)
during past five years
and other relevant
professional experience | Number of
Funds in the
Columbia Funds
Complex*
overseen | Other directorships
held by Trustee
during the past
five years |
David M. Moffett
c/o Columbia Management
Investment Advisers, LLC
290 Congress Street
Boston, MA 02210
1952 | Trustee since 2011 | Retired; Consultant to Bridgewater and Associates | 175 | Director, CSX Corporation (transportation suppliers); Director, Genworth Financial, Inc. (financial and insurance products and services); Director, PayPal Holdings Inc. (payment and data processing services); Trustee, University of Oklahoma Foundation; former Director, eBay Inc. (online trading community), 2007-2015; and former Director, CIT Bank, CIT Group Inc. (commercial and consumer finance), 2010-2016 |
Catherine James Paglia
c/o Columbia Management
Investment Advisers, LLC
290 Congress Street
Boston, MA 02210
1952 | Co-Chair since 2021; Chair of CFST, CFST II, CFVST II, CET I and CET II since 2020; Trustee of CFST, CFST II and CFVST II since 2004 and CFST I and CFVIT since 2021 | Director, Enterprise Asset Management, Inc. (private real estate and asset management company) since September 1998; Managing Director and Partner, Interlaken Capital, Inc., 1989-1997; Vice President, 1982-1985, Principal, 1985-1987, Managing Director, 1987-1989, Morgan Stanley; Vice President, Investment Banking, 1980-1982, Associate, Investment Banking, 1976-1980, Dean Witter Reynolds, Inc. | 177 | Director, Valmont Industries, Inc. (irrigation systems manufacturer) since 2012; Trustee, Carleton College (on the Investment Committee); Trustee, Carnegie Endowment for International Peace (on the Investment Committee) |
Minor M. Shaw
c/o Columbia Management
Investment Advisers, LLC
290 Congress Street
Boston, MA 02210
1947 | Trustee since 2003 | President, Micco LLC (private investments) since 2011; President, Micco Corp. (family investment business), 1998-2011 | 177 | Director, Blue Cross Blue Shield of South Carolina (Chair of Compensation Committee) since April 2008; Trustee, Hollingsworth Funds (on the Investment Committee) since 2016 (previously Board Chair from 2016-2019); Former Advisory Board member, Duke Energy Corp., 2016-2020; Chair of the Duke Endowment; Chair of Greenville – Spartanburg Airport Commission; former Trustee, BofA Funds Series Trust (11 funds), 2003-2011; former Director, Piedmont Natural Gas, 2004-2016; former Director, National Association of Corporate Directors, Carolinas Chapter, 2013-2018; Chair, Daniel-Mickel Foundation since 1998 |
Columbia Large Cap Growth Opportunity Fund | Annual Report 2022
| 33 |
TRUSTEES AND OFFICERS (continued)
Independent trustees (continued)
Name,
address,
year of birth | Position held
with the Columbia Funds and
length of service | Principal occupation(s)
during past five years
and other relevant
professional experience | Number of
Funds in the
Columbia Funds
Complex*
overseen | Other directorships
held by Trustee
during the past
five years |
Natalie A. Trunow
c/o Columbia Management
Investment Advisers, LLC
290 Congress Street
Boston, MA 02210
1967 | Trustee since 2020 | Chief Executive Officer, Millennial Portfolio Solutions LLC (asset management and consulting services), January 2016-January 2021; Non-executive Member of the Investment Committee and Valuation Committee, Sarona Asset Management Inc. (private equity firm) since September 2019; Advisor, Horizon Investments (asset management and consulting services), August 2018-January 2021; Advisor, Paradigm Asset Management, November 2016-December 2021; Consultant to Independent Trustees of CFVIT and CFST I from September 2016 to June 2020 with respect to CFVIT and to December 2020 with respect to CFST I; Director of Investments/Consultant, Casey Family Programs, April 2016-November 2016; Senior Vice President and Chief Investment Officer, Calvert Investments, August 2008-January 2016; Section Head and Portfolio Manager, General Motors Asset Management, June 1997-August 2008 | 175 | Former Director, Investment Committee, Health Services for Children with Special Needs, Inc., 2012-2019; Director, Chair of Audit Committee, Consumer Credit Counseling Services (formerly Guidewell Financial Solutions), since 2019; Independent Director, Investment Committee and Valuation Committee, Sarona Asset Management, since 2019 |
Sandra Yeager
c/o Columbia Management
Investment Advisers, LLC
290 Congress Street
Boston, MA 02210
1964 | Trustee since 2017 | Retired; President and founder, Hanoverian Capital, LLC (SEC registered investment advisor firm), 2008-2016; Managing Director, DuPont Capital, 2006-2008; Managing Director, Morgan Stanley Investment Management, 2004-2006; Senior Vice President, Alliance Bernstein, 1990-2004 | 177 | Former Director, NAPE Education Foundation, October 2016-October 2020 |
| * | The term “Columbia Funds Complex” as used herein includes Columbia Seligman Premium Technology Growth Fund, Tri-Continental Corporation and each series of Columbia Fund Series Trust (CFST), Columbia Funds Series Trust I (CFST I), Columbia Funds Series Trust II (CFST II), Columbia ETF Trust I (CET I), Columbia ETF Trust II (CET II), Columbia Funds Variable Insurance Trust (CFVIT) and Columbia Funds Variable Series Trust II (CFVST II). Messrs. Batejan, Beckman, Gallagher and Hacker and Mses. Blatz, Carlton, Flynn, Paglia, Shaw and Yeager serve as Directors of Columbia Seligman Premium Technology Growth Fund and Tri-Continental Corporation. |
Interested trustee affiliated with Investment Manager*
Name,
address,
year of birth | Position held with the Columbia Funds and length of service | Principal occupation(s) during the
past five years and other relevant
professional experience | Number of
Funds in the
Columbia Funds
Complex overseen | Other directorships
held by Trustee
during the past
five years |
Daniel J. Beckman
c/o Columbia Management
Investment Advisers, LLC
290 Congress Street
Boston, MA 02210
1962 | Trustee since November 2021 and President since June 2021 | Vice President – Head of North America Product, Columbia Management Investment Advisers, LLC since April 2015; President and Principal Executive Officer of the Columbia Funds since June 2021; officer of Columbia Funds and affiliated funds, 2020-2021 | 177 | Director, Ameriprise Trust Company, since October 2016; Director, Columbia Management Investment Distributors, Inc. since November 2018; Board of Governors, Columbia Wanger Asset Management, LLC since January 2022 |
| * | Interested person (as defined under the 1940 Act) by reason of being an officer, director, security holder and/or employee of the Investment Manager or Ameriprise Financial. |
The Statement of Additional Information has additional information about the Fund’s Board members and is available, without charge, upon request by calling 800.345.6611, visiting columbiathreadneedleus.com/investor/ or contacting your financial intermediary.
| 34 | Columbia Large Cap Growth Opportunity Fund | Annual Report 2022 |
TRUSTEES AND OFFICERS (continued)
The Board has appointed officers who are responsible for day-to-day business decisions based on policies it has established. The officers serve at the pleasure of the Board. The following table provides basic information about the Officers of the Fund as of the printing of this report, including principal occupations during the past five years, although their specific titles may have varied over the period. In addition to Mr. Beckman, who is President and Principal Executive Officer, the Fund’s other officers are:
Fund officers
Name,
address and
year of birth | Position and year
first appointed to
position for any Fund
in the Columbia
Funds Complex or a
predecessor thereof | Principal occupation(s) during past five years |
Michael G. Clarke
290 Congress Street
Boston, MA 02210
1969 | Chief Financial Officer and Principal Financial Officer (2009) and Senior Vice President (2019) | Senior Vice President and Head of Global Operations & Investor Services, Columbia Management Investment Advisers, LLC, since March 2022 (previously Vice President, Head of North American Operations, and Co-Head of Global Operations, June 2019 to February 2022 and Vice President – Accounting and Tax, May 2010 - May 2019); senior officer of Columbia Funds and affiliated funds since 2002. |
Joseph Beranek
5890 Ameriprise
Financial Center
Minneapolis, MN 55474
1965 | Treasurer and Chief Accounting Officer (Principal Accounting Officer) (2019) and Principal Financial Officer (2020), CFST, CFST I, CFST II, CFVIT and CFVST II; Assistant Treasurer, CET I and CET II | Vice President – Mutual Fund Accounting and Financial Reporting, Columbia Management Investment Advisers, LLC, since December 2018 and March 2017, respectively (previously Vice President – Pricing and Corporate Actions, May 2010 - March 2017). |
Marybeth Pilat
290 Congress Street
Boston, MA 02210
1968 | Treasurer and Chief Accounting Officer (Principal Accounting Officer) and Principal Financial Officer (2020) for CET I and CET II; Assistant Treasurer, CFST, CFST I, CFST II, CFVIT and CFVST II | Vice President – Product Pricing and Administration, Columbia Management Investment Advisers, LLC, since May 2017; Director - Fund Administration, Calvert Investments, August 2015 – March 2017; Vice President - Fund Administration, Legg Mason, May 2015 - July 2015; Vice President - Fund Administration, Columbia Management Investment Advisers, LLC, May 2010 - April 2015. |
William F. Truscott
290 Congress Street
Boston, MA 02210
1960 | Senior Vice President (2001) | Formerly, Trustee/Director of Columbia Funds Complex or legacy funds, November 2001-January 1, 2021; Chief Executive Officer, Global Asset Management, Ameriprise Financial, Inc. since September 2012; Chairman of the Board and President, Columbia Management Investment Advisers, LLC since July 2004 and February 2012, respectively; Chairman of the Board and Chief Executive Officer, Columbia Management Investment Distributors, Inc. since November 2008 and February 2012, respectively; Chairman of the Board and Director, Threadneedle Asset Management Holdings, Sàrl since March 2013 and December 2008, respectively; senior executive of various entities affiliated with Columbia Threadneedle. |
Christopher O. Petersen
5228 Ameriprise Financial Center
Minneapolis, MN 55474
1970 | Senior Vice President and Assistant Secretary | Formerly, Trustee/Director of funds within the Columbia Funds Complex, July 1, 2020 - November 22, 2021; Senior Vice President and Assistant General Counsel, Ameriprise Financial, Inc. since September 2021 (previously Vice President and Lead Chief Counsel, January 2015 - September 2021); President and Principal Executive Officer of the Columbia Funds, 2015 - 2021; officer of Columbia Funds and affiliated funds since 2007. |
Thomas P. McGuire
290 Congress Street
Boston, MA 02210
1972 | Senior Vice President and Chief Compliance Officer (2012) | Vice President – Asset Management Compliance, Ameriprise Financial, Inc., since May 2010; Chief Compliance Officer, Columbia Acorn/Wanger Funds since December 2015; Chief Compliance Officer, Ameriprise Certificate Company, September 2010 – September 2020. |
Ryan C. Larrenaga
290 Congress Street
Boston, MA 02210
1970 | Senior Vice President (2017), Chief Legal Officer (2017), and Secretary (2015) | Vice President and Chief Counsel, Ameriprise Financial, Inc. since August 2018 (previously Vice President and Group Counsel, August 2011 - August 2018); Chief Legal Officer, Columbia Acorn/Wanger Funds, since September 2020; officer of Columbia Funds and affiliated funds since 2005. |
Columbia Large Cap Growth Opportunity Fund | Annual Report 2022
| 35 |
TRUSTEES AND OFFICERS (continued)
Fund officers (continued)
Name,
address and
year of birth | Position and year
first appointed to
position for any Fund
in the Columbia
Funds Complex or a
predecessor thereof | Principal occupation(s) during past five years |
Michael E. DeFao
290 Congress Street
Boston, MA 02210
1968 | Vice President (2011) and Assistant Secretary (2010) | Vice President and Chief Counsel, Ameriprise Financial, Inc. since May 2010; Vice President, Chief Legal Officer and Assistant Secretary, Columbia Management Investment Advisers, LLC since October 2021 (previously Vice President and Assistant Secretary, May 2010 – September 2021). |
Lyn Kephart-Strong
5228 Ameriprise
Financial Center
Minneapolis, MN 55474
1960 | Vice President (2015) | President, Columbia Management Investment Services Corp. since October 2014; Vice President & Resolution Officer, Ameriprise Trust Company since August 2009. |
| 36 | Columbia Large Cap Growth Opportunity Fund | Annual Report 2022 |
[THIS PAGE INTENTIONALLY LEFT BLANK]
[THIS PAGE INTENTIONALLY LEFT BLANK]
[THIS PAGE INTENTIONALLY LEFT BLANK]
Columbia Large Cap Growth Opportunity Fund
P.O. Box 219104
Kansas City, MO 64121-9104
Please read and consider the investment objectives, risks, charges and expenses for any fund carefully before investing. For a prospectus and summary prospectus, which contains this and other important information about the Fund, go to
columbiathreadneedleus.com/investor/. The Fund is distributed by Columbia Management Investment Distributors, Inc., member FINRA, and managed by Columbia Management Investment Advisers, LLC.
Columbia Threadneedle Investments (Columbia Threadneedle) is the global brand name of the Columbia and Threadneedle group of companies. All rights reserved.
© 2022 Columbia Management Investment Advisers, LLC.
columbiathreadneedleus.com/investor/

Annual Report
February 28, 2022
Columbia Select Mid Cap Value Fund
Not Federally Insured • No Financial Institution Guarantee • May Lose Value
If you elect to receive the shareholder report for Columbia Select Mid Cap Value Fund (the Fund) in paper, mailed to you, the Fund mails one shareholder report to each shareholder address, unless such shareholder elects to receive shareholder reports from the Fund electronically via e-mail or by having a paper notice mailed to you (Postcard Notice) that your Fund’s shareholder report is available at the Columbia funds’ website (columbiathreadneedleus.com/investor/). If you would like more than one report in paper to be mailed to you, or would like to elect to receive reports via e-mail or access them through Postcard Notice, please call shareholder services at 800.345.6611 and additional reports will be sent to you.
Proxy voting policies and procedures
The policy of the Board of Trustees is to vote the proxies of the companies in which the Fund holds investments consistent with the procedures as stated in the Statement of Additional Information (SAI). You may obtain a copy of the SAI without charge by calling 800.345.6611; contacting your financial intermediary; visiting columbiathreadneedleus.com/investor/; or searching the website of the Securities and Exchange Commission (SEC) at sec.gov. Information regarding how the Fund voted proxies relating to portfolio securities is filed with the SEC by August 31st for the most recent 12-month period ending June 30th of that year, and is available without charge by visiting columbiathreadneedleus.com/investor/, or searching the website of the SEC at sec.gov.
Quarterly schedule of investments
The Fund files a complete schedule of portfolio holdings with the SEC for the first and third quarters of each fiscal year on Form N-PORT. The Fund’s Form N-PORT filings are available on the SEC’s website at sec.gov. The Fund’s complete schedule of portfolio holdings, as filed on Form N-PORT, can also be obtained without charge, upon request, by calling 800.345.6611.
Additional Fund information
For more information about the Fund, please visit columbiathreadneedleus.com/investor/ or call 800.345.6611. Customer Service Representatives are available to answer your questions Monday through Friday from 8 a.m. to 7 p.m. Eastern time.
Fund investment manager
Columbia Management Investment Advisers, LLC (the Investment Manager)
290 Congress Street
Boston, MA 02210
Fund distributor
Columbia Management Investment Distributors, Inc.
290 Congress Street
Boston, MA 02210
Fund transfer agent
Columbia Management Investment Services Corp.
P.O. Box 219104
Kansas City, MO 64121-9104
Columbia Select Mid Cap Value Fund | Annual Report 2022
Investment objective
The Fund seeks long-term capital appreciation.
Portfolio management
Kari Montanus
Lead Portfolio Manager
Managed Fund since 2018
Jonas Patrikson, CFA
Portfolio Manager
Managed Fund since 2014
Morningstar style boxTM
The Morningstar Style Box is based on a fund’s portfolio holdings. For equity funds, the vertical axis shows the market capitalization of the stocks owned, and the horizontal axis shows investment style (value, blend, or growth). Information shown is based on the most recent data provided by Morningstar.
© 2022 Morningstar, Inc. All rights reserved. The Morningstar information contained herein: (1) is proprietary to Morningstar and/or its content providers; (2) may not be copied or distributed; and (3) is not warranted to be accurate, complete or timely. Neither Morningstar nor its content providers are responsible for any damages or losses arising from any use of this information.
| Average annual total returns (%) (for the period ended February 28, 2022) |
| | | Inception | 1 Year | 5 Years | 10 Years |
| Class A | Excluding sales charges | 11/20/01 | 18.15 | 10.99 | 11.86 |
| | Including sales charges | | 11.38 | 9.68 | 11.19 |
| Advisor Class* | 11/08/12 | 18.36 | 11.25 | 12.11 |
| Class C | Excluding sales charges | 11/20/01 | 17.19 | 10.16 | 11.03 |
| | Including sales charges | | 16.19 | 10.16 | 11.03 |
| Institutional Class | 11/20/01 | 18.36 | 11.25 | 12.13 |
| Institutional 2 Class* | 11/08/12 | 18.47 | 11.39 | 12.25 |
| Institutional 3 Class | 07/15/09 | 18.53 | 11.43 | 12.32 |
| Class R | 01/23/06 | 17.79 | 10.72 | 11.58 |
| Russell Midcap Value Index | | 13.75 | 9.18 | 11.93 |
Returns for Class A shares are shown with and without the maximum initial sales charge of 5.75%. Returns for Class C shares are shown with and without the 1.00% contingent deferred sales charge for the first year only. Please see the Fund’s prospectus for details. Performance for different share classes will vary based on differences in sales charges and fees associated with each share class. All results shown assume reinvestment of distributions during the period. Returns do not reflect the deduction of taxes that a shareholder may pay on Fund distributions or on the redemption of Fund shares. Performance results reflect the effect of any fee waivers or reimbursements of Fund expenses by Columbia Management Investment Advisers, LLC and/or any of its affiliates. Absent these fee waivers or expense reimbursement arrangements, performance results would have been lower.
The performance information shown represents past performance and is not a guarantee of future results. The investment return and principal value of your investment will fluctuate so that your shares, when redeemed, may be worth more or less than their original cost. Current performance may be lower or higher than the performance information shown. You may obtain performance information current to the most recent month-end by contacting your financial intermediary, visiting columbiathreadneedleus.com/investor/ or calling 800.345.6611.
| * | The returns shown for periods prior to the share class inception date (including returns for the Life of the Fund, if shown, which are since Fund inception) include the returns of the Fund’s oldest share class. Since the Fund launched more than one share class at its inception, Class A shares were used. These returns are adjusted to reflect any higher class-related operating expenses of the newer share classes, as applicable. Please visit columbiathreadneedleus.com/investor/investment-products/mutual-funds/appended-performance for more information. |
The Russell Midcap Value Index, an unmanaged index, measures the performance of those Russell Midcap Index companies with lower price-to-book ratios and forecasted growth values.
Indices are not available for investment, are not professionally managed and do not reflect sales charges, fees, brokerage commissions, taxes or other expenses of investing. Securities in the Fund may not match those in an index.
Fund performance may be significantly negatively impacted by the economic impact of the COVID-19 pandemic. The COVID-19 pandemic has adversely impacted economies and capital markets around the world in ways that will likely continue and may change in unforeseen ways for an indeterminate period. The COVID-19 pandemic may exacerbate pre-existing political, social and economic risks in certain countries and globally.
Columbia Select Mid Cap Value Fund | Annual Report 2022
| 3 |
Fund at a Glance (continued)
Performance of a hypothetical $10,000 investment (February 29, 2012 — February 28, 2022)
The chart above shows the change in value of a hypothetical $10,000 investment in Class A shares of Columbia Select Mid Cap Value Fund during the stated time period, and does not reflect the deduction of taxes that a shareholder may pay on Fund distributions or on the redemption of Fund shares.
| Portfolio breakdown (%) (at February 28, 2022) |
| Common Stocks | 96.8 |
| Money Market Funds | 3.2 |
| Total | 100.0 |
Percentages indicated are based upon total investments excluding investments in derivatives, if any. The Fund’s portfolio composition is subject to change.
| Equity sector breakdown (%) (at February 28, 2022) |
| Communication Services | 6.1 |
| Consumer Discretionary | 11.7 |
| Consumer Staples | 4.0 |
| Energy | 6.2 |
| Financials | 17.5 |
| Health Care | 8.7 |
| Industrials | 14.9 |
| Information Technology | 9.4 |
| Materials | 7.5 |
| Real Estate | 9.3 |
| Utilities | 4.7 |
| Total | 100.0 |
Percentages indicated are based upon total equity investments. The Fund’s portfolio composition is subject to change.
| 4 | Columbia Select Mid Cap Value Fund | Annual Report 2022 |
Manager Discussion of Fund Performance
For the 12-month period that ended February 28, 2022, Class A shares of Columbia Select Mid Cap Value Fund returned 18.15% excluding sales charges. The Fund outperformed its benchmark, the Russell Midcap Value Index, which returned 13.75% for the same time period.
Market overview
U.S. equities posted gains through much of the 12-month period that ended February 28, 2022. As pandemic-related restrictions were eased, robust economic growth and corporate earnings drove gains for stocks. Both U.S. monetary and fiscal policy were highly supportive, as Congress approved massive spending packages that included direct payments to citizens and the U.S. Federal Reserve (the Fed) maintained its benchmark overnight lending rate near zero while engaging in bond market purchases to keep longer-term borrowing costs low. The fourth quarter of 2021 saw the Fed adopt a more hawkish tone in response to persistently high inflation, driven in large part by supply chain constraints and rising commodity prices, which led to increased market volatility. The first two months of 2022 brought a rocky start, with most major indices returning in negative territory as markets grappled with individual stock volatility, the number and timing of interest rate hikes by the Fed, inflation and geopolitical tensions. Of most significance, tensions between Russia and Ukraine near the end of the period, and the subsequent invasion of Ukraine by Russia on February 24, 2022, roiled global markets and drove significant sell-offs.
Ten of eleven sectors within the benchmark delivered positive gains for the 12-month period. The energy, materials, real estate, financials, consumer staples and utilities sectors delivered the strongest gains, outperforming the overall benchmark’s return for the period. The communication services sector lagged most, delivering a negative return for the period, followed by consumer discretionary, information technology, industrials and health care.
The Fund’s notable contributors during the period
| • | The Fund’s outperformance of its benchmark during the period was driven by strong stock selection, particularly within the communication services, information technology, energy, and consumer discretionary sectors. |
| • | Devon Energy Corp., an oil exploration and production company, was a strong contributor to overall relative performance. The company reported better-than-expected results during the period, driven by higher production and lower operating costs. The company continues to generate impressive amounts of free cash flow and remains committed to returning cash to shareholders through their pioneering variable dividend. |
| • | The Fund’s position in semiconductor company ON Semiconductor Corp. performed strongly within information technology. Shares climbed after a strong quarterly report that saw earnings and forward guidance above consensus expectations. The beat (exceeded expectations) and raise (raised guidance) was driven by significant gross margin expansion. Investors seem to be increasingly recognizing that the strategic measures undertaken by the new CEO to improve profitability at the company are taking hold. |
| • | Not holding a position in Twitter helped relative performance as the social media platform weighed heavily on the benchmark’s return. |
The Fund’s notable detractors during the period
| • | Stock selection within the utilities sector weighed most on the Fund’s performance versus its benchmark during the period. |
| • | The Fund’s position in The AES Corporation, a diversified power generation and utility company, detracted from results versus the benchmark. The company underperformed after reporting mostly in-line quarterly results. More broadly, the more defensive utility name underperformed as markets rallied earlier in the period on re-opening momentum. |
| • | Shares in Southwest fell, as the outbreak of the Omicron variant of COVID-19, weather issues and labor challenges disrupted air travel. |
| • | Zimmer Biomet Holdings, Inc., a medical device company that provides orthopedic reconstructive products, declined due to macro-related headwinds. With the emergence of COVID-19 variants and labor shortages at hospitals, surgical procedures such as knee and hip replacements have been canceled or delayed, which weighed on the stock. |
Columbia Select Mid Cap Value Fund | Annual Report 2022
| 5 |
Manager Discussion of Fund Performance (continued)
Market risk may affect a single issuer, sector of the economy, industry or the market as a whole. Foreign investments subject the Fund to risks, including political, economic, market, social and others within a particular country, as well as to currency instabilities and less stringent financial and accounting standards generally applicable to U.S. issuers. Investments in mid-cap companies involve risks and volatility greater than investments in larger, more established companies. Value securities may be unprofitable if the market fails to recognize their intrinsic worth or the portfolio manager misgauged that worth. The Fund may invest significantly in issuers within a particular sector, which may be negatively affected by market, economic or other conditions, making the fund more vulnerable to unfavorable developments in the sector. See the Fund’s prospectus for more information on these and other risks.
The views expressed in this report reflect the current views of the respective parties who have contributed to this report. These views are not guarantees of future performance and involve certain risks, uncertainties and assumptions that are difficult to predict, so actual outcomes and results may differ significantly from the views expressed. These views are subject to change at any time based upon economic, market or other conditions and the respective parties disclaim any responsibility to update such views. These views may not be relied on as investment advice and, because investment decisions for a Columbia fund are based on numerous factors, may not be relied on as an indication of trading intent on behalf of any particular Columbia fund. References to specific securities should not be construed as a recommendation or investment advice.
| 6 | Columbia Select Mid Cap Value Fund | Annual Report 2022 |
Understanding Your Fund’s Expenses
(Unaudited)
As an investor, you incur two types of costs. There are shareholder transaction costs, which generally include sales charges on purchases and may include redemption fees. There are also ongoing fund costs, which generally include management fees, distribution and/or service fees, and other fund expenses. The following information is intended to help you understand your ongoing costs (in dollars) of investing in the Fund and to help you compare these costs with the ongoing costs of investing in other mutual funds.
Analyzing your Fund’s expenses
To illustrate these ongoing costs, we have provided examples and calculated the expenses paid by investors in each share class of the Fund during the period. The actual and hypothetical information in the table is based on an initial investment of $1,000 at the beginning of the period indicated and held for the entire period. Expense information is calculated two ways and each method provides you with different information. The amount listed in the “Actual” column is calculated using the Fund’s actual operating expenses and total return for the period. You may use the Actual information, together with the amount invested, to estimate the expenses that you paid over the period. Simply divide your account value by $1,000 (for example, an $8,600 account value divided by $1,000 = 8.6), then multiply the results by the expenses paid during the period under the “Actual” column. The amount listed in the “Hypothetical” column assumes a 5% annual rate of return before expenses (which is not the Fund’s actual return) and then applies the Fund’s actual expense ratio for the period to the hypothetical return. You should not use the hypothetical account values and expenses to estimate either your actual account balance at the end of the period or the expenses you paid during the period. See “Compare with other funds” below for details on how to use the hypothetical data.
Compare with other funds
Since all mutual funds are required to include the same hypothetical calculations about expenses in shareholder reports, you can use this information to compare the ongoing cost of investing in the Fund with other funds. To do so, compare the hypothetical example with the 5% hypothetical examples that appear in the shareholder reports of other funds. As you compare hypothetical examples of other funds, it is important to note that hypothetical examples are meant to highlight the ongoing costs of investing in a fund only and do not reflect any transaction costs, such as sales charges, or redemption or exchange fees. Therefore, the hypothetical calculations are useful in comparing ongoing costs only, and will not help you determine the relative total costs of owning different funds. If transaction costs were included in these calculations, your costs would be higher.
| September 1, 2021 — February 28, 2022 |
| | Account value at the
beginning of the
period ($) | Account value at the
end of the
period ($) | Expenses paid during
the period ($) | Fund’s annualized
expense ratio (%) |
| | Actual | Hypothetical | Actual | Hypothetical | Actual | Hypothetical | Actual |
| Class A | 1,000.00 | 1,000.00 | 1,063.30 | 1,019.24 | 5.73 | 5.61 | 1.12 |
| Advisor Class | 1,000.00 | 1,000.00 | 1,064.00 | 1,020.48 | 4.45 | 4.36 | 0.87 |
| Class C | 1,000.00 | 1,000.00 | 1,059.80 | 1,015.52 | 9.55 | 9.35 | 1.87 |
| Institutional Class | 1,000.00 | 1,000.00 | 1,064.40 | 1,020.48 | 4.45 | 4.36 | 0.87 |
| Institutional 2 Class | 1,000.00 | 1,000.00 | 1,065.30 | 1,020.93 | 3.99 | 3.91 | 0.78 |
| Institutional 3 Class | 1,000.00 | 1,000.00 | 1,065.50 | 1,021.12 | 3.79 | 3.71 | 0.74 |
| Class R | 1,000.00 | 1,000.00 | 1,062.30 | 1,018.00 | 7.01 | 6.85 | 1.37 |
Expenses paid during the period are equal to the annualized expense ratio for each class as indicated above, multiplied by the average account value over the period and then multiplied by the number of days in the Fund’s most recent fiscal half year and divided by 365.
Expenses do not include fees and expenses incurred indirectly by the Fund from its investment in underlying funds, including affiliated and non-affiliated pooled investment vehicles, such as mutual funds and exchange-traded funds.
Had Columbia Management Investment Advisers, LLC and/or certain of its affiliates not waived/reimbursed certain fees and expenses, account value at the end of the period would have been reduced.
Columbia Select Mid Cap Value Fund | Annual Report 2022
| 7 |
Portfolio of Investments
February 28, 2022
(Percentages represent value of investments compared to net assets)
Investments in securities
| Common Stocks 96.7% |
| Issuer | Shares | Value ($) |
| Communication Services 5.9% |
| Entertainment 3.7% |
| Live Nation Entertainment, Inc.(a) | 373,171 | 45,086,520 |
| Take-Two Interactive Software, Inc.(a) | 356,559 | 57,762,558 |
| Total | | 102,849,078 |
| Media 2.2% |
| Nexstar Media Group, Inc., Class A | 327,239 | 60,555,577 |
| Total Communication Services | 163,404,655 |
| Consumer Discretionary 11.3% |
| Hotels, Restaurants & Leisure 2.1% |
| Hyatt Hotels Corp., Class A(a) | 606,205 | 58,868,568 |
| Household Durables 1.6% |
| D.R. Horton, Inc. | 510,385 | 43,586,879 |
| Multiline Retail 2.4% |
| Dollar Tree, Inc.(a) | 464,097 | 65,938,902 |
| Specialty Retail 3.6% |
| Burlington Stores, Inc.(a) | 194,382 | 43,908,950 |
| O’Reilly Automotive, Inc.(a) | 89,235 | 57,934,931 |
| Total | | 101,843,881 |
| Textiles, Apparel & Luxury Goods 1.6% |
| Capri Holdings Ltd.(a) | 657,635 | 44,548,195 |
| Total Consumer Discretionary | 314,786,425 |
| Consumer Staples 3.8% |
| Food & Staples Retailing 2.0% |
| U.S. Foods Holding Corp.(a) | 1,435,533 | 56,114,985 |
| Food Products 1.8% |
| Tyson Foods, Inc., Class A | 546,735 | 50,660,465 |
| Total Consumer Staples | 106,775,450 |
| Energy 6.0% |
| Oil, Gas & Consumable Fuels 6.0% |
| Devon Energy Corp. | 1,396,328 | 83,151,332 |
| Marathon Petroleum Corp. | 1,083,002 | 84,333,366 |
| Total | | 167,484,698 |
| Total Energy | 167,484,698 |
| Common Stocks (continued) |
| Issuer | Shares | Value ($) |
| Financials 16.9% |
| Banks 6.9% |
| Popular, Inc. | 742,942 | 68,239,223 |
| Regions Financial Corp. | 2,701,421 | 65,347,374 |
| SVB Financial Group(a) | 98,126 | 59,464,356 |
| Total | | 193,050,953 |
| Consumer Finance 2.7% |
| Discover Financial Services | 597,491 | 73,754,289 |
| Diversified Financial Services 1.3% |
| Voya Financial, Inc. | 549,299 | 36,995,288 |
| Insurance 6.0% |
| Hanover Insurance Group, Inc. (The) | 352,725 | 49,208,665 |
| Lincoln National Corp. | 967,362 | 65,219,546 |
| Reinsurance Group of America, Inc. | 485,367 | 53,807,785 |
| Total | | 168,235,996 |
| Total Financials | 472,036,526 |
| Health Care 8.5% |
| Health Care Equipment & Supplies 2.1% |
| Zimmer Biomet Holdings, Inc. | 460,071 | 58,516,431 |
| Health Care Providers & Services 3.5% |
| Centene Corp.(a) | 607,509 | 50,192,393 |
| Quest Diagnostics, Inc. | 348,714 | 45,775,687 |
| Total | | 95,968,080 |
| Life Sciences Tools & Services 2.9% |
| Agilent Technologies, Inc. | 309,595 | 40,358,804 |
| Syneos Health, Inc.(a) | 520,979 | 41,261,537 |
| Total | | 81,620,341 |
| Total Health Care | 236,104,852 |
| Industrials 14.4% |
| Airlines 1.8% |
| Southwest Airlines Co.(a) | 1,143,256 | 50,074,613 |
| Building Products 2.4% |
| Trane Technologies PLC | 438,362 | 67,477,063 |
The accompanying Notes to Financial Statements are an integral part of this statement.
| 8 | Columbia Select Mid Cap Value Fund | Annual Report 2022 |
Portfolio of Investments (continued)
February 28, 2022
| Common Stocks (continued) |
| Issuer | Shares | Value ($) |
| Electrical Equipment 3.0% |
| AMETEK, Inc. | 559,507 | 72,618,413 |
| Bloom Energy Corp., Class A(a) | 474,643 | 10,537,075 |
| Total | | 83,155,488 |
| Machinery 4.8% |
| Ingersoll Rand, Inc. | 1,268,570 | 64,088,156 |
| ITT, Inc. | 793,111 | 69,690,664 |
| Total | | 133,778,820 |
| Professional Services 2.4% |
| CACI International, Inc., Class A(a) | 238,438 | 66,712,568 |
| Total Industrials | 401,198,552 |
| Information Technology 9.1% |
| Communications Equipment 2.1% |
| Motorola Solutions, Inc. | 272,711 | 60,113,686 |
| Electronic Equipment, Instruments & Components 2.1% |
| Corning, Inc. | 1,428,311 | 57,703,764 |
| Semiconductors & Semiconductor Equipment 4.9% |
| GlobalFoundries, Inc.(a) | 376,224 | 22,866,895 |
| Marvell Technology, Inc. | 536,418 | 36,653,442 |
| ON Semiconductor Corp.(a) | 587,536 | 36,785,629 |
| Teradyne, Inc. | 333,861 | 39,368,889 |
| Total | | 135,674,855 |
| Total Information Technology | 253,492,305 |
| Materials 7.3% |
| Chemicals 4.2% |
| Chemours Co. LLC (The) | 1,292,000 | 35,659,200 |
| Eastman Chemical Co. | 283,462 | 33,581,743 |
| FMC Corp. | 404,686 | 47,449,434 |
| Total | | 116,690,377 |
| Common Stocks (continued) |
| Issuer | Shares | Value ($) |
| Metals & Mining 3.1% |
| Allegheny Technologies, Inc.(a) | 1,769,808 | 45,554,858 |
| Freeport-McMoRan, Inc. | 874,997 | 41,081,109 |
| Total | | 86,635,967 |
| Total Materials | 203,326,344 |
| Real Estate 9.0% |
| Equity Real Estate Investment Trusts (REITS) 9.0% |
| First Industrial Realty Trust, Inc. | 1,263,379 | 72,745,363 |
| Gaming and Leisure Properties, Inc. | 1,186,569 | 53,882,098 |
| Simon Property Group, Inc. | 348,954 | 48,002,112 |
| Welltower, Inc. | 908,721 | 75,687,372 |
| Total | | 250,316,945 |
| Total Real Estate | 250,316,945 |
| Utilities 4.5% |
| Independent Power and Renewable Electricity Producers 1.8% |
| AES Corp. (The) | 2,340,603 | 49,691,002 |
| Multi-Utilities 2.7% |
| Ameren Corp. | 892,909 | 76,745,528 |
| Total Utilities | 126,436,530 |
Total Common Stocks
(Cost $1,822,987,683) | 2,695,363,282 |
|
| Money Market Funds 3.2% |
| | Shares | Value ($) |
| Columbia Short-Term Cash Fund, 0.168%(b),(c) | 89,679,702 | 89,652,798 |
Total Money Market Funds
(Cost $89,656,582) | 89,652,798 |
Total Investments in Securities
(Cost: $1,912,644,265) | 2,785,016,080 |
| Other Assets & Liabilities, Net | | 1,854,276 |
| Net Assets | 2,786,870,356 |
The accompanying Notes to Financial Statements are an integral part of this statement.
Columbia Select Mid Cap Value Fund | Annual Report 2022
| 9 |
Portfolio of Investments (continued)
February 28, 2022
Notes to Portfolio of Investments
| (a) | Non-income producing investment. |
| (b) | The rate shown is the seven-day current annualized yield at February 28, 2022. |
| (c) | As defined in the Investment Company Act of 1940, as amended, an affiliated company is one in which the Fund owns 5% or more of the company’s outstanding voting securities, or a company which is under common ownership or control with the Fund. The value of the holdings and transactions in these affiliated companies during the year ended February 28, 2022 are as follows: |
| Affiliated issuers | Beginning
of period($) | Purchases($) | Sales($) | Net change in
unrealized
appreciation
(depreciation)($) | End of
period($) | Realized gain
(loss)($) | Dividends($) | End of
period shares |
| Columbia Short-Term Cash Fund, 0.168% |
| | 16,809,145 | 436,312,576 | (363,463,437) | (5,486) | 89,652,798 | (10,020) | 44,736 | 89,679,702 |
Fair value measurements
The Fund categorizes its fair value measurements according to a three-level hierarchy that maximizes the use of observable inputs and minimizes the use of unobservable inputs by prioritizing that the most observable input be used when available. Observable inputs are those that market participants would use in pricing an investment based on market data obtained from sources independent of the reporting entity. Unobservable inputs are those that reflect the Fund’s assumptions about the information market participants would use in pricing an investment. An investment’s level within the fair value hierarchy is based on the lowest level of any input that is deemed significant to the asset’s or liability’s fair value measurement. The input levels are not necessarily an indication of the risk or liquidity associated with investments at that level. For example, certain U.S. government securities are generally high quality and liquid, however, they are reflected as Level 2 because the inputs used to determine fair value may not always be quoted prices in an active market.
Fair value inputs are summarized in the three broad levels listed below:
| ■ | Level 1 — Valuations based on quoted prices for investments in active markets that the Fund has the ability to access at the measurement date. Valuation adjustments are not applied to Level 1 investments. |
| ■ | Level 2 — Valuations based on other significant observable inputs (including quoted prices for similar securities, interest rates, prepayment speeds, credit risks, etc.). |
| ■ | Level 3 — Valuations based on significant unobservable inputs (including the Fund’s own assumptions and judgment in determining the fair value of investments). |
Inputs that are used in determining fair value of an investment may include price information, credit data, volatility statistics, and other factors. These inputs can be either observable or unobservable. The availability of observable inputs can vary between investments, and is affected by various factors such as the type of investment, and the volume and level of activity for that investment or similar investments in the marketplace. The inputs will be considered by the Investment Manager, along with any other relevant factors in the calculation of an investment’s fair value. The Fund uses prices and inputs that are current as of the measurement date, which may include periods of market dislocations. During these periods, the availability of prices and inputs may be reduced for many investments. This condition could cause an investment to be reclassified between the various levels within the hierarchy.
Investments falling into the Level 3 category are primarily supported by quoted prices from brokers and dealers participating in the market for those investments. However, these may be classified as Level 3 investments due to lack of market transparency and corroboration to support these quoted prices. Additionally, valuation models may be used as the pricing source for any remaining investments classified as Level 3. These models may rely on one or more significant unobservable inputs and/or significant assumptions by the Investment Manager. Inputs used in valuations may include, but are not limited to, financial statement analysis, capital account balances, discount rates and estimated cash flows, and comparable company data.
Under the direction of the Fund’s Board of Trustees (the Board), the Investment Manager’s Valuation Committee (the Committee) is responsible for overseeing the valuation procedures approved by the Board. The Committee consists of voting and non-voting members from various groups within the Investment Manager’s organization, including operations and accounting, trading and investments, compliance, risk management and legal.
The Committee meets at least monthly to review and approve valuation matters, which may include a description of specific valuation determinations, data regarding pricing information received from approved pricing vendors and brokers and the results of Board-approved valuation control policies and procedures (the Policies). The Policies address, among other things, instances when market quotations are or are not readily available, including recommendations of third party pricing vendors and a determination of appropriate pricing methodologies; events that require specific valuation determinations and assessment of fair value techniques; securities with a potential for stale pricing, including those that are illiquid, restricted, or in default; and the effectiveness of third party pricing vendors, including periodic reviews of vendors. The Committee meets more frequently, as needed, to discuss additional valuation matters, which may include the need to review back-testing results, review time-sensitive information or approve related valuation actions. The Committee reports to the Board, with members of the Committee meeting with the Board at each of its regularly scheduled meetings to discuss valuation matters and actions during the period, similar to those described earlier.
The following table is a summary of the inputs used to value the Fund’s investments at February 28, 2022:
| | Level 1 ($) | Level 2 ($) | Level 3 ($) | Total ($) |
| Investments in Securities | | | | |
| Common Stocks | | | | |
| Communication Services | 163,404,655 | — | — | 163,404,655 |
| Consumer Discretionary | 314,786,425 | — | — | 314,786,425 |
| Consumer Staples | 106,775,450 | — | — | 106,775,450 |
| Energy | 167,484,698 | — | — | 167,484,698 |
| Financials | 472,036,526 | — | — | 472,036,526 |
| Health Care | 236,104,852 | — | — | 236,104,852 |
| Industrials | 401,198,552 | — | — | 401,198,552 |
The accompanying Notes to Financial Statements are an integral part of this statement.
| 10 | Columbia Select Mid Cap Value Fund | Annual Report 2022 |
Portfolio of Investments (continued)
February 28, 2022
Fair value measurements (continued)
| | Level 1 ($) | Level 2 ($) | Level 3 ($) | Total ($) |
| Information Technology | 253,492,305 | — | — | 253,492,305 |
| Materials | 203,326,344 | — | — | 203,326,344 |
| Real Estate | 250,316,945 | — | — | 250,316,945 |
| Utilities | 126,436,530 | — | — | 126,436,530 |
| Total Common Stocks | 2,695,363,282 | — | — | 2,695,363,282 |
| Money Market Funds | 89,652,798 | — | — | 89,652,798 |
| Total Investments in Securities | 2,785,016,080 | — | — | 2,785,016,080 |
See the Portfolio of Investments for all investment classifications not indicated in the table.
The accompanying Notes to Financial Statements are an integral part of this statement.
Columbia Select Mid Cap Value Fund | Annual Report 2022
| 11 |
Statement of Assets and Liabilities
February 28, 2022
| Assets | |
| Investments in securities, at value | |
| Unaffiliated issuers (cost $1,822,987,683) | $2,695,363,282 |
| Affiliated issuers (cost $89,656,582) | 89,652,798 |
| Receivable for: | |
| Capital shares sold | 3,267,451 |
| Dividends | 2,868,742 |
| Expense reimbursement due from Investment Manager | 2,840 |
| Prepaid expenses | 19,558 |
| Total assets | 2,791,174,671 |
| Liabilities | |
| Payable for: | |
| Capital shares purchased | 3,291,564 |
| Management services fees | 166,296 |
| Distribution and/or service fees | 25,783 |
| Transfer agent fees | 318,347 |
| Compensation of board members | 421,351 |
| Compensation of chief compliance officer | 428 |
| Other expenses | 80,546 |
| Total liabilities | 4,304,315 |
| Net assets applicable to outstanding capital stock | $2,786,870,356 |
| Represented by | |
| Paid in capital | 1,836,885,034 |
| Total distributable earnings (loss) | 949,985,322 |
| Total - representing net assets applicable to outstanding capital stock | $2,786,870,356 |
| Class A | |
| Net assets | $1,142,074,993 |
| Shares outstanding | 84,364,147 |
| Net asset value per share | $13.54 |
| Maximum sales charge | 5.75% |
| Maximum offering price per share (calculated by dividing the net asset value per share by 1.0 minus the maximum sales charge for Class A shares) | $14.37 |
| Advisor Class | |
| Net assets | $178,227,941 |
| Shares outstanding | 12,573,469 |
| Net asset value per share | $14.17 |
| Class C | |
| Net assets | $12,830,336 |
| Shares outstanding | 1,076,644 |
| Net asset value per share | $11.92 |
| Institutional Class | |
| Net assets | $861,575,785 |
| Shares outstanding | 63,390,667 |
| Net asset value per share | $13.59 |
| Institutional 2 Class | |
| Net assets | $130,350,663 |
| Shares outstanding | 9,192,110 |
| Net asset value per share | $14.18 |
| Institutional 3 Class | |
| Net assets | $434,024,060 |
| Shares outstanding | 32,080,315 |
| Net asset value per share | $13.53 |
| Class R | |
| Net assets | $27,786,578 |
| Shares outstanding | 2,065,008 |
| Net asset value per share | $13.46 |
The accompanying Notes to Financial Statements are an integral part of this statement.
| 12 | Columbia Select Mid Cap Value Fund | Annual Report 2022 |
Statement of Operations
Year Ended February 28, 2022
| Net investment income | |
| Income: | |
| Dividends — unaffiliated issuers | $39,048,937 |
| Dividends — affiliated issuers | 44,736 |
| Interfund lending | 961 |
| Foreign taxes withheld | (137,844) |
| Total income | 38,956,790 |
| Expenses: | |
| Management services fees | 19,191,348 |
| Distribution and/or service fees | |
| Class A | 2,753,034 |
| Class C | 127,939 |
| Class R | 150,660 |
| Transfer agent fees | |
| Class A | 1,524,439 |
| Advisor Class | 229,823 |
| Class C | 17,721 |
| Institutional Class | 1,124,432 |
| Institutional 2 Class | 67,031 |
| Institutional 3 Class | 24,061 |
| Class R | 41,735 |
| Compensation of board members | 104,254 |
| Custodian fees | 14,167 |
| Printing and postage fees | 145,374 |
| Registration fees | 124,311 |
| Audit fees | 35,000 |
| Legal fees | 39,029 |
| Compensation of chief compliance officer | 411 |
| Other | 36,711 |
| Total expenses | 25,751,480 |
| Fees waived or expenses reimbursed by Investment Manager and its affiliates | (192,449) |
| Fees waived by transfer agent | |
| Institutional 2 Class | (18,242) |
| Institutional 3 Class | (24,061) |
| Expense reduction | (2,700) |
| Total net expenses | 25,514,028 |
| Net investment income | 13,442,762 |
| Realized and unrealized gain (loss) — net | |
| Net realized gain (loss) on: | |
| Investments — unaffiliated issuers | 277,020,553 |
| Investments — affiliated issuers | (10,020) |
| Net realized gain | 277,010,533 |
| Net change in unrealized appreciation (depreciation) on: | |
| Investments — unaffiliated issuers | 141,077,120 |
| Investments — affiliated issuers | (5,486) |
| Net change in unrealized appreciation (depreciation) | 141,071,634 |
| Net realized and unrealized gain | 418,082,167 |
| Net increase in net assets resulting from operations | $431,524,929 |
The accompanying Notes to Financial Statements are an integral part of this statement.
Columbia Select Mid Cap Value Fund | Annual Report 2022
| 13 |
Statement of Changes in Net Assets
| | Year Ended
February 28, 2022 | Year Ended
February 28, 2021 |
| Operations | | |
| Net investment income | $13,442,762 | $12,839,293 |
| Net realized gain | 277,010,533 | 35,911,756 |
| Net change in unrealized appreciation (depreciation) | 141,071,634 | 605,075,953 |
| Net increase in net assets resulting from operations | 431,524,929 | 653,827,002 |
| Distributions to shareholders | | |
| Net investment income and net realized gains | | |
| Class A | (95,776,131) | (17,676,345) |
| Advisor Class | (13,763,048) | (1,096,305) |
| Class C | (1,171,441) | (373,633) |
| Institutional Class | (73,036,294) | (22,705,183) |
| Institutional 2 Class | (10,768,053) | (2,421,282) |
| Institutional 3 Class | (36,507,016) | (7,952,391) |
| Class R | (2,487,239) | (757,365) |
| Total distributions to shareholders | (233,509,222) | (52,982,504) |
| Increase in net assets from capital stock activity | 216,032,102 | 426,729,328 |
| Total increase in net assets | 414,047,809 | 1,027,573,826 |
| Net assets at beginning of year | 2,372,822,547 | 1,345,248,721 |
| Net assets at end of year | $2,786,870,356 | $2,372,822,547 |
The accompanying Notes to Financial Statements are an integral part of this statement.
| 14 | Columbia Select Mid Cap Value Fund | Annual Report 2022 |
Statement of Changes in Net Assets (continued)
| | Year Ended | Year Ended |
| | February 28, 2022 | February 28, 2021 |
| | Shares | Dollars ($) | Shares | Dollars ($) |
| Capital stock activity |
| Class A | | | | |
| Subscriptions | 5,909,633 | 80,584,016 | 4,671,905 | 45,629,276 |
| Fund reorganization | 2,451,935 | 32,338,454 | 39,170,046 | 338,427,345 |
| Distributions reinvested | 6,609,810 | 90,795,130 | 1,834,484 | 16,251,790 |
| Redemptions | (10,825,461) | (147,526,000) | (14,614,146) | (144,279,931) |
| Net increase | 4,145,917 | 56,191,600 | 31,062,289 | 256,028,480 |
| Advisor Class | | | | |
| Subscriptions | 3,163,318 | 44,985,786 | 11,572,395 | 109,734,091 |
| Fund reorganization | 185,751 | 2,564,607 | 2,434,767 | 21,937,275 |
| Distributions reinvested | 949,858 | 13,638,294 | 108,583 | 1,056,042 |
| Redemptions | (3,445,998) | (49,245,622) | (4,404,517) | (47,412,019) |
| Net increase | 852,929 | 11,943,065 | 9,711,228 | 85,315,389 |
| Class C | | | | |
| Subscriptions | 308,952 | 3,755,602 | 93,312 | 835,907 |
| Fund reorganization | — | — | 543,360 | 4,205,613 |
| Distributions reinvested | 94,008 | 1,141,080 | 44,083 | 347,951 |
| Redemptions | (451,667) | (5,490,415) | (1,008,448) | (9,142,544) |
| Net decrease | (48,707) | (593,733) | (327,693) | (3,753,073) |
| Institutional Class | | | | |
| Subscriptions | 12,670,719 | 172,324,656 | 6,624,100 | 64,456,629 |
| Fund reorganization | — | — | 5,608,529 | 48,625,920 |
| Distributions reinvested | 4,943,198 | 68,113,102 | 2,425,313 | 21,406,965 |
| Redemptions | (10,255,528) | (140,960,727) | (20,421,123) | (191,725,497) |
| Net increase (decrease) | 7,358,389 | 99,477,031 | (5,763,181) | (57,235,983) |
| Institutional 2 Class | | | | |
| Subscriptions | 3,076,208 | 43,814,292 | 2,772,450 | 28,783,226 |
| Fund reorganization | — | — | 1,608,162 | 14,489,499 |
| Distributions reinvested | 676,436 | 9,713,445 | 259,114 | 2,385,510 |
| Redemptions | (2,482,935) | (35,578,309) | (2,891,479) | (28,953,694) |
| Net increase | 1,269,709 | 17,949,428 | 1,748,247 | 16,704,541 |
| Institutional 3 Class | | | | |
| Subscriptions | 11,762,304 | 161,202,450 | 11,620,696 | 107,181,810 |
| Fund reorganization | 83,061 | 1,094,384 | 8,691,673 | 75,009,378 |
| Distributions reinvested | 2,306,416 | 31,617,245 | 767,213 | 6,876,162 |
| Redemptions | (11,648,122) | (159,945,955) | (5,855,282) | (57,421,915) |
| Net increase | 2,503,659 | 33,968,124 | 15,224,300 | 131,645,435 |
| Class R | | | | |
| Subscriptions | 672,334 | 9,048,538 | 799,660 | 7,723,118 |
| Fund reorganization | — | — | 303,824 | 2,612,872 |
| Distributions reinvested | 181,931 | 2,485,764 | 85,793 | 749,444 |
| Redemptions | (1,062,609) | (14,437,715) | (1,351,248) | (13,060,895) |
| Net decrease | (208,344) | (2,903,413) | (161,971) | (1,975,461) |
| Total net increase | 15,873,552 | 216,032,102 | 51,493,219 | 426,729,328 |
The accompanying Notes to Financial Statements are an integral part of this statement.
Columbia Select Mid Cap Value Fund | Annual Report 2022
| 15 |
The following table is intended to help you understand the Fund’s financial performance. Certain information reflects financial results for a single share of a class held for the periods shown. Per share net investment income (loss) amounts are calculated based on average shares outstanding during the period. Total return assumes reinvestment of all dividends and distributions, if any. Total return does not reflect payment of sales charges, if any. Total return and portfolio turnover are not annualized for periods of less than one year. The portfolio turnover rate is calculated without regard to purchase and sales transactions of short-term instruments and certain derivatives, if any. If such transactions were included, the Fund’s portfolio turnover rate may be higher.
| | Net asset value,
beginning of
period | Net
investment
income
(loss) | Net
realized
and
unrealized
gain (loss) | Total from
investment
operations | Distributions
from net
investment
income | Distributions
from net
realized
gains | Total
distributions to
shareholders |
| Class A |
| Year Ended 2/28/2022 | $12.50 | 0.05 | 2.22 | 2.27 | (0.04) | (1.19) | (1.23) |
| Year Ended 2/28/2021 | $9.76 | 0.05 | 3.04 | 3.09 | (0.07) | (0.28) | (0.35) |
| Year Ended 2/29/2020 | $10.34 | 0.10 | (0.32) | (0.22) | (0.10) | (0.26) | (0.36) |
| Year Ended 2/28/2019 | $13.27 | 0.07 | 0.18 | 0.25 | (0.07) | (3.11) | (3.18) |
| Year Ended 2/28/2018 | $15.19 | 0.13 | 0.80 | 0.93 | (0.14) | (2.71) | (2.85) |
| Advisor Class |
| Year Ended 2/28/2022 | $13.04 | 0.09 | 2.30 | 2.39 | (0.07) | (1.19) | (1.26) |
| Year Ended 2/28/2021 | $10.17 | 0.07 | 3.17 | 3.24 | (0.09) | (0.28) | (0.37) |
| Year Ended 2/29/2020 | $10.75 | 0.13 | (0.33) | (0.20) | (0.12) | (0.26) | (0.38) |
| Year Ended 2/28/2019 | $13.67 | 0.10 | 0.19 | 0.29 | (0.10) | (3.11) | (3.21) |
| Year Ended 2/28/2018 | $15.57 | 0.17 | 0.82 | 0.99 | (0.18) | (2.71) | (2.89) |
| Class C |
| Year Ended 2/28/2022 | $11.18 | (0.05) | 1.98 | 1.93 | — | (1.19) | (1.19) |
| Year Ended 2/28/2021 | $8.76 | (0.01) | 2.72 | 2.71 | (0.01) | (0.28) | (0.29) |
| Year Ended 2/29/2020 | $9.30 | 0.02 | (0.28) | (0.26) | (0.02) | (0.26) | (0.28) |
| Year Ended 2/28/2019 | $12.29 | (0.02) | 0.14 | 0.12 | — | (3.11) | (3.11) |
| Year Ended 2/28/2018 | $14.29 | 0.01 | 0.75 | 0.76 | (0.05) | (2.71) | (2.76) |
| Institutional Class |
| Year Ended 2/28/2022 | $12.55 | 0.08 | 2.22 | 2.30 | (0.07) | (1.19) | (1.26) |
| Year Ended 2/28/2021 | $9.80 | 0.09 | 3.03 | 3.12 | (0.09) | (0.28) | (0.37) |
| Year Ended 2/29/2020 | $10.38 | 0.13 | (0.33) | (0.20) | (0.12) | (0.26) | (0.38) |
| Year Ended 2/28/2019 | $13.31 | 0.10 | 0.18 | 0.28 | (0.10) | (3.11) | (3.21) |
| Year Ended 2/28/2018 | $15.23 | 0.18 | 0.79 | 0.97 | (0.18) | (2.71) | (2.89) |
| Institutional 2 Class |
| Year Ended 2/28/2022 | $13.05 | 0.10 | 2.31 | 2.41 | (0.09) | (1.19) | (1.28) |
| Year Ended 2/28/2021 | $10.17 | 0.10 | 3.17 | 3.27 | (0.11) | (0.28) | (0.39) |
| Year Ended 2/29/2020 | $10.76 | 0.14 | (0.33) | (0.19) | (0.14) | (0.26) | (0.40) |
| Year Ended 2/28/2019 | $13.67 | 0.11 | 0.20 | 0.31 | (0.11) | (3.11) | (3.22) |
| Year Ended 2/28/2018 | $15.57 | 0.18 | 0.83 | 1.01 | (0.20) | (2.71) | (2.91) |
| Institutional 3 Class |
| Year Ended 2/28/2022 | $12.50 | 0.10 | 2.21 | 2.31 | (0.09) | (1.19) | (1.28) |
| Year Ended 2/28/2021 | $9.76 | 0.09 | 3.04 | 3.13 | (0.11) | (0.28) | (0.39) |
| Year Ended 2/29/2020 | $10.34 | 0.14 | (0.32) | (0.18) | (0.14) | (0.26) | (0.40) |
| Year Ended 2/28/2019 | $13.27 | 0.12 | 0.18 | 0.30 | (0.12) | (3.11) | (3.23) |
| Year Ended 2/28/2018 | $15.20 | 0.14 | 0.84 | 0.98 | (0.20) | (2.71) | (2.91) |
The accompanying Notes to Financial Statements are an integral part of this statement.
| 16 | Columbia Select Mid Cap Value Fund | Annual Report 2022 |
Financial Highlights (continued)
| | Net
asset
value,
end of
period | Total
return | Total gross
expense
ratio to
average
net assets(a) | Total net
expense
ratio to
average
net assets(a),(b) | Net investment
income (loss)
ratio to
average
net assets | Portfolio
turnover | Net
assets,
end of
period
(000’s) |
| Class A |
| Year Ended 2/28/2022 | $13.54 | 18.15% | 1.13% | 1.13%(c) | 0.35% | 37% | $1,142,075 |
| Year Ended 2/28/2021 | $12.50 | 33.20% | 1.18% | 1.15%(c) | 0.54% | 44% | $1,003,004 |
| Year Ended 2/29/2020 | $9.76 | (2.47%) | 1.21% | 1.16%(c) | 0.91% | 28% | $479,921 |
| Year Ended 2/28/2019 | $10.34 | 3.57% | 1.20% | 1.17%(c) | 0.57% | 79% | $575,861 |
| Year Ended 2/28/2018 | $13.27 | 5.96% | 1.18% | 1.18%(c) | 0.86% | 59% | $692,641 |
| Advisor Class |
| Year Ended 2/28/2022 | $14.17 | 18.36% | 0.89% | 0.88%(c) | 0.60% | 37% | $178,228 |
| Year Ended 2/28/2021 | $13.04 | 33.49% | 0.93% | 0.90%(c) | 0.66% | 44% | $152,860 |
| Year Ended 2/29/2020 | $10.17 | (2.14%) | 0.96% | 0.91%(c) | 1.16% | 28% | $20,433 |
| Year Ended 2/28/2019 | $10.75 | 3.79% | 0.95% | 0.92%(c) | 0.78% | 79% | $21,857 |
| Year Ended 2/28/2018 | $13.67 | 6.20% | 0.93% | 0.92%(c) | 1.10% | 59% | $69,624 |
| Class C |
| Year Ended 2/28/2022 | $11.92 | 17.19% | 1.88% | 1.88%(c) | (0.39%) | 37% | $12,830 |
| Year Ended 2/28/2021 | $11.18 | 32.30% | 1.94% | 1.90%(c) | (0.12%) | 44% | $12,577 |
| Year Ended 2/29/2020 | $8.76 | (3.11%) | 1.96% | 1.92%(c) | 0.17% | 28% | $12,726 |
| Year Ended 2/28/2019 | $9.30 | 2.78% | 1.95% | 1.92%(c) | (0.20%) | 79% | $20,763 |
| Year Ended 2/28/2018 | $12.29 | 5.09% | 1.93% | 1.92%(c) | 0.10% | 59% | $69,670 |
| Institutional Class |
| Year Ended 2/28/2022 | $13.59 | 18.36% | 0.89% | 0.88%(c) | 0.60% | 37% | $861,576 |
| Year Ended 2/28/2021 | $12.55 | 33.52% | 0.94% | 0.90%(c) | 0.91% | 44% | $703,152 |
| Year Ended 2/29/2020 | $9.80 | (2.22%) | 0.96% | 0.91%(c) | 1.16% | 28% | $605,614 |
| Year Ended 2/28/2019 | $10.38 | 3.84% | 0.95% | 0.92%(c) | 0.82% | 79% | $694,941 |
| Year Ended 2/28/2018 | $13.31 | 6.21% | 0.93% | 0.93%(c) | 1.20% | 59% | $837,610 |
| Institutional 2 Class |
| Year Ended 2/28/2022 | $14.18 | 18.47% | 0.80% | 0.78% | 0.70% | 37% | $130,351 |
| Year Ended 2/28/2021 | $13.05 | 33.75% | 0.84% | 0.79% | 0.96% | 44% | $103,360 |
| Year Ended 2/29/2020 | $10.17 | (2.12%) | 0.85% | 0.80% | 1.27% | 28% | $62,808 |
| Year Ended 2/28/2019 | $10.76 | 3.99% | 0.83% | 0.80% | 0.89% | 79% | $70,379 |
| Year Ended 2/28/2018 | $13.67 | 6.33% | 0.82% | 0.82% | 1.17% | 59% | $82,174 |
| Institutional 3 Class |
| Year Ended 2/28/2022 | $13.53 | 18.53% | 0.75% | 0.74% | 0.73% | 37% | $434,024 |
| Year Ended 2/28/2021 | $12.50 | 33.80% | 0.79% | 0.75% | 0.94% | 44% | $369,599 |
| Year Ended 2/29/2020 | $9.76 | (2.07%) | 0.80% | 0.75% | 1.32% | 28% | $140,100 |
| Year Ended 2/28/2019 | $10.34 | 4.02% | 0.78% | 0.76% | 0.97% | 79% | $153,442 |
| Year Ended 2/28/2018 | $13.27 | 6.34% | 0.77% | 0.77% | 0.98% | 59% | $239,180 |
The accompanying Notes to Financial Statements are an integral part of this statement.
Columbia Select Mid Cap Value Fund | Annual Report 2022
| 17 |
Financial Highlights (continued)
| | Net asset value,
beginning of
period | Net
investment
income
(loss) | Net
realized
and
unrealized
gain (loss) | Total from
investment
operations | Distributions
from net
investment
income | Distributions
from net
realized
gains | Total
distributions to
shareholders |
| Class R |
| Year Ended 2/28/2022 | $12.44 | 0.01 | 2.21 | 2.22 | (0.01) | (1.19) | (1.20) |
| Year Ended 2/28/2021 | $9.71 | 0.04 | 3.02 | 3.06 | (0.05) | (0.28) | (0.33) |
| Year Ended 2/29/2020 | $10.29 | 0.07 | (0.32) | (0.25) | (0.07) | (0.26) | (0.33) |
| Year Ended 2/28/2019 | $13.22 | 0.04 | 0.18 | 0.22 | (0.04) | (3.11) | (3.15) |
| Year Ended 2/28/2018 | $15.14 | 0.09 | 0.80 | 0.89 | (0.10) | (2.71) | (2.81) |
| Notes to Financial Highlights |
| (a) | In addition to the fees and expenses that the Fund bears directly, the Fund indirectly bears a pro rata share of the fees and expenses of any other funds in which it invests. Such indirect expenses are not included in the Fund’s reported expense ratios. |
| (b) | Total net expenses include the impact of certain fee waivers/expense reimbursements made by the Investment Manager and certain of its affiliates, if applicable. |
| (c) | The benefits derived from expense reductions had an impact of less than 0.01%. |
The accompanying Notes to Financial Statements are an integral part of this statement.
| 18 | Columbia Select Mid Cap Value Fund | Annual Report 2022 |
Financial Highlights (continued)
| | Net
asset
value,
end of
period | Total
return | Total gross
expense
ratio to
average
net assets(a) | Total net
expense
ratio to
average
net assets(a),(b) | Net investment
income (loss)
ratio to
average
net assets | Portfolio
turnover | Net
assets,
end of
period
(000’s) |
| Class R |
| Year Ended 2/28/2022 | $13.46 | 17.79% | 1.38% | 1.38%(c) | 0.10% | 37% | $27,787 |
| Year Ended 2/28/2021 | $12.44 | 32.90% | 1.44% | 1.40%(c) | 0.39% | 44% | $28,271 |
| Year Ended 2/29/2020 | $9.71 | (2.72%) | 1.46% | 1.41%(c) | 0.66% | 28% | $23,646 |
| Year Ended 2/28/2019 | $10.29 | 3.34% | 1.45% | 1.42%(c) | 0.32% | 79% | $31,097 |
| Year Ended 2/28/2018 | $13.22 | 5.71% | 1.43% | 1.42%(c) | 0.61% | 59% | $41,290 |
The accompanying Notes to Financial Statements are an integral part of this statement.
Columbia Select Mid Cap Value Fund | Annual Report 2022
| 19 |
Notes to Financial Statements
February 28, 2022
Note 1. Organization
Columbia Select Mid Cap Value Fund (the Fund), a series of Columbia Funds Series Trust (the Trust), is a diversified fund. The Trust is registered under the Investment Company Act of 1940, as amended (the 1940 Act), as an open-end management investment company organized as a Delaware statutory trust.
Fund shares
The Trust may issue an unlimited number of shares (without par value). The Fund offers each of the share classes listed in the Statement of Assets and Liabilities. Although all share classes generally have identical voting, dividend and liquidation rights, each share class votes separately when required by the Trust’s organizational documents or by law. Each share class has its own expense and sales charge structure. Different share classes may have different minimum initial investment amounts and pay different net investment income distribution amounts to the extent the expenses of distributing such share classes vary. Distributions to shareholders in a liquidation will be proportional to the net asset value of each share class.
As described in the Fund’s prospectus, Class A and Class C shares are offered to the general public for investment. Effective April 1, 2021, Class C shares automatically convert to Class A shares after 8 years. Prior to April 1, 2021, Class C shares automatically converted to Class A shares after 10 years. Advisor Class, Institutional Class, Institutional 2 Class, Institutional 3 Class and Class R shares are available for purchase through authorized investment professionals to omnibus retirement plans or to institutional investors and to certain other investors as also described in the Fund’s prospectus.
Note 2. Summary of significant accounting policies
Basis of preparation
The Fund is an investment company that applies the accounting and reporting guidance in the Financial Accounting Standards Board (FASB) Accounting Standards Codification Topic 946, Financial Services - Investment Companies (ASC 946). The financial statements are prepared in accordance with U.S. generally accepted accounting principles (GAAP), which requires management to make certain estimates and assumptions that affect the reported amounts of assets and liabilities, the disclosure of contingent assets and liabilities at the date of the financial statements and the reported amounts of income and expenses during the reporting period. Actual results could differ from those estimates.
The following is a summary of significant accounting policies followed by the Fund in the preparation of its financial statements.
Security valuation
Equity securities listed on an exchange are valued at the closing price or last trade price on their primary exchange at the close of business of the New York Stock Exchange. Securities with a closing price not readily available or not listed on any exchange are valued at the mean between the closing bid and ask prices. Listed preferred stocks convertible into common stocks are valued using an evaluated price from a pricing service.
Foreign equity securities are valued based on the closing price or last trade price on their primary exchange at the close of business of the New York Stock Exchange. If any foreign equity security closing prices are not readily available, the securities are valued at the mean of the latest quoted bid and ask prices on such exchanges or markets. Foreign currency exchange rates are determined at the scheduled closing time of the New York Stock Exchange. Many securities markets and exchanges outside the U.S. close prior to the close of the New York Stock Exchange; therefore, the closing prices for securities in such markets or on such exchanges may not fully reflect events that occur after such close but before the close of the New York Stock Exchange. In those situations, foreign securities will be fair valued pursuant to a policy adopted by the Board of Trustees. Under the policy, the Fund may utilize a third-party pricing service to determine these fair values. The third-party pricing service takes into account multiple factors, including, but not limited to, movements in the U.S. securities markets, certain depositary receipts, futures contracts and foreign exchange rates that have occurred subsequent to the close of the foreign exchange or market, to determine a good faith estimate that reasonably reflects the current market conditions as of the close of the New York Stock Exchange. The fair value of a security is likely to be different from the quoted or published price, if available.
| 20 | Columbia Select Mid Cap Value Fund | Annual Report 2022 |
Notes to Financial Statements (continued)
February 28, 2022
Investments in open-end investment companies (other than exchange-traded funds (ETFs)), are valued at the latest net asset value reported by those companies as of the valuation time.
Investments for which market quotations are not readily available, or that have quotations which management believes are not reflective of market value or reliable, are valued at fair value as determined in good faith under procedures approved by and under the general supervision of the Board of Trustees. If a security or class of securities (such as foreign securities) is valued at fair value, such value is likely to be different from the quoted or published price for the security, if available.
The determination of fair value often requires significant judgment. To determine fair value, management may use assumptions including but not limited to future cash flows and estimated risk premiums. Multiple inputs from various sources may be used to determine fair value.
GAAP requires disclosure regarding the inputs and valuation techniques used to measure fair value and any changes in valuation inputs or techniques. In addition, investments shall be disclosed by major category. This information is disclosed following the Fund’s Portfolio of Investments.
Security transactions
Security transactions are accounted for on the trade date. Cost is determined and gains (losses) are based upon the specific identification method for both financial statement and federal income tax purposes.
Income recognition
Corporate actions and dividend income are generally recorded net of any non-reclaimable tax withholdings, on the ex-dividend date or upon receipt of an ex-dividend notification in the case of certain foreign securities.
The Fund may receive distributions from holdings in equity securities, business development companies (BDCs), exchange-traded funds (ETFs), limited partnerships (LPs), other regulated investment companies (RICs), and real estate investment trusts (REITs), which report information as to the tax character of their distributions annually. These distributions are allocated to dividend income, capital gain and return of capital based on actual information reported. Return of capital is recorded as a reduction of the cost basis of securities held. If the Fund no longer owns the applicable securities, return of capital is recorded as a realized gain. With respect to REITs, to the extent actual information has not yet been reported, estimates for return of capital are made by Columbia Management Investment Advisers, LLC (the Investment Manager), a wholly-owned subsidiary of Ameriprise Financial, Inc. (Ameriprise Financial). The Investment Manager’s estimates are subsequently adjusted when the actual character of the distributions is disclosed by the REITs, which could result in a proportionate change in return of capital to shareholders.
Awards from class action litigation are recorded as a reduction of cost basis if the Fund still owns the applicable securities on the payment date. If the Fund no longer owns the applicable securities on the payment date, the proceeds are recorded as realized gains.
Expenses
General expenses of the Trust are allocated to the Fund and other funds of the Trust based upon relative net assets or other expense allocation methodologies determined by the nature of the expense. Expenses directly attributable to the Fund are charged to the Fund. Expenses directly attributable to a specific class of shares are charged to that share class.
Determination of class net asset value
All income, expenses (other than class-specific expenses, which are charged to that share class, as shown in the Statement of Operations) and realized and unrealized gains (losses) are allocated to each class of the Fund on a daily basis, based on the relative net assets of each class, for purposes of determining the net asset value of each class.
Columbia Select Mid Cap Value Fund | Annual Report 2022
| 21 |
Notes to Financial Statements (continued)
February 28, 2022
Federal income tax status
The Fund intends to qualify each year as a regulated investment company under Subchapter M of the Internal Revenue Code, as amended, and will distribute substantially all of its investment company taxable income and net capital gain, if any, for its tax year, and as such will not be subject to federal income taxes. In addition, the Fund intends to distribute in each calendar year substantially all of its ordinary income, capital gain net income and certain other amounts, if any, such that the Fund should not be subject to federal excise tax. Therefore, no federal income or excise tax provision is recorded.
Foreign taxes
The Fund may be subject to foreign taxes on income, gains on investments or currency repatriation, a portion of which may be recoverable. The Fund will accrue such taxes and recoveries, as applicable, based upon its current interpretation of tax rules and regulations that exist in the markets in which it invests.
Realized gains in certain countries may be subject to foreign taxes at the Fund level, based on statutory rates. The Fund accrues for such foreign taxes on realized and unrealized gains at the appropriate rate for each jurisdiction, as applicable. The amount, if any, is disclosed as a liability on the Statement of Assets and Liabilities.
Distributions to shareholders
Distributions from net investment income, if any, are declared and paid each calendar quarter. Net realized capital gains, if any, are distributed at least annually. Income distributions and capital gain distributions are determined in accordance with federal income tax regulations, which may differ from GAAP.
Guarantees and indemnifications
Under the Trust’s organizational documents and, in some cases, by contract, its officers and trustees are indemnified against certain liabilities arising out of the performance of their duties to the Trust or its funds. In addition, certain of the Fund’s contracts with its service providers contain general indemnification clauses. The Fund’s maximum exposure under these arrangements is unknown since the amount of any future claims that may be made against the Fund cannot be determined, and the Fund has no historical basis for predicting the likelihood of any such claims.
Note 3. Fees and other transactions with affiliates
Management services fees
The Fund has entered into a Management Agreement with Columbia Management Investment Advisers, LLC (the Investment Manager), a wholly-owned subsidiary of Ameriprise Financial, Inc. (Ameriprise Financial). Under the Management Agreement, the Investment Manager provides the Fund with investment research and advice, as well as administrative and accounting services. The management services fee is an annual fee that is equal to a percentage of the Fund’s daily net assets that declines from 0.82% to 0.65% as the Fund’s net assets increase. The effective management services fee rate for the year ended February 28, 2022 was 0.73% of the Fund’s average daily net assets.
Compensation of board members
Members of the Board of Trustees who are not officers or employees of the Investment Manager or Ameriprise Financial are compensated for their services to the Fund as disclosed in the Statement of Operations. Under a Deferred Compensation Plan (the Deferred Plan), these members of the Board of Trustees may elect to defer payment of up to 100% of their compensation. Deferred amounts are treated as though equivalent dollar amounts had been invested in shares of certain funds managed by the Investment Manager. The Fund’s liability for these amounts is adjusted for market value changes and remains in the Fund until distributed in accordance with the Deferred Plan. All amounts payable under the Deferred Plan constitute a general unsecured obligation of the Fund. The expense for the Deferred Plan, which includes Trustees’ fees deferred during the current period as well as any gains or losses on the Trustees’ deferred compensation balances as a result of market fluctuations, is included in "Compensation of board members" on the Statement of Operations.
| 22 | Columbia Select Mid Cap Value Fund | Annual Report 2022 |
Notes to Financial Statements (continued)
February 28, 2022
Compensation of Chief Compliance Officer
The Board of Trustees has appointed a Chief Compliance Officer for the Fund in accordance with federal securities regulations. As disclosed in the Statement of Operations, a portion of the Chief Compliance Officer’s total compensation is allocated to the Fund, along with other allocations to affiliated registered investment companies managed by the Investment Manager and its affiliates, based on relative net assets.
Transfer agency fees
Under a Transfer and Dividend Disbursing Agent Agreement, Columbia Management Investment Services Corp. (the Transfer Agent), an affiliate of the Investment Manager and a wholly-owned subsidiary of Ameriprise Financial, is responsible for providing transfer agency services to the Fund. The Transfer Agent has contracted with DST Asset Manager Solutions, Inc. (DST) to serve as sub-transfer agent. The Transfer Agent pays the fees of DST for services as sub-transfer agent and DST is not entitled to reimbursement for such fees from the Fund (with the exception of out-of-pocket fees).
The Fund pays the Transfer Agent a monthly transfer agency fee based on the number or the average value of accounts, depending on the type of account. In addition, the Fund pays the Transfer Agent a fee for shareholder services based on the number of accounts or on a percentage of the average aggregate value of the Fund’s shares maintained in omnibus accounts up to the lesser of the amount charged by the financial intermediary or a cap established by the Board of Trustees from time to time.
The Transfer Agent also receives compensation from the Fund for various shareholder services and reimbursements for certain out-of-pocket fees. Total transfer agency fees for Institutional 2 Class and Institutional 3 Class shares are subject to an annual limitation of not more than 0.07% and 0.02%, respectively, of the average daily net assets attributable to each share class. In addition, effective through June 30, 2023, Institutional 2 Class shares are subject to a contractual transfer agency fee annual limitation of not more than 0.04% and Institutional 3 Class shares are subject to a contractual transfer agency fee annual limitation of not more than 0.00% of the average daily net assets attributable to each share class.
For the year ended February 28, 2022, the Fund’s effective transfer agency fee rates as a percentage of average daily net assets of each class were as follows:
| | Effective rate (%) |
| Class A | 0.14 |
| Advisor Class | 0.14 |
| Class C | 0.14 |
| Institutional Class | 0.14 |
| Institutional 2 Class | 0.04 |
| Institutional 3 Class | 0.00 |
| Class R | 0.14 |
An annual minimum account balance fee of $20 may apply to certain accounts with a value below the applicable share class’s initial minimum investment requirements to reduce the impact of small accounts on transfer agency fees. These minimum account balance fees are remitted to the Fund and recorded as part of expense reductions in the Statement of Operations. For the year ended February 28, 2022, these minimum account balance fees reduced total expenses of the Fund by $2,700.
Distribution and service fees
The Fund has entered into an agreement with Columbia Management Investment Distributors, Inc. (the Distributor), an affiliate of the Investment Manager and a wholly-owned subsidiary of Ameriprise Financial, for distribution and shareholder services. The Board of Trustees has approved, and the Fund has adopted, distribution and shareholder service plans (the Plans) applicable to certain share classes, which set the distribution and service fees for the Fund. These fees are calculated daily and are intended to compensate the Distributor and/or eligible selling and/or servicing agents for selling shares of the Fund and providing services to investors.
Columbia Select Mid Cap Value Fund | Annual Report 2022
| 23 |
Notes to Financial Statements (continued)
February 28, 2022
Under the Plans, the Fund pays a monthly combined distribution and service fee to the Distributor at the maximum annual rate of 0.25% of the average daily net assets attributable to Class A shares of the Fund. Also under the Plans, the Fund pays a monthly service fee to the Distributor at the maximum annual rate of 0.25% of the average daily net assets attributable to Class C shares of the Fund and a monthly distribution fee to the Distributor at the maximum annual rates of 0.75% and 0.50% of the average daily net assets attributable to Class C and Class R shares of the Fund, respectively.
Sales charges (unaudited)
Sales charges, including front-end charges and contingent deferred sales charges (CDSCs), received by the Distributor for distributing Fund shares for the year ended February 28, 2022, if any, are listed below:
| | Front End (%) | CDSC (%) | Amount ($) |
| Class A | 5.75 | 0.50 - 1.00(a) | 335,149 |
| Class C | — | 1.00(b) | 1,632 |
| (a) | This charge is imposed on certain investments of between $1 million and $50 million redeemed within 18 months after purchase, as follows: 1.00% if redeemed within 12 months after purchase, and 0.50% if redeemed more than 12, but less than 18, months after purchase, with certain limited exceptions. |
| (b) | This charge applies to redemptions within 12 months after purchase, with certain limited exceptions. |
The Fund’s other share classes are not subject to sales charges.
Expenses waived/reimbursed by the Investment Manager and its affiliates
The Investment Manager and certain of its affiliates have contractually agreed to waive fees and/or reimburse expenses (excluding certain fees and expenses described below) for the period(s) disclosed below, unless sooner terminated at the sole discretion of the Board of Trustees, so that the Fund’s net operating expenses, after giving effect to fees waived/expenses reimbursed and any balance credits and/or overdraft charges from the Fund’s custodian, do not exceed the following annual rate(s) as a percentage of the classes’ average daily net assets:
| | January 22, 2022
through
June 30, 2024 | July 1, 2021
through
January 21, 2022 | Prior to
July 1, 2021 |
| Class A | 1.13% | 1.13% | 1.17% |
| Advisor Class | 0.88 | 0.88 | 0.92 |
| Class C | 1.88 | 1.88 | 1.92 |
| Institutional Class | 0.88 | 0.88 | 0.92 |
| Institutional 2 Class | 0.78 | 0.78 | 0.78 |
| Institutional 3 Class | 0.73 | 0.74 | 0.74 |
| Class R | 1.38 | 1.38 | 1.42 |
Under the agreement governing these fee waivers and/or expense reimbursement arrangements, the following fees and expenses are excluded from the waiver/reimbursement commitment, and therefore will be paid by the Fund, if applicable: taxes (including foreign transaction taxes), expenses associated with investments in affiliated and non-affiliated pooled investment vehicles (including mutual funds and exchange-traded funds), transaction costs and brokerage commissions, costs related to any securities lending program, dividend expenses associated with securities sold short, inverse floater program fees and expenses, transaction charges and interest on borrowed money, interest, costs associated with shareholder meetings, infrequent and/or unusual expenses and any other expenses the exclusion of which is specifically approved by the Board of Trustees. This agreement may be modified or amended only with approval from the Investment Manager, certain of its affiliates and the Fund. In addition to the contractual agreement, the Investment Manager and certain of its affiliates have voluntarily agreed to waive fees and/or reimburse Fund expenses (excluding certain fees and expenses described above) so that Fund level expenses (expenses directly attributable to the Fund and not to a specific share class) are waived proportionately across all share classes. This arrangement may be revised or discontinued at any time. Reflected in the contractual cap commitments, effective through June 30, 2023, is the Transfer Agent’s contractual agreement to limit total transfer agency fees to an annual rate of not more than 0.04% for Institutional 2 Class and 0.00% for Institutional 3 Class of the average daily net assets attributable to each share class, unless sooner terminated at the sole discretion of the Board of Trustees. Any fees waived and/or expenses reimbursed under the expense reimbursement arrangements described above are not recoverable by the Investment Manager or its affiliates in future periods.
| 24 | Columbia Select Mid Cap Value Fund | Annual Report 2022 |
Notes to Financial Statements (continued)
February 28, 2022
Note 4. Federal tax information
The timing and character of income and capital gain distributions are determined in accordance with income tax regulations, which may differ from GAAP because of temporary or permanent book to tax differences.
At February 28, 2022, these differences were primarily due to differing treatment for deferral/reversal of wash sale losses, trustees’ deferred compensation, and re-characterization of distributions for investments. To the extent these differences were permanent, reclassifications were made among the components of the Fund’s net assets. Temporary differences do not require reclassifications.
The following reclassifications were made:
Undistributed net
investment
income ($) | Accumulated
net realized
gain ($) | Paid in
capital ($) |
| (1,063,277) | 1,046,822 | 16,455 |
Net investment income (loss) and net realized gains (losses), as disclosed in the Statement of Operations, and net assets were not affected by this reclassification.
The tax character of distributions paid during the years indicated was as follows:
| Year Ended February 28, 2022 | Year Ended February 28, 2021 |
Ordinary
income ($) | Long-term
capital gains ($) | Total ($) | Ordinary
income ($) | Long-term
capital gains ($) | Total ($) |
| 74,416,479 | 159,092,743 | 233,509,222 | 14,349,286 | 38,633,218 | 52,982,504 |
Short-term capital gain distributions, if any, are considered ordinary income distributions for tax purposes.
At February 28, 2022, the components of distributable earnings on a tax basis were as follows:
Undistributed
ordinary income ($) | Undistributed
long-term
capital gains ($) | Capital loss
carryforwards ($) | Net unrealized
appreciation ($) |
| 7,911,222 | 88,690,071 | — | 853,802,986 |
At February 28, 2022, the cost of all investments for federal income tax purposes along with the aggregate gross unrealized appreciation and depreciation based on that cost was:
Federal
tax cost ($) | Gross unrealized
appreciation ($) | Gross unrealized
(depreciation) ($) | Net unrealized
appreciation ($) |
| 1,931,213,094 | 877,176,561 | (23,373,575) | 853,802,986 |
Tax cost of investments and unrealized appreciation/(depreciation) may also include timing differences that do not constitute adjustments to tax basis.
Management of the Fund has concluded that there are no significant uncertain tax positions in the Fund that would require recognition in the financial statements. However, management’s conclusion may be subject to review and adjustment at a later date based on factors including, but not limited to, new tax laws, regulations, and administrative interpretations (including relevant court decisions). Generally, the Fund’s federal tax returns for the prior three fiscal years remain subject to examination by the Internal Revenue Service.
Note 5. Portfolio information
The cost of purchases and proceeds from sales of securities, excluding short-term investments and derivatives, if any, aggregated to $944,809,011 and $1,027,321,895, respectively, for the year ended February 28, 2022. The amount of purchase and sale activity impacts the portfolio turnover rate reported in the Financial Highlights.
Columbia Select Mid Cap Value Fund | Annual Report 2022
| 25 |
Notes to Financial Statements (continued)
February 28, 2022
Note 6. Affiliated money market fund
The Fund invests in Columbia Short-Term Cash Fund, an affiliated money market fund established for the exclusive use by the Fund and other affiliated funds (the Affiliated MMF). The income earned by the Fund from such investments is included as Dividends - affiliated issuers in the Statement of Operations. As an investing fund, the Fund indirectly bears its proportionate share of the expenses of the Affiliated MMF. The Affiliated MMF prices its shares with a floating net asset value. In addition, the Board of Trustees of the Affiliated MMF may impose a fee on redemptions (sometimes referred to as a liquidity fee) or temporarily suspend redemptions (sometimes referred to as imposing a redemption gate) in the event its liquidity falls below regulatory limits.
Note 7. Interfund lending
Pursuant to an exemptive order granted by the Securities and Exchange Commission, the Fund participates in a program (the Interfund Program) allowing each participating Columbia Fund (each, a Participating Fund) to lend money directly to and, except for closed-end funds and money market funds, borrow money directly from other Participating Funds for temporary purposes. The amounts eligible for borrowing and lending under the Interfund Program are subject to certain restrictions.
Interfund loans are subject to the risk that the borrowing fund could be unable to repay the loan when due, and a delay in repayment to the lending fund could result in lost opportunities and/or additional lending costs. The exemptive order is subject to conditions intended to mitigate conflicts of interest arising from the Investment Manager’s relationship with each Participating Fund.
The Fund’s activity in the Interfund Program during the year ended February 28, 2022 was as follows:
| Borrower or lender | Average loan
balance ($) | Weighted average
interest rate (%) | Number of days
with outstanding loans |
| Lender | 7,300,000 | 0.65 | 7 |
Interest income earned by the Fund is recorded as Interfund lending in the Statement of Operations. The Fund had no outstanding interfund loans at February 28, 2022.
Note 8. Line of credit
The Fund has access to a revolving credit facility with a syndicate of banks led by JPMorgan Chase Bank, N.A., Citibank, N.A. and Wells Fargo Bank, N.A. whereby the Fund may borrow for the temporary funding of shareholder redemptions or for other temporary or emergency purposes. Pursuant to an October 28, 2021 amendment and restatement, the credit facility, which is an agreement between the Fund and certain other funds managed by the Investment Manager or an affiliated investment manager, severally and not jointly, permits aggregate borrowings up to $950 million. Interest is currently charged to each participating fund based on its borrowings at a rate equal to the higher of (i) the federal funds effective rate, (ii) the secured overnight financing rate plus 0.11448% and (iii) the overnight bank funding rate, plus in each case, 1.00%. Each borrowing under the credit facility matures no later than 60 days after the date of borrowing. The Fund also pays a commitment fee equal to its pro rata share of the unused amount of the credit facility at a rate of 0.15% per annum. The commitment fee is included in other expenses in the Statement of Operations. This agreement expires annually in October unless extended or renewed. Prior to the October 28, 2021 amendment and restatement, the Fund had access to a revolving credit facility with a syndicate of banks led by JPMorgan Chase Bank, N.A., Citibank, N.A. and Wells Fargo Bank, N.A. which permitted collective borrowings up to $950 million. Interest was charged to each participating fund based on its borrowings at a rate equal to the higher of (i) the federal funds effective rate, (ii) the one-month London Interbank Offered Rate (LIBOR) rate and (iii) the overnight bank funding rate, plus in each case, 1.25%.
The Fund had no borrowings during the year ended February 28, 2022.
| 26 | Columbia Select Mid Cap Value Fund | Annual Report 2022 |
Notes to Financial Statements (continued)
February 28, 2022
Note 9. Fund reorganization
At the close of business on January 21, 2022, the Fund acquired the assets and assumed the identified liabilities of BMO Mid-Cap Value Fund (the Acquired Fund), a series of BMO Funds Inc. The reorganization was completed after shareholders of the Acquired Fund approved a plan of reorganization at a shareholder meeting held on January 7, 2022. The purpose of the reorganization was to combine two funds with comparable investment objectives and strategies.
The aggregate net assets of the Fund immediately before the reorganization were $2,652,133,395 and the combined net assets immediately after the reorganization were $2,688,130,840.
The reorganization was accomplished by a tax-free exchange of 3,697,791 shares of the Acquired Fund valued at $35,997,445 (including $239,818 of unrealized appreciation/(depreciation)).
In exchange for the Acquired Fund’s shares, the Fund issued the following number of shares:
| | Shares |
| Class A | 2,451,935 |
| Advisor Class | 185,751 |
| Institutional 3 Class | 83,061 |
For financial reporting purposes, net assets received and shares issued by the Fund were recorded at fair value; however, the Acquired Fund’s cost of investments was carried forward.
The Fund’s financial statements reflect both the operations of the Fund for the period prior to the reorganization and the combined Fund for the period subsequent to the reorganization. Because the combined investment portfolios have been managed as a single integrated portfolio since the reorganization was completed, it is not practicable to separate the amounts of revenue and earnings of the Acquired Fund that have been included in the combined Fund’s Statement of Operations since the reorganization was completed.
Assuming the reorganization had been completed on March 1, 2021, the Fund’s pro-forma results of operations for the year ended February 28, 2022 would have been approximately:
| | ($) |
| Net investment income | 13,725,000 |
| Net realized gain | 296,199,000 |
| Net change in unrealized appreciation/(depreciation) | 129,758,000 |
| Net increase in net assets from operations | 439,682,000 |
Note 10. Fund reorganization
At the close of business on July 10, 2020, the Fund acquired the assets and assumed the identified liabilities of Columbia Small/Mid Cap Value Fund (the Acquired Fund), a series of Columbia Funds Series Trust II. The reorganization was completed after the Board of Trustees of the Acquired Fund approved a plan of reorganization at a meeting held in February 2020. The purpose of the transaction was to combine two funds managed by the Investment Manager with comparable investment objectives and strategies.
The aggregate net assets of the Fund immediately before the reorganization were $1,250,747,976 and the combined net assets immediately after the reorganization were $1,756,055,878.
The reorganization was accomplished by a tax-free exchange of 66,086,472 shares of the Acquired Fund valued at $505,307,902 (including $60,893,032 of unrealized appreciation/(depreciation)).
Columbia Select Mid Cap Value Fund | Annual Report 2022
| 27 |
Notes to Financial Statements (continued)
February 28, 2022
In exchange for the Acquired Fund’s shares, the Fund issued the following number of shares:
| | Shares |
| Class A | 39,170,046 |
| Advisor Class | 2,434,767 |
| Class C | 543,360 |
| Institutional Class | 5,608,529 |
| Institutional 2 Class | 1,608,162 |
| Institutional 3 Class | 8,691,673 |
| Class R | 303,824 |
For financial reporting purposes, net assets received and shares issued by the Fund were recorded at fair value; however, the Acquired Fund’s cost of investments was carried forward.
The Fund’s financial statements reflect both the operations of the Fund for the period prior to the reorganization and the combined Fund for the period subsequent to the reorganization. Because the combined investment portfolios have been managed as a single integrated portfolio since the reorganization was completed, it is not practicable to separate the amounts of revenue and earnings of the Acquired Fund that have been included in the combined Fund’s Statement of Operations since the reorganization was completed.
Assuming the reorganization had been completed on March 1, 2020, the Fund’s pro-forma results of operations for the year ended February 28, 2021 would have been approximately:
| | ($) |
| Net investment income | 14,586,000 |
| Net realized gain | 21,580,000 |
| Net change in unrealized appreciation/(depreciation) | 582,251,000 |
| Net increase in net assets from operations | 618,417,000 |
Note 11. Significant risks
Market risk
The Fund may incur losses due to declines in the value of one or more securities in which it invests. These declines may be due to factors affecting a particular issuer, or the result of, among other things, political, regulatory, market, economic or social developments affecting the relevant market(s) more generally. In addition, turbulence in financial markets and reduced liquidity in equity, credit and/or fixed income markets may negatively affect many issuers, which could adversely affect the Fund, including causing difficulty in assigning prices to hard-to-value assets in thinly traded and closed markets, significant redemptions and operational challenges. Global economies and financial markets are increasingly interconnected, and conditions and events in one country, region or financial market may adversely impact issuers in a different country, region or financial market. These risks may be magnified if certain events or developments adversely interrupt the global supply chain; in these and other circumstances, such risks might affect companies worldwide. As a result, local, regional or global events such as terrorism, war, natural disasters, disease/virus outbreaks and epidemics or other public health issues, recessions, depressions or other events – or the potential for such events – could have a significant negative impact on global economic and market conditions.
The large-scale invasion of Ukraine by Russia in February 2022 has resulted in sanctions and market disruptions, including declines in regional and global stock and commodity markets and significant devaluations of Russian currency. The extent and duration of the military action are impossible to predict but could be significant. Market disruption caused by the Russian military action, and any counter measures or responses thereto (including international sanctions, a downgrade in the country’s credit rating, purchasing and financing restrictions, boycotts, tariffs, changes in consumer or purchaser preferences, cyberattacks and espionage) could have a severe adverse impact on regional and/or global securities and commodities markets, including markets for oil and natural gas. These and other related events could have a negative impact on Fund performance and the value of an investment in the Fund.
| 28 | Columbia Select Mid Cap Value Fund | Annual Report 2022 |
Notes to Financial Statements (continued)
February 28, 2022
The pandemic caused by coronavirus disease 2019 and its variants (COVID-19) has resulted in, and may continue to result in, significant global economic and societal disruption and market volatility due to disruptions in market access, resource availability, facilities operations, imposition of tariffs, export controls and supply chain disruption, among others. Such disruptions may be caused, or exacerbated by, quarantines and travel restrictions, workforce displacement and loss in human and other resources. The uncertainty surrounding the magnitude, duration, reach, costs and effects of the global pandemic, as well as actions that have been or could be taken by governmental authorities or other third parties, present unknowns that are yet to unfold. The impacts, as well as the uncertainty over impacts to come, of COVID-19 – and any other infectious illness outbreaks, epidemics and pandemics that may arise in the future – could negatively affect global economies and markets in ways that cannot necessarily be foreseen. In addition, the impact of infectious illness outbreaks and epidemics in emerging market countries may be greater due to generally less established healthcare systems, governments and financial markets. Public health crises caused by the COVID-19 outbreak may exacerbate other pre-existing political, social and economic risks in certain countries or globally. The disruptions caused by COVID-19 could prevent the Fund from executing advantageous investment decisions in a timely manner and negatively impact the Fund’s ability to achieve its investment objectives. Any such event(s) could have a significant adverse impact on the value and risk profile of the Fund.
Shareholder concentration risk
At February 28, 2022, affiliated shareholders of record owned 21.0% of the outstanding shares of the Fund in one or more accounts. Subscription and redemption activity by concentrated accounts may have a significant effect on the operations of the Fund. In the case of a large redemption, the Fund may be forced to sell investments at inopportune times, including its liquid positions, which may result in Fund losses and the Fund holding a higher percentage of less liquid positions. Large redemptions could result in decreased economies of scale and increased operating expenses for non-redeeming Fund shareholders.
Small- and mid-cap company risk
Investments in small- and mid-capitalization companies (small- and mid-cap companies) often involve greater risks than investments in larger, more established companies (larger companies) because small- and mid-cap companies tend to have less predictable earnings and may lack the management experience, financial resources, product diversification and competitive strengths of larger companies. Securities of small- and mid-cap companies may be less liquid and more volatile than the securities of larger companies.
Note 12. Subsequent events
Management has evaluated the events and transactions that have occurred through the date the financial statements were issued and noted no items requiring adjustment of the financial statements or additional disclosure.
Note 13. Information regarding pending and settled legal proceedings
Ameriprise Financial and certain of its affiliates are involved in the normal course of business in legal proceedings which include regulatory inquiries, arbitration and litigation, including class actions concerning matters arising in connection with the conduct of its activities as a diversified financial services firm. Ameriprise Financial believes that the Fund is not currently the subject of, and that neither Ameriprise Financial nor any of its affiliates are the subject of, any pending legal, arbitration or regulatory proceedings that are likely to have a material adverse effect on the Fund or the ability of Ameriprise Financial or its affiliates to perform under their contracts with the Fund. Ameriprise Financial is required to make quarterly (10-Q), annual (10-K) and, as necessary, 8-K filings with the Securities and Exchange Commission (SEC) on legal and regulatory matters that relate to Ameriprise Financial and its affiliates. Copies of these filings may be obtained by accessing the SEC website at www.sec.gov.
There can be no assurance that these matters, or the adverse publicity associated with them, will not result in increased Fund redemptions, reduced sale of Fund shares or other adverse consequences to the Fund. Further, although we believe proceedings are not likely to have a material adverse effect on the Fund or the ability of Ameriprise Financial or its affiliates to perform under their contracts with the Fund, these proceedings are subject to uncertainties and, as such, we are unable to estimate the possible loss or range of loss that may result. An adverse outcome in one or more of these proceedings could
Columbia Select Mid Cap Value Fund | Annual Report 2022
| 29 |
Notes to Financial Statements (continued)
February 28, 2022
result in adverse judgments, settlements, fines, penalties or other relief that could have a material adverse effect on the consolidated financial condition or results of operations of Ameriprise Financial or one or more of its affiliates that provides services to the Fund.
| 30 | Columbia Select Mid Cap Value Fund | Annual Report 2022 |
Report of Independent Registered Public Accounting Firm
To the Board of Trustees of Columbia Funds Series Trust and Shareholders of Columbia Select Mid Cap Value Fund
Opinion on the Financial Statements
We have audited the accompanying statement of assets and liabilities, including the portfolio of investments, of Columbia Select Mid Cap Value Fund (one of the funds constituting Columbia Funds Series Trust, referred to hereafter as the "Fund") as of February 28, 2022, the related statement of operations for the year ended February 28, 2022, the statement of changes in net assets for each of the two years in the period ended February 28, 2022, including the related notes, and the financial highlights for each of the five years in the period ended February 28, 2022 (collectively referred to as the "financial statements"). In our opinion, the financial statements present fairly, in all material respects, the financial position of the Fund as of February 28, 2022, the results of its operations for the year then ended, the changes in its net assets for each of the two years in the period ended February 28, 2022 and the financial highlights for each of the five years in the period ended February 28, 2022 in conformity with accounting principles generally accepted in the United States of America.
Basis for Opinion
These financial statements are the responsibility of the Fund’s management. Our responsibility is to express an opinion on the Fund’s financial statements based on our audits. We are a public accounting firm registered with the Public Company Accounting Oversight Board (United States) (PCAOB) and are required to be independent with respect to the Fund in accordance with the U.S. federal securities laws and the applicable rules and regulations of the Securities and Exchange Commission and the PCAOB.
We conducted our audits of these financial statements in accordance with the standards of the PCAOB. Those standards require that we plan and perform the audit to obtain reasonable assurance about whether the financial statements are free of material misstatement, whether due to error or fraud.
Our audits included performing procedures to assess the risks of material misstatement of the financial statements, whether due to error or fraud, and performing procedures that respond to those risks. Such procedures included examining, on a test basis, evidence regarding the amounts and disclosures in the financial statements. Our audits also included evaluating the accounting principles used and significant estimates made by management, as well as evaluating the overall presentation of the financial statements. Our procedures included confirmation of securities owned as of February 28, 2022 by correspondence with the custodian and transfer agent. We believe that our audits provide a reasonable basis for our opinion.
/s/PricewaterhouseCoopers LLP
Minneapolis, Minnesota
April 21, 2022
We have served as the auditor of one or more investment companies within the Columbia Funds Complex since 1977.
Columbia Select Mid Cap Value Fund | Annual Report 2022
| 31 |
Federal Income Tax Information
(Unaudited)
The Fund hereby designates the following tax attributes for the fiscal year ended February 28, 2022. Shareholders will be notified in early 2023 of the amounts for use in preparing 2022 income tax returns.
Qualified
dividend
income | Dividends
received
deduction | Section
199A
dividends | Capital
gain
dividend |
| 58.82% | 54.41% | 6.10% | $257,433,767 |
Qualified dividend income. For taxable, non-corporate shareholders, the percentage of ordinary income distributed during the fiscal year that represents qualified dividend income subject to reduced tax rates.
Dividends received deduction. The percentage of ordinary income distributed during the fiscal year that qualifies for the corporate dividends received deduction.
Section 199A dividends. For taxable, non-corporate shareholders, the percentage of ordinary income distributed during the fiscal year that represents Section 199A dividends potentially eligible for a 20% deduction.
Capital gain dividend. The Fund designates as a capital gain dividend the amount reflected above, or if subsequently determined to be different, the net capital gain of such fiscal period.
TRUSTEES AND OFFICERS
The Board oversees the Fund’s operations and appoints officers who are responsible for day-to-day business decisions based on policies set by the Board. The following table provides basic biographical information about the Fund’s Trustees as of the printing of this report, including their principal occupations during the past five years, although specific titles for individuals may have varied over the period. The year set forth beneath Length of Service in the table below is the year in which the Trustee was first appointed or elected as Trustee to any Fund currently in the Columbia Funds Complex or a predecessor thereof. Under current Board policy, each Trustee generally serves until December 31 of the year such Trustee turns seventy-five (75).
Independent trustees
Name,
address,
year of birth | Position held
with the Columbia Funds and
length of service | Principal occupation(s)
during past five years
and other relevant
professional experience | Number of
Funds in the
Columbia Funds
Complex*
overseen | Other directorships
held by Trustee
during the past
five years |
George S. Batejan
c/o Columbia Management
Investment Advisers, LLC
290 Congress Street
Boston, MA 02210
1953 | Trustee since 2017 | Executive Vice President, Global Head of Technology and Operations, Janus Capital Group, Inc., 2010-2016 | 177 | Former Chairman of the Board, NICSA (National Investment Company Services Association) (Executive Committee, Nominating Committee and Governance Committee), 2014-2016; former Director, Intech Investment Management, 2011-2016; former Board Member, Metro Denver Chamber of Commerce, 2015-2016; former Advisory Board Member, University of Colorado Business School, 2015-2018 |
| 32 | Columbia Select Mid Cap Value Fund | Annual Report 2022 |
TRUSTEES AND OFFICERS (continued)
Independent trustees (continued)
Name,
address,
year of birth | Position held
with the Columbia Funds and
length of service | Principal occupation(s)
during past five years
and other relevant
professional experience | Number of
Funds in the
Columbia Funds
Complex*
overseen | Other directorships
held by Trustee
during the past
five years |
Kathleen Blatz
c/o Columbia Management
Investment Advisers, LLC
290 Congress Street
Boston, MA 02210
1954 | Trustee since 2006 | Attorney, specializing in arbitration and mediation; Chief Justice, Minnesota Supreme Court, 1998-2006; Associate Justice, Minnesota Supreme Court, 1996-1998; Fourth Judicial District Court Judge, Hennepin County, 1994-1996; Attorney in private practice and public service, 1984-1993; State Representative, Minnesota House of Representatives, 1979-1993, which included service on the Tax and Financial Institutions and Insurance Committees; Member and Interim Chair, Minnesota Sports Facilities Authority, January 2017-July 2017; Interim President and Chief Executive Officer, Blue Cross and Blue Shield of Minnesota (health care insurance), February-July 2018, April-October 2021 | 177 | Former Trustee, Blue Cross and Blue Shield of Minnesota, 2009-2021 (Chair of the Business Development Committee, 2014-2017; Chair of the Governance Committee, 2017-2019); former Member and Chair of the Board, Minnesota Sports Facilities Authority, January 2017-July 2017; former Director, Robina Foundation, 2009-2020 (Chair, 2014-2020); Director, Schulze Family Foundation, since 2021 |
Pamela G. Carlton
c/o Columbia Management
Investment Advisers, LLC
290 Congress Street
Boston, MA 02210
1954 | Trustee since 2007 | President, Springboard — Partners in Cross Cultural Leadership (consulting company) since 2003; Managing Director of US Equity Research, JP Morgan Chase, 1999-2003; Director of US Equity Research, Chase Asset Management, 1996-1999; Co-Director Latin America Research, 1993-1996, COO Global Research, 1992-1996, Co-Director of US Research, 1991-1992, Investment Banker, Morgan Stanley, 1982-1991, Morgan Stanley; Attorney, Cleary Gottlieb Steen & Hamilton LLP, 1980-1982 | 177 | Trustee, New York Presbyterian Hospital Board (Executive Committee and Chair of People Committee) since 1996; Director, DR Bank (Audit Committee) since 2017; Director, Evercore Inc. (Audit Committee) since 2019; Director, Apollo Commercial Real Estate Finance, Inc. since 2021; the Governing Council of the Independent Directors Council (IDC), since 2021 |
Janet Langford Carrig
c/o Columbia Management
Investment Advisers, LLC
290 Congress Street
Boston, MA 02210
1957 | Trustee since 1996 | Senior Vice President, General Counsel and Corporate Secretary, ConocoPhillips (independent energy company), September 2007-October 2018 | 175 | Director, EQT Corporation (natural gas producer) since 2019; Director, Whiting Petroleum Corporation (independent oil and gas company) since 2020 |
J. Kevin Connaughton
c/o Columbia Management
Investment Advisers, LLC
290 Congress Street
Boston, MA 02210
1964 | Trustee since 2020 | Member, FINRA National Adjudicatory Council since January 2020; Adjunct Professor of Finance, Bentley University since January 2018; Consultant to Independent Trustees of CFVIT and CFST I from March 2016 to June 2020 with respect to CFVIT and to December 2020 with respect to CFST I; Managing Director and General Manager of Mutual Fund Products, Columbia Management Investment Advisers, LLC, May 2010-February 2015; President, Columbia Funds, 2008-2015; and senior officer of Columbia Funds and affiliated funds, 2003-2015 | 175 | Former Director, The Autism Project, March 2015-December 2021; former Member of the Investment Committee, St. Michael’s College, November 2015-February 2020; former Trustee, St. Michael’s College, June 2017-September 2019; former Trustee, New Century Portfolios, January 2015-December 2017 |
Columbia Select Mid Cap Value Fund | Annual Report 2022
| 33 |
TRUSTEES AND OFFICERS (continued)
Independent trustees (continued)
Name,
address,
year of birth | Position held
with the Columbia Funds and
length of service | Principal occupation(s)
during past five years
and other relevant
professional experience | Number of
Funds in the
Columbia Funds
Complex*
overseen | Other directorships
held by Trustee
during the past
five years |
Olive M. Darragh
c/o Columbia Management
Investment Advisers, LLC
290 Congress Street
Boston, MA 02210
1962 | Trustee since 2020 | Managing Director of Darragh Inc. (strategy and talent management consulting firm) since 2010; Founder and CEO, Zolio, Inc. (investment management talent identification platform) since 2004; Consultant to Independent Trustees of CFVIT and CFST I from June 2019 to June 2020 with respect to CFVIT and to December 2020 with respect to CFST I; Partner, Tudor Investments, 2004-2010; Senior Partner, McKinsey & Company (consulting), 1990-2004; Touche Ross CPA, 1985-1988 | 175 | Former Director, University of Edinburgh Business School (Member of US Board); former Director, Boston Public Library Foundation |
Patricia M. Flynn
c/o Columbia Management
Investment Advisers, LLC
290 Congress Street
Boston, MA 02210
1950 | Trustee since 2004 | Trustee Professor of Economics and Management, Bentley University since 1976 (also teaches and conducts research on corporate governance); Dean, McCallum Graduate School of Business, Bentley University, 1992-2002 | 177 | Trustee, MA Taxpayers Foundation since 1997; Board of Governors, Innovation Institute, MA Technology Collaborative, 2010-2020; former Board of Directors, The MA Business Roundtable, 2003-2019 |
Brian J. Gallagher
c/o Columbia Management
Investment Advisers, LLC
290 Congress Street
Boston, MA 02210
1954 | Trustee since 2017 | Retired; Partner with Deloitte & Touche LLP and its predecessors, 1977-2016 | 177 | Trustee, Catholic Schools Foundation since 2004 |
Douglas A. Hacker
c/o Columbia Management
Investment Advisers, LLC
290 Congress Street
Boston, MA 02210
1955 | Co-Chair since 2021; Chair of CFST I and CFVIT since 2014; Trustee of CFST I and CFVIT since 1996 and CFST, CFST II, CFVST II, CET I and CET II since 2021 | Independent business executive since May 2006; Executive Vice President – Strategy of United Airlines, December 2002 - May 2006; President of UAL Loyalty Services (airline marketing company), September 2001-December 2002; Executive Vice President and Chief Financial Officer of United Airlines, July 1999-September 2001 | 177 | Director, Spartan Nash Company (food distributor); Director, Aircastle Limited (Chair of Audit Committee) (aircraft leasing); former Director, Nash Finch Company (food distributor), 2005-2013; former Director, SeaCube Container Leasing Ltd. (container leasing), 2010-2013; and former Director, Travelport Worldwide Limited (travel information technology), 2014-2019 |
Nancy T. Lukitsh
c/o Columbia Management
Investment Advisers, LLC
290 Congress Street
Boston, MA 02210
1956 | Trustee since 2011 | Senior Vice President, Partner and Director of Marketing, Wellington Management Company, LLP (investment adviser), 1997-2010; Chair, Wellington Management Portfolios (commingled non-U.S. investment pools), 2007 -2010; Director, Wellington Trust Company, NA and other Wellington affiliates, 1997-2010 | 175 | None |
| 34 | Columbia Select Mid Cap Value Fund | Annual Report 2022 |
TRUSTEES AND OFFICERS (continued)
Independent trustees (continued)
Name,
address,
year of birth | Position held
with the Columbia Funds and
length of service | Principal occupation(s)
during past five years
and other relevant
professional experience | Number of
Funds in the
Columbia Funds
Complex*
overseen | Other directorships
held by Trustee
during the past
five years |
David M. Moffett
c/o Columbia Management
Investment Advisers, LLC
290 Congress Street
Boston, MA 02210
1952 | Trustee since 2011 | Retired; Consultant to Bridgewater and Associates | 175 | Director, CSX Corporation (transportation suppliers); Director, Genworth Financial, Inc. (financial and insurance products and services); Director, PayPal Holdings Inc. (payment and data processing services); Trustee, University of Oklahoma Foundation; former Director, eBay Inc. (online trading community), 2007-2015; and former Director, CIT Bank, CIT Group Inc. (commercial and consumer finance), 2010-2016 |
Catherine James Paglia
c/o Columbia Management
Investment Advisers, LLC
290 Congress Street
Boston, MA 02210
1952 | Co-Chair since 2021; Chair of CFST, CFST II, CFVST II, CET I and CET II since 2020; Trustee of CFST, CFST II and CFVST II since 2004 and CFST I and CFVIT since 2021 | Director, Enterprise Asset Management, Inc. (private real estate and asset management company) since September 1998; Managing Director and Partner, Interlaken Capital, Inc., 1989-1997; Vice President, 1982-1985, Principal, 1985-1987, Managing Director, 1987-1989, Morgan Stanley; Vice President, Investment Banking, 1980-1982, Associate, Investment Banking, 1976-1980, Dean Witter Reynolds, Inc. | 177 | Director, Valmont Industries, Inc. (irrigation systems manufacturer) since 2012; Trustee, Carleton College (on the Investment Committee); Trustee, Carnegie Endowment for International Peace (on the Investment Committee) |
Minor M. Shaw
c/o Columbia Management
Investment Advisers, LLC
290 Congress Street
Boston, MA 02210
1947 | Trustee since 2003 | President, Micco LLC (private investments) since 2011; President, Micco Corp. (family investment business), 1998-2011 | 177 | Director, Blue Cross Blue Shield of South Carolina (Chair of Compensation Committee) since April 2008; Trustee, Hollingsworth Funds (on the Investment Committee) since 2016 (previously Board Chair from 2016-2019); Former Advisory Board member, Duke Energy Corp., 2016-2020; Chair of the Duke Endowment; Chair of Greenville – Spartanburg Airport Commission; former Trustee, BofA Funds Series Trust (11 funds), 2003-2011; former Director, Piedmont Natural Gas, 2004-2016; former Director, National Association of Corporate Directors, Carolinas Chapter, 2013-2018; Chair, Daniel-Mickel Foundation since 1998 |
Columbia Select Mid Cap Value Fund | Annual Report 2022
| 35 |
TRUSTEES AND OFFICERS (continued)
Independent trustees (continued)
Name,
address,
year of birth | Position held
with the Columbia Funds and
length of service | Principal occupation(s)
during past five years
and other relevant
professional experience | Number of
Funds in the
Columbia Funds
Complex*
overseen | Other directorships
held by Trustee
during the past
five years |
Natalie A. Trunow
c/o Columbia Management
Investment Advisers, LLC
290 Congress Street
Boston, MA 02210
1967 | Trustee since 2020 | Chief Executive Officer, Millennial Portfolio Solutions LLC (asset management and consulting services), January 2016-January 2021; Non-executive Member of the Investment Committee and Valuation Committee, Sarona Asset Management Inc. (private equity firm) since September 2019; Advisor, Horizon Investments (asset management and consulting services), August 2018-January 2021; Advisor, Paradigm Asset Management, November 2016-December 2021; Consultant to Independent Trustees of CFVIT and CFST I from September 2016 to June 2020 with respect to CFVIT and to December 2020 with respect to CFST I; Director of Investments/Consultant, Casey Family Programs, April 2016-November 2016; Senior Vice President and Chief Investment Officer, Calvert Investments, August 2008-January 2016; Section Head and Portfolio Manager, General Motors Asset Management, June 1997-August 2008 | 175 | Former Director, Investment Committee, Health Services for Children with Special Needs, Inc., 2012-2019; Director, Chair of Audit Committee, Consumer Credit Counseling Services (formerly Guidewell Financial Solutions), since 2019; Independent Director, Investment Committee and Valuation Committee, Sarona Asset Management, since 2019 |
Sandra Yeager
c/o Columbia Management
Investment Advisers, LLC
290 Congress Street
Boston, MA 02210
1964 | Trustee since 2017 | Retired; President and founder, Hanoverian Capital, LLC (SEC registered investment advisor firm), 2008-2016; Managing Director, DuPont Capital, 2006-2008; Managing Director, Morgan Stanley Investment Management, 2004-2006; Senior Vice President, Alliance Bernstein, 1990-2004 | 177 | Former Director, NAPE Education Foundation, October 2016-October 2020 |
| * | The term “Columbia Funds Complex” as used herein includes Columbia Seligman Premium Technology Growth Fund, Tri-Continental Corporation and each series of Columbia Fund Series Trust (CFST), Columbia Funds Series Trust I (CFST I), Columbia Funds Series Trust II (CFST II), Columbia ETF Trust I (CET I), Columbia ETF Trust II (CET II), Columbia Funds Variable Insurance Trust (CFVIT) and Columbia Funds Variable Series Trust II (CFVST II). Messrs. Batejan, Beckman, Gallagher and Hacker and Mses. Blatz, Carlton, Flynn, Paglia, Shaw and Yeager serve as Directors of Columbia Seligman Premium Technology Growth Fund and Tri-Continental Corporation. |
Interested trustee affiliated with Investment Manager*
Name,
address,
year of birth | Position held with the Columbia Funds and length of service | Principal occupation(s) during the
past five years and other relevant
professional experience | Number of
Funds in the
Columbia Funds
Complex overseen | Other directorships
held by Trustee
during the past
five years |
Daniel J. Beckman
c/o Columbia Management
Investment Advisers, LLC
290 Congress Street
Boston, MA 02210
1962 | Trustee since November 2021 and President since June 2021 | Vice President – Head of North America Product, Columbia Management Investment Advisers, LLC since April 2015; President and Principal Executive Officer of the Columbia Funds since June 2021; officer of Columbia Funds and affiliated funds, 2020-2021 | 177 | Director, Ameriprise Trust Company, since October 2016; Director, Columbia Management Investment Distributors, Inc. since November 2018; Board of Governors, Columbia Wanger Asset Management, LLC since January 2022 |
| * | Interested person (as defined under the 1940 Act) by reason of being an officer, director, security holder and/or employee of the Investment Manager or Ameriprise Financial. |
The Statement of Additional Information has additional information about the Fund’s Board members and is available, without charge, upon request by calling 800.345.6611, visiting columbiathreadneedleus.com/investor/ or contacting your financial intermediary.
| 36 | Columbia Select Mid Cap Value Fund | Annual Report 2022 |
TRUSTEES AND OFFICERS (continued)
The Board has appointed officers who are responsible for day-to-day business decisions based on policies it has established. The officers serve at the pleasure of the Board. The following table provides basic information about the Officers of the Fund as of the printing of this report, including principal occupations during the past five years, although their specific titles may have varied over the period. In addition to Mr. Beckman, who is President and Principal Executive Officer, the Fund’s other officers are:
Fund officers
Name,
address and
year of birth | Position and year
first appointed to
position for any Fund
in the Columbia
Funds Complex or a
predecessor thereof | Principal occupation(s) during past five years |
Michael G. Clarke
290 Congress Street
Boston, MA 02210
1969 | Chief Financial Officer and Principal Financial Officer (2009) and Senior Vice President (2019) | Senior Vice President and Head of Global Operations & Investor Services, Columbia Management Investment Advisers, LLC, since March 2022 (previously Vice President, Head of North American Operations, and Co-Head of Global Operations, June 2019 to February 2022 and Vice President – Accounting and Tax, May 2010 - May 2019); senior officer of Columbia Funds and affiliated funds since 2002. |
Joseph Beranek
5890 Ameriprise
Financial Center
Minneapolis, MN 55474
1965 | Treasurer and Chief Accounting Officer (Principal Accounting Officer) (2019) and Principal Financial Officer (2020), CFST, CFST I, CFST II, CFVIT and CFVST II; Assistant Treasurer, CET I and CET II | Vice President – Mutual Fund Accounting and Financial Reporting, Columbia Management Investment Advisers, LLC, since December 2018 and March 2017, respectively (previously Vice President – Pricing and Corporate Actions, May 2010 - March 2017). |
Marybeth Pilat
290 Congress Street
Boston, MA 02210
1968 | Treasurer and Chief Accounting Officer (Principal Accounting Officer) and Principal Financial Officer (2020) for CET I and CET II; Assistant Treasurer, CFST, CFST I, CFST II, CFVIT and CFVST II | Vice President – Product Pricing and Administration, Columbia Management Investment Advisers, LLC, since May 2017; Director - Fund Administration, Calvert Investments, August 2015 – March 2017; Vice President - Fund Administration, Legg Mason, May 2015 - July 2015; Vice President - Fund Administration, Columbia Management Investment Advisers, LLC, May 2010 - April 2015. |
William F. Truscott
290 Congress Street
Boston, MA 02210
1960 | Senior Vice President (2001) | Formerly, Trustee/Director of Columbia Funds Complex or legacy funds, November 2001-January 1, 2021; Chief Executive Officer, Global Asset Management, Ameriprise Financial, Inc. since September 2012; Chairman of the Board and President, Columbia Management Investment Advisers, LLC since July 2004 and February 2012, respectively; Chairman of the Board and Chief Executive Officer, Columbia Management Investment Distributors, Inc. since November 2008 and February 2012, respectively; Chairman of the Board and Director, Threadneedle Asset Management Holdings, Sàrl since March 2013 and December 2008, respectively; senior executive of various entities affiliated with Columbia Threadneedle. |
Christopher O. Petersen
5228 Ameriprise Financial Center
Minneapolis, MN 55474
1970 | Senior Vice President and Assistant Secretary | Formerly, Trustee/Director of funds within the Columbia Funds Complex, July 1, 2020 - November 22, 2021; Senior Vice President and Assistant General Counsel, Ameriprise Financial, Inc. since September 2021 (previously Vice President and Lead Chief Counsel, January 2015 - September 2021); President and Principal Executive Officer of the Columbia Funds, 2015 - 2021; officer of Columbia Funds and affiliated funds since 2007. |
Thomas P. McGuire
290 Congress Street
Boston, MA 02210
1972 | Senior Vice President and Chief Compliance Officer (2012) | Vice President – Asset Management Compliance, Ameriprise Financial, Inc., since May 2010; Chief Compliance Officer, Columbia Acorn/Wanger Funds since December 2015; Chief Compliance Officer, Ameriprise Certificate Company, September 2010 – September 2020. |
Ryan C. Larrenaga
290 Congress Street
Boston, MA 02210
1970 | Senior Vice President (2017), Chief Legal Officer (2017), and Secretary (2015) | Vice President and Chief Counsel, Ameriprise Financial, Inc. since August 2018 (previously Vice President and Group Counsel, August 2011 - August 2018); Chief Legal Officer, Columbia Acorn/Wanger Funds, since September 2020; officer of Columbia Funds and affiliated funds since 2005. |
Columbia Select Mid Cap Value Fund | Annual Report 2022
| 37 |
TRUSTEES AND OFFICERS (continued)
Fund officers (continued)
Name,
address and
year of birth | Position and year
first appointed to
position for any Fund
in the Columbia
Funds Complex or a
predecessor thereof | Principal occupation(s) during past five years |
Michael E. DeFao
290 Congress Street
Boston, MA 02210
1968 | Vice President (2011) and Assistant Secretary (2010) | Vice President and Chief Counsel, Ameriprise Financial, Inc. since May 2010; Vice President, Chief Legal Officer and Assistant Secretary, Columbia Management Investment Advisers, LLC since October 2021 (previously Vice President and Assistant Secretary, May 2010 – September 2021). |
Lyn Kephart-Strong
5228 Ameriprise
Financial Center
Minneapolis, MN 55474
1960 | Vice President (2015) | President, Columbia Management Investment Services Corp. since October 2014; Vice President & Resolution Officer, Ameriprise Trust Company since August 2009. |
| 38 | Columbia Select Mid Cap Value Fund | Annual Report 2022 |
[THIS PAGE INTENTIONALLY LEFT BLANK]
Columbia Select Mid Cap Value Fund
P.O. Box 219104
Kansas City, MO 64121-9104
Please read and consider the investment objectives, risks, charges and expenses for any fund carefully before investing. For a prospectus and summary prospectus, which contains this and other important information about the Fund, go to
columbiathreadneedleus.com/investor/. The Fund is distributed by Columbia Management Investment Distributors, Inc., member FINRA, and managed by Columbia Management Investment Advisers, LLC.
Columbia Threadneedle Investments (Columbia Threadneedle) is the global brand name of the Columbia and Threadneedle group of companies. All rights reserved.
© 2022 Columbia Management Investment Advisers, LLC.
columbiathreadneedleus.com/investor/

Annual Report
February 28, 2022
Columbia Small Cap Index Fund
Not Federally Insured • No Financial Institution Guarantee • May Lose Value
If you elect to receive the shareholder report for Columbia Small Cap Index Fund (the Fund) in paper, mailed to you, the Fund mails one shareholder report to each shareholder address, unless such shareholder elects to receive shareholder reports from the Fund electronically via e-mail or by having a paper notice mailed to you (Postcard Notice) that your Fund’s shareholder report is available at the Columbia funds’ website (columbiathreadneedleus.com/investor/). If you would like more than one report in paper to be mailed to you, or would like to elect to receive reports via e-mail or access them through Postcard Notice, please call shareholder services at 800.345.6611 and additional reports will be sent to you.
Proxy voting policies and procedures
The policy of the Board of Trustees is to vote the proxies of the companies in which the Fund holds investments consistent with the procedures as stated in the Statement of Additional Information (SAI). You may obtain a copy of the SAI without charge by calling 800.345.6611; contacting your financial intermediary; visiting columbiathreadneedleus.com/investor/; or searching the website of the Securities and Exchange Commission (SEC) at sec.gov. Information regarding how the Fund voted proxies relating to portfolio securities is filed with the SEC by August 31st for the most recent 12-month period ending June 30th of that year, and is available without charge by visiting columbiathreadneedleus.com/investor/, or searching the website of the SEC at sec.gov.
Quarterly schedule of investments
The Fund files a complete schedule of portfolio holdings with the SEC for the first and third quarters of each fiscal year on Form N-PORT. The Fund’s Form N-PORT filings are available on the SEC’s website at sec.gov. The Fund’s complete schedule of portfolio holdings, as filed on Form N-PORT, can also be obtained without charge, upon request, by calling 800.345.6611.
Additional Fund information
For more information about the Fund, please visit columbiathreadneedleus.com/investor/ or call 800.345.6611. Customer Service Representatives are available to answer your questions Monday through Friday from 8 a.m. to 7 p.m. Eastern time.
Fund investment manager
Columbia Management Investment Advisers, LLC (the Investment Manager)
290 Congress Street
Boston, MA 02210
Fund distributor
Columbia Management Investment Distributors, Inc.
290 Congress Street
Boston, MA 02210
Fund transfer agent
Columbia Management Investment Services Corp.
P.O. Box 219104
Kansas City, MO 64121-9104
Columbia Small Cap Index Fund | Annual Report 2022
Investment objective
The Fund seeks total return before fees and expenses that corresponds to the total return of the Standard & Poor’s (S&P) SmallCap 600® Index.
Portfolio management
Christopher Lo, CFA
Lead Portfolio Manager
Managed Fund since 2014
Kaiyu Zhao
Portfolio Manager
Managed Fund since 2020
Christopher Rowe
Portfolio Manager
Managed Fund since 2020
Morningstar style boxTM
The Morningstar Style Box is based on a fund’s portfolio holdings. For equity funds, the vertical axis shows the market capitalization of the stocks owned, and the horizontal axis shows investment style (value, blend, or growth). Information shown is based on the most recent data provided by Morningstar.
© 2022 Morningstar, Inc. All rights reserved. The Morningstar information contained herein: (1) is proprietary to Morningstar and/or its content providers; (2) may not be copied or distributed; and (3) is not warranted to be accurate, complete or timely. Neither Morningstar nor its content providers are responsible for any damages or losses arising from any use of this information.
| Average annual total returns (%) (for the period ended February 28, 2022) |
| | | Inception | 1 Year | 5 Years | 10 Years |
| Class A | 10/15/96 | 3.62 | 10.29 | 12.32 |
| Institutional Class | 10/15/96 | 3.92 | 10.57 | 12.60 |
| Institutional 2 Class* | 11/08/12 | 3.92 | 10.57 | 12.59 |
| Institutional 3 Class* | 03/01/17 | 3.93 | 10.58 | 12.47 |
| S&P SmallCap 600 Index | | 4.22 | 10.78 | 12.84 |
All results shown assume reinvestment of distributions during the period. Returns do not reflect the deduction of taxes that a shareholder may pay on Fund distributions or on the redemption of Fund shares. Performance results reflect the effect of any fee waivers or reimbursements of Fund expenses by Columbia Management Investment Advisers, LLC and/or any of its affiliates. Absent these fee waivers or expense reimbursement arrangements, performance results would have been lower.
The performance information shown represents past performance and is not a guarantee of future results. The investment return and principal value of your investment will fluctuate so that your shares, when redeemed, may be worth more or less than their original cost. Current performance may be lower or higher than the performance information shown. You may obtain performance information current to the most recent month-end by contacting your financial intermediary, visiting columbiathreadneedleus.com/investor/ or calling 800.345.6611.
| * | The returns shown for periods prior to the share class inception date (including returns for the Life of the Fund, if shown, which are since Fund inception) include the returns of the Fund’s oldest share class. Since the Fund launched more than one share class at its inception, Class A shares were used. These returns are adjusted to reflect any higher class-related operating expenses of the newer share classes, as applicable. Please visit columbiathreadneedleus.com/investor/investment-products/mutual-funds/appended-performance for more information. |
The S&P SmallCap 600 Index tracks the performance of 600 domestic companies traded on major stock exchanges. The S&P SmallCap 600 Index is heavily weighted with the stocks of companies with small market capitalizations.
Indices are not available for investment, are not professionally managed and do not reflect sales charges, fees, brokerage commissions, taxes or other expenses of investing. Securities in the Fund may not match those in an index.
Fund performance may be significantly negatively impacted by the economic impact of the COVID-19 pandemic. The COVID-19 pandemic has adversely impacted economies and capital markets around the world in ways that will likely continue and may change in unforeseen ways for an indeterminate period. The COVID-19 pandemic may exacerbate pre-existing political, social and economic risks in certain countries and globally.
Columbia Small Cap Index Fund | Annual Report 2022
| 3 |
Fund at a Glance (continued)
Performance of a hypothetical $10,000 investment (February 29, 2012 — February 28, 2022)
The chart above shows the change in value of a hypothetical $10,000 investment in Class A shares of Columbia Small Cap Index Fund during the stated time period, and does not reflect the deduction of taxes that a shareholder may pay on Fund distributions or on the redemption of Fund shares.
| Portfolio breakdown (%) (at February 28, 2022) |
| Common Stocks | 98.1 |
| Exchange-Traded Equity Funds | 1.2 |
| Money Market Funds | 0.7 |
| Total | 100.0 |
Percentages indicated are based upon total investments excluding investments in derivatives, if any. The Fund’s portfolio composition is subject to change.
| Equity sector breakdown (%) (at February 28, 2022) |
| Communication Services | 1.8 |
| Consumer Discretionary | 11.9 |
| Consumer Staples | 4.8 |
| Energy | 5.8 |
| Financials | 18.9 |
| Health Care | 11.7 |
| Industrials | 16.6 |
| Information Technology | 13.0 |
| Materials | 5.5 |
| Real Estate | 8.1 |
| Utilities | 1.9 |
| Total | 100.0 |
Percentages indicated are based upon total equity investments. The Fund’s portfolio composition is subject to change.
| 4 | Columbia Small Cap Index Fund | Annual Report 2022 |
Manager Discussion of Fund Performance
For the 12-month period that ended February 28, 2022, Class A shares of the Fund returned 3.62%. The Fund closely tracked its benchmark, the unmanaged S&P Small Cap 600 Index, which returned 4.22% for the same period. Mutual funds, unlike unmanaged indices, incur operating expenses.
Market overview
COVID-19 vaccinations allowed for greater economic reopening during the annual period. In turn, the U.S. equity market, as measured by the S&P 500 Index, achieved double-digit gains. Mid-cap and small-cap stocks also rose, albeit more modestly. Still, volatility remained heightened throughout the period.
As the annual period began in March 2021, U.S. equities produced healthy gains, boosted by both the passage of a fiscal stimulus package and by investor confidence that the U.S. Federal Reserve (Fed) would maintain its highly accommodative monetary policy. Stocks were then well supported during the second quarter of 2021 by a combination of strong economic growth, gradual rollbacks of COVID-19 lockdowns and robust corporate earnings. Although concerns about rising inflation led to a brief stretch of volatility mid-way through the quarter, the Fed reassured the markets that monetary policy would remain accommodative for an extended period. As a result, most major U.S. equity indices finished June 2021 at or near their then-all-time highs.
U.S. equities posted mixed results in the third quarter, reflecting an increasingly challenging environment. The market performed reasonably well in July and August, during which the prospects of improving economic growth and rising corporate profits outweighed concerns about the COVID-19 Delta variant. The backdrop became less favorable in September, however, fueling a downturn that erased almost all of the advance of the prior two months. The markets were contending with a persistent increase in inflation, worsening supply-chain bottlenecks, instability in China’s property market and the Fed indicating it was likely to announce a tapering of its quantitative easing program before year end. In the fourth quarter, U.S. equities displayed remarkable resilience despite potential headwinds. Investors faced the emergence of the COVID-19 Omicron variant, contagious enough to raise concerns about a possible new wave of lockdowns. Also, the Fed had previously viewed rising inflation as “transitory,” but continued price pressures drove the central bank to announce the tapering of its stimulative quantitative easing program and to prepare the financial markets for the likelihood of multiple interest rate increases in 2022. Still, the S&P 500 Index finished the calendar year with a solid gain on the strength of robust investment inflows and the lack of compelling total return potential in bonds.
U.S. equities fell in January and February 2022. In January, the S&P 500 Index experienced its worst month since the COVID-19-induced sell-off of March 2020. Hawkish commentary from the Fed was perhaps the most significant driver of the market’s decline. Heightened inflation concerns also weighed on investor sentiment, more than offsetting the positive news that the Omicron variant appeared to be milder than previous COVID-19 variants. In February, Russia’s invasion of Ukraine, stunning in its magnitude, rattled equity markets, while inflation and shifting Fed policy remained overhangs. Notably, the growing sense that COVID-19 is transitioning from pandemic to endemic in the U.S. supported U.S. small-cap stocks, which significantly outpaced their large-cap peers in a reversal of the recent performance trend.
For the annual period overall, large-cap stocks within the U.S. equity market performed best, followed by mid-cap stocks and then small-cap stocks, each generating a positive total return. From a style perspective, there was a sharp reversal from the prior annual period, as value-oriented stocks significantly outperformed growth-oriented stocks across the capitalization spectrum of the U.S. equity market for the 12 months ended February 28, 2022. Seven of the eleven sectors of the S&P Small Cap 600 Index posted a positive return during the 12 months ended February 28, 2022.
The Fund’s notable detractors during the period
| • | Health care was by far the weakest sector from a total return perspective, followed at some distance by consumer discretionary and information technology. |
| • | On the basis of impact, health care, information technology and consumer discretionary were the weakest sectors. |
| • | The worst performing industries for the annual period on the basis of total return were life sciences tools and services; technology hardware, storage and peripherals; interactive media and services; diversified consumer services; and airlines. |
Columbia Small Cap Index Fund | Annual Report 2022
| 5 |
Manager Discussion of Fund Performance (continued)
| • | Top individual detractors were cancer-focused testing laboratories operator NeoGenomics, Inc.; conversational commerce software provider LivePerson, Inc.; technology and service company for the energy, water and smart city space industries Itron, Inc.; 3D printer manufacturer 3D Systems Corp.; and e-commerce-driven digital manufacturer of custom prototypes and on-demand production parts Proto Labs, Inc. |
The Fund’s notable contributors during the period
| • | In terms of total return, the energy sector was the best relative performer, followed at some distance by the utilities and real estate sectors. |
| • | On the basis of impact, which takes weightings and total returns into account, the energy, financials and real estate sectors were the biggest contributors to the Index’s return. |
| • | The top performing industries for the annual period on the basis of total return were oil, gas and consumable fuels; marine; industrial conglomerates; trading companies and distributors; and air freight and logistics. |
| • | Top individual contributors within the S&P Small Cap 600 Index during the annual period included oil and gas exploration, development and acquisition company Range Resources Corp.; oil and gas exploration and production companies Matador Resources Co. and SM Energy Co.; department store retailer Macy’s Inc.; and Internet-based postage solutions provider Stamps.com, Inc. The Fund’s position in Macy’s Inc. was eliminated during the period. |
| • | Surpassing industrials, which had been the largest sector by weighting in the S&P Small Cap 600 Index during the prior annual period, financials was the largest sector by weighting in the S&P Small Cap 600 Index as of February 28, 2022, with a weighting of 18.95%. |
| • | As always, each sector and stock in the S&P Small Cap 600 Index was represented in the Fund with approximately the same weighting as in the Index and therefore had a similar effect. |
Market risk may affect a single issuer, sector of the economy, industry or the market as a whole. Investments in small-cap companies involve risks and volatility greater than investments in larger, more established companies. The Fund’s net value will generally decline when the performance of its targeted index declines. Investing in derivatives is a specialized activity that involves special risks, which may result in significant losses. The Fund may invest significantly in issuers within a particular sector, which may be negatively affected by market, economic or other conditions, making the Fund more vulnerable to unfavorable developments in the sector. See the Fund’s prospectus for more information on these and other risks.
The views expressed in this report reflect the current views of the respective parties who have contributed to this report. These views are not guarantees of future performance and involve certain risks, uncertainties and assumptions that are difficult to predict, so actual outcomes and results may differ significantly from the views expressed. These views are subject to change at any time based upon economic, market or other conditions and the respective parties disclaim any responsibility to update such views. These views may not be relied on as investment advice and, because investment decisions for a Columbia fund are based on numerous factors, may not be relied on as an indication of trading intent on behalf of any particular Columbia fund. References to specific securities should not be construed as a recommendation or investment advice.
| 6 | Columbia Small Cap Index Fund | Annual Report 2022 |
Understanding Your Fund’s Expenses
(Unaudited)
As an investor, you incur two types of costs. There are shareholder transaction costs, which may include redemption fees. There are also ongoing fund costs, which generally include management fees, distribution and/or service fees, and other fund expenses. The following information is intended to help you understand your ongoing costs (in dollars) of investing in the Fund and to help you compare these costs with the ongoing costs of investing in other mutual funds.
Analyzing your Fund’s expenses
To illustrate these ongoing costs, we have provided examples and calculated the expenses paid by investors in each share class of the Fund during the period. The actual and hypothetical information in the table is based on an initial investment of $1,000 at the beginning of the period indicated and held for the entire period. Expense information is calculated two ways and each method provides you with different information. The amount listed in the “Actual” column is calculated using the Fund’s actual operating expenses and total return for the period. You may use the Actual information, together with the amount invested, to estimate the expenses that you paid over the period. Simply divide your account value by $1,000 (for example, an $8,600 account value divided by $1,000 = 8.6), then multiply the results by the expenses paid during the period under the “Actual” column. The amount listed in the “Hypothetical” column assumes a 5% annual rate of return before expenses (which is not the Fund’s actual return) and then applies the Fund’s actual expense ratio for the period to the hypothetical return. You should not use the hypothetical account values and expenses to estimate either your actual account balance at the end of the period or the expenses you paid during the period. See “Compare with other funds” below for details on how to use the hypothetical data.
Compare with other funds
Since all mutual funds are required to include the same hypothetical calculations about expenses in shareholder reports, you can use this information to compare the ongoing cost of investing in the Fund with other funds. To do so, compare the hypothetical example with the 5% hypothetical examples that appear in the shareholder reports of other funds. As you compare hypothetical examples of other funds, it is important to note that hypothetical examples are meant to highlight the ongoing costs of investing in a fund only and do not reflect any transaction costs, such as redemption or exchange fees. Therefore, the hypothetical calculations are useful in comparing ongoing costs only, and will not help you determine the relative total costs of owning different funds. If transaction costs were included in these calculations, your costs would be higher.
| September 1, 2021 — February 28, 2022 |
| | Account value at the
beginning of the
period ($) | Account value at the
end of the
period ($) | Expenses paid during
the period ($) | Fund’s annualized
expense ratio (%) |
| | Actual | Hypothetical | Actual | Hypothetical | Actual | Hypothetical | Actual |
| Class A | 1,000.00 | 1,000.00 | 966.20 | 1,022.56 | 2.19 | 2.26 | 0.45 |
| Institutional Class | 1,000.00 | 1,000.00 | 967.60 | 1,023.80 | 0.98 | 1.00 | 0.20 |
| Institutional 2 Class | 1,000.00 | 1,000.00 | 967.40 | 1,023.80 | 0.98 | 1.00 | 0.20 |
| Institutional 3 Class | 1,000.00 | 1,000.00 | 967.60 | 1,023.80 | 0.98 | 1.00 | 0.20 |
Expenses paid during the period are equal to the annualized expense ratio for each class as indicated above, multiplied by the average account value over the period and then multiplied by the number of days in the Fund’s most recent fiscal half year and divided by 365.
Expenses do not include fees and expenses incurred indirectly by the Fund from its investment in underlying funds, including affiliated and non-affiliated pooled investment vehicles, such as mutual funds and exchange-traded funds.
Had Columbia Management Investment Advisers, LLC and/or certain of its affiliates not waived/reimbursed certain fees and expenses, account value at the end of the period would have been reduced.
Columbia Small Cap Index Fund | Annual Report 2022
| 7 |
Portfolio of Investments
February 28, 2022
(Percentages represent value of investments compared to net assets)
Investments in securities
| Common Stocks 98.1% |
| Issuer | Shares | Value ($) |
| Communication Services 1.7% |
| Diversified Telecommunication Services 0.3% |
| ATN International, Inc. | 44,044 | 1,467,987 |
| Cogent Communications Holdings, Inc. | 171,156 | 10,851,290 |
| Consolidated Communications Holdings, Inc.(a) | 290,802 | 2,070,510 |
| Total | | 14,389,787 |
| Entertainment 0.2% |
| Cinemark Holdings, Inc.(a) | 429,473 | 7,532,957 |
| Marcus Corp. (The)(a) | 88,180 | 1,603,112 |
| Total | | 9,136,069 |
| Interactive Media & Services 0.2% |
| Cars.com, Inc.(a) | 262,023 | 4,239,532 |
| QuinStreet, Inc.(a) | 201,300 | 2,264,625 |
| Total | | 6,504,157 |
| Media 0.7% |
| AMC Networks, Inc., Class A(a) | 117,908 | 4,887,287 |
| EW Scripps Co. (The), Class A(a) | 230,654 | 5,134,358 |
| Gannett Co, Inc.(a) | 574,130 | 2,847,685 |
| Loyalty Ventures, Inc.(a) | 80,379 | 1,929,096 |
| Scholastic Corp. | 122,876 | 5,170,622 |
| TechTarget, Inc.(a) | 104,630 | 8,200,899 |
| Thryv Holdings, Inc.(a) | 68,507 | 2,082,613 |
| Total | | 30,252,560 |
| Wireless Telecommunication Services 0.3% |
| Shenandoah Telecommunications Co. | 201,552 | 4,504,687 |
| Telephone and Data Systems, Inc. | 398,510 | 6,914,149 |
| Total | | 11,418,836 |
| Total Communication Services | 71,701,409 |
| Consumer Discretionary 11.6% |
| Auto Components 1.4% |
| American Axle & Manufacturing Holdings, Inc.(a) | 460,106 | 4,260,582 |
| Cooper-Standard Holding, Inc.(a) | 68,539 | 871,816 |
| Dorman Products, Inc.(a) | 114,810 | 10,725,550 |
| Gentherm, Inc.(a) | 134,041 | 11,372,038 |
| LCI Industries | 101,948 | 12,694,565 |
| Motorcar Parts of America, Inc.(a) | 77,470 | 1,251,141 |
| Common Stocks (continued) |
| Issuer | Shares | Value ($) |
| Patrick Industries, Inc. | 90,654 | 6,467,256 |
| Standard Motor Products, Inc. | 77,204 | 3,374,587 |
| XPEL, Inc.(a) | 67,131 | 4,873,711 |
| Total | | 55,891,246 |
| Automobiles 0.2% |
| Winnebago Industries, Inc. | 134,973 | 8,647,720 |
| Diversified Consumer Services 0.4% |
| Adtalem Global Education, Inc.(a) | 200,745 | 4,171,481 |
| American Public Education, Inc.(a) | 75,469 | 1,506,361 |
| Perdoceo Education Corp.(a) | 282,797 | 2,960,885 |
| Strategic Education, Inc. | 91,294 | 5,388,172 |
| WW International, Inc.(a) | 214,665 | 2,187,436 |
| Total | | 16,214,335 |
| Hotels, Restaurants & Leisure 1.7% |
| BJ’s Restaurants, Inc.(a) | 94,005 | 3,014,740 |
| Bloomin’ Brands, Inc.(a) | 327,616 | 8,062,630 |
| Brinker International, Inc.(a) | 183,210 | 7,793,753 |
| Cheesecake Factory, Inc. (The)(a) | 195,711 | 8,374,474 |
| Chuy’s Holdings, Inc.(a) | 79,878 | 2,604,023 |
| Dave & Buster’s Entertainment, Inc.(a) | 155,726 | 6,749,165 |
| Dine Brands Global, Inc. | 69,451 | 5,822,772 |
| El Pollo Loco Holdings, Inc.(a) | 78,165 | 1,037,250 |
| Fiesta Restaurant Group, Inc.(a) | 69,117 | 696,008 |
| Jack in the Box, Inc. | 87,260 | 7,527,920 |
| Monarch Casino & Resort, Inc.(a) | 52,905 | 4,121,300 |
| Red Robin Gourmet Burgers, Inc.(a) | 63,396 | 1,112,600 |
| Ruth’s Hospitality Group, Inc. | 128,008 | 3,175,878 |
| Shake Shack, Inc., Class A(a) | 157,885 | 11,797,167 |
| Total | | 71,889,680 |
| Household Durables 2.1% |
| Cavco Industries, Inc.(a) | 34,427 | 9,385,833 |
| Century Communities, Inc. | 119,845 | 7,636,523 |
| Ethan Allen Interiors, Inc. | 88,649 | 2,310,193 |
| Installed Building Products, Inc. | 94,669 | 9,154,492 |
| iRobot Corp.(a) | 108,745 | 6,759,589 |
| La-Z-Boy, Inc. | 178,793 | 5,217,180 |
The accompanying Notes to Financial Statements are an integral part of this statement.
| 8 | Columbia Small Cap Index Fund | Annual Report 2022 |
Portfolio of Investments (continued)
February 28, 2022
| Common Stocks (continued) |
| Issuer | Shares | Value ($) |
| LGI Homes, Inc.(a) | 86,164 | 10,867,865 |
| M/I Homes, Inc.(a) | 117,385 | 5,785,907 |
| MDC Holdings, Inc. | 228,087 | 10,113,378 |
| Meritage Homes Corp.(a) | 150,507 | 14,836,980 |
| Tupperware Brands Corp.(a) | 197,175 | 3,594,500 |
| Universal Electronics, Inc.(a) | 52,852 | 1,756,272 |
| Total | | 87,418,712 |
| Internet & Direct Marketing Retail 0.3% |
| Liquidity Services, Inc.(a) | 107,220 | 1,847,401 |
| PetMed Express, Inc. | 84,481 | 2,276,763 |
| Shutterstock, Inc. | 94,357 | 8,542,139 |
| Total | | 12,666,303 |
| Leisure Products 0.3% |
| Sturm Ruger & Co., Inc. | 70,984 | 5,139,951 |
| Vista Outdoor, Inc.(a) | 231,124 | 8,424,470 |
| Total | | 13,564,421 |
| Multiline Retail 0.1% |
| Big Lots, Inc. | 131,326 | 4,564,892 |
| Specialty Retail 3.9% |
| Aaron’s Co., Inc. (The) | 126,998 | 2,665,688 |
| Abercrombie & Fitch Co., Class A(a) | 238,328 | 9,075,530 |
| America’s Car-Mart, Inc.(a) | 24,523 | 2,358,622 |
| Asbury Automotive Group, Inc.(a) | 93,327 | 18,115,704 |
| Barnes & Noble Education, Inc.(a) | 145,666 | 798,250 |
| Bed Bath & Beyond, Inc.(a),(b) | 407,661 | 6,885,394 |
| Boot Barn Holdings, Inc.(a) | 119,438 | 10,393,495 |
| Buckle, Inc. (The) | 118,482 | 4,265,352 |
| Caleres, Inc. | 154,368 | 3,204,680 |
| Cato Corp. (The), Class A | 78,783 | 1,386,581 |
| Chico’s FAS, Inc.(a) | 494,010 | 2,321,847 |
| Children’s Place, Inc. (The)(a) | 56,413 | 3,551,762 |
| Conn’s, Inc.(a) | 77,305 | 1,417,774 |
| Designer Brands, Inc.(a) | 247,481 | 3,229,627 |
| Genesco, Inc.(a) | 57,291 | 3,675,218 |
| Group 1 Automotive, Inc. | 73,017 | 13,283,983 |
| Guess?, Inc. | 157,216 | 3,443,030 |
| Haverty Furniture Companies, Inc. | 60,019 | 1,705,140 |
| Hibbett, Inc. | 60,715 | 2,737,032 |
| Common Stocks (continued) |
| Issuer | Shares | Value ($) |
| LL Flooring Holdings, Inc.(a) | 117,337 | 1,884,432 |
| MarineMax, Inc.(a) | 87,716 | 4,013,884 |
| Monro, Inc. | 135,300 | 6,315,804 |
| ODP Corp. (The)(a) | 185,154 | 8,146,776 |
| Rent-A-Center, Inc. | 243,969 | 6,931,159 |
| Sally Beauty Holdings, Inc.(a) | 455,959 | 7,878,972 |
| Shoe Carnival, Inc. | 70,623 | 2,059,367 |
| Signet Jewelers Ltd. | 214,024 | 15,088,692 |
| Sleep Number Corp.(a) | 91,355 | 6,002,023 |
| Sonic Automotive, Inc., Class A | 83,701 | 4,495,581 |
| Zumiez, Inc.(a) | 86,282 | 3,838,686 |
| Total | | 161,170,085 |
| Textiles, Apparel & Luxury Goods 1.2% |
| Fossil Group, Inc.(a) | 191,418 | 2,587,971 |
| G-III Apparel Group Ltd.(a) | 176,317 | 4,891,034 |
| Kontoor Brands, Inc. | 191,903 | 9,506,875 |
| Movado Group, Inc. | 66,583 | 2,624,702 |
| Oxford Industries, Inc. | 64,063 | 5,662,528 |
| Steven Madden Ltd. | 308,628 | 13,166,070 |
| Unifi, Inc.(a) | 56,057 | 1,052,190 |
| Vera Bradley, Inc.(a) | 102,927 | 778,128 |
| Wolverine World Wide, Inc. | 332,265 | 7,652,063 |
| Total | | 47,921,561 |
| Total Consumer Discretionary | 479,948,955 |
| Consumer Staples 4.7% |
| Beverages 0.7% |
| Celsius Holdings, Inc.(a) | 153,914 | 9,833,566 |
| Coca-Cola Bottling Co. Consolidated | 18,724 | 9,304,517 |
| MGP Ingredients, Inc. | 50,502 | 4,020,464 |
| National Beverage Corp. | 94,110 | 4,141,781 |
| Total | | 27,300,328 |
| Food & Staples Retailing 0.7% |
| Andersons, Inc. (The) | 124,872 | 5,694,163 |
| PriceSmart, Inc. | 97,048 | 7,057,331 |
| SpartanNash Co. | 144,993 | 4,080,103 |
| The Chefs’ Warehouse(a) | 131,424 | 4,317,278 |
| United Natural Foods, Inc.(a) | 227,308 | 9,144,601 |
| Total | | 30,293,476 |
The accompanying Notes to Financial Statements are an integral part of this statement.
Columbia Small Cap Index Fund | Annual Report 2022
| 9 |
Portfolio of Investments (continued)
February 28, 2022
| Common Stocks (continued) |
| Issuer | Shares | Value ($) |
| Food Products 1.7% |
| B&G Foods, Inc. | 261,785 | 7,748,836 |
| Calavo Growers, Inc. | 71,331 | 3,045,120 |
| Cal-Maine Foods, Inc. | 151,062 | 6,687,515 |
| Fresh Del Monte Produce, Inc. | 134,253 | 3,474,468 |
| Hostess Brands, Inc.(a) | 558,916 | 12,039,051 |
| J&J Snack Foods Corp. | 59,983 | 9,820,417 |
| John B. Sanfilippo & Son, Inc. | 35,788 | 2,845,862 |
| Seneca Foods Corp., Class A(a) | 25,304 | 1,258,874 |
| Simply Good Foods Co. (The)(a) | 340,194 | 13,481,888 |
| Tootsie Roll Industries, Inc. | 69,810 | 2,356,087 |
| TreeHouse Foods, Inc.(a) | 225,025 | 8,832,231 |
| Total | | 71,590,349 |
| Household Products 0.5% |
| Central Garden & Pet Co.(a) | 39,326 | 1,861,693 |
| Central Garden & Pet Co., Class A(a) | 162,009 | 7,134,876 |
| WD-40 Co. | 55,300 | 11,717,517 |
| Total | | 20,714,086 |
| Personal Products 0.8% |
| Edgewell Personal Care Co. | 219,292 | 7,824,338 |
| elf Beauty, Inc.(a) | 193,113 | 5,103,977 |
| Inter Parfums, Inc. | 71,686 | 6,658,196 |
| Medifast, Inc. | 46,857 | 8,715,402 |
| Usana Health Sciences, Inc.(a) | 47,104 | 4,145,623 |
| Total | | 32,447,536 |
| Tobacco 0.3% |
| Universal Corp. | 99,261 | 5,371,013 |
| Vector Group Ltd. | 527,891 | 5,917,658 |
| Total | | 11,288,671 |
| Total Consumer Staples | 193,634,446 |
| Energy 5.7% |
| Energy Equipment & Services 1.8% |
| Archrock, Inc. | 540,631 | 4,514,269 |
| Bristow Group, Inc.(a) | 93,494 | 3,098,391 |
| Core Laboratories NV | 186,727 | 5,146,196 |
| DMC Global Inc(a) | 75,534 | 2,220,700 |
| Dril-Quip, Inc.(a) | 142,742 | 4,116,679 |
| Helix Energy Solutions Group, Inc.(a) | 572,144 | 2,317,183 |
| Common Stocks (continued) |
| Issuer | Shares | Value ($) |
| Helmerich & Payne, Inc. | 435,249 | 15,769,071 |
| Nabors Industries Ltd.(a) | 31,248 | 3,922,874 |
| Oceaneering International, Inc.(a) | 402,575 | 5,893,698 |
| Oil States International, Inc.(a) | 247,582 | 1,294,854 |
| Patterson-UTI Energy, Inc. | 867,731 | 12,521,358 |
| ProPetro Holding Corp.(a) | 341,927 | 4,366,408 |
| RPC, Inc.(a) | 287,167 | 2,518,455 |
| US Silica Holdings, Inc.(a) | 300,809 | 4,349,698 |
| Total | | 72,049,834 |
| Oil, Gas & Consumable Fuels 3.9% |
| Callon Petroleum Co.(a) | 191,497 | 10,792,771 |
| Civitas Resources, Inc. | 290,740 | 14,673,648 |
| CONSOL Energy, Inc.(a) | 127,960 | 3,933,490 |
| Dorian LPG Ltd. | 111,724 | 1,539,557 |
| Green Plains, Inc.(a) | 216,198 | 7,078,323 |
| Laredo Petroleum, Inc.(a) | 57,844 | 4,428,537 |
| Matador Resources Co. | 444,917 | 22,067,883 |
| Par Pacific Holdings, Inc.(a) | 184,529 | 2,509,594 |
| PBF Energy, Inc., Class A(a) | 383,193 | 6,368,668 |
| Range Resources Corp.(a) | 1,007,625 | 23,124,994 |
| Ranger Oil Corp.(a) | 85,066 | 2,871,828 |
| Renewable Energy Group, Inc.(a) | 202,786 | 12,471,339 |
| REX American Resources Corp.(a) | 21,196 | 2,002,174 |
| SM Energy Co. | 490,008 | 17,400,184 |
| Southwestern Energy Co.(a) | 4,094,274 | 20,430,427 |
| Talos Energy, Inc.(a) | 165,148 | 2,594,475 |
| World Fuel Services Corp. | 254,819 | 7,221,570 |
| Total | | 161,509,462 |
| Total Energy | 233,559,296 |
| Financials 18.6% |
| Banks 10.6% |
| Allegiance Bancshares, Inc. | 75,971 | 3,255,357 |
| Ameris Bancorp | 266,853 | 13,209,224 |
| Banc of California, Inc. | 218,218 | 4,287,984 |
| BancFirst Corp. | 76,207 | 5,954,053 |
| Bancorp, Inc. (The)(a) | 229,849 | 6,734,576 |
| BankUnited, Inc. | 359,380 | 15,884,596 |
| Banner Corp. | 138,168 | 8,512,531 |
| Berkshire Hills Bancorp, Inc. | 196,283 | 6,104,401 |
The accompanying Notes to Financial Statements are an integral part of this statement.
| 10 | Columbia Small Cap Index Fund | Annual Report 2022 |
Portfolio of Investments (continued)
February 28, 2022
| Common Stocks (continued) |
| Issuer | Shares | Value ($) |
| Brookline Bancorp, Inc. | 313,188 | 5,368,042 |
| Central Pacific Financial Corp. | 112,815 | 3,293,070 |
| City Holding Co. | 60,984 | 4,858,595 |
| Columbia Banking System, Inc. | 313,583 | 11,486,545 |
| Community Bank System, Inc. | 217,550 | 15,868,097 |
| Customers Bancorp, Inc.(a) | 120,286 | 7,403,603 |
| CVB Financial Corp. | 513,875 | 12,117,173 |
| Dime Community Bancshares, Inc. | 133,812 | 4,548,270 |
| Eagle Bancorp, Inc. | 128,870 | 7,721,890 |
| FB Financial Corp. | 144,347 | 6,414,781 |
| First BanCorp | 829,542 | 11,713,133 |
| First BanCorp | 139,278 | 6,250,797 |
| First Commonwealth Financial Corp. | 382,942 | 6,184,513 |
| First Financial Bancorp | 378,174 | 9,295,517 |
| First Hawaiian, Inc. | 519,637 | 15,105,848 |
| Hanmi Financial Corp. | 122,661 | 3,203,905 |
| Heritage Financial Corp. | 141,859 | 3,719,543 |
| Hilltop Holdings, Inc. | 245,258 | 7,583,377 |
| HomeStreet, Inc. | 82,492 | 4,245,038 |
| Hope Bancorp, Inc. | 484,869 | 8,223,378 |
| Independent Bank Corp. | 191,661 | 16,484,763 |
| Independent Bank Group, Inc. | 148,950 | 11,491,493 |
| Investors Bancorp, Inc. | 909,428 | 15,223,825 |
| Lakeland Financial Corp. | 102,052 | 8,185,591 |
| Meta Financial Group, Inc. | 127,752 | 7,076,183 |
| National Bank Holdings Corp., Class A | 122,218 | 5,424,035 |
| NBT Bancorp, Inc. | 174,868 | 6,709,685 |
| Northwest Bancshares, Inc. | 510,537 | 7,188,361 |
| OFG Bancorp | 201,076 | 5,666,322 |
| Pacific Premier Bancorp, Inc. | 380,614 | 14,733,568 |
| Park National Corp. | 58,232 | 7,806,582 |
| Preferred Bank | 55,303 | 4,340,179 |
| Renasant Corp. | 224,875 | 8,210,186 |
| S&T Bancorp, Inc. | 158,732 | 4,934,978 |
| Seacoast Banking Corp. of Florida | 235,371 | 8,626,347 |
| ServisFirst Bancshares, Inc. | 196,811 | 17,197,345 |
| Simmons First National Corp., Class A | 463,208 | 13,210,692 |
| Southside Bancshares, Inc. | 130,197 | 5,427,913 |
| Tompkins Financial Corp. | 47,897 | 3,788,653 |
| Common Stocks (continued) |
| Issuer | Shares | Value ($) |
| Triumph Bancorp, Inc.(a) | 95,266 | 9,557,085 |
| Trustmark Corp. | 251,914 | 7,932,772 |
| United Community Banks, Inc. | 422,164 | 16,320,860 |
| Veritex Holdings, Inc. | 198,853 | 8,079,397 |
| Westamerica BanCorp | 108,374 | 6,428,746 |
| Total | | 438,593,398 |
| Capital Markets 0.9% |
| B Riley Financial, Inc. | 64,504 | 3,841,213 |
| Blucora, Inc.(a) | 196,525 | 3,910,848 |
| BrightSphere Investment Group, Inc. | 144,606 | 3,451,745 |
| Donnelley Financial Solutions, Inc.(a) | 117,654 | 3,776,693 |
| Greenhill & Co., Inc. | 55,952 | 989,231 |
| Piper Sandler Companies | 56,938 | 8,427,393 |
| StoneX Group, Inc.(a) | 67,948 | 5,126,677 |
| Virtus Investment Partners, Inc. | 28,772 | 6,923,119 |
| WisdomTree Investments, Inc. | 439,084 | 2,472,043 |
| Total | | 38,918,962 |
| Consumer Finance 0.9% |
| Encore Capital Group, Inc.(a) | 100,027 | 6,600,782 |
| Enova International, Inc.(a) | 146,917 | 5,989,806 |
| Ezcorp, Inc., Class A(a) | 214,141 | 1,282,705 |
| Green Dot Corp., Class A(a) | 220,583 | 6,319,703 |
| LendingTree, Inc.(a) | 46,261 | 5,598,044 |
| PRA Group, Inc.(a) | 175,929 | 7,851,711 |
| World Acceptance Corp.(a) | 17,024 | 3,344,705 |
| Total | | 36,987,456 |
| Insurance 3.0% |
| Ambac Financial Group, Inc.(a) | 186,784 | 2,396,439 |
| American Equity Investment Life Holding Co. | 332,137 | 12,518,244 |
| AMERISAFE, Inc. | 78,112 | 3,679,075 |
| Assured Guaranty Ltd. | 281,587 | 17,449,946 |
| eHealth, Inc.(a) | 95,801 | 1,488,748 |
| Employers Holdings, Inc. | 112,803 | 4,383,525 |
| Genworth Financial, Inc., Class A(a) | 2,046,721 | 8,309,687 |
| HCI Group, Inc. | 32,254 | 2,008,134 |
| Horace Mann Educators Corp. | 167,357 | 6,960,378 |
| James River Group Holdings Ltd. | 150,426 | 4,001,332 |
| Mr. Cooper Group, Inc.(a) | 303,035 | 15,403,269 |
The accompanying Notes to Financial Statements are an integral part of this statement.
Columbia Small Cap Index Fund | Annual Report 2022
| 11 |
Portfolio of Investments (continued)
February 28, 2022
| Common Stocks (continued) |
| Issuer | Shares | Value ($) |
| Palomar Holdings, Inc.(a) | 97,394 | 6,275,095 |
| ProAssurance Corp. | 217,764 | 5,248,112 |
| Safety Insurance Group, Inc. | 57,413 | 4,790,541 |
| Selectquote, Inc.(a) | 502,651 | 1,563,245 |
| SiriusPoint Ltd.(a) | 352,742 | 2,606,763 |
| Stewart Information Services Corp. | 108,474 | 7,363,215 |
| Trupanion, Inc.(a) | 138,413 | 12,405,957 |
| United Fire Group, Inc. | 87,009 | 2,402,318 |
| Universal Insurance Holdings, Inc. | 113,154 | 1,308,060 |
| Total | | 122,562,083 |
| Mortgage Real Estate Investment Trusts (REITS) 1.3% |
| Apollo Commercial Real Estate Finance, Inc. | 530,453 | 6,922,412 |
| ARMOUR Residential REIT, Inc. | 361,792 | 2,941,369 |
| Ellington Financial, Inc. | 220,073 | 3,888,690 |
| Franklin BSP Realty Trust, Inc. | 177,292 | 2,340,254 |
| Granite Point Mortgage Trust, Inc. | 216,977 | 2,434,482 |
| Invesco Mortgage Capital, Inc. | 1,257,518 | 2,741,389 |
| KKR Real Estate Finance Trust, Inc. | 179,106 | 3,845,406 |
| New York Mortgage Trust, Inc. | 1,529,985 | 5,370,247 |
| PennyMac Mortgage Investment Trust | 391,312 | 6,104,467 |
| Ready Capital Corp. | 237,494 | 3,526,786 |
| Redwood Trust, Inc. | 462,582 | 4,806,227 |
| Two Harbors Investment Corp. | 1,387,263 | 7,019,551 |
| Total | | 51,941,280 |
| Thrifts & Mortgage Finance 1.9% |
| Axos Financial, Inc.(a) | 215,995 | 11,823,566 |
| Capitol Federal Financial, Inc. | 520,826 | 5,687,420 |
| Flagstar Bancorp, Inc. | 213,246 | 9,719,753 |
| NMI Holdings, Inc., Class A(a) | 345,887 | 8,003,825 |
| Northfield Bancorp, Inc. | 175,913 | 2,761,834 |
| Provident Financial Services, Inc. | 311,518 | 7,392,322 |
| TrustCo Bank Corp. | 77,527 | 2,649,098 |
| Walker & Dunlop, Inc. | 118,898 | 16,449,538 |
| WSFS Financial Corp. | 264,132 | 13,425,830 |
| Total | | 77,913,186 |
| Total Financials | 766,916,365 |
| Common Stocks (continued) |
| Issuer | Shares | Value ($) |
| Health Care 11.5% |
| Biotechnology 2.0% |
| Anika Therapeutics, Inc.(a) | 58,237 | 1,892,703 |
| Avid Bioservices, Inc.(a) | 247,441 | 5,067,592 |
| Coherus Biosciences, Inc.(a) | 257,084 | 3,031,020 |
| Cytokinetics, Inc.(a) | 338,372 | 11,951,299 |
| Eagle Pharmaceuticals, Inc.(a) | 45,842 | 2,172,452 |
| Emergent BioSolutions, Inc.(a) | 193,145 | 7,992,340 |
| Enanta Pharmaceuticals, Inc.(a) | 72,574 | 5,110,661 |
| iTeos Therapeutics, Inc.(a) | 80,958 | 2,925,013 |
| Ligand Pharmaceuticals, Inc.(a) | 67,414 | 6,823,645 |
| Myriad Genetics, Inc.(a) | 322,123 | 7,853,359 |
| Organogenesis Holdings, Inc.(a) | 254,272 | 1,891,784 |
| REGENXBIO, Inc.(a) | 151,821 | 3,979,228 |
| uniQure NV(a) | 145,370 | 2,469,836 |
| Vanda Pharmaceuticals, Inc.(a) | 224,734 | 2,552,978 |
| Vericel Corp.(a) | 188,845 | 7,782,302 |
| Xencor, Inc.(a) | 235,908 | 7,386,280 |
| Total | | 80,882,492 |
| Health Care Equipment & Supplies 3.1% |
| Angiodynamics, Inc.(a) | 155,908 | 3,668,515 |
| Artivion, Inc.(a) | 158,652 | 3,101,647 |
| Avanos Medical, Inc.(a) | 194,379 | 6,879,073 |
| BioLife Solutions, Inc.(a) | 118,208 | 2,777,888 |
| Cardiovascular Systems, Inc.(a) | 163,577 | 3,444,932 |
| CONMED Corp. | 117,978 | 17,243,664 |
| Cutera, Inc.(a) | 65,917 | 2,528,576 |
| Glaukos Corp.(a) | 189,147 | 10,461,721 |
| Heska Corp.(a) | 43,207 | 6,135,394 |
| Inogen, Inc.(a) | 82,499 | 2,878,390 |
| Integer Holdings Corp.(a) | 133,194 | 11,170,981 |
| Lantheus Holdings, Inc.(a) | 273,056 | 13,057,538 |
| LeMaitre Vascular, Inc. | 77,520 | 3,679,874 |
| Meridian Bioscience, Inc.(a) | 174,884 | 4,424,565 |
| Merit Medical Systems, Inc.(a) | 204,969 | 13,329,134 |
| Mesa Laboratories, Inc. | 21,077 | 5,381,590 |
| Natus Medical, Inc.(a) | 137,764 | 3,832,594 |
| OraSure Technologies, Inc.(a) | 290,591 | 2,266,610 |
| Orthofix Medical, Inc.(a) | 79,648 | 2,706,439 |
The accompanying Notes to Financial Statements are an integral part of this statement.
| 12 | Columbia Small Cap Index Fund | Annual Report 2022 |
Portfolio of Investments (continued)
February 28, 2022
| Common Stocks (continued) |
| Issuer | Shares | Value ($) |
| SurModics, Inc.(a) | 55,958 | 2,511,395 |
| Tactile Systems Technology, Inc.(a) | 79,963 | 1,628,047 |
| Varex Imaging Corp.(a) | 158,934 | 3,757,200 |
| Zynex, Inc. | 87,968 | 553,317 |
| Total | | 127,419,084 |
| Health Care Providers & Services 3.3% |
| Addus HomeCare Corp.(a) | 64,247 | 5,463,565 |
| AMN Healthcare Services, Inc.(a) | 190,700 | 20,240,898 |
| Apollo Medical Holdings, Inc.(a) | 152,372 | 7,332,141 |
| Community Health Systems, Inc.(a) | 500,930 | 5,264,774 |
| Corvel Corp.(a) | 37,884 | 6,025,829 |
| Covetrus, Inc.(a) | 416,847 | 7,386,529 |
| Cross Country Healthcare, Inc.(a) | 142,571 | 3,183,610 |
| Ensign Group, Inc. (The) | 211,746 | 17,795,134 |
| Fulgent Genetics, Inc.(a) | 78,217 | 4,872,919 |
| Hanger, Inc.(a) | 148,339 | 2,687,903 |
| Joint Corp. (The)(a) | 58,140 | 2,383,740 |
| Mednax, Inc.(a) | 348,735 | 8,184,810 |
| ModivCare, Inc.(a) | 49,697 | 5,864,246 |
| Owens & Minor, Inc. | 304,379 | 13,438,333 |
| Pennant Group, Inc. (The)(a) | 109,128 | 1,773,330 |
| RadNet, Inc.(a) | 178,912 | 4,413,759 |
| Select Medical Holdings Corp. | 427,486 | 9,896,301 |
| Tivity Health, Inc.(a) | 178,613 | 4,872,563 |
| U.S. Physical Therapy, Inc. | 52,085 | 4,790,257 |
| Total | | 135,870,641 |
| Health Care Technology 1.1% |
| Allscripts Healthcare Solutions, Inc.(a) | 494,438 | 9,621,763 |
| Computer Programs & Systems, Inc.(a) | 59,088 | 1,818,728 |
| HealthStream, Inc.(a) | 101,853 | 2,086,968 |
| NextGen Healthcare, Inc.(a) | 231,725 | 4,525,589 |
| Omnicell, Inc.(a) | 177,260 | 22,916,173 |
| OptimizeRx Corp.(a) | 71,682 | 3,246,478 |
| Simulations Plus, Inc. | 63,394 | 2,497,090 |
| Tabula Rasa HealthCare, Inc.(a) | 95,447 | 544,048 |
| Total | | 47,256,837 |
| Life Sciences Tools & Services 0.3% |
| NeoGenomics, Inc.(a) | 496,656 | 10,633,405 |
| Common Stocks (continued) |
| Issuer | Shares | Value ($) |
| Pharmaceuticals 1.7% |
| Amphastar Pharmaceuticals, Inc.(a) | 148,622 | 4,118,316 |
| ANI Pharmaceuticals, Inc.(a) | 43,659 | 1,635,030 |
| Cara Therapeutics, Inc.(a) | 170,360 | 1,766,633 |
| Collegium Pharmaceutical, Inc.(a) | 139,446 | 2,715,014 |
| Corcept Therapeutics, Inc.(a) | 382,840 | 8,533,504 |
| Endo International PLC(a) | 942,595 | 2,931,470 |
| Harmony Biosciences Holdings, Inc.(a) | 91,988 | 3,675,840 |
| Innoviva, Inc.(a) | 252,289 | 4,846,472 |
| Nektar Therapeutics(a) | 744,476 | 7,623,434 |
| Pacira Pharmaceuticals, Inc.(a) | 179,684 | 11,983,126 |
| Phibro Animal Health Corp., Class A | 82,041 | 1,747,473 |
| Prestige Consumer Healthcare, Inc.(a) | 202,112 | 12,031,727 |
| Supernus Pharmaceuticals, Inc.(a) | 214,524 | 6,854,042 |
| Total | | 70,462,081 |
| Total Health Care | 472,524,540 |
| Industrials 16.3% |
| Aerospace & Defense 1.2% |
| AAR Corp.(a) | 134,500 | 6,044,430 |
| Aerojet Rocketdyne Holdings, Inc. | 301,998 | 11,702,423 |
| Aerovironment, Inc.(a) | 93,078 | 6,613,192 |
| Kaman Corp. | 112,343 | 4,876,810 |
| Moog, Inc., Class A | 118,095 | 9,814,875 |
| National Presto Industries, Inc. | 20,447 | 1,625,537 |
| Park Aerospace Corp. | 78,398 | 1,087,380 |
| Triumph Group, Inc.(a) | 260,631 | 6,526,200 |
| Total | | 48,290,847 |
| Air Freight & Logistics 0.8% |
| Atlas Air Worldwide Holdings, Inc.(a) | 108,898 | 8,533,247 |
| Forward Air Corp. | 108,745 | 11,220,309 |
| HUB Group, Inc., Class A(a) | 137,022 | 11,564,657 |
| Total | | 31,318,213 |
| Airlines 0.5% |
| Allegiant Travel Co.(a) | 61,290 | 10,669,976 |
| Hawaiian Holdings, Inc.(a) | 206,586 | 3,962,319 |
| Skywest, Inc.(a) | 203,226 | 5,712,683 |
| Total | | 20,344,978 |
The accompanying Notes to Financial Statements are an integral part of this statement.
Columbia Small Cap Index Fund | Annual Report 2022
| 13 |
Portfolio of Investments (continued)
February 28, 2022
| Common Stocks (continued) |
| Issuer | Shares | Value ($) |
| Building Products 1.8% |
| AAON, Inc. | 167,075 | 9,783,912 |
| American Woodmark Corp.(a) | 66,833 | 3,580,912 |
| Apogee Enterprises, Inc. | 102,198 | 4,606,064 |
| Gibraltar Industries, Inc.(a) | 131,826 | 6,369,832 |
| Griffon Corp. | 192,046 | 4,426,660 |
| Insteel Industries, Inc. | 78,289 | 2,905,305 |
| PGT, Inc.(a) | 240,531 | 5,173,822 |
| Quanex Building Products Corp. | 135,223 | 3,091,198 |
| Resideo Technologies, Inc.(a) | 582,432 | 14,991,800 |
| UFP Industries, Inc. | 249,647 | 21,407,230 |
| Total | | 76,336,735 |
| Commercial Services & Supplies 2.2% |
| ABM Industries, Inc. | 271,240 | 12,159,689 |
| Brady Corp., Class A | 195,755 | 9,020,390 |
| CoreCivic, Inc.(a) | 485,212 | 4,420,281 |
| Deluxe Corp. | 171,866 | 5,346,751 |
| GEO Group, Inc. (The)(a) | 494,288 | 2,945,957 |
| Harsco Corp.(a) | 319,497 | 3,805,209 |
| Healthcare Services Group, Inc. | 300,679 | 4,756,742 |
| HNI Corp. | 175,711 | 7,149,681 |
| Interface, Inc. | 238,219 | 3,108,758 |
| KAR Auction Services, Inc.(a) | 488,718 | 9,021,734 |
| Matthews International Corp., Class A | 127,522 | 4,231,180 |
| Pitney Bowes, Inc. | 667,607 | 3,324,683 |
| Unifirst Corp. | 61,419 | 11,132,194 |
| US Ecology, Inc.(a) | 127,115 | 6,030,336 |
| Viad Corp.(a) | 82,815 | 2,893,556 |
| Total | | 89,347,141 |
| Construction & Engineering 1.0% |
| Arcosa, Inc. | 194,956 | 10,268,333 |
| Comfort Systems U.S.A., Inc. | 145,384 | 12,500,116 |
| Granite Construction, Inc. | 184,859 | 5,595,682 |
| MYR Group, Inc.(a) | 68,051 | 6,107,577 |
| NV5 Global, Inc.(a) | 47,778 | 5,124,191 |
| Total | | 39,595,899 |
| Common Stocks (continued) |
| Issuer | Shares | Value ($) |
| Electrical Equipment 0.4% |
| AZZ, Inc. | 100,201 | 4,932,895 |
| Encore Wire Corp. | 81,710 | 9,512,678 |
| Powell Industries, Inc. | 36,316 | 767,721 |
| Total | | 15,213,294 |
| Machinery 5.0% |
| Alamo Group, Inc. | 39,923 | 5,553,689 |
| Albany International Corp., Class A | 130,616 | 11,470,697 |
| Astec Industries, Inc. | 91,831 | 4,573,184 |
| Barnes Group, Inc. | 187,884 | 8,727,212 |
| Chart Industries, Inc.(a) | 143,694 | 20,749,414 |
| CIRCOR International, Inc.(a) | 81,718 | 2,201,483 |
| Enerpac Tool Group Corp. | 243,205 | 4,195,286 |
| EnPro Industries, Inc. | 83,118 | 9,179,552 |
| ESCO Technologies, Inc. | 105,126 | 7,313,616 |
| Federal Signal Corp. | 246,356 | 8,895,915 |
| Franklin Electric Co., Inc. | 157,329 | 13,303,740 |
| Greenbrier Companies, Inc. (The) | 131,286 | 5,833,037 |
| Hillenbrand, Inc. | 294,625 | 14,056,559 |
| John Bean Technologies Corp. | 128,147 | 14,528,025 |
| Lindsay Corp. | 44,001 | 5,773,371 |
| Meritor, Inc.(a) | 282,947 | 10,075,743 |
| Mueller Industries, Inc. | 231,410 | 13,201,940 |
| Proto Labs, Inc.(a) | 111,294 | 6,258,062 |
| SPX Corp.(a) | 183,189 | 9,287,682 |
| SPX FLOW, Inc. | 169,305 | 14,541,606 |
| Standex International Corp. | 49,253 | 5,217,370 |
| Tennant Co. | 74,772 | 5,890,538 |
| Titan International, Inc.(a) | 206,338 | 2,310,986 |
| Wabash National Corp. | 199,583 | 3,400,894 |
| Total | | 206,539,601 |
| Marine 0.4% |
| Matson, Inc. | 169,551 | 18,781,164 |
| Professional Services 1.4% |
| Exponent, Inc. | 210,212 | 19,919,689 |
| Forrester Research, Inc.(a) | 44,853 | 2,329,216 |
| Heidrick & Struggles International, Inc. | 79,031 | 3,378,575 |
| Kelly Services, Inc., Class A | 145,344 | 3,084,200 |
The accompanying Notes to Financial Statements are an integral part of this statement.
| 14 | Columbia Small Cap Index Fund | Annual Report 2022 |
Portfolio of Investments (continued)
February 28, 2022
| Common Stocks (continued) |
| Issuer | Shares | Value ($) |
| Korn/Ferry International | 219,869 | 14,568,520 |
| Mantech International Corp., Class A | 111,181 | 9,269,160 |
| Resources Connection, Inc. | 125,839 | 2,088,928 |
| TrueBlue, Inc.(a) | 143,125 | 3,893,000 |
| Total | | 58,531,288 |
| Road & Rail 0.4% |
| ArcBest Corp. | 103,138 | 9,558,830 |
| Heartland Express, Inc. | 187,792 | 2,696,693 |
| Marten Transport Ltd. | 240,898 | 4,155,490 |
| Total | | 16,411,013 |
| Trading Companies & Distributors 1.2% |
| Applied Industrial Technologies, Inc. | 155,130 | 15,683,643 |
| Boise Cascade Co. | 158,656 | 12,682,961 |
| DXP Enterprises, Inc.(a) | 68,920 | 1,978,693 |
| GMS, Inc.(a) | 174,053 | 9,442,375 |
| NOW, Inc.(a) | 445,979 | 4,165,444 |
| Veritiv Corp.(a) | 55,923 | 5,993,268 |
| Total | | 49,946,384 |
| Total Industrials | 670,656,557 |
| Information Technology 12.8% |
| Communications Equipment 1.5% |
| ADTRAN, Inc. | 196,368 | 4,043,217 |
| CalAmp Corp.(a) | 144,743 | 1,021,886 |
| Comtech Telecommunications Corp. | 106,280 | 2,187,242 |
| Digi International, Inc.(a) | 137,599 | 2,762,988 |
| Extreme Networks, Inc.(a) | 523,913 | 6,019,760 |
| Harmonic, Inc.(a) | 413,744 | 3,851,957 |
| InterDigital, Inc. | 123,751 | 7,972,040 |
| NETGEAR, Inc.(a) | 118,051 | 3,141,337 |
| Netscout Systems, Inc.(a) | 298,001 | 9,276,771 |
| Plantronics, Inc.(a) | 172,375 | 4,855,804 |
| Viavi Solutions, Inc.(a) | 958,791 | 15,724,172 |
| Total | | 60,857,174 |
| Electronic Equipment, Instruments & Components 3.8% |
| Advanced Energy Industries, Inc. | 151,955 | 13,045,337 |
| Arlo Technologies, Inc.(a) | 340,050 | 3,155,664 |
| Badger Meter, Inc. | 117,990 | 11,729,386 |
| Benchmark Electronics, Inc. | 142,088 | 3,714,180 |
| Common Stocks (continued) |
| Issuer | Shares | Value ($) |
| CTS Corp. | 129,991 | 4,931,859 |
| ePlus, Inc.(a) | 108,979 | 5,111,115 |
| Fabrinet(a) | 149,325 | 14,951,912 |
| FARO Technologies, Inc.(a) | 73,432 | 4,019,668 |
| Insight Enterprises, Inc.(a) | 140,725 | 14,635,400 |
| Itron, Inc.(a) | 182,621 | 8,705,543 |
| Knowles Corp.(a) | 372,506 | 8,113,181 |
| Methode Electronics, Inc. | 153,976 | 7,027,465 |
| OSI Systems, Inc.(a) | 67,309 | 5,429,817 |
| PC Connection, Inc. | 44,404 | 2,166,471 |
| Plexus Corp.(a) | 113,956 | 9,283,995 |
| Rogers Corp.(a) | 75,554 | 20,626,242 |
| Sanmina Corp.(a) | 259,687 | 10,330,349 |
| Scansource, Inc.(a) | 102,988 | 3,252,361 |
| TTM Technologies, Inc.(a) | 420,969 | 5,291,580 |
| Total | | 155,521,525 |
| IT Services 1.4% |
| CSG Systems International, Inc. | 131,689 | 8,127,845 |
| EVERTEC, Inc. | 240,963 | 9,725,267 |
| ExlService Holdings, Inc.(a) | 134,339 | 16,226,808 |
| Perficient, Inc.(a) | 132,867 | 13,539,147 |
| TTEC Holdings, Inc. | 73,923 | 5,876,878 |
| Unisys Corp.(a) | 270,881 | 5,788,727 |
| Total | | 59,284,672 |
| Semiconductors & Semiconductor Equipment 3.4% |
| Axcelis Technologies, Inc.(a) | 134,376 | 9,301,507 |
| Ceva, Inc.(a) | 92,674 | 3,778,319 |
| Cohu, Inc.(a) | 196,400 | 6,123,752 |
| Diodes, Inc.(a) | 181,596 | 16,269,186 |
| Formfactor, Inc.(a) | 315,476 | 12,773,623 |
| Ichor Holdings Ltd.(a) | 114,606 | 4,037,569 |
| Kulicke & Soffa Industries, Inc. | 249,974 | 13,058,642 |
| MaxLinear, Inc., Class A(a) | 284,775 | 17,470,946 |
| Onto Innovation, Inc.(a) | 198,780 | 17,136,824 |
| PDF Solutions, Inc.(a) | 120,515 | 3,297,291 |
| Photronics, Inc.(a) | 246,674 | 4,543,735 |
| Rambus, Inc.(a) | 441,163 | 11,911,401 |
| SMART Global Holdings, Inc.(a) | 186,834 | 5,128,593 |
The accompanying Notes to Financial Statements are an integral part of this statement.
Columbia Small Cap Index Fund | Annual Report 2022
| 15 |
Portfolio of Investments (continued)
February 28, 2022
| Common Stocks (continued) |
| Issuer | Shares | Value ($) |
| Ultra Clean Holdings, Inc.(a) | 181,120 | 8,297,107 |
| Veeco Instruments, Inc.(a) | 203,726 | 5,820,452 |
| Total | | 138,948,947 |
| Software 2.4% |
| 8x8, Inc.(a) | 459,658 | 5,957,168 |
| Agilysys, Inc.(a) | 78,429 | 3,296,371 |
| Alarm.com Holdings, Inc.(a) | 185,780 | 12,229,897 |
| Bottomline Technologies de, Inc.(a) | 156,017 | 8,836,803 |
| Consensus Cloud Solutions, Inc.(a) | 64,739 | 3,603,373 |
| Ebix, Inc. | 96,111 | 2,836,235 |
| LivePerson, Inc.(a) | 265,466 | 5,383,650 |
| OneSpan, Inc.(a) | 138,647 | 1,910,556 |
| Progress Software Corp. | 176,856 | 7,795,812 |
| SPS Commerce, Inc.(a) | 145,074 | 18,837,859 |
| Vonage Holdings Corp.(a) | 1,018,443 | 20,694,762 |
| Xperi Holding Corp. | 421,659 | 7,303,134 |
| Total | | 98,685,620 |
| Technology Hardware, Storage & Peripherals 0.3% |
| 3D Systems Corp.(a) | 515,240 | 9,181,577 |
| Corsair Gaming, Inc.(a) | 133,536 | 3,082,011 |
| Diebold, Inc.(a) | 293,948 | 2,557,347 |
| Total | | 14,820,935 |
| Total Information Technology | 528,118,873 |
| Materials 5.4% |
| Chemicals 2.9% |
| AdvanSix, Inc. | 113,480 | 4,546,009 |
| American Vanguard Corp. | 108,561 | 1,636,014 |
| Balchem Corp. | 130,624 | 18,070,524 |
| Ferro Corp.(a) | 333,769 | 7,252,800 |
| FutureFuel Corp. | 104,155 | 766,581 |
| GCP Applied Technologies(a) | 216,457 | 6,835,712 |
| Hawkins, Inc. | 75,798 | 3,430,618 |
| HB Fuller Co. | 211,979 | 14,493,004 |
| Innospec, Inc. | 99,422 | 9,494,801 |
| Koppers Holdings, Inc.(a) | 85,945 | 2,460,605 |
| Kraton Performance Polymers, Inc.(a) | 129,680 | 5,984,732 |
| Livent Corp.(a) | 651,770 | 15,349,184 |
| Quaker Chemical Corp. | 54,136 | 10,048,183 |
| Common Stocks (continued) |
| Issuer | Shares | Value ($) |
| Rayonier Advanced Materials, Inc.(a) | 257,106 | 1,509,212 |
| Stepan Co. | 85,902 | 8,901,165 |
| Tredegar Corp. | 103,444 | 1,190,640 |
| Trinseo PLC | 156,663 | 8,140,210 |
| Total | | 120,109,994 |
| Containers & Packaging 0.3% |
| Myers Industries, Inc. | 146,183 | 2,429,562 |
| O-I Glass, Inc.(a) | 632,617 | 8,084,845 |
| Total | | 10,514,407 |
| Metals & Mining 1.8% |
| Allegheny Technologies, Inc.(a) | 513,300 | 13,212,342 |
| Arconic Corp.(a) | 429,553 | 13,187,277 |
| Carpenter Technology Corp. | 194,379 | 7,462,210 |
| Century Aluminum Co.(a) | 203,598 | 4,808,985 |
| Compass Minerals International, Inc. | 137,486 | 8,059,429 |
| Haynes International, Inc. | 51,186 | 1,871,360 |
| Kaiser Aluminum Corp. | 63,989 | 6,174,939 |
| Materion Corp. | 82,448 | 6,888,530 |
| Olympic Steel, Inc. | 37,534 | 1,004,785 |
| SunCoke Energy, Inc. | 335,137 | 2,657,636 |
| TimkenSteel Corp.(a) | 165,893 | 2,991,051 |
| Warrior Met Coal, Inc. | 207,385 | 6,532,628 |
| Total | | 74,851,172 |
| Paper & Forest Products 0.4% |
| Clearwater Paper Corp.(a) | 67,321 | 1,940,864 |
| Glatfelter Corp. | 179,607 | 2,467,800 |
| Mercer International, Inc. | 162,496 | 2,172,572 |
| Neenah, Inc. | 67,603 | 2,633,137 |
| Schweitzer-Mauduit International, Inc. | 126,897 | 3,961,724 |
| Sylvamo Corp.(a) | 142,331 | 4,967,352 |
| Total | | 18,143,449 |
| Total Materials | 223,619,022 |
| Real Estate 7.9% |
| Equity Real Estate Investment Trusts (REITS) 7.3% |
| Acadia Realty Trust | 356,811 | 7,650,028 |
| Agree Realty Corp. | 281,482 | 18,057,070 |
| Alexander & Baldwin, Inc. | 292,575 | 6,562,457 |
| American Assets Trust, Inc. | 212,224 | 7,758,909 |
The accompanying Notes to Financial Statements are an integral part of this statement.
| 16 | Columbia Small Cap Index Fund | Annual Report 2022 |
Portfolio of Investments (continued)
February 28, 2022
| Common Stocks (continued) |
| Issuer | Shares | Value ($) |
| Armada Hoffler Properties, Inc. | 248,102 | 3,642,137 |
| Brandywine Realty Trust | 690,297 | 9,201,659 |
| CareTrust REIT, Inc. | 391,417 | 6,849,798 |
| Centerspace | 57,607 | 5,414,482 |
| Chatham Lodging Trust(a) | 196,723 | 2,704,941 |
| Community Healthcare Trust, Inc. | 94,731 | 3,950,283 |
| DiamondRock Hospitality Co.(a) | 849,610 | 8,113,775 |
| Diversified Healthcare Trust | 964,071 | 2,776,524 |
| Easterly Government Properties, Inc. | 347,468 | 7,234,284 |
| Essential Properties Realty Trust, Inc. | 490,412 | 12,397,615 |
| Four Corners Property Trust, Inc. | 312,031 | 8,231,378 |
| Franklin Street Properties Corp. | 383,497 | 2,216,613 |
| Getty Realty Corp. | 159,129 | 4,384,004 |
| Global Net Lease, Inc. | 417,923 | 5,938,686 |
| Hersha Hospitality Trust(a) | 133,230 | 1,229,713 |
| Independence Realty Trust, Inc. | 421,780 | 10,658,381 |
| Industrial Logistics Properties Trust | 263,834 | 5,901,967 |
| Innovative Industrial Properties, Inc. | 96,522 | 18,190,536 |
| iStar, Inc. | 280,256 | 7,040,031 |
| LTC Properties, Inc. | 158,829 | 5,373,185 |
| LXP Industrial Trust | 1,140,843 | 17,637,433 |
| NexPoint Residential Trust, Inc. | 91,677 | 7,789,795 |
| Office Properties Income Trust | 195,343 | 4,893,342 |
| Orion Office REIT, Inc.(a) | 218,522 | 3,721,430 |
| Retail Opportunity Investments Corp. | 489,807 | 8,894,895 |
| RPT Realty | 340,014 | 4,403,181 |
| Safehold, Inc. | 57,039 | 3,499,913 |
| Saul Centers, Inc. | 52,581 | 2,420,303 |
| Service Properties Trust | 665,957 | 5,747,209 |
| SITE Centers Corp. | 724,219 | 11,261,605 |
| Summit Hotel Properties, Inc.(a) | 429,408 | 4,246,845 |
| Tanger Factory Outlet Centers, Inc. | 419,460 | 6,996,593 |
| Uniti Group, Inc. | 952,276 | 12,351,020 |
| Universal Health Realty Income Trust | 51,710 | 2,953,158 |
| Urban Edge Properties | 445,287 | 8,113,129 |
| Urstadt Biddle Properties, Inc., Class A | 121,346 | 2,284,945 |
| Veris Residential, Inc.(a) | 322,839 | 5,455,979 |
| Washington Real Estate Investment Trust | 341,409 | 7,975,314 |
| Common Stocks (continued) |
| Issuer | Shares | Value ($) |
| Whitestone REIT | 186,228 | 2,193,766 |
| Xenia Hotels & Resorts, Inc.(a) | 460,703 | 8,541,434 |
| Total | | 302,859,745 |
| Real Estate Management & Development 0.6% |
| Douglas Elliman, Inc.(a) | 263,945 | 1,990,145 |
| Marcus & Millichap, Inc.(a) | 100,809 | 5,013,232 |
| RE/MAX Holdings, Inc., Class A | 76,204 | 2,258,687 |
| Realogy Holdings Corp.(a) | 470,299 | 8,550,036 |
| St. Joe Co. (The) | 133,014 | 7,186,746 |
| Total | | 24,998,846 |
| Total Real Estate | 327,858,591 |
| Utilities 1.9% |
| Gas Utilities 0.7% |
| Chesapeake Utilities Corp. | 71,012 | 9,441,045 |
| Northwest Natural Holding Co. | 123,960 | 6,447,160 |
| South Jersey Industries, Inc. | 453,599 | 15,390,614 |
| Total | | 31,278,819 |
| Multi-Utilities 0.4% |
| Avista Corp. | 285,468 | 12,740,437 |
| Unitil Corp. | 64,433 | 3,253,222 |
| Total | | 15,993,659 |
| Water Utilities 0.8% |
| American States Water Co. | 148,994 | 12,539,335 |
| California Water Service Group | 212,213 | 12,081,286 |
| Middlesex Water Co. | 70,580 | 7,057,294 |
| Total | | 31,677,915 |
| Total Utilities | 78,950,393 |
Total Common Stocks
(Cost $2,498,074,154) | 4,047,488,447 |
|
| Exchange-Traded Equity Funds 1.2% |
| | Shares | Value ($) |
| U.S. Small Cap 1.2% |
| iShares Core S&P Small-Cap ETF | 447,875 | 48,240,616 |
Total Exchange-Traded Equity Funds
(Cost $30,910,919) | 48,240,616 |
|
The accompanying Notes to Financial Statements are an integral part of this statement.
Columbia Small Cap Index Fund | Annual Report 2022
| 17 |
Portfolio of Investments (continued)
February 28, 2022
| Money Market Funds 0.7% |
| | Shares | Value ($) |
| Columbia Short-Term Cash Fund, 0.168%(c),(d) | 28,850,475 | 28,841,820 |
Total Money Market Funds
(Cost $28,839,955) | 28,841,820 |
Total Investments in Securities
(Cost: $2,557,825,028) | 4,124,570,883 |
| Other Assets & Liabilities, Net | | 517,245 |
| Net Assets | 4,125,088,128 |
At February 28, 2022, securities and/or cash totaling $3,847,542 were pledged as collateral.
Investments in derivatives
| Long futures contracts |
| Description | Number of
contracts | Expiration
date | Trading
currency | Notional
amount | Value/Unrealized
appreciation ($) | Value/Unrealized
depreciation ($) |
| Russell 2000 Index E-mini | 304 | 03/2022 | USD | 31,076,400 | 579,082 | — |
Notes to Portfolio of Investments
| (a) | Non-income producing investment. |
| (b) | This security or a portion of this security has been pledged as collateral in connection with derivative contracts. |
| (c) | The rate shown is the seven-day current annualized yield at February 28, 2022. |
| (d) | As defined in the Investment Company Act of 1940, as amended, an affiliated company is one in which the Fund owns 5% or more of the company’s outstanding voting securities, or a company which is under common ownership or control with the Fund. The value of the holdings and transactions in these affiliated companies during the year ended February 28, 2022 are as follows: |
| Affiliated issuers | Beginning
of period($) | Purchases($) | Sales($) | Net change in
unrealized
appreciation
(depreciation)($) | End of
period($) | Realized gain
(loss)($) | Dividends($) | End of
period shares |
| Columbia Short-Term Cash Fund, 0.168% |
| | 56,765,602 | 516,094,480 | (544,020,119) | 1,857 | 28,841,820 | (8,110) | 29,256 | 28,850,475 |
Currency Legend
Fair value measurements
The Fund categorizes its fair value measurements according to a three-level hierarchy that maximizes the use of observable inputs and minimizes the use of unobservable inputs by prioritizing that the most observable input be used when available. Observable inputs are those that market participants would use in pricing an investment based on market data obtained from sources independent of the reporting entity. Unobservable inputs are those that reflect the Fund’s assumptions about the information market participants would use in pricing an investment. An investment’s level within the fair value hierarchy is based on the lowest level of any input that is deemed significant to the asset’s or liability’s fair value measurement. The input levels are not necessarily an indication of the risk or liquidity associated with investments at that level. For example, certain U.S. government securities are generally high quality and liquid, however, they are reflected as Level 2 because the inputs used to determine fair value may not always be quoted prices in an active market.
Fair value inputs are summarized in the three broad levels listed below:
| ■ | Level 1 — Valuations based on quoted prices for investments in active markets that the Fund has the ability to access at the measurement date. Valuation adjustments are not applied to Level 1 investments. |
| ■ | Level 2 — Valuations based on other significant observable inputs (including quoted prices for similar securities, interest rates, prepayment speeds, credit risks, etc.). |
| ■ | Level 3 — Valuations based on significant unobservable inputs (including the Fund’s own assumptions and judgment in determining the fair value of investments). |
The accompanying Notes to Financial Statements are an integral part of this statement.
| 18 | Columbia Small Cap Index Fund | Annual Report 2022 |
Portfolio of Investments (continued)
February 28, 2022
Fair value measurements (continued)
Inputs that are used in determining fair value of an investment may include price information, credit data, volatility statistics, and other factors. These inputs can be either observable or unobservable. The availability of observable inputs can vary between investments, and is affected by various factors such as the type of investment, and the volume and level of activity for that investment or similar investments in the marketplace. The inputs will be considered by the Investment Manager, along with any other relevant factors in the calculation of an investment’s fair value. The Fund uses prices and inputs that are current as of the measurement date, which may include periods of market dislocations. During these periods, the availability of prices and inputs may be reduced for many investments. This condition could cause an investment to be reclassified between the various levels within the hierarchy.
Investments falling into the Level 3 category are primarily supported by quoted prices from brokers and dealers participating in the market for those investments. However, these may be classified as Level 3 investments due to lack of market transparency and corroboration to support these quoted prices. Additionally, valuation models may be used as the pricing source for any remaining investments classified as Level 3. These models may rely on one or more significant unobservable inputs and/or significant assumptions by the Investment Manager. Inputs used in valuations may include, but are not limited to, financial statement analysis, capital account balances, discount rates and estimated cash flows, and comparable company data.
Under the direction of the Fund’s Board of Trustees (the Board), the Investment Manager’s Valuation Committee (the Committee) is responsible for overseeing the valuation procedures approved by the Board. The Committee consists of voting and non-voting members from various groups within the Investment Manager’s organization, including operations and accounting, trading and investments, compliance, risk management and legal.
The Committee meets at least monthly to review and approve valuation matters, which may include a description of specific valuation determinations, data regarding pricing information received from approved pricing vendors and brokers and the results of Board-approved valuation control policies and procedures (the Policies). The Policies address, among other things, instances when market quotations are or are not readily available, including recommendations of third party pricing vendors and a determination of appropriate pricing methodologies; events that require specific valuation determinations and assessment of fair value techniques; securities with a potential for stale pricing, including those that are illiquid, restricted, or in default; and the effectiveness of third party pricing vendors, including periodic reviews of vendors. The Committee meets more frequently, as needed, to discuss additional valuation matters, which may include the need to review back-testing results, review time-sensitive information or approve related valuation actions. The Committee reports to the Board, with members of the Committee meeting with the Board at each of its regularly scheduled meetings to discuss valuation matters and actions during the period, similar to those described earlier.
The following table is a summary of the inputs used to value the Fund’s investments at February 28, 2022:
| | Level 1 ($) | Level 2 ($) | Level 3 ($) | Total ($) |
| Investments in Securities | | | | |
| Common Stocks | | | | |
| Communication Services | 71,701,409 | — | — | 71,701,409 |
| Consumer Discretionary | 479,948,955 | — | — | 479,948,955 |
| Consumer Staples | 193,634,446 | — | — | 193,634,446 |
| Energy | 233,559,296 | — | — | 233,559,296 |
| Financials | 766,916,365 | — | — | 766,916,365 |
| Health Care | 472,524,540 | — | — | 472,524,540 |
| Industrials | 670,656,557 | — | — | 670,656,557 |
| Information Technology | 528,118,873 | — | — | 528,118,873 |
| Materials | 223,619,022 | — | — | 223,619,022 |
| Real Estate | 327,858,591 | — | — | 327,858,591 |
| Utilities | 78,950,393 | — | — | 78,950,393 |
| Total Common Stocks | 4,047,488,447 | — | — | 4,047,488,447 |
| Exchange-Traded Equity Funds | 48,240,616 | — | — | 48,240,616 |
| Money Market Funds | 28,841,820 | — | — | 28,841,820 |
| Total Investments in Securities | 4,124,570,883 | — | — | 4,124,570,883 |
| Investments in Derivatives | | | | |
| Asset | | | | |
| Futures Contracts | 579,082 | — | — | 579,082 |
| Total | 4,125,149,965 | — | — | 4,125,149,965 |
See the Portfolio of Investments for all investment classifications not indicated in the table.
Derivative instruments are valued at unrealized appreciation (depreciation).
The accompanying Notes to Financial Statements are an integral part of this statement.
Columbia Small Cap Index Fund | Annual Report 2022
| 19 |
Statement of Assets and Liabilities
February 28, 2022
| Assets | |
| Investments in securities, at value | |
| Unaffiliated issuers (cost $2,528,985,073) | $4,095,729,063 |
| Affiliated issuers (cost $28,839,955) | 28,841,820 |
| Receivable for: | |
| Capital shares sold | 3,464,837 |
| Dividends | 1,930,546 |
| Variation margin for futures contracts | 90,475 |
| Expense reimbursement due from Investment Manager | 384 |
| Total assets | 4,130,057,125 |
| Liabilities | |
| Payable for: | |
| Capital shares purchased | 4,544,017 |
| Variation margin for futures contracts | 32,257 |
| Management services fees | 67,590 |
| Distribution and/or service fees | 21,973 |
| Compensation of board members | 303,160 |
| Total liabilities | 4,968,997 |
| Net assets applicable to outstanding capital stock | $4,125,088,128 |
| Represented by | |
| Paid in capital | 2,485,031,738 |
| Total distributable earnings (loss) | 1,640,056,390 |
| Total - representing net assets applicable to outstanding capital stock | $4,125,088,128 |
| Class A | |
| Net assets | $1,070,943,035 |
| Shares outstanding | 38,909,422 |
| Net asset value per share | $27.52 |
| Institutional Class | |
| Net assets | $1,763,232,630 |
| Shares outstanding | 63,498,573 |
| Net asset value per share | $27.77 |
| Institutional 2 Class | |
| Net assets | $1,199,979,759 |
| Shares outstanding | 42,033,053 |
| Net asset value per share | $28.55 |
| Institutional 3 Class | |
| Net assets | $90,932,704 |
| Shares outstanding | 3,379,458 |
| Net asset value per share | $26.91 |
The accompanying Notes to Financial Statements are an integral part of this statement.
| 20 | Columbia Small Cap Index Fund | Annual Report 2022 |
Statement of Operations
Year Ended February 28, 2022
| Net investment income | |
| Income: | |
| Dividends — unaffiliated issuers | $57,605,557 |
| Dividends — affiliated issuers | 29,256 |
| Foreign taxes withheld | (50,869) |
| Total income | 57,583,944 |
| Expenses: | |
| Management services fees | 8,941,618 |
| Distribution and/or service fees | |
| Class A | 2,943,484 |
| Compensation of board members | 107,091 |
| Interest on collateral | 706 |
| Other | 284 |
| Total expenses | 11,993,183 |
| Fees waived or expenses reimbursed by Investment Manager and its affiliates | (107,374) |
| Expense reduction | (1,080) |
| Total net expenses | 11,884,729 |
| Net investment income | 45,699,215 |
| Realized and unrealized gain (loss) — net | |
| Net realized gain (loss) on: | |
| Investments — unaffiliated issuers | 319,150,005 |
| Investments — affiliated issuers | (8,110) |
| Foreign currency translations | (2) |
| Futures contracts | 250,460 |
| Net realized gain | 319,392,353 |
| Net change in unrealized appreciation (depreciation) on: | |
| Investments — unaffiliated issuers | (182,735,474) |
| Investments — affiliated issuers | 1,857 |
| Futures contracts | (535,504) |
| Net change in unrealized appreciation (depreciation) | (183,269,121) |
| Net realized and unrealized gain | 136,123,232 |
| Net increase in net assets resulting from operations | $181,822,447 |
The accompanying Notes to Financial Statements are an integral part of this statement.
Columbia Small Cap Index Fund | Annual Report 2022
| 21 |
Statement of Changes in Net Assets
| | Year Ended
February 28, 2022 | Year Ended
February 28, 2021 |
| Operations | | |
| Net investment income | $45,699,215 | $34,121,939 |
| Net realized gain | 319,392,353 | 125,971,897 |
| Net change in unrealized appreciation (depreciation) | (183,269,121) | 1,166,052,959 |
| Net increase in net assets resulting from operations | 181,822,447 | 1,326,146,795 |
| Distributions to shareholders | | |
| Net investment income and net realized gains | | |
| Class A | (90,877,215) | (32,771,990) |
| Institutional Class | (151,339,217) | (53,973,888) |
| Institutional 2 Class | (97,402,387) | (25,163,888) |
| Institutional 3 Class | (7,395,880) | (2,289,248) |
| Total distributions to shareholders | (347,014,699) | (114,199,014) |
| Decrease in net assets from capital stock activity | (122,118,941) | (156,601,896) |
| Total increase (decrease) in net assets | (287,311,193) | 1,055,345,885 |
| Net assets at beginning of year | 4,412,399,321 | 3,357,053,436 |
| Net assets at end of year | $4,125,088,128 | $4,412,399,321 |
| | Year Ended | Year Ended |
| | February 28, 2022 | February 28, 2021 |
| | Shares | Dollars ($) | Shares | Dollars ($) |
| Capital stock activity |
| Class A | | | | |
| Subscriptions | 6,871,306 | 203,973,849 | 8,772,377 | 176,225,195 |
| Distributions reinvested | 2,667,184 | 78,041,984 | 1,274,492 | 27,865,631 |
| Redemptions | (11,669,698) | (345,770,746) | (19,817,244) | (409,941,679) |
| Net decrease | (2,131,208) | (63,754,913) | (9,770,375) | (205,850,853) |
| Institutional Class | | | | |
| Subscriptions | 8,209,632 | 245,235,326 | 14,952,708 | 303,828,228 |
| Distributions reinvested | 3,953,756 | 116,597,000 | 1,878,061 | 41,449,814 |
| Redemptions | (14,989,733) | (448,800,004) | (28,858,468) | (584,127,079) |
| Net decrease | (2,826,345) | (86,967,678) | (12,027,699) | (238,849,037) |
| Institutional 2 Class | | | | |
| Subscriptions | 13,891,385 | 427,539,854 | 27,203,178 | 675,050,843 |
| Distributions reinvested | 2,970,935 | 89,977,964 | 968,240 | 22,295,675 |
| Redemptions | (16,428,592) | (508,690,062) | (16,980,262) | (376,793,084) |
| Net increase | 433,728 | 8,827,756 | 11,191,156 | 320,553,434 |
| Institutional 3 Class | | | | |
| Subscriptions | 1,704,017 | 49,590,547 | 1,465,633 | 31,501,162 |
| Distributions reinvested | 193,333 | 5,532,686 | 106,432 | 2,195,288 |
| Redemptions | (1,212,485) | (35,347,339) | (3,020,356) | (66,151,890) |
| Net increase (decrease) | 684,865 | 19,775,894 | (1,448,291) | (32,455,440) |
| Total net decrease | (3,838,960) | (122,118,941) | (12,055,209) | (156,601,896) |
The accompanying Notes to Financial Statements are an integral part of this statement.
| 22 | Columbia Small Cap Index Fund | Annual Report 2022 |
[THIS PAGE INTENTIONALLY LEFT BLANK]
Columbia Small Cap Index Fund | Annual Report 2022
| 23 |
The following table is intended to help you understand the Fund’s financial performance. Certain information reflects financial results for a single share of a class held for the periods shown. Per share net investment income (loss) amounts are calculated based on average shares outstanding during the period. Total return assumes reinvestment of all dividends and distributions, if any. Total return does not reflect payment of sales charges, if any. Total return and portfolio turnover are not annualized for periods of less than one year. The portfolio turnover rate is calculated without regard to purchase and sales transactions of short-term instruments and certain derivatives, if any. If such transactions were included, the Fund’s portfolio turnover rate may be higher.
| | Net asset value,
beginning of
period | Net
investment
income | Net
realized
and
unrealized
gain (loss) | Total from
investment
operations | Distributions
from net
investment
income | Distributions
from net
realized
gains | Total
distributions to
shareholders |
| Class A |
| Year Ended 2/28/2022 | $28.74 | 0.25 | 0.90 | 1.15 | (0.27) | (2.10) | (2.37) |
| Year Ended 2/28/2021 | $20.32 | 0.18 | 8.97 | 9.15 | (0.22) | (0.51) | (0.73) |
| Year Ended 2/29/2020 | $23.54 | 0.24 | (2.00) | (1.76) | (0.26) | (1.20) | (1.46) |
| Year Ended 2/28/2019 | $24.33 | 0.23 | 1.32 | 1.55 | (0.23) | (2.11) | (2.34) |
| Year Ended 2/28/2018 | $23.83 | 0.21 | 2.11 | 2.32 | (0.22) | (1.60) | (1.82) |
| Institutional Class |
| Year Ended 2/28/2022 | $28.96 | 0.33 | 0.91 | 1.24 | (0.33) | (2.10) | (2.43) |
| Year Ended 2/28/2021 | $20.47 | 0.24 | 9.03 | 9.27 | (0.27) | (0.51) | (0.78) |
| Year Ended 2/29/2020 | $23.69 | 0.30 | (2.02) | (1.72) | (0.30) | (1.20) | (1.50) |
| Year Ended 2/28/2019 | $24.47 | 0.29 | 1.33 | 1.62 | (0.29) | (2.11) | (2.40) |
| Year Ended 2/28/2018 | $23.96 | 0.27 | 2.12 | 2.39 | (0.28) | (1.60) | (1.88) |
| Institutional 2 Class |
| Year Ended 2/28/2022 | $29.71 | 0.34 | 0.93 | 1.27 | (0.33) | (2.10) | (2.43) |
| Year Ended 2/28/2021 | $20.98 | 0.25 | 9.26 | 9.51 | (0.27) | (0.51) | (0.78) |
| Year Ended 2/29/2020 | $24.25 | 0.30 | (2.07) | (1.77) | (0.30) | (1.20) | (1.50) |
| Year Ended 2/28/2019 | $24.99 | 0.30 | 1.36 | 1.66 | (0.29) | (2.11) | (2.40) |
| Year Ended 2/28/2018 | $24.43 | 0.28 | 2.16 | 2.44 | (0.28) | (1.60) | (1.88) |
| Institutional 3 Class |
| Year Ended 2/28/2022 | $28.13 | 0.32 | 0.89 | 1.21 | (0.33) | (2.10) | (2.43) |
| Year Ended 2/28/2021 | $19.91 | 0.23 | 8.77 | 9.00 | (0.27) | (0.51) | (0.78) |
| Year Ended 2/29/2020 | $23.08 | 0.29 | (1.96) | (1.67) | (0.30) | (1.20) | (1.50) |
| Year Ended 2/28/2019 | $23.90 | 0.29 | 1.29 | 1.58 | (0.29) | (2.11) | (2.40) |
| Year Ended 2/28/2018(f) | $23.87 | 0.24 | 1.67 | 1.91 | (0.28) | (1.60) | (1.88) |
| Notes to Financial Highlights |
| (a) | In addition to the fees and expenses that the Fund bears directly, the Fund indirectly bears a pro rata share of the fees and expenses of any other funds in which it invests. Such indirect expenses are not included in the Fund’s reported expense ratios. |
| (b) | Total net expenses include the impact of certain fee waivers/expense reimbursements made by the Investment Manager and certain of its affiliates, if applicable. |
| (c) | Ratios include interest on collateral expense which is less than 0.01%. |
| (d) | The benefits derived from expense reductions had an impact of less than 0.01%. |
| (e) | Ratios include interfund lending expense which is less than 0.01%. |
| (f) | Institutional 3 Class shares commenced operations on March 1, 2017. Per share data and total return reflect activity from that date. |
The accompanying Notes to Financial Statements are an integral part of this statement.
| 24 | Columbia Small Cap Index Fund | Annual Report 2022 |
Financial Highlights (continued)
| | Net
asset
value,
end of
period | Total
return | Total gross
expense
ratio to
average
net assets(a) | Total net
expense
ratio to
average
net assets(a),(b) | Net investment
income
ratio to
average
net assets | Portfolio
turnover | Net
assets,
end of
period
(000’s) |
| Class A |
| Year Ended 2/28/2022 | $27.52 | 3.62% | 0.45%(c) | 0.45%(c),(d) | 0.84% | 13% | $1,070,943 |
| Year Ended 2/28/2021 | $28.74 | 46.15% | 0.45%(e) | 0.45%(d),(e) | 0.89% | 24% | $1,179,484 |
| Year Ended 2/29/2020 | $20.32 | (8.08%) | 0.45%(e) | 0.45%(d),(e) | 1.04% | 17% | $1,032,677 |
| Year Ended 2/28/2019 | $23.54 | 6.70% | 0.45% | 0.45%(d) | 0.89% | 22% | $1,440,665 |
| Year Ended 2/28/2018 | $24.33 | 9.86% | 0.45% | 0.45%(d) | 0.88% | 16% | $1,488,143 |
| Institutional Class |
| Year Ended 2/28/2022 | $27.77 | 3.92% | 0.20%(c) | 0.20%(c),(d) | 1.09% | 13% | $1,763,233 |
| Year Ended 2/28/2021 | $28.96 | 46.46% | 0.20%(e) | 0.20%(d),(e) | 1.14% | 24% | $1,920,981 |
| Year Ended 2/29/2020 | $20.47 | (7.85%) | 0.20%(e) | 0.20%(d),(e) | 1.29% | 17% | $1,603,859 |
| Year Ended 2/28/2019 | $23.69 | 6.99% | 0.20% | 0.20%(d) | 1.14% | 22% | $2,026,925 |
| Year Ended 2/28/2018 | $24.47 | 10.11% | 0.20% | 0.20%(d) | 1.12% | 16% | $1,866,835 |
| Institutional 2 Class |
| Year Ended 2/28/2022 | $28.55 | 3.92% | 0.20%(c) | 0.20%(c) | 1.09% | 13% | $1,199,980 |
| Year Ended 2/28/2021 | $29.71 | 46.48% | 0.20%(e) | 0.20%(e) | 1.12% | 24% | $1,236,122 |
| Year Ended 2/29/2020 | $20.98 | (7.87%) | 0.20%(e) | 0.20%(e) | 1.29% | 17% | $638,046 |
| Year Ended 2/28/2019 | $24.25 | 7.01% | 0.20% | 0.20% | 1.14% | 22% | $748,749 |
| Year Ended 2/28/2018 | $24.99 | 10.12% | 0.20% | 0.20% | 1.12% | 16% | $584,472 |
| Institutional 3 Class |
| Year Ended 2/28/2022 | $26.91 | 3.93% | 0.20%(c) | 0.20%(c) | 1.09% | 13% | $90,933 |
| Year Ended 2/28/2021 | $28.13 | 46.41% | 0.20%(e) | 0.20%(e) | 1.16% | 24% | $75,812 |
| Year Ended 2/29/2020 | $19.91 | (7.84%) | 0.20%(e) | 0.20%(e) | 1.30% | 17% | $82,471 |
| Year Ended 2/28/2019 | $23.08 | 6.99% | 0.20% | 0.20% | 1.16% | 22% | $70,934 |
| Year Ended 2/28/2018(f) | $23.90 | 8.14% | 0.21% | 0.20% | 1.01% | 16% | $4,327 |
The accompanying Notes to Financial Statements are an integral part of this statement.
Columbia Small Cap Index Fund | Annual Report 2022
| 25 |
Notes to Financial Statements
February 28, 2022
Note 1. Organization
Columbia Small Cap Index Fund (the Fund), a series of Columbia Funds Series Trust (the Trust), is a diversified fund. The Trust is registered under the Investment Company Act of 1940, as amended (the 1940 Act), as an open-end management investment company organized as a Delaware statutory trust.
Fund shares
The Trust may issue an unlimited number of shares (without par value). The Fund offers each of the share classes listed in the Statement of Assets and Liabilities. Although all share classes generally have identical voting, dividend and liquidation rights, each share class votes separately when required by the Trust’s organizational documents or by law. Each share class has its own expense and sales charge structure. Different share classes may have different minimum initial investment amounts and pay different net investment income distribution amounts to the extent the expenses of distributing such share classes vary. Distributions to shareholders in a liquidation will be proportional to the net asset value of each share class.
As described in the Fund’s prospectus, Class A shares are offered to the general public for investment. Institutional Class, Institutional 2 Class and Institutional 3 Class shares are available for purchase through authorized investment professionals to omnibus retirement plans or to institutional investors and to certain other investors as also described in the Fund’s prospectus.
Note 2. Summary of significant accounting policies
Basis of preparation
The Fund is an investment company that applies the accounting and reporting guidance in the Financial Accounting Standards Board (FASB) Accounting Standards Codification Topic 946, Financial Services - Investment Companies (ASC 946). The financial statements are prepared in accordance with U.S. generally accepted accounting principles (GAAP), which requires management to make certain estimates and assumptions that affect the reported amounts of assets and liabilities, the disclosure of contingent assets and liabilities at the date of the financial statements and the reported amounts of income and expenses during the reporting period. Actual results could differ from those estimates.
The following is a summary of significant accounting policies followed by the Fund in the preparation of its financial statements.
Security valuation
Equity securities listed on an exchange are valued at the closing price or last trade price on their primary exchange at the close of business of the New York Stock Exchange. Securities with a closing price not readily available or not listed on any exchange are valued at the mean between the closing bid and ask prices. Listed preferred stocks convertible into common stocks are valued using an evaluated price from a pricing service.
Foreign equity securities are valued based on the closing price or last trade price on their primary exchange at the close of business of the New York Stock Exchange. If any foreign equity security closing prices are not readily available, the securities are valued at the mean of the latest quoted bid and ask prices on such exchanges or markets. Foreign currency exchange rates are determined at the scheduled closing time of the New York Stock Exchange. Many securities markets and exchanges outside the U.S. close prior to the close of the New York Stock Exchange; therefore, the closing prices for securities in such markets or on such exchanges may not fully reflect events that occur after such close but before the close of the New York Stock Exchange. In those situations, foreign securities will be fair valued pursuant to a policy adopted by the Board of Trustees. Under the policy, the Fund may utilize a third-party pricing service to determine these fair values. The third-party pricing service takes into account multiple factors, including, but not limited to, movements in the U.S. securities markets, certain depositary receipts, futures contracts and foreign exchange rates that have occurred subsequent to the close of the foreign exchange or market, to determine a good faith estimate that reasonably reflects the current market conditions as of the close of the New York Stock Exchange. The fair value of a security is likely to be different from the quoted or published price, if available.
Investments in open-end investment companies (other than exchange-traded funds (ETFs)), are valued at the latest net asset value reported by those companies as of the valuation time.
| 26 | Columbia Small Cap Index Fund | Annual Report 2022 |
Notes to Financial Statements (continued)
February 28, 2022
Futures and options on futures contracts are valued based upon the settlement price at the close of regular trading on their principal exchanges or, in the absence of a settlement price, at the mean of the latest quoted bid and ask prices.
Investments for which market quotations are not readily available, or that have quotations which management believes are not reflective of market value or reliable, are valued at fair value as determined in good faith under procedures approved by and under the general supervision of the Board of Trustees. If a security or class of securities (such as foreign securities) is valued at fair value, such value is likely to be different from the quoted or published price for the security, if available.
The determination of fair value often requires significant judgment. To determine fair value, management may use assumptions including but not limited to future cash flows and estimated risk premiums. Multiple inputs from various sources may be used to determine fair value.
GAAP requires disclosure regarding the inputs and valuation techniques used to measure fair value and any changes in valuation inputs or techniques. In addition, investments shall be disclosed by major category. This information is disclosed following the Fund’s Portfolio of Investments.
Foreign currency transactions and translations
The values of all assets and liabilities denominated in foreign currencies are generally translated into U.S. dollars at exchange rates determined at the close of regular trading on the New York Stock Exchange. Net realized and unrealized gains (losses) on foreign currency transactions and translations include gains (losses) arising from the fluctuation in exchange rates between trade and settlement dates on securities transactions, gains (losses) arising from the disposition of foreign currency and currency gains (losses) between the accrual and payment dates on dividends, interest income and foreign withholding taxes.
For financial statement purposes, the Fund does not distinguish that portion of gains (losses) on investments which is due to changes in foreign exchange rates from that which is due to changes in market prices of the investments. Such fluctuations are included with the net realized and unrealized gains (losses) on investments in the Statement of Operations.
Derivative instruments
The Fund invests in certain derivative instruments, as detailed below, in seeking to meet its investment objectives. Derivatives are instruments whose values depend on, or are derived from, in whole or in part, the value of one or more securities, currencies, commodities, indices, or other assets or instruments. Derivatives may be used to increase investment flexibility (including to maintain cash reserves while maintaining desired exposure to certain assets), for risk management (hedging) purposes, to facilitate trading, to reduce transaction costs and to pursue higher investment returns. The Fund may also use derivative instruments to mitigate certain investment risks, such as foreign currency exchange rate risk, interest rate risk and credit risk. Derivatives may involve various risks, including the potential inability of the counterparty to fulfill its obligations under the terms of the contract, the potential for an illiquid secondary market (making it difficult for the Fund to sell or terminate, including at favorable prices) and the potential for market movements which may expose the Fund to gains or losses in excess of the amount shown in the Statement of Assets and Liabilities. The notional amounts of derivative instruments, if applicable, are not recorded in the financial statements.
A derivative instrument may suffer a marked-to-market loss if the value of the contract decreases due to an unfavorable change in the market rates or values of the underlying instrument. Losses can also occur if the counterparty does not perform its obligations under the contract. The Fund’s risk of loss from counterparty credit risk on over-the-counter derivatives is generally limited to the aggregate unrealized gain netted against any collateral held by the Fund and the amount of any variation margin held by the counterparty, plus any replacement costs or related amounts. With exchange-traded or centrally cleared derivatives, there is reduced counterparty credit risk to the Fund since the clearinghouse or central counterparty (CCP) provides some protection in the case of clearing member default. The clearinghouse or CCP stands between the buyer and the seller of the contract; therefore, failure of the clearinghouse or CCP may pose additional counterparty credit risk. However, credit risk still exists in exchange-traded or centrally cleared derivatives with respect to initial and variation margin that is held in a broker’s customer account. While clearing brokers are required to segregate customer margin from their own assets, in the event that a clearing broker becomes insolvent or goes into bankruptcy and at that time there is a shortfall in
Columbia Small Cap Index Fund | Annual Report 2022
| 27 |
Notes to Financial Statements (continued)
February 28, 2022
the aggregate amount of margin held by the clearing broker for all its clients and such shortfall is remedied by the CCP or otherwise, U.S. bankruptcy laws will typically allocate that shortfall on a pro-rata basis across all the clearing broker’s customers (including the Fund), potentially resulting in losses to the Fund.
In order to better define its contractual rights and to secure rights that will help the Fund mitigate its counterparty risk, the Fund may enter into an International Swaps and Derivatives Association, Inc. Master Agreement (ISDA Master Agreement) or similar agreement with its derivatives counterparties. An ISDA Master Agreement is an agreement between the Fund and a counterparty that governs over-the-counter derivatives and foreign exchange forward contracts and contains, among other things, collateral posting terms and netting provisions in the event of a default and/or termination event. Under an ISDA Master Agreement, the Fund may, under certain circumstances, offset with the counterparty certain derivative instruments’ payables and/or receivables with collateral held and/or posted and create one single net payment. The provisions of the ISDA Master Agreement typically permit a single net payment in the event of default (close-out netting), including the bankruptcy or insolvency of the counterparty. Note, however, that bankruptcy or insolvency laws of a particular jurisdiction may impose restrictions on or prohibitions against the right of offset or netting in bankruptcy, insolvency or other events.
Collateral (margin) requirements differ by type of derivative. Margin requirements are established by the clearinghouse or CCP for exchange-traded and centrally cleared derivatives. Brokers can ask for margin in excess of the minimum in certain circumstances. Collateral terms for most over-the-counter derivatives are subject to regulatory requirements to exchange variation margin with trading counterparties and may have contract specific margin terms as well. For over-the-counter derivatives traded under an ISDA Master Agreement, the collateral requirements are typically calculated by netting the marked-to-market amount for each transaction under such agreement and comparing that amount to the value of any variation margin currently pledged by the Fund and/or the counterparty. Generally, the amount of collateral due from or to a party has to exceed a minimum transfer amount threshold (e.g., $250,000) before a transfer has to be made. To the extent amounts due to the Fund from its counterparties are not fully collateralized, contractually or otherwise, the Fund bears the risk of loss from counterparty nonperformance. The Fund may also pay interest expense on cash collateral received from the broker. Any interest expense paid by the Fund is shown on the Statement of Operations. The Fund attempts to mitigate counterparty risk by only entering into agreements with counterparties that it believes have the financial resources to honor their obligations and by monitoring the financial stability of those counterparties.
Certain ISDA Master Agreements allow counterparties of over-the-counter derivatives transactions to terminate derivatives contracts prior to maturity in the event the Fund’s net asset value declines by a stated percentage over a specified time period or if the Fund fails to meet certain terms of the ISDA Master Agreement, which would cause the Fund to accelerate payment of any net liability owed to the counterparty. The Fund also has termination rights if the counterparty fails to meet certain terms of the ISDA Master Agreement. In determining whether to exercise such termination rights, the Fund would consider, in addition to counterparty credit risk, whether termination would result in a net liability owed from the counterparty.
For financial reporting purposes, the Fund does not offset derivative assets and derivative liabilities that are subject to netting arrangements in the Statement of Assets and Liabilities.
Futures contracts
Futures contracts are exchange-traded and represent commitments for the future purchase or sale of an asset at a specified price on a specified date. The Fund bought and sold futures contracts to manage the duration and yield curve exposure of the Fund versus the benchmark and to manage exposure to movements in interest rates. These instruments may be used for other purposes in future periods. Upon entering into futures contracts, the Fund bears risks that it may not achieve the anticipated benefits of the futures contracts and may realize a loss. Additional risks include counterparty credit risk, the possibility of an illiquid market, and that a change in the value of the contract or option may not correlate with changes in the value of the underlying asset.
Upon entering into a futures contract, the Fund deposits cash or securities with the broker, known as a futures commission merchant (FCM), in an amount sufficient to meet the initial margin requirement. The initial margin deposit must be maintained at an established level over the life of the contract. Cash deposited as initial margin is recorded in the Statement of Assets and Liabilities as margin deposits. Securities deposited as initial margin are designated in the Portfolio of Investments. Subsequent payments (variation margin) are made or received by the Fund each day. The variation margin payments are equal to the daily change in the contract value and are recorded as variation margin receivable or payable and are offset in
| 28 | Columbia Small Cap Index Fund | Annual Report 2022 |
Notes to Financial Statements (continued)
February 28, 2022
unrealized gains or losses. The Fund generally expects to earn interest income on its margin deposits. The Fund recognizes a realized gain or loss when the contract is closed or expires. Futures contracts involve, to varying degrees, risk of loss in excess of the variation margin disclosed in the Statement of Assets and Liabilities.
Effects of derivative transactions in the financial statements
The following tables are intended to provide additional information about the effect of derivatives on the financial statements of the Fund, including: the fair value of derivatives by risk category and the location of those fair values in the Statement of Assets and Liabilities; and the impact of derivative transactions over the period in the Statement of Operations, including realized and unrealized gains (losses). The derivative instrument schedules following the Portfolio of Investments present additional information regarding derivative instruments outstanding at the end of the period, if any.
The following table is a summary of the fair value of derivative instruments (not considered to be hedging instruments for accounting disclosure purposes) at February 28, 2022:
| | Asset derivatives | |
Risk exposure
category | Statement
of assets and liabilities
location | Fair value ($) |
| Equity risk | Component of total distributable earnings (loss) — unrealized appreciation on futures contracts | 579,082* |
| * | Includes cumulative appreciation (depreciation) as reported in the tables following the Portfolio of Investments. Only the current day’s variation margin is reported in receivables or payables in the Statement of Assets and Liabilities. |
The following table indicates the effect of derivative instruments (not considered to be hedging instruments for accounting disclosure purposes) in the Statement of Operations for the year ended February 28, 2022:
| Amount of realized gain (loss) on derivatives recognized in income |
| Risk exposure category | | | | | | Futures
contracts
($) |
| Equity risk | | | | | | 250,460 |
| |
| Change in unrealized appreciation (depreciation) on derivatives recognized in income |
| Risk exposure category | | | | | | Futures
contracts
($) |
| Equity risk | | | | | | (535,504) |
The following table is a summary of the average outstanding volume by derivative instrument for the year ended February 28, 2022:
| Derivative instrument | Average notional
amounts ($)* |
| Futures contracts — long | 48,409,101 |
| * | Based on the ending quarterly outstanding amounts for the year ended February 28, 2022. |
Security transactions
Security transactions are accounted for on the trade date. Cost is determined and gains (losses) are based upon the specific identification method for both financial statement and federal income tax purposes.
Income recognition
Corporate actions and dividend income are generally recorded net of any non-reclaimable tax withholdings, on the ex-dividend date or upon receipt of an ex-dividend notification in the case of certain foreign securities.
Columbia Small Cap Index Fund | Annual Report 2022
| 29 |
Notes to Financial Statements (continued)
February 28, 2022
The Fund may receive distributions from holdings in equity securities, business development companies (BDCs), exchange-traded funds (ETFs), limited partnerships (LPs), other regulated investment companies (RICs), and real estate investment trusts (REITs), which report information as to the tax character of their distributions annually. These distributions are allocated to dividend income, capital gain and return of capital based on actual information reported. Return of capital is recorded as a reduction of the cost basis of securities held. If the Fund no longer owns the applicable securities, return of capital is recorded as a realized gain. With respect to REITs, to the extent actual information has not yet been reported, estimates for return of capital are made by Columbia Management Investment Advisers, LLC (the Investment Manager), a wholly-owned subsidiary of Ameriprise Financial, Inc. (Ameriprise Financial). The Investment Manager’s estimates are subsequently adjusted when the actual character of the distributions is disclosed by the REITs, which could result in a proportionate change in return of capital to shareholders.
Awards from class action litigation are recorded as a reduction of cost basis if the Fund still owns the applicable securities on the payment date. If the Fund no longer owns the applicable securities on the payment date, the proceeds are recorded as realized gains.
Expenses
General expenses of the Trust are allocated to the Fund and other funds of the Trust based upon relative net assets or other expense allocation methodologies determined by the nature of the expense. Expenses directly attributable to the Fund are charged to the Fund. Expenses directly attributable to a specific class of shares are charged to that share class.
Determination of class net asset value
All income, expenses (other than class-specific expenses, which are charged to that share class, as shown in the Statement of Operations) and realized and unrealized gains (losses) are allocated to each class of the Fund on a daily basis, based on the relative net assets of each class, for purposes of determining the net asset value of each class.
Federal income tax status
The Fund intends to qualify each year as a regulated investment company under Subchapter M of the Internal Revenue Code, as amended, and will distribute substantially all of its investment company taxable income and net capital gain, if any, for its tax year, and as such will not be subject to federal income taxes. In addition, the Fund intends to distribute in each calendar year substantially all of its ordinary income, capital gain net income and certain other amounts, if any, such that the Fund should not be subject to federal excise tax. Therefore, no federal income or excise tax provision is recorded.
Foreign taxes
The Fund may be subject to foreign taxes on income, gains on investments or currency repatriation, a portion of which may be recoverable. The Fund will accrue such taxes and recoveries, as applicable, based upon its current interpretation of tax rules and regulations that exist in the markets in which it invests.
Realized gains in certain countries may be subject to foreign taxes at the Fund level, based on statutory rates. The Fund accrues for such foreign taxes on realized and unrealized gains at the appropriate rate for each jurisdiction, as applicable. The amount, if any, is disclosed as a liability on the Statement of Assets and Liabilities.
Distributions to shareholders
Distributions from net investment income, if any, are declared and paid semi-annually. Net realized capital gains, if any, are distributed at least annually. Income distributions and capital gain distributions are determined in accordance with federal income tax regulations, which may differ from GAAP.
Guarantees and indemnifications
Under the Trust’s organizational documents and, in some cases, by contract, its officers and trustees are indemnified against certain liabilities arising out of the performance of their duties to the Trust or its funds. In addition, certain of the Fund’s contracts with its service providers contain general indemnification clauses. The Fund’s maximum exposure under these arrangements is unknown since the amount of any future claims that may be made against the Fund cannot be determined, and the Fund has no historical basis for predicting the likelihood of any such claims.
| 30 | Columbia Small Cap Index Fund | Annual Report 2022 |
Notes to Financial Statements (continued)
February 28, 2022
Note 3. Fees and other transactions with affiliates
Management services fees
The Fund has entered into a Management Agreement with Columbia Management Investment Advisers, LLC (the Investment Manager), a wholly-owned subsidiary of Ameriprise Financial, Inc. (Ameriprise Financial). Under the Management Agreement, the Investment Manager provides the Fund with investment research and advice, as well as administrative and accounting services. The management services fee is an annual fee that is equal to 0.20% of the Fund’s daily net assets.
The Investment Manager, from the management services fee it receives from the Fund, pays all operating expenses of the Fund, with the exception of brokerage fees and commissions, taxes, interest, fees and expenses of Board of Trustees who are not officers, directors or employees of the Investment Manager or its affiliates, distribution and/or shareholder servicing and any extraordinary non-recurring expenses that may arise, including litigation fees.
Compensation of board members
Members of the Board of Trustees who are not officers or employees of the Investment Manager or Ameriprise Financial are compensated for their services to the Fund as disclosed in the Statement of Operations. Under a Deferred Compensation Plan (the Deferred Plan), these members of the Board of Trustees may elect to defer payment of up to 100% of their compensation. Deferred amounts are treated as though equivalent dollar amounts had been invested in shares of certain funds managed by the Investment Manager. The Fund’s liability for these amounts is adjusted for market value changes and remains in the Fund until distributed in accordance with the Deferred Plan. All amounts payable under the Deferred Plan constitute a general unsecured obligation of the Fund. The expense for the Deferred Plan, which includes Trustees’ fees deferred during the current period as well as any gains or losses on the Trustees’ deferred compensation balances as a result of market fluctuations, is included in "Compensation of board members" on the Statement of Operations.
Compensation of Chief Compliance Officer
The Board of Trustees has appointed a Chief Compliance Officer for the Fund in accordance with federal securities regulations. A portion of the Chief Compliance Officer’s total compensation is allocated to the Fund, along with other allocations to affiliated registered investment companies managed by the Investment Manager and its affiliates, based on relative net assets. The expenses of the Chief Compliance Officer allocated to the Fund are payable by the Investment Manager.
Transfer agency fees
Under a Transfer and Dividend Disbursing Agent Agreement, Columbia Management Investment Services Corp. (the Transfer Agent), an affiliate of the Investment Manager and a wholly-owned subsidiary of Ameriprise Financial, is responsible for providing transfer agency services to the Fund. The Transfer Agent has contracted with DST Asset Manager Solutions, Inc. (DST) to serve as sub-transfer agent.
The transfer agency fees are payable by the Investment Manager. The Transfer Agent pays the fees of DST for services as sub-transfer agent and DST is not entitled to reimbursement for such fees from the Fund. The Transfer Agent also receives compensation from the Investment Manager for various shareholder services and reimbursements for certain out-of-pocket expenses.
An annual minimum account balance fee of $20 may apply to certain accounts with a value below the applicable share class’s initial minimum investment requirements to reduce the impact of small accounts on transfer agency fees. These minimum account balance fees are remitted to the Fund and recorded as part of expense reductions in the Statement of Operations. For the year ended February 28, 2022, these minimum account balance fees reduced total expenses of the Fund by $1,080.
Distribution and service fees
The Fund has entered into an agreement with Columbia Management Investment Distributors, Inc. (the Distributor), an affiliate of the Investment Manager and a wholly-owned subsidiary of Ameriprise Financial, for distribution and shareholder services. The Board of Trustees has approved, and the Fund has adopted, distribution and shareholder service plans (the
Columbia Small Cap Index Fund | Annual Report 2022
| 31 |
Notes to Financial Statements (continued)
February 28, 2022
Plans) applicable to certain share classes, which set the distribution and service fees for the Fund. These fees are calculated daily and are intended to compensate the Distributor and/or eligible selling and/or servicing agents for selling shares of the Fund and providing services to investors.
Under the Plans, the Fund pays a monthly combined distribution and service fee to the Distributor at the maximum annual rate of 0.25% of the average daily net assets attributable to Class A shares of the Fund.
Expenses waived/reimbursed by the Investment Manager and its affiliates
The Investment Manager and certain of its affiliates have contractually agreed to waive fees and/or reimburse expenses (excluding certain fees and expenses described below) for the period(s) disclosed below, unless sooner terminated at the sole discretion of the Board of Trustees, so that the Fund’s net operating expenses, after giving effect to fees waived/expenses reimbursed and any balance credits and/or overdraft charges from the Fund’s custodian, do not exceed the following annual rate(s) as a percentage of the classes’ average daily net assets:
| | Fee rate(s) contractual
through
June 30, 2022 |
| Class A | 0.45% |
| Institutional Class | 0.20 |
| Institutional 2 Class | 0.20 |
| Institutional 3 Class | 0.20 |
Under the agreement governing these fee waivers and/or expense reimbursement arrangements, the following fees and expenses are excluded from the waiver/reimbursement commitment, and therefore will be paid by the Fund, if applicable: taxes (including foreign transaction taxes), expenses associated with investments in affiliated and non-affiliated pooled investment vehicles (including mutual funds and exchange-traded funds), transaction costs and brokerage commissions, costs related to any securities lending program, dividend expenses associated with securities sold short, inverse floater program fees and expenses, transaction charges and interest on borrowed money, interest, costs associated with shareholder meetings, infrequent and/or unusual expenses and any other expenses the exclusion of which is specifically approved by the Board of Trustees. This agreement may be modified or amended only with approval from the Investment Manager, certain of its affiliates and the Fund. Any fees waived and/or expenses reimbursed under the expense reimbursement arrangements described above are not recoverable by the Investment Manager or its affiliates in future periods.
Note 4. Federal tax information
The timing and character of income and capital gain distributions are determined in accordance with income tax regulations, which may differ from GAAP because of temporary or permanent book to tax differences.
At February 28, 2022, these differences were primarily due to differing treatment for deferral/reversal of wash sale losses, trustees’ deferred compensation, derivative investments, re-characterization of distributions for investments, distribution reclassifications and foreign currency transactions. To the extent these differences were permanent, reclassifications were made among the components of the Fund’s net assets. Temporary differences do not require reclassifications.
The following reclassifications were made:
Excess of distributions
over net investment
income ($) | Accumulated
net realized
gain ($) | Paid in
capital ($) |
| (321,089) | 321,089 | — |
Net investment income (loss) and net realized gains (losses), as disclosed in the Statement of Operations, and net assets were not affected by this reclassification.
| 32 | Columbia Small Cap Index Fund | Annual Report 2022 |
Notes to Financial Statements (continued)
February 28, 2022
The tax character of distributions paid during the years indicated was as follows:
| Year Ended February 28, 2022 | Year Ended February 28, 2021 |
Ordinary
income ($) | Long-term
capital gains ($) | Total ($) | Ordinary
income ($) | Long-term
capital gains ($) | Total ($) |
| 71,711,256 | 275,303,443 | 347,014,699 | 36,587,589 | 77,611,425 | 114,199,014 |
Short-term capital gain distributions, if any, are considered ordinary income distributions for tax purposes.
At February 28, 2022, the components of distributable earnings on a tax basis were as follows:
Undistributed
ordinary income ($) | Undistributed
long-term
capital gains ($) | Capital loss
carryforwards ($) | Net unrealized
appreciation ($) |
| — | 106,591,157 | — | 1,533,765,305 |
At February 28, 2022, the cost of all investments for federal income tax purposes along with the aggregate gross unrealized appreciation and depreciation based on that cost was:
Federal
tax cost ($) | Gross unrealized
appreciation ($) | Gross unrealized
(depreciation) ($) | Net unrealized
appreciation ($) |
| 2,591,384,660 | 1,776,719,795 | (242,954,490) | 1,533,765,305 |
Tax cost of investments and unrealized appreciation/(depreciation) may also include timing differences that do not constitute adjustments to tax basis.
Management of the Fund has concluded that there are no significant uncertain tax positions in the Fund that would require recognition in the financial statements. However, management’s conclusion may be subject to review and adjustment at a later date based on factors including, but not limited to, new tax laws, regulations, and administrative interpretations (including relevant court decisions). Generally, the Fund’s federal tax returns for the prior three fiscal years remain subject to examination by the Internal Revenue Service.
Note 5. Portfolio information
The cost of purchases and proceeds from sales of securities, excluding short-term investments and derivatives, if any, aggregated to $583,060,714 and $950,590,260, respectively, for the year ended February 28, 2022. The amount of purchase and sale activity impacts the portfolio turnover rate reported in the Financial Highlights.
Note 6. Affiliated money market fund
The Fund invests in Columbia Short-Term Cash Fund, an affiliated money market fund established for the exclusive use by the Fund and other affiliated funds (the Affiliated MMF). The income earned by the Fund from such investments is included as Dividends - affiliated issuers in the Statement of Operations. As an investing fund, the Fund indirectly bears its proportionate share of the expenses of the Affiliated MMF. The Affiliated MMF prices its shares with a floating net asset value. In addition, the Board of Trustees of the Affiliated MMF may impose a fee on redemptions (sometimes referred to as a liquidity fee) or temporarily suspend redemptions (sometimes referred to as imposing a redemption gate) in the event its liquidity falls below regulatory limits.
Note 7. Interfund lending
Pursuant to an exemptive order granted by the Securities and Exchange Commission, the Fund participates in a program (the Interfund Program) allowing each participating Columbia Fund (each, a Participating Fund) to lend money directly to and, except for closed-end funds and money market funds, borrow money directly from other Participating Funds for temporary purposes. The amounts eligible for borrowing and lending under the Interfund Program are subject to certain restrictions.
Columbia Small Cap Index Fund | Annual Report 2022
| 33 |
Notes to Financial Statements (continued)
February 28, 2022
Interfund loans are subject to the risk that the borrowing fund could be unable to repay the loan when due, and a delay in repayment to the lending fund could result in lost opportunities and/or additional lending costs. The exemptive order is subject to conditions intended to mitigate conflicts of interest arising from the Investment Manager’s relationship with each Participating Fund.
The Fund did not borrow or lend money under the Interfund Program during the year ended February 28, 2022.
Note 8. Line of credit
The Fund has access to a revolving credit facility with a syndicate of banks led by JPMorgan Chase Bank, N.A., Citibank, N.A. and Wells Fargo Bank, N.A. whereby the Fund may borrow for the temporary funding of shareholder redemptions or for other temporary or emergency purposes. Pursuant to an October 28, 2021 amendment and restatement, the credit facility, which is an agreement between the Fund and certain other funds managed by the Investment Manager or an affiliated investment manager, severally and not jointly, permits aggregate borrowings up to $950 million. Interest is currently charged to each participating fund based on its borrowings at a rate equal to the higher of (i) the federal funds effective rate, (ii) the secured overnight financing rate plus 0.11448% and (iii) the overnight bank funding rate, plus in each case, 1.00%. Each borrowing under the credit facility matures no later than 60 days after the date of borrowing. The Fund also pays a commitment fee equal to its pro rata share of the unused amount of the credit facility at a rate of 0.15% per annum. The commitment fee is included in other expenses in the Statement of Operations. This agreement expires annually in October unless extended or renewed. Prior to the October 28, 2021 amendment and restatement, the Fund had access to a revolving credit facility with a syndicate of banks led by JPMorgan Chase Bank, N.A., Citibank, N.A. and Wells Fargo Bank, N.A. which permitted collective borrowings up to $950 million. Interest was charged to each participating fund based on its borrowings at a rate equal to the higher of (i) the federal funds effective rate, (ii) the one-month London Interbank Offered Rate (LIBOR) rate and (iii) the overnight bank funding rate, plus in each case, 1.25%.
The Fund had no borrowings during the year ended February 28, 2022.
Note 9. Significant risks
Market risk
The Fund may incur losses due to declines in the value of one or more securities in which it invests. These declines may be due to factors affecting a particular issuer, or the result of, among other things, political, regulatory, market, economic or social developments affecting the relevant market(s) more generally. In addition, turbulence in financial markets and reduced liquidity in equity, credit and/or fixed income markets may negatively affect many issuers, which could adversely affect the Fund, including causing difficulty in assigning prices to hard-to-value assets in thinly traded and closed markets, significant redemptions and operational challenges. Global economies and financial markets are increasingly interconnected, and conditions and events in one country, region or financial market may adversely impact issuers in a different country, region or financial market. These risks may be magnified if certain events or developments adversely interrupt the global supply chain; in these and other circumstances, such risks might affect companies worldwide. As a result, local, regional or global events such as terrorism, war, natural disasters, disease/virus outbreaks and epidemics or other public health issues, recessions, depressions or other events – or the potential for such events – could have a significant negative impact on global economic and market conditions.
The large-scale invasion of Ukraine by Russia in February 2022 has resulted in sanctions and market disruptions, including declines in regional and global stock and commodity markets and significant devaluations of Russian currency. The extent and duration of the military action are impossible to predict but could be significant. Market disruption caused by the Russian military action, and any counter measures or responses thereto (including international sanctions, a downgrade in the country’s credit rating, purchasing and financing restrictions, boycotts, tariffs, changes in consumer or purchaser preferences, cyberattacks and espionage) could have a severe adverse impact on regional and/or global securities and commodities markets, including markets for oil and natural gas. These and other related events could have a negative impact on Fund performance and the value of an investment in the Fund.
| 34 | Columbia Small Cap Index Fund | Annual Report 2022 |
Notes to Financial Statements (continued)
February 28, 2022
The pandemic caused by coronavirus disease 2019 and its variants (COVID-19) has resulted in, and may continue to result in, significant global economic and societal disruption and market volatility due to disruptions in market access, resource availability, facilities operations, imposition of tariffs, export controls and supply chain disruption, among others. Such disruptions may be caused, or exacerbated by, quarantines and travel restrictions, workforce displacement and loss in human and other resources. The uncertainty surrounding the magnitude, duration, reach, costs and effects of the global pandemic, as well as actions that have been or could be taken by governmental authorities or other third parties, present unknowns that are yet to unfold. The impacts, as well as the uncertainty over impacts to come, of COVID-19 – and any other infectious illness outbreaks, epidemics and pandemics that may arise in the future – could negatively affect global economies and markets in ways that cannot necessarily be foreseen. In addition, the impact of infectious illness outbreaks and epidemics in emerging market countries may be greater due to generally less established healthcare systems, governments and financial markets. Public health crises caused by the COVID-19 outbreak may exacerbate other pre-existing political, social and economic risks in certain countries or globally. The disruptions caused by COVID-19 could prevent the Fund from executing advantageous investment decisions in a timely manner and negatively impact the Fund’s ability to achieve its investment objectives. Any such event(s) could have a significant adverse impact on the value and risk profile of the Fund.
Passive investment risk
The Fund is not “actively” managed and may be affected by a general decline in market segments related to its tracking index. The Fund invests in securities or instruments included in, or believed by the Investment Manager to be representative of, its tracking index, regardless of their investment merits. The Fund does not seek temporary defensive positions when markets decline or appear overvalued. The decision of whether to remove a security from the tracking index is made by an independent index provider who is not affiliated with the Fund or the Investment Manager.
Shareholder concentration risk
At February 28, 2022, two unaffiliated shareholders of record owned 30.8% of the outstanding shares of the Fund in one or more accounts. The Fund has no knowledge about whether any portion of those shares was owned beneficially. Affiliated shareholders of record owned 15.9% of the outstanding shares of the Fund in one or more accounts. Subscription and redemption activity by concentrated accounts may have a significant effect on the operations of the Fund. In the case of a large redemption, the Fund may be forced to sell investments at inopportune times, including its liquid positions, which may result in Fund losses and the Fund holding a higher percentage of less liquid positions. Large redemptions could result in decreased economies of scale and increased operating expenses for non-redeeming Fund shareholders.
Small- and mid-cap company risk
Investments in small- and mid-capitalization companies (small- and mid-cap companies) often involve greater risks than investments in larger, more established companies (larger companies) because small- and mid-cap companies tend to have less predictable earnings and may lack the management experience, financial resources, product diversification and competitive strengths of larger companies. Securities of small- and mid-cap companies may be less liquid and more volatile than the securities of larger companies.
Note 10. Subsequent events
Management has evaluated the events and transactions that have occurred through the date the financial statements were issued and noted no items requiring adjustment of the financial statements or additional disclosure.
Note 11. Information regarding pending and settled legal proceedings
Ameriprise Financial and certain of its affiliates are involved in the normal course of business in legal proceedings which include regulatory inquiries, arbitration and litigation, including class actions concerning matters arising in connection with the conduct of its activities as a diversified financial services firm. Ameriprise Financial believes that the Fund is not currently the subject of, and that neither Ameriprise Financial nor any of its affiliates are the subject of, any pending legal, arbitration or regulatory proceedings that are likely to have a material adverse effect on the Fund or the ability of Ameriprise Financial or its affiliates to perform under their contracts with the Fund. Ameriprise Financial is required to make quarterly (10-Q), annual
Columbia Small Cap Index Fund | Annual Report 2022
| 35 |
Notes to Financial Statements (continued)
February 28, 2022
(10-K) and, as necessary, 8-K filings with the Securities and Exchange Commission (SEC) on legal and regulatory matters that relate to Ameriprise Financial and its affiliates. Copies of these filings may be obtained by accessing the SEC website at www.sec.gov.
There can be no assurance that these matters, or the adverse publicity associated with them, will not result in increased Fund redemptions, reduced sale of Fund shares or other adverse consequences to the Fund. Further, although we believe proceedings are not likely to have a material adverse effect on the Fund or the ability of Ameriprise Financial or its affiliates to perform under their contracts with the Fund, these proceedings are subject to uncertainties and, as such, we are unable to estimate the possible loss or range of loss that may result. An adverse outcome in one or more of these proceedings could result in adverse judgments, settlements, fines, penalties or other relief that could have a material adverse effect on the consolidated financial condition or results of operations of Ameriprise Financial or one or more of its affiliates that provides services to the Fund.
| 36 | Columbia Small Cap Index Fund | Annual Report 2022 |
Report of Independent Registered Public Accounting Firm
To the Board of Trustees of Columbia Funds Series Trust and Shareholders of Columbia Small Cap Index Fund
Opinion on the Financial Statements
We have audited the accompanying statement of assets and liabilities, including the portfolio of investments, of Columbia Small Cap Index Fund (one of the funds constituting Columbia Funds Series Trust, referred to hereafter as the "Fund") as of February 28, 2022, the related statement of operations for the year ended February 28, 2022, the statement of changes in net assets for each of the two years in the period ended February 28, 2022, including the related notes, and the financial highlights for each of the five years in the period ended February 28, 2022 (collectively referred to as the "financial statements"). In our opinion, the financial statements present fairly, in all material respects, the financial position of the Fund as of February 28, 2022, the results of its operations for the year then ended, the changes in its net assets for each of the two years in the period ended February 28, 2022 and the financial highlights for each of the five years in the period ended February 28, 2022 in conformity with accounting principles generally accepted in the United States of America.
Basis for Opinion
These financial statements are the responsibility of the Fund’s management. Our responsibility is to express an opinion on the Fund’s financial statements based on our audits. We are a public accounting firm registered with the Public Company Accounting Oversight Board (United States) (PCAOB) and are required to be independent with respect to the Fund in accordance with the U.S. federal securities laws and the applicable rules and regulations of the Securities and Exchange Commission and the PCAOB.
We conducted our audits of these financial statements in accordance with the standards of the PCAOB. Those standards require that we plan and perform the audit to obtain reasonable assurance about whether the financial statements are free of material misstatement, whether due to error or fraud.
Our audits included performing procedures to assess the risks of material misstatement of the financial statements, whether due to error or fraud, and performing procedures that respond to those risks. Such procedures included examining, on a test basis, evidence regarding the amounts and disclosures in the financial statements. Our audits also included evaluating the accounting principles used and significant estimates made by management, as well as evaluating the overall presentation of the financial statements. Our procedures included confirmation of securities owned as of February 28, 2022 by correspondence with the custodian, transfer agent and broker. We believe that our audits provide a reasonable basis for our opinion.
/s/PricewaterhouseCoopers LLP
Minneapolis, Minnesota
April 21, 2022
We have served as the auditor of one or more investment companies within the Columbia Funds Complex since 1977.
Columbia Small Cap Index Fund | Annual Report 2022
| 37 |
Federal Income Tax Information
(Unaudited)
Qualified
dividend
income | Dividends
received
deduction | Section
199A
dividends | Capital
gain
dividend |
| 77.10% | 76.17% | 9.69% | $320,374,033 |
Qualified dividend income. For taxable, non-corporate shareholders, the percentage of ordinary income distributed during the fiscal year that represents qualified dividend income subject to reduced tax rates.
Dividends received deduction. The percentage of ordinary income distributed during the fiscal year that qualifies for the corporate dividends received deduction.
Section 199A dividends. For taxable, non-corporate shareholders, the percentage of ordinary income distributed during the fiscal year that represents Section 199A dividends potentially eligible for a 20% deduction.
Capital gain dividend. The Fund designates as a capital gain dividend the amount reflected above, or if subsequently determined to be different, the net capital gain of such fiscal period.
TRUSTEES AND OFFICERS
The Board oversees the Fund’s operations and appoints officers who are responsible for day-to-day business decisions based on policies set by the Board. The following table provides basic biographical information about the Fund’s Trustees as of the printing of this report, including their principal occupations during the past five years, although specific titles for individuals may have varied over the period. The year set forth beneath Length of Service in the table below is the year in which the Trustee was first appointed or elected as Trustee to any Fund currently in the Columbia Funds Complex or a predecessor thereof. Under current Board policy, each Trustee generally serves until December 31 of the year such Trustee turns seventy-five (75).
Independent trustees
Name,
address,
year of birth | Position held
with the Columbia Funds and
length of service | Principal occupation(s)
during past five years
and other relevant
professional experience | Number of
Funds in the
Columbia Funds
Complex*
overseen | Other directorships
held by Trustee
during the past
five years |
George S. Batejan
c/o Columbia Management
Investment Advisers, LLC
290 Congress Street
Boston, MA 02210
1953 | Trustee since 2017 | Executive Vice President, Global Head of Technology and Operations, Janus Capital Group, Inc., 2010-2016 | 177 | Former Chairman of the Board, NICSA (National Investment Company Services Association) (Executive Committee, Nominating Committee and Governance Committee), 2014-2016; former Director, Intech Investment Management, 2011-2016; former Board Member, Metro Denver Chamber of Commerce, 2015-2016; former Advisory Board Member, University of Colorado Business School, 2015-2018 |
| 38 | Columbia Small Cap Index Fund | Annual Report 2022 |
TRUSTEES AND OFFICERS (continued)
Independent trustees (continued)
Name,
address,
year of birth | Position held
with the Columbia Funds and
length of service | Principal occupation(s)
during past five years
and other relevant
professional experience | Number of
Funds in the
Columbia Funds
Complex*
overseen | Other directorships
held by Trustee
during the past
five years |
Kathleen Blatz
c/o Columbia Management
Investment Advisers, LLC
290 Congress Street
Boston, MA 02210
1954 | Trustee since 2006 | Attorney, specializing in arbitration and mediation; Chief Justice, Minnesota Supreme Court, 1998-2006; Associate Justice, Minnesota Supreme Court, 1996-1998; Fourth Judicial District Court Judge, Hennepin County, 1994-1996; Attorney in private practice and public service, 1984-1993; State Representative, Minnesota House of Representatives, 1979-1993, which included service on the Tax and Financial Institutions and Insurance Committees; Member and Interim Chair, Minnesota Sports Facilities Authority, January 2017-July 2017; Interim President and Chief Executive Officer, Blue Cross and Blue Shield of Minnesota (health care insurance), February-July 2018, April-October 2021 | 177 | Former Trustee, Blue Cross and Blue Shield of Minnesota, 2009-2021 (Chair of the Business Development Committee, 2014-2017; Chair of the Governance Committee, 2017-2019); former Member and Chair of the Board, Minnesota Sports Facilities Authority, January 2017-July 2017; former Director, Robina Foundation, 2009-2020 (Chair, 2014-2020); Director, Schulze Family Foundation, since 2021 |
Pamela G. Carlton
c/o Columbia Management
Investment Advisers, LLC
290 Congress Street
Boston, MA 02210
1954 | Trustee since 2007 | President, Springboard — Partners in Cross Cultural Leadership (consulting company) since 2003; Managing Director of US Equity Research, JP Morgan Chase, 1999-2003; Director of US Equity Research, Chase Asset Management, 1996-1999; Co-Director Latin America Research, 1993-1996, COO Global Research, 1992-1996, Co-Director of US Research, 1991-1992, Investment Banker, Morgan Stanley, 1982-1991, Morgan Stanley; Attorney, Cleary Gottlieb Steen & Hamilton LLP, 1980-1982 | 177 | Trustee, New York Presbyterian Hospital Board (Executive Committee and Chair of People Committee) since 1996; Director, DR Bank (Audit Committee) since 2017; Director, Evercore Inc. (Audit Committee) since 2019; Director, Apollo Commercial Real Estate Finance, Inc. since 2021; the Governing Council of the Independent Directors Council (IDC), since 2021 |
Janet Langford Carrig
c/o Columbia Management
Investment Advisers, LLC
290 Congress Street
Boston, MA 02210
1957 | Trustee since 1996 | Senior Vice President, General Counsel and Corporate Secretary, ConocoPhillips (independent energy company), September 2007-October 2018 | 175 | Director, EQT Corporation (natural gas producer) since 2019; Director, Whiting Petroleum Corporation (independent oil and gas company) since 2020 |
J. Kevin Connaughton
c/o Columbia Management
Investment Advisers, LLC
290 Congress Street
Boston, MA 02210
1964 | Trustee since 2020 | Member, FINRA National Adjudicatory Council since January 2020; Adjunct Professor of Finance, Bentley University since January 2018; Consultant to Independent Trustees of CFVIT and CFST I from March 2016 to June 2020 with respect to CFVIT and to December 2020 with respect to CFST I; Managing Director and General Manager of Mutual Fund Products, Columbia Management Investment Advisers, LLC, May 2010-February 2015; President, Columbia Funds, 2008-2015; and senior officer of Columbia Funds and affiliated funds, 2003-2015 | 175 | Former Director, The Autism Project, March 2015-December 2021; former Member of the Investment Committee, St. Michael’s College, November 2015-February 2020; former Trustee, St. Michael’s College, June 2017-September 2019; former Trustee, New Century Portfolios, January 2015-December 2017 |
Columbia Small Cap Index Fund | Annual Report 2022
| 39 |
TRUSTEES AND OFFICERS (continued)
Independent trustees (continued)
Name,
address,
year of birth | Position held
with the Columbia Funds and
length of service | Principal occupation(s)
during past five years
and other relevant
professional experience | Number of
Funds in the
Columbia Funds
Complex*
overseen | Other directorships
held by Trustee
during the past
five years |
Olive M. Darragh
c/o Columbia Management
Investment Advisers, LLC
290 Congress Street
Boston, MA 02210
1962 | Trustee since 2020 | Managing Director of Darragh Inc. (strategy and talent management consulting firm) since 2010; Founder and CEO, Zolio, Inc. (investment management talent identification platform) since 2004; Consultant to Independent Trustees of CFVIT and CFST I from June 2019 to June 2020 with respect to CFVIT and to December 2020 with respect to CFST I; Partner, Tudor Investments, 2004-2010; Senior Partner, McKinsey & Company (consulting), 1990-2004; Touche Ross CPA, 1985-1988 | 175 | Former Director, University of Edinburgh Business School (Member of US Board); former Director, Boston Public Library Foundation |
Patricia M. Flynn
c/o Columbia Management
Investment Advisers, LLC
290 Congress Street
Boston, MA 02210
1950 | Trustee since 2004 | Trustee Professor of Economics and Management, Bentley University since 1976 (also teaches and conducts research on corporate governance); Dean, McCallum Graduate School of Business, Bentley University, 1992-2002 | 177 | Trustee, MA Taxpayers Foundation since 1997; Board of Governors, Innovation Institute, MA Technology Collaborative, 2010-2020; former Board of Directors, The MA Business Roundtable, 2003-2019 |
Brian J. Gallagher
c/o Columbia Management
Investment Advisers, LLC
290 Congress Street
Boston, MA 02210
1954 | Trustee since 2017 | Retired; Partner with Deloitte & Touche LLP and its predecessors, 1977-2016 | 177 | Trustee, Catholic Schools Foundation since 2004 |
Douglas A. Hacker
c/o Columbia Management
Investment Advisers, LLC
290 Congress Street
Boston, MA 02210
1955 | Co-Chair since 2021; Chair of CFST I and CFVIT since 2014; Trustee of CFST I and CFVIT since 1996 and CFST, CFST II, CFVST II, CET I and CET II since 2021 | Independent business executive since May 2006; Executive Vice President – Strategy of United Airlines, December 2002 - May 2006; President of UAL Loyalty Services (airline marketing company), September 2001-December 2002; Executive Vice President and Chief Financial Officer of United Airlines, July 1999-September 2001 | 177 | Director, Spartan Nash Company (food distributor); Director, Aircastle Limited (Chair of Audit Committee) (aircraft leasing); former Director, Nash Finch Company (food distributor), 2005-2013; former Director, SeaCube Container Leasing Ltd. (container leasing), 2010-2013; and former Director, Travelport Worldwide Limited (travel information technology), 2014-2019 |
Nancy T. Lukitsh
c/o Columbia Management
Investment Advisers, LLC
290 Congress Street
Boston, MA 02210
1956 | Trustee since 2011 | Senior Vice President, Partner and Director of Marketing, Wellington Management Company, LLP (investment adviser), 1997-2010; Chair, Wellington Management Portfolios (commingled non-U.S. investment pools), 2007 -2010; Director, Wellington Trust Company, NA and other Wellington affiliates, 1997-2010 | 175 | None |
| 40 | Columbia Small Cap Index Fund | Annual Report 2022 |
TRUSTEES AND OFFICERS (continued)
Independent trustees (continued)
Name,
address,
year of birth | Position held
with the Columbia Funds and
length of service | Principal occupation(s)
during past five years
and other relevant
professional experience | Number of
Funds in the
Columbia Funds
Complex*
overseen | Other directorships
held by Trustee
during the past
five years |
David M. Moffett
c/o Columbia Management
Investment Advisers, LLC
290 Congress Street
Boston, MA 02210
1952 | Trustee since 2011 | Retired; Consultant to Bridgewater and Associates | 175 | Director, CSX Corporation (transportation suppliers); Director, Genworth Financial, Inc. (financial and insurance products and services); Director, PayPal Holdings Inc. (payment and data processing services); Trustee, University of Oklahoma Foundation; former Director, eBay Inc. (online trading community), 2007-2015; and former Director, CIT Bank, CIT Group Inc. (commercial and consumer finance), 2010-2016 |
Catherine James Paglia
c/o Columbia Management
Investment Advisers, LLC
290 Congress Street
Boston, MA 02210
1952 | Co-Chair since 2021; Chair of CFST, CFST II, CFVST II, CET I and CET II since 2020; Trustee of CFST, CFST II and CFVST II since 2004 and CFST I and CFVIT since 2021 | Director, Enterprise Asset Management, Inc. (private real estate and asset management company) since September 1998; Managing Director and Partner, Interlaken Capital, Inc., 1989-1997; Vice President, 1982-1985, Principal, 1985-1987, Managing Director, 1987-1989, Morgan Stanley; Vice President, Investment Banking, 1980-1982, Associate, Investment Banking, 1976-1980, Dean Witter Reynolds, Inc. | 177 | Director, Valmont Industries, Inc. (irrigation systems manufacturer) since 2012; Trustee, Carleton College (on the Investment Committee); Trustee, Carnegie Endowment for International Peace (on the Investment Committee) |
Minor M. Shaw
c/o Columbia Management
Investment Advisers, LLC
290 Congress Street
Boston, MA 02210
1947 | Trustee since 2003 | President, Micco LLC (private investments) since 2011; President, Micco Corp. (family investment business), 1998-2011 | 177 | Director, Blue Cross Blue Shield of South Carolina (Chair of Compensation Committee) since April 2008; Trustee, Hollingsworth Funds (on the Investment Committee) since 2016 (previously Board Chair from 2016-2019); Former Advisory Board member, Duke Energy Corp., 2016-2020; Chair of the Duke Endowment; Chair of Greenville – Spartanburg Airport Commission; former Trustee, BofA Funds Series Trust (11 funds), 2003-2011; former Director, Piedmont Natural Gas, 2004-2016; former Director, National Association of Corporate Directors, Carolinas Chapter, 2013-2018; Chair, Daniel-Mickel Foundation since 1998 |
Columbia Small Cap Index Fund | Annual Report 2022
| 41 |
TRUSTEES AND OFFICERS (continued)
Independent trustees (continued)
Name,
address,
year of birth | Position held
with the Columbia Funds and
length of service | Principal occupation(s)
during past five years
and other relevant
professional experience | Number of
Funds in the
Columbia Funds
Complex*
overseen | Other directorships
held by Trustee
during the past
five years |
Natalie A. Trunow
c/o Columbia Management
Investment Advisers, LLC
290 Congress Street
Boston, MA 02210
1967 | Trustee since 2020 | Chief Executive Officer, Millennial Portfolio Solutions LLC (asset management and consulting services), January 2016-January 2021; Non-executive Member of the Investment Committee and Valuation Committee, Sarona Asset Management Inc. (private equity firm) since September 2019; Advisor, Horizon Investments (asset management and consulting services), August 2018-January 2021; Advisor, Paradigm Asset Management, November 2016-December 2021; Consultant to Independent Trustees of CFVIT and CFST I from September 2016 to June 2020 with respect to CFVIT and to December 2020 with respect to CFST I; Director of Investments/Consultant, Casey Family Programs, April 2016-November 2016; Senior Vice President and Chief Investment Officer, Calvert Investments, August 2008-January 2016; Section Head and Portfolio Manager, General Motors Asset Management, June 1997-August 2008 | 175 | Former Director, Investment Committee, Health Services for Children with Special Needs, Inc., 2012-2019; Director, Chair of Audit Committee, Consumer Credit Counseling Services (formerly Guidewell Financial Solutions), since 2019; Independent Director, Investment Committee and Valuation Committee, Sarona Asset Management, since 2019 |
Sandra Yeager
c/o Columbia Management
Investment Advisers, LLC
290 Congress Street
Boston, MA 02210
1964 | Trustee since 2017 | Retired; President and founder, Hanoverian Capital, LLC (SEC registered investment advisor firm), 2008-2016; Managing Director, DuPont Capital, 2006-2008; Managing Director, Morgan Stanley Investment Management, 2004-2006; Senior Vice President, Alliance Bernstein, 1990-2004 | 177 | Former Director, NAPE Education Foundation, October 2016-October 2020 |
| * | The term “Columbia Funds Complex” as used herein includes Columbia Seligman Premium Technology Growth Fund, Tri-Continental Corporation and each series of Columbia Fund Series Trust (CFST), Columbia Funds Series Trust I (CFST I), Columbia Funds Series Trust II (CFST II), Columbia ETF Trust I (CET I), Columbia ETF Trust II (CET II), Columbia Funds Variable Insurance Trust (CFVIT) and Columbia Funds Variable Series Trust II (CFVST II). Messrs. Batejan, Beckman, Gallagher and Hacker and Mses. Blatz, Carlton, Flynn, Paglia, Shaw and Yeager serve as Directors of Columbia Seligman Premium Technology Growth Fund and Tri-Continental Corporation. |
Interested trustee affiliated with Investment Manager*
Name,
address,
year of birth | Position held with the Columbia Funds and length of service | Principal occupation(s) during the
past five years and other relevant
professional experience | Number of
Funds in the
Columbia Funds
Complex overseen | Other directorships
held by Trustee
during the past
five years |
Daniel J. Beckman
c/o Columbia Management
Investment Advisers, LLC
290 Congress Street
Boston, MA 02210
1962 | Trustee since November 2021 and President since June 2021 | Vice President – Head of North America Product, Columbia Management Investment Advisers, LLC since April 2015; President and Principal Executive Officer of the Columbia Funds since June 2021; officer of Columbia Funds and affiliated funds, 2020-2021 | 177 | Director, Ameriprise Trust Company, since October 2016; Director, Columbia Management Investment Distributors, Inc. since November 2018; Board of Governors, Columbia Wanger Asset Management, LLC since January 2022 |
| * | Interested person (as defined under the 1940 Act) by reason of being an officer, director, security holder and/or employee of the Investment Manager or Ameriprise Financial. |
The Statement of Additional Information has additional information about the Fund’s Board members and is available, without charge, upon request by calling 800.345.6611, visiting columbiathreadneedleus.com/investor/ or contacting your financial intermediary.
| 42 | Columbia Small Cap Index Fund | Annual Report 2022 |
TRUSTEES AND OFFICERS (continued)
The Board has appointed officers who are responsible for day-to-day business decisions based on policies it has established. The officers serve at the pleasure of the Board. The following table provides basic information about the Officers of the Fund as of the printing of this report, including principal occupations during the past five years, although their specific titles may have varied over the period. In addition to Mr. Beckman, who is President and Principal Executive Officer, the Fund’s other officers are:
Fund officers
Name,
address and
year of birth | Position and year
first appointed to
position for any Fund
in the Columbia
Funds Complex or a
predecessor thereof | Principal occupation(s) during past five years |
Michael G. Clarke
290 Congress Street
Boston, MA 02210
1969 | Chief Financial Officer and Principal Financial Officer (2009) and Senior Vice President (2019) | Senior Vice President and Head of Global Operations & Investor Services, Columbia Management Investment Advisers, LLC, since March 2022 (previously Vice President, Head of North American Operations, and Co-Head of Global Operations, June 2019 to February 2022 and Vice President – Accounting and Tax, May 2010 - May 2019); senior officer of Columbia Funds and affiliated funds since 2002. |
Joseph Beranek
5890 Ameriprise
Financial Center
Minneapolis, MN 55474
1965 | Treasurer and Chief Accounting Officer (Principal Accounting Officer) (2019) and Principal Financial Officer (2020), CFST, CFST I, CFST II, CFVIT and CFVST II; Assistant Treasurer, CET I and CET II | Vice President – Mutual Fund Accounting and Financial Reporting, Columbia Management Investment Advisers, LLC, since December 2018 and March 2017, respectively (previously Vice President – Pricing and Corporate Actions, May 2010 - March 2017). |
Marybeth Pilat
290 Congress Street
Boston, MA 02210
1968 | Treasurer and Chief Accounting Officer (Principal Accounting Officer) and Principal Financial Officer (2020) for CET I and CET II; Assistant Treasurer, CFST, CFST I, CFST II, CFVIT and CFVST II | Vice President – Product Pricing and Administration, Columbia Management Investment Advisers, LLC, since May 2017; Director - Fund Administration, Calvert Investments, August 2015 – March 2017; Vice President - Fund Administration, Legg Mason, May 2015 - July 2015; Vice President - Fund Administration, Columbia Management Investment Advisers, LLC, May 2010 - April 2015. |
William F. Truscott
290 Congress Street
Boston, MA 02210
1960 | Senior Vice President (2001) | Formerly, Trustee/Director of Columbia Funds Complex or legacy funds, November 2001-January 1, 2021; Chief Executive Officer, Global Asset Management, Ameriprise Financial, Inc. since September 2012; Chairman of the Board and President, Columbia Management Investment Advisers, LLC since July 2004 and February 2012, respectively; Chairman of the Board and Chief Executive Officer, Columbia Management Investment Distributors, Inc. since November 2008 and February 2012, respectively; Chairman of the Board and Director, Threadneedle Asset Management Holdings, Sàrl since March 2013 and December 2008, respectively; senior executive of various entities affiliated with Columbia Threadneedle. |
Christopher O. Petersen
5228 Ameriprise Financial Center
Minneapolis, MN 55474
1970 | Senior Vice President and Assistant Secretary | Formerly, Trustee/Director of funds within the Columbia Funds Complex, July 1, 2020 - November 22, 2021; Senior Vice President and Assistant General Counsel, Ameriprise Financial, Inc. since September 2021 (previously Vice President and Lead Chief Counsel, January 2015 - September 2021); President and Principal Executive Officer of the Columbia Funds, 2015 - 2021; officer of Columbia Funds and affiliated funds since 2007. |
Thomas P. McGuire
290 Congress Street
Boston, MA 02210
1972 | Senior Vice President and Chief Compliance Officer (2012) | Vice President – Asset Management Compliance, Ameriprise Financial, Inc., since May 2010; Chief Compliance Officer, Columbia Acorn/Wanger Funds since December 2015; Chief Compliance Officer, Ameriprise Certificate Company, September 2010 – September 2020. |
Ryan C. Larrenaga
290 Congress Street
Boston, MA 02210
1970 | Senior Vice President (2017), Chief Legal Officer (2017), and Secretary (2015) | Vice President and Chief Counsel, Ameriprise Financial, Inc. since August 2018 (previously Vice President and Group Counsel, August 2011 - August 2018); Chief Legal Officer, Columbia Acorn/Wanger Funds, since September 2020; officer of Columbia Funds and affiliated funds since 2005. |
Columbia Small Cap Index Fund | Annual Report 2022
| 43 |
TRUSTEES AND OFFICERS (continued)
Fund officers (continued)
Name,
address and
year of birth | Position and year
first appointed to
position for any Fund
in the Columbia
Funds Complex or a
predecessor thereof | Principal occupation(s) during past five years |
Michael E. DeFao
290 Congress Street
Boston, MA 02210
1968 | Vice President (2011) and Assistant Secretary (2010) | Vice President and Chief Counsel, Ameriprise Financial, Inc. since May 2010; Vice President, Chief Legal Officer and Assistant Secretary, Columbia Management Investment Advisers, LLC since October 2021 (previously Vice President and Assistant Secretary, May 2010 – September 2021). |
Lyn Kephart-Strong
5228 Ameriprise
Financial Center
Minneapolis, MN 55474
1960 | Vice President (2015) | President, Columbia Management Investment Services Corp. since October 2014; Vice President & Resolution Officer, Ameriprise Trust Company since August 2009. |
| 44 | Columbia Small Cap Index Fund | Annual Report 2022 |
[THIS PAGE INTENTIONALLY LEFT BLANK]
[THIS PAGE INTENTIONALLY LEFT BLANK]
[THIS PAGE INTENTIONALLY LEFT BLANK]
Columbia Small Cap Index Fund
P.O. Box 219104
Kansas City, MO 64121-9104
Please read and consider the investment objectives, risks, charges and expenses for any fund carefully before investing. For a prospectus and summary prospectus, which contains this and other important information about the Fund, go to
columbiathreadneedleus.com/investor/. The Fund is distributed by Columbia Management Investment Distributors, Inc., member FINRA, and managed by Columbia Management Investment Advisers, LLC.
Columbia Threadneedle Investments (Columbia Threadneedle) is the global brand name of the Columbia and Threadneedle group of companies. All rights reserved.
© 2022 Columbia Management Investment Advisers, LLC.
columbiathreadneedleus.com/investor/

Annual Report
February 28, 2022
Columbia Small Cap Value Fund II
Not Federally Insured • No Financial Institution Guarantee • May Lose Value
If you elect to receive the shareholder report for Columbia Small Cap Value Fund II (the Fund) in paper, mailed to you, the Fund mails one shareholder report to each shareholder address, unless such shareholder elects to receive shareholder reports from the Fund electronically via e-mail or by having a paper notice mailed to you (Postcard Notice) that your Fund’s shareholder report is available at the Columbia funds’ website (columbiathreadneedleus.com/investor/). If you would like more than one report in paper to be mailed to you, or would like to elect to receive reports via e-mail or access them through Postcard Notice, please call shareholder services at 800.345.6611 and additional reports will be sent to you.
Proxy voting policies and procedures
The policy of the Board of Trustees is to vote the proxies of the companies in which the Fund holds investments consistent with the procedures as stated in the Statement of Additional Information (SAI). You may obtain a copy of the SAI without charge by calling 800.345.6611; contacting your financial intermediary; visiting columbiathreadneedleus.com/investor/; or searching the website of the Securities and Exchange Commission (SEC) at sec.gov. Information regarding how the Fund voted proxies relating to portfolio securities is filed with the SEC by August 31st for the most recent 12-month period ending June 30th of that year, and is available without charge by visiting columbiathreadneedleus.com/investor/, or searching the website of the SEC at sec.gov.
Quarterly schedule of investments
The Fund files a complete schedule of portfolio holdings with the SEC for the first and third quarters of each fiscal year on Form N-PORT. The Fund’s Form N-PORT filings are available on the SEC’s website at sec.gov. The Fund’s complete schedule of portfolio holdings, as filed on Form N-PORT, can also be obtained without charge, upon request, by calling 800.345.6611.
Additional Fund information
For more information about the Fund, please visit columbiathreadneedleus.com/investor/ or call 800.345.6611. Customer Service Representatives are available to answer your questions Monday through Friday from 8 a.m. to 7 p.m. Eastern time.
Fund investment manager
Columbia Management Investment Advisers, LLC (the Investment Manager)
290 Congress Street
Boston, MA 02210
Fund distributor
Columbia Management Investment Distributors, Inc.
290 Congress Street
Boston, MA 02210
Fund transfer agent
Columbia Management Investment Services Corp.
P.O. Box 219104
Kansas City, MO 64121-9104
Columbia Small Cap Value Fund II | Annual Report 2022
Investment objective
The Fund seeks long-term capital appreciation.
Portfolio management
Christian Stadlinger, Ph.D., CFA
Co-Portfolio Manager
Managed Fund since 2002
Jarl Ginsberg, CFA, CAIA
Co-Portfolio Manager
Managed Fund since 2003
Morningstar style boxTM
The Morningstar Style Box is based on a fund’s portfolio holdings. For equity funds, the vertical axis shows the market capitalization of the stocks owned, and the horizontal axis shows investment style (value, blend, or growth). Information shown is based on the most recent data provided by Morningstar.
© 2022 Morningstar, Inc. All rights reserved. The Morningstar information contained herein: (1) is proprietary to Morningstar and/or its content providers; (2) may not be copied or distributed; and (3) is not warranted to be accurate, complete or timely. Neither Morningstar nor its content providers are responsible for any damages or losses arising from any use of this information.
| Average annual total returns (%) (for the period ended February 28, 2022) |
| | | Inception | 1 Year | 5 Years | 10 Years |
| Class A | Excluding sales charges | 05/01/02 | 11.94 | 8.76 | 11.05 |
| | Including sales charges | | 5.50 | 7.48 | 10.40 |
| Advisor Class* | 11/08/12 | 12.26 | 9.05 | 11.32 |
| Class C | Excluding sales charges | 05/01/02 | 11.10 | 7.95 | 10.23 |
| | Including sales charges | | 10.15 | 7.95 | 10.23 |
| Institutional Class | 05/01/02 | 12.27 | 9.05 | 11.34 |
| Institutional 2 Class* | 11/08/12 | 12.41 | 9.22 | 11.47 |
| Institutional 3 Class* | 11/08/12 | 12.46 | 9.26 | 11.52 |
| Class R | 01/23/06 | 11.73 | 8.50 | 10.79 |
| Russell 2000 Value Index | | 6.63 | 7.97 | 10.66 |
Returns for Class A shares are shown with and without the maximum initial sales charge of 5.75%. Returns for Class C shares are shown with and without the 1.00% contingent deferred sales charge for the first year only. The Fund’s other share classes are not subject to sales charges and have limited eligibility. Please see the Fund’s prospectus for details. Performance for different share classes will vary based on differences in sales charges and fees associated with each share class. All results shown assume reinvestment of distributions during the period. Returns do not reflect the deduction of taxes that a shareholder may pay on Fund distributions or on the redemption of Fund shares. Performance results reflect the effect of any fee waivers or reimbursements of Fund expenses by Columbia Management Investment Advisers, LLC and/or any of its affiliates. Absent these fee waivers or expense reimbursement arrangements, performance results would have been lower.
The performance information shown represents past performance and is not a guarantee of future results. The investment return and principal value of your investment will fluctuate so that your shares, when redeemed, may be worth more or less than their original cost. Current performance may be lower or higher than the performance information shown. You may obtain performance information current to the most recent month-end by contacting your financial intermediary, visiting columbiathreadneedleus.com/investor/ or calling 800.345.6611.
| * | The returns shown for periods prior to the share class inception date (including returns for the Life of the Fund, if shown, which are since Fund inception) include the returns of the Fund’s oldest share class. Since the Fund launched more than one share class at its inception, Class A shares were used. These returns are adjusted to reflect any higher class-related operating expenses of the newer share classes, as applicable. Please visit columbiathreadneedleus.com/investor/investment-products/mutual-funds/appended-performance for more information. |
The Russell 2000 Value Index, an unmanaged index, tracks the performance of those Russell 2000 Index companies with lower price-to-book ratios and lower forecasted growth values.
Indices are not available for investment, are not professionally managed and do not reflect sales charges, fees, brokerage commissions, taxes or other expenses of investing. Securities in the Fund may not match those in an index.
Fund performance may be significantly negatively impacted by the economic impact of the COVID-19 pandemic. The COVID-19 pandemic has adversely impacted economies and capital markets around the world in ways that will likely continue and may change in unforeseen ways for an indeterminate period. The COVID-19 pandemic may exacerbate pre-existing political, social and economic risks in certain countries and globally.
Columbia Small Cap Value Fund II | Annual Report 2022
| 3 |
Fund at a Glance (continued)
Performance of a hypothetical $10,000 investment (February 29, 2012 — February 28, 2022)
The chart above shows the change in value of a hypothetical $10,000 investment in Class A shares of Columbia Small Cap Value Fund II during the stated time period, and does not reflect the deduction of taxes that a shareholder may pay on Fund distributions or on the redemption of Fund shares.
| Portfolio breakdown (%) (at February 28, 2022) |
| Common Stocks | 96.2 |
| Money Market Funds | 3.8 |
| Total | 100.0 |
Percentages indicated are based upon total investments excluding investments in derivatives, if any. The Fund’s portfolio composition is subject to change.
| Equity sector breakdown (%) (at February 28, 2022) |
| Communication Services | 1.8 |
| Consumer Discretionary | 7.4 |
| Consumer Staples | 3.3 |
| Energy | 8.4 |
| Financials | 29.7 |
| Health Care | 5.4 |
| Industrials | 17.2 |
| Information Technology | 5.9 |
| Materials | 8.4 |
| Real Estate | 7.3 |
| Utilities | 5.2 |
| Total | 100.0 |
Percentages indicated are based upon total equity investments. The Fund’s portfolio composition is subject to change.
| 4 | Columbia Small Cap Value Fund II | Annual Report 2022 |
Manager Discussion of Fund Performance
For the 12-month period that ended February 28, 2022, Class A shares of Columbia Small Cap Value Fund II returned 11.94% excluding sales charges. The Fund outperformed its benchmark, the Russell 2000 Value Index, which returned 6.63% for the same time period.
Market overview
U.S. equities posted gains through much of the 12-month period that ended February 28, 2022. As pandemic-related restrictions were eased, robust economic growth and corporate earnings drove gains for stocks. Both U.S. monetary and fiscal policy were highly supportive, as Congress approved massive spending packages that included direct payments to citizens and the U.S. Federal Reserve (Fed) maintained its benchmark overnight lending rate near zero while engaging in bond market purchases to keep longer term borrowing costs low. The fourth quarter of 2021 saw the Fed adopt a more hawkish tone in response to persistently high inflation, driven in large part by supply chain constraints and rising commodity prices, which led to increased market volatility. The first two months of 2022 brought a rocky start, with most major indices returning in negative territory as markets grappled with individual stock volatility, the number and timing of interest rate hikes by the Fed, inflation and geopolitical tensions. Of most significance, tensions between Russia and Ukraine near the end of the period, and the subsequent invasion of Ukraine by Russia on February 24, 2022, roiled global markets and drove significant sell-offs.
The energy sector led returns for the benchmark during the period, followed by the materials, utilities, financials and real estate sectors. The health care sector delivered double-digit negative returns for the benchmark during the period, followed by the information technology and consumer discretionary sectors, which also ended the period in negative territory.
The Fund’s notable contributors during the period
| • | The Fund’s outperformance of its benchmark during the period was driven by strong stock selection, most notably within the industrials, energy, consumer staples, materials and financials sectors. |
| • | Allocations also contributed to the Fund’s results versus its benchmark, particularly the Fund’s underweight in the health care sector, which delivered the worst returns for the benchmark during the period. |
| • | A top contributor to relative performance was the Fund’s position in industrial and construction equipment rental company Herc Holdings Inc. The firm reported strong quarterly earnings during the period and we believe it is actually poised to benefit from supply constraints in areas of the economy, as businesses utilize rentals to expand capacity. The company also announced an initiation of a quarterly dividend. |
| • | Other top contributors to performance included two exploration and production names within the energy sector, Ovintiv, Inc. and Matador Resources Co., which saw substantial gains as energy prices rose. Ovintiv also announced their intention to accelerate their debt reduction plans through further divestitures. |
| • | Within consumer staples, the Fund’s position in United Natural Foods, Inc. was a notable contributor to outperformance. Shares in the company, which distributes natural and organic foods, climbed toward the end of the period after reporting quarterly results that beat consensus expectations. The company also raised its forward guidance. The beat (exceeded expectations) and raise (raised guidance) was driven by continued strong execution and better gross margins. |
| • | Within information technology, the Fund’s position in Synaptics, Inc. was a notable outperformer. Shares in the company, which specializes in human interface semiconductor solutions, rose sharply after reporting quarterly results in November 2021. The report was highlighted by earnings above expectations and a raise of forward guidance. The outperformance of expectations was driven by strong demand and revenue growth, particularly in Synaptics’ internet-of-things business line, and higher gross margins. |
The Fund’s notable detractors during the period
| • | The biggest detractor from relative performance was a lack of exposure to video game retailer GameStop. Shares in GameStop skyrocketed early in the period, as retail investors from internet forums such as Reddit piled into the stock, |
Columbia Small Cap Value Fund II | Annual Report 2022
| 5 |
Manager Discussion of Fund Performance (continued)
| | causing an unprecedented short squeeze that led to huge losses for some notable hedge funds. The Fund did not own GameStop, which by the end of the first quarter of 2021 was up over 900% and became one of the largest names in the benchmark. We believe that over the long-term, stock prices will track fundamentals and so we did not invest in GameStop. |
| • | The Fund’s lack of exposure to Avis Budget Group was a detractor within the industrials sector. Shares in the heavily shorted vehicle sharing and rental company rose sharply at the beginning of November 2021, as the company reported strong earnings which triggered an apparent short squeeze in the stock. |
| • | Other individual detractors from performance included SkyWest, Inc., a regional airline that primarily provides service through contracts with other major airlines. Shares declined alongside other airline names as market sentiment changed in the second quarter of 2021, with investors rotating out of certain COVID-19 recovery names and back into more growth-oriented areas. |
| • | Within information technology, the Fund’s position in solar panel and systems designer and manufacturer SunPower Corp. was a notable detractor. Shares declined early in the period following tremendous performance in 2020 and in the first quarter of 2021 as a result of mandates in certain states requiring that new homes be solar equipped, and due to certain natural disasters and outages, all of which fueled demand for solar panels. Following this run of strong performance, shares declined in the second quarter of 2021, and we exited the position. |
Market risk may affect a single issuer, sector of the economy, industry or the market as a whole. Foreign investments subject the Fund to risks, including political, economic, market, social and others within a particular country, as well as to currency instabilities and less stringent financial and accounting standards generally applicable to U.S. issuers. Investments in small-cap companies involve risks and volatility greater than investments in larger, more established companies. Value securities may be unprofitable if the market fails to recognize their intrinsic worth or the portfolio manager misgauged that worth. The Fund may invest significantly in issuers within a particular sector, which may be negatively affected by market, economic or other conditions, making the Fund more vulnerable to unfavorable developments in the sector. See the Fund’s prospectus for more information on these and other risks.
The views expressed in this report reflect the current views of the respective parties who have contributed to this report. These views are not guarantees of future performance and involve certain risks, uncertainties and assumptions that are difficult to predict, so actual outcomes and results may differ significantly from the views expressed. These views are subject to change at any time based upon economic, market or other conditions and the respective parties disclaim any responsibility to update such views. These views may not be relied on as investment advice and, because investment decisions for a Columbia fund are based on numerous factors, may not be relied on as an indication of trading intent on behalf of any particular Columbia fund. References to specific securities should not be construed as a recommendation or investment advice.
| 6 | Columbia Small Cap Value Fund II | Annual Report 2022 |
Understanding Your Fund’s Expenses
(Unaudited)
As an investor, you incur two types of costs. There are shareholder transaction costs, which generally include sales charges on purchases and may include redemption fees. There are also ongoing fund costs, which generally include management fees, distribution and/or service fees, and other fund expenses. The following information is intended to help you understand your ongoing costs (in dollars) of investing in the Fund and to help you compare these costs with the ongoing costs of investing in other mutual funds.
Analyzing your Fund’s expenses
To illustrate these ongoing costs, we have provided examples and calculated the expenses paid by investors in each share class of the Fund during the period. The actual and hypothetical information in the table is based on an initial investment of $1,000 at the beginning of the period indicated and held for the entire period. Expense information is calculated two ways and each method provides you with different information. The amount listed in the “Actual” column is calculated using the Fund’s actual operating expenses and total return for the period. You may use the Actual information, together with the amount invested, to estimate the expenses that you paid over the period. Simply divide your account value by $1,000 (for example, an $8,600 account value divided by $1,000 = 8.6), then multiply the results by the expenses paid during the period under the “Actual” column. The amount listed in the “Hypothetical” column assumes a 5% annual rate of return before expenses (which is not the Fund’s actual return) and then applies the Fund’s actual expense ratio for the period to the hypothetical return. You should not use the hypothetical account values and expenses to estimate either your actual account balance at the end of the period or the expenses you paid during the period. See “Compare with other funds” below for details on how to use the hypothetical data.
Compare with other funds
Since all mutual funds are required to include the same hypothetical calculations about expenses in shareholder reports, you can use this information to compare the ongoing cost of investing in the Fund with other funds. To do so, compare the hypothetical example with the 5% hypothetical examples that appear in the shareholder reports of other funds. As you compare hypothetical examples of other funds, it is important to note that hypothetical examples are meant to highlight the ongoing costs of investing in a fund only and do not reflect any transaction costs, such as sales charges, or redemption or exchange fees. Therefore, the hypothetical calculations are useful in comparing ongoing costs only, and will not help you determine the relative total costs of owning different funds. If transaction costs were included in these calculations, your costs would be higher.
| September 1, 2021 — February 28, 2022 |
| | Account value at the
beginning of the
period ($) | Account value at the
end of the
period ($) | Expenses paid during
the period ($) | Fund’s annualized
expense ratio (%) |
| | Actual | Hypothetical | Actual | Hypothetical | Actual | Hypothetical | Actual |
| Class A | 1,000.00 | 1,000.00 | 1,031.50 | 1,018.50 | 6.40 | 6.36 | 1.27 |
| Advisor Class | 1,000.00 | 1,000.00 | 1,033.60 | 1,019.74 | 5.14 | 5.11 | 1.02 |
| Class C | 1,000.00 | 1,000.00 | 1,027.90 | 1,014.78 | 10.16 | 10.09 | 2.02 |
| Institutional Class | 1,000.00 | 1,000.00 | 1,033.60 | 1,019.74 | 5.14 | 5.11 | 1.02 |
| Institutional 2 Class | 1,000.00 | 1,000.00 | 1,034.30 | 1,020.43 | 4.44 | 4.41 | 0.88 |
| Institutional 3 Class | 1,000.00 | 1,000.00 | 1,034.10 | 1,020.68 | 4.19 | 4.16 | 0.83 |
| Class R | 1,000.00 | 1,000.00 | 1,030.90 | 1,017.26 | 7.65 | 7.60 | 1.52 |
Expenses paid during the period are equal to the annualized expense ratio for each class as indicated above, multiplied by the average account value over the period and then multiplied by the number of days in the Fund’s most recent fiscal half year and divided by 365.
Expenses do not include fees and expenses incurred indirectly by the Fund from its investment in underlying funds, including affiliated and non-affiliated pooled investment vehicles, such as mutual funds and exchange-traded funds.
Had Columbia Management Investment Advisers, LLC and/or certain of its affiliates not waived/reimbursed certain fees and expenses, account value at the end of the period would have been reduced.
Columbia Small Cap Value Fund II | Annual Report 2022
| 7 |
Portfolio of Investments
February 28, 2022
(Percentages represent value of investments compared to net assets)
Investments in securities
| Common Stocks 97.1% |
| Issuer | Shares | Value ($) |
| Communication Services 1.8% |
| Entertainment 0.4% |
| AMC Entertainment Holdings, Inc., Class A(a) | 293,700 | 5,539,182 |
| Media 1.4% |
| Nexstar Media Group, Inc., Class A | 124,408 | 23,021,700 |
| Total Communication Services | 28,560,882 |
| Consumer Discretionary 7.2% |
| Auto Components 1.1% |
| Dana, Inc. | 448,127 | 8,344,125 |
| Goodyear Tire & Rubber Co. (The)(a) | 583,807 | 9,043,170 |
| Total | | 17,387,295 |
| Hotels, Restaurants & Leisure 2.2% |
| F45 Training Holdings, Inc.(a) | 1,064,578 | 16,373,210 |
| International Game Technology PLC | 388,000 | 11,880,560 |
| Red Rock Resorts, Inc., Class A | 138,700 | 6,973,836 |
| Total | | 35,227,606 |
| Household Durables 0.5% |
| KB Home | 220,700 | 8,521,227 |
| Multiline Retail 1.1% |
| Macy’s, Inc. | 695,086 | 18,016,629 |
| Specialty Retail 1.9% |
| Children’s Place, Inc. (The)(a) | 64,400 | 4,054,624 |
| Genesco, Inc.(a) | 145,672 | 9,344,859 |
| Petco Health & Wellness Co., Inc.(a) | 977,614 | 17,127,797 |
| Total | | 30,527,280 |
| Textiles, Apparel & Luxury Goods 0.4% |
| Rocky Brands, Inc. | 153,997 | 5,935,044 |
| Total Consumer Discretionary | 115,615,081 |
| Consumer Staples 3.2% |
| Food & Staples Retailing 2.8% |
| BJ’s Wholesale Club Holdings, Inc.(a) | 262,565 | 16,507,462 |
| The Chefs’ Warehouse(a) | 289,500 | 9,510,075 |
| United Natural Foods, Inc.(a) | 460,944 | 18,543,777 |
| Total | | 44,561,314 |
| Common Stocks (continued) |
| Issuer | Shares | Value ($) |
| Personal Products 0.4% |
| BellRing Brands, Inc., Class A(a) | 270,100 | 6,906,457 |
| Total Consumer Staples | 51,467,771 |
| Energy 8.1% |
| Oil, Gas & Consumable Fuels 8.1% |
| Antero Resources Corp.(a) | 667,600 | 15,308,068 |
| Chesapeake Energy Corp. | 146,200 | 11,293,950 |
| Matador Resources Co. | 390,800 | 19,383,680 |
| Ovintiv, Inc. | 731,033 | 33,517,863 |
| PDC Energy, Inc. | 389,528 | 25,132,346 |
| SM Energy Co. | 502,821 | 17,855,174 |
| Whiting Petroleum Corp. | 99,800 | 7,370,230 |
| Total | | 129,861,311 |
| Total Energy | 129,861,311 |
| Financials 28.8% |
| Banks 15.7% |
| Ameris Bancorp | 352,358 | 17,441,721 |
| Atlantic Union Bankshares Corp. | 482,838 | 19,617,708 |
| Bancorp, Inc. (The)(a) | 705,051 | 20,657,994 |
| Cathay General Bancorp | 418,746 | 19,693,624 |
| Community Bank System, Inc. | 222,707 | 16,244,248 |
| Hancock Whitney Corp. | 381,688 | 21,252,388 |
| Independent Bank Corp. | 170,159 | 14,635,375 |
| Independent Bank Group, Inc. | 222,060 | 17,131,929 |
| Pacific Premier Bancorp, Inc. | 346,925 | 13,429,467 |
| Popular, Inc. | 236,062 | 21,682,295 |
| Renasant Corp. | 346,611 | 12,654,768 |
| Sandy Spring Bancorp, Inc. | 449,010 | 21,143,881 |
| Triumph Bancorp, Inc.(a) | 153,755 | 15,424,702 |
| UMB Financial Corp. | 206,784 | 21,063,018 |
| Total | | 252,073,118 |
The accompanying Notes to Financial Statements are an integral part of this statement.
| 8 | Columbia Small Cap Value Fund II | Annual Report 2022 |
Portfolio of Investments (continued)
February 28, 2022
| Common Stocks (continued) |
| Issuer | Shares | Value ($) |
| Capital Markets 3.7% |
| Cowen, Inc., Class A | 335,096 | 9,935,596 |
| Focus Financial Partners, Inc., Class A(a) | 348,000 | 17,413,920 |
| Houlihan Lokey, Inc., Class A | 174,500 | 17,949,070 |
| Stifel Financial Corp. | 196,734 | 14,459,949 |
| Total | | 59,758,535 |
| Consumer Finance 1.0% |
| SLM Corp. | 767,051 | 15,110,905 |
| Insurance 1.3% |
| AMERISAFE, Inc. | 187,540 | 8,833,134 |
| Argo Group International Holdings Ltd. | 289,121 | 12,192,233 |
| Total | | 21,025,367 |
| Mortgage Real Estate Investment Trusts (REITS) 2.7% |
| Blackstone Mortgage Trust, Inc. | 502,329 | 15,964,016 |
| Hannon Armstrong Sustainable Infrastructure Capital, Inc. | 376,400 | 17,818,776 |
| Starwood Property Trust, Inc. | 385,028 | 9,179,067 |
| Total | | 42,961,859 |
| Thrifts & Mortgage Finance 4.4% |
| Axos Financial, Inc.(a) | 425,722 | 23,304,022 |
| MGIC Investment Corp. | 1,100,037 | 16,698,562 |
| Radian Group, Inc. | 567,500 | 13,563,250 |
| WSFS Financial Corp. | 344,975 | 17,535,079 |
| Total | | 71,100,913 |
| Total Financials | 462,030,697 |
| Health Care 5.3% |
| Biotechnology 2.3% |
| Apellis Pharmaceuticals, Inc.(a) | 95,100 | 4,044,603 |
| Arcutis Biotherapeutics, Inc.(a) | 152,500 | 2,714,500 |
| Arena Pharmaceuticals, Inc.(a) | 129,300 | 12,279,621 |
| Atara Biotherapeutics, Inc.(a) | 288,300 | 3,704,655 |
| Cytokinetics, Inc.(a) | 116,500 | 4,114,780 |
| Iovance Biotherapeutics, Inc.(a) | 231,200 | 3,622,904 |
| Myriad Genetics, Inc.(a) | 260,700 | 6,355,866 |
| Total | | 36,836,929 |
| Common Stocks (continued) |
| Issuer | Shares | Value ($) |
| Health Care Equipment & Supplies 1.8% |
| Integer Holdings Corp.(a) | 71,527 | 5,998,970 |
| Merit Medical Systems, Inc.(a) | 283,899 | 18,461,952 |
| Varex Imaging Corp.(a) | 171,208 | 4,047,357 |
| Total | | 28,508,279 |
| Health Care Providers & Services 1.2% |
| Tenet Healthcare Corp.(a) | 218,378 | 18,778,324 |
| Total Health Care | 84,123,532 |
| Industrials 16.7% |
| Aerospace & Defense 1.5% |
| Moog, Inc., Class A | 170,600 | 14,178,566 |
| Triumph Group, Inc.(a) | 406,600 | 10,181,264 |
| Total | | 24,359,830 |
| Air Freight & Logistics 0.5% |
| Atlas Air Worldwide Holdings, Inc.(a) | 106,226 | 8,323,869 |
| Building Products 0.6% |
| Masonite International Corp.(a) | 98,279 | 9,270,658 |
| Construction & Engineering 2.4% |
| API Group Corp.(a) | 616,700 | 13,302,219 |
| EMCOR Group, Inc. | 143,166 | 16,541,400 |
| MasTec, Inc.(a) | 103,381 | 8,142,287 |
| Total | | 37,985,906 |
| Electrical Equipment 0.9% |
| Bloom Energy Corp., Class A(a) | 392,100 | 8,704,620 |
| Sunrun, Inc.(a) | 226,300 | 6,173,464 |
| Total | | 14,878,084 |
| Machinery 1.4% |
| Altra Industrial Motion Corp. | 255,340 | 10,844,290 |
| Evoqua Water Technologies Corp.(a) | 288,900 | 12,324,474 |
| Total | | 23,168,764 |
| Professional Services 4.2% |
| ICF International, Inc. | 172,400 | 15,278,088 |
| KBR, Inc. | 447,238 | 22,200,895 |
| Kforce, Inc. | 276,756 | 20,806,516 |
| Science Applications International Corp. | 103,258 | 9,054,694 |
| Total | | 67,340,193 |
The accompanying Notes to Financial Statements are an integral part of this statement.
Columbia Small Cap Value Fund II | Annual Report 2022
| 9 |
Portfolio of Investments (continued)
February 28, 2022
| Common Stocks (continued) |
| Issuer | Shares | Value ($) |
| Road & Rail 1.1% |
| ArcBest Corp. | 184,306 | 17,081,480 |
| Trading Companies & Distributors 4.1% |
| Beacon Roofing Supply, Inc.(a) | 195,830 | 11,689,093 |
| Core & Main, Inc., Class A(a) | 608,900 | 13,688,072 |
| Herc Holdings Inc | 115,761 | 18,419,890 |
| Triton International Ltd. | 324,914 | 21,340,352 |
| Total | | 65,137,407 |
| Total Industrials | 267,546,191 |
| Information Technology 5.7% |
| IT Services 0.9% |
| ExlService Holdings, Inc.(a) | 121,600 | 14,688,064 |
| Semiconductors & Semiconductor Equipment 4.6% |
| Diodes, Inc.(a) | 177,386 | 15,892,012 |
| Kulicke & Soffa Industries, Inc. | 129,254 | 6,752,229 |
| MagnaChip Semiconductor Corp.(a) | 889,471 | 16,188,372 |
| SMART Global Holdings, Inc.(a) | 645,138 | 17,709,038 |
| Synaptics, Inc.(a) | 30,100 | 6,875,743 |
| Ultra Clean Holdings, Inc.(a) | 244,761 | 11,212,501 |
| Total | | 74,629,895 |
| Software 0.2% |
| Marathon Digital Holdings, Inc.(a) | 110,000 | 2,788,500 |
| Total Information Technology | 92,106,459 |
| Materials 8.1% |
| Chemicals 4.8% |
| Ashland Global Holdings, Inc. | 97,000 | 8,951,160 |
| Avient Corp. | 276,630 | 14,492,646 |
| Cabot Corp. | 156,587 | 11,455,905 |
| HB Fuller Co. | 102,600 | 7,014,762 |
| Intrepid Potash, Inc.(a) | 274,622 | 15,623,246 |
| Kraton Performance Polymers, Inc.(a) | 274,500 | 12,668,175 |
| Orion Engineered Carbons SA | 424,032 | 6,589,457 |
| Total | | 76,795,351 |
| Construction Materials 0.9% |
| Summit Materials, Inc., Class A(a) | 470,600 | 14,692,132 |
| Common Stocks (continued) |
| Issuer | Shares | Value ($) |
| Metals & Mining 2.4% |
| Allegheny Technologies, Inc.(a) | 375,500 | 9,665,370 |
| Arconic Corp.(a) | 191,400 | 5,875,980 |
| Cleveland-Cliffs, Inc.(a) | 401,900 | 8,986,484 |
| Materion Corp. | 173,620 | 14,505,951 |
| Total | | 39,033,785 |
| Total Materials | 130,521,268 |
| Real Estate 7.1% |
| Equity Real Estate Investment Trusts (REITS) 7.1% |
| American Assets Trust, Inc. | 409,900 | 14,985,944 |
| Apple Hospitality REIT, Inc. | 493,700 | 8,733,553 |
| Centerspace | 204,137 | 19,186,837 |
| First Industrial Realty Trust, Inc. | 395,261 | 22,759,128 |
| Hudson Pacific Properties, Inc. | 233,305 | 6,159,252 |
| PotlatchDeltic Corp. | 174,200 | 9,563,580 |
| PS Business Parks, Inc. | 88,069 | 14,028,511 |
| Tanger Factory Outlet Centers, Inc. | 1,097,969 | 18,314,123 |
| Total | | 113,730,928 |
| Total Real Estate | 113,730,928 |
| Utilities 5.1% |
| Electric Utilities 1.2% |
| Portland General Electric Co. | 369,207 | 18,744,639 |
| Gas Utilities 2.9% |
| New Jersey Resources Corp. | 312,837 | 13,645,950 |
| ONE Gas, Inc. | 165,377 | 13,741,175 |
| South Jersey Industries, Inc. | 550,657 | 18,683,792 |
| Total | | 46,070,917 |
| Independent Power and Renewable Electricity Producers 1.0% |
| Clearway Energy, Inc., Class C | 489,180 | 16,338,612 |
| Total Utilities | 81,154,168 |
Total Common Stocks
(Cost $1,038,042,111) | 1,556,718,288 |
|
The accompanying Notes to Financial Statements are an integral part of this statement.
| 10 | Columbia Small Cap Value Fund II | Annual Report 2022 |
Portfolio of Investments (continued)
February 28, 2022
| Money Market Funds 3.9% |
| | Shares | Value ($) |
| Columbia Short-Term Cash Fund, 0.168%(b),(c) | 61,974,365 | 61,955,773 |
Total Money Market Funds
(Cost $61,956,536) | 61,955,773 |
Total Investments in Securities
(Cost: $1,099,998,647) | 1,618,674,061 |
| Other Assets & Liabilities, Net | | (15,662,138) |
| Net Assets | 1,603,011,923 |
Notes to Portfolio of Investments
| (a) | Non-income producing investment. |
| (b) | The rate shown is the seven-day current annualized yield at February 28, 2022. |
| (c) | As defined in the Investment Company Act of 1940, as amended, an affiliated company is one in which the Fund owns 5% or more of the company’s outstanding voting securities, or a company which is under common ownership or control with the Fund. The value of the holdings and transactions in these affiliated companies during the year ended February 28, 2022 are as follows: |
| Affiliated issuers | Beginning
of period($) | Purchases($) | Sales($) | Net change in
unrealized
appreciation
(depreciation)($) | End of
period($) | Realized gain
(loss)($) | Dividends($) | End of
period shares |
| Columbia Short-Term Cash Fund, 0.168% |
| | 27,419,887 | 488,728,973 | (454,190,501) | (2,586) | 61,955,773 | (7,019) | 28,275 | 61,974,365 |
Fair value measurements
The Fund categorizes its fair value measurements according to a three-level hierarchy that maximizes the use of observable inputs and minimizes the use of unobservable inputs by prioritizing that the most observable input be used when available. Observable inputs are those that market participants would use in pricing an investment based on market data obtained from sources independent of the reporting entity. Unobservable inputs are those that reflect the Fund’s assumptions about the information market participants would use in pricing an investment. An investment’s level within the fair value hierarchy is based on the lowest level of any input that is deemed significant to the asset’s or liability’s fair value measurement. The input levels are not necessarily an indication of the risk or liquidity associated with investments at that level. For example, certain U.S. government securities are generally high quality and liquid, however, they are reflected as Level 2 because the inputs used to determine fair value may not always be quoted prices in an active market.
Fair value inputs are summarized in the three broad levels listed below:
| ■ | Level 1 — Valuations based on quoted prices for investments in active markets that the Fund has the ability to access at the measurement date. Valuation adjustments are not applied to Level 1 investments. |
| ■ | Level 2 — Valuations based on other significant observable inputs (including quoted prices for similar securities, interest rates, prepayment speeds, credit risks, etc.). |
| ■ | Level 3 — Valuations based on significant unobservable inputs (including the Fund’s own assumptions and judgment in determining the fair value of investments). |
Inputs that are used in determining fair value of an investment may include price information, credit data, volatility statistics, and other factors. These inputs can be either observable or unobservable. The availability of observable inputs can vary between investments, and is affected by various factors such as the type of investment, and the volume and level of activity for that investment or similar investments in the marketplace. The inputs will be considered by the Investment Manager, along with any other relevant factors in the calculation of an investment’s fair value. The Fund uses prices and inputs that are current as of the measurement date, which may include periods of market dislocations. During these periods, the availability of prices and inputs may be reduced for many investments. This condition could cause an investment to be reclassified between the various levels within the hierarchy.
Investments falling into the Level 3 category are primarily supported by quoted prices from brokers and dealers participating in the market for those investments. However, these may be classified as Level 3 investments due to lack of market transparency and corroboration to support these quoted prices. Additionally, valuation models may be used as the pricing source for any remaining investments classified as Level 3. These models may rely on one or more significant unobservable inputs and/or significant assumptions by the Investment Manager. Inputs used in valuations may include, but are not limited to, financial statement analysis, capital account balances, discount rates and estimated cash flows, and comparable company data.
Under the direction of the Fund’s Board of Trustees (the Board), the Investment Manager’s Valuation Committee (the Committee) is responsible for overseeing the valuation procedures approved by the Board. The Committee consists of voting and non-voting members from various groups within the Investment Manager’s organization, including operations and accounting, trading and investments, compliance, risk management and legal.
The Committee meets at least monthly to review and approve valuation matters, which may include a description of specific valuation determinations, data regarding pricing information received from approved pricing vendors and brokers and the results of Board-approved valuation control policies and procedures (the Policies). The Policies address, among other things, instances when market quotations are or are not readily available, including recommendations of third party pricing vendors and a determination of appropriate pricing methodologies; events that require specific valuation determinations and assessment of fair value techniques; securities with a potential for stale pricing, including those that are illiquid, restricted, or in default; and the effectiveness of third party pricing vendors, including periodic reviews of vendors. The Committee meets more frequently, as needed, to discuss
The accompanying Notes to Financial Statements are an integral part of this statement.
Columbia Small Cap Value Fund II | Annual Report 2022
| 11 |
Portfolio of Investments (continued)
February 28, 2022
Fair value measurements (continued)
additional valuation matters, which may include the need to review back-testing results, review time-sensitive information or approve related valuation actions. The Committee reports to the Board, with members of the Committee meeting with the Board at each of its regularly scheduled meetings to discuss valuation matters and actions during the period, similar to those described earlier.
The following table is a summary of the inputs used to value the Fund’s investments at February 28, 2022:
| | Level 1 ($) | Level 2 ($) | Level 3 ($) | Total ($) |
| Investments in Securities | | | | |
| Common Stocks | | | | |
| Communication Services | 28,560,882 | — | — | 28,560,882 |
| Consumer Discretionary | 115,615,081 | — | — | 115,615,081 |
| Consumer Staples | 51,467,771 | — | — | 51,467,771 |
| Energy | 129,861,311 | — | — | 129,861,311 |
| Financials | 462,030,697 | — | — | 462,030,697 |
| Health Care | 84,123,532 | — | — | 84,123,532 |
| Industrials | 267,546,191 | — | — | 267,546,191 |
| Information Technology | 92,106,459 | — | — | 92,106,459 |
| Materials | 130,521,268 | — | — | 130,521,268 |
| Real Estate | 113,730,928 | — | — | 113,730,928 |
| Utilities | 81,154,168 | — | — | 81,154,168 |
| Total Common Stocks | 1,556,718,288 | — | — | 1,556,718,288 |
| Money Market Funds | 61,955,773 | — | — | 61,955,773 |
| Total Investments in Securities | 1,618,674,061 | — | — | 1,618,674,061 |
See the Portfolio of Investments for all investment classifications not indicated in the table.
The accompanying Notes to Financial Statements are an integral part of this statement.
| 12 | Columbia Small Cap Value Fund II | Annual Report 2022 |
Statement of Assets and Liabilities
February 28, 2022
| Assets | |
| Investments in securities, at value | |
| Unaffiliated issuers (cost $1,038,042,111) | $1,556,718,288 |
| Affiliated issuers (cost $61,956,536) | 61,955,773 |
| Receivable for: | |
| Investments sold | 4,193,360 |
| Capital shares sold | 2,884,904 |
| Dividends | 1,009,517 |
| Expense reimbursement due from Investment Manager | 8,170 |
| Prepaid expenses | 13,581 |
| Total assets | 1,626,783,593 |
| Liabilities | |
| Payable for: | |
| Investments purchased | 20,927,346 |
| Capital shares purchased | 2,254,587 |
| Management services fees | 105,522 |
| Distribution and/or service fees | 2,129 |
| Transfer agent fees | 219,367 |
| Compensation of board members | 178,458 |
| Compensation of chief compliance officer | 240 |
| Other expenses | 84,021 |
| Total liabilities | 23,771,670 |
| Net assets applicable to outstanding capital stock | $1,603,011,923 |
| Represented by | |
| Paid in capital | 1,059,649,213 |
| Total distributable earnings (loss) | 543,362,710 |
| Total - representing net assets applicable to outstanding capital stock | $1,603,011,923 |
The accompanying Notes to Financial Statements are an integral part of this statement.
Columbia Small Cap Value Fund II | Annual Report 2022
| 13 |
Statement of Assets and Liabilities (continued)
February 28, 2022
| Class A | |
| Net assets | $91,223,401 |
| Shares outstanding | 4,935,082 |
| Net asset value per share | $18.48 |
| Maximum sales charge | 5.75% |
| Maximum offering price per share (calculated by dividing the net asset value per share by 1.0 minus the maximum sales charge for Class A shares) | $19.61 |
| Advisor Class | |
| Net assets | $178,598,653 |
| Shares outstanding | 9,179,553 |
| Net asset value per share | $19.46 |
| Class C | |
| Net assets | $1,470,168 |
| Shares outstanding | 96,714 |
| Net asset value per share | $15.20 |
| Institutional Class | |
| Net assets | $425,250,229 |
| Shares outstanding | 22,503,436 |
| Net asset value per share | $18.90 |
| Institutional 2 Class | |
| Net assets | $223,545,221 |
| Shares outstanding | 11,447,512 |
| Net asset value per share | $19.53 |
| Institutional 3 Class | |
| Net assets | $679,291,485 |
| Shares outstanding | 34,640,426 |
| Net asset value per share | $19.61 |
| Class R | |
| Net assets | $3,632,766 |
| Shares outstanding | 201,749 |
| Net asset value per share | $18.01 |
The accompanying Notes to Financial Statements are an integral part of this statement.
| 14 | Columbia Small Cap Value Fund II | Annual Report 2022 |
Statement of Operations
Year Ended February 28, 2022
| Net investment income | |
| Income: | |
| Dividends — unaffiliated issuers | $17,837,481 |
| Dividends — affiliated issuers | 28,275 |
| Interfund lending | 320 |
| Foreign taxes withheld | (39,193) |
| Total income | 17,826,883 |
| Expenses: | |
| Management services fees | 12,213,435 |
| Distribution and/or service fees | |
| Class A | 208,858 |
| Class C | 10,166 |
| Class R | 19,183 |
| Transfer agent fees | |
| Class A | 201,783 |
| Advisor Class | 304,357 |
| Class C | 2,465 |
| Institutional Class | 953,351 |
| Institutional 2 Class | 125,836 |
| Institutional 3 Class | 41,159 |
| Class R | 9,252 |
| Compensation of board members | 55,515 |
| Custodian fees | 16,798 |
| Printing and postage fees | 151,358 |
| Registration fees | 113,997 |
| Audit fees | 32,250 |
| Legal fees | 27,478 |
| Compensation of chief compliance officer | 232 |
| Other | 27,385 |
| Total expenses | 14,514,858 |
| Fees waived or expenses reimbursed by Investment Manager and its affiliates | (588,235) |
| Fees waived by transfer agent | |
| Institutional 2 Class | (4,888) |
| Institutional 3 Class | (13,071) |
| Expense reduction | (40) |
| Total net expenses | 13,908,624 |
| Net investment income | 3,918,259 |
| Realized and unrealized gain (loss) — net | |
| Net realized gain (loss) on: | |
| Investments — unaffiliated issuers | 180,516,558 |
| Investments — affiliated issuers | (7,019) |
| Net realized gain | 180,509,539 |
| Net change in unrealized appreciation (depreciation) on: | |
| Investments — unaffiliated issuers | (17,516,121) |
| Investments — affiliated issuers | (2,586) |
| Net change in unrealized appreciation (depreciation) | (17,518,707) |
| Net realized and unrealized gain | 162,990,832 |
| Net increase in net assets resulting from operations | $166,909,091 |
The accompanying Notes to Financial Statements are an integral part of this statement.
Columbia Small Cap Value Fund II | Annual Report 2022
| 15 |
Statement of Changes in Net Assets
| | Year Ended
February 28, 2022 | Year Ended
February 28, 2021 |
| Operations | | |
| Net investment income | $3,918,259 | $6,011,880 |
| Net realized gain | 180,509,539 | 59,415,095 |
| Net change in unrealized appreciation (depreciation) | (17,518,707) | 411,887,744 |
| Net increase in net assets resulting from operations | 166,909,091 | 477,314,719 |
| Distributions to shareholders | | |
| Net investment income and net realized gains | | |
| Class A | (11,132,679) | (611,308) |
| Advisor Class | (15,473,174) | (797,326) |
| Class C | (172,699) | (1,335) |
| Institutional Class | (54,172,778) | (2,814,817) |
| Institutional 2 Class | (27,431,969) | (1,788,519) |
| Institutional 3 Class | (86,013,104) | (4,907,822) |
| Class R | (505,702) | (30,100) |
| Total distributions to shareholders | (194,902,105) | (10,951,227) |
| Increase (decrease) in net assets from capital stock activity | 295,265,372 | (180,292,967) |
| Total increase in net assets | 267,272,358 | 286,070,525 |
| Net assets at beginning of year | 1,335,739,565 | 1,049,669,040 |
| Net assets at end of year | $1,603,011,923 | $1,335,739,565 |
The accompanying Notes to Financial Statements are an integral part of this statement.
| 16 | Columbia Small Cap Value Fund II | Annual Report 2022 |
Statement of Changes in Net Assets (continued)
| | Year Ended | Year Ended |
| | February 28, 2022 | February 28, 2021 |
| | Shares | Dollars ($) | Shares | Dollars ($) |
| Capital stock activity |
| Class A | | | | |
| Subscriptions | 1,904,995 | 37,448,934 | 1,542,111 | 20,637,627 |
| Fund reorganization | 102,798 | 1,822,064 | — | — |
| Distributions reinvested | 515,548 | 10,020,650 | 44,644 | 568,733 |
| Redemptions | (1,280,388) | (25,009,568) | (5,603,739) | (71,864,547) |
| Net increase (decrease) | 1,242,953 | 24,282,080 | (4,016,984) | (50,658,187) |
| Advisor Class | | | | |
| Subscriptions | 3,499,219 | 71,418,698 | 4,567,722 | 63,325,960 |
| Fund reorganization | 4,247,560 | 79,222,767 | — | — |
| Distributions reinvested | 669,131 | 13,759,766 | 48,602 | 728,394 |
| Redemptions | (6,142,833) | (124,064,664) | (1,975,419) | (27,842,556) |
| Net increase | 2,273,077 | 40,336,567 | 2,640,905 | 36,211,798 |
| Class C | | | | |
| Subscriptions | 70,460 | 1,155,402 | 23,372 | 297,882 |
| Distributions reinvested | 10,663 | 171,009 | 128 | 1,281 |
| Redemptions | (20,474) | (333,741) | (16,037) | (176,734) |
| Net increase | 60,649 | 992,670 | 7,463 | 122,429 |
| Institutional Class | | | | |
| Subscriptions | 8,709,443 | 176,726,803 | 4,414,975 | 61,003,074 |
| Distributions reinvested | 2,485,306 | 49,323,735 | 192,427 | 2,638,133 |
| Redemptions | (6,068,437) | (120,323,290) | (13,945,774) | (197,508,697) |
| Net increase (decrease) | 5,126,312 | 105,727,248 | (9,338,372) | (133,867,490) |
| Institutional 2 Class | | | | |
| Subscriptions | 4,554,026 | 92,890,951 | 5,415,563 | 70,493,668 |
| Distributions reinvested | 1,337,272 | 27,417,036 | 121,929 | 1,786,594 |
| Redemptions | (5,903,551) | (123,227,966) | (4,776,859) | (67,521,473) |
| Net increase (decrease) | (12,253) | (2,919,979) | 760,633 | 4,758,789 |
| Institutional 3 Class | | | | |
| Subscriptions | 12,888,406 | 267,021,479 | 12,937,492 | 169,180,965 |
| Fund reorganization | 50,335 | 946,037 | — | — |
| Distributions reinvested | 3,709,447 | 76,346,220 | 304,761 | 4,492,929 |
| Redemptions | (10,429,093) | (215,750,681) | (13,863,637) | (209,465,693) |
| Net increase (decrease) | 6,219,095 | 128,563,055 | (621,384) | (35,791,799) |
| Class R | | | | |
| Subscriptions | 43,521 | 857,511 | 77,790 | 1,012,994 |
| Distributions reinvested | 26,625 | 505,702 | 2,426 | 30,099 |
| Redemptions | (161,147) | (3,079,482) | (167,432) | (2,111,600) |
| Net decrease | (91,001) | (1,716,269) | (87,216) | (1,068,507) |
| Total net increase (decrease) | 14,818,832 | 295,265,372 | (10,654,955) | (180,292,967) |
The accompanying Notes to Financial Statements are an integral part of this statement.
Columbia Small Cap Value Fund II | Annual Report 2022
| 17 |
The following table is intended to help you understand the Fund’s financial performance. Certain information reflects financial results for a single share of a class held for the periods shown. Per share net investment income (loss) amounts are calculated based on average shares outstanding during the period. Total return assumes reinvestment of all dividends and distributions, if any. Total return does not reflect payment of sales charges, if any. Total return and portfolio turnover are not annualized for periods of less than one year. The portfolio turnover rate is calculated without regard to purchase and sales transactions of short-term instruments and certain derivatives, if any. If such transactions were included, the Fund’s portfolio turnover rate may be higher.
| | Net asset value,
beginning of
period | Net
investment
income
(loss) | Net
realized
and
unrealized
gain (loss) | Total from
investment
operations | Distributions
from net
investment
income | Distributions
from net
realized
gains | Total
distributions to
shareholders |
| Class A |
| Year Ended 2/28/2022 | $18.85 | (0.02) | 2.33 | 2.31 | (0.03) | (2.65) | (2.68) |
| Year Ended 2/28/2021 | $12.89 | 0.03 | 6.04 | 6.07 | (0.05) | (0.06) | (0.11) |
| Year Ended 2/29/2020 | $15.11 | 0.06 | (1.76) | (1.70) | (0.09) | (0.43) | (0.52) |
| Year Ended 2/28/2019 | $17.11 | 0.03 | (0.10) | (0.07) | (0.01) | (1.92) | (1.93) |
| Year Ended 2/28/2018 | $18.01 | 0.01 | 0.75 | 0.76 | (0.01) | (1.65) | (1.66) |
| Advisor Class |
| Year Ended 2/28/2022 | $19.71 | 0.03 | 2.45 | 2.48 | (0.08) | (2.65) | (2.73) |
| Year Ended 2/28/2021 | $13.46 | 0.06 | 6.33 | 6.39 | (0.08) | (0.06) | (0.14) |
| Year Ended 2/29/2020 | $15.75 | 0.10 | (1.83) | (1.73) | (0.13) | (0.43) | (0.56) |
| Year Ended 2/28/2019 | $17.75 | 0.07 | (0.11) | (0.04) | (0.04) | (1.92) | (1.96) |
| Year Ended 2/28/2018 | $18.61 | 0.05 | 0.79 | 0.84 | (0.05) | (1.65) | (1.70) |
| Class C |
| Year Ended 2/28/2022 | $16.01 | (0.13) | 1.97 | 1.84 | — | (2.65) | (2.65) |
| Year Ended 2/28/2021 | $11.00 | (0.06) | 5.13 | 5.07 | — | (0.06) | (0.06) |
| Year Ended 2/29/2020 | $12.96 | (0.04) | (1.51) | (1.55) | — | (0.41) | (0.41) |
| Year Ended 2/28/2019 | $15.06 | (0.11) | (0.07) | (0.18) | — | (1.92) | (1.92) |
| Year Ended 2/28/2018 | $16.13 | (0.11) | 0.68 | 0.57 | — | (1.64) | (1.64) |
| Institutional Class |
| Year Ended 2/28/2022 | $19.21 | 0.04 | 2.38 | 2.42 | (0.08) | (2.65) | (2.73) |
| Year Ended 2/28/2021 | $13.12 | 0.07 | 6.16 | 6.23 | (0.08) | (0.06) | (0.14) |
| Year Ended 2/29/2020 | $15.37 | 0.10 | (1.79) | (1.69) | (0.13) | (0.43) | (0.56) |
| Year Ended 2/28/2019 | $17.37 | 0.07 | (0.11) | (0.04) | (0.04) | (1.92) | (1.96) |
| Year Ended 2/28/2018 | $18.25 | 0.05 | 0.77 | 0.82 | (0.05) | (1.65) | (1.70) |
| Institutional 2 Class |
| Year Ended 2/28/2022 | $19.77 | 0.06 | 2.45 | 2.51 | (0.10) | (2.65) | (2.75) |
| Year Ended 2/28/2021 | $13.48 | 0.09 | 6.35 | 6.44 | (0.09) | (0.06) | (0.15) |
| Year Ended 2/29/2020 | $15.78 | 0.12 | (1.84) | (1.72) | (0.15) | (0.43) | (0.58) |
| Year Ended 2/28/2019 | $17.78 | 0.10 | (0.11) | (0.01) | (0.07) | (1.92) | (1.99) |
| Year Ended 2/28/2018 | $18.63 | 0.08 | 0.79 | 0.87 | (0.07) | (1.65) | (1.72) |
| Institutional 3 Class |
| Year Ended 2/28/2022 | $19.84 | 0.08 | 2.45 | 2.53 | (0.11) | (2.65) | (2.76) |
| Year Ended 2/28/2021 | $13.53 | 0.09 | 6.38 | 6.47 | (0.10) | (0.06) | (0.16) |
| Year Ended 2/29/2020 | $15.84 | 0.13 | (1.85) | (1.72) | (0.16) | (0.43) | (0.59) |
| Year Ended 2/28/2019 | $17.84 | 0.11 | (0.12) | (0.01) | (0.07) | (1.92) | (1.99) |
| Year Ended 2/28/2018 | $18.68 | 0.09 | 0.80 | 0.89 | (0.08) | (1.65) | (1.73) |
The accompanying Notes to Financial Statements are an integral part of this statement.
| 18 | Columbia Small Cap Value Fund II | Annual Report 2022 |
Financial Highlights (continued)
| | Net
asset
value,
end of
period | Total
return | Total gross
expense
ratio to
average
net assets(a) | Total net
expense
ratio to
average
net assets(a),(b) | Net investment
income (loss)
ratio to
average
net assets | Portfolio
turnover | Net
assets,
end of
period
(000’s) |
| Class A |
| Year Ended 2/28/2022 | $18.48 | 11.94% | 1.34% | 1.28%(c) | (0.08%) | 50% | $91,223 |
| Year Ended 2/28/2021 | $18.85 | 47.45% | 1.37% | 1.29%(c) | 0.27% | 55% | $69,591 |
| Year Ended 2/29/2020 | $12.89 | (11.58%) | 1.36% | 1.28%(c) | 0.40% | 27% | $99,356 |
| Year Ended 2/28/2019 | $15.11 | (0.15%) | 1.35% | 1.27%(c) | 0.17% | 38% | $144,155 |
| Year Ended 2/28/2018 | $17.11 | 4.45% | 1.33% | 1.29%(c) | 0.04% | 45% | $165,419 |
| Advisor Class |
| Year Ended 2/28/2022 | $19.46 | 12.26% | 1.09% | 1.03%(c) | 0.15% | 50% | $178,599 |
| Year Ended 2/28/2021 | $19.71 | 47.83% | 1.12% | 1.05%(c) | 0.44% | 55% | $136,110 |
| Year Ended 2/29/2020 | $13.46 | (11.34%) | 1.11% | 1.03%(c) | 0.64% | 27% | $57,400 |
| Year Ended 2/28/2019 | $15.75 | 0.09% | 1.10% | 1.02%(c) | 0.42% | 38% | $85,978 |
| Year Ended 2/28/2018 | $17.75 | 4.73% | 1.08% | 1.04%(c) | 0.30% | 45% | $71,415 |
| Class C |
| Year Ended 2/28/2022 | $15.20 | 11.10% | 2.09% | 2.03%(c) | (0.81%) | 50% | $1,470 |
| Year Ended 2/28/2021 | $16.01 | 46.38% | 2.12% | 2.05%(c) | (0.55%) | 55% | $577 |
| Year Ended 2/29/2020 | $11.00 | (12.27%) | 2.11% | 2.03%(c) | (0.33%) | 27% | $315 |
| Year Ended 2/28/2019 | $12.96 | (0.93%) | 2.09% | 2.02%(c) | (0.71%) | 38% | $611 |
| Year Ended 2/28/2018 | $15.06 | 3.72% | 2.07% | 2.04%(c) | (0.72%) | 45% | $7,785 |
| Institutional Class |
| Year Ended 2/28/2022 | $18.90 | 12.27% | 1.09% | 1.03%(c) | 0.18% | 50% | $425,250 |
| Year Ended 2/28/2021 | $19.21 | 47.85% | 1.12% | 1.04%(c) | 0.51% | 55% | $333,786 |
| Year Ended 2/29/2020 | $13.12 | (11.36%) | 1.11% | 1.03%(c) | 0.66% | 27% | $350,469 |
| Year Ended 2/28/2019 | $15.37 | 0.09% | 1.10% | 1.02%(c) | 0.42% | 38% | $545,568 |
| Year Ended 2/28/2018 | $17.37 | 4.71% | 1.07% | 1.04%(c) | 0.28% | 45% | $727,418 |
| Institutional 2 Class |
| Year Ended 2/28/2022 | $19.53 | 12.41% | 0.91% | 0.88% | 0.30% | 50% | $223,545 |
| Year Ended 2/28/2021 | $19.77 | 48.19% | 0.94% | 0.90% | 0.62% | 55% | $226,504 |
| Year Ended 2/29/2020 | $13.48 | (11.26%) | 0.92% | 0.89% | 0.79% | 27% | $144,260 |
| Year Ended 2/28/2019 | $15.78 | 0.22% | 0.91% | 0.88% | 0.60% | 38% | $118,654 |
| Year Ended 2/28/2018 | $17.78 | 4.90% | 0.90% | 0.89% | 0.44% | 45% | $78,479 |
| Institutional 3 Class |
| Year Ended 2/28/2022 | $19.61 | 12.46% | 0.86% | 0.83% | 0.37% | 50% | $679,291 |
| Year Ended 2/28/2021 | $19.84 | 48.20% | 0.89% | 0.85% | 0.67% | 55% | $563,772 |
| Year Ended 2/29/2020 | $13.53 | (11.23%) | 0.87% | 0.84% | 0.84% | 27% | $393,074 |
| Year Ended 2/28/2019 | $15.84 | 0.27% | 0.85% | 0.83% | 0.62% | 38% | $487,282 |
| Year Ended 2/28/2018 | $17.84 | 4.98% | 0.86% | 0.84% | 0.52% | 45% | $478,580 |
The accompanying Notes to Financial Statements are an integral part of this statement.
Columbia Small Cap Value Fund II | Annual Report 2022
| 19 |
Financial Highlights (continued)
| | Net asset value,
beginning of
period | Net
investment
income
(loss) | Net
realized
and
unrealized
gain (loss) | Total from
investment
operations | Distributions
from net
investment
income | Distributions
from net
realized
gains | Total
distributions to
shareholders |
| Class R |
| Year Ended 2/28/2022 | $18.44 | (0.07) | 2.29 | 2.22 | — | (2.65) | (2.65) |
| Year Ended 2/28/2021 | $12.62 | (0.00)(d) | 5.91 | 5.91 | (0.03) | (0.06) | (0.09) |
| Year Ended 2/29/2020 | $14.80 | 0.02 | (1.71) | (1.69) | (0.06) | (0.43) | (0.49) |
| Year Ended 2/28/2019 | $16.84 | (0.01) | (0.11) | (0.12) | — | (1.92) | (1.92) |
| Year Ended 2/28/2018 | $17.77 | (0.04) | 0.75 | 0.71 | — | (1.64) | (1.64) |
| Notes to Financial Highlights |
| (a) | In addition to the fees and expenses that the Fund bears directly, the Fund indirectly bears a pro rata share of the fees and expenses of any other funds in which it invests. Such indirect expenses are not included in the Fund’s reported expense ratios. |
| (b) | Total net expenses include the impact of certain fee waivers/expense reimbursements made by the Investment Manager and certain of its affiliates, if applicable. |
| (c) | The benefits derived from expense reductions had an impact of less than 0.01%. |
| (d) | Rounds to zero. |
The accompanying Notes to Financial Statements are an integral part of this statement.
| 20 | Columbia Small Cap Value Fund II | Annual Report 2022 |
Financial Highlights (continued)
| | Net
asset
value,
end of
period | Total
return | Total gross
expense
ratio to
average
net assets(a) | Total net
expense
ratio to
average
net assets(a),(b) | Net investment
income (loss)
ratio to
average
net assets | Portfolio
turnover | Net
assets,
end of
period
(000’s) |
| Class R |
| Year Ended 2/28/2022 | $18.01 | 11.73% | 1.59% | 1.53%(c) | (0.34%) | 50% | $3,633 |
| Year Ended 2/28/2021 | $18.44 | 47.11% | 1.62% | 1.55%(c) | (0.00%)(d) | 55% | $5,399 |
| Year Ended 2/29/2020 | $12.62 | (11.79%) | 1.61% | 1.53%(c) | 0.15% | 27% | $4,796 |
| Year Ended 2/28/2019 | $14.80 | (0.46%) | 1.60% | 1.52%(c) | (0.08%) | 38% | $6,104 |
| Year Ended 2/28/2018 | $16.84 | 4.19% | 1.58% | 1.54%(c) | (0.21%) | 45% | $8,302 |
The accompanying Notes to Financial Statements are an integral part of this statement.
Columbia Small Cap Value Fund II | Annual Report 2022
| 21 |
Notes to Financial Statements
February 28, 2022
Note 1. Organization
Columbia Small Cap Value Fund II (the Fund), a series of Columbia Funds Series Trust (the Trust), is a diversified fund. The Trust is registered under the Investment Company Act of 1940, as amended (the 1940 Act), as an open-end management investment company organized as a Delaware statutory trust.
Fund shares
The Trust may issue an unlimited number of shares (without par value). The Fund offers each of the share classes listed in the Statement of Assets and Liabilities. Although all share classes generally have identical voting, dividend and liquidation rights, each share class votes separately when required by the Trust’s organizational documents or by law. Each share class has its own expense and sales charge structure. Different share classes may have different minimum initial investment amounts and pay different net investment income distribution amounts to the extent the expenses of distributing such share classes vary. Distributions to shareholders in a liquidation will be proportional to the net asset value of each share class.
As described in the Fund’s prospectus, Class A and Class C shares are offered to the general public for investment. Effective April 1, 2021, Class C shares automatically convert to Class A shares after 8 years. Prior to April 1, 2021, Class C shares automatically converted to Class A shares after 10 years. Advisor Class, Institutional Class, Institutional 2 Class, Institutional 3 Class and Class R shares are available for purchase through authorized investment professionals to omnibus retirement plans or to institutional investors and to certain other investors as also described in the Fund’s prospectus.
Note 2. Summary of significant accounting policies
Basis of preparation
The Fund is an investment company that applies the accounting and reporting guidance in the Financial Accounting Standards Board (FASB) Accounting Standards Codification Topic 946, Financial Services - Investment Companies (ASC 946). The financial statements are prepared in accordance with U.S. generally accepted accounting principles (GAAP), which requires management to make certain estimates and assumptions that affect the reported amounts of assets and liabilities, the disclosure of contingent assets and liabilities at the date of the financial statements and the reported amounts of income and expenses during the reporting period. Actual results could differ from those estimates.
The following is a summary of significant accounting policies followed by the Fund in the preparation of its financial statements.
Security valuation
Equity securities listed on an exchange are valued at the closing price or last trade price on their primary exchange at the close of business of the New York Stock Exchange. Securities with a closing price not readily available or not listed on any exchange are valued at the mean between the closing bid and ask prices. Listed preferred stocks convertible into common stocks are valued using an evaluated price from a pricing service.
Foreign equity securities are valued based on the closing price or last trade price on their primary exchange at the close of business of the New York Stock Exchange. If any foreign equity security closing prices are not readily available, the securities are valued at the mean of the latest quoted bid and ask prices on such exchanges or markets. Foreign currency exchange rates are determined at the scheduled closing time of the New York Stock Exchange. Many securities markets and exchanges outside the U.S. close prior to the close of the New York Stock Exchange; therefore, the closing prices for securities in such markets or on such exchanges may not fully reflect events that occur after such close but before the close of the New York Stock Exchange. In those situations, foreign securities will be fair valued pursuant to a policy adopted by the Board of Trustees. Under the policy, the Fund may utilize a third-party pricing service to determine these fair values. The third-party pricing service takes into account multiple factors, including, but not limited to, movements in the U.S. securities markets, certain depositary receipts, futures contracts and foreign exchange rates that have occurred subsequent to the close of the foreign exchange or market, to determine a good faith estimate that reasonably reflects the current market conditions as of the close of the New York Stock Exchange. The fair value of a security is likely to be different from the quoted or published price, if available.
| 22 | Columbia Small Cap Value Fund II | Annual Report 2022 |
Notes to Financial Statements (continued)
February 28, 2022
Investments in open-end investment companies (other than exchange-traded funds (ETFs)), are valued at the latest net asset value reported by those companies as of the valuation time.
Investments for which market quotations are not readily available, or that have quotations which management believes are not reflective of market value or reliable, are valued at fair value as determined in good faith under procedures approved by and under the general supervision of the Board of Trustees. If a security or class of securities (such as foreign securities) is valued at fair value, such value is likely to be different from the quoted or published price for the security, if available.
The determination of fair value often requires significant judgment. To determine fair value, management may use assumptions including but not limited to future cash flows and estimated risk premiums. Multiple inputs from various sources may be used to determine fair value.
GAAP requires disclosure regarding the inputs and valuation techniques used to measure fair value and any changes in valuation inputs or techniques. In addition, investments shall be disclosed by major category. This information is disclosed following the Fund’s Portfolio of Investments.
Security transactions
Security transactions are accounted for on the trade date. Cost is determined and gains (losses) are based upon the specific identification method for both financial statement and federal income tax purposes.
Income recognition
Corporate actions and dividend income are generally recorded net of any non-reclaimable tax withholdings, on the ex-dividend date or upon receipt of an ex-dividend notification in the case of certain foreign securities.
The Fund may receive distributions from holdings in equity securities, business development companies (BDCs), exchange-traded funds (ETFs), limited partnerships (LPs), other regulated investment companies (RICs), and real estate investment trusts (REITs), which report information as to the tax character of their distributions annually. These distributions are allocated to dividend income, capital gain and return of capital based on actual information reported. Return of capital is recorded as a reduction of the cost basis of securities held. If the Fund no longer owns the applicable securities, return of capital is recorded as a realized gain. With respect to REITs, to the extent actual information has not yet been reported, estimates for return of capital are made by Columbia Management Investment Advisers, LLC (the Investment Manager), a wholly-owned subsidiary of Ameriprise Financial, Inc. (Ameriprise Financial). The Investment Manager’s estimates are subsequently adjusted when the actual character of the distributions is disclosed by the REITs, which could result in a proportionate change in return of capital to shareholders.
Awards from class action litigation are recorded as a reduction of cost basis if the Fund still owns the applicable securities on the payment date. If the Fund no longer owns the applicable securities on the payment date, the proceeds are recorded as realized gains.
Expenses
General expenses of the Trust are allocated to the Fund and other funds of the Trust based upon relative net assets or other expense allocation methodologies determined by the nature of the expense. Expenses directly attributable to the Fund are charged to the Fund. Expenses directly attributable to a specific class of shares are charged to that share class.
Determination of class net asset value
All income, expenses (other than class-specific expenses, which are charged to that share class, as shown in the Statement of Operations) and realized and unrealized gains (losses) are allocated to each class of the Fund on a daily basis, based on the relative net assets of each class, for purposes of determining the net asset value of each class.
Columbia Small Cap Value Fund II | Annual Report 2022
| 23 |
Notes to Financial Statements (continued)
February 28, 2022
Federal income tax status
The Fund intends to qualify each year as a regulated investment company under Subchapter M of the Internal Revenue Code, as amended, and will distribute substantially all of its investment company taxable income and net capital gain, if any, for its tax year, and as such will not be subject to federal income taxes. In addition, the Fund intends to distribute in each calendar year substantially all of its ordinary income, capital gain net income and certain other amounts, if any, such that the Fund should not be subject to federal excise tax. Therefore, no federal income or excise tax provision is recorded.
Foreign taxes
The Fund may be subject to foreign taxes on income, gains on investments or currency repatriation, a portion of which may be recoverable. The Fund will accrue such taxes and recoveries, as applicable, based upon its current interpretation of tax rules and regulations that exist in the markets in which it invests.
Realized gains in certain countries may be subject to foreign taxes at the Fund level, based on statutory rates. The Fund accrues for such foreign taxes on realized and unrealized gains at the appropriate rate for each jurisdiction, as applicable. The amount, if any, is disclosed as a liability on the Statement of Assets and Liabilities.
Distributions to shareholders
Distributions from net investment income, if any, are declared and paid semi-annually. Net realized capital gains, if any, are distributed at least annually. Income distributions and capital gain distributions are determined in accordance with federal income tax regulations, which may differ from GAAP.
Guarantees and indemnifications
Under the Trust’s organizational documents and, in some cases, by contract, its officers and trustees are indemnified against certain liabilities arising out of the performance of their duties to the Trust or its funds. In addition, certain of the Fund’s contracts with its service providers contain general indemnification clauses. The Fund’s maximum exposure under these arrangements is unknown since the amount of any future claims that may be made against the Fund cannot be determined, and the Fund has no historical basis for predicting the likelihood of any such claims.
Note 3. Fees and other transactions with affiliates
Management services fees
The Fund has entered into a Management Agreement with Columbia Management Investment Advisers, LLC (the Investment Manager), a wholly-owned subsidiary of Ameriprise Financial, Inc. (Ameriprise Financial). Under the Management Agreement, the Investment Manager provides the Fund with investment research and advice, as well as administrative and accounting services. The management services fee is an annual fee that is equal to a percentage of the Fund’s daily net assets that declines from 0.87% to 0.75% as the Fund’s net assets increase. The effective management services fee rate for the year ended February 28, 2022 was 0.82% of the Fund’s average daily net assets.
Compensation of board members
Members of the Board of Trustees who are not officers or employees of the Investment Manager or Ameriprise Financial are compensated for their services to the Fund as disclosed in the Statement of Operations. Under a Deferred Compensation Plan (the Deferred Plan), these members of the Board of Trustees may elect to defer payment of up to 100% of their compensation. Deferred amounts are treated as though equivalent dollar amounts had been invested in shares of certain funds managed by the Investment Manager. The Fund’s liability for these amounts is adjusted for market value changes and remains in the Fund until distributed in accordance with the Deferred Plan. All amounts payable under the Deferred Plan constitute a general unsecured obligation of the Fund. The expense for the Deferred Plan, which includes Trustees’ fees deferred during the current period as well as any gains or losses on the Trustees’ deferred compensation balances as a result of market fluctuations, is included in "Compensation of board members" on the Statement of Operations.
| 24 | Columbia Small Cap Value Fund II | Annual Report 2022 |
Notes to Financial Statements (continued)
February 28, 2022
Compensation of Chief Compliance Officer
The Board of Trustees has appointed a Chief Compliance Officer for the Fund in accordance with federal securities regulations. As disclosed in the Statement of Operations, a portion of the Chief Compliance Officer’s total compensation is allocated to the Fund, along with other allocations to affiliated registered investment companies managed by the Investment Manager and its affiliates, based on relative net assets.
Transfer agency fees
Under a Transfer and Dividend Disbursing Agent Agreement, Columbia Management Investment Services Corp. (the Transfer Agent), an affiliate of the Investment Manager and a wholly-owned subsidiary of Ameriprise Financial, is responsible for providing transfer agency services to the Fund. The Transfer Agent has contracted with DST Asset Manager Solutions, Inc. (DST) to serve as sub-transfer agent. The Transfer Agent pays the fees of DST for services as sub-transfer agent and DST is not entitled to reimbursement for such fees from the Fund (with the exception of out-of-pocket fees).
The Fund pays the Transfer Agent a monthly transfer agency fee based on the number or the average value of accounts, depending on the type of account. In addition, the Fund pays the Transfer Agent a fee for shareholder services based on the number of accounts or on a percentage of the average aggregate value of the Fund’s shares maintained in omnibus accounts up to the lesser of the amount charged by the financial intermediary or a cap established by the Board of Trustees from time to time.
The Transfer Agent also receives compensation from the Fund for various shareholder services and reimbursements for certain out-of-pocket fees. Total transfer agency fees for Institutional 2 Class and Institutional 3 Class shares are subject to an annual limitation of not more than 0.07% and 0.02%, respectively, of the average daily net assets attributable to each share class. In addition, prior to July 1, 2021, Institutional 2 Class shares were subject to a contractual transfer agency fee annual limitation of not more than 0.05% and Institutional 3 Class shares were subject to a contractual transfer agency fee annual limitation of not more than 0.00% of the average daily net assets attributable to each share class.
For the year ended February 28, 2022, the Fund’s effective transfer agency fee rates as a percentage of average daily net assets of each class were as follows:
| | Effective rate (%) |
| Class A | 0.24 |
| Advisor Class | 0.24 |
| Class C | 0.24 |
| Institutional Class | 0.24 |
| Institutional 2 Class | 0.05 |
| Institutional 3 Class | 0.00 |
| Class R | 0.24 |
An annual minimum account balance fee of $20 may apply to certain accounts with a value below the applicable share class’s initial minimum investment requirements to reduce the impact of small accounts on transfer agency fees. These minimum account balance fees are remitted to the Fund and recorded as part of expense reductions in the Statement of Operations. For the year ended February 28, 2022, these minimum account balance fees reduced total expenses of the Fund by $40.
Distribution and service fees
The Fund has entered into an agreement with Columbia Management Investment Distributors, Inc. (the Distributor), an affiliate of the Investment Manager and a wholly-owned subsidiary of Ameriprise Financial, for distribution and shareholder services. The Board of Trustees has approved, and the Fund has adopted, distribution and shareholder service plans (the Plans) applicable to certain share classes, which set the distribution and service fees for the Fund. These fees are calculated daily and are intended to compensate the Distributor and/or eligible selling and/or servicing agents for selling shares of the Fund and providing services to investors.
Columbia Small Cap Value Fund II | Annual Report 2022
| 25 |
Notes to Financial Statements (continued)
February 28, 2022
Under the Plans, the Fund pays a monthly combined distribution and service fee to the Distributor at the maximum annual rate of 0.25% of the average daily net assets attributable to Class A shares of the Fund. Also under the Plans, the Fund pays a monthly service fee to the Distributor at the maximum annual rate of 0.25% of the average daily net assets attributable to Class C shares of the Fund and a monthly distribution fee to the Distributor at the maximum annual rates of 0.75% and 0.50% of the average daily net assets attributable to Class C and Class R shares of the Fund, respectively.
Sales charges (unaudited)
Sales charges, including front-end charges and contingent deferred sales charges (CDSCs), received by the Distributor for distributing Fund shares for the year ended February 28, 2022, if any, are listed below:
| | Front End (%) | CDSC (%) | Amount ($) |
| Class A | 5.75 | 0.50 - 1.00(a) | 134,663 |
| Class C | — | 1.00(b) | 65 |
| (a) | This charge is imposed on certain investments of between $1 million and $50 million redeemed within 18 months after purchase, as follows: 1.00% if redeemed within 12 months after purchase, and 0.50% if redeemed more than 12, but less than 18, months after purchase, with certain limited exceptions. |
| (b) | This charge applies to redemptions within 12 months after purchase, with certain limited exceptions. |
The Fund’s other share classes are not subject to sales charges.
Expenses waived/reimbursed by the Investment Manager and its affiliates
The Investment Manager and certain of its affiliates have contractually agreed to waive fees and/or reimburse expenses (excluding certain fees and expenses described below) for the period(s) disclosed below, unless sooner terminated at the sole discretion of the Board of Trustees, so that the Fund’s net operating expenses, after giving effect to fees waived/expenses reimbursed and any balance credits and/or overdraft charges from the Fund’s custodian, do not exceed the following annual rate(s) as a percentage of the classes’ average daily net assets:
| | July 1, 2021
through
June 30, 2024 | Prior to
July 1, 2021 |
| Class A | 1.27% | 1.29% |
| Advisor Class | 1.02 | 1.04 |
| Class C | 2.02 | 2.04 |
| Institutional Class | 1.02 | 1.04 |
| Institutional 2 Class | 0.88 | 0.89 |
| Institutional 3 Class | 0.83 | 0.84 |
| Class R | 1.52 | 1.54 |
Under the agreement governing these fee waivers and/or expense reimbursement arrangements, the following fees and expenses are excluded from the waiver/reimbursement commitment, and therefore will be paid by the Fund, if applicable: taxes (including foreign transaction taxes), expenses associated with investments in affiliated and non-affiliated pooled investment vehicles (including mutual funds and exchange-traded funds), transaction costs and brokerage commissions, costs related to any securities lending program, dividend expenses associated with securities sold short, inverse floater program fees and expenses, transaction charges and interest on borrowed money, interest, costs associated with shareholder meetings, infrequent and/or unusual expenses and any other expenses the exclusion of which is specifically approved by the Board of Trustees. This agreement may be modified or amended only with approval from the Investment Manager, certain of its affiliates and the Fund. Reflected in the contractual cap commitment, prior to July 1, 2021, is the Transfer Agent’s contractual agreement to limit total transfer agency fees to an annual rate of not more than 0.05% for Institutional 2 Class and 0.00% for Institutional 3 Class of the average daily net assets attributable to each share class. Any fees waived and/or expenses reimbursed under the expense reimbursement arrangements described above are not recoverable by the Investment Manager or its affiliates in future periods.
| 26 | Columbia Small Cap Value Fund II | Annual Report 2022 |
Notes to Financial Statements (continued)
February 28, 2022
Note 4. Federal tax information
The timing and character of income and capital gain distributions are determined in accordance with income tax regulations, which may differ from GAAP because of temporary or permanent book to tax differences.
At February 28, 2022, these differences were primarily due to differing treatment for deferral/reversal of wash sale losses, trustees’ deferred compensation, post-October capital losses, late-year ordinary losses, distribution reclassifications and earnings and profits distributed to shareholders on the redemption of shares. To the extent these differences were permanent, reclassifications were made among the components of the Fund’s net assets. Temporary differences do not require reclassifications.
The following reclassifications were made:
Excess of distributions
over net investment
income ($) | Accumulated
net realized
gain ($) | Paid in
capital ($) |
| 2,018,774 | (19,331,881) | 17,313,107 |
Net investment income (loss) and net realized gains (losses), as disclosed in the Statement of Operations, and net assets were not affected by this reclassification.
The tax character of distributions paid during the years indicated was as follows:
| Year Ended February 28, 2022 | Year Ended February 28, 2021 |
Ordinary
income ($) | Long-term
capital gains ($) | Total ($) | Ordinary
income ($) | Long-term
capital gains ($) | Total ($) |
| 53,913,346 | 140,988,759 | 194,902,105 | 6,300,189 | 4,651,038 | 10,951,227 |
Short-term capital gain distributions, if any, are considered ordinary income distributions for tax purposes.
At February 28, 2022, the components of distributable earnings on a tax basis were as follows:
Undistributed
ordinary income ($) | Undistributed
long-term
capital gains ($) | Capital loss
carryforwards ($) | Net unrealized
appreciation ($) |
| — | 39,516,263 | — | 514,836,535 |
At February 28, 2022, the cost of all investments for federal income tax purposes along with the aggregate gross unrealized appreciation and depreciation based on that cost was:
Federal
tax cost ($) | Gross unrealized
appreciation ($) | Gross unrealized
(depreciation) ($) | Net unrealized
appreciation ($) |
| 1,103,837,526 | 547,198,914 | (32,362,379) | 514,836,535 |
Tax cost of investments and unrealized appreciation/(depreciation) may also include timing differences that do not constitute adjustments to tax basis.
Under current tax rules, regulated investment companies can elect to treat certain late-year ordinary losses incurred and post-October capital losses (capital losses realized after October 31) as arising on the first day of the following taxable year. As of February 28, 2022, the Fund will elect to treat the following late-year ordinary losses and post-October capital losses as arising on March 1, 2022.
Late year
ordinary losses ($) | Post-October
capital losses ($) |
| 373,541 | 10,440,056 |
Columbia Small Cap Value Fund II | Annual Report 2022
| 27 |
Notes to Financial Statements (continued)
February 28, 2022
Management of the Fund has concluded that there are no significant uncertain tax positions in the Fund that would require recognition in the financial statements. However, management’s conclusion may be subject to review and adjustment at a later date based on factors including, but not limited to, new tax laws, regulations, and administrative interpretations (including relevant court decisions). Generally, the Fund’s federal tax returns for the prior three fiscal years remain subject to examination by the Internal Revenue Service.
Note 5. Portfolio information
The cost of purchases and proceeds from sales of securities, excluding short-term investments and derivatives, if any, aggregated to $738,233,637 and $725,910,838, respectively, for the year ended February 28, 2022. The amount of purchase and sale activity impacts the portfolio turnover rate reported in the Financial Highlights.
Transactions to realign the portfolio for the Fund following the reorganization as described in Note 9 are excluded for purposes of calculating the Fund’s portfolio turnover rate. These realignment transactions amounted to cost of purchases and proceeds from sales of $29,565,312 and $0, respectively, for the year ended February 28, 2022.
Note 6. Affiliated money market fund
The Fund invests in Columbia Short-Term Cash Fund, an affiliated money market fund established for the exclusive use by the Fund and other affiliated funds (the Affiliated MMF). The income earned by the Fund from such investments is included as Dividends - affiliated issuers in the Statement of Operations. As an investing fund, the Fund indirectly bears its proportionate share of the expenses of the Affiliated MMF. The Affiliated MMF prices its shares with a floating net asset value. In addition, the Board of Trustees of the Affiliated MMF may impose a fee on redemptions (sometimes referred to as a liquidity fee) or temporarily suspend redemptions (sometimes referred to as imposing a redemption gate) in the event its liquidity falls below regulatory limits.
Note 7. Interfund lending
Pursuant to an exemptive order granted by the Securities and Exchange Commission, the Fund participates in a program (the Interfund Program) allowing each participating Columbia Fund (each, a Participating Fund) to lend money directly to and, except for closed-end funds and money market funds, borrow money directly from other Participating Funds for temporary purposes. The amounts eligible for borrowing and lending under the Interfund Program are subject to certain restrictions.
Interfund loans are subject to the risk that the borrowing fund could be unable to repay the loan when due, and a delay in repayment to the lending fund could result in lost opportunities and/or additional lending costs. The exemptive order is subject to conditions intended to mitigate conflicts of interest arising from the Investment Manager’s relationship with each Participating Fund.
The Fund’s activity in the Interfund Program during the year ended February 28, 2022 was as follows:
| Borrower or lender | Average loan
balance ($) | Weighted average
interest rate (%) | Number of days
with outstanding loans |
| Lender | 1,700,000 | 0.64 | 11 |
Interest income earned by the Fund is recorded as Interfund lending in the Statement of Operations. The Fund had no outstanding interfund loans at February 28, 2022.
Note 8. Line of credit
The Fund has access to a revolving credit facility with a syndicate of banks led by JPMorgan Chase Bank, N.A., Citibank, N.A. and Wells Fargo Bank, N.A. whereby the Fund may borrow for the temporary funding of shareholder redemptions or for other temporary or emergency purposes. Pursuant to an October 28, 2021 amendment and restatement, the credit facility, which is an agreement between the Fund and certain other funds managed by the Investment Manager or an affiliated investment manager, severally and not jointly, permits aggregate borrowings up to $950 million. Interest is currently charged to each participating fund based on its borrowings at a rate equal to the higher of (i) the federal funds effective rate, (ii) the secured overnight financing rate plus 0.11448% and (iii) the overnight bank funding rate, plus in each case, 1.00%. Each borrowing
| 28 | Columbia Small Cap Value Fund II | Annual Report 2022 |
Notes to Financial Statements (continued)
February 28, 2022
under the credit facility matures no later than 60 days after the date of borrowing. The Fund also pays a commitment fee equal to its pro rata share of the unused amount of the credit facility at a rate of 0.15% per annum. The commitment fee is included in other expenses in the Statement of Operations. This agreement expires annually in October unless extended or renewed. Prior to the October 28, 2021 amendment and restatement, the Fund had access to a revolving credit facility with a syndicate of banks led by JPMorgan Chase Bank, N.A., Citibank, N.A. and Wells Fargo Bank, N.A. which permitted collective borrowings up to $950 million. Interest was charged to each participating fund based on its borrowings at a rate equal to the higher of (i) the federal funds effective rate, (ii) the one-month London Interbank Offered Rate (LIBOR) rate and (iii) the overnight bank funding rate, plus in each case, 1.25%.
The Fund had no borrowings during the year ended February 28, 2022.
Note 9. Fund reorganization
At the close of business on January 21, 2022, the Fund acquired the assets and assumed the identified liabilities of BMO Small-Cap Value Fund (the Acquired Fund), a series of BMO Funds Inc. The reorganization was completed after shareholders of the Acquired Fund approved a plan of reorganization at a shareholder meeting held on January 7, 2022. The purpose of the reorganization was to combine two funds with comparable investment objectives and strategies.
The aggregate net assets of the Fund immediately before the reorganization were $1,435,987,849 and the combined net assets immediately after the reorganization were $1,517,978,717.
The reorganization was accomplished by a tax-free exchange of 6,695,724 shares of the Acquired Fund valued at $81,990,868 (including $4,638,318 of unrealized appreciation/(depreciation)).
In exchange for the Acquired Fund’s shares, the Fund issued the following number of shares:
| | Shares |
| Class A | 102,798 |
| Advisor Class | 4,247,560 |
| Institutional 3 Class | 50,335 |
For financial reporting purposes, net assets received and shares issued by the Fund were recorded at fair value; however, the Acquired Fund’s cost of investments was carried forward.
The Fund’s financial statements reflect both the operations of the Fund for the period prior to the reorganization and the combined Fund for the period subsequent to the reorganization. Because the combined investment portfolios have been managed as a single integrated portfolio since the reorganization was completed, it is not practicable to separate the amounts of revenue and earnings of the Acquired Fund that have been included in the combined Fund’s Statement of Operations since the reorganization was completed.
Assuming the reorganization had been completed on March 1, 2021, the Fund’s pro-forma results of operations for the year ended February 28, 2022 would have been approximately:
| | ($) |
| Net investment income | 4,488,000 |
| Net realized gain | 206,826,000 |
| Net change in unrealized appreciation/(depreciation) | (31,844,000) |
| Net increase in net assets from operations | 179,470,000 |
Note 10. Significant risks
Financial sector risk
The Fund is more susceptible to the particular risks that may affect companies in the financial services sector than if it were invested in a wider variety of companies in unrelated sectors. Companies in the financial services sector are subject to certain risks, including the risk of regulatory change, decreased liquidity in credit markets and unstable interest rates. Such
Columbia Small Cap Value Fund II | Annual Report 2022
| 29 |
Notes to Financial Statements (continued)
February 28, 2022
companies may have concentrated portfolios, such as a high level of loans to one or more industries or sectors, which makes them vulnerable to economic conditions that affect such industries or sectors. Performance of such companies may be affected by competitive pressures and exposure to investments, agreements and counterparties, including credit products that, under certain circumstances, may lead to losses (e.g., subprime loans). Companies in the financial services sector are subject to extensive governmental regulation that may limit the amount and types of loans and other financial commitments they can make, and interest rates and fees that they may charge. In addition, profitability of such companies is largely dependent upon the availability and the cost of capital.
Market risk
The Fund may incur losses due to declines in the value of one or more securities in which it invests. These declines may be due to factors affecting a particular issuer, or the result of, among other things, political, regulatory, market, economic or social developments affecting the relevant market(s) more generally. In addition, turbulence in financial markets and reduced liquidity in equity, credit and/or fixed income markets may negatively affect many issuers, which could adversely affect the Fund, including causing difficulty in assigning prices to hard-to-value assets in thinly traded and closed markets, significant redemptions and operational challenges. Global economies and financial markets are increasingly interconnected, and conditions and events in one country, region or financial market may adversely impact issuers in a different country, region or financial market. These risks may be magnified if certain events or developments adversely interrupt the global supply chain; in these and other circumstances, such risks might affect companies worldwide. As a result, local, regional or global events such as terrorism, war, natural disasters, disease/virus outbreaks and epidemics or other public health issues, recessions, depressions or other events – or the potential for such events – could have a significant negative impact on global economic and market conditions.
The large-scale invasion of Ukraine by Russia in February 2022 has resulted in sanctions and market disruptions, including declines in regional and global stock and commodity markets and significant devaluations of Russian currency. The extent and duration of the military action are impossible to predict but could be significant. Market disruption caused by the Russian military action, and any counter measures or responses thereto (including international sanctions, a downgrade in the country’s credit rating, purchasing and financing restrictions, boycotts, tariffs, changes in consumer or purchaser preferences, cyberattacks and espionage) could have a severe adverse impact on regional and/or global securities and commodities markets, including markets for oil and natural gas. These and other related events could have a negative impact on Fund performance and the value of an investment in the Fund.
The pandemic caused by coronavirus disease 2019 and its variants (COVID-19) has resulted in, and may continue to result in, significant global economic and societal disruption and market volatility due to disruptions in market access, resource availability, facilities operations, imposition of tariffs, export controls and supply chain disruption, among others. Such disruptions may be caused, or exacerbated by, quarantines and travel restrictions, workforce displacement and loss in human and other resources. The uncertainty surrounding the magnitude, duration, reach, costs and effects of the global pandemic, as well as actions that have been or could be taken by governmental authorities or other third parties, present unknowns that are yet to unfold. The impacts, as well as the uncertainty over impacts to come, of COVID-19 – and any other infectious illness outbreaks, epidemics and pandemics that may arise in the future – could negatively affect global economies and markets in ways that cannot necessarily be foreseen. In addition, the impact of infectious illness outbreaks and epidemics in emerging market countries may be greater due to generally less established healthcare systems, governments and financial markets. Public health crises caused by the COVID-19 outbreak may exacerbate other pre-existing political, social and economic risks in certain countries or globally. The disruptions caused by COVID-19 could prevent the Fund from executing advantageous investment decisions in a timely manner and negatively impact the Fund’s ability to achieve its investment objectives. Any such event(s) could have a significant adverse impact on the value and risk profile of the Fund.
Shareholder concentration risk
At February 28, 2022, two unaffiliated shareholders of record owned 34.5% of the outstanding shares of the Fund in one or more accounts. The Fund has no knowledge about whether any portion of those shares was owned beneficially. Subscription and redemption activity by concentrated accounts may have a significant effect on the operations of the Fund. In the case of
| 30 | Columbia Small Cap Value Fund II | Annual Report 2022 |
Notes to Financial Statements (continued)
February 28, 2022
a large redemption, the Fund may be forced to sell investments at inopportune times, including its liquid positions, which may result in Fund losses and the Fund holding a higher percentage of less liquid positions. Large redemptions could result in decreased economies of scale and increased operating expenses for non-redeeming Fund shareholders.
Small- and mid-cap company risk
Investments in small- and mid-capitalization companies (small- and mid-cap companies) often involve greater risks than investments in larger, more established companies (larger companies) because small- and mid-cap companies tend to have less predictable earnings and may lack the management experience, financial resources, product diversification and competitive strengths of larger companies. Securities of small- and mid-cap companies may be less liquid and more volatile than the securities of larger companies.
Note 11. Subsequent events
Management has evaluated the events and transactions that have occurred through the date the financial statements were issued and noted no items requiring adjustment of the financial statements or additional disclosure.
Note 12. Information regarding pending and settled legal proceedings
Ameriprise Financial and certain of its affiliates are involved in the normal course of business in legal proceedings which include regulatory inquiries, arbitration and litigation, including class actions concerning matters arising in connection with the conduct of its activities as a diversified financial services firm. Ameriprise Financial believes that the Fund is not currently the subject of, and that neither Ameriprise Financial nor any of its affiliates are the subject of, any pending legal, arbitration or regulatory proceedings that are likely to have a material adverse effect on the Fund or the ability of Ameriprise Financial or its affiliates to perform under their contracts with the Fund. Ameriprise Financial is required to make quarterly (10-Q), annual (10-K) and, as necessary, 8-K filings with the Securities and Exchange Commission (SEC) on legal and regulatory matters that relate to Ameriprise Financial and its affiliates. Copies of these filings may be obtained by accessing the SEC website at www.sec.gov.
There can be no assurance that these matters, or the adverse publicity associated with them, will not result in increased Fund redemptions, reduced sale of Fund shares or other adverse consequences to the Fund. Further, although we believe proceedings are not likely to have a material adverse effect on the Fund or the ability of Ameriprise Financial or its affiliates to perform under their contracts with the Fund, these proceedings are subject to uncertainties and, as such, we are unable to estimate the possible loss or range of loss that may result. An adverse outcome in one or more of these proceedings could result in adverse judgments, settlements, fines, penalties or other relief that could have a material adverse effect on the consolidated financial condition or results of operations of Ameriprise Financial or one or more of its affiliates that provides services to the Fund.
Columbia Small Cap Value Fund II | Annual Report 2022
| 31 |
Report of Independent Registered Public Accounting Firm
To the Board of Trustees of Columbia Funds Series Trust and Shareholders of Columbia Small Cap Value Fund II
Opinion on the Financial Statements
We have audited the accompanying statement of assets and liabilities, including the portfolio of investments, of Columbia Small Cap Value Fund II (one of the funds constituting Columbia Funds Series Trust, referred to hereafter as the "Fund") as of February 28, 2022, the related statement of operations for the year ended February 28, 2022, the statement of changes in net assets for each of the two years in the period ended February 28, 2022, including the related notes, and the financial highlights for each of the five years in the period ended February 28, 2022 (collectively referred to as the "financial statements"). In our opinion, the financial statements present fairly, in all material respects, the financial position of the Fund as of February 28, 2022, the results of its operations for the year then ended, the changes in its net assets for each of the two years in the period ended February 28, 2022 and the financial highlights for each of the five years in the period ended February 28, 2022 in conformity with accounting principles generally accepted in the United States of America.
Basis for Opinion
These financial statements are the responsibility of the Fund’s management. Our responsibility is to express an opinion on the Fund’s financial statements based on our audits. We are a public accounting firm registered with the Public Company Accounting Oversight Board (United States) (PCAOB) and are required to be independent with respect to the Fund in accordance with the U.S. federal securities laws and the applicable rules and regulations of the Securities and Exchange Commission and the PCAOB.
We conducted our audits of these financial statements in accordance with the standards of the PCAOB. Those standards require that we plan and perform the audit to obtain reasonable assurance about whether the financial statements are free of material misstatement, whether due to error or fraud.
Our audits included performing procedures to assess the risks of material misstatement of the financial statements, whether due to error or fraud, and performing procedures that respond to those risks. Such procedures included examining, on a test basis, evidence regarding the amounts and disclosures in the financial statements. Our audits also included evaluating the accounting principles used and significant estimates made by management, as well as evaluating the overall presentation of the financial statements. Our procedures included confirmation of securities owned as of February 28, 2022 by correspondence with the custodian, transfer agent and brokers; when replies were not received from brokers, we performed other auditing procedures. We believe that our audits provide a reasonable basis for our opinion.
/s/PricewaterhouseCoopers LLP
Minneapolis, Minnesota
April 21, 2022
We have served as the auditor of one or more investment companies within the Columbia Funds Complex since 1977.
| 32 | Columbia Small Cap Value Fund II | Annual Report 2022 |
Federal Income Tax Information
(Unaudited)
The Fund hereby designates the following tax attributes for the fiscal year ended February 28, 2022. Shareholders will be notified in early 2023 of the amounts for use in preparing 2022 income tax returns.
Qualified
dividend
income | Dividends
received
deduction | Section
199A
dividends | Capital
gain
dividend |
| 43.75% | 42.71% | 4.15% | $170,531,519 |
Qualified dividend income. For taxable, non-corporate shareholders, the percentage of ordinary income distributed during the fiscal year that represents qualified dividend income subject to reduced tax rates.
Dividends received deduction. The percentage of ordinary income distributed during the fiscal year that qualifies for the corporate dividends received deduction.
Section 199A dividends. For taxable, non-corporate shareholders, the percentage of ordinary income distributed during the fiscal year that represents Section 199A dividends potentially eligible for a 20% deduction.
Capital gain dividend. The Fund designates as a capital gain dividend the amount reflected above, or if subsequently determined to be different, the net capital gain of such fiscal period.
TRUSTEES AND OFFICERS
The Board oversees the Fund’s operations and appoints officers who are responsible for day-to-day business decisions based on policies set by the Board. The following table provides basic biographical information about the Fund’s Trustees as of the printing of this report, including their principal occupations during the past five years, although specific titles for individuals may have varied over the period. The year set forth beneath Length of Service in the table below is the year in which the Trustee was first appointed or elected as Trustee to any Fund currently in the Columbia Funds Complex or a predecessor thereof. Under current Board policy, each Trustee generally serves until December 31 of the year such Trustee turns seventy-five (75).
Independent trustees
Name,
address,
year of birth | Position held
with the Columbia Funds and
length of service | Principal occupation(s)
during past five years
and other relevant
professional experience | Number of
Funds in the
Columbia Funds
Complex*
overseen | Other directorships
held by Trustee
during the past
five years |
George S. Batejan
c/o Columbia Management
Investment Advisers, LLC
290 Congress Street
Boston, MA 02210
1953 | Trustee since 2017 | Executive Vice President, Global Head of Technology and Operations, Janus Capital Group, Inc., 2010-2016 | 177 | Former Chairman of the Board, NICSA (National Investment Company Services Association) (Executive Committee, Nominating Committee and Governance Committee), 2014-2016; former Director, Intech Investment Management, 2011-2016; former Board Member, Metro Denver Chamber of Commerce, 2015-2016; former Advisory Board Member, University of Colorado Business School, 2015-2018 |
Columbia Small Cap Value Fund II | Annual Report 2022
| 33 |
TRUSTEES AND OFFICERS (continued)
Independent trustees (continued)
Name,
address,
year of birth | Position held
with the Columbia Funds and
length of service | Principal occupation(s)
during past five years
and other relevant
professional experience | Number of
Funds in the
Columbia Funds
Complex*
overseen | Other directorships
held by Trustee
during the past
five years |
Kathleen Blatz
c/o Columbia Management
Investment Advisers, LLC
290 Congress Street
Boston, MA 02210
1954 | Trustee since 2006 | Attorney, specializing in arbitration and mediation; Chief Justice, Minnesota Supreme Court, 1998-2006; Associate Justice, Minnesota Supreme Court, 1996-1998; Fourth Judicial District Court Judge, Hennepin County, 1994-1996; Attorney in private practice and public service, 1984-1993; State Representative, Minnesota House of Representatives, 1979-1993, which included service on the Tax and Financial Institutions and Insurance Committees; Member and Interim Chair, Minnesota Sports Facilities Authority, January 2017-July 2017; Interim President and Chief Executive Officer, Blue Cross and Blue Shield of Minnesota (health care insurance), February-July 2018, April-October 2021 | 177 | Former Trustee, Blue Cross and Blue Shield of Minnesota, 2009-2021 (Chair of the Business Development Committee, 2014-2017; Chair of the Governance Committee, 2017-2019); former Member and Chair of the Board, Minnesota Sports Facilities Authority, January 2017-July 2017; former Director, Robina Foundation, 2009-2020 (Chair, 2014-2020); Director, Schulze Family Foundation, since 2021 |
Pamela G. Carlton
c/o Columbia Management
Investment Advisers, LLC
290 Congress Street
Boston, MA 02210
1954 | Trustee since 2007 | President, Springboard — Partners in Cross Cultural Leadership (consulting company) since 2003; Managing Director of US Equity Research, JP Morgan Chase, 1999-2003; Director of US Equity Research, Chase Asset Management, 1996-1999; Co-Director Latin America Research, 1993-1996, COO Global Research, 1992-1996, Co-Director of US Research, 1991-1992, Investment Banker, Morgan Stanley, 1982-1991, Morgan Stanley; Attorney, Cleary Gottlieb Steen & Hamilton LLP, 1980-1982 | 177 | Trustee, New York Presbyterian Hospital Board (Executive Committee and Chair of People Committee) since 1996; Director, DR Bank (Audit Committee) since 2017; Director, Evercore Inc. (Audit Committee) since 2019; Director, Apollo Commercial Real Estate Finance, Inc. since 2021; the Governing Council of the Independent Directors Council (IDC), since 2021 |
Janet Langford Carrig
c/o Columbia Management
Investment Advisers, LLC
290 Congress Street
Boston, MA 02210
1957 | Trustee since 1996 | Senior Vice President, General Counsel and Corporate Secretary, ConocoPhillips (independent energy company), September 2007-October 2018 | 175 | Director, EQT Corporation (natural gas producer) since 2019; Director, Whiting Petroleum Corporation (independent oil and gas company) since 2020 |
J. Kevin Connaughton
c/o Columbia Management
Investment Advisers, LLC
290 Congress Street
Boston, MA 02210
1964 | Trustee since 2020 | Member, FINRA National Adjudicatory Council since January 2020; Adjunct Professor of Finance, Bentley University since January 2018; Consultant to Independent Trustees of CFVIT and CFST I from March 2016 to June 2020 with respect to CFVIT and to December 2020 with respect to CFST I; Managing Director and General Manager of Mutual Fund Products, Columbia Management Investment Advisers, LLC, May 2010-February 2015; President, Columbia Funds, 2008-2015; and senior officer of Columbia Funds and affiliated funds, 2003-2015 | 175 | Former Director, The Autism Project, March 2015-December 2021; former Member of the Investment Committee, St. Michael’s College, November 2015-February 2020; former Trustee, St. Michael’s College, June 2017-September 2019; former Trustee, New Century Portfolios, January 2015-December 2017 |
| 34 | Columbia Small Cap Value Fund II | Annual Report 2022 |
TRUSTEES AND OFFICERS (continued)
Independent trustees (continued)
Name,
address,
year of birth | Position held
with the Columbia Funds and
length of service | Principal occupation(s)
during past five years
and other relevant
professional experience | Number of
Funds in the
Columbia Funds
Complex*
overseen | Other directorships
held by Trustee
during the past
five years |
Olive M. Darragh
c/o Columbia Management
Investment Advisers, LLC
290 Congress Street
Boston, MA 02210
1962 | Trustee since 2020 | Managing Director of Darragh Inc. (strategy and talent management consulting firm) since 2010; Founder and CEO, Zolio, Inc. (investment management talent identification platform) since 2004; Consultant to Independent Trustees of CFVIT and CFST I from June 2019 to June 2020 with respect to CFVIT and to December 2020 with respect to CFST I; Partner, Tudor Investments, 2004-2010; Senior Partner, McKinsey & Company (consulting), 1990-2004; Touche Ross CPA, 1985-1988 | 175 | Former Director, University of Edinburgh Business School (Member of US Board); former Director, Boston Public Library Foundation |
Patricia M. Flynn
c/o Columbia Management
Investment Advisers, LLC
290 Congress Street
Boston, MA 02210
1950 | Trustee since 2004 | Trustee Professor of Economics and Management, Bentley University since 1976 (also teaches and conducts research on corporate governance); Dean, McCallum Graduate School of Business, Bentley University, 1992-2002 | 177 | Trustee, MA Taxpayers Foundation since 1997; Board of Governors, Innovation Institute, MA Technology Collaborative, 2010-2020; former Board of Directors, The MA Business Roundtable, 2003-2019 |
Brian J. Gallagher
c/o Columbia Management
Investment Advisers, LLC
290 Congress Street
Boston, MA 02210
1954 | Trustee since 2017 | Retired; Partner with Deloitte & Touche LLP and its predecessors, 1977-2016 | 177 | Trustee, Catholic Schools Foundation since 2004 |
Douglas A. Hacker
c/o Columbia Management
Investment Advisers, LLC
290 Congress Street
Boston, MA 02210
1955 | Co-Chair since 2021; Chair of CFST I and CFVIT since 2014; Trustee of CFST I and CFVIT since 1996 and CFST, CFST II, CFVST II, CET I and CET II since 2021 | Independent business executive since May 2006; Executive Vice President – Strategy of United Airlines, December 2002 - May 2006; President of UAL Loyalty Services (airline marketing company), September 2001-December 2002; Executive Vice President and Chief Financial Officer of United Airlines, July 1999-September 2001 | 177 | Director, Spartan Nash Company (food distributor); Director, Aircastle Limited (Chair of Audit Committee) (aircraft leasing); former Director, Nash Finch Company (food distributor), 2005-2013; former Director, SeaCube Container Leasing Ltd. (container leasing), 2010-2013; and former Director, Travelport Worldwide Limited (travel information technology), 2014-2019 |
Nancy T. Lukitsh
c/o Columbia Management
Investment Advisers, LLC
290 Congress Street
Boston, MA 02210
1956 | Trustee since 2011 | Senior Vice President, Partner and Director of Marketing, Wellington Management Company, LLP (investment adviser), 1997-2010; Chair, Wellington Management Portfolios (commingled non-U.S. investment pools), 2007 -2010; Director, Wellington Trust Company, NA and other Wellington affiliates, 1997-2010 | 175 | None |
Columbia Small Cap Value Fund II | Annual Report 2022
| 35 |
TRUSTEES AND OFFICERS (continued)
Independent trustees (continued)
Name,
address,
year of birth | Position held
with the Columbia Funds and
length of service | Principal occupation(s)
during past five years
and other relevant
professional experience | Number of
Funds in the
Columbia Funds
Complex*
overseen | Other directorships
held by Trustee
during the past
five years |
David M. Moffett
c/o Columbia Management
Investment Advisers, LLC
290 Congress Street
Boston, MA 02210
1952 | Trustee since 2011 | Retired; Consultant to Bridgewater and Associates | 175 | Director, CSX Corporation (transportation suppliers); Director, Genworth Financial, Inc. (financial and insurance products and services); Director, PayPal Holdings Inc. (payment and data processing services); Trustee, University of Oklahoma Foundation; former Director, eBay Inc. (online trading community), 2007-2015; and former Director, CIT Bank, CIT Group Inc. (commercial and consumer finance), 2010-2016 |
Catherine James Paglia
c/o Columbia Management
Investment Advisers, LLC
290 Congress Street
Boston, MA 02210
1952 | Co-Chair since 2021; Chair of CFST, CFST II, CFVST II, CET I and CET II since 2020; Trustee of CFST, CFST II and CFVST II since 2004 and CFST I and CFVIT since 2021 | Director, Enterprise Asset Management, Inc. (private real estate and asset management company) since September 1998; Managing Director and Partner, Interlaken Capital, Inc., 1989-1997; Vice President, 1982-1985, Principal, 1985-1987, Managing Director, 1987-1989, Morgan Stanley; Vice President, Investment Banking, 1980-1982, Associate, Investment Banking, 1976-1980, Dean Witter Reynolds, Inc. | 177 | Director, Valmont Industries, Inc. (irrigation systems manufacturer) since 2012; Trustee, Carleton College (on the Investment Committee); Trustee, Carnegie Endowment for International Peace (on the Investment Committee) |
Minor M. Shaw
c/o Columbia Management
Investment Advisers, LLC
290 Congress Street
Boston, MA 02210
1947 | Trustee since 2003 | President, Micco LLC (private investments) since 2011; President, Micco Corp. (family investment business), 1998-2011 | 177 | Director, Blue Cross Blue Shield of South Carolina (Chair of Compensation Committee) since April 2008; Trustee, Hollingsworth Funds (on the Investment Committee) since 2016 (previously Board Chair from 2016-2019); Former Advisory Board member, Duke Energy Corp., 2016-2020; Chair of the Duke Endowment; Chair of Greenville – Spartanburg Airport Commission; former Trustee, BofA Funds Series Trust (11 funds), 2003-2011; former Director, Piedmont Natural Gas, 2004-2016; former Director, National Association of Corporate Directors, Carolinas Chapter, 2013-2018; Chair, Daniel-Mickel Foundation since 1998 |
| 36 | Columbia Small Cap Value Fund II | Annual Report 2022 |
TRUSTEES AND OFFICERS (continued)
Independent trustees (continued)
Name,
address,
year of birth | Position held
with the Columbia Funds and
length of service | Principal occupation(s)
during past five years
and other relevant
professional experience | Number of
Funds in the
Columbia Funds
Complex*
overseen | Other directorships
held by Trustee
during the past
five years |
Natalie A. Trunow
c/o Columbia Management
Investment Advisers, LLC
290 Congress Street
Boston, MA 02210
1967 | Trustee since 2020 | Chief Executive Officer, Millennial Portfolio Solutions LLC (asset management and consulting services), January 2016-January 2021; Non-executive Member of the Investment Committee and Valuation Committee, Sarona Asset Management Inc. (private equity firm) since September 2019; Advisor, Horizon Investments (asset management and consulting services), August 2018-January 2021; Advisor, Paradigm Asset Management, November 2016-December 2021; Consultant to Independent Trustees of CFVIT and CFST I from September 2016 to June 2020 with respect to CFVIT and to December 2020 with respect to CFST I; Director of Investments/Consultant, Casey Family Programs, April 2016-November 2016; Senior Vice President and Chief Investment Officer, Calvert Investments, August 2008-January 2016; Section Head and Portfolio Manager, General Motors Asset Management, June 1997-August 2008 | 175 | Former Director, Investment Committee, Health Services for Children with Special Needs, Inc., 2012-2019; Director, Chair of Audit Committee, Consumer Credit Counseling Services (formerly Guidewell Financial Solutions), since 2019; Independent Director, Investment Committee and Valuation Committee, Sarona Asset Management, since 2019 |
Sandra Yeager
c/o Columbia Management
Investment Advisers, LLC
290 Congress Street
Boston, MA 02210
1964 | Trustee since 2017 | Retired; President and founder, Hanoverian Capital, LLC (SEC registered investment advisor firm), 2008-2016; Managing Director, DuPont Capital, 2006-2008; Managing Director, Morgan Stanley Investment Management, 2004-2006; Senior Vice President, Alliance Bernstein, 1990-2004 | 177 | Former Director, NAPE Education Foundation, October 2016-October 2020 |
| * | The term “Columbia Funds Complex” as used herein includes Columbia Seligman Premium Technology Growth Fund, Tri-Continental Corporation and each series of Columbia Fund Series Trust (CFST), Columbia Funds Series Trust I (CFST I), Columbia Funds Series Trust II (CFST II), Columbia ETF Trust I (CET I), Columbia ETF Trust II (CET II), Columbia Funds Variable Insurance Trust (CFVIT) and Columbia Funds Variable Series Trust II (CFVST II). Messrs. Batejan, Beckman, Gallagher and Hacker and Mses. Blatz, Carlton, Flynn, Paglia, Shaw and Yeager serve as Directors of Columbia Seligman Premium Technology Growth Fund and Tri-Continental Corporation. |
Interested trustee affiliated with Investment Manager*
Name,
address,
year of birth | Position held with the Columbia Funds and length of service | Principal occupation(s) during the
past five years and other relevant
professional experience | Number of
Funds in the
Columbia Funds
Complex overseen | Other directorships
held by Trustee
during the past
five years |
Daniel J. Beckman
c/o Columbia Management
Investment Advisers, LLC
290 Congress Street
Boston, MA 02210
1962 | Trustee since November 2021 and President since June 2021 | Vice President – Head of North America Product, Columbia Management Investment Advisers, LLC since April 2015; President and Principal Executive Officer of the Columbia Funds since June 2021; officer of Columbia Funds and affiliated funds, 2020-2021 | 177 | Director, Ameriprise Trust Company, since October 2016; Director, Columbia Management Investment Distributors, Inc. since November 2018; Board of Governors, Columbia Wanger Asset Management, LLC since January 2022 |
| * | Interested person (as defined under the 1940 Act) by reason of being an officer, director, security holder and/or employee of the Investment Manager or Ameriprise Financial. |
The Statement of Additional Information has additional information about the Fund’s Board members and is available, without charge, upon request by calling 800.345.6611, visiting columbiathreadneedleus.com/investor/ or contacting your financial intermediary.
Columbia Small Cap Value Fund II | Annual Report 2022
| 37 |
TRUSTEES AND OFFICERS (continued)
The Board has appointed officers who are responsible for day-to-day business decisions based on policies it has established. The officers serve at the pleasure of the Board. The following table provides basic information about the Officers of the Fund as of the printing of this report, including principal occupations during the past five years, although their specific titles may have varied over the period. In addition to Mr. Beckman, who is President and Principal Executive Officer, the Fund’s other officers are:
Fund officers
Name,
address and
year of birth | Position and year
first appointed to
position for any Fund
in the Columbia
Funds Complex or a
predecessor thereof | Principal occupation(s) during past five years |
Michael G. Clarke
290 Congress Street
Boston, MA 02210
1969 | Chief Financial Officer and Principal Financial Officer (2009) and Senior Vice President (2019) | Senior Vice President and Head of Global Operations & Investor Services, Columbia Management Investment Advisers, LLC, since March 2022 (previously Vice President, Head of North American Operations, and Co-Head of Global Operations, June 2019 to February 2022 and Vice President – Accounting and Tax, May 2010 - May 2019); senior officer of Columbia Funds and affiliated funds since 2002. |
Joseph Beranek
5890 Ameriprise
Financial Center
Minneapolis, MN 55474
1965 | Treasurer and Chief Accounting Officer (Principal Accounting Officer) (2019) and Principal Financial Officer (2020), CFST, CFST I, CFST II, CFVIT and CFVST II; Assistant Treasurer, CET I and CET II | Vice President – Mutual Fund Accounting and Financial Reporting, Columbia Management Investment Advisers, LLC, since December 2018 and March 2017, respectively (previously Vice President – Pricing and Corporate Actions, May 2010 - March 2017). |
Marybeth Pilat
290 Congress Street
Boston, MA 02210
1968 | Treasurer and Chief Accounting Officer (Principal Accounting Officer) and Principal Financial Officer (2020) for CET I and CET II; Assistant Treasurer, CFST, CFST I, CFST II, CFVIT and CFVST II | Vice President – Product Pricing and Administration, Columbia Management Investment Advisers, LLC, since May 2017; Director - Fund Administration, Calvert Investments, August 2015 – March 2017; Vice President - Fund Administration, Legg Mason, May 2015 - July 2015; Vice President - Fund Administration, Columbia Management Investment Advisers, LLC, May 2010 - April 2015. |
William F. Truscott
290 Congress Street
Boston, MA 02210
1960 | Senior Vice President (2001) | Formerly, Trustee/Director of Columbia Funds Complex or legacy funds, November 2001-January 1, 2021; Chief Executive Officer, Global Asset Management, Ameriprise Financial, Inc. since September 2012; Chairman of the Board and President, Columbia Management Investment Advisers, LLC since July 2004 and February 2012, respectively; Chairman of the Board and Chief Executive Officer, Columbia Management Investment Distributors, Inc. since November 2008 and February 2012, respectively; Chairman of the Board and Director, Threadneedle Asset Management Holdings, Sàrl since March 2013 and December 2008, respectively; senior executive of various entities affiliated with Columbia Threadneedle. |
Christopher O. Petersen
5228 Ameriprise Financial Center
Minneapolis, MN 55474
1970 | Senior Vice President and Assistant Secretary | Formerly, Trustee/Director of funds within the Columbia Funds Complex, July 1, 2020 - November 22, 2021; Senior Vice President and Assistant General Counsel, Ameriprise Financial, Inc. since September 2021 (previously Vice President and Lead Chief Counsel, January 2015 - September 2021); President and Principal Executive Officer of the Columbia Funds, 2015 - 2021; officer of Columbia Funds and affiliated funds since 2007. |
Thomas P. McGuire
290 Congress Street
Boston, MA 02210
1972 | Senior Vice President and Chief Compliance Officer (2012) | Vice President – Asset Management Compliance, Ameriprise Financial, Inc., since May 2010; Chief Compliance Officer, Columbia Acorn/Wanger Funds since December 2015; Chief Compliance Officer, Ameriprise Certificate Company, September 2010 – September 2020. |
Ryan C. Larrenaga
290 Congress Street
Boston, MA 02210
1970 | Senior Vice President (2017), Chief Legal Officer (2017), and Secretary (2015) | Vice President and Chief Counsel, Ameriprise Financial, Inc. since August 2018 (previously Vice President and Group Counsel, August 2011 - August 2018); Chief Legal Officer, Columbia Acorn/Wanger Funds, since September 2020; officer of Columbia Funds and affiliated funds since 2005. |
| 38 | Columbia Small Cap Value Fund II | Annual Report 2022 |
TRUSTEES AND OFFICERS (continued)
Fund officers (continued)
Name,
address and
year of birth | Position and year
first appointed to
position for any Fund
in the Columbia
Funds Complex or a
predecessor thereof | Principal occupation(s) during past five years |
Michael E. DeFao
290 Congress Street
Boston, MA 02210
1968 | Vice President (2011) and Assistant Secretary (2010) | Vice President and Chief Counsel, Ameriprise Financial, Inc. since May 2010; Vice President, Chief Legal Officer and Assistant Secretary, Columbia Management Investment Advisers, LLC since October 2021 (previously Vice President and Assistant Secretary, May 2010 – September 2021). |
Lyn Kephart-Strong
5228 Ameriprise
Financial Center
Minneapolis, MN 55474
1960 | Vice President (2015) | President, Columbia Management Investment Services Corp. since October 2014; Vice President & Resolution Officer, Ameriprise Trust Company since August 2009. |
Columbia Small Cap Value Fund II | Annual Report 2022
| 39 |
Columbia Small Cap Value Fund II
P.O. Box 219104
Kansas City, MO 64121-9104
Please read and consider the investment objectives, risks, charges and expenses for any fund carefully before investing. For a prospectus and summary prospectus, which contains this and other important information about the Fund, go to
columbiathreadneedleus.com/investor/. The Fund is distributed by Columbia Management Investment Distributors, Inc., member FINRA, and managed by Columbia Management Investment Advisers, LLC.
Columbia Threadneedle Investments (Columbia Threadneedle) is the global brand name of the Columbia and Threadneedle group of companies. All rights reserved.
© 2022 Columbia Management Investment Advisers, LLC.
columbiathreadneedleus.com/investor/

Annual Report
February 28, 2022
Columbia Overseas Value Fund
Not Federally Insured • No Financial Institution Guarantee • May Lose Value
If you elect to receive the shareholder report for Columbia Overseas Value Fund (the Fund) in paper, mailed to you, the Fund mails one shareholder report to each shareholder address, unless such shareholder elects to receive shareholder reports from the Fund electronically via e-mail or by having a paper notice mailed to you (Postcard Notice) that your Fund’s shareholder report is available at the Columbia funds’ website (columbiathreadneedleus.com/investor/). If you would like more than one report in paper to be mailed to you, or would like to elect to receive reports via e-mail or access them through Postcard Notice, please call shareholder services at 800.345.6611 and additional reports will be sent to you.
Proxy voting policies and procedures
The policy of the Board of Trustees is to vote the proxies of the companies in which the Fund holds investments consistent with the procedures as stated in the Statement of Additional Information (SAI). You may obtain a copy of the SAI without charge by calling 800.345.6611; contacting your financial intermediary; visiting columbiathreadneedleus.com/investor/; or searching the website of the Securities and Exchange Commission (SEC) at sec.gov. Information regarding how the Fund voted proxies relating to portfolio securities is filed with the SEC by August 31st for the most recent 12-month period ending June 30th of that year, and is available without charge by visiting columbiathreadneedleus.com/investor/, or searching the website of the SEC at sec.gov.
Quarterly schedule of investments
The Fund files a complete schedule of portfolio holdings with the SEC for the first and third quarters of each fiscal year on Form N-PORT. The Fund’s Form N-PORT filings are available on the SEC’s website at sec.gov. The Fund’s complete schedule of portfolio holdings, as filed on Form N-PORT, can also be obtained without charge, upon request, by calling 800.345.6611.
Additional Fund information
For more information about the Fund, please visit columbiathreadneedleus.com/investor/ or call 800.345.6611. Customer Service Representatives are available to answer your questions Monday through Friday from 8 a.m. to 7 p.m. Eastern time.
Fund investment manager
Columbia Management Investment Advisers, LLC (the Investment Manager)
290 Congress Street
Boston, MA 02210
Fund distributor
Columbia Management Investment Distributors, Inc.
290 Congress Street
Boston, MA 02210
Fund transfer agent
Columbia Management Investment Services Corp.
P.O. Box 219104
Kansas City, MO 64121-9104
Columbia Overseas Value Fund | Annual Report 2022
Investment objective
The Fund seeks long-term capital appreciation.
Portfolio management
Fred Copper, CFA
Co-Portfolio Manager
Managed Fund since 2008
Daisuke Nomoto, CMA (SAAJ)
Co-Portfolio Manager
Managed Fund since 2013
Morningstar style boxTM
The Morningstar Style Box is based on a fund’s portfolio holdings. For equity funds, the vertical axis shows the market capitalization of the stocks owned, and the horizontal axis shows investment style (value, blend, or growth). Information shown is based on the most recent data provided by Morningstar.
© 2022 Morningstar, Inc. All rights reserved. The Morningstar information contained herein: (1) is proprietary to Morningstar and/or its content providers; (2) may not be copied or distributed; and (3) is not warranted to be accurate, complete or timely. Neither Morningstar nor its content providers are responsible for any damages or losses arising from any use of this information.
| Average annual total returns (%) (for the period ended February 28, 2022) |
| | | Inception | 1 Year | 5 Years | 10 Years |
| Class A* | Excluding sales charges | 02/28/13 | 4.65 | 6.63 | 6.07 |
| | Including sales charges | | -1.37 | 5.37 | 5.45 |
| Advisor Class* | 07/01/15 | 4.93 | 6.90 | 6.36 |
| Class C* | Excluding sales charges | 02/28/13 | 3.88 | 5.84 | 5.27 |
| | Including sales charges | | 2.88 | 5.84 | 5.27 |
| Institutional Class | 03/31/08 | 4.91 | 6.89 | 6.36 |
| Institutional 2 Class* | 07/01/15 | 5.02 | 7.02 | 6.44 |
| Institutional 3 Class* | 07/01/15 | 5.07 | 7.05 | 6.48 |
| Class R* | 03/01/16 | 4.40 | 6.36 | 5.84 |
| MSCI EAFE Value Index (Net) | | 6.33 | 4.62 | 4.68 |
Returns for Class A shares are shown with and without the maximum initial sales charge of 5.75%. Returns for Class C shares are shown with and without the 1.00% contingent deferred sales charge for the first year only. The Fund’s other share classes are not subject to sales charges and have limited eligibility. Please see the Fund’s prospectus for details. Performance for different share classes will vary based on differences in sales charges and fees associated with each share class. All results shown assume reinvestment of distributions during the period. Returns do not reflect the deduction of taxes that a shareholder may pay on Fund distributions or on the redemption of Fund shares. Performance results reflect the effect of any fee waivers or reimbursements of Fund expenses by Columbia Management Investment Advisers, LLC and/or any of its affiliates. Absent these fee waivers or expense reimbursement arrangements, performance results would have been lower.
The performance information shown represents past performance and is not a guarantee of future results. The investment return and principal value of your investment will fluctuate so that your shares, when redeemed, may be worth more or less than their original cost. Current performance may be lower or higher than the performance information shown. You may obtain performance information current to the most recent month-end by contacting your financial intermediary, visiting columbiathreadneedleus.com/investor/ or calling 800.345.6611.
| * | The returns shown for periods prior to the share class inception date (including returns for the Life of the Fund, if shown, which are since Fund inception) include the returns of the Fund’s oldest share class. These returns are adjusted to reflect any higher class-related operating expenses of the newer share classes, as applicable. Please visit columbiathreadneedleus.com/investor/investment-products/mutual-funds/appended-performance for more information. |
The MSCI EAFE Value Index (Net) is a subset of the MSCI EAFE Index (Net), and constituents of the index include securities from Europe, Australasia and the Far East. The index generally represents approximately 50% of the free float-adjusted market capitalization of the MSCI EAFE Index (Net), and consists of those securities classified by MSCI Inc. as most representing the value style, such as, higher book value-to-price ratios, higher forward earnings-to-price ratios, higher dividend yields and lower forecasted growth rates than securities representing the growth style.
Indices are not available for investment, are not professionally managed and do not reflect sales charges, fees, brokerage commissions, taxes (except the MSCI EAFE Value Index (Net), which reflects reinvested dividends net of withholding taxes) or other expenses of investing. Securities in the Fund may not match those in an index.
Fund performance may be significantly negatively impacted by the economic impact of the COVID-19 pandemic. The COVID-19 pandemic has adversely impacted economies and capital markets around the world in ways that will likely continue and may change in unforeseen ways for an indeterminate period. The COVID-19 pandemic may exacerbate pre-existing political, social and economic risks in certain countries and globally.
Columbia Overseas Value Fund | Annual Report 2022
| 3 |
Fund at a Glance (continued)
Performance of a hypothetical $10,000 investment (February 29, 2012 — February 28, 2022)
The chart above shows the change in value of a hypothetical $10,000 investment in Class A shares of Columbia Overseas Value Fund during the stated time period, and does not reflect the deduction of taxes that a shareholder may pay on Fund distributions or on the redemption of Fund shares.
| Equity sector breakdown (%) (at February 28, 2022) |
| Communication Services | 9.6 |
| Consumer Discretionary | 5.6 |
| Consumer Staples | 10.5 |
| Energy | 11.9 |
| Financials | 23.5 |
| Health Care | 9.7 |
| Industrials | 11.7 |
| Information Technology | 4.6 |
| Materials | 8.5 |
| Real Estate | 1.1 |
| Utilities | 3.3 |
| Total | 100.0 |
Percentages indicated are based upon total equity investments. The Fund’s portfolio composition is subject to change.
| Country breakdown (%) (at February 28, 2022) |
| Australia | 0.1 |
| Austria | 0.4 |
| Brazil | 0.5 |
| Canada | 7.6 |
| China | 0.5 |
| Finland | 1.8 |
| France | 12.5 |
| Germany | 6.5 |
| Greece | 0.6 |
| Hong Kong | 1.6 |
| Ireland | 1.5 |
| Country breakdown (%) (at February 28, 2022) |
| Israel | 0.9 |
| Japan | 18.6 |
| Netherlands | 6.1 |
| Norway | 1.2 |
| Pakistan | 0.1 |
| Russian Federation | 0.1 |
| Singapore | 2.2 |
| South Africa | 0.7 |
| South Korea | 1.4 |
| Spain | 3.4 |
| Sweden | 0.8 |
| Switzerland | 2.0 |
| Taiwan | 1.5 |
| United Kingdom | 19.9 |
| United States(a) | 7.5 |
| Total | 100.0 |
| (a) | Includes investments in Money Market Funds and Exchange-Traded Funds. |
Country breakdown is based primarily on issuer’s place of organization/incorporation. Percentages indicated are based upon total investments, excluding investments in derivatives, if any. The Fund’s portfolio composition is subject to change.
| 4 | Columbia Overseas Value Fund | Annual Report 2022 |
Manager Discussion of Fund Performance
For the 12-month period that ended February 28, 2022, Class A shares of Columbia Overseas Value Fund returned 4.65% excluding sales charges. The Fund underperformed its benchmark, the MSCI EAFE Value Index (Net), which returned 6.33% for the same time period.
Market overview
International equity markets delivered positive results during the 12-month period, with the broad developed-market MSCI EAFE Index (Net) finishing up more than 2% in U.S. dollar terms. Most of the upside came during the first half of the period, as the gradual, though globally uneven, re-opening of the world economy continued to boost sentiment, activity and stock prices. Positive momentum – which also was driven to some degree by highly speculative behavior among retail investors – stalled somewhat midway through the period, triggered largely by more hawkish policy expectations from the U.S. Federal Reserve in June that weighed on cyclical parts of the market. Concerns over the emergence of the Delta and Omicron COVID-19 variants added to market choppiness, as did worries over strained U.S.-China trade relations. Problems in China’s property sector added to global equity market consternation, most notably symbolized by the credit crisis at Evergrande, a systemically important property developer in China with significant amounts of outstanding debt. Additional headwinds included inflation, which reached almost 7% in the U.S. and caused a further hawkish turn as the Federal Reserve announced a plan to taper the pace of quantitative easing and signaled three interest rate hikes in 2022. Central banks in other parts of the world tightened monetary policy as well, particularly in emerging markets. Of significance, tensions between Russia and Ukraine near the end of the period roiled global markets and drove significant sell-offs.
The Fund’s notable detractors during the period
| • | The Fund’s underperformance of its benchmark during the period was caused primarily by adverse stock selection, particularly within the United Kingdom, as well as the health care, information technology and consumer discretionary sectors. |
| • | Individual holdings that lagged in absolute and relative terms included TP Icap Group PLC (U.K.), Atos (France), Stillfront Group AB (Sweden), Covestro AG (Germany) and Ship Healthcare Holdings, Inc. (Japan). |
| • | From a geographical perspective, the Fund’s out-of-benchmark allocations to Korea and Russia hurt relative performance, as did stock selection within the United Kingdom and France. |
The Fund’s notable contributors during the period
| • | Relative to its benchmark, the Fund’s overweight positions in Canada, Taiwan and the energy sector helped results. |
| • | Individual top performers included Fubon Financial Holding Co., Ltd. (Taiwan), Teck Resources Ltd. (Canada), Alimentation Couche-Tard, Inc. (Canada), Bank Hapoalim BM (Israel) and Cameco Corp. (Canada). The Fund’s position in Bank Hapoalim BM was sold. |
Market risk may affect a single issuer, sector of the economy, industry or the market as a whole. Value securities may be unprofitable if the market fails to recognize their intrinsic worth or the portfolio manager misgauged that worth. International investing involves certain risks and volatility due to potential political, economic or currency instabilities and different financial and accounting standards. Risks are enhanced for emerging market issuers. Investing in derivatives is a specialized activity that involves special risks that subject the Fund to significant loss potential, including when used as leverage, and may result in greater fluctuation in Fund value. See the Fund’s prospectus for information on these and other risks.
The views expressed in this report reflect the current views of the respective parties who have contributed to this report. These views are not guarantees of future performance and involve certain risks, uncertainties and assumptions that are difficult to predict, so actual outcomes and results may differ significantly from the views expressed. These views are subject to change at any time based upon economic, market or other conditions and the respective parties disclaim any responsibility to update such views. These views may not be relied on as investment advice and, because investment decisions for a Columbia fund are based on numerous factors, may not be relied on as an indication of trading intent on behalf of any particular Columbia fund. References to specific securities should not be construed as a recommendation or investment advice.
Columbia Overseas Value Fund | Annual Report 2022
| 5 |
Understanding Your Fund’s Expenses
(Unaudited)
As an investor, you incur two types of costs. There are shareholder transaction costs, which generally include sales charges on purchases and may include redemption fees. There are also ongoing fund costs, which generally include management fees, distribution and/or service fees, and other fund expenses. The following information is intended to help you understand your ongoing costs (in dollars) of investing in the Fund and to help you compare these costs with the ongoing costs of investing in other mutual funds.
Analyzing your Fund’s expenses
To illustrate these ongoing costs, we have provided examples and calculated the expenses paid by investors in each share class of the Fund during the period. The actual and hypothetical information in the table is based on an initial investment of $1,000 at the beginning of the period indicated and held for the entire period. Expense information is calculated two ways and each method provides you with different information. The amount listed in the “Actual” column is calculated using the Fund’s actual operating expenses and total return for the period. You may use the Actual information, together with the amount invested, to estimate the expenses that you paid over the period. Simply divide your account value by $1,000 (for example, an $8,600 account value divided by $1,000 = 8.6), then multiply the results by the expenses paid during the period under the “Actual” column. The amount listed in the “Hypothetical” column assumes a 5% annual rate of return before expenses (which is not the Fund’s actual return) and then applies the Fund’s actual expense ratio for the period to the hypothetical return. You should not use the hypothetical account values and expenses to estimate either your actual account balance at the end of the period or the expenses you paid during the period. See “Compare with other funds” below for details on how to use the hypothetical data.
Compare with other funds
Since all mutual funds are required to include the same hypothetical calculations about expenses in shareholder reports, you can use this information to compare the ongoing cost of investing in the Fund with other funds. To do so, compare the hypothetical example with the 5% hypothetical examples that appear in the shareholder reports of other funds. As you compare hypothetical examples of other funds, it is important to note that hypothetical examples are meant to highlight the ongoing costs of investing in a fund only and do not reflect any transaction costs, such as sales charges, or redemption or exchange fees. Therefore, the hypothetical calculations are useful in comparing ongoing costs only, and will not help you determine the relative total costs of owning different funds. If transaction costs were included in these calculations, your costs would be higher.
| September 1, 2021 — February 28, 2022 |
| | Account value at the
beginning of the
period ($) | Account value at the
end of the
period ($) | Expenses paid during
the period ($) | Fund’s annualized
expense ratio (%) |
| | Actual | Hypothetical | Actual | Hypothetical | Actual | Hypothetical | Actual |
| Class A | 1,000.00 | 1,000.00 | 966.80 | 1,019.09 | 5.61 | 5.76 | 1.15 |
| Advisor Class | 1,000.00 | 1,000.00 | 967.90 | 1,020.33 | 4.39 | 4.51 | 0.90 |
| Class C | 1,000.00 | 1,000.00 | 962.90 | 1,015.37 | 9.25 | 9.49 | 1.90 |
| Institutional Class | 1,000.00 | 1,000.00 | 968.10 | 1,020.33 | 4.39 | 4.51 | 0.90 |
| Institutional 2 Class | 1,000.00 | 1,000.00 | 968.60 | 1,020.73 | 4.00 | 4.11 | 0.82 |
| Institutional 3 Class | 1,000.00 | 1,000.00 | 969.00 | 1,020.98 | 3.76 | 3.86 | 0.77 |
| Class R | 1,000.00 | 1,000.00 | 965.60 | 1,017.85 | 6.82 | 7.00 | 1.40 |
Expenses paid during the period are equal to the annualized expense ratio for each class as indicated above, multiplied by the average account value over the period and then multiplied by the number of days in the Fund’s most recent fiscal half year and divided by 365.
Expenses do not include fees and expenses incurred indirectly by the Fund from its investment in underlying funds, including affiliated and non-affiliated pooled investment vehicles, such as mutual funds and exchange-traded funds.
Had Columbia Management Investment Advisers, LLC and/or certain of its affiliates not waived/reimbursed certain fees and expenses, account value at the end of the period would have been reduced.
| 6 | Columbia Overseas Value Fund | Annual Report 2022 |
Portfolio of Investments
February 28, 2022
(Percentages represent value of investments compared to net assets)
Investments in securities
| Common Stocks 97.1% |
| Issuer | Shares | Value ($) |
| Australia 0.1% |
| Ansell Ltd. | 152,711 | 2,861,464 |
| Austria 0.4% |
| Andritz AG | 255,413 | 11,449,961 |
| Brazil 0.5% |
| Azul SA, ADR(a) | 983,877 | 14,374,443 |
| Canada 7.6% |
| Alimentation Couche-Tard, Inc. | 1,460,305 | 57,317,691 |
| Cameco Corp.(b) | 1,445,023 | 35,518,665 |
| Teck Resources Ltd., Class B(b) | 956,253 | 34,377,296 |
| Teekay Tankers Ltd., Class A(a) | 1,171,856 | 16,745,822 |
| West Fraser Timber Co., Ltd. | 295,719 | 29,518,239 |
| Yamana Gold, Inc. | 7,040,933 | 34,500,572 |
| Total | 207,978,285 |
| China 0.5% |
| Guangdong Investment Ltd. | 10,360,000 | 13,941,403 |
| Finland 1.8% |
| UPM-Kymmene OYJ | 1,445,024 | 49,930,239 |
| France 12.5% |
| AtoS | 548,832 | 19,499,133 |
| AXA SA | 2,606,643 | 70,529,583 |
| BNP Paribas SA | 1,213,603 | 70,418,808 |
| DBV Technologies SA, ADR(a) | 335,217 | 449,191 |
| Eiffage SA | 335,314 | 34,156,432 |
| Sanofi | 577,105 | 60,326,283 |
| TotalEnergies SE | 1,700,367 | 86,625,638 |
| Total | 342,005,068 |
| Germany 6.5% |
| Aroundtown SA | 2,113,555 | 13,032,484 |
| Bayer AG, Registered Shares | 296,250 | 17,112,286 |
| Covestro AG | 634,339 | 33,547,484 |
| Daimler Truck Holding AG(a) | 199,431 | 6,077,774 |
| Duerr AG | 744,178 | 26,800,759 |
| E.ON SE | 3,179,620 | 43,247,763 |
| KION Group AG | 307,908 | 24,683,839 |
| Common Stocks (continued) |
| Issuer | Shares | Value ($) |
| Mercedes-Benz Group AG, Registered Shares | 171,938 | 13,431,720 |
| Total | 177,934,109 |
| Greece 0.6% |
| Piraeus Financial Holdings SA(a) | 10,680,950 | 16,915,990 |
| Hong Kong 1.6% |
| WH Group Ltd. | 60,810,830 | 42,468,831 |
| Ireland 1.5% |
| Amarin Corp. PLC, ADR(a) | 311,700 | 1,031,727 |
| Bank of Ireland Group PLC(a) | 2,923,836 | 19,400,394 |
| Flutter Entertainment PLC(a) | 139,938 | 20,152,212 |
| Total | 40,584,333 |
| Israel 0.9% |
| Bezeq Israeli Telecommunication Corp., Ltd.(a) | 15,012,482 | 24,646,930 |
| Japan 18.6% |
| Dai-ichi Life Holdings, Inc. | 1,344,300 | 27,918,614 |
| Daiwabo Holdings Co., Ltd. | 2,115,900 | 32,752,806 |
| Invincible Investment Corp. | 24,212 | 8,303,002 |
| ITOCHU Corp. | 1,992,300 | 64,926,280 |
| Kinden Corp. | 1,252,300 | 17,760,896 |
| Koito Manufacturing Co., Ltd. | 467,000 | 24,154,590 |
| MatsukiyoCocokara & Co. | 1,194,800 | 46,062,159 |
| Nippon Telegraph & Telephone Corp. | 1,151,300 | 33,089,388 |
| ORIX Corp. | 3,138,300 | 62,210,942 |
| Ship Healthcare Holdings, Inc. | 1,255,800 | 24,997,345 |
| Simplex Holdings, Inc.(a) | 233,700 | 3,355,107 |
| SoftBank Group Corp. | 317,900 | 14,266,089 |
| Sony Group Corp. | 160,600 | 16,408,856 |
| Starts Corp., Inc. | 308,400 | 6,969,852 |
| Sumitomo Mitsui Financial Group, Inc. | 1,187,000 | 42,093,726 |
| Takeda Pharmaceutical Co., Ltd. | 910,800 | 27,770,574 |
| Takuma Co., Ltd. | 824,845 | 10,482,770 |
| Toyota Motor Corp. | 2,401,000 | 43,929,158 |
| Total | 507,452,154 |
The accompanying Notes to Financial Statements are an integral part of this statement.
Columbia Overseas Value Fund | Annual Report 2022
| 7 |
Portfolio of Investments (continued)
February 28, 2022
| Common Stocks (continued) |
| Issuer | Shares | Value ($) |
| Netherlands 6.1% |
| ABN AMRO Bank NV | 1,549,421 | 20,618,492 |
| ASR Nederland NV | 1,299,515 | 56,166,322 |
| ING Groep NV | 4,980,931 | 58,169,822 |
| Signify NV | 600,239 | 30,704,504 |
| Total | 165,659,140 |
| Norway 1.2% |
| Leroy Seafood Group ASA | 3,872,354 | 33,807,128 |
| Pakistan 0.1% |
| DG Khan Cement Co., Ltd. | 6,779,443 | 2,742,740 |
| Russian Federation 0.1% |
| Lukoil PJSC, ADR | 106,132 | 1,990,705 |
| Singapore 2.2% |
| BW LPG Ltd. | 2,349,305 | 14,000,004 |
| Venture Corp., Ltd. | 3,544,400 | 46,234,574 |
| Total | 60,234,578 |
| South Africa 0.7% |
| Sibanye Stillwater Ltd., ADR(b) | 980,691 | 18,750,812 |
| South Korea 1.4% |
| GS Retail Co., Ltd. | 717,418 | 15,953,549 |
| Hyundai Home Shopping Network Corp. | 128,465 | 6,246,438 |
| Youngone Corp. | 479,524 | 17,053,751 |
| Total | 39,253,738 |
| Spain 3.3% |
| ACS Actividades de Construccion y Servicios SA | 632,928 | 15,380,526 |
| Banco Santander SA | 12,518,680 | 41,687,434 |
| Endesa SA | 1,372,174 | 30,162,345 |
| Tecnicas Reunidas SA(a) | 507,767 | 4,150,812 |
| Total | 91,381,117 |
| Sweden 0.7% |
| Granges AB | 504,288 | 5,390,713 |
| Stillfront Group AB(a) | 4,215,258 | 13,716,748 |
| Total | 19,107,461 |
| Switzerland 2.0% |
| Novartis AG, Registered Shares | 633,942 | 55,718,089 |
| Taiwan 1.5% |
| Fubon Financial Holding Co., Ltd. | 14,770,300 | 39,880,771 |
| Common Stocks (continued) |
| Issuer | Shares | Value ($) |
| United Kingdom 19.8% |
| AstraZeneca PLC, ADR | 398,791 | 24,278,396 |
| Barclays Bank PLC | 9,322,202 | 22,779,369 |
| BP PLC | 6,832,504 | 33,302,419 |
| British American Tobacco PLC | 1,899,044 | 83,229,235 |
| BT Group PLC | 9,869,862 | 24,626,241 |
| Crest Nicholson Holdings PLC | 1,621,136 | 6,653,564 |
| DCC PLC | 554,988 | 43,551,835 |
| John Wood Group PLC(a) | 2,205,414 | 5,349,357 |
| Just Group PLC(a) | 26,022,357 | 29,216,138 |
| Liberty Global PLC, Class C(a) | 1,678,211 | 43,415,319 |
| Micro Focus International PLC | 1,553,102 | 8,072,147 |
| Royal Mail PLC | 1,956,653 | 10,283,299 |
| Shell PLC | 3,191,518 | 84,162,876 |
| TP Icap Group PLC | 14,668,570 | 23,593,786 |
| Vodafone Group PLC | 40,972,603 | 72,125,675 |
| WPP PLC | 1,975,430 | 27,784,202 |
| Total | 542,423,858 |
| United States 4.9% |
| Aerie Pharmaceuticals, Inc.(a) | 259,720 | 2,155,676 |
| Burford Capital Ltd. | 2,282,597 | 22,278,147 |
| Diversified Energy Co. PLC | 22,799,795 | 36,091,391 |
| Insmed, Inc.(a) | 202,524 | 4,840,324 |
| Jazz Pharmaceuticals PLC(a) | 246,080 | 33,816,314 |
| Livent Corp.(a) | 763,655 | 17,984,075 |
| Quotient Ltd.(a) | 910,623 | 1,274,872 |
| Sage Therapeutics, Inc.(a) | 61,654 | 2,242,356 |
| TE Connectivity Ltd. | 82,366 | 11,731,389 |
| Total | 132,414,544 |
Total Common Stocks
(Cost $2,622,592,111) | 2,655,907,891 |
|
| Exchange-Traded Equity Funds 2.2% |
| | Shares | Value ($) |
| United States 2.2% |
| iShares MSCI EAFE Value ETF | 1,201,586 | 60,019,221 |
Total Exchange-Traded Equity Funds
(Cost $62,439,403) | 60,019,221 |
|
The accompanying Notes to Financial Statements are an integral part of this statement.
| 8 | Columbia Overseas Value Fund | Annual Report 2022 |
Portfolio of Investments (continued)
February 28, 2022
| Rights 0.1% |
| Issuer | Shares | Value ($) |
| Sweden 0.1% |
| Stillfront Group AB(a) | 4,215,258 | 1,845,443 |
Total Rights
(Cost $—) | 1,845,443 |
|
| Money Market Funds 0.4% |
| | Shares | Value ($) |
| Columbia Short-Term Cash Fund, 0.168%(c),(d) | 11,104,200 | 11,100,869 |
Total Money Market Funds
(Cost $11,100,287) | 11,100,869 |
Total Investments in Securities
(Cost $2,696,131,801) | 2,728,873,424 |
| Other Assets & Liabilities, Net | | 5,874,104 |
| Net Assets | $2,734,747,528 |
At February 28, 2022, securities and/or cash totaling $53,695,817 were pledged as collateral.
Investments in derivatives
| Forward foreign currency exchange contracts |
Currency to
be sold | Currency to
be purchased | Counterparty | Settlement
date | Unrealized
appreciation ($) | Unrealized
depreciation ($) |
| 167,794,000 CAD | 132,403,791 USD | Goldman Sachs International | 04/07/2022 | 2,090 | — |
| 10,602,000 GBP | 14,339,951 USD | Goldman Sachs International | 04/07/2022 | 113,297 | — |
| 92,391,000 ILS | 28,700,793 USD | Goldman Sachs International | 04/07/2022 | — | (102,809) |
| 40,994,616,000 KRW | 34,206,165 USD | Goldman Sachs International | 04/07/2022 | 131,768 | — |
| 1,116,102,000 TWD | 40,125,903 USD | Goldman Sachs International | 04/07/2022 | 251,572 | — |
| 137,438,083 USD | 191,921,000 AUD | Goldman Sachs International | 04/07/2022 | 2,038,201 | — |
| 45,573,306 USD | 42,164,000 CHF | Goldman Sachs International | 04/07/2022 | 481,806 | — |
| 14,030,110 USD | 45,292,000 ILS | Goldman Sachs International | 04/07/2022 | 90,018 | — |
| 8,447,315 USD | 971,013,000 JPY | Goldman Sachs International | 04/07/2022 | 6,206 | — |
| 39,590,347 USD | 365,765,000 SEK | Goldman Sachs International | 04/07/2022 | — | (935,122) |
| Total | | | | 3,114,958 | (1,037,931) |
| Call option contracts written |
| Description | Counterparty | Trading
currency | Notional
amount | Number of
contracts | Exercise
price/Rate | Expiration
date | Premium
received ($) | Value ($) |
| Cameco Corp. | Morgan Stanley | USD | (17,759,050) | (7,225) | 28.00 | 3/18/2022 | (161,773) | (299,837) |
| Sibanye Stillwater Ltd. | Morgan Stanley | USD | (18,749,072) | (9,806) | 20.00 | 3/18/2022 | (53,647) | (661,905) |
| Teck Resources Ltd. | Morgan Stanley | USD | (17,187,695) | (4,781) | 43.00 | 3/18/2022 | (88,500) | (102,792) |
| Total | | | | | | | (303,920) | (1,064,534) |
Notes to Portfolio of Investments
| (a) | Non-income producing investment. |
| (b) | This security or a portion of this security has been pledged as collateral in connection with derivative contracts. |
| (c) | The rate shown is the seven-day current annualized yield at February 28, 2022. |
The accompanying Notes to Financial Statements are an integral part of this statement.
Columbia Overseas Value Fund | Annual Report 2022
| 9 |
Portfolio of Investments (continued)
February 28, 2022
Notes to Portfolio of Investments (continued)
| (d) | As defined in the Investment Company Act of 1940, as amended, an affiliated company is one in which the Fund owns 5% or more of the company’s outstanding voting securities, or a company which is under common ownership or control with the Fund. The value of the holdings and transactions in these affiliated companies during the year ended February 28, 2022 are as follows: |
| Affiliated issuers | Beginning
of period($) | Purchases($) | Sales($) | Net change in
unrealized
appreciation
(depreciation)($) | End of
period($) | Realized gain
(loss)($) | Dividends($) | End of
period shares |
| Columbia Short-Term Cash Fund, 0.168% |
| | 12,842,919 | 777,552,364 | (779,294,996) | 582 | 11,100,869 | (3,215) | 13,529 | 11,104,200 |
Abbreviation Legend
| ADR | American Depositary Receipt |
Currency Legend
| AUD | Australian Dollar |
| CAD | Canada Dollar |
| CHF | Swiss Franc |
| GBP | British Pound |
| ILS | Israeli Shekel |
| JPY | Japanese Yen |
| KRW | South Korean Won |
| SEK | Swedish Krona |
| TWD | New Taiwan Dollar |
| USD | US Dollar |
Fair value measurements
The Fund categorizes its fair value measurements according to a three-level hierarchy that maximizes the use of observable inputs and minimizes the use of unobservable inputs by prioritizing that the most observable input be used when available. Observable inputs are those that market participants would use in pricing an investment based on market data obtained from sources independent of the reporting entity. Unobservable inputs are those that reflect the Fund’s assumptions about the information market participants would use in pricing an investment. An investment’s level within the fair value hierarchy is based on the lowest level of any input that is deemed significant to the asset’s or liability’s fair value measurement. The input levels are not necessarily an indication of the risk or liquidity associated with investments at that level. For example, certain U.S. government securities are generally high quality and liquid, however, they are reflected as Level 2 because the inputs used to determine fair value may not always be quoted prices in an active market.
Fair value inputs are summarized in the three broad levels listed below:
| ■ | Level 1 — Valuations based on quoted prices for investments in active markets that the Fund has the ability to access at the measurement date. Valuation adjustments are not applied to Level 1 investments. |
| ■ | Level 2 — Valuations based on other significant observable inputs (including quoted prices for similar securities, interest rates, prepayment speeds, credit risks, etc.). |
| ■ | Level 3 — Valuations based on significant unobservable inputs (including the Fund’s own assumptions and judgment in determining the fair value of investments). |
Inputs that are used in determining fair value of an investment may include price information, credit data, volatility statistics, and other factors. These inputs can be either observable or unobservable. The availability of observable inputs can vary between investments, and is affected by various factors such as the type of investment, and the volume and level of activity for that investment or similar investments in the marketplace. The inputs will be considered by the Investment Manager, along with any other relevant factors in the calculation of an investment’s fair value. The Fund uses prices and inputs that are current as of the measurement date, which may include periods of market dislocations. During these periods, the availability of prices and inputs may be reduced for many investments. This condition could cause an investment to be reclassified between the various levels within the hierarchy.
Foreign equity securities actively traded in markets where there is a significant delay in the local close relative to the New York Stock Exchange are classified as Level 2. The values of these securities may include an adjustment to reflect the impact of market movements following the close of local trading, as described in Note 2 to the financial statements – Security valuation.
Investments falling into the Level 3 category are primarily supported by quoted prices from brokers and dealers participating in the market for those investments. However, these may be classified as Level 3 investments due to lack of market transparency and corroboration to support these quoted prices. Additionally, valuation models may be used as the pricing source for any remaining investments classified as Level 3. These models may rely on one or more significant unobservable inputs and/or significant assumptions by the Investment Manager. Inputs used in valuations may include, but are not limited to, financial statement analysis, capital account balances, discount rates and estimated cash flows, and comparable company data.
Under the direction of the Fund’s Board of Trustees (the Board), the Investment Manager’s Valuation Committee (the Committee) is responsible for overseeing the valuation procedures approved by the Board. The Committee consists of voting and non-voting members from various groups within the Investment Manager’s organization, including operations and accounting, trading and investments, compliance, risk management and legal.
The accompanying Notes to Financial Statements are an integral part of this statement.
| 10 | Columbia Overseas Value Fund | Annual Report 2022 |
Portfolio of Investments (continued)
February 28, 2022
Fair value measurements (continued)
The Committee meets at least monthly to review and approve valuation matters, which may include a description of specific valuation determinations, data regarding pricing information received from approved pricing vendors and brokers and the results of Board-approved valuation control policies and procedures (the Policies). The Policies address, among other things, instances when market quotations are or are not readily available, including recommendations of third party pricing vendors and a determination of appropriate pricing methodologies; events that require specific valuation determinations and assessment of fair value techniques; securities with a potential for stale pricing, including those that are illiquid, restricted, or in default; and the effectiveness of third party pricing vendors, including periodic reviews of vendors. The Committee meets more frequently, as needed, to discuss additional valuation matters, which may include the need to review back-testing results, review time-sensitive information or approve related valuation actions. The Committee reports to the Board, with members of the Committee meeting with the Board at each of its regularly scheduled meetings to discuss valuation matters and actions during the period, similar to those described earlier.
The following table is a summary of the inputs used to value the Fund’s investments at February 28, 2022:
| | Level 1 ($) | Level 2 ($) | Level 3 ($) | Total ($) |
| Investments in Securities | | | | |
| Common Stocks | | | | |
| Australia | — | 2,861,464 | — | 2,861,464 |
| Austria | — | 11,449,961 | — | 11,449,961 |
| Brazil | 14,374,443 | — | — | 14,374,443 |
| Canada | 207,978,285 | — | — | 207,978,285 |
| China | — | 13,941,403 | — | 13,941,403 |
| Finland | — | 49,930,239 | — | 49,930,239 |
| France | 449,191 | 341,555,877 | — | 342,005,068 |
| Germany | — | 177,934,109 | — | 177,934,109 |
| Greece | — | 16,915,990 | — | 16,915,990 |
| Hong Kong | — | 42,468,831 | — | 42,468,831 |
| Ireland | 1,031,727 | 39,552,606 | — | 40,584,333 |
| Israel | — | 24,646,930 | — | 24,646,930 |
| Japan | — | 507,452,154 | — | 507,452,154 |
| Netherlands | — | 165,659,140 | — | 165,659,140 |
| Norway | — | 33,807,128 | — | 33,807,128 |
| Pakistan | — | 2,742,740 | — | 2,742,740 |
| Russian Federation | — | 1,990,705 | — | 1,990,705 |
| Singapore | — | 60,234,578 | — | 60,234,578 |
| South Africa | 18,750,812 | — | — | 18,750,812 |
| South Korea | — | 39,253,738 | — | 39,253,738 |
| Spain | — | 91,381,117 | — | 91,381,117 |
| Sweden | — | 19,107,461 | — | 19,107,461 |
| Switzerland | — | 55,718,089 | — | 55,718,089 |
| Taiwan | — | 39,880,771 | — | 39,880,771 |
| United Kingdom | 67,693,715 | 474,730,143 | — | 542,423,858 |
| United States | 96,323,153 | 36,091,391 | — | 132,414,544 |
| Total Common Stocks | 406,601,326 | 2,249,306,565 | — | 2,655,907,891 |
| Exchange-Traded Equity Funds | 60,019,221 | — | — | 60,019,221 |
| Rights | | | | |
| Sweden | — | 1,845,443 | — | 1,845,443 |
| Total Rights | — | 1,845,443 | — | 1,845,443 |
| Money Market Funds | 11,100,869 | — | — | 11,100,869 |
| Total Investments in Securities | 477,721,416 | 2,251,152,008 | — | 2,728,873,424 |
| Investments in Derivatives | | | | |
| Asset | | | | |
| Forward Foreign Currency Exchange Contracts | — | 3,114,958 | — | 3,114,958 |
| Liability | | | | |
| Forward Foreign Currency Exchange Contracts | — | (1,037,931) | — | (1,037,931) |
| Options Contracts Written | (1,064,534) | — | — | (1,064,534) |
| Total | 476,656,882 | 2,253,229,035 | — | 2,729,885,917 |
See the Portfolio of Investments for all investment classifications not indicated in the table.
The accompanying Notes to Financial Statements are an integral part of this statement.
Columbia Overseas Value Fund | Annual Report 2022
| 11 |
Portfolio of Investments (continued)
February 28, 2022
Fair value measurements (continued)
The Fund’s assets assigned to the Level 2 input category are generally valued using the market approach, in which a security’s value is determined through reference to prices and information from market transactions for similar or identical assets. These assets include certain foreign securities for which a third party statistical pricing service may be employed for purposes of fair market valuation. The model utilized by such third party statistical pricing service takes into account a security’s correlation to available market data including, but not limited to, intraday index, ADR, and exchange-traded fund movements.
Forward foreign currency exchange contracts are valued at unrealized appreciation (depreciation).
The accompanying Notes to Financial Statements are an integral part of this statement.
| 12 | Columbia Overseas Value Fund | Annual Report 2022 |
Statement of Assets and Liabilities
February 28, 2022
| Assets | |
| Investments in securities, at value | |
| Unaffiliated issuers (cost $2,685,031,514) | $2,717,772,555 |
| Affiliated issuers (cost $11,100,287) | 11,100,869 |
| Cash | 1,417 |
| Unrealized appreciation on forward foreign currency exchange contracts | 3,114,958 |
| Receivable for: | |
| Investments sold | 4,034,361 |
| Capital shares sold | 4,151,562 |
| Dividends | 2,548,326 |
| Foreign tax reclaims | 4,083,583 |
| Expense reimbursement due from Investment Manager | 13,641 |
| Prepaid expenses | 16,703 |
| Total assets | 2,746,837,975 |
| Liabilities | |
| Option contracts written, at value (premiums received $303,920) | 1,064,534 |
| Unrealized depreciation on forward foreign currency exchange contracts | 1,037,931 |
| Payable for: | |
| Investments purchased | 6,332,370 |
| Capital shares purchased | 2,822,830 |
| Management services fees | 177,207 |
| Distribution and/or service fees | 9,375 |
| Transfer agent fees | 183,242 |
| Compensation of board members | 259,829 |
| Compensation of chief compliance officer | 420 |
| Other expenses | 202,709 |
| Total liabilities | 12,090,447 |
| Net assets applicable to outstanding capital stock | $2,734,747,528 |
| Represented by | |
| Paid in capital | 2,982,766,228 |
| Total distributable earnings (loss) | (248,018,700) |
| Total - representing net assets applicable to outstanding capital stock | $2,734,747,528 |
The accompanying Notes to Financial Statements are an integral part of this statement.
Columbia Overseas Value Fund | Annual Report 2022
| 13 |
Statement of Assets and Liabilities (continued)
February 28, 2022
| Class A | |
| Net assets | $338,513,347 |
| Shares outstanding | 33,489,605 |
| Net asset value per share | $10.11 |
| Maximum sales charge | 5.75% |
| Maximum offering price per share (calculated by dividing the net asset value per share by 1.0 minus the maximum sales charge for Class A shares) | $10.73 |
| Advisor Class | |
| Net assets | $404,890,833 |
| Shares outstanding | 40,156,734 |
| Net asset value per share | $10.08 |
| Class C | |
| Net assets | $19,242,862 |
| Shares outstanding | 1,917,905 |
| Net asset value per share | $10.03 |
| Institutional Class | |
| Net assets | $518,966,092 |
| Shares outstanding | 51,240,646 |
| Net asset value per share | $10.13 |
| Institutional 2 Class | |
| Net assets | $716,539,371 |
| Shares outstanding | 71,180,163 |
| Net asset value per share | $10.07 |
| Institutional 3 Class | |
| Net assets | $721,028,423 |
| Shares outstanding | 71,530,791 |
| Net asset value per share | $10.08 |
| Class R | |
| Net assets | $15,566,600 |
| Shares outstanding | 1,581,243 |
| Net asset value per share | $9.84 |
The accompanying Notes to Financial Statements are an integral part of this statement.
| 14 | Columbia Overseas Value Fund | Annual Report 2022 |
Statement of Operations
Year Ended February 28, 2022
| Net investment income | |
| Income: | |
| Dividends — unaffiliated issuers | $95,595,757 |
| Dividends — affiliated issuers | 13,529 |
| Foreign taxes withheld | (9,263,983) |
| Total income | 86,345,303 |
| Expenses: | |
| Management services fees | 20,379,104 |
| Distribution and/or service fees | |
| Class A | 857,120 |
| Class C | 209,200 |
| Class R | 70,322 |
| Transfer agent fees | |
| Class A | 486,976 |
| Advisor Class | 489,007 |
| Class C | 29,766 |
| Institutional Class | 708,180 |
| Institutional 2 Class | 398,006 |
| Institutional 3 Class | 45,590 |
| Class R | 19,925 |
| Compensation of board members | 79,877 |
| Custodian fees | 377,026 |
| Printing and postage fees | 264,572 |
| Registration fees | 147,165 |
| Audit fees | 93,243 |
| Legal fees | 37,481 |
| Interest on collateral | 271 |
| Compensation of chief compliance officer | 406 |
| Other | 152,268 |
| Total expenses | 24,845,505 |
| Fees waived or expenses reimbursed by Investment Manager and its affiliates | (1,611,875) |
| Expense reduction | (280) |
| Total net expenses | 23,233,350 |
| Net investment income | 63,111,953 |
| Realized and unrealized gain (loss) — net | |
| Net realized gain (loss) on: | |
| Investments — unaffiliated issuers | 80,489,676 |
| Investments — affiliated issuers | (3,215) |
| Foreign currency translations | (451,162) |
| Forward foreign currency exchange contracts | (8,509,988) |
| Options purchased | (2,630,105) |
| Options contracts written | 1,933,761 |
| Net realized gain | 70,828,967 |
| Net change in unrealized appreciation (depreciation) on: | |
| Investments — unaffiliated issuers | (45,486,909) |
| Investments — affiliated issuers | 582 |
| Foreign currency translations | (232,969) |
| Forward foreign currency exchange contracts | 1,523,925 |
| Options contracts written | (872,158) |
| Net change in unrealized appreciation (depreciation) | (45,067,529) |
| Net realized and unrealized gain | 25,761,438 |
| Net increase in net assets resulting from operations | $88,873,391 |
The accompanying Notes to Financial Statements are an integral part of this statement.
Columbia Overseas Value Fund | Annual Report 2022
| 15 |
Statement of Changes in Net Assets
| | Year Ended
February 28, 2022 | Year Ended
February 28, 2021 |
| Operations | | |
| Net investment income | $63,111,953 | $29,247,431 |
| Net realized gain (loss) | 70,828,967 | (38,581,286) |
| Net change in unrealized appreciation (depreciation) | (45,067,529) | 273,234,581 |
| Net increase in net assets resulting from operations | 88,873,391 | 263,900,726 |
| Distributions to shareholders | | |
| Net investment income and net realized gains | | |
| Class A | (11,067,794) | (4,679,448) |
| Advisor Class | (11,757,755) | (4,113,864) |
| Class C | (504,315) | (221,278) |
| Institutional Class | (17,975,864) | (6,665,431) |
| Institutional 2 Class | (26,006,694) | (8,976,802) |
| Institutional 3 Class | (27,502,053) | (4,989,626) |
| Class R | (484,871) | (105,374) |
| Total distributions to shareholders | (95,299,346) | (29,751,823) |
| Increase in net assets from capital stock activity | 740,751,097 | 14,195,808 |
| Total increase in net assets | 734,325,142 | 248,344,711 |
| Net assets at beginning of year | 2,000,422,386 | 1,752,077,675 |
| Net assets at end of year | $2,734,747,528 | $2,000,422,386 |
The accompanying Notes to Financial Statements are an integral part of this statement.
| 16 | Columbia Overseas Value Fund | Annual Report 2022 |
Statement of Changes in Net Assets (continued)
| | Year Ended | Year Ended |
| | February 28, 2022 | February 28, 2021 |
| | Shares | Dollars ($) | Shares | Dollars ($) |
| Capital stock activity |
| Class A | | | | |
| Subscriptions | 6,233,691 | 66,476,786 | 5,649,789 | 46,683,648 |
| Fund reorganization | 4,285 | 44,736 | — | — |
| Distributions reinvested | 1,059,055 | 10,705,814 | 500,549 | 4,511,486 |
| Redemptions | (5,913,875) | (62,548,415) | (10,174,739) | (84,461,850) |
| Net increase (decrease) | 1,383,156 | 14,678,921 | (4,024,401) | (33,266,716) |
| Advisor Class | | | | |
| Subscriptions | 17,797,576 | 190,309,034 | 19,057,164 | 156,298,198 |
| Fund reorganization | 4,039,099 | 42,049,576 | — | — |
| Distributions reinvested | 1,162,793 | 11,726,703 | 451,710 | 4,100,981 |
| Redemptions | (11,769,913) | (123,972,382) | (15,215,267) | (122,206,468) |
| Net increase | 11,229,555 | 120,112,931 | 4,293,607 | 38,192,711 |
| Class C | | | | |
| Subscriptions | 188,106 | 1,978,112 | 430,551 | 3,615,079 |
| Distributions reinvested | 50,165 | 503,448 | 25,186 | 215,435 |
| Redemptions | (583,560) | (6,147,866) | (1,557,708) | (12,960,986) |
| Net decrease | (345,289) | (3,666,306) | (1,101,971) | (9,130,472) |
| Institutional Class | | | | |
| Subscriptions | 21,464,914 | 228,595,718 | 19,275,980 | 159,111,887 |
| Distributions reinvested | 1,714,711 | 17,352,111 | 700,908 | 6,375,932 |
| Redemptions | (12,203,529) | (128,865,133) | (31,446,557) | (243,935,033) |
| Net increase (decrease) | 10,976,096 | 117,082,696 | (11,469,669) | (78,447,214) |
| Institutional 2 Class | | | | |
| Subscriptions | 44,433,415 | 467,540,027 | 19,386,268 | 162,369,386 |
| Distributions reinvested | 2,583,941 | 25,998,838 | 984,166 | 8,975,679 |
| Redemptions | (30,847,596) | (326,703,923) | (23,270,768) | (178,520,751) |
| Net increase (decrease) | 16,169,760 | 166,834,942 | (2,900,334) | (7,175,686) |
| Institutional 3 Class | | | | |
| Subscriptions | 49,017,595 | 518,942,169 | 32,159,038 | 286,411,490 |
| Distributions reinvested | 1,924,294 | 19,356,884 | 549,666 | 4,980,697 |
| Redemptions | (20,635,911) | (219,964,259) | (22,044,289) | (187,438,300) |
| Net increase | 30,305,978 | 318,334,794 | 10,664,415 | 103,953,887 |
| Class R | | | | |
| Subscriptions | 1,098,288 | 11,569,685 | 427,100 | 3,325,459 |
| Distributions reinvested | 49,177 | 483,756 | 11,815 | 103,286 |
| Redemptions | (452,156) | (4,680,322) | (417,258) | (3,359,447) |
| Net increase | 695,309 | 7,373,119 | 21,657 | 69,298 |
| Total net increase (decrease) | 70,414,565 | 740,751,097 | (4,516,696) | 14,195,808 |
The accompanying Notes to Financial Statements are an integral part of this statement.
Columbia Overseas Value Fund | Annual Report 2022
| 17 |
The following table is intended to help you understand the Fund’s financial performance. Certain information reflects financial results for a single share of a class held for the periods shown. Per share net investment income (loss) amounts are calculated based on average shares outstanding during the period. Total return assumes reinvestment of all dividends and distributions, if any. Total return does not reflect payment of sales charges, if any. Total return and portfolio turnover are not annualized for periods of less than one year. The portfolio turnover rate is calculated without regard to purchase and sales transactions of short-term instruments and certain derivatives, if any. If such transactions were included, the Fund’s portfolio turnover rate may be higher.
| | Net asset value,
beginning of
period | Net
investment
income | Net
realized
and
unrealized
gain (loss) | Total from
investment
operations | Distributions
from net
investment
income | Distributions
from net
realized
gains | Total
distributions to
shareholders |
| Class A |
| Year Ended 2/28/2022 | $9.99 | 0.23 | 0.23 | 0.46 | (0.27) | (0.07) | (0.34) |
| Year Ended 2/28/2021 | $8.55 | 0.14 | 1.44 | 1.58 | (0.10) | (0.04) | (0.14) |
| Year Ended 2/29/2020 | $9.24 | 0.22 | (0.56) | (0.34) | (0.33) | (0.02) | (0.35) |
| Year Ended 2/28/2019 | $10.37 | 0.27 | (1.10) | (0.83) | (0.13) | (0.17) | (0.30) |
| Year Ended 2/28/2018 | $8.52 | 0.14 | 2.04 | 2.18 | (0.15) | (0.18) | (0.33) |
| Advisor Class |
| Year Ended 2/28/2022 | $9.96 | 0.25 | 0.24 | 0.49 | (0.30) | (0.07) | (0.37) |
| Year Ended 2/28/2021 | $8.53 | 0.16 | 1.43 | 1.59 | (0.12) | (0.04) | (0.16) |
| Year Ended 2/29/2020 | $9.21 | 0.22 | (0.52) | (0.30) | (0.36) | (0.02) | (0.38) |
| Year Ended 2/28/2019 | $10.35 | 0.28 | (1.10) | (0.82) | (0.15) | (0.17) | (0.32) |
| Year Ended 2/28/2018 | $8.49 | 0.15 | 2.06 | 2.21 | (0.17) | (0.18) | (0.35) |
| Class C |
| Year Ended 2/28/2022 | $9.91 | 0.16 | 0.22 | 0.38 | (0.19) | (0.07) | (0.26) |
| Year Ended 2/28/2021 | $8.50 | 0.08 | 1.41 | 1.49 | (0.04) | (0.04) | (0.08) |
| Year Ended 2/29/2020 | $9.20 | 0.16 | (0.57) | (0.41) | (0.27) | (0.02) | (0.29) |
| Year Ended 2/28/2019 | $10.31 | 0.20 | (1.09) | (0.89) | (0.05) | (0.17) | (0.22) |
| Year Ended 2/28/2018 | $8.48 | 0.06 | 2.04 | 2.10 | (0.09) | (0.18) | (0.27) |
| Institutional Class |
| Year Ended 2/28/2022 | $10.01 | 0.26 | 0.23 | 0.49 | (0.30) | (0.07) | (0.37) |
| Year Ended 2/28/2021 | $8.57 | 0.16 | 1.44 | 1.60 | (0.12) | (0.04) | (0.16) |
| Year Ended 2/29/2020 | $9.25 | 0.24 | (0.54) | (0.30) | (0.36) | (0.02) | (0.38) |
| Year Ended 2/28/2019 | $10.38 | 0.29 | (1.10) | (0.81) | (0.15) | (0.17) | (0.32) |
| Year Ended 2/28/2018 | $8.53 | 0.15 | 2.05 | 2.20 | (0.17) | (0.18) | (0.35) |
| Institutional 2 Class |
| Year Ended 2/28/2022 | $9.95 | 0.27 | 0.23 | 0.50 | (0.31) | (0.07) | (0.38) |
| Year Ended 2/28/2021 | $8.52 | 0.16 | 1.44 | 1.60 | (0.13) | (0.04) | (0.17) |
| Year Ended 2/29/2020 | $9.20 | 0.25 | (0.54) | (0.29) | (0.37) | (0.02) | (0.39) |
| Year Ended 2/28/2019 | $10.33 | 0.30 | (1.10) | (0.80) | (0.16) | (0.17) | (0.33) |
| Year Ended 2/28/2018 | $8.48 | 0.18 | 2.03 | 2.21 | (0.18) | (0.18) | (0.36) |
The accompanying Notes to Financial Statements are an integral part of this statement.
| 18 | Columbia Overseas Value Fund | Annual Report 2022 |
Financial Highlights (continued)
| | Net
asset
value,
end of
period | Total
return | Total gross
expense
ratio to
average
net assets(a) | Total net
expense
ratio to
average
net assets(a),(b) | Net investment
income
ratio to
average
net assets | Portfolio
turnover | Net
assets,
end of
period
(000’s) |
| Class A |
| Year Ended 2/28/2022 | $10.11 | 4.65% | 1.21%(c) | 1.15%(c),(d) | 2.20% | 43% | $338,513 |
| Year Ended 2/28/2021 | $9.99 | 18.68% | 1.28%(c),(e) | 1.18%(c),(d),(e) | 1.65% | 54% | $320,615 |
| Year Ended 2/29/2020 | $8.55 | (4.10%) | 1.24%(c) | 1.22%(c),(d) | 2.35% | 35% | $309,065 |
| Year Ended 2/28/2019 | $9.24 | (7.96%) | 1.29%(c),(e) | 1.25%(c),(d),(e) | 2.80% | 58% | $341,198 |
| Year Ended 2/28/2018 | $10.37 | 25.72% | 1.36%(f) | 1.36%(d),(f) | 1.41% | 47% | $363,817 |
| Advisor Class |
| Year Ended 2/28/2022 | $10.08 | 4.93% | 0.96%(c) | 0.90%(c),(d) | 2.37% | 43% | $404,891 |
| Year Ended 2/28/2021 | $9.96 | 18.86% | 1.03%(c),(e) | 0.93%(c),(d),(e) | 1.85% | 54% | $288,182 |
| Year Ended 2/29/2020 | $8.53 | (3.78%) | 0.99%(c) | 0.97%(c),(d) | 2.41% | 35% | $210,152 |
| Year Ended 2/28/2019 | $9.21 | (7.80%) | 1.04%(c),(e) | 0.99%(c),(d),(e) | 2.96% | 58% | $161,150 |
| Year Ended 2/28/2018 | $10.35 | 26.18% | 1.11%(f) | 1.10%(d),(f) | 1.47% | 47% | $78,634 |
| Class C |
| Year Ended 2/28/2022 | $10.03 | 3.88% | 1.96%(c) | 1.90%(c),(d) | 1.50% | 43% | $19,243 |
| Year Ended 2/28/2021 | $9.91 | 17.66% | 2.03%(c),(e) | 1.93%(c),(d),(e) | 0.98% | 54% | $22,436 |
| Year Ended 2/29/2020 | $8.50 | (4.81%) | 1.99%(c) | 1.97%(c),(d) | 1.73% | 35% | $28,608 |
| Year Ended 2/28/2019 | $9.20 | (8.60%) | 2.04%(c),(e) | 2.00%(c),(d),(e) | 2.09% | 58% | $42,165 |
| Year Ended 2/28/2018 | $10.31 | 24.87% | 2.11%(f) | 2.10%(d),(f) | 0.61% | 47% | $44,594 |
| Institutional Class |
| Year Ended 2/28/2022 | $10.13 | 4.91% | 0.96%(c) | 0.90%(c),(d) | 2.40% | 43% | $518,966 |
| Year Ended 2/28/2021 | $10.01 | 18.89% | 1.03%(c),(e) | 0.93%(c),(d),(e) | 1.93% | 54% | $402,868 |
| Year Ended 2/29/2020 | $8.57 | (3.76%) | 0.99%(c) | 0.97%(c),(d) | 2.54% | 35% | $443,217 |
| Year Ended 2/28/2019 | $9.25 | (7.69%) | 1.04%(c),(e) | 1.00%(c),(d),(e) | 3.05% | 58% | $432,061 |
| Year Ended 2/28/2018 | $10.38 | 25.94% | 1.11%(f) | 1.10%(d),(f) | 1.46% | 47% | $309,845 |
| Institutional 2 Class |
| Year Ended 2/28/2022 | $10.07 | 5.02% | 0.88%(c) | 0.82%(c) | 2.52% | 43% | $716,539 |
| Year Ended 2/28/2021 | $9.95 | 18.99% | 0.93%(c),(e) | 0.84%(c),(e) | 1.92% | 54% | $547,159 |
| Year Ended 2/29/2020 | $8.52 | (3.68%) | 0.90%(c) | 0.86%(c) | 2.70% | 35% | $493,226 |
| Year Ended 2/28/2019 | $9.20 | (7.61%) | 0.96%(c),(e) | 0.88%(c),(e) | 3.39% | 58% | $533,584 |
| Year Ended 2/28/2018 | $10.33 | 26.23% | 0.99%(f) | 0.98%(f) | 1.82% | 47% | $68,822 |
The accompanying Notes to Financial Statements are an integral part of this statement.
Columbia Overseas Value Fund | Annual Report 2022
| 19 |
Financial Highlights (continued)
| | Net asset value,
beginning of
period | Net
investment
income | Net
realized
and
unrealized
gain (loss) | Total from
investment
operations | Distributions
from net
investment
income | Distributions
from net
realized
gains | Total
distributions to
shareholders |
| Institutional 3 Class |
| Year Ended 2/28/2022 | $9.96 | 0.26 | 0.24 | 0.50 | (0.31) | (0.07) | (0.38) |
| Year Ended 2/28/2021 | $8.53 | 0.16 | 1.44 | 1.60 | (0.13) | (0.04) | (0.17) |
| Year Ended 2/29/2020 | $9.21 | 0.25 | (0.54) | (0.29) | (0.37) | (0.02) | (0.39) |
| Year Ended 2/28/2019 | $10.35 | 0.30 | (1.10) | (0.80) | (0.17) | (0.17) | (0.34) |
| Year Ended 2/28/2018 | $8.49 | 0.21 | 2.02 | 2.23 | (0.19) | (0.18) | (0.37) |
| Class R |
| Year Ended 2/28/2022 | $9.73 | 0.19 | 0.24 | 0.43 | (0.25) | (0.07) | (0.32) |
| Year Ended 2/28/2021 | $8.34 | 0.11 | 1.40 | 1.51 | (0.08) | (0.04) | (0.12) |
| Year Ended 2/29/2020 | $9.02 | 0.18 | (0.53) | (0.35) | (0.31) | (0.02) | (0.33) |
| Year Ended 2/28/2019 | $10.13 | 0.23 | (1.07) | (0.84) | (0.10) | (0.17) | (0.27) |
| Year Ended 2/28/2018 | $8.33 | 0.08 | 2.03 | 2.11 | (0.13) | (0.18) | (0.31) |
| Notes to Financial Highlights |
| (a) | In addition to the fees and expenses that the Fund bears directly, the Fund indirectly bears a pro rata share of the fees and expenses of any other funds in which it invests. Such indirect expenses are not included in the Fund’s reported expense ratios. |
| (b) | Total net expenses include the impact of certain fee waivers/expense reimbursements made by the Investment Manager and certain of its affiliates, if applicable. |
| (c) | Ratios include interest on collateral expense which is less than 0.01%. |
| (d) | The benefits derived from expense reductions had an impact of less than 0.01%. |
| (e) | Ratios include interfund lending expense which is less than 0.01%. |
| (f) | Ratios include line of credit interest expense which is less than 0.01%. |
The accompanying Notes to Financial Statements are an integral part of this statement.
| 20 | Columbia Overseas Value Fund | Annual Report 2022 |
Financial Highlights (continued)
| | Net
asset
value,
end of
period | Total
return | Total gross
expense
ratio to
average
net assets(a) | Total net
expense
ratio to
average
net assets(a),(b) | Net investment
income
ratio to
average
net assets | Portfolio
turnover | Net
assets,
end of
period
(000’s) |
| Institutional 3 Class |
| Year Ended 2/28/2022 | $10.08 | 5.07% | 0.83%(c) | 0.77%(c) | 2.46% | 43% | $721,028 |
| Year Ended 2/28/2021 | $9.96 | 19.00% | 0.88%(c),(e) | 0.79%(c),(e) | 1.93% | 54% | $410,541 |
| Year Ended 2/29/2020 | $8.53 | (3.65%) | 0.85%(c) | 0.83%(c) | 2.67% | 35% | $260,599 |
| Year Ended 2/28/2019 | $9.21 | (7.64%) | 0.89%(c),(e) | 0.85%(c),(e) | 3.11% | 58% | $248,248 |
| Year Ended 2/28/2018 | $10.35 | 26.37% | 0.94%(f) | 0.93%(f) | 2.08% | 47% | $340,651 |
| Class R |
| Year Ended 2/28/2022 | $9.84 | 4.40% | 1.47%(c) | 1.40%(c),(d) | 1.84% | 43% | $15,567 |
| Year Ended 2/28/2021 | $9.73 | 18.29% | 1.53%(c),(e) | 1.43%(c),(d),(e) | 1.36% | 54% | $8,621 |
| Year Ended 2/29/2020 | $8.34 | (4.30%) | 1.49%(c) | 1.47%(c),(d) | 2.00% | 35% | $7,209 |
| Year Ended 2/28/2019 | $9.02 | (8.20%) | 1.55%(c),(e) | 1.49%(c),(d),(e) | 2.47% | 58% | $5,864 |
| Year Ended 2/28/2018 | $10.13 | 25.46% | 1.61%(f) | 1.59%(d),(f) | 0.80% | 47% | $3,099 |
The accompanying Notes to Financial Statements are an integral part of this statement.
Columbia Overseas Value Fund | Annual Report 2022
| 21 |
Notes to Financial Statements
February 28, 2022
Note 1. Organization
Columbia Overseas Value Fund (the Fund), a series of Columbia Funds Series Trust (the Trust), is a diversified fund. The Trust is registered under the Investment Company Act of 1940, as amended (the 1940 Act), as an open-end management investment company organized as a Delaware statutory trust.
Fund shares
The Trust may issue an unlimited number of shares (without par value). The Fund offers each of the share classes listed in the Statement of Assets and Liabilities. Although all share classes generally have identical voting, dividend and liquidation rights, each share class votes separately when required by the Trust’s organizational documents or by law. Each share class has its own expense and sales charge structure. Different share classes may have different minimum initial investment amounts and pay different net investment income distribution amounts to the extent the expenses of distributing such share classes vary. Distributions to shareholders in a liquidation will be proportional to the net asset value of each share class.
As described in the Fund’s prospectus, Class A and Class C shares are offered to the general public for investment. Effective April 1, 2021, Class C shares automatically convert to Class A shares after 8 years. Prior to April 1, 2021, Class C shares automatically converted to Class A shares after 10 years. Advisor Class, Institutional Class, Institutional 2 Class, Institutional 3 Class and Class R shares are available for purchase through authorized investment professionals to omnibus retirement plans or to institutional investors and to certain other investors as also described in the Fund’s prospectus.
Note 2. Summary of significant accounting policies
Basis of preparation
The Fund is an investment company that applies the accounting and reporting guidance in the Financial Accounting Standards Board (FASB) Accounting Standards Codification Topic 946, Financial Services - Investment Companies (ASC 946). The financial statements are prepared in accordance with U.S. generally accepted accounting principles (GAAP), which requires management to make certain estimates and assumptions that affect the reported amounts of assets and liabilities, the disclosure of contingent assets and liabilities at the date of the financial statements and the reported amounts of income and expenses during the reporting period. Actual results could differ from those estimates.
The following is a summary of significant accounting policies followed by the Fund in the preparation of its financial statements.
Security valuation
Equity securities listed on an exchange are valued at the closing price or last trade price on their primary exchange at the close of business of the New York Stock Exchange. Securities with a closing price not readily available or not listed on any exchange are valued at the mean between the closing bid and ask prices. Listed preferred stocks convertible into common stocks are valued using an evaluated price from a pricing service.
Foreign equity securities are valued based on the closing price or last trade price on their primary exchange at the close of business of the New York Stock Exchange. If any foreign equity security closing prices are not readily available, the securities are valued at the mean of the latest quoted bid and ask prices on such exchanges or markets. Foreign currency exchange rates are determined at the scheduled closing time of the New York Stock Exchange. Many securities markets and exchanges outside the U.S. close prior to the close of the New York Stock Exchange; therefore, the closing prices for securities in such markets or on such exchanges may not fully reflect events that occur after such close but before the close of the New York Stock Exchange. In those situations, foreign securities will be fair valued pursuant to a policy adopted by the Board of Trustees. Under the policy, the Fund may utilize a third-party pricing service to determine these fair values. The third-party pricing service takes into account multiple factors, including, but not limited to, movements in the U.S. securities markets, certain depositary receipts, futures contracts and foreign exchange rates that have occurred subsequent to the close of the foreign exchange or market, to determine a good faith estimate that reasonably reflects the current market conditions as of the close of the New York Stock Exchange. The fair value of a security is likely to be different from the quoted or published price, if available.
| 22 | Columbia Overseas Value Fund | Annual Report 2022 |
Notes to Financial Statements (continued)
February 28, 2022
Investments in open-end investment companies (other than exchange-traded funds (ETFs)), are valued at the latest net asset value reported by those companies as of the valuation time.
Forward foreign currency exchange contracts are marked-to-market based upon foreign currency exchange rates provided by a pricing service.
Option contracts are valued at the mean of the latest quoted bid and ask prices on their primary exchanges. Option contracts, including over-the-counter option contracts, with no readily available market quotations are valued using mid-market evaluations from independent third-party vendors.
Investments for which market quotations are not readily available, or that have quotations which management believes are not reflective of market value or reliable, are valued at fair value as determined in good faith under procedures approved by and under the general supervision of the Board of Trustees. If a security or class of securities (such as foreign securities) is valued at fair value, such value is likely to be different from the quoted or published price for the security, if available.
The determination of fair value often requires significant judgment. To determine fair value, management may use assumptions including but not limited to future cash flows and estimated risk premiums. Multiple inputs from various sources may be used to determine fair value.
GAAP requires disclosure regarding the inputs and valuation techniques used to measure fair value and any changes in valuation inputs or techniques. In addition, investments shall be disclosed by major category. This information is disclosed following the Fund’s Portfolio of Investments.
Foreign currency transactions and translations
The values of all assets and liabilities denominated in foreign currencies are generally translated into U.S. dollars at exchange rates determined at the close of regular trading on the New York Stock Exchange. Net realized and unrealized gains (losses) on foreign currency transactions and translations include gains (losses) arising from the fluctuation in exchange rates between trade and settlement dates on securities transactions, gains (losses) arising from the disposition of foreign currency and currency gains (losses) between the accrual and payment dates on dividends, interest income and foreign withholding taxes.
For financial statement purposes, the Fund does not distinguish that portion of gains (losses) on investments which is due to changes in foreign exchange rates from that which is due to changes in market prices of the investments. Such fluctuations are included with the net realized and unrealized gains (losses) on investments in the Statement of Operations.
Derivative instruments
The Fund invests in certain derivative instruments, as detailed below, in seeking to meet its investment objectives. Derivatives are instruments whose values depend on, or are derived from, in whole or in part, the value of one or more securities, currencies, commodities, indices, or other assets or instruments. Derivatives may be used to increase investment flexibility (including to maintain cash reserves while maintaining desired exposure to certain assets), for risk management (hedging) purposes, to facilitate trading, to reduce transaction costs and to pursue higher investment returns. The Fund may also use derivative instruments to mitigate certain investment risks, such as foreign currency exchange rate risk, interest rate risk and credit risk. Derivatives may involve various risks, including the potential inability of the counterparty to fulfill its obligations under the terms of the contract, the potential for an illiquid secondary market (making it difficult for the Fund to sell or terminate, including at favorable prices) and the potential for market movements which may expose the Fund to gains or losses in excess of the amount shown in the Statement of Assets and Liabilities. The notional amounts of derivative instruments, if applicable, are not recorded in the financial statements.
A derivative instrument may suffer a marked-to-market loss if the value of the contract decreases due to an unfavorable change in the market rates or values of the underlying instrument. Losses can also occur if the counterparty does not perform its obligations under the contract. The Fund’s risk of loss from counterparty credit risk on over-the-counter derivatives is generally limited to the aggregate unrealized gain netted against any collateral held by the Fund and the amount of any variation margin held by the counterparty, plus any replacement costs or related amounts. With exchange-traded or centrally cleared derivatives, there is reduced counterparty credit risk to the Fund since the clearinghouse or central counterparty
Columbia Overseas Value Fund | Annual Report 2022
| 23 |
Notes to Financial Statements (continued)
February 28, 2022
(CCP) provides some protection in the case of clearing member default. The clearinghouse or CCP stands between the buyer and the seller of the contract; therefore, failure of the clearinghouse or CCP may pose additional counterparty credit risk. However, credit risk still exists in exchange-traded or centrally cleared derivatives with respect to initial and variation margin that is held in a broker’s customer account. While clearing brokers are required to segregate customer margin from their own assets, in the event that a clearing broker becomes insolvent or goes into bankruptcy and at that time there is a shortfall in the aggregate amount of margin held by the clearing broker for all its clients and such shortfall is remedied by the CCP or otherwise, U.S. bankruptcy laws will typically allocate that shortfall on a pro-rata basis across all the clearing broker’s customers (including the Fund), potentially resulting in losses to the Fund.
In order to better define its contractual rights and to secure rights that will help the Fund mitigate its counterparty risk, the Fund may enter into an International Swaps and Derivatives Association, Inc. Master Agreement (ISDA Master Agreement) or similar agreement with its derivatives counterparties. An ISDA Master Agreement is an agreement between the Fund and a counterparty that governs over-the-counter derivatives and foreign exchange forward contracts and contains, among other things, collateral posting terms and netting provisions in the event of a default and/or termination event. Under an ISDA Master Agreement, the Fund may, under certain circumstances, offset with the counterparty certain derivative instruments’ payables and/or receivables with collateral held and/or posted and create one single net payment. The provisions of the ISDA Master Agreement typically permit a single net payment in the event of default (close-out netting), including the bankruptcy or insolvency of the counterparty. Note, however, that bankruptcy or insolvency laws of a particular jurisdiction may impose restrictions on or prohibitions against the right of offset or netting in bankruptcy, insolvency or other events.
Collateral (margin) requirements differ by type of derivative. Margin requirements are established by the clearinghouse or CCP for exchange-traded and centrally cleared derivatives. Brokers can ask for margin in excess of the minimum in certain circumstances. Collateral terms for most over-the-counter derivatives are subject to regulatory requirements to exchange variation margin with trading counterparties and may have contract specific margin terms as well. For over-the-counter derivatives traded under an ISDA Master Agreement, the collateral requirements are typically calculated by netting the marked-to-market amount for each transaction under such agreement and comparing that amount to the value of any variation margin currently pledged by the Fund and/or the counterparty. Generally, the amount of collateral due from or to a party has to exceed a minimum transfer amount threshold (e.g., $250,000) before a transfer has to be made. To the extent amounts due to the Fund from its counterparties are not fully collateralized, contractually or otherwise, the Fund bears the risk of loss from counterparty nonperformance. The Fund may also pay interest expense on cash collateral received from the broker. Any interest expense paid by the Fund is shown on the Statement of Operations. The Fund attempts to mitigate counterparty risk by only entering into agreements with counterparties that it believes have the financial resources to honor their obligations and by monitoring the financial stability of those counterparties.
Certain ISDA Master Agreements allow counterparties of over-the-counter derivatives transactions to terminate derivatives contracts prior to maturity in the event the Fund’s net asset value declines by a stated percentage over a specified time period or if the Fund fails to meet certain terms of the ISDA Master Agreement, which would cause the Fund to accelerate payment of any net liability owed to the counterparty. The Fund also has termination rights if the counterparty fails to meet certain terms of the ISDA Master Agreement. In determining whether to exercise such termination rights, the Fund would consider, in addition to counterparty credit risk, whether termination would result in a net liability owed from the counterparty.
For financial reporting purposes, the Fund does not offset derivative assets and derivative liabilities that are subject to netting arrangements in the Statement of Assets and Liabilities.
Forward foreign currency exchange contracts
Forward foreign currency exchange contracts are over-the-counter agreements between two parties to buy and sell a currency at a set price on a future date. The Fund utilized forward foreign currency exchange contracts to hedge the currency exposure associated with some or all of the Fund’s securities, to shift investment exposure from one currency to another and to shift U.S. dollar exposure to achieve a representative weighted mix of major currencies in its benchmark. These instruments may be used for other purposes in future periods.
| 24 | Columbia Overseas Value Fund | Annual Report 2022 |
Notes to Financial Statements (continued)
February 28, 2022
The values of forward foreign currency exchange contracts fluctuate daily with changes in foreign currency exchange rates. Changes in the value of these contracts are recorded as unrealized appreciation or depreciation until the contract is exercised or has expired. The Fund will realize a gain or loss when the forward foreign currency exchange contract is closed or expires. Non-deliverable forward foreign currency exchange contracts are settled with the counterparty in U.S. dollars without delivery of foreign currency.
The use of forward foreign currency exchange contracts does not eliminate fluctuations in the prices of the Fund’s portfolio securities. The risks of forward foreign currency exchange contracts include movement in the values of the foreign currencies relative to the U.S. dollar (or other foreign currencies) and the possibility that counterparties will not complete their contractual obligations, which may be in excess of the amount reflected, if any, in the Statement of Assets and Liabilities.
Options contracts
Options are contracts which entitle the holder to purchase or sell securities or other identified assets at a specified price, or in the case of index option contracts, to receive or pay the difference between the index value and the strike price of the index option contract. Option contracts can be either exchange-traded or over-the-counter. The Fund purchased and has written option contracts to decrease the Fund’s exposure to equity market risk and to facilitate buying and selling of securities for investments. These instruments may be used for other purposes in future periods. Completion of transactions for option contracts traded in the over-the-counter market depends upon the performance of the other party. Collateral may be collected or posted by the Fund to secure over-the-counter option contract trades. Collateral held or posted by the Fund for such option contract trades must be returned to the broker or the Fund upon closure, exercise or expiration of the contract.
Options contracts purchased are recorded as investments. When the Fund writes an options contract, the premium received is recorded as an asset and an amount equivalent to the premium is recorded as a liability in the Statement of Assets and Liabilities and is subsequently adjusted to reflect the current fair value of the option written. Changes in the fair value of the written option are recorded as unrealized appreciation or depreciation until the contract is exercised or has expired. The Fund realizes a gain or loss when the option contract is closed or expires. When option contracts are exercised, the proceeds on sales for a written call or purchased put option contract, or the purchase cost for a written put or purchased call option contract, is adjusted by the amount of premium received or paid.
For over-the-counter options purchased, the Fund bears the risk of loss of the amount of the premiums paid plus the positive change in market values net of any collateral held by the Fund should the counterparty fail to perform under the contracts. Option contracts written by the Fund do not typically give rise to significant counterparty credit risk, as options written generally obligate the Fund and not the counterparty to perform. The risk in writing a call option contract is that the Fund gives up the opportunity for profit if the market price of the security increases above the strike price and the option contract is exercised. The risk in writing a put option contract is that the Fund may incur a loss if the market price of the security decreases below the strike price and the option contract is exercised. Exercise of a written option could result in the Fund purchasing or selling a security or foreign currency when it otherwise would not, or at a price different from the current market value. In purchasing and writing options, the Fund bears the risk of an unfavorable change in the value of the underlying instrument or the risk that the Fund may not be able to enter into a closing transaction due to an illiquid market.
Effects of derivative transactions in the financial statements
The following tables are intended to provide additional information about the effect of derivatives on the financial statements of the Fund, including: the fair value of derivatives by risk category and the location of those fair values in the Statement of Assets and Liabilities; and the impact of derivative transactions over the period in the Statement of Operations, including realized and unrealized gains (losses). The derivative instrument schedules following the Portfolio of Investments present additional information regarding derivative instruments outstanding at the end of the period, if any.
Columbia Overseas Value Fund | Annual Report 2022
| 25 |
Notes to Financial Statements (continued)
February 28, 2022
The following table is a summary of the fair value of derivative instruments (not considered to be hedging instruments for accounting disclosure purposes) at February 28, 2022:
| | Asset derivatives | |
Risk exposure
category | Statement
of assets and liabilities
location | Fair value ($) |
| Foreign exchange risk | Unrealized appreciation on forward foreign currency exchange contracts | 3,114,958 |
| | Liability derivatives | |
Risk exposure
category | Statement
of assets and liabilities
location | Fair value ($) |
| Equity risk | Options contracts written, at value | 1,064,534 |
| Foreign exchange risk | Unrealized depreciation on forward foreign currency exchange contracts | 1,037,931 |
| Total | | 2,102,465 |
The following table indicates the effect of derivative instruments (not considered to be hedging instruments for accounting disclosure purposes) in the Statement of Operations for the year ended February 28, 2022:
| Amount of realized gain (loss) on derivatives recognized in income |
| Risk exposure category | Forward
foreign
currency
exchange
contracts
($) | Options
contracts
written
($) | Options
contracts
purchased
($) | Total
($) |
| Equity risk | — | 1,933,761 | (2,630,105) | (696,344) |
| Foreign exchange risk | (8,509,988) | — | — | (8,509,988) |
| Total | (8,509,988) | 1,933,761 | (2,630,105) | (9,206,332) |
| Change in unrealized appreciation (depreciation) on derivatives recognized in income |
| Risk exposure category | Forward
foreign
currency
exchange
contracts
($) | Options
contracts
written
($) | Total
($) |
| Equity risk | — | (872,158) | (872,158) |
| Foreign exchange risk | 1,523,925 | — | 1,523,925 |
| Total | 1,523,925 | (872,158) | 651,767 |
The following table is a summary of the average outstanding volume by derivative instrument for the year ended February 28, 2022:
| Derivative instrument | Average
value ($) |
| Options contracts — purchased | 209,534* |
| Options contracts — written | (286,667)** |
| Derivative instrument | Average unrealized
appreciation ($)** | Average unrealized
depreciation ($)** |
| Forward foreign currency exchange contracts | 2,057,148 | (2,438,290) |
| * | Based on the ending daily outstanding amounts for the year ended February 28, 2022. |
| ** | Based on the ending quarterly outstanding amounts for the year ended February 28, 2022. |
| 26 | Columbia Overseas Value Fund | Annual Report 2022 |
Notes to Financial Statements (continued)
February 28, 2022
Offsetting of assets and liabilities
The following table presents the Fund’s gross and net amount of assets and liabilities available for offset under netting arrangements as well as any related collateral received or pledged by the Fund as of February 28, 2022:
| | Goldman
Sachs
International ($) | Morgan
Stanley ($) | Total ($) |
| Assets | | | |
| Forward foreign currency exchange contracts | 3,114,958 | - | 3,114,958 |
| Liabilities | | | |
| Forward foreign currency exchange contracts | 1,037,931 | - | 1,037,931 |
| Options contracts written | - | 1,064,534 | 1,064,534 |
| Total liabilities | 1,037,931 | 1,064,534 | 2,102,465 |
| Total financial and derivative net assets | 2,077,027 | (1,064,534) | 1,012,493 |
| Total collateral received (pledged) (a) | 460,000 | (1,064,534) | (604,534) |
| Net amount (b) | 1,617,027 | - | 1,617,027 |
| (a) | In some instances, the actual collateral received and/or pledged may be more than the amount shown due to overcollateralization. |
| (b) | Represents the net amount due from/(to) counterparties in the event of default. |
Security transactions
Security transactions are accounted for on the trade date. Cost is determined and gains (losses) are based upon the specific identification method for both financial statement and federal income tax purposes.
Income recognition
Corporate actions and dividend income are generally recorded net of any non-reclaimable tax withholdings, on the ex-dividend date or upon receipt of an ex-dividend notification in the case of certain foreign securities.
The Fund may receive distributions from holdings in equity securities, business development companies (BDCs), exchange-traded funds (ETFs), limited partnerships (LPs), other regulated investment companies (RICs), and real estate investment trusts (REITs), which report information as to the tax character of their distributions annually. These distributions are allocated to dividend income, capital gain and return of capital based on actual information reported. Return of capital is recorded as a reduction of the cost basis of securities held. If the Fund no longer owns the applicable securities, return of capital is recorded as a realized gain. With respect to REITs, to the extent actual information has not yet been reported, estimates for return of capital are made by Columbia Management Investment Advisers, LLC (the Investment Manager), a wholly-owned subsidiary of Ameriprise Financial, Inc. (Ameriprise Financial). The Investment Manager’s estimates are subsequently adjusted when the actual character of the distributions is disclosed by the REITs, which could result in a proportionate change in return of capital to shareholders.
Awards from class action litigation are recorded as a reduction of cost basis if the Fund still owns the applicable securities on the payment date. If the Fund no longer owns the applicable securities on the payment date, the proceeds are recorded as realized gains.
Expenses
General expenses of the Trust are allocated to the Fund and other funds of the Trust based upon relative net assets or other expense allocation methodologies determined by the nature of the expense. Expenses directly attributable to the Fund are charged to the Fund. Expenses directly attributable to a specific class of shares are charged to that share class.
Determination of class net asset value
All income, expenses (other than class-specific expenses, which are charged to that share class, as shown in the Statement of Operations) and realized and unrealized gains (losses) are allocated to each class of the Fund on a daily basis, based on the relative net assets of each class, for purposes of determining the net asset value of each class.
Columbia Overseas Value Fund | Annual Report 2022
| 27 |
Notes to Financial Statements (continued)
February 28, 2022
Federal income tax status
The Fund intends to qualify each year as a regulated investment company under Subchapter M of the Internal Revenue Code, as amended, and will distribute substantially all of its investment company taxable income and net capital gain, if any, for its tax year, and as such will not be subject to federal income taxes. In addition, the Fund intends to distribute in each calendar year substantially all of its ordinary income, capital gain net income and certain other amounts, if any, such that the Fund should not be subject to federal excise tax. Therefore, no federal income or excise tax provision is recorded.
Foreign taxes
The Fund may be subject to foreign taxes on income, gains on investments or currency repatriation, a portion of which may be recoverable. The Fund will accrue such taxes and recoveries, as applicable, based upon its current interpretation of tax rules and regulations that exist in the markets in which it invests.
Realized gains in certain countries may be subject to foreign taxes at the Fund level, based on statutory rates. The Fund accrues for such foreign taxes on realized and unrealized gains at the appropriate rate for each jurisdiction, as applicable. The amount, if any, is disclosed as a liability on the Statement of Assets and Liabilities.
Distributions to shareholders
Distributions from net investment income, if any, are declared and paid semi-annually. Net realized capital gains, if any, are distributed at least annually. Income distributions and capital gain distributions are determined in accordance with federal income tax regulations, which may differ from GAAP.
Guarantees and indemnifications
Under the Trust’s organizational documents and, in some cases, by contract, its officers and trustees are indemnified against certain liabilities arising out of the performance of their duties to the Trust or its funds. In addition, certain of the Fund’s contracts with its service providers contain general indemnification clauses. The Fund’s maximum exposure under these arrangements is unknown since the amount of any future claims that may be made against the Fund cannot be determined, and the Fund has no historical basis for predicting the likelihood of any such claims.
Note 3. Fees and other transactions with affiliates
Management services fees
The Fund has entered into a Management Agreement with Columbia Management Investment Advisers, LLC (the Investment Manager), a wholly-owned subsidiary of Ameriprise Financial, Inc. (Ameriprise Financial). Under the Management Agreement, the Investment Manager provides the Fund with investment research and advice, as well as administrative and accounting services. The management services fee is an annual fee that is equal to a percentage of the Fund’s daily net assets that declines from 0.87% to 0.67% as the Fund’s net assets increase. The effective management services fee rate for the year ended February 28, 2022 was 0.78% of the Fund’s average daily net assets.
Compensation of board members
Members of the Board of Trustees who are not officers or employees of the Investment Manager or Ameriprise Financial are compensated for their services to the Fund as disclosed in the Statement of Operations. Under a Deferred Compensation Plan (the Deferred Plan), these members of the Board of Trustees may elect to defer payment of up to 100% of their compensation. Deferred amounts are treated as though equivalent dollar amounts had been invested in shares of certain funds managed by the Investment Manager. The Fund’s liability for these amounts is adjusted for market value changes and remains in the Fund until distributed in accordance with the Deferred Plan. All amounts payable under the Deferred Plan constitute a general unsecured obligation of the Fund. The expense for the Deferred Plan, which includes Trustees’ fees deferred during the current period as well as any gains or losses on the Trustees’ deferred compensation balances as a result of market fluctuations, is included in "Compensation of board members" on the Statement of Operations.
| 28 | Columbia Overseas Value Fund | Annual Report 2022 |
Notes to Financial Statements (continued)
February 28, 2022
Compensation of Chief Compliance Officer
The Board of Trustees has appointed a Chief Compliance Officer for the Fund in accordance with federal securities regulations. As disclosed in the Statement of Operations, a portion of the Chief Compliance Officer’s total compensation is allocated to the Fund, along with other allocations to affiliated registered investment companies managed by the Investment Manager and its affiliates, based on relative net assets.
Transfer agency fees
Under a Transfer and Dividend Disbursing Agent Agreement, Columbia Management Investment Services Corp. (the Transfer Agent), an affiliate of the Investment Manager and a wholly-owned subsidiary of Ameriprise Financial, is responsible for providing transfer agency services to the Fund. The Transfer Agent has contracted with DST Asset Manager Solutions, Inc. (DST) to serve as sub-transfer agent. The Transfer Agent pays the fees of DST for services as sub-transfer agent and DST is not entitled to reimbursement for such fees from the Fund (with the exception of out-of-pocket fees).
The Fund pays the Transfer Agent a monthly transfer agency fee based on the number or the average value of accounts, depending on the type of account. In addition, the Fund pays the Transfer Agent a fee for shareholder services based on the number of accounts or on a percentage of the average aggregate value of the Fund’s shares maintained in omnibus accounts up to the lesser of the amount charged by the financial intermediary or a cap established by the Board of Trustees from time to time.
The Transfer Agent also receives compensation from the Fund for various shareholder services and reimbursements for certain out-of-pocket fees. Total transfer agency fees for Institutional 2 Class and Institutional 3 Class shares are subject to an annual limitation of not more than 0.07% and 0.02%, respectively, of the average daily net assets attributable to each share class.
For the year ended February 28, 2022, the Fund’s effective transfer agency fee rates as a percentage of average daily net assets of each class were as follows:
| | Effective rate (%) |
| Class A | 0.14 |
| Advisor Class | 0.14 |
| Class C | 0.14 |
| Institutional Class | 0.14 |
| Institutional 2 Class | 0.06 |
| Institutional 3 Class | 0.01 |
| Class R | 0.14 |
An annual minimum account balance fee of $20 may apply to certain accounts with a value below the applicable share class’s initial minimum investment requirements to reduce the impact of small accounts on transfer agency fees. These minimum account balance fees are remitted to the Fund and recorded as part of expense reductions in the Statement of Operations. For the year ended February 28, 2022, these minimum account balance fees reduced total expenses of the Fund by $280.
Distribution and service fees
The Fund has entered into an agreement with Columbia Management Investment Distributors, Inc. (the Distributor), an affiliate of the Investment Manager and a wholly-owned subsidiary of Ameriprise Financial, for distribution and shareholder services. The Board of Trustees has approved, and the Fund has adopted, distribution and shareholder service plans (the Plans) applicable to certain share classes, which set the distribution and service fees for the Fund. These fees are calculated daily and are intended to compensate the Distributor and/or eligible selling and/or servicing agents for selling shares of the Fund and providing services to investors.
Columbia Overseas Value Fund | Annual Report 2022
| 29 |
Notes to Financial Statements (continued)
February 28, 2022
Under the Plans, the Fund pays a monthly combined distribution and service fee to the Distributor at the maximum annual rate of 0.25% of the average daily net assets attributable to Class A shares of the Fund. Also under the Plans, the Fund pays a monthly service fee to the Distributor at the maximum annual rate of 0.25% of the average daily net assets attributable to Class C shares of the Fund and a monthly distribution fee to the Distributor at the maximum annual rates of 0.75% and 0.50% of the average daily net assets attributable to Class C and Class R shares of the Fund, respectively.
Sales charges (unaudited)
Sales charges, including front-end charges and contingent deferred sales charges (CDSCs), received by the Distributor for distributing Fund shares for the year ended February 28, 2022, if any, are listed below:
| | Front End (%) | CDSC (%) | Amount ($) |
| Class A | 5.75 | 0.50 - 1.00(a) | 179,114 |
| Class C | — | 1.00(b) | 809 |
| (a) | This charge is imposed on certain investments of between $1 million and $50 million redeemed within 18 months after purchase, as follows: 1.00% if redeemed within 12 months after purchase, and 0.50% if redeemed more than 12, but less than 18, months after purchase, with certain limited exceptions. |
| (b) | This charge applies to redemptions within 12 months after purchase, with certain limited exceptions. |
The Fund’s other share classes are not subject to sales charges.
Expenses waived/reimbursed by the Investment Manager and its affiliates
The Investment Manager and certain of its affiliates have contractually agreed to waive fees and/or reimburse expenses (excluding certain fees and expenses described below) for the period(s) disclosed below, unless sooner terminated at the sole discretion of the Board of Trustees, so that the Fund’s net operating expenses, after giving effect to fees waived/expenses reimbursed and any balance credits and/or overdraft charges from the Fund’s custodian, do not exceed the following annual rate(s) as a percentage of the classes’ average daily net assets:
| | Fee rate(s) contractual
through
June 30, 2024 |
| Class A | 1.16% |
| Advisor Class | 0.91 |
| Class C | 1.91 |
| Institutional Class | 0.91 |
| Institutional 2 Class | 0.82 |
| Institutional 3 Class | 0.77 |
| Class R | 1.41 |
Under the agreement governing these fee waivers and/or expense reimbursement arrangements, the following fees and expenses are excluded from the waiver/reimbursement commitment, and therefore will be paid by the Fund, if applicable: taxes (including foreign transaction taxes), expenses associated with investments in affiliated and non-affiliated pooled investment vehicles (including mutual funds and exchange-traded funds), transaction costs and brokerage commissions, costs related to any securities lending program, dividend expenses associated with securities sold short, inverse floater program fees and expenses, transaction charges and interest on borrowed money, interest, costs associated with shareholder meetings, infrequent and/or unusual expenses and any other expenses the exclusion of which is specifically approved by the Board of Trustees. This agreement may be modified or amended only with approval from the Investment Manager, certain of its affiliates and the Fund. In addition to the contractual agreement, the Investment Manager and certain of its affiliates have voluntarily agreed to waive fees and/or reimburse Fund expenses (excluding certain fees and expenses described above) so that Fund level expenses (expenses directly attributable to the Fund and not to a specific share class) are waived proportionately across all share classes. This arrangement may be revised or discontinued at any time. Any fees waived and/or expenses reimbursed under the expense reimbursement arrangements described above are not recoverable by the Investment Manager or its affiliates in future periods.
| 30 | Columbia Overseas Value Fund | Annual Report 2022 |
Notes to Financial Statements (continued)
February 28, 2022
Note 4. Federal tax information
The timing and character of income and capital gain distributions are determined in accordance with income tax regulations, which may differ from GAAP because of temporary or permanent book to tax differences.
At February 28, 2022, these differences were primarily due to differing treatment for deferral/reversal of wash sale losses, trustees’ deferred compensation, derivative investments, late-year ordinary losses, capital loss carryforward, former passive foreign investment company (PFIC) holdings, foreign capital gains tax, foreign currency transactions and PFIC holdings. To the extent these differences were permanent, reclassifications were made among the components of the Fund’s net assets. Temporary differences do not require reclassifications.
The following reclassifications were made:
Excess of distributions
over net investment
income ($) | Accumulated
net realized
(loss) ($) | Paid in
capital ($) |
| (7,642,574) | 7,454,369 | 188,205 |
Net investment income (loss) and net realized gains (losses), as disclosed in the Statement of Operations, and net assets were not affected by this reclassification.
The tax character of distributions paid during the years indicated was as follows:
| Year Ended February 28, 2022 | Year Ended February 28, 2021 |
Ordinary
income ($) | Long-term
capital gains ($) | Total ($) | Ordinary
income ($) | Long-term
capital gains ($) | Total ($) |
| 77,253,206 | 18,046,140 | 95,299,346 | 21,683,330 | 8,068,493 | 29,751,823 |
Short-term capital gain distributions, if any, are considered ordinary income distributions for tax purposes.
At February 28, 2022, the components of distributable earnings on a tax basis were as follows:
Undistributed
ordinary income ($) | Undistributed
long-term
capital gains ($) | Capital loss
carryforwards ($) | Net unrealized
appreciation ($) |
| — | 26,079,312 | (274,747,450) | 3,491,240 |
At February 28, 2022, the cost of all investments for federal income tax purposes along with the aggregate gross unrealized appreciation and depreciation based on that cost was:
Federal
tax cost ($) | Gross unrealized
appreciation ($) | Gross unrealized
(depreciation) ($) | Net unrealized
appreciation ($) |
| 2,726,394,677 | 256,811,293 | (253,320,053) | 3,491,240 |
Tax cost of investments and unrealized appreciation/(depreciation) may also include timing differences that do not constitute adjustments to tax basis.
The following capital loss carryforwards, determined at February 28, 2022, may be available to reduce future net realized gains on investments, if any, to the extent permitted by the Internal Revenue Code. In addition, for the year ended February 28, 2022, capital loss carryforwards utilized, if any, were as follows:
No expiration
short-term ($) | No expiration
long-term ($) | Total ($) | Utilized ($) |
| — | (274,747,450) | (274,747,450) | 35,298,171 |
Columbia Overseas Value Fund | Annual Report 2022
| 31 |
Notes to Financial Statements (continued)
February 28, 2022
Under current tax rules, regulated investment companies can elect to treat certain late-year ordinary losses incurred and post-October capital losses (capital losses realized after October 31) as arising on the first day of the following taxable year. As of February 28, 2022, the Fund will elect to treat the following late-year ordinary losses and post-October capital losses as arising on March 1, 2022.
Late year
ordinary losses ($) | Post-October
capital losses ($) |
| 2,435,594 | — |
Management of the Fund has concluded that there are no significant uncertain tax positions in the Fund that would require recognition in the financial statements. However, management’s conclusion may be subject to review and adjustment at a later date based on factors including, but not limited to, new tax laws, regulations, and administrative interpretations (including relevant court decisions). Generally, the Fund’s federal tax returns for the prior three fiscal years remain subject to examination by the Internal Revenue Service.
Note 5. Portfolio information
The cost of purchases and proceeds from sales of securities, excluding short-term investments and derivatives, if any, aggregated to $1,763,705,326 and $1,099,349,914, respectively, for the year ended February 28, 2022. The amount of purchase and sale activity impacts the portfolio turnover rate reported in the Financial Highlights.
Note 6. Affiliated money market fund
The Fund invests in Columbia Short-Term Cash Fund, an affiliated money market fund established for the exclusive use by the Fund and other affiliated funds (the Affiliated MMF). The income earned by the Fund from such investments is included as Dividends - affiliated issuers in the Statement of Operations. As an investing fund, the Fund indirectly bears its proportionate share of the expenses of the Affiliated MMF. The Affiliated MMF prices its shares with a floating net asset value. In addition, the Board of Trustees of the Affiliated MMF may impose a fee on redemptions (sometimes referred to as a liquidity fee) or temporarily suspend redemptions (sometimes referred to as imposing a redemption gate) in the event its liquidity falls below regulatory limits.
Note 7. Interfund lending
Pursuant to an exemptive order granted by the Securities and Exchange Commission, the Fund participates in a program (the Interfund Program) allowing each participating Columbia Fund (each, a Participating Fund) to lend money directly to and, except for closed-end funds and money market funds, borrow money directly from other Participating Funds for temporary purposes. The amounts eligible for borrowing and lending under the Interfund Program are subject to certain restrictions.
Interfund loans are subject to the risk that the borrowing fund could be unable to repay the loan when due, and a delay in repayment to the lending fund could result in lost opportunities and/or additional lending costs. The exemptive order is subject to conditions intended to mitigate conflicts of interest arising from the Investment Manager’s relationship with each Participating Fund.
The Fund did not borrow or lend money under the Interfund Program during the year ended February 28, 2022.
Note 8. Line of credit
The Fund has access to a revolving credit facility with a syndicate of banks led by JPMorgan Chase Bank, N.A., Citibank, N.A. and Wells Fargo Bank, N.A. whereby the Fund may borrow for the temporary funding of shareholder redemptions or for other temporary or emergency purposes. Pursuant to an October 28, 2021 amendment and restatement, the credit facility, which is an agreement between the Fund and certain other funds managed by the Investment Manager or an affiliated investment manager, severally and not jointly, permits aggregate borrowings up to $950 million. Interest is currently charged to each participating fund based on its borrowings at a rate equal to the higher of (i) the federal funds effective rate, (ii) the secured overnight financing rate plus 0.11448% and (iii) the overnight bank funding rate, plus in each case, 1.00%. Each borrowing under the credit facility matures no later than 60 days after the date of borrowing. The Fund also pays a commitment fee equal to its pro rata share of the unused amount of the credit facility at a rate of 0.15% per annum. The commitment fee is
| 32 | Columbia Overseas Value Fund | Annual Report 2022 |
Notes to Financial Statements (continued)
February 28, 2022
included in other expenses in the Statement of Operations. This agreement expires annually in October unless extended or renewed. Prior to the October 28, 2021 amendment and restatement, the Fund had access to a revolving credit facility with a syndicate of banks led by JPMorgan Chase Bank, N.A., Citibank, N.A. and Wells Fargo Bank, N.A. which permitted collective borrowings up to $950 million. Interest was charged to each participating fund based on its borrowings at a rate equal to the higher of (i) the federal funds effective rate, (ii) the one-month London Interbank Offered Rate (LIBOR) rate and (iii) the overnight bank funding rate, plus in each case, 1.25%.
The Fund had no borrowings during the year ended February 28, 2022.
Note 9. Fund reorganization
At the close of business on January 21, 2022, the Fund acquired the assets and assumed the identified liabilities of BMO Disciplined International Equity Fund (the Acquired Fund), a series of BMO Funds, Inc. The reorganization was completed after shareholders of the Acquired Fund approved a plan of reorganization at a shareholder meeting held on January 7, 2022. The purpose of the reorganization was to combine two funds with comparable investment objectives and strategies.
The aggregate net assets of the Fund immediately before the reorganization were $2,750,846,061 and the combined net assets immediately after the reorganization were $2,792,940,373.
The reorganization was accomplished by a tax-free exchange of 3,972,476 shares of the Acquired Fund valued at $42,094,312 (including $1,363,189 of unrealized appreciation/(depreciation)).
In exchange for the Acquired Fund’s shares, the Fund issued the following number of shares:
| | Shares |
| Class A | 4,285 |
| Advisor Class | 4,039,099 |
For financial reporting purposes, net assets received and shares issued by the Fund were recorded at fair value; however, the Acquired Fund’s cost of investments was carried forward.
The Fund’s financial statements reflect both the operations of the Fund for the period prior to the reorganization and the combined Fund for the period subsequent to the reorganization. Because the combined investment portfolios have been managed as a single integrated portfolio since the reorganization was completed, it is not practicable to separate the amounts of revenue and earnings of the Acquired Fund that have been included in the combined Fund’s Statement of Operations since the reorganization was completed.
Assuming the reorganization had been completed on March 1, 2021, the Fund’s pro-forma results of operations for the year ended February 28, 2022 would have been approximately:
| | ($) |
| Net investment income | 64,507,000 |
| Net realized gain | 81,877,000 |
| Net change in unrealized appreciation/(depreciation) | (52,161,000) |
| Net increase in net assets from operations | 94,223,000 |
Note 10. Significant risks
Derivatives risk
Losses involving derivative instruments may be substantial, because a relatively small movement in the underlying reference (which is generally the price, rate or other economic indicator associated with a security(ies), commodity, currency, index or other instrument or asset) may result in a substantial loss for the Fund. In addition to the potential for increased losses, the use of derivative instruments may lead to increased volatility within the Fund. Derivatives will typically increase the Fund’s exposure to principal risks to which it is otherwise exposed, and may expose the Fund to additional risks, including correlation risk, counterparty risk, hedging risk, leverage risk, liquidity risk and pricing risk.
Columbia Overseas Value Fund | Annual Report 2022
| 33 |
Notes to Financial Statements (continued)
February 28, 2022
Financial sector risk
The Fund is more susceptible to the particular risks that may affect companies in the financial services sector than if it were invested in a wider variety of companies in unrelated sectors. Companies in the financial services sector are subject to certain risks, including the risk of regulatory change, decreased liquidity in credit markets and unstable interest rates. Such companies may have concentrated portfolios, such as a high level of loans to one or more industries or sectors, which makes them vulnerable to economic conditions that affect such industries or sectors. Performance of such companies may be affected by competitive pressures and exposure to investments, agreements and counterparties, including credit products that, under certain circumstances, may lead to losses (e.g., subprime loans). Companies in the financial services sector are subject to extensive governmental regulation that may limit the amount and types of loans and other financial commitments they can make, and interest rates and fees that they may charge. In addition, profitability of such companies is largely dependent upon the availability and the cost of capital.
Foreign securities and emerging market countries risk
Investing in foreign securities may involve certain risks not typically associated with investing in U.S. securities, such as increased currency volatility and risks associated with political, regulatory, economic, social, diplomatic and other conditions or events occurring in the country or region, which may result in significant market volatility. In addition, certain foreign securities may not be as liquid as U.S. securities. Investing in emerging markets may increase these risks and expose the Fund to elevated risks associated with increased inflation, deflation or currency devaluation. To the extent that the Fund concentrates its investment exposure to any one or a few specific countries, the Fund will be particularly susceptible to the risks associated with the conditions, events or other factors impacting those countries or regions and may, therefore, have a greater risk than that of a fund that is more geographically diversified.
Geographic focus risk
The Fund may be particularly susceptible to economic, political, regulatory or other events or conditions affecting issuers and countries within the specific geographic regions in which the Fund invests. The Fund’s NAV may be more volatile than the NAV of a more geographically diversified fund.
Asia Pacific Region. The Fund is particularly susceptible to economic, political, regulatory or other events or conditions affecting issuers and countries in the Asia Pacific region. Many of the countries in the region are considered underdeveloped or developing, including from a political, economic and/or social perspective, and may have relatively unstable governments and economies based on limited business, industries and/or natural resources or commodities. Events in any one country within the region may impact other countries in the region or the region as a whole. As a result, events in the region will generally have a greater effect on the Fund than if the Fund were more geographically diversified. This could result in increased volatility in the value of the Fund’s investments and losses for the Fund. Also, securities of some companies in the region can be less liquid than U.S. or other foreign securities, potentially making it difficult for the Fund to sell such securities at a desirable time and price.
Europe. The Fund is particularly susceptible to economic, political, regulatory or other events or conditions affecting issuers and countries in Europe which are often closely connected and interdependent, and events in one European country can have an adverse impact on other European countries. In addition, the private and public sectors’ debt problems of a single European Union (EU) country can pose significant economic risks to the EU as a whole. As a result, the Fund’s NAV may be more volatile than the NAV of a more geographically diversified fund. If securities of issuers in Europe fall out of favor, it may cause the Fund to underperform other funds that do not focus their investments in this region of the world. The UK’s departure from the EU single market became effective January 1, 2021 with the end of the Brexit transition period and the post-Brexit trade deal between the UK and EU taking effect on December 31, 2020. The impact of Brexit on the UK and European economies and the broader global economy could be significant, resulting in negative impacts on currency and financial markets generally, such as increased volatility and illiquidity, and potentially lower economic growth in markets in Europe, which may adversely affect the value of your investment in the Fund.
| 34 | Columbia Overseas Value Fund | Annual Report 2022 |
Notes to Financial Statements (continued)
February 28, 2022
Market risk
The Fund may incur losses due to declines in the value of one or more securities in which it invests. These declines may be due to factors affecting a particular issuer, or the result of, among other things, political, regulatory, market, economic or social developments affecting the relevant market(s) more generally. In addition, turbulence in financial markets and reduced liquidity in equity, credit and/or fixed income markets may negatively affect many issuers, which could adversely affect the Fund, including causing difficulty in assigning prices to hard-to-value assets in thinly traded and closed markets, significant redemptions and operational challenges. Global economies and financial markets are increasingly interconnected, and conditions and events in one country, region or financial market may adversely impact issuers in a different country, region or financial market. These risks may be magnified if certain events or developments adversely interrupt the global supply chain; in these and other circumstances, such risks might affect companies worldwide. As a result, local, regional or global events such as terrorism, war, natural disasters, disease/virus outbreaks and epidemics or other public health issues, recessions, depressions or other events – or the potential for such events – could have a significant negative impact on global economic and market conditions.
The large-scale invasion of Ukraine by Russia in February 2022 has resulted in sanctions and market disruptions, including declines in regional and global stock and commodity markets and significant devaluations of Russian currency. The extent and duration of the military action are impossible to predict but could be significant. Market disruption caused by the Russian military action, and any counter measures or responses thereto (including international sanctions, a downgrade in the country’s credit rating, purchasing and financing restrictions, boycotts, tariffs, changes in consumer or purchaser preferences, cyberattacks and espionage) could have a severe adverse impact on regional and/or global securities and commodities markets, including markets for oil and natural gas. These and other related events could have a negative impact on Fund performance and the value of an investment in the Fund.
The pandemic caused by coronavirus disease 2019 and its variants (COVID-19) has resulted in, and may continue to result in, significant global economic and societal disruption and market volatility due to disruptions in market access, resource availability, facilities operations, imposition of tariffs, export controls and supply chain disruption, among others. Such disruptions may be caused, or exacerbated by, quarantines and travel restrictions, workforce displacement and loss in human and other resources. The uncertainty surrounding the magnitude, duration, reach, costs and effects of the global pandemic, as well as actions that have been or could be taken by governmental authorities or other third parties, present unknowns that are yet to unfold. The impacts, as well as the uncertainty over impacts to come, of COVID-19 – and any other infectious illness outbreaks, epidemics and pandemics that may arise in the future – could negatively affect global economies and markets in ways that cannot necessarily be foreseen. In addition, the impact of infectious illness outbreaks and epidemics in emerging market countries may be greater due to generally less established healthcare systems, governments and financial markets. Public health crises caused by the COVID-19 outbreak may exacerbate other pre-existing political, social and economic risks in certain countries or globally. The disruptions caused by COVID-19 could prevent the Fund from executing advantageous investment decisions in a timely manner and negatively impact the Fund’s ability to achieve its investment objectives. Any such event(s) could have a significant adverse impact on the value and risk profile of the Fund.
Shareholder concentration risk
At February 28, 2022, three unaffiliated shareholders of record owned 44.0% of the outstanding shares of the Fund in one or more accounts. The Fund has no knowledge about whether any portion of those shares was owned beneficially. Affiliated shareholders of record owned 10.4% of the outstanding shares of the Fund in one or more accounts. Subscription and redemption activity by concentrated accounts may have a significant effect on the operations of the Fund. In the case of a large redemption, the Fund may be forced to sell investments at inopportune times, including its liquid positions, which may result in Fund losses and the Fund holding a higher percentage of less liquid positions. Large redemptions could result in decreased economies of scale and increased operating expenses for non-redeeming Fund shareholders.
Note 11. Subsequent events
Management has evaluated the events and transactions that have occurred through the date the financial statements were issued. There were no items requiring adjustment of the financial statements and, other than as noted below, no items requiring additional disclosure.
Columbia Overseas Value Fund | Annual Report 2022
| 35 |
Notes to Financial Statements (continued)
February 28, 2022
On February 24, 2022, Russia began a large-scale invasion of Ukraine, and economic sanctions against Russia swiftly followed. Following regulatory concerns regarding these economic sanctions, a number of market exchanges halted trading in the stocks of Russia-based companies listed on their exchange. These and other related events could have a negative impact on Fund performance and the value of an investment in the Fund. Since the invasion, the value and liquidity of securities with exposure in Russia, Ukraine and Belarus have experienced significant declines. At February 28, 2022, securities with exposure in these countries represented 0.1% of the Fund’s net assets. Effective March 3, 2022, the value of all equity securities with exposure in these countries represents their fair value as determined in good faith under procedures approved by the Board of Trustees.
Note 12. Information regarding pending and settled legal proceedings
Ameriprise Financial and certain of its affiliates are involved in the normal course of business in legal proceedings which include regulatory inquiries, arbitration and litigation, including class actions concerning matters arising in connection with the conduct of its activities as a diversified financial services firm. Ameriprise Financial believes that the Fund is not currently the subject of, and that neither Ameriprise Financial nor any of its affiliates are the subject of, any pending legal, arbitration or regulatory proceedings that are likely to have a material adverse effect on the Fund or the ability of Ameriprise Financial or its affiliates to perform under their contracts with the Fund. Ameriprise Financial is required to make quarterly (10-Q), annual (10-K) and, as necessary, 8-K filings with the Securities and Exchange Commission (SEC) on legal and regulatory matters that relate to Ameriprise Financial and its affiliates. Copies of these filings may be obtained by accessing the SEC website at www.sec.gov.
There can be no assurance that these matters, or the adverse publicity associated with them, will not result in increased Fund redemptions, reduced sale of Fund shares or other adverse consequences to the Fund. Further, although we believe proceedings are not likely to have a material adverse effect on the Fund or the ability of Ameriprise Financial or its affiliates to perform under their contracts with the Fund, these proceedings are subject to uncertainties and, as such, we are unable to estimate the possible loss or range of loss that may result. An adverse outcome in one or more of these proceedings could result in adverse judgments, settlements, fines, penalties or other relief that could have a material adverse effect on the consolidated financial condition or results of operations of Ameriprise Financial or one or more of its affiliates that provides services to the Fund.
| 36 | Columbia Overseas Value Fund | Annual Report 2022 |
Report of Independent Registered Public Accounting Firm
To the Board of Trustees of Columbia Funds Series Trust and Shareholders of Columbia Overseas Value Fund
Opinion on the Financial Statements
We have audited the accompanying statement of assets and liabilities, including the portfolio of investments, of Columbia Overseas Value Fund (one of the funds constituting Columbia Funds Series Trust, referred to hereafter as the "Fund") as of February 28, 2022, the related statement of operations for the year ended February 28, 2022, the statement of changes in net assets for each of the two years in the period ended February 28, 2022, including the related notes, and the financial highlights for each of the five years in the period ended February 28, 2022 (collectively referred to as the "financial statements"). In our opinion, the financial statements present fairly, in all material respects, the financial position of the Fund as of February 28, 2022, the results of its operations for the year then ended, the changes in its net assets for each of the two years in the period ended February 28, 2022 and the financial highlights for each of the five years in the period ended February 28, 2022 in conformity with accounting principles generally accepted in the United States of America.
Basis for Opinion
These financial statements are the responsibility of the Fund’s management. Our responsibility is to express an opinion on the Fund’s financial statements based on our audits. We are a public accounting firm registered with the Public Company Accounting Oversight Board (United States) (PCAOB) and are required to be independent with respect to the Fund in accordance with the U.S. federal securities laws and the applicable rules and regulations of the Securities and Exchange Commission and the PCAOB.
We conducted our audits of these financial statements in accordance with the standards of the PCAOB. Those standards require that we plan and perform the audit to obtain reasonable assurance about whether the financial statements are free of material misstatement, whether due to error or fraud.
Our audits included performing procedures to assess the risks of material misstatement of the financial statements, whether due to error or fraud, and performing procedures that respond to those risks. Such procedures included examining, on a test basis, evidence regarding the amounts and disclosures in the financial statements. Our audits also included evaluating the accounting principles used and significant estimates made by management, as well as evaluating the overall presentation of the financial statements. Our procedures included confirmation of securities owned as of February 28, 2022 by correspondence with the custodian, transfer agent and brokers; when replies were not received from brokers, we performed other auditing procedures. We believe that our audits provide a reasonable basis for our opinion.
/s/PricewaterhouseCoopers LLP
Minneapolis, Minnesota
April 21, 2022
We have served as the auditor of one or more investment companies within the Columbia Funds Complex since 1977.
Columbia Overseas Value Fund | Annual Report 2022
| 37 |
Federal Income Tax Information
(Unaudited)
The Fund hereby designates the following tax attributes for the fiscal year ended February 28, 2022. Shareholders will be notified in early 2023 of the amounts for use in preparing 2022 income tax returns.
Qualified
dividend
income | Capital
gain
dividend | Foreign
taxes paid
to foreign
countries | Foreign
taxes paid
per share
to foreign
countries | Foreign
source
income | Foreign
source
income per
share |
| 100.00% | $46,331,725 | $8,825,234 | $0.03 | $93,428,222 | $0.34 |
Qualified dividend income. For taxable, non-corporate shareholders, the percentage of ordinary income distributed during the fiscal year that represents qualified dividend income subject to reduced tax rates.
Capital gain dividend. The Fund designates as a capital gain dividend the amount reflected above, or if subsequently determined to be different, the net capital gain of such fiscal period.
Foreign taxes. The Fund makes the election to pass through to shareholders the foreign taxes paid. Eligible shareholders may claim a foreign tax credit. These taxes, and the corresponding foreign source income, are provided in the table above.
TRUSTEES AND OFFICERS
The Board oversees the Fund’s operations and appoints officers who are responsible for day-to-day business decisions based on policies set by the Board. The following table provides basic biographical information about the Fund’s Trustees as of the printing of this report, including their principal occupations during the past five years, although specific titles for individuals may have varied over the period. The year set forth beneath Length of Service in the table below is the year in which the Trustee was first appointed or elected as Trustee to any Fund currently in the Columbia Funds Complex or a predecessor thereof. Under current Board policy, each Trustee generally serves until December 31 of the year such Trustee turns seventy-five (75).
Independent trustees
Name,
address,
year of birth | Position held
with the Columbia Funds and
length of service | Principal occupation(s)
during past five years
and other relevant
professional experience | Number of
Funds in the
Columbia Funds
Complex*
overseen | Other directorships
held by Trustee
during the past
five years |
George S. Batejan
c/o Columbia Management
Investment Advisers, LLC
290 Congress Street
Boston, MA 02210
1953 | Trustee since 2017 | Executive Vice President, Global Head of Technology and Operations, Janus Capital Group, Inc., 2010-2016 | 177 | Former Chairman of the Board, NICSA (National Investment Company Services Association) (Executive Committee, Nominating Committee and Governance Committee), 2014-2016; former Director, Intech Investment Management, 2011-2016; former Board Member, Metro Denver Chamber of Commerce, 2015-2016; former Advisory Board Member, University of Colorado Business School, 2015-2018 |
| 38 | Columbia Overseas Value Fund | Annual Report 2022 |
TRUSTEES AND OFFICERS (continued)
Independent trustees (continued)
Name,
address,
year of birth | Position held
with the Columbia Funds and
length of service | Principal occupation(s)
during past five years
and other relevant
professional experience | Number of
Funds in the
Columbia Funds
Complex*
overseen | Other directorships
held by Trustee
during the past
five years |
Kathleen Blatz
c/o Columbia Management
Investment Advisers, LLC
290 Congress Street
Boston, MA 02210
1954 | Trustee since 2006 | Attorney, specializing in arbitration and mediation; Chief Justice, Minnesota Supreme Court, 1998-2006; Associate Justice, Minnesota Supreme Court, 1996-1998; Fourth Judicial District Court Judge, Hennepin County, 1994-1996; Attorney in private practice and public service, 1984-1993; State Representative, Minnesota House of Representatives, 1979-1993, which included service on the Tax and Financial Institutions and Insurance Committees; Member and Interim Chair, Minnesota Sports Facilities Authority, January 2017-July 2017; Interim President and Chief Executive Officer, Blue Cross and Blue Shield of Minnesota (health care insurance), February-July 2018, April-October 2021 | 177 | Former Trustee, Blue Cross and Blue Shield of Minnesota, 2009-2021 (Chair of the Business Development Committee, 2014-2017; Chair of the Governance Committee, 2017-2019); former Member and Chair of the Board, Minnesota Sports Facilities Authority, January 2017-July 2017; former Director, Robina Foundation, 2009-2020 (Chair, 2014-2020); Director, Schulze Family Foundation, since 2021 |
Pamela G. Carlton
c/o Columbia Management
Investment Advisers, LLC
290 Congress Street
Boston, MA 02210
1954 | Trustee since 2007 | President, Springboard — Partners in Cross Cultural Leadership (consulting company) since 2003; Managing Director of US Equity Research, JP Morgan Chase, 1999-2003; Director of US Equity Research, Chase Asset Management, 1996-1999; Co-Director Latin America Research, 1993-1996, COO Global Research, 1992-1996, Co-Director of US Research, 1991-1992, Investment Banker, Morgan Stanley, 1982-1991, Morgan Stanley; Attorney, Cleary Gottlieb Steen & Hamilton LLP, 1980-1982 | 177 | Trustee, New York Presbyterian Hospital Board (Executive Committee and Chair of People Committee) since 1996; Director, DR Bank (Audit Committee) since 2017; Director, Evercore Inc. (Audit Committee) since 2019; Director, Apollo Commercial Real Estate Finance, Inc. since 2021; the Governing Council of the Independent Directors Council (IDC), since 2021 |
Janet Langford Carrig
c/o Columbia Management
Investment Advisers, LLC
290 Congress Street
Boston, MA 02210
1957 | Trustee since 1996 | Senior Vice President, General Counsel and Corporate Secretary, ConocoPhillips (independent energy company), September 2007-October 2018 | 175 | Director, EQT Corporation (natural gas producer) since 2019; Director, Whiting Petroleum Corporation (independent oil and gas company) since 2020 |
J. Kevin Connaughton
c/o Columbia Management
Investment Advisers, LLC
290 Congress Street
Boston, MA 02210
1964 | Trustee since 2020 | Member, FINRA National Adjudicatory Council since January 2020; Adjunct Professor of Finance, Bentley University since January 2018; Consultant to Independent Trustees of CFVIT and CFST I from March 2016 to June 2020 with respect to CFVIT and to December 2020 with respect to CFST I; Managing Director and General Manager of Mutual Fund Products, Columbia Management Investment Advisers, LLC, May 2010-February 2015; President, Columbia Funds, 2008-2015; and senior officer of Columbia Funds and affiliated funds, 2003-2015 | 175 | Former Director, The Autism Project, March 2015-December 2021; former Member of the Investment Committee, St. Michael’s College, November 2015-February 2020; former Trustee, St. Michael’s College, June 2017-September 2019; former Trustee, New Century Portfolios, January 2015-December 2017 |
Columbia Overseas Value Fund | Annual Report 2022
| 39 |
TRUSTEES AND OFFICERS (continued)
Independent trustees (continued)
Name,
address,
year of birth | Position held
with the Columbia Funds and
length of service | Principal occupation(s)
during past five years
and other relevant
professional experience | Number of
Funds in the
Columbia Funds
Complex*
overseen | Other directorships
held by Trustee
during the past
five years |
Olive M. Darragh
c/o Columbia Management
Investment Advisers, LLC
290 Congress Street
Boston, MA 02210
1962 | Trustee since 2020 | Managing Director of Darragh Inc. (strategy and talent management consulting firm) since 2010; Founder and CEO, Zolio, Inc. (investment management talent identification platform) since 2004; Consultant to Independent Trustees of CFVIT and CFST I from June 2019 to June 2020 with respect to CFVIT and to December 2020 with respect to CFST I; Partner, Tudor Investments, 2004-2010; Senior Partner, McKinsey & Company (consulting), 1990-2004; Touche Ross CPA, 1985-1988 | 175 | Former Director, University of Edinburgh Business School (Member of US Board); former Director, Boston Public Library Foundation |
Patricia M. Flynn
c/o Columbia Management
Investment Advisers, LLC
290 Congress Street
Boston, MA 02210
1950 | Trustee since 2004 | Trustee Professor of Economics and Management, Bentley University since 1976 (also teaches and conducts research on corporate governance); Dean, McCallum Graduate School of Business, Bentley University, 1992-2002 | 177 | Trustee, MA Taxpayers Foundation since 1997; Board of Governors, Innovation Institute, MA Technology Collaborative, 2010-2020; former Board of Directors, The MA Business Roundtable, 2003-2019 |
Brian J. Gallagher
c/o Columbia Management
Investment Advisers, LLC
290 Congress Street
Boston, MA 02210
1954 | Trustee since 2017 | Retired; Partner with Deloitte & Touche LLP and its predecessors, 1977-2016 | 177 | Trustee, Catholic Schools Foundation since 2004 |
Douglas A. Hacker
c/o Columbia Management
Investment Advisers, LLC
290 Congress Street
Boston, MA 02210
1955 | Co-Chair since 2021; Chair of CFST I and CFVIT since 2014; Trustee of CFST I and CFVIT since 1996 and CFST, CFST II, CFVST II, CET I and CET II since 2021 | Independent business executive since May 2006; Executive Vice President – Strategy of United Airlines, December 2002 - May 2006; President of UAL Loyalty Services (airline marketing company), September 2001-December 2002; Executive Vice President and Chief Financial Officer of United Airlines, July 1999-September 2001 | 177 | Director, Spartan Nash Company (food distributor); Director, Aircastle Limited (Chair of Audit Committee) (aircraft leasing); former Director, Nash Finch Company (food distributor), 2005-2013; former Director, SeaCube Container Leasing Ltd. (container leasing), 2010-2013; and former Director, Travelport Worldwide Limited (travel information technology), 2014-2019 |
Nancy T. Lukitsh
c/o Columbia Management
Investment Advisers, LLC
290 Congress Street
Boston, MA 02210
1956 | Trustee since 2011 | Senior Vice President, Partner and Director of Marketing, Wellington Management Company, LLP (investment adviser), 1997-2010; Chair, Wellington Management Portfolios (commingled non-U.S. investment pools), 2007 -2010; Director, Wellington Trust Company, NA and other Wellington affiliates, 1997-2010 | 175 | None |
| 40 | Columbia Overseas Value Fund | Annual Report 2022 |
TRUSTEES AND OFFICERS (continued)
Independent trustees (continued)
Name,
address,
year of birth | Position held
with the Columbia Funds and
length of service | Principal occupation(s)
during past five years
and other relevant
professional experience | Number of
Funds in the
Columbia Funds
Complex*
overseen | Other directorships
held by Trustee
during the past
five years |
David M. Moffett
c/o Columbia Management
Investment Advisers, LLC
290 Congress Street
Boston, MA 02210
1952 | Trustee since 2011 | Retired; Consultant to Bridgewater and Associates | 175 | Director, CSX Corporation (transportation suppliers); Director, Genworth Financial, Inc. (financial and insurance products and services); Director, PayPal Holdings Inc. (payment and data processing services); Trustee, University of Oklahoma Foundation; former Director, eBay Inc. (online trading community), 2007-2015; and former Director, CIT Bank, CIT Group Inc. (commercial and consumer finance), 2010-2016 |
Catherine James Paglia
c/o Columbia Management
Investment Advisers, LLC
290 Congress Street
Boston, MA 02210
1952 | Co-Chair since 2021; Chair of CFST, CFST II, CFVST II, CET I and CET II since 2020; Trustee of CFST, CFST II and CFVST II since 2004 and CFST I and CFVIT since 2021 | Director, Enterprise Asset Management, Inc. (private real estate and asset management company) since September 1998; Managing Director and Partner, Interlaken Capital, Inc., 1989-1997; Vice President, 1982-1985, Principal, 1985-1987, Managing Director, 1987-1989, Morgan Stanley; Vice President, Investment Banking, 1980-1982, Associate, Investment Banking, 1976-1980, Dean Witter Reynolds, Inc. | 177 | Director, Valmont Industries, Inc. (irrigation systems manufacturer) since 2012; Trustee, Carleton College (on the Investment Committee); Trustee, Carnegie Endowment for International Peace (on the Investment Committee) |
Minor M. Shaw
c/o Columbia Management
Investment Advisers, LLC
290 Congress Street
Boston, MA 02210
1947 | Trustee since 2003 | President, Micco LLC (private investments) since 2011; President, Micco Corp. (family investment business), 1998-2011 | 177 | Director, Blue Cross Blue Shield of South Carolina (Chair of Compensation Committee) since April 2008; Trustee, Hollingsworth Funds (on the Investment Committee) since 2016 (previously Board Chair from 2016-2019); Former Advisory Board member, Duke Energy Corp., 2016-2020; Chair of the Duke Endowment; Chair of Greenville – Spartanburg Airport Commission; former Trustee, BofA Funds Series Trust (11 funds), 2003-2011; former Director, Piedmont Natural Gas, 2004-2016; former Director, National Association of Corporate Directors, Carolinas Chapter, 2013-2018; Chair, Daniel-Mickel Foundation since 1998 |
Columbia Overseas Value Fund | Annual Report 2022
| 41 |
TRUSTEES AND OFFICERS (continued)
Independent trustees (continued)
Name,
address,
year of birth | Position held
with the Columbia Funds and
length of service | Principal occupation(s)
during past five years
and other relevant
professional experience | Number of
Funds in the
Columbia Funds
Complex*
overseen | Other directorships
held by Trustee
during the past
five years |
Natalie A. Trunow
c/o Columbia Management
Investment Advisers, LLC
290 Congress Street
Boston, MA 02210
1967 | Trustee since 2020 | Chief Executive Officer, Millennial Portfolio Solutions LLC (asset management and consulting services), January 2016-January 2021; Non-executive Member of the Investment Committee and Valuation Committee, Sarona Asset Management Inc. (private equity firm) since September 2019; Advisor, Horizon Investments (asset management and consulting services), August 2018-January 2021; Advisor, Paradigm Asset Management, November 2016-December 2021; Consultant to Independent Trustees of CFVIT and CFST I from September 2016 to June 2020 with respect to CFVIT and to December 2020 with respect to CFST I; Director of Investments/Consultant, Casey Family Programs, April 2016-November 2016; Senior Vice President and Chief Investment Officer, Calvert Investments, August 2008-January 2016; Section Head and Portfolio Manager, General Motors Asset Management, June 1997-August 2008 | 175 | Former Director, Investment Committee, Health Services for Children with Special Needs, Inc., 2012-2019; Director, Chair of Audit Committee, Consumer Credit Counseling Services (formerly Guidewell Financial Solutions), since 2019; Independent Director, Investment Committee and Valuation Committee, Sarona Asset Management, since 2019 |
Sandra Yeager
c/o Columbia Management
Investment Advisers, LLC
290 Congress Street
Boston, MA 02210
1964 | Trustee since 2017 | Retired; President and founder, Hanoverian Capital, LLC (SEC registered investment advisor firm), 2008-2016; Managing Director, DuPont Capital, 2006-2008; Managing Director, Morgan Stanley Investment Management, 2004-2006; Senior Vice President, Alliance Bernstein, 1990-2004 | 177 | Former Director, NAPE Education Foundation, October 2016-October 2020 |
| * | The term “Columbia Funds Complex” as used herein includes Columbia Seligman Premium Technology Growth Fund, Tri-Continental Corporation and each series of Columbia Fund Series Trust (CFST), Columbia Funds Series Trust I (CFST I), Columbia Funds Series Trust II (CFST II), Columbia ETF Trust I (CET I), Columbia ETF Trust II (CET II), Columbia Funds Variable Insurance Trust (CFVIT) and Columbia Funds Variable Series Trust II (CFVST II). Messrs. Batejan, Beckman, Gallagher and Hacker and Mses. Blatz, Carlton, Flynn, Paglia, Shaw and Yeager serve as Directors of Columbia Seligman Premium Technology Growth Fund and Tri-Continental Corporation. |
Interested trustee affiliated with Investment Manager*
Name,
address,
year of birth | Position held with the Columbia Funds and length of service | Principal occupation(s) during the
past five years and other relevant
professional experience | Number of
Funds in the
Columbia Funds
Complex overseen | Other directorships
held by Trustee
during the past
five years |
Daniel J. Beckman
c/o Columbia Management
Investment Advisers, LLC
290 Congress Street
Boston, MA 02210
1962 | Trustee since November 2021 and President since June 2021 | Vice President – Head of North America Product, Columbia Management Investment Advisers, LLC since April 2015; President and Principal Executive Officer of the Columbia Funds since June 2021; officer of Columbia Funds and affiliated funds, 2020-2021 | 177 | Director, Ameriprise Trust Company, since October 2016; Director, Columbia Management Investment Distributors, Inc. since November 2018; Board of Governors, Columbia Wanger Asset Management, LLC since January 2022 |
| * | Interested person (as defined under the 1940 Act) by reason of being an officer, director, security holder and/or employee of the Investment Manager or Ameriprise Financial. |
The Statement of Additional Information has additional information about the Fund’s Board members and is available, without charge, upon request by calling 800.345.6611, visiting columbiathreadneedleus.com/investor/ or contacting your financial intermediary.
| 42 | Columbia Overseas Value Fund | Annual Report 2022 |
TRUSTEES AND OFFICERS (continued)
The Board has appointed officers who are responsible for day-to-day business decisions based on policies it has established. The officers serve at the pleasure of the Board. The following table provides basic information about the Officers of the Fund as of the printing of this report, including principal occupations during the past five years, although their specific titles may have varied over the period. In addition to Mr. Beckman, who is President and Principal Executive Officer, the Fund’s other officers are:
Fund officers
Name,
address and
year of birth | Position and year
first appointed to
position for any Fund
in the Columbia
Funds Complex or a
predecessor thereof | Principal occupation(s) during past five years |
Michael G. Clarke
290 Congress Street
Boston, MA 02210
1969 | Chief Financial Officer and Principal Financial Officer (2009) and Senior Vice President (2019) | Senior Vice President and Head of Global Operations & Investor Services, Columbia Management Investment Advisers, LLC, since March 2022 (previously Vice President, Head of North American Operations, and Co-Head of Global Operations, June 2019 to February 2022 and Vice President – Accounting and Tax, May 2010 - May 2019); senior officer of Columbia Funds and affiliated funds since 2002. |
Joseph Beranek
5890 Ameriprise
Financial Center
Minneapolis, MN 55474
1965 | Treasurer and Chief Accounting Officer (Principal Accounting Officer) (2019) and Principal Financial Officer (2020), CFST, CFST I, CFST II, CFVIT and CFVST II; Assistant Treasurer, CET I and CET II | Vice President – Mutual Fund Accounting and Financial Reporting, Columbia Management Investment Advisers, LLC, since December 2018 and March 2017, respectively (previously Vice President – Pricing and Corporate Actions, May 2010 - March 2017). |
Marybeth Pilat
290 Congress Street
Boston, MA 02210
1968 | Treasurer and Chief Accounting Officer (Principal Accounting Officer) and Principal Financial Officer (2020) for CET I and CET II; Assistant Treasurer, CFST, CFST I, CFST II, CFVIT and CFVST II | Vice President – Product Pricing and Administration, Columbia Management Investment Advisers, LLC, since May 2017; Director - Fund Administration, Calvert Investments, August 2015 – March 2017; Vice President - Fund Administration, Legg Mason, May 2015 - July 2015; Vice President - Fund Administration, Columbia Management Investment Advisers, LLC, May 2010 - April 2015. |
William F. Truscott
290 Congress Street
Boston, MA 02210
1960 | Senior Vice President (2001) | Formerly, Trustee/Director of Columbia Funds Complex or legacy funds, November 2001-January 1, 2021; Chief Executive Officer, Global Asset Management, Ameriprise Financial, Inc. since September 2012; Chairman of the Board and President, Columbia Management Investment Advisers, LLC since July 2004 and February 2012, respectively; Chairman of the Board and Chief Executive Officer, Columbia Management Investment Distributors, Inc. since November 2008 and February 2012, respectively; Chairman of the Board and Director, Threadneedle Asset Management Holdings, Sàrl since March 2013 and December 2008, respectively; senior executive of various entities affiliated with Columbia Threadneedle. |
Christopher O. Petersen
5228 Ameriprise Financial Center
Minneapolis, MN 55474
1970 | Senior Vice President and Assistant Secretary | Formerly, Trustee/Director of funds within the Columbia Funds Complex, July 1, 2020 - November 22, 2021; Senior Vice President and Assistant General Counsel, Ameriprise Financial, Inc. since September 2021 (previously Vice President and Lead Chief Counsel, January 2015 - September 2021); President and Principal Executive Officer of the Columbia Funds, 2015 - 2021; officer of Columbia Funds and affiliated funds since 2007. |
Thomas P. McGuire
290 Congress Street
Boston, MA 02210
1972 | Senior Vice President and Chief Compliance Officer (2012) | Vice President – Asset Management Compliance, Ameriprise Financial, Inc., since May 2010; Chief Compliance Officer, Columbia Acorn/Wanger Funds since December 2015; Chief Compliance Officer, Ameriprise Certificate Company, September 2010 – September 2020. |
Ryan C. Larrenaga
290 Congress Street
Boston, MA 02210
1970 | Senior Vice President (2017), Chief Legal Officer (2017), and Secretary (2015) | Vice President and Chief Counsel, Ameriprise Financial, Inc. since August 2018 (previously Vice President and Group Counsel, August 2011 - August 2018); Chief Legal Officer, Columbia Acorn/Wanger Funds, since September 2020; officer of Columbia Funds and affiliated funds since 2005. |
Columbia Overseas Value Fund | Annual Report 2022
| 43 |
TRUSTEES AND OFFICERS (continued)
Fund officers (continued)
Name,
address and
year of birth | Position and year
first appointed to
position for any Fund
in the Columbia
Funds Complex or a
predecessor thereof | Principal occupation(s) during past five years |
Michael E. DeFao
290 Congress Street
Boston, MA 02210
1968 | Vice President (2011) and Assistant Secretary (2010) | Vice President and Chief Counsel, Ameriprise Financial, Inc. since May 2010; Vice President, Chief Legal Officer and Assistant Secretary, Columbia Management Investment Advisers, LLC since October 2021 (previously Vice President and Assistant Secretary, May 2010 – September 2021). |
Lyn Kephart-Strong
5228 Ameriprise
Financial Center
Minneapolis, MN 55474
1960 | Vice President (2015) | President, Columbia Management Investment Services Corp. since October 2014; Vice President & Resolution Officer, Ameriprise Trust Company since August 2009. |
| 44 | Columbia Overseas Value Fund | Annual Report 2022 |
[THIS PAGE INTENTIONALLY LEFT BLANK]
[THIS PAGE INTENTIONALLY LEFT BLANK]
[THIS PAGE INTENTIONALLY LEFT BLANK]
Columbia Overseas Value Fund
P.O. Box 219104
Kansas City, MO 64121-9104
Please read and consider the investment objectives, risks, charges and expenses for any fund carefully before investing. For a prospectus and summary prospectus, which contains this and other important information about the Fund, go to
columbiathreadneedleus.com/investor/. The Fund is distributed by Columbia Management Investment Distributors, Inc., member FINRA, and managed by Columbia Management Investment Advisers, LLC.
Columbia Threadneedle Investments (Columbia Threadneedle) is the global brand name of the Columbia and Threadneedle group of companies. All rights reserved.
© 2022 Columbia Management Investment Advisers, LLC.
columbiathreadneedleus.com/investor/

Annual Report
February 28, 2022
Columbia Large Cap Enhanced Core Fund
Not Federally Insured • No Financial Institution Guarantee • May Lose Value
If you elect to receive the shareholder report for Columbia Large Cap Enhanced Core Fund (the Fund) in paper, mailed to you, the Fund mails one shareholder report to each shareholder address, unless such shareholder elects to receive shareholder reports from the Fund electronically via e-mail or by having a paper notice mailed to you (Postcard Notice) that your Fund’s shareholder report is available at the Columbia funds’ website (columbiathreadneedleus.com/investor/). If you would like more than one report in paper to be mailed to you, or would like to elect to receive reports via e-mail or access them through Postcard Notice, please call shareholder services at 800.345.6611 and additional reports will be sent to you.
Proxy voting policies and procedures
The policy of the Board of Trustees is to vote the proxies of the companies in which the Fund holds investments consistent with the procedures as stated in the Statement of Additional Information (SAI). You may obtain a copy of the SAI without charge by calling 800.345.6611; contacting your financial intermediary; visiting columbiathreadneedleus.com/investor/; or searching the website of the Securities and Exchange Commission (SEC) at sec.gov. Information regarding how the Fund voted proxies relating to portfolio securities is filed with the SEC by August 31st for the most recent 12-month period ending June 30th of that year, and is available without charge by visiting columbiathreadneedleus.com/investor/, or searching the website of the SEC at sec.gov.
Quarterly schedule of investments
The Fund files a complete schedule of portfolio holdings with the SEC for the first and third quarters of each fiscal year on Form N-PORT. The Fund’s Form N-PORT filings are available on the SEC’s website at sec.gov. The Fund’s complete schedule of portfolio holdings, as filed on Form N-PORT, can also be obtained without charge, upon request, by calling 800.345.6611.
Additional Fund information
For more information about the Fund, please visit columbiathreadneedleus.com/investor/ or call 800.345.6611. Customer Service Representatives are available to answer your questions Monday through Friday from 8 a.m. to 7 p.m. Eastern time.
Fund investment manager
Columbia Management Investment Advisers, LLC (the Investment Manager)
290 Congress Street
Boston, MA 02210
Fund distributor
Columbia Management Investment Distributors, Inc.
290 Congress Street
Boston, MA 02210
Fund transfer agent
Columbia Management Investment Services Corp.
P.O. Box 219104
Kansas City, MO 64121-9104
Columbia Large Cap Enhanced Core Fund | Annual Report 2022
Investment objective
The Fund seeks total return before fees and expenses that exceeds the total return of the Standard & Poor’s (S&P) 500 Index.
Portfolio management
Raghavendran Sivaraman, Ph.D., CFA
Co-Portfolio Manager
Managed Fund since 2019
Oleg Nusinzon, CFA
Co-Portfolio Manager
Managed Fund since June 2021
Morningstar style boxTM
The Morningstar Style Box is based on a fund’s portfolio holdings. For equity funds, the vertical axis shows the market capitalization of the stocks owned, and the horizontal axis shows investment style (value, blend, or growth). Information shown is based on the most recent data provided by Morningstar.
© 2022 Morningstar, Inc. All rights reserved. The Morningstar information contained herein: (1) is proprietary to Morningstar and/or its content providers; (2) may not be copied or distributed; and (3) is not warranted to be accurate, complete or timely. Neither Morningstar nor its content providers are responsible for any damages or losses arising from any use of this information.
| Average annual total returns (%) (for the period ended February 28, 2022) |
| | | Inception | 1 Year | 5 Years | 10 Years |
| Class A | 07/31/96 | 20.15 | 14.72 | 14.04 |
| Advisor Class* | 07/01/15 | 20.50 | 15.01 | 14.23 |
| Institutional Class | 07/31/96 | 20.49 | 15.01 | 14.34 |
| Institutional 2 Class* | 06/25/14 | 20.67 | 15.13 | 14.36 |
| Institutional 3 Class | 07/15/09 | 20.73 | 15.19 | 14.50 |
| Class R | 01/23/06 | 19.85 | 14.43 | 13.77 |
| S&P 500 Index | | 16.39 | 15.17 | 14.59 |
All results shown assume reinvestment of distributions during the period. Returns do not reflect the deduction of taxes that a shareholder may pay on Fund distributions or on the redemption of Fund shares. Performance results reflect the effect of any fee waivers or reimbursements of Fund expenses by Columbia Management Investment Advisers, LLC and/or any of its affiliates. Absent these fee waivers or expense reimbursement arrangements, performance results would have been lower.
The performance information shown represents past performance and is not a guarantee of future results. The investment return and principal value of your investment will fluctuate so that your shares, when redeemed, may be worth more or less than their original cost. Current performance may be lower or higher than the performance information shown. You may obtain performance information current to the most recent month-end by contacting your financial intermediary, visiting columbiathreadneedleus.com/investor/ or calling 800.345.6611.
| * | The returns shown for periods prior to the share class inception date (including returns for the Life of the Fund, if shown, which are since Fund inception) include the returns of the Fund’s oldest share class. Since the Fund launched more than one share class at its inception, Class A shares were used. These returns are adjusted to reflect any higher class-related operating expenses of the newer share classes, as applicable. Please visit columbiathreadneedleus.com/investor/investment-products/mutual-funds/appended-performance for more information. |
The S&P 500 Index, an unmanaged index, measures the performance of 500 widely held, large-capitalization U.S. stocks and is frequently used as a general measure of market performance.
Indices are not available for investment, are not professionally managed and do not reflect sales charges, fees, brokerage commissions, taxes or other expenses of investing. Securities in the Fund may not match those in an index.
Fund performance may be significantly negatively impacted by the economic impact of the COVID-19 pandemic. The COVID-19 pandemic has adversely impacted economies and capital markets around the world in ways that will likely continue and may change in unforeseen ways for an indeterminate period. The COVID-19 pandemic may exacerbate pre-existing political, social and economic risks in certain countries and globally.
Columbia Large Cap Enhanced Core Fund | Annual Report 2022
| 3 |
Fund at a Glance (continued)
Performance of a hypothetical $10,000 investment (February 29, 2012 — February 28, 2022)
The chart above shows the change in value of a hypothetical $10,000 investment in Class A shares of Columbia Large Cap Enhanced Core Fund during the stated time period, and does not reflect the deduction of taxes that a shareholder may pay on Fund distributions or on the redemption of Fund shares.
| Portfolio breakdown (%) (at February 28, 2022) |
| Common Stocks | 97.5 |
| Money Market Funds | 2.5 |
| Total | 100.0 |
Percentages indicated are based upon total investments excluding investments in derivatives, if any. The Fund’s portfolio composition is subject to change.
| Equity sector breakdown (%) (at February 28, 2022) |
| Communication Services | 9.7 |
| Consumer Discretionary | 11.9 |
| Consumer Staples | 6.6 |
| Energy | 3.3 |
| Financials | 11.0 |
| Health Care | 13.8 |
| Industrials | 8.5 |
| Information Technology | 28.0 |
| Materials | 2.4 |
| Real Estate | 2.5 |
| Utilities | 2.3 |
| Total | 100.0 |
Percentages indicated are based upon total equity investments. The Fund’s portfolio composition is subject to change.
| 4 | Columbia Large Cap Enhanced Core Fund | Annual Report 2022 |
Manager Discussion of Fund Performance
For the 12-month period that ended February 28, 2022, Class A shares of Columbia Large Cap Enhanced Core Fund returned 20.15%. The Fund outperformed its benchmark, the S&P 500 Index, which returned 16.39% for the same time period.
Market overview
U.S. equities posted gains through much of the 12-month period that ended February 28, 2022. As pandemic-related restrictions were eased, robust economic growth and corporate earnings drove gains for stocks. Both U.S. monetary and fiscal policy were highly supportive, as Congress approved massive spending packages that included direct payments to citizens and the U.S. Federal Reserve (Fed) maintained its benchmark overnight lending rate near zero while engaging in bond market purchases to keep longer term borrowing costs low. The fourth quarter of 2021 saw the Fed adopt a more hawkish tone in response to persistently high inflation, driven in large part by supply chain constraints and rising commodity prices, which led to increased market volatility. The first two months of 2022 brought a rocky start, with most major indices returning in negative territory as markets grappled with individual stock volatility, the number and timing of interest rate hikes by the Fed, inflation and geopolitical tensions. Of most significance, tensions between Russia and Ukraine near the end of the period, and the subsequent invasion of Ukraine by Russia on February 24, 2022, roiled global markets and drove significant sell-offs.
We divide the metrics for our stock selection model into three broad categories: value (fundamental measures, such as earnings and cash flow, relative to market values), catalyst (price momentum and business momentum) and quality (quality of earnings and financial strength). We then rank the securities within a sector/industry from 1 (most attractive) to 5 (least attractive) based upon the metrics within these categories. For the period, the Fund’s value, quality and catalyst factors were in favor. Value factors contributed the most to the Fund’s relative outperformance.
The Fund’s notable contributors during the period
| • | The Fund’s outperformance of its benchmark during the period was driven by strong stock selection, most notably in the information technology, health care and communication services sectors. |
| • | Individual stocks that contributed most to relative performance included online payment company PayPal Holdings, parent company of search engine giant Google Alphabet (Class A), cybersecurity company Fortinet, steel manufacturer Nucor Corporation and entertainment conglomerate Walt Disney. |
o The Fund’s holding in PayPal was underweight relative the benchmark’s weight in the company, which benefited the Fund as PayPal delivered weak performance.
The Fund’s notable detractors during the period
| • | An underweight posture in financials and security selection in utilities detracted, resulting in relative underperformance in both sectors during the period. |
| • | Individual stocks that detracted most from relative performance during the period included computer graphics semiconductor company NVIDIA, interactive entertainment software company Activision Blizzard, computer software and multimedia tool supplier Autodesk and oil and gas giant Chevron Corp. We sold the Fund’s position in Chevron Corp. before the close of the reporting period. |
| • | Not owning Class C shares of Alphabet also weighed on results versus the benchmark during the period. |
Market risk may affect a single issuer, sector of the economy, industry or the market as a whole. Investing in derivatives is a specialized activity that involves special risks, which may result in significant losses. The Fund’s net value will generally decline when the performance of its targeted index declines. See the Fund’s prospectus for more information on these and other risks.
The views expressed in this report reflect the current views of the respective parties who have contributed to this report. These views are not guarantees of future performance and involve certain risks, uncertainties and assumptions that are difficult to predict, so actual outcomes and results may differ significantly from the views expressed. These views are subject to change at any time based upon economic, market or other conditions and the respective parties disclaim any responsibility to update such views. These views may not be relied on as investment advice and, because investment decisions for a Columbia fund are based on numerous factors, may not be relied on as an indication of trading intent on behalf of any particular Columbia fund. References to specific securities should not be construed as a recommendation or investment advice.
Columbia Large Cap Enhanced Core Fund | Annual Report 2022
| 5 |
Understanding Your Fund’s Expenses
(Unaudited)
As an investor, you incur two types of costs. There are shareholder transaction costs, which may include redemption fees. There are also ongoing fund costs, which generally include management fees, distribution and/or service fees, and other fund expenses. The following information is intended to help you understand your ongoing costs (in dollars) of investing in the Fund and to help you compare these costs with the ongoing costs of investing in other mutual funds.
Analyzing your Fund’s expenses
To illustrate these ongoing costs, we have provided examples and calculated the expenses paid by investors in each share class of the Fund during the period. The actual and hypothetical information in the table is based on an initial investment of $1,000 at the beginning of the period indicated and held for the entire period. Expense information is calculated two ways and each method provides you with different information. The amount listed in the “Actual” column is calculated using the Fund’s actual operating expenses and total return for the period. You may use the Actual information, together with the amount invested, to estimate the expenses that you paid over the period. Simply divide your account value by $1,000 (for example, an $8,600 account value divided by $1,000 = 8.6), then multiply the results by the expenses paid during the period under the “Actual” column. The amount listed in the “Hypothetical” column assumes a 5% annual rate of return before expenses (which is not the Fund’s actual return) and then applies the Fund’s actual expense ratio for the period to the hypothetical return. You should not use the hypothetical account values and expenses to estimate either your actual account balance at the end of the period or the expenses you paid during the period. See “Compare with other funds” below for details on how to use the hypothetical data.
Compare with other funds
Since all mutual funds are required to include the same hypothetical calculations about expenses in shareholder reports, you can use this information to compare the ongoing cost of investing in the Fund with other funds. To do so, compare the hypothetical example with the 5% hypothetical examples that appear in the shareholder reports of other funds. As you compare hypothetical examples of other funds, it is important to note that hypothetical examples are meant to highlight the ongoing costs of investing in a fund only and do not reflect any transaction costs, such as redemption or exchange fees. Therefore, the hypothetical calculations are useful in comparing ongoing costs only, and will not help you determine the relative total costs of owning different funds. If transaction costs were included in these calculations, your costs would be higher.
| September 1, 2021 — February 28, 2022 |
| | Account value at the
beginning of the
period ($) | Account value at the
end of the
period ($) | Expenses paid during
the period ($) | Fund’s annualized
expense ratio (%) |
| | Actual | Hypothetical | Actual | Hypothetical | Actual | Hypothetical | Actual |
| Class A | 1,000.00 | 1,000.00 | 990.80 | 1,020.68 | 4.10 | 4.16 | 0.83 |
| Advisor Class | 1,000.00 | 1,000.00 | 992.10 | 1,021.92 | 2.86 | 2.91 | 0.58 |
| Institutional Class | 1,000.00 | 1,000.00 | 992.20 | 1,021.92 | 2.86 | 2.91 | 0.58 |
| Institutional 2 Class | 1,000.00 | 1,000.00 | 992.70 | 1,022.56 | 2.22 | 2.26 | 0.45 |
| Institutional 3 Class | 1,000.00 | 1,000.00 | 992.80 | 1,022.81 | 1.98 | 2.01 | 0.40 |
| Class R | 1,000.00 | 1,000.00 | 989.30 | 1,019.44 | 5.33 | 5.41 | 1.08 |
Expenses paid during the period are equal to the annualized expense ratio for each class as indicated above, multiplied by the average account value over the period and then multiplied by the number of days in the Fund’s most recent fiscal half year and divided by 365.
Expenses do not include fees and expenses incurred indirectly by the Fund from its investment in underlying funds, including affiliated and non-affiliated pooled investment vehicles, such as mutual funds and exchange-traded funds.
Had Columbia Management Investment Advisers, LLC and/or certain of its affiliates not waived/reimbursed certain fees and expenses, account value at the end of the period would have been reduced.
| 6 | Columbia Large Cap Enhanced Core Fund | Annual Report 2022 |
Portfolio of Investments
February 28, 2022
(Percentages represent value of investments compared to net assets)
Investments in securities
| Common Stocks 97.5% |
| Issuer | Shares | Value ($) |
| Communication Services 9.5% |
| Entertainment 0.4% |
| Activision Blizzard, Inc. | 8,351 | 680,606 |
| Walt Disney Co. (The)(a) | 5,532 | 821,281 |
| Total | | 1,501,887 |
| Interactive Media & Services 6.7% |
| Alphabet, Inc., Class A(a) | 7,205 | 19,461,714 |
| Meta Platforms, Inc., Class A(a) | 37,268 | 7,864,666 |
| Total | | 27,326,380 |
| Media 2.4% |
| Charter Communications, Inc., Class A(a) | 2,907 | 1,749,375 |
| Comcast Corp., Class A | 16,517 | 772,335 |
| Fox Corp., Class A | 33,760 | 1,412,181 |
| Interpublic Group of Companies, Inc. (The) | 80,559 | 2,964,571 |
| Omnicom Group, Inc. | 36,470 | 3,059,468 |
| Total | | 9,957,930 |
| Total Communication Services | 38,786,197 |
| Consumer Discretionary 11.6% |
| Automobiles 1.3% |
| Tesla Motors, Inc.(a) | 5,941 | 5,171,225 |
| Distributors 0.9% |
| Genuine Parts Co. | 17,858 | 2,181,533 |
| LKQ Corp. | 35,988 | 1,689,637 |
| Total | | 3,871,170 |
| Hotels, Restaurants & Leisure 1.4% |
| Darden Restaurants, Inc. | 18,752 | 2,723,165 |
| Expedia Group, Inc.(a) | 8,744 | 1,714,786 |
| McDonald’s Corp. | 5,718 | 1,399,595 |
| Total | | 5,837,546 |
| Household Durables 1.7% |
| Lennar Corp., Class A | 27,321 | 2,455,611 |
| NVR, Inc.(a) | 338 | 1,675,953 |
| PulteGroup, Inc. | 55,888 | 2,775,398 |
| Total | | 6,906,962 |
| Internet & Direct Marketing Retail 3.0% |
| Amazon.com, Inc.(a) | 3,992 | 12,260,470 |
| Common Stocks (continued) |
| Issuer | Shares | Value ($) |
| Specialty Retail 1.7% |
| AutoZone, Inc.(a) | 1,356 | 2,526,757 |
| Home Depot, Inc. (The) | 5,581 | 1,762,647 |
| O’Reilly Automotive, Inc.(a) | 3,839 | 2,492,432 |
| Total | | 6,781,836 |
| Textiles, Apparel & Luxury Goods 1.6% |
| Ralph Lauren Corp. | 16,700 | 2,205,068 |
| Tapestry, Inc. | 53,794 | 2,200,175 |
| Under Armour, Inc., Class A(a) | 112,607 | 2,014,539 |
| Total | | 6,419,782 |
| Total Consumer Discretionary | 47,248,991 |
| Consumer Staples 6.4% |
| Beverages 1.4% |
| Coca-Cola Co. (The) | 89,898 | 5,595,251 |
| Food & Staples Retailing 0.5% |
| Kroger Co. (The) | 23,260 | 1,088,568 |
| Walmart, Inc. | 8,930 | 1,206,979 |
| Total | | 2,295,547 |
| Food Products 0.8% |
| Tyson Foods, Inc., Class A | 34,607 | 3,206,685 |
| Household Products 1.7% |
| Procter & Gamble Co. (The) | 44,655 | 6,961,268 |
| Tobacco 2.0% |
| Altria Group, Inc. | 72,872 | 3,737,605 |
| Philip Morris International, Inc. | 44,565 | 4,504,184 |
| Total | | 8,241,789 |
| Total Consumer Staples | 26,300,540 |
| Energy 3.3% |
| Oil, Gas & Consumable Fuels 3.3% |
| ConocoPhillips Co. | 42,445 | 4,026,333 |
| EOG Resources, Inc. | 19,103 | 2,195,317 |
| Exxon Mobil Corp. | 75,585 | 5,927,375 |
| Occidental Petroleum Corp. | 25,900 | 1,132,607 |
| Total | | 13,281,632 |
| Total Energy | 13,281,632 |
The accompanying Notes to Financial Statements are an integral part of this statement.
Columbia Large Cap Enhanced Core Fund | Annual Report 2022
| 7 |
Portfolio of Investments (continued)
February 28, 2022
| Common Stocks (continued) |
| Issuer | Shares | Value ($) |
| Financials 10.7% |
| Banks 2.8% |
| Bank of America Corp. | 21,678 | 958,168 |
| Citigroup, Inc. | 20,903 | 1,238,085 |
| JPMorgan Chase & Co. | 14,092 | 1,998,245 |
| Wells Fargo & Co. | 94,433 | 5,039,889 |
| Zions Bancorp | 32,010 | 2,269,189 |
| Total | | 11,503,576 |
| Capital Markets 2.3% |
| Cboe Global Markets, Inc. | 20,867 | 2,447,490 |
| Goldman Sachs Group, Inc. (The) | 10,381 | 3,542,932 |
| Morgan Stanley | 39,315 | 3,567,443 |
| Total | | 9,557,865 |
| Consumer Finance 1.6% |
| Capital One Financial Corp. | 21,164 | 3,243,806 |
| Discover Financial Services | 24,883 | 3,071,558 |
| Total | | 6,315,364 |
| Diversified Financial Services 0.9% |
| Berkshire Hathaway, Inc., Class B(a) | 11,252 | 3,616,955 |
| Insurance 3.1% |
| Allstate Corp. (The) | 19,811 | 2,424,074 |
| Aon PLC, Class A | 4,099 | 1,197,482 |
| Marsh & McLennan Companies, Inc. | 22,219 | 3,453,055 |
| MetLife, Inc. | 51,677 | 3,490,781 |
| Prudential Financial, Inc. | 19,738 | 2,203,945 |
| Total | | 12,769,337 |
| Total Financials | 43,763,097 |
| Health Care 13.4% |
| Biotechnology 2.3% |
| AbbVie, Inc. | 28,998 | 4,285,034 |
| Amgen, Inc. | 3,517 | 796,530 |
| Gilead Sciences, Inc. | 10,180 | 614,872 |
| Regeneron Pharmaceuticals, Inc.(a) | 2,039 | 1,260,836 |
| Vertex Pharmaceuticals, Inc.(a) | 10,080 | 2,318,602 |
| Total | | 9,275,874 |
| Common Stocks (continued) |
| Issuer | Shares | Value ($) |
| Health Care Equipment & Supplies 2.7% |
| Abbott Laboratories | 36,596 | 4,414,210 |
| Baxter International, Inc. | 37,273 | 3,167,087 |
| Becton Dickinson and Co. | 13,440 | 3,646,003 |
| Total | | 11,227,300 |
| Health Care Providers & Services 2.6% |
| Anthem, Inc. | 2,309 | 1,043,322 |
| CVS Health Corp. | 40,439 | 4,191,502 |
| McKesson Corp. | 11,916 | 3,276,423 |
| UnitedHealth Group, Inc. | 4,688 | 2,230,879 |
| Total | | 10,742,126 |
| Life Sciences Tools & Services 0.7% |
| IQVIA Holdings, Inc.(a) | 12,951 | 2,980,284 |
| Pharmaceuticals 5.1% |
| Bristol-Myers Squibb Co. | 69,279 | 4,757,389 |
| Eli Lilly & Co. | 5,001 | 1,250,000 |
| Johnson & Johnson | 31,319 | 5,154,168 |
| Merck & Co., Inc. | 59,677 | 4,570,064 |
| Pfizer, Inc. | 105,033 | 4,930,249 |
| Total | | 20,661,870 |
| Total Health Care | 54,887,454 |
| Industrials 8.3% |
| Aerospace & Defense 2.6% |
| General Dynamics Corp. | 15,729 | 3,687,664 |
| Lockheed Martin Corp. | 9,500 | 4,121,100 |
| Textron, Inc. | 38,934 | 2,847,243 |
| Total | | 10,656,007 |
| Air Freight & Logistics 1.0% |
| United Parcel Service, Inc., Class B | 18,783 | 3,952,319 |
| Airlines 0.1% |
| Southwest Airlines Co.(a) | 14,236 | 623,537 |
| Building Products 0.4% |
| Allegion PLC | 14,950 | 1,712,074 |
| Commercial Services & Supplies 0.6% |
| Cintas Corp. | 2,385 | 895,138 |
| Republic Services, Inc. | 12,380 | 1,489,067 |
| Total | | 2,384,205 |
The accompanying Notes to Financial Statements are an integral part of this statement.
| 8 | Columbia Large Cap Enhanced Core Fund | Annual Report 2022 |
Portfolio of Investments (continued)
February 28, 2022
| Common Stocks (continued) |
| Issuer | Shares | Value ($) |
| Electrical Equipment 0.8% |
| Emerson Electric Co. | 33,491 | 3,111,984 |
| Industrial Conglomerates 0.8% |
| Roper Technologies, Inc. | 7,211 | 3,232,114 |
| Machinery 0.6% |
| Snap-On, Inc. | 11,790 | 2,478,022 |
| Road & Rail 1.4% |
| Norfolk Southern Corp. | 7,039 | 1,805,644 |
| Union Pacific Corp. | 16,023 | 3,940,857 |
| Total | | 5,746,501 |
| Total Industrials | 33,896,763 |
| Information Technology 27.3% |
| Communications Equipment 1.3% |
| Cisco Systems, Inc. | 93,232 | 5,199,549 |
| IT Services 3.5% |
| Fidelity National Information Services, Inc. | 27,523 | 2,621,015 |
| Gartner, Inc.(a) | 9,877 | 2,769,708 |
| MasterCard, Inc., Class A | 2,593 | 935,606 |
| VeriSign, Inc.(a) | 12,326 | 2,634,313 |
| Visa, Inc., Class A | 24,612 | 5,319,146 |
| Total | | 14,279,788 |
| Semiconductors & Semiconductor Equipment 5.1% |
| Advanced Micro Devices, Inc.(a) | 30,576 | 3,771,244 |
| KLA Corp. | 2,600 | 906,100 |
| Lam Research Corp. | 5,451 | 3,059,919 |
| NVIDIA Corp. | 18,861 | 4,599,255 |
| QUALCOMM, Inc. | 28,296 | 4,866,629 |
| Teradyne, Inc. | 24,250 | 2,859,560 |
| Texas Instruments, Inc. | 4,751 | 807,622 |
| Total | | 20,870,329 |
| Software 9.9% |
| Adobe, Inc.(a) | 9,089 | 4,250,743 |
| Autodesk, Inc.(a) | 11,355 | 2,500,712 |
| Cadence Design Systems, Inc.(a) | 11,024 | 1,669,364 |
| Fortinet, Inc.(a) | 9,286 | 3,199,213 |
| Common Stocks (continued) |
| Issuer | Shares | Value ($) |
| Intuit, Inc. | 6,827 | 3,238,524 |
| Microsoft Corp.(b) | 86,405 | 25,816,950 |
| Total | | 40,675,506 |
| Technology Hardware, Storage & Peripherals 7.5% |
| Apple, Inc. | 181,535 | 29,975,059 |
| HP, Inc. | 23,579 | 810,175 |
| Total | | 30,785,234 |
| Total Information Technology | 111,810,406 |
| Materials 2.3% |
| Chemicals 1.4% |
| Celanese Corp., Class A | 14,147 | 1,970,394 |
| Dow, Inc. | 47,336 | 2,790,931 |
| LyondellBasell Industries NV, Class A | 11,626 | 1,130,396 |
| Total | | 5,891,721 |
| Metals & Mining 0.9% |
| Nucor Corp. | 27,911 | 3,673,646 |
| Total Materials | 9,565,367 |
| Real Estate 2.4% |
| Equity Real Estate Investment Trusts (REITS) 1.9% |
| Iron Mountain, Inc. | 20,187 | 992,797 |
| Public Storage | 3,280 | 1,164,465 |
| Simon Property Group, Inc. | 21,264 | 2,925,076 |
| Weyerhaeuser Co. | 74,593 | 2,900,176 |
| Total | | 7,982,514 |
| Real Estate Management & Development 0.5% |
| CBRE Group, Inc., Class A(a) | 19,747 | 1,912,497 |
| Total Real Estate | 9,895,011 |
| Utilities 2.3% |
| Electric Utilities 2.3% |
| Duke Energy Corp. | 34,288 | 3,442,858 |
| Evergy, Inc. | 42,052 | 2,624,465 |
| Exelon Corp. | 14,835 | 631,378 |
| NRG Energy, Inc. | 68,501 | 2,592,078 |
| Total | | 9,290,779 |
| Total Utilities | 9,290,779 |
Total Common Stocks
(Cost $249,206,610) | 398,726,237 |
|
The accompanying Notes to Financial Statements are an integral part of this statement.
Columbia Large Cap Enhanced Core Fund | Annual Report 2022
| 9 |
Portfolio of Investments (continued)
February 28, 2022
| Money Market Funds 2.4% |
| | Shares | Value ($) |
| Columbia Short-Term Cash Fund, 0.168%(c),(d) | 10,067,584 | 10,064,564 |
Total Money Market Funds
(Cost $10,065,041) | 10,064,564 |
Total Investments in Securities
(Cost: $259,271,651) | 408,790,801 |
| Other Assets & Liabilities, Net | | 225,808 |
| Net Assets | 409,016,609 |
At February 28, 2022, securities and/or cash totaling $860,515 were pledged as collateral.
Investments in derivatives
| Long futures contracts |
| Description | Number of
contracts | Expiration
date | Trading
currency | Notional
amount | Value/Unrealized
appreciation ($) | Value/Unrealized
depreciation ($) |
| S&P 500 Index E-mini | 9 | 03/2022 | USD | 1,965,600 | 1,440 | — |
| S&P 500 Index E-mini | 39 | 03/2022 | USD | 8,517,600 | — | (222,964) |
| Total | | | | | 1,440 | (222,964) |
Notes to Portfolio of Investments
| (a) | Non-income producing investment. |
| (b) | This security or a portion of this security has been pledged as collateral in connection with derivative contracts. |
| (c) | The rate shown is the seven-day current annualized yield at February 28, 2022. |
| (d) | As defined in the Investment Company Act of 1940, as amended, an affiliated company is one in which the Fund owns 5% or more of the company’s outstanding voting securities, or a company which is under common ownership or control with the Fund. The value of the holdings and transactions in these affiliated companies during the year ended February 28, 2022 are as follows: |
| Affiliated issuers | Beginning
of period($) | Purchases($) | Sales($) | Net change in
unrealized
appreciation
(depreciation)($) | End of
period($) | Realized gain
(loss)($) | Dividends($) | End of
period shares |
| Columbia Short-Term Cash Fund, 0.168% |
| | 7,860,589 | 70,259,515 | (68,054,674) | (866) | 10,064,564 | (655) | 5,002 | 10,067,584 |
Currency Legend
Fair value measurements
The Fund categorizes its fair value measurements according to a three-level hierarchy that maximizes the use of observable inputs and minimizes the use of unobservable inputs by prioritizing that the most observable input be used when available. Observable inputs are those that market participants would use in pricing an investment based on market data obtained from sources independent of the reporting entity. Unobservable inputs are those that reflect the Fund’s assumptions about the information market participants would use in pricing an investment. An investment’s level within the fair value hierarchy is based on the lowest level of any input that is deemed significant to the asset’s or liability’s fair value measurement. The input levels are not necessarily an indication of the risk or liquidity associated with investments at that level. For example, certain U.S. government securities are generally high quality and liquid, however, they are reflected as Level 2 because the inputs used to determine fair value may not always be quoted prices in an active market.
Fair value inputs are summarized in the three broad levels listed below:
| ■ | Level 1 — Valuations based on quoted prices for investments in active markets that the Fund has the ability to access at the measurement date. Valuation adjustments are not applied to Level 1 investments. |
| ■ | Level 2 — Valuations based on other significant observable inputs (including quoted prices for similar securities, interest rates, prepayment speeds, credit risks, etc.). |
| ■ | Level 3 — Valuations based on significant unobservable inputs (including the Fund’s own assumptions and judgment in determining the fair value of investments). |
The accompanying Notes to Financial Statements are an integral part of this statement.
| 10 | Columbia Large Cap Enhanced Core Fund | Annual Report 2022 |
Portfolio of Investments (continued)
February 28, 2022
Fair value measurements (continued)
Inputs that are used in determining fair value of an investment may include price information, credit data, volatility statistics, and other factors. These inputs can be either observable or unobservable. The availability of observable inputs can vary between investments, and is affected by various factors such as the type of investment, and the volume and level of activity for that investment or similar investments in the marketplace. The inputs will be considered by the Investment Manager, along with any other relevant factors in the calculation of an investment’s fair value. The Fund uses prices and inputs that are current as of the measurement date, which may include periods of market dislocations. During these periods, the availability of prices and inputs may be reduced for many investments. This condition could cause an investment to be reclassified between the various levels within the hierarchy.
Investments falling into the Level 3 category are primarily supported by quoted prices from brokers and dealers participating in the market for those investments. However, these may be classified as Level 3 investments due to lack of market transparency and corroboration to support these quoted prices. Additionally, valuation models may be used as the pricing source for any remaining investments classified as Level 3. These models may rely on one or more significant unobservable inputs and/or significant assumptions by the Investment Manager. Inputs used in valuations may include, but are not limited to, financial statement analysis, capital account balances, discount rates and estimated cash flows, and comparable company data.
Under the direction of the Fund’s Board of Trustees (the Board), the Investment Manager’s Valuation Committee (the Committee) is responsible for overseeing the valuation procedures approved by the Board. The Committee consists of voting and non-voting members from various groups within the Investment Manager’s organization, including operations and accounting, trading and investments, compliance, risk management and legal.
The Committee meets at least monthly to review and approve valuation matters, which may include a description of specific valuation determinations, data regarding pricing information received from approved pricing vendors and brokers and the results of Board-approved valuation control policies and procedures (the Policies). The Policies address, among other things, instances when market quotations are or are not readily available, including recommendations of third party pricing vendors and a determination of appropriate pricing methodologies; events that require specific valuation determinations and assessment of fair value techniques; securities with a potential for stale pricing, including those that are illiquid, restricted, or in default; and the effectiveness of third party pricing vendors, including periodic reviews of vendors. The Committee meets more frequently, as needed, to discuss additional valuation matters, which may include the need to review back-testing results, review time-sensitive information or approve related valuation actions. The Committee reports to the Board, with members of the Committee meeting with the Board at each of its regularly scheduled meetings to discuss valuation matters and actions during the period, similar to those described earlier.
The following table is a summary of the inputs used to value the Fund’s investments at February 28, 2022:
| | Level 1 ($) | Level 2 ($) | Level 3 ($) | Total ($) |
| Investments in Securities | | | | |
| Common Stocks | | | | |
| Communication Services | 38,786,197 | — | — | 38,786,197 |
| Consumer Discretionary | 47,248,991 | — | — | 47,248,991 |
| Consumer Staples | 26,300,540 | — | — | 26,300,540 |
| Energy | 13,281,632 | — | — | 13,281,632 |
| Financials | 43,763,097 | — | — | 43,763,097 |
| Health Care | 54,887,454 | — | — | 54,887,454 |
| Industrials | 33,896,763 | — | — | 33,896,763 |
| Information Technology | 111,810,406 | — | — | 111,810,406 |
| Materials | 9,565,367 | — | — | 9,565,367 |
| Real Estate | 9,895,011 | — | — | 9,895,011 |
| Utilities | 9,290,779 | — | — | 9,290,779 |
| Total Common Stocks | 398,726,237 | — | — | 398,726,237 |
| Money Market Funds | 10,064,564 | — | — | 10,064,564 |
| Total Investments in Securities | 408,790,801 | — | — | 408,790,801 |
| Investments in Derivatives | | | | |
| Asset | | | | |
| Futures Contracts | 1,440 | — | — | 1,440 |
| Liability | | | | |
| Futures Contracts | (222,964) | — | — | (222,964) |
| Total | 408,569,277 | — | — | 408,569,277 |
See the Portfolio of Investments for all investment classifications not indicated in the table.
Derivative instruments are valued at unrealized appreciation (depreciation).
The accompanying Notes to Financial Statements are an integral part of this statement.
Columbia Large Cap Enhanced Core Fund | Annual Report 2022
| 11 |
Statement of Assets and Liabilities
February 28, 2022
| Assets | |
| Investments in securities, at value | |
| Unaffiliated issuers (cost $249,206,610) | $398,726,237 |
| Affiliated issuers (cost $10,065,041) | 10,064,564 |
| Cash | 693 |
| Receivable for: | |
| Capital shares sold | 98,390 |
| Dividends | 622,049 |
| Expense reimbursement due from Investment Manager | 13,305 |
| Prepaid expenses | 8,733 |
| Total assets | 409,533,971 |
| Liabilities | |
| Payable for: | |
| Capital shares purchased | 258,970 |
| Variation margin for futures contracts | 28,800 |
| Management services fees | 25,246 |
| Distribution and/or service fees | 3,377 |
| Transfer agent fees | 43,858 |
| Compensation of board members | 134,838 |
| Compensation of chief compliance officer | 68 |
| Other expenses | 22,205 |
| Total liabilities | 517,362 |
| Net assets applicable to outstanding capital stock | $409,016,609 |
| Represented by | |
| Paid in capital | 238,699,834 |
| Total distributable earnings (loss) | 170,316,775 |
| Total - representing net assets applicable to outstanding capital stock | $409,016,609 |
| Class A | |
| Net assets | $61,023,910 |
| Shares outstanding | 2,373,116 |
| Net asset value per share | $25.71 |
| Advisor Class | |
| Net assets | $8,459,403 |
| Shares outstanding | 334,629 |
| Net asset value per share | $25.28 |
| Institutional Class | |
| Net assets | $88,027,546 |
| Shares outstanding | 3,430,747 |
| Net asset value per share | $25.66 |
| Institutional 2 Class | |
| Net assets | $6,628,319 |
| Shares outstanding | 259,825 |
| Net asset value per share | $25.51 |
| Institutional 3 Class | |
| Net assets | $193,328,680 |
| Shares outstanding | 7,528,321 |
| Net asset value per share | $25.68 |
| Class R | |
| Net assets | $51,548,751 |
| Shares outstanding | 2,012,463 |
| Net asset value per share | $25.61 |
The accompanying Notes to Financial Statements are an integral part of this statement.
| 12 | Columbia Large Cap Enhanced Core Fund | Annual Report 2022 |
Statement of Operations
Year Ended February 28, 2022
| Net investment income | |
| Income: | |
| Dividends — unaffiliated issuers | $7,608,205 |
| Dividends — affiliated issuers | 5,002 |
| Total income | 7,613,207 |
| Expenses: | |
| Management services fees | 3,444,662 |
| Distribution and/or service fees | |
| Class A | 160,911 |
| Class R | 292,241 |
| Transfer agent fees | |
| Class A | 119,330 |
| Advisor Class | 15,196 |
| Institutional Class | 169,264 |
| Institutional 2 Class | 4,707 |
| Institutional 3 Class | 14,883 |
| Class R | 108,581 |
| Compensation of board members | 38,495 |
| Custodian fees | 9,881 |
| Printing and postage fees | 20,667 |
| Registration fees | 91,086 |
| Audit fees | 29,500 |
| Legal fees | 16,764 |
| Interest on collateral | 195 |
| Compensation of chief compliance officer | 65 |
| Other | 14,287 |
| Total expenses | 4,550,715 |
| Fees waived or expenses reimbursed by Investment Manager and its affiliates | (1,834,770) |
| Fees waived by transfer agent | |
| Institutional 2 Class | (411) |
| Institutional 3 Class | (9,012) |
| Expense reduction | (40) |
| Total net expenses | 2,706,482 |
| Net investment income | 4,906,725 |
| Realized and unrealized gain (loss) — net | |
| Net realized gain (loss) on: | |
| Investments — unaffiliated issuers | 114,636,524 |
| Investments — affiliated issuers | (655) |
| Futures contracts | 1,632,226 |
| Net realized gain | 116,268,095 |
| Net change in unrealized appreciation (depreciation) on: | |
| Investments — unaffiliated issuers | (28,852,770) |
| Investments — affiliated issuers | (866) |
| Futures contracts | (369,858) |
| Net change in unrealized appreciation (depreciation) | (29,223,494) |
| Net realized and unrealized gain | 87,044,601 |
| Net increase in net assets resulting from operations | $91,951,326 |
The accompanying Notes to Financial Statements are an integral part of this statement.
Columbia Large Cap Enhanced Core Fund | Annual Report 2022
| 13 |
Statement of Changes in Net Assets
| | Year Ended
February 28, 2022 | Year Ended
February 28, 2021 |
| Operations | | |
| Net investment income | $4,906,725 | $5,531,537 |
| Net realized gain | 116,268,095 | 22,648,502 |
| Net change in unrealized appreciation (depreciation) | (29,223,494) | 91,492,066 |
| Net increase in net assets resulting from operations | 91,951,326 | 119,672,105 |
| Distributions to shareholders | | |
| Net investment income and net realized gains | | |
| Class A | (15,720,116) | (4,505,290) |
| Advisor Class | (2,090,505) | (990,442) |
| Institutional Class | (22,298,922) | (6,631,927) |
| Institutional 2 Class | (1,892,219) | (761,560) |
| Institutional 3 Class | (53,752,772) | (18,311,383) |
| Class R | (13,055,006) | (4,161,044) |
| Total distributions to shareholders | (108,809,540) | (35,361,646) |
| Increase (decrease) in net assets from capital stock activity | (61,711,493) | 810,973 |
| Total increase (decrease) in net assets | (78,569,707) | 85,121,432 |
| Net assets at beginning of year | 487,586,316 | 402,464,884 |
| Net assets at end of year | $409,016,609 | $487,586,316 |
The accompanying Notes to Financial Statements are an integral part of this statement.
| 14 | Columbia Large Cap Enhanced Core Fund | Annual Report 2022 |
Statement of Changes in Net Assets (continued)
| | Year Ended | Year Ended |
| | February 28, 2022 | February 28, 2021 |
| | Shares | Dollars ($) | Shares | Dollars ($) |
| Capital stock activity |
| Class A | | | | |
| Subscriptions | 324,168 | 9,387,862 | 280,091 | 6,662,555 |
| Distributions reinvested | 454,796 | 12,508,794 | 158,667 | 3,675,238 |
| Redemptions | (545,889) | (15,786,572) | (740,543) | (18,101,523) |
| Net increase (decrease) | 233,075 | 6,110,084 | (301,785) | (7,763,730) |
| Advisor Class | | | | |
| Subscriptions | 47,974 | 1,440,214 | 67,303 | 1,542,820 |
| Distributions reinvested | 77,442 | 2,090,505 | 43,533 | 990,442 |
| Redemptions | (86,688) | (2,528,250) | (341,527) | (8,253,798) |
| Net increase (decrease) | 38,728 | 1,002,469 | (230,691) | (5,720,536) |
| Institutional Class | | | | |
| Subscriptions | 477,447 | 13,232,520 | 377,887 | 8,820,872 |
| Distributions reinvested | 697,927 | 19,154,056 | 244,043 | 5,661,877 |
| Redemptions | (876,756) | (25,332,187) | (1,709,689) | (37,842,447) |
| Net increase (decrease) | 298,618 | 7,054,389 | (1,087,759) | (23,359,698) |
| Institutional 2 Class | | | | |
| Subscriptions | 67,414 | 1,975,397 | 122,167 | 2,861,702 |
| Distributions reinvested | 67,519 | 1,846,529 | 33,002 | 761,559 |
| Redemptions | (197,380) | (5,849,287) | (335,196) | (7,715,412) |
| Net decrease | (62,447) | (2,027,361) | (180,027) | (4,092,151) |
| Institutional 3 Class | | | | |
| Subscriptions | 700,226 | 20,034,893 | 4,601,237 | 99,913,321 |
| Distributions reinvested | 951,957 | 26,126,306 | 405,751 | 9,469,012 |
| Redemptions | (3,806,575) | (114,838,980) | (2,853,671) | (65,358,220) |
| Net increase (decrease) | (2,154,392) | (68,677,781) | 2,153,317 | 44,024,113 |
| Class R | | | | |
| Subscriptions | 473,731 | 13,757,874 | 658,851 | 16,092,539 |
| Distributions reinvested | 461,727 | 12,684,637 | 168,570 | 3,884,605 |
| Redemptions | (1,060,505) | (31,615,804) | (917,703) | (22,254,169) |
| Net decrease | (125,047) | (5,173,293) | (90,282) | (2,277,025) |
| Total net increase (decrease) | (1,771,465) | (61,711,493) | 262,773 | 810,973 |
The accompanying Notes to Financial Statements are an integral part of this statement.
Columbia Large Cap Enhanced Core Fund | Annual Report 2022
| 15 |
The following table is intended to help you understand the Fund’s financial performance. Certain information reflects financial results for a single share of a class held for the periods shown. Per share net investment income (loss) amounts are calculated based on average shares outstanding during the period. Total return assumes reinvestment of all dividends and distributions, if any. Total return does not reflect payment of sales charges, if any. Total return and portfolio turnover are not annualized for periods of less than one year. The portfolio turnover rate is calculated without regard to purchase and sales transactions of short-term instruments and certain derivatives, if any. If such transactions were included, the Fund’s portfolio turnover rate may be higher.
| | Net asset value,
beginning of
period | Net
investment
income | Net
realized
and
unrealized
gain | Total from
investment
operations | Distributions
from net
investment
income | Distributions
from net
realized
gains | Total
distributions to
shareholders |
| Class A |
| Year Ended 2/28/2022 | $27.58 | 0.25 | 5.49 | 5.74 | (0.26) | (7.35) | (7.61) |
| Year Ended 2/28/2021 | $23.11 | 0.25 | 6.18 | 6.43 | (0.26) | (1.70) | (1.96) |
| Year Ended 2/29/2020 | $23.52 | 0.27 | 0.32 | 0.59 | (0.24) | (0.76) | (1.00) |
| Year Ended 2/28/2019 | $25.12 | 0.28 | 0.69 | 0.97 | (0.24) | (2.33) | (2.57) |
| Year Ended 2/28/2018 | $23.81 | 0.32 | 4.16 | 4.48 | (0.32) | (2.85) | (3.17) |
| Advisor Class |
| Year Ended 2/28/2022 | $27.21 | 0.31 | 5.44 | 5.75 | (0.33) | (7.35) | (7.68) |
| Year Ended 2/28/2021 | $22.83 | 0.31 | 6.09 | 6.40 | (0.32) | (1.70) | (2.02) |
| Year Ended 2/29/2020 | $23.23 | 0.33 | 0.32 | 0.65 | (0.29) | (0.76) | (1.05) |
| Year Ended 2/28/2019 | $24.85 | 0.36 | 0.65 | 1.01 | (0.30) | (2.33) | (2.63) |
| Year Ended 2/28/2018 | $23.58 | 0.37 | 4.13 | 4.50 | (0.38) | (2.85) | (3.23) |
| Institutional Class |
| Year Ended 2/28/2022 | $27.53 | 0.32 | 5.49 | 5.81 | (0.33) | (7.35) | (7.68) |
| Year Ended 2/28/2021 | $23.07 | 0.31 | 6.17 | 6.48 | (0.32) | (1.70) | (2.02) |
| Year Ended 2/29/2020 | $23.47 | 0.32 | 0.33 | 0.65 | (0.29) | (0.76) | (1.05) |
| Year Ended 2/28/2019 | $25.07 | 0.34 | 0.69 | 1.03 | (0.30) | (2.33) | (2.63) |
| Year Ended 2/28/2018 | $23.77 | 0.38 | 4.15 | 4.53 | (0.38) | (2.85) | (3.23) |
| Institutional 2 Class |
| Year Ended 2/28/2022 | $27.40 | 0.36 | 5.48 | 5.84 | (0.38) | (7.35) | (7.73) |
| Year Ended 2/28/2021 | $22.97 | 0.34 | 6.14 | 6.48 | (0.35) | (1.70) | (2.05) |
| Year Ended 2/29/2020 | $23.37 | 0.35 | 0.32 | 0.67 | (0.31) | (0.76) | (1.07) |
| Year Ended 2/28/2019 | $24.98 | 0.37 | 0.68 | 1.05 | (0.33) | (2.33) | (2.66) |
| Year Ended 2/28/2018 | $23.69 | 0.40 | 4.14 | 4.54 | (0.40) | (2.85) | (3.25) |
| Institutional 3 Class |
| Year Ended 2/28/2022 | $27.54 | 0.37 | 5.51 | 5.88 | (0.39) | (7.35) | (7.74) |
| Year Ended 2/28/2021 | $23.08 | 0.35 | 6.17 | 6.52 | (0.36) | (1.70) | (2.06) |
| Year Ended 2/29/2020 | $23.47 | 0.38 | 0.31 | 0.69 | (0.32) | (0.76) | (1.08) |
| Year Ended 2/28/2019 | $25.07 | 0.38 | 0.69 | 1.07 | (0.34) | (2.33) | (2.67) |
| Year Ended 2/28/2018 | $23.77 | 0.44 | 4.13 | 4.57 | (0.42) | (2.85) | (3.27) |
The accompanying Notes to Financial Statements are an integral part of this statement.
| 16 | Columbia Large Cap Enhanced Core Fund | Annual Report 2022 |
Financial Highlights (continued)
| | Net
asset
value,
end of
period | Total
return | Total gross
expense
ratio to
average
net assets(a) | Total net
expense
ratio to
average
net assets(a),(b) | Net investment
income
ratio to
average
net assets | Portfolio
turnover | Net
assets,
end of
period
(000’s) |
| Class A |
| Year Ended 2/28/2022 | $25.71 | 20.15% | 1.23%(c) | 0.84%(c),(d) | 0.83% | 67% | $61,024 |
| Year Ended 2/28/2021 | $27.58 | 29.53% | 1.25%(c) | 0.85%(c),(d) | 1.02% | 81% | $59,015 |
| Year Ended 2/29/2020 | $23.11 | 2.33% | 1.20% | 0.88%(d) | 1.11% | 77% | $56,439 |
| Year Ended 2/28/2019 | $23.52 | 4.14% | 1.21% | 0.89% | 1.17% | 99% | $75,497 |
| Year Ended 2/28/2018 | $25.12 | 19.81% | 1.23% | 0.89% | 1.31% | 70% | $60,502 |
| Advisor Class |
| Year Ended 2/28/2022 | $25.28 | 20.50% | 0.98%(c) | 0.58%(c),(d) | 1.08% | 67% | $8,459 |
| Year Ended 2/28/2021 | $27.21 | 29.79% | 1.00%(c) | 0.61%(c),(d) | 1.29% | 81% | $8,052 |
| Year Ended 2/29/2020 | $22.83 | 2.60% | 0.95% | 0.63%(d) | 1.38% | 77% | $12,021 |
| Year Ended 2/28/2019 | $23.23 | 4.38% | 0.96% | 0.64% | 1.53% | 99% | $5,222 |
| Year Ended 2/28/2018 | $24.85 | 20.12% | 0.98% | 0.64% | 1.48% | 70% | $663 |
| Institutional Class |
| Year Ended 2/28/2022 | $25.66 | 20.49% | 0.98%(c) | 0.59%(c),(d) | 1.08% | 67% | $88,028 |
| Year Ended 2/28/2021 | $27.53 | 29.83% | 1.00%(c) | 0.60%(c),(d) | 1.27% | 81% | $86,219 |
| Year Ended 2/29/2020 | $23.07 | 2.58% | 0.94% | 0.63%(d) | 1.34% | 77% | $97,348 |
| Year Ended 2/28/2019 | $23.47 | 4.42% | 0.96% | 0.64% | 1.41% | 99% | $329,587 |
| Year Ended 2/28/2018 | $25.07 | 20.08% | 0.98% | 0.64% | 1.56% | 70% | $260,985 |
| Institutional 2 Class |
| Year Ended 2/28/2022 | $25.51 | 20.67% | 0.85%(c) | 0.45%(c) | 1.21% | 67% | $6,628 |
| Year Ended 2/28/2021 | $27.40 | 29.96% | 0.86%(c) | 0.48%(c) | 1.40% | 81% | $8,831 |
| Year Ended 2/29/2020 | $22.97 | 2.66% | 0.85% | 0.54% | 1.46% | 77% | $11,538 |
| Year Ended 2/28/2019 | $23.37 | 4.50% | 0.87% | 0.54% | 1.56% | 99% | $26,349 |
| Year Ended 2/28/2018 | $24.98 | 20.20% | 0.87% | 0.55% | 1.63% | 70% | $11,486 |
| Institutional 3 Class |
| Year Ended 2/28/2022 | $25.68 | 20.73% | 0.80%(c) | 0.40%(c) | 1.25% | 67% | $193,329 |
| Year Ended 2/28/2021 | $27.54 | 30.01% | 0.81%(c) | 0.43%(c) | 1.44% | 81% | $266,693 |
| Year Ended 2/29/2020 | $23.08 | 2.73% | 0.81% | 0.49% | 1.59% | 77% | $173,757 |
| Year Ended 2/28/2019 | $23.47 | 4.58% | 0.81% | 0.49% | 1.61% | 99% | $55,689 |
| Year Ended 2/28/2018 | $25.07 | 20.24% | 0.82% | 0.50% | 1.77% | 70% | $28,180 |
The accompanying Notes to Financial Statements are an integral part of this statement.
Columbia Large Cap Enhanced Core Fund | Annual Report 2022
| 17 |
Financial Highlights (continued)
| | Net asset value,
beginning of
period | Net
investment
income | Net
realized
and
unrealized
gain | Total from
investment
operations | Distributions
from net
investment
income | Distributions
from net
realized
gains | Total
distributions to
shareholders |
| Class R |
| Year Ended 2/28/2022 | $27.50 | 0.17 | 5.47 | 5.64 | (0.18) | (7.35) | (7.53) |
| Year Ended 2/28/2021 | $23.05 | 0.19 | 6.16 | 6.35 | (0.20) | (1.70) | (1.90) |
| Year Ended 2/29/2020 | $23.48 | 0.21 | 0.31 | 0.52 | (0.19) | (0.76) | (0.95) |
| Year Ended 2/28/2019 | $25.08 | 0.22 | 0.69 | 0.91 | (0.18) | (2.33) | (2.51) |
| Year Ended 2/28/2018 | $23.78 | 0.26 | 4.15 | 4.41 | (0.26) | (2.85) | (3.11) |
| Notes to Financial Highlights |
| (a) | In addition to the fees and expenses that the Fund bears directly, the Fund indirectly bears a pro rata share of the fees and expenses of any other funds in which it invests. Such indirect expenses are not included in the Fund’s reported expense ratios. |
| (b) | Total net expenses include the impact of certain fee waivers/expense reimbursements made by the Investment Manager and certain of its affiliates, if applicable. |
| (c) | Ratios include interest on collateral expense which is less than 0.01%. |
| (d) | The benefits derived from expense reductions had an impact of less than 0.01%. |
The accompanying Notes to Financial Statements are an integral part of this statement.
| 18 | Columbia Large Cap Enhanced Core Fund | Annual Report 2022 |
Financial Highlights (continued)
| | Net
asset
value,
end of
period | Total
return | Total gross
expense
ratio to
average
net assets(a) | Total net
expense
ratio to
average
net assets(a),(b) | Net investment
income
ratio to
average
net assets | Portfolio
turnover | Net
assets,
end of
period
(000’s) |
| Class R |
| Year Ended 2/28/2022 | $25.61 | 19.85% | 1.48%(c) | 1.09%(c),(d) | 0.57% | 67% | $51,549 |
| Year Ended 2/28/2021 | $27.50 | 29.22% | 1.50%(c) | 1.10%(c),(d) | 0.77% | 81% | $58,775 |
| Year Ended 2/29/2020 | $23.05 | 2.04% | 1.45% | 1.13%(d) | 0.86% | 77% | $51,362 |
| Year Ended 2/28/2019 | $23.48 | 3.88% | 1.46% | 1.14% | 0.93% | 99% | $53,131 |
| Year Ended 2/28/2018 | $25.08 | 19.51% | 1.48% | 1.14% | 1.06% | 70% | $38,251 |
The accompanying Notes to Financial Statements are an integral part of this statement.
Columbia Large Cap Enhanced Core Fund | Annual Report 2022
| 19 |
Notes to Financial Statements
February 28, 2022
Note 1. Organization
Columbia Large Cap Enhanced Core Fund (the Fund), a series of Columbia Funds Series Trust (the Trust), is a diversified fund. The Trust is registered under the Investment Company Act of 1940, as amended (the 1940 Act), as an open-end management investment company organized as a Delaware statutory trust.
Fund shares
The Trust may issue an unlimited number of shares (without par value). The Fund offers each of the share classes listed in the Statement of Assets and Liabilities. Although all share classes generally have identical voting, dividend and liquidation rights, each share class votes separately when required by the Trust’s organizational documents or by law. Each share class has its own expense and sales charge structure. Different share classes may have different minimum initial investment amounts and pay different net investment income distribution amounts to the extent the expenses of distributing such share classes vary. Distributions to shareholders in a liquidation will be proportional to the net asset value of each share class.
As described in the Fund’s prospectus, Class A shares are offered to the general public for investment. Advisor Class, Institutional Class, Institutional 2 Class, Institutional 3 Class and Class R shares are available for purchase through authorized investment professionals to omnibus retirement plans or to institutional investors and to certain other investors as also described in the Fund’s prospectus.
Note 2. Summary of significant accounting policies
Basis of preparation
The Fund is an investment company that applies the accounting and reporting guidance in the Financial Accounting Standards Board (FASB) Accounting Standards Codification Topic 946, Financial Services - Investment Companies (ASC 946). The financial statements are prepared in accordance with U.S. generally accepted accounting principles (GAAP), which requires management to make certain estimates and assumptions that affect the reported amounts of assets and liabilities, the disclosure of contingent assets and liabilities at the date of the financial statements and the reported amounts of income and expenses during the reporting period. Actual results could differ from those estimates.
The following is a summary of significant accounting policies followed by the Fund in the preparation of its financial statements.
Security valuation
Equity securities listed on an exchange are valued at the closing price or last trade price on their primary exchange at the close of business of the New York Stock Exchange. Securities with a closing price not readily available or not listed on any exchange are valued at the mean between the closing bid and ask prices. Listed preferred stocks convertible into common stocks are valued using an evaluated price from a pricing service.
Foreign equity securities are valued based on the closing price or last trade price on their primary exchange at the close of business of the New York Stock Exchange. If any foreign equity security closing prices are not readily available, the securities are valued at the mean of the latest quoted bid and ask prices on such exchanges or markets. Foreign currency exchange rates are determined at the scheduled closing time of the New York Stock Exchange. Many securities markets and exchanges outside the U.S. close prior to the close of the New York Stock Exchange; therefore, the closing prices for securities in such markets or on such exchanges may not fully reflect events that occur after such close but before the close of the New York Stock Exchange. In those situations, foreign securities will be fair valued pursuant to a policy adopted by the Board of Trustees. Under the policy, the Fund may utilize a third-party pricing service to determine these fair values. The third-party pricing service takes into account multiple factors, including, but not limited to, movements in the U.S. securities markets, certain depositary receipts, futures contracts and foreign exchange rates that have occurred subsequent to the close of the foreign exchange or market, to determine a good faith estimate that reasonably reflects the current market conditions as of the close of the New York Stock Exchange. The fair value of a security is likely to be different from the quoted or published price, if available.
Investments in open-end investment companies (other than exchange-traded funds (ETFs)), are valued at the latest net asset value reported by those companies as of the valuation time.
| 20 | Columbia Large Cap Enhanced Core Fund | Annual Report 2022 |
Notes to Financial Statements (continued)
February 28, 2022
Futures and options on futures contracts are valued based upon the settlement price at the close of regular trading on their principal exchanges or, in the absence of a settlement price, at the mean of the latest quoted bid and ask prices.
Investments for which market quotations are not readily available, or that have quotations which management believes are not reflective of market value or reliable, are valued at fair value as determined in good faith under procedures approved by and under the general supervision of the Board of Trustees. If a security or class of securities (such as foreign securities) is valued at fair value, such value is likely to be different from the quoted or published price for the security, if available.
The determination of fair value often requires significant judgment. To determine fair value, management may use assumptions including but not limited to future cash flows and estimated risk premiums. Multiple inputs from various sources may be used to determine fair value.
GAAP requires disclosure regarding the inputs and valuation techniques used to measure fair value and any changes in valuation inputs or techniques. In addition, investments shall be disclosed by major category. This information is disclosed following the Fund’s Portfolio of Investments.
Derivative instruments
The Fund invests in certain derivative instruments, as detailed below, in seeking to meet its investment objectives. Derivatives are instruments whose values depend on, or are derived from, in whole or in part, the value of one or more securities, currencies, commodities, indices, or other assets or instruments. Derivatives may be used to increase investment flexibility (including to maintain cash reserves while maintaining desired exposure to certain assets), for risk management (hedging) purposes, to facilitate trading, to reduce transaction costs and to pursue higher investment returns. The Fund may also use derivative instruments to mitigate certain investment risks, such as foreign currency exchange rate risk, interest rate risk and credit risk. Derivatives may involve various risks, including the potential inability of the counterparty to fulfill its obligations under the terms of the contract, the potential for an illiquid secondary market (making it difficult for the Fund to sell or terminate, including at favorable prices) and the potential for market movements which may expose the Fund to gains or losses in excess of the amount shown in the Statement of Assets and Liabilities. The notional amounts of derivative instruments, if applicable, are not recorded in the financial statements.
A derivative instrument may suffer a marked-to-market loss if the value of the contract decreases due to an unfavorable change in the market rates or values of the underlying instrument. Losses can also occur if the counterparty does not perform its obligations under the contract. The Fund’s risk of loss from counterparty credit risk on over-the-counter derivatives is generally limited to the aggregate unrealized gain netted against any collateral held by the Fund and the amount of any variation margin held by the counterparty, plus any replacement costs or related amounts. With exchange-traded or centrally cleared derivatives, there is reduced counterparty credit risk to the Fund since the clearinghouse or central counterparty (CCP) provides some protection in the case of clearing member default. The clearinghouse or CCP stands between the buyer and the seller of the contract; therefore, failure of the clearinghouse or CCP may pose additional counterparty credit risk. However, credit risk still exists in exchange-traded or centrally cleared derivatives with respect to initial and variation margin that is held in a broker’s customer account. While clearing brokers are required to segregate customer margin from their own assets, in the event that a clearing broker becomes insolvent or goes into bankruptcy and at that time there is a shortfall in the aggregate amount of margin held by the clearing broker for all its clients and such shortfall is remedied by the CCP or otherwise, U.S. bankruptcy laws will typically allocate that shortfall on a pro-rata basis across all the clearing broker’s customers (including the Fund), potentially resulting in losses to the Fund.
In order to better define its contractual rights and to secure rights that will help the Fund mitigate its counterparty risk, the Fund may enter into an International Swaps and Derivatives Association, Inc. Master Agreement (ISDA Master Agreement) or similar agreement with its derivatives counterparties. An ISDA Master Agreement is an agreement between the Fund and a counterparty that governs over-the-counter derivatives and foreign exchange forward contracts and contains, among other things, collateral posting terms and netting provisions in the event of a default and/or termination event. Under an ISDA Master Agreement, the Fund may, under certain circumstances, offset with the counterparty certain derivative instruments’ payables and/or receivables with collateral held and/or posted and create one single net payment. The provisions of the ISDA Master Agreement typically permit a single net payment in the event of default (close-out netting), including the bankruptcy or insolvency of the counterparty. Note, however, that bankruptcy or insolvency laws of a particular jurisdiction may impose restrictions on or prohibitions against the right of offset or netting in bankruptcy, insolvency or other events.
Columbia Large Cap Enhanced Core Fund | Annual Report 2022
| 21 |
Notes to Financial Statements (continued)
February 28, 2022
Collateral (margin) requirements differ by type of derivative. Margin requirements are established by the clearinghouse or CCP for exchange-traded and centrally cleared derivatives. Brokers can ask for margin in excess of the minimum in certain circumstances. Collateral terms for most over-the-counter derivatives are subject to regulatory requirements to exchange variation margin with trading counterparties and may have contract specific margin terms as well. For over-the-counter derivatives traded under an ISDA Master Agreement, the collateral requirements are typically calculated by netting the marked-to-market amount for each transaction under such agreement and comparing that amount to the value of any variation margin currently pledged by the Fund and/or the counterparty. Generally, the amount of collateral due from or to a party has to exceed a minimum transfer amount threshold (e.g., $250,000) before a transfer has to be made. To the extent amounts due to the Fund from its counterparties are not fully collateralized, contractually or otherwise, the Fund bears the risk of loss from counterparty nonperformance. The Fund may also pay interest expense on cash collateral received from the broker. Any interest expense paid by the Fund is shown on the Statement of Operations. The Fund attempts to mitigate counterparty risk by only entering into agreements with counterparties that it believes have the financial resources to honor their obligations and by monitoring the financial stability of those counterparties.
Certain ISDA Master Agreements allow counterparties of over-the-counter derivatives transactions to terminate derivatives contracts prior to maturity in the event the Fund’s net asset value declines by a stated percentage over a specified time period or if the Fund fails to meet certain terms of the ISDA Master Agreement, which would cause the Fund to accelerate payment of any net liability owed to the counterparty. The Fund also has termination rights if the counterparty fails to meet certain terms of the ISDA Master Agreement. In determining whether to exercise such termination rights, the Fund would consider, in addition to counterparty credit risk, whether termination would result in a net liability owed from the counterparty.
For financial reporting purposes, the Fund does not offset derivative assets and derivative liabilities that are subject to netting arrangements in the Statement of Assets and Liabilities.
Futures contracts
Futures contracts are exchange-traded and represent commitments for the future purchase or sale of an asset at a specified price on a specified date. The Fund bought and sold futures contracts to maintain appropriate equity market exposure while keeping sufficient cash to accommodate daily redemptions. These instruments may be used for other purposes in future periods. Upon entering into futures contracts, the Fund bears risks that it may not achieve the anticipated benefits of the futures contracts and may realize a loss. Additional risks include counterparty credit risk, the possibility of an illiquid market, and that a change in the value of the contract or option may not correlate with changes in the value of the underlying asset.
Upon entering into a futures contract, the Fund deposits cash or securities with the broker, known as a futures commission merchant (FCM), in an amount sufficient to meet the initial margin requirement. The initial margin deposit must be maintained at an established level over the life of the contract. Cash deposited as initial margin is recorded in the Statement of Assets and Liabilities as margin deposits. Securities deposited as initial margin are designated in the Portfolio of Investments. Subsequent payments (variation margin) are made or received by the Fund each day. The variation margin payments are equal to the daily change in the contract value and are recorded as variation margin receivable or payable and are offset in unrealized gains or losses. The Fund generally expects to earn interest income on its margin deposits. The Fund recognizes a realized gain or loss when the contract is closed or expires. Futures contracts involve, to varying degrees, risk of loss in excess of the variation margin disclosed in the Statement of Assets and Liabilities.
Effects of derivative transactions in the financial statements
The following tables are intended to provide additional information about the effect of derivatives on the financial statements of the Fund, including: the fair value of derivatives by risk category and the location of those fair values in the Statement of Assets and Liabilities; and the impact of derivative transactions over the period in the Statement of Operations, including realized and unrealized gains (losses). The derivative instrument schedules following the Portfolio of Investments present additional information regarding derivative instruments outstanding at the end of the period, if any.
| 22 | Columbia Large Cap Enhanced Core Fund | Annual Report 2022 |
Notes to Financial Statements (continued)
February 28, 2022
The following table is a summary of the fair value of derivative instruments (not considered to be hedging instruments for accounting disclosure purposes) at February 28, 2022:
| | Asset derivatives | |
Risk exposure
category | Statement
of assets and liabilities
location | Fair value ($) |
| Equity risk | Component of total distributable earnings (loss) — unrealized appreciation on futures contracts | 1,440* |
| | Liability derivatives | |
Risk exposure
category | Statement
of assets and liabilities
location | Fair value ($) |
| Equity risk | Component of total distributable earnings (loss) — unrealized depreciation on futures contracts | 222,964* |
| * | Includes cumulative appreciation (depreciation) as reported in the tables following the Portfolio of Investments. Only the current day’s variation margin is reported in receivables or payables in the Statement of Assets and Liabilities. |
The following table indicates the effect of derivative instruments (not considered to be hedging instruments for accounting disclosure purposes) in the Statement of Operations for the year ended February 28, 2022:
| Amount of realized gain (loss) on derivatives recognized in income |
| Risk exposure category | | | | | | Futures
contracts
($) |
| Equity risk | | | | | | 1,632,226 |
| |
| Change in unrealized appreciation (depreciation) on derivatives recognized in income |
| Risk exposure category | | | | | | Futures
contracts
($) |
| Equity risk | | | | | | (369,858) |
The following table is a summary of the average outstanding volume by derivative instrument for the year ended February 28, 2022:
| Derivative instrument | Average notional
amounts ($)* |
| Futures contracts — long | 6,742,090 |
| * | Based on the ending quarterly outstanding amounts for the year ended February 28, 2022. |
Security transactions
Security transactions are accounted for on the trade date. Cost is determined and gains (losses) are based upon the specific identification method for both financial statement and federal income tax purposes.
Income recognition
Corporate actions and dividend income are generally recorded net of any non-reclaimable tax withholdings, on the ex-dividend date or upon receipt of an ex-dividend notification in the case of certain foreign securities.
The Fund may receive distributions from holdings in equity securities, business development companies (BDCs), exchange-traded funds (ETFs), limited partnerships (LPs), other regulated investment companies (RICs), and real estate investment trusts (REITs), which report information as to the tax character of their distributions annually. These distributions are allocated to dividend income, capital gain and return of capital based on actual information reported. Return of capital is recorded as a reduction of the cost basis of securities held. If the Fund no longer owns the applicable securities, return of capital is recorded as a realized gain. With respect to REITs, to the extent actual information has not yet been reported, estimates for return of capital are made by Columbia Management Investment Advisers, LLC (the Investment Manager), a wholly-owned subsidiary of Ameriprise Financial, Inc. (Ameriprise Financial). The Investment Manager’s estimates are
Columbia Large Cap Enhanced Core Fund | Annual Report 2022
| 23 |
Notes to Financial Statements (continued)
February 28, 2022
subsequently adjusted when the actual character of the distributions is disclosed by the REITs, which could result in a proportionate change in return of capital to shareholders.
Awards from class action litigation are recorded as a reduction of cost basis if the Fund still owns the applicable securities on the payment date. If the Fund no longer owns the applicable securities on the payment date, the proceeds are recorded as realized gains.
Expenses
General expenses of the Trust are allocated to the Fund and other funds of the Trust based upon relative net assets or other expense allocation methodologies determined by the nature of the expense. Expenses directly attributable to the Fund are charged to the Fund. Expenses directly attributable to a specific class of shares are charged to that share class.
Determination of class net asset value
All income, expenses (other than class-specific expenses, which are charged to that share class, as shown in the Statement of Operations) and realized and unrealized gains (losses) are allocated to each class of the Fund on a daily basis, based on the relative net assets of each class, for purposes of determining the net asset value of each class.
Federal income tax status
The Fund intends to qualify each year as a regulated investment company under Subchapter M of the Internal Revenue Code, as amended, and will distribute substantially all of its investment company taxable income and net capital gain, if any, for its tax year, and as such will not be subject to federal income taxes. In addition, the Fund intends to distribute in each calendar year substantially all of its ordinary income, capital gain net income and certain other amounts, if any, such that the Fund should not be subject to federal excise tax. Therefore, no federal income or excise tax provision is recorded.
Distributions to shareholders
Distributions from net investment income, if any, are declared and paid semi-annually. Net realized capital gains, if any, are distributed at least annually. Income distributions and capital gain distributions are determined in accordance with federal income tax regulations, which may differ from GAAP.
Guarantees and indemnifications
Under the Trust’s organizational documents and, in some cases, by contract, its officers and trustees are indemnified against certain liabilities arising out of the performance of their duties to the Trust or its funds. In addition, certain of the Fund’s contracts with its service providers contain general indemnification clauses. The Fund’s maximum exposure under these arrangements is unknown since the amount of any future claims that may be made against the Fund cannot be determined, and the Fund has no historical basis for predicting the likelihood of any such claims.
Note 3. Fees and other transactions with affiliates
Management services fees
The Fund has entered into a Management Agreement with Columbia Management Investment Advisers, LLC (the Investment Manager), a wholly-owned subsidiary of Ameriprise Financial, Inc. (Ameriprise Financial). Under the Management Agreement, the Investment Manager provides the Fund with investment research and advice, as well as administrative and accounting services. The management services fee is an annual fee that is equal to a percentage of the Fund’s daily net assets that declines from 0.75% to 0.55% as the Fund’s net assets increase. The effective management services fee rate for the year ended February 28, 2022 was 0.75% of the Fund’s average daily net assets.
Compensation of board members
Members of the Board of Trustees who are not officers or employees of the Investment Manager or Ameriprise Financial are compensated for their services to the Fund as disclosed in the Statement of Operations. Under a Deferred Compensation Plan (the Deferred Plan), these members of the Board of Trustees may elect to defer payment of up to 100% of their compensation. Deferred amounts are treated as though equivalent dollar amounts had been invested in shares of certain
| 24 | Columbia Large Cap Enhanced Core Fund | Annual Report 2022 |
Notes to Financial Statements (continued)
February 28, 2022
funds managed by the Investment Manager. The Fund’s liability for these amounts is adjusted for market value changes and remains in the Fund until distributed in accordance with the Deferred Plan. All amounts payable under the Deferred Plan constitute a general unsecured obligation of the Fund. The expense for the Deferred Plan, which includes Trustees’ fees deferred during the current period as well as any gains or losses on the Trustees’ deferred compensation balances as a result of market fluctuations, is included in "Compensation of board members" on the Statement of Operations.
Compensation of Chief Compliance Officer
The Board of Trustees has appointed a Chief Compliance Officer for the Fund in accordance with federal securities regulations. As disclosed in the Statement of Operations, a portion of the Chief Compliance Officer’s total compensation is allocated to the Fund, along with other allocations to affiliated registered investment companies managed by the Investment Manager and its affiliates, based on relative net assets.
Transfer agency fees
Under a Transfer and Dividend Disbursing Agent Agreement, Columbia Management Investment Services Corp. (the Transfer Agent), an affiliate of the Investment Manager and a wholly-owned subsidiary of Ameriprise Financial, is responsible for providing transfer agency services to the Fund. The Transfer Agent has contracted with DST Asset Manager Solutions, Inc. (DST) to serve as sub-transfer agent. The Transfer Agent pays the fees of DST for services as sub-transfer agent and DST is not entitled to reimbursement for such fees from the Fund (with the exception of out-of-pocket fees).
The Fund pays the Transfer Agent a monthly transfer agency fee based on the number or the average value of accounts, depending on the type of account. In addition, the Fund pays the Transfer Agent a fee for shareholder services based on the number of accounts or on a percentage of the average aggregate value of the Fund’s shares maintained in omnibus accounts up to the lesser of the amount charged by the financial intermediary or a cap established by the Board of Trustees from time to time.
The Transfer Agent also receives compensation from the Fund for various shareholder services and reimbursements for certain out-of-pocket fees. Total transfer agency fees for Institutional 2 Class and Institutional 3 Class shares are subject to an annual limitation of not more than 0.07% and 0.02%, respectively, of the average daily net assets attributable to each share class. In addition, effective July 1, 2021 through June 30, 2022, Institutional 2 Class shares are subject to a contractual transfer agency fee annual limitation of not more than 0.05% and Institutional 3 Class shares are subject to a contractual transfer agency fee annual limitation of not more than 0.00% of the average daily net assets attributable to each share class.
For the year ended February 28, 2022, the Fund’s effective transfer agency fee rates as a percentage of average daily net assets of each class were as follows:
| | Effective rate (%) |
| Class A | 0.19 |
| Advisor Class | 0.19 |
| Institutional Class | 0.19 |
| Institutional 2 Class | 0.05 |
| Institutional 3 Class | 0.00 |
| Class R | 0.19 |
An annual minimum account balance fee of $20 may apply to certain accounts with a value below the applicable share class’s initial minimum investment requirements to reduce the impact of small accounts on transfer agency fees. These minimum account balance fees are remitted to the Fund and recorded as part of expense reductions in the Statement of Operations. For the year ended February 28, 2022, these minimum account balance fees reduced total expenses of the Fund by $40.
Columbia Large Cap Enhanced Core Fund | Annual Report 2022
| 25 |
Notes to Financial Statements (continued)
February 28, 2022
Distribution and service fees
The Fund has entered into an agreement with Columbia Management Investment Distributors, Inc. (the Distributor), an affiliate of the Investment Manager and a wholly-owned subsidiary of Ameriprise Financial, for distribution and shareholder services. The Board of Trustees has approved, and the Fund has adopted, distribution and shareholder service plans (the Plans) applicable to certain share classes, which set the distribution and service fees for the Fund. These fees are calculated daily and are intended to compensate the Distributor and/or eligible selling and/or servicing agents for selling shares of the Fund and providing services to investors.
Under the Plans, the Fund pays a monthly combined distribution and service fee to the Distributor at the maximum annual rate of 0.25% of the average daily net assets attributable to Class A shares of the Fund. Also under the Plans, the Fund pays a monthly distribution fee to the Distributor at the maximum annual rate of 0.50% of the average daily net assets attributable to Class R shares of the Fund.
Expenses waived/reimbursed by the Investment Manager and its affiliates
The Investment Manager and certain of its affiliates have contractually agreed to waive fees and/or reimburse expenses (excluding certain fees and expenses described below) for the period(s) disclosed below, unless sooner terminated at the sole discretion of the Board of Trustees, so that the Fund’s net operating expenses, after giving effect to fees waived/expenses reimbursed and any balance credits and/or overdraft charges from the Fund’s custodian, do not exceed the following annual rate(s) as a percentage of the classes’ average daily net assets:
| | Fee rate(s) contractual
through
June 30, 2022 |
| Class A | 0.84% |
| Advisor Class | 0.59 |
| Institutional Class | 0.59 |
| Institutional 2 Class | 0.45 |
| Institutional 3 Class | 0.40 |
| Class R | 1.09 |
Under the agreement governing these fee waivers and/or expense reimbursement arrangements, the following fees and expenses are excluded from the waiver/reimbursement commitment, and therefore will be paid by the Fund, if applicable: taxes (including foreign transaction taxes), expenses associated with investments in affiliated and non-affiliated pooled investment vehicles (including mutual funds and exchange-traded funds), transaction costs and brokerage commissions, costs related to any securities lending program, dividend expenses associated with securities sold short, inverse floater program fees and expenses, transaction charges and interest on borrowed money, interest, costs associated with shareholder meetings, infrequent and/or unusual expenses and any other expenses the exclusion of which is specifically approved by the Board of Trustees. This agreement may be modified or amended only with approval from the Investment Manager, certain of its affiliates and the Fund. Reflected in the contractual cap commitment, effective July 1, 2021 through June 30, 2022, is the Transfer Agent’s contractual agreement to limit total transfer agency fees to an annual rate of not more than 0.05% for Institutional 2 Class and 0.00% for Institutional 3 Class of the average daily net assets attributable to each share class, unless sooner terminated at the sole discretion of the Board of Trustees. Any fees waived and/or expenses reimbursed under the expense reimbursement arrangements described above are not recoverable by the Investment Manager or its affiliates in future periods.
Note 4. Federal tax information
The timing and character of income and capital gain distributions are determined in accordance with income tax regulations, which may differ from GAAP because of temporary or permanent book to tax differences.
| 26 | Columbia Large Cap Enhanced Core Fund | Annual Report 2022 |
Notes to Financial Statements (continued)
February 28, 2022
At February 28, 2022, these differences were primarily due to differing treatment for deferral/reversal of wash sale losses, trustees’ deferred compensation, derivative investments, tax straddles, re-characterization of distributions for investments and earnings and profits distributed to shareholders on the redemption of shares. To the extent these differences were permanent, reclassifications were made among the components of the Fund’s net assets. Temporary differences do not require reclassifications.
The following reclassifications were made:
Undistributed net
investment
income ($) | Accumulated
net realized
gain ($) | Paid in
capital ($) |
| (420,055) | (11,142,743) | 11,562,798 |
Net investment income (loss) and net realized gains (losses), as disclosed in the Statement of Operations, and net assets were not affected by this reclassification.
The tax character of distributions paid during the years indicated was as follows:
| Year Ended February 28, 2022 | Year Ended February 28, 2021 |
Ordinary
income ($) | Long-term
capital gains ($) | Total ($) | Ordinary
income ($) | Long-term
capital gains ($) | Total ($) |
| 39,316,763 | 69,492,777 | 108,809,540 | 6,043,108 | 29,318,538 | 35,361,646 |
Short-term capital gain distributions, if any, are considered ordinary income distributions for tax purposes.
At February 28, 2022, the components of distributable earnings on a tax basis were as follows:
Undistributed
ordinary income ($) | Undistributed
long-term
capital gains ($) | Capital loss
carryforwards ($) | Net unrealized
appreciation ($) |
| 4,726,909 | 17,816,232 | — | 147,906,920 |
At February 28, 2022, the cost of all investments for federal income tax purposes along with the aggregate gross unrealized appreciation and depreciation based on that cost was:
Federal
tax cost ($) | Gross unrealized
appreciation ($) | Gross unrealized
(depreciation) ($) | Net unrealized
appreciation ($) |
| 260,662,357 | 152,878,527 | (4,971,607) | 147,906,920 |
Tax cost of investments and unrealized appreciation/(depreciation) may also include timing differences that do not constitute adjustments to tax basis.
Management of the Fund has concluded that there are no significant uncertain tax positions in the Fund that would require recognition in the financial statements. However, management’s conclusion may be subject to review and adjustment at a later date based on factors including, but not limited to, new tax laws, regulations, and administrative interpretations (including relevant court decisions). Generally, the Fund’s federal tax returns for the prior three fiscal years remain subject to examination by the Internal Revenue Service.
Note 5. Portfolio information
The cost of purchases and proceeds from sales of securities, excluding short-term investments and derivatives, if any, aggregated to $302,810,342 and $468,964,735, respectively, for the year ended February 28, 2022. The amount of purchase and sale activity impacts the portfolio turnover rate reported in the Financial Highlights.
Columbia Large Cap Enhanced Core Fund | Annual Report 2022
| 27 |
Notes to Financial Statements (continued)
February 28, 2022
Note 6. Affiliated money market fund
The Fund invests in Columbia Short-Term Cash Fund, an affiliated money market fund established for the exclusive use by the Fund and other affiliated funds (the Affiliated MMF). The income earned by the Fund from such investments is included as Dividends - affiliated issuers in the Statement of Operations. As an investing fund, the Fund indirectly bears its proportionate share of the expenses of the Affiliated MMF. The Affiliated MMF prices its shares with a floating net asset value. In addition, the Board of Trustees of the Affiliated MMF may impose a fee on redemptions (sometimes referred to as a liquidity fee) or temporarily suspend redemptions (sometimes referred to as imposing a redemption gate) in the event its liquidity falls below regulatory limits.
Note 7. Interfund lending
Pursuant to an exemptive order granted by the Securities and Exchange Commission, the Fund participates in a program (the Interfund Program) allowing each participating Columbia Fund (each, a Participating Fund) to lend money directly to and, except for closed-end funds and money market funds, borrow money directly from other Participating Funds for temporary purposes. The amounts eligible for borrowing and lending under the Interfund Program are subject to certain restrictions.
Interfund loans are subject to the risk that the borrowing fund could be unable to repay the loan when due, and a delay in repayment to the lending fund could result in lost opportunities and/or additional lending costs. The exemptive order is subject to conditions intended to mitigate conflicts of interest arising from the Investment Manager’s relationship with each Participating Fund.
The Fund did not borrow or lend money under the Interfund Program during the year ended February 28, 2022.
Note 8. Line of credit
The Fund has access to a revolving credit facility with a syndicate of banks led by JPMorgan Chase Bank, N.A., Citibank, N.A. and Wells Fargo Bank, N.A. whereby the Fund may borrow for the temporary funding of shareholder redemptions or for other temporary or emergency purposes. Pursuant to an October 28, 2021 amendment and restatement, the credit facility, which is an agreement between the Fund and certain other funds managed by the Investment Manager or an affiliated investment manager, severally and not jointly, permits aggregate borrowings up to $950 million. Interest is currently charged to each participating fund based on its borrowings at a rate equal to the higher of (i) the federal funds effective rate, (ii) the secured overnight financing rate plus 0.11448% and (iii) the overnight bank funding rate, plus in each case, 1.00%. Each borrowing under the credit facility matures no later than 60 days after the date of borrowing. The Fund also pays a commitment fee equal to its pro rata share of the unused amount of the credit facility at a rate of 0.15% per annum. The commitment fee is included in other expenses in the Statement of Operations. This agreement expires annually in October unless extended or renewed. Prior to the October 28, 2021 amendment and restatement, the Fund had access to a revolving credit facility with a syndicate of banks led by JPMorgan Chase Bank, N.A., Citibank, N.A. and Wells Fargo Bank, N.A. which permitted collective borrowings up to $950 million. Interest was charged to each participating fund based on its borrowings at a rate equal to the higher of (i) the federal funds effective rate, (ii) the one-month London Interbank Offered Rate (LIBOR) rate and (iii) the overnight bank funding rate, plus in each case, 1.25%.
The Fund had no borrowings during the year ended February 28, 2022.
Note 9. Significant risks
Information technology sector risk
The Fund is more susceptible to the particular risks that may affect companies in the information technology sector than if it were invested in a wider variety of companies in unrelated sectors. Companies in the information technology sector are subject to certain risks, including the risk that new services, equipment or technologies will not be accepted by consumers and businesses or will become rapidly obsolete. Performance of such companies may be affected by factors including obtaining and protecting patents (or the failure to do so) and significant competitive pressures, including aggressive pricing of their products or services, new market entrants, competition for market share and short product cycles due to an accelerated rate of technological developments. Such competitive pressures may lead to limited earnings and/or falling profit margins. As a result, the value of their securities may fall or fail to rise. In addition, many information technology sector companies have
| 28 | Columbia Large Cap Enhanced Core Fund | Annual Report 2022 |
Notes to Financial Statements (continued)
February 28, 2022
limited operating histories and prices of these companies’ securities historically have been more volatile than other securities, especially over the short term. Some companies in the information technology sector are facing increased government and regulatory scrutiny and may be subject to adverse government or regulatory action, which could negatively impact the value of their securities.
Market risk
The Fund may incur losses due to declines in the value of one or more securities in which it invests. These declines may be due to factors affecting a particular issuer, or the result of, among other things, political, regulatory, market, economic or social developments affecting the relevant market(s) more generally. In addition, turbulence in financial markets and reduced liquidity in equity, credit and/or fixed income markets may negatively affect many issuers, which could adversely affect the Fund, including causing difficulty in assigning prices to hard-to-value assets in thinly traded and closed markets, significant redemptions and operational challenges. Global economies and financial markets are increasingly interconnected, and conditions and events in one country, region or financial market may adversely impact issuers in a different country, region or financial market. These risks may be magnified if certain events or developments adversely interrupt the global supply chain; in these and other circumstances, such risks might affect companies worldwide. As a result, local, regional or global events such as terrorism, war, natural disasters, disease/virus outbreaks and epidemics or other public health issues, recessions, depressions or other events – or the potential for such events – could have a significant negative impact on global economic and market conditions.
The large-scale invasion of Ukraine by Russia in February 2022 has resulted in sanctions and market disruptions, including declines in regional and global stock and commodity markets and significant devaluations of Russian currency. The extent and duration of the military action are impossible to predict but could be significant. Market disruption caused by the Russian military action, and any counter measures or responses thereto (including international sanctions, a downgrade in the country’s credit rating, purchasing and financing restrictions, boycotts, tariffs, changes in consumer or purchaser preferences, cyberattacks and espionage) could have a severe adverse impact on regional and/or global securities and commodities markets, including markets for oil and natural gas. These and other related events could have a negative impact on Fund performance and the value of an investment in the Fund.
The pandemic caused by coronavirus disease 2019 and its variants (COVID-19) has resulted in, and may continue to result in, significant global economic and societal disruption and market volatility due to disruptions in market access, resource availability, facilities operations, imposition of tariffs, export controls and supply chain disruption, among others. Such disruptions may be caused, or exacerbated by, quarantines and travel restrictions, workforce displacement and loss in human and other resources. The uncertainty surrounding the magnitude, duration, reach, costs and effects of the global pandemic, as well as actions that have been or could be taken by governmental authorities or other third parties, present unknowns that are yet to unfold. The impacts, as well as the uncertainty over impacts to come, of COVID-19 – and any other infectious illness outbreaks, epidemics and pandemics that may arise in the future – could negatively affect global economies and markets in ways that cannot necessarily be foreseen. In addition, the impact of infectious illness outbreaks and epidemics in emerging market countries may be greater due to generally less established healthcare systems, governments and financial markets. Public health crises caused by the COVID-19 outbreak may exacerbate other pre-existing political, social and economic risks in certain countries or globally. The disruptions caused by COVID-19 could prevent the Fund from executing advantageous investment decisions in a timely manner and negatively impact the Fund’s ability to achieve its investment objectives. Any such event(s) could have a significant adverse impact on the value and risk profile of the Fund.
Shareholder concentration risk
At February 28, 2022, two unaffiliated shareholders of record owned 39.5% of the outstanding shares of the Fund in one or more accounts. The Fund has no knowledge about whether any portion of those shares was owned beneficially. Affiliated shareholders of record owned 15.4% of the outstanding shares of the Fund in one or more accounts. Subscription and redemption activity by concentrated accounts may have a significant effect on the operations of the Fund. In the case of a large redemption, the Fund may be forced to sell investments at inopportune times, including its liquid positions, which may result in Fund losses and the Fund holding a higher percentage of less liquid positions. Large redemptions could result in decreased economies of scale and increased operating expenses for non-redeeming Fund shareholders.
Columbia Large Cap Enhanced Core Fund | Annual Report 2022
| 29 |
Notes to Financial Statements (continued)
February 28, 2022
Note 10. Subsequent events
Management has evaluated the events and transactions that have occurred through the date the financial statements were issued and noted no items requiring adjustment of the financial statements or additional disclosure.
Note 11. Information regarding pending and settled legal proceedings
Ameriprise Financial and certain of its affiliates are involved in the normal course of business in legal proceedings which include regulatory inquiries, arbitration and litigation, including class actions concerning matters arising in connection with the conduct of its activities as a diversified financial services firm. Ameriprise Financial believes that the Fund is not currently the subject of, and that neither Ameriprise Financial nor any of its affiliates are the subject of, any pending legal, arbitration or regulatory proceedings that are likely to have a material adverse effect on the Fund or the ability of Ameriprise Financial or its affiliates to perform under their contracts with the Fund. Ameriprise Financial is required to make quarterly (10-Q), annual (10-K) and, as necessary, 8-K filings with the Securities and Exchange Commission (SEC) on legal and regulatory matters that relate to Ameriprise Financial and its affiliates. Copies of these filings may be obtained by accessing the SEC website at www.sec.gov.
There can be no assurance that these matters, or the adverse publicity associated with them, will not result in increased Fund redemptions, reduced sale of Fund shares or other adverse consequences to the Fund. Further, although we believe proceedings are not likely to have a material adverse effect on the Fund or the ability of Ameriprise Financial or its affiliates to perform under their contracts with the Fund, these proceedings are subject to uncertainties and, as such, we are unable to estimate the possible loss or range of loss that may result. An adverse outcome in one or more of these proceedings could result in adverse judgments, settlements, fines, penalties or other relief that could have a material adverse effect on the consolidated financial condition or results of operations of Ameriprise Financial or one or more of its affiliates that provides services to the Fund.
| 30 | Columbia Large Cap Enhanced Core Fund | Annual Report 2022 |
Report of Independent Registered Public Accounting Firm
To the Board of Trustees of Columbia Funds Series Trust and Shareholders of Columbia Large Cap Enhanced Core Fund
Opinion on the Financial Statements
We have audited the accompanying statement of assets and liabilities, including the portfolio of investments, of Columbia Large Cap Enhanced Core Fund (one of the funds constituting Columbia Funds Series Trust, referred to hereafter as the "Fund") as of February 28, 2022, the related statement of operations for the year ended February 28, 2022, the statement of changes in net assets for each of the two years in the period ended February 28, 2022, including the related notes, and the financial highlights for each of the five years in the period ended February 28, 2022 (collectively referred to as the "financial statements"). In our opinion, the financial statements present fairly, in all material respects, the financial position of the Fund as of February 28, 2022, the results of its operations for the year then ended, the changes in its net assets for each of the two years in the period ended February 28, 2022 and the financial highlights for each of the five years in the period ended February 28, 2022 in conformity with accounting principles generally accepted in the United States of America.
Basis for Opinion
These financial statements are the responsibility of the Fund’s management. Our responsibility is to express an opinion on the Fund’s financial statements based on our audits. We are a public accounting firm registered with the Public Company Accounting Oversight Board (United States) (PCAOB) and are required to be independent with respect to the Fund in accordance with the U.S. federal securities laws and the applicable rules and regulations of the Securities and Exchange Commission and the PCAOB.
We conducted our audits of these financial statements in accordance with the standards of the PCAOB. Those standards require that we plan and perform the audit to obtain reasonable assurance about whether the financial statements are free of material misstatement, whether due to error or fraud.
Our audits included performing procedures to assess the risks of material misstatement of the financial statements, whether due to error or fraud, and performing procedures that respond to those risks. Such procedures included examining, on a test basis, evidence regarding the amounts and disclosures in the financial statements. Our audits also included evaluating the accounting principles used and significant estimates made by management, as well as evaluating the overall presentation of the financial statements. Our procedures included confirmation of securities owned as of February 28, 2022 by correspondence with the custodian, transfer agent and broker. We believe that our audits provide a reasonable basis for our opinion.
/s/PricewaterhouseCoopers LLP
Minneapolis, Minnesota
April 21, 2022
We have served as the auditor of one or more investment companies within the Columbia Funds Complex since 1977.
Columbia Large Cap Enhanced Core Fund | Annual Report 2022
| 31 |
Federal Income Tax Information
(Unaudited)
The Fund hereby designates the following tax attributes for the fiscal year ended February 28, 2022. Shareholders will be notified in early 2023 of the amounts for use in preparing 2022 income tax returns.
Qualified
dividend
income | Dividends
received
deduction | Section
199A
dividends | Capital
gain
dividend |
| 25.01% | 24.20% | 0.49% | $81,422,625 |
Qualified dividend income. For taxable, non-corporate shareholders, the percentage of ordinary income distributed during the fiscal year that represents qualified dividend income subject to reduced tax rates.
Dividends received deduction. The percentage of ordinary income distributed during the fiscal year that qualifies for the corporate dividends received deduction.
Section 199A dividends. For taxable, non-corporate shareholders, the percentage of ordinary income distributed during the fiscal year that represents Section 199A dividends potentially eligible for a 20% deduction.
Capital gain dividend. The Fund designates as a capital gain dividend the amount reflected above, or if subsequently determined to be different, the net capital gain of such fiscal period.
TRUSTEES AND OFFICERS
The Board oversees the Fund’s operations and appoints officers who are responsible for day-to-day business decisions based on policies set by the Board. The following table provides basic biographical information about the Fund’s Trustees as of the printing of this report, including their principal occupations during the past five years, although specific titles for individuals may have varied over the period. The year set forth beneath Length of Service in the table below is the year in which the Trustee was first appointed or elected as Trustee to any Fund currently in the Columbia Funds Complex or a predecessor thereof. Under current Board policy, each Trustee generally serves until December 31 of the year such Trustee turns seventy-five (75).
Independent trustees
Name,
address,
year of birth | Position held
with the Columbia Funds and
length of service | Principal occupation(s)
during past five years
and other relevant
professional experience | Number of
Funds in the
Columbia Funds
Complex*
overseen | Other directorships
held by Trustee
during the past
five years |
George S. Batejan
c/o Columbia Management
Investment Advisers, LLC
290 Congress Street
Boston, MA 02210
1953 | Trustee since 2017 | Executive Vice President, Global Head of Technology and Operations, Janus Capital Group, Inc., 2010-2016 | 177 | Former Chairman of the Board, NICSA (National Investment Company Services Association) (Executive Committee, Nominating Committee and Governance Committee), 2014-2016; former Director, Intech Investment Management, 2011-2016; former Board Member, Metro Denver Chamber of Commerce, 2015-2016; former Advisory Board Member, University of Colorado Business School, 2015-2018 |
| 32 | Columbia Large Cap Enhanced Core Fund | Annual Report 2022 |
TRUSTEES AND OFFICERS (continued)
Independent trustees (continued)
Name,
address,
year of birth | Position held
with the Columbia Funds and
length of service | Principal occupation(s)
during past five years
and other relevant
professional experience | Number of
Funds in the
Columbia Funds
Complex*
overseen | Other directorships
held by Trustee
during the past
five years |
Kathleen Blatz
c/o Columbia Management
Investment Advisers, LLC
290 Congress Street
Boston, MA 02210
1954 | Trustee since 2006 | Attorney, specializing in arbitration and mediation; Chief Justice, Minnesota Supreme Court, 1998-2006; Associate Justice, Minnesota Supreme Court, 1996-1998; Fourth Judicial District Court Judge, Hennepin County, 1994-1996; Attorney in private practice and public service, 1984-1993; State Representative, Minnesota House of Representatives, 1979-1993, which included service on the Tax and Financial Institutions and Insurance Committees; Member and Interim Chair, Minnesota Sports Facilities Authority, January 2017-July 2017; Interim President and Chief Executive Officer, Blue Cross and Blue Shield of Minnesota (health care insurance), February-July 2018, April-October 2021 | 177 | Former Trustee, Blue Cross and Blue Shield of Minnesota, 2009-2021 (Chair of the Business Development Committee, 2014-2017; Chair of the Governance Committee, 2017-2019); former Member and Chair of the Board, Minnesota Sports Facilities Authority, January 2017-July 2017; former Director, Robina Foundation, 2009-2020 (Chair, 2014-2020); Director, Schulze Family Foundation, since 2021 |
Pamela G. Carlton
c/o Columbia Management
Investment Advisers, LLC
290 Congress Street
Boston, MA 02210
1954 | Trustee since 2007 | President, Springboard — Partners in Cross Cultural Leadership (consulting company) since 2003; Managing Director of US Equity Research, JP Morgan Chase, 1999-2003; Director of US Equity Research, Chase Asset Management, 1996-1999; Co-Director Latin America Research, 1993-1996, COO Global Research, 1992-1996, Co-Director of US Research, 1991-1992, Investment Banker, Morgan Stanley, 1982-1991, Morgan Stanley; Attorney, Cleary Gottlieb Steen & Hamilton LLP, 1980-1982 | 177 | Trustee, New York Presbyterian Hospital Board (Executive Committee and Chair of People Committee) since 1996; Director, DR Bank (Audit Committee) since 2017; Director, Evercore Inc. (Audit Committee) since 2019; Director, Apollo Commercial Real Estate Finance, Inc. since 2021; the Governing Council of the Independent Directors Council (IDC), since 2021 |
Janet Langford Carrig
c/o Columbia Management
Investment Advisers, LLC
290 Congress Street
Boston, MA 02210
1957 | Trustee since 1996 | Senior Vice President, General Counsel and Corporate Secretary, ConocoPhillips (independent energy company), September 2007-October 2018 | 175 | Director, EQT Corporation (natural gas producer) since 2019; Director, Whiting Petroleum Corporation (independent oil and gas company) since 2020 |
J. Kevin Connaughton
c/o Columbia Management
Investment Advisers, LLC
290 Congress Street
Boston, MA 02210
1964 | Trustee since 2020 | Member, FINRA National Adjudicatory Council since January 2020; Adjunct Professor of Finance, Bentley University since January 2018; Consultant to Independent Trustees of CFVIT and CFST I from March 2016 to June 2020 with respect to CFVIT and to December 2020 with respect to CFST I; Managing Director and General Manager of Mutual Fund Products, Columbia Management Investment Advisers, LLC, May 2010-February 2015; President, Columbia Funds, 2008-2015; and senior officer of Columbia Funds and affiliated funds, 2003-2015 | 175 | Former Director, The Autism Project, March 2015-December 2021; former Member of the Investment Committee, St. Michael’s College, November 2015-February 2020; former Trustee, St. Michael’s College, June 2017-September 2019; former Trustee, New Century Portfolios, January 2015-December 2017 |
Columbia Large Cap Enhanced Core Fund | Annual Report 2022
| 33 |
TRUSTEES AND OFFICERS (continued)
Independent trustees (continued)
Name,
address,
year of birth | Position held
with the Columbia Funds and
length of service | Principal occupation(s)
during past five years
and other relevant
professional experience | Number of
Funds in the
Columbia Funds
Complex*
overseen | Other directorships
held by Trustee
during the past
five years |
Olive M. Darragh
c/o Columbia Management
Investment Advisers, LLC
290 Congress Street
Boston, MA 02210
1962 | Trustee since 2020 | Managing Director of Darragh Inc. (strategy and talent management consulting firm) since 2010; Founder and CEO, Zolio, Inc. (investment management talent identification platform) since 2004; Consultant to Independent Trustees of CFVIT and CFST I from June 2019 to June 2020 with respect to CFVIT and to December 2020 with respect to CFST I; Partner, Tudor Investments, 2004-2010; Senior Partner, McKinsey & Company (consulting), 1990-2004; Touche Ross CPA, 1985-1988 | 175 | Former Director, University of Edinburgh Business School (Member of US Board); former Director, Boston Public Library Foundation |
Patricia M. Flynn
c/o Columbia Management
Investment Advisers, LLC
290 Congress Street
Boston, MA 02210
1950 | Trustee since 2004 | Trustee Professor of Economics and Management, Bentley University since 1976 (also teaches and conducts research on corporate governance); Dean, McCallum Graduate School of Business, Bentley University, 1992-2002 | 177 | Trustee, MA Taxpayers Foundation since 1997; Board of Governors, Innovation Institute, MA Technology Collaborative, 2010-2020; former Board of Directors, The MA Business Roundtable, 2003-2019 |
Brian J. Gallagher
c/o Columbia Management
Investment Advisers, LLC
290 Congress Street
Boston, MA 02210
1954 | Trustee since 2017 | Retired; Partner with Deloitte & Touche LLP and its predecessors, 1977-2016 | 177 | Trustee, Catholic Schools Foundation since 2004 |
Douglas A. Hacker
c/o Columbia Management
Investment Advisers, LLC
290 Congress Street
Boston, MA 02210
1955 | Co-Chair since 2021; Chair of CFST I and CFVIT since 2014; Trustee of CFST I and CFVIT since 1996 and CFST, CFST II, CFVST II, CET I and CET II since 2021 | Independent business executive since May 2006; Executive Vice President – Strategy of United Airlines, December 2002 - May 2006; President of UAL Loyalty Services (airline marketing company), September 2001-December 2002; Executive Vice President and Chief Financial Officer of United Airlines, July 1999-September 2001 | 177 | Director, Spartan Nash Company (food distributor); Director, Aircastle Limited (Chair of Audit Committee) (aircraft leasing); former Director, Nash Finch Company (food distributor), 2005-2013; former Director, SeaCube Container Leasing Ltd. (container leasing), 2010-2013; and former Director, Travelport Worldwide Limited (travel information technology), 2014-2019 |
Nancy T. Lukitsh
c/o Columbia Management
Investment Advisers, LLC
290 Congress Street
Boston, MA 02210
1956 | Trustee since 2011 | Senior Vice President, Partner and Director of Marketing, Wellington Management Company, LLP (investment adviser), 1997-2010; Chair, Wellington Management Portfolios (commingled non-U.S. investment pools), 2007 -2010; Director, Wellington Trust Company, NA and other Wellington affiliates, 1997-2010 | 175 | None |
| 34 | Columbia Large Cap Enhanced Core Fund | Annual Report 2022 |
TRUSTEES AND OFFICERS (continued)
Independent trustees (continued)
Name,
address,
year of birth | Position held
with the Columbia Funds and
length of service | Principal occupation(s)
during past five years
and other relevant
professional experience | Number of
Funds in the
Columbia Funds
Complex*
overseen | Other directorships
held by Trustee
during the past
five years |
David M. Moffett
c/o Columbia Management
Investment Advisers, LLC
290 Congress Street
Boston, MA 02210
1952 | Trustee since 2011 | Retired; Consultant to Bridgewater and Associates | 175 | Director, CSX Corporation (transportation suppliers); Director, Genworth Financial, Inc. (financial and insurance products and services); Director, PayPal Holdings Inc. (payment and data processing services); Trustee, University of Oklahoma Foundation; former Director, eBay Inc. (online trading community), 2007-2015; and former Director, CIT Bank, CIT Group Inc. (commercial and consumer finance), 2010-2016 |
Catherine James Paglia
c/o Columbia Management
Investment Advisers, LLC
290 Congress Street
Boston, MA 02210
1952 | Co-Chair since 2021; Chair of CFST, CFST II, CFVST II, CET I and CET II since 2020; Trustee of CFST, CFST II and CFVST II since 2004 and CFST I and CFVIT since 2021 | Director, Enterprise Asset Management, Inc. (private real estate and asset management company) since September 1998; Managing Director and Partner, Interlaken Capital, Inc., 1989-1997; Vice President, 1982-1985, Principal, 1985-1987, Managing Director, 1987-1989, Morgan Stanley; Vice President, Investment Banking, 1980-1982, Associate, Investment Banking, 1976-1980, Dean Witter Reynolds, Inc. | 177 | Director, Valmont Industries, Inc. (irrigation systems manufacturer) since 2012; Trustee, Carleton College (on the Investment Committee); Trustee, Carnegie Endowment for International Peace (on the Investment Committee) |
Minor M. Shaw
c/o Columbia Management
Investment Advisers, LLC
290 Congress Street
Boston, MA 02210
1947 | Trustee since 2003 | President, Micco LLC (private investments) since 2011; President, Micco Corp. (family investment business), 1998-2011 | 177 | Director, Blue Cross Blue Shield of South Carolina (Chair of Compensation Committee) since April 2008; Trustee, Hollingsworth Funds (on the Investment Committee) since 2016 (previously Board Chair from 2016-2019); Former Advisory Board member, Duke Energy Corp., 2016-2020; Chair of the Duke Endowment; Chair of Greenville – Spartanburg Airport Commission; former Trustee, BofA Funds Series Trust (11 funds), 2003-2011; former Director, Piedmont Natural Gas, 2004-2016; former Director, National Association of Corporate Directors, Carolinas Chapter, 2013-2018; Chair, Daniel-Mickel Foundation since 1998 |
Columbia Large Cap Enhanced Core Fund | Annual Report 2022
| 35 |
TRUSTEES AND OFFICERS (continued)
Independent trustees (continued)
Name,
address,
year of birth | Position held
with the Columbia Funds and
length of service | Principal occupation(s)
during past five years
and other relevant
professional experience | Number of
Funds in the
Columbia Funds
Complex*
overseen | Other directorships
held by Trustee
during the past
five years |
Natalie A. Trunow
c/o Columbia Management
Investment Advisers, LLC
290 Congress Street
Boston, MA 02210
1967 | Trustee since 2020 | Chief Executive Officer, Millennial Portfolio Solutions LLC (asset management and consulting services), January 2016-January 2021; Non-executive Member of the Investment Committee and Valuation Committee, Sarona Asset Management Inc. (private equity firm) since September 2019; Advisor, Horizon Investments (asset management and consulting services), August 2018-January 2021; Advisor, Paradigm Asset Management, November 2016-December 2021; Consultant to Independent Trustees of CFVIT and CFST I from September 2016 to June 2020 with respect to CFVIT and to December 2020 with respect to CFST I; Director of Investments/Consultant, Casey Family Programs, April 2016-November 2016; Senior Vice President and Chief Investment Officer, Calvert Investments, August 2008-January 2016; Section Head and Portfolio Manager, General Motors Asset Management, June 1997-August 2008 | 175 | Former Director, Investment Committee, Health Services for Children with Special Needs, Inc., 2012-2019; Director, Chair of Audit Committee, Consumer Credit Counseling Services (formerly Guidewell Financial Solutions), since 2019; Independent Director, Investment Committee and Valuation Committee, Sarona Asset Management, since 2019 |
Sandra Yeager
c/o Columbia Management
Investment Advisers, LLC
290 Congress Street
Boston, MA 02210
1964 | Trustee since 2017 | Retired; President and founder, Hanoverian Capital, LLC (SEC registered investment advisor firm), 2008-2016; Managing Director, DuPont Capital, 2006-2008; Managing Director, Morgan Stanley Investment Management, 2004-2006; Senior Vice President, Alliance Bernstein, 1990-2004 | 177 | Former Director, NAPE Education Foundation, October 2016-October 2020 |
| * | The term “Columbia Funds Complex” as used herein includes Columbia Seligman Premium Technology Growth Fund, Tri-Continental Corporation and each series of Columbia Fund Series Trust (CFST), Columbia Funds Series Trust I (CFST I), Columbia Funds Series Trust II (CFST II), Columbia ETF Trust I (CET I), Columbia ETF Trust II (CET II), Columbia Funds Variable Insurance Trust (CFVIT) and Columbia Funds Variable Series Trust II (CFVST II). Messrs. Batejan, Beckman, Gallagher and Hacker and Mses. Blatz, Carlton, Flynn, Paglia, Shaw and Yeager serve as Directors of Columbia Seligman Premium Technology Growth Fund and Tri-Continental Corporation. |
Interested trustee affiliated with Investment Manager*
Name,
address,
year of birth | Position held with the Columbia Funds and length of service | Principal occupation(s) during the
past five years and other relevant
professional experience | Number of
Funds in the
Columbia Funds
Complex overseen | Other directorships
held by Trustee
during the past
five years |
Daniel J. Beckman
c/o Columbia Management
Investment Advisers, LLC
290 Congress Street
Boston, MA 02210
1962 | Trustee since November 2021 and President since June 2021 | Vice President – Head of North America Product, Columbia Management Investment Advisers, LLC since April 2015; President and Principal Executive Officer of the Columbia Funds since June 2021; officer of Columbia Funds and affiliated funds, 2020-2021 | 177 | Director, Ameriprise Trust Company, since October 2016; Director, Columbia Management Investment Distributors, Inc. since November 2018; Board of Governors, Columbia Wanger Asset Management, LLC since January 2022 |
| * | Interested person (as defined under the 1940 Act) by reason of being an officer, director, security holder and/or employee of the Investment Manager or Ameriprise Financial. |
The Statement of Additional Information has additional information about the Fund’s Board members and is available, without charge, upon request by calling 800.345.6611, visiting columbiathreadneedleus.com/investor/ or contacting your financial intermediary.
| 36 | Columbia Large Cap Enhanced Core Fund | Annual Report 2022 |
TRUSTEES AND OFFICERS (continued)
The Board has appointed officers who are responsible for day-to-day business decisions based on policies it has established. The officers serve at the pleasure of the Board. The following table provides basic information about the Officers of the Fund as of the printing of this report, including principal occupations during the past five years, although their specific titles may have varied over the period. In addition to Mr. Beckman, who is President and Principal Executive Officer, the Fund’s other officers are:
Fund officers
Name,
address and
year of birth | Position and year
first appointed to
position for any Fund
in the Columbia
Funds Complex or a
predecessor thereof | Principal occupation(s) during past five years |
Michael G. Clarke
290 Congress Street
Boston, MA 02210
1969 | Chief Financial Officer and Principal Financial Officer (2009) and Senior Vice President (2019) | Senior Vice President and Head of Global Operations & Investor Services, Columbia Management Investment Advisers, LLC, since March 2022 (previously Vice President, Head of North American Operations, and Co-Head of Global Operations, June 2019 to February 2022 and Vice President – Accounting and Tax, May 2010 - May 2019); senior officer of Columbia Funds and affiliated funds since 2002. |
Joseph Beranek
5890 Ameriprise
Financial Center
Minneapolis, MN 55474
1965 | Treasurer and Chief Accounting Officer (Principal Accounting Officer) (2019) and Principal Financial Officer (2020), CFST, CFST I, CFST II, CFVIT and CFVST II; Assistant Treasurer, CET I and CET II | Vice President – Mutual Fund Accounting and Financial Reporting, Columbia Management Investment Advisers, LLC, since December 2018 and March 2017, respectively (previously Vice President – Pricing and Corporate Actions, May 2010 - March 2017). |
Marybeth Pilat
290 Congress Street
Boston, MA 02210
1968 | Treasurer and Chief Accounting Officer (Principal Accounting Officer) and Principal Financial Officer (2020) for CET I and CET II; Assistant Treasurer, CFST, CFST I, CFST II, CFVIT and CFVST II | Vice President – Product Pricing and Administration, Columbia Management Investment Advisers, LLC, since May 2017; Director - Fund Administration, Calvert Investments, August 2015 – March 2017; Vice President - Fund Administration, Legg Mason, May 2015 - July 2015; Vice President - Fund Administration, Columbia Management Investment Advisers, LLC, May 2010 - April 2015. |
William F. Truscott
290 Congress Street
Boston, MA 02210
1960 | Senior Vice President (2001) | Formerly, Trustee/Director of Columbia Funds Complex or legacy funds, November 2001-January 1, 2021; Chief Executive Officer, Global Asset Management, Ameriprise Financial, Inc. since September 2012; Chairman of the Board and President, Columbia Management Investment Advisers, LLC since July 2004 and February 2012, respectively; Chairman of the Board and Chief Executive Officer, Columbia Management Investment Distributors, Inc. since November 2008 and February 2012, respectively; Chairman of the Board and Director, Threadneedle Asset Management Holdings, Sàrl since March 2013 and December 2008, respectively; senior executive of various entities affiliated with Columbia Threadneedle. |
Christopher O. Petersen
5228 Ameriprise Financial Center
Minneapolis, MN 55474
1970 | Senior Vice President and Assistant Secretary | Formerly, Trustee/Director of funds within the Columbia Funds Complex, July 1, 2020 - November 22, 2021; Senior Vice President and Assistant General Counsel, Ameriprise Financial, Inc. since September 2021 (previously Vice President and Lead Chief Counsel, January 2015 - September 2021); President and Principal Executive Officer of the Columbia Funds, 2015 - 2021; officer of Columbia Funds and affiliated funds since 2007. |
Thomas P. McGuire
290 Congress Street
Boston, MA 02210
1972 | Senior Vice President and Chief Compliance Officer (2012) | Vice President – Asset Management Compliance, Ameriprise Financial, Inc., since May 2010; Chief Compliance Officer, Columbia Acorn/Wanger Funds since December 2015; Chief Compliance Officer, Ameriprise Certificate Company, September 2010 – September 2020. |
Ryan C. Larrenaga
290 Congress Street
Boston, MA 02210
1970 | Senior Vice President (2017), Chief Legal Officer (2017), and Secretary (2015) | Vice President and Chief Counsel, Ameriprise Financial, Inc. since August 2018 (previously Vice President and Group Counsel, August 2011 - August 2018); Chief Legal Officer, Columbia Acorn/Wanger Funds, since September 2020; officer of Columbia Funds and affiliated funds since 2005. |
Columbia Large Cap Enhanced Core Fund | Annual Report 2022
| 37 |
TRUSTEES AND OFFICERS (continued)
Fund officers (continued)
Name,
address and
year of birth | Position and year
first appointed to
position for any Fund
in the Columbia
Funds Complex or a
predecessor thereof | Principal occupation(s) during past five years |
Michael E. DeFao
290 Congress Street
Boston, MA 02210
1968 | Vice President (2011) and Assistant Secretary (2010) | Vice President and Chief Counsel, Ameriprise Financial, Inc. since May 2010; Vice President, Chief Legal Officer and Assistant Secretary, Columbia Management Investment Advisers, LLC since October 2021 (previously Vice President and Assistant Secretary, May 2010 – September 2021). |
Lyn Kephart-Strong
5228 Ameriprise
Financial Center
Minneapolis, MN 55474
1960 | Vice President (2015) | President, Columbia Management Investment Services Corp. since October 2014; Vice President & Resolution Officer, Ameriprise Trust Company since August 2009. |
| 38 | Columbia Large Cap Enhanced Core Fund | Annual Report 2022 |
[THIS PAGE INTENTIONALLY LEFT BLANK]
Columbia Large Cap Enhanced Core Fund
P.O. Box 219104
Kansas City, MO 64121-9104
Please read and consider the investment objectives, risks, charges and expenses for any fund carefully before investing. For a prospectus and summary prospectus, which contains this and other important information about the Fund, go to
columbiathreadneedleus.com/investor/. The Fund is distributed by Columbia Management Investment Distributors, Inc., member FINRA, and managed by Columbia Management Investment Advisers, LLC.
Columbia Threadneedle Investments (Columbia Threadneedle) is the global brand name of the Columbia and Threadneedle group of companies. All rights reserved.
© 2022 Columbia Management Investment Advisers, LLC.
columbiathreadneedleus.com/investor/

Annual Report
February 28, 2022
Columbia Mid Cap Index Fund
Not Federally Insured • No Financial Institution Guarantee • May Lose Value
If you elect to receive the shareholder report for Columbia Mid Cap Index Fund (the Fund) in paper, mailed to you, the Fund mails one shareholder report to each shareholder address, unless such shareholder elects to receive shareholder reports from the Fund electronically via e-mail or by having a paper notice mailed to you (Postcard Notice) that your Fund’s shareholder report is available at the Columbia funds’ website (columbiathreadneedleus.com/investor/). If you would like more than one report in paper to be mailed to you, or would like to elect to receive reports via e-mail or access them through Postcard Notice, please call shareholder services at 800.345.6611 and additional reports will be sent to you.
Proxy voting policies and procedures
The policy of the Board of Trustees is to vote the proxies of the companies in which the Fund holds investments consistent with the procedures as stated in the Statement of Additional Information (SAI). You may obtain a copy of the SAI without charge by calling 800.345.6611; contacting your financial intermediary; visiting columbiathreadneedleus.com/investor/; or searching the website of the Securities and Exchange Commission (SEC) at sec.gov. Information regarding how the Fund voted proxies relating to portfolio securities is filed with the SEC by August 31st for the most recent 12-month period ending June 30th of that year, and is available without charge by visiting columbiathreadneedleus.com/investor/, or searching the website of the SEC at sec.gov.
Quarterly schedule of investments
The Fund files a complete schedule of portfolio holdings with the SEC for the first and third quarters of each fiscal year on Form N-PORT. The Fund’s Form N-PORT filings are available on the SEC’s website at sec.gov. The Fund’s complete schedule of portfolio holdings, as filed on Form N-PORT, can also be obtained without charge, upon request, by calling 800.345.6611.
Additional Fund information
For more information about the Fund, please visit columbiathreadneedleus.com/investor/ or call 800.345.6611. Customer Service Representatives are available to answer your questions Monday through Friday from 8 a.m. to 7 p.m. Eastern time.
Fund investment manager
Columbia Management Investment Advisers, LLC (the Investment Manager)
290 Congress Street
Boston, MA 02210
Fund distributor
Columbia Management Investment Distributors, Inc.
290 Congress Street
Boston, MA 02210
Fund transfer agent
Columbia Management Investment Services Corp.
P.O. Box 219104
Kansas City, MO 64121-9104
Columbia Mid Cap Index Fund | Annual Report 2022
Investment objective
The Fund seeks total return before fees and expenses that corresponds to the total return of the Standard & Poor’s (S&P) MidCap 400® Index.
Portfolio management
Christopher Lo, CFA
Lead Portfolio Manager
Managed Fund since 2014
Kaiyu Zhao
Portfolio Manager
Managed Fund since 2020
Christopher Rowe
Portfolio Manager
Managed Fund since 2020
Morningstar style boxTM
The Morningstar Style Box is based on a fund’s portfolio holdings. For equity funds, the vertical axis shows the market capitalization of the stocks owned, and the horizontal axis shows investment style (value, blend, or growth). Information shown is based on the most recent data provided by Morningstar.
© 2022 Morningstar, Inc. All rights reserved. The Morningstar information contained herein: (1) is proprietary to Morningstar and/or its content providers; (2) may not be copied or distributed; and (3) is not warranted to be accurate, complete or timely. Neither Morningstar nor its content providers are responsible for any damages or losses arising from any use of this information.
| Average annual total returns (%) (for the period ended February 28, 2022) |
| | | Inception | 1 Year | 5 Years | 10 Years |
| Class A | 05/31/00 | 7.48 | 10.18 | 11.73 |
| Institutional Class | 03/31/00 | 7.72 | 10.45 | 12.01 |
| Institutional 2 Class* | 11/08/12 | 7.75 | 10.46 | 12.03 |
| Institutional 3 Class* | 03/01/17 | 7.78 | 10.46 | 12.02 |
| S&P MidCap 400 Index | | 7.98 | 10.71 | 12.26 |
All results shown assume reinvestment of distributions during the period. Returns do not reflect the deduction of taxes that a shareholder may pay on Fund distributions or on the redemption of Fund shares. Performance results reflect the effect of any fee waivers or reimbursements of Fund expenses by Columbia Management Investment Advisers, LLC and/or any of its affiliates. Absent these fee waivers or expense reimbursement arrangements, performance results would have been lower.
The performance information shown represents past performance and is not a guarantee of future results. The investment return and principal value of your investment will fluctuate so that your shares, when redeemed, may be worth more or less than their original cost. Current performance may be lower or higher than the performance information shown. You may obtain performance information current to the most recent month-end by contacting your financial intermediary, visiting columbiathreadneedleus.com/investor/ or calling 800.345.6611.
| * | The returns shown for periods prior to the share class inception date (including returns for the Life of the Fund, if shown, which are since Fund inception) include the returns of the Fund’s oldest share class. These returns are adjusted to reflect any higher class-related operating expenses of the newer share classes, as applicable. Please visit columbiathreadneedleus.com/investor/investment-products/mutual-funds/appended-performance for more information. |
The S&P MidCap 400 Index is a market-value weighted index that tracks the performance of 400 mid-cap U.S. companies.
Indices are not available for investment, are not professionally managed and do not reflect sales charges, fees, brokerage commissions, taxes or other expenses of investing. Securities in the Fund may not match those in an index.
Fund performance may be significantly negatively impacted by the economic impact of the COVID-19 pandemic. The COVID-19 pandemic has adversely impacted economies and capital markets around the world in ways that will likely continue and may change in unforeseen ways for an indeterminate period. The COVID-19 pandemic may exacerbate pre-existing political, social and economic risks in certain countries and globally.
Columbia Mid Cap Index Fund | Annual Report 2022
| 3 |
Fund at a Glance (continued)
Performance of a hypothetical $10,000 investment (February 29, 2012 — February 28, 2022)
The chart above shows the change in value of a hypothetical $10,000 investment in Class A shares of Columbia Mid Cap Index Fund during the stated time period, and does not reflect the deduction of taxes that a shareholder may pay on Fund distributions or on the redemption of Fund shares.
| Portfolio breakdown (%) (at February 28, 2022) |
| Common Stocks | 98.7 |
| Money Market Funds | 1.3 |
| Total | 100.0 |
Percentages indicated are based upon total investments excluding investments in derivatives, if any. The Fund’s portfolio composition is subject to change.
| Equity sector breakdown (%) (at February 28, 2022) |
| Communication Services | 1.7 |
| Consumer Discretionary | 15.0 |
| Consumer Staples | 3.5 |
| Energy | 2.7 |
| Financials | 14.7 |
| Health Care | 9.3 |
| Industrials | 18.2 |
| Information Technology | 14.4 |
| Materials | 7.0 |
| Real Estate | 10.1 |
| Utilities | 3.4 |
| Total | 100.0 |
Percentages indicated are based upon total equity investments. The Fund’s portfolio composition is subject to change.
| 4 | Columbia Mid Cap Index Fund | Annual Report 2022 |
Manager Discussion of Fund Performance
For the 12-month period that ended February 28, 2022, Class A shares of Columbia Mid Cap Index Fund returned 7.48%. The Fund closely tracked its benchmark, the unmanaged S&P MidCap 400 Index, which returned 7.98% for the same period. Mutual funds, unlike unmanaged indices, incur operating expenses.
Market overview
COVID-19 vaccinations allowed for greater economic reopening during the annual period. In turn, the U.S. equity market, as measured by the S&P 500 Index, achieved double-digit gains. Mid-cap stocks also rose. Still, volatility remained heightened throughout the annual period.
As the annual period began in March 2021, U.S. equities produced healthy gains, boosted by both the passage of a fiscal stimulus package and by investor confidence that the U.S. Federal Reserve (Fed) would maintain its highly accommodative monetary policy. Stocks were then well supported during the second quarter of 2021 by a combination of strong economic growth, gradual rollbacks of COVID-19 lockdowns and robust corporate earnings. Although concerns about rising inflation led to a brief stretch of volatility mid-way through the quarter, the Fed reassured the markets that monetary policy would remain accommodative for an extended period. As a result, most major U.S. equity indices finished June 2021 at or near their then-all-time highs.
U.S. equities posted mixed results in the third quarter, reflecting an increasingly challenging environment. The market performed reasonably well in July and August, during which the prospects of improving economic growth and rising corporate profits outweighed concerns about the COVID-19 Delta variant. The backdrop became less favorable in September, however, fueling a downturn that erased almost all of the advance of the prior two months. The markets were contending with a persistent increase in inflation, worsening supply-chain bottlenecks, instability in China’s property market and the Fed indicating it was likely to announce a tapering of its quantitative easing program before year end. In the fourth quarter, U.S. equities displayed remarkable resilience despite potential headwinds. Investors faced the emergence of the COVID-19 Omicron variant, contagious enough to raise concerns about a possible new wave of lockdowns. Also, the Fed had previously viewed rising inflation as “transitory,” but continued price pressures drove the central bank to announce the tapering of its stimulative quantitative easing program and to prepare the financial markets for the likelihood of multiple interest rate increases in 2022. Still, the S&P 500 Index finished the calendar year with a solid gain on the strength of robust investment inflows and the lack of compelling total return potential in bonds.
U.S. equities fell in January and February 2022. In January the S&P 500 Index experienced its worst month since the COVID-19-induced sell-off of March 2020. Hawkish commentary from the Fed was perhaps the most significant driver of the market’s decline. Heightened inflation concerns also weighed on investor sentiment, more than offsetting the positive news that the Omicron variant appeared to be milder than previous COVID-19 variants. In February, Russia’s invasion of Ukraine, stunning in its magnitude, rattled equity markets, while inflation and shifting Fed policy remained overhangs. Notably, the growing sense that COVID-19 is transitioning from pandemic to endemic in the U.S. supported U.S. small-cap stocks, which significantly outpaced their large-cap peers in a reversal of the recent performance trend.
For the annual period overall, large-cap stocks within the U.S. equity market performed best, followed by mid-cap stocks and then small-cap stocks, each generating a positive total return. From a style perspective, there was a sharp reversal from the prior annual period, as value-oriented stocks significantly outperformed growth-oriented stocks across the capitalization spectrum of the U.S. equity market for the 12 months ended February 28, 2022. Six of the eleven sectors of the S&P MidCap 400 Index posted a positive return during the 12 months ended February 28, 2022.
The Fund’s notable detractors during the period
| • | Communication services, health care and information technology were the weakest sectors in terms of total return. |
| • | On the basis of impact, health care, information technology and consumer discretionary were the weakest sectors. |
| • | The worst performing industries for the annual period on the basis of total return were Internet and direct marketing retail; beverages; pharmaceuticals; multiline retail; and biotechnology. |
Columbia Mid Cap Index Fund | Annual Report 2022
| 5 |
Manager Discussion of Fund Performance (continued)
| • | Top individual detractors were residential solar energy systems company Sunrun Inc.; high-end alcoholic beverage company and craft brewer Boston Beer Company, Inc.-A; medical technology company Masimo Corp.; online and mobile platform for restaurant pick-up and delivery orders Grubhub, Inc.; and biotechnology company Arrowhead Pharmaceuticals, Inc. |
The Fund’s notable contributors during the period
| • | In terms of total return, the energy sector was the best relative performer, followed at some distance by the materials and real estate sectors. |
| • | On the basis of impact, which takes weighting and total returns into account, the financials, real estate and materials sectors were the biggest contributors to the Index’s return. |
| • | The top performing industries on the basis of total return were oil, gas and consumable fuels; metals and mining; air freight and logistics; paper and forest products; and real estate management and development. |
| • | Top individual contributors within the S&P MidCap 400 Index during the annual period included multifamily apartment communities real estate investment trust Camden Property Trust; car rental company Avis Budget Group, Inc.; integrated financial data and software solutions provider Factset Research Systems, Inc.; building materials supplier and manufacturer Builders FirstSource, Inc; and steel producer and metal recycler Steel Dynamics, Inc. |
| • | Industrials remained the largest sector by weighting in the S&P MidCap 400 Index, with a weighting of 18.46% as of February 28, 2022. |
| • | Each sector and stock in the S&P MidCap 400 Index was represented in the Fund with approximately the same weighting as in the Index and therefore had a similar effect. |
Market risk may affect a single issuer, sector of the economy, industry or the market as a whole. Investments in mid-cap companies involve risks and volatility greater than investments in larger, more established companies. The Fund’s net value will generally decline when the performance of its targeted index declines. Investing in derivatives is a specialized activity that involves special risks, which may result in significant losses. See the Fund’s prospectus for more information on these and other risks.
The views expressed in this report reflect the current views of the respective parties who have contributed to this report. These views are not guarantees of future performance and involve certain risks, uncertainties and assumptions that are difficult to predict, so actual outcomes and results may differ significantly from the views expressed. These views are subject to change at any time based upon economic, market or other conditions and the respective parties disclaim any responsibility to update such views. These views may not be relied on as investment advice and, because investment decisions for a Columbia fund are based on numerous factors, may not be relied on as an indication of trading intent on behalf of any particular Columbia fund. References to specific securities should not be construed as a recommendation or investment advice.
| 6 | Columbia Mid Cap Index Fund | Annual Report 2022 |
Understanding Your Fund’s Expenses
(Unaudited)
As an investor, you incur two types of costs. There are shareholder transaction costs, which may include redemption fees. There are also ongoing fund costs, which generally include management fees, distribution and/or service fees, and other fund expenses. The following information is intended to help you understand your ongoing costs (in dollars) of investing in the Fund and to help you compare these costs with the ongoing costs of investing in other mutual funds.
Analyzing your Fund’s expenses
To illustrate these ongoing costs, we have provided examples and calculated the expenses paid by investors in each share class of the Fund during the period. The actual and hypothetical information in the table is based on an initial investment of $1,000 at the beginning of the period indicated and held for the entire period. Expense information is calculated two ways and each method provides you with different information. The amount listed in the “Actual” column is calculated using the Fund’s actual operating expenses and total return for the period. You may use the Actual information, together with the amount invested, to estimate the expenses that you paid over the period. Simply divide your account value by $1,000 (for example, an $8,600 account value divided by $1,000 = 8.6), then multiply the results by the expenses paid during the period under the “Actual” column. The amount listed in the “Hypothetical” column assumes a 5% annual rate of return before expenses (which is not the Fund’s actual return) and then applies the Fund’s actual expense ratio for the period to the hypothetical return. You should not use the hypothetical account values and expenses to estimate either your actual account balance at the end of the period or the expenses you paid during the period. See “Compare with other funds” below for details on how to use the hypothetical data.
Compare with other funds
Since all mutual funds are required to include the same hypothetical calculations about expenses in shareholder reports, you can use this information to compare the ongoing cost of investing in the Fund with other funds. To do so, compare the hypothetical example with the 5% hypothetical examples that appear in the shareholder reports of other funds. As you compare hypothetical examples of other funds, it is important to note that hypothetical examples are meant to highlight the ongoing costs of investing in a fund only and do not reflect any transaction costs, such as redemption or exchange fees. Therefore, the hypothetical calculations are useful in comparing ongoing costs only, and will not help you determine the relative total costs of owning different funds. If transaction costs were included in these calculations, your costs would be higher.
| September 1, 2021 — February 28, 2022 |
| | Account value at the
beginning of the
period ($) | Account value at the
end of the
period ($) | Expenses paid during
the period ($) | Fund’s annualized
expense ratio (%) |
| | Actual | Hypothetical | Actual | Hypothetical | Actual | Hypothetical | Actual |
| Class A | 1,000.00 | 1,000.00 | 970.60 | 1,022.56 | 2.20 | 2.26 | 0.45 |
| Institutional Class | 1,000.00 | 1,000.00 | 972.00 | 1,023.80 | 0.98 | 1.00 | 0.20 |
| Institutional 2 Class | 1,000.00 | 1,000.00 | 972.20 | 1,023.80 | 0.98 | 1.00 | 0.20 |
| Institutional 3 Class | 1,000.00 | 1,000.00 | 972.50 | 1,023.80 | 0.98 | 1.00 | 0.20 |
Expenses paid during the period are equal to the annualized expense ratio for each class as indicated above, multiplied by the average account value over the period and then multiplied by the number of days in the Fund’s most recent fiscal half year and divided by 365.
Expenses do not include fees and expenses incurred indirectly by the Fund from its investment in underlying funds, including affiliated and non-affiliated pooled investment vehicles, such as mutual funds and exchange-traded funds.
Had Columbia Management Investment Advisers, LLC and/or certain of its affiliates not waived/reimbursed certain fees and expenses, account value at the end of the period would have been reduced.
Columbia Mid Cap Index Fund | Annual Report 2022
| 7 |
Portfolio of Investments
February 28, 2022
(Percentages represent value of investments compared to net assets)
Investments in securities
| Common Stocks 98.7% |
| Issuer | Shares | Value ($) |
| Communication Services 1.7% |
| Diversified Telecommunication Services 0.2% |
| Iridium Communications, Inc.(a) | 169,569 | 6,713,237 |
| Entertainment 0.1% |
| World Wrestling Entertainment, Inc., Class A | 57,358 | 3,399,035 |
| Interactive Media & Services 0.4% |
| TripAdvisor, Inc.(a) | 127,048 | 3,232,101 |
| Yelp, Inc.(a) | 88,035 | 2,983,506 |
| Ziff Davis, Inc.(a) | 61,851 | 6,222,211 |
| Total | | 12,437,818 |
| Media 1.0% |
| Cable One, Inc. | 6,358 | 9,110,060 |
| John Wiley & Sons, Inc., Class A | 55,860 | 2,810,316 |
| New York Times Co. (The), Class A | 214,324 | 9,428,113 |
| TEGNA, Inc. | 283,827 | 6,505,315 |
| Total | | 27,853,804 |
| Total Communication Services | 50,403,894 |
| Consumer Discretionary 14.7% |
| Auto Components 1.5% |
| Adient PLC(a) | 120,849 | 5,407,993 |
| Dana, Inc. | 185,002 | 3,444,737 |
| Fox Factory Holding Corp.(a) | 54,005 | 6,373,670 |
| Gentex Corp. | 303,373 | 9,183,101 |
| Goodyear Tire & Rubber Co. (The)(a) | 360,400 | 5,582,596 |
| Lear Corp. | 76,468 | 12,031,475 |
| Visteon Corp.(a) | 35,910 | 4,315,305 |
| Total | | 46,338,877 |
| Automobiles 0.5% |
| Harley-Davidson, Inc. | 197,371 | 8,151,422 |
| Thor Industries, Inc. | 71,227 | 6,446,044 |
| Total | | 14,597,466 |
| Common Stocks (continued) |
| Issuer | Shares | Value ($) |
| Diversified Consumer Services 0.9% |
| Graham Holdings Co., Class B | 5,117 | 3,075,982 |
| Grand Canyon Education, Inc.(a) | 51,401 | 4,463,149 |
| H&R Block, Inc. | 225,271 | 5,588,974 |
| Service Corp. International | 211,525 | 12,871,296 |
| Total | | 25,999,401 |
| Hotels, Restaurants & Leisure 3.0% |
| Boyd Gaming Corp.(a) | 105,194 | 7,462,462 |
| Choice Hotels International, Inc. | 42,098 | 6,076,846 |
| Churchill Downs, Inc. | 44,154 | 10,635,374 |
| Cracker Barrel Old Country Store, Inc. | 30,158 | 4,049,315 |
| Marriott Vacations Worldwide Corp. | 54,635 | 8,778,205 |
| Papa John’s International, Inc. | 41,512 | 4,434,312 |
| Scientific Games Corp.(a) | 123,791 | 7,788,930 |
| Six Flags Entertainment Corp.(a) | 99,258 | 4,333,604 |
| Texas Roadhouse, Inc. | 89,330 | 8,478,310 |
| Travel + Leisure Co. | 110,690 | 6,204,175 |
| Wendy’s Co. (The) | 226,398 | 5,148,291 |
| Wingstop, Inc. | 38,256 | 5,560,510 |
| Wyndham Hotels & Resorts, Inc. | 119,515 | 10,327,291 |
| Total | | 89,277,625 |
| Household Durables 1.6% |
| Helen of Troy Ltd.(a) | 30,948 | 6,365,075 |
| KB Home | 109,932 | 4,244,475 |
| Leggett & Platt, Inc. | 171,076 | 6,343,498 |
| Taylor Morrison Home Corp., Class A(a) | 157,627 | 4,649,997 |
| Tempur Sealy International, Inc. | 246,924 | 8,150,961 |
| Toll Brothers, Inc. | 146,753 | 7,962,818 |
| TopBuild Corp.(a) | 42,231 | 9,066,151 |
| Tri Pointe Homes, Inc.(a) | 142,552 | 3,188,888 |
| Total | | 49,971,863 |
The accompanying Notes to Financial Statements are an integral part of this statement.
| 8 | Columbia Mid Cap Index Fund | Annual Report 2022 |
Portfolio of Investments (continued)
February 28, 2022
| Common Stocks (continued) |
| Issuer | Shares | Value ($) |
| Leisure Products 1.3% |
| Brunswick Corp. | 98,886 | 9,445,591 |
| Callaway Golf Co.(a) | 150,313 | 3,718,743 |
| Mattel, Inc.(a) | 449,366 | 11,225,163 |
| Polaris, Inc. | 73,164 | 8,890,157 |
| YETI Holdings, Inc.(a) | 112,414 | 6,920,206 |
| Total | | 40,199,860 |
| Multiline Retail 0.9% |
| Kohl’s Corp. | 193,083 | 10,739,276 |
| Macy’s, Inc. | 397,244 | 10,296,564 |
| Nordstrom, Inc.(a) | 142,690 | 2,959,391 |
| Ollie’s Bargain Outlet Holdings, Inc.(a) | 77,621 | 3,351,675 |
| Total | | 27,346,906 |
| Specialty Retail 3.2% |
| American Eagle Outfitters, Inc. | 196,789 | 4,148,312 |
| AutoNation, Inc.(a) | 51,278 | 5,879,535 |
| Dick’s Sporting Goods, Inc. | 83,234 | 8,739,570 |
| Five Below, Inc.(a) | 71,857 | 11,756,524 |
| Foot Locker, Inc. | 115,840 | 3,662,861 |
| GameStop Corp., Class A(a) | 79,470 | 9,801,830 |
| Gap, Inc. (The) | 274,975 | 4,000,886 |
| Lithia Motors, Inc., Class A | 38,839 | 13,237,108 |
| Murphy U.S.A., Inc. | 30,248 | 5,467,023 |
| Restoration Hardware Holdings, Inc.(a) | 22,248 | 8,940,804 |
| Urban Outfitters, Inc.(a) | 84,532 | 2,325,475 |
| Victoria’s Secret & Co.(a) | 92,931 | 4,983,890 |
| Williams-Sonoma, Inc. | 95,386 | 13,817,616 |
| Total | | 96,761,434 |
| Textiles, Apparel & Luxury Goods 1.8% |
| Capri Holdings Ltd.(a) | 192,987 | 13,072,939 |
| Carter’s, Inc. | 54,213 | 5,241,313 |
| Columbia Sportswear Co. | 44,335 | 4,110,741 |
| Crocs, Inc.(a) | 75,480 | 6,319,941 |
| Deckers Outdoor Corp.(a) | 35,206 | 10,161,860 |
| Hanesbrands, Inc. | 447,909 | 6,920,194 |
| Skechers U.S.A., Inc., Class A(a) | 173,034 | 7,956,103 |
| Total | | 53,783,091 |
| Total Consumer Discretionary | 444,276,523 |
| Common Stocks (continued) |
| Issuer | Shares | Value ($) |
| Consumer Staples 3.5% |
| Beverages 0.2% |
| Boston Beer Co., Inc. (The), Class A(a) | 12,041 | 4,617,242 |
| Food & Staples Retailing 1.3% |
| BJ’s Wholesale Club Holdings, Inc.(a) | 175,139 | 11,010,989 |
| Casey’s General Stores, Inc. | 47,589 | 8,950,539 |
| Grocery Outlet Holding Corp.(a) | 112,072 | 3,116,722 |
| Performance Food Group, Inc.(a) | 197,933 | 11,092,165 |
| Sprouts Farmers Market, Inc.(a) | 143,989 | 4,100,807 |
| Total | | 38,271,222 |
| Food Products 1.7% |
| Darling Ingredients, Inc.(a) | 207,544 | 15,042,789 |
| Flowers Foods, Inc. | 254,878 | 6,986,206 |
| Hain Celestial Group, Inc. (The)(a) | 119,134 | 4,331,712 |
| Ingredion, Inc. | 85,343 | 7,573,338 |
| Lancaster Colony Corp. | 25,424 | 4,276,571 |
| Pilgrim’s Pride Corp.(a) | 62,510 | 1,473,986 |
| Post Holdings, Inc.(a) | 75,086 | 7,894,542 |
| Sanderson Farms, Inc. | 27,210 | 4,859,434 |
| Total | | 52,438,578 |
| Household Products 0.1% |
| Energizer Holdings, Inc. | 80,682 | 2,693,972 |
| Personal Products 0.2% |
| Coty, Inc., Class A(a) | 430,427 | 3,947,016 |
| Nu Skin Enterprises, Inc., Class A | 63,906 | 2,964,599 |
| Total | | 6,911,615 |
| Total Consumer Staples | 104,932,629 |
| Energy 2.7% |
| Energy Equipment & Services 0.5% |
| ChampionX Corp.(a) | 259,186 | 5,549,172 |
| NOV, Inc. | 501,122 | 8,594,243 |
| Total | | 14,143,415 |
| Oil, Gas & Consumable Fuels 2.2% |
| Antero Midstream Corp. | 416,481 | 4,181,469 |
| CNX Resources Corp.(a) | 270,896 | 4,426,441 |
| DT Midstream, Inc. | 124,074 | 6,588,330 |
| EQT Corp. | 387,822 | 8,974,201 |
| Equitrans Midstream Corp. | 521,464 | 3,342,584 |
The accompanying Notes to Financial Statements are an integral part of this statement.
Columbia Mid Cap Index Fund | Annual Report 2022
| 9 |
Portfolio of Investments (continued)
February 28, 2022
| Common Stocks (continued) |
| Issuer | Shares | Value ($) |
| HollyFrontier Corp.(a) | 191,752 | 5,838,848 |
| Murphy Oil Corp. | 186,230 | 6,456,594 |
| PDC Energy, Inc. | 124,906 | 8,058,935 |
| Targa Resources Corp. | 293,692 | 19,198,646 |
| Total | | 67,066,048 |
| Total Energy | 81,209,463 |
| Financials 14.5% |
| Banks 7.1% |
| Associated Banc-Corp. | 192,493 | 4,694,904 |
| Bank of Hawaii Corp. | 51,919 | 4,474,379 |
| Bank OZK | 155,053 | 7,290,592 |
| Cadence Bank | 251,331 | 7,947,086 |
| Cathay General Bancorp | 99,050 | 4,658,322 |
| Commerce Bancshares, Inc. | 142,377 | 10,219,821 |
| Cullen/Frost Bankers, Inc. | 72,735 | 10,235,997 |
| East West Bancorp, Inc. | 182,017 | 15,937,409 |
| First Financial Bankshares, Inc. | 164,469 | 7,881,354 |
| First Horizon Corp. | 693,595 | 16,285,611 |
| FNB Corp. | 434,409 | 5,834,113 |
| Fulton Financial Corp. | 206,897 | 3,728,284 |
| Glacier Bancorp, Inc. | 139,134 | 7,708,024 |
| Hancock Whitney Corp. | 111,368 | 6,200,970 |
| Home Bancshares, Inc. | 193,344 | 4,526,183 |
| International Bancshares Corp. | 68,273 | 2,936,422 |
| Old National Bancorp | 378,672 | 6,922,124 |
| PacWest Bancorp | 150,401 | 7,432,817 |
| Pinnacle Financial Partners, Inc. | 97,656 | 9,871,068 |
| Prosperity Bancshares, Inc. | 118,216 | 8,802,363 |
| Synovus Financial Corp. | 186,640 | 9,826,596 |
| Texas Capital Bancshares, Inc.(a) | 64,913 | 4,323,206 |
| UMB Financial Corp. | 55,205 | 5,623,181 |
| Umpqua Holdings Corp. | 277,851 | 5,932,119 |
| United Bankshares, Inc. | 174,860 | 6,403,373 |
| Valley National Bancorp | 521,981 | 7,292,075 |
| Webster Financial Corp. | 230,633 | 13,886,413 |
| Wintrust Financial Corp. | 73,120 | 7,265,203 |
| Total | | 214,140,009 |
| Common Stocks (continued) |
| Issuer | Shares | Value ($) |
| Capital Markets 2.0% |
| Affiliated Managers Group, Inc. | 52,141 | 7,214,229 |
| Evercore, Inc., Class A | 50,048 | 6,356,596 |
| Federated Hermes, Inc., Class B | 124,217 | 4,058,169 |
| Interactive Brokers Group, Inc., Class A | 112,071 | 7,416,859 |
| Janus Henderson Group PLC | 218,801 | 7,345,150 |
| Jefferies Financial Group, Inc. | 251,976 | 8,955,227 |
| SEI Investments Co. | 135,941 | 7,963,424 |
| Stifel Financial Corp. | 133,538 | 9,815,043 |
| Total | | 59,124,697 |
| Consumer Finance 0.6% |
| FirstCash Holdings, Inc. | 51,862 | 3,736,138 |
| Navient Corp. | 206,728 | 3,640,480 |
| PROG Holdings, Inc.(a) | 72,750 | 2,229,060 |
| SLM Corp. | 376,044 | 7,408,067 |
| Total | | 17,013,745 |
| Diversified Financial Services 0.3% |
| Voya Financial, Inc. | 142,368 | 9,588,485 |
| Insurance 3.8% |
| Alleghany Corp.(a) | 17,571 | 11,630,596 |
| American Financial Group, Inc. | 84,848 | 11,487,571 |
| Brighthouse Financial, Inc.(a) | 102,380 | 5,350,379 |
| CNO Financial Group, Inc. | 158,168 | 3,822,921 |
| First American Financial Corp. | 140,793 | 9,438,763 |
| Hanover Insurance Group, Inc. (The) | 45,637 | 6,366,818 |
| Kemper Corp. | 76,746 | 4,101,306 |
| Kinsale Capital Group, Inc. | 27,513 | 5,771,127 |
| Mercury General Corp. | 34,090 | 1,874,950 |
| Old Republic International Corp. | 366,221 | 9,649,923 |
| Primerica, Inc. | 50,652 | 6,579,188 |
| Reinsurance Group of America, Inc. | 86,707 | 9,612,338 |
| RenaissanceRe Holdings Ltd. | 59,028 | 8,900,242 |
| RLI Corp. | 51,070 | 5,183,605 |
| Selective Insurance Group, Inc. | 77,118 | 6,415,446 |
| Unum Group | 262,242 | 7,321,797 |
| Total | | 113,506,970 |
The accompanying Notes to Financial Statements are an integral part of this statement.
| 10 | Columbia Mid Cap Index Fund | Annual Report 2022 |
Portfolio of Investments (continued)
February 28, 2022
| Common Stocks (continued) |
| Issuer | Shares | Value ($) |
| Thrifts & Mortgage Finance 0.7% |
| Essent Group Ltd. | 141,646 | 6,257,920 |
| MGIC Investment Corp. | 417,610 | 6,339,320 |
| New York Community Bancorp, Inc. | 596,461 | 6,883,160 |
| Washington Federal, Inc. | 83,558 | 2,972,994 |
| Total | | 22,453,394 |
| Total Financials | 435,827,300 |
| Health Care 9.2% |
| Biotechnology 1.4% |
| Arrowhead Pharmaceuticals, Inc.(a) | 133,728 | 5,884,032 |
| Exelixis, Inc.(a) | 405,828 | 8,331,649 |
| Halozyme Therapeutics, Inc.(a) | 180,581 | 6,405,208 |
| Neurocrine Biosciences, Inc.(a) | 121,681 | 10,935,472 |
| United Therapeutics Corp.(a) | 57,767 | 9,600,875 |
| Total | | 41,157,236 |
| Health Care Equipment & Supplies 2.9% |
| Envista Holdings Corp.(a) | 206,979 | 9,934,992 |
| Globus Medical, Inc., Class A(a) | 101,382 | 7,129,182 |
| Haemonetics Corp.(a) | 65,550 | 3,782,890 |
| ICU Medical, Inc.(a) | 25,608 | 6,062,182 |
| Integra LifeSciences Holdings Corp.(a) | 93,431 | 6,265,483 |
| LivaNova PLC(a) | 68,269 | 5,380,963 |
| Masimo Corp.(a) | 65,164 | 10,260,072 |
| Neogen Corp.(a) | 137,876 | 4,922,173 |
| NuVasive, Inc.(a) | 66,359 | 3,591,349 |
| Penumbra, Inc.(a) | 45,044 | 9,988,057 |
| Quidel Corp.(a) | 48,644 | 5,146,049 |
| STAAR Surgical Co.(a) | 61,054 | 4,842,803 |
| Tandem Diabetes Care, Inc.(a) | 81,491 | 9,178,331 |
| Total | | 86,484,526 |
| Health Care Providers & Services 3.1% |
| Acadia Healthcare Co., Inc.(a) | 115,357 | 6,541,896 |
| Amedisys, Inc.(a) | 41,817 | 6,700,756 |
| Chemed Corp. | 19,746 | 9,444,314 |
| Encompass Health Corp. | 127,614 | 8,425,076 |
| HealthEquity, Inc.(a) | 107,113 | 5,753,039 |
| LHC Group, Inc.(a) | 40,623 | 5,531,634 |
| Molina Healthcare, Inc.(a) | 74,907 | 22,986,711 |
| Common Stocks (continued) |
| Issuer | Shares | Value ($) |
| Option Care Health, Inc.(a) | 177,652 | 4,565,656 |
| Patterson Companies, Inc. | 111,099 | 3,321,860 |
| Progyny, Inc.(a) | 89,313 | 3,515,360 |
| R1 RCM, Inc.(a) | 170,913 | 4,647,125 |
| Tenet Healthcare Corp.(a) | 137,406 | 11,815,542 |
| Total | | 93,248,969 |
| Life Sciences Tools & Services 1.3% |
| Bruker Corp. | 130,329 | 9,171,252 |
| Medpace Holdings, Inc.(a) | 36,878 | 5,641,228 |
| Repligen Corp.(a) | 65,952 | 12,972,758 |
| Syneos Health, Inc.(a) | 133,001 | 10,533,679 |
| Total | | 38,318,917 |
| Pharmaceuticals 0.5% |
| Jazz Pharmaceuticals PLC(a) | 78,845 | 10,834,880 |
| Perrigo Co. PLC | 171,586 | 6,094,734 |
| Total | | 16,929,614 |
| Total Health Care | 276,139,262 |
| Industrials 18.0% |
| Aerospace & Defense 1.3% |
| Axon Enterprise, Inc.(a) | 84,240 | 11,814,660 |
| Curtiss-Wright Corp. | 50,331 | 7,424,829 |
| Hexcel Corp. | 107,607 | 6,230,445 |
| Mercury Systems, Inc.(a) | 72,657 | 4,375,405 |
| Woodward, Inc. | 80,864 | 10,078,080 |
| Total | | 39,923,419 |
| Air Freight & Logistics 0.4% |
| GXO Logistics, Inc.(a) | 126,461 | 10,613,872 |
| Airlines 0.2% |
| JetBlue Airways Corp.(a) | 407,924 | 6,228,999 |
| Building Products 2.6% |
| Builders FirstSource, Inc.(a) | 245,629 | 18,279,710 |
| Carlisle Companies, Inc. | 67,064 | 15,920,994 |
| Lennox International, Inc. | 43,177 | 11,525,237 |
| Owens Corning | 128,890 | 12,011,259 |
| Simpson Manufacturing Co., Inc. | 55,718 | 6,603,140 |
| Trex Company, Inc.(a) | 147,655 | 13,560,635 |
| Total | | 77,900,975 |
The accompanying Notes to Financial Statements are an integral part of this statement.
Columbia Mid Cap Index Fund | Annual Report 2022
| 11 |
Portfolio of Investments (continued)
February 28, 2022
| Common Stocks (continued) |
| Issuer | Shares | Value ($) |
| Commercial Services & Supplies 1.5% |
| Brink’s Co. (The) | 63,048 | 4,417,143 |
| Clean Harbors, Inc.(a) | 64,208 | 6,127,369 |
| IAA, Inc.(a) | 172,961 | 6,354,587 |
| MillerKnoll, Inc. | 97,192 | 3,778,825 |
| MSA Safety, Inc. | 46,769 | 6,505,568 |
| Stericycle, Inc.(a) | 117,828 | 6,876,442 |
| Tetra Tech, Inc. | 69,354 | 11,011,335 |
| Total | | 45,071,269 |
| Construction & Engineering 1.3% |
| AECOM | 184,782 | 13,426,260 |
| Dycom Industries, Inc.(a) | 38,699 | 3,369,135 |
| EMCOR Group, Inc. | 68,460 | 7,909,869 |
| Fluor Corp.(a) | 181,383 | 3,928,756 |
| MasTec, Inc.(a) | 73,386 | 5,779,881 |
| Valmont Industries, Inc. | 27,223 | 5,892,418 |
| Total | | 40,306,319 |
| Electrical Equipment 1.8% |
| Acuity Brands, Inc. | 44,797 | 8,169,629 |
| EnerSys | 53,732 | 3,907,928 |
| Hubbell, Inc. | 69,790 | 12,440,068 |
| nVent Electric PLC | 215,790 | 7,321,755 |
| Regal Rexnord Corp. | 86,911 | 13,936,179 |
| Sunrun, Inc.(a) | 265,516 | 7,243,276 |
| Vicor Corp.(a) | 27,509 | 2,056,848 |
| Total | | 55,075,683 |
| Machinery 4.3% |
| AGCO Corp. | 78,709 | 9,457,673 |
| Colfax Corp.(a) | 172,723 | 6,945,192 |
| Crane Co. | 64,027 | 6,471,849 |
| Donaldson Co., Inc. | 158,530 | 8,603,423 |
| Flowserve Corp. | 167,089 | 5,074,493 |
| Graco, Inc. | 218,007 | 15,716,125 |
| ITT, Inc. | 109,795 | 9,647,687 |
| Kennametal, Inc. | 107,288 | 3,402,103 |
| Lincoln Electric Holdings, Inc. | 75,738 | 9,653,566 |
| Middleby Corp. (The)(a) | 71,349 | 12,673,009 |
| Oshkosh Corp. | 88,036 | 9,775,517 |
| Common Stocks (continued) |
| Issuer | Shares | Value ($) |
| Terex Corp. | 89,529 | 3,695,757 |
| Timken Co. (The) | 88,545 | 5,805,010 |
| Toro Co. (The) | 136,532 | 12,808,067 |
| Trinity Industries, Inc. | 104,911 | 3,027,731 |
| Watts Water Technologies, Inc., Class A | 35,347 | 5,088,201 |
| Total | | 127,845,403 |
| Marine 0.2% |
| Kirby Corp.(a) | 77,102 | 5,023,195 |
| Professional Services 1.6% |
| ASGN, Inc.(a) | 66,826 | 7,403,652 |
| CACI International, Inc., Class A(a) | 29,920 | 8,371,317 |
| FTI Consulting, Inc.(a) | 43,980 | 6,421,080 |
| Insperity, Inc. | 45,928 | 4,131,224 |
| KBR, Inc. | 179,937 | 8,932,073 |
| ManpowerGroup, Inc. | 69,571 | 7,394,006 |
| Science Applications International Corp. | 73,837 | 6,474,766 |
| Total | | 49,128,118 |
| Road & Rail 1.9% |
| Avis Budget Group, Inc.(a) | 51,406 | 9,429,917 |
| Knight-Swift Transportation Holdings, Inc. | 212,865 | 11,596,885 |
| Landstar System, Inc. | 48,881 | 7,547,715 |
| Ryder System, Inc. | 68,870 | 5,429,711 |
| Saia, Inc.(a) | 33,781 | 9,702,917 |
| Werner Enterprises, Inc. | 78,068 | 3,392,835 |
| XPO Logistics, Inc.(a) | 126,536 | 9,196,636 |
| Total | | 56,296,616 |
| Trading Companies & Distributors 0.9% |
| GATX Corp. | 45,534 | 4,855,290 |
| MSC Industrial Direct Co., Inc., Class A | 60,054 | 4,652,984 |
| Univar, Inc.(a) | 219,280 | 6,734,089 |
| Watsco, Inc. | 42,361 | 11,567,095 |
| Total | | 27,809,458 |
| Total Industrials | 541,223,326 |
The accompanying Notes to Financial Statements are an integral part of this statement.
| 12 | Columbia Mid Cap Index Fund | Annual Report 2022 |
Portfolio of Investments (continued)
February 28, 2022
| Common Stocks (continued) |
| Issuer | Shares | Value ($) |
| Information Technology 14.2% |
| Communications Equipment 1.0% |
| Calix, Inc.(a) | 70,328 | 3,821,624 |
| Ciena Corp.(a) | 198,720 | 13,596,422 |
| Lumentum Holdings, Inc.(a) | 92,736 | 9,167,881 |
| Viasat, Inc.(a) | 94,203 | 4,299,425 |
| Total | | 30,885,352 |
| Electronic Equipment, Instruments & Components 3.1% |
| Arrow Electronics, Inc.(a) | 89,310 | 10,885,103 |
| Avnet, Inc. | 127,267 | 5,354,123 |
| Belden, Inc. | 57,589 | 3,245,140 |
| Cognex Corp. | 226,772 | 15,320,716 |
| Coherent, Inc.(a) | 31,470 | 8,318,150 |
| II-VI, Inc.(a) | 136,141 | 9,456,354 |
| Jabil, Inc. | 183,849 | 10,628,311 |
| Littelfuse, Inc. | 31,594 | 8,157,887 |
| National Instruments Corp. | 169,159 | 6,791,734 |
| TD SYNNEX Corp. | 52,952 | 5,392,102 |
| Vishay Intertechnology, Inc. | 170,222 | 3,266,560 |
| Vontier Corp. | 216,845 | 5,269,333 |
| Total | | 92,085,513 |
| IT Services 2.3% |
| Alliance Data Systems Corp. | 63,857 | 4,307,155 |
| Concentrix Corp. | 55,029 | 10,999,747 |
| Euronet Worldwide, Inc.(a) | 67,796 | 8,693,481 |
| Genpact Ltd. | 221,915 | 9,284,924 |
| Kyndryl Holdings, Inc.(a) | 229,769 | 3,644,136 |
| LiveRamp Holdings, Inc.(a) | 87,340 | 3,769,594 |
| MAXIMUS, Inc. | 78,847 | 6,217,874 |
| Sabre Corp.(a) | 414,858 | 4,534,398 |
| Western Union Co. (The) | 515,636 | 9,374,263 |
| WEX, Inc.(a) | 57,487 | 9,687,134 |
| Total | | 70,512,706 |
| Semiconductors & Semiconductor Equipment 3.9% |
| Amkor Technology, Inc. | 128,593 | 2,915,203 |
| Azenta, Inc. | 95,361 | 8,345,995 |
| Cirrus Logic, Inc.(a) | 73,286 | 6,366,355 |
| CMC Materials, Inc. | 36,459 | 6,760,592 |
| Common Stocks (continued) |
| Issuer | Shares | Value ($) |
| First Solar, Inc.(a) | 126,834 | 9,549,332 |
| Lattice Semiconductor Corp.(a) | 175,647 | 10,999,015 |
| MKS Instruments, Inc. | 71,135 | 10,712,931 |
| Power Integrations, Inc. | 77,385 | 6,964,650 |
| Semtech Corp.(a) | 82,599 | 5,730,719 |
| Silicon Laboratories, Inc.(a) | 51,546 | 7,923,136 |
| SiTime Corp.(a) | 19,224 | 3,885,939 |
| SunPower Corp.(a) | 106,504 | 1,909,617 |
| Synaptics, Inc.(a),(b) | 50,371 | 11,506,247 |
| Universal Display Corp. | 55,611 | 8,614,700 |
| Wolfspeed, Inc.(a) | 148,648 | 15,269,123 |
| Total | | 117,453,554 |
| Software 3.8% |
| ACI Worldwide, Inc.(a) | 150,796 | 5,054,682 |
| Aspen Technology, Inc.(a) | 85,834 | 13,081,960 |
| Blackbaud, Inc.(a) | 53,143 | 3,320,906 |
| CDK Global, Inc. | 151,783 | 6,881,841 |
| Cerence, Inc.(a) | 48,749 | 1,760,327 |
| CommVault Systems, Inc.(a) | 58,372 | 3,672,183 |
| Digital Turbine, Inc.(a) | 112,783 | 5,467,720 |
| Envestnet, Inc.(a) | 70,089 | 5,244,059 |
| Fair Isaac Corp.(a) | 35,091 | 16,534,528 |
| Manhattan Associates, Inc.(a) | 81,169 | 10,850,672 |
| Mimecast Ltd.(a) | 79,200 | 6,298,776 |
| NCR Corp.(a) | 169,310 | 6,860,441 |
| Paylocity Holding Corp.(a) | 50,817 | 10,795,564 |
| Qualys, Inc.(a) | 42,826 | 5,366,526 |
| SailPoint Technologies Holdings, Inc.(a) | 119,625 | 4,948,886 |
| Teradata Corp.(a) | 139,168 | 6,957,008 |
| Total | | 113,096,079 |
| Technology Hardware, Storage & Peripherals 0.1% |
| Xerox Holdings Corp. | 176,306 | 3,474,991 |
| Total Information Technology | 427,508,195 |
The accompanying Notes to Financial Statements are an integral part of this statement.
Columbia Mid Cap Index Fund | Annual Report 2022
| 13 |
Portfolio of Investments (continued)
February 28, 2022
| Common Stocks (continued) |
| Issuer | Shares | Value ($) |
| Materials 6.9% |
| Chemicals 2.5% |
| Ashland Global Holdings, Inc. | 72,446 | 6,685,317 |
| Avient Corp. | 117,351 | 6,148,019 |
| Cabot Corp. | 72,761 | 5,323,195 |
| Chemours Co. LLC (The) | 209,022 | 5,769,007 |
| Ingevity Corp.(a) | 50,390 | 3,438,110 |
| Minerals Technologies, Inc. | 42,703 | 2,988,783 |
| NewMarket Corp. | 8,861 | 2,815,671 |
| Olin Corp. | 183,983 | 9,476,964 |
| RPM International, Inc. | 166,381 | 14,070,841 |
| Scotts Miracle-Gro Co. (The), Class A | 52,249 | 7,317,995 |
| Sensient Technologies Corp. | 53,905 | 4,427,218 |
| Valvoline, Inc. | 231,854 | 7,495,840 |
| Total | | 75,956,960 |
| Construction Materials 0.2% |
| Eagle Materials, Inc. | 52,171 | 7,138,558 |
| Containers & Packaging 0.8% |
| AptarGroup, Inc. | 84,433 | 10,290,694 |
| Greif, Inc., Class A | 34,056 | 1,957,879 |
| Silgan Holdings, Inc. | 107,629 | 4,507,503 |
| Sonoco Products Co. | 126,118 | 7,405,649 |
| Total | | 24,161,725 |
| Metals & Mining 3.1% |
| Alcoa Corp. | 239,988 | 18,080,696 |
| Cleveland-Cliffs, Inc.(a) | 583,713 | 13,051,823 |
| Commercial Metals Co. | 154,676 | 5,962,760 |
| Reliance Steel & Aluminum Co. | 80,365 | 15,339,267 |
| Royal Gold, Inc. | 84,190 | 10,208,879 |
| Steel Dynamics, Inc. | 241,817 | 17,067,444 |
| United States Steel Corp. | 346,615 | 9,431,394 |
| Worthington Industries, Inc. | 41,492 | 2,365,874 |
| Total | | 91,508,137 |
| Paper & Forest Products 0.3% |
| Louisiana-Pacific Corp. | 112,859 | 8,120,205 |
| Total Materials | 206,885,585 |
| Common Stocks (continued) |
| Issuer | Shares | Value ($) |
| Real Estate 10.0% |
| Equity Real Estate Investment Trusts (REITS) 9.5% |
| American Campus Communities, Inc. | 178,490 | 9,604,547 |
| Apartment Income REIT Corp. | 201,357 | 10,392,035 |
| Brixmor Property Group, Inc. | 380,933 | 9,569,037 |
| Camden Property Trust | 131,083 | 21,643,114 |
| Corporate Office Properties Trust | 144,074 | 3,776,180 |
| Cousins Properties, Inc. | 190,715 | 7,367,320 |
| CyrusOne, Inc. | 162,784 | 14,707,534 |
| Douglas Emmett, Inc. | 225,088 | 7,135,290 |
| EastGroup Properties, Inc. | 52,183 | 9,954,429 |
| EPR Properties | 95,949 | 4,778,260 |
| First Industrial Realty Trust, Inc. | 167,117 | 9,622,597 |
| Healthcare Realty Trust, Inc. | 189,245 | 4,935,510 |
| Highwoods Properties, Inc. | 133,887 | 5,837,473 |
| Hudson Pacific Properties, Inc. | 195,576 | 5,163,206 |
| JBG SMITH Properties | 146,425 | 3,906,619 |
| Kilroy Realty Corp. | 134,442 | 9,628,736 |
| Kite Realty Group Trust | 280,924 | 6,160,663 |
| Lamar Advertising Co., Class A | 111,359 | 12,144,812 |
| Life Storage, Inc. | 105,205 | 13,317,901 |
| Macerich Co. (The) | 273,254 | 4,180,786 |
| Medical Properties Trust, Inc. | 764,846 | 15,556,968 |
| National Retail Properties, Inc. | 225,256 | 9,598,158 |
| National Storage Affiliates Trust | 105,105 | 6,124,468 |
| Omega Healthcare Investors, Inc. | 306,521 | 8,634,697 |
| Park Hotels & Resorts, Inc.(a) | 303,321 | 5,714,568 |
| Pebblebrook Hotel Trust | 168,519 | 3,793,363 |
| Physicians Realty Trust | 282,554 | 4,594,328 |
| PotlatchDeltic Corp. | 86,067 | 4,725,078 |
| PS Business Parks, Inc. | 25,797 | 4,109,204 |
| Rayonier, Inc. | 183,614 | 7,289,476 |
| Rexford Industrial Realty, Inc. | 194,305 | 13,626,610 |
| Sabra Health Care REIT, Inc. | 293,315 | 3,939,220 |
| SL Green Realty Corp. | 85,588 | 6,805,958 |
| Spirit Realty Capital, Inc. | 158,172 | 7,334,436 |
| STORE Capital Corp. | 314,772 | 9,669,796 |
| Total | | 285,342,377 |
The accompanying Notes to Financial Statements are an integral part of this statement.
| 14 | Columbia Mid Cap Index Fund | Annual Report 2022 |
Portfolio of Investments (continued)
February 28, 2022
| Common Stocks (continued) |
| Issuer | Shares | Value ($) |
| Real Estate Management & Development 0.5% |
| Jones Lang LaSalle, Inc.(a) | 64,733 | 15,938,559 |
| Total Real Estate | 301,280,936 |
| Utilities 3.3% |
| Electric Utilities 1.0% |
| Allete, Inc. | 67,432 | 4,244,170 |
| Hawaiian Electric Industries, Inc. | 140,208 | 5,745,724 |
| IDACORP, Inc. | 64,795 | 6,735,440 |
| OGE Energy Corp. | 256,755 | 9,641,150 |
| PNM Resources, Inc. | 110,097 | 4,973,082 |
| Total | | 31,339,566 |
| Gas Utilities 1.3% |
| National Fuel Gas Co. | 116,955 | 7,279,279 |
| New Jersey Resources Corp. | 123,691 | 5,395,401 |
| ONE Gas, Inc. | 68,735 | 5,711,191 |
| Southwest Gas Holdings, Inc. | 77,453 | 5,494,516 |
| Spire, Inc. | 66,293 | 4,448,923 |
| UGI Corp. | 268,199 | 10,309,570 |
| Total | | 38,638,880 |
| Common Stocks (continued) |
| Issuer | Shares | Value ($) |
| Multi-Utilities 0.5% |
| Black Hills Corp. | 81,859 | 5,729,311 |
| MDU Resources Group, Inc. | 260,829 | 6,982,392 |
| NorthWestern Corp. | 67,537 | 4,084,638 |
| Total | | 16,796,341 |
| Water Utilities 0.5% |
| Essential Utilities, Inc. | 295,005 | 13,897,686 |
| Total Utilities | 100,672,473 |
Total Common Stocks
(Cost $1,795,874,299) | 2,970,359,586 |
|
| Money Market Funds 1.3% |
| | Shares | Value ($) |
| Columbia Short-Term Cash Fund, 0.168%(c),(d) | 38,066,084 | 38,054,664 |
Total Money Market Funds
(Cost $38,053,968) | 38,054,664 |
Total Investments in Securities
(Cost: $1,833,928,267) | 3,008,414,250 |
| Other Assets & Liabilities, Net | | (696,053) |
| Net Assets | 3,007,718,197 |
At February 28, 2022, securities and/or cash totaling $3,517,822 were pledged as collateral.
Investments in derivatives
| Long futures contracts |
| Description | Number of
contracts | Expiration
date | Trading
currency | Notional
amount | Value/Unrealized
appreciation ($) | Value/Unrealized
depreciation ($) |
| S&P Mid 400 Index E-mini | 152 | 03/2022 | USD | 40,401,600 | 501,077 | — |
Notes to Portfolio of Investments
| (a) | Non-income producing investment. |
| (b) | This security or a portion of this security has been pledged as collateral in connection with derivative contracts. |
| (c) | The rate shown is the seven-day current annualized yield at February 28, 2022. |
| (d) | As defined in the Investment Company Act of 1940, as amended, an affiliated company is one in which the Fund owns 5% or more of the company’s outstanding voting securities, or a company which is under common ownership or control with the Fund. The value of the holdings and transactions in these affiliated companies during the year ended February 28, 2022 are as follows: |
| Affiliated issuers | Beginning
of period($) | Purchases($) | Sales($) | Net change in
unrealized
appreciation
(depreciation)($) | End of
period($) | Realized gain
(loss)($) | Dividends($) | End of
period shares |
| Columbia Short-Term Cash Fund, 0.168% |
| | 42,608,964 | 561,500,214 | (566,055,203) | 689 | 38,054,664 | (5,487) | 20,181 | 38,066,084 |
The accompanying Notes to Financial Statements are an integral part of this statement.
Columbia Mid Cap Index Fund | Annual Report 2022
| 15 |
Portfolio of Investments (continued)
February 28, 2022
Currency Legend
Fair value measurements
The Fund categorizes its fair value measurements according to a three-level hierarchy that maximizes the use of observable inputs and minimizes the use of unobservable inputs by prioritizing that the most observable input be used when available. Observable inputs are those that market participants would use in pricing an investment based on market data obtained from sources independent of the reporting entity. Unobservable inputs are those that reflect the Fund’s assumptions about the information market participants would use in pricing an investment. An investment’s level within the fair value hierarchy is based on the lowest level of any input that is deemed significant to the asset’s or liability’s fair value measurement. The input levels are not necessarily an indication of the risk or liquidity associated with investments at that level. For example, certain U.S. government securities are generally high quality and liquid, however, they are reflected as Level 2 because the inputs used to determine fair value may not always be quoted prices in an active market.
Fair value inputs are summarized in the three broad levels listed below:
| ■ | Level 1 — Valuations based on quoted prices for investments in active markets that the Fund has the ability to access at the measurement date. Valuation adjustments are not applied to Level 1 investments. |
| ■ | Level 2 — Valuations based on other significant observable inputs (including quoted prices for similar securities, interest rates, prepayment speeds, credit risks, etc.). |
| ■ | Level 3 — Valuations based on significant unobservable inputs (including the Fund’s own assumptions and judgment in determining the fair value of investments). |
Inputs that are used in determining fair value of an investment may include price information, credit data, volatility statistics, and other factors. These inputs can be either observable or unobservable. The availability of observable inputs can vary between investments, and is affected by various factors such as the type of investment, and the volume and level of activity for that investment or similar investments in the marketplace. The inputs will be considered by the Investment Manager, along with any other relevant factors in the calculation of an investment’s fair value. The Fund uses prices and inputs that are current as of the measurement date, which may include periods of market dislocations. During these periods, the availability of prices and inputs may be reduced for many investments. This condition could cause an investment to be reclassified between the various levels within the hierarchy.
Investments falling into the Level 3 category are primarily supported by quoted prices from brokers and dealers participating in the market for those investments. However, these may be classified as Level 3 investments due to lack of market transparency and corroboration to support these quoted prices. Additionally, valuation models may be used as the pricing source for any remaining investments classified as Level 3. These models may rely on one or more significant unobservable inputs and/or significant assumptions by the Investment Manager. Inputs used in valuations may include, but are not limited to, financial statement analysis, capital account balances, discount rates and estimated cash flows, and comparable company data.
Under the direction of the Fund’s Board of Trustees (the Board), the Investment Manager’s Valuation Committee (the Committee) is responsible for overseeing the valuation procedures approved by the Board. The Committee consists of voting and non-voting members from various groups within the Investment Manager’s organization, including operations and accounting, trading and investments, compliance, risk management and legal.
The Committee meets at least monthly to review and approve valuation matters, which may include a description of specific valuation determinations, data regarding pricing information received from approved pricing vendors and brokers and the results of Board-approved valuation control policies and procedures (the Policies). The Policies address, among other things, instances when market quotations are or are not readily available, including recommendations of third party pricing vendors and a determination of appropriate pricing methodologies; events that require specific valuation determinations and assessment of fair value techniques; securities with a potential for stale pricing, including those that are illiquid, restricted, or in default; and the effectiveness of third party pricing vendors, including periodic reviews of vendors. The Committee meets more frequently, as needed, to discuss additional valuation matters, which may include the need to review back-testing results, review time-sensitive information or approve related valuation actions. The Committee reports to the Board, with members of the Committee meeting with the Board at each of its regularly scheduled meetings to discuss valuation matters and actions during the period, similar to those described earlier.
The following table is a summary of the inputs used to value the Fund’s investments at February 28, 2022:
| | Level 1 ($) | Level 2 ($) | Level 3 ($) | Total ($) |
| Investments in Securities | | | | |
| Common Stocks | | | | |
| Communication Services | 50,403,894 | — | — | 50,403,894 |
| Consumer Discretionary | 444,276,523 | — | — | 444,276,523 |
| Consumer Staples | 104,932,629 | — | — | 104,932,629 |
| Energy | 81,209,463 | — | — | 81,209,463 |
| Financials | 435,827,300 | — | — | 435,827,300 |
| Health Care | 276,139,262 | — | — | 276,139,262 |
| Industrials | 541,223,326 | — | — | 541,223,326 |
| Information Technology | 427,508,195 | — | — | 427,508,195 |
| Materials | 206,885,585 | — | — | 206,885,585 |
| Real Estate | 301,280,936 | — | — | 301,280,936 |
| Utilities | 100,672,473 | — | — | 100,672,473 |
| Total Common Stocks | 2,970,359,586 | — | — | 2,970,359,586 |
| Money Market Funds | 38,054,664 | — | — | 38,054,664 |
| Total Investments in Securities | 3,008,414,250 | — | — | 3,008,414,250 |
The accompanying Notes to Financial Statements are an integral part of this statement.
| 16 | Columbia Mid Cap Index Fund | Annual Report 2022 |
Portfolio of Investments (continued)
February 28, 2022
Fair value measurements (continued)
| | Level 1 ($) | Level 2 ($) | Level 3 ($) | Total ($) |
| Investments in Derivatives | | | | |
| Asset | | | | |
| Futures Contracts | 501,077 | — | — | 501,077 |
| Total | 3,008,915,327 | — | — | 3,008,915,327 |
See the Portfolio of Investments for all investment classifications not indicated in the table.
Derivative instruments are valued at unrealized appreciation (depreciation).
The accompanying Notes to Financial Statements are an integral part of this statement.
Columbia Mid Cap Index Fund | Annual Report 2022
| 17 |
Statement of Assets and Liabilities
February 28, 2022
| Assets | |
| Investments in securities, at value | |
| Unaffiliated issuers (cost $1,795,874,299) | $2,970,359,586 |
| Affiliated issuers (cost $38,053,968) | 38,054,664 |
| Receivable for: | |
| Capital shares sold | 2,358,424 |
| Dividends | 2,157,745 |
| Foreign tax reclaims | 11,153 |
| Expense reimbursement due from Investment Manager | 23,167 |
| Prepaid expenses | 26,205 |
| Total assets | 3,012,990,944 |
| Liabilities | |
| Payable for: | |
| Capital shares purchased | 4,464,467 |
| Variation margin for futures contracts | 58,400 |
| Management services fees | 49,506 |
| Distribution and/or service fees | 15,817 |
| Transfer agent fees | 324,668 |
| Compensation of board members | 297,296 |
| Compensation of chief compliance officer | 502 |
| Other expenses | 62,091 |
| Total liabilities | 5,272,747 |
| Net assets applicable to outstanding capital stock | $3,007,718,197 |
| Represented by | |
| Paid in capital | 1,708,481,438 |
| Total distributable earnings (loss) | 1,299,236,759 |
| Total - representing net assets applicable to outstanding capital stock | $3,007,718,197 |
| Class A | |
| Net assets | $768,486,587 |
| Shares outstanding | 47,631,002 |
| Net asset value per share | $16.13 |
| Institutional Class | |
| Net assets | $1,534,549,667 |
| Shares outstanding | 95,716,345 |
| Net asset value per share | $16.03 |
| Institutional 2 Class | |
| Net assets | $634,732,233 |
| Shares outstanding | 38,426,461 |
| Net asset value per share | $16.52 |
| Institutional 3 Class | |
| Net assets | $69,949,710 |
| Shares outstanding | 4,476,639 |
| Net asset value per share | $15.63 |
The accompanying Notes to Financial Statements are an integral part of this statement.
| 18 | Columbia Mid Cap Index Fund | Annual Report 2022 |
Statement of Operations
Year Ended February 28, 2022
| Net investment income | |
| Income: | |
| Dividends — unaffiliated issuers | $41,562,040 |
| Dividends — affiliated issuers | 20,181 |
| Total income | 41,582,221 |
| Expenses: | |
| Management services fees | 6,746,461 |
| Distribution and/or service fees | |
| Class A | 2,147,729 |
| Transfer agent fees | |
| Class A | 970,748 |
| Institutional Class | 1,891,268 |
| Institutional 2 Class | 442,114 |
| Institutional 3 Class | 6,183 |
| Compensation of board members | 94,246 |
| Custodian fees | 37,305 |
| Printing and postage fees | 81,194 |
| Registration fees | 83,517 |
| Licensing fees and expenses | 35,084 |
| Audit fees | 32,250 |
| Legal fees | 47,183 |
| Interest on collateral | 432 |
| Interest on interfund lending | 58 |
| Compensation of chief compliance officer | 478 |
| Other | 53,912 |
| Total expenses | 12,670,162 |
| Fees waived or expenses reimbursed by Investment Manager and its affiliates | (3,771,140) |
| Expense reduction | (60) |
| Total net expenses | 8,898,962 |
| Net investment income | 32,683,259 |
| Realized and unrealized gain (loss) — net | |
| Net realized gain (loss) on: | |
| Investments — unaffiliated issuers | 519,362,482 |
| Investments — affiliated issuers | (5,487) |
| Futures contracts | 3,191,852 |
| Net realized gain | 522,548,847 |
| Net change in unrealized appreciation (depreciation) on: | |
| Investments — unaffiliated issuers | (282,619,796) |
| Investments — affiliated issuers | 689 |
| Futures contracts | 746,083 |
| Net change in unrealized appreciation (depreciation) | (281,873,024) |
| Net realized and unrealized gain | 240,675,823 |
| Net increase in net assets resulting from operations | $273,359,082 |
The accompanying Notes to Financial Statements are an integral part of this statement.
Columbia Mid Cap Index Fund | Annual Report 2022
| 19 |
Statement of Changes in Net Assets
| | Year Ended
February 28, 2022 | Year Ended
February 28, 2021 |
| Operations | | |
| Net investment income | $32,683,259 | $35,814,864 |
| Net realized gain | 522,548,847 | 339,867,522 |
| Net change in unrealized appreciation (depreciation) | (281,873,024) | 655,182,551 |
| Net increase in net assets resulting from operations | 273,359,082 | 1,030,864,937 |
| Distributions to shareholders | | |
| Net investment income and net realized gains | | |
| Class A | (135,070,252) | (88,045,504) |
| Institutional Class | (273,707,103) | (151,169,164) |
| Institutional 2 Class | (116,221,827) | (70,141,704) |
| Institutional 3 Class | (12,289,676) | (4,906,518) |
| Total distributions to shareholders | (537,288,858) | (314,262,890) |
| Decrease in net assets from capital stock activity | (180,940,391) | (531,088,162) |
| Total increase (decrease) in net assets | (444,870,167) | 185,513,885 |
| Net assets at beginning of year | 3,452,588,364 | 3,267,074,479 |
| Net assets at end of year | $3,007,718,197 | $3,452,588,364 |
| | Year Ended | Year Ended |
| | February 28, 2022 | February 28, 2021 |
| | Shares | Dollars ($) | Shares | Dollars ($) |
| Capital stock activity |
| Class A | | | | |
| Subscriptions | 10,500,248 | 189,096,084 | 14,672,411 | 203,619,796 |
| Distributions reinvested | 5,983,974 | 104,160,218 | 4,814,076 | 70,385,948 |
| Redemptions | (19,766,784) | (360,095,460) | (38,633,224) | (554,500,739) |
| Net decrease | (3,282,562) | (66,839,158) | (19,146,737) | (280,494,995) |
| Institutional Class | | | | |
| Subscriptions | 10,884,215 | 193,765,369 | 16,972,325 | 228,747,103 |
| Distributions reinvested | 10,834,133 | 187,145,079 | 7,184,928 | 104,888,905 |
| Redemptions | (19,167,274) | (347,443,155) | (43,827,331) | (604,187,359) |
| Net increase (decrease) | 2,551,074 | 33,467,293 | (19,670,078) | (270,551,351) |
| Institutional 2 Class | | | | |
| Subscriptions | 11,582,940 | 213,043,448 | 20,680,339 | 302,766,208 |
| Distributions reinvested | 5,016,559 | 89,542,477 | 3,701,848 | 55,785,031 |
| Redemptions | (24,818,436) | (462,546,284) | (24,052,108) | (352,694,991) |
| Net increase (decrease) | (8,218,937) | (159,960,359) | 330,079 | 5,856,248 |
| Institutional 3 Class | | | | |
| Subscriptions | 1,857,561 | 32,795,913 | 1,843,887 | 25,848,897 |
| Distributions reinvested | 518,830 | 8,757,949 | 263,153 | 3,809,292 |
| Redemptions | (1,652,664) | (29,162,029) | (1,100,104) | (15,556,253) |
| Net increase | 723,727 | 12,391,833 | 1,006,936 | 14,101,936 |
| Total net decrease | (8,226,698) | (180,940,391) | (37,479,800) | (531,088,162) |
The accompanying Notes to Financial Statements are an integral part of this statement.
| 20 | Columbia Mid Cap Index Fund | Annual Report 2022 |
[THIS PAGE INTENTIONALLY LEFT BLANK]
Columbia Mid Cap Index Fund | Annual Report 2022
| 21 |
The following table is intended to help you understand the Fund’s financial performance. Certain information reflects financial results for a single share of a class held for the periods shown. Per share net investment income (loss) amounts are calculated based on average shares outstanding during the period. Total return assumes reinvestment of all dividends and distributions, if any. Total return does not reflect payment of sales charges, if any. Total return and portfolio turnover are not annualized for periods of less than one year. The portfolio turnover rate is calculated without regard to purchase and sales transactions of short-term instruments and certain derivatives, if any. If such transactions were included, the Fund’s portfolio turnover rate may be higher.
| | Net asset value,
beginning of
period | Net
investment
income | Net
realized
and
unrealized
gain (loss) | Total from
investment
operations | Distributions
from net
investment
income | Distributions
from net
realized
gains | Total
distributions to
shareholders |
| Class A |
| Year Ended 2/28/2022 | $17.72 | 0.14(c) | 1.30 | 1.44 | (0.13) | (2.90) | (3.03) |
| Year Ended 2/28/2021 | $14.07 | 0.14 | 5.02 | 5.16 | (0.16) | (1.35) | (1.51) |
| Year Ended 2/29/2020 | $15.47 | 0.18 | (0.71) | (0.53) | (0.19) | (0.68) | (0.87) |
| Year Ended 2/28/2019 | $16.25 | 0.18 | 0.36 | 0.54 | (0.17) | (1.15) | (1.32) |
| Year Ended 2/28/2018 | $16.05 | 0.17 | 1.26 | 1.43 | (0.16) | (1.07) | (1.23) |
| Institutional Class |
| Year Ended 2/28/2022 | $17.63 | 0.19(c) | 1.29 | 1.48 | (0.18) | (2.90) | (3.08) |
| Year Ended 2/28/2021 | $14.00 | 0.18 | 4.99 | 5.17 | (0.19) | (1.35) | (1.54) |
| Year Ended 2/29/2020 | $15.39 | 0.22 | (0.70) | (0.48) | (0.23) | (0.68) | (0.91) |
| Year Ended 2/28/2019 | $16.18 | 0.22 | 0.35 | 0.57 | (0.21) | (1.15) | (1.36) |
| Year Ended 2/28/2018 | $15.99 | 0.21 | 1.25 | 1.46 | (0.20) | (1.07) | (1.27) |
| Institutional 2 Class |
| Year Ended 2/28/2022 | $18.08 | 0.19(c) | 1.33 | 1.52 | (0.18) | (2.90) | (3.08) |
| Year Ended 2/28/2021 | $14.32 | 0.18 | 5.12 | 5.30 | (0.19) | (1.35) | (1.54) |
| Year Ended 2/29/2020 | $15.73 | 0.22 | (0.72) | (0.50) | (0.23) | (0.68) | (0.91) |
| Year Ended 2/28/2019 | $16.50 | 0.22 | 0.37 | 0.59 | (0.21) | (1.15) | (1.36) |
| Year Ended 2/28/2018 | $16.28 | 0.22 | 1.27 | 1.49 | (0.20) | (1.07) | (1.27) |
| Institutional 3 Class |
| Year Ended 2/28/2022 | $17.25 | 0.18(c) | 1.28 | 1.46 | (0.18) | (2.90) | (3.08) |
| Year Ended 2/28/2021 | $13.73 | 0.17 | 4.89 | 5.06 | (0.19) | (1.35) | (1.54) |
| Year Ended 2/29/2020 | $15.11 | 0.21 | (0.68) | (0.47) | (0.23) | (0.68) | (0.91) |
| Year Ended 2/28/2019 | $15.91 | 0.22 | 0.34 | 0.56 | (0.21) | (1.15) | (1.36) |
| Year Ended 2/28/2018(g) | $16.00 | 0.21 | 0.97 | 1.18 | (0.20) | (1.07) | (1.27) |
| Notes to Financial Highlights |
| (a) | In addition to the fees and expenses that the Fund bears directly, the Fund indirectly bears a pro rata share of the fees and expenses of any other funds in which it invests. Such indirect expenses are not included in the Fund’s reported expense ratios. |
| (b) | Total net expenses include the impact of certain fee waivers/expense reimbursements made by the Investment Manager and certain of its affiliates, if applicable. |
| (c) | Net investment income per share includes special dividends. The per share effect of these dividends amounted to: |
| Year Ended | Class A | Institutional
Class | Institutional 2
Class | Institutional 3
Class |
| 02/28/2022 | $0.01 | $0.01 | $0.01 | $0.01 |
| (d) | Ratios include interest on collateral expense which is less than 0.01%. |
| (e) | Ratios include interfund lending expense which is less than 0.01%. |
| (f) | The benefits derived from expense reductions had an impact of less than 0.01%. |
| (g) | Institutional 3 Class shares commenced operations on March 1, 2017. Per share data and total return reflect activity from that date. |
The accompanying Notes to Financial Statements are an integral part of this statement.
| 22 | Columbia Mid Cap Index Fund | Annual Report 2022 |
Financial Highlights (continued)
| | Net
asset
value,
end of
period | Total
return | Total gross
expense
ratio to
average
net assets(a) | Total net
expense
ratio to
average
net assets(a),(b) | Net investment
income
ratio to
average
net assets | Portfolio
turnover | Net
assets,
end of
period
(000’s) |
| Class A |
| Year Ended 2/28/2022 | $16.13 | 7.48% | 0.58%(d),(e) | 0.45%(d),(e),(f) | 0.78% | 16% | $768,487 |
| Year Ended 2/28/2021 | $17.72 | 39.13% | 0.58%(e) | 0.45%(e),(f) | 1.01% | 14% | $902,341 |
| Year Ended 2/29/2020 | $14.07 | (3.88%) | 0.58%(e) | 0.45%(e),(f) | 1.16% | 14% | $986,055 |
| Year Ended 2/28/2019 | $15.47 | 3.66% | 0.58% | 0.45%(f) | 1.08% | 17% | $1,351,153 |
| Year Ended 2/28/2018 | $16.25 | 8.99% | 0.58% | 0.45%(f) | 1.05% | 23% | $1,543,057 |
| Institutional Class |
| Year Ended 2/28/2022 | $16.03 | 7.72% | 0.33%(d),(e) | 0.20%(d),(e),(f) | 1.03% | 16% | $1,534,550 |
| Year Ended 2/28/2021 | $17.63 | 39.49% | 0.34%(e) | 0.20%(e),(f) | 1.25% | 14% | $1,642,259 |
| Year Ended 2/29/2020 | $14.00 | (3.59%) | 0.33%(e) | 0.20%(e),(f) | 1.40% | 14% | $1,579,863 |
| Year Ended 2/28/2019 | $15.39 | 3.89% | 0.33% | 0.20%(f) | 1.33% | 17% | $1,979,350 |
| Year Ended 2/28/2018 | $16.18 | 9.22% | 0.33% | 0.20%(f) | 1.30% | 23% | $2,229,366 |
| Institutional 2 Class |
| Year Ended 2/28/2022 | $16.52 | 7.75% | 0.27%(d),(e) | 0.20%(d),(e) | 1.03% | 16% | $634,732 |
| Year Ended 2/28/2021 | $18.08 | 39.52% | 0.28%(e) | 0.20%(e) | 1.24% | 14% | $843,249 |
| Year Ended 2/29/2020 | $14.32 | (3.65%) | 0.28%(e) | 0.20%(e) | 1.40% | 14% | $663,451 |
| Year Ended 2/28/2019 | $15.73 | 3.94% | 0.27% | 0.20% | 1.33% | 17% | $798,386 |
| Year Ended 2/28/2018 | $16.50 | 9.24% | 0.28% | 0.20% | 1.30% | 23% | $893,473 |
| Institutional 3 Class |
| Year Ended 2/28/2022 | $15.63 | 7.78% | 0.22%(d),(e) | 0.20%(d),(e) | 1.04% | 16% | $69,950 |
| Year Ended 2/28/2021 | $17.25 | 39.46% | 0.23%(e) | 0.20%(e) | 1.23% | 14% | $64,740 |
| Year Ended 2/29/2020 | $13.73 | (3.59%) | 0.23%(e) | 0.20%(e) | 1.41% | 14% | $37,706 |
| Year Ended 2/28/2019 | $15.11 | 3.89% | 0.23% | 0.20% | 1.38% | 17% | $25,066 |
| Year Ended 2/28/2018(g) | $15.91 | 7.47% | 0.22% | 0.20% | 1.33% | 23% | $8,094 |
The accompanying Notes to Financial Statements are an integral part of this statement.
Columbia Mid Cap Index Fund | Annual Report 2022
| 23 |
Notes to Financial Statements
February 28, 2022
Note 1. Organization
Columbia Mid Cap Index Fund (the Fund), a series of Columbia Funds Series Trust (the Trust), is a diversified fund. The Trust is registered under the Investment Company Act of 1940, as amended (the 1940 Act), as an open-end management investment company organized as a Delaware statutory trust.
Fund shares
The Trust may issue an unlimited number of shares (without par value). The Fund offers each of the share classes listed in the Statement of Assets and Liabilities. Although all share classes generally have identical voting, dividend and liquidation rights, each share class votes separately when required by the Trust’s organizational documents or by law. Each share class has its own expense and sales charge structure. Different share classes may have different minimum initial investment amounts and pay different net investment income distribution amounts to the extent the expenses of distributing such share classes vary. Distributions to shareholders in a liquidation will be proportional to the net asset value of each share class.
As described in the Fund’s prospectus, Class A shares are offered to the general public for investment. Institutional Class, Institutional 2 Class and Institutional 3 Class shares are available for purchase through authorized investment professionals to omnibus retirement plans or to institutional investors and to certain other investors as also described in the Fund’s prospectus.
Note 2. Summary of significant accounting policies
Basis of preparation
The Fund is an investment company that applies the accounting and reporting guidance in the Financial Accounting Standards Board (FASB) Accounting Standards Codification Topic 946, Financial Services - Investment Companies (ASC 946). The financial statements are prepared in accordance with U.S. generally accepted accounting principles (GAAP), which requires management to make certain estimates and assumptions that affect the reported amounts of assets and liabilities, the disclosure of contingent assets and liabilities at the date of the financial statements and the reported amounts of income and expenses during the reporting period. Actual results could differ from those estimates.
The following is a summary of significant accounting policies followed by the Fund in the preparation of its financial statements.
Security valuation
Equity securities listed on an exchange are valued at the closing price or last trade price on their primary exchange at the close of business of the New York Stock Exchange. Securities with a closing price not readily available or not listed on any exchange are valued at the mean between the closing bid and ask prices. Listed preferred stocks convertible into common stocks are valued using an evaluated price from a pricing service.
Foreign equity securities are valued based on the closing price or last trade price on their primary exchange at the close of business of the New York Stock Exchange. If any foreign equity security closing prices are not readily available, the securities are valued at the mean of the latest quoted bid and ask prices on such exchanges or markets. Foreign currency exchange rates are determined at the scheduled closing time of the New York Stock Exchange. Many securities markets and exchanges outside the U.S. close prior to the close of the New York Stock Exchange; therefore, the closing prices for securities in such markets or on such exchanges may not fully reflect events that occur after such close but before the close of the New York Stock Exchange. In those situations, foreign securities will be fair valued pursuant to a policy adopted by the Board of Trustees. Under the policy, the Fund may utilize a third-party pricing service to determine these fair values. The third-party pricing service takes into account multiple factors, including, but not limited to, movements in the U.S. securities markets, certain depositary receipts, futures contracts and foreign exchange rates that have occurred subsequent to the close of the foreign exchange or market, to determine a good faith estimate that reasonably reflects the current market conditions as of the close of the New York Stock Exchange. The fair value of a security is likely to be different from the quoted or published price, if available.
Investments in open-end investment companies (other than exchange-traded funds (ETFs)), are valued at the latest net asset value reported by those companies as of the valuation time.
| 24 | Columbia Mid Cap Index Fund | Annual Report 2022 |
Notes to Financial Statements (continued)
February 28, 2022
Futures and options on futures contracts are valued based upon the settlement price at the close of regular trading on their principal exchanges or, in the absence of a settlement price, at the mean of the latest quoted bid and ask prices.
Investments for which market quotations are not readily available, or that have quotations which management believes are not reflective of market value or reliable, are valued at fair value as determined in good faith under procedures approved by and under the general supervision of the Board of Trustees. If a security or class of securities (such as foreign securities) is valued at fair value, such value is likely to be different from the quoted or published price for the security, if available.
The determination of fair value often requires significant judgment. To determine fair value, management may use assumptions including but not limited to future cash flows and estimated risk premiums. Multiple inputs from various sources may be used to determine fair value.
GAAP requires disclosure regarding the inputs and valuation techniques used to measure fair value and any changes in valuation inputs or techniques. In addition, investments shall be disclosed by major category. This information is disclosed following the Fund’s Portfolio of Investments.
Derivative instruments
The Fund invests in certain derivative instruments, as detailed below, in seeking to meet its investment objectives. Derivatives are instruments whose values depend on, or are derived from, in whole or in part, the value of one or more securities, currencies, commodities, indices, or other assets or instruments. Derivatives may be used to increase investment flexibility (including to maintain cash reserves while maintaining desired exposure to certain assets), for risk management (hedging) purposes, to facilitate trading, to reduce transaction costs and to pursue higher investment returns. The Fund may also use derivative instruments to mitigate certain investment risks, such as foreign currency exchange rate risk, interest rate risk and credit risk. Derivatives may involve various risks, including the potential inability of the counterparty to fulfill its obligations under the terms of the contract, the potential for an illiquid secondary market (making it difficult for the Fund to sell or terminate, including at favorable prices) and the potential for market movements which may expose the Fund to gains or losses in excess of the amount shown in the Statement of Assets and Liabilities. The notional amounts of derivative instruments, if applicable, are not recorded in the financial statements.
A derivative instrument may suffer a marked-to-market loss if the value of the contract decreases due to an unfavorable change in the market rates or values of the underlying instrument. Losses can also occur if the counterparty does not perform its obligations under the contract. The Fund’s risk of loss from counterparty credit risk on over-the-counter derivatives is generally limited to the aggregate unrealized gain netted against any collateral held by the Fund and the amount of any variation margin held by the counterparty, plus any replacement costs or related amounts. With exchange-traded or centrally cleared derivatives, there is reduced counterparty credit risk to the Fund since the clearinghouse or central counterparty (CCP) provides some protection in the case of clearing member default. The clearinghouse or CCP stands between the buyer and the seller of the contract; therefore, failure of the clearinghouse or CCP may pose additional counterparty credit risk. However, credit risk still exists in exchange-traded or centrally cleared derivatives with respect to initial and variation margin that is held in a broker’s customer account. While clearing brokers are required to segregate customer margin from their own assets, in the event that a clearing broker becomes insolvent or goes into bankruptcy and at that time there is a shortfall in the aggregate amount of margin held by the clearing broker for all its clients and such shortfall is remedied by the CCP or otherwise, U.S. bankruptcy laws will typically allocate that shortfall on a pro-rata basis across all the clearing broker’s customers (including the Fund), potentially resulting in losses to the Fund.
In order to better define its contractual rights and to secure rights that will help the Fund mitigate its counterparty risk, the Fund may enter into an International Swaps and Derivatives Association, Inc. Master Agreement (ISDA Master Agreement) or similar agreement with its derivatives counterparties. An ISDA Master Agreement is an agreement between the Fund and a counterparty that governs over-the-counter derivatives and foreign exchange forward contracts and contains, among other things, collateral posting terms and netting provisions in the event of a default and/or termination event. Under an ISDA Master Agreement, the Fund may, under certain circumstances, offset with the counterparty certain derivative instruments’ payables and/or receivables with collateral held and/or posted and create one single net payment. The provisions of the ISDA Master Agreement typically permit a single net payment in the event of default (close-out netting), including the bankruptcy or insolvency of the counterparty. Note, however, that bankruptcy or insolvency laws of a particular jurisdiction may impose restrictions on or prohibitions against the right of offset or netting in bankruptcy, insolvency or other events.
Columbia Mid Cap Index Fund | Annual Report 2022
| 25 |
Notes to Financial Statements (continued)
February 28, 2022
Collateral (margin) requirements differ by type of derivative. Margin requirements are established by the clearinghouse or CCP for exchange-traded and centrally cleared derivatives. Brokers can ask for margin in excess of the minimum in certain circumstances. Collateral terms for most over-the-counter derivatives are subject to regulatory requirements to exchange variation margin with trading counterparties and may have contract specific margin terms as well. For over-the-counter derivatives traded under an ISDA Master Agreement, the collateral requirements are typically calculated by netting the marked-to-market amount for each transaction under such agreement and comparing that amount to the value of any variation margin currently pledged by the Fund and/or the counterparty. Generally, the amount of collateral due from or to a party has to exceed a minimum transfer amount threshold (e.g., $250,000) before a transfer has to be made. To the extent amounts due to the Fund from its counterparties are not fully collateralized, contractually or otherwise, the Fund bears the risk of loss from counterparty nonperformance. The Fund may also pay interest expense on cash collateral received from the broker. Any interest expense paid by the Fund is shown on the Statement of Operations. The Fund attempts to mitigate counterparty risk by only entering into agreements with counterparties that it believes have the financial resources to honor their obligations and by monitoring the financial stability of those counterparties.
Certain ISDA Master Agreements allow counterparties of over-the-counter derivatives transactions to terminate derivatives contracts prior to maturity in the event the Fund’s net asset value declines by a stated percentage over a specified time period or if the Fund fails to meet certain terms of the ISDA Master Agreement, which would cause the Fund to accelerate payment of any net liability owed to the counterparty. The Fund also has termination rights if the counterparty fails to meet certain terms of the ISDA Master Agreement. In determining whether to exercise such termination rights, the Fund would consider, in addition to counterparty credit risk, whether termination would result in a net liability owed from the counterparty.
For financial reporting purposes, the Fund does not offset derivative assets and derivative liabilities that are subject to netting arrangements in the Statement of Assets and Liabilities.
Futures contracts
Futures contracts are exchange-traded and represent commitments for the future purchase or sale of an asset at a specified price on a specified date. The Fund bought and sold futures contracts to maintain appropriate equity market exposure while keeping sufficient cash to accommodate daily redemptions. These instruments may be used for other purposes in future periods. Upon entering into futures contracts, the Fund bears risks that it may not achieve the anticipated benefits of the futures contracts and may realize a loss. Additional risks include counterparty credit risk, the possibility of an illiquid market, and that a change in the value of the contract or option may not correlate with changes in the value of the underlying asset.
Upon entering into a futures contract, the Fund deposits cash or securities with the broker, known as a futures commission merchant (FCM), in an amount sufficient to meet the initial margin requirement. The initial margin deposit must be maintained at an established level over the life of the contract. Cash deposited as initial margin is recorded in the Statement of Assets and Liabilities as margin deposits. Securities deposited as initial margin are designated in the Portfolio of Investments. Subsequent payments (variation margin) are made or received by the Fund each day. The variation margin payments are equal to the daily change in the contract value and are recorded as variation margin receivable or payable and are offset in unrealized gains or losses. The Fund generally expects to earn interest income on its margin deposits. The Fund recognizes a realized gain or loss when the contract is closed or expires. Futures contracts involve, to varying degrees, risk of loss in excess of the variation margin disclosed in the Statement of Assets and Liabilities.
Effects of derivative transactions in the financial statements
The following tables are intended to provide additional information about the effect of derivatives on the financial statements of the Fund, including: the fair value of derivatives by risk category and the location of those fair values in the Statement of Assets and Liabilities; and the impact of derivative transactions over the period in the Statement of Operations, including realized and unrealized gains (losses). The derivative instrument schedules following the Portfolio of Investments present additional information regarding derivative instruments outstanding at the end of the period, if any.
| 26 | Columbia Mid Cap Index Fund | Annual Report 2022 |
Notes to Financial Statements (continued)
February 28, 2022
The following table is a summary of the fair value of derivative instruments (not considered to be hedging instruments for accounting disclosure purposes) at February 28, 2022:
| | Asset derivatives | |
Risk exposure
category | Statement
of assets and liabilities
location | Fair value ($) |
| Equity risk | Component of total distributable earnings (loss) — unrealized appreciation on futures contracts | 501,077* |
| * | Includes cumulative appreciation (depreciation) as reported in the tables following the Portfolio of Investments. Only the current day’s variation margin is reported in receivables or payables in the Statement of Assets and Liabilities. |
The following table indicates the effect of derivative instruments (not considered to be hedging instruments for accounting disclosure purposes) in the Statement of Operations for the year ended February 28, 2022:
| Amount of realized gain (loss) on derivatives recognized in income |
| Risk exposure category | Futures
contracts
($) |
| Equity risk | 3,191,852 |
| |
| Change in unrealized appreciation (depreciation) on derivatives recognized in income |
| Risk exposure category | Futures
contracts
($) |
| Equity risk | 746,083 |
The following table is a summary of the average outstanding volume by derivative instrument for the year ended February 28, 2022:
| Derivative instrument | Average notional
amounts ($)* |
| Futures contracts — long | 40,289,098 |
| * | Based on the ending quarterly outstanding amounts for the year ended February 28, 2022. |
Security transactions
Security transactions are accounted for on the trade date. Cost is determined and gains (losses) are based upon the specific identification method for both financial statement and federal income tax purposes.
Income recognition
Corporate actions and dividend income are generally recorded net of any non-reclaimable tax withholdings, on the ex-dividend date or upon receipt of an ex-dividend notification in the case of certain foreign securities.
The Fund may receive distributions from holdings in equity securities, business development companies (BDCs), exchange-traded funds (ETFs), limited partnerships (LPs), other regulated investment companies (RICs), and real estate investment trusts (REITs), which report information as to the tax character of their distributions annually. These distributions are allocated to dividend income, capital gain and return of capital based on actual information reported. Return of capital is recorded as a reduction of the cost basis of securities held. If the Fund no longer owns the applicable securities, return of capital is recorded as a realized gain. With respect to REITs, to the extent actual information has not yet been reported, estimates for return of capital are made by Columbia Management Investment Advisers, LLC (the Investment Manager), a wholly-owned subsidiary of Ameriprise Financial, Inc. (Ameriprise Financial). The Investment Manager’s estimates are subsequently adjusted when the actual character of the distributions is disclosed by the REITs, which could result in a proportionate change in return of capital to shareholders.
Columbia Mid Cap Index Fund | Annual Report 2022
| 27 |
Notes to Financial Statements (continued)
February 28, 2022
Awards from class action litigation are recorded as a reduction of cost basis if the Fund still owns the applicable securities on the payment date. If the Fund no longer owns the applicable securities on the payment date, the proceeds are recorded as realized gains.
Expenses
General expenses of the Trust are allocated to the Fund and other funds of the Trust based upon relative net assets or other expense allocation methodologies determined by the nature of the expense. Expenses directly attributable to the Fund are charged to the Fund. Expenses directly attributable to a specific class of shares are charged to that share class.
Determination of class net asset value
All income, expenses (other than class-specific expenses, which are charged to that share class, as shown in the Statement of Operations) and realized and unrealized gains (losses) are allocated to each class of the Fund on a daily basis, based on the relative net assets of each class, for purposes of determining the net asset value of each class.
Federal income tax status
The Fund intends to qualify each year as a regulated investment company under Subchapter M of the Internal Revenue Code, as amended, and will distribute substantially all of its investment company taxable income and net capital gain, if any, for its tax year, and as such will not be subject to federal income taxes. In addition, the Fund intends to distribute in each calendar year substantially all of its ordinary income, capital gain net income and certain other amounts, if any, such that the Fund should not be subject to federal excise tax. Therefore, no federal income or excise tax provision is recorded.
Foreign taxes
The Fund may be subject to foreign taxes on income, gains on investments or currency repatriation, a portion of which may be recoverable. The Fund will accrue such taxes and recoveries, as applicable, based upon its current interpretation of tax rules and regulations that exist in the markets in which it invests.
Realized gains in certain countries may be subject to foreign taxes at the Fund level, based on statutory rates. The Fund accrues for such foreign taxes on realized and unrealized gains at the appropriate rate for each jurisdiction, as applicable. The amount, if any, is disclosed as a liability on the Statement of Assets and Liabilities.
Distributions to shareholders
Distributions from net investment income, if any, are declared and paid semi-annually. Net realized capital gains, if any, are distributed at least annually. Income distributions and capital gain distributions are determined in accordance with federal income tax regulations, which may differ from GAAP.
Guarantees and indemnifications
Under the Trust’s organizational documents and, in some cases, by contract, its officers and trustees are indemnified against certain liabilities arising out of the performance of their duties to the Trust or its funds. In addition, certain of the Fund’s contracts with its service providers contain general indemnification clauses. The Fund’s maximum exposure under these arrangements is unknown since the amount of any future claims that may be made against the Fund cannot be determined, and the Fund has no historical basis for predicting the likelihood of any such claims.
Note 3. Fees and other transactions with affiliates
Management services fees
The Fund has entered into a Management Agreement with Columbia Management Investment Advisers, LLC (the Investment Manager), a wholly-owned subsidiary of Ameriprise Financial, Inc. (Ameriprise Financial). Under the Management Agreement, the Investment Manager provides the Fund with investment research and advice, as well as administrative and accounting services. The management services fee is an annual fee that is equal to 0.20% of the Fund’s daily net assets.
| 28 | Columbia Mid Cap Index Fund | Annual Report 2022 |
Notes to Financial Statements (continued)
February 28, 2022
Compensation of board members
Members of the Board of Trustees who are not officers or employees of the Investment Manager or Ameriprise Financial are compensated for their services to the Fund as disclosed in the Statement of Operations. Under a Deferred Compensation Plan (the Deferred Plan), these members of the Board of Trustees may elect to defer payment of up to 100% of their compensation. Deferred amounts are treated as though equivalent dollar amounts had been invested in shares of certain funds managed by the Investment Manager. The Fund’s liability for these amounts is adjusted for market value changes and remains in the Fund until distributed in accordance with the Deferred Plan. All amounts payable under the Deferred Plan constitute a general unsecured obligation of the Fund. The expense for the Deferred Plan, which includes Trustees’ fees deferred during the current period as well as any gains or losses on the Trustees’ deferred compensation balances as a result of market fluctuations, is included in "Compensation of board members" on the Statement of Operations.
Compensation of Chief Compliance Officer
The Board of Trustees has appointed a Chief Compliance Officer for the Fund in accordance with federal securities regulations. As disclosed in the Statement of Operations, a portion of the Chief Compliance Officer’s total compensation is allocated to the Fund, along with other allocations to affiliated registered investment companies managed by the Investment Manager and its affiliates, based on relative net assets.
Transfer agency fees
Under a Transfer and Dividend Disbursing Agent Agreement, Columbia Management Investment Services Corp. (the Transfer Agent), an affiliate of the Investment Manager and a wholly-owned subsidiary of Ameriprise Financial, is responsible for providing transfer agency services to the Fund. The Transfer Agent has contracted with DST Asset Manager Solutions, Inc. (DST) to serve as sub-transfer agent. The Transfer Agent pays the fees of DST for services as sub-transfer agent and DST is not entitled to reimbursement for such fees from the Fund (with the exception of out-of-pocket fees).
The Fund pays the Transfer Agent a monthly transfer agency fee based on the number or the average value of accounts, depending on the type of account. In addition, the Fund pays the Transfer Agent a fee for shareholder services based on the number of accounts or on a percentage of the average aggregate value of the Fund’s shares maintained in omnibus accounts up to the lesser of the amount charged by the financial intermediary or a cap established by the Board of Trustees from time to time.
The Transfer Agent also receives compensation from the Fund for various shareholder services and reimbursements for certain out-of-pocket fees. Total transfer agency fees for Institutional 2 Class and Institutional 3 Class shares are subject to an annual limitation of not more than 0.07% and 0.02%, respectively, of the average daily net assets attributable to each share class.
For the year ended February 28, 2022, the Fund’s effective transfer agency fee rates as a percentage of average daily net assets of each class were as follows:
| | Effective rate (%) |
| Class A | 0.11 |
| Institutional Class | 0.11 |
| Institutional 2 Class | 0.06 |
| Institutional 3 Class | 0.01 |
An annual minimum account balance fee of $20 may apply to certain accounts with a value below the applicable share class’s initial minimum investment requirements to reduce the impact of small accounts on transfer agency fees. These minimum account balance fees are remitted to the Fund and recorded as part of expense reductions in the Statement of Operations. For the year ended February 28, 2022, these minimum account balance fees reduced total expenses of the Fund by $60.
Columbia Mid Cap Index Fund | Annual Report 2022
| 29 |
Notes to Financial Statements (continued)
February 28, 2022
Distribution and service fees
The Fund has entered into an agreement with Columbia Management Investment Distributors, Inc. (the Distributor), an affiliate of the Investment Manager and a wholly-owned subsidiary of Ameriprise Financial, for distribution and shareholder services. The Board of Trustees has approved, and the Fund has adopted, distribution and shareholder service plans (the Plans) applicable to certain share classes, which set the distribution and service fees for the Fund. These fees are calculated daily and are intended to compensate the Distributor and/or eligible selling and/or servicing agents for selling shares of the Fund and providing services to investors.
Under the Plans, the Fund pays a monthly combined distribution and service fee to the Distributor at the maximum annual rate of 0.25% of the average daily net assets attributable to Class A shares of the Fund.
Expenses waived/reimbursed by the Investment Manager and its affiliates
The Investment Manager and certain of its affiliates have contractually agreed to waive fees and/or reimburse expenses (excluding certain fees and expenses described below) for the period(s) disclosed below, unless sooner terminated at the sole discretion of the Board of Trustees, so that the Fund’s net operating expenses, after giving effect to fees waived/expenses reimbursed and any balance credits and/or overdraft charges from the Fund’s custodian, do not exceed the following annual rate(s) as a percentage of the classes’ average daily net assets:
| | Fee rate(s) contractual
through
June 30, 2022 |
| Class A | 0.45% |
| Institutional Class | 0.20 |
| Institutional 2 Class | 0.20 |
| Institutional 3 Class | 0.20 |
Under the agreement governing these fee waivers and/or expense reimbursement arrangements, the following fees and expenses are excluded from the waiver/reimbursement commitment, and therefore will be paid by the Fund, if applicable: taxes (including foreign transaction taxes), expenses associated with investments in affiliated and non-affiliated pooled investment vehicles (including mutual funds and exchange-traded funds), transaction costs and brokerage commissions, costs related to any securities lending program, dividend expenses associated with securities sold short, inverse floater program fees and expenses, transaction charges and interest on borrowed money, interest, costs associated with shareholder meetings, infrequent and/or unusual expenses and any other expenses the exclusion of which is specifically approved by the Board of Trustees. This agreement may be modified or amended only with approval from the Investment Manager, certain of its affiliates and the Fund. Any fees waived and/or expenses reimbursed under the expense reimbursement arrangements described above are not recoverable by the Investment Manager or its affiliates in future periods.
Note 4. Federal tax information
The timing and character of income and capital gain distributions are determined in accordance with income tax regulations, which may differ from GAAP because of temporary or permanent book to tax differences.
At February 28, 2022, these differences were primarily due to differing treatment for deferral/reversal of wash sale losses, trustees’ deferred compensation, derivative investments and earnings and profits distributed to shareholders on the redemption of shares. To the extent these differences were permanent, reclassifications were made among the components of the Fund’s net assets. Temporary differences do not require reclassifications.
The following reclassifications were made:
Undistributed net
investment
income ($) | Accumulated
net realized
gain ($) | Paid in
capital ($) |
| (1,823,185) | (48,987,253) | 50,810,438 |
| 30 | Columbia Mid Cap Index Fund | Annual Report 2022 |
Notes to Financial Statements (continued)
February 28, 2022
Net investment income (loss) and net realized gains (losses), as disclosed in the Statement of Operations, and net assets were not affected by this reclassification.
The tax character of distributions paid during the years indicated was as follows:
| Year Ended February 28, 2022 | Year Ended February 28, 2021 |
Ordinary
income ($) | Long-term
capital gains ($) | Total ($) | Ordinary
income ($) | Long-term
capital gains ($) | Total ($) |
| 87,782,065 | 449,506,793 | 537,288,858 | 42,504,690 | 271,758,200 | 314,262,890 |
Short-term capital gain distributions, if any, are considered ordinary income distributions for tax purposes.
At February 28, 2022, the components of distributable earnings on a tax basis were as follows:
Undistributed
ordinary income ($) | Undistributed
long-term
capital gains ($) | Capital loss
carryforwards ($) | Net unrealized
appreciation ($) |
| 6,920,126 | 126,721,338 | — | 1,165,889,975 |
At February 28, 2022, the cost of all investments for federal income tax purposes along with the aggregate gross unrealized appreciation and depreciation based on that cost was:
Federal
tax cost ($) | Gross unrealized
appreciation ($) | Gross unrealized
(depreciation) ($) | Net unrealized
appreciation ($) |
| 1,843,025,352 | 1,271,498,916 | (105,608,941) | 1,165,889,975 |
Tax cost of investments and unrealized appreciation/(depreciation) may also include timing differences that do not constitute adjustments to tax basis.
Management of the Fund has concluded that there are no significant uncertain tax positions in the Fund that would require recognition in the financial statements. However, management’s conclusion may be subject to review and adjustment at a later date based on factors including, but not limited to, new tax laws, regulations, and administrative interpretations (including relevant court decisions). Generally, the Fund’s federal tax returns for the prior three fiscal years remain subject to examination by the Internal Revenue Service.
Note 5. Portfolio information
The cost of purchases and proceeds from sales of securities, excluding short-term investments and derivatives, if any, aggregated to $536,377,647 and $1,211,970,997, respectively, for the year ended February 28, 2022. The amount of purchase and sale activity impacts the portfolio turnover rate reported in the Financial Highlights.
Note 6. Affiliated money market fund
The Fund invests in Columbia Short-Term Cash Fund, an affiliated money market fund established for the exclusive use by the Fund and other affiliated funds (the Affiliated MMF). The income earned by the Fund from such investments is included as Dividends - affiliated issuers in the Statement of Operations. As an investing fund, the Fund indirectly bears its proportionate share of the expenses of the Affiliated MMF. The Affiliated MMF prices its shares with a floating net asset value. In addition, the Board of Trustees of the Affiliated MMF may impose a fee on redemptions (sometimes referred to as a liquidity fee) or temporarily suspend redemptions (sometimes referred to as imposing a redemption gate) in the event its liquidity falls below regulatory limits.
Note 7. Interfund lending
Pursuant to an exemptive order granted by the Securities and Exchange Commission, the Fund participates in a program (the Interfund Program) allowing each participating Columbia Fund (each, a Participating Fund) to lend money directly to and, except for closed-end funds and money market funds, borrow money directly from other Participating Funds for temporary purposes. The amounts eligible for borrowing and lending under the Interfund Program are subject to certain restrictions.
Columbia Mid Cap Index Fund | Annual Report 2022
| 31 |
Notes to Financial Statements (continued)
February 28, 2022
Interfund loans are subject to the risk that the borrowing fund could be unable to repay the loan when due, and a delay in repayment to the lending fund could result in lost opportunities and/or additional lending costs. The exemptive order is subject to conditions intended to mitigate conflicts of interest arising from the Investment Manager’s relationship with each Participating Fund.
The Fund’s activity in the Interfund Program during the year ended February 28, 2022 was as follows:
| Borrower or lender | Average loan
balance ($) | Weighted average
interest rate (%) | Number of days
with outstanding loans |
| Borrower | 3,000,000 | 0.69 | 1 |
Interest expense incurred by the Fund is recorded as Interfund lending in the Statement of Operations. The Fund had no outstanding interfund loans at February 28, 2022.
Note 8. Line of credit
The Fund has access to a revolving credit facility with a syndicate of banks led by JPMorgan Chase Bank, N.A., Citibank, N.A. and Wells Fargo Bank, N.A. whereby the Fund may borrow for the temporary funding of shareholder redemptions or for other temporary or emergency purposes. Pursuant to an October 28, 2021 amendment and restatement, the credit facility, which is an agreement between the Fund and certain other funds managed by the Investment Manager or an affiliated investment manager, severally and not jointly, permits aggregate borrowings up to $950 million. Interest is currently charged to each participating fund based on its borrowings at a rate equal to the higher of (i) the federal funds effective rate, (ii) the secured overnight financing rate plus 0.11448% and (iii) the overnight bank funding rate, plus in each case, 1.00%. Each borrowing under the credit facility matures no later than 60 days after the date of borrowing. The Fund also pays a commitment fee equal to its pro rata share of the unused amount of the credit facility at a rate of 0.15% per annum. The commitment fee is included in other expenses in the Statement of Operations. This agreement expires annually in October unless extended or renewed. Prior to the October 28, 2021 amendment and restatement, the Fund had access to a revolving credit facility with a syndicate of banks led by JPMorgan Chase Bank, N.A., Citibank, N.A. and Wells Fargo Bank, N.A. which permitted collective borrowings up to $950 million. Interest was charged to each participating fund based on its borrowings at a rate equal to the higher of (i) the federal funds effective rate, (ii) the one-month London Interbank Offered Rate (LIBOR) rate and (iii) the overnight bank funding rate, plus in each case, 1.25%.
The Fund had no borrowings during the year ended February 28, 2022.
Note 9. Significant risks
Market risk
The Fund may incur losses due to declines in the value of one or more securities in which it invests. These declines may be due to factors affecting a particular issuer, or the result of, among other things, political, regulatory, market, economic or social developments affecting the relevant market(s) more generally. In addition, turbulence in financial markets and reduced liquidity in equity, credit and/or fixed income markets may negatively affect many issuers, which could adversely affect the Fund, including causing difficulty in assigning prices to hard-to-value assets in thinly traded and closed markets, significant redemptions and operational challenges. Global economies and financial markets are increasingly interconnected, and conditions and events in one country, region or financial market may adversely impact issuers in a different country, region or financial market. These risks may be magnified if certain events or developments adversely interrupt the global supply chain; in these and other circumstances, such risks might affect companies worldwide. As a result, local, regional or global events such as terrorism, war, natural disasters, disease/virus outbreaks and epidemics or other public health issues, recessions, depressions or other events – or the potential for such events – could have a significant negative impact on global economic and market conditions.
The large-scale invasion of Ukraine by Russia in February 2022 has resulted in sanctions and market disruptions, including declines in regional and global stock and commodity markets and significant devaluations of Russian currency. The extent and duration of the military action are impossible to predict but could be significant. Market disruption caused by the Russian military action, and any counter measures or responses thereto (including international sanctions, a downgrade in the country’s credit rating, purchasing and financing restrictions, boycotts, tariffs, changes in consumer or purchaser
| 32 | Columbia Mid Cap Index Fund | Annual Report 2022 |
Notes to Financial Statements (continued)
February 28, 2022
preferences, cyberattacks and espionage) could have a severe adverse impact on regional and/or global securities and commodities markets, including markets for oil and natural gas. These and other related events could have a negative impact on Fund performance and the value of an investment in the Fund.
The pandemic caused by coronavirus disease 2019 and its variants (COVID-19) has resulted in, and may continue to result in, significant global economic and societal disruption and market volatility due to disruptions in market access, resource availability, facilities operations, imposition of tariffs, export controls and supply chain disruption, among others. Such disruptions may be caused, or exacerbated by, quarantines and travel restrictions, workforce displacement and loss in human and other resources. The uncertainty surrounding the magnitude, duration, reach, costs and effects of the global pandemic, as well as actions that have been or could be taken by governmental authorities or other third parties, present unknowns that are yet to unfold. The impacts, as well as the uncertainty over impacts to come, of COVID-19 – and any other infectious illness outbreaks, epidemics and pandemics that may arise in the future – could negatively affect global economies and markets in ways that cannot necessarily be foreseen. In addition, the impact of infectious illness outbreaks and epidemics in emerging market countries may be greater due to generally less established healthcare systems, governments and financial markets. Public health crises caused by the COVID-19 outbreak may exacerbate other pre-existing political, social and economic risks in certain countries or globally. The disruptions caused by COVID-19 could prevent the Fund from executing advantageous investment decisions in a timely manner and negatively impact the Fund’s ability to achieve its investment objectives. Any such event(s) could have a significant adverse impact on the value and risk profile of the Fund.
Passive investment risk
The Fund is not “actively” managed and may be affected by a general decline in market segments related to its tracking index. The Fund invests in securities or instruments included in, or believed by the Investment Manager to be representative of, its tracking index, regardless of their investment merits. The Fund does not seek temporary defensive positions when markets decline or appear overvalued. The decision of whether to remove a security from the tracking index is made by an independent index provider who is not affiliated with the Fund or the Investment Manager.
Shareholder concentration risk
At February 28, 2022, one unaffiliated shareholder of record owned 25.7% of the outstanding shares of the Fund in one or more accounts. The Fund has no knowledge about whether any portion of those shares was owned beneficially. Affiliated shareholders of record owned 15.4% of the outstanding shares of the Fund in one or more accounts. Subscription and redemption activity by concentrated accounts may have a significant effect on the operations of the Fund. In the case of a large redemption, the Fund may be forced to sell investments at inopportune times, including its liquid positions, which may result in Fund losses and the Fund holding a higher percentage of less liquid positions. Large redemptions could result in decreased economies of scale and increased operating expenses for non-redeeming Fund shareholders.
Small- and mid-cap company risk
Investments in small- and mid-capitalization companies (small- and mid-cap companies) often involve greater risks than investments in larger, more established companies (larger companies) because small- and mid-cap companies tend to have less predictable earnings and may lack the management experience, financial resources, product diversification and competitive strengths of larger companies. Securities of small- and mid-cap companies may be less liquid and more volatile than the securities of larger companies.
Note 10. Subsequent events
Management has evaluated the events and transactions that have occurred through the date the financial statements were issued and noted no items requiring adjustment of the financial statements or additional disclosure.
Note 11. Information regarding pending and settled legal proceedings
Ameriprise Financial and certain of its affiliates are involved in the normal course of business in legal proceedings which include regulatory inquiries, arbitration and litigation, including class actions concerning matters arising in connection with the conduct of its activities as a diversified financial services firm. Ameriprise Financial believes that the Fund is not currently
Columbia Mid Cap Index Fund | Annual Report 2022
| 33 |
Notes to Financial Statements (continued)
February 28, 2022
the subject of, and that neither Ameriprise Financial nor any of its affiliates are the subject of, any pending legal, arbitration or regulatory proceedings that are likely to have a material adverse effect on the Fund or the ability of Ameriprise Financial or its affiliates to perform under their contracts with the Fund. Ameriprise Financial is required to make quarterly (10-Q), annual (10-K) and, as necessary, 8-K filings with the Securities and Exchange Commission (SEC) on legal and regulatory matters that relate to Ameriprise Financial and its affiliates. Copies of these filings may be obtained by accessing the SEC website at www.sec.gov.
There can be no assurance that these matters, or the adverse publicity associated with them, will not result in increased Fund redemptions, reduced sale of Fund shares or other adverse consequences to the Fund. Further, although we believe proceedings are not likely to have a material adverse effect on the Fund or the ability of Ameriprise Financial or its affiliates to perform under their contracts with the Fund, these proceedings are subject to uncertainties and, as such, we are unable to estimate the possible loss or range of loss that may result. An adverse outcome in one or more of these proceedings could result in adverse judgments, settlements, fines, penalties or other relief that could have a material adverse effect on the consolidated financial condition or results of operations of Ameriprise Financial or one or more of its affiliates that provides services to the Fund.
| 34 | Columbia Mid Cap Index Fund | Annual Report 2022 |
Report of Independent Registered Public Accounting Firm
To the Board of Trustees of Columbia Funds Series Trust and Shareholders of Columbia Mid Cap Index Fund
Opinion on the Financial Statements
We have audited the accompanying statement of assets and liabilities, including the portfolio of investments, of Columbia Mid Cap Index Fund (one of the funds constituting Columbia Funds Series Trust, referred to hereafter as the "Fund") as of February 28, 2022, the related statement of operations for the year ended February 28, 2022, the statement of changes in net assets for each of the two years in the period ended February 28, 2022, including the related notes, and the financial highlights for each of the five years in the period ended February 28, 2022 (collectively referred to as the "financial statements"). In our opinion, the financial statements present fairly, in all material respects, the financial position of the Fund as of February 28, 2022, the results of its operations for the year then ended, the changes in its net assets for each of the two years in the period ended February 28, 2022 and the financial highlights for each of the five years in the period ended February 28, 2022 in conformity with accounting principles generally accepted in the United States of America.
Basis for Opinion
These financial statements are the responsibility of the Fund’s management. Our responsibility is to express an opinion on the Fund’s financial statements based on our audits. We are a public accounting firm registered with the Public Company Accounting Oversight Board (United States) (PCAOB) and are required to be independent with respect to the Fund in accordance with the U.S. federal securities laws and the applicable rules and regulations of the Securities and Exchange Commission and the PCAOB.
We conducted our audits of these financial statements in accordance with the standards of the PCAOB. Those standards require that we plan and perform the audit to obtain reasonable assurance about whether the financial statements are free of material misstatement, whether due to error or fraud.
Our audits included performing procedures to assess the risks of material misstatement of the financial statements, whether due to error or fraud, and performing procedures that respond to those risks. Such procedures included examining, on a test basis, evidence regarding the amounts and disclosures in the financial statements. Our audits also included evaluating the accounting principles used and significant estimates made by management, as well as evaluating the overall presentation of the financial statements. Our procedures included confirmation of securities owned as of February 28, 2022 by correspondence with the custodian, transfer agent and broker. We believe that our audits provide a reasonable basis for our opinion.
/s/PricewaterhouseCoopers LLP
Minneapolis, Minnesota
April 21, 2022
We have served as the auditor of one or more investment companies within the Columbia Funds Complex since 1977.
Columbia Mid Cap Index Fund | Annual Report 2022
| 35 |
Federal Income Tax Information
(Unaudited)
The Fund hereby designates the following tax attributes for the fiscal year ended February 28, 2022. Shareholders will be notified in early 2023 of the amounts for use in preparing 2022 income tax returns.
Qualified
dividend
income | Dividends
received
deduction | Section
199A
dividends | Capital
gain
dividend |
| 52.29% | 51.78% | 6.15% | $522,308,750 |
Qualified dividend income. For taxable, non-corporate shareholders, the percentage of ordinary income distributed during the fiscal year that represents qualified dividend income subject to reduced tax rates.
Dividends received deduction. The percentage of ordinary income distributed during the fiscal year that qualifies for the corporate dividends received deduction.
Section 199A dividends. For taxable, non-corporate shareholders, the percentage of ordinary income distributed during the fiscal year that represents Section 199A dividends potentially eligible for a 20% deduction.
Capital gain dividend. The Fund designates as a capital gain dividend the amount reflected above, or if subsequently determined to be different, the net capital gain of such fiscal period.
TRUSTEES AND OFFICERS
The Board oversees the Fund’s operations and appoints officers who are responsible for day-to-day business decisions based on policies set by the Board. The following table provides basic biographical information about the Fund’s Trustees as of the printing of this report, including their principal occupations during the past five years, although specific titles for individuals may have varied over the period. The year set forth beneath Length of Service in the table below is the year in which the Trustee was first appointed or elected as Trustee to any Fund currently in the Columbia Funds Complex or a predecessor thereof. Under current Board policy, each Trustee generally serves until December 31 of the year such Trustee turns seventy-five (75).
Independent trustees
Name,
address,
year of birth | Position held
with the Columbia Funds and
length of service | Principal occupation(s)
during past five years
and other relevant
professional experience | Number of
Funds in the
Columbia Funds
Complex*
overseen | Other directorships
held by Trustee
during the past
five years |
George S. Batejan
c/o Columbia Management
Investment Advisers, LLC
290 Congress Street
Boston, MA 02210
1953 | Trustee since 2017 | Executive Vice President, Global Head of Technology and Operations, Janus Capital Group, Inc., 2010-2016 | 177 | Former Chairman of the Board, NICSA (National Investment Company Services Association) (Executive Committee, Nominating Committee and Governance Committee), 2014-2016; former Director, Intech Investment Management, 2011-2016; former Board Member, Metro Denver Chamber of Commerce, 2015-2016; former Advisory Board Member, University of Colorado Business School, 2015-2018 |
| 36 | Columbia Mid Cap Index Fund | Annual Report 2022 |
TRUSTEES AND OFFICERS (continued)
Independent trustees (continued)
Name,
address,
year of birth | Position held
with the Columbia Funds and
length of service | Principal occupation(s)
during past five years
and other relevant
professional experience | Number of
Funds in the
Columbia Funds
Complex*
overseen | Other directorships
held by Trustee
during the past
five years |
Kathleen Blatz
c/o Columbia Management
Investment Advisers, LLC
290 Congress Street
Boston, MA 02210
1954 | Trustee since 2006 | Attorney, specializing in arbitration and mediation; Chief Justice, Minnesota Supreme Court, 1998-2006; Associate Justice, Minnesota Supreme Court, 1996-1998; Fourth Judicial District Court Judge, Hennepin County, 1994-1996; Attorney in private practice and public service, 1984-1993; State Representative, Minnesota House of Representatives, 1979-1993, which included service on the Tax and Financial Institutions and Insurance Committees; Member and Interim Chair, Minnesota Sports Facilities Authority, January 2017-July 2017; Interim President and Chief Executive Officer, Blue Cross and Blue Shield of Minnesota (health care insurance), February-July 2018, April-October 2021 | 177 | Former Trustee, Blue Cross and Blue Shield of Minnesota, 2009-2021 (Chair of the Business Development Committee, 2014-2017; Chair of the Governance Committee, 2017-2019); former Member and Chair of the Board, Minnesota Sports Facilities Authority, January 2017-July 2017; former Director, Robina Foundation, 2009-2020 (Chair, 2014-2020); Director, Schulze Family Foundation, since 2021 |
Pamela G. Carlton
c/o Columbia Management
Investment Advisers, LLC
290 Congress Street
Boston, MA 02210
1954 | Trustee since 2007 | President, Springboard — Partners in Cross Cultural Leadership (consulting company) since 2003; Managing Director of US Equity Research, JP Morgan Chase, 1999-2003; Director of US Equity Research, Chase Asset Management, 1996-1999; Co-Director Latin America Research, 1993-1996, COO Global Research, 1992-1996, Co-Director of US Research, 1991-1992, Investment Banker, Morgan Stanley, 1982-1991, Morgan Stanley; Attorney, Cleary Gottlieb Steen & Hamilton LLP, 1980-1982 | 177 | Trustee, New York Presbyterian Hospital Board (Executive Committee and Chair of People Committee) since 1996; Director, DR Bank (Audit Committee) since 2017; Director, Evercore Inc. (Audit Committee) since 2019; Director, Apollo Commercial Real Estate Finance, Inc. since 2021; the Governing Council of the Independent Directors Council (IDC), since 2021 |
Janet Langford Carrig
c/o Columbia Management
Investment Advisers, LLC
290 Congress Street
Boston, MA 02210
1957 | Trustee since 1996 | Senior Vice President, General Counsel and Corporate Secretary, ConocoPhillips (independent energy company), September 2007-October 2018 | 175 | Director, EQT Corporation (natural gas producer) since 2019; Director, Whiting Petroleum Corporation (independent oil and gas company) since 2020 |
J. Kevin Connaughton
c/o Columbia Management
Investment Advisers, LLC
290 Congress Street
Boston, MA 02210
1964 | Trustee since 2020 | Member, FINRA National Adjudicatory Council since January 2020; Adjunct Professor of Finance, Bentley University since January 2018; Consultant to Independent Trustees of CFVIT and CFST I from March 2016 to June 2020 with respect to CFVIT and to December 2020 with respect to CFST I; Managing Director and General Manager of Mutual Fund Products, Columbia Management Investment Advisers, LLC, May 2010-February 2015; President, Columbia Funds, 2008-2015; and senior officer of Columbia Funds and affiliated funds, 2003-2015 | 175 | Former Director, The Autism Project, March 2015-December 2021; former Member of the Investment Committee, St. Michael’s College, November 2015-February 2020; former Trustee, St. Michael’s College, June 2017-September 2019; former Trustee, New Century Portfolios, January 2015-December 2017 |
Columbia Mid Cap Index Fund | Annual Report 2022
| 37 |
TRUSTEES AND OFFICERS (continued)
Independent trustees (continued)
Name,
address,
year of birth | Position held
with the Columbia Funds and
length of service | Principal occupation(s)
during past five years
and other relevant
professional experience | Number of
Funds in the
Columbia Funds
Complex*
overseen | Other directorships
held by Trustee
during the past
five years |
Olive M. Darragh
c/o Columbia Management
Investment Advisers, LLC
290 Congress Street
Boston, MA 02210
1962 | Trustee since 2020 | Managing Director of Darragh Inc. (strategy and talent management consulting firm) since 2010; Founder and CEO, Zolio, Inc. (investment management talent identification platform) since 2004; Consultant to Independent Trustees of CFVIT and CFST I from June 2019 to June 2020 with respect to CFVIT and to December 2020 with respect to CFST I; Partner, Tudor Investments, 2004-2010; Senior Partner, McKinsey & Company (consulting), 1990-2004; Touche Ross CPA, 1985-1988 | 175 | Former Director, University of Edinburgh Business School (Member of US Board); former Director, Boston Public Library Foundation |
Patricia M. Flynn
c/o Columbia Management
Investment Advisers, LLC
290 Congress Street
Boston, MA 02210
1950 | Trustee since 2004 | Trustee Professor of Economics and Management, Bentley University since 1976 (also teaches and conducts research on corporate governance); Dean, McCallum Graduate School of Business, Bentley University, 1992-2002 | 177 | Trustee, MA Taxpayers Foundation since 1997; Board of Governors, Innovation Institute, MA Technology Collaborative, 2010-2020; former Board of Directors, The MA Business Roundtable, 2003-2019 |
Brian J. Gallagher
c/o Columbia Management
Investment Advisers, LLC
290 Congress Street
Boston, MA 02210
1954 | Trustee since 2017 | Retired; Partner with Deloitte & Touche LLP and its predecessors, 1977-2016 | 177 | Trustee, Catholic Schools Foundation since 2004 |
Douglas A. Hacker
c/o Columbia Management
Investment Advisers, LLC
290 Congress Street
Boston, MA 02210
1955 | Co-Chair since 2021; Chair of CFST I and CFVIT since 2014; Trustee of CFST I and CFVIT since 1996 and CFST, CFST II, CFVST II, CET I and CET II since 2021 | Independent business executive since May 2006; Executive Vice President – Strategy of United Airlines, December 2002 - May 2006; President of UAL Loyalty Services (airline marketing company), September 2001-December 2002; Executive Vice President and Chief Financial Officer of United Airlines, July 1999-September 2001 | 177 | Director, Spartan Nash Company (food distributor); Director, Aircastle Limited (Chair of Audit Committee) (aircraft leasing); former Director, Nash Finch Company (food distributor), 2005-2013; former Director, SeaCube Container Leasing Ltd. (container leasing), 2010-2013; and former Director, Travelport Worldwide Limited (travel information technology), 2014-2019 |
Nancy T. Lukitsh
c/o Columbia Management
Investment Advisers, LLC
290 Congress Street
Boston, MA 02210
1956 | Trustee since 2011 | Senior Vice President, Partner and Director of Marketing, Wellington Management Company, LLP (investment adviser), 1997-2010; Chair, Wellington Management Portfolios (commingled non-U.S. investment pools), 2007 -2010; Director, Wellington Trust Company, NA and other Wellington affiliates, 1997-2010 | 175 | None |
| 38 | Columbia Mid Cap Index Fund | Annual Report 2022 |
TRUSTEES AND OFFICERS (continued)
Independent trustees (continued)
Name,
address,
year of birth | Position held
with the Columbia Funds and
length of service | Principal occupation(s)
during past five years
and other relevant
professional experience | Number of
Funds in the
Columbia Funds
Complex*
overseen | Other directorships
held by Trustee
during the past
five years |
David M. Moffett
c/o Columbia Management
Investment Advisers, LLC
290 Congress Street
Boston, MA 02210
1952 | Trustee since 2011 | Retired; Consultant to Bridgewater and Associates | 175 | Director, CSX Corporation (transportation suppliers); Director, Genworth Financial, Inc. (financial and insurance products and services); Director, PayPal Holdings Inc. (payment and data processing services); Trustee, University of Oklahoma Foundation; former Director, eBay Inc. (online trading community), 2007-2015; and former Director, CIT Bank, CIT Group Inc. (commercial and consumer finance), 2010-2016 |
Catherine James Paglia
c/o Columbia Management
Investment Advisers, LLC
290 Congress Street
Boston, MA 02210
1952 | Co-Chair since 2021; Chair of CFST, CFST II, CFVST II, CET I and CET II since 2020; Trustee of CFST, CFST II and CFVST II since 2004 and CFST I and CFVIT since 2021 | Director, Enterprise Asset Management, Inc. (private real estate and asset management company) since September 1998; Managing Director and Partner, Interlaken Capital, Inc., 1989-1997; Vice President, 1982-1985, Principal, 1985-1987, Managing Director, 1987-1989, Morgan Stanley; Vice President, Investment Banking, 1980-1982, Associate, Investment Banking, 1976-1980, Dean Witter Reynolds, Inc. | 177 | Director, Valmont Industries, Inc. (irrigation systems manufacturer) since 2012; Trustee, Carleton College (on the Investment Committee); Trustee, Carnegie Endowment for International Peace (on the Investment Committee) |
Minor M. Shaw
c/o Columbia Management
Investment Advisers, LLC
290 Congress Street
Boston, MA 02210
1947 | Trustee since 2003 | President, Micco LLC (private investments) since 2011; President, Micco Corp. (family investment business), 1998-2011 | 177 | Director, Blue Cross Blue Shield of South Carolina (Chair of Compensation Committee) since April 2008; Trustee, Hollingsworth Funds (on the Investment Committee) since 2016 (previously Board Chair from 2016-2019); Former Advisory Board member, Duke Energy Corp., 2016-2020; Chair of the Duke Endowment; Chair of Greenville – Spartanburg Airport Commission; former Trustee, BofA Funds Series Trust (11 funds), 2003-2011; former Director, Piedmont Natural Gas, 2004-2016; former Director, National Association of Corporate Directors, Carolinas Chapter, 2013-2018; Chair, Daniel-Mickel Foundation since 1998 |
Columbia Mid Cap Index Fund | Annual Report 2022
| 39 |
TRUSTEES AND OFFICERS (continued)
Independent trustees (continued)
Name,
address,
year of birth | Position held
with the Columbia Funds and
length of service | Principal occupation(s)
during past five years
and other relevant
professional experience | Number of
Funds in the
Columbia Funds
Complex*
overseen | Other directorships
held by Trustee
during the past
five years |
Natalie A. Trunow
c/o Columbia Management
Investment Advisers, LLC
290 Congress Street
Boston, MA 02210
1967 | Trustee since 2020 | Chief Executive Officer, Millennial Portfolio Solutions LLC (asset management and consulting services), January 2016-January 2021; Non-executive Member of the Investment Committee and Valuation Committee, Sarona Asset Management Inc. (private equity firm) since September 2019; Advisor, Horizon Investments (asset management and consulting services), August 2018-January 2021; Advisor, Paradigm Asset Management, November 2016-December 2021; Consultant to Independent Trustees of CFVIT and CFST I from September 2016 to June 2020 with respect to CFVIT and to December 2020 with respect to CFST I; Director of Investments/Consultant, Casey Family Programs, April 2016-November 2016; Senior Vice President and Chief Investment Officer, Calvert Investments, August 2008-January 2016; Section Head and Portfolio Manager, General Motors Asset Management, June 1997-August 2008 | 175 | Former Director, Investment Committee, Health Services for Children with Special Needs, Inc., 2012-2019; Director, Chair of Audit Committee, Consumer Credit Counseling Services (formerly Guidewell Financial Solutions), since 2019; Independent Director, Investment Committee and Valuation Committee, Sarona Asset Management, since 2019 |
Sandra Yeager
c/o Columbia Management
Investment Advisers, LLC
290 Congress Street
Boston, MA 02210
1964 | Trustee since 2017 | Retired; President and founder, Hanoverian Capital, LLC (SEC registered investment advisor firm), 2008-2016; Managing Director, DuPont Capital, 2006-2008; Managing Director, Morgan Stanley Investment Management, 2004-2006; Senior Vice President, Alliance Bernstein, 1990-2004 | 177 | Former Director, NAPE Education Foundation, October 2016-October 2020 |
| * | The term “Columbia Funds Complex” as used herein includes Columbia Seligman Premium Technology Growth Fund, Tri-Continental Corporation and each series of Columbia Fund Series Trust (CFST), Columbia Funds Series Trust I (CFST I), Columbia Funds Series Trust II (CFST II), Columbia ETF Trust I (CET I), Columbia ETF Trust II (CET II), Columbia Funds Variable Insurance Trust (CFVIT) and Columbia Funds Variable Series Trust II (CFVST II). Messrs. Batejan, Beckman, Gallagher and Hacker and Mses. Blatz, Carlton, Flynn, Paglia, Shaw and Yeager serve as Directors of Columbia Seligman Premium Technology Growth Fund and Tri-Continental Corporation. |
Interested trustee affiliated with Investment Manager*
Name,
address,
year of birth | Position held with the Columbia Funds and length of service | Principal occupation(s) during the
past five years and other relevant
professional experience | Number of
Funds in the
Columbia Funds
Complex overseen | Other directorships
held by Trustee
during the past
five years |
Daniel J. Beckman
c/o Columbia Management
Investment Advisers, LLC
290 Congress Street
Boston, MA 02210
1962 | Trustee since November 2021 and President since June 2021 | Vice President – Head of North America Product, Columbia Management Investment Advisers, LLC since April 2015; President and Principal Executive Officer of the Columbia Funds since June 2021; officer of Columbia Funds and affiliated funds, 2020-2021 | 177 | Director, Ameriprise Trust Company, since October 2016; Director, Columbia Management Investment Distributors, Inc. since November 2018; Board of Governors, Columbia Wanger Asset Management, LLC since January 2022 |
| * | Interested person (as defined under the 1940 Act) by reason of being an officer, director, security holder and/or employee of the Investment Manager or Ameriprise Financial. |
The Statement of Additional Information has additional information about the Fund’s Board members and is available, without charge, upon request by calling 800.345.6611, visiting columbiathreadneedleus.com/investor/ or contacting your financial intermediary.
| 40 | Columbia Mid Cap Index Fund | Annual Report 2022 |
TRUSTEES AND OFFICERS (continued)
The Board has appointed officers who are responsible for day-to-day business decisions based on policies it has established. The officers serve at the pleasure of the Board. The following table provides basic information about the Officers of the Fund as of the printing of this report, including principal occupations during the past five years, although their specific titles may have varied over the period. In addition to Mr. Beckman, who is President and Principal Executive Officer, the Fund’s other officers are:
Fund officers
Name,
address and
year of birth | Position and year
first appointed to
position for any Fund
in the Columbia
Funds Complex or a
predecessor thereof | Principal occupation(s) during past five years |
Michael G. Clarke
290 Congress Street
Boston, MA 02210
1969 | Chief Financial Officer and Principal Financial Officer (2009) and Senior Vice President (2019) | Senior Vice President and Head of Global Operations & Investor Services, Columbia Management Investment Advisers, LLC, since March 2022 (previously Vice President, Head of North American Operations, and Co-Head of Global Operations, June 2019 to February 2022 and Vice President – Accounting and Tax, May 2010 - May 2019); senior officer of Columbia Funds and affiliated funds since 2002. |
Joseph Beranek
5890 Ameriprise
Financial Center
Minneapolis, MN 55474
1965 | Treasurer and Chief Accounting Officer (Principal Accounting Officer) (2019) and Principal Financial Officer (2020), CFST, CFST I, CFST II, CFVIT and CFVST II; Assistant Treasurer, CET I and CET II | Vice President – Mutual Fund Accounting and Financial Reporting, Columbia Management Investment Advisers, LLC, since December 2018 and March 2017, respectively (previously Vice President – Pricing and Corporate Actions, May 2010 - March 2017). |
Marybeth Pilat
290 Congress Street
Boston, MA 02210
1968 | Treasurer and Chief Accounting Officer (Principal Accounting Officer) and Principal Financial Officer (2020) for CET I and CET II; Assistant Treasurer, CFST, CFST I, CFST II, CFVIT and CFVST II | Vice President – Product Pricing and Administration, Columbia Management Investment Advisers, LLC, since May 2017; Director - Fund Administration, Calvert Investments, August 2015 – March 2017; Vice President - Fund Administration, Legg Mason, May 2015 - July 2015; Vice President - Fund Administration, Columbia Management Investment Advisers, LLC, May 2010 - April 2015. |
William F. Truscott
290 Congress Street
Boston, MA 02210
1960 | Senior Vice President (2001) | Formerly, Trustee/Director of Columbia Funds Complex or legacy funds, November 2001-January 1, 2021; Chief Executive Officer, Global Asset Management, Ameriprise Financial, Inc. since September 2012; Chairman of the Board and President, Columbia Management Investment Advisers, LLC since July 2004 and February 2012, respectively; Chairman of the Board and Chief Executive Officer, Columbia Management Investment Distributors, Inc. since November 2008 and February 2012, respectively; Chairman of the Board and Director, Threadneedle Asset Management Holdings, Sàrl since March 2013 and December 2008, respectively; senior executive of various entities affiliated with Columbia Threadneedle. |
Christopher O. Petersen
5228 Ameriprise Financial Center
Minneapolis, MN 55474
1970 | Senior Vice President and Assistant Secretary | Formerly, Trustee/Director of funds within the Columbia Funds Complex, July 1, 2020 - November 22, 2021; Senior Vice President and Assistant General Counsel, Ameriprise Financial, Inc. since September 2021 (previously Vice President and Lead Chief Counsel, January 2015 - September 2021); President and Principal Executive Officer of the Columbia Funds, 2015 - 2021; officer of Columbia Funds and affiliated funds since 2007. |
Thomas P. McGuire
290 Congress Street
Boston, MA 02210
1972 | Senior Vice President and Chief Compliance Officer (2012) | Vice President – Asset Management Compliance, Ameriprise Financial, Inc., since May 2010; Chief Compliance Officer, Columbia Acorn/Wanger Funds since December 2015; Chief Compliance Officer, Ameriprise Certificate Company, September 2010 – September 2020. |
Ryan C. Larrenaga
290 Congress Street
Boston, MA 02210
1970 | Senior Vice President (2017), Chief Legal Officer (2017), and Secretary (2015) | Vice President and Chief Counsel, Ameriprise Financial, Inc. since August 2018 (previously Vice President and Group Counsel, August 2011 - August 2018); Chief Legal Officer, Columbia Acorn/Wanger Funds, since September 2020; officer of Columbia Funds and affiliated funds since 2005. |
Columbia Mid Cap Index Fund | Annual Report 2022
| 41 |
TRUSTEES AND OFFICERS (continued)
Fund officers (continued)
Name,
address and
year of birth | Position and year
first appointed to
position for any Fund
in the Columbia
Funds Complex or a
predecessor thereof | Principal occupation(s) during past five years |
Michael E. DeFao
290 Congress Street
Boston, MA 02210
1968 | Vice President (2011) and Assistant Secretary (2010) | Vice President and Chief Counsel, Ameriprise Financial, Inc. since May 2010; Vice President, Chief Legal Officer and Assistant Secretary, Columbia Management Investment Advisers, LLC since October 2021 (previously Vice President and Assistant Secretary, May 2010 – September 2021). |
Lyn Kephart-Strong
5228 Ameriprise
Financial Center
Minneapolis, MN 55474
1960 | Vice President (2015) | President, Columbia Management Investment Services Corp. since October 2014; Vice President & Resolution Officer, Ameriprise Trust Company since August 2009. |
| 42 | Columbia Mid Cap Index Fund | Annual Report 2022 |
[THIS PAGE INTENTIONALLY LEFT BLANK]
Columbia Mid Cap Index Fund
P.O. Box 219104
Kansas City, MO 64121-9104
Please read and consider the investment objectives, risks, charges and expenses for any fund carefully before investing. For a prospectus and summary prospectus, which contains this and other important information about the Fund, go to
columbiathreadneedleus.com/investor/. The Fund is distributed by Columbia Management Investment Distributors, Inc., member FINRA, and managed by Columbia Management Investment Advisers, LLC.
Columbia Threadneedle Investments (Columbia Threadneedle) is the global brand name of the Columbia and Threadneedle group of companies. All rights reserved.
© 2022 Columbia Management Investment Advisers, LLC.
columbiathreadneedleus.com/investor/
Item 2. Code of Ethics.
(a)The registrant has adopted a code of ethics that applies to the registrant's principal executive officer, principal financial officer, principal accounting officer or controller, or persons performing similar functions, regardless of whether these individuals are employed by the registrant or a third party.
(b)During the period covered by this report, there were not any amendments to a provision of the code of ethics that applies to the registrant's principal executive officer, principal financial officer, principal accounting officer or controller, or persons performing similar functions, regardless of whether these individuals are employed by the registrant or a third party, and that relates to any element of the code of ethics definition enumerated in paragraph (b) of this Item.
(c)During the period covered by this report, there were no waivers, including any implicit waivers, from a provision of the code of ethics to the registrant's principal executive officer, principal financial officer, principal accounting officer or controller, or persons performing similar functions, regardless of whether these individuals are employed by the registrant or a third party that relates to one or more of the items set forth in paragraph (b) of this Item.
Item 3. Audit Committee Financial Expert.
The registrant's Board of Trustees has determined that David M. Moffett, Brian J. Gallagher, J. Kevin Connaughton, and Sandra L. Yeager, each of whom are members of the registrant's Board of Trustees and Audit Committee, each qualify as an audit committee financial expert. Mr. Moffett, Mr. Gallagher, Mr. Connaughton, and Ms. Yeager are each independent trustees, as defined in paragraph (a)(2) of this item's instructions.
Item 4. Principal Accountant Fees and Services.
Fee information below is disclosed for the ten series of the registrant whose reports to stockholders are included in this annual filing.
(a)Audit Fees. Aggregate Audit Fees billed by the principal accountant for professional services rendered during the fiscal years ended February 28, 2022 and February 28, 2021 are approximately as follows:
20222021
$295,000 $322,000
Audit Fees include amounts related to the audit of the registrant's annual financial statements or services that are normally provided by the accountant in connection with statutory and regulatory filings or engagements for those fiscal years.
(b)Audit-Related Fees. Aggregate Audit-Related Fees billed to the registrant by the principal accountant for professional services rendered during the fiscal years ended February 28, 2022 and February 28, 2021 are approximately as follows:
20222021
$13,500 $10,800
Audit-Related Fees include amounts for assurance and related services by the principal accountant that are reasonably related to the performance of the audit of the registrant's financial statements and are not reported in Audit Fees above.
During the fiscal years ended February 28, 2022 and February 28, 2021, there were no Audit-Related Fees billed by the registrant's principal accountant to the registrant's investment adviser (not including any sub-adviser whose role is primarily portfolio management and is subcontracted with or overseen by another investment adviser) and any entity controlling, controlled by, or under common control with the adviser that provides ongoing services to the registrant for an engagement that related directly to the operations and financial reporting of the registrant.
(c)Tax Fees. Aggregate Tax Fees billed by the principal accountant to the registrant for professional services rendered during the fiscal years ended February 28, 2022 and February 28, 2021 are approximately as follows:
20222021
$5,500 $1,600
Tax Fees include amounts for the review of annual tax returns, the review of required shareholder distribution calculations and typically include amounts for professional services by the principal accountant for tax compliance, tax advice and tax planning. Fiscal year 2021 and 2022 include Tax Fees for foreign tax filings.
During the fiscal years ended February 28, 2022 and February 28, 2021, there were no Tax Fees billed by the registrant's principal accountant to the registrant's investment adviser (not including any sub-adviser whose role is primarily portfolio management and is subcontracted with or overseen by another investment adviser) and any entity controlling, controlled by, or under common control with the adviser that provides ongoing services to the registrant for an engagement that related directly to the operations and financial reporting of the registrant.
(d)All Other Fees. Aggregate All Other Fees billed by the principal accountant to the registrant for professional services rendered during the fiscal years ended February 28,
2022 and February 28, 2021 are approximately as follows:
All Other Fees, if any, include amounts for products and services provided by the principal accountant, other than the services reported in paragraphs (a) through (c) above.
Aggregate All Other Fees billed by the registrant's principal accountant to the registrant's investment adviser (not including any sub-adviser whose role is primarily portfolio management and is subcontracted with or overseen by another investment adviser) and any entity controlling, controlled by, or under common control with the adviser that provides ongoing services to the registrant for an engagement that related directly to the operations and financial reporting of the registrant during the fiscal years ended February 28, 2022 and February 28, 2021 are approximately as follows:
20222021
$520,000 $550,700
In fiscal years 2022 and 2021, All Other Fees primarily consists of fees billed for internal control examinations of the registrant's transfer agent and investment adviser.
(e)(1) Audit Committee Pre-Approval Policies and Procedures
The registrant's Audit Committee is required to pre-approve the engagement of the
registrant's independent auditors to provide audit and non-audit services to the registrant and non-audit services to its investment adviser (excluding any sub -adviser whose role is primarily portfolio management and is sub-contracted or overseen by another investment adviser (the "Adviser") or any entity controlling, controlled by or under common control with the Adviser that provides ongoing services to the Fund (a "Control Affiliate") if the engagement relates directly to the operations and financial reporting of the registrant.
The Audit Committee has adopted a Policy for Engagement of Independent Auditors for Audit and Non-Audit Services (the "Policy"). The Policy sets forth the understanding of the Audit Committee regarding the engagement of the registrant's independent accountants to provide (i) audit and permissible audit-related, tax and other services to the registrant ("Fund Services"); (ii) non-audit services to the registrant's Adviser and any Control Affiliates, that relates directly to the operations and financial reporting of a Fund ("Fund-related Adviser Services"); and (iii) certain other audit and non-audit services to the registrant's Adviser and its Control Affiliates. A service will require specific pre-approval by the Audit Committee if it is to be provided by the Fund's independent auditor; provided, however, that pre-approval of non-audit services to the Fund, the Adviser or Control Affiliates may be waived if certain de minimis requirements set forth in the SEC's rules are met.
Under the Policy, the Audit Committee may delegate pre-approval authority to any pre- designated member or members who are independent board members. The member(s) to whom such authority is delegated must report, for informational purposes only, any pre - approval decisions to the Audit Committee at its next regular meeting. The Audit Committee's responsibilities with respect to the pre-approval of services performed by the independent auditor may not be delegated to management.
On an annual basis, at a regularly scheduled Audit Committee meeting, the Fund's Treasurer or other Fund officer shall submit to the Audit Committee a schedule of the types of Fund Services and Fund-related Adviser Services that are subject to specific pre- approval. This schedule will provide a description of each type of service that is subject to specific pre-approval, along with total projected fees for each service. The pre- approval will generally cover a one-year period. The Audit Committee will review and approve the types of services and the projected fees for the next one-year period and may add to, or subtract from, the list of pre-approved services from time to time, based on subsequent determinations. This specific approval acknowledges that the Audit Committee is in agreement with the specific types of services that the independent auditor will be permitted to perform and the projected fees for each service.
The Fund's Treasurer or other Fund officer shall report to the Audit Committee at each of its regular meetings regarding all Fund Services or Fund-related Adviser Services provided since the last such report was rendered, including a description of the services, by category, with forecasted fees for the annual reporting period, proposed changes requiring specific pre-approval and a description of services provided by the independent auditor, by category, with actual fees during the current reporting period.
*****
(e)(2) None, or 0%, of the Audit-Related Fees, Tax Fees and All Other Fees paid by the Fund or affiliated entities relating directly to the operations and financial reporting of the Registrant disclosed above were approved by the audit committee pursuant to paragraphs (c)(7)(i)(C) of Rule 2-01 of Regulation S-X (which permits audit committee approval after the start of the engagement with respect to services other than audit, review or attest services, if certain conditions are satisfied).
(f)Not applicable.
(g)The aggregate non-audit fees billed by the registrant's accountant for services rendered to the registrant, and rendered to the registrant's investment adviser (not including any sub-adviser whose role is primarily portfolio management and is subcontracted with or overseen by another investment adviser), and any entity controlling, controlled by, or under common control with the adviser that provides ongoing services to the registrant for the fiscal years ended February 28, 2022 and February 28, 2021 are approximately as follows:
20222021
$539,000 $563,100
(h)The registrant's Audit Committee of the Board of Directors has considered whether the provision of non-audit services that were rendered to the registrant's adviser (not including any sub-adviser whose role is primarily portfolio management and is subcontracted with or overseen by another investment adviser), and any entity controlling, controlled by, or under common control with the investment adviser that provides ongoing services to the registrant that were not pre-approved pursuant to
paragraph (c)(7)(ii) of Rule 2-01 of Regulation S-X, is compatible with maintaining the principal accountant's independence.
Item 5. Audit Committee of Listed Registrants.
Not applicable.
Item 6. Investments
(a)The registrant's "Schedule I – Investments in securities of unaffiliated issuers" (as set forth in 17 CFR 210.12-12) is included in Item 1 of this Form N-CSR.
(b)Not applicable.
Item 7. Disclosure of Proxy Voting Policies and Procedures for Closed-End Management Investment Companies.
Not applicable.
Item 8. Portfolio Managers of Closed-End Management Investment Companies.
Not applicable.
Item 9. Purchases of Equity Securities by Closed-End Management Investment Company and Affiliated Purchasers.
Not applicable.
Item 10. Submission of Matters to a Vote of Security Holders.
There were no material changes to the procedures by which shareholders may recommend nominees to the registrant's board of directors.
Item 11. Controls and Procedures.
(a)The registrant's principal executive officer and principal financial officer, based on their evaluation of the registrant's disclosure controls and procedures as of a date within 90 days of the filing of this report, have concluded that such controls and procedures are adequately designed to ensure that information required to be disclosed by the registrant in Form N-CSR is accumulated and communicated to the registrant's management, including the principal executive officer and principal financial officer, or persons performing similar functions, as appropriate to allow timely decisions regarding required disclosure.
(b)There was no change in the registrant's internal control over financial reporting that occurred during the period covered by this report that has materially affected,
SIGNATURES
Pursuant to the requirements of the Securities Exchange Act of 1934 and the Investment Company Act of 1940, the registrant has duly caused this report to be signed on its behalf by the undersigned, thereunto duly
authorized. | | |
(registrant) | | Columbia Funds Series Trust | |
By (Signature and Title) | /s/ Daniel J. Beckman | |
| | | Daniel J. Beckman, President and Principal Executive Officer | |
Date | | April 21, 2022 | |
Pursuant to the requirements of the Securities Exchange Act of 1934 and the Investment Company Act of 1940, this report has been signed below by the following persons on behalf of the registrant and in the capacities and on the dates indicated.
By (Signature and Title) | /s/ Daniel J. Beckman |
| | Daniel J. Beckman, President and Principal Executive Officer |
Date | | April 21, 2022 | |
By (Signature and Title) | /s/ Michael G. Clarke |
| | Michael G. Clarke, Chief Financial Officer, Principal Financial Officer |
| | and Senior Vice President |
Date | | April 21, 2022 | |
By (Signature and Title) | /s/ Joseph Beranek |
| | Joseph Beranek, Treasurer, Chief Accounting Officer and Principal |
| | Financial Officer |
Date | | April 21, 2022 | |