SECURITIES AND EXCHANGE COMMISSION
Washington, D.C. 20549
FORM 6-K
Report of Foreign Private Issuer
Pursuant to Rule 13a-16 or 15d-16
of the Securities Exchange Act of 1934
For the month of February 26th, 2003
Commission File Number: 000-28011
Terra Networks, S.A.
(Translation of registrant’s name into English)
Paseo de la Castellana, 92
28.046 Madrid
Spain
(34) 91-452-3900
(Address of principal executive offices)
Indicate by check mark whether the registrant files or will file annual reports under cover of Form 20-F or Form 40-F:
Form 20-F x Form 40-F ¨
Indicate by check mark if the registrant is submitting the Form 6-K in paper as permitted by Regulation S-T Rule 101(b)(1):
Yes ¨ No x
Indicate by check mark if the registrant is submitting the Form 6-K in paper as permitted by Regulation S-T Rule 101(b)(7):
Yes ¨ No x
Indicate by check mark whether by furnishing the information contained in this Form, the registrant is also thereby furnishing the information to the Commission pursuant to Rule 12g3-2(b) under the Securities Exchange Act of 1934:
Yes ¨ No x
If “Yes” is marked, indicate below the file number assigned to the registrant in connection with Rule 12g3-2(b): N/A
Terra Networks, S.A.
TABLE OF CONTENTS
Item | 4Q-02 Terra Lycos Earnings Release | Sequential Page Number |
| 1. | Fourth Quarter 2002 Results |
| · | Press Release |
| · | Highlights |
| 2. | Financial Statements |
| · | Consolidated Operating P&L |
| · | Consolidated Income Statement |
| · | Consolidated Balance Sheet |
| · | Cash Flow |
| · | Revenue Data |
| · | Operating Data |
| 3. | Historic Data |
| · | Consolidated Operating P&L |
| · | Consolidated Income Statement |
| · | Consolidated Balance Sheet |
| · | Revenue Data |
| · | Operating Expenses and Margins |
| · | Operating Data |
| 4. | Other Information |
| · | Extraordinary Expense and Tax Reversal |
| · | Operating P&L Description |
| · | Main Fully and Equity Consolidated Companies |
| · | Guidance |
| · | Press Releases |
| · | Contact Information |
2

02/26/03
In the fourth quarter of 2002 and for the ninth consecutive quarter, the Company met its EBITDA and revenue projections made to analysts.
TERRA LYCOS WRITES DOWN 1.4 BILLION EUROS IN ASSETS
| • | Terra Lycos used transparency and prudent conservative accounting criteria to bring the book value of past investments in line with the current market situation. |
| • | These non-cash charges resulted in a net loss for the year of 2 billion euros. Net income for the year, excluding these asset write-downs and applying the same tax rate as in the previous year, amounted to 423 million euros, a 25% improvement over 2001. |
| • | Write-down of goodwill was 857 million euros, of which 81% corresponded to the acquisition of Lycos, while the write-down of the tax credit amounted to 453 million euros. |
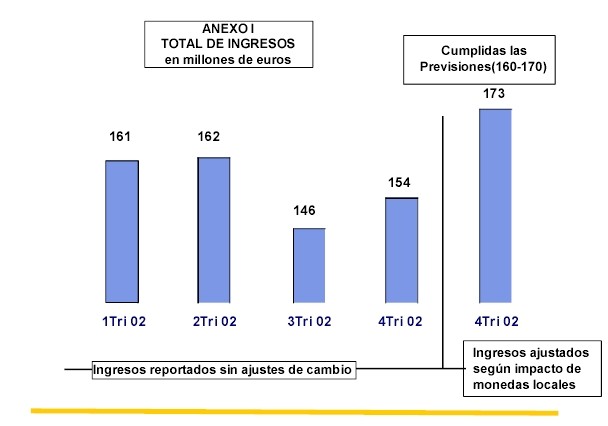
| • | In the fourth quarter of 2002, revenues were 173 million euros, applying the same exchange rate of the third quarter, exceeding the guidance of 160-170 million euros provided in the third quarter conference call. This is an increase of 19% over the third quarter on a constant euro basis. (SEE APPENDIX I) |
| • | The effect of the devaluation in 2002 of all currencies outside the euro zone where Terra operates yielded a negative impact of 19 million euros in the fourth quarter. Taking into account the exchange rate impact, revenues were 154 million euros, 5% more than the previous quarter. |
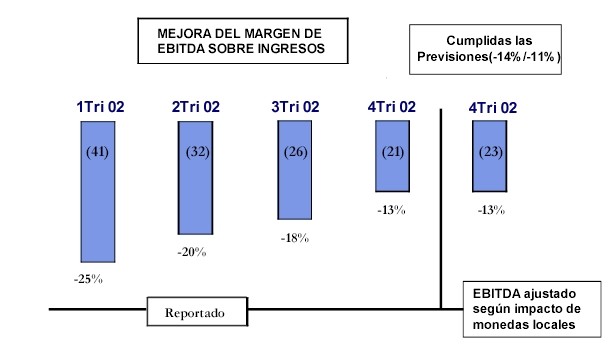
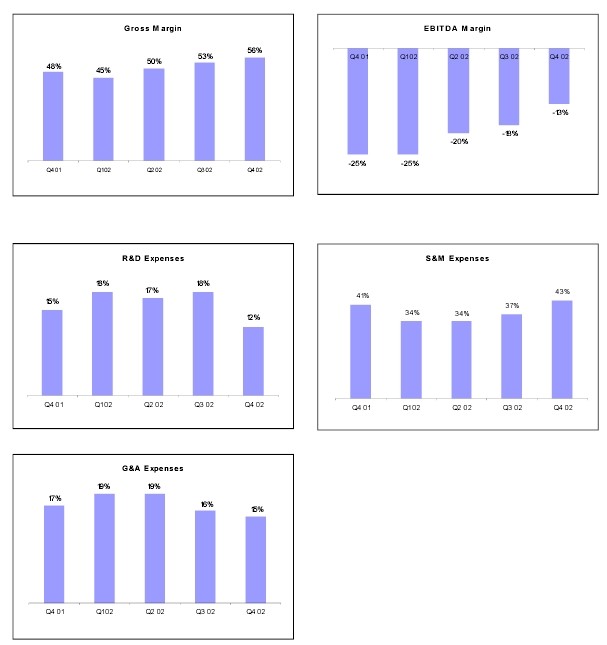
| • | Earnings before interest, taxes, depreciation and amortization (EBITDA) for the quarter was –21 million euros, an EBITDA margin of –13%, also in line with the Company’s guidance (between -11% and –14%). EBITDA for the year was –120 million euros, a 48% improvement over 2001, equivalent to 112 million euros. |
| • | At the end of December 2002, Terra Lycos had a total of 3.1 million paying access, communications services and portal subscribers, an increase of 24% over the previous quarter and 88% over 2001. The Company ended the year with 378,000 ADSLcustomers, an increase of 11% over the previous quarter and 62% over 2001. |
3
Madrid, 26 February 2003 —Terra Lycos (MC: TRR; NASDAQ: TRLY), the global Internet leader, presented its financial results for the fourth quarter and fiscal year 2002 today. During a year shaped by an adverse macroeconomic backdrop and the prolongation of the advertising market crisis, Terra Lycos maintained positive and constant progress towards profitability. The Company carried out significant write-downs in assets at year end and recently signed a strategic agreement with reinforcing Terra Lycos’ business model by boosting future growth.
ASSET IMPAIRMENT
Terra Lycos employed transparency and prudent conservative accounting criteria to bring the book value of past investments in line with the current market situation via an asset write-down totaling 1.4 billion euros.
The write-down of goodwill was 857 million euros, of which 81% corresponded to the acquisition of Lycos, with the remainder due to other acquisitions. In keeping with this, a write-down of the tax credit amounted to 453 million euros. The rest of the write-downs, up to 1.4 million euros, correspond to other asset entries. These write-downs, which did not result in any cash disbursements, led to a net loss for the year of 2 billion euros. Net income for the year, excluding asset write-downs and using the same tax rate as in the previous year, amounted to -423 million euros, a 25% improvement over 2001.
FOURTH QUARTER
The Company kept its commitments with the Market.
In the fourth quarter of 2002, Terra Lycos earned revenue of 173 million in constant third-quarter euros, an increase of 19% over the previous quarter. Exceeding the Company’s guidance for the quarter (between 160 and 170 million in constant third-quarter euros). Total revenue, after consolidation of the different local currencies, suffered a negative exchange-rate effect of 19 million euros due to the appreciation of the euro against other currencies.
Revenue in current euros, taking into account the exchange-rate effect, was 154 million euros, an increase of 5% over the previous quarter.
The transition of the Company’s business model was reflected in results for the fourth quarter of 2002, with the diversification of Company revenue being especially noteworthy. During the quarter, 33% of total revenue came from access subscriptions, 35% from advertising and e-commerce, 22% from portal subscriptions and communications services, and 10% from other sources, including corporate and SME services.
4
During the fourth quarter, Terra Lycos launched value-added communications services, including Terra Messenger in Spain, inaugurating a new strategy based on real-time communications services. Terra Messenger was just one of several value-added products rolled out within the framework of the O.B.P. model in 2002, which also included the launch of a for-pay e-mail service in Brazil, which offers the protection of anti-virus and anti-spam filters and which already has almost 480,000 customers.
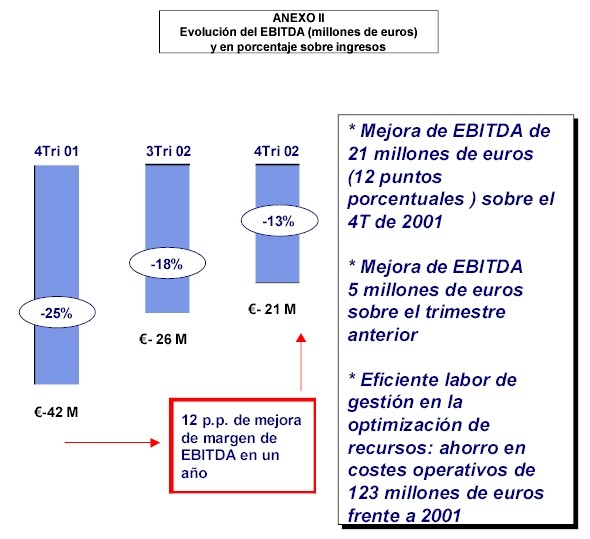
Earnings before interest, taxes, depreciation and amortization (EBITDA) for the fourth quarter of 2002 improved by 21 million euros over the same period of the previous year, to –21 million euros, advancing the continual improvement in EBITDA over the last two years. The EBITDA margin was –13%, in line with the Company’s guidance for the quarter (between -11% and –14%) an increase of 5 percentage points over the third quarter and 12 percentage points over the same period of the previous year. (SEE APPENDIX I)
FISCAL YEAR 2002
Terra Lycos’ revenue increased quarter by quarter.
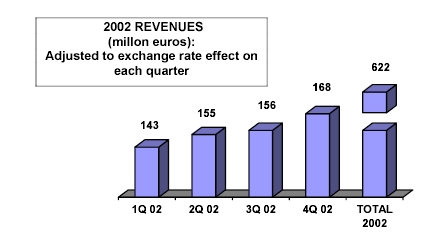
Revenue for fiscal year 2002 amounted to 622 million euros. At a constant 2001 exchange rate, revenue for 2002 would have amounted to 692 million euros. Despite an adverse macroeconomic environment, this is a figure similar to that reached the previous year, although it has greater quality because it is based on growth in profitable segments.
At the close of 2002, and applying to each quarter of the year the foreign exchange rate effect for the twelve month period, Terra Lycos’ revenues increased quarter by quarter throughout the year as you can see in the following graph:
EBITDA for the year was –120 million euros, a 48% or 112 million euro improvement over 2001. The EBITDA margin for the year was –19%, a 14 percentage point improvement over the previous year.
5
Operating Expenses
In 2002, Terra Lycos continued to combine effective management with process improvement and created an organization consistent with its global presence, enabling the gradual reduction of operating expenses. During the year, the Company reduced costs by 22% from the previous year, a savings of 123 million euros.
Net Income
In 2002, the Company posted a net loss of 2 billion euros, due to the asset write-down of 1.4 billion euros Excluding this non-cash charge, and applying the same tax rate as in 2001, net income would have reached 423 million euros, 25% higher than the year before.
Cash
Terra Lycos has one of the strongest cash positions in the sector, allowing it to fund its operations and explore new business opportunities in order to boost profitability. Skilled cash management enabled the Company to end 2002 with 1.8 billion euros.
OPERATING RESULTS
An increase of paying subscribers
Terra Lycos ended 2002 with a total of 5.9 million subscribers, 3.1 million or 53% of which are paying subscribers to access, communications and portal services. This marks a 24% increase from the end of the third quarter and an 88% increase from the close of 2001. The Company ended the fourth quarter of the year with 378,000 ADSL subscribers, 62% more than the previous year and 11% more than at the end of the third quarter.
Terra Lycos closed December with 1.7 million subscribers to communications and portal services, a 379% leap from the year before and 52% more than at the end of the third quarter.
“2002 presented a major challenge for Terra Lycos, with an adverse macroeconomic backdrop and a crisis in the advertising industry in general and in the online advertising market in particular” stated Terra Lycos Executive Chairman Joaquim Agut. He added “We were still able to continue growing and focusing on services for which our clients are willing to pay. At the same time, we have maintained a constant path towards profitability through efficient management and a commitment to innovation that allows us to obtain new sources of recurring revenue.”
This growth and progress towards profitability were reinforced with an asset write-down in the year’s last quarter and also with the strategic alliance signed with which will allow Terra Lycos to consolidate its long-term business model. The agreement makes Terra Lycos the exclusive portal and provider of value-added Internet services for the Group, as well as continuing to exploit globally its broadband and narrowband access business.
6
The agreement, for an initial period of six years with an automatic one-year renewal, guarantees that Terra Lycos will generate a minimum margin of 78.5 million euros per year, the difference between revenues from these services and the related direct costs and investment. For the first year (2003), Terra Lycos estimates it will obtain about 118 million euros from this agreement, generating a minimum margin of 78.5 million euros.
2002 SUMMARY:
GROWTH:
Despite an adverse operating environment, Terra Lycos managed to sustain its growth and profitability. Growth in revenues in local currency accelerated each quarter. Terra Lycos refocused towards the client and profitable services.
EBITDA:
This remains the key measure used by analysts of Internet companies. For the ninth straight quarter, Terra Lycos outperformed the guidance and met its commitments. In 2002, EBITDA increased by 112 million euros and the EBITDA margin by 14 percentage points.
CASH:
Terra Lycos boasts one of the strongest cash positions in the sector, which leaves it in a comfortable position to carry out operations to drive growth.
TERRA LYCOS-TELEFONICA AGREEMENT:
This agreement is aimed at tapping existing synergies between the two companies, while for Terra Lycos and its shareholders it provides a long-term guarantee for its business model.
GOODWILL:
The significant write-downs and the restructuring of assets and fiscal credits in the 2002 financial statements are all part of Terra Lycos’ aim of maintaining a high level of investor transparency.
MANAGEMENT:
Reorganisation of the global group realized efficiencies and redundancies in the organization that led to management changes. The aim is to bring the size of the teams in line with the desired objectives, while complying with prevailing labour laws. This need was particularly evident in 2002.
U.S.:
The U.S. is one of Terra Lycos’ most important markets. The company intends to maintain its presence there, both because of its position (it is the country’s fourth-largest portal) and because of its technological leadership, which can be exported to the rest of the world.
SPAIN AND LATIN AMERICA:
They are both the natural markets in which Terra Lycos will continue its operations maintaining its leadership position.
7
8
9
D% | |||||||||||||||
Q4 2002 | Q3 2002 | Q4 2001 | Quarterly | Annual | |||||||||||
Total Revenue | 153.7 |
| 145.8 |
| 166.0 |
| 5 | % | -7 | % | |||||
Media | 86.1 |
| 86.8 |
| 105.6 |
| -1 | % | -18 | % | |||||
Access and Services | 67.6 |
| 58.9 |
| 60.4 |
| 15 | % | 12 | % | |||||
EBITDA | (20.6 | ) | (26.5 | ) | (41.7 | ) | |||||||||
EBITDA Margin | -13 | % | -18 | % | -25 | % | 5 | p.p. | 12 | p.p. | |||||
Total Subscribers (million) | 5.9 |
| 5.3 |
| 4.7 |
| 11 | % | 25 | % | |||||
Access Subs | 4.1 |
| 4.2 |
| 4.3 |
| 0 | % | -5 | % | |||||
CSP + Portal Subs | 1.7 |
| 1.1 |
| 0.4 |
| 52 | % | 379 | % | |||||
Average daily page views (million) | 368 |
| 390 |
| 500 |
| -6 | % | -26 | % | |||||
Unique users (million) | 120 |
| 118 |
| 111 |
| 2 | % | 8 | % | |||||
FY 2002 | FY 2002 | FY 2001 | D% | D% | |||||||||||
Constant € (*) | Constant € (*) | ||||||||||||||
Total Revenue | 621.8 |
| 692.2 |
| 693.5 |
| -10 | % | 0 | % | |||||
Media | 359.4 |
| 391.7 |
| 448.1 |
| -20 | % | -13 | % | |||||
Access and Services | 262.4 |
| 300.5 |
| 245.4 |
| 7 | % | 22 | % | |||||
EBITDA | (120.3 | ) | (133.9 | ) | (232.0 | ) | |||||||||
EBITDA Margin | -19 | % | -19 | % | -33 | % | 14 | p.p. | 14 | p.p. | |||||
Total Subscribers (million) | 5.9 |
| 5.9 |
| 4.7 |
| 25 | % | |||||||
Access Subs | 4.1 |
| 4.1 |
| 4.3 |
| -5 | % | |||||||
CSP + Portal Subs | 1.7 |
| 1.7 |
| 0.4 |
| 379 | % | |||||||
Average daily page views (million) | 368 |
| 368 |
| 500 |
| -26 | % | |||||||
Unique users (million) | 120 |
| 120 |
| 111 |
| 8 | % | |||||||
(*) 2001 average exchange rates
10
Financial Statements
11

Consolidated Operating P&L(1)
(in million of Euros—Spanish GAAP)
unaudited
Three Months Ended December 31 | Twelve Months Ended Dcember 31 | |||||||||||
2002 | 2001 | 2002 | 2001 | |||||||||
Revenues: | ||||||||||||
Media | 86.1 |
| 105.6 |
| 359.4 |
| 448.1 |
| ||||
Access and Services | 67.6 |
| 60.4 |
| 262.4 |
| 245.4 |
| ||||
Total revenues | 153.7 |
| 166.0 |
| 621.8 |
| 693.5 |
| ||||
Cost of revenues | (67.2 | ) | (86.6 | ) | (304.4 | ) | (364.6 | ) | ||||
Gross Profit | 86.4 |
| 79.4 |
| 317.4 |
| 328.9 |
| ||||
Operating expenses: | ||||||||||||
Research and development | (18.3 | ) | (24.8 | ) | (101.5 | ) | (127.6 | ) | ||||
Sales and marketing | (65.6 | ) | (68.5 | ) | (229.5 | ) | (305.1 | ) | ||||
General and administrative | (23.2 | ) | (27.7 | ) | (106.6 | ) | (128.3 | ) | ||||
Total operating expenses | (107.1 | ) | (121.0 | ) | (437.7 | ) | (561.0 | ) | ||||
EBITDA | (20.6 | ) | (41.7 | ) | (120.3 | ) | (232.0 | ) | ||||
EBITDA Margin | -13 | % | -25 | % | -19 | % | -33 | % | ||||
Depreciation/non-cash charges | (37.0 | ) | (54.5 | ) | (164.1 | ) | (185.5 | ) | ||||
Financial income (loss) | 14.2 |
| 29.7 |
| 63.5 |
| 126.3 |
| ||||
Share in gains (losses) by equity method | (88.6 | ) | (8.7 | ) | (148.9 | ) | (181.7 | ) | ||||
Amortization of goodwill | (61.5 | ) | (63.2 | ) | (252.6 | ) | (383.5 | ) | ||||
Extraordinary and other (2) | (1,047.2 | ) | (43.4 | ) | (1,046.3 | ) | (74.8 | ) | ||||
Income (loss) before taxes | (1,240.8 | ) | (181.9 | ) | (1,668.7 | ) | (931.3 | ) | ||||
Corporate income tax (2) | (435.4 | ) | 88.4 |
| (342.6 | ) | 363.4 |
| ||||
Minority interest | (0.6 | ) | 0.5 |
| 2.4 |
| 1.6 |
| ||||
Net Income (loss) | (1,676.7 | ) | (93.0 | ) | (2,008.9 | ) | (566.3 | ) | ||||
Shares Outstanding (‘ 000) (3) | 559,569 |
| 558,835 |
| 559,569 |
| 558,835 |
| ||||
| (1) | See Operating P&L Description in the Other Information section |
| (2) | See Extraordinary Expense and Tax Reversal in the Other Information section |
| (3) | Excludes shares assigned to the Stock Option Plan |
12
Consolidated Income Statement
(in million of Euros—Spanish GAAP)
Three Months Ended December 31 | Twelve Months Ended Dcember 31 | |||||||||||
2002 | 2001 | 2002 | 2001 | |||||||||
unaudited | audited | |||||||||||
Total revenues | 153.7 |
| 166.0 |
| 621.8 |
| 693.5 |
| ||||
Goods purchased | (66.6 | ) | (78.7 | ) | (293.6 | ) | (352.0 | ) | ||||
Personnel expenses | (28.7 | ) | (47.8 | ) | (165.4 | ) | (205.0 | ) | ||||
Depreciation and amortization | (32.3 | ) | (48.1 | ) | (142.7 | ) | (157.4 | ) | ||||
Other operating expenses | (83.8 | ) | (87.7 | ) | (304.4 | ) | (396.5 | ) | ||||
Operating income (loss) | (57.7 | ) | (96.2 | ) | (284.4 | ) | (417.4 | ) | ||||
Financial income (loss), net | 14.2 |
| 29.7 |
| 63.5 |
| 126.3 |
| ||||
Amortization of goodwill | (61.9 | ) | (63.6 | ) | (254.2 | ) | (386.3 | ) | ||||
Reversal of negative goodwill in consolidation | 0.4 |
| 0.4 |
| 1.6 |
| 2.8 |
| ||||
Equity share of affiliate losses, net | (88.6 | ) | (8.7 | ) | (148.9 | ) | (181.7 | ) | ||||
Income (loss) from ordinary activities | (193.5 | ) | (138.4 | ) | (622.3 | ) | (856.4 | ) | ||||
Extraordinary income (expense) (1) | (1,047.2 | ) | (43.4 | ) | (1,046.3 | ) | (74.8 | ) | ||||
Income (loss) before taxes | (1,240.8 | ) | (181.9 | ) | (1,668.7 | ) | (931.3 | ) | ||||
Corporate income tax credit (1) | (435.4 | ) | 88.4 |
| (342.6 | ) | 363.4 |
| ||||
Minority interest | (0.6 | ) | 0.5 |
| 2.4 |
| 1.6 |
| ||||
Net income (loss) | (1,676.7 | ) | (93.0 | ) | (2,008.9 | ) | (566.3 | ) | ||||
(1) See Extraordinary Expense and Tax Reversal in the Other Information section
13
Consolidated Balance Sheet
as of December 31, 2002
(in million of Euros—Spanish GAAP)
audited
ASSETS | ||
Due from Shareholders for Uncalled Capital | 291.9 | |
Fixed Assets | 637.4 | |
Goodwill in Consolidation | 627.2 | |
Long-term deferred expenses | 10.4 | |
Current Assets | 1,938.1 | |
Cash and Short-term financial investments | 1,761.1 | |
Other current assets | 177.0 | |
TOTAL ASSETS | 3,504.9 | |
LIABILITIES AND SHAREHOLDERS’ EQUITY | ||
Shareholders’ equity | 3,190.9 | |
Minority interests | 0.0 | |
Long-term liabilities | 51.7 | |
Current liabilities | 262.3 | |
TOTAL LIABILITIES AND SHAREHOLDERS’ EQUITY | 3,504.9 |
14
Cash Flow
three months ended December 31, 2002
(in million of Euros—Spanish GAAP)
unaudited
Initial Balance (*) | 1,782 | |
Cash flows from operating activities | -32 | |
Cash flows from investing activities | -13 | |
Cash flows from financing activities | 14 | |
Ending Balance | 1,751 |
(*) Q3’02 ending balance expressed in Euros at Q4’02 closing exchange rates.
15
Revenue Data
Q4 2002 | Q3 2002 | Q4 2001 | 2002 | 2001 | |||||||||||
Revenue by Business (% of total revenue) | |||||||||||||||
Media | 56 | % | 60 | % | 64 | % | 58 | % | 65 | % | |||||
Access and Services | 44 | % | 40 | % | 36 | % | 42 | % | 35 | % | |||||
Revenue by Region and Business (% of total revenue) | |||||||||||||||
United States | 21 | % | 42 | % | 43 | % | 37 | % | 51 | % | |||||
Media | 21 | % | 42 | % | 43 | % | 37 | % | 51 | % | |||||
Access and Services | 0 | % | 0 | % | 0 | % | 0 | % | 0 | % | |||||
Spain & Latam | 79 | % | 58 | % | 57 | % | 63 | % | 49 | % | |||||
Media | 35 | % | 18 | % | 21 | % | 21 | % | 14 | % | |||||
Access and Services | 44 | % | 40 | % | 36 | % | 42 | % | 35 | % |
16
Operating Data
D% | |||||||||||||||
Q4 2002 | Q3 2002 | Q4 2001 | Quarterly | Annual | |||||||||||
Total Subscribers (million) | 5.9 |
| 5.3 |
| 4.7 |
| 11 | % | 25 | % | |||||
Access Subscribers (million) | 4.1 |
| 4.2 |
| 4.3 |
| 0 | % | -5 | % | |||||
Pay | 34 | % | 33 | % | 30 | % | |||||||||
Free | 66 | % | 67 | % | 70 | % | |||||||||
ADSL (thousand) | 378 |
| 342 |
| 233 |
| 11 | % | 62 | % | |||||
Spain | 125 |
| 125 |
| 109 |
| 1 | % | 15 | % | |||||
Latam | 253 |
| 217 |
| 124 |
| 17 | % | 104 | % | |||||
CSP + Portal Subscribers (million) | 1.7 |
| 1.1 |
| 0.4 |
| 52 | % | 379 | % | |||||
Total Pay Subscribers (million) | 3.1 |
| 2.5 |
| 1.7 |
| 24 | % | 88 | % | |||||
Access | 45 | % | 55 | % | 78 | % | |||||||||
Communication Services + Portal | 55 | % | 45 | % | 22 | % | |||||||||
Average daily page views (million) | 368 |
| 390 |
| 500 |
| -6 | % | -26 | % | |||||
Unique users (million) | 120 |
| 118 |
| 111 |
| 2 | % | 8 | % | |||||
17
Historic Data
18

Consolidated Operating P&L(1)
(in million of Euros—Spanish GAAP) (2)
unaudited
2001 | 2002 | ||||||||||||||||||||
Q4 | FY | Q1 | Q2 | Q3 | Q4 | FY | |||||||||||||||
Revenues: | |||||||||||||||||||||
Media | 105.6 |
| 448.1 |
| 90.1 |
| 96.4 |
| 86.8 |
| 86.1 |
| 359.4 |
| |||||||
Access and Services | 60.4 |
| 245.4 |
| 70.5 |
| 65.3 |
| 58.9 |
| 67.6 |
| 262.4 |
| |||||||
Total Revenue | 166.0 |
| 693.5 |
| 160.6 |
| 161.7 |
| 145.8 |
| 153.7 |
| 621.8 |
| |||||||
Cost of Revenues | (86.6 | ) | (364.6 | ) | (88.3 | ) | (80.5 | ) | (68.3 | ) | (67.2 | ) | (304.4 | ) | |||||||
Gross Profit | 79.4 |
| 328.9 |
| 72.3 |
| 81.2 |
| 77.5 |
| 86.4 |
| 317.4 |
| |||||||
Operating espenses: | |||||||||||||||||||||
Research and development | (24.8 | ) | (127.6 | ) | (28.7 | ) | (27.7 | ) | (26.9 | ) | (18.3 | ) | (101.5 | ) | |||||||
Sales and marketing | (68.5 | ) | (305.1 | ) | (54.5 | ) | (55.5 | ) | (54.0 | ) | (65.6 | ) | (229.5 | ) | |||||||
General and administrative | (27.7 | ) | (128.3 | ) | (30.0 | ) | (30.4 | ) | (23.0 | ) | (23.2 | ) | (106.6 | ) | |||||||
Total Operating Expenses | (121.0 | ) | (561.0 | ) | (113.1 | ) | (113.6 | ) | (103.9 | ) | (107.1 | ) | (437.7 | ) | |||||||
EBITDA | (41.7 | ) | (232.0 | ) | (40.8 | ) | (32.3 | ) | (26.5 | ) | (20.6 | ) | (120.3 | ) | |||||||
Depreciation/non-cash charges | (54.5 | ) | (185.5 | ) | (46.4 | ) | (41.8 | ) | (38.9 | ) | (37.0 | ) | (164.1 | ) | |||||||
Financial income (loss) | 29.7 |
| 126.3 |
| 14.4 |
| 19.3 |
| 15.6 |
| 14.2 |
| 63.5 |
| |||||||
Share in gains (losses) by equity method | (8.7 | ) | (181.7 | ) | (21.0 | ) | (18.1 | ) | (21.2 | ) | (88.6 | ) | (148.9 | ) | |||||||
Amortization of goodwill | (63.2 | ) | (383.5 | ) | (65.7 | ) | (63.2 | ) | (62.2 | ) | (61.5 | ) | (252.6 | ) | |||||||
Extraordinary and other | (43.4 | ) | (74.8 | ) | (1.4 | ) | (1.6 | ) | 3.8 |
| (1,047.2 | ) | (1,046.3 | ) | |||||||
Income (loss) before taxes | (181.9 | ) | (931.3 | ) | (160.8 | ) | (137.8 | ) | (129.3 | ) | (1,240.8 | ) | (1,668.7 | ) | |||||||
Corporate income tax | 88.4 |
| 363.4 |
| 30.0 |
| 32.2 |
| 30.4 |
| (435.4 | ) | (342.6 | ) | |||||||
Minority interest | 0.5 |
| 1.6 |
| 0.6 |
| 2.2 |
| 0.2 |
| (0.6 | ) | 2.4 |
| |||||||
Net Income (loss) | (93.0 | ) | (566.3 | ) | (130.2 | ) | (103.3 | ) | (98.7 | ) | (1,676.7 | ) | (2,008.9 | ) | |||||||
Shares Outstanding (000) (3) | 558,835 |
| 558,835 |
| 560,600 |
| 559,313 |
| 559,364 |
| 559,569 |
| 559,569 |
| |||||||
| (1) | See Operating P&L Description in the Other Information section |
| (2) | As of 2001 and 2002 P&L data through EBITDA accounted under Spanish GAAP does not differ from P&L data under US GAAP. |
| (3) | Excludes shares assigned to the Stock Option Plan |
19
Consolidated Income Statement
(in million of Euros—Spanish GAAP)
2001 | 2002 | ||||||||||||||||||||
Q4 | FY | Q1 | Q2 | Q3 | Q4 | FY | |||||||||||||||
unaudited | audited | unaudited | audited | ||||||||||||||||||
Total revenues | 166.0 |
| 693.5 |
| 160.6 |
| 161.7 |
| 145.8 |
| 153.7 |
| 621.8 |
| |||||||
Goods purchased | (78.7 | ) | (352.0 | ) | (83.2 | ) | (74.1 | ) | (69.7 | ) | (66.6 | ) | (293.6 | ) | |||||||
Personnel expenses | (47.8 | ) | (205.0 | ) | (47.8 | ) | (46.2 | ) | (42.8 | ) | (28.7 | ) | (165.4 | ) | |||||||
Depreciation and amortization | (48.1 | ) | (157.4 | ) | (40.4 | ) | (36.2 | ) | (33.8 | ) | (32.3 | ) | (142.7 | ) | |||||||
Other operating expenses | (87.7 | ) | (396.5 | ) | (76.4 | ) | (79.3 | ) | (64.9 | ) | (83.8 | ) | (304.4 | ) | |||||||
Operating income (loss) | (96.2 | ) | (417.4 | ) | (87.2 | ) | (74.2 | ) | (65.4 | ) | (57.7 | ) | (284.4 | ) | |||||||
Financial income (loss), net | 29.7 |
| 126.3 |
| 14.4 |
| 19.3 |
| 15.6 |
| 14.2 |
| 63.5 |
| |||||||
Amortization of goodwill | (63.6 | ) | (386.3 | ) | (66.1 | ) | (63.6 | ) | (62.6 | ) | (61.9 | ) | (254.2 | ) | |||||||
Reversal of negative goodwill in consolidation | 0.4 |
| 2.8 |
| 0.5 |
| 0.4 |
| 0.4 |
| 0.4 |
| 1.6 |
| |||||||
Equity share of affiliate losses, net | (8.7 | ) | (181.7 | ) | (21.0 | ) | (18.1 | ) | (21.2 | ) | (88.6 | ) | (148.9 | ) | |||||||
Income (loss) from ordinary activities | (138.4 | ) | (856.4 | ) | (159.4 | ) | (136.2 | ) | (133.1 | ) | (193.5 | ) | (622.3 | ) | |||||||
Extraordinary income (expense) | (43.4 | ) | (74.8 | ) | (1.4 | ) | (1.6 | ) | 3.8 |
| (1,047.2 | ) | (1,046.3 | ) | |||||||
Income (loss) before taxes | (181.9 | ) | (931.3 | ) | (160.8 | ) | (137.8 | ) | (129.3 | ) | (1,240.8 | ) | (1,668.7 | ) | |||||||
Corporate income tax credit | 88.4 |
| 363.4 |
| 30.0 |
| 32.2 |
| 30.4 |
| (435.4 | ) | (342.6 | ) | |||||||
Minority interest | 0.5 |
| 1.6 |
| 0.6 |
| 2.2 |
| 0.2 |
| (0.6 | ) | 2.4 |
| |||||||
Net income (loss) | (93.0 | ) | (566.3 | ) | (130.2 | ) | (103.3 | ) | (98.7 | ) | (1,676.7 | ) | (2,008.9 | ) | |||||||
20
Consolidated Balance Sheet
(in million of Euros—Spanish GAAP)
2001 | 2002 | |||||||||
Dec 31 | March 31 | June 30 | Sept 30 | Dec 31 | ||||||
ASSETS | audited | unaudited | audited | |||||||
Due from Shareholders for Uncalled Capital | 367.0 | 350.3 | 339.0 | 322.5 | 291.9 | |||||
Fixed Assets | 1,499.9 | 1,423.2 | 1,375.7 | 1,359.9 | 637.4 | |||||
Goodwill in Consolidation | 1,819.2 | 1,760.0 | 1,625.5 | 1,570.9 | 627.2 | |||||
Long-term deferred expenses | 8.8 | 14.9 | 12.3 | 13.7 | 10.4 | |||||
Current Assets | 2,412.5 | 2,234.1 | 2,098.8 | 2,027.1 | 1,938.1 | |||||
Cash and Short-term financial investments | 2,190.1 | 2,021.9 | 1,911.4 | 1,825.1 | 1,761.1 | |||||
Other current assets | 222.3 | 212.3 | 187.3 | 202.0 | 177.0 | |||||
TOTAL ASSETS | 6,107.3 | 5,782.4 | 5,451.3 | 5,294.1 | 3,504.9 | |||||
LIABILITIES AND SHAREHOLDERS’ EQUITY | ||||||||||
Shareholders’ equity | 5,556.8 | 5,311.7 | 5,007.4 | 4,906.4 | 3,190.9 | |||||
Minority interests | 3.5 | 1.6 | -0.1 | 0.0 | 0.0 | |||||
Long-term liabilities | 115.5 | 108.0 | 109.9 | 78.7 | 51.7 | |||||
Current liabilities | 431.5 | 361.1 | 334.1 | 309.0 | 262.3 | |||||
TOTAL LIABILITIES AND SHAREHOLDERS’ EQUITY | 6,107.3 | 5,782.4 | 5,451.3 | 5,294.1 | 3,504.9 | |||||
21
Revenue Data
2001 | 2002 | ||||||||||||||||||||
Q4 | FY | Q1 | Q2 | Q3 | Q4 | FY | |||||||||||||||
Revenue by Business (% of total revenue) | |||||||||||||||||||||
Media | 64 | % | 65 | % | 56 | % | 60 | % | 60 | % | 56 | % | 58 | % | |||||||
Access and Services | 36 | % | 35 | % | 44 | % | 40 | % | 40 | % | 44 | % | 42 | % | |||||||
Revenue by Region and Business (% of total revenue) | |||||||||||||||||||||
United States | 43 | % | 51 | % | 42 | % | 44 | % | 42 | % | 21 | % | 37 | % | |||||||
Media | 43 | % | 51 | % | 42 | % | 44 | % | 42 | % | 21 | % | 37 | % | |||||||
Access and Services | 0 | % | 0 | % | 0 | % | 0 | % | 0 | % | 0 | % | 0 | % | |||||||
Spain & Latam | 57 | % | 49 | % | 58 | % | 56 | % | 58 | % | 79 | % | 63 | % | |||||||
Media | 21 | % | 14 | % | 14 | % | 16 | % | 18 | % | 35 | % | 21 | % | |||||||
Access and Services | 36 | % | 35 | % | 44 | % | 40 | % | 40 | % | 44 | % | 42 | % | |||||||
22
Operating Expenses and Margins
23
Operating Data
2001 | 2002 | ||||||||||||||||||||
Q4 | FY | Q1 | Q2 | Q3 | Q4 | FY | |||||||||||||||
Total Subscribers (million) | 4.7 |
| 4.7 |
| 4.9 |
| 5.0 |
| 5.3 |
| 5.9 |
| 5.9 |
| |||||||
Access Subscribers (million) | 4.3 |
| 4.3 |
| �� | 4.4 |
| 4.1 |
| 4.2 |
| 4.1 |
| 4.1 |
| ||||||
Pay | 30 | % | 30 | % | 30 | % | 33 | % | 33 | % | 34 | % | 34 | % | |||||||
Free | 70 | % | 70 | % | 67 | % | 67 | % | 66 | % | 66 | % | |||||||||
ADSL (thousand) | 233 |
| 233 |
| 272 |
| 301 |
| 342 |
| 378 |
| 378 |
| |||||||
Spain | 109 |
| 109 |
| 122 |
| 123 |
| 125 |
| 125 |
| 125 |
| |||||||
Latam | 124 |
| 124 |
| 150 |
| 178 |
| 217 |
| 253 |
| 253 |
| |||||||
CSP + Portal Subscribers (million) | 0.4 |
| 0.4 |
| 0.5 |
| 0.9 |
| 1.1 |
| 1.7 |
| 1.7 |
| |||||||
Total Pay Subscribers (million) | 1.7 |
| 1.7 |
| 1.8 |
| 2.3 |
| 2.5 |
| 3.1 |
| 3.1 |
| |||||||
Access | 78 | % | 78 | % | 72 | % | 59 | % | 55 | % | 45 | % | 45 | % | |||||||
CSP + Portal | 22 | % | 22 | % | 28 | % | 41 | % | 45 | % | 55 | % | 55 | % | |||||||
Average daily page views (million) | 500 |
| 500 |
| 450 |
| 416 |
| 390 |
| 368 |
| 368 |
| |||||||
Unique users (million) | 111 |
| 111 |
| 115 |
| 116 |
| 118 |
| 120 |
| 120 |
| |||||||
24
Other Information
25

Extraordinary Expense and Tax Reversal
FY 2002 | ||
Goodwill impairment | 856.7 | |
Write-down of start-up costs | 56.6 | |
Fixed assets allowances and write-offs | 61.2 | |
Severance and labor force restructuring costs | 9.1 | |
Other | 62.8 | |
Total Extraordinary Expense | 1,046.3 | |
The Company performs on-going business reviews and, based on quantitative and qualitative measures, assesses the need to record impairment losses on goodwill and other intangibles used in operations when impairment indicators are identified. When impairment indicators are identified, the Company determines the amount of the impairment charge by comparing the carrying value of goodwill and certain other fixed assets to their fair value. The Company determines fair value based on a discounted cash flow methodology, which is calculated as the present value of the expected future cash flows. At 2002 year-end, the Company performed these analyses based on the estimated future value that each of the businesses and countries will generate in order to determine the recovery of the goodwill, tax assets, and of other fixed assets in the consolidated balance sheet of the Terra Lycos Group, in accordance with the accounting principle of prudence in valuation. Additionally, the Company used the assistance of third-party experts in its determination of the fair value of the goodwill related to the acquisition of Lycos, Inc. (which represents approximately 50% of the total).
As a result, it was determined that the carrying value of goodwill and certain other fixed assets was not fully recoverable. Therefore, as of December 31, 2002 the Company recorded impairment charges amounting to 857 million Euro related to goodwill. Also, the Company wrote down 57 million Euro of start-up costs and recorded fixed assets allowances and write off amounting to 61 million Euro.
Also, at 2002 year-end, the Company has performed an analysis of the recoverability of the tax assets focused on the impact on Terra Networks, S.A. of the future earnings expectations of the subsidiaries and, in particular, on the reversal of the investment valuation allowance recorded in the Parent Company’s individual financial statements. As a result of this analysis, the Company reversed tax assets amounting to 385 million Euro (this reversal amounted to 453 million Euro considering the tax assets booked during 2002).
26
Operating P&L Description
Cost of sales represents the direct cost of supporting the Terra Lycos networks including all direct employee costs, product delivery and content, customer service, Ad servicing costs, and hosting and bandwidth and general office overhead.
Research and development includes the direct cost of developing new and supporting existing products and services, primarily direct employee costs, consulting, content, software and general office overhead.
Sales and marketing includes all direct costs of promoting the brand and selling against that brand including direct employee costs, marketing development and promotion, research, public relations, general office overhead.
General and Administrative includes all those costs which act as a support function to the company.
What is excluded from EBITDA includes interest on our commercial paper, taxes on corporate income, depreciation on fixed assets (including lease expense on fixed assets), and amortization on intangible assets (primarily relating to goodwill).
Other below the line items that are not included in EBITDA represent costs that are either not directly related to our core business or are non-recurring in nature including our share of gains and losses on strategic investments, equity losses on affiliates, and other one time charges we believe to be outside the normal course of business and which may change from period to period.
27
Main Fully and Equity Consolidated Companies
MAIN FULLY CONSOLIDATED COMPANIES | ||
ARGENTINA | TERRA NETWORKS ARGENTINA S.A. | |
BRAZIL | TELEFONICA INTERACTIVA BRASIL LTDA. (GRUPO) | |
COLOMBIA | TERRA NETWORKS COLOMBIA HOLDING S.A. (GRUPO) | |
CHILE | TERRA NETWORKS CHILE HOLDING LIMITADO | |
SPAIN | BUMERAN PARTICIPACIONES S.L. (GRUPO) | |
SPAIN | IFIGENIA PLUS, S.A. | |
SPAIN | MAPTEL NETWORKS, S.A. | |
SPAIN | TERRA NETWORKS ESPAÑA, S.A. | |
GUATEMALA | TERRA NETWORKS GUATEMALA S.A. | |
MEXICO | TERRA NETWORKS MEXICO HOLDING S.A. DE C.V. (GRUPO) | |
PERU | TERRA NETWORKS PERU S.A.I | |
DOMINICAN REPUBLIC | TERRA NETWORKS CARIBE, S.A. | |
URUGUAY | TERRA NETWORKS URUGUAY, S.A. | |
USA | LYCOS INC. | |
USA | TERRA NETWORKS USA INC. | |
VENEZUELA | TERRA NETWORKS VENEZUELA S.A. | |
MAIN EQUITY CONSOLIDATED COMPANIES | ||||
HOLLAND | LYCOS EUROPE | 32,1% | ||
SPAIN | TERRA MOBILE, S.A. | 20% | ||
SPAIN | AZELER AUTOMOCIÓN, S.A. | 50% | ||
SPAIN | A TU HORA, S.A. | 50% | ||
SINGAPUR | LYCOS ASIA | 50% | ||
SPAIN | RED UNIVERSAL DE MARKETING Y BOOKINGS ON-LINE, S.A. | 50% | ||
SPAIN | UNO_ E BANK | 49% | ||
USA | ONE TRAVEL.COM, INC. | 39,6% | ||
28
Guidance
Revenue (€ m) | EBITDA Mg | |||
February 26, 2003 | ||||
For the period of: | ||||
FY 2003 | 570–620 | -12%-8% |
29
Press Releases
| • | October 7th2002: Terra Lycos acquires GetRelevant, an online direct marketing services provider. The acquisition adds a powerful suit of products to Terra Lycos’ robust direct marketing services. GetRelevant offers online customer acquisition technology which provides managed co-registration software for content sites and co-registration inventory. |
| • | October 8th2002: Terra.com teams with Fox Sports Español to create the leading sports channel for the Hispanic market. |
| • | October 14th2002: Terra Lycos launches “LiveChats Plus”, a new subscription service from Lycos Finance that includes powerful technical chart analysis tools. |
| • | October 24th2002: Rumbo is launched in Colombia. |
| • | November 11th2002: Terra Lycos launches “Lycos Insite 2.0, an expansion of its highly successful search marketing platform, that provides greater functionality for business to manage the visibility of their web sites in the result of search engines. |
| • | December 16th2002: Terra Lycos launches an entirely new version of HotBot, featuring a revolutionary interface that connects users conveniently to the four primary search engines on the Internet. |
| • | December 18th2002: Terra Lycos announces a strategic agreement with Rakuten and Sumitomo, under which the company sells them its stake in Lycos Japan. At the same time, Terra Lycos reinforces its operating presence in the region though its relationship with these strategic partners. |
After the Period:
| • | January 6th2003: Lycos Matchmaker expands internationally with European sites and multilingual capability. Through an agreement between Terra Lycos and Lycos Europe, Matchmaker built individual localized Matchmaker sites for the UK, France, Germany, Italy and Spain. |
| • | January 22nd 2003: RCN Teams with Lycos to offer RCN High Speed Internet subscribers start pages based on award-winning My Lycos platform. |
| • | February 5th2003: Terra Lycos launches “Tripod Blog Builder”, web site creation tool, added to portfolio of technology tools. |
30
Contact Information
Terra Lycos | ||
Investor Relations | ||
Miguel von Bernard | Investor Relations Director | |
Phone: | 34.91. 452.3922 | |
e-mail: | miguel.vonbernard@corp.terra.com | |
Claudia Sierra | Investor Relations | |
Phone: | 34.91. 452.3927 | |
e-mail: | claudia.sierra@corp.terra.com | |
Concha López | Investor Relations | |
Phone: | 34.91. 452.3926 | |
e-mail: | concha.lopez@corp.terra.com | |
Justine Alonzo | Investor Relations USA | |
Phone | 1.781. 370.28.07 | |
e-mail: | justine.alonzo@corp.terralycos.com | |
Terra Lycos | ||
Shareholders Office | ||
Cristina García | Shareholders Office | |
Phone: | 900.500.525 | |
e-mail: | oficina.accionistas@corp.terra.com | |
31
Safe-Harbour
This document contains statements that constitute forward-looking statements within the meaning of the Private Securities Litigation Reform Act of 1995. These statements appear in a number of places in this document and include statements regarding the intent, belief or current expectations of the customer base, estimates regarding future growth in the different business lines and the global business, market share, financial results and other aspects of the activities and situation relating to the Company.
Such forward looking statements are not guarantees of future performance and involve risks and uncertainties, and actual results may differ materially from those in the forward looking statements as a result of various factors.
Analysts and investors are cautioned not to place undue reliance on those forward looking statements, which speak only as of the date of this presentation. Terra Lycos undertakes no obligation to release publicly the results of any revisions to these forward looking statements which may be made to reflect events and circumstances after the date of this presentation, including, without limitation, changes in Terra Lycos business or acquisition strategy or to reflect the occurrence of unanticipated events. Analysts and investors are encouraged to consult the Company’s Annual Report on Form 20-F as well as periodic filings made on Form 6-K, which are on file with the United States Securities and Exchange Commission.
32

33
SIGNATURES
Pursuant to the requirements of the Securities Exchange Act of 1934, the registrant has duly caused this report to be signed on its behalf by the undersigned, thereunto duly authorized.
Terra Networks, S.A. | ||||||||
Date: | By: | /s/ ELÍAS RODRÍGUEZ-VIÑA CANCIO | ||||||
Name: Elías Rodríguez-Viña Cancio Title: Chief Financial Officer Terra Networks, S.A | ||||||||