SECURITIES AND EXCHANGE COMMISSION
Washington, D.C. 20549
FORM 6-K
Report of Foreign Private Issuer
Pursuant to Rule 13a-16 or 15d-16
of the Securities Exchange Act of 1934
For the month of May 12th, 2004
Commission File Number: 000-28011
Terra Networks, S.A.
(Translation of registrant’s name into English)
Paseo de la Castellana, 92
28.046 Madrid
Spain
(34) 91-452-3900
(Address of principal executive offices)
Indicate by check mark whether the registrant files or will file annual reports under cover of Form 20-F or Form 40-F:
Form 20-F x Form 40-F ¨
Indicate by check mark if the registrant is submitting the Form 6-K in paper as permitted by Regulation S-T Rule 101(b)(1):
Yes ¨ No x
Indicate by check mark if the registrant is submitting the Form 6-K in paper as permitted by Regulation S-T Rule 101(b)(7):
Yes ¨ No x
Indicate by check mark whether by furnishing the information contained in this Form, the registrant is also thereby furnishing the information to the Commission pursuant to Rule 12g3-2(b) under the Securities Exchange Act of 1934:
Yes ¨ No x
If “Yes” is marked, indicate below the file number assigned to the registrant in connection with Rule 12g3-2(b):N/A
Terra Networks, S.A.
TABLE OF CONTENTS
| Item | Sequential Page Number | |||
| 1 | 1Q-04 Earnings Release Financial Report | 30 |
|  |


| 1. | Terra Lycos Group Financial Results Analysis |
| • | Revenue |
| • | Costs and Expenses |
| • | Cash and Capex |
| 2. | Financial Statements |
| • | Consolidated Statement of Operations |
| • | Notes to Consolidated Statement of Operations |
| • | Consolidated Balance Sheet |
| • | Cash Flow and Change in Net Debt Position |
| • | Operating Data |
| 3. | Historic Data |
| • | Consolidated Statements of Operations |
| • | Notes to Consolidated Statements of Operations |
| • | Consolidated Balance Sheet |
| • | Operating Data |
| 4. | Other Information |
| • | Description of main Consolidated Statement of Operations accounts and EBITDA |
| • | Main Fully and Equity Consolidated companies |
| • | Relevant Facts filed with the CNMV/SEC |
| • | Press releases |
| • | Contact information |
2

Terra Lycos Group Results
| Note: | The rounding-off of figures has produced small |
| differences in the partial totals shown and in the |
| percentage changes stated. |
3

Terra Lycos Group Results
Key highlights:
| • | More than 5.3 million paying subscribers: 3.5 million OBP (CSP/Portal) customers and 1.7 million access subscribers. |
| • | Increase of 73% year-over-year in Broadband customers in Spain and Latin America to over 725,000. At March 31, 2004, these represented 42% of the total paid access customer base (vs. 29% in 1Q03). |
| • | Terra Lycos still the largest internet access services company in Latin America, with a total of 1.4 million paid subs, of which more than half a million are broadband clients. |
| • | Year-over-year revenues growth of 17% to 134 million euros in the first quarter of 2004, equivalent to 140 million at constant 1Q03 euros (+22%). |
| • | Solid 32% growth in revenues in Spain compared to the same period of last year, underpinned mainly by growth in paying customers for both access and OBP/CSP services. Revenues generated in Spain represented 41% of the total. |
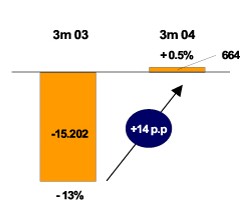
| • | EBITDA was 664 thousand euros, equivalent to 0.5% of total revenues, a 16 million euro improvement on the loss recorded in the same quarter of last year (-15 million euros or -13% of total revenue). |
| • | Net loss of 40 million euros marked a 15 million euro improvement on the 56 million euros loss reported a year earlier. |
| • | Prudent cash management, ending March with a final balance of 1.6 billion euros. Operating cash flow was positive, totalling 19 million euros. |
4
Revenue
In 1Q04, Terra Lycos reported revenues of 134 million euros, an increase of 17% on the same period of last year. In constant 1Q03 euros this was equivalent to revenues of 140 million euros, an increase of 22%. Around 60% of consolidated revenues come from countries with currencies other than the euro.
Revenue growth in the first three months of 2004, excluding the 8.8 million euros in revenue from OneTravel, included in the consolidation perimeter in April 2003, would have been 9%.
The Alliance with Telefónica generated revenue of €27 million, €8 million more than in the first quarter 2003.
Revenue by Business Line
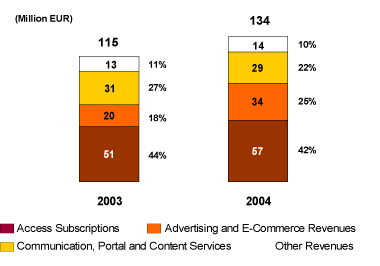
Access revenues reached 57 million euros, equivalent to 42% of total revenues vs. 44% in the first quarter of 2003. The 13% year-over-year growth was achieved on the back of a sustained increase in the number of broadband subscribers, especially in Brazil, Spain and Chile.
5
Paid Access Subs
(Thousand subscribers)

In one year, broadband customers have increased by 307,000 or 73%, to over 725,000. This represents 42% of total paying access service customers (29% in 1Q03). Brazil saw subscriber numbers increase 186,000 or 71%, Spain 62,000 or 50%, and Chile 58,000 or 162%. Narrowband customer numbers are similar to last year’s due mainly to migration towards free and broadband products.
As budgeted, monthly ARPU declined from 10.8 euros in 1Q03 to 10 euros in 1Q04. This decline was largely the result of the new ADSL tariff structure in Brazil arising from the launch of the new portfolio of Speedy products by Telesp, in force since September 2003. The decline in ARPU also reflects penetration of market segments with lower prices both in narrow and broad band.
Advertising and E-Commerce revenues totalled 34 million euros (+69%), 25% of total revenue vs. 18% in 2003.
Excluding the €8.8 million in revenue from OneTravel, growth in Advertising and E-Commerce revenues would have been 25%. This increase was mainly due to a better performance by the local advertising business in Brazil, Spain and the US, boosted by the global recovery of online advertising. In local currency, revenues from Advertising and E-Commerce in these three countries registered double-digit growth: 58%, 45% and 26% respectively.
The US made the largest contribution to Advertising and E-Commerce revenues, generating 69% of the total. Around 7% of total Advertising and E-Commerce revenues was generated as a result of the alliance with Telefónica.
6
Revenues fromCommunication, Portal and Content Services was 29 million euros (-7%), 22% of total revenues vs. 27% in 2002. 51% of these revenues were generated as a result of the alliance with Telefónica.
Revenues fell compared to the first quarter of 2003, due to the €10 million in revenues booked last year from the sale of software in Brazil, within the scope of the alliance with Telefónica. Organic growth (excluding the one-off revenues) was 35%, driven by steady growth in OBP/CSP customers.
OBP (CSP/Portal) Subs
(Thousand subs)
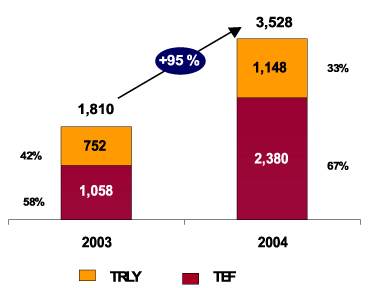
Paying Communication and Content subscribers, including corporate and SME recurring clients increased by 1.7 million or 95%, reaching a total of more than 3.5 million. One third are direct Terra Lycos OBP clients, the rest are reached through Telefonica as a result of the Alliance.
Anti-virus and anti-spam applications, which have been very well received in Brazil and recently in Spain, are the communications services most in demand. The most popular portal product subscription services are Tripod, Angel Fire and Quote.
Corporate Services and Otherwas 14 million euros (+11%), representing 10% of total revenues vs. 11% in the same period of 2003.
51% of revenues in the first quarter this year came from corporate access services, webhosting, webdesign and financial/e-commerce services that Terra Lycos provides directly to companies in Brazil and Mexico.
27% of revenues are generated within the scope of the alliance with Telefónica and correspond to audit, e-learning and consultancy services.
7
Revenue by Country
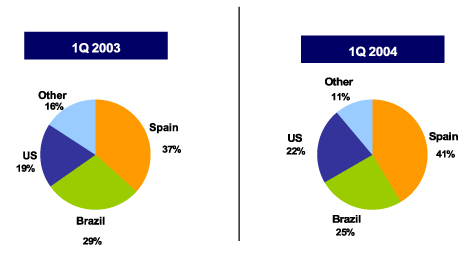
The various countries’ contributions to total revenues were similar lo last year’s, with Spain, Brazil and the US accounting for the bulk.
Spain, with year-over-year growth of 32%, generated 55 million euros of revenues, equivalent to 41% of the total (vs. 37% in the same quarter of 2003). Growth was driven by the increase in the number of subscribers to both access and OBP services and by the recovery of the local advertising industry. The Access; Advertising and E-Commerce; and Communication, Portal and Content Services business lines reported growth of 13%, 45% and 42% respectively.
Some of the significant events involving Terra Lycos’ operations in Spain in the period were: the positive impact of the Christmas advertising campaign, which continued to generated customer adds in the first few months of 2004, and the highly successful launch of the Antivirus and Anti-spam paid product at a price of 3.3 euros a month, which had over 2,000 customers by the end of March.
Brazil generated 122 million reais of revenues (-2%), equivalent to 34 million euros at the average exchange rate prevailing in 1Q04 (+1%). Stripping out the 10 million euro one-off revenues obtained from the sale of software to Telefónica within the scope of the Alliance, growth was 39%. Growth was mostly organic and sustained in all business lines. The Access; Advertising and E-Commerce;
8
Communication, Portal and Content Services; and Corporate, SME and Other Services business lines reported growth of 22%, 587%, 353%, and 14%, respectively.
Terra Brasil, with over 1.1 million subscribers, remains the leading paid access provider in Brazil. The company is undisputed leader of the broadband market, with over 447 thousand customers. Further, renowned brands such as Nike and Dell continue to join Terra Brasil’s customer portfolio and the Brazilian media still acknowledge Terra as the most well-known brand in the south of the country.
Some of the most significant events involving Terra Lycos’ Brazilian operations in the first quarter of 2004 include: (i) the launch in conjunction with Vivo—Brazil’s largest mobile telephony company with nearly 22 million subscribers—of a new pay content service for mobile telephones, which was very well received by the market, and (ii) the launch of a new 128Kps ADSL access product to accelerate penetration of Sao Paulo’s broadband market.
The US generated 37.5 million dollars of revenues (+64%), equivalent to 30 million euros (+41%) at the average exchange rate prevailing in 1Q04. Excluding revenues from the consolidation of OneTravel, US operations saw year-over-year growth in local currency of 16%. Higher revenue in the quarter was mainly due to advertising revenue underpinned by the agreement with 24/7 Real Media for the sale of advertising and the higher revenue generated by the agreement with Google, against a favourable backdrop of a rebound in on-line advertising.
A new strategy was announced in the period whereby Lycos is to abandon the generalist portal model and become a compact network of interconnected vertical portals aimed at making communications between people easier. In accordance with this strategy the company was restructured, with activities being centred on Lycos Search, Tripod, Angelfire, Wired News, Matchmaker, Quote and Gamesville, and a new homepage was launched.
Costs and Expenses
The €70 millionGross Margin, calculated as the difference between Total Revenues and Goods Purchased, improved by two percentage points to 52% of total revenues from 50% in the first quarter of 2003. The large savings in communication and content costs achieved during the year have not only easily offset the smaller margins on OneTravel products, but have also led to an improvement in the overall gross margin.
Operating expenses declined in absolute terms and as a percentage of revenues to 70 million euros or 52% of revenues from 77 million euros or 67% of revenues in the first quarter of 2003.

9
The biggest saving was achieved inPersonnel costs, which have fallen by 5 million euros (from 32 million euros in 1Q03 to 27 million euros in 1Q04) due mainly to the restructuring of the workforce in the US. At the end of March, the total headcount was 2,147 employees, 104 less than a year earlier.
Marketing Expenses and Commissionswere 15 million euros, similar to the figure for the first quarter of 2003 and representing 11% of total sales vs. 14% in 1Q03. A more selective investment policy explains the decline. Client sign-ups objectives were achieved.
Professional Services expenses were 5 million euros—similar to last year’s—and represented 4% of total revenue.
Maintenance, Supplies and Leasesamounted to 8 million euros, a 4.5 million euro decrease compared to the previous year, due mainly to the capitalisation of equipment leases by Lycos Inc.
Other Expenses, which includes working capital provisions, taxes (other than income tax), and travel and insurance expenses, among others, totalled 15 million euros, 2.7 million euros more than in 1Q03. Growth is explained by higher insurance premiums.
EBITDA
The larger gross margin and control over operating costs led to an increase in EBITDA (earnings before interest, tax, depreciation and amortisation), which has been positive since the fourth quarter of 2004.
EBITDA
(thousand EUR)
10
EBITDA in the period was 664 thousand euros, a 16 million euro or 14-percentage point improvement on the same period of last year.
Net Result
Below EBITDA lines have shown the following evolution.
Depreciation and amortization amounted to €22 million at the end of 1Q04, €2.4 million more than in the first quarter of 2003, mainly due to the accelerated amortization of some intangible assets of OneTravel.
Amortization of Goodwill amounted to €20 million, similar to the registered in 1Q03.
NetFinancial Income was €12 million reflecting interest received on cash balances and the mark-to-market of financial investments.
Equity share in Affiliates’ lossesamounted to 4.6 million euros, down from the 11 million euros loss in 2003. The large decrease in this item is mainly due to the improvement in Lycos Europe and Lycos Asia’s results.
Extraordinary expensesshow a 19.6 million euros loss compared to income of 2.5 million euros in the first quarter of 2003, due mainly to the extraordinary costs associated with the restructuring of the US operations, which included severance payments and the cancellation of operating contracts and leases.
The 10.6 million euros inCorporate Tax corresponds to the tax credit recorded as a result of Grupo Terra’s inclusion in the special consolidated tax regime of the Grupo Telefónica since January 1, 2004. The adoption of Grupo Telefónica’s consolidated tax regime has enabled the use of tax credits which had been inactive since 2002.
Minority interest was €2 million and corresponds 100% to OneTravel.
Net Income reflects a loss of 40 million euros, a 15.3 million euro or 27% improvement on the same period last year.
11
Cash and Capex
The cash balance at the end of March 2004 was 1.606 billion euros, 10.5 million euros more than in December 2003, representing approximately 2.86 euros per share.
This increase on the previous quarter was due to cash generation of 3.3 million euros and the 7.2 million euro positive impact of the dollar’s appreciation. At 31 March 2003, the cash position denominated in dollars amounted to $262 million.
Operating Cash-flowwas positive by 19 million euros, mirroring the improvement in EBITDA. In 1Q04 the company received an 8 million euro tax rebate.
Cash flow from investing activitieswas negative by 23 million euros. It includes a €9 million payment associated to the use of backbone infrastructure (intangible asset).
Cash flow from financing activities was positive by 8 million euros and corresponds to the interest received on cash balances.
12
Financial Statements
| Note: | The rounding-off of figures has produced small |
| differences in the partial totals shown and in the |
| percentage changes stated. |
13

Consolidated Statement of Operations
(in thousand of Euros—Spanish GAAP)
unaudited
Three Months Mar-31 | ||||||
| 2004 | 2003 (1) | |||||
Revenues: | ||||||
Access | 56.959 | 50.566 | ||||
Advertising and e-commerce | 34.214 | 20.285 | ||||
Communication, portal and content services | 29.135 | 31.452 | ||||
Corporate & SMEs Services and Other | 13.928 | 12.523 | ||||
Total revenues | 134.236 | 114.827 | ||||
Goods purchased | (63.881 | ) | (57.857 | ) | ||
Gross profit | 70.355 | 56.970 | ||||
Personnel expenses | (27.187 | ) | (31.831 | ) | ||
Professional services | (5.048 | ) | (5.118 | ) | ||
Depreciation and amortization | (21.848 | ) | (19.461 | ) | ||
Marketing and Commissions | (15.204 | ) | (15.592 | ) | ||
Maintenance, supplies and leases | (7.726 | ) | (12.176 | ) | ||
Other expenses | (14.526 | ) | (11.814 | ) | ||
Total other operating expenses | (91.539 | ) | (95.992 | ) | ||
Operating loss | (21.184 | ) | (39.022 | ) | ||
Financial income (expense) | 11.988 | 12.270 | ||||
Amortization of goodwill | (19.675 | ) | (20.129 | ) | ||
Equity share in affiliate losses, net | (4.609 | ) | (11.187 | ) | ||
Extraordinary income (expense) and other | (19.607 | ) | 2.518 | |||
Income (loss) before taxes | (53.087 | ) | (55.550 | ) | ||
Corporate income tax | 10.573 | (164 | ) | |||
Minority interest | 2.121 | 26 | ||||
Net Loss (Spanish GAAP) | (40.393 | ) | (55.688 | ) | ||
Shares excluding Stock Options Plan (‘000) | 561.012 | 559.848 | ||||
| (1) | Revenue by business line and some operating expenses show slight variations from previously reported figures due to reclassifications |
14
Notes to Consolidated Statement of Operations
(in thousands—Spanish GAAP)
unaudited
Revenues by Country (1)
| Mar-31 | Mar-31 | ||||||||||||
| 2004 | 2003 | 2004 | 2003 | ||||||||||
| Current Euros | Local Currency | D% | |||||||||||
Spain | 55,427 | 42,051 | 55,427 | 42,051 | 32 | % | |||||||
Brazil | 33,651 | 33,270 | 121,798 | 124,408 | -2 | % | |||||||
US | 30,041 | 21,317 | 37,533 | 22,870 | 64 | % | |||||||
Other | 15,116 | 18,189 | 17,026 | (2) | 18,189 | (3) | -6 | % | |||||
Total revenues | 134,236 | 114,827 | |||||||||||
| (1) | Not by legal entity |
| (2) | In Euros at 3m’03 average exchange rates |
| (3) | In Euros |
EBITDA Reconciliation—Current Euros
Three Months Mar-31 | |||||||||
2004 constant €(1) | 2003 | D% | |||||||
Revenue by business: | |||||||||
Access | 56.957 | 50.566 | 13 | % | |||||
Advertising and e-commerce | 38.298 | 20.285 | 89 | % | |||||
Communication, portal and content | 30.216 | 31.452 | -4 | % | |||||
Corporate & SMEs Services and Other | 14.536 | 12.523 | 16 | % | |||||
Total revenues | 140.008 | 114.827 | 22 | % | |||||
Revenue by country: | |||||||||
Spain | 55.427 | 42.051 | 32 | % | |||||
Brazil | 32.573 | 33.270 | -2 | % | |||||
US | 34.983 | 21.317 | 64 | % | |||||
Other | 17.026 | 18.189 | -6 | % | |||||
Total revenues | 140.008 | 114.827 | 22 | % | |||||
EBITDA (2) | (568 | ) | (15.202 | ) | 96 | % | |||
EBITDA Margin | 0 | % | -13 | % | 13 p.p. | ||||
| (1) | 3m’03 average exchange rates |
| (2) | See EBITDA description in the Other Information section |
15
Figures at Constant Euros
| Three Months Mar-31 | |||||||||
2004 constant €(1) | 2003
| D%
| |||||||
Revenue by business: | |||||||||
Access | 56,957 | 50,566 | 13 | % | |||||
Advertising and e-commerce | 38,298 | 20,285 | 89 | % | |||||
Communication, portal and content | 30,216 | 31,452 | -4 | % | |||||
Corporate & SMEs Services and Other | 14,536 | 12,523 | 16 | % | |||||
Total revenues | 140,008 | 114,827 | 22 | % | |||||
Revenue by country: | |||||||||
Spain | 55,427 | 42,051 | 32 | % | |||||
Brazil | 32,573 | 33,270 | -2 | % | |||||
US | 34,983 | 21,317 | 64 | % | |||||
Other | 17,026 | 18,189 | -6 | % | |||||
Total revenues | 140,008 | 114,827 | 22 | % | |||||
EBITDA (2) | (183 | ) | (15,202 | ) | 99 | % | |||
EBITDA Margin | 0 | % | -13 | % | 13 p.p. | ||||
| (1) | 3m’03 average exchange rates |
| (2) | See EBITDA description in the Other Information section |
16
Consolidated Balance Sheet
(in million of Euros—Spanish GAAP)
unaudited
| Mar-31 | ||||
| 2004 | 2003 | |||
ASSETS | ||||
Due from Shareholders for Uncalled Capital | 0 | 254 | ||
Fixed and Other Noncurrent Assets: | ||||
Intangible assets | 75 | 72 | ||
Property and equipment | 34 | 46 | ||
Long-term investments | 561 | 559 | ||
Treasury Stock | 125 | 2 | ||
Other fixed and noncurrent assets | 1 | 1 | ||
Total fixed an other noncurrent assets | 796 | 679 | ||
Goodwill in consolidation | 403 | 606 | ||
Long-Term deferred expenses | 6 | 7 | ||
Current Assets: | ||||
Cash and Short-term investments | 1,608 | 1,744 | ||
Other current assets | 139 | 147 | ||
Total current Assets | 1,747 | 1,891 | ||
TOTAL ASSETS | 2,952 | 3,437 | ||
SHAREHOLDERS’ EQUITY AND LIABILITIES | ||||
Shareholders’ equity | 2,685 | 3,112 | ||
Minority interests | 1 | 0 | ||
Long-term liabilities | 69 | 60 | ||
Current liabilities | 197 | 266 | ||
TOTAL SHAREHOLDERS’ EQUITY AND LIABILITIES | 2,952 | 3,437 | ||
17
Cash Flow Statement
(in million of Euros—Spanish GAAP)
unaudited
| Mar-31 2004 | |||
Initial Balance (1) | 1.595,2 | ||
Cash flows from operating activities | 18,6 | ||
Cash flows from investing activities | (23 | ) | |
Cash flows from financing activities | 7,5 | ||
Conversion rates changes | 7,2 | ||
Ending Balance (2) | 1.605,7 |
| (1) | ´03 initial balance expressed in Euros at Dec ‘03 closing exchange rates. |
| There | is a €2 million difference with the 12m03 reported final balance due to a change in the consolidation perimeter |
| (2) | ´03 ending balance expressed in Euros at Mar ‘04 closing exchange rates |
Change in Net Debt Position
(in million of Euros—Spanish GAAP)
unaudited
| Mar-31 2004 | ||||
| I | Cash flow from operations | 18.6 | ||
| II | Other payment related to operating activities | 0.0 | ||
| III | Net interest payment | 8.3 | ||
| IV | Payment for income tax | 0.0 | ||
| A=I+II+III+IV | Net cash provided by operating activities | 26.9 | ||
| V | Net payment for investment in fixed and intangible assets | -22.0 | ||
| VI | Net payment for financial investment | -0.7 | ||
| B=V+VI | Net cash used in investing activities | -22.7 | ||
| C | Dividends paid | 0.0 | ||
| D=A+B+C | Free cash flow after dividends | 4.1 | ||
| E | Capital increases | -0.8 | ||
| F | Effects of conversion rate changes on net debt | 7.2 | ||
| G | Net debt at beginning of period | -1,600.2 | ||
| Cash and cash equivalent | -1,595.2 | |||
| Other short term financial investment | -5.0 | |||
| H=G-D-E-F | Net debt at end of period | -1,607.7 | ||
| Cash and cash equivalent | -1,605.7 | |||
| Other short term financial investment | -2.1 | |||
18
Operating Data
(in thousands)
| Mar-31 | |||||||
| 2004 | 2003 | D% | |||||
Total Paid Subscribers (1) | 5,273 | 3,260 | 62 | % | |||
Access: | |||||||
Narrowband | 1,020 | 1,031 | -1 | % | |||
Broadband | 726 | 419 | 73 | % | |||
Total | 1,746 | 1,450 | 20 | % | |||
OBP (CSP/ Portal): | 3,528 | 1,810 | 95 | % | |||
Broadband Access Subscribers: | |||||||
Spain | 184 | 122 | 50 | % | |||
Latam | 542 | 297 | 83 | % | |||
Total | 726 | 419 | 73 | % | |||
| (1) | Based on number of services delivered. Some subscribers may be contracting access and OBP product/ services at the same time. |
19
Historic Data
| Note: | The rounding-off of figures has produced small |
| differences in the partial totals shown and in the |
| percentage changes stated. |
| . |
20

Consolidated Statement of Operations
(in thousand of Euros—Spanish GAAP)
unaudited
| 2003 | 2004 | ||||||||||||||
| 3m | 6m | 9m | 12m | 3m | |||||||||||
Revenues: | |||||||||||||||
Access | 50.566 | 104.409 | 161.392 | 221.034 | 56.959 | ||||||||||
Advertising and e-commerce | 20.285 | 59.933 | 99.558 | 143.021 | 34.214 | ||||||||||
Communication, portal and content services | 31.452 | 62.333 | 88.766 | 119.023 | 29.135 | ||||||||||
Corporate & SMEs Services and Other | 12.523 | 27.061 | 41.523 | 63.550 | 13.928 | ||||||||||
Total revenues | 114.827 | 253.736 | 391.239 | 546.627 | 134.236 | ||||||||||
Goods purchased | (57.857 | ) | (129.529 | ) | (199.561 | ) | (265.836 | ) | (63.881 | ) | |||||
Gross profit | 56.970 | 124.207 | 191.678 | 280.791 | 70.355 | ||||||||||
Personnel expenses | (31.831 | ) | (62.712 | ) | (93.126 | ) | (119.653 | ) | (27.187 | ) | |||||
Professional services | (5.118 | ) | (11.430 | ) | (16.374 | ) | (23.191 | ) | (5.048 | ) | |||||
Depreciation and amortization | (19.461 | ) | (37.492 | ) | (57.158 | ) | (78.742 | ) | (21.848 | ) | |||||
Marketing and Commissions | (15.592 | ) | (35.398 | ) | (54.395 | ) | (79.104 | ) | (15.204 | ) | |||||
Maintenance, supplies and leases | (12.176 | ) | (23.905 | ) | (33.333 | ) | (41.306 | ) | (7.726 | ) | |||||
Other expenses | (11.814 | ) | (27.385 | ) | (41.553 | ) | (57.021 | ) | (14.526 | ) | |||||
Total other operating expenses | (95.992 | ) | (198.322 | ) | (295.939 | ) | (399.017 | ) | (91.539 | ) | |||||
Operating loss | (39.022 | ) | (74.115 | ) | (104.261 | ) | (118.226 | ) | (21.184 | ) | |||||
Financial income (expense) | 12.270 | 21.416 | 27.059 | 57.743 | 11.988 | ||||||||||
Amortization of goodwill | (20.129 | ) | (42.173 | ) | (62.385 | ) | (82.297 | ) | (19.675 | ) | |||||
Equity share in affiliate losses, net | (11.187 | ) | (8.608 | ) | (15.014 | ) | (34.734 | ) | (4.609 | ) | |||||
Extraordinary income (expense) and other | 2.518 | 5.773 | 17.401 | 4.534 | (19.607 | ) | |||||||||
Income (loss) before taxes | (55.550 | ) | (97.707 | ) | (137.200 | ) | (172.980 | ) | (53.087 | ) | |||||
Corporate income tax | (164 | ) | (168 | ) | (226 | ) | (266 | ) | 10.573 | ||||||
Minority interest | 26 | 24 | 447 | 536 | 2.121 | ||||||||||
Net Loss (Spanish GAAP) | (55.688 | ) | (97.851 | ) | (136.979 | ) | (172.710 | ) | (40.393 | ) | |||||
Shares excluding Stock Options Plan (‘000) | 559.848 | 560.835 | 560.973 | 560.997 | 561.012 | ||||||||||
| (1) | Revenue by business line and some operating expenses show slight variations from previously reported figures due to reclassifications |
21
Notes to Consolidated Statement of Operations
(in thousand of Euros—Spanish GAAP)
unaudited
| 2003 | 2004 | ||||||||||||||
| 3m | 6m | 9m | 12m | 3m | |||||||||||
Revenues by Country: (1) | |||||||||||||||
Spain | 42.051 | 89.638 | 139.949 | 203.257 | 55.427 | ||||||||||
Brazil | 33.270 | 71.934 | 105.990 | 142.599 | 33.651 | ||||||||||
US | 21.317 | 57.263 | 93.812 | 126.026 | 30.041 | ||||||||||
Other | 18.189 | 34.902 | 51.488 | 74.746 | 15.116 | ||||||||||
Total revenues | 114.827 | 253.736 | 391.239 | 546.627 | 134.236 | ||||||||||
EBITDA reconciliation: | |||||||||||||||
Operating loss | (39.022 | ) | (74.115 | ) | (104.261 | ) | (118.226 | ) | (21.184 | ) | |||||
Depreciation and amortization | 19.461 | 37.492 | 57.158 | 78.742 | 21.848 | ||||||||||
Lease expense on fixed assets (2) | 4.359 | 8.404 | 9.875 | 10.133 | 0 | ||||||||||
EBITDA(3) | (15.202 | ) | (28.219 | ) | (37.228 | ) | (29.352 | ) | 664 | ||||||
EBITDA Margin | -13 | % | -11 | % | -10 | % | -5 | % | 0,5 | % | |||||
| (1) | Not by legal entity |
| (2) | In all prior periods reported and for EBITDA guidance calculation purposes, expenses related to equipment leases recorded in Lycos are deemed to be depreciation costs. |
| (3) | See EBITDA description in the Other Information section |
22
Consolidated Balance Sheet
(in million of Euros—Spanish GAAP)
| 2003 | 2004 | |||||||||
| Mar-31 | Jun-30 | Sep-30 | Dec-31 | Mar-31 | ||||||
ASSETS | ||||||||||
Due from Shareholders for Uncalled Capital | 254 | 229 | 224 | 0 | 0 | |||||
Fixed and Other Noncurrent Assets: | ||||||||||
Intangible assets | 72 | 69 | 78 | 80 | 75 | |||||
Property and equipment | 46 | 43 | 39 | 39 | 34 | |||||
Long-term investments | 559 | 615 | 619 | 546 | 561 | |||||
Treasury Stock | 2 | 2 | 0 | 126 | 125 | |||||
Other fixed and noncurrent assets | 1 | 1 | 1 | 1 | 1 | |||||
Total fixed an other noncurrent assets | 679 | 730 | 737 | 792 | 796 | |||||
Goodwill in consolidation | 606 | 471 | 451 | 422 | 403 | |||||
Long-Term deferred expenses | 7 | 7 | 7 | 6 | 6 | |||||
Curent Assets: | ||||||||||
Cash and Short-term investments | 1.744 | 1.650 | 1.622 | 1.599 | 1.608 | |||||
Other current assets | 147 | 169 | 176 | 168 | 139 | |||||
Total current Assets | 1.891 | 1.819 | 1.798 | 1.767 | 1.747 | |||||
TOTAL ASSETS | 3.437 | 3.256 | 3.217 | 2.987 | 2.952 | |||||
SHAREHOLDERS’ EQUITY AND LIABILITIES | ||||||||||
Shareholders’ equity | 3.112 | 2.987 | 2.939 | 2.721 | 2.685 | |||||
Minority interests | 0 | 4 | 3 | 3 | 1 | |||||
Long-term liabilities | 60 | 62 | 73 | 60 | 69 | |||||
Current liabilities | 266 | 203 | 202 | 203 | 197 | |||||
TOTAL SHAREHOLDERS’ EQUITY AND LIABILITIES | 3.437 | 3.256 | 3.217 | 2.987 | 2.952 | |||||
23
Operating Data
(in thousands)
| 2003 | 2004 | |||||||||
| 3m | 6m | 9m | 12m | 3m | ||||||
Total Paid Subscribers (1) | 3.260 | 3.610 | 4.602 | 5.033 | 5.273 | |||||
Access: | ||||||||||
Narrowband | 1.031 | 1.045 | 1.035 | 1.028 | 1.020 | |||||
Broadband | 419 | 477 | 543 | 644 | 726 | |||||
Total | 1.450 | 1.522 | 1.578 | 1.672 | 1.746 | |||||
OBP (CSP/ Portal): | 1.810 | 2.088 | 3.024 | 3.361 | 3.528 | |||||
Broadband Access Subscribers: | ||||||||||
Spain | 122 | 135 | 143 | 166 | 184 | |||||
Latam | 297 | 342 | 400 | 478 | 542 | |||||
Total | 419 | 477 | 543 | 644 | 726 | |||||
| (1) | Based on number of services delivered. Some subscribers may be contracting access and OBP product/ services at the same time |
24
Other Information
25

Description of main Consolidated Statement of Operations accounts and EBITDA
Revenues
Access: subscriptions, traffic-inducement fees and call center revenues from residential clients.
Advertising and e-commerce: advertising, slotting fees and transaction commissions.
Communication, Portal and Content Services: value-added service fees related to communication, portal and content services and software package licenses paid to us by the final user or the companies through which we distribute them to the final user.
Corporate & SMEs Services and Other: primarily services to corporations and SMEs both access and media related. It excludes fees paid to us by the companies that distribute our value-added services, which are included under the Communication, Portal and Content Services line.
Goods Purchased
Include telecommunication expenses, technical help desk expenses, purchase of customer connection kits and modems, cost of e-commerce products sold, ad-serving costs, purchase of content, operating outsourcing and any other purchase.
Personnel Expenses
Include salaries, associated expenses and other employee benefits, regardless of the job classification of the employee.
Professional Services
Include consulting, legal advisors’ and auditors’ fees, among others.
Depreciation and Amortization Expenses
Include depreciation charges relating to tangible assets and amortization charges relating to intangible assets (not including goodwill), intangible rights and start-up costs.
Marketing and Commissions
Include expenses related to advertising and marketing.
Maintenance, Supplies and Leases
Include rental expenses, equipment leases, repairs and maintenance expenses, as well as expenses related to internal communications and other office expenses.
Other Expenses
These expenses include bad debt, tax (other than income tax), travel and insurance expenses and other operating expenses.
EBITDA
EBITDA is defined as operating income (loss) before depreciation on fixed assets, lease expense on fixed assets and amortization on intangible assets.
Other below the line items that are not included in EBITDA represent costs that are either not directly related to our core business or are non-recurring in nature including our share of gains and losses on equity method investments, goodwill amortization and other one time charges we believe to be outside the normal course of business and which may change from period to period, as well as income taxes.
26
Main Fully and Equity Consolidated Companies
| MAIN FULLY CONSOLIDATED COMPANIES | ||
| ARGENTINA | TERRA NETWORKS ARGENTINA, S.A. | |
| BRAZIL | TELEFONICA INTERACTIVA BRASIL, LTDA. (GROUP) | |
| CHILE | TERRA NETWORKS CHILE HOLDING LIMITADA, S.A. (GROUP) | |
| COLOMBIA | TERRA NETWORKS COLOMBIA HOLDING, S.A. (GROUP) | |
| DOMINICAN REPUBLIC | TERRA NETWORKS CARIBE, S.A. | |
| GUATEMALA | TERRA NETWORKS GUATEMALA, S.A. (GROUP) | |
| MEXICO | TERRA NETWORKS MEXICO HOLDING, S.A. DE C.V. (GROUP) | |
| PERU | TERRA NETWORKS PERU, S.A. | |
| SPAIN | EDUCATERRA, S.L. | |
| SPAIN | IFIGENIA PLUS, S.L. | |
| SPAIN | MAPTEL NETWORKS, S.A.U. | |
| SPAIN | TERRA NETWORKS ESPAÑA, S.A.U. | |
| USA | LYCOS, INC. (GRUPO) | |
| USA | ONE TRAVEL.COM, INC. | |
| VENEZUELA | TERRA NETWORKS VENEZUELA S.A. | |
| MAIN EQUITY CONSOLIDATED COMPANIES | ||||
| HOLLAND | LYCOS EUROPE | 32,1% | ||
| SINGAPUR | LYCOS ASIA | 100% | ||
| SPAIN | AZELER AUTOMOCIÓN, S.A. | 50% | ||
| SPAIN | ATREA | 50% | ||
| SPAIN | RED UNIVERSAL DE MARKETING Y BOOKINGS ON-LINE, S.A. | 50% | ||
27
Relevant Facts filed with the CNMV/SEC
| ¨ | April 29th. 2004:Terra Networks, S.A. is currently involved in a reviewing and analyzing process on some of its operating units. As part of this global process, different alternatives are being analyzed for Lycos US. No definitive decision has been adopted so far. |
| ¨ | March 30th. 2004: To complete the restructuring process at Terra Lycos group, the Company believes it needs, amongst other things, to reduce personnel costs. Accordingly, it has submitted an application to make redundancies. For the time being, it does not know the precise scope of this action or the number of employees that will be affected. |
| ¨ | March 24th. 2004: As part of the technical reorganization of its central operating units, Terra Networks, S.A. has created two new areas called, respectively, the Content and Innovation Unit, and the Technology and Development Unit. Luis Velo has been appointed to head the former and Alfonso Vicente the latter. |
| ¨ | March 10th. 2004: Terra Lycos files the Corporate Governance Annual Report related to year 2003 once it has been approved by the Board of Directors of Terra Networks, S.A. with the favourable report from the Audit and Control Committee. The mentioned Report of Corporate Governance may be consult throughout Terra Networks, S.A. web page. (http://www.terralycos.com). |
| ¨ | February 25th. 2004: The Board of Directors of Terra Lycos accepted the resignation submitted by Mr. Luis Ramón Arrieta Durana, as Member of the Board of Directors as well as Member of the Audit and Control Committee and Appointment and Remuneration Committee, after thanking Mr. Arrieta for his work and dedication during the term of his functions. At the end of the same meeting it was also accepted the resignation submitted by Mr. Joaquim Agut Bonsfills, as Member of the Board of Directors, after thanking Mr. Agut for his work and dedication during the term of his functions, for both, Executive Chairman and Member of the Board of Directors. |
| ¨ | January 27th. 2004:The Board of Directors of Terra Lycos accepted the resignation submitted by Mr. Edward M. Philip, as Member of the Board of Directors, after thanking Mr. Philip for his work and dedication during the term of his functions. |
28
Press Releases of the Quarter
| ¨ | February 11th. 2004:Terra Lycos and 24/7 Real Media, Inc. a pioneer in interactive marketing and technology, announced the signing of a multi-year strategic agreement for 24/7 Real Media media sales, ad serving and analytics technology services for Lycos’ U.S. Web properties. |
| ¨ | February 11th. 2004: Terra Lycos announced the creation of the first Internet network specifically constructed to enable people to create and recreate relationships with the people who most enrich their lives. With the change, to be rolled out in a series of steps over the coming months, the new Lycos is poised to be a leader in the emerging personal connectivity category, the Internet arena that connects people around areas of passion including family, friends, career and more. |
| ¨ | February 3th. 2004: Terra Lycos and Network Associates Inc, the leading provider of online security solutions, have reached an agreement to offer portal users easy access to their anti-virus products and “Personal Firewall Plus” (the best online protection against hackers and intruders). |
29
Contact Information
Terra Lycos | ||
Investor Relations | ||
Miguel von Bernard | Investor Relations Director | |
Phone: | 34.91.452.3922 | |
e-mail: | miguel.vonbernard@corp.terra.com | |
Claudia Sierra | Investor Relations | |
Phone: | 34.91.452.3927 | |
e-mail: | claudia.sierra@corp.terra.com | |
Concha López | Investor Relations | |
Phone: | 34.91.452.3926 | |
e-mail: | concha.lopez@corp.terra.com | |
Justine Alonzo | Investor Relations USA | |
Phone | 1.781.370.28.07 | |
e-mail: | justine.alonzo@corp.terralycos.com | |
Terra Lycos | ||
Shareholders Office | ||
Cristina García | Shareholders Office | |
Phone: | 900.500.525 | |
e-mail: | oficina.accionistas@corp.terra.com | |
30
|
|
SIGNATURES
Pursuant to the requirements of the Securities Exchange Act of 1934, the registrant has duly caused this report to be signed on its behalf by the undersigned, thereunto duly authorized.
| Terra Networks, S.A. | ||||||||
| Date: | May 12th, 2004 | By: | /s/ Elías J. Rodríguez-Viña | |||||
| Name: | Elías J. Rodríguez-Viña | |||||||
| Title: | Chief Financial Officer Terra Networks, S.A. | |||||||