UNITED STATES
SECURITIES AND EXCHANGE COMMISSION
Washington, D.C. 20549
FORM N-CSR
CERTIFIED SHAREHOLDER REPORT OF REGISTERED MANAGEMENT
INVESTMENT COMPANIES
Investment Company Act File Number 811-09679
Adelante Funds
(Exact name of registrant as specified in charter)
555 12th Street, Suite 2100
Oakland, CA 94607
(Address of principal executive offices)
Adelante Capital Management LLC
555 12th Street, Suite 2100
Oakland, CA 94607
(Name and address of agent for service)
Registrant's telephone number, including area code: (510) 986-2100
Date of fiscal year end: January 31
Date of reporting period: January 31, 2009
Item 1. Reports to Stockholders
The following is a copy of the report transmitted to shareholders pursuant to Rule 30e-1 under the Investment Company Act of 1940, as amended (the “1940 Act”):
Adelante Funds:
Adelante U.S. Real Estate Securities Fund
Annual Report
January 31, 2009

Shares of Adelante Funds are distributed by an independent third party, UMB Distribution Services, LLC.
January 31, 2009
Dear Shareholder:
We are presenting you with Adelante Funds’ annual report for the fiscal year ended January 31, 2009. This marks our ninth anniversary in the mutual fund arena and we would like to take this opportunity to thank you for your investment in and continued support of Adelante Funds.
Although we entered 2008 with a certain level of caution due to a slowing economy, tightening lending standards and increasingly higher debt costs, the magnitude of the sector’s decline over the last quarter of 2008 (subsequent to the failure of Lehman Brothers) was greater than even our most pessimistic expectations - the commercial real estate market and sector proved not to be immune from the strains in the financial sector and the collapse of the securitized credit market. However, despite the breadth of negative sentiment amongst investors, increased volatility and focus on dividend policies, we still remain confident in the ownership of commercial real estate through publicly traded REITs; the underlying property portfolios - buildings - remain the same and the publicly traded REITs are likely to be among the strongest landlords standing as the economy bottoms.
Although the Adelante U.S. Real Estate Securities Fund (the “Fund”) experienced its second consecutive year of negative absolute performance, the aggregate returns of the Fund have been favorable for long term investors. For the fiscal year ended January 31, 2009, the average annual returns since inception (February 16, 2000) for Class Y shares, the Dow Jones Wilshire REIT Index and the S&P 500® Index were 6.93%, 6.55% and (4.07)%, respectively. Over a trailing three year period, the average annual returns for Class Y shares, the Dow Jones Wilshire REIT Index and the S&P 500® Index were (18.21)%, (19.70)% and (11.78)%, respectively. For a more detailed discussion of the Fund’s performance, please see the Management& #146;s Discussion of Fund Performance section of this report. Average annual returns for Class Y shares of the Fund, as of December 31, 2008, were (37.23)%, 1.23% and 9.35% for the 1-year, 5-year and since inception periods, respectively. The Fund’s gross expense ratio for Class Y shares is 2.01% and for Class K shares is 2.81% as reported in the Fund’s prospectus dated May 31, 2008. Performance quoted represents past performance and past performance is no guarantee of future results. Investment return and principal value will fluctuate so that an investor’s shares, when redeemed, may be worth more or less than their original cost. Performance for Class K and Class Y shares will differ due to differences in class expenses. Current performance may be higher or lower than the performance quoted. To obtain perf ormance information current to the most recent month-end, please call 1-877-563-5327.
Given the significant amount of uncertainty which currently exists in the capital markets, we expect that the real estate securities’ volatility will remain elevated. While we believe that the volatility may present us with opportunities, it also can magnify the potential risks of investing in these securities, and consequently in the Fund. The principal risks of investing in the Fund are risks generally associated with investing in stocks and risks specific to investing in the real estate industry. Real estate investing involves special risks, including interest rate fluctuation, credit risk, liquidity risk and the impact of varied economic conditions on real estate values and occupancy rates. Some real estate securities, including REITs, have limited diversification and are, therefore, subject to risks inherent in operating and financing a limited number of projects, including greater market fluctuations.
As we diligently monitor our universe of companies, their markets and portfolio activities, our experienced management team will continue to employ the same disciplined and research-driven approach to our investment management process. It has been our pleasure to serve you and we appreciate your loyalty to Adelante Funds. As always, if you have any questions or issues or you would like to make an additional purchase, you can call and talk to a shareholder services representative at 1-877-563-5327.
Sincerely,
Michael A. Torres
Chairman and President
UMB Distribution Services, LLC, Distributor
Not authorized for use unless preceded or accompanied by a current Adelante Funds prospectus.
2
A message from your portfolio manager:
Although we entered 2008 with a note of caution, the magnitude of the commercial real estate sector’s decline over the last year has been far beyond even our most pessimistic expectations. During the fiscal year ended January 31, 2009, Class Y shares of Adelante U. S. Real Estate Securities Fund (the “Fund”) declined 47.75% while Class K shares declined 47.89% versus a decline of 49.95% for the Dow Jones Wilshire REIT Indexi. These results underperformed relative to the S&P 500® Indexii, which declined 38.63% over the same period. For the year ended December 31, 2008, Class Y shares declined 37.23% versus a decline of 39.20% for the Dow Jones Wilshire REIT Inde x. Since inception (February 16, 2000) the cumulative total returns for Class Y shares, the Dow Jones Wilshire REIT Index and the S&P 500® Index for the period ended January 31, 2009, were 82.25%, 76.64% and (31.12)%, respectively, and for the period ended December 31, 2008 were 121.18%, 115.62% and (24.78)%, respectively.
For the reporting period, REITs, as evidenced by the Dow Jones Wilshire REIT Index, underperformed relative to broader equity benchmarks as shown above. The decline was broad based across all companies as only two of out the original 86 constituents of the Dow Jones Wilshire REIT Index produced positive returns in 2008. Both were the result of mergers announced early in the year prior to the sector’s more pronounced decline in the fourth quarter that ensued following the Lehman Brothers’ bankruptcy filing in mid September. With 2008 going down as the worst single year for REITs, the most obvious questions facing investors center around how fully and accurately the market has priced in the future uncertainty regarding REIT earnings, as well as uncertainty regarding the availability and cost of capital for the real estate sector. Investor angst regarding these issues is clearly weighing down the sector and it will likely take the continued passage of time until there is greater clarity.
The Fund’s return for the fiscal year was primarily driven by security selection and sector weighting. The Fund’s storage, health care, apartment and preferred stock holdings all contributed to the Fund’s relative outperformance. Three of the best performing holdings were Corporate Office Properties, Public Storage and Nationwide Health Properties. Corporate Office Properties, a specialty office owner focused on tenant demand driven by the U.S. Government, Defense Information Technology and Data Sectors, was down 14.0% for the year. Public Storage, the largest owner and operator of self storage facilities in the U.S., was down 9.90% in the Fund for the year. Public Storage benefited not only from being a strong operator within its property sector, but also from having what is undoubtedly the strongest balance sheet in the REIT sector. Nationwide Health Properties, which acquires senior housing facilities, long-term care facilities and medical o ffice buildings and then leases the assets under long-term net leases to operators, provided the Fund a 12.81% gain for the year. Nationwide Health Properties’ predictable cash flows and focus on an aging population where demand is a bit more resilient in recessionary times proved to be of value to investors.
With respect to sector performance in the Fund, the health care, storage and apartment sectors each performed significantly better on a relative basis to the Dow Jones Wilshire REIT Index with total returns of 8.46%, (9.90)% and (39.33)%, respectively for the year. Although the sector had a smaller weighting in the overall portfolio, manufactured housing stocks also contributed on a relative basis with a total return of 9.65% for the year. The Fund’s weakest performing sector was the industrial sector which turned in a total return of (75.04)% for the year. The performance of the apartment sector was driven by the performance of Equity Residential and Essex Property Trust, both of which benefited from the weakness in the for-sale housing market creating more renters and the availability of attractive financing from Fannie Mae and Freddie Mac. The weak performance of the Fund’s industrial holdings was driven by a combination of issues. With consumer demand hitting a wall, trade flows declined considerably, thereby affecting tenant demand at a time when there was a considerable amount of space available in the markets. Additionally, future prospects for the sector’s two biggest companies, AMB Property Corporation and ProLogis, were diminished by the recent demise of the fund management model.
Over the course of the year, the Fund elected to invest in certain non-core sectors of the commercial real estate market, which it had previously avoided. That decision proved to be a benefit for the Fund’s performance. The Fund made the decision to invest in select health care, manufactured housing and storage companies primarily as a result of three factors – (i) attractively priced entry points; (ii) strong balance sheets; and (iii) the defensive characteristics of their portfolios. The Fund continued to avoid the hotel and factory outlet sectors. The Fund benefited from not being invested in the hotel sector which returned (67.19)% for the year.
3
Looking forward into 2009, we expect REIT share price volatility to remain elevated. With consumer confidence down, unemployment spiking, and a new administration in the White House, investor time horizons have shortened, despite, the longer term nature of real estate investing. Two trends from 2008 are likely to persist for at least the first part of 2009. First, investors are likely to continue to favor companies with lower leverage and uncomplicated balance sheets since we continue to be in the thick of a substantial trough in the credit cycle. Secondly, 2009 will likely see a continued evolution in the dividend policy of public REITs. With dividend yields having crept up to historically high levels following the sector’s October declines, more than one third of the public REITs have announced that they will reduce their 2009 dividends in an effort to preserve corporate liquidity. As a result of a special ruling by the IRS which provides REITs with ad ded flexibility in 2009 to enhance their liquidity, a trend that has started to emerge is the notion of paying a portion of the dividend in stock. While we are generally in opposition to stock dividends because they seize the reinvestment decision from investors’ hands, this may admittedly be an interesting avenue to help some companies navigate short-term cash constraints in the current environment of capital scarcity. Longer term, we remain convinced that REITs are a compelling vehicle for patient long-term capital to invest in high quality real estate in diversified portfolios across a variety of property sectors. Although real estate fundamentals will continue to weaken in a declining economic environment, REITs with the best positioned portfolios, seasoned management teams and strong balance sheets should be able to navigate the difficult operating environment and ultimately benefit from the opportunities that are created from these turbulent times. When placed into a historical context, cap rates and dividend yields on public REITs have both become attractive again and we believe that over a protracted period of time current levels could be interesting entry points for increasing exposure to real estate securities. Finally, we would also like to remind investors to consider the risks inherent in investing in REITs such as risks associated with the real estate industry, liquidity, interest rates and small market capitalization, all of which could be magnified in today’s volatile market.
As always, we vigilantly analyze and monitor each REIT’s premium/discount to its underlying net asset value and strive to manage the Fund to produce an attractive risk adjusted return for its investors. By doing so, we hope to provide investors the opportunity to add the diversification benefits that real estate can bring to a multi-asset class portfolio.
Michael A. Torres
Chief Executive Officer, Adelante Capital Management LLC
| * | Portfolio composition will change due to ongoing management of the Fund. References to specific securities or sectors should not be construed as a recommendation by the Fund, its adviser or distributor. |
| i | The Dow Jones Wilshire REIT Index is an unmanaged market capitalization weighted index of U.S. publicly traded real estate investment trusts (REITS) representing a variety of property types. |
| ii | The S&P 500® Index is an unmanaged index of 500 selected common stocks, most of which are listed on the New York Stock Exchange. The S&P 500® Index is heavily weighted toward stocks with large market capitalization and represents approximately two-thirds of the total market value of all domestic common stocks. |
Adelante U.S. Real Estate Securities Fund is distributed by UMB Distribution Services, LLC.
4
Adelante U.S. Real Estate Securities Fund
Expense Example (Unaudited)
For the Six Months Ended January 31, 2009
As a shareholder of the Adelante U.S. Real Estate Securities Fund (the “Fund”), you incur ongoing costs, including management fees and other Fund expenses. If you invest through a financial intermediary, you may also incur additional costs such as a transaction fee charged on the purchase or sale of the Fund or an asset-based management fee. This Example is intended to help you understand your ongoing costs (in dollars) of investing in the Fund and to compare these costs with the ongoing costs of investing in other mutual funds.
The Example is based on an investment of $1,000 invested at the beginning of the period and held for the entire period from August 1, 2008 to January 31, 2009.
Actual Expenses
The first line of the table below provides information about actual account values and actual expenses. You may use the information in this line, together with the amount you invested, to estimate the expenses you paid over the period. Simply divide your account value by $1,000 (for example, an $8,600 account value divided by $1,000 = 8.6), then multiply the result by the number in the first line under the heading entitled “Expenses Paid During Period” to estimate the expenses you paid on your account during the period.
Hypothetical Example for Comparison Purposes
The second line of the table below provides information about hypothetical account values and hypothetical expenses based on the Fund’s actual expense ratios and an assumed rate of return of 5% per year before expenses, which is not the Fund’s actual return. The hypothetical account values and expenses may not be used to estimate the actual ending account balance or expenses you paid for the period. You may use this information to compare the ongoing costs of investing in the Fund and other funds. To do so, compare this 5% hypothetical example with the 5% hypothetical examples that appear in the shareholder reports of the other funds.
Please note that the expenses shown in the table are meant to highlight your ongoing costs only and do not reflect any costs that may be associated with investing in the Fund through a financial intermediary. Therefore, the second line of the table is useful in comparing the ongoing costs only, and will not help you determine the relative total costs of owning different funds. In addition, if any costs associated with investing through a financial intermediary were included, your costs would have been higher.
| | | | | | | | | | | | | | | | | | | |
| | | | Class K | | Class Y | |
| | | Beginning
account
value
8/1/08 | | Ending
account
value
1/31/09 | | Expenses
paid during
period
8/1/08 -
1/31/091 | | Beginning
account
value
8/1/08 | | Ending
account
value
1/31/09 | | Expenses
paid during
period
8/1/08 -
1/31/091 | |
| | | | | | | | |
| | | | | | | | |
| | | | | | | | |
| | | | | | | | |
| Actual | | $ | 1,000.00 | | $ | 521.50 | | $ | 4.21 | | $ | 1,000.00 | | $ | 522.30 | | $ | 3.45 | |
| Hypothetical (5% return before expenses) | | $ | 1,000.00 | | $ | 1,019.46 | | $ | 5.59 | | $ | 1,000.00 | | $ | 1,020.47 | | $ | 4.57 | |
| 1 | Expenses are equal to the Funds’ annualized expense ratios (1.10% for Class K and 0.90% for Class Y), multiplied by the average account value over the period, multiplied by 184/366 (to reflect the one-half year period). |
5
Adelante U.S. Real Estate Securities Fund
Growth of a $10,000 Investment (Unaudited)

| | | | | | |
Adelante U.S. Real Estate Securities Fund
Average Annual Total Returns
Periods Ended January 31, 2009 (Unaudited) |
| | One Year | | Five Year | | Since Inception (2/16/00) | |
| Adelante U.S. Real Estate Securities Fund - Class K | (47.89 | )% | (3.58 | )% | 6.59 | % |
| Adelante U.S. Real Estate Securities Fund - Class Y | (47.75 | )% | (3.32 | )% | 6.93 | % |
| S&P 500® Index | (38.63 | )% | (4.24 | )% | (4.07 | )% |
| Dow Jones Wilshire REIT Index | (49.95 | )% | (4.04 | )% | 6.55 | % |
The line graphs shown above for the Fund assumes an initial investment of $10,000 made after the close of business on 2/15/00 (the Fund’s inception date). Returns shown include the reinvestment of all dividends and distributions.Past performance, particularly for periods of less than one year, is not predictive of future results. Investment return and principal value will fluctuate, so that your shares, when redeemed, may be worth more or less than the original cost. As of January 31, 2008, the effective date of the most recent prospectus, the gross expense ratio for class K and Y was 2.81% and 2.01%, respectively.
The S&P 500® Index is an unmanaged index of 500 selected common stocks, most of which are listed on the New York Stock Exchange. The Index is heavily weighted toward stocks with large market capitalizations and represents approximately two-thirds of the total market value of all domestic common stocks.
The Dow Jones Wilshire REIT Index is an unmanaged index of approximately 80 selected securities which measures U.S. publicly traded Real Estate Investment Trusts.
Average annual total returns do not reflect the deduction of taxes that a shareholder would pay on Fund distributions or the redemption of Fund shares.
6
| | | | | | | |
| Adelante U.S. Real Estate Securities Fund | |
| |
| Schedule of Investments | | | | |
| January 31, 2009 | | | | |
| |
| Number | | | | | | |
| of Shares | | | | | | Value |
| |
| | | | Common Stocks | | 93.6% | | |
| |
| | | | Apartments | | 19.5% | | |
| | 42,697 | | AvalonBay Communities, Inc. | | | $ | 2,212,117 |
| | 62,710 | | BRE Properties, Inc. | | | | 1,592,207 |
| 158,270 | | Equity Residential | | | | 3,787,401 |
| | 33,860 | | Essex Property Trust, Inc. | | | | 2,236,453 |
| | 20,100 | | Post Properties, Inc. | | | | 263,109 |
| | 60,482 | | UDR, Inc. | | | | 709,454 |
| | | | | | | | 10,800,741 |
| | | Diversified/Specialty | | 9.3% | | |
| | 2,255 | | Alexander's, Inc. | | | | 433,952 |
| | 78,730 | | Vornado Realty Trust | | | | 4,000,272 |
| | 30,300 | | Washington Real Estate Investment Trust | | | | 721,443 |
| | | | | | | | 5,155,667 |
| | | | Healthcare | | 9.4% | | |
| | 87,775 | | HCP, Inc. | | | | 2,048,669 |
| | 27,000 | | Healthcare Realty Trust, Inc. | | | | 445,770 |
| 107,500 | | Nationwide Health Properties, Inc. | | | | 2,744,475 |
| | | | | | | | 5,238,914 |
| | | | Industrial | | 5.2% | | |
| | 76,070 | | AMB Property Corporation | | | | 1,226,248 |
| | 73,100 | | DCT Industrial Trust, Inc. | | | | 266,815 |
| | 21,000 | | EastGroup Properties, Inc. | | | | 637,980 |
| | 78,180 | | ProLogis | | | | 782,582 |
| | | | | | | | 2,913,625 |
| | | | Industrial Mixed | | 4.3% | | |
| | 48,390 | | Kilroy Realty Corporation | | | | 1,106,195 |
| | 50,390 | | Liberty Property Trust | | | | 1,007,800 |
| | 5,800 | | PS Business Parks, Inc. | | | | 248,820 |
| | | | | | | | 2,362,815 |
| | | | Manufactured Homes | | 1.5% | | |
| | 21,700 | | Equity Lifestyle Properties, Inc. | | | | 818,741 |
| |
| |
| |
| |
| See notes to financial statements. | | | | |
7 |
| | | | | | | | |
| | | | | | | |
| Adelante U.S. Real Estate Securities Fund |
| |
| Schedule of Investments (continued) | | | | |
| January 31, 2009 | | | | |
| |
| Number | | | | | | |
| of Shares | | | | | | Value |
| | | Office | | 15.6% | | |
| | 21,210 | | Alexandria Real Estate Equities, Inc. | | | $ | 1,258,601 |
| | 95,700 | | BioMed Realty Trust, Inc. | | | | 1,056,528 |
| | 67,300 | | Boston Properties, Inc. | | | | 2,914,090 |
| | 53,300 | | Brandywine Realty Trust | | | | 318,201 |
| | 52,250 | | Brookfield Properties Corporation | | | | 281,627 |
| | 45,265 | | Corporate Office Properties Trust | | | | 1,194,091 |
| | 46,500 | | Douglas Emmett, Inc. | | | | 432,450 |
| | 29,700 | | Highwoods Properties, Inc. | | | | 670,032 |
| | 33,590 | | SL Green Realty Corporation | | | | 527,699 |
| | | | | | | | 8,653,319 |
| | | | Retail - Local | | 10.0% | | |
| | 25,900 | | Equity One, Inc. | | | | 369,075 |
| | 45,890 | | Federal Realty Investment Trust | | | | 2,323,411 |
| | 45,500 | | Regency Centers Corporation | | | | 1,606,150 |
| | 37,500 | | Saul Centers, Inc. | | | | 1,226,250 |
| | | | | | | | 5,524,886 |
| | | | Retail - Regional | | 14.3% | | |
| | 29,200 | | CBL & Associates Properties, Inc. | | | | 118,844 |
| 107,390 | | Simon Property Group, Inc. | | | | 4,615,622 |
| 109,150 | | Taubman Centers, Inc. | | | | 2,166,628 |
| | 69,650 | | The Macerich Company | | | | 1,026,641 |
| | | | | | | | 7,927,735 |
| | | | Storage | | 4.5% | | |
| | 40,000 | | Public Storage | | | | 2,474,800 |
| |
| | | | Total Common Stocks (cost $51,182,434) | | | | 51,871,243 |
See notes to financial statements.
8
| | | | | | | |
| Schedule of Investments (continued) | | | | |
| January 31, 2009 | | | | |
| | Number | | | | | | |
| of Shares | | | | | | Value |
| | | | Preferred Stocks | | 3.1% | | |
| | | Diversified/Specialty | | 0.4% | | |
| | 15,800 | | Vornado Realty Trust, Series I | | | $ | 245,690 |
| | | | Industrial Mixed | | 0.2% | | |
| | 8,200 | | Kilroy Realty Corporation, Series E | | | | 127,100 |
| | | Office | | 1.6% | | |
| | 42,000 | | Corporate Office Properties Trust, Series H | | 670,740 |
| | 15,900 | | SL Green Realty Corporation, Series D | | | | 194,775 |
| | | | | | | | 865,515 |
| | | | Retail - Local | | 0.2% | | |
| | 4,700 | | Regency Centers Corporation, Series C | | | | 95,269 |
| | | | Retail - Regional | | 0.7% | | |
| | 22,100 | | Taubman Centers, Inc., Series G | | | | 364,650 |
| | | | Total preferred stocks (cost $1,854,996) | | | | 1,698,224 |
| | | | Short-Term Investment | | 2.9% | | |
| 1,642,042 | | Federated Government | | | | |
| | | | Obligations Fund I | | | | 1,642,042 |
| | | | Total short-term investment (cost $1,642,042) | | 1,642,042 |
| | | | Total investments (cost $54,679,472) | | 99.6% | | 55,211,509 |
| | | | Other assets less liabilities | | 0.4% | | 199,932 |
| | | | NET ASSETS | | 100.0% | $ | 55,411,441 |
| |
| |
| |
| |
| See notes to financial statements. | | | | |
9 |
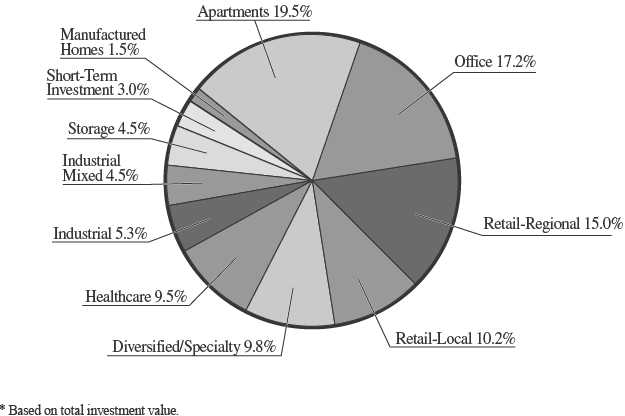
Adelante U.S. Real Estate Securities Fund
Sector Breakdown (Unaudited)*
January 31, 2009
10
| | | |
| Adelante U.S. Real Estate Securities Fund |
| |
| Statement of Assets and Liabilities | | | |
| January 31, 2009 | | | |
| |
| ASSETS: | | | |
| Investments, at value (cost $54,679,472) | $ | 55,211,509 | |
| Interest and dividends receivable | | 68,779 | |
| Receivable for capital stock sold | | 190,871 | |
| Due from advisor | | 12,707 | |
| Prepaid expenses | | 35,696 | |
| |
| Total assets | | 55,519,562 | |
| |
| LIABILITIES: | | | |
| Payable for capital stock redeemed | | 26,198 | |
| Other accrued expenses | | 81,923 | |
| |
| Total liabilities | | 108,121 | |
| |
| NET ASSETS | $ | 55,411,441 | |
| |
| NET ASSETS CONSIST OF: | | | |
| Paid-in-capital | $ | 59,487,489 | |
| Undistributed net investment income | | 317,603 | |
| Accumulated undistributed net realized loss on investments | | (4,925,688 | ) |
| Net unrealized appreciation on investments | | 532,037 | |
| |
| NET ASSETS | $ | 55,411,441 | |
| |
| SHARES OUTSTANDING, $0.0001 par value, | | | |
| (Unlimited shares authorized) | | | |
| Class K | | 8,544,268 | |
| Class Y | | 1,521,261 | |
| |
| NET ASSET VALUE, OFFERING AND | | | |
| REDEMPTION PRICE PER SHARE | | | |
| Class K | | | |
| (based on net assets $47,150,508 and shares outstanding 8,544,268) | $ | 5.52 | |
| Class Y | | | |
| (based on net assets $8,260,933 and shares outstanding 1,521,261) | $ | 5.43 | |
| |
| |
| |
| |
| See notes to financial statements. | | | |
| |
| 11 |
| | | |
| Adelante U.S. Real Estate Securities Fund |
| |
| Statement of Operations | | | |
| Year Ended January 31, 2009 | | | |
| |
| INVESTMENT INCOME: | | | |
| Dividends | $ | 1,416,949 | |
| Interest | | 19,864 | |
| |
| Total investment income | | 1,436,813 | |
| |
| EXPENSES: | | | |
| Investment advisory fees (see note 5) | | 229,678 | |
| Professional fees | | 151,869 | |
| Shareholder servicing fees | | 90,429 | |
| Administration and accounting fees | | 83,278 | |
| Trustees' fees and expenses | | 51,000 | |
| Distribution fees (see note 5) | | 34,981 | |
| Reports to shareholders | | 33,446 | |
| Federal and state registration fees | | 30,572 | |
| Insurance expense | | 29,441 | |
| Custody fees | | 12,607 | |
| Other expenses | | 4,037 | |
| |
| Total expenses before waiver and reimbursement of expenses | | 751,338 | |
| |
| Less: Waiver and reimbursement of expenses | | (464,966 | ) |
| |
| Net expenses | | 286,372 | |
| |
| NET INVESTMENT INCOME | | 1,150,441 | |
| |
| REALIZED AND UNREALIZED LOSS ON INVESTMENTS: | | | |
| |
| Net realized loss on investments | | (5,091,392 | ) |
| Change in unrealized appreciation/(depreciation) on investments | | (2,852,409 | ) |
| Net loss on investments | | (7,943,801 | ) |
| |
| NET DECREASE IN NET ASSETS | | | |
| RESULTING FROM OPERATIONS | $ | (6,793,360 | ) |
See notes to financial statements.
12
| | | | | | | |
| Adelante U.S. Real Estate Securities Fund | | | | | |
| |
| Statements of Changes in Net Assets | | | | | | | |
| |
| | Year Ended
January 31, 2009 | | Year Ended
January 31, 2008 |
| |
| OPERATIONS: | | | | | | | |
| Net investment income | $ | 1,150,441 | | | $ | 739,882 | |
| Net realized gain (loss) on investments | | (5,091,392 | ) | | | 3,259,083 | |
| Change in unrealized appreciation/depreciation on investments | | (2,852,409 | ) | | | (13,571,623 | ) |
| Net decrease in net assets resulting from operations | | (6,793,360 | ) | | | (9,572,658 | ) |
| |
| CAPITAL SHARE TRANSACTIONS: | | | | | | | |
| Proceeds from sale of shares | | | | | | | |
| Class K shares | | 51,987,609 | | | | 3,519,391 | |
| Class Y shares | | 5,078,929 | | | | 8,586,814 | |
| Shares issued to shareholders in reinvestment of distributions | | | | | | | |
| Class K shares | | 910,687 | | | | 1,472,519 | |
| Class Y shares | | 397,145 | | | | 4,311,458 | |
| Payments for shares redeemed | | | | | | | |
| Class K shares | | (11,007,907 | ) | | | (8,511,720 | ) |
| Class Y shares | | (5,583,268 | ) | | | (11,506,178 | ) |
| Net increase (decrease) from capital share transactions | | 41,783,195 | | | | (2,127,716 | ) |
| |
| DISTRIBUTIONS PAID FROM: | | | | | | | |
| Net investment income | | | | | | | |
| Class K shares | | (254,863 | ) | | | (31,029 | ) |
| Class Y shares | | (379,019 | ) | | | (161,165 | ) |
| Net realized gains | | | | | | | |
| Class K shares | | (658,080 | ) | | | (1,466,079 | ) |
| Class Y shares | | (110,011 | ) | | | (4,899,180 | ) |
| Total distributions | | (1,401,973 | ) | | | (6,557,453 | ) |
| |
| TOTAL INCREASE (DECREASE) IN NET ASSETS | | 33,587,862 | | | | (18,257,827 | ) |
| |
| NET ASSETS: | | | | | | | |
| Beginning of year | | 21,823,579 | | | | 40,081,406 | |
| |
| End of year | $ | 55,411,441 | | | $ | 21,823,579 | |
| |
| Undistributed Net Investment Income | $ | 317,603 | | | $ | 192,964 | |
| |
| |
| |
| |
| See notes to financial statements. | | | | | | | |
| |
| 13 |
| | | | | | | |
| Adelante U.S. Real Estate Securities Fund |
| |
| Financial Highlights | Class K | | Class K |
For a Fund Share Outstanding
Throughout the Year. | Year Ended
January 31,2009 | Year Ended
January 31, 2008 |
| |
| Net Asset Value, Beginning of Year | $ | 10.95 | | | $ | 20.08 | |
| |
| Income from Investment Operations: | | | | | | | |
| Net investment income | | 0.16 | | | | 0.39 | |
| Net realized and unrealized gain/(loss) on investments | | (5.30 | ) | | | (5.35 | ) |
| �� Total from investment operations | | (5.14 | ) | | | (4.96 | ) |
| |
| Distributions to Shareholders: | | | | | | | |
| Dividends from net investment income | | (0.21 | ) | | | (0.05 | ) |
| Distributions from capital gains | | (0.08 | ) | | | (4.12 | ) |
| Total distributions | | (0.29 | ) | | | (4.17 | ) |
| |
| Net Asset Value, End of Year | $ | 5.52 | | | $ | 10.95 | |
| |
| Total Return | | (47.89 | )% | | | (24.69 | )% |
| |
| Supplemental Data and Ratios: | | | | | | | |
| Net assets, end of year | $ | 47,150,508 | | | $ | 4,876,578 | |
| Ratio of expenses to average net assets | | 1.10 | % | | | 1.25 | % |
| Ratio of expenses before waivers to | | | | | | | |
| average net assets | | 2.92 | % | | | 2.81 | % |
| Ratio of net investment income to | | | | | | | |
| average net assets | | 4.66 | % | | | 1.99 | % |
| Ratio of net investment income before | | | | | | | |
| waivers to average net assets | | 2.84 | % | | | 0.43 | % |
| Portfolio turnover rate | | 55 | % | | | 39 | % |
(1) Calculated based on average shares outstanding during the year.
See notes to financial statements.
14
| | | | | | | | | | |
| Adelante U.S. Real Estate Securities Fund |
| | Class K | | | | Class K | | | | Class K | |
Year Ended
January 31, 2007 | | Year Ended
January 31, 2006 | | Year Ended
January 31, 2005 |
| |
| $ | 19.07 | | | $ | 17.92 | | | $ | 17.23 | |
| | 0.46 | (1) | | | 0.57 | | | | 0.65 | |
| | 6.29 | (1) | | | 5.05 | | | | 2.09 | |
| | 6.75 | | | | 5.62 | | | | 2.74 | |
| | (0.11 | ) | | | (0.26 | ) | | | (0.52 | ) |
| | (5.63 | ) | | | (4.21 | ) | | | (1.53 | ) |
| | (5.74 | ) | | | (4.47 | ) | | | (2.05 | ) |
| $ | 20.08 | | | $ | 19.07 | | | $ | 17.92 | |
| 38.43 | % | | | 33.14 | % | | | 15.19 | % |
| |
| $ | 12,525,326 | | | $ | 15,947,297 | | | $ | 18,350,017 | |
| | 1.25 | % | | | 1.25 | % | | | 1.25 | % |
| 2.72 | % | | | 2.55 | % | | | 2.10 | % |
| 2.16 | % | | | 3.05 | % | | | 3.38 | % |
| 0.69 | % | | | 1.75 | % | | | 2.54 | % |
| | 45 | % | | | 31 | % | | | 32 | % |
| |
| |
| |
| 15 |
| | | | | | | | | | | |
| | | | | | | |
| Adelante U.S. Real Estate Securities Fund |
| |
| Financial Highlights | Class Y | | Class Y |
For a Fund Share Outstanding
Throughout the Year. | Year Ended
January 31, 2009 | | Year Ended
January 31, 2008 |
| |
| Net Asset Value, Beginning of Year | $ | 10.78 | | | $ | 19.87 | |
| |
| Income from Investment Operations: | | | | | | | |
| Net investment income | | 0.32 | | | | 0.36 | |
| Net realized and unrealized gain/(loss) on investments | | (5.35 | ) | | | (5.22 | ) |
| Total from investment operations | | (5.03 | ) | | | (4.86 | ) |
| |
| Distributions to Shareholders: | | | | | | | |
| Dividends from net investment income | | (0.24 | ) | | | (0.11 | ) |
| Distributions from capital gains | | (0.08 | ) | | | (4.12 | ) |
| Total distributions | | (0.32 | ) | | | (4.23 | ) |
| |
| Net Asset Value, End of Year | $ | 5.43 | | | $ | 10.78 | |
| |
| Total Return | | (47.75 | )% | | | (24.52 | )% |
| |
| Supplemental Data and Ratios: | | | | | | | |
| Net assets, end of year | $ | 8,260,933 | | | $ | 16,947,001 | |
| Ratio of expenses to average net assets | | 0.90 | % | | | 0.97 | % |
| Ratio of expenses before waivers to | | | | | | | |
| average net assets | | 2.33 | % | | | 2.01 | % |
| Ratio of net investment income to | | | | | | | |
| average net assets | | 3.39 | % | | | 2.27 | % |
| Ratio of net investment income before | | | | | | | |
| waivers to average net assets | | 1.96 | % | | | 1.23 | % |
| Portfolio turnover rate | | 55 | % | | | 39 | % |
(1) Calculated based on average shares outstanding during the year.
See notes to financial statements.
16
| | | | | | | | | | |
| Adelante U.S. Real Estate Securities Fund |
| | Class Y | | | | Class Y | | | | Class Y | |
Year Ended
January 31, 2007 | | Year Ended
January 31, 2006 | | Year Ended
January 31, 2005 |
| |
| $ | 18.92 | | | $ | 17.81 | | | $ | 17.12 | |
| |
| | 0.51 | (1) | | | 0.65 | | | | 0.67 | |
| | 6.23 | (1) | | | 4.99 | | | | 2.12 | |
| | 6.74 | | | | 5.64 | | | | 2.79 | |
| |
| | (0.16 | ) | | | (0.32 | ) | | | (0.57 | ) |
| | (5.63 | ) | | | (4.21 | ) | | | (1.53 | ) |
| | (5.79 | ) | | | (4.53 | ) | | | (2.10 | ) |
| $ | 19.87 | | | $ | 18.92 | | | $ | 17.81 | |
| 38.76 | % | | | 33.51 | % | | | 15.62 | % |
| |
| $ | 27,556,080 | | | $ | 21,271,290 | | | $ | 15,580,015 | |
| | 0.97 | % | | | 0.97 | % | | | 0.97 | % |
| 2.07 | % | | | 2.05 | % | | | 1.88 | % |
| 2.50 | % | | | 3.32 | % | | | 3.68 | % |
| 1.40 | % | | | 2.24 | % | | | 2.78 | % |
| | 45 | % | | | 31 | % | | | 32 | % |
| |
| |
| |
| 17 |
| | | | | | | | | | | |
Adelante U.S. Real Estate Securities Fund
Notes to Financial Statements
January 31, 2009
1. Organization
Adelante Funds (the “Trust”) was organized on October 28, 1999 as a Delaware business trust and registered under the Investment Company Act of 1940 (the “1940 Act”), as amended, as an open-end management investment company. The Trust currently consists of one investment portfolio: Adelante U.S. Real Estate Securities Fund (the “Fund”). The Fund is a non-diversified portfolio of the Trust and is authorized to issue three classes of shares: Class A, Class K and Class Y. The Fund’s share classes differ in terms of sales charges, fees and eligibility requirements. The Fund’s Class K and Class Y shares commenced operations on February 16, 2000. As of January 31, 2009, the Fund’s Class K and Class Y shares are outstanding. Adelante Capital Management LLC (the “Adviser”) is the Fund’s investment adviser.
2. Significant Accounting Policies
The following is a summary of significant accounting policies consistently followed by the Fund in the preparation of its financial statements. The financial statements have been prepared in accordance with accounting policies generally accepted in the United States of America that require management to make certain estimates and assumptions at the date of the financial statements. Actual results may differ from such estimates.
Investment Valuation – In connection with the determination of the Fund’s net asset value, securities that are traded on a recognized stock exchange are valued at the last sale price on the securities exchange on which such securities are primarily traded. If a closing price is not reported, equity securities for which reliable bid quotations are available are valued at the mean between bid and asked prices. Short-term securities having a maturity of 60 days or less are valued at amortized cost, which approximates market value. Any securities for which there are no readily available market quotations and other assets will be valued at their fair value as determined in good faith by the Adviser pursuant to procedures established by and under the supervision of the Board of Trustees. The fair value of a security is the amount which a Fund might reasonably expect to receive upon a current sale. Valui ng securities at fair value involves greater reliance on judgment than valuing securities that have readily available market quotations. There can be no assurance that the Funds could obtain the fair value assigned to a security if they were to sell the security at approximately the time at which the Funds determine their net asset value per share.
In September 2006, the Financial Accounting Standards Board issued Statement of Financial Accounting Standards No. 157, “Fair Value Measurements” (“FAS 157”) effective for fiscal years beginning after November 15, 2007. FAS 157 defines fair value, establishes a framework for measuring fair value in generally accepted accounting principles (GAAP), and expands disclosures about fair value measurements. The Fund adopted FAS 157 as of February 1, 2008. Under FAS 157, various inputs are used in determining the value of the Fund’s investments. These inputs are summarized into three broad levels and described below:
18
Adelante U.S. Real Estate Securities Fund
Notes to Financial Statements (continued)
January 31, 2009
Level 1 – quoted prices for active markets for identical securities. An active market for the security is a market in which transactions occur with sufficient frequency and volume to provide pricing information on an ongoing basis.
Level 2 – other significant observable inputs (including quoted prices for similar securities, interest rates, prepayment speeds, credit risk, etc.) Quoted prices for identical or similar assets in markets that are not active. Inputs that are derived principally from or corroborated by observable market data. An adjustment to any observable input that is significant to the fair value may render the measurement a Level 3 measurement.
The inputs or methodology used for valuing securities are not necessarily an indication of the risk associated with investing in those securities. The following is a summary of the inputs used to value the Fund’s net assets as of 1/31/2009:
| | | | | | | |
| | | Level 1 | | Level 2 | | Level 3 |
| Investments Owned | | $ | 55,211,509 | | — | | — |
| Total | | $ | 55,211,509 | | — | | — |
Federal Income Taxes – It is the Fund’s policy to meet the requirements of the Internal Revenue Code applicable to regulated investment companies and the Fund intends to distribute all investment company net taxable income and net capital gains each year to shareholders in a manner which results in no tax cost to the Fund. Therefore, no federal income tax or excise tax provision has been made.
In July 2006, the Financial Accounting Standards Board (“FASB”) issued Interpretation No. 48, “Accounting for Uncertainty in Income Taxes” (“FIN 48”). FIN 48 addresses the accounting for uncertainty in income taxes and establishes for all entities, including pass-through entities, such as the Fund, a minimum threshold for financial statement recognition of the benefit of positions taken in filing tax returns (including whether an entity is taxable in a particular jurisdiction). The Fund recognizes tax benefits only if it is more likely than not that a tax position (including the Fund’s assertion that its income is exempt from tax) will be sustained upon examination. The Fund adopted FIN 48 in fiscal 2008. The Fund had no material uncertain tax positions and has not recorded a liability for unrecognized tax benefits as of January 31, 2008 or 2009. Also, the Fund had recognized no interest and penalties related to uncertain tax benefits for the years ended January 31, 2009 and 2008. At January 31, 2009, the fiscal years 2006 through 2009 remain open to examination in the Fund’s major tax jurisdictions.
19
Adelante U.S. Real Estate Securities Fund
Notes to Financial Statements (continued)
January 31, 2009
Securities Transactions and Investment Income – Securities transactions are accounted for on a trade date basis. Realized gains and losses from securities transactions are recorded on the identified cost basis. Dividend income is recognized on the ex-dividend date and interest income is recognized daily on an accrual basis. Return of capital distributions from investments are accounted for as a decrease in the cost of the investment and thus impact unrealized appreciation or depreciation of the investment security.
In March 2008, Statement of Financial Accounting Standards No. 161, Disclosures about Derivative Instruments and Hedging Activities (“SFAS 161”) was issued and is effective for fiscal years beginning after November 15, 2008. SFAS 161 is intended to improve financial reporting for derivative instruments by requiring enhanced disclosure that enables investors to understand how and why an entity uses derivatives, how derivatives are accounted for, and how derivative instruments affect an entity’s results of operations and financial position. Management does not believe that adoption of SFAS 161 will have an impact on the amount reported in the financial statements.
Distributions to Shareholders – Dividends from net investment income are declared and paid quarterly. Distributions of net realized capital gains, if any, are declared and paid at least annually.
Distributions to shareholders are determined in accordance with federal income tax regulations and are recorded on the ex-dividend date. The character of distributions made during the year from net investment income or net realized gains may differ from the characterization for federal income tax purposes due to differences in the recognition of income, expense and gain items for financial statement and tax purposes. Where appropriate, reclassifications between net asset accounts are made for such differences that are permanent in nature.
Expenses – Each class of shares is charged for those expenses directly attributable to the class. Expenses that are not directly attributable to a class of shares are typically allocated among the classes in proportion to their relative shares outstanding.
Indemnifications – Under the Fund’s organizational documents, their officers and trustees are indemnified against certain liability arising out of the performance of their duties to the Fund. Additionally, in the normal course of business, the Fund enters into contracts with service providers that contain general indemnification clauses. The Fund’s maximum exposure under these arrangements is unknown as this would involve future claims that may be made against the Fund that have not yet occurred. However, the Fund expects the risk of loss to be remote.
20
| | | | | | | | | | |
| Adelante U.S. Real Estate Securities Fund |
Notes to Financial Statements (continued)
January 31, 2009 |
| |
| 3. Capital Transactions | | | | | | | | | | |
| Transactions of the Fund were as follows: | | | | | | | | | | |
| | Year Ended | | Year Ended | |
| | January 31, 2009 | | January 31, 2008 | |
| Class K Shares: | Shares | | | Dollars | | Shares | | | Dollars | |
| Shares sold | 9,786,041 | | $ | 51,987,609 | | 187,716 | | $ | 3,519,391 | |
| Shares issued to holders in reinvestment of dividends and capital gains | 136,899 | | | 910,687 | | 133,584 | | | 1,472,519 | |
| Shares redeemed | (1,824,069 | ) | | (11,007,907 | ) | (499,744 | ) | | (8,511,720 | ) |
| |
| Net increase (decrease) | 8,098,871 | | $ | 41,890,389 | | (178,444 | ) | $ | (3,519,810 | ) |
| |
| | Year Ended | | Year Ended | |
| | January 31, 2009 | | January 31, 2008 | |
| Class Y Shares: | Shares | | | Dollars | | Shares | | | Dollars | |
| Shares sold | 635,524 | | $ | 5,078,929 | | 507,016 | | $ | 8,586,814 | |
| Shares issued to holders in reinvestment of dividends and capital gains | 44,508 | | | 397,145 | | 394,846 | | | 4,311,458 | |
| Shares redeemed | (730,160 | ) | | (5,583,268 | ) | (717,368 | ) | | (11,506,178 | ) |
| |
| Net increase (decrease) | (50,128 | ) | $ | (107,194 | ) | 184,494 | | $ | 1,392,094 | |
| |
| Net increase (decrease) from | | | | | | | | | | |
| capital share transactions | 8,048,743 | | $ | 41,783,195 | | 6,050 | | $ | (2,127,716 | ) |
4. Investment Transactions
Purchases and sales of securities for the Fund, excluding short-term investments, for the year ended January 31, 2009 were $56,307,604 and $16,160,982 respectively. There were no purchases or sales of U.S. Government securities for the year ended January 31, 2009.
21
Adelante U.S. Real Estate Securities Fund
Notes to Financial Statements (continued)
January 31, 2009
5. Investment Advisory Agreement
The Fund has entered into an Investment Advisory Agreement with the Adviser. The Fund pays a fee based on the Fund’s average daily net assets at the annual rate of 0.80% for the services provided by the Adviser. The Adviser has contractually agreed to limit the annual operating expenses of Class K and Class Y shares of the Fund to 1.10% and 0.90%, respectively, through May 31, 2009, subject to later reimbursement by the Fund in certain circumstances. Subsequent to the reporting period, at the March 13, 2009 Board of Trustees Meeting, the Trustees approved the extension of the limitation on the annual operating expenses through May 31, 2010. The Adviser has contractually agreed that in the event that the foregoing Fund expense limitation is not renewed, the Adviser will limit the Fund’s Class K and Y shares total annual fund operating expense to 2.25% through January 31, 2011. During the year ended January 31, 2009, the Adviser waived investment a dvisory fees for the Fund of $229,678. The Adviser is entitled to recoup from the Fund amounts waived or reimbursed for a period of up to three years from the date such amounts were waived or reimbursed, provided the Fund’s expenses, including such recouped amounts, do not exceed the stated expense limitations. During the year ended January 31, 2009, the Adviser did not recoup any expenses. At January 31, 2009, the following amounts are subject to recoupment through January 31, 2012, January 31, 2011, and January 31, 2010, respectively.
| | | | | | | |
| | | Expires | | Expires | | Expires |
| | | January 31, 2012 | | January 31, 2011 | | January 31, 2010 |
| |
| Class K | $ | 254,663 | $ | 142,110 | $ | 166,751 |
| Class Y | $ | 210,303 | $ | 254,360 | $ | 269,706 |
Pursuant to Rule 12b-1 of the 1940 Act, the Trust has adopted a plan of distribution for the Class K shares of the Fund (the “Plan”) which permits the Fund to pay for certain expenses associated with the distribution of its Class K shares and for services provided to its Class K shareholders. Under the Plan, the Fund’s Class K shares may pay expenses pursuant to the distribution plan equal to a maximum of 0.25% of the average daily net assets of such class. During the year ended January 31, 2009, the Fund incurred distribution expenses of $34,981.
6. Investment Risks
As an investor in real estate investment trusts and other public companies in the real estate industry, the Fund is subject to certain risks generally incidental to the development, ownership and management of real property. These risks include the cyclical nature of real estate markets; changes in general economic, business and credit conditions, including interest rate levels and availability of financing; applicable federal, state, and local regulations; changes in availability and cost of insurance; increases in the costs of labor and materials; material shortages; strikes; changes in market rental rates; competition for tenants; the bankruptcy or insolvency of tenants; and potential liability under environmental and other laws.
22
Adelante U.S. Real Estate Securities Fund
Notes to Financial Statements (continued)
January 31, 2009
7. Federal Income Tax Information
At January 31, 2009, gross unrealized appreciation and depreciation of investments, based on cost for federal income tax purposes was as follows:
| | | | |
| Cost of investments | | $ | 58,410,545 | |
| Gross unrealized appreciation | | $ | 4,232,291 | |
| Gross unrealized depreciation | | | (7,236,238 | ) |
| Net unrealized depreciation on investments | | $ | (3,003,947 | ) |
The difference between cost amounts for financial statement and federal income tax purposes is due primarily to timing differences in recognizing certain gains and losses in security transactions.
The tax basis of components of distributable net earnings (deficit) at January 31, 2009 were as follows:
| | | | |
| Undistributed ordinary income | | $ | 317,603 | |
| Accumulated capital and other losses | | | (1,389,704 | ) |
| Unrealized depreciation | | | (3,003,947 | ) |
| Total accumulated earnings (deficit) | | $ | (4,076,048 | ) |
The differences between book-basis and tax-basis unrealized appreciation is attributable primarily to the tax deferral from losses on wash sales.
As of January 31, 2009, the Fund had a capital loss carryover of $355,121, which expires on January 31, 2017. To the extent that the Fund realizes future net capital gains, those gains will be offset by any unused capital loss carryforwards.
At January 31, 2009, the Fund had net realized capital losses from transactions between November 1, 2008 and January 31, 2009 of $1,034,583 which for tax purposes, are deferred and will be recognized in fiscal year 2010.
The tax components of distributions paid during the fiscal years ending January 31, 2009 and January 31, 2008 were as follows:
| | | | | |
| | Year Ended
January 31, 2009 | | Year Ended
January 31, 2008 |
| | |
| Distributions paid from: | | | | | |
| Ordinary income | $ | 633,882 | | $ | 352,383 |
| Net long-term capital gains | | 756,929 | | | 6,109,997 |
| Unrecaptured section 1250 gain | | 11,162 | | | 95,073 |
| Total distributions paid | $ | 1,401,973 | | $ | 6,557,453 |
8. Payments to Affiliates, Officers and Trustees
Certain officers or trustees of the Trust are also officers or trustees of the Adviser. During the year ended January 31, 2009, the Trust made no direct payments to its officers and paid $51,000 to its unaffiliated trustees.
23
Adelante U.S. Real Estate Securities Fund
Tax Designation (Unaudited)
The fund hereby designates $768,091 as long-term capital gain distributions for the purpose of the dividends paid deduction.
Under Section 854 of the Internal Revenue Code of 1986, the Fund designates income dividends of $12,229 as qualified dividend income paid during the fiscal year ended January 31, 2009.
Proxy Voting Policies and Procedures (Unaudited)
For a description of the policies and procedures that the Fund uses to determine how to vote proxies relating to portfolio securities, please call 1-877-563-5327 and request a Statement of Additional Information. One will be mailed to you free of charge. The Statement of Additional Information is also available on the website of the Securities and Exchange Commission at http://www.sec.gov. Information on how the Fund voted proxies relating to portfolio securities during the twelve month period ending June 30, 2009, will be available without charge, upon request, by calling 1-877-563-5327 or by accessing the website of the Securities and Exchange Commission.
Disclosure of Portfolio Holdings (Unaudited)
The Fund will file complete schedules of portfolio holdings with the Securities and Exchange Commission for the first and third quarters of each fiscal year on Form N-Q. The Fund’s Form N-Q will be available on the Web site of the Securities and Exchange Commission at http://www.sec.gov.
24
Report of Independent Registered Public Accounting Firm

25
| | |
| Adelante U.S. Real Estate Securities Fund | |
| Fund Trustee and Officer Information | |
| |
| Independent Trustees | | |
| |
| |
| | | Current position held |
| Name/Age | Address | with the Fund |
| William J. Klipp, 53 | 555 12th Street, Suite 2100 | Trustee |
| | Oakland, CA 94607 | since 2000 |
| |
| |
| Scott MacKillop, 57 | 555 12th Street, Suite 2100 | Trustee |
| | Oakland, CA 94607 | since 2002 |
| |
| |
| |
| |
| Kevin Malone, 61 | 555 12th Street, Suite 2100 | Trustee |
| | Oakland, CA 94607 | since 2000 |
| |
| Interested Trustee and Officer | | |
| * Michael A. Torres, 48 | 555 12th Street, Suite 2100 | Chairman of the Board and President |
| | Oakland, CA 94607 | since 2002, Vice President 2000-2002 |
| |
| |
| |
| Officers | | |
| * Mark A. Hoopes, 44 | 555 12th Street, Suite 2100 | Vice President since 2000, Treasurer |
| | Oakland, CA 94607 | since 2003, Chief Compliance Officer |
| | | since 2004 |
| |
| * Mark J. Nuti, 50 | 555 12th Street, Suite 2100 | Secretary since 2003 |
| Oakland, CA 94607 |
| * | Mr. Torres, Mr. Hoopes and Mr. Nuti are “interested persons” of the Trust within the meaning of the 1940 Act by virtue of their positions with the Trust and with Adelante Capital Management LLC, the Adviser for the Fund. |
Each Trustee serves until the Trust is terminated except if the Trustee dies, resigns, retires or is removed before then. The Trust's President, Treasurer, and Secretary hold office until the next annual meeting of the Trustees and until their respective successors are chosen and qualified or if before then, until he or she dies, resigns, is removed or becomes disqualified. The Vice President holds office at the pleasure of the Trustees. Additional information about the Trustees is available in the Statement of Additional Information and is available, without charge, upon request, by calling 1-877-563-5327.
26
| | Number of | |
| | funds overseen | |
| | within the fund | Other directorships held |
| Principal occupation during the past five years | complex | outside the fund complex |
| |
Private investor (2000-present); President and Chief
Operating Officer, Charles Schwab Investment Management,
Inc., an investment advisory firm (1995-1999); Executive
Vice President, Schwab Funds® and Charles Schwab & Co.,
Inc., a financial services company (1995-1999). | 1 | Director of Assetmark Funds
(12 portfolios) |
| |
| | |
| | |
| | |
| |
President, Frontier Asset Management, LLC, (2007-present);
President, U.S. Fiduciary Services (2004-2006); President and
Principal, Trivium Consulting, LLC, consulting to financial
services organizations (2001-2004); President (1999-2000),
Executive Vice President and Chief Operating Officer (1997-1999),
Portfolio Management Consultants, Inc., consulting to financial
advisors and institutions; President, ADAM Investment Services,
Inc., consulting to financial advisors and institutions (1997-2000). | 1 | None |
| | |
| | |
| | |
| | |
| | |
| | |
| | |
| | |
| President and Founder, Greenrock Research, LLC (1996-present). | 1 | None |
| xxxxxxxxxxxxxxxxxxx | xxxxxxxxxxxxxxxxxxx |
Chief Executive Officer, Adelante Capital Management LLC,
an investment advisory firm (2002-present); President and
Co-President, Lend Lease Rosen Real Estate Securities LLC
(1998-2002); President and Co-President, ERE Rosen Real Estate
Securities, LLC, an investment advisory firm (1997-1998); Director, AMB Rosen Real Estate Securities, LLC, an investment advisory firm (1995-1997). | 1 | None |
| | |
| | |
| | |
| | |
| | |
| | |
| |
Chief Compliance Officer, Adelante Capital Management
LLC, an investment advisory firm (2004-present); Principal
(2002-2004); Vice President (2000-2001), Lend Lease Real
Estate Investments, Inc.; Account Director, Mutual Fund
Services Division, SEI Investments, Inc. (1994-2000). | 1 | None |
| | |
| | |
| | |
| | |
| |
Chief Operating Officer, Adelante Capital Management
LLC, an investment advisory firm (2004-present); Chief
Operating Officer, Lend Lease Rosen Real Estate Securities
LLC, an investment advisory firm (2003-2004); Director,
Senior Vice President and Chief Operating Officer, Jurika &
Voyles, L.P., an investment advisory firm (1999-2003). | 1 | None |
| | |
| | |
| | |
| | |
| | |
27
Adelante U.S. Real Estate Securities Fund
| | |
| | TRUSTEES | William J. Klipp
Scott MacKillop
Kevin Malone
Michael A. Torres |
| |
| | INVESTMENT ADVISER | Adelante Capital Management LLC |
| | | 555 12th Street, Suite 2100 |
| | | Oakland, CA 94607 |
| |
| | ADMINISTRATOR AND
FUND ACCOUNTANT | UMB Fund Services, Inc. |
| | 803 West Michigan Street |
| | Milwaukee, WI 53233 |
| |
| | CUSTODIAN | UMB Bank, n.a. |
| | | 928 Grand Boulevard |
| | | Kansas City, MO 64106 |
| |
| | INDEPENDENT REGISTERED
PUBLIC ACCOUNTING FIRM | Deloitte & Touche LLP |
| | 555 East Wells Street |
| | Milwaukee, WI 53202 |
| |
| | LEGAL COUNSEL | Goodwin Procter LLP |
| | | Exchange Place |
| | | Boston, MA 02109 |
| |
| | DISTRIBUTOR | UMB Distribution Services, LLC |
| | | 803 West Michigan Street |
| | | Milwaukee, WI 53233 |
| |
| | DIVIDEND-DISBURSING
AND TRANSFER AGENT | UMB Fund Services, Inc. |
| | c/o Adelante Funds |
| | 803 West Michigan Street |
| | Milwaukee, WI 53233 |
This report is submitted for the general information of shareholders of Adelante Funds. It is not authorized for distribution to prospective investors unless accompanied or preceded by an effective Prospectus for the Adelante U.S. Real Estate Securities Fund. The Prospectus provides more complete information, including fees and expenses, the investment objectives, risks and operating policies of the Fund. Read the Prospectus carefully.
LE 410 0109
Item 2. Code of Ethics
The Registrant has adopted a code of ethics (the “Code”) that applies to its principal executive officer, principal financial officer and principal accounting officer. A copy of the Code is available free of charge upon request by calling 1-877-563-5327.
Item 3. Audit Committee Financial Expert
Having reviewed and discussed the background and qualification of each member of its audit committee, the Board of Trustees has determined that no member of the audit committee satisfies the definition of audit committee financial expert in Form N-CSR. Based on this evaluation, the Board has nevertheless concluded that its audit committee members’ experience and expertise will enable them to effectively perform their oversight duties with respect to the Trust’s financial statements and the Trust’s independent auditors.
Item 4. Principal Accountant Fees and Services
The aggregate fees for each of the last two fiscal years for professional services rendered by the principal accountant for the audit of the Registrant’s annual financial statements or services that are normally provided by the accountant in connection with statutory and regulatory filings or engagements are listed below.
| | |
| (a) Audit Fees. | | |
| Fiscal year ended January 31, 2009 | $ | 29,925 |
| Fiscal year ended January 31, 2008 | $ | 28,500 |
| |
| (b) Audit-Related Fees. | | |
| None. | | |
| |
| (c) Tax Fees. | | |
| Fiscal year ended January 31, 2009 | $ | 5,900 |
| Fiscal year ended January 31, 2008 | $ | 5,600 |
| |
| (d) All Other Fees. | | |
| None. | | |
(e)
(1) The audit committee of the Registrant's board of directors considered whether the provision of non-audit services that was rendered to the Registrant's investment adviser and was not required to be pre-approved by the audit committee is compatible with maintaining the independence of the Registrant's principal accountant. The audit committee receives quarterly reports on the amount and nature of such services and discusses such services and their effect on the principal accountant's independence with the Registrant's principal accountant in connection with the committee's deliberations regarding the engagement of the principal accountant.
(2) During fiscal year 2008, all of the non-audit services provided by the Registrant’s principal accountant were pre-approved by the audit committee.
(f) Not applicable.
(g) The aggregate non-audit fees billed by the Registrant's accountant for services rendered to the Registrant, and rendered to the Registrant's investment adviser, and any entity controlling, controlled by, or under common control with the adviser that provides ongoing services to the Registrant:
Fiscal year ended January 31, 2009 $ 0
Fiscal year ended January 31, 2008 $ 0
(h) Not applicable.
Item 5. Audit Committee of Listed Registrants
Not applicable.
Item 6. Schedule of Investments
The schedule of investments in securities of unaffiliated issuers is included as part of the reports to shareholders filed under Item 1.
Item 7. Disclosure of Proxy Voting Policies and Procedures for Closed-End Management Investment Companies
Not applicable.
Item 8. Portfolio Managers of Closed-End Management Investment Companies
Not applicable.
Item 9. Purchases of Equity Securities by Closed-End Management Investment Company and Affiliated Purchasers
Not applicable.
Item 10. Submission of Matters to a Vote of Security Holders
Not applicable.
Item 11. Controls and Procedures
| (a) | The Registrant’s principal executive officer and principal financial officer concluded that the Registrant’s disclosure controls and procedures (as defined in Rule 30a-3(c) under the 1940 Act) provide reasonable assurances that information required to be disclosed by the Registrant on Form N–CSR is recorded, processed, summarized and reported within the required time periods and that information required to be disclosed by the Registrant in the reports that it files or submits on Form N–CSR is accumulated and communicated to the Registrant’s management, including its principal executive and principal financial officers, as appropriate to allow timely decisions regarding required disclosure, based on their evaluation of the disclosure controls and procedures as of a date within 90 days of the filing date of this report. |
| (b) | There was no change in the Registrant’s internal control over financial reporting (as defined in Rule 30a–3(d) under the 1940 Act) that occurred during the second fiscal quarter of the period covered by this report that has materially affected, or is reasonably likely to materially affect, the Registrant’s internal control over financial reporting. |
Item 12. Exhibits
| (a) | Code of Ethics. |
| | (1) | The Code of Ethics for the principal executive and principal financial officer is available free of charge upon request by calling 1-877-563-5327. |
| | (2) | Certifications, as required by Rule 30a-2(a) under the Investment Company Act of 1940, for the principal executive officer and principal financial officer are filed herewith. |
SIGNATURES
Pursuant to the requirements of the Securities Exchange Act of 1934 and the Investment Company Act of 1940, the Registrant has duly caused this report to be signed on its behalf by the undersigned, thereunto duly authorized.
Adelante Funds
/s/ Michael A. Torres
Michael A. Torres
Principal Executive Officer
April 6, 2009
Pursuant to the requirements of the Securities Exchange Act of 1934 and the Investment Company Act of 1940, this report has been signed below by the following persons on behalf of the Registrant and in the capacities and on the dates indicated.
/s/ Michael A. Torres
Michael A. Torres
Principal Executive Officer
April 6, 2009
/s/ Mark A. Hoopes
Mark A. Hoopes
Principal Financial Officer
April 6, 2009