UNITED STATES
SECURITIES AND EXCHANGE COMMISSION
Washington, D.C. 20549
FORMN-CSR
CERTIFIED SHAREHOLDER REPORT OF REGISTERED MANAGEMENT
INVESTMENT COMPANIES
Investment Company Act file number:811-09721
PIMCO Managed Accounts Trust
(Exact name of registrant as specified in charter)
1633 Broadway, New York, NY 10019
(Address of principal executive offices)
Trent W. Walker
Treasurer (Principal Financial & Accounting Officer)
PIMCO Funds
650 Newport Center Drive, Newport Beach, CA 92660
(Name and address of agent for service)
Copies to:
David C. Sullivan
Ropes & Gray LLP
Prudential Tower
800 Boylston Street
Boston, MA 02199
Registrant’s telephone number, including area code: (800)927-4648
Date of fiscal year end: December 31
Date of reporting period: December 31, 2018
Form N-CSR is to be used by management investment companies to file reports with the Commission not later than 10 days after the transmission to stockholders of any report that is required to be transmitted to stockholders under Rule 30e-1 under the Investment Company Act of 1940 (17 CFR 270.30e-1). The Commission may use the information provided on Form N-CSR in its regulatory, disclosure review, inspection, and policymaking roles.
A registrant is required to disclose the information specified by Form N-CSR, and the Commission will make this information public. A registrant is not required to respond to the collection of information contained in Form N-CSR unless the Form displays a currently valid Office of Management and Budget (“OMB”) control number. Please direct comments concerning the accuracy of the information collection burden estimate and any suggestions for reducing the burden to Secretary, Securities and Exchange Commission, 450 Fifth Street, NW, Washington, DC 20549-0609. The OMB has reviewed this collection of information under the clearance requirements of 44 U.S.C. § 3507.
| Item 1. | Reports to Shareholders. |
The following is a copy of the report transmitted to shareholders pursuant to Rule 30e-1 under the Investment Company Act of 1940, as amended (the “1940 Act”) (17 CFR 270.30e-1).

PIMCO MANAGED ACCOUNTS TRUST
Annual Report
December 31, 2018
Fixed Income SHares: Series C (“FISH: Series C”)
Fixed Income SHares: Series LD (“FISH: Series LD”)
Fixed Income SHares: Series M (“FISH: Series M”)
Fixed Income SHares: Series R (“FISH: Series R”)
Fixed Income SHares: Series TE (“FISH: Series TE”)
Beginning on January 1, 2021, as permitted by regulations adopted by the Securities and Exchange Commission, you may not receive paper copies of shareholder reports from your financial intermediary, such as a broker-dealer or bank, which offers the Portfolio unless you specifically request paper copies from your financial intermediary. Instead, the shareholder reports will be made available on a website, and your financial intermediary will notify you by mail each time a report is posted and provide you with a website link to access the report. Instructions for requesting paper copies will be provided by your financial intermediary.
If you already elected to receive shareholder reports electronically, you will not be affected by this change and you need not take any action. You may elect to receive shareholder reports and other communications from your financial intermediary electronically by following the instructions provided by your financial intermediary.
You may elect to receive all future reports in paper free of charge from your financial intermediary. You should contact your financial intermediary if you wish to continue receiving paper copies of your shareholder reports. Your election to receive reports in paper will apply to all portfolios held in your account at the financial intermediary.
Table of Contents
Letter from the Chair of the Board & President
Dear Shareholder,
Following this letter is the PIMCO Managed Accounts Trust Annual Report, which covers the12-month reporting period ended December 31, 2018. On the subsequent pages you will find specific details regarding investment results and discussion of the factors that most affected performance during the reporting period.
For the12-month reporting period ended December 31, 2018
The U.S. economy continued to expand during the reporting period. Looking back, U.S. gross domestic product (“GDP”) grew at an annual pace of 2.2% during the first quarter of 2018. During the second quarter of 2018, GDP growth rose to an annual pace of 4.2%, the strongest since the third quarter of 2014. GDP then expanded at an annual pace of 3.4% during the third quarter of the year. Finally, the Commerce Department’s initial reading for fourth-quarter 2018 GDP has been delayed due to the partial government shutdown.
The Federal Reserve (the “Fed”) continued to normalize monetary policy during the reporting period. During its meetings that concluded in March, June, September and December 2018, the Fed raised the federal funds rate in 0.25% increments. The Fed’s December rate hike pushed the federal funds rate to a range between 2.25% and 2.50%. In addition, the Fed continued to reduce its balance sheet during the reporting period.
Economic activity outside the U.S. initially accelerated during the reporting period, but moderated as it progressed. Against this backdrop, the European Central Bank (the “ECB”) and the Bank of Japan largely maintained their highly accommodative monetary policies, while other central banks took a more hawkish stance. The Bank of England raised rates at its meeting in August 2018 and the Bank of Canada raised rates twice during the reporting period. Meanwhile, the ECB ended its quantitative easing program in December 2018, but indicated that it does not expect to raise interest rates “at least through the summer of 2019.”
The U.S. Treasury yield curve flattened during the reporting period as short-term rates moved up more than longer-term rates. In our view, the increase in rates at the short end of the yield curve was mostly due to Fed interest rate increases. The yield on the benchmark10-year U.S. Treasury note was 2.69% at the end of the reporting period, up from 2.40% on December 31, 2017. U.S. Treasuries, as measured by the Bloomberg Barclays U.S. Treasury Index, returned 0.86% over the 12 months ended December 31, 2018. Meanwhile, the Bloomberg Barclays U.S. Aggregate Bond Index, a widely used index of U.S. investment grade bonds, returned 0.01% over the period. Riskier fixed income asset classes, including high yield corporate bonds and emerging market debt, generated weak results versus the broad U.S. market. The ICE BofAML U.S. High Yield Index returned-2.27% over the reporting period, whereas emerging market external debt, as represented by the JPMorgan Emerging Markets Bond Index (EMBI) Global, returned-4.61% over the reporting period. Emerging market local bonds, as represented by the JPMorgan Government Bond Index-Emerging Markets Global Diversified Index (Unhedged), returned-6.21% over the period.
Global equities produced poor results during the reporting period. U.S. equities moved sharply higher over the first nine months of the period. We believe this rally was driven
| | | | | | |
| 2 | | PIMCO MANAGED ACCOUNTS TRUST | | | | |
by a number of factors, including corporate profits that often exceeded expectations. However, U.S. equities fell sharply during the fourth quarter of 2018. We believe this was triggered by a number of factors, including signs of moderating global growth, concerns over future Fed rate hikes, the ongoing trade dispute between the U.S. and China and the partial U.S. government shutdown. All told, U.S. equities, as represented by the S&P 500 Index, returned-4.38% during the reporting period. Elsewhere, emerging market equities, as measured by the MSCI Emerging Markets Index, returned-14.58% during the reporting period, whereas global equities, as represented by the MSCI World Index, returned-8.71%. Elsewhere, Japanese equities, as represented by the Nikkei 225 Index (in JPY), returned-10.39% during the reporting period and European equities, as represented by the MSCI Europe Index (in EUR), returned-10.57%.
Commodity prices fluctuated and generally declined during the reporting period. When the reporting period began, West Texas crude oil was approximately $65 a barrel, but by the end it was roughly $45 a barrel. This was driven in part by increased supply and declining global demand. Elsewhere, gold and copper prices also moved lower during the reporting period.
Finally, during the reporting period the foreign exchange markets experienced periods of volatility, due in part to signs of decoupling economic growth and central bank policies, along with a number of geopolitical events. The U.S. dollar produced mixed results against other major currencies during the reporting period. For example, the U.S. dollar appreciated 4.71% and 5.90% versus the euro and the British pound, respectively, whereas the U.S. dollar depreciated 2.66% versus the yen during the reporting period.
Thank you for the assets you have placed with us. We deeply value your trust, and we will continue to work diligently to meet your broad investment needs. We also invite you to visit our website at pimco.com/FISH to learn more about our global viewpoints.
Sincerely,
| | |
 | |  |
| |
 | |  |
| Deborah A. DeCotis | | Peter G. Strelow |
| Chair of the Board of Trustees | | President |
Past performance is no guarantee of future results. Unless otherwise noted, index returns reflect the reinvestment of income distributions and capital gains, if any, but do not reflect fees, brokerage commissions or other expenses of investing. It is not possible to invest directly in an unmanaged index.
| | | | | | |
| | ANNUAL REPORT | | DECEMBER 31, 2018 | | 3 |
Important Information About the Portfolios
We believe that bond funds have an important role to play in a well-diversified investment portfolio. It is important to note, however, that in an environment where interest rates may trend upward, rising rates would negatively impact the performance of most bond funds, and fixed-income securities and other instruments held by a Portfolio are likely to decrease in value. A wide variety of factors can cause interest rates to rise (e.g., central bank monetary policies, inflation rates, general economic conditions). In addition, changes in interest rates can be sudden and unpredictable, and there is no guarantee that Portfolio management will anticipate such movement accurately. A Portfolio may lose money as a result of movement in interest rates.
As of the date of this report, interest rates in the U.S. and many parts of the world, including certain European countries, are at or near historically low levels. Thus, the Portfolios currently face a heightened level of interest rate risk, especially since the Federal Reserve Board has ended its quantitative easing program and has begun, and may continue, to raise interest rates. To the extent the Federal Reserve Board continues to raise interest rates, there is a risk that rates across the financial system may rise. Further, while bond markets have steadily grown over the past three decades, dealer inventories of corporate bonds are near historic lows in relation to market size. As a result, there has been a significant reduction in the ability of dealers to “make markets.” Bond funds and individual bonds with a longer duration (a measure used to determine the sensitivity of a security’s price to changes in interest rates) tend to be more sensitive to changes in interest rates, usually making them more volatile than securities or funds with shorter durations. In addition, in the current low interest rate environment, the net asset value (“NAV”) of the Portfolios’ common shares may be particularly sensitive to changes in interest rates or the perception that there will be a change in interest rates. All of the factors mentioned above, individually or collectively, could lead to increased volatility and/or lower liquidity in the fixed income markets or negatively impact a Portfolio’s performance or cause a Portfolio to incur losses. As a result, the Portfolio may experience increased shareholder redemptions, which, among other things, could further reduce the net assets of the Portfolio.
The use of derivatives may subject the Portfolios to greater volatility than investments in traditional securities. The Portfolios may use derivative instruments for hedging purposes or as part of an investment strategy. Use of these instruments may involve certain costs and risks such as liquidity risk, interest rate risk, market risk, call risk, credit risk, leverage risk, management risk and the risk that a Portfolio may not be able to close out a position when it would be most advantageous to do so. Changes in regulation relating to a mutual fund’s use of derivatives and related instruments could potentially limit or impact the Portfolio’s ability to invest in derivatives, limit the Portfolio’s ability to employ certain strategies that use derivatives and/or adversely affect the value or performance of derivatives and the Portfolio. Certain derivative transactions may have a leveraging effect on a Portfolio. For example, a small investment in a derivative instrument may have a significant impact on a Portfolio’s exposure to interest rates, currency exchange rates or other investments. As a result, a relatively small price movement in an asset, instrument or component of the index underlying a derivative instrument may cause an immediate and substantial loss or gain, which translates into heightened volatility in a Portfolio’s NAV. A Portfolio may engage in such transactions regardless of whether the Portfolio owns the asset, instrument or components of the index underlying the derivative instrument. A Portfolio may invest a significant portion of its assets in these types of instruments. If it does, a Portfolio’s investment exposure could far exceed the value of its portfolio securities and its investment performance could be primarily dependent upon securities it does not own.
| | | | | | |
| 4 | | PIMCO MANAGED ACCOUNTS TRUST | | | | |
A Portfolio’s use of leverage creates the opportunity for increased income for the Portfolio’s shareholders, but also creates special risks. Leverage is a speculative technique that may expose a Portfolio to greater risk and increased costs. If shorter-term interest rates rise relative to the rate of return on a Portfolio’s holdings, the interest and other costs of leverage to the Portfolio could exceed the rate of return on the debt obligations and other investments held by the Portfolio, thereby reducing return to the Portfolio’s shareholders. In addition, fees and expenses of any form of leverage used by a Portfolio will be borne entirely by its shareholders and will reduce the investment return of the Portfolio’s shares. There can be no assurance that a Portfolio’s use of leverage will result in a higher yield on its shares, and it may result in losses. Leverage creates several major types of risks for a Portfolio’s shareholders, including (1) the likelihood of greater volatility of net asset value of the Portfolio’s shares, and of the investment return to the Portfolio’s shareholders, than a comparable portfolio without leverage; (2) the possibility either that the Portfolio’s dividends will fall if the interest and other costs of leverage rise, or that dividends paid on the Portfolio’s shares will fluctuate because such costs vary over time; and (3) the effects of leverage in a declining market or a rising interest rate environment, as leverage is likely to cause a greater decline in the net asset value of the Portfolio’s shares than if the Portfolio were not leveraged. Moreover, to make payments of interest and other loan costs, a Portfolio may be forced to sell portfolio securities when it is not otherwise advantageous to do so.
There is a risk that a Portfolio investing in a tender option bond program will not be considered the owner of a tender option bond for federal income tax purposes, and thus will not be entitled to treat such interest as exempt from federal income tax. Certain tender option bonds may be illiquid or may become illiquid as a result of, among other things, a credit rating downgrade, a payment default or a disqualification fromtax-exempt status. A Portfolio’s investment in the securities issued by a tender option bond trust may involve greater risk and volatility than an investment in a fixed rate bond, and the value of such securities may decrease significantly when market interest rates increase. Tender option bond trusts could be terminated due to market, credit or other events beyond the Portfolios’ control, which could require the Portfolios to dispose of portfolio investments at inopportune times and prices. A Portfolio may use a tender option bond program as a way of achieving leverage in its portfolio, in which case the Portfolio will be subject to leverage risk.
A Portfolio’s investments in and exposure to foreign securities involve special risks. For example, the value of these investments may decline in response to unfavorable political and legal developments, unreliable or untimely information or economic and financial instability. Foreign securities may experience more rapid and extreme changes in value than investments in securities of U.S. issuers. The securities markets of certain foreign countries are relatively small, with a limited number of companies representing a small number of industries. Issuers of foreign securities are usually not subject to the same degree of regulation as U.S. issuers. Reporting, accounting, auditing and custody standards of foreign countries differ, in some cases significantly, from U.S. standards. Also, nationalization, expropriation or other confiscation, currency blockage, political changes or diplomatic developments could adversely affect a Portfolio’s investments in foreign securities. In the event of nationalization, expropriation or other confiscation, a Portfolio could lose its entire investment in foreign securities. Investing in foreign(non-U.S.) securities may entail risk due to foreign(non-U.S.) economic and political developments; this risk may be increased when investing in emerging markets. For example, if a Portfolio invests in emerging market debt, it may face increased
| | | | | | |
| | ANNUAL REPORT | | DECEMBER 31, 2018 | | 5 |
Important Information About the Portfolios(Cont.)
exposure to interest rate, liquidity, volatility, and redemption risk due to the specific economic, political, geographical, or legal background of the foreign(non-U.S.) issuer.
The geographical classification of foreign(non-U.S.) securities in this report are classified by the country of incorporation of a holding. In certain instances, a security’s country of incorporation may be different from its country of economic exposure.
The United States presidential administration’s enforcement of tariffs on goods from other countries, with a focus on China, has contributed to international trade tensions and may impact portfolio securities.
Investments in loans (including whole loans) are generally subject to risks similar to those of investments in other types of debt obligations, including, among others, credit risk, interest rate risk, variable and floating rate securities risk, and, as applicable, risks associated with mortgage-related securities. In addition, in many cases loans are subject to the risks associated with below-investment grade securities. In the case of a loan participation or assignment, a Portfolio generally has no right to enforce compliance with the terms of the loan agreement with the borrower. As a result, a Portfolio may be subject to the credit risk of both the borrower and the lender that is selling the loan agreement. In the event of the insolvency of the lender selling a loan participation, a Portfolio may be treated as a general creditor of the lender and may not benefit from anyset-off between the lender and the borrower. The Portfolios may be subject to heightened or additional risks and potential liabilities and costs by investing in mezzanine and other subordinated loans, including those arising under bankruptcy, fraudulent conveyance, equitable subordination, lender liability, environmental and other laws and regulations, and risks and costs associated with debt servicing and taking foreclosure actions associated with the loans.
Mortgage-related and other asset-backed securities represent interests in “pools” of mortgages or other assets such as consumer loans or receivables held in trust and often involve risks that are different from or more acute than risks associated with other types of debt instruments. Generally, rising interest rates tend to extend the duration of fixed rate mortgage-related securities, making them more sensitive to changes in interest rates. As a result, in a period of rising interest rates, if a Portfolio holds mortgage-related securities, it may exhibit additional volatility since individual mortgage holders are less likely to exercise prepayment options, thereby putting additional downward pressure on the value of these securities and potentially causing the Portfolio to lose money. This is known as extension risk. Mortgage-backed securities can be highly sensitive to rising interest rates, such that even small movements can cause an investing Portfolio to lose value. Mortgage-backed securities, and in particular those not backed by a government guarantee, are subject to credit risk. In addition, adjustable and fixed rate mortgage-related securities are subject to prepayment risk. When interest rates decline, borrowers may pay off their mortgages sooner than expected. This can reduce the returns of the Portfolios because the Portfolios may have to reinvest that money at the lower prevailing interest rates. A Portfolio’s investments in other asset-backed securities are subject to risks similar to those associated with mortgage-related securities, as well as additional risks associated with the nature of the assets and the servicing of those assets. Payment of principal and interest on asset-backed securities may be largely dependent upon the cash flows generated by the assets backing the securities, and asset-backed securities may not have the benefit of any security interest in the related assets. Additionally, investments in subordinate mortgage-backed and other asset-backed securities will be subject to risks arising from delinquencies and foreclosures, thereby exposing a Portfolio’s investment portfolio to potential losses. Subordinate
| | | | | | |
| 6 | | PIMCO MANAGED ACCOUNTS TRUST | | | | |
securities of mortgage-backed and other asset-backed securities are also subject to greater credit risk than those mortgage-backed or other asset-backed securities that are more highly rated.
A Portfolio may also invest in the residual or equity tranches of mortgage-related and other asset-backed instruments, which may be referred to as subordinate mortgage-backed or asset-backed instruments and interest-only mortgage-backed or asset-backed instruments. Subordinatemortgage-backed or asset-backed instruments are paid interest only to the extent that there are funds available to make payments. To the extent the collateral pool includes a large percentage of delinquent loans, there is a risk that interest payment on subordinate mortgage-backed or asset-backed instruments will not be fully paid. Investments in subordinate mortgage-backed and other asset-backed instruments may be subject to risks arising from delinquencies and foreclosures, thereby exposing its investment portfolio to potential losses. Subordinate securities of mortgage-backed and other asset-backed instruments are also subject to greater credit risk than those mortgage-backed or other asset-backed securities that are more highly rated. There are multiple tranches of mortgage-backed and asset-backed instruments, offering investors various maturity and credit risk characteristics. Tranches are categorized as senior, mezzanine, and subordinated/equity or “first loss,” according to their degree of risk. The most senior tranche of a mortgage-backed or asset-backed instrument has the greatest collateralization and pays the lowest interest rate. If there are defaults or the collateral otherwise underperforms, scheduled payments to senior tranches take precedence over those of mezzanine tranches, and scheduled payments to mezzanine tranches take precedence over those to subordinated/equity tranches. Lower tranches represent lower degrees of credit quality and pay higher interest rates intended to compensate for the attendant risks. The return on the lower tranches is especially sensitive to the rate of defaults in the collateral pool. The lowest tranche (i.e., the “equity” or “residual” tranche) specifically receives the residual interest payments (i.e., money that is left over after the higher tranches have been paid and expenses of the issuing entities have been paid) rather than a fixed interest rate. Because an investment in the residual or equity tranche of a mortgage-related or other asset-backed instrument will be the first to bear losses incurred by such instrument, these investments may involve a significantly greater degree of risk than investments in other tranches of a mortgage-related or other asset-backed instrument.
High-yield bonds (commonly referred to as “junk bonds”) typically have a lower credit rating than other bonds. Lower-rated bonds generally involve a greater risk to principal than higher-rated bonds. Further, markets for lower-rated bonds are typically less liquid than for higher-rated bonds, and public information is usually less abundant in markets for lower-rated bonds. Thus, high yield investments increase the chance that a Portfolio will lose money. PIMCO does not rely solely on credit ratings, and develops its own analysis of issuer credit quality. The Portfolio may purchase unrated securities (which are not rated by a rating agency) if PIMCO determines that the security is of comparable quality to a rated security that the Portfolio may purchase. Unrated securities may be less liquid than comparable rated securities and involve the risk that PIMCO may not accurately evaluate the security’s comparative credit quality, which could result in a Portfolio’s portfolio having a higher level of credit and/or high yield risk than PIMCO has estimated or desires for the Portfolio, and could negatively impact the Portfolio’s performance and/or returns. Certain Portfolios may invest a substantial portion of their assets in unrated securities and therefore may be particularly subject to the associated risks. Analysis of the creditworthiness of issuers of high yield securities may be more complex than for issuers of higher-quality debt obligations. To the extent that a Portfolio invests in high yield and/or unrated securities, the Portfolio’s success in achieving its investment objectives may
| | | | | | |
| | ANNUAL REPORT | | DECEMBER 31, 2018 | | 7 |
Important Information About the Portfolios(Cont.)
depend more heavily on the portfolio manager’s creditworthiness analysis than if the Portfolio invested exclusively in higher-quality and rated securities. The Portfolios may hold defaulted securities that may involve special considerations including bankruptcy proceedings, other regulatory and legal restrictions affecting the Portfolio’s ability to trade, and the availability of prices from independent pricing services or dealer quotations. Defaulted obligations might be repaid only after lengthy workout or bankruptcy proceedings, during which the issuer might not make any interest or other payments. Defaulted securities are often illiquid and may not be actively traded. Sales of securities in bankrupt companies at an acceptable price may be difficult and differences compared to the value of the securities used by the Portfolios could be material. The credit quality of a particular security or group of securities does not ensure the stability or safety of the overall portfolio.
Contingent convertible securities (“CoCos”) are a form of hybrid debt security issued primarily bynon-U.S. issuers, which have loss absorption mechanisms built into their terms. The risks of investing in contingent convertible securities ("CoCos") include, without limitation, the risk that interest payments will be cancelled by the issuer or a regulatory authority, the risk of ranking junior to other creditors in the event of a liquidation or other bankruptcy-related event as a result of holding subordinated debt, the risk of a Portfolio’s investment becoming further subordinated as a result of conversion from debt to equity, the risk that the principal amount due can be written down to a lesser amount, and the general risks applicable to fixed income investments, including interest rate risk, credit risk, market risk and liquidity risk, any of which could result in losses to the Portfolio. CoCos may experience a loss absorption mechanism trigger event, which would likely be the result of, or related to, the deterioration of the issuer’s financial condition (e.g., a decrease in the issuer’s capital ratio) and status as a going concern. In such a case, with respect to contingent convertible securities that provide for conversion into common stock upon the occurrence of the trigger event, the market price of the issuer’s common stock received by a Portfolio will have likely declined, perhaps substantially, and may continue to decline, which may adversely affect the Portfolio’s net asset value.
Variable and floating rate securities generally are less sensitive to interest rate changes but may decline in value if their interest rates do not rise as much, or as quickly, as interest rates in general. Conversely floating rate securities will not generally increase in value if interest rates decline. Inverse floating rate securities may decrease in value if interest rates increase. Inverse floating rate securities may also exhibit greater price volatility than a fixed rate obligation with similar credit quality. When a Portfolio holds variable or floating rate securities, a decrease (or, in the case of inverse floating rate securities, an increase) in market interest rates will adversely affect the income received from such securities and the NAV of the Portfolios’ shares.
The Portfolios may invest in securities and instruments that are economically tied to Russia. Investments in Russia are subject to various risks such as political, economic, legal, market and currency risks. The risks include uncertain political and economic policies, short-term market volatility, poor accounting standards, corruption and crime, an inadequate regulatory system, and unpredictable taxation. Investments in Russia are particularly subject to the risk that economic sanctions may be imposed by the United States and/or other countries. Such sanctions — which may impact companies in many sectors, including energy, financial services and defense, among others — may negatively impact the Portfolios’ performance and/or ability to achieve their investment objectives. The Russian securities market is characterized by limited volume of trading, resulting in difficulty in obtaining accurate prices. The Russian securities market, as compared to U.S.
| | | | | | |
| 8 | | PIMCO MANAGED ACCOUNTS TRUST | | | | |
markets, has significant price volatility, less liquidity, a smaller market capitalization and a smaller number of traded securities. There may be little publicly available information about issuers. Settlement, clearing and registration of securities transactions are subject to risks because of registration systems that may not be subject to effective government supervision. This may result in significant delays or problems in registering the transfer of securities. Russian securities laws may not recognize foreign nominee accounts held with a custodian bank, and therefore the custodian may be considered the ultimate owner of securities they hold for their clients. Ownership of securities issued by Russian companies is recorded by companies themselves and by registrars instead of through a central registration system. It is possible that the ownership rights of the Portfolios could be lost through fraud or negligence. While applicable Russian regulations impose liability on registrars for losses resulting from their errors, it may be difficult for the Portfolios to enforce any rights they may have against the registrar or issuer of the securities in the event of loss of share registration. Adverse currency exchange rates are a risk and there may be a lack of available currency hedging instruments. Investments in Russia may be subject to the risk of nationalization or expropriation of assets. Oil, natural gas, metals, and timber account for a significant portion of Russia’s exports, leaving the country vulnerable to swings in world prices.
Investing in the municipal bond market involves the risks of investing in debt securities generally and certain other risks. The amount of public information available about the municipal bonds in which a Portfolio may invest is generally less than that for corporate equities or bonds, and the investment performance of a Portfolio’s investment in municipal bonds may therefore be more dependent on the analytical abilities of PIMCO than investments in taxable bonds. The secondary market for municipal bonds, also tends to be less well-developed or liquid than many other securities markets, which may adversely affect a Portfolio’s ability to sell its bonds at attractive prices.
The ability of municipal issuers to make timely payments of interest and principal may be diminished during general economic downturns, by litigation, legislation or political events, or by the bankruptcy of the issuer. Laws, referenda, ordinances or regulations enacted in the future by Congress or state legislatures or the applicable governmental entity could extend the time for payment of principal and/or interest, or impose other constraints on enforcement of such obligations, or on the ability of municipal issuers to levy taxes. Issuers of municipal securities might also seek protection under the bankruptcy laws. In the event of bankruptcy of such an issuer, a Portfolio could experience delays in collecting principal and interest and the Portfolio may not, in all circumstances, be able to collect all principal and interest to which it is entitled. To enforce its rights in the event of a default in the payment of interest or repayment of principal, or both, a Portfolio may take possession of, and manage, the assets securing the issuer’s obligations on such securities, which may increase the Portfolio’s operating expenses. Any income derived from the Portfolio’s ownership or operation of such assets may not betax-exempt. More generally, the Portfolios other than FISH: Series TE do not expect to be eligible to pass through to shareholders thetax-exempt character of interest earned on municipal bonds.
A Portfolio that has substantial exposures to California municipal bonds may be affected significantly by economic, regulatory or political developments affecting the ability of California issuers to pay interest or repay principal. Certain issuers of California municipal bonds have experienced serious financial difficulties in the past and reoccurrence of these difficulties may impair the ability of certain California issuers to pay principal or interest on their obligations. Provisions of the California Constitution and State statutes that limit the taxing and spending authority of California
| | | | | | |
| | ANNUAL REPORT | | DECEMBER 31, 2018 | | 9 |
Important Information About the Portfolios(Cont.)
governmental entities may impair the ability of California issuers to pay principal and/or interest on their obligations. While California’s economy is broad, it does have major concentrations in high technology, aerospace and defense-related manufacturing, trade, entertainment, real estate and financial services, and may be sensitive to economic problems affecting those industries. Future California political and economic developments, constitutional amendments, legislative measures, executive orders, administrative regulations, litigation and voter initiatives could have an adverse effect on the debt obligations of California issuers.
A Portfolio that has substantial exposures to New York municipal bonds may be affected significantly by economic, regulatory or political developments affecting the ability of New York issuers to pay interest or repay principal. While New York’s economy is broad, it does have concentrations in the financial services industry, and may be sensitive to economic problems affecting that industry. Certain issuers of New York municipal bonds have experienced serious financial difficulties in the past and a reoccurrence of these difficulties may impair the ability of certain New York issuers to pay principal or interest on their obligations. The financial health of New York City affects that of the State, and when New York City experiences financial difficulty it may have an adverse effect on New York municipal bonds held by a Portfolio. The growth rate of New York has at times been somewhat slower than the nation overall. The economic and financial condition of New York also may be affected by various financial, social, economic and political factors.
As the use of technology has become more prevalent in the course of business, the Portfolios have become potentially more susceptible to operational and information security risks resulting from breaches in cyber security. A breach in cyber security refers to both intentional and unintentional cyber events that may, among other things, cause a Portfolio to lose proprietary information, suffer data corruption and/or destruction or lose operational capacity, result in the unauthorized release or other misuse of confidential information, or otherwise disrupt normal business operations. Cyber security breaches may involve unauthorized access to a Portfolio’s digital information systems (e.g., through “hacking” or malicious software coding), but may also result from outside attacks such asdenial-of-service attacks (i.e., efforts to make network services unavailable to intended users). In addition, cyber security breaches involving a Portfolio’s third party service providers (including but not limited to advisers,sub-advisers, administrators, transfer agents, custodians, distributors and other third parties), trading counterparties or issuers in which a Portfolio invests can also subject a Portfolio to many of the same risks associated with direct cyber security breaches. Moreover, cyber security breaches involving trading counterparties or issuers in which a Portfolio invests could adversely impact such counterparties or issuers and cause the Portfolio’s investment to lose value.
Cyber security failures or breaches may result in financial losses to a Portfolio and its shareholders. These failures or breaches may also result in disruptions to business operations, potentially resulting in financial losses; interference with a Portfolio’s ability to calculate its net asset value, process shareholder transactions or otherwise transact business with shareholders; impediments to trading; violations of applicable privacy and other laws; regulatory fines; penalties; reputational damage; reimbursement or other compensation costs; additional compliance and cyber security risk management costs and other adverse consequences. In addition, substantial costs may be incurred in order to prevent any cyber incidents in the future.
Like with operational risk in general, the Portfolios have established business continuity plans and risk management systems designed to reduce the risks associated with cyber security. However, there
| | | | | | |
| 10 | | PIMCO MANAGED ACCOUNTS TRUST | | | | |
are inherent limitations in these plans and systems, including that certain risks may not have been identified, in large part because different or unknown threats may emerge in the future. As such, there is no guarantee that such efforts will succeed, especially because the Portfolios do not directly control the cyber security systems of issuers in which a Portfolio may invest, trading counterparties or third party service providers to the Portfolios. There is also a risk that cyber security breaches may not be detected. The Portfolios and their shareholders could be negatively impacted as a result.
The Portfolios may be subject to various risks, including, but not limited to, the following: credit risk, currency risk, focused-investment risk, interest rate risk,issuer-non-diversification risk, sovereign debt risk, issuer risk, leveraging risk, liquidity risk, management risk, contingent convertible securities risk, high yield risk, market risk, municipal project-specific risk, municipal securities risk, and turnover risk. A description of certain of these risks is available in the Notes to Financial Statements of this report.
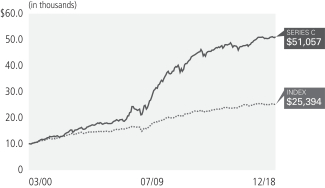
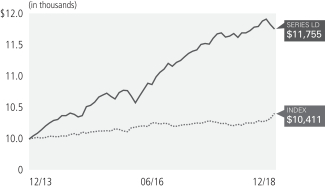
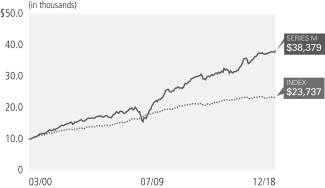
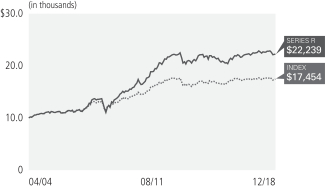
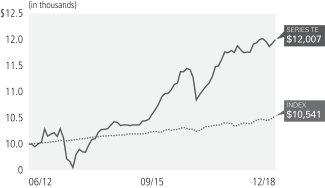
On each Portfolio Summary page in this Shareholder Report, the Average Annual Total Return table and Cumulative Returns chart measure performance assuming that all dividend and capital gain distributions were reinvested. Returns do not reflect the deduction of taxes that a shareholder would pay on (i) Portfolio distributions or (ii) the redemption of Portfolio shares. Total return for a period of more than one year represents the average annual total return. Performance shown is net of fees and expenses. The figures in the line graph are calculated at net asset value and assume the investment of $10,000 at the end of the month that a Portfolio commenced operations. Each Portfolio measures its performance against a broad-based securities market index (“benchmark index”). Each benchmark index does not take into account fees, expenses or taxes.
The following table discloses the commencement of operations and diversification status of each Portfolio:
| | | | | | | | | | |
| | | |
| Portfolio Name | | | | | Commencement
of Operations | | | Diversification
Status |
| Fixed Income SHares: Series C | | | | | | | 03/17/00 | | | Diversified |
| Fixed Income SHares: Series LD | | | | | | | 12/20/13 | | | Diversified |
| Fixed Income SHares: Series M | | | | | | | 03/17/00 | | | Diversified |
| Fixed Income SHares: Series R | | | | | | | 04/15/04 | | | Diversified |
| Fixed Income SHares: Series TE | | | | | | | 06/25/12 | | | Diversified |
The Trustees are responsible generally for overseeing the management of the Trust. The Trustees authorize the Trust to enter into service agreements with PIMCO as the Investment Adviser and Administrator, PIMCO Investments LLC and other service providers in order to provide, and in some cases authorize service providers to procure through other parties, necessary or desirable services on behalf of the Trust and the Portfolios. Shareholders are not parties to or third-party beneficiaries of such service agreements. Neither a Portfolio’s prospectus nor summary prospectus, the Trust’s Statement of Additional Information (SAI), any press release or shareholder report, any contracts filed as exhibits to the Trust’s registration statement, nor any other communications, disclosure documents or regulatory filings from or on behalf of the Trust or a Portfolio creates a contract between or among any shareholders of a Portfolio, on the one hand, and the Trust, a Portfolio, a service provider to the Trust or a Portfolio, and/or the Trustees or officers of the Trust, on the other hand.
| | | | | | |
| | ANNUAL REPORT | | DECEMBER 31, 2018 | | 11 |
Important Information About the Portfolios(Cont.)
The Trustees (or the Trust and its officers, service providers or other delegates acting under authority of the Trustees) may amend its most recent or use a new prospectus, summary prospectus or SAI with respect to a Portfolio or the Trust, and/or amend, file and/or issue any other communications, disclosure documents or regulatory filings, and may amend or enter into any contracts to which the Trust or a Portfolio is a party, and interpret the investment objective(s), policies, restrictions and contractual provisions applicable to any Portfolio, without shareholder input or approval, except in circumstances in which shareholder approval is specifically required by law (such as changes to fundamental investment policies) or where a shareholder approval requirement is specifically disclosed in the Trust’s then-current prospectus or SAI.
An investment in a Portfolio is not a deposit of a bank and is not guaranteed or insured by the Federal Deposit Insurance Corporation or any other government agency. It is possible to lose money on investments in the Portfolios.
PIMCO has adopted written proxy voting policies and procedures (“Proxy Policy”) as required byRule 206(4)-6 under the Investment Advisers Act of 1940. The Proxy Policy has been adopted by the Portfolios as the policies and procedures that PIMCO will use when voting proxies on behalf of the Portfolios. A description of the policies and procedures that PIMCO uses to vote proxies relating to portfolio securities of each Portfolio, and information about how each Portfolio voted proxies relating to portfolio securities held during the most recent twelve-month period ended June 30, are available without charge, upon request, by calling the Portfolios at (800)927-4648, on the Portfolios’ website at www.pimco.com/ FISH, and on the Securities and Exchange Commission’s (“SEC”) website at http://www.sec.gov.
Each Portfolio files a complete schedule of its portfolio holdings with the SEC for the first and third quarters of its fiscal year on FormN-Q. A copy of each Portfolio’s FormN-Q is available on the SEC’s website at http://www.sec.gov and is available without charge, upon request by calling the Portfolios at(800) 927-4648, on the Portfolios’ website at www.pimco.com/FISH.
The SEC adopted a rule that, beginning in 2021, will generally allow funds to fulfill their obligation to deliver shareholder reports to investors by providing access to such reports online free of charge and by mailing a notice that the report is electronically available. Pursuant to the rule, investors may still elect to receive a complete shareholder report in the mail. Instructions for electing to receive paper copies of a Portfolio’s shareholder reports going forward may be found on the front cover of this report.
The SEC adopted amendments to certain disclosure requirements relating to open-end investment companies’ liquidity risk management programs. Effective December 1, 2019, large fund complexes will be required to include in their shareholder reports a discussion of their liquidity risk management programs’ operations over the past year.
| | | | | | |
| 12 | | PIMCO MANAGED ACCOUNTS TRUST | | | | |
(THIS PAGE INTENTIONALLY LEFT BLANK)
| | | | | | |
| | ANNUAL REPORT | | DECEMBER 31, 2018 | | 13 |
| | |
| Fixed Income SHares: Series C | | FXICX |
Cumulative Returns Through December 31, 2018
| | | | |
|
| Allocation Breakdown as of 12/31/2018†§ | |
| |
| U.S. Government Agencies | | | 33.2% | |
| Corporate Bonds & Notes | | | 32.7% | |
| Asset-Backed Securities | | | 17.1% | |
| U.S. Treasury Obligations | | | 8.6% | |
| Non-Agency Mortgage-Backed Securities | | | 3.8% | |
| Short-Term Instruments‡ | | | 2.6% | |
| Loan Participations and Assignments | | | 1.0% | |
| Other | | | 1.0% | |
| † | | % of Investments, at value. |
| § | | Allocation Breakdown and % of investments exclude securities sold short and financial derivative instruments, if any. |
| ‡ | | Includes Central Funds Used for Cash Management Purposes. |
| | | | | | | | | | | | | | | | | | |
|
| Average Annual Total Return for the period ended December 31, 2018 | |
| | | | | |
| | | | | 1 Year | | | 5 Year | | | 10 Year | | | Commencement
of Operations
(03/17/00) | |
 | | Fixed Income SHares: Series C | | | 0.21% | | | | 2.39% | | | | 7.65% | | | | 9.09% | |
 | | Bloomberg Barclays U.S. Intermediate Credit Index | | | 0.01% | | | | 2.47% | | | | 4.84% | | | | 5.09%¨ | |
All Portfolio returns are net of fees and expenses.
¨ Average Annual Return since 03/31/00
Performance quoted represents past performance. Past performance is not a guarantee or a reliable indicator of future results. Current performance may be lower or higher than performance shown. Investment return and the principal value of an investment will fluctuate. Returns presented do not reflect the deduction of taxes that a shareholder would pay on portfolio distribution or the redemption of portfolio shares or the deduction of any fees charged to investors at the “wrap account” level. Differences in the Portfolio’s performance versus the index and related attribution information with respect to particular categories of securities or individual positions may be attributable, in part, to differences in the pricing methodologies used by the Portfolio and the index.
The Portfolio’s total annual operating expense ratio in effect as of period end was 0.43%. Details regarding any changes to the Portfolio’s operating expenses, subsequent to period end, can be found in the Portfolio’s current prospectus, as supplemented.
| | | | | | |
| 14 | | PIMCO MANAGED ACCOUNTS TRUST | | | | |
Investment Objective
The Portfolio seeks maximum total return, consistent with preservation of capital and prudent investment management.
Portfolio Insights
The following affected performance during the reporting period:
| » | | U.S. interest rate strategies, particularly a combination of yield advantage and underweight exposure to overall duration contributed to relative performance, as rates fell. |
| » | | Underweight exposure to investment grade corporate credit contributed to performance, as spreads widened. |
| » | | Short exposure to the Australian dollar contributed to performance, as the currency depreciated relative to the U.S. dollar. |
| » | | Positions in agency mortgage-backed securities detracted from performance, as total returns in these securities were negative. |
| » | | Long exposure to select emerging market currencies, particularly the Turkish lira and Russian ruble detracted from relative performance, as these currencies depreciated against the U.S. dollar. |
| » | | Positions in high yield corporates detracted from relative performance, as spreads widened. |
| | | | | | |
| | ANNUAL REPORT | | DECEMBER 31, 2018 | | 15 |
| | |
| Fixed Income SHares: Series LD | | FXIDX |
Cumulative Returns Through December 31, 2018
| | | | |
|
| Allocation Breakdown as of 12/31/2018†§ | |
| |
| Corporate Bonds & Notes | | | 48.8% | |
| U.S. Treasury Obligations | | | 33.8% | |
| Asset-Backed Securities | | | 8.6% | |
| Non-Agency Mortgage-Backed Securities | | | 3.9% | |
| Short-Term Instruments‡ | | | 2.9% | |
| Other | | | 2.0% | |
| † | | % of Investments, at value. |
| § | | Allocation Breakdown and % of investments exclude securities sold short and financial derivative instruments, if any. |
| ‡ | | Includes Central Funds Used for Cash Management Purposes. |
| | | | | | | | | | | | | | |
|
| Average Annual Total Return for the period ended December 31, 2018 | |
| | | | |
| | | | | 1 Year | | | 5 Year | | | Commencement
of Operations
(12/20/13) | |
| | Fixed Income SHares: Series LD | | | 1.07% | | | | 3.29% | | | | 3.25% | |
| | ICE BofAML1-3 Year U.S. Treasury Index | | | 1.58% | | | | 0.81% | | | | 0.80% | |
All Portfolio returns are net of fees and expenses.
Performance quoted represents past performance. Past performance is not a guarantee or a reliable indicator of future results. Current performance may be lower or higher than performance shown. Investment return and the principal value of an investment will fluctuate. Returns presented do not reflect the deduction of taxes that a shareholder would pay on portfolio distribution or the redemption of portfolio shares or the deduction of any fees charged to investors at the “wrap account” level. Differences in the Portfolio’s performance versus the index and related attribution information with respect to particular categories of securities or individual positions may be attributable, in part, to differences in the pricing methodologies used by the Portfolio and the index.
The Portfolio’s total annual operating expense ratio in effect as of period end was 1.30%. Details regarding any changes to the Portfolio’s operating expenses, subsequent to period end, can be found in the Portfolio’s current prospectus, as supplemented.
| | | | | | |
| 16 | | PIMCO MANAGED ACCOUNTS TRUST | | | | |
Investment Objective
The Portfolio seeks maximum total return, consistent with preservation of capital and prudent investment management.
Portfolio Insights
The following affected performance during the reporting period:
| » | | Holdings of investment grade corporate credit detracted from performance, as the securities generally posted negative total returns. |
| » | | Overweight exposure to the 1-year portion of the U.S. Treasury curve detracted from performance, as the 1-year portion of the curve rose. |
| » | | Overweight exposure to Treasury Inflation-Protected Securities detracted from performance, as the securities generally posted negative total returns. |
| » | | Underweight exposure to high yield corporate credit contributed to performance, as securities generally posted negative total returns. |
| » | | Short exposure to the euro versus the U.S. dollar contributed to performance, as the euro depreciated against the U.S. dollar. |
| | | | | | |
| | ANNUAL REPORT | | DECEMBER 31, 2018 | | 17 |
| | |
| Fixed Income SHares: Series M | | FXIMX |
Cumulative Returns Through December 31, 2018
| | | | |
| |
| Allocation Breakdown as of 12/31/2018†§ | | | |
| |
| U.S. Government Agencies | | | 34.0% | |
| Asset-Backed Securities | | | 24.1% | |
| Corporate Bonds & Notes | | | 18.2% | |
| Non-Agency Mortgage-Backed Securities | | | 13.7% | |
| U.S. Treasury Obligations | | | 3.6% | |
| Municipal Bonds & Notes | | | 3.2% | |
| Short-Term Instruments‡ | | | 2.8% | |
| Sovereign Issues | | | 0.4% | |
| † | | % of Investments, at value. |
| § | | Allocation Breakdown and % of investments exclude securities sold short and financial derivative instruments, if any. |
| ‡ | | Includes Central Funds Used for Cash Management Purposes. |
| | | | | | | | | | | | | | | | | | |
|
| Average Annual Total Return for the period ended December 31, 2018 | |
| | | | | |
| | | | | 1 Year | | | 5 Year | | | 10 Year | | | Commencement
of Operations
(03/17/00) | |
| | Fixed Income SHares: Series M | | | 2.23% | | | | 5.16% | | | | 8.63% | | | | 7.46% | |
| | Bloomberg Barclays U.S. MBS Fixed Rate Index | | | 0.99% | | | | 2.54% | | | | 3.12% | | | | 4.71%¨ | |
All Portfolio returns are net of fees and expenses.
¨ Average Annual Return since 03/31/00
Performance quoted represents past performance. Past performance is not a guarantee or a reliable indicator of future results. Current performance may be lower or higher than performance shown. Investment return and the principal value of an investment will fluctuate. Returns presented do not reflect the deduction of taxes that a shareholder would pay on portfolio distribution or the redemption of portfolio shares or the deduction of any fees charged to investors at the “wrap account” level. Differences in the Portfolio’s performance versus the index and related attribution information with respect to particular categories of securities or individual positions may be attributable, in part, to differences in the pricing methodologies used by the Portfolio and the index.
The Portfolio’s total annual operating expense ratio in effect as of period end was 0.24%. Details regarding any changes to the Portfolio’s operating expenses, subsequent to period end, can be found in the Portfolio’s current prospectus, as supplemented.
| | | | | | |
| 18 | | PIMCO MANAGED ACCOUNTS TRUST | | | | |
Investment Objective
The Portfolio seeks maximum total return, consistent with preservation of capital and prudent investment management.
Portfolio Insights
The following affected performance during the reporting period:
| » | | Positions in non-agency mortgage-backed securities (“MBS”) contributed to relative performance, as total returns in these securities were positive. |
| » | | Underweight exposure to agency MBS contributed to relative performance, as excess returns in these securities were negative. |
| » | | Positions in taxable municipal bonds contributed to relative performance, as total returns in these securities were positive. |
| » | | Short exposure to duration in the United Kingdom detracted from performance — particularly during the middle and end of the reporting period, as rates fell. |
| » | | Overweight exposure to investment grade corporate credit detracted from performance, as spreads widened. |
| » | | Holdings of sovereign emerging markets external debt detracted from relative performance, as evidenced via a comparable Index (the JP Morgan Emerging Market Bond Index (EMBI). This Index generally tracks the total returns of emerging market external debt and it declined during the reporting period. |
| | | | | | |
| | ANNUAL REPORT | | DECEMBER 31, 2018 | | 19 |
| | |
| Fixed Income SHares: Series R | | FXIRX |
Cumulative Returns Through December 31, 2018
| | | | |
| |
| Allocation Breakdown as of 12/31/2018†§ | | | |
| |
| U.S. Treasury Obligations | | | 68.8% | |
| U.S. Government Agencies | | | 11.7% | |
| Sovereign Issues | | | 7.0% | |
| Corporate Bonds & Notes | | | 5.8% | |
| Asset-Backed Securities | | | 4.6% | |
| Non-Agency Mortgage-Backed Securities | | | 1.7% | |
| Short-Term Instruments | | | 0.4% | |
| † | | % of Investments, at value. |
| § | | Allocation Breakdown and % of investments exclude securities sold short and financial derivative instruments, if any. |
| | | | | | | | | | | | | | | | | | |
|
| Average Annual Total Return for the period ended December 31, 2018 | |
| | | | | |
| | | | | 1 Year | | | 5 Year | | | 10 Year | | | Commencement
of Operations
(04/15/04) | |
| | Fixed Income SHares: Series R | | | (2.52)% | | | | 1.61% | | | | 6.30% | | | | 5.57% | |
| | Bloomberg Barclays U.S. TIPS Index | | | (1.26)% | | | | 1.69% | | | | 3.64% | | | | 3.87%¨ | |
All Portfolio returns are net of fees and expenses.
¨ Average Annual Return since 04/30/04
Performance quoted represents past performance. Past performance is not a guarantee or a reliable indicator of future results. Current performance may be lower or higher than performance shown. Investment return and the principal value of an investment will fluctuate. Returns presented do not reflect the deduction of taxes that a shareholder would pay on portfolio distribution or the redemption of portfolio shares or the deduction of any fees charged to investors at the “wrap account” level. Differences in the Portfolio’s performance versus the index and related attribution information with respect to particular categories of securities or individual positions may be attributable, in part, to differences in the pricing methodologies used by the Portfolio and the index.
The Portfolio’s total annual operating expense ratio in effect as of period end was 0.62%. Details regarding any changes to the Portfolio’s operating expenses, subsequent to period end, can be found in the Portfolio’s current prospectus, as supplemented.
| | | | | | |
| 20 | | PIMCO MANAGED ACCOUNTS TRUST | | | | |
Investment Objective
The Portfolio seeks maximum real return, consistent with preservation of real capital and prudent investment management.
Portfolio Insights
The following affected performance during the reporting period:
| » | | Exposure to U.S. Treasury Inflation-Protected Securities (“TIPS”) detracted from absolute performance as U.S. TIPS, as measured by the Bloomberg Barclays U.S. TIPS Index, posted negative returns. |
| » | | Overweight exposure to U.S. real duration detracted from relative performance, as U.S. real yields rose. |
| » | | Underweight exposure to U.K. breakeven inflation rates via inflation-linked derivatives detracted from relative performance, as U.K. breakeven inflation rates rose. |
| » | | Exposure to external emerging market debt detracted from relative performance, as external emerging market debt yield spreads widened. |
| » | | Overweight exposure to the Argentine peso detracted from relative performance, as the currency depreciated. |
| » | | Underweight exposure to U.S. nominal duration contributed to relative performance, as U.S. nominal yields rose. |
| | | | | | |
| | ANNUAL REPORT | | DECEMBER 31, 2018 | | 21 |
| | |
| Fixed Income SHares: Series TE | | FXIEX |
Cumulative Returns Through December 31, 2018
| | | | |
| |
| Allocation Breakdown as of 12/31/2018†§ | | | |
| |
| Municipal Bonds & Notes | | | 98.0% | |
| Short-Term Instruments‡ | | | 2.0% | |
| † | | % of Investments, at value. |
| § | | Allocation Breakdown and % of investments exclude securities sold short and financial derivative instruments, if any. |
| ‡ | | Includes Central Funds Used for Cash Management Purposes. |
| | | | | | | | | | | | | | |
|
| Average Annual Total Return for the period ended December 31, 2018 | |
| | | | |
| | | | | 1 Year | | | 5 Year | | | Commencement
of Operations
(06/25/12) | |
| | Fixed Income SHares: Series TE | | | 0.97% | | | | 4.05% | | | | 2.85% | |
| | Bloomberg Barclays 1-Year Municipal Bond Index | | | 1.74% | | | | 0.83% | | | | 0.81% | |
All Portfolio returns are net of fees and expenses.
Performance quoted represents past performance. Past performance is not a guarantee or a reliable indicator of future results. Current performance may be lower or higher than performance shown. Investment return and the principal value of an investment will fluctuate. Returns presented do not reflect the deduction of taxes that a shareholder would pay on portfolio distribution or the redemption of portfolio shares or the deduction of any fees charged to investors at the “wrap account” level. Differences in the Portfolio’s performance versus the index and related attribution information with respect to particular categories of securities or individual positions may be attributable, in part, to differences in the pricing methodologies used by the Portfolio and the index.
The Portfolio’s total annual operating expense ratio in effect as of period end was 0.04%. Details regarding any changes to the Portfolio’s operating expenses, subsequent to period end, can be found in the Portfolio’s current prospectus, as supplemented.
| | | | | | |
| 22 | | PIMCO MANAGED ACCOUNTS TRUST | | | | |
Investment Objective
The Portfolio seeks high current income exempt from U.S. federal income tax consistent with prudent investment management. Total return/capital appreciation is a secondary objective.
Portfolio Insights
The following affected performance during the reporting period:
| » | | Select exposure within the transportation sector contributed to performance. |
| » | | Select exposure within the special tax sector contributed to performance. |
| » | | A modest short interest rate position contributed to performance. |
| » | | Duration positioning detracted from performance, as municipal yields moved higher during the year. |
| » | | Select exposure within the housing sector detracted from performance. |
| » | | Underweight exposure to pre-refunded debt detracted from performance, as the sector outperformed the general municipal market. |
| | | | | | |
| | ANNUAL REPORT | | DECEMBER 31, 2018 | | 23 |
Expense Examples
Example
As a shareholder of a Portfolio, you incur two types of costs: (1) transaction costs and (2) ongoing costs, including management fees, distribution and/or service (12b-1) fees (if applicable), and other Portfolio expenses. The Example is intended to help you understand your ongoing costs (in dollars) of investing in the Portfolio and to compare these costs with the ongoing costs of investing in other mutual funds.
The Example is based on an investment of $1,000 invested at the beginning of the period and held for the entire period indicated, which for all Portfolios is from July 1, 2018 to December 31, 2018 unless noted otherwise in the table and footnotes below.
Actual Expenses
The information in the table under the heading “Actual” provides information about actual account values and actual expenses. You may use the information in these rows, together with the amount you invested, to estimate the expenses that you paid over the period. Simply divide your account value by $1,000 (for example, an $8,600 account value divided by $1,000 = 8.60), then multiply the result by the number in the appropriate row for your Portfolio in the column titled “Expenses Paid During Period” to estimate the expenses you paid on your account during this period.
Hypothetical Example for Comparison Purposes
The information in the table under the heading “Hypothetical (5% return before expenses)” provides information about hypothetical account values and hypothetical expenses based on a Portfolio’s actual expense ratio and an assumed rate of return of 5% per year before expenses, which is not the Portfolio’s actual return. The hypothetical account values and expenses may not be used to estimate the actual ending account balance or expenses you paid for the period. You may use this information to compare the ongoing costs of investing in a Portfolio and other funds. To do so, compare this 5% hypothetical example with the 5% hypothetical examples that appear in the shareholder reports of the other funds.
Please note that the expenses shown in the table are meant to highlight your ongoing costs only and do not reflect any transactional costs. Therefore, the information under the heading “Hypothetical (5% return before expenses)” is useful in comparing ongoing costs only, and will not help you determine the relative total costs of owning different funds. In addition, if these transactional costs were included, your costs would have been higher.
Expense ratios may vary period to period because of various factors, such as an increase in expenses that are not covered by the management fees such as fees and expenses of the independent trustees and their counsel, extraordinary expenses and interest expense.
| | | | | | | | | | | | | | | | | | | | | | | | | | | | | | | | | | | | | | | | |
| | | | | | Actual | | | | | | Hypothetical
(5% return before expenses) | | | | | | | |
| | | | | | Beginning
Account Value
(07/01/18) | | | Ending
Account Value
(12/31/18) | | | Expenses Paid
During Period* | | | | | | Beginning
Account Value
(07/01/18) | | | Ending
Account Value
(12/31/18) | | | Expenses Paid
During Period* | | | | | | Net Annualized
Expense Ratio** | |
Series C | | | | | | $ | 1,000.00 | | | $ | 1,013.20 | | | $ | 0.85 | | | | | | | $ | 1,000.00 | | | $ | 1,024.36 | | | $ | 0.86 | | | | | | | | 0.17 | % |
Series LD | | | | | | | 1,000.00 | | | | 1,002.30 | | | | 17.16 | | | | | | | | 1,000.00 | | | | 1,008.07 | | | | 17.21 | | | | | | | | 3.40 | |
Series M | | | | | | | 1,000.00 | | | | 1,023.20 | | | | 0.43 | | | | | | | | 1,000.00 | | | | 1,024.78 | | | | 0.43 | | | | | | | | 0.08 | |
Series R | | | | | | | 1,000.00 | | | | 975.00 | | | | 6.37 | | | | | | | | 1,000.00 | | | | 1,018.75 | | | | 6.51 | | | | | | | | 1.28 | |
Series TE | | | | | | | 1,000.00 | | | | 1,005.30 | | | | 0.40 | | | | | | | | 1,000.00 | | | | 1,024.80 | | | | 0.41 | | | | | | | | 0.08 | (a) |
* Expenses Paid During Period are equal to the net annualized expense ratio for the Portfolio, multiplied by the average account value over the period, multiplied by 184/365 (to reflect theone-half year period).
** Net Annualized Expense Ratio is reflective of any applicable contractual fee waivers and/or expense reimbursements or voluntary fee waivers. Details regarding fee waivers, if any, can be found in Note 9, Fees and Expenses, in the Notes to Financial Statements.
(a) The Net Annualized Expense Ratio reflected in the expense example above includes 0.08% ofnon-cash interest expense as shown in the Financial Statements. If the example excludednon-cash interest expense, Expenses Paid During Period would have been $0.00 for Actual Performance and $0.00 Hypothetical Performance. The additionalnon-cash interest expense does not reflect actual expenses paid by the Portfolio, but instead is offset by additional interest income recorded by the Portfolio in Tender Option Bonds Bond Transactions, in the Notes to Financial Statements for additional information regarding TOBs. (“TOB”) transactions accounted for as secured borrowing Refer to Note 5, Tender Option Bond Transactions, in the Notes to Financial Statements for additional information regarding TOBs.
| | | | | | |
| 24 | | PIMCO MANAGED ACCOUNTS TRUST | | | | |
Benchmark Descriptions
| | |
| Index | | Description |
| |
| Bloomberg Barclays U.S. Intermediate Credit Index | | The Bloomberg Barclays U.S. Intermediate Credit Index is an unmanaged index of publicly issued U.S. corporate and specified non-U.S. debentures and secured notes with intermediate maturities ranging from 1 to less than 10 years. To qualify, bonds must be SEC-registered. Securities must also meet specific liquidity and quality requirements. |
| |
| Bloomberg Barclays U.S. MBSFixed-Rate Index | | Bloomberg Barclays U.S. MBS Fixed Rate Index is an unmanaged index of mortgage-backed pass-through securities and hybrid ARM pools of Ginnie Mae (GNMA), Fannie Mae (FNMA), and Freddie Mac (FHLMC). The MBS Index is formed by grouping individual fixed rate MBS pools into generic aggregates. |
| |
Bloomberg Barclays U.S.
TIPS Index | | Bloomberg Barclays U.S. TIPS Index is an unmanaged index comprised of all U.S. Treasury Inflation-Protected Securities rated investment grade (Baa3 or better), have at least one year to final maturity, and at least $500 million par amount outstanding. |
| |
| Bloomberg Barclays 1-Year Municipal Bond Index | | The Bloomberg Barclays 1-Year Municipal Bond Index is the 1 Year (1-2) component of the Municipal Bond Index. The Index is a rules- based, market-value-weighted index engineered for the long term tax-exempt bond market. To be included in the Index, bonds must be rated investment-grade (Baa3/BBB- or higher) by at least two of the following ratings agencies: Moody’s, S&P and Fitch. If only two of the three agencies rate the security, the lower rating is used to determine index eligibility. If only one of the three agencies rates a security, the rating must be investment-grade. They must have an outstanding par value of at least $7 million and be issued as part of a transaction of at least $75 million. The bonds must be fixed rate, have a dated-date after December 31, 1990, and must be at least one year from their maturity date. Remarketed issues, taxable municipal bonds, bonds with floating rates, and derivatives, are excluded from the benchmark. |
| |
ICE BofAML 1-3 Year U.S. Treasury Index | | The ICE BofAML 1-3 Year U.S. Treasury Index is an unmanaged index comprised of U.S. Treasury securities, other than inflation-protection securities and STRIPS, with at least $1 billion in outstanding face value and a remaining term to final maturity of at least one year and less than three years. |
| * | It is not possible to invest directly in an unmanaged index. |
| | | | | | |
| | ANNUAL REPORT | | DECEMBER 31, 2018 | | 25 |
Financial Highlights
| | | | | | | | | | | | | | | | | | | | | | | | | | | | | | | | | | | | | | | | | | | | | |
| | | | | Investment Operations | | | | Less Distributions(b) |
| | | | | | | | | | | | | | | | | | | |
Selected Per Share Data for the Year or Period Ended^: | | Net Asset
Value Beginning
of Year
or Period | | Net Investment Income
(Loss)(a) | | Net
Realized/ Unrealized Gain (Loss) | | Total | | | | From Net Investment Income | | From Net Realized Capital Gains | | Tax Basis Return of Capital | | Total |
| | | | | | | | | |
Series C | | | | | | | | | | | | | | | | | | | | | | | | | | | | | | | | | | | | | | | | | | | | | |
| | | | | | | | | |
12/31/2018 | | | $ | 10.30 | | | | $ | 0.36 | | | | $ | (0.34 | ) | | | $ | 0.02 | | | | | | | | | $ | (0.38 | ) | | | $ | 0.00 | | | | $ | 0.00 | | | | $ | (0.38 | ) |
| | | | | | | | | |
12/31/2017 | | | | 10.05 | | | | | 0.39 | | | | | 0.25 | | | | | 0.64 | | | | | | | | | | (0.29 | ) | | | | 0.00 | | | | | (0.10 | ) | | | | (0.39 | ) |
| | | | | | | | | |
12/31/2016 | | | | 10.42 | | | | | 0.44 | | | | | (0.36 | ) | | | | 0.08 | | | | | | | | | | (0.38 | ) | | | | 0.00 | | | | | (0.07 | ) | | | | (0.45 | ) |
| | | | | | | | | |
11/01/2015 - 12/31/2015(e) | | | | 11.20 | | | | | 0.09 | | | | | (0.11 | ) | | | | (0.02 | ) | | | | | | | | | (0.76 | ) | | | | 0.00 | | | | | 0.00 | | | | | (0.76 | )(f) |
| | | | | | | | | |
10/31/2015 | | | | 12.29 | | | | | 0.53 | | | | | (0.48 | ) | | | | 0.05 | | | | | | | | | | (0.56 | ) | | | | (0.58 | ) | | | | 0.00 | | | | | (1.14 | ) |
| | | | | | | | | |
10/31/2014 | | | | 13.11 | | | | | 0.51 | | | | | 0.05 | | | | | 0.56 | | | | | | | | | | (0.55 | ) | | | | (0.83 | ) | | | | 0.00 | | | | | (1.38 | ) |
| | | | | | | | | |
Series LD | | | | | | | | | | | | | | | | | | | | | | | | | | | | | | | | | | | | | | | | | | | | | |
| | | | | | | | | |
12/31/2018 | | | $ | 9.73 | | | | $ | 0.38 | | | | $ | (0.28 | ) | | | $ | 0.10 | | | | | | | | | $ | (0.42 | ) | | | $ | 0.00 | | | | $ | (0.01 | ) | | | $ | (0.43 | ) |
| | | | | | | | | |
12/31/2017 | | | | 9.77 | | | | | 0.37 | | | | | (0.02 | ) | | | | 0.35 | | | | | | | | | | (0.39 | ) | | | | 0.00 | | | | | 0.00 | | | | | (0.39 | ) |
| | | | | | | | | |
12/31/2016 | | | | 9.83 | | | | | 0.37 | | | | | 0.03 | | | | | 0.40 | | | | | | | | | | (0.46 | ) | | | | 0.00 | | | | | 0.00 | | | | | (0.46 | ) |
| | | | | | | | | |
11/01/2015 - 12/31/2015(e) | | | | 10.02 | | | | | 0.06 | | | | | (0.03 | ) | | | | 0.03 | | | | | | | | | | (0.10 | ) | | | | (0.12 | ) | | | | 0.00 | | | | | (0.22 | )(f) |
| | | | | | | | | |
10/31/2015 | | | | 10.20 | | | | | 0.31 | | | | | 0.00 | | | | | 0.31 | | | | | | | | | | (0.38 | ) | | | | (0.11 | ) | | | | 0.00 | | | | | (0.49 | ) |
| | | | | | | | | |
12/20/2013 - 10/31/2014 | | | | 10.00 | | | | | 0.19 | | | | | 0.22 | | | | | 0.41 | | | | | | | | | | (0.21 | ) | | | | 0.00 | | | | | 0.00 | | | | | (0.21 | ) |
| | | | | | | | | |
Series M | | | | | | | | | | | | | | | | | | | | | | | | | | | | | | | | | | | | | | | | | | | | | |
| | | | | | | | | |
12/31/2018 | | | $ | 10.31 | | | | $ | 0.46 | | | | $ | (0.24 | ) | | | $ | 0.22 | | | | | | | | | $ | (0.39 | ) | | | $ | 0.00 | | | | $ | 0.00 | | | | $ | (0.39 | ) |
| | | | | | | | | |
12/31/2017 | | | | 9.95 | | | | | 0.45 | | | | | 0.49 | | | | | 0.94 | | | | | | | | | | (0.49 | ) | | | | (0.09 | ) | | | | 0.00 | | | | | (0.58 | ) |
| | | | | | | | | |
12/31/2016 | | | | 9.87 | | | | | 0.58 | | | | | 0.27 | | | | | 0.85 | | | | | | | | | | (0.49 | ) | | | | (0.28 | ) | | | | 0.00 | | | | | (0.77 | ) |
| | | | | | | | | |
11/01/2015 - 12/31/2015(e) | | | | 10.06 | | | | | 0.10 | | | | | (0.11 | ) | | | | (0.01 | ) | | | | | | | | | (0.18 | ) | | | | 0.00 | | | | | 0.00 | | | | | (0.18 | )(f) |
| | | | | | | | | |
10/31/2015 | | | | 10.78 | | | | | 0.50 | | | | | (0.45 | ) | | | | 0.05 | | | | | | | | | | (0.50 | ) | | | | (0.27 | ) | | | | 0.00 | | | | | (0.77 | ) |
| | | | | | | | | |
10/31/2014 | | | | 10.86 | | | | | 0.43 | | | | | 0.07 | | | | | 0.50 | | | | | | | | | | (0.40 | ) | | | | (0.18 | ) | | | | 0.00 | | | | | (0.58 | ) |
| | | | | | | | | |
Series R | | | | | | | | | | | | | | | | | | | | | | | | | | | | | | | | | | | | | | | | | | | | | |
| | | | | | | | | |
12/31/2018 | | | $ | 9.26 | | | | $ | 0.37 | | | | $ | (0.60 | ) | | | $ | (0.23 | ) | | | | | | | | $ | (0.35 | ) | | | $ | 0.00 | | | | $ | 0.00 | | | | $ | (0.35 | ) |
| | | | | | | | | |
12/31/2017 | | | | 9.13 | | | | | 0.35 | | | | | 0.11 | | | | | 0.46 | | | | | | | | | | (0.17 | ) | | | | 0.00 | | | | | (0.16 | ) | | | | (0.33 | ) |
| | | | | | | | | |
12/31/2016 | | | | 8.94 | | | | | 0.35 | | | | | 0.16 | | | | | 0.51 | | | | | | | | | | (0.13 | ) | | | | 0.00 | | | | | (0.19 | ) | | | | (0.32 | ) |
| | | | | | | | | |
11/01/2015 - 12/31/2015(e) | | | | 9.46 | | | | | 0.01 | | | | | (0.18 | ) | | | | (0.17 | ) | | | | | | | | | (0.33 | ) | | | | 0.00 | | | | | (0.02 | ) | | | | (0.35 | )(f) |
| | | | | | | | | |
10/31/2015 | | | | 10.47 | | | | | 0.19 | | | | | (0.62 | ) | | | | (0.43 | ) | | | | | | | | | (0.58 | ) | | | | 0.00 | | | | | 0.00 | | | | | (0.58 | ) |
| | | | | | | | | |
10/31/2014 | | | | 10.52 | | | | | 0.37 | | | | | 0.01 | | | | | 0.38 | | | | | | | | | | (0.18 | ) | | | | (0.25 | ) | | | | 0.00 | | | | | (0.43 | ) |
| | | | | | |
| 26 | | PIMCO MANAGED ACCOUNTS TRUST | | | | See Accompanying Notes |
| | | | | | | | | | | | | | | | | | | | | | | | | | | | | | | | | | | | | | | | | | | |
| | | | | Ratios/Supplemental Data |
| | | | | | | Ratios to Average Net Assets | | |
Net Asset Value End of Year or Period | | Total
Return(c) | | Net Assets End of Year or Period (000s) | | Expenses(d) | | Expenses Excluding Waivers(d) | | Expenses Excluding Interest Expense(d) | | Expenses Excluding Interest Expense and
Waivers(d) | | Net Investment Income
(Loss) | | Portfolio Turnover
Rate |
| | | | | | | | |
| | | | | | | | | | | | | | | | | | | | | | | | | | | | | | | | | | | | | | | | | | | | |
| | | | | | | | |
| | $ | 9.94 | | | | | 0.21 | % | | | $ | 1,185,003 | | | | | 0.31 | % | | | | 0.31 | % | | | | 0.00 | % | | | | 0.00 | % | | | | 3.62 | % | | | | 450 | % |
| | | | | | | | |
| | | 10.30 | | | | | 6.43 | | | | | 1,310,388 | | | | | 0.43 | | | | | 0.43 | | | | | 0.00 | | | | | 0.00 | | | | | 3.79 | | | | | 366 | |
| | | | | | | | |
| | | 10.05 | | | | | 0.84 | | | | | 1,299,845 | | | | | 0.13 | | | | | 0.13 | | | | | 0.00 | | | | | 0.00 | | | | | 4.35 | | | | | 259 | |
| | | | | | | | |
| | | 10.42 | | | | | (0.17 | ) | | | | 1,429,703 | | | | | 0.11 | * | | | | 0.11 | * | | | | 0.00 | * | | | | 0.00 | * | | | | 4.54 | * | | | | 8 | |
| | | | | | | | |
| | | 11.20 | | | | | 0.43 | | | | | 1,604,425 | | | | | 0.03 | | | | | 0.03 | | | | | 0.00 | | | | | 0.00 | | | | | 4.56 | | | | | 95 | |
| | | | | | | | |
| | | 12.29 | | | | | 4.72 | | | | | 2,353,773 | | | | | 0.01 | | | | | 0.01 | | | | | 0.00 | | | | | 0.00 | | | | | 4.11 | | | | | 82 | |
| | | | | | | | |
| | | | | | | | | | | | | | | | | | | | | | | | | | | | | | | | | | | | | | | | | | | | |
| | | | | | | | |
| | $ | 9.40 | | | | | 1.07 | % | | | $ | 82,684 | | | | | 3.02 | % | | | | 3.02 | % | | | | 0.00 | % | | | | 0.00 | % | | | | 3.94 | % | | | | 290 | % |
| | | | | | | | |
| | | 9.73 | | | | | 3.64 | | | | | 86,101 | | | | | 1.30 | | | | | 1.30 | | | | | 0.00 | | | | | 0.00 | | | | | 3.76 | | | | | 230 | |
| | | | | | | | |
| | | 9.77 | | | | | 4.17 | | | | | 31,609 | | | | | 0.69 | | | | | 0.69 | | | | | 0.00 | | | | | 0.00 | | | | | 3.83 | | | | | 1395 | |
| | | | | | | | |
| | | 9.83 | | | | | 0.29 | | | | | 31,900 | | | | | 0.32 | * | | | | 0.32 | * | | | | 0.00 | * | | | | 0.00 | * | | | | 3.48 | * | | | | 44 | |
| | | | | | | | |
| | | 10.02 | | | | | 3.11 | | | | | 28,100 | | | | | 0.24 | | | | | 0.24 | | | | | 0.00 | | | | | 0.00 | | | | | 3.10 | | | | | 1,135 | |
| | | | | | | | |
| | | 10.20 | | | | | 4.08 | | | | | 9,070 | | | | | 0.10 | * | | | | 0.10 | * | | | | 0.00 | * | | | | 0.00 | * | | | | 2.15 | * | | | | 8,278 | |
| | | | | | | | |
| | | | | | | | | | | | | | | | | | | | | | | | | | | | | | | | | | | | | | | | | | | | |
| | | | | | | | |
| | $ | 10.14 | | | | | 2.23 | % | | | $ | 1,241,128 | | | | | 0.31 | % | | | | 0.31 | % | | | | 0.00 | % | | | | 0.00 | % | | | | 4.58 | % | | | | 495 | % |
| | | | | | | | |
| | | 10.31 | | | | | 9.60 | | | | | 1,331,955 | | | | | 0.24 | | | | | 0.24 | | | | | 0.00 | | | | | 0.00 | | | | | 4.35 | | | | | 556 | |
| | | | | | | | |
| | | 9.95 | | | | | 8.78 | | | | | 1,324,624 | | | | | 0.16 | | | | | 0.16 | | | | | 0.00 | | | | | 0.00 | | | | | 5.65 | | | | | 582 | |
| | | | | | | | |
| | | 9.87 | | | | | (0.07 | ) | | | | 1,487,909 | | | | | 0.14 | * | | | | 0.14 | * | | | | 0.00 | * | | | | 0.00 | * | | | | 5.60 | * | | | | 68 | |
| | | | | | | | |
| | | 10.06 | | | | | 0.51 | | | | | 1,622,393 | | | | | 0.06 | | | | | 0.06 | | | | | 0.00 | | | | | 0.00 | | | | | 4.83 | | | | | 473 | |
| | | | | | | | |
| | | 10.78 | | | | | 4.78 | | | | | 2,332,201 | | | | | 0.04 | | | | | 0.04 | | | | | 0.00 | | | | | 0.00 | | | | | 4.01 | | | | | 587 | |
| | | | | | | | |
| | | | | | | | | | | | | | | | | | | | | | | | | | | | | | | | | | | | | | | | | | | | |
| | | | | | | | |
| | $ | 8.68 | | | | | (2.52 | )% | | | $ | 115,407 | | | | | 1.29 | % | | | | 1.29 | % | | | | 0.00 | % | | | | 0.00 | % | | | | 4.16 | % | | | | 231 | % |
| | | | | | | | |
| | | 9.26 | | | | | 5.16 | | | | | 142,081 | | | | | 0.62 | | | | | 0.62 | | | | | 0.00 | | | | | 0.00 | | | | | 3.81 | | | | | 225 | |
| | | | | | | | |
| | | 9.13 | | | | | 5.68 | | | | | 150,112 | | | | | 0.42 | | | | | 0.42 | | | | | 0.00 | | | | | 0.00 | | | | | 3.81 | | | | | 311 | |
| | | | | | | | |
| | | 8.94 | | | | | (1.76 | ) | | | | 157,218 | | | | | 0.28 | * | | | | 0.28 | * | | | | 0.00 | * | | | | 0.00 | * | | | | 0.87 | * | | | | 16 | |
| | | | | | | | |
| | | 9.46 | | | | | (4.22 | ) | | | | 174,222 | | | | | 0.16 | | | | | 0.16 | | | | | 0.00 | | | | | 0.00 | | | | | 1.89 | | | | | 126 | |
| | | | | | | | |
| | | 10.47 | | | | | 3.82 | | | | | 215,671 | | | | | 0.07 | | | | | 0.07 | | | | | 0.00 | | | | | 0.00 | | | | | 3.55 | | | | | 88 | |
| | | | | | |
| | ANNUAL REPORT | | DECEMBER 31, 2018 | | 27 |
Financial Highlights(Cont.)
| | | | | | | | | | | | | | | | | | | | | | | | | | | | | | | | | | | | | | | | | | | | | |
| | | | | Investment Operations | | | | Less Distributions(b) |
| | | | | | | | | | | | | | | | | | | |
Selected Per Share Data for the Year or Period Ended^: | | Net Asset
Value Beginning
of Year
or Period | | Net Investment Income
(Loss)(a) | | Net
Realized/ Unrealized Gain (Loss) | | Total | | | | From Net Investment Income | | From Net Realized Capital Gains | | Tax Basis Return of Capital | | Total |
| | | | | | | | | |
Series TE | | | | | | | | | | | | | | | | | | | | | | | | | | | | | | | | | | | | | | | | | | | | | |
| | | | | | | | | |
12/31/2018 | | | $ | 10.22 | | | | $ | 0.38 | | | | $ | (0.28 | ) | | | $ | 0.10 | | | | | | | | | $ | (0.38 | ) | | | $ | 0.00 | | | | $ | 0.00 | | | | $ | (0.38 | ) |
| | | | | | | | | |
12/31/2017 | | | | 9.75 | | | | | 0.36 | | | | | 0.47 | | | | | 0.83 | | | | | | | | | | (0.36 | ) | | | | 0.00 | | | | | 0.00 | | | | | (0.36 | ) |
| | | | | | | | | |
12/31/2016 | | | | 10.02 | | | | | 0.32 | | | | | (0.27 | ) | | | | 0.05 | | | | | | | | | | (0.32 | ) | | | | 0.00 | | | | | 0.00 | | | | | (0.32 | ) |
| | | | | | | | | |
11/01/2015 - 12/31/2015(e) | | | | 9.85 | | | | | 0.06 | | | | | 0.17 | | | | | 0.23 | | | | | | | | | | (0.06 | ) | | | | 0.00 | | | | | 0.00 | | | | | (0.06 | )(f) |
| | | | | | | | | |
10/31/2015 | | | | 9.90 | | | | | 0.28 | | | | | (0.06 | ) | | | | 0.22 | | | | | | | | | | (0.27 | ) | | | | 0.00 | | | | | 0.00 | | | | | (0.27 | ) |
| | | | | | | | | |
10/31/2014 | | | | 9.64 | | | | | 0.26 | | | | | 0.24 | | | | | 0.50 | | | | | | | | | | (0.24 | ) | | | | 0.00 | | | | | 0.00 | | | | | (0.24 | ) |
| ^ | A zero balance may reflect actual amounts rounding to less than $0.01 or 0.01%. |
| (a) | Per share amounts based on average number of shares outstanding during the year or period. |
| (b) | The tax characterization of distributions is determined in accordance with Federal income tax regulations. See Note 2, Distributions to Shareholders, in the Notes to Financial Statements for more information. |
| (c) | The calculation assumes that all income dividends and capital gain distributions, if any, have been reinvested. Total return does not reflect broker commissions or “wrap fee” charges. Total investment return for a period of less than one year is not annualized. |
| (d) | The financial statements reflect the fact that no investment management fees or expenses are incurred by the Portfolios. The Portfolios are an integral part of“wrap-fee” programs sponsored by investment advisers and/or broker-dealers unaffiliated with the Portfolios and PIMCO. Participants in these programs pay a “wrap” fee to the sponsor of the program. |
| (e) | Fiscal year end changed from October 31st to December 31st. |
| (f) | Total distributions for the period ended December 31, 2015 may be lower than prior fiscal years due to fiscal year end changes resulting in a reduction of the amount of days in the period ended December 31, 2015. |
| | | | | | |
| 28 | | PIMCO MANAGED ACCOUNTS TRUST | | | | See Accompanying Notes |
| | | | | | | | | | | | | | | | | | | | | | | | | | | | | | | | | | | | | | | | | | | |
| | | | | Ratios/Supplemental Data |
| | | | | | | Ratios to Average Net Assets | | |
Net Asset Value End of Year or Period | | Total
Return(c) | | Net Assets End of Year or
Period (000s) | | Expenses(d) | | Expenses Excluding Waivers(d) | | Expenses Excluding Interest Expense(d) | | Expenses Excluding Interest Expense and
Waivers(d) | | Net Investment Income
(Loss) | | Portfolio Turnover
Rate |
| | | | | | | | |
| | | | | | | | | | | | | | | | | | | | | | | | | | | | | | | | | | | | | | | | | | | | |
| | | | | | | | |
| | $ | 9.94 | | | | | 0.97 | % | | | $ | 82,521 | | | | | 0.08 | % | | | | 0.08 | % | | | | 0.00 | % | | | | 0.00 | % | | | | 3.79 | % | | | | 57 | % |
| | | | | | | | |
| | | 10.22 | | | | | 8.61 | | | | | 91,086 | | | | | 0.04 | | | | | 0.04 | | | | | 0.00 | | | | | 0.00 | | | | | 3.64 | | | | | 86 | |
| | | | | | | | |
| | | 9.75 | | | | | 0.40 | | | | | 90,288 | | | | | 0.00 | | | | | 0.00 | | | | | 0.00 | | | | | 0.00 | | | | | 3.14 | | | | | 193 | |
| | | | | | | | |
| | | 10.02 | | | | | 2.33 | | | | | 92,821 | | | | | 0.00 | * | | | | 0.00 | * | | | | 0.00 | * | | | | 0.00 | * | | | | 3.43 | * | | | | 5 | |
| | | | | | | | |
| | | 9.85 | | | | | 2.25 | | | | | 91,524 | | | | | 0.00 | | | | | 0.00 | | | | | 0.00 | | | | | 0.00 | | | | | 2.91 | | | | | 72 | |
| | | | | | | | |
| | | 9.90 | | | | | 5.27 | | | | | 95,841 | | | | | 0.00 | | | | | 0.00 | | | | | 0.00 | | | | | 0.00 | | | | | 2.67 | | | | | 8 | |
| | | | | | |
| | ANNUAL REPORT | | DECEMBER 31, 2018 | | 29 |
Statements of Assets and Liabilities
| | | | | | | | |
| (Amounts in thousands†, except per share amounts) | | Series C | | | Series LD | |
| | |
Assets: | | | | | | | | |
| | |
Investments, at value | | | | | | | | |
Investments in securities* | | $ | 1,860,760 | | | $ | 209,231 | |
Investments in Affiliates | | | 16,339 | | | | 5,317 | |
Financial Derivative Instruments | | | | | | | | |
Exchange-traded or centrally cleared | | | 754 | | | | 221 | |
Over the counter | | | 2,196 | | | | 331 | |
Cash | | | 1 | | | | 0 | |
Deposits with counterparty | | | 19,858 | | | | 1,683 | |
Foreign currency, at value | | | 1,941 | | | | 277 | |
Receivable for investments sold | | | 433 | | | | 13,932 | |
Receivable for investments sold on a delayed-delivery basis | | | 0 | | | | 0 | |
Receivable for TBA investments sold | | | 669,446 | | | | 0 | |
Receivable for Portfolio shares sold | | | 1,205 | | | | 80 | |
Interest and/or dividends receivable | | | 10,747 | | | | 1,685 | |
Dividends receivable from Affiliates | | | 6 | | | | 1 | |
Other assets | | | 17 | | | | 0 | |
| | |
Total Assets | | | 2,583,703 | | | | 232,758 | |
| | |
Liabilities: | | | | | | | | |
| | |
Borrowings & Other Financing Transactions | | | | | | | | |
Payable for reverse repurchase agreements | | $ | 53,852 | | | $ | 63,129 | |
Payable for sale-buyback transactions | | | 58,139 | | | | 82,997 | |
Payable for tender option bond floating rate certificates | | | 0 | | | | 0 | |
Financial Derivative Instruments | | | | | | | | |
Exchange-traded or centrally cleared | | | 2,053 | | | | 459 | |
Over the counter | | | 2,890 | | | | 471 | |
Payable for investments in Affiliates purchased | | | 6 | | | | 1 | |
Payable for TBA investments purchased | | | 1,263,512 | | | | 0 | |
Deposits from counterparty | | | 11,830 | | | | 0 | |
Payable for Portfolio shares redeemed | | | 2,675 | | | | 0 | |
Distributions payable | | | 3,743 | | | | 196 | |
Overdraft due to custodian | | | 0 | | | | 2,821 | |
Other liabilities | | | 0 | | | | 0 | |
| | |
Total Liabilities | | | 1,398,700 | | | | 150,074 | |
| | |
Net Assets | | $ | 1,185,003 | | | $ | 82,684 | |
| | |
Net Assets Consist of: | | | | | | | | |
| | |
Shares of beneficial interest of $0.001 par value (unlimited number authorized) | | $ | 119 | | | $ | 9 | |
| | |
Paid in capital in excess of par | | | 1,405,672 | | | | 86,708 | |
Distributable earnings (accumulated loss) | | | (220,788 | ) | | | (4,033 | ) |
| | |
Net Assets | | $ | 1,185,003 | | | $ | 82,684 | |
| | |
Shares Issued and Outstanding | | | 119,217 | | | | 8,797 | |
| | |
Net Asset Value Per Share Outstanding | | $ | 9.94 | | | $ | 9.40 | |
| | |
Cost of investments in securities | | $ | 1,873,680 | | | $ | 210,967 | |
Cost of investments in Affiliates | | $ | 16,339 | | | $ | 5,317 | |
Cost of foreign currency held | | $ | 1,989 | | | $ | 281 | |
Cost or premiums of financial derivative instruments, net | | $ | 1,740 | | | $ | (813 | ) |
| | |
* Includes repurchase agreements of: | | $ | 33,175 | | | $ | 0 | |
| † | A zero balance may reflect actual amounts rounding to less than one thousand. |
| | | | | | |
| 30 | | PIMCO MANAGED ACCOUNTS TRUST | | | | See Accompanying Notes |
| | | | | | | | | | |
| Series M | | | Series R | | | Series TE | |
| | |
| | | | | | | | | | |
| | |
| | | | | | | | | | | |
| $ | 1,848,651 | | | $ | 206,662 | | | $ | 83,870 | |
| | 23,504 | | | | 0 | | | | 1,380 | |
| | | | | | | | | | | |
| | 1,002 | | | | 294 | | | | 0 | |
| | 610 | | | | 1,037 | | | | 0 | |
| | 1 | | | | 1 | | | | 1 | |
| | 3,169 | | | | 2,670 | | | | 174 | |
| | 1,598 | | | | 893 | | | | 0 | |
| | 54 | | | | 782 | | | | 0 | |
| | 0 | | | | 9,942 | | | | 0 | |
| | 556,889 | | | | 7,922 | | | | 0 | |
| | 920 | | | | 392 | | | | 0 | |
| | 7,144 | | | | 819 | | | | 794 | |
| | 9 | | | | 0 | | | | 2 | |
| | 17 | | | | 0 | | | | 0 | |
| | |
| | 2,443,568 | | | | 231,414 | | | | 86,221 | |
| | |
| | | | | | | | | | |
| | |
| | | | | | | | | | | |
| $ | 37,469 | | | $ | 0 | | | $ | 0 | |
| | 0 | | | | 83,040 | | | | 0 | |
| | 0 | | | | 0 | | | | 3,391 | |
| | | | | | | | | | | |
| | 846 | | | | 468 | | | | 45 | |
| | 2,035 | | | | 766 | | | | 0 | |
| | 9 | | | | 0 | | | | 2 | |
| | 1,146,961 | | | | 30,681 | | | | 0 | |
| | 9,192 | | | | 691 | | | | 0 | |
| | 1,811 | | | | 38 | | | | 0 | |
| | 4,116 | | | | 303 | | | | 261 | |
| | 0 | | | | 0 | | | | 0 | |
| | 1 | | | | 20 | | | | 1 | |
| | |
| | 1,202,440 | | | | 116,007 | | | | 3,700 | |
| | |
| $ | 1,241,128 | | | $ | 115,407 | | | $ | 82,521 | |
| | |
| | | | | | | | | | |
| | |
$ | 122 | | | $ | 13 | | | $ | 8 | |
| | |
| | 1,223,948 | | | | 157,463 | | | | 81,705 | |
| | 17,058 | | | | (42,069 | ) | | | 808 | |
| | |
| $ | 1,241,128 | | | $ | 115,407 | | | $ | 82,521 | |
| | |
| | 122,341 | | | | 13,290 | | | | 8,299 | |
| | |
| $ | 10.14 | | | $ | 8.68 | | | $ | 9.94 | |
| | |
| $ | 1,814,437 | | | $ | 211,803 | | | $ | 81,563 | |
| $ | 23,504 | | | $ | 0 | | | $ | 1,380 | |
| $ | 1,584 | | | $ | 896 | | | $ | 0 | |
| $ | (1,949 | ) | | $ | (612 | ) | | $ | 0 | |
| | |
| $ | 29,446 | | | $ | 779 | | | $ | 339 | |
| | | | | | |
| | ANNUAL REPORT | | DECEMBER 31, 2018 | | 31 |
Statements of Operations
| | | | | | | | |
| Year Ended December 31, 2018 | | | | | | |
| (Amounts in thousands†) | | Series C | | | Series LD | |
| | |
Investment Income: | | | | | | | | |
| | |
Interest | | $ | 50,408 | | | $ | 5,619 | |
Dividends from Investments in Affiliates | | | 36 | | | | 7 | |
Total Income | | | 50,444 | | | | 5,626 | |
| | |
Expenses: | | | | | | | | |
| | |
Interest expense | | | 3,915 | | | | 2,442 | |
Miscellaneous expense | | | 10 | | | | 0 | |
Total Expenses | | | 3,925 | | | | 2,442 | |
| | |
Net Investment Income (Loss) | | | 46,519 | | | | 3,184 | |
| | |
Net Realized Gain (Loss): | | | | | | | | |
| | |
Investments in securities | | | (25,149 | ) | | | (327 | ) |
Investments in Affiliates | | | 2 | | | | 0 | |
Exchange-traded or centrally cleared financial derivative instruments | | | 1,403 | | | | 329 | |
Over the counter financial derivative instruments | | | 10,187 | | | | (55 | ) |
Short sales | | | 0 | | | | 76 | |
Foreign currency | | | 1,069 | | | | 90 | |
| | |
Net Realized Gain (Loss) | | | (12,488 | ) | | | 113 | |
| | |
Net Change in Unrealized Appreciation (Depreciation): | | | | | | | | |
| | |
Investments in securities | | | (31,945 | ) | | | (2,265 | ) |
Exchange-traded or centrally cleared financial derivative instruments | | | (229 | ) | | | (352 | ) |
Over the counter financial derivative instruments | | | 1,257 | | | | 112 | |
Foreign currency assets and liabilities | | | (635 | ) | | | (1 | ) |
| | |
Net Change in Unrealized Appreciation (Depreciation) | | | (31,552 | ) | | | (2,506 | ) |
| | |
Net Increase (Decrease) in Net Assets Resulting from Operations | | $ | 2,479 | | | $ | 791 | |
| † | A zero balance may reflect actual amounts rounding to less than one thousand. |
| | | | | | |
| 32 | | PIMCO MANAGED ACCOUNTS TRUST | | | | See Accompanying Notes |
| | | | | | | | | | |
| | | | | | | | |
| Series M | | | Series R | | | Series TE | |
| | |
| | | | | | | | | | |
| | |
| $ | 63,473 | | | $ | 7,531 | | | $ | 3,351 | |
| | 199 | | | | 0 | | | | 38 | |
| | 63,672 | | | | 7,531 | | | | 3,389 | |
| | |
| | | | | | | | | | |
| | |
| | 4,046 | | | | 1,785 | | | | 67 | |
| | 13 | | | | 2 | | | | 0 | |
| | 4,059 | | | | 1,787 | | | | 67 | |
| | |
| | 59,613 | | | | 5,744 | | | | 3,322 | |
| | |
| | | | | | | | | | |
| | |
| | (29,104 | ) | | | (5,083 | ) | | | (118 | ) |
| | 4 | | | | 0 | | | | 1 | |
| | 715 | | | | 1,649 | | | | 348 | |
| | 9,705 | | | | 1,016 | | | | 33 | |
| | 0 | | | | 0 | | | | 0 | |
| | 762 | | | | (142 | ) | | | 0 | |
| | |
| | (17,918 | ) | | | (2,560) | | | | 264 | |
| | |
| | | | | | | | | | |
| | |
| | (17,258 | ) | | | (7,465 | ) | | | (2,471 | ) |
| | 2,166 | | | | (1,072 | ) | | | (270 | ) |
| | 1,266 | | | | 1,855 | | | | (23 | ) |
| | (15 | ) | | | (46 | ) | | | 0 | |
| | |
| | (13,841) | | | | (6,728 | ) | | | (2,764 | ) |
| | |
| $ | 27,854 | | | $ | (3,544 | ) | | $ | 822 | |
| | | | | | |
| | ANNUAL REPORT | | DECEMBER 31, 2018 | | 33 |
Statements of Changes in Net Assets
| | | | | | | | | | | | | | | | |
| | | Series C | | | Series LD | |
| (Amounts in thousands†) | | Year Ended
December 31,
2018 | | | Year Ended
December 31,
2017 | | | Year Ended
December 31,
2018 | | | Year Ended
December 31,
2017 | |
| | | | |
Increase (Decrease) in Net Assets from: | | | | | | | | | | | | | | | | |
| | | | |
Operations: | | | | | | | | | | | | | | | | |
| | | | |
Net investment income (loss) | | $ | 46,519 | | | $ | 50,444 | | | $ | 3,184 | | | $ | 2,333 | |
Net realized gain (loss) | | | (12,488 | ) | | | 33,348 | | | | 113 | | | | (115 | ) |
Net change in unrealized appreciation (depreciation) | | | (31,552 | ) | | | (1,066 | ) | | | (2,506 | ) | | | (161 | ) |
| | | | |
Net Increase (Decrease) in Net Assets Resulting from Operations | | | 2,479 | | | | 82,726 | | | | 791 | | | | 2,057 | |
| | | | |
Distributions to Shareholders: | | | | | | | | | | | | | | | | |
| | | | |
From net investment income and/or net realized capital gains* | | | (48,344 | ) | | | (37,777 | ) | | | (3,596 | ) | | | (2,436 | ) |
Tax basis return of capital | | | 0 | | | | (12,824 | ) | | | (45 | ) | | | 0 | |
| | | | |
Total Distributions(a) | | | (48,344 | ) | | | (50,601 | ) | | | (3,641 | ) | | | (2,436 | ) |
| | | | |
Portfolio Share Transactions: | | | | | | | | | | | | | | | | |
| | | | |
Receipts for shares sold | | | 263,167 | | | | 251,677 | | | | 28,931 | | | | 69,893 | |
Cost of shares redeemed | | | (342,687 | ) | | | (273,259 | ) | | | (29,498) | | | | (15,022 | ) |
Net increase (decrease) resulting from Portfolio share transactions | | | (79,520 | ) | | | (21,582 | ) | | | (567 | ) | | | 54,871 | |
| | | | |
Total Increase (Decrease) in Net Assets | | | (125,385 | ) | | | 10,543 | | | | (3,417 | ) | | | 54,492 | |
| | | | |
Net Assets: | | | | | | | | | | | | | | | | |
| | | | |
Beginning of year | | | 1,310,388 | | | | 1,299,845 | | | | 86,101 | | | | 31,609 | |
End of year | | $ | 1,185,003 | | | $ | 1,310,388 | | | $ | 82,684 | | | $ | 86,101 | |
| | | | |
Shares of Beneficial Interest: | | | | | | | | | | | | | | | | |
| | | | |
Shares sold | | | 26,203 | | | | 24,616 | | | | 3,001 | | | | 7,145 | |
Shares redeemed | | | (34,272 | ) | | | (26,658 | ) | | | (3,049 | ) | | | (1,537 | ) |
Net increase (decrease) in shares outstanding | | | (8,069 | ) | | | (2,042 | ) | | | (48 | ) | | | 5,608 | |
| † | A zero balance may reflect actual amounts rounding to less than one thousand. |
| * | See Note 2, New Accounting Pronouncements, in the Notes to Financial Statements for more information. |
| (a) | The tax characterization of distributions is determined in accordance with Federal income tax regulations. See Note 2, Distributions to Shareholders, in the Notes to Financial Statements for more information. |
| | | | | | |
| 34 | | PIMCO MANAGED ACCOUNTS TRUST | | | | See Accompanying Notes |
| | | | | | | | | | | | | | | | | | | | | | |
| Series M | | | Series R | | | Series TE | |
Year Ended
December 31,
2018 | | | Year Ended
December 31,
2017 | | | Year Ended
December 31,
2018 | | | Year Ended
December 31,
2017 | | | Year Ended
December 31,
2018 | | | Year Ended
December 31,
2017 | |
| | | | | |
|
|
| | | | | | | | | | | | | | | | | | | | |
| | | | | |
| | | | | | | | | | | | | | | | | | | | | | |
| | | | | |
| $ | 59,613 | | | $ | 58,990 | | | $ | 5,744 | | | $ | 5,856 | | | $ | 3,322 | | | $ | 3,254 | |
| | (17,918 | ) | | | 34,289 | | | | (2,560 | ) | | | (1,695 | ) | | | 264 | | | | 1,216 | |
| | (13,841 | ) | | | 31,011 | | | | (6,728 | ) | | | 3,492 | | | | (2,764 | ) | | | 3,032 | |
| | | | | |
| 27,854 | | | | 124,290 | | | | (3,544 | ) | | | 7,653 | | | | 822 | | | | 7,502 | |
| | | | | |
| | | | | | | | | | | | | | | | | | | | | | |
| | | | | |
| (50,390 | ) | | | (75,791 | ) | | | (5,447 | ) | | | (2,982 | ) | | | (3,282 | ) | | | (3,191 | ) |
| | 0 | | | | 0 | | | | 0 | | | | (2,658 | ) | | | 0 | | | | 0 | |
| | | | | |
| | (50,390 | ) | | | (75,791 | ) | | | (5,447 | ) | | | (5,640 | ) | | | (3,282 | ) | | | (3,191 | ) |
| | | | | |
| | | | | | | | | | | | | | | | | | | | | | |
| | | | | |
| | 219,211 | | | | 221,955 | | | | 29,900 | | | | 41,645 | | | | 20,898 | | | | 11,555 | |
| | (287,502 | ) | | | (263,123 | ) | | | (47,583 | ) | | | (51,689 | ) | | | (27,003 | ) | | | (15,068 | ) |
| (68,291 | ) | | | (41,168 | ) | | | (17,683 | ) | | | (10,044 | ) | | | (6,105 | ) | | | (3,513 | ) |
| | | | | |
| | (90,827 | ) | | | 7,331 | | | | (26,674 | ) | | | (8,031 | ) | | | (8,565 | ) | | | 798 | |
| | | | | |
| | | | | | | | | | | | | | | | | | | | | | |
| | | | | |
| | 1,331,955 | | | | 1,324,624 | | | | 142,081 | | | | 150,112 | | | | 91,086 | | | | 90,288 | |
| $ | 1,241,128 | | | $ | 1,331,955 | | | $ | 115,407 | | | $ | 142,081 | | | $ | 82,521 | | | $ | 91,086 | |
| | | | | |
| | | | | | | | | | | | | | | | | | | | | | |
| | | | | |
| | 21,664 | | | | 21,519 | | | | 3,333 | | | | 4,528 | | | | 2,080 | | | | 1,159 | |
| | (28,487 | ) | | | (25,432 | ) | | | (5,387 | ) | | | (5,624 | ) | | | (2,692 | ) | | | (1,514 | ) |
| | (6,823 | ) | | | (3,913 | ) | | | (2,054 | ) | | | (1,096 | ) | | | (612 | ) | | | (355 | ) |
| | | | | | |
| | ANNUAL REPORT | | DECEMBER 31, 2018 | | 35 |
Statements of Cash Flows
| | | | | | | | |
Year Ended December 31, 2018 (Amounts in thousands†) | | Series LD | | | Series R | |
| | |
Cash Flows Provided by (Used for) Operating Activities: | | | | | | | | |
| | |
Net increase (decrease) in net assets resulting from operations | | $ | 791 | | | $ | (3,544 | ) |
| | |
Adjustments to Reconcile Net Increase (Decrease) in Net Assets from Operations to Net Cash Provided by (Used for) Operating Activities: | | | | | | | | |
| | |
Purchases of long-term securities | | | (608,242 | ) | | | (537,831 | ) |
Proceeds from sales of long-term securities | | | 541,646 | | | | 568,071 | |
(Purchases) Proceeds from sales of short-term portfolio investments, net | | | 13,277 | | | | 3,482 | |
(Increase) decrease in deposits with counterparty | | | (406 | ) | | | (278 | ) |
(Increase) decrease in receivable for investments sold | | | (9,531 | ) | | | 41,884 | |
(Increase) decrease in interest and/or dividends receivable | | | (597 | ) | | | 3 | |
(Increase) decrease in dividends receivable from Affiliates | | | (1 | ) | | | 0 | |
Proceeds from (Payments on) exchange-traded or centrally cleared financial derivative instruments | | | 210 | | | | 790 | |
Proceeds from (Payments on) over the counter financial derivative instruments | | | (55 | ) | | | 1,125 | |
Increase (decrease) in payable for investments purchased | | | 1 | | | | 30,681 | |
Increase (decrease) in payable for unfunded loan commitments | | | 0 | | | | (69,658 | ) |
Increase (decrease) in deposits from counterparty | | | 0 | | | | 691 | |
Proceeds from (Payments on) short sales transactions, net | | | 76 | | | | (2,984 | ) |
Proceeds from (Payments on) foreign currency transactions | | | 89 | | | | (188 | ) |
Net Realized (Gain) Loss | | | | | | | | |
Investments in securities | | | 327 | | | | 5,083 | |
Exchange-traded or centrally cleared financial derivative instruments | | | (329 | ) | | | (1,649 | ) |
Over the counter financial derivative instruments | | | 55 | | | | (1,016 | ) |
Short sales | | | (76 | ) | | | 0 | |
Foreign currency | | | (90 | ) | | | 142 | |
Net Change in Unrealized (Appreciation) Depreciation | | | | | | | | |
Investments in securities | | | 2,265 | | | | 7,465 | |
Exchange-traded or centrally cleared financial derivative instruments | | | 352 | | | | 1,072 | |
Over the counter financial derivative instruments | | | (112 | ) | | | (1,855 | ) |
Foreign currency assets and liabilities | | | 1 | | | | 46 | |
Net amortization (accretion) on investments | | | 695 | | | | 6 | |
Net Cash Provided by (Used for) Operating Activities | | | (59,654 | ) | | | 41,538 | |
| | |
Cash Flows Received from (Used for) Financing Activities: | | | | | | | | |
| | |
Proceeds from shares sold | | | 29,128 | | | | 29,739 | |
Payments on shares redeemed | | | (29,499 | ) | | | (47,688 | ) |
Increase (decrease) in overdraft due to custodian | | | 2,821 | | | | 0 | |
Cash distributions paid | | | (3,670 | ) | | | (5,177 | ) |
Proceeds from reverse repurchase agreements | | | 905,405 | | | | 1,677 | |
Payments on reverse repurchase agreements | | | (907,398 | ) | | | (1,677 | ) |
Proceeds from sale-buyback transactions | | | 9,798,575 | | | | 1,817,745 | |
Payments on sale-buyback transactions | | | (9,735,591 | ) | | | (1,835,960 | ) |
Net Cash Received from (Used for) Financing Activities | | | 59,771 | | | | (41,341 | ) |
| | |
Net Increase (Decrease) in Cash and Foreign Currency | | | 117 | | | | 197 | |
| | |
Cash and Foreign Currency: | | | | | | | | |
| | |
Beginning of year | | | 160 | | | | 697 | |
End of year | | $ | 277 | | | $ | 894 | |
| | |
Supplemental Disclosure of Cash Flow Information: | | | | | | | | |
Interest expense paid during the year | | $ | 2,399 | | | $ | 1,803 | |
| † | A zero balance may reflect actual amounts rounding to less than one thousand. |
A Statement of Cash Flows is presented when a Portfolio has a significant amount of borrowing during the year, based on the average total borrowing outstanding in relation to total assets or when substantially all of a Portfolio’s investments are not classified as Level 1 or 2 in the fair value hierarchy.
| | | | | | |
| 36 | | PIMCO MANAGED ACCOUNTS TRUST | | | | See Accompanying Notes |
Schedule of InvestmentsPIMCO Fixed Income SHares: Series C
December 31, 2018
(Amounts in thousands*, except number of shares, contracts and units, if any)
| | | | | | | | | | | | |
| | | | | PRINCIPAL
AMOUNT
(000S) | | | | | MARKET
VALUE
(000S) | |
| INVESTMENTS IN SECURITIES 157.0% | |
| |
| LOAN PARTICIPATIONS AND ASSIGNMENTS 1.6% | |
|
Castlelake Aircraft Securitization Trust | |
3.967% due 07/15/2042 | | $ | | | 8,106 | | | $ | | | 8,053 | |
|
State of Rio de Janeiro | |
6.024% (LIBOR03M + 3.250%) due 12/20/2020 «~ | | | | | 3,900 | | | | | | 3,766 | |
|
Zephyrus Capital Aviation Partners LLC | |
4.605% due 10/15/2038 | | | | | 6,825 | | | | | | 6,794 | |
| | | | | | | | | | | | |
Total Loan Participations and Assignments (Cost $18,730) | | | 18,613 | |
| | | | |
| |
| CORPORATE BONDS & NOTES 51.8% | |
| |
| BANKING & FINANCE 37.6% | |
|
ABN AMRO Bank NV | |
4.800% due 04/18/2026 | | | | | 2,400 | | | | | | 2,401 | |
|
Air Lease Corp. | |
3.000% due 09/15/2023 | | | | | 3,150 | | | | | | 2,961 | |
|
American Tower Corp. | |
3.500% due 01/31/2023 | | | | | 3,375 | | | | | | 3,320 | |
4.700% due 03/15/2022 | | | | | 1,600 | | | | | | 1,644 | |
|
Banco Santander S.A. | |
6.250% due 09/11/2021 •(c)(d) | | EUR | | | 400 | | | | | | 451 | |
|
Bank of America Corp. | |
3.419% due 12/20/2028 • | | $ | | | 242 | | | | | | 226 | |
3.499% due 05/17/2022 • | | | | | 4,500 | | | | | | 4,502 | |
4.000% due 04/01/2024 | | | | | 271 | | | | | | 273 | |
4.100% due 07/24/2023 | | | | | 5,600 | | | | | | 5,679 | |
4.125% due 01/22/2024 | | | | | 15,100 | | | | | | 15,315 | |
5.875% due 03/15/2028 •(c) | | | | | 6,700 | | | | | | 6,108 | |
|
Barclays Bank PLC | |
7.625% due 11/21/2022 (d) | | | | | 12,100 | | | | | | 12,561 | |
10.000% due 05/21/2021 | | GBP | | | 300 | | | | | | 441 | |
14.000% due 06/15/2019 •(c) | | | | | 100 | | | | | | 134 | |
|
Barclays PLC | |
4.375% due 01/12/2026 | | $ | | | 1,500 | | | | | | 1,428 | |
6.500% due 09/15/2019 •(c)(d) | | EUR | | | 400 | | | | | | 448 | |
|
Blackstone CQP Holdco LP | |
6.500% due 03/20/2021 | | $ | | | 12,800 | | | | | | 12,897 | |
|
BNP Paribas S.A. | |
4.400% due 08/14/2028 | | | | | 14,700 | | | | | | 14,384 | |
|
BPCE S.A. | |
5.150% due 07/21/2024 | | | | | 1,000 | | | | | | 1,005 | |
|
Charles Schwab Corp. | |
4.625% due 03/01/2022 •(c) | | | | | 4,503 | | | | | | 4,132 | |
| | | | | | | | | | | | |
| | | | | PRINCIPAL
AMOUNT
(000S) | | | | | MARKET
VALUE
(000S) | |
5.000% due 12/01/2027 •(c) | | $ | | | 5,000 | | | $ | | | 4,208 | |
|
CIT Group, Inc. | |
4.750% due 02/16/2024 | | | | | 5,400 | | | | | | 5,204 | |
|
Cooperatieve Rabobank UA | |
4.375% due 08/04/2025 | | | | | 6,300 | | | | | | 6,199 | |
|
Credit Agricole S.A. | |
7.500% due 06/23/2026 •(c)(d) | | GBP | | | 100 | | | | | | 132 | |
|
Credit Suisse AG | |
6.500% due 08/08/2023 (d) | | $ | | | 7,216 | | | | | | 7,546 | |
|
Credit Suisse Group AG | |
7.500% due 07/17/2023 •(c)(d) | | | | | 10,000 | | | | | | 9,775 | |
|
Credit Suisse Group Funding Guernsey Ltd. | |
3.800% due 09/15/2022 | | | | | 400 | | | | | | 397 | |
|
Crown Castle International Corp. | |
5.250% due 01/15/2023 | | | | | 4,000 | | | | | | 4,157 | |
|
Deutsche Bank AG | |
4.250% due 10/14/2021 | | | | | 16,375 | | | | | | 16,020 | |
|
Doric Nimrod Air Finance Alpha Ltd. Pass-Through Trust | |
5.125% due 11/30/2024 | | | | | 5,896 | | | | | | 6,126 | |
|
FleetBoston Financial Corp. | |
6.875% due 01/15/2028 | | | | | 2,120 | | | | | | 2,438 | |
|
General Motors Financial Co., Inc. | |
4.250% due 05/15/2023 | | | | | 23,220 | | | | | | 22,734 | |
|
GLP Capital LP | |
5.250% due 06/01/2025 | | | | | 2,350 | | | | | | 2,339 | |
5.300% due 01/15/2029 | | | | | 3,150 | | | | | | 3,093 | |
|
Goldman Sachs Group, Inc. | |
3.500% due 01/23/2025 | | | | | 25,000 | | | | | | 23,727 | |
4.000% due 03/03/2024 | | | | | 16,700 | | | | | | 16,489 | |
|
Goodman U.S. Finance Three LLC | |
3.700% due 03/15/2028 | | | | | 3,200 | | | | | | 3,053 | |
|
HSBC Holdings PLC | |
4.583% due 06/19/2029 • | | | | | 4,000 | | | | | | 3,972 | |
5.875% due 09/28/2026 •(c)(d) | | GBP | | | 10,400 | | | | | | 12,713 | |
6.250% due 03/23/2023 •(c)(d) | | $ | | | 7,000 | | | | | | 6,571 | |
6.375% due 09/17/2024 •(c)(d) | | | | | 1,200 | | | | | | 1,119 | |
|
ING Groep NV | |
4.625% due 01/06/2026 | | | | | 5,000 | | | | | | 5,044 | |
|
Intesa Sanpaolo SpA | |
3.375% due 01/12/2023 | | | | | 10,400 | | | | | | 9,642 | |
|
JPMorgan Chase & Co. | |
3.625% due 05/13/2024 | | | | | 900 | | | | | | 895 | |
5.990% (US0003M + 3.470%) due 01/30/2019 ~(c) | | | 22,164 | | | | | | 21,942 | |
|
Karntner Ausgleichszahlungs-Fonds | |
0.000% due 01/01/2023 « | | EUR | | | 1,402 | | | | | | 83 | |
| | | | | | |
| See Accompanying Notes | | ANNUAL REPORT | | DECEMBER 31, 2018 | | 37 |
Schedule of InvestmentsPIMCO Fixed Income SHares: Series C(Cont.)
| | | | | | | | | | | | |
| | | | | PRINCIPAL
AMOUNT
(000S) | | | | | MARKET
VALUE
(000S) | |
|
Lincoln Finance Ltd. | |
6.875% due 04/15/2021 | | EUR | | | 3,300 | | | $ | | | 3,873 | |
|
Lloyds Banking Group PLC | |
7.500% due 09/27/2025 •(c)(d) | | $ | | | 7,100 | | | | | | 6,871 | |
|
MetLife Capital Trust | |
7.875% due 12/15/2067 | | | | | 600 | | | | | | 683 | |
|
Morgan Stanley | |
3.700% due 10/23/2024 | | | | | 10,000 | | | | | | 9,841 | |
3.737% due 04/24/2024 • | | | | | 6,400 | | | | | | 6,357 | |
3.875% due 04/29/2024 | | | | | 1,000 | | | | | | 996 | |
4.000% due 07/23/2025 | | | | | 6,900 | | | | | | 6,816 | |
|
Navient Corp. | |
5.875% due 03/25/2021 | | | | | 5,255 | | | | | | 5,051 | |
7.250% due 01/25/2022 | | | | | 12,700 | | | | | | 12,303 | |
8.000% due 03/25/2020 | | | | | 1,950 | | | | | | 1,986 | |
|
Oversea-Chinese Banking Corp. Ltd. | |
3.090% (US0003M + 0.450%)
due 05/17/2021 ~ | | | 7,700 | | | | | | 7,698 | |
|
Royal Bank of Scotland Group PLC | |
7.500% due 08/10/2020 •(c)(d) | | | | | 1,800 | | | | | | 1,787 | |
8.625% due 08/15/2021 •(c)(d) | | | | | 17,400 | | | | | | 18,052 | |
|
Santander UK Group Holdings PLC | |
2.875% due 08/05/2021 | | | | | 3,100 | | | | | | 2,994 | |
|
SLM Student Loan Trust | |
1.450% (BP0003M + 0.550%) due 12/15/2039 ~ | | GBP | | | 7,810 | | | | | | 9,471 | |
|
Springleaf Finance Corp. | |
6.125% due 05/15/2022 | | $ | | | 7,700 | | | | | | 7,505 | |
|
State Street Corp. | |
5.625% due 12/15/2023 •(c) | | | | | 14,000 | | | | | | 13,247 | |
|
Tesco Property Finance PLC | |
5.411% due 07/13/2044 | | GBP | | | 386 | | | | | | 534 | |
5.744% due 04/13/2040 | | | | | 1,068 | | | | | | 1,536 | |
5.801% due 10/13/2040 | | | | | 6,945 | | | | | | 10,061 | |
|
UBS AG | |
4.750% due 02/12/2026 •(d) | | EUR | | | 400 | | | | | | 486 | |
7.625% due 08/17/2022 (d) | | $ | | | 4,000 | | | | | | 4,270 | |
|
Wells Fargo & Co. | |
3.450% due 02/13/2023 | | | | | 5,400 | | | | | | 5,291 | |
3.757% (US0003M + 1.230%) due 10/31/2023 ~ | | | | | 10,000 | | | | | | 9,976 | |
6.558% (US0003M + 3.770%) due 03/15/2019 ~(c) | | | | | 12,417 | | | | | | 12,355 | |
| | | | | | | | | | | | |
| | | | | | | | | | | 445,968 | |
| | | | | | | | | | | | |
| |
| | | | | | | | | | | | |
| | | | | PRINCIPAL
AMOUNT
(000S) | | | | | MARKET
VALUE
(000S) | |
| INDUSTRIALS 11.6% | |
|
Bacardi Ltd. | |
4.450% due 05/15/2025 | | $ | | | 5,000 | | | $ | | | 4,942 | |
|
Bayer U.S. Finance LLC | |
4.375% due 12/15/2028 | | | | | 6,900 | | | | | | 6,605 | |
|
BMW U.S. Capital LLC | |
3.118% (US0003M + 0.500%) due 08/13/2021 ~ | | | | | 15,300 | | | | | | 15,160 | |
|
Braskem Finance Ltd. | |
5.750% due 04/15/2021 | | | | | 1,600 | | | | | | 1,651 | |
|
Campbell Soup Co. | |
3.650% due 03/15/2023 | | | | | 5,800 | | | | | | 5,661 | |
|
Charter Communications Operating LLC | |
4.908% due 07/23/2025 | | | | | 800 | | | | | | 796 | |
|
CVS Health Corp. | |
4.100% due 03/25/2025 | | | | | 2,850 | | | | | | 2,829 | |
4.300% due 03/25/2028 | | | | | 10,000 | | | | | | 9,810 | |
|
DAE Funding LLC | |
5.250% due 11/15/2021 | | | | | 6,300 | | | | | | 6,213 | |
|
Delta Air Lines Pass-Through Trust | |
4.950% due 11/23/2020 | | | | | 57 | | | | | | 57 | |
|
Ecopetrol S.A. | |
5.875% due 09/18/2023 | | | | | 2,500 | | | | | | 2,613 | |
|
Energy Transfer Operating LP | |
9.700% due 03/15/2019 | | | | | 300 | | | | | | 304 | |
|
Equifax, Inc. | |
3.486% (US0003M + 0.870%) due 08/15/2021 ~ | | | | | 4,050 | | | | | | 4,006 | |
|
General Electric Co. | |
5.000% due 01/21/2021 •(c) | | | | | 9,000 | | | | | | 6,896 | |
|
General Mills, Inc. | |
3.700% due 10/17/2023 | | | | | 4,000 | | | | | | 3,981 | |
4.000% due 04/17/2025 | | | | | 4,600 | | | | | | 4,535 | |
|
Kinder Morgan Energy Partners LP | |
3.500% due 03/01/2021 | | | | | 300 | | | | | | 299 | |
3.950% due 09/01/2022 | | | | | 1,000 | | | | | | 1,000 | |
6.850% due 02/15/2020 | | | | | 3,000 | | | | | | 3,107 | |
|
Latam Airlines Pass-Through Trust | |
4.200% due 08/15/2029 | | | | | 2,650 | | | | | | 2,564 | |
|
Magellan Health, Inc. | |
4.400% due 09/22/2024 | | | | | 8,500 | | | | | | 8,008 | |
|
Marvell Technology Group Ltd. | |
4.875% due 06/22/2028 | | | | | 6,050 | | | | | | 5,909 | |
|
Northwest Airlines Pass-Through Trust | |
7.041% due 10/01/2023 | | | | | 1,011 | | | | | | 1,087 | |
7.150% due 04/01/2021 « | | | | | 6,100 | | | | | | 6,058 | |
|
Ooredoo International Finance Ltd. | |
5.000% due 10/19/2025 | | | | | 11,800 | | | | | | 12,223 | |
|
Rockies Express Pipeline LLC | |
5.625% due 04/15/2020 | | | | | 100 | | | | | | 101 | |
|
Sands China Ltd. | |
4.600% due 08/08/2023 | | | | | 15,400 | | | | | | 15,337 | |
| | | | | | |
| 38 | | PIMCO MANAGED ACCOUNTS TRUST | | | | See Accompanying Notes |
December 31, 2018
| | | | | | | | | | | | |
| | | | | PRINCIPAL
AMOUNT
(000S) | | | | | MARKET
VALUE
(000S) | |
|
SES Global Americas Holdings GP | |
2.500% due 03/25/2019 | | $ | | | 400 | | | $ | | | 399 | |
|
Syngenta Finance NV | |
4.441% due 04/24/2023 | | | | | 2,500 | | | | | | 2,412 | |
|
Wabtec Corp. | |
4.700% due 09/15/2028 | | | | | 1,400 | | | | | | 1,316 | |
|
WestJet Airlines Ltd. | |
3.500% due 06/16/2021 | | | | | 1,800 | | | | | | 1,785 | |
| | | | | | | | | | | | |
| | | | | | | | | | | 137,664 | |
| | | | | | | | | | | | |
| |
| UTILITIES 2.6% | |
|
AT&T, Inc. | |
3.956% (US0003M + 1.180%) due 06/12/2024 ~ | | | | | 5,500 | | | | | | 5,339 | |
|
Odebrecht Drilling Norbe Ltd. | |
6.350% due 12/01/2021 | | | | | 1,860 | | | | | | 1,796 | |
|
Verizon Communications, Inc. | |
4.500% due 08/10/2033 | | | | | 12,000 | | | | | | 11,886 | |
4.672% due 03/15/2055 | | | | | 8,000 | | | | | | 7,388 | |
|
Vodafone Group PLC | |
3.750% due 01/16/2024 | | | | | 4,150 | | | | | | 4,095 | |
| | | | | | | | | | | | |
| | | | | | | | | | | 30,504 | |
| | | | | | | | | | | | |
Total Corporate Bonds & Notes (Cost $632,902) | | | 614,136 | |
| | | | |
| |
| MUNICIPAL BONDS & NOTES 0.7% | |
| |
| ILLINOIS 0.2% | |
|
Chicago, Illinois General Obligation Bonds, Series 2008 | |
5.630% due 01/01/2022 | | | | | 200 | | | | | | 202 | |
|
Chicago, Illinois General Obligation Bonds, Series 2015 | |
7.750% due 01/01/2042 | | | | | 670 | | | | | | 718 | |
|
Chicago, Illinois General Obligation Notes, Series 2015 | |
5.633% due 01/01/2020 | | | | | 200 | | | | | | 201 | |
|
Illinois State General Obligation Bonds, (BABs), Series 2010 | |
7.350% due 07/01/2035 | | | | | 1,095 | | | | | | 1,216 | |
| | | | | | | | | | | | |
| | | | | | | | | | | 2,337 | |
| | | | | | | | | | | | |
| |
| TEXAS 0.5% | |
|
Texas Public Finance Authority Revenue Notes, Series 2014 | |
8.250% due 07/01/2024 | | | | | 5,720 | | | | | | 5,814 | |
| | | | | | | | | | | | |
Total Municipal Bonds & Notes (Cost $8,012) | | | 8,151 | |
| | | | |
| |
| | | | | | | | | | | | |
| | | | | PRINCIPAL
AMOUNT
(000S) | | | | | MARKET
VALUE
(000S) | |
| U.S. GOVERNMENT AGENCIES 52.6% | |
|
Fannie Mae | |
4.500% due 08/01/2039 - 11/01/2041 | | $ | | | 258 | | | $ | | | 270 | |
|
Fannie Mae, TBA | |
3.000% due 01/01/2034 - 02/01/2034 | | | | | 37,000 | | | | | | 36,920 | |
3.500% due 02/01/2034 - 02/01/2049 | | | | | 349,400 | | | | | | 349,937 | |
4.000% due 01/01/2049 - 02/01/2049 | | | | | 182,200 | | | | | | 185,661 | |
|
Freddie Mac | |
6.500% due 01/01/2038 - 10/01/2038 | | | | | 50 | | | | | | 55 | |
|
Ginnie Mae | |
3.084% due 02/20/2066 • | | | | | 2,143 | | | | | | 2,150 | |
3.375% (H15T1Y + 1.500%)
due 01/20/2022 ~ | | | | | 2 | | | | | | 2 | |
|
Ginnie Mae, TBA | |
5.000% due 01/01/2049 | | | | | 33,000 | | | | | | 34,336 | |
|
Tennessee Valley Authority | |
7.125% due 05/01/2030 | | | | | 10,000 | | | | | | 13,799 | |
| | | | | | | | | | | | |
Total U.S. Government Agencies (Cost $616,824) | | | 623,130 | |
| | | | |
| |
| U.S. TREASURY OBLIGATIONS 13.7% | |
|
U.S. Treasury Notes | |
1.875% due 01/31/2022 (f)(h)(j) | | | | | 164,900 | | | | | | 161,996 | |
| | | | | | | | | | | | |
Total U.S. Treasury Obligations (Cost $164,578) | | | 161,996 | |
| | | | |
| |
| NON-AGENCY MORTGAGE-BACKED SECURITIES 6.0% | |
|
Banc of America Funding Trust | |
4.447% due 01/20/2047 ^~ | | | | | 59 | | | | | | 57 | |
|
Bear Stearns Adjustable Rate Mortgage Trust | |
3.123% due 05/25/2034 ~ | | | | | 23 | | | | | | 21 | |
4.486% due 10/25/2033 ~ | | | | | 26 | | | | | | 26 | |
|
Bear StearnsALT-A Trust | |
4.035% due 02/25/2036 ^~ | | | | | 591 | | | | | | 515 | |
|
Cascade Funding Mortgage Trust | |
4.000% due 10/25/2068 «~ | | | | | 2,956 | | | | | | 2,971 | |
|
Citigroup Mortgage Loan Trust, Inc. | |
4.240% due 09/25/2035 • | | | | | 99 | | | | | | 100 | |
4.680% due 09/25/2035 • | | | | | 119 | | | | | | 121 | |
|
Civic Mortgage LLC | |
3.892% due 06/25/2022 Ø | | | | | 1,634 | | | | | | 1,632 | |
4.349% due 11/25/2022 Ø | | | | | 4,760 | | | | | | 4,764 | |
|
Cordusio RMBS SRL | |
0.000% due 06/30/2035 • | | EUR | | | 23 | | | | | | 26 | |
| | | | | | |
| See Accompanying Notes | | ANNUAL REPORT | | DECEMBER 31, 2018 | | 39 |
Schedule of InvestmentsPIMCO Fixed Income SHares: Series C(Cont.)
| | | | | | | | | | | | |
| | | | | PRINCIPAL
AMOUNT
(000S) | | | | | MARKET
VALUE
(000S) | |
|
Countrywide Alternative Loan Trust | |
2.706% due 05/25/2036 • | | $ | | | 55 | | | $ | | | 48 | |
6.000% due 08/25/2034 | | | | | 7,177 | | | | | | 7,555 | |
|
Countrywide Home Loan Mortgage Pass-Through Trust | |
3.146% due 03/25/2035 • | | | | | 105 | | | | | | 94 | |
3.910% due 08/25/2034 ^~ | | | | | 16 | | | | | | 15 | |
|
Credit Suisse First Boston Mortgage-Backed Pass-through Certificates | |
3.916% due 07/25/2033 ~ | | | | | 4 | | | | | | 4 | |
|
Downey Savings & Loan Association Mortgage Loan Trust | |
2.730% due 08/19/2045 • | | | | | 732 | | | | | | 702 | |
4.154% due 07/19/2044 ~ | | | | | 489 | | | | | | 496 | |
|
Eurosail PLC | |
1.850% due 06/13/2045 • | | GBP | | | 2,375 | | | | | | 2,936 | |
|
GreenPoint Mortgage Funding Trust | |
2.966% due 06/25/2045 • | | $ | | | 1,771 | | | | | | 1,636 | |
|
GreenPoint Mortgage Funding Trust Pass-Through Certificates | |
4.852% due 10/25/2033 ~ | | | | | 3 | | | | | | 3 | |
|
GSR Mortgage Loan Trust | |
3.830% due 03/25/2033 • | | | | | 21 | | | | | | 21 | |
4.300% due 09/25/2035 ~ | | | | | 160 | | | | | | 163 | |
4.494% due 09/25/2035 ~ | | | | | 340 | | | | | | 350 | |
|
HarborView Mortgage Loan Trust | |
2.660% due 01/19/2038 • | | | | | 151 | | | | | | 146 | |
2.810% due 06/20/2035 • | | | | | 243 | | | | | | 240 | |
|
HomeBanc Mortgage Trust | |
2.766% due 01/25/2036 • | | | | | 1,007 | | | | | | 998 | |
3.228% due 04/25/2037 ^~ | | | | | 75 | | | | | | 70 | |
|
JPMorgan Mortgage Trust | |
4.115% due 11/25/2033 ~ | | | | | 26 | | | | | | 26 | |
4.314% due 07/25/2035 ~ | | | | | 215 | | | | | | 216 | |
4.327% due 07/25/2035 ~ | | | | | 353 | | | | | | 366 | |
4.336% due 02/25/2035 ~ | | | | | 23 | | | | | | 23 | |
|
LMREC, Inc. | |
3.484% due 02/22/2032 • | | | | | 4,500 | | | | | | 4,488 | |
4.204% due 11/24/2031 «• | | | | | 19,729 | | | | | | 19,729 | |
|
Morgan Stanley Mortgage Loan Trust | |
4.329% due 08/25/2034 ~ | | | | | 2,017 | | | | | | 2,050 | |
|
RBSSP Resecuritization Trust | |
2.822% due 09/26/2034 • | | | | | 321 | | | | | | 319 | |
2.822% due 04/26/2037 • | | | | | 996 | | | | | | 991 | |
|
Residential Accredit Loans, Inc. Trust | |
2.716% due 04/25/2046 • | | | | | 900 | | | | | | 414 | |
|
Structured Adjustable Rate Mortgage Loan Trust | |
4.232% due 02/25/2034 ~ | | | | | 42 | | | | | | 41 | |
|
Structured Asset Mortgage Investments Trust | |
3.126% due 09/25/2045 • | | | | | 631 | | | | | | 601 | |
|
Uropa Securities PLC | |
1.107% due 06/10/2059 • | | GBP | | | 7,859 | | | | | | 9,530 | |
| | | | | | | | | | | | |
| | | | | PRINCIPAL
AMOUNT
(000S) | | | | | MARKET
VALUE
(000S) | |
1.257% due 06/10/2059 • | | GBP | | | 1,816 | | | $ | | | 2,190 | |
1.457% due 06/10/2059 • | | | | | 1,420 | | | | | | 1,721 | |
1.657% due 06/10/2059 • | | | | | 1,513 | | | | | | 1,811 | |
|
WaMu Mortgage Pass-Through Certificates Trust | |
2.816% due 01/25/2045 • | | $ | | | 85 | | | | | | 85 | |
3.157% due 02/25/2046 • | | | | | 577 | | | | | | 574 | |
3.246% due 11/25/2034 • | | | | | 879 | | | | | | 869 | |
|
Wells Fargo Mortgage-Backed Securities Trust | |
4.990% due 03/25/2036 ~ | | | | | 147 | | | | | | 144 | |
| | | | | | | | | | | | |
TotalNon-Agency Mortgage-Backed Securities (Cost $70,445) | | | 71,898 | |
| | | | |
| |
| ASSET-BACKED SECURITIES 27.0% | |
|
Ally Master Owner Trust | |
3.290% due 05/15/2023 | | | | | 5,000 | | | | | | 5,034 | |
|
Ameriquest Mortgage Securities Trust | |
2.896% due 03/25/2036 • | | | | | 100 | | | | | | 99 | |
|
Arbor Realty Commercial Real Estate Notes Ltd. | |
3.755% due 04/15/2027 • | | | | | 11,900 | | | | | | 11,928 | |
|
Atrium Corp. | |
3.299% due 04/22/2027 • | | | | | 5,650 | | | | | | 5,584 | |
3.827% due 10/23/2024 • | | | | | 10,000 | | | | | | 10,033 | |
|
Bear Stearns Asset-Backed Securities Trust | |
2.706% due 12/25/2036 • | | | | | 851 | | | | | | 850 | |
2.916% due 12/25/2035 • | | | | | 138 | | | | | | 138 | |
3.506% due 10/25/2037 • | | | | | 237 | | | | | | 238 | |
|
BSPRT Issuer Ltd. | |
3.630% due 06/15/2027 • | | | | | 2,389 | | | | | | 2,392 | |
|
Citigroup Mortgage Loan Trust Asset-Backed Pass-Through Certificates | |
3.436% due 05/25/2035 • | | | | | 3,499 | | | | | | 3,461 | |
|
Conseco Finance Corp. | |
6.220% due 03/01/2030 | | | | | 60 | | | | | | 63 | |
6.530% due 02/01/2031 ~ | | | | | 2,030 | | | | | | 1,958 | |
|
Credit Suisse Mortgage Capital Trust | |
4.500% due 03/25/2021 | | | | | 5,897 | | | | | | 5,919 | |
|
Crown Point CLO Ltd. | |
3.975% due 10/20/2028 • | | | | | 9,260 | | | | | | 9,218 | |
|
Denali Capital CLO LLC | |
3.558% due 10/26/2027 • | | | | | 22,470 | | | | | | 22,329 | |
|
Dryden Senior Loan Fund | |
3.336% due 10/15/2027 • | | | | | 8,300 | | | | | | 8,240 | |
|
ECAF Ltd. | |
3.473% due 06/15/2040 | | | | | 465 | | | | | | 462 | |
4.947% due 06/15/2040 | | | | | 456 | | | | | | 471 | |
|
ECMC Group Student Loan Trust | |
3.256% due 02/27/2068 • | | | | | 8,945 | | | | | | 8,941 | |
|
First Franklin Mortgage Loan Trust | |
3.241% due 09/25/2035 • | | | | | 411 | | | | | | 413 | |
|
First NLC Trust | |
3.211% due 12/25/2035 • | | | | | 488 | | | | | | 491 | |
| | | | | | |
| 40 | | PIMCO MANAGED ACCOUNTS TRUST | | | | See Accompanying Notes |
December 31, 2018
| | | | | | | | | | | | |
| | | | | PRINCIPAL
AMOUNT
(000S) | | | | | MARKET
VALUE
(000S) | |
|
Gallatin CLO Ltd. | |
3.486% (US0003M + 1.050%) due 07/15/2027 ~ | | $ | | | 13,600 | | | $ | | | 13,547 | |
|
Greystone Commercial Real Estate Ltd. | |
4.005% due 03/15/2027 • | | | | | 17,900 | | | | | | 17,904 | |
|
Harvest CLO DAC | |
0.630% due 11/18/2029 • | | EUR | | | 2,150 | | | | | | 2,442 | |
|
Home Equity Asset Trust | |
3.706% due 10/25/2033 • | | $ | | | 506 | | | | | | 502 | |
|
ICG U.S. CLO Ltd. | |
3.286% due 01/16/2028 • | | | | | 5,600 | | | | | | 5,567 | |
|
Jamestown CLO Ltd. | |
3.669% due 01/17/2027 • | | | | | 12,252 | | | | | | 12,244 | |
|
Jubilee CLO BV | |
0.489% due 12/15/2029 • | | EUR | | | 12,850 | | | | | | 14,589 | |
|
Loomis Sayles CLO Ltd. | |
3.336% due 04/15/2028 • | | $ | | | 14,000 | | | | | | 13,816 | |
|
M360 Advisors LLC | |
4.395% due 07/24/2028 | | | | | 5,000 | | | | | | 5,021 | |
|
Merrill Lynch Mortgage Investors Trust | |
2.626% due 02/25/2037 • | | | | | 175 | | | | | | 76 | |
|
METAL LLC | |
4.581% due 10/15/2042 | | | | | 3,134 | | | | | | 3,162 | |
|
Morgan Stanley ABS Capital, Inc. Trust | |
3.151% due 09/25/2035 • | | | | | 380 | | | | | | 380 | |
|
Morgan Stanley Mortgage Loan Trust | |
2.866% due 04/25/2037 • | | | | | 123 | | | | | | 59 | |
|
Mountain View CLO Ltd. | |
3.236% due 10/15/2026 • | | | | | 7,000 | | | | | | 6,988 | |
|
Navient Student Loan Trust | |
3.556% due 12/27/2066 • | | | | | 16,766 | | | | | | 16,787 | |
|
Nomura Home Equity Loan, Inc. Home Equity Loan Trust | |
3.391% due 09/25/2035 • | | | | | 1,000 | | | | | | 1,004 | |
|
OCP CLO Ltd. | |
3.236% due 07/15/2027 • | | | | | 3,300 | | | | | | 3,274 | |
|
OFSI Fund Ltd. | |
3.086% due 03/20/2025 • | | | | | 2,717 | | | | | | 2,712 | |
|
Prosper Marketplace Issuance Trust | |
3.350% due 10/15/2024 | | | | | 4,727 | | | | | | 4,719 | |
|
Residential Asset Securities Corp. Trust | |
3.146% due 08/25/2035 • | | | | | 6,189 | | | | | | 6,066 | |
|
RMAT LP | |
4.090% due 05/25/2048 Ø | | | | | 3,796 | | | | | | 3,796 | |
|
S-Jets Ltd. | |
3.967% due 08/15/2042 | | | | | 5,685 | | | | | | 5,743 | |
|
SLM Student Loan Trust | |
1.450% due 03/15/2038 • | | GBP | | | 21,848 | | | | | | 26,942 | |
| | | | | | | | | | | | |
| | | | | PRINCIPAL
AMOUNT
(000S) | | | | | MARKET
VALUE
(000S) | |
|
Structured Asset Investment Loan Trust | |
3.196% due 06/25/2035 • | | $ | | | 224 | | | $ | | | 225 | |
3.211% due 03/25/2034 • | | | | | 3,368 | | | | | | 3,324 | |
|
Structured Asset Securities Corp. Mortgage Loan Trust | |
2.846% due 02/25/2036 • | | | | | 842 | | | | | | 844 | |
3.181% due 11/25/2035 • | | | | | 1,200 | | | | | | 1,203 | |
|
Symphony CLO Ltd. | |
3.316% due 04/15/2028 • | | | | | 9,600 | | | | | | 9,565 | |
|
Telos CLO Ltd. | |
3.399% due 04/17/2028 • | | | | | 2,950 | | | | | | 2,945 | |
|
TICP CLO Ltd. | |
3.309% due 04/20/2028 • | | | | | 12,450 | | | | | | 12,291 | |
|
Venture CLO Ltd. | |
3.316% due 04/15/2027 • | | | | | 23,000 | | | | | | 22,759 | |
|
Wells Fargo Home Equity Asset-Backed Securities Trust | |
3.391% due 11/25/2035 • | | | | | 1,500 | | | | | | 1,505 | |
3.556% due 10/25/2034 • | | | | | 220 | | | | | | 216 | |
| | | | | | | | | | | | |
Total Asset-Backed Securities (Cost $320,001) | | | 320,479 | |
| | | | |
| |
| SOVEREIGN ISSUES 0.8% | |
|
Qatar Government International Bond | |
3.875% due 04/23/2023 | | | | | 9,000 | | | | | | 9,116 | |
| | | | | | | | | | | | |
Total Sovereign Issues (Cost $8,947) | | | 9,116 | |
| | | | |
| |
| SHORT-TERM INSTRUMENTS 2.8% | |
| |
| REPURCHASE AGREEMENTS (e) 2.8% | |
| | | | | | | | | | | 33,175 | |
| | | | | | | | | | | | |
| |
| U.S. TREASURY BILLS 0.0% | |
2.387% due 03/07/2019 (a)(b)(j) | | | | | 66 | | | | | | 66 | |
| | | | | | | | | | | | |
Total Short-Term Instruments (Cost $33,241) | | | 33,241 | |
| | | | |
|
| |
| Total Investments in Securities (Cost $1,873,680) | | | 1,860,760 | |
| | | | |
| | | | | | | | | | | | |
| | | | | | |
| See Accompanying Notes | | ANNUAL REPORT | | DECEMBER 31, 2018 | | 41 |
Schedule of InvestmentsPIMCO Fixed Income SHares: Series C(Cont.)
| | | | | | | | | | | | |
| | | | | SHARES | | | | | MARKET
VALUE
(000S) | |
| INVESTMENTS IN AFFILIATES 1.4% | |
| |
| SHORT-TERM INSTRUMENTS 1.4% | |
| |
| CENTRAL FUNDS USED FOR CASH MANAGEMENT PURPOSES 1.4% | |
| | | |
PIMCO Short-Term Floating NAV Portfolio III | | | 1,653,045 | | | $ | | | 16,339 | |
| | | | | | | | | | | | |
Total Short-Term Instruments (Cost $16,339) | | | 16,339 | |
| | | | |
|
| |
| Total Investments in Affiliates (Cost $16,339) | | | 16,339 | |
| |
| | | | |
| Total Investments 158.4% (Cost $1,890,019) | | | $ | | | 1,877,099 | |
| | | | | | | | | | | | |
Financial Derivative
Instruments (g)(i) (0.2)% (Cost or Premiums, net $1,740) | | | | | | (1,993 | ) |
| | | | | | | | | | | | |
| Other Assets and Liabilities, net (58.2)% | | | (690,103 | ) |
| | | | |
| Net Assets 100.0% | | | $ | | | 1,185,003 | |
| | | | | | | |
NOTES TO SCHEDULE OF INVESTMENTS:
| * | A zero balance may reflect actual amounts rounding to less than one thousand. |
| « | Security valued using significant unobservable inputs (Level 3). |
| ~ | Variable or Floating rate security. Rate shown is the rate in effect as of period end. Certain variable rate securities are not based on a published reference rate and spread, rather are determined by the issuer or agent and are based on current market conditions. Reference rate is as of reset date, which may vary by security. These securities may not indicate a reference rate and/or spread in their description. |
| • | Rate shown is the rate in effect as of period end. The rate may be based on a fixed rate, a capped rate or a floor rate and may convert to a variable or floating rate in the future. These securities do not indicate a reference rate and spread in their description. |
| Ø | Coupon represents a rate which changes periodically based on a predetermined schedule or event. Rate shown is the rate in effect as of period end. |
| (b) | Coupon represents a yield to maturity. |
| (c) | Perpetual maturity; date shown, if applicable, represents next contractual call date. |
| (d) | Contingent convertible security. |
BORROWINGS AND OTHER FINANCING TRANSACTIONS
(e) REPURCHASE AGREEMENTS:
| | | | | | | | | | | | | | | | | | | | | | | | | | | | |
| Counterparty | | Lending
Rate | | Settlement
Date | | | Maturity
Date | | | Principal
Amount | | | Collateralized By | | Collateral
(Received) | | | Repurchase
Agreements,
at Value | | | Repurchase
Agreement
Proceeds
to be
Received(1) | |
FICC | | 2.000% | | | 12/31/2018 | | | | 01/02/2019 | | | $ | 2,975 | | | U.S. Treasury Notes 2.875% due 09/30/2023 | | $ | (3,037 | ) | | $ | 2,975 | | | $ | 2,975 | |
| | | | | | |
| 42 | | PIMCO MANAGED ACCOUNTS TRUST | | | | See Accompanying Notes |
December 31, 2018
| | | | | | | | | | | | | | | | | | | | | | | | | | | | |
| Counterparty | | Lending
Rate | | Settlement
Date | | | Maturity
Date | | | Principal
Amount | | | Collateralized By | | Collateral
(Received) | | | Repurchase
Agreements,
at Value | | | Repurchase
Agreement
Proceeds
to be
Received(1) | |
RDR | | 3.200% | | | 12/31/2018 | | | | 01/02/2019 | | | $ | 30,200 | | | U.S. Treasury Notes 2.000% due 11/30/2022 | | $ | (30,859 | ) | | $ | 30,200 | | | $ | 30,206 | |
| | | | | | | | | | | | | | | | | | | | | | | | | | | | |
Total Repurchase Agreements | | | | | $ | (33,896 | ) | | $ | 33,175 | | | $ | 33,181 | |
| | | | | | | | | | | | | | | | | | | | | | | | | | | | |
REVERSE REPURCHASE AGREEMENTS:
| | | | | | | | | | | | | | | | | | | | |
| Counterparty | | Borrowing
Rate(2) | | | Settlement
Date | | | Maturity
Date | | | Amount
Borrowed(2) | | | Payable for
Reverse
Repurchase
Agreements | |
BOM | | | 2.570 | % | | | 11/14/2018 | | | | 01/14/2019 | | | $ | (8,947 | ) | | $ | (8,978 | ) |
| | | 2.600 | | | | 11/27/2018 | | | | 01/23/2019 | | | | (6,825 | ) | | | (6,843 | ) |
| | | 2.720 | | | | 12/27/2018 | | | | 02/27/2019 | | | | (17,030 | ) | | | (17,038 | ) |
BSN | | | 2.370 | | | | 10/09/2018 | | | | 01/09/2019 | | | | (4,547 | ) | | | (4,573 | ) |
GRE | | | 2.460 | | | | 11/28/2018 | | | | 01/22/2019 | | | | (9,177 | ) | | | (9,199 | ) |
| | | 2.540 | | | | 11/14/2018 | | | | 02/14/2019 | | | | (7,197 | ) | | | (7,221 | ) |
| | | | | | | | | | | | | | | | | | | | |
Total Reverse Repurchase Agreements | | | $ | (53,852 | ) |
| | | | | | | | | | | | | | | | | | | | |
SALE-BUYBACK TRANSACTIONS:
| | | | | | | | | | | | | | | | | | | | |
| Counterparty | | Borrowing
Rate(2) | | | Borrowing
Date | | | Maturity
Date | | | Amount
Borrowed(2) | | | Payable for
Sale-Buyback
Transactions(3) | |
UBS | | | 2.420 | % | | | 10/17/2018 | | | | 01/17/2019 | | | $ | (48,690 | ) | | $ | (48,942 | ) |
| | | 2.420 | | | | 11/28/2018 | | | | 01/17/2019 | | | | (9,175 | ) | | | (9,197 | ) |
| | | | | | | | | | | | | | | | | | | | |
Total Sale-Buyback Transactions | | | | | | | | | | | $ | (58,139 | ) |
| | | | | | | | | | | | | | | | | | | | |
BORROWINGS AND OTHER FINANCING TRANSACTIONS SUMMARY
The following is a summary by counterparty of the market value of Borrowings and Other Financing Transactions and collateral pledged/(received) as of December 31, 2018:
| | | | | | | | | | | | | | | | | | | | | | | | |
| Counterparty | | Repurchase
Agreement
Proceeds
to be
Received(1) | | | Payable for
Reverse
Repurchase
Agreements | | | Payable for
Sale-Buyback
Transactions(3) | | | Total
Borrowings and
Other Financing
Transactions | | | Collateral
Pledged/
(Received) | | | Net Exposure(4) | |
Global/Master Repurchase Agreement | |
BOM | | $ | 0 | | | $ | (32,859 | ) | | $ | 0 | | | $ | (32,859 | ) | | $ | 32,689 | | | $ | (170 | ) |
BSN | | | 0 | | | | (4,573 | ) | | | 0 | | | | (4,573 | ) | | | 4,617 | | | | 44 | |
FICC | | | 2,975 | | | | 0 | | | | 0 | | | | 2,975 | | | | (3,037 | ) | | | (62 | ) |
GRE | | | 0 | | | | (16,420 | ) | | | 0 | | | | (16,420 | ) | | | 16,504 | | | | 84 | |
RDR | | | 30,206 | | | | 0 | | | | 0 | | | | 30,206 | | | | (30,859 | ) | | | (653 | ) |
| | | | |
Master Securities Forward Transaction Agreement | | | | | | | | | | | | | | | | | |
UBS | | | 0 | | | | 0 | | | | (58,139 | ) | | | (58,139 | ) | | | 57,940 | | | | (199 | ) |
| | | | | | | | | | | | | | | | | | | | | | | | |
Total Borrowings and Other Financing Transactions | | $ | 33,181 | | | $ | (53,852 | ) | | $ | (58,139 | ) | | | | | | | | | | | | |
| | | | | | | | | | | | | | | | | | | | | | | | |
| | | | | | |
| See Accompanying Notes | | ANNUAL REPORT | | DECEMBER 31, 2018 | | 43 |
Schedule of InvestmentsPIMCO Fixed Income SHares: Series C(Cont.)
CERTAIN TRANSFERS ACCOUNTED FOR AS SECURED BORROWINGS
Remaining Contractual Maturity of the Agreements
| | | | | | | | | | | | | | | | | | | | |
| | | Overnight and
Continuous | | | Up to 30 days | | | 31-90 days | | | Greater Than 90 days | | | Total | |
Reverse Repurchase Agreements | |
U.S. Treasury Obligations | | $ | 0 | | | $ | (29,593 | ) | | $ | (24,259 | ) | | $ | 0 | | | $ | (53,852 | ) |
| | | | | | | | | | | | | | | | | | | | |
Total | | $ | 0 | | | $ | (29,593 | ) | | $ | (24,259 | ) | | $ | 0 | | | $ | (53,852 | ) |
| | | | | |
Sale-Buyback Transactions | | | | | | | | | | | | | | | | | | | | |
U.S. Treasury Obligations | | | 0 | | | | (58,139 | ) | | | 0 | | | | 0 | | | | (58,139 | ) |
| | | | | | | | | | | | | | | | | | | | |
Total | | $ | 0 | | | $ | (58,139 | ) | | $ | 0 | | | $ | 0 | | | $ | (58,139 | ) |
| | | | | | | | | | | | | | | | | | | | |
Total Borrowings | | $ | 0 | | | $ | (87,732 | ) | | $ | (24,259 | ) | | $ | 0 | | | $ | (111,991 | ) |
| | | | | | | | | | | | | | | | | | | | |
Payable for reverse repurchase agreements and sale-buyback financing transactions | | | $ | (111,991 | ) |
| | | | | | | | | | | | | | | | | | | | |
| (f) | Securities with an aggregate market value of $112,680 have been pledged as collateral under the terms of the above master agreements as of December 31, 2018. |
| (1) | Includes accrued interest. |
| (2) | The average amount of borrowings outstanding during the period ended December 31, 2018 was $(193,055) at a weighted average interest rate of 1.721%. Average borrowings may include sale-buyback transactions and reverse repurchase agreements, if held during the period. |
| (3) | Payable for sale-buyback transactions includes $(58) of deferred price drop. |
| (4) | Net Exposure represents the net receivable/(payable) that would be due from/to the counterparty in the event of default. Exposure from borrowings and other financing transactions can only be netted across transactions governed under the same master agreement with the same legal entity. See Note 8, Master Netting Arrangements, in the Notes to Financial Statements for more information regarding master netting arrangements. |
(g) FINANCIAL DERIVATIVE INSTRUMENTS: EXCHANGE-TRADED OR CENTRALLY CLEARED
PURCHASED OPTIONS:
OPTIONS ON EXCHANGE-TRADED FUTURES CONTRACTS
| | | | | | | | | | | | | | | | | | | | | | | | |
| Description | | Strike
Price | | | Expiration
Date | | | # of
Contracts | | | Notional
Amount | | | Cost | | | Market
Value | |
Put - CBOT U.S. Treasury5-Year Note March 2019 Futures | | $ | 103.250 | | | | 02/22/2019 | | | | 127 | | | $ | 127 | | | $ | 1 | | | $ | 0 | |
Put - CBOT U.S. Treasury5-Year Note March 2019 Futures | | | 103.500 | | | | 02/22/2019 | | | | 101 | | | | 101 | | | | 1 | | | | 0 | |
Put - CBOT U.S. Treasury5-Year Note March 2019 Futures | | | 103.750 | | | | 02/22/2019 | | | | 28 | | | | 28 | | | | 0 | | | | 0 | |
Put - CBOT U.S. Treasury5-Year Note March 2019 Futures | | | 104.000 | | | | 02/22/2019 | | | | 1,458 | | | | 1,458 | | | | 13 | | | | 2 | |
Put - CBOT U.S. Treasury5-Year Note March 2019 Futures | | | 107.000 | | | | 02/22/2019 | | | | 22 | | | | 22 | | | | 0 | | | | 0 | |
Put - CBOT U.S. Treasury5-Year Note March 2019 Futures | | | 107.250 | | | | 02/22/2019 | | | | 122 | | | | 122 | | | | 1 | | | | 0 | |
Put - CBOT U.S. Treasury5-Year Note March 2019 Futures | | | 107.500 | | | | 02/22/2019 | | | | 144 | | | | 144 | | | | 1 | | | | 1 | |
| | | | | | | | | | | | | | | | | | | | | | | | |
| | | | | | | | | | | | | | | | | | $ | 17 | | | $ | 3 | |
| | | | | | | | | | | | | | | | | | | | | | | | |
Total Purchased Options | | | | | | | | | | | $ | 17 | | | $ | 3 | |
| | | | | | | | | | | | | | | | | | | | | | | | |
| | | | | | |
| 44 | | PIMCO MANAGED ACCOUNTS TRUST | | | | See Accompanying Notes |
December 31, 2018
FUTURES CONTRACTS:
LONG FUTURES CONTRACTS
| | | | | | | | | | | | | | | | | | | | | | | | | | |
Description | | Expiration
Month | | # of
Contracts | | | Notional
Amount | | | Unrealized
Appreciation/
(Depreciation) | | | Variation Margin | |
| | Asset | | | Liability | |
90-Day Eurodollar December Futures | | 12/2019 | | | 1,635 | | | | $ | | | | 397,918 | | | $ | 1,142 | | | $ | 41 | | | $ | 0 | |
Euro-Bund10-Year Bond March Futures | | 03/2019 | | | 525 | | | | | | | | 98,372 | | | | 1,008 | | | | 0 | | | | (115 | ) |
U.S. Treasury5-Year Note March Futures | | 03/2019 | | | 2,002 | | | | | | | | 229,604 | | | | 3,759 | | | | 500 | | | | 0 | |
| | | | | | | | | | | | | | | | | | | | | | | | | | |
| | | | | | | | | | | | | | | | $ | 5,909 | | | $ | 541 | | | $ | (115 | ) |
| | | | | | | | | | | | | | | | | | | | | | | | | | |
SHORT FUTURES CONTRACTS
| | | | | | | | | | | | | | | | | | | | | | | | | | |
Description | | Expiration
Month | | # of
Contracts | | | Notional
Amount | | | Unrealized
Appreciation/
(Depreciation) | | | Variation Margin | |
| | Asset | | | Liability | |
Euro-OAT France Government10-Year Bond March Futures | | 03/2019 | | | 832 | | | | $ | | | | (143,752 | ) | | $ | (311 | ) | | $ | 200 | | | $ | 0 | |
| | | | | | | | | | | | | | | | | | | | | | | | | | |
Total Futures Contracts | | | $ | 5,598 | | | $ | 741 | | | $ | (115 | ) |
| | | | | | | | | | | | | | | | | | | | | | | | | | |
SWAP AGREEMENTS:
CREDIT DEFAULT SWAPS ON CORPORATE ISSUES - SELL PROTECTION(1)
| | | | | | | | | | | | | | | | | | | | | | | | | | | | | | | | | | | | | | | | |
Reference
Entity | | Fixed
Receive
Rate | | | Payment
Frequency | | | Maturity
Date | | | Implied
Credit
Spread at
December 31,
2018(2) | | | Notional
Amount(3) | | | Premiums
Paid/
(Received) | | | Unrealized
Appreciation/
(Depreciation) | | | Market
Value(4) | | | Variation Margin | |
| | Asset | | | Liability | |
Ally Financial, Inc. | | | 5.000 | % | | | Quarterly | | | | 06/20/2022 | | | | 1.510 | % | | $ | 30,500 | | | $ | 3,769 | | | $ | (249 | ) | | $ | 3,520 | | | $ | 0 | | | $ | (57 | ) |
Ford Motor Co. | | | 5.000 | | | | Quarterly | | | | 12/20/2023 | | | | 2.648 | | | | 11,000 | | | | 1,997 | | | | (840 | ) | | | 1,157 | | | | 5 | | | | 0 | |
General Electric Co. | | | 1.000 | | | | Quarterly | | | | 12/20/2023 | | | | 2.039 | | | | 11,900 | | | | (408 | ) | | | (129 | ) | | | (537 | ) | | | 4 | | | | 0 | |
Kinder Morgan, Inc. | | | 1.000 | | | | Quarterly | | | | 06/20/2021 | | | | 0.410 | | | | 8,900 | | | | (182 | ) | | | 311 | | | | 129 | | | | 0 | | | | 0 | |
Kinder Morgan, Inc. | | | 1.000 | | | | Quarterly | | | | 12/20/2021 | | | | 0.517 | | | | 1,100 | | | | (37 | ) | | | 53 | | | | 16 | | | | 0 | | | | 0 | |
| | | | | | | | | | | | | | | | | | | | | | | | | | | | | | | | | | | | | | | | |
| | | | | | | | | | | | | | | | | | | | | | $ | 5,139 | | | $ | (854 | ) | | $ | 4,285 | | | $ | 9 | | | $ | (57 | ) |
| | | | | | | | | | | | | | | | | | | | | | | | | | | | | | | | | | | | | | | | |
INTEREST RATE SWAPS
| | | | | | | | | | | | | | | | | | | | | | | | | | | | | | | | | | | | | | | | |
Pay/
Receive
Floating
Rate | | Floating
Rate Index | | Fixed
Rate | | | Payment
Frequency | | Maturity
Date | | | Notional
Amount | | | Premiums
Paid/
(Received) | | | Unrealized
Appreciation/
(Depreciation) | | | Market
Value | | | Variation Margin | |
| | Asset | | | Liability | |
Pay | | 3-MonthUSD-LIBOR | | | 1.750 | % | | Semi-Annual | | | 06/20/2020 | | | | $ | | | | 600,000 | | | $ | (9,368 | ) | | $ | 732 | | | $ | (8,636 | ) | | $ | 0 | | | $ | (21 | ) |
Receive | | 3-MonthUSD-LIBOR | | | 2.000 | | | Semi-Annual | | | 06/20/2023 | | | | | | | | 78,400 | | | | 3,026 | | | | (1,120 | ) | | | 1,906 | | | | 0 | | | | (142 | ) |
Receive | | 3-MonthUSD-LIBOR | | | 1.750 | | | Semi-Annual | | | 12/21/2026 | | | | | | | | 256,700 | | | | 1,879 | | | | 15,132 | | | | 17,011 | | | | 0 | | | | (829 | ) |
Receive | | 3-MonthUSD-LIBOR | | | 3.000 | | | Semi-Annual | | | 12/19/2028 | | | | | | | | 172,800 | | | | 1,906 | | | | (6,066 | ) | | | (4,160 | ) | | | 0 | | | | (669 | ) |
| | | | | | |
| See Accompanying Notes | | ANNUAL REPORT | | DECEMBER 31, 2018 | | 45 |
Schedule of InvestmentsPIMCO Fixed Income SHares: Series C(Cont.)
| | | | | | | | | | | | | | | | | | | | | | | | | | | | | | | | | | | | | | | | | | | | |
Pay/
Receive
Floating
Rate | | Floating
Rate Index | | | Fixed
Rate | | | Payment
Frequency | | | Maturity
Date | | | Notional
Amount | | | Premiums
Paid/
(Received) | | | Unrealized
Appreciation/
(Depreciation) | | | Market
Value | | | Variation Margin | |
| | Asset | | | Liability | |
Receive(5) | |
| 6-Month
GBP-LIBOR |
| | | 1.500 | % | | | Semi-Annual | | | | 03/20/2029 | | | | GBP | | | | 46,000 | | | $ | 791 | | | $ | (1,101 | ) | | $ | (310 | ) | | $ | 0 | | | $ | (220 | ) |
Receive | |
| 6-Month
JPY-LIBOR |
| | | 0.300 | | | | Semi-Annual | | | | 09/20/2027 | | | | JPY | | | | 6,290,000 | | | | (80 | ) | | | (816 | ) | | | (896 | ) | | | 1 | | | | 0 | |
| | | | | | | | | | | | | | | | | | | | | | | | | | | | | | | | | | | | | | | | | | | | |
| | | | | | | | | | | | | | | | | | | | | | | | | | $ | (1,846 | ) | | $ | 6,761 | | | $ | 4,915 | | | $ | 1 | | | $ | (1,881 | ) |
| | | | | | | | | | | | | | | | | | | | | | | | | | | | | | | | | | | | | | | | | | | | |
Total Swap Agreements | | | $ | 3,293 | | | $ | 5,907 | | | $ | 9,200 | | | $ | 10 | | | $ | (1,938 | ) |
| | | | | | | | | | | | | | | | | | | | | | | | | | | | | | | | | | | | | | | | | | | | |
FINANCIAL DERIVATIVE INSTRUMENTS: EXCHANGE-TRADED OR CENTRALLY CLEARED SUMMARY
The following is a summary of the market value and variation margin of Exchange-Traded or Centrally Cleared Financial Derivative Instruments as of December 31, 2018:
| | | | | | | | | | | | | | | | | | | | | | | | | | | | | | | | | | | | |
| | | Financial Derivative Assets | | | | | | Financial Derivative Liabilities | |
| | | Market Value | | | Variation Margin
Asset | | | | | | | | | Market Value | | | Variation Margin
Liability | | | | |
| | | Purchased
Options | | | Futures | | | Swap
Agreements | | | Total | | | | | | Written
Options | | | Futures | | | Swap
Agreements | | | Total | |
Total Exchange-Traded or Centrally Cleared | | $ | 3 | | | $ | 741 | | | $ | 10 | | | $ | 754 | | | | | | | $ | 0 | | | $ | (115) | | | $ | (1,938) | | | $ | (2,053) | |
| | | | | | | | | | | | | | | | | | | | | | | | | | | | | | | | | | | | |
| (h) | Securities with an aggregate market value of $22,885 and cash of $19,858 have been pledged as collateral for exchange-traded and centrally cleared financial derivative instruments as of December 31, 2018. See Note 8, Master Netting Arrangements, in the Notes to Financial Statements for more information regarding master netting arrangements. |
| (1) | If the Portfolio is a seller of protection and a credit event occurs, as defined under the terms of that particular swap agreement, the Portfolio will either (i) pay to the buyer of protection an amount equal to the notional amount of the swap and take delivery of the referenced obligation or underlying securities comprising the referenced index or (ii) pay a net settlement amount in the form of cash, securities or other deliverable obligations equal to the notional amount of the swap less the recovery value of the referenced obligation or underlying securities comprising the referenced index. |
| (2) | Implied credit spreads, represented in absolute terms, utilized in determining the market value of credit default swap agreements on corporate or sovereign issues as of period end serve as indicators of the current status of the payment/performance risk and represent the likelihood or risk of default for the credit derivative. The implied credit spread of a particular referenced entity reflects the cost of buying/selling protection and may include upfront payments required to be made to enter into the agreement. Wider credit spreads represent a deterioration of the referenced entity’s credit soundness and a greater likelihood or risk of default or other credit event occurring as defined under the terms of the agreement. |
| (3) | The maximum potential amount the Portfolio could be required to pay as a seller of credit protection or receive as a buyer of credit protection if a credit event occurs as defined under the terms of that particular swap agreement. |
| (4) | The prices and resulting values for credit default swap agreements serve as indicators of the current status of the payment/performance risk and represent the likelihood of an expected liability (or profit) for the credit derivative should the notional amount of the swap agreement be closed/sold as of the period end. Increasing market values, in absolute terms when compared to the notional amount of the swap, represent a deterioration of the referenced indices’ credit soundness and a greater likelihood or risk of default or other credit event occurring as defined under the terms of the agreement. |
| (5) | This instrument has a forward starting effective date. See Note 2, Securities Transactions and Investment Income, in the Notes to Financial Statements for further information. |
| | | | | | |
| 46 | | PIMCO MANAGED ACCOUNTS TRUST | | | | See Accompanying Notes |
December 31, 2018
(i) FINANCIAL DERIVATIVE INSTRUMENTS: OVER THE COUNTER
FORWARD FOREIGN CURRENCY CONTRACTS:
| | | | | | | | | | | | | | | | | | | | | | | | | | | | |
Counterparty | | Settlement
Month | | | Currency to
be Delivered | | | Currency to
be Received | | | Unrealized Appreciation/
(Depreciation) | |
| | Asset | | | Liability | |
BOA | | | 01/2019 | | | | EUR | | | | 19,865 | | | | $ | | | | 22,679 | | | $ | 0 | | | $ | (96 | ) |
CBK | | | 01/2019 | | | | AUD | | | | 34,746 | | | | | | | | 25,454 | | | | 976 | | | | 0 | |
| | | 01/2019 | | | | GBP | | | | 580 | | | | | | | | 743 | | | | 3 | | | | 0 | |
| | | 01/2019 | | | | $ | | | | 24,489 | | | | MXN | | | | 470,839 | | | | 0 | | | | (609 | ) |
| | | 02/2019 | | | | | | | | 12,642 | | | | COP | | | | 40,006,120 | | | | 0 | | | | (351 | ) |
| | | 03/2019 | | | | KRW | | | | 3,199,711 | | | | $ | | | | 2,855 | | | | 0 | | | | (21 | ) |
GLM | | | 01/2019 | | | | GBP | | | | 60,888 | | | | | | | | 77,862 | | | | 223 | | | | 0 | |
| | | 01/2019 | | | | $ | | | | 692 | | | | EUR | | | | 608 | | | | 5 | | | | 0 | |
| | | 03/2019 | | | | | | | | 16,828 | | | | IDR | | | | 247,371,644 | | | | 231 | | | | 0 | |
HUS | | | 01/2019 | | | | MXN | | | | 257,461 | | | | $ | | | | 12,807 | | | | 0 | | | | (251 | ) |
IND | | | 01/2019 | | | | $ | | | | 2,465 | | | | JPY | | | | 279,378 | | | | 85 | | | | 0 | |
JPM | | | 02/2019 | | | | | | | | 6,543 | | | | TRY | | | | 36,723 | | | | 218 | | | | 0 | |
| | | 02/2019 | | | | | | | | 213 | | | | ZAR | | | | 3,135 | | | | 4 | | | | 0 | |
MYI | | | 01/2019 | | | | | | | | 429 | | | | PLN | | | | 1,602 | | | | 0 | | | | (1 | ) |
SCX | | | 01/2019 | | | | | | | | 1,138 | | | | GBP | | | | 899 | | | | 9 | | | | 0 | |
SOG | | | 01/2019 | | | | | | | | 11,803 | | | | RUB | | | | 788,736 | | | | 0 | | | | (515 | ) |
| | | 03/2019 | | | | | | | | 25,007 | | | | INR | | | | 1,786,776 | | | | 374 | | | | 0 | |
SSB | | | 03/2019 | | | | TWD | | | | 1,450,703 | | | | $ | | | | 47,437 | | | | 0 | | | | (60 | ) |
| | | | | | | | | | | | | | | | | | | | | | | | | | | | |
Total Forward Foreign Currency Contracts | | | $ | 2,128 | | | $ | (1,904 | ) |
| | | | | | | | | | | | | | | | | | | | | | | | | | | | |
PURCHASED OPTIONS:
OPTIONS ON SECURITIES
| | | | | | | | | | | | | | | | | | | | | | |
| Counterparty | | Description | | Strike
Price | | | Expiration
Date | | | Notional
Amount | | | Cost | | | Market
Value | |
| JPM | | Put - OTC Fannie Mae, TBA 3.500% due 01/01/2049 | | $ | 69.000 | | | | 01/07/2019 | | | $ | 265,000 | | | $ | 10 | | | $ | 0 | |
| | | | | | | | | | | | | | | | | | | | | | |
Total Purchased Options | | | | | | | | | | | | | | $ | 10 | | | $ | 0 | |
| | | | | | | | | | | | | | | | | | | | | | |
WRITTEN OPTIONS:
CREDIT DEFAULT SWAPTIONS ON CREDIT INDICES
| | | | | | | | | | | | | | | | | | | | | | | | | | | | |
| Counterparty | | Description | | Buy/Sell
Protection | | Exercise
Rate | | | Expiration
Date | | | Notional
Amount | | | Premiums
(Received) | | | Market
Value | |
BOA | | Put - OTCCDX.IG-315-Year Index | | Sell | | | 0.900 | % | | | 01/16/2019 | | | $ | | | | | 5,800 | | | $ | (9 | ) | | $ | (9 | ) |
CBK | | Put - OTCCDX.IG-315-Year Index | | Sell | | | 1.050 | | | | 02/20/2019 | | | | | | | | 13,000 | | | | (22 | ) | | | (22 | ) |
GST | | Put - OTCCDX.IG-315-Year Index | | Sell | | | 2.400 | | | | 09/18/2019 | | | | | | | | 20,500 | | | | (35 | ) | | | (39 | ) |
| | | | | | | | | | | | | | | | | | | | | | | | | | | | |
| | | | | | | | | | | | | | | | | | | | | | $ | (66 | ) | | $ | (70 | ) |
| | | | | | | | | | | | | | | | | | | | | | | | | | | | |
Total Written Options | | | $ | (66 | ) | | $ | (70 | ) |
| | | | | | | | | | | | | | | | | | | | | | | | | | | | |
| | | | | | |
| See Accompanying Notes | | ANNUAL REPORT | | DECEMBER 31, 2018 | | 47 |
Schedule of InvestmentsPIMCO Fixed Income SHares: Series C(Cont.)
SWAP AGREEMENTS:
CREDIT DEFAULT SWAPS ON CORPORATE ISSUES - BUY PROTECTION(1)
| | | | | | | | | | | | | | | | | | | | | | | | | | | | | | | | | | | | | | | | | | |
| Counterparty | | Reference Entity | | Fixed
(Pay) Rate | | | Payment
Frequency | | | Maturity
Date | | | Implied
Credit
Spread at
December 31,
2018(3) | | | Notional
Amount(4) | | | Premiums
Paid/
(Received) | | | Unrealized
Appreciation/
(Depreciation) | | | Swap
Agreements,
at Value(5) | |
| | Asset | | | Liability | |
GST | | UBS AG | | | (1.000 | )% | | | Quarterly | | | | 09/20/2022 | | | | 0.993 | % | | $ | | | | | 2,800 | | | $ | | (16) | | $ | 14 | | | $ | 0 | | | $ | | (2) |
| | | | | | | | | | | | | | | | | | | | | | | | | | | | | | | | | | | | | | | | | | |
CREDIT DEFAULT SWAPS ON CORPORATE AND SOVEREIGN ISSUES - SELL PROTECTION(2)
| | | | | | | | | | | | | | | | | | | | | | | | | | | | | | | | | | | | | | |
Counterparty | | Reference Entity | | Fixed
Receive
Rate | | | Payment
Frequency | | | Maturity
Date | | | Implied
Credit
Spread at
December 31,
2018(3) | | | Notional
Amount(4) | | | Premiums
Paid/
(Received) | | | Unrealized
Appreciation/
(Depreciation) | | | Swap
Agreements,
at Value(5) | |
| | Asset | | | Liability | |
BPS | | Brazil Government International Bond | | | 1.000 | % | | | Quarterly | | | | 06/20/2022 | | | | 1.609 | % | | $ | 9,250 | | | $ | (644 | ) | | $ | 464 | | | $ | 0 | | | $ | (180 | ) |
| | Mexico Government International Bond | | | 1.000 | | | | Quarterly | | | | 12/20/2023 | | | | 1.549 | | | | 700 | | | | (5 | ) | | | (12 | ) | | | 0 | | | | (17 | ) |
BRC | | Mexico Government International Bond | | | 1.000 | | | | Quarterly | | | | 06/20/2022 | | | | 1.208 | | | | 19,800 | | | | (519 | ) | | | 392 | | | | 0 | | | | (127 | ) |
| | Springleaf Finance Corp. | | | 5.000 | | | | Quarterly | | | | 06/20/2022 | | | | 3.391 | | | | 800 | | | | 66 | | | | (24 | ) | | | 42 | | | | 0 | |
CBK | | Mexico Government International Bond | | | 1.000 | | | | Quarterly | | | | 12/20/2023 | | | | 1.549 | | | | 500 | | | | (2 | ) | | | (10 | ) | | | 0 | | | | (12 | ) |
GST | | Brazil Government International Bond | | | 1.000 | | | | Quarterly | | | | 06/20/2023 | | | | 1.903 | | | | 6,800 | | | | (275 | ) | | | 27 | | | | 0 | | | | (248 | ) |
| | Mexico Government International Bond | | | 1.000 | | | | Quarterly | | | | 06/20/2023 | | | | 1.434 | | | | 7,400 | | | | (69 | ) | | | (61 | ) | | | 0 | | | | (130 | ) |
| | Springleaf Finance Corp. | | | 5.000 | | | | Quarterly | | | | 06/20/2022 | | | | 3.391 | | | | 500 | | | | 43 | | | | (17 | ) | | | 26 | | | | 0 | |
HUS | | Mexico Government International Bond | | | 1.000 | | | | Quarterly | | | | 06/20/2023 | | | | 1.434 | | | | 6,500 | | | | (47 | ) | | | (67 | ) | | | 0 | | | | (114 | ) |
| | Mexico Government International Bond | | | 1.000 | | | | Quarterly | | | | 12/20/2023 | | | | 1.549 | | | | 2,800 | | | | (39 | ) | | | (30 | ) | | | 0 | | | | (69 | ) |
JPM | | Mexico Government International Bond | | | 1.000 | | | | Quarterly | | | | 12/20/2023 | | | | 1.549 | | | | 700 | | | | (7 | ) | | | (10 | ) | | | 0 | | | | (17 | ) |
| | | | | | | | | | | | | | | | | | | | | | | | | | | | | | | | | | | | | | |
| | | | | | | | | | | | | | | | | | | | | | $ | (1,498 | ) | | $ | 652 | | | $ | 68 | | | $ | (914 | ) |
| | | | | | | | | | | | | | | | | | | | | | | | | | | | | | | | | | | | | | |
Total Swap Agreements | | | $ | (1,514 | ) | | $ | 666 | | | $ | 68 | | | $ | (916 | ) |
| | | | | | | | | | | | | | | | | | | | | | | | | | | | | | | | | | | | | | |
| | | | | | |
| 48 | | PIMCO MANAGED ACCOUNTS TRUST | | | | See Accompanying Notes |
December 31, 2018
FINANCIAL DERIVATIVE INSTRUMENTS: OVER THE COUNTER SUMMARY
The following is a summary by counterparty of the market value of OTC financial derivative instruments and collateral pledged/(received) as of December 31, 2018:
| | | | | | | | | | | | | | | | | | | | | | | | | | | | | | | | | | | | | | | | | | | | | | | | |
| | | Financial Derivative Assets | | | | | | Financial Derivative Liabilities | | | | | | | | | | |
| Counterparty | | Forward
Foreign
Currency
Contracts | | | Purchased
Options | | | Swap
Agreements | | | Total
Over the
Counter | | | | | | Forward
Foreign
Currency
Contracts | | | Written
Options | | | Swap
Agreements | | | Total
Over the
Counter | | | Net Market
Value of OTC
Derivatives | | | Collateral
Pledged/
(Received) | | | Net
Exposure(6) | |
BOA | | $ | 0 | | | $ | 0 | | | $ | 0 | | | $ | 0 | | | | | | | $ | (96 | ) | | $ | (9 | ) | | $ | 0 | | | $ | (105 | ) | | $ | (105 | ) | | $ | 0 | | | $ | (105 | ) |
BPS | | | 0 | | | | 0 | | | | 0 | | | | 0 | | | | | | | | 0 | | | | 0 | | | | (197 | ) | | | (197 | ) | | | (197 | ) | | | 0 | | | | (197 | ) |
BRC | | | 0 | | | | 0 | | | | 42 | | | | 42 | | | | | | | | 0 | | | | 0 | | | | (127 | ) | | | (127 | ) | | | (85 | ) | | | 0 | | | | (85 | ) |
CBK | | | 979 | | | | 0 | | | | 0 | | | | 979 | | | | | | | | (981 | ) | | | (22 | ) | | | (12 | ) | | | (1,015 | ) | | | (36 | ) | | | 0 | | | | (36 | ) |
GLM | | | 459 | | | | 0 | | | | 0 | | | | 459 | | | | | | | | 0 | | | | 0 | | | | 0 | | | | 0 | | | | 459 | | | | (580 | ) | | | (121 | ) |
GST | | | 0 | | | | 0 | | | | 26 | | | | 26 | | | | | | | | 0 | | | | (39 | ) | | | (380 | ) | | | (419 | ) | | | (393 | ) | | | 421 | | | | 28 | |
HUS | | | 0 | | | | 0 | | | | 0 | | | | 0 | | | | | | | | (251 | ) | | | 0 | | | | (183 | ) | | | (434 | ) | | | (434 | ) | | | 264 | | | | (170 | ) |
IND | | | 85 | | | | 0 | | | | 0 | | | | 85 | | | | | | | | 0 | | | | 0 | | | | 0 | | | | 0 | | | | 85 | | | | 0 | | | | 85 | |
JPM | | | 222 | | | | 0 | | | | 0 | | | | 222 | | | | | | | | 0 | | | | 0 | | | | (17 | ) | | | (17 | ) | | | 205 | | | | 0 | | | | 205 | |
MYI | | | 0 | | | | 0 | | | | 0 | | | | 0 | | | | | | | | (1 | ) | | | 0 | | | | 0 | | | | (1 | ) | | | (1 | ) | | | 66 | | | | 65 | |
SCX | | | 9 | | | | 0 | | | | 0 | | | | 9 | | | | | | | | 0 | | | | 0 | | | | 0 | | | | 0 | | | | 9 | | | | 0 | | | | 9 | |
SOG | | | 374 | | | | 0 | | | | 0 | | | | 374 | | | | | | | | (515 | ) | | | 0 | | | | 0 | | | | (515 | ) | | | (141 | ) | | | 285 | | | | 144 | |
SSB | | | 0 | | | | 0 | | | | 0 | | | | 0 | | | | | | | | (60 | ) | | | 0 | | | | 0 | | | | (60 | ) | | | (60 | ) | | | 365 | | | | 305 | |
| | | | | | | | | | | | | | | | | | | | | | | | | | | | | | | | | | | | | | | | | | | | | | | | |
Total Over the Counter | | $ | 2,128 | | | $ | 0 | | | $ | 68 | | | $ | 2,196 | | | | | | | $ | (1,904 | ) | | $ | (70 | ) | | $ | (916 | ) | | $ | (2,890 | ) | | | | | | | | | | | | |
| | | | | | | | | | | | | | | | | | | | | | | | | | | | | | | | | | | | | | | | | | | | | | | | |
| (j) | Securities with an aggregate market value of $1,402 have been pledged as collateral for financial derivative instruments as governed by International Swaps and Derivatives Association, Inc. master agreements as of December 31, 2018. |
| (1) | If the Portfolio is a buyer of protection and a credit event occurs, as defined under the terms of that particular swap agreement, the Portfolio will either (i) receive from the seller of protection an amount equal to the notional amount of the swap and deliver the referenced obligation or underlying securities comprising the referenced index or (ii) receive a net settlement amount in the form of cash, securities or other deliverable obligations equal to the notional amount of the swap less the recovery value of the referenced obligation or underlying securities comprising the referenced index. |
| (2) | If the Portfolio is a seller of protection and a credit event occurs, as defined under the terms of that particular swap agreement, the Portfolio will either (i) pay to the buyer of protection an amount equal to the notional amount of the swap and take delivery of the referenced obligation or underlying securities comprising the referenced index or (ii) pay a net settlement amount in the form of cash, securities or other deliverable obligations equal to the notional amount of the swap less the recovery value of the referenced obligation or underlying securities comprising the referenced index. |
| (3) | Implied credit spreads, represented in absolute terms, utilized in determining the market value of credit default swap agreements on corporate or sovereign issues as of period end serve as indicators of the current status of the payment/performance risk and represent the likelihood or risk of default for the credit derivative. The implied credit spread of a particular referenced entity reflects the cost of buying/selling protection and may include upfront payments required to be made to enter into the agreement. Wider credit spreads represent a deterioration of the referenced entity’s credit soundness and a greater likelihood or risk of default or other credit event occurring as defined under the terms of the agreement. |
| (4) | The maximum potential amount the Portfolio could be required to pay as a seller of credit protection or receive as a buyer of credit protection if a credit event occurs as defined under the terms of that particular swap agreement. |
| (5) | The prices and resulting values for credit default swap agreements serve as indicators of the current status of the payment/performance risk and represent the likelihood of an expected liability (or profit) for the credit derivative should the notional amount of the swap agreement be closed/sold as of the period end. Increasing market values, in absolute terms when compared to the notional amount of the swap, represent a deterioration of the referenced indices’ credit soundness and a greater likelihood or risk of default or other credit event occurring as defined under the terms of the agreement. |
| (6) | Net Exposure represents the net receivable/(payable) that would be due from/to the counterparty in the event of default. Exposure from OTC financial derivative instruments can only be netted across transactions governed under the same master agreement with the same legal entity. See Note 8, Master Netting Arrangements, in the Notes to Financial Statements for more information regarding master netting arrangements. |
| | | | | | |
| See Accompanying Notes | | ANNUAL REPORT | | DECEMBER 31, 2018 | | 49 |
Schedule of InvestmentsPIMCO Fixed Income SHares: Series C(Cont.)
FAIR VALUE OF FINANCIAL DERIVATIVE INSTRUMENTS
The following is a summary of the fair valuation of the Portfolio’s derivative instruments categorized by risk exposure. See Note 7, Principal Risks, in the Notes to Financial Statements on risks of the Portfolio.
Fair Values of Financial Derivative Instruments on the Statements of Assets and Liabilities as of December 31, 2018:
| | | | | | | | | | | | | | | | | | | | | | | | |
| | | Derivatives not accounted for as hedging instruments | |
| | | Commodity
Contracts | | | Credit
Contracts | | | Equity
Contracts | | | Foreign
Exchange
Contracts | | | Interest
Rate Contracts | | | Total | |
Financial Derivative Instruments - Assets | |
Exchange-traded or centrally cleared | |
Purchased Options | | $ | 0 | | | $ | 0 | | | $ | 0 | | | $ | 0 | | | $ | 3 | | | $ | 3 | |
Futures | | | 0 | | | | 0 | | | | 0 | | | | 0 | | | | 741 | | | | 741 | |
Swap Agreements | | | 0 | | | | 9 | | | | 0 | | | | 0 | | | | 1 | | | �� | 10 | |
| | | | | | | | | | | | | | | | | | | | | | | | |
| | $ | 0 | | | $ | 9 | | | $ | 0 | | | $ | 0 | | | $ | 745 | | | $ | 754 | |
| | | | | | | | | | | | | | | | | | | | | | | | |
Over the counter | |
Forward Foreign Currency Contracts | | $ | 0 | | | $ | 0 | | | $ | 0 | | | $ | 2,128 | | | $ | 0 | | | $ | 2,128 | |
Swap Agreements | | | 0 | | | | 68 | | | | 0 | | | | 0 | | | | 0 | | | | 68 | |
| | | | | | | | | | | | | | | | | | | | | | | | |
| | $ | 0 | | | $ | 68 | | | $ | 0 | | | $ | 2,128 | | | $ | 0 | | | $ | 2,196 | |
| | | | | | | | | | | | | | | | | | | | | | | | |
| | $ | 0 | | | $ | 77 | | | $ | 0 | | | $ | 2,128 | | | $ | 745 | | | $ | 2,950 | |
| | | | | | | | | | | | | | | | | | | | | | | | |
|
Financial Derivative Instruments - Liabilities | |
Exchange-traded or centrally cleared | |
Futures | | $ | 0 | | | $ | 0 | | | $ | 0 | | | $ | 0 | | | $ | 115 | | | $ | 115 | |
Swap Agreements | | | 0 | | | | 57 | | | | 0 | | | | 0 | | | | 1,881 | | | | 1,938 | |
| | | | | | | | | | | | | | | | | | | | | | | | |
| | $ | 0 | | | $ | 57 | | | $ | 0 | | | $ | 0 | | | $ | 1,996 | | | $ | 2,053 | |
| | | | | | | | | | | | | | | | | | | | | | | | |
Over the counter | |
Forward Foreign Currency Contracts | | $ | 0 | | | $ | 0 | | | $ | 0 | | | $ | 1,904 | | | $ | 0 | | | $ | 1,904 | |
Written Options | | | 0 | | | | 70 | | | | 0 | | | | 0 | | | | 0 | | | | 70 | |
Swap Agreements | | | 0 | | | | 916 | | | | 0 | | | | 0 | | | | 0 | | | | 916 | |
| | | | | | | | | | | | | | | | | | | | | | | | |
| | $ | 0 | | | $ | 986 | | | $ | 0 | | | $ | 1,904 | | | $ | 0 | | | $ | 2,890 | |
| | | | | | | | | | | | | | | | | | | | | | | | |
| | $ | 0 | | | $ | 1,043 | | | $ | 0 | | | $ | 1,904 | | | $ | 1,996 | | | $ | 4,943 | |
| | | | | | | | | | | | | | | | | | | | | | | | |
The effect of Financial Derivative Instruments on the Statements of Operations for the period ended December 31, 2018:
| | | | | | | | | | | | | | | | | | | | | | | | |
| | | Derivatives not accounted for as hedging instruments | |
| | | Commodity
Contracts | | | Credit
Contracts | | | Equity
Contracts | | | Foreign
Exchange
Contracts | | | Interest
Rate Contracts | | | Total | |
Net Realized Gain (Loss) on Financial Derivative Instruments | |
Exchange-traded or centrally cleared | |
Purchased Options | | $ | 0 | | | $ | 0 | | | $ | 0 | | | $ | 0 | | | $ | (55 | ) | | $ | (55 | ) |
Futures | | | 0 | | | | 0 | | | | 0 | | | | 0 | | | | (2,416 | ) | | | (2,416 | ) |
Swap Agreements | | | 0 | | | | 3,929 | | | | 0 | | | | 0 | | | | (55 | ) | | | 3,874 | |
| | | | | | | | | | | | | | | | | | | | | | | | |
| | $ | 0 | | | $ | 3,929 | | | $ | 0 | | | $ | 0 | | | $ | (2,526 | ) | | $ | 1,403 | |
| | | | | | | | | | | | | | | | | | | | | | | | |
Over the counter | |
Forward Foreign Currency Contracts | | $ | 0 | | | $ | 0 | | | $ | 0 | | | $ | 8,146 | | | $ | 0 | | | $ | 8,146 | |
Purchased Options | | | 0 | | | | 0 | | | | 0 | | | | 0 | | | | (52 | ) | | | (52 | ) |
Written Options | | | 0 | | | | 742 | | | | 0 | | | | 0 | | | | 80 | | | | 822 | |
Swap Agreements | | | 0 | | | | 1,271 | | | | 0 | | | | 0 | | | | 0 | | | | 1,271 | |
| | | | | | | | | | | | | | | | | | | | | | | | |
| | $ | 0 | | | $ | 2,013 | | | $ | 0 | | | $ | 8,146 | | | $ | 28 | | | $ | 10,187 | |
| | | | | | | | | | | | | | | | | | | | | | | | |
| | $ | 0 | | | $ | 5,942 | | | $ | 0 | | | $ | 8,146 | | | $ | (2,498 | ) | | $ | 11,590 | |
| | | | | | | | | | | | | | | | | | | | | | | | |
| | | | | | |
| 50 | | PIMCO MANAGED ACCOUNTS TRUST | | | | See Accompanying Notes |
December 31, 2018
| | | | | | | | | | | | | | | | | | | | | | | | |
| | | Derivatives not accounted for as hedging instruments | |
| | | Commodity
Contracts | | | Credit
Contracts | | | Equity
Contracts | | | Foreign
Exchange
Contracts | | | Interest
Rate Contracts | | | Total | |
Net Change in Unrealized Appreciation (Depreciation) on Financial Derivative Instruments | |
Exchange-traded or centrally cleared | |
Purchased Options | | $ | 0 | | | $ | 0 | | | $ | 0 | | | $ | 0 | | | $ | 4 | | | $ | 4 | |
Futures | | | 0 | | | | 0 | | | | 0 | | | | 0 | | | | 4,912 | | | | 4,912 | |
Swap Agreements | | | 0 | | | | (3,194 | ) | | | 0 | | | | 0 | | | | (1,951 | ) | | | (5,145 | ) |
| | | | | | | | | | | | | | | | | | | | | | | | |
| | $ | 0 | | | $ | (3,194 | ) | | $ | 0 | | | $ | 0 | | | $ | 2,965 | | | $ | (229 | ) |
| | | | | | | | | | | | | | | | | | | | | | | | |
Over the counter | |
Forward Foreign Currency Contracts | | $ | 0 | | | $ | 0 | | | $ | 0 | | | $ | 2,292 | | | $ | 0 | | | $ | 2,292 | |
Written Options | | | 0 | | | | (4 | ) | | | 0 | | | | 0 | | | | 0 | | | | (4 | ) |
Swap Agreements | | | 0 | | | | (1,031 | ) | | | 0 | | | | 0 | | | | 0 | | | | (1,031 | ) |
| | | | | | | | | | | | | | | | | | | | | | | | |
| | $ | 0 | | | $ | (1,035 | ) | | $ | 0 | | | $ | 2,292 | | | $ | 0 | | | $ | 1,257 | |
| | | | | | | | | | | | | | | | | | | | | | | | |
| | $ | 0 | | | $ | (4,229 | ) | | $ | 0 | | | $ | 2,292 | | | $ | 2,965 | | | $ | 1,028 | |
| | | | | | | | | | | | | | | | | | | | | | | | |
FAIR VALUE MEASUREMENTS
The following is a summary of the fair valuations according to the inputs used as of December 31, 2018 in valuing the Portfolio’s assets and liabilities:
| | | | | | | | | | | | | | | | |
| Category and Subcategory | | Level 1 | | | Level 2 | | | Level 3 | | | Fair
Value at
12/31/2018 | |
Investments in Securities, at Value | |
Loan Participations and Assignments | | $ | 0 | | | $ | 14,847 | | | $ | 3,766 | | | $ | 18,613 | |
Corporate Bonds & Notes | |
Banking & Finance | | | 0 | | | | 445,885 | | | | 83 | | | | 445,968 | |
Industrials | | | 0 | | | | 131,606 | | | | 6,058 | | | | 137,664 | |
Utilities | | | 0 | | | | 30,504 | | | | 0 | | | | 30,504 | |
Municipal Bonds & Notes | |
Illinois | | | 0 | | | | 2,337 | | | | 0 | | | | 2,337 | |
Texas | | | 0 | | | | 5,814 | | | | 0 | | | | 5,814 | |
U.S. Government Agencies | | | 0 | | | | 623,130 | | | | 0 | | | | 623,130 | |
U.S. Treasury Obligations | | | 0 | | | | 161,996 | | | | 0 | | | | 161,996 | |
Non-Agency Mortgage-Backed Securities | | | 0 | | | | 49,198 | | | | 22,700 | | | | 71,898 | |
Asset-Backed Securities | | | 0 | | | | 320,479 | | | | 0 | | | | 320,479 | |
Sovereign Issues | | | 0 | | | | 9,116 | | | | 0 | | | | 9,116 | |
Short-Term Instruments | |
Repurchase Agreements | | | 0 | | | | 33,175 | | | | 0 | | | | 33,175 | |
U.S. Treasury Bills | | | 0 | | | | 66 | | | | 0 | | | | 66 | |
| | $ | 0 | | | $ | 1,828,153 | | | $ | 32,607 | | | $ | 1,860,760 | |
|
Investments in Affiliates, at Value | |
Short-Term Instruments | |
Central Funds Used for Cash Management Purposes | | $ | 16,339 | | | $ | 0 | | | $ | 0 | | | $ | 16,339 | |
| | | | |
Total Investments | | $ | 16,339 | | | $ | 1,828,153 | | | $ | 32,607 | | | $ | 1,877,099 | |
|
Financial Derivative Instruments - Assets | |
Exchange-traded or centrally cleared | | | 741 | | | | 13 | | | | 0 | | | | 754 | |
Over the counter | | | 0 | | | | 2,196 | | | | 0 | | | | 2,196 | |
| | $ | 741 | | | $ | 2,209 | | | $ | 0 | | | $ | 2,950 | |
| | | | | | |
| See Accompanying Notes | | ANNUAL REPORT | | DECEMBER 31, 2018 | | 51 |
Schedule of InvestmentsPIMCO Fixed Income SHares: Series C(Cont.)
December 31, 2018
| | | | | | | | | | | | | | | | |
| Category and Subcategory | | Level 1 | | | Level 2 | | | Level 3 | | | Fair
Value at
12/31/2018 | |
Financial Derivative Instruments - Liabilities | |
Exchange-traded or centrally cleared | | $ | (115 | ) | | $ | (1,938 | ) | | $ | 0 | | | $ | (2,053 | ) |
Over the counter | | | 0 | | | | (2,890 | ) | | | 0 | | | | (2,890 | ) |
| | $ | (115 | ) | | $ | (4,828 | ) | | $ | 0 | | | $ | (4,943 | ) |
| | | | |
Total Financial Derivative Instruments | | $ | 626 | | | $ | (2,619 | ) | | $ | 0 | | | $ | (1,993 | ) |
| | | | |
Totals | | $ | 16,965 | | | $ | 1,825,534 | | | $ | 32,607 | | | $ | 1,875,106 | |
The following is a reconciliation of the fair valuations using significant unobservable inputs (Level 3) for the Portfolio during the period ended December 31, 2018:
| | | | | | | | | | | | | | | | | | | | | | | | | | | | | | | | | | | | | | | | |
| Category and Subcategory | | Beginning
Balance
at 12/31/2017 | | | Net
Purchases | | | Net
Sales | | | Accrued
Discounts/
(Premiums) | | | Realized
Gain/
(Loss) | | | Net Change in
Unrealized
Appreciation/
(Depreciation)(1) | | | Transfers
into
Level 3 | | | Transfers
out of
Level 3 | | | Ending
Balance
at 12/31/2018 | | | Net Change in
Unrealized
Appreciation/
(Depreciation)
on Investments
Held at
12/31/2018(1) | |
Investments in Securities, at Value | |
Loan Participations and Assignments | | $ | 30,917 | | | $ | 0 | | | $ | (19,015 | ) | | $ | 33 | | | $ | 491 | | | $ | (607 | ) | | $ | 0 | | | $ | (8,053 | ) | | $ | 3,766 | | | $ | (140 | ) |
Corporate Bonds & Notes | |
Banking & Finance | | | 0 | | | | 0 | | | | 0 | | | | 0 | | | | 0 | | | | 83 | | | | 0 | | | | 0 | | | | 83 | | | | 83 | |
Industrials | | | 199 | | | | 0 | | | | (196 | ) | | | (2 | ) | | | (7 | ) | | | 6 | | | | 6,058 | | | | 0 | | | | 6,058 | | | | 0 | |
Non-Agency Mortgage-Backed Securities | | | 21,210 | | | | 2,986 | | | | (1,315 | ) | | | 0 | | | | 0 | | | | (181 | ) | | | 0 | | | | 0 | | | | 22,700 | | | | (168 | ) |
| | | | | | | | | | | | | | | | | | | | | | | | | | | | | | | | | | | | | | | | |
Totals | | $ | 52,326 | | | $ | 2,986 | | | $ | (20,526 | ) | | $ | 31 | | | $ | 484 | | | $ | (699 | ) | | $ | 6,058 | | | $ | (8,053 | ) | | $ | 32,607 | | | $ | (225 | ) |
| | | | | | | | | | | | | | | | | | | | | | | | | | | | | | | | | | | | | | | | |
The following is a summary of significant unobservable inputs used in the fair valuations of assets and liabilities categorized within Level 3 of the fair value hierarchy:
| | | | | | | | | | | | | | | | | | | | |
| Category and Subcategory | | Ending
Balance
at 12/31/2018 | | Valuation
Technique | | Unobservable
Inputs | | Input Value(s)
(% Unless
Noted
Otherwise) |
Investments in Securities, at Value | |
Loan Participations and Assignments | | | $ | 3,766 | | | Proxy Pricing | | Base Price | | | | 96.340 | |
Corporate Bonds & Notes | | | | | | | | | | | | | | |
Banking & Finance | | | | 83 | | | Other Valuation Techniques(2) | | — | | | | — | |
Industrials | | | | 6,058 | | | Third Party Vendor | | Broker Quote | | | | 99.310 | |
Non-Agency Mortgage-Backed Securities | | | | 22,700 | | | Third Party Vendor | | Broker Quote | | | | 100.000-100.521 | |
| | | | | | | | | | | | | | |
Total | | | $ | 32,607 | | | | | | | | | | |
| | | | | | | | | | | | | | |
| (1) | Any difference between Net Change in Unrealized Appreciation/(Depreciation) and Net Change in Unrealized Appreciation/(Depreciation) on Investments Held at December 31, 2018 may be due to an investment no longer held or categorized as Level 3 at period end. |
| (2) | Includes valuation techniques not defined in the Notes to Financial Statements as securities valued using such techniques are not considered significant to the Portfolio. |
| | | | | | |
| 52 | | PIMCO MANAGED ACCOUNTS TRUST | | | | See Accompanying Notes |
Schedule of InvestmentsPIMCO Fixed Income SHares: Series LD
December 31, 2018
(Amounts in thousands*, except number of shares, contracts and units, if any)
| | | | | | | | | | | | |
| | | | | PRINCIPAL
AMOUNT
(000S) | | | | | MARKET
VALUE
(000S) | |
| INVESTMENTS IN SECURITIES 253.1% | |
| | | | | | | | | | | | |
| LOAN PARTICIPATIONS AND ASSIGNMENTS 1.5% | |
|
Las Vegas Sands LLC | |
4.272% due 03/27/2025 | | $ | | | 244 | | | $ | | | 234 | |
|
Qatar National Bank SAQ | |
3.516% due 12/22/2020 | | | | | 1,000 | | | | | | 992 | |
| | | | | | | | | | | | |
Total Loan Participations and Assignments (Cost $1,238) | | | 1,226 | |
| | | | | | | | | | | | |
| |
| CORPORATE BONDS & NOTES 126.6% | |
| |
| BANKING & FINANCE 65.1% | |
|
AerCap Ireland Capital DAC | |
4.250% due 07/01/2020 (d) | | | | | 500 | | | | | | 501 | |
4.625% due 10/30/2020 (d) | | | | | 500 | | | | | | 504 | |
|
Air Lease Corp. | |
2.750% due 01/15/2023 (d) | | | | | 1,300 | | | | | | 1,231 | |
4.750% due 03/01/2020 (d) | | | | | 500 | | | | | | 507 | |
|
Aircastle Ltd. | |
5.500% due 02/15/2022 (d) | | | | | 1,500 | | | | | | 1,536 | |
|
Ally Financial, Inc. | |
3.500% due 01/27/2019 | | | | | 300 | | | | | | 300 | |
4.125% due 03/30/2020 | | | | | 300 | | | | | | 298 | |
4.250% due 04/15/2021 | | | | | 200 | | | | | | 197 | |
8.000% due 03/15/2020 | | | | | 200 | | | | | | 207 | |
|
American Tower Corp. | |
3.300% due 02/15/2021 | | | | | 400 | | | | | | 398 | |
|
Aozora Bank Ltd. | |
2.750% due 03/09/2020 (d) | | | | | 1,000 | | | | | | 993 | |
|
Assurant, Inc. | |
4.072% (US0003M + 1.250%) due 03/26/2021 ~ | | | | | 400 | | | | | | 400 | |
|
Athene Global Funding | |
4.038% (US0003M + 1.230%) due 07/01/2022 ~(d) | | | | | 900 | | | | | | 904 | |
|
Aviation Capital Group LLC | |
2.875% due 01/20/2022 (d) | | | | | 800 | | | | | | 775 | |
4.125% due 08/01/2025 | | | | | 400 | | | | | | 389 | |
6.750% due 04/06/2021 (d) | | | | | 250 | | | | | | 265 | |
|
Barclays PLC | |
2.750% due 11/08/2019 (d) | | | | | 1,000 | | | | | | 993 | |
|
BGC Partners, Inc. | |
5.125% due 05/27/2021 (d) | | | | | 300 | | | | | | 303 | |
|
BOC Aviation Ltd. | |
2.375% due 09/15/2021 (d) | | | | | 400 | | | | | | 386 | |
3.000% due 03/30/2020 (d) | | | | | 850 | | | | | | 846 | |
3.000% due 05/23/2022 | | | | | 1,300 | | | | | | 1,266 | |
3.875% due 05/09/2019 | | | | | 294 | | | | | | 295 | |
|
Cantor Fitzgerald LP | |
6.500% due 06/17/2022 (d) | | | | | 200 | | | | | | 212 | |
7.875% due 10/15/2019 (d) | | | | | 1,500 | | | | | | 1,544 | |
| | | | | | | | | | | | |
| | | | | PRINCIPAL
AMOUNT
(000S) | | | | | MARKET
VALUE
(000S) | |
|
Citigroup, Inc. | |
3.437% (US0003M + 0.950%) due 07/24/2023 ~(d) | | $ | | | 1,500 | | | $ | | | 1,466 | |
|
Credit Suisse Group Funding Guernsey Ltd. | |
3.800% due 09/15/2022 (d) | | | | | 850 | | | | | | 844 | |
|
Danske Bank A/S | |
3.836% (US0003M + 1.060%) due 09/12/2023 ~(d) | | | | | 1,500 | | | | | | 1,444 | |
|
Doric Nimrod Air Finance Alpha Ltd. Pass-Through Trust | |
5.125% due 11/30/2024 | | | | | 105 | | | | | | 109 | |
|
Five Corners Funding Trust | |
4.419% due 11/15/2023 (d) | | | | | 500 | | | | | | 515 | |
|
Ford Motor Credit Co. LLC | |
2.681% due 01/09/2020 (d) | | | | | 2,000 | | | | | | 1,967 | |
5.750% due 02/01/2021 | | | | | 500 | | | | | | 510 | |
|
General Motors Financial Co., Inc. | |
3.500% due 07/10/2019 (d) | | | | | 2,000 | | | | | | 2,000 | |
|
Goodman HK Finance | |
4.375% due 06/19/2024 | | | | | 1,100 | | | | | | 1,105 | |
|
Hartford Financial Services Group, Inc. | |
5.500% due 03/30/2020 (d) | | | | | 350 | | | | | | 359 | |
|
HSBC Holdings PLC | |
3.426% (US0003M + 0.650%) due 09/11/2021 ~(d) | | | | | 2,500 | | | | | | 2,468 | |
|
Hyundai Capital Services, Inc. | |
1.625% due 08/30/2019 | | | | | 1,000 | | | | | | 990 | |
|
ICICI Bank Ltd. | |
3.125% due 08/12/2020 | | | | | 300 | | | | | | 296 | |
3.500% due 03/18/2020 | | | | | 400 | | | | | | 399 | |
|
International Lease Finance Corp. | |
6.250% due 05/15/2019 (d) | | | | | 200 | | | | | | 202 | |
8.250% due 12/15/2020 (d) | | | | | 250 | | | | | | 269 | |
|
JPMorgan Chase & Co. | |
5.990% (US0003M + 3.470%) due 01/30/2019 ~(b) | | | | | 646 | | | | | | 640 | |
|
LeasePlan Corp. NV | |
2.875% due 01/22/2019 (d) | | | | | 600 | | | | | | 600 | |
|
Lloyds Banking Group PLC | |
7.000% due 06/27/2019 •(b)(c) | | GBP | | | 1,050 | | | | | | 1,341 | |
|
Macquarie Bank Ltd. | |
2.600% due 06/24/2019 | | $ | | | 100 | | | | | | 100 | |
|
Mitsubishi UFJ Financial Group, Inc. | |
3.368% (US0003M + 0.860%) due 07/26/2023 ~(d) | | | | | 2,000 | | | | | | 1,979 | |
|
Mitsubishi UFJ Lease & Finance Co. Ltd. | |
2.250% due 09/07/2021 | | | | | 1,000 | | | | | | 960 | |
2.750% due 10/21/2020 | | | | | 300 | | | | | | 295 | |
|
Mizuho Financial Group, Inc. | |
3.647% (US0003M + 0.940%) due 02/28/2022 ~(d) | | | | | 1,400 | | | | | | 1,400 | |
| | | | | | |
| See Accompanying Notes | | ANNUAL REPORT | | DECEMBER 31, 2018 | | 53 |
Schedule of InvestmentsPIMCO Fixed Income SHares: Series LD(Cont.)
| | | | | | | | | | | | |
| | | | | PRINCIPAL
AMOUNT
(000S) | | | | | MARKET
VALUE
(000S) | |
|
Morgan Stanley | |
3.649% (US0003M + 1.180%) due 01/20/2022 ~ | | $ | | | 300 | | | $ | | | 299 | |
|
Navient Corp. | |
4.875% due 06/17/2019 | | | | | 690 | | | | | | 688 | |
5.875% due 03/25/2021 | | | | | 100 | | | | | | 96 | |
8.000% due 03/25/2020 | | | | | 500 | | | | | | 509 | |
|
Nomura Holdings, Inc. | |
6.700% due 03/04/2020 (d) | | | | | 623 | | | | | | 647 | |
|
ORIX Corp. | |
2.900% due 07/18/2022 (d) | | | | | 1,200 | | | | | | 1,173 | |
|
Qatari Diar Finance Co. | |
5.000% due 07/21/2020 | | | | | 600 | | | | | | 612 | |
|
QNB Finance Ltd. | |
2.125% due 09/07/2021 | | | | | 200 | | | | | | 191 | |
4.068% (US0003M + 1.450%) due 08/11/2021 ~ | | | | | 600 | | | | | | 599 | |
|
Royal Bank of Scotland Group PLC | |
3.498% due 05/15/2023 • | | | | | 600 | | | | | | 577 | |
4.086% (US0003M + 1.470%) due 05/15/2023 ~(d) | | | | | 700 | | | | | | 679 | |
4.372% (US0003M + 1.550%) due 06/25/2024 ~ | | | | | 500 | | | | | | 478 | |
|
Santander UK Group Holdings PLC | |
2.875% due 10/16/2020 | | | | | 1,000 | | | | | | 985 | |
|
Santander UK PLC | |
2.350% due 09/10/2019 (d) | | | | | 200 | | | | | | 199 | |
3.400% due 06/01/2021 (d) | | | | | 1,100 | | | | | | 1,095 | |
|
SBA Tower Trust | |
3.156% due 10/10/2045 | | | | | 1,800 | | | | | | 1,784 | |
|
Sinochem Overseas Capital Co. Ltd. | |
4.500% due 11/12/2020 | | | | | 1,000 | | | | | | 1,015 | |
|
SMBC Aviation Capital Finance DAC | |
2.650% due 07/15/2021 (d) | | | | | 1,200 | | | | | | 1,168 | |
2.650% due 07/15/2021 | | | | | 600 | | | | | | 584 | |
3.000% due 07/15/2022 (d) | | | | | 300 | | | | | | 291 | |
|
Springleaf Finance Corp. | |
8.250% due 12/15/2020 | | | | | 200 | | | | | | 207 | |
|
State Bank of India | |
3.358% (US0003M + 0.950%) due 04/06/2020 ~ | | | | | 600 | | | | | | 601 | |
3.622% due 04/17/2019 (d) | | | | | 800 | | | | | | 801 | |
|
VEREIT Operating Partnership LP | |
3.000% due 02/06/2019 (d) | | | | | 500 | | | | | | 500 | |
|
WEA Finance LLC | |
2.700% due 09/17/2019 (d) | | | | | 500 | | | | | | 498 | |
| | | | | | | | | | | | |
| | | | | | | | | | | 53,784 | |
| | | | | | | | | | | | |
| |
| INDUSTRIALS 48.2% | |
|
Allergan Sales LLC | |
5.000% due 12/15/2021 (d) | | | | | 400 | | | | | | 412 | |
| | | | | | | | | | | | |
| | | | | PRINCIPAL
AMOUNT
(000S) | | | | | MARKET
VALUE
(000S) | |
|
Andeavor Logistics LP | |
5.500% due 10/15/2019 | | $ | | | 1,800 | | | $ | | | 1,815 | |
|
Aptiv PLC | |
3.150% due 11/19/2020 (d) | | | | | 700 | | | | | | 695 | |
|
Arrow Electronics, Inc. | |
3.500% due 04/01/2022 (d) | | | | | 600 | | | | | | 592 | |
|
BAT Capital Corp. | |
3.496% (US0003M + 0.880%) due 08/15/2022 ~(d) | | | | | 1,500 | | | | | | 1,472 | |
|
Bayer U.S. Finance LLC | |
2.750% due 07/15/2021 | | | | | 100 | | | | | | 97 | |
|
BMW U.S. Capital LLC | |
3.118% (US0003M + 0.500%)
due 08/13/2021 ~(d) | | | | | 1,500 | | | | | | 1,486 | |
|
Boral Finance Pty. Ltd. | |
3.000% due 11/01/2022 (d) | | | | | 600 | | | | | | 580 | |
|
Broadcom Corp. | |
2.375% due 01/15/2020 (d) | | | | | 1,800 | | | | | | 1,778 | |
|
Central Nippon Expressway Co. Ltd. | |
3.628% (US0003M + 0.850%) due 09/14/2021 ~(d) | | | | | 1,400 | | | | | | 1,404 | |
|
Charter Communications Operating LLC | |
3.579% due 07/23/2020 | | | | | 500 | | | | | | 500 | |
4.191% (US0003M + 1.650%) due 02/01/2024 ~ | | | | | 300 | | | | | | 295 | |
4.464% due 07/23/2022 | | | | | 1,200 | | | | | | 1,212 | |
|
Crown Castle Towers LLC | |
3.222% due 05/15/2042 (d) | | | | | 300 | | | | | | 296 | |
|
CVS Health Corp. | |
3.350% due 03/09/2021 (d) | | | | | 1,000 | | | | | | 997 | |
3.500% due 07/20/2022 (d) | | | | | 200 | | | | | | 199 | |
|
D.R. Horton, Inc. | |
3.750% due 03/01/2019 | | | | | 200 | | | | | | 200 | |
4.000% due 02/15/2020 (d) | | | | | 300 | | | | | | 301 | |
4.375% due 09/15/2022 (d) | | | | | 1,000 | | | | | | 1,012 | |
|
Dell International LLC | |
4.420% due 06/15/2021 | | | | | 400 | | | | | | 400 | |
5.450% due 06/15/2023 (d) | | | | | 400 | | | | | | 407 | |
|
Delta Air Lines Pass-Through Trust | |
7.750% due 06/17/2021 | | | | | 115 | | | | | | 119 | |
|
Delta Air Lines, Inc. | |
3.625% due 03/15/2022 | | | | | 1,400 | | | | | | 1,371 | |
|
DISH DBS Corp. | |
7.875% due 09/01/2019 | | | | | 300 | | | | | | 307 | |
|
Dominion Energy Gas Holdings LLC | |
3.388% (US0003M + 0.600%) due 06/15/2021 ~(d) | | | | | 1,000 | | | | | | 998 | |
|
Energy Transfer Operating LP | |
9.000% due 04/15/2019 (d) | | | | | 200 | | | | | | 203 | |
|
Flex Ltd. | |
4.625% due 02/15/2020 (d) | | | | | 300 | | | | | | 302 | |
| | | | | | |
| 54 | | PIMCO MANAGED ACCOUNTS TRUST | | | | See Accompanying Notes |
December 31, 2018
| | | | | | | | | | | | |
| | | | | PRINCIPAL
AMOUNT
(000S) | | | | | MARKET
VALUE
(000S) | |
|
GATX Corp. | |
3.302% (US0003M + 0.720%) due 11/05/2021 ~ | | $ | | | 200 | | | $ | | | 198 | |
|
General Electric Co. | |
5.000% due 01/21/2021 •(b) | | | | | 2,000 | | | | | | 1,533 | |
6.000% due 08/07/2019 | | | | | 500 | | | | | | 505 | |
|
General Mills, Inc. | |
3.459% (US0003M + 1.010%)
due 10/17/2023 ~ | | | | | 100 | | | | | | 98 | |
6.610% due 10/15/2022 | | | | | 500 | | | | | | 528 | |
|
Georgia-Pacific LLC | |
3.734% due 07/15/2023 (d) | | | | | 200 | | | | | | 202 | |
|
Imperial Brands Finance PLC | |
2.950% due 07/21/2020 (d) | | | | | 650 | | | | | | 640 | |
|
Kansas City Southern | |
3.000% due 05/15/2023 (d) | | | | | 1,500 | | | | | | 1,469 | |
|
Latam Airlines Pass-Through Trust | |
4.200% due 08/15/2029 | | | | | 168 | | | | | | 163 | |
|
Masco Corp. | |
5.950% due 03/15/2022 | | | | | 76 | | | | | | 81 | |
7.125% due 03/15/2020 | | | | | 52 | | | | | | 54 | |
|
McCormick & Co., Inc. | |
3.150% due 08/15/2024 (d) | | | | | 1,400 | | | | | | 1,351 | |
|
MGM Resorts International | |
6.750% due 10/01/2020 | | | | | 300 | | | | | | 309 | |
8.625% due 02/01/2019 | | | | | 400 | | | | | | 403 | |
|
Minera y Metalurgica del Boleo SAPI de C.V. | |
2.875% due 05/07/2019 (d) | | | | | 400 | | | | | | 400 | |
|
Mylan NV | |
3.150% due 06/15/2021 (d) | | | | | 1,400 | | | | | | 1,372 | |
|
Pacific National Finance Pty. Ltd. | |
4.625% due 09/23/2020 (d) | | | | | 700 | | | | | | 709 | |
6.000% due 04/07/2023 (d) | | | | | 1,000 | | | | | | 1,065 | |
|
Pioneer Natural Resources Co. | |
3.450% due 01/15/2021 (d) | | | | | 300 | | | | | | 299 | |
|
QUALCOMM, Inc. | |
2.600% due 01/30/2023 (d) | | | | | 1,700 | | | | | | 1,637 | |
|
Reynolds American, Inc. | |
4.000% due 06/12/2022 (d) | | | | | 600 | | | | | | 594 | |
|
Sabine Pass Liquefaction LLC | |
5.625% due 02/01/2021 | | | | | 700 | | | | | | 721 | |
6.250% due 03/15/2022 (d) | | | | | 300 | | | | | | 316 | |
|
Shire Acquisitions Investments Ireland DAC | |
1.900% due 09/23/2019 | | | | | 1,500 | | | | | | 1,479 | |
2.400% due 09/23/2021 | | | | | 100 | | | | | | 97 | |
|
Sky Ltd. | |
3.125% due 11/26/2022 (d) | | | | | 1,000 | | | | | | 987 | |
|
Syngenta Finance NV | |
3.933% due 04/23/2021 | | | | | 200 | | | | | | 197 | |
|
Telefonica Emisiones S.A. | |
5.134% due 04/27/2020 (d) | | | | | 850 | | | | | | 868 | |
5.877% due 07/15/2019 (d) | | | | | 200 | | | | | | 202 | |
| | | | | | | | | | | | |
| | | | | PRINCIPAL
AMOUNT
(000S) | | | | | MARKET
VALUE
(000S) | |
|
Teva Pharmaceutical Finance Co. BV | |
3.650% due 11/10/2021 | | $ | | | 400 | | | $ | | | 379 | |
|
Teva Pharmaceutical Finance Netherlands BV | |
1.700% due 07/19/2019 (d) | | | | | 500 | | | | | | 494 | |
|
WestJet Airlines Ltd. | |
3.500% due 06/16/2021 (d) | | | | | 1,100 | | | | | | 1,091 | |
| | | | | | | | | | | | |
| | | | | | | | | | | 39,891 | |
| | | | | | | | | | | | |
| |
| UTILITIES 13.3% | |
|
AT&T, Inc. | |
3.504% (US0003M + 0.890%) due 02/15/2023 ~(d) | | | | | 1,100 | | | | | | 1,081 | |
3.956% (US0003M + 1.180%) due 06/12/2024 ~ | | | | | 300 | | | | | | 291 | |
|
Chugoku Electric Power Co., Inc. | |
2.701% due 03/16/2020 | | | | | 200 | | | | | | 199 | |
|
Duquesne Light Holdings, Inc. | |
5.900% due 12/01/2021 (d) | | | | | 300 | | | | | | 318 | |
|
Enel Finance International NV | |
4.250% due 09/14/2023 | | | | | 200 | | | | | | 196 | |
|
FirstEnergy Corp. | |
2.850% due 07/15/2022 | | | | | 700 | | | | | | 683 | |
|
KT Corp. | |
2.625% due 04/22/2019 | | | | | 200 | | | | | | 200 | |
|
NextEra Energy Capital Holdings, Inc. | |
3.257% (US0003M + 0.550%) due 08/28/2021 ~(d) | | | | | 1,800 | | | | | | 1,778 | |
|
Pennsylvania Electric Co. | |
5.200% due 04/01/2020 (d) | | | | | 800 | | | | | | 820 | |
|
Plains All American Pipeline LP | |
2.600% due 12/15/2019 | | | | | 500 | | | | | | 493 | |
|
Sinopec Group Overseas Development Ltd. | |
2.125% due 05/03/2019 | | | | | 800 | | | | | | 798 | |
2.500% due 04/28/2020 | | | | | 1,200 | | | | | | 1,185 | |
|
Southern Power Co. | |
3.342% due 12/20/2020 | | | | | 65 | | | | | | 64 | |
|
Telstra Corp. Ltd. | |
3.125% due 04/07/2025 | | | | | 100 | | | | | | 96 | |
|
Verizon Communications, Inc. | |
3.716% (US0003M + 1.100%) due 05/15/2025 ~(d) | | | | | 1,100 | | | | | | 1,067 | |
|
Vodafone Group PLC | |
3.426% (US0003M + 0.990%) due 01/16/2024 ~(d) | | | | | 1,800 | | | | | | 1,757 | |
| | | | | | | | | | | | |
| | | | | | | | | | | 11,026 | |
| | | | | | | | | | | | |
Total Corporate Bonds & Notes (Cost $106,617) | | | 104,701 | |
| | | | | | | | | | | | |
| |
| | | | | | |
| See Accompanying Notes | | ANNUAL REPORT | | DECEMBER 31, 2018 | | 55 |
Schedule of InvestmentsPIMCO Fixed Income SHares: Series LD(Cont.)
| | | | | | | | | | | | |
| | | | | PRINCIPAL
AMOUNT
(000S) | | | | | MARKET
VALUE
(000S) | |
| MUNICIPAL BONDS & NOTES 1.4% | |
| |
| PENNSYLVANIA 1.4% | |
|
Pennsylvania Higher Education Assistance Agency Revenue Bonds, Series 2006 | |
2.620% (US0003M + 0.130%)
due 10/25/2036 ~ | | $ | | | 1,130 | | | $ | | | 1,118 | |
| | | | | | | | | | | | |
Total Municipal Bonds & Notes (Cost $1,110) | | | 1,118 | |
| | | | | | | | | | | | |
| |
| U.S. GOVERNMENT AGENCIES 1.0% | |
|
Fannie Mae | |
2.760% due 09/25/2022 • | | | | | 18 | | | | | | 18 | |
3.000% due 03/01/2042 | | | | | 178 | | | | | | 175 | |
3.500% due 08/01/2047 | | | | | 366 | | | | | | 366 | |
|
Freddie Mac | |
6.455% due 01/15/2022 • | | | | | 11 | | | | | | 11 | |
|
Ginnie Mae | |
2.920% due 10/20/2037 • | | | | | 45 | | | | | | 45 | |
2.994% due 08/20/2061 • | | | | | 53 | | | | | | 53 | |
3.114% due 05/20/2066 • | | | | | 176 | | | | | | 179 | |
| | | | | | | | | | | | |
Total U.S. Government Agencies (Cost $845) | | | 847 | |
| | | | | | | | | | | | |
| |
| U.S. TREASURY OBLIGATIONS 87.8% | |
|
U.S. Treasury Inflation Protected Securities (a) | |
0.125% due 04/15/2022 (d) | | | | | 5,927 | | | | | | 5,736 | |
0.625% due 04/15/2023 (d) | | | | | 4,602 | | | | | | 4,528 | |
0.750% due 07/15/2028 (d) | | | | | 6,146 | | | | | | 6,021 | |
|
U.S. Treasury Notes | |
2.625% due 07/31/2020 (d) | | | | | 56,200 | | | | | | 56,270 | |
| | | | | | | | | | | | |
Total U.S. Treasury Obligations (Cost $72,396) | | | 72,555 | |
| | | | | | | | | | | | |
| |
| NON-AGENCY MORTGAGE-BACKED SECURITIES 10.0% | |
|
Banc of America Funding Trust | |
2.770% due 02/20/2035 • | | | | | 10 | | | | | | 10 | |
4.746% due 09/20/2034 ~ | | | | | 71 | | | | | | 73 | |
|
Bear Stearns Adjustable Rate Mortgage Trust | |
3.997% due 04/25/2033 ~ | | | | | 33 | | | | | | 34 | |
4.543% due 11/25/2034 ~ | | | | | 58 | | | | | | 58 | |
4.835% due 01/25/2034 ~ | | | | | 8 | | | | | | 9 | |
|
Citicorp Mortgage Securities Trust | |
5.500% due 08/25/2021 | | | | | 1 | | | | | | 1 | |
|
Citigroup Mortgage Loan Trust | |
4.820% due 10/25/2035 • | | | | | 7 | | | | | | 7 | |
|
Countrywide Alternative Loan Trust | |
2.666% due 07/25/2036 • | | | | | 137 | | | | | | 132 | |
|
Credit Suisse First Boston Mortgage Securities Corp. | |
3.884% due 06/25/2033 ~ | | | | | 17 | | | | | | 17 | |
6.500% due 04/25/2033 | | | | | 64 | | | | | | 65 | |
| | | | | | | | | | | | |
| | | | | PRINCIPAL
AMOUNT
(000S) | | | | | MARKET
VALUE
(000S) | |
|
GSR Mortgage Loan Trust | |
4.300% due 09/25/2035 ~ | | $ | | | 6 | | | $ | | | 7 | |
4.869% due 08/25/2033 • | | | | | 98 | | | | | | 99 | |
|
Holmes Master Issuer PLC | |
2.856% due 10/15/2054 • | | | | | 1,500 | | | | | | 1,497 | |
|
Impac CMB Trust | |
3.146% due 03/25/2035 • | | | | | 378 | | | | | | 368 | |
3.506% due 07/25/2033 • | | | | | 286 | | | | | | 278 | |
|
JPMorgan Mortgage Trust | |
3.855% due 06/25/2035 ~ | | | | | 19 | | | | | | 19 | |
4.303% due 09/25/2034 ~ | | | | | 8 | | | | | | 8 | |
4.336% due 02/25/2035 ~ | | | | | 5 | | | | | | 5 | |
4.642% due 04/25/2035 ~ | | | | | 167 | | | | | | 170 | |
4.701% due 02/25/2034 ~ | | | | | 45 | | | | | | 46 | |
|
Mellon Residential Funding Corp. Mortgage Pass-Through Trust | |
2.892% due 10/20/2029 • | | | | | 13 | | | | | | 13 | |
2.935% due 06/15/2030 • | | | | | 20 | | | | | | 20 | |
|
Merrill Lynch Mortgage Investors Trust | |
2.966% due 04/25/2029 • | | | | | 7 | | | | | | 7 | |
3.146% due 10/25/2028 • | | | | | 6 | | | | | | 6 | |
3.677% due 02/25/2035 ~ | | | | | 138 | | | | | | 143 | |
|
Morgan Stanley Mortgage Loan Trust | |
4.333% due 11/25/2034 ~ | | | | | 9 | | | | | | 9 | |
|
Motel 6 Trust | |
3.375% due 08/15/2034 • | | | | | 861 | | | | | | 848 | |
|
Prime Mortgage Trust | |
2.906% due 02/25/2034 • | | | | | 9 | | | | | | 8 | |
|
Sequoia Mortgage Trust | |
3.170% due 10/19/2026 • | | | | | 71 | | | | | | 71 | |
3.230% due 10/20/2027 • | | | | | 12 | | | | | | 11 | |
|
Structured Asset Mortgage Investments Trust | |
3.050% due 07/19/2034 • | | | | | 46 | | | | | | 45 | |
3.130% due 09/19/2032 • | | | | | 11 | | | | | | 11 | |
6.389% due 06/25/2029 ~ | | | | | 6 | | | | | | 6 | |
|
Structured Asset Securities Corp. Mortgage Loan Trust | |
3.106% due 10/25/2027 • | | | | | 9 | | | | | | 8 | |
|
Thornburg Mortgage Securities Trust | |
3.146% due 09/25/2043 • | | | | | 7 | | | | | | 7 | |
3.718% due 04/25/2045 ~ | | | | | 30 | | | | | | 30 | |
|
VMC Finance LLC | |
3.390% due 10/15/2035 • | | | | | 800 | | | | | | 791 | |
|
WaMu Mortgage Pass-Through Certificates Trust | |
2.776% due 12/25/2045 • | | | | | 210 | | | | | | 208 | |
2.796% due 10/25/2045 • | | | | | 36 | | | | | | 36 | |
2.906% due 06/25/2044 • | | | | | 30 | | | | | | 29 | |
3.246% due 11/25/2034 • | | | | | 71 | | | | | | 70 | |
3.557% due 06/25/2042 • | | | | | 8 | | | | | | 7 | |
|
Wells Fargo Commercial Mortgage Trust | |
3.282% due 12/13/2031 • | | | | | 1,000 | | | | | | 996 | |
| | | | | | |
| 56 | | PIMCO MANAGED ACCOUNTS TRUST | | | | See Accompanying Notes |
December 31, 2018
| | | | | | | | | | | | |
| | | | | PRINCIPAL
AMOUNT
(000S) | | | | | MARKET
VALUE
(000S) | |
|
Wells Fargo Mortgage-Backed Securities Trust | |
4.566% due 12/25/2034 ~ | | $ | | | 105 | | | $ | | | 109 | |
4.668% due 10/25/2033 ~ | | | | | 43 | | | | | | 44 | |
|
WellsFargo-RBS Commercial Mortgage Trust | |
3.905% due 06/15/2044 • | | | | | 1,800 | | | | | | 1,825 | |
| | | | | | | | | | | | |
TotalNon-Agency Mortgage-Backed Securities (Cost $8,232) | | | 8,261 | |
| | | | | | | | | | | | |
| |
| ASSET-BACKED SECURITIES 22.4% | |
|
Allegro CLO Ltd. | |
3.740% due 01/30/2026 • | | | | | 273 | | | | | | 273 | |
|
Amortizing Residential Collateral Trust | |
3.506% due 10/25/2034 • | | | | | 285 | | | | | | 285 | |
|
Argent Securities, Inc. Asset-Backed Pass-Through Certificates | |
3.546% due 04/25/2034 • | | | | | 101 | | | | | | 101 | |
|
Bayview Opportunity Master Fund Trust | |
4.213% due 10/29/2033 Ø | | | | | 475 | | | | | | 476 | |
|
Bear Stearns Asset-Backed Securities Trust | |
3.256% due 03/25/2035 • | | | | | 1,000 | | | | | | 978 | |
3.306% due 10/27/2032 • | | | | | 40 | | | | | | 39 | |
3.706% due 01/25/2045 • | | | | | 554 | | | | | | 552 | |
|
Chase Funding Trust | |
3.246% due 10/25/2032 • | | | | | 68 | | | | | | 67 | |
|
Colony American Finance Ltd. | |
2.544% due 06/15/2048 | | | | | 115 | | | | | | 114 | |
|
Delta Funding Home Equity Loan Trust | |
3.275% due 09/15/2029 • | | | | | 6 | | | | | | 6 | |
|
First Franklin Mortgage Loan Trust | |
2.666% due 04/25/2036 • | | | | | 1,721 | | | | | | 1,671 | |
|
GSAA Home Equity Trust | |
3.146% due 12/25/2034 • | | | | | 9 | | | | | | 10 | |
|
Halcyon Loan Advisors Funding Ltd. | |
3.389% due 04/20/2027 • | | | | | 1,000 | | | | | | 994 | |
3.575% due 04/18/2026 • | | | | | 671 | | | | | | 670 | |
|
LCM LP | |
3.379% due 10/20/2027 • | | | | | 250 | | | | | | 249 | |
|
Monarch Grove CLO | |
3.370% due 01/25/2028 • | | | | | 1,500 | | | | | | 1,485 | |
|
New Century Home Equity Loan Trust | |
3.436% due 11/25/2034 • | | | | | 902 | | | | | | 901 | |
|
NovaStar Mortgage Funding Trust | |
3.166% due 01/25/2036 • | | | | | 1,500 | | | | | | 1,487 | |
|
RAAC Trust | |
3.056% due 01/25/2046 • | | | | | 1,000 | | | | | | 990 | |
|
Renaissance Home Equity Loan Trust | |
3.506% due 12/25/2033 • | | | | | 5 | | | | | | 5 | |
|
Residential Mortgage Loan Trust | |
3.815% due 09/25/2029 • | | | | | 5 | | | | | | 5 | |
| | | | | | | | | | | | |
| | | | | PRINCIPAL
AMOUNT
(000S) | | | | | MARKET
VALUE
(000S) | |
|
Securitized Asset-Backed Receivables LLC Trust | |
3.181% due 01/25/2035 • | | $ | | | 1,033 | | | $ | | | 1,018 | |
|
SLM Student Loan Trust | |
3.240% due 04/25/2023 • | | | | | 795 | | | | | | 788 | |
3.338% due 12/15/2025 • | | | | | 449 | | | | | | 452 | |
3.990% due 04/25/2023 • | | | | | 905 | | | | | | 911 | |
4.190% due 07/25/2023 • | | | | | 750 | | | | | | 763 | |
|
SMB Private Education Loan Trust | |
3.455% due 06/15/2027 • | | | | | 284 | | | | | | 286 | |
|
SoFi Professional Loan Program LLC | |
3.020% due 02/25/2040 | | | | | 292 | | | | | | 290 | |
|
Vericrest Opportunity Loan Transferee LLC | |
3.125% due 09/25/2047 Ø | | | | | 1,090 | | | | | | 1,082 | |
3.250% due 06/25/2047 Ø | | | | | 294 | | | | | | 293 | |
|
Wellfleet CLO Ltd. | |
3.609% due 10/20/2027 • | | | | | 1,000 | | | | | | 1,000 | |
|
Zais CLO Ltd. | |
3.586% due 04/15/2028 • | | | | | 300 | | | | | | 299 | |
| | | | | | | | | | | | |
Total Asset-Backed Securities (Cost $18,531) | | | 18,540 | |
| | | | | | | | | | | | |
| |
| SOVEREIGN ISSUES 1.4% | |
|
Export-Import Bank of India | |
2.750% due 04/01/2020 (d) | | | | | 1,200 | | | | | | 1,187 | |
| | | | | | | | | | | | |
Total Sovereign Issues (Cost $1,202) | | | 1,187 | |
| | | | | | | | | | | | |
| |
| SHORT-TERM INSTRUMENTS 1.0% | |
| |
| CERTIFICATES OF DEPOSIT 0.6% | |
|
Itau CorpBanca | |
2.570% due 01/11/2019 | | | | | 500 | | | | | | 500 | |
| | | | | | | | | | | | |
| |
| COMMERCIAL PAPER 0.4% | |
|
CNH Industrial Capital LLC | |
3.500% due 05/09/2019 | | | | | 300 | | | | | | 296 | |
| | | | | | | | | | | | |
Total Short-Term Instruments (Cost $796) | | | 796 | |
| | | | | | | | | | | | |
|
| |
| Total Investments in Securities (Cost $210,967) | | | 209,231 | |
| | | | | | | | | | | | |
| | | | | | | | | | | | |
| | | | | | |
| See Accompanying Notes | | ANNUAL REPORT | | DECEMBER 31, 2018 | | 57 |
Schedule of InvestmentsPIMCO Fixed Income SHares: Series LD(Cont.)
| | | | | | | | | | | | |
| | | | | SHARES | | | | | MARKET
VALUE
(000S) | |
| INVESTMENTS IN AFFILIATES 6.4% | |
| |
| SHORT-TERM INSTRUMENTS 6.4% | |
| |
| CENTRAL FUNDS USED FOR CASH MANAGEMENT PURPOSES 6.4% | |
| | | |
PIMCO Short-Term Floating NAV Portfolio III | | | 537,960 | | | $ | | | 5,317 | |
| | | | | | | | | | | | |
Total Short-Term Instruments (Cost $5,317) | | | 5,317 | |
| | | | | | | | | | | | |
|
| |
| Total Investments in Affiliates (Cost $5,317) | | | 5,317 | |
| | | | |
| | | | | | | | | | | | |
| Total Investments 259.5% (Cost $216,284) | | | $ | | | 214,548 | |
| | | | | | | | | | | | |
Financial Derivative
Instruments (e)(f) (0.5)% (Cost or Premiums, net $(813)) | | | | | | (378 | ) |
| | | | | | | | | | | | |
| Other Assets and Liabilities, net (159.0)% | | | (131,486 | ) |
| | | | | | | | | | | | |
| Net Assets 100.0% | | | | | | | | $ | | | 82,684 | |
| | | | | | | | | | | | |
NOTES TO SCHEDULE OF INVESTMENTS:
| * | A zero balance may reflect actual amounts rounding to less than one thousand. |
| ~ | Variable or Floating rate security. Rate shown is the rate in effect as of period end. Certain variable rate securities are not based on a published reference rate and spread, rather are determined by the issuer or agent and are based on current market conditions. Reference rate is as of reset date, which may vary by security. These securities may not indicate a reference rate and/or spread in their description. |
| • | Rate shown is the rate in effect as of period end. The rate may be based on a fixed rate, a capped rate or a floor rate and may convert to a variable or floating rate in the future. These securities do not indicate a reference rate and spread in their description. |
| Ø | Coupon represents a rate which changes periodically based on a predetermined schedule or event. Rate shown is the rate in effect as of period end. |
| (a) | Principal amount of security is adjusted for inflation. |
| (b) | Perpetual maturity; date shown, if applicable, represents next contractual call date. |
| (c) | Contingent convertible security. |
BORROWINGS AND OTHER FINANCING TRANSACTIONS
REVERSE REPURCHASE AGREEMENTS:
| | | | | | | | | | | | | | | | | | | | |
| Counterparty | | Borrowing
Rate(1) | | | Settlement
Date | | | Maturity
Date | | | Amount
Borrowed(1) | | | Payable for
Reverse
Repurchase
Agreements | |
CIW | | | 2.850 | % | | | 12/19/2018 | | | | 01/18/2019 | | | $ | (4,542 | ) | | $ | (4,547 | ) |
| | | 2.850 | | | | 12/20/2018 | | | | 01/18/2019 | | | | (11,364 | ) | | | (11,376 | ) |
FOB | | | 2.800 | | | | 12/10/2018 | | | | 01/10/2019 | | | | (5,620 | ) | | | (5,630 | ) |
RDR | | | 2.640 | | | | 12/07/2018 | | | | 01/07/2019 | | | | (592 | ) | | | (593 | ) |
| | | 2.720 | | | | 12/19/2018 | | | | 01/18/2019 | | | | (5,979 | ) | | | (5,985 | ) |
| | | | | | |
| 58 | | PIMCO MANAGED ACCOUNTS TRUST | | | | See Accompanying Notes |
December 31, 2018
| | | | | | | | | | | | | | | | | | | | |
| Counterparty | | Borrowing
Rate(1) | | | Settlement
Date | | | Maturity
Date | | | Amount
Borrowed(1) | | | Payable for
Reverse
Repurchase
Agreements | |
| | | 2.900 | % | | | 12/17/2018 | | | | 01/17/2019 | | | $ | (1,839 | ) | | $ | (1,841 | ) |
UBS | | | 2.760 | | | | 12/14/2018 | | | | 01/14/2019 | | | | (14,940 | ) | | | (14,962 | ) |
| | | 2.760 | | | | 12/17/2018 | | | | 01/17/2019 | | | | (16,278 | ) | | | (16,298 | ) |
| | | 2.770 | | | | 12/21/2018 | | | | 01/22/2019 | | | | (1,895 | ) | | | (1,897 | ) |
| | | | | | | | | | | | | | | | | | | | |
Total Reverse Repurchase Agreements | | | $ | (63,129 | ) |
| | | | | | | | | | | | | | | | | | | | |
SALE-BUYBACK TRANSACTIONS:
| | | | | | | | | | | | | | | | | | | | |
| Counterparty | | Borrowing
Rate(1) | | | Borrowing
Date | | | Maturity
Date | | | Amount
Borrowed(1) | | | Payable for
Sale-Buyback
Transactions(2) | |
BOS | | | 2.950 | % | | | 12/28/2018 | | | | 01/04/2019 | | | $ | (13,046 | ) | | $ | (13,051 | ) |
| | | 3.350 | | | | 12/31/2018 | | | | 01/02/2019 | | | | (69,933 | ) | | | (69,946 | ) |
| | | | | | | | | | | | | | | | | | | | |
Total Sale-Buyback Transactions | | | | | | | | | | | $ | (82,997 | ) |
| | | | | | | | | | | | | | | | | | | | |
BORROWINGS AND OTHER FINANCING TRANSACTIONS SUMMARY
The following is a summary by counterparty of the market value of Borrowings and Other Financing Transactions and collateral pledged/(received) as of December 31, 2018:
| | | | | | | | | | | | | | | | | | | | | | | | |
| Counterparty | | Repurchase
Agreement
Proceeds
to be
Received | | | Payable for
Reverse
Repurchase
Agreements | | | Payable for
Sale-Buyback
Transactions(2) | | | Total
Borrowings and
Other Financing
Transactions | | | Collateral
Pledged/
(Received) | | | Net Exposure(3) | |
Global/Master Repurchase Agreement | |
CIW | | $ | 0 | | | $ | (15,923 | ) | | $ | 0 | | | $ | (15,923 | ) | | $ | 16,645 | | | $ | 722 | |
FOB | | | 0 | | | | (5,630 | ) | | | 0 | | | | (5,630 | ) | | | 5,987 | | | | 357 | |
RDR | | | 0 | | | | (8,419 | ) | | | 0 | | | | (8,419 | ) | | | 8,809 | | | | 390 | |
UBS | | | 0 | | | | (33,157 | ) | | | 0 | | | | (33,157 | ) | | | 34,629 | | | | 1,472 | |
| | | | |
Master Securities Forward Transaction Agreement | | | | | | | | | | | | | | | | | |
BOS | | | 0 | | | | 0 | | | | (82,997 | ) | | | (82,997 | ) | | | 82,359 | | | | (638 | ) |
| | | | | | | | | | | | | | | | | | | | | | | | |
Total Borrowings and Other Financing Transactions | | $ | 0 | | | $ | (63,129 | ) | | $ | (82,997 | ) | | | | | | | | | | | | |
| | | | | | | | | | | | | | | | | | | | | | | | |
CERTAIN TRANSFERS ACCOUNTED FOR AS SECURED BORROWINGS
Remaining Contractual Maturity of the Agreements
| | | | | | | | | | | | | | | | | | | | |
| | | Overnight and
Continuous | | | Up to 30 days | | | 31-90 days | | | Greater Than 90 days | | | Total | |
Reverse Repurchase Agreements | |
Corporate Bonds & Notes | | $ | 0 | | | $ | (63,129 | ) | | $ | 0 | | | $ | 0 | | | $ | (63,129 | ) |
| | | | | | | | | | | | | | | | | | | | |
Total | | $ | 0 | | | $ | (63,129 | ) | | $ | 0 | | | $ | 0 | | | $ | (63,129 | ) |
|
Sale-Buyback Transactions | |
U.S. Treasury Obligations | | | 0 | | | | (82,997 | ) | | | 0 | | | | 0 | | | | (82,997 | ) |
| | | | | | | | | | | | | | | | | | | | |
Total | | $ | 0 | | | $ | (82,997 | ) | | $ | 0 | | | $ | 0 | | | $ | (82,997 | ) |
| | | | | | | | | | | | | | | | | | | | |
Total Borrowings | | $ | 0 | | | $ | (146,126 | ) | | $ | 0 | | | $ | 0 | | | $ | (146,126 | ) |
| | | | | | | | | | | | | | | | | | | | |
Payable for reverse repurchase agreements and sale-buyback financing transactions | | | $ | (146,126 | ) |
| | | | | | | | | | | | | | | | | | | | |
| | | | | | |
| See Accompanying Notes | | ANNUAL REPORT | | DECEMBER 31, 2018 | | 59 |
Schedule of InvestmentsPIMCO Fixed Income SHares: Series LD(Cont.)
| (d) | Securities with an aggregate market value of $148,429 have been pledged as collateral under the terms of the above master agreements as of December 31, 2018. |
| (1) | The average amount of borrowings outstanding during the period ended December 31, 2018 was $(115,309) at a weighted average interest rate of 2.068%. Average borrowings may include sale-buyback transactions and reverse repurchase agreements, if held during the period. |
| (2) | Payable for sale-buyback transactions includes $(2) of deferred price drop. |
| (3) | Net Exposure represents the net receivable/(payable) that would be due from/to the counterparty in the event of default. Exposure from borrowings and other financing transactions can only be netted across transactions governed under the same master agreement with the same legal entity. See Note 8, Master Netting Arrangements, in the Notes to Financial Statements for more information regarding master netting arrangements. |
(e) FINANCIAL DERIVATIVE INSTRUMENTS: EXCHANGE-TRADED OR CENTRALLY CLEARED
PURCHASED OPTIONS:
OPTIONS ON EXCHANGE-TRADED FUTURES CONTRACTS
| | | | | | | | | | | | | | | | | | | | | | | | |
| Description | | Strike
Price | | | Expiration
Date | | | # of
Contracts | | | Notional
Amount | | | Cost | | | Market
Value | |
Call - CBOT U.S. Treasury10-Year Note March 2019 Futures | | $ | 131.000 | | | | 02/22/2019 | | | | 110 | | | $ | 110 | | | $ | 1 | | | $ | 2 | |
Call - CBOT U.S. Treasury10-Year Note March 2019 Futures | | | 132.000 | | | | 02/22/2019 | | | | 20 | | | | 20 | | | | 0 | | | | 0 | |
Call - CBOT U.S. Treasury10-Year Note March 2019 Futures | | | 133.500 | | | | 02/22/2019 | | | | 107 | | | | 107 | | | | 1 | | | | 0 | |
Call - CBOT U.S. Treasury10-Year Note March 2019 Futures | | | 135.000 | | | | 02/22/2019 | | | | 9 | | | | 9 | | | | 0 | | | | 0 | |
Call - CBOT U.S. Treasury10-Year Note March 2019 Futures | | | 135.500 | | | | 02/22/2019 | | | | 2 | | | | 2 | | | | 0 | | | | 0 | |
Call - CBOT U.S. Treasury10-Year Note March 2019 Futures | | | 137.500 | | | | 02/22/2019 | | | | 16 | | | | 16 | | | | 0 | | | | 0 | |
Put - CBOT U.S. Treasury2-Year Note March 2019 Futures | | | 103.250 | | | | 02/22/2019 | | | | 65 | | | | 130 | | | | 1 | | | | 0 | |
Put - CBOT U.S. Treasury2-Year Note March 2019 Futures | | | 103.375 | | | | 02/22/2019 | | | | 340 | | | | 680 | | | | 3 | | | | 0 | |
Put - CBOT U.S. Treasury2-Year Note March 2019 Futures | | | 103.500 | | | | 02/22/2019 | | | | 20 | | | | 40 | | | | 0 | | | | 0 | |
Call - CBOT U.S. Treasury5-Year Note March 2019 Futures | | | 119.250 | | | | 02/22/2019 | | | | 40 | | | | 40 | | | | 0 | | | | 1 | |
Call - CBOT U.S. Treasury5-Year Note March 2019 Futures | | | 120.000 | | | | 02/22/2019 | | | | 416 | | | | 416 | | | | 4 | | | | 6 | |
Call - CBOT U.S. Treasury5-Year Note March 2019 Futures | | | 120.250 | | | | 02/22/2019 | | | | 10 | | | | 10 | | | | 0 | | | | 0 | |
Call - CBOT U.S. Treasury Ultra Long-Term Bond March 2019 Futures | | | 142.000 | | | | 02/22/2019 | | | | 40 | | | | 40 | | | | 1 | | | | 1 | |
Call - CBOT U.S. Treasury Ultra Long-Term Bond March 2019 Futures | | | 144.000 | | | | 02/22/2019 | | | | 20 | | | | 20 | | | | 0 | | | | 0 | |
Call - CBOT U.S. Treasury Ultra Long-Term Bond March 2019 Futures | | | 195.000 | | | | 02/22/2019 | | | | 4 | | | | 4 | | | | 0 | | | | 0 | |
Call - CBOT U.S. Treasury Ultra Long-Term Bond March 2019 Futures | | | 200.000 | | | | 02/22/2019 | | | | 12 | | | | 12 | | | | 0 | | | | 0 | |
| | | | | | | | | | | | | | | | | | | | | | | | |
Total Purchased Options | | | $ | 11 | | | $ | 10 | |
| | | | | | | | | | | | | | | | | | | | | | | | |
FUTURES CONTRACTS:
LONG FUTURES CONTRACTS
| | | | | | | | | | | | | | | | | | | | | | | | | | |
| Description | | Expiration
Month | | # of
Contracts | | | Notional
Amount | | | Unrealized
Appreciation/
(Depreciation) | | | Variation Margin | |
| | Asset | | | Liability | |
3-Month Canada Bankers Acceptance December Futures | | 12/2019 | | | 52 | | | $ | | | | | 9,309 | | | $ | 49 | | | $ | 3 | | | $ | 0 | |
3-Month Canada Bankers Acceptance March Futures | | 03/2020 | | | 16 | | | | | | | | 2,865 | | | | 5 | | | | 1 | | | | 0 | |
3-Month Canada Bankers Acceptance September Futures | | 09/2019 | | | 90 | | | | | | | | 16,112 | | | | 39 | | | | 5 | | | | (2 | ) |
30-Day Federal Fund February Futures | | 02/2019 | | | 56 | | | | | | | | 22,775 | | | | (3 | ) | | | 0 | | | | 0 | |
90-Day Eurodollar December Futures | | 12/2019 | | | 49 | | | | | | | | 11,925 | | | | 7 | | | | 1 | | | | 0 | |
| | | | | | |
| 60 | | PIMCO MANAGED ACCOUNTS TRUST | | | | See Accompanying Notes |
December 31, 2018
| | | | | | | | | | | | | | | | | | | | | | | | | | | | |
| Description | | Expiration
Month | | | # of
Contracts | | | Notional
Amount | | | Unrealized
Appreciation/
(Depreciation) | | | Variation Margin | |
| | Asset | | | Liability | |
90-Day Eurodollar March Futures | | | 03/2019 | | | | 256 | | | $ | | | | | 62,266 | | | $ | 66 | | | $ | 0 | | | $ | 0 | |
Call Options Strike @ EUR 150.000 on United Kingdom Long Gilt March 2019 Futures | | | 02/2019 | | | | 63 | | | | | | | | 0 | | | | (1 | ) | | | 0 | | | | 0 | |
U.S. Treasury2-Year Note March Futures | | | 03/2019 | | | | 384 | | | | | | | | 81,528 | | | | 531 | | | | 54 | | | | 0 | |
United Kingdom90-Day LIBOR Sterling Interest Rate March Futures | | | 03/2019 | | | | 288 | | | | | | | | 45,454 | | | | (14 | ) | | | 2 | | | | 0 | |
| | | | | | | | | | | | | | | | | | | | | | | | | | | | |
| | | | | | | | | | | | | | $ | 679 | | | $ | 66 | | | $ | (2 | ) |
| | | | | | | | | | | | | | | | | | | | | | | | | | | | |
SHORT FUTURES CONTRACTS
| | | | | | | | | | | | | | | | | | | | | | | | | | | | |
| Description | | Expiration
Month | | | # of
Contracts | | | Notional
Amount | | | Unrealized
Appreciation/
(Depreciation) | | | Variation Margin | |
| | Asset | | | Liability | |
90-Day Eurodollar December Futures | | | 12/2020 | | | | 49 | | | | $ | | | | (11,947 | ) | | $ | (10 | ) | | $ | 0 | | | $ | (4 | ) |
90-Day Eurodollar March Futures | | | 03/2020 | | | | 101 | | | | | | | | (24,605 | ) | | | (148 | ) | | | 0 | | | | (5 | ) |
U.S. Treasury5-Year Note March Futures | | | 03/2019 | | | | 304 | | | | | | | | (34,865 | ) | | | (422 | ) | | | 0 | | | | (76 | ) |
U.S. Treasury10-Year Note March Futures | | | 03/2019 | | | | 265 | | | | | | | | (32,334 | ) | | | (744 | ) | | | 0 | | | | (104 | ) |
U.S. Treasury10-Year Ultra March Futures | | | 03/2019 | | | | 60 | | | | | | | | (7,805 | ) | | | (252 | ) | | | 0 | | | | (28 | ) |
U.S. Treasury Ultra Long-Term Bond March Futures | | | 03/2019 | | | | 16 | | | | | | | | (2,571 | ) | | | (135 | ) | | | 0 | | | | (10 | ) |
United Kingdom90-Day LIBOR Sterling Interest Rate March Futures | | | 03/2020 | | | | 288 | | | | | | | | (45,365 | ) | | | 0 | | | | 5 | | | | (9 | ) |
United Kingdom Long Gilt March Futures | | | 03/2019 | | | | 63 | | | | | | | | (9,891 | ) | | | (82 | ) | | | 10 | | | | (32 | ) |
| | | | | | | | | | | | | | | | | | | | | | | | | | | | |
| | | | | | | | | | | | | | $ | (1,793 | ) | | $ | 15 | | | $ | (268 | ) |
| | | | | | | | | | | | | | | | | | | | | | | | | | | | |
Total Futures Contracts | | | $ | (1,114 | ) | | $ | 81 | | | $ | (270 | ) |
| | | | | | | | | | | | | | | | | | | | | | | | | | | | |
SWAP AGREEMENTS:
CREDIT DEFAULT SWAPS ON CREDIT INDICES - BUY PROTECTION(1)
| | | | | | | | | | | | | | | | | | | | | | | | | | | | | | | | | | | | |
| Index/Tranches | | Fixed
(Pay) Rate | | Payment
Frequency | | Maturity
Date | | | Notional
Amount(2) | | | Premiums
Paid/
(Received) | | | Unrealized
Appreciation/
(Depreciation) | | | Market
Value(3) | | | Variation Margin | |
| | Asset | | | Liability | |
CDX.HY-315-Year Index | | (5.000)% | | Quarterly | | | 12/20/2023 | | | $ | | | | | 16,000 | | | $ | (847 | ) | | $ | 493 | | | $ | (354 | ) | | $ | 0 | | | $ | (26 | ) |
| | | | | | | | | | | | | | | | | | | | | | | | | | | | | | | | | | | | |
INTEREST RATE SWAPS
| | | | | | | | | | | | | | | | | | | | | | | | | | | | | | | | | | | | | | | | | | | | |
Pay/
Receive
Floating
Rate | | Floating
Rate Index | | | Fixed
Rate | | | Payment
Frequency | | | Maturity
Date | | | Notional
Amount | | | Premiums
Paid/
(Received) | | | Unrealized
Appreciation/
(Depreciation) | | | Market
Value | | | Variation Margin | |
| | Asset | | | Liability | |
Pay(4) | |
| 3-Month
USD-LIBOR |
| | | 12.500 | % | | | Quarterly | | | | 06/21/2020 | | | | $ | | | | 61,000 | | | $ | 2 | | | $ | (6 | ) | | $ | (4 | ) | | $ | 4 | | | $ | 0 | |
Pay | |
| 3-Month
USD-LIBOR |
| | | 2.750 | | | | Semi-Annual | | | | 12/19/2023 | | | | | | | | 62,000 | | | | (91 | ) | | | 573 | | | | 482 | | | | 121 | | | | 0 | |
Receive(4) | |
| 3-Month
USD-LIBOR |
| | | 2.750 | | | | Semi-Annual | | | | 12/19/2024 | | | | | | | | 62,000 | | | | 117 | | | | (629 | ) | | | (512 | ) | | | 0 | | | | (158 | ) |
Receive | |
| 3-Month
USD-LIBOR |
| | | 3.000 | | | | Semi-Annual | | | | 12/19/2028 | | | | | | | | 1,200 | | | | 20 | | | | (49 | ) | | | (29 | ) | | | 0 | | | | (5 | ) |
| | | | | | | | | | | | | | | | | | | | | | | | | | | | | | | | | | | | | | | | | | | | |
| | | | | | | | | | | | | | | | | | | | | | | | | | $ | 48 | | | $ | (111 | ) | | $ | (63 | ) | | $ | 125 | | | $ | (163 | ) |
| | | | | | | | | | | | | | | | | | | | | | | | | | | | | | | | | | | | | | | | | | | | |
| | | | | | |
| See Accompanying Notes | | ANNUAL REPORT | | DECEMBER 31, 2018 | | 61 |
Schedule of InvestmentsPIMCO Fixed Income SHares: Series LD(Cont.)
INTEREST RATE SWAPS - BASIS SWAPS
| | | | | | | | | | | | | | | | | | | | | | | | | | | | | | | | | | | | | | |
Pay
Floating
Rate
Index | | Receive Floating
Rate Index | | Payment
Frequency | | | Maturity
Date | | | Notional
Amount | | | Premiums
Paid/
(Received) | | | Unrealized
Appreciation/
(Depreciation) | | | Market
Value | | | Variation Margin | |
| | Asset | | | Liability | |
3-MonthUSD-LIBOR | | 1-Month USD-LIBOR + 0.139% | | | Quarterly | | | | 05/10/2021 | | | | $ | | | | 26,180 | | | $ | 0 | | | $ | (6 | ) | | $ | (6 | ) | | $ | 2 | | | $ | 0 | |
3-MonthUSD-LIBOR | | 1-Month USD-LIBOR + 0.136% | | | Quarterly | | | | 05/11/2021 | | | | | | | | 13,100 | | | | 0 | | | | (2 | ) | | | (2 | ) | | | 1 | | | | 0 | |
3-MonthUSD-LIBOR | | 1-Month USD-LIBOR + 0.139% | | | Quarterly | | | | 05/14/2021 | | | | | | | | 16,220 | | | | 0 | | | | (4 | ) | | | (4 | ) | | | 1 | | | | 0 | |
3-MonthUSD-LIBOR | | 1-Month USD-LIBOR + 0.095% | | | Quarterly | | | | 05/21/2022 | | | | | | | | 44,300 | | | | 0 | | | | 26 | | | | 26 | | | | 1 | | | | 0 | |
| | | | | | | | | | | | | | | | | | | | | | | | | | | | | | | | | | | | | | |
| | | | | | | | | | | | | | | | | | | | $ | 0 | | | $ | 14 | | | $ | 14 | | | $ | 5 | | | $ | 0 | |
| | | | | | | | | | | | | | | | | | | | | | | | | | | | | | | | | | | | | | |
Total Swap Agreements | | | $ | (799 | ) | | $ | 396 | | | $ | (403 | ) | | $ | 130 | | | $ | (189 | ) |
| | | | | | | | | | | | | | | | | | | | | | | | | | | | | | | | | | | | | | |
FINANCIAL DERIVATIVE INSTRUMENTS: EXCHANGE-TRADED OR CENTRALLY CLEARED SUMMARY
The following is a summary of the market value and variation margin of Exchange-Traded or Centrally Cleared Financial Derivative Instruments as of December 31, 2018:
| | | | | | | | | | | | | | | | | | | | | | | | | | | | | | | | | | | | |
| | | Financial Derivative Assets | | | | | | Financial Derivative Liabilities | |
| | | Market Value | | | Variation Margin
Asset | | | | | | | | | Market Value | | | Variation Margin
Liability | | | | |
| | | Purchased
Options | | | Futures | | | Swap
Agreements | | | Total | | | | | | Written
Options | | | Futures | | | Swap
Agreements | | | Total | |
Total Exchange-Traded or Centrally Cleared | | $ | 10 | | | $ | 81 | | | $ | 130 | | | $ | 221 | | | | | | | $ | 0 | | | $ | (270) | | | $ | (189) | | | $ | (459) | |
| | | | | | | | | | | | | | | | | | | | | | | | | | | | | | | | | | | | |
Cash of $1,683 has been pledged as collateral for exchange-traded and centrally cleared financial derivative instruments as of December 31, 2018. See Note 8, Master Netting Arrangements, in the Notes to Financial Statements for more information regarding master netting arrangements.
| (1) | If the Portfolio is a buyer of protection and a credit event occurs, as defined under the terms of that particular swap agreement, the Portfolio will either (i) receive from the seller of protection an amount equal to the notional amount of the swap and deliver the referenced obligation or underlying securities comprising the referenced index or (ii) receive a net settlement amount in the form of cash, securities or other deliverable obligations equal to the notional amount of the swap less the recovery value of the referenced obligation or underlying securities comprising the referenced index. |
| (2) | The maximum potential amount the Portfolio could be required to pay as a seller of credit protection or receive as a buyer of credit protection if a credit event occurs as defined under the terms of that particular swap agreement. |
| (3) | The prices and resulting values for credit default swap agreements serve as indicators of the current status of the payment/performance risk and represent the likelihood of an expected liability (or profit) for the credit derivative should the notional amount of the swap agreement be closed/sold as of the period end. Increasing market values, in absolute terms when compared to the notional amount of the swap, represent a deterioration of the referenced indices’ credit soundness and a greater likelihood or risk of default or other credit event occurring as defined under the terms of the agreement. |
| (4) | This instrument has a forward starting effective date. See Note 2, Securities Transactions and Investment Income, in the Notes to Financial Statements for further information. |
| | | | | | |
| 62 | | PIMCO MANAGED ACCOUNTS TRUST | | | | See Accompanying Notes |
December 31, 2018
(f) FINANCIAL DERIVATIVE INSTRUMENTS: OVER THE COUNTER
FORWARD FOREIGN CURRENCY CONTRACTS:
| | | | | | | | | | | | | | | | | | | | | | | | | | | | |
| Counterparty | | Settlement
Month | | | Currency to
be Delivered | | | Currency to
be Received | | | Unrealized Appreciation/
(Depreciation) | |
| | Asset | | | Liability | |
BOA | | | 01/2019 | | | | CAD | | | | 111 | | | | $ | | | | 83 | | | $ | 2 | | | $ | 0 | |
| | | 01/2019 | | | | EUR | | | | 4,785 | | | | | | | | 5,463 | | | | 0 | | | | (23 | ) |
BPS | | | 01/2019 | | | | $ | | | | 1,014 | | | | JPY | | | | 114,400 | | | | 30 | | | | 0 | |
BRC | | | 01/2019 | | | | EUR | | | | 131 | | | | $ | | | | 149 | | | | 0 | | | | (1 | ) |
| | | 01/2019 | | | | GBP | | | | 78 | | | | | | | | 100 | | | | 0 | | | | 0 | |
| | | 01/2019 | | | | MXN | | | | 2,597 | | | | | | | | 127 | | | | 0 | | | | (4 | ) |
| | | 01/2019 | | | | $ | | | | 108 | | | | GBP | | | | 85 | | | | 1 | | | | 0 | |
GLM | | | 01/2019 | | | | EUR | | | | 1,558 | | | | $ | | | | 1,777 | | | | 0 | | | | (10 | ) |
| | | 01/2019 | | | | GBP | | | | 1,182 | | | | | | | | 1,511 | | | | 4 | | | | 0 | |
IND | | | 01/2019 | | | | JPY | | | | 521,900 | | | | | | | | 4,604 | | | | 0 | | | | (159 | ) |
JPM | | | 01/2019 | | | | | | | | 109,200 | | | | | | | | 966 | | | | 0 | | | | (31 | ) |
| | | 01/2019 | | | | $ | | | | 4,627 | | | | JPY | | | | 516,400 | | | | 86 | | | | 0 | |
| | | | | | | | | | | | | | | | | | | | | | | | | | | | |
Total Forward Foreign Currency Contracts | | | $ | 123 | | | $ | (228 | ) |
| | | | | | | | | | | | | | | | | | | | | | | | | | | | |
PURCHASED OPTIONS:
CREDIT DEFAULT SWAPTIONS ON CREDIT INDICES
| | | | | | | | | | | | | | | | | | | | | | | | | | | | |
| Counterparty | | Description | | Buy/Sell
Protection | | Exercise
Rate | | | Expiration
Date | | | | | | Notional
Amount | | | Cost | | | Market
Value | |
FBF | | Put - OTCCDX.IG-315-Year Index | | Buy | | | 1.600 | % | | | 01/16/2019 | | | $ | | | | | 22,900 | | | $ | 1 | | | $ | 0 | |
| | | | | | | | | | | | | | | | | | | | | | | | | | | | |
FOREIGN CURRENCY OPTIONS
| | | | | | | | | | | | | | | | | | | | | | | | | | | | | | |
| Counterparty | | Description | | Strike
Price | | | Expiration
Date | | | Notional
Amount | | | Cost | | | Market
Value | |
| BOA | | Put - OTC USD versus JPY | | | JPY | | | | 98.000 | | | | 03/04/2019 | | | | $ | | | | 1,000 | | | $ | 0 | | | $ | 1 | |
| BPS | | Call - OTC EUR versus USD | | | $ | | | | 1.260 | | | | 01/21/2019 | | | | EUR | | | | 3,000 | | | | 1 | | | | 0 | |
| | Call - OTC EUR versus USD | | | | | | | 1.290 | | | | 03/25/2019 | | | | | | | | 1,300 | | | | 0 | | | | 0 | |
| GLM | | Put - OTC USD versus JPY | | | JPY | | | | 95.000 | | | | 01/24/2019 | | | | $ | | | | 2,800 | | | | 0 | | | | 0 | |
| JPM | | Call - OTC EUR versus USD | | | $ | | | | 1.290 | | | | 01/18/2019 | | | | EUR | | | | 2,100 | | | | 0 | | | | 0 | |
| | | | | | | | | | | | | | | | | | | | | | | | | | | | | | |
| | | | | | | | | | | | | | | | | | | | | | | | $ | 1 | | | $ | 1 | |
| | | | | | | | | | | | | | | | | | | | | | | | | | | | |
INTEREST RATE SWAPTIONS
| | | | | | | | | | | | | | | | | | | | | | | | | | | | |
| Counterparty | | Description | | Floating Rate Index | | | Pay/
Receive
Floating
Rate | | Exercise
Rate | | | Expiration
Date | | | Notional
Amount | | | Cost | | | Market
Value | |
| GLM | | Call - OTC2-Year Interest Rate Swap | | | 3-Month USD-LIBOR | | | Pay | | | 3.000 | % | | | 02/11/2019 | | | $ | 28,600 | | | $ | 18 | | | $ | 207 | |
| | | | | | | | | | | | | | | | | | | | | | | | | | | | |
Total Purchased Options | | | $ | 20 | | | $ | 208 | |
| | | | | | | | | |
| | | | | | |
| See Accompanying Notes | | ANNUAL REPORT | | DECEMBER 31, 2018 | | 63 |
Schedule of InvestmentsPIMCO Fixed Income SHares: Series LD(Cont.)
WRITTEN OPTIONS:
CREDIT DEFAULT SWAPTIONS ON CREDIT INDICES
| | | | | | | | | | | | | | | | | | | | | | | | | | | | | | |
| Counterparty | | Description | | Buy/Sell
Protection | | | Exercise
Rate | | | Expiration
Date | | | Notional
Amount | | | Premiums
(Received) | | | Market
Value | |
| BOA | | Put - OTCCDX.IG-315-Year Index | | | Sell | | | | 0.850 | % | | | 01/16/2019 | | | | $ | | | | 1,000 | | | $ | (1 | ) | | $ | (3 | ) |
| | Put - OTCCDX.IG-315-Year Index | | | Sell | | | | 0.900 | | | | 01/16/2019 | | | | | | | | 1,100 | | | | (1 | ) | | | (2 | ) |
| | Put - OTCCDX.IG-315-Year Index | | | Sell | | | | 1.000 | | | | 02/20/2019 | | | | | | | | 500 | | | | (1 | ) | | | (1 | ) |
| BRC | | Put - OTCCDX.IG-315-Year Index | | | Sell | | | | 1.050 | | | | 02/20/2019 | | | | | | | | 300 | | | | (1 | ) | | | (1 | ) |
| | Put - OTCCDX.IG-315-Year Index | | | Sell | | | | 1.100 | | | | 03/20/2019 | | | | | | | | 900 | | | | (2 | ) | | | (2 | ) |
| GST | | Put - OTCCDX.IG-315-Year Index | | | Sell | | | | 0.900 | | | | 01/16/2019 | | | | | | | | 17,600 | | | | (16 | ) | | | (28 | ) |
| | Put - OTCCDX.IG-315-Year Index | | | Sell | | | | 2.400 | | | | 09/18/2019 | | | | | | | | 1,100 | | | | (2 | ) | | | (2 | ) |
| JPM | | Put - OTCCDX.IG-315-Year Index | | | Sell | | | | 0.950 | | | | 02/20/2019 | | | | | | | | 400 | | | | (1 | ) | | | (1 | ) |
| | Put - OTCCDX.IG-315-Year Index | | | Sell | | | | 1.200 | | | | 03/20/2019 | | | | | | | | 1,000 | | | | (2 | ) | | | (2 | ) |
| | | | | | | | | | | | | | | | | | | | | | | | | | | | | | |
| | | | | | | | | | | | | | | | | | | | | | $ | (27 | ) | | $ | (42 | ) |
| | | | | | | | | | | | | | | | | | | | | | | | | | | | | | |
INTEREST RATE SWAPTIONS
| | | | | | | | | | | | | | | | | | | | | | | | | | | | | | |
| Counterparty | | Description | | Floating Rate Index | | Pay/
Receive
Floating
Rate | | Exercise
Rate | | | Expiration
Date | | | Notional
Amount | | | Premiums
(Received) | | | Market
Value | |
GLM | | Call - OTC5-Year Interest Rate Swap | | 3-Month USD-LIBOR | | Receive | | | 2.950 | % | | | 02/11/2019 | | | | $ | | | | 6,200 | | | $ | (9 | ) | | $ | (110 | ) |
| | Call - OTC10-Year Interest Rate Swap | | 3-Month USD-LIBOR | | Receive | | | 3.030 | | | | 02/11/2019 | | | | | | | | 3,300 | | | | (9 | ) | | | (91 | ) |
| | | | | | | | | | | | | | | | | | | | | | | | | | | | | | |
| | | | | | | | | | | | | | | | | | | | | | $ | (18 | ) | | $ | (201 | ) |
| | | | | | | | | | | | | | | | | | | | | | | | | | | | | | |
Total Written Options | | | $ | (45 | ) | | $ | (243 | ) |
| | | | | | | | | | | | | | | | | | | | | | | | | | | | | | |
FINANCIAL DERIVATIVE INSTRUMENTS: OVER THE COUNTER SUMMARY
The following is a summary by counterparty of the market value of OTC financial derivative instruments and collateral pledged/(received) as of December 31, 2018:
| | | | | | | | | | | | | | | | | | | | | | | | | | | | | | | | | | | | | | | | | | | | | | | | |
| | | Financial Derivative Assets | | | | | | Financial Derivative Liabilities | | | | | | | | | | |
| Counterparty | | Forward
Foreign
Currency
Contracts | | | Purchased
Options | | | Swap
Agreements | | | Total
Over the
Counter | | | | | | Forward
Foreign
Currency
Contracts | | | Written
Options | | | Swap
Agreements | | | Total
Over the
Counter | | | Net Market
Value of OTC
Derivatives | | | Collateral
Pledged/
(Received) | | | Net
Exposure(1) | |
BOA | | $ | 2 | | | $ | 1 | | | $ | 0 | | | $ | 3 | | | | | | | $ | (23 | ) | | $ | (6 | ) | | $ | 0 | | | $ | (29 | ) | | $ | (26 | ) | | $ | 0 | | | $ | (26 | ) |
BPS | | | 30 | | | | 0 | | | | 0 | | | | 30 | | | | | | | | 0 | | | | 0 | | | | 0 | | | | 0 | | | | 30 | | | | 0 | | | | 30 | |
BRC | | | 1 | | | | 0 | | | | 0 | | | | 1 | | | | | | | | (5 | ) | | | (3 | ) | | | 0 | | | | (8 | ) | | | (7 | ) | | | 0 | | | | (7 | ) |
GLM | | | 4 | | | | 207 | | | | 0 | | | | 211 | | | | | | | | (10 | ) | | | (201 | ) | | | 0 | | | | (211 | ) | | | 0 | | | | 0 | | | | 0 | |
GST | | | 0 | | | | 0 | | | | 0 | | | | 0 | | | | | | | | 0 | | | | (30 | ) | | | 0 | | | | (30 | ) | | | (30 | ) | | | 0 | | | | (30 | ) |
IND | | | 0 | | | | 0 | | | | 0 | | | | 0 | | | | | | | | (159 | ) | | | 0 | | | | 0 | | | | (159 | ) | | | (159 | ) | | | 0 | | | | (159 | ) |
JPM | | | 86 | | | | 0 | | | | 0 | | | | 86 | | | | | | | | (31 | ) | | | (3 | ) | | | 0 | | | | (34 | ) | | | 52 | | | | 0 | | | | 52 | |
| | | | | | | | | | | | | | | | | | | | | | | | | | | | | | | | | | | | | | | | | | | | | | | | |
Total Over the Counter | | $ | 123 | | | $ | 208 | | | $ | 0 | | | $ | 331 | | | | | | | $ | (228 | ) | | $ | (243 | ) | | $ | 0 | | | $ | (471 | ) | | | | | | | | | | | | |
| | | | | | | | | | | | | | | | | | | | | | | | | | | | | | | | | | | | | | | | | | | | | | | | |
| (1) | Net Exposure represents the net receivable/(payable) that would be due from/to the counterparty in the event of default. Exposure from OTC financial derivative instruments can only be netted across transactions governed under the same master agreement with the same legal entity. See Note 8, Master Netting Arrangements, in the Notes to Financial Statements for more information regarding master netting arrangements. |
| | | | | | |
| 64 | | PIMCO MANAGED ACCOUNTS TRUST | | | | See Accompanying Notes |
December 31, 2018
FAIR VALUE OF FINANCIAL DERIVATIVE INSTRUMENTS
The following is a summary of the fair valuation of the Portfolio’s derivative instruments categorized by risk exposure. See Note 7, Principal Risks, in the Notes to Financial Statements on risks of the Portfolio.
Fair Values of Financial Derivative Instruments on the Statements of Assets and Liabilities as of December 31, 2018:
| | | | | | | | | | | | | | | | | | | | | | | | |
| | | Derivatives not accounted for as hedging instruments | |
| | | Commodity
Contracts | | | Credit
Contracts | | | Equity
Contracts | | | Foreign
Exchange
Contracts | | | Interest
Rate Contracts | | | Total | |
Financial Derivative Instruments - Assets | |
Exchange-traded or centrally cleared | |
Purchased Options | | $ | 0 | | | $ | 0 | | | $ | 0 | | | $ | 0 | | | $ | 10 | | | $ | 10 | |
Futures | | | 0 | | | | 0 | | | | 0 | | | | 0 | | | | 81 | | | | 81 | |
Swap Agreements | | | 0 | | | | 0 | | | | 0 | | | | 0 | | | | 130 | | | | 130 | |
| | | | | | | | | | | | | | | | | | | | | | | | |
| | $ | 0 | | | $ | 0 | | | $ | 0 | | | $ | 0 | | | $ | 221 | | | $ | 221 | |
| | | | | | | | | | | | | | | | | | | | | | | | |
Over the counter | |
Forward Foreign Currency Contracts | | $ | 0 | | | $ | 0 | | | $ | 0 | | | $ | 123 | | | $ | 0 | | | $ | 123 | |
Purchased Options | | | 0 | | | | 0 | | | | 0 | | | | 1 | | | | 207 | | | | 208 | |
| | | | | | | | | | | | | | | | | | | | | | | | |
| | $ | 0 | | | $ | 0 | | | $ | 0 | | | $ | 124 | | | $ | 207 | | | $ | 331 | |
| | | | | | | | | | | | | | | | | | | | | | | | |
| | $ | 0 | | | $ | 0 | | | $ | 0 | | | $ | 124 | | | $ | 428 | | | $ | 552 | |
| | | | | | | | | | | | | | | | | | | | | | | | |
|
Financial Derivative Instruments - Liabilities | |
Exchange-traded or centrally cleared | |
Futures | | $ | 0 | | | $ | 0 | | | $ | 0 | | | $ | 0 | | | $ | 270 | | | $ | 270 | |
Swap Agreements | | | 0 | | | | 26 | | | | 0 | | | | 0 | | | | 163 | | | | 189 | |
| | | | | | | | | | | | | | | | | | | | | | | | |
| | $ | 0 | | | $ | 26 | | | $ | 0 | | | $ | 0 | | | $ | 433 | | | $ | 459 | |
| | | | | | | | | | | | | | | | | | | | | | | | |
Over the counter | |
Forward Foreign Currency Contracts | | $ | 0 | | | $ | 0 | | | $ | 0 | | | $ | 228 | | | $ | 0 | | | $ | 228 | |
Written Options | | | 0 | | | | 42 | | | | 0 | | | | 0 | | | | 201 | | | | 243 | |
| | | | | | | | | | | | | | | | | | | | | | | | |
| | $ | 0 | | | $ | 42 | | | $ | 0 | | | $ | 228 | | | $ | 201 | | | $ | 471 | |
| | | | | | | | | | | | | | | | | | | | | | | | |
| | $ | 0 | | | $ | 68 | | | $ | 0 | | | $ | 228 | | | $ | 634 | | | $ | 930 | |
| | | | | | | | | | | | | | | | | | | | | | | | |
The effect of Financial Derivative Instruments on the Statements of Operations for the period ended December 31, 2018:
| | | | | | | | | | | | | | | | | | | | | | | | |
| | | Derivatives not accounted for as hedging instruments | |
| | | Commodity
Contracts | | | Credit
Contracts | | | Equity
Contracts | | | Foreign
Exchange
Contracts | | | Interest
Rate Contracts | | | Total | |
Net Realized Gain (Loss) on Financial Derivative Instruments | |
Exchange-traded or centrally cleared | |
Purchased Options | | $ | 0 | | | $ | 0 | | | $ | 0 | | | $ | 0 | | | $ | (30 | ) | | $ | (30 | ) |
Futures | | | 0 | | | | 0 | | | | 0 | | | | 0 | | | | 961 | | | | 961 | |
Swap Agreements | | | 0 | | | | (347 | ) | | | 0 | | | | 0 | | | | (255 | ) | | | (602 | ) |
| | | | | | | | | | | | | | | | | | | | | | | | |
| | $ | 0 | | | $ | (347 | ) | | $ | 0 | | | $ | 0 | | | $ | 676 | | | $ | 329 | |
| | | | | | | | | | | | | | | | | | | | | | | | |
Over the counter | |
Forward Foreign Currency Contracts | | $ | 0 | | | $ | 0 | | | $ | 0 | | | $ | (10 | ) | | $ | 0 | | | $ | (10 | ) |
Purchased Options | | | 0 | | | | 0 | | | | 0 | | | | (10 | ) | | | (125 | ) | | | (135 | ) |
Written Options | | | 0 | | | | 13 | | | | 0 | | | | 12 | | | | 65 | | | | 90 | |
| | | | | | | | | | | | | | | | | | | | | | | | |
| | $ | 0 | | | $ | 13 | | | $ | 0 | | | $ | (8 | ) | | $ | (60 | ) | | $ | (55 | ) |
| | | | | | | | | | | | | | | | | | | | | | | | |
| | $ | 0 | | | $ | (334 | ) | | $ | 0 | | | $ | (8 | ) | | $ | 616 | | | $ | 274 | |
| | | | | | | | | | | | | | | | | | | | | | | | |
| | | | | | |
| See Accompanying Notes | | ANNUAL REPORT | | DECEMBER 31, 2018 | | 65 |
Schedule of InvestmentsPIMCO Fixed Income SHares: Series LD(Cont.)
| | | | | | | | | | | | | | | | | | | | | | | | |
| | | Derivatives not accounted for as hedging instruments | |
| | | Commodity
Contracts | | | Credit
Contracts | | | Equity
Contracts | | | Foreign
Exchange
Contracts | | | Interest
Rate Contracts | | | Total | |
Net Change in Unrealized Appreciation (Depreciation) on Financial Derivative Instruments | |
Exchange-traded or centrally cleared | |
Purchased Options | | $ | 0 | | | $ | 0 | | | $ | 0 | | | $ | 0 | | | $ | 2 | | | $ | 2 | |
Futures | | | 0 | | | | 0 | | | | 0 | | | | 0 | | | | (1,066 | ) | | | (1,066 | ) |
Swap Agreements | | | 0 | | | | 577 | | | | 0 | | | | 0 | | | | 135 | | | | 712 | |
| | | | | | | | | | | | | | | | | | | | | | | | |
| | $ | 0 | | | $ | 577 | | | $ | 0 | | | $ | 0 | | | $ | (929 | ) | | $ | (352 | ) |
| | | | | | | | | | | | | | | | | | | | | | | | |
Over the counter | |
Forward Foreign Currency Contracts | | $ | 0 | | | $ | 0 | | | $ | 0 | | | $ | 115 | | | $ | 0 | | | $ | 115 | |
Purchased Options | | | 0 | | | | (1 | ) | | | 0 | | | | 1 | | | | 189 | | | | 189 | |
Written Options | | | 0 | | | | (15 | ) | | | 0 | | | | 0 | | | | (177 | ) | | | (192 | ) |
| | | | | | | | | | | | | | | | | | | | | | | | |
| | $ | 0 | | | $ | (16 | ) | | $ | 0 | | | $ | 116 | | | $ | 12 | | | $ | 112 | |
| | | | | | | | | | | | | | | | | | | | | | | | |
| | $ | 0 | | | $ | 561 | | | $ | 0 | | | $ | 116 | | | $ | (917 | ) | | $ | (240 | ) |
| | | | | | | | | | | | | | | | | | | | | | | | |
FAIR VALUE MEASUREMENTS
The following is a summary of the fair valuations according to the inputs used as of December 31, 2018 in valuing the Portfolio’s assets and liabilities:
| | | | | | | | | | | | | | | | |
| Category and Subcategory | | Level 1 | | | Level 2 | | | Level 3 | | | Fair
Value at
12/31/2018 | |
Investments in Securities, at Value | |
Loan Participations and Assignments | | $ | 0 | | | $ | 1,226 | | | $ | 0 | | | $ | 1,226 | |
Corporate Bonds & Notes | |
Banking & Finance | | | 0 | | | | 53,784 | | | | 0 | | | | 53,784 | |
Industrials | | | 0 | | | | 39,891 | | | | 0 | | | | 39,891 | |
Utilities | | | 0 | | | | 11,026 | | | | 0 | | | | 11,026 | |
Municipal Bonds & Notes | |
Pennsylvania | | | 0 | | | | 1,118 | | | | 0 | | | | 1,118 | |
U.S. Government Agencies | | | 0 | | | | 847 | | | | 0 | | | | 847 | |
U.S. Treasury Obligations | | | 0 | | | | 72,555 | | | | 0 | | | | 72,555 | |
Non-Agency Mortgage-Backed Securities | | | 0 | | | | 8,261 | | | | 0 | | | | 8,261 | |
Asset-Backed Securities | | | 0 | | | | 18,540 | | | | 0 | | | | 18,540 | |
Sovereign Issues | | | 0 | | | | 1,187 | | | | 0 | | | | 1,187 | |
Short-Term Instruments | |
Certificates of Deposit | | | 0 | | | | 500 | | | | 0 | | | | 500 | |
Commercial Paper | | | 0 | | | | 296 | | | | 0 | | | | 296 | |
| | $ | 0 | | | $ | 209,231 | | | $ | 0 | | | $ | 209,231 | |
|
Investments in Affiliates, at Value | |
Short-Term Instruments | |
Central Funds Used for Cash Management Purposes | | $ | 5,317 | | | $ | 0 | | | $ | 0 | | | $ | 5,317 | |
| | | | |
Total Investments | | $ | 5,317 | | | $ | 209,231 | | | $ | 0 | | | $ | 214,548 | |
|
Financial Derivative Instruments - Assets | |
Exchange-traded or centrally cleared | | | 81 | | | | 140 | | | | 0 | | | | 221 | |
Over the counter | | | 0 | | | | 331 | | | | 0 | | | | 331 | |
| | $ | 81 | | | $ | 471 | | | $ | 0 | | | $ | 552 | |
| | | | | | |
| 66 | | PIMCO MANAGED ACCOUNTS TRUST | | | | See Accompanying Notes |
December 31, 2018
| | | | | | | | | | | | | | | | |
| Category and Subcategory | | Level 1 | | | Level 2 | | | Level 3 | | | Fair
Value at
12/31/2018 | |
Financial Derivative Instruments - Liabilities | |
Exchange-traded or centrally cleared | | $ | (270 | ) | | $ | (189 | ) | | $ | 0 | | | $ | (459 | ) |
Over the counter | | | 0 | | | | (471 | ) | | | 0 | | | | (471 | ) |
| | $ | (270 | ) | | $ | (660 | ) | | $ | 0 | | | $ | (930 | ) |
| | | | |
Total Financial Derivative Instruments | | $ | (189 | ) | | $ | (189 | ) | | $ | 0 | | | $ | (378 | ) |
| | | | |
Totals | | $ | 5,128 | | | $ | 209,042 | | | $ | 0 | | | $ | 214,170 | |
There were no significant transfers into or out of Level 3 during the period ended December 31, 2018.
| | | | | | |
| See Accompanying Notes | | ANNUAL REPORT | | DECEMBER 31, 2018 | | 67 |
Schedule of InvestmentsPIMCO Fixed Income SHares: Series M
(Amounts in thousands*, except number of shares, contracts and units, if any)
| | | | | | | | | | | | |
| | | | | PRINCIPAL
AMOUNT
(000S) | | | | | MARKET
VALUE
(000S) | |
| INVESTMENTS IN SECURITIES 148.9% | |
| |
| CORPORATE BONDS & NOTES 27.4% | |
| |
| BANKING & FINANCE 20.4% | |
|
AerCap Ireland Capital DAC | |
5.000% due 10/01/2021 | | $ | | | 15,800 | | | $ | | | 16,058 | |
|
Air Lease Corp. | |
3.625% due 12/01/2027 | | | | | 3,300 | | | | | | 2,922 | |
|
Banco Bilbao Vizcaya Argentaria S.A. | |
6.750% due 02/18/2020 •(d)(e) | | EUR | | | 2,000 | | | | | | 2,278 | |
|
Banco Santander Mexico S.A. | |
4.125% due 11/09/2022 | | $ | | | 26,100 | | | | | | 25,774 | |
|
Bank of America Corp. | |
3.541% (US0003M + 0.790%) due 03/05/2024 ~ | | | | | 635 | | | | | | 617 | |
|
Barclays Bank PLC | |
7.625% due 11/21/2022 (e) | | | | | 5,200 | | | | | | 5,398 | |
14.000% due 06/15/2019 •(d) | | GBP | | | 3,500 | | | | | | 4,678 | |
|
Barclays PLC | |
3.684% due 01/10/2023 | | $ | | | 6,400 | | | | | | 6,155 | |
|
BGC Partners, Inc. | |
5.375% due 07/24/2023 | | | | | 10,200 | | | | | | 10,358 | |
|
Blackstone CQP Holdco LP | |
6.500% due 03/20/2021 | | | | | 35,000 | | | | | | 35,264 | |
|
BPCE S.A. | |
4.625% due 07/11/2024 | | | | | 14,300 | | | | | | 14,078 | |
|
Charles Schwab Corp. | |
5.000% due 12/01/2027 •(d) | | | | | 4,200 | | | | | | 3,534 | |
|
Credit Suisse AG | |
6.500% due 08/08/2023 (e) | | | | | 14,100 | | | | | | 14,743 | |
|
Crown Castle International Corp. | |
4.450% due 02/15/2026 | | | | | 8,000 | | | | | | 7,981 | |
|
Deutsche Bank AG | |
0.184% (EUR003M + 0.500%) due 12/07/2020 ~ | | EUR | | | 3,800 | | | | | | 4,240 | |
|
Equinix, Inc. | |
2.875% due 03/15/2024 | | | | | 10,000 | | | | | | 11,460 | |
|
Ford Motor Credit Co. LLC | |
3.157% due 08/04/2020 | | $ | | | 1,000 | | | | | | 980 | |
|
General Motors Financial Co., Inc. | |
3.200% due 07/13/2020 | | | | | 300 | | | | | | 296 | |
4.250% due 05/15/2023 | | | | | 9,630 | | | | | | 9,428 | |
|
Goldman Sachs Group, Inc. | |
4.306% (US0003M + 1.600%) due 11/29/2023 ~ | | | | | 4,200 | | | | | | 4,165 | |
|
Hospitality Properties Trust | |
5.000% due 08/15/2022 | | | | | 8,500 | | | | | | 8,688 | |
|
HSBC Holdings PLC | |
4.583% due 06/19/2029 • | | | | | 3,400 | | | | | | 3,376 | |
|
ING Groep NV | |
4.625% due 01/06/2026 | | | | | 5,200 | | | | | | 5,245 | |
| | | | | | | | | | | | |
| | | | | PRINCIPAL
AMOUNT
(000S) | | | | | MARKET
VALUE
(000S) | |
|
Intesa Sanpaolo SpA | |
6.500% due 02/24/2021 | | $ | | | 2,300 | | | $ | | | 2,359 | |
|
JPMorgan Chase & Co. | |
3.367% (US0003M + 0.890%) due 07/23/2024 ~ | | | | | 4,000 | | | | | | 3,911 | |
3.717% (US0003M + 1.230%) due 10/24/2023 ~ | | | | | 1,200 | | | | | | 1,201 | |
|
Lloyds Banking Group PLC | |
2.907% due 11/07/2023 • | | | | | 6,400 | | | | | | 6,057 | |
7.500% due 09/27/2025 •(d)(e) | | | 6,000 | | | | | | 5,806 | |
|
Morgan Stanley | |
3.875% due 04/29/2024 | | | | | 4,100 | | | | | | 4,083 | |
|
Ohio National Financial Services, Inc. | |
6.375% due 04/30/2020 | | | | | 1,500 | | | | | | 1,549 | |
|
Oversea-Chinese Banking Corp. Ltd. | |
3.090% (US0003M + 0.450%) due 05/17/2021 ~ | | | | | 7,200 | | | | | | 7,198 | |
|
Royal Bank of Scotland Group PLC | |
4.372% (US0003M + 1.550%) due 06/25/2024 ~ | | | | | 1,900 | | | | | | 1,817 | |
|
Santander Holdings USA, Inc. | |
3.700% due 03/28/2022 | | | | | 2,000 | | | | | | 1,966 | |
|
Santander UK Group Holdings PLC | |
3.373% due 01/05/2024 • | | | | | 1,000 | | | | | | 950 | |
|
Tesco Property Finance PLC | |
5.661% due 10/13/2041 | | GBP | | | 98 | | | | | | 140 | |
5.744% due 04/13/2040 | | | | | 194 | | | | | | 279 | |
5.801% due 10/13/2040 | | | | | 685 | | | | | | 992 | |
|
UBS AG | |
7.625% due 08/17/2022 (e) | | $ | | | 14,000 | | | | | | 14,945 | |
|
Washington Prime Group LP | |
3.850% due 04/01/2020 | | | | | 1,900 | | | | | | 1,872 | |
|
Wells Fargo & Co. | |
4.100% due 06/03/2026 | | | | | 400 | | | | | | 391 | |
| | | | | | | | | | | | |
| | | | | | | | | | | 253,232 | |
| | | | | | | | | | | | |
| |
| INDUSTRIALS 6.8% | |
|
American Airlines Pass-Through Trust | |
4.950% due 07/15/2024 | | | | | 3,332 | | | | | | 3,386 | |
|
CVS Pass-Through Trust | |
7.507% due 01/10/2032 | | | | | 6,160 | | | | | | 7,128 | |
|
DAE Funding LLC | |
5.250% due 11/15/2021 | | | | | 6,200 | | | | | | 6,115 | |
|
DP World Ltd. | |
2.375% due 09/25/2026 | | EUR | | | 8,200 | | | | | | 9,269 | |
|
Florida Gas Transmission Co. LLC | |
7.900% due 05/15/2019 | | $ | | | 5,000 | | | | | | 5,076 | |
|
General Electric Co. | |
5.000% due 01/21/2021 •(d) | | | 5,000 | | | | | | 3,831 | |
|
Georgia-Pacific LLC | |
8.000% due 01/15/2024 | | | | | 4,200 | | | | | | 5,045 | |
| | | | | | |
| 68 | | PIMCO MANAGED ACCOUNTS TRUST | | | | See Accompanying Notes |
December 31, 2018
| | | | | | | | | | | | |
| | | | | PRINCIPAL
AMOUNT
(000S) | | | | | MARKET
VALUE
(000S) | |
|
HCA Healthcare, Inc. | |
6.250% due 02/15/2021 | | $ | | | 800 | | | $ | | | 820 | |
|
HCA, Inc. | |
6.500% due 02/15/2020 | | | | | 10,300 | | | | | | 10,583 | |
|
Imperial Brands Finance PLC | |
2.950% due 07/21/2020 | | | | | 2,700 | | | | | | 2,660 | |
|
Kinder Morgan, Inc. | |
5.625% due 11/15/2023 | | | | | 1,150 | | | | | | 1,218 | |
7.750% due 01/15/2032 | | | | | 2,200 | | | | | | 2,645 | |
|
Marvell Technology Group Ltd. | |
4.875% due 06/22/2028 | | | | | 7,000 | | | | | | 6,837 | |
|
Odebrecht Oil & Gas Finance Ltd. | |
0.000% due 01/31/2019 (b)(d) | | | | | 46 | | | | | | 1 | |
|
Petroleos Mexicanos | |
5.500% due 02/24/2025 | | EUR | | | 13,000 | | | | | | 15,458 | |
|
QVC, Inc. | |
5.125% due 07/02/2022 | | $ | | | 900 | | | | | | 910 | |
|
Teva Pharmaceutical Finance Netherlands BV | |
1.700% due 07/19/2019 | | | | | 3,100 | | | | | | 3,060 | |
| | | | | | | | | | | | |
| | | | | | | | | | | 84,042 | |
| | | | | | | | | | | | |
| |
| UTILITIES 0.2% | |
|
AT&T, Inc. | |
4.550% due 03/09/2049 | | | | | 1,036 | | | | | | 896 | |
|
Odebrecht Drilling Norbe Ltd. | |
6.350% due 12/01/2021 | | | | | 41 | | | | | | 40 | |
|
Odebrecht Drilling Norbe Ltd. (6.350% Cash or 7.350% PIK) | |
7.350% due 12/01/2026 (a) | | | 88 | | | | | | 50 | |
|
Verizon Communications, Inc. | |
4.400% due 11/01/2034 | | | | | 2,000 | | | | | | 1,935 | |
| | | | | | | | | | | | |
| | | | | | | | | | | 2,921 | |
| | | | | | | | | | | | |
Total Corporate Bonds & Notes (Cost $351,933) | | | 340,195 | |
| | | | | | | | | | | | |
| |
| MUNICIPAL BONDS & NOTES 4.9% | |
| |
| CALIFORNIA 0.4% | |
|
Newport Beach, California Certificates of Participation Bonds, (BABs), Series 2010 | |
7.168% due 07/01/2040 | | | | | 3,500 | | | | | | 4,783 | |
| | | | | | | | | | | | |
| |
| ILLINOIS 0.2% | |
|
Chicago, Illinois Waterworks Revenue Bonds, Series 2010 | |
6.642% due 11/01/2029 | | | | | 900 | | | | | | 1,071 | |
|
Illinois State General Obligation Bonds, Series 2003 | |
5.100% due 06/01/2033 | | | | | 2,005 | | | | | | 1,915 | |
| | | | | | | | | | | | |
| | | | | | | | | | | 2,986 | |
| | | | | | | | | | | | |
| | | | | | | | | | | | |
| | | | | PRINCIPAL
AMOUNT
(000S) | | | | | MARKET
VALUE
(000S) | |
| OHIO 0.1% | |
|
American Municipal Power, Inc., Ohio Revenue Bonds, Series 2010 | |
7.734% due 02/15/2033 | | $ | | | 900 | | | $ | | | 1,245 | |
| | | | | | | | | | | | |
| |
| PENNSYLVANIA 0.8% | |
|
Pennsylvania Economic Development Financing Authority Revenue Bonds, (BABs), Series 2010 | |
6.532% due 06/15/2039 | | | | | 600 | | | | | | 740 | |
|
State Public School Building Authority, Pennsylvania Revenue Bonds, Series 2011 | |
5.426% due 09/15/2026 | | | | | 8,500 | | | | | | 9,352 | |
| | | | | | | | | | | | |
| | | | | | | | | | | 10,092 | |
| | | | | | | | | | | | |
| |
| TEXAS 0.1% | |
|
Texas Public Finance Authority Revenue Notes, Series 2014 | |
8.250% due 07/01/2024 | | | | | 890 | | | | | | 905 | |
| | | | | | | | | | | | |
| |
| VIRGINIA 1.4% | |
|
Tobacco Settlement Financing Corp., Virginia Revenue Bonds, Series 2007 | |
6.706% due 06/01/2046 | | | | | 18,805 | | | | | | 17,789 | |
| | | | | | | | | | | | |
| |
| WEST VIRGINIA 1.9% | |
|
Tobacco Settlement Finance Authority, West Virginia Revenue Bonds, Series 2007 | |
7.467% due 06/01/2047 | | | | | 23,325 | | | | | | 22,905 | |
| | | | | | | | | | | | |
Total Municipal Bonds & Notes (Cost $52,053) | | | 60,705 | |
| | | | | | | | | | | | |
| |
| U.S. GOVERNMENT AGENCIES 51.2% | |
|
Fannie Mae | |
2.956% due 08/25/2021 • | | | | | 1 | | | | | | 1 | |
3.000% due 01/01/2046 | | | | | 295 | | | | | | 288 | |
3.462% due 12/01/2034 • | | | | | 46 | | | | | | 48 | |
3.500% due 05/01/2047 | | | | | 504 | | | | | | 505 | |
4.000% due 11/25/2019 - 11/01/2048 | | | | | 30,613 | | | | | | 31,236 | |
4.006% due 05/01/2033 • | | | | | 54 | | | | | | 56 | |
4.114% due 01/01/2033 • | | | | | 32 | | | | | | 33 | |
4.236% due 05/01/2028 • | | | | | 6 | | | | | | 6 | |
4.419% due 10/01/2032 • | | | | | 11 | | | | | | 11 | |
4.465% due 09/01/2032 • | | | | | 7 | | | | | | 7 | |
4.470% due 09/01/2027 • | | | | | 36 | | | | | | 37 | |
4.474% due 11/01/2032 • | | | | | 12 | | | | | | 12 | |
4.480% due 03/25/2041 ~ | | | | | 11 | | | | | | 12 | |
4.482% due 05/25/2042 ~ | | | | | 12 | | | | | | 12 | |
4.675% due 10/01/2034 • | | | | | 42 | | | | | | 42 | |
| | | | | | |
| See Accompanying Notes | | ANNUAL REPORT | | DECEMBER 31, 2018 | | 69 |
Schedule of InvestmentsPIMCO Fixed Income SHares: Series M(Cont.)
| | | | | | | | | | | | |
| | | | | PRINCIPAL
AMOUNT
(000S) | | | | | MARKET
VALUE
(000S) | |
6.000% due 08/01/2022 - 12/01/2023 | | $ | | | 41 | | | $ | | | 43 | |
6.500% due 07/18/2027 - 12/01/2028 | | | | | 23 | | | | | | 26 | |
7.000% due 11/01/2038 | | | | | 18 | | | | | | 18 | |
7.010% due 08/01/2022 | | | | | 10 | | | | | | 10 | |
|
Fannie Mae, TBA | |
3.000% due 01/01/2049 | | | | | 146,050 | | | | | | 142,529 | |
3.500% due 02/01/2034 - 02/01/2049 | | | | | 118,000 | | | | | | 117,984 | |
4.000% due 02/01/2049 | | | | | 132,845 | | | | | | 135,359 | |
4.500% due 02/01/2049 | | | | | 127,000 | | | | | | 131,472 | |
|
Freddie Mac | |
2.905% due 08/15/2029 - 12/15/2031 • | | | | | 28 | | | | | | 29 | |
2.955% due 09/15/2030 • | | | | | 4 | | | | | | 4 | |
3.005% due 03/15/2032 • | | | | | 4 | | | | | | 4 | |
3.105% due 02/15/2024 • | | | | | 223 | | | | | | 227 | |
3.605% due 09/15/2022 • | | | | | 12 | | | | | | 12 | |
3.723% due 01/01/2033 • | | | | | 2 | | | | | | 2 | |
3.742% due 08/01/2032 • | | | | | 60 | | | | | | 61 | |
3.805% due 08/15/2023 • | | | | | 4 | | | | | | 4 | |
4.131% due 02/01/2033 • | | | | | 34 | | | | | | 35 | |
4.226% due 02/01/2029 • | | | | | 36 | | | | | | 38 | |
4.375% due 08/01/2029 • | | | | | 12 | | | | | | 12 | |
4.625% due 10/01/2032 • | | | | | 22 | | | | | | 23 | |
4.643% due 07/01/2032 • | | | | | 3 | | | | | | 3 | |
4.750% due 01/01/2032 • | | | | | 21 | | | | | | 21 | |
4.875% due 10/01/2032 • | | | | | 51 | | | | | | 52 | |
6.000% due 12/15/2028 | | | | | 187 | | | | | | 203 | |
6.500% due 12/15/2023 | | | | | 3 | | | | | | 3 | |
7.000% due 04/01/2029 - 03/01/2030 | | | | | 13 | | | | | | 14 | |
7.500% due 08/15/2030 | | | | | 28 | | | | | | 31 | |
|
Ginnie Mae | |
2.820% due 06/20/2032 • | | | | | 9 | | | | | | 9 | |
3.125% due 11/20/2023 - 10/20/2026 ~ | | | | | 32 | | | | | | 33 | |
3.125% due 10/20/2027 • | | | | | 7 | | | | | | 6 | |
3.375% (H15T1Y + 1.500%) due 01/20/2022 - 01/20/2026 ~ | | | | | 48 | | | | | | 47 | |
3.375% due 01/20/2027 - 03/20/2032 • | | | | | 107 | | | | | | 110 | |
3.625% (H15T1Y + 1.500%) due 06/20/2021 - 06/20/2026 ~ | | | | | 57 | | | | | | 58 | |
3.625% (H15T1Y + 1.500%) due 04/20/2027 - 06/20/2032 • | | | | | 45 | | | | | | 47 | |
3.750% (H15T1Y + 1.500%) due 04/20/2019 - 08/20/2026 ~ | | | | | 12 | | | | | | 12 | |
3.750% due 07/20/2027 - 07/20/2029 • | | | | | 38 | | | | | | 38 | |
4.000% (H15T1Y + 1.500%) due 08/20/2025 ~ | | | | | 35 | | | | | | 35 | |
| | | | | | | | | | | | |
| | | | | PRINCIPAL
AMOUNT
(000S) | | | | | MARKET
VALUE
(000S) | |
4.125% (H15T1Y + 2.000%)
due 06/20/2022 ~ | | $ | | | 13 | | | $ | | | 13 | |
6.500% due 05/15/2023 - 12/15/2023 | | | | | 1 | | | | | | 1 | |
|
Ginnie Mae, TBA | |
4.000% due 01/01/2049 | | | | | 71,700 | | | | | | 73,431 | |
|
NCUA Guaranteed Notes | |
2.830% due 10/07/2020 • | | | | | 983 | | | | | | 985 | |
|
Vendee Mortgage Trust | |
6.500% due 09/15/2024 | | | | | 295 | | | | | | 318 | |
| | | | | | | | | | | | |
Total U.S. Government Agencies (Cost $629,078) | | | 635,668 | |
| | | | | | | | | | | | |
| |
| U.S. TREASURY OBLIGATIONS 5.4% | |
|
U.S. Treasury Notes | |
2.000% due 05/31/2024 (h)(j)(l) | | | | | 60,400 | | | | | | 58,782 | |
2.250% due 10/31/2024 (h)(j)(l) | | | | | 8,080 | | | | | | 7,948 | |
| | | | | | | | | | | | |
Total U.S. Treasury Obligations (Cost $68,410) | | | 66,730 | |
| | | | | | | | | | | | |
| |
| NON-AGENCY MORTGAGE-BACKED SECURITIES 20.6% | |
|
Adjustable Rate Mortgage Trust | |
3.915% due 01/25/2036 ^~ | | | | | 58 | | | | | | 55 | |
4.106% due 11/25/2035 ^~ | | | | | 151 | | | | | | 127 | |
4.123% due 02/25/2036 ^~ | | | | | 131 | | | | | | 118 | |
4.738% due 11/25/2035 ^~ | | | | | 77 | | | | | | 71 | |
|
American Home Mortgage Assets Trust | |
2.696% due 09/25/2046 ^• | | | | | 697 | | | | | | 649 | |
2.716% due 10/25/2046 • | | | | | 610 | | | | | | 439 | |
3.077% due 11/25/2046 • | | | | | 610 | | | | | | 308 | |
|
Banc of America Alternative Loan Trust | |
6.000% due 07/25/2046 ^ | | | | | 160 | | | | | | 139 | |
11.426% due 09/25/2035 ^• | | | | | 134 | | | | | | 153 | |
|
Banc of America Funding Trust | |
2.455% due 08/27/2036 ~ | | | | | 7,509 | | | | | | 6,520 | |
2.660% due 10/20/2036 • | | | | | 166 | | | | | | 147 | |
2.716% due 04/25/2037 ^• | | | | | 130 | | | | | | 105 | |
2.770% due 05/20/2047 • | | | | | 70 | | | | | | 64 | |
2.906% due 05/25/2037 ^• | | | | | 125 | | | | | | 109 | |
4.339% due 09/20/2046 ^~ | | | | | 112 | | | | | | 101 | |
4.375% due 09/20/2047 ^~ | | | | | 154 | | | | | | 135 | |
4.470% due 04/20/2035 ^~ | | | | | 127 | | | | | | 116 | |
4.631% due 02/20/2036 ~ | | | | | 336 | | | | | | 332 | |
5.500% due 03/25/2036 ^ | | | | | 22 | | | | | | 20 | |
|
Banc of America Mortgage Trust | |
3.917% due 02/25/2034 ~ | | | | | 216 | | | | | | 217 | |
4.076% due 05/25/2035 ^~ | | | | | 892 | | | | | | 887 | |
4.239% due 07/25/2035 ^~ | | | | | 24 | | | | | | 22 | |
5.500% due 09/25/2035 ^ | | | | | 463 | | | | | | 440 | |
5.500% due 05/25/2037 ^ | | | | | 142 | | | | | | 122 | |
| | | | | | |
| 70 | | PIMCO MANAGED ACCOUNTS TRUST | | | | See Accompanying Notes |
December 31, 2018
| | | | | | | | | | | | |
| | | | | PRINCIPAL
AMOUNT
(000S) | | | | | MARKET
VALUE
(000S) | |
|
BCAP LLC Trust | |
2.501% due 07/26/2036 ~ | | $ | | | 137 | | | $ | | | 132 | |
2.644% due 11/26/2046 • | | | | | 192 | | | | | | 191 | |
2.656% due 05/25/2047 ^• | | | | | 76 | | | | | | 71 | |
2.726% due 05/25/2047 ^• | | | | | 493 | | | | | | 460 | |
2.815% due 05/26/2035 • | | | | | 39 | | | | | | 39 | |
3.156% due 09/25/2047 • | | | | | 124 | | | | | | 116 | |
3.706% due 10/25/2047 • | | | | | 17,567 | | | | | | 16,312 | |
3.732% due 03/26/2037 ~ | | | | | 143 | | | | | | 125 | |
3.881% due 07/26/2036 ~ | | | | | 40 | | | | | | 36 | |
3.922% due 03/27/2037 ~ | | | | | 382 | | | | | | 282 | |
4.093% due 02/26/2035 ~ | | | | | 9 | | | | | | 9 | |
4.206% due 07/26/2036 ~ | | | | | 285 | | | | | | 272 | |
4.293% due 01/26/2034 ~ | | | | | 25 | | | | | | 25 | |
4.479% due 07/26/2036 ~ | | | | | 4 | | | | | | 4 | |
4.501% due 06/26/2035 ~ | | | | | 74 | | | | | | 74 | |
6.109% due 10/26/2036 ~ | | | | | 353 | | | | | | 345 | |
|
Bear Stearns Adjustable Rate Mortgage Trust | |
3.559% due 05/25/2034 ~ | | | | | 39 | | | | | | 38 | |
3.903% due 03/25/2035 ~ | | | | | 60 | | | | | | 59 | |
3.961% due 05/25/2047 ^~ | | | | | 256 | | | | | | 238 | |
4.069% due 06/25/2035 ^~ | | | | | 28 | | | | | | 27 | |
4.088% due 02/25/2036 ^~ | | | | | 144 | | | | | | 135 | |
4.141% due 01/25/2035 ~ | | | | | 15 | | | | | | 16 | |
4.170% due 11/25/2034 ~ | | | | | 71 | | | | | | 69 | |
4.187% due 02/25/2034 ~ | | | | | 76 | | | | | | 75 | |
4.263% due 08/25/2035 ~ | | | | | 64 | | | | | | 56 | |
4.488% due 10/25/2035 ~ | | | | | 99 | | | | | | 100 | |
4.689% due 01/25/2034 ~ | | | | | 80 | | | | | | 80 | |
4.730% due 10/25/2035 • | | | | | 604 | | | | | | 610 | |
4.792% due 12/25/2046 ^• | | | | | 1,024 | | | | | | 934 | |
|
Bear StearnsALT-A Trust | |
2.946% due 04/25/2036 ^• | | | | | 168 | | | | | | 188 | |
3.839% due 05/25/2036 ^~ | | | | | 597 | | | | | | 428 | |
3.848% due 08/25/2036 ^~ | | | | | 302 | | | | | | 246 | |
3.952% due 11/25/2036 ^~ | | | | | 125 | | | | | | 111 | |
4.032% due 05/25/2035 ~ | | | | | 107 | | | | | | 109 | |
4.035% due 02/25/2036 ^~ | | | | | 467 | | | | | | 409 | |
4.178% due 06/25/2034 ~ | | | | | 2,731 | | | | | | 2,482 | |
4.296% due 01/25/2036 ~ | | | | | 5,836 | | | | | | 5,421 | |
4.512% due 07/25/2035 ^~ | | | | | 641 | | | | | | 520 | |
|
Bear Stearns Mortgage Funding Trust | |
2.696% due 01/25/2037 • | | | | | 123 | | | | | | 118 | |
|
Bear Stearns Mortgage Securities, Inc. | |
6.202% due 03/25/2031 ~ | | | | | 4 | | | | | | 4 | |
|
Bear Stearns Structured Products, Inc. Trust | |
4.348% due 01/26/2036 ^~ | | | | | 863 | | | | | | 781 | |
|
Chase Mortgage Finance Trust | |
3.781% due 03/25/2037 ^~ | | | | | 54 | | | | | | 53 | |
3.786% due 03/25/2037 ^~ | | | | | 98 | | | | | | 97 | |
4.204% due 09/25/2036 ^~ | | | | | 1,640 | | | | | | 1,532 | |
6.000% due 05/25/2037 ^ | | | | | 142 | | | | | | 108 | |
|
ChaseFlex Trust | |
2.806% due 07/25/2037 • | | | | | 228 | | | | | | 210 | |
4.270% due 08/25/2037 ^Ø | | | | | 46 | | | | | | 44 | |
| | | | | | | | | | | | |
| | | | | PRINCIPAL
AMOUNT
(000S) | | | | | MARKET
VALUE
(000S) | |
5.000% due 07/25/2037 ^ | | $ | | | 124 | | | $ | | | 103 | |
|
Chevy Chase Funding LLC Mortgage-Backed Certificates | |
2.736% due 10/25/2035 • | | | | | 1,716 | | | | | | 1,693 | |
|
Citigroup Mortgage Loan Trust | |
2.726% due 01/25/2037 • | | | | | 4,633 | | | | | | 4,173 | |
3.254% due 10/25/2046 ^~ | | | | | 211 | | | | | | 188 | |
3.732% due 03/25/2037 ^~ | | | | | 98 | | | | | | 88 | |
4.238% due 09/25/2037 ^~ | | | | | 606 | | | | | | 583 | |
4.274% due 07/25/2037 ^~ | | | | | 1,252 | | | | | | 1,254 | |
4.282% due 09/25/2037 ~ | | | | | 121 | | | | | | 118 | |
4.380% due 08/25/2035 ~ | | | | | 29 | | | | | | 29 | |
4.820% due 10/25/2035 • | | | | | 136 | | | | | | 138 | |
4.990% due 11/25/2035 • | | | | | 87 | | | | | | 87 | |
5.500% due 12/25/2035 | | | | | 215 | | | | | | 174 | |
6.250% due 11/25/2037 ~ | | | | | 126 | | | | | | 93 | |
|
Citigroup Mortgage Loan Trust, Inc. | |
4.179% due 12/25/2035 ^~ | | | | | 129 | | | | | | 95 | |
4.471% due 08/25/2035 ~ | | | | | 1,178 | | | | | | 1,191 | |
|
CitiMortgage Alternative Loan Trust | |
6.500% due 06/25/2037 ^ | | | | | 165 | | | | | | 164 | |
|
Community Program Loan Trust | |
4.500% due 04/01/2029 | | | | | 123 | | | | | | 121 | |
|
Countrywide Alternative Loan Resecuritization Trust | |
5.105% due 03/25/2047 ~ | | | | | 44 | | | | | | 44 | |
6.000% due 08/25/2037 ^~ | | | | | 75 | | | | | | 58 | |
7.648% due 08/25/2037 ^~ | | | | | 77 | | | | | | 55 | |
|
Countrywide Alternative Loan Trust | |
2.646% due 08/25/2037 • | | | | | 756 | | | | | | 690 | |
2.650% due 02/20/2047 ^• | | | | | 1,655 | | | | | | 1,346 | |
2.666% due 12/25/2046 ^• | | | | | 25 | | | | | | 25 | |
2.676% due 11/25/2036 • | | | | | 534 | | | | | | 515 | |
2.676% due 01/25/2037 ^• | | | | | 258 | | | | | | 252 | |
2.680% due 07/20/2046 ^• | | | | | 51 | | | | | | 39 | |
2.681% due 11/25/2036 • | | | | | 8,157 | | | | | | 7,262 | |
2.686% due 11/25/2036 • | | | | | 117 | | | | | | 110 | |
2.686% due 05/25/2047 • | | | | | 1,312 | | | | | | 1,273 | |
2.696% due 07/25/2046 ^• | | | | | 101 | | | | | | 92 | |
2.696% due 09/25/2046 ^• | | | | | 499 | | | | | | 460 | |
2.696% due 10/25/2046 • | | | | | 8 | | | | | | 8 | |
2.726% due 05/25/2035 • | | | | | 2,130 | | | | | | 1,946 | |
2.776% due 05/25/2036 ^• | | | | | 7 | | | | | | 3 | |
2.816% due 08/25/2035 ^• | | | | | 201 | | | | | | 175 | |
3.006% due 05/25/2035 ^• | | | | | 3,223 | | | | | | 2,965 | |
3.006% due 06/25/2035 • | | | | | 126 | | | | | | 122 | |
3.026% due 07/25/2035 • | | | | | 146 | | | | | | 141 | |
3.026% due 12/25/2035 • | | | | | 1,060 | | | | | | 1,034 | |
3.045% due 11/25/2035 • | | | | | 1,252 | | | | | | 1,259 | |
3.126% due 10/25/2035 • | | | | | 103 | | | | | | 92 | |
3.157% due 02/25/2036 • | | | | | 526 | | | | | | 483 | |
3.325% due 05/25/2036 ~ | | | | | 56 | | | | | | 45 | |
3.537% due 11/25/2047 ^• | | | | | 3,333 | | | | | | 2,889 | |
3.778% due 08/25/2035 ~ | | | | | 227 | | | | | | 213 | |
3.830% due 06/25/2037 ^~ | | | | | 171 | | | | | | 158 | |
4.118% due 11/25/2035 ^~ | | | | | 125 | | | | | | 113 | |
| | | | | | |
| See Accompanying Notes | | ANNUAL REPORT | | DECEMBER 31, 2018 | | 71 |
Schedule of InvestmentsPIMCO Fixed Income SHares: Series M(Cont.)
| | | | | | | | | | | | |
| | | | | PRINCIPAL
AMOUNT
(000S) | | | | | MARKET
VALUE
(000S) | |
5.500% due 11/25/2035 | | $ | | | 121 | | | $ | | | 93 | |
5.500% due 02/25/2036 ^ | | | | | 86 | | | | | | 74 | |
5.750% due 03/25/2037 ^• | | | | | 148 | | | | | | 126 | |
5.750% due 07/25/2037 ^ | | | | | 23 | | | | | | 19 | |
5.750% due 04/25/2047 ^ | | | | | 156 | | | | | | 133 | |
6.000% due 12/25/2034 | | | | | 91 | | | | | | 90 | |
6.000% due 03/25/2036 ^ | | | | | 240 | | | | | | 187 | |
6.000% due 08/25/2036 ^• | | | | | 82 | | | | | | 67 | |
6.000% due 08/25/2036 ^ | | | | | 255 | | | | | | 209 | |
6.000% due 02/25/2037 ^ | | | | | 561 | | | | | | 397 | |
6.000% due 04/25/2037 ^ | | | | | 99 | | | | | | 82 | |
6.000% due 05/25/2037 ^ | | | | | 462 | | | | | | 327 | |
6.000% due 08/25/2037 ^• | | | | | 513 | | | | | | 401 | |
6.250% due 11/25/2036 ^ | | | | | 106 | | | | | | 92 | |
6.500% due 05/25/2036 ^ | | | | | 1,795 | | | | | | 1,403 | |
6.500% due 12/25/2036 ^ | | | | | 83 | | | | | | 59 | |
6.500% due 08/25/2037 ^ | | | | | 419 | | | | | | 302 | |
12.908% due 07/25/2035 • | | | | | 53 | | | | | | 60 | |
|
Countrywide Asset-Backed Certificates | |
3.006% due 03/25/2036 • | | | | | 6,776 | | | | | | 6,176 | |
|
Countrywide Home Loan Mortgage Pass-Through Trust | |
2.806% due 04/25/2046 ^• | | | | | 30 | | | | | | 2 | |
2.833% due 04/25/2035 ^~ | | | | | 113 | | | | | | 32 | |
2.846% due 03/25/2036 • | | | | | 312 | | | | | | 122 | |
2.966% due 05/25/2035 • | | | | | 92 | | | | | | 84 | |
3.046% due 02/25/2035 • | | | | | 17 | | | | | | 16 | |
3.126% due 03/25/2035 • | | | | | 356 | | | | | | 344 | |
3.246% due 02/25/2035 • | | | | | 387 | | | | | | 378 | |
3.286% due 02/25/2035 • | | | | | 328 | | | | | | 319 | |
3.393% due 05/20/2036 ^~ | | | | | 155 | | | | | | 145 | |
3.538% due 05/20/2036 ~ | | | | | 66 | | | | | | 63 | |
3.568% due 01/25/2036 ^~ | | | | | 129 | | | | | | 119 | |
3.587% due 02/20/2036 ~ | | | | | 294 | | | | | | 238 | |
3.943% due 10/20/2035 ~ | | | | | 81 | | | | | | 72 | |
3.958% due 06/25/2034 ~ | | | | | 918 | | | | | | 949 | |
3.996% due 11/25/2037 ~ | | | | | 257 | | | | | | 226 | |
4.136% due 08/25/2034 ~ | | | | | 6,258 | | | | | | 6,136 | |
4.290% due 11/25/2034 ~ | | | | | 100 | | | | | | 99 | |
4.540% due 08/25/2034 ^~ | | | | | 71 | | | | | | 67 | |
4.592% due 02/20/2036 ^• | | | | | 39 | | | | | | 34 | |
5.500% due 07/25/2037 ^ | | | | | 392 | | | | | | 310 | |
5.750% due 12/25/2035 ^ | | | | | 117 | | | | | | 101 | |
6.000% due 02/25/2037 ^ | | | | | 450 | | | | | | 386 | |
6.000% due 03/25/2037 ^ | | | | | 156 | | | | | | 124 | |
6.000% due 07/25/2037 | | | | | 234 | | | | | | 171 | |
6.500% due 11/25/2036 ^ | | | | | 1,033 | | | | | | 726 | |
|
Countrywide Home Loan Reperforming REMIC Trust | |
6.000% due 03/25/2035 ^ | | | | | 90 | | | | | | 89 | |
|
Credit Suisse First Boston Mortgage Securities Corp. | |
2.885% due 03/25/2032 ~ | | | | | 15 | | | | | | 15 | |
3.656% due 09/25/2034 ^• | | | | | 84 | | | | | | 83 | |
|
Credit Suisse Mortgage Capital Certificates | |
2.975% due 12/27/2035 • | | | | | 149 | | | | | | 148 | |
3.500% due 04/26/2038 ~ | | | | | 1,084 | | | | | | 1,079 | |
| | | | | | | | | | | | |
| | | | | PRINCIPAL
AMOUNT
(000S) | | | | | MARKET
VALUE
(000S) | |
4.084% due 08/28/2036 ~ | | $ | | | 27 | | | $ | | | 27 | |
4.490% due 04/28/2037 ~ | | | | | 450 | | | | | | 432 | |
|
Credit Suisse Mortgage Capital Trust | |
2.555% due 05/27/2037 • | | | | | 59 | | | | | | 59 | |
|
DeutscheALT-A Securities, Inc. | |
2.806% due 04/25/2037 • | | | | | 390 | | | | | | 252 | |
|
DeutscheALT-A Securities, Inc. Mortgage Loan Trust | |
2.666% due 01/25/2047 • | | | | | 70 | | | | | | 68 | |
2.696% due 08/25/2047 • | | | | | 421 | | | | | | 397 | |
|
Deutsche Mortgage & Asset Receiving Corp. | |
2.555% due 11/27/2036 • | | | | | 359 | | | | | | 350 | |
|
Downey Savings & Loan Association Mortgage Loan Trust | |
2.790% due 07/19/2045 ^• | | | | | 14 | | | | | | 0 | |
|
Eurosail PLC | |
1.850% due 06/13/2045 • | | GBP | | | 4,971 | | | | | | 6,190 | |
|
First Horizon Alternative Mortgage Securities Trust | |
4.052% due 01/25/2036 ^~ | | $ | | | 293 | | | | | | 225 | |
4.105% due 04/25/2036 ^~ | | | | | 179 | | | | | | 167 | |
|
First Horizon Mortgage Pass-Through Trust | |
4.504% due 11/25/2037 ^~ | | | | | 65 | | | | | | 63 | |
|
GMAC Mortgage Corp. Loan Trust | |
4.075% due 11/19/2035 ^~ | | | | | 142 | | | | | | 137 | |
|
GreenPoint Mortgage Funding Trust | |
2.706% due 12/25/2046 ^• | | | | | 343 | | | | | | 312 | |
|
GS Mortgage Securities Trust | |
3.602% due 10/10/2049 ~ | | | | | 5,000 | | | | | | 5,008 | |
|
GSC Capital Corp. Mortgage Trust | |
2.686% due 05/25/2036 ^• | | | | | 147 | | | | | | 134 | |
|
GSR Mortgage Loan Trust | |
3.850% due 04/25/2035 ~ | | | | | 65 | | | | | | 66 | |
3.941% due 04/25/2035 ~ | | | | | 37 | | | | | | 37 | |
4.300% due 09/25/2035 ~ | | | | | 256 | | | | | | 261 | |
4.431% due 09/25/2035 ~ | | | | | 105 | | | | | | 107 | |
4.592% due 11/25/2035 ~ | | | | | 146 | | | | | | 119 | |
4.680% due 09/25/2034 ~ | | | | | 76 | | | | | | 78 | |
|
HarborView Mortgage Loan Trust | |
2.660% due 01/19/2038 • | | | | | 50 | | | | | | 48 | |
2.710% due 12/19/2036 ^• | | | | | 5,975 | | | | | | 5,499 | |
2.720% due 01/19/2038 ^• | | | | | 55 | | | | | | 40 | |
2.910% due 05/19/2035 • | | | | | 3,006 | | | | | | 2,915 | |
2.970% due 01/19/2036 • | | | | | 147 | | | | | | 116 | |
3.150% due 01/19/2035 • | | | | | 52 | | | | | | 52 | |
3.465% due 07/19/2045 • | | | | | 54 | | | | | | 51 | |
3.850% due 06/19/2036 ^~ | | | | | 226 | | | | | | 152 | |
4.056% due 12/19/2035 ^~ | | | | | 139 | | | | | | 112 | |
4.714% due 12/19/2035 ^~ | | | | | 84 | | | | | | 83 | |
|
HomeBanc Mortgage Trust | |
2.686% due 12/25/2036 • | | | | | 96 | | | | | | 94 | |
|
Impac Secured Assets Trust | |
2.656% due 11/25/2036 • | | | | | 1,015 | | | | | | 941 | |
2.676% due 01/25/2037 • | | | | | 99 | | | | | | 95 | |
| | | | | | |
| 72 | | PIMCO MANAGED ACCOUNTS TRUST | | | | See Accompanying Notes |
December 31, 2018
| | | | | | | | | | | | |
| | | | | PRINCIPAL
AMOUNT
(000S) | | | | | MARKET
VALUE
(000S) | |
|
IndyMac Mortgage Loan Trust | |
2.686% due 07/25/2047 • | | $ | | | 386 | | | $ | | | 326 | |
2.696% due 09/25/2046 • | | | | | 146 | | | | | | 130 | |
2.806% due 11/25/2035 ^• | | | | | 213 | | | | | | 162 | |
3.066% due 03/25/2035 • | | | | | 225 | | | | | | 223 | |
3.279% due 06/25/2037 ^~ | | | | | 112 | | | | | | 102 | |
3.559% due 06/25/2036 ~ | | | | | 5,536 | | | | | | 4,754 | |
3.627% due 06/25/2036 ~ | | | | | 1,383 | | | | | | 1,324 | |
3.735% due 11/25/2035 ^~ | | | | | 155 | | | | | | 142 | |
3.754% due 10/25/2035 ~ | | | | | 839 | | | | | | 752 | |
3.874% due 09/25/2035 ^~ | | | | | 101 | | | | | | 94 | |
3.896% due 08/25/2036 ~ | | | | | 2,818 | | | | | | 2,776 | |
3.909% due 08/25/2035 ~ | | | | | 1,066 | | | | | | 954 | |
4.238% due 06/25/2035 ^~ | | | | | 73 | | | | | | 69 | |
|
JPMorgan Alternative Loan Trust | |
2.656% due 03/25/2037 • | | | | | 12 | | | | | | 16 | |
2.666% due 10/25/2036 • | | | | | 7,063 | | | | | | 6,764 | |
2.822% due 06/27/2037 • | | | | | 3,730 | | | | | | 3,324 | |
3.866% due 12/25/2036 ~ | | | | | 25 | | | | | | 29 | |
|
JPMorgan Mortgage Trust | |
3.670% due 06/25/2037 ^~ | | | | | 184 | | | | | | 178 | |
4.187% due 04/25/2035 ~ | | | | | 39 | | | | | | 39 | |
4.220% due 11/25/2035 ^~ | | | | | 76 | | | | | | 75 | |
4.327% due 07/25/2035 ~ | | | | | 437 | | | | | | 453 | |
4.343% due 01/25/2037 ^~ | | | | | 23 | | | | | | 21 | |
4.385% due 11/25/2035 ^~ | | | | | 116 | | | | | | 113 | |
4.452% due 07/25/2035 ~ | | | | | 299 | | | | | | 305 | |
4.466% due 09/25/2034 ~ | | | | | 214 | | | | | | 214 | |
4.642% due 04/25/2035 ~ | | | | | 24 | | | | | | 24 | |
6.000% due 01/25/2036 ^ | | | | | 142 | | | | | | 111 | |
|
JPMorgan Resecuritization Trust | |
4.141% due 05/27/2037 ~ | | | | | 422 | | | | | | 421 | |
|
Lavender Trust | |
6.250% due 10/26/2036 | | | | | 319 | | | | | | 252 | |
|
Lehman Mortgage Trust | |
5.221% due 01/25/2036 ^~ | | | | | 173 | | | | | | 171 | |
5.335% due 12/25/2035 ~ | | | | | 247 | | | | | | 136 | |
6.000% due 07/25/2036 ^ | | | | | 93 | | | | | | 71 | |
|
Lehman XS Trust | |
2.696% due 11/25/2046 • | | | | | 16,137 | | | | | | 15,116 | |
2.706% due 08/25/2046 ^• | | | | | 78 | | | | | | 72 | |
2.736% due 04/25/2046 ^• | | | | | 55 | | | | | | 54 | |
2.746% due 11/25/2046 ^• | | | | | 19 | | | | | | 2 | |
2.776% due 02/25/2036 • | | | | | 7,832 | | | | | | 7,491 | |
|
Luminent Mortgage Trust | |
2.676% due 12/25/2036 • | | | | | 811 | | | | | | 766 | |
2.706% due 10/25/2046 • | | | | | 246 | | | | | | 237 | |
|
MASTR Adjustable Rate Mortgages Trust | |
2.746% due 05/25/2037 • | | | | | 134 | | | | | | 80 | |
|
MASTR Reperforming Loan Trust | |
7.000% due 05/25/2035 | | | | | 1,063 | | | | | | 1,014 | |
8.000% due 07/25/2035 | | | | | 1,005 | | | | | | 1,065 | |
| | | | | | | | | | | | |
| | | | | PRINCIPAL
AMOUNT
(000S) | | | | | MARKET
VALUE
(000S) | |
|
Mellon Residential Funding Corp. MortgagePass-Through Trust | |
2.892% due 10/20/2029 • | | $ | | | 44 | | | $ | | | 45 | |
|
Merrill Lynch Alternative Note Asset Trust | |
2.666% due 01/25/2037 • | | | | | 141 | | | | | | 66 | |
2.686% due 04/25/2037 • | | | | | 143 | | | | | | 144 | |
2.806% due 03/25/2037 • | | | | | 967 | | | | | | 418 | |
6.000% due 05/25/2037 ^ | | | | | 195 | | | | | | 189 | |
|
Merrill Lynch Mortgage Investors Trust | |
2.966% due 04/25/2029 • | | | | | 46 | | | | | | 45 | |
2.975% due 11/25/2029 • | | | | | 62 | | | | | | 61 | |
3.166% due 09/25/2029 • | | | | | 45 | | | | | | 45 | |
3.908% due 07/25/2029 • | | | | | 43 | | | | | | 43 | |
4.176% due 02/25/2036 ~ | | | | | 46 | | | | | | 46 | |
4.674% due 11/25/2035 • | | | | | 92 | | | | | | 93 | |
6.250% due 10/25/2036 | | | | | 2,447 | | | | | | 2,021 | |
|
Morgan Stanley Dean Witter Capital, Inc. Trust | |
3.813% due 03/25/2033 ~ | | | | | 82 | | | | | | 81 | |
|
Morgan Stanley Mortgage Loan Trust | |
2.786% due 11/25/2035 • | | | | | 23 | | | | | | 23 | |
2.826% due 01/25/2035 • | | | | | 39 | | | | | | 38 | |
3.683% due 07/25/2035 ~ | | | | | 3,204 | | | | | | 2,822 | |
4.274% due 06/25/2036 ~ | | | | | 92 | | | | | | 93 | |
6.000% due 10/25/2037 ^ | | | | | 85 | | | | | | 69 | |
|
Morgan StanleyRe-REMIC Trust | |
2.828% due 02/26/2037 • | | | | | 227 | | | | | | 198 | |
4.437% due 03/26/2037 Ø | | | | | 121 | | | | | | 109 | |
5.500% due 10/26/2035 ~ | | | | | 10,429 | | | | | | 8,901 | |
|
Morgan Stanley Resecuritization Trust | |
2.625% due 01/26/2051 • | | | | | 223 | | | | | | 222 | |
|
NAAC Reperforming Loan REMIC Trust | |
7.500% due 03/25/2034 ^ | | | | | 480 | | | | | | 460 | |
|
Nomura Asset Acceptance Corp. Alternative Loan Trust | |
4.941% due 02/25/2036 ^~ | | | | | 755 | | | | | | 662 | |
|
RBSSP Resecuritization Trust | |
2.565% due 02/26/2037 • | | | | | 1,163 | | | | | | 1,145 | |
4.391% due 10/26/2035 ~ | | | | | 1,462 | | | | | | 1,473 | |
|
Residential Accredit Loans, Inc. Trust | |
2.676% due 12/25/2036 • | | | | | 395 | | | | | | 336 | |
2.706% due 05/25/2047 • | | | | | 154 | | | | | | 147 | |
2.716% due 06/25/2037 • | | | | | 127 | | | | | | 109 | |
2.756% due 08/25/2037 • | | | | | 395 | | | | | | 367 | |
2.915% due 08/25/2035 • | | | | | 170 | | | | | | 151 | |
3.306% due 10/25/2045 • | | | | | 126 | | | | | | 115 | |
3.919% due 02/25/2035 ^~ | | | | | 289 | | | | | | 248 | |
5.089% due 02/25/2036 ^~ | | | | | 137 | | | | | | 122 | |
8.000% due 04/25/2036 ^• | | | | | 152 | | | | | | 149 | |
|
Residential Asset Securitization Trust | |
6.000% due 06/25/2036 | | | | | 204 | | | | | | 140 | |
6.000% due 11/25/2036 ^ | | | | | 138 | | | | | | 86 | |
6.000% due 03/25/2037 ^ | | | | | 121 | | | | | | 76 | |
6.250% due 11/25/2036 ^ | | | | | 94 | | | | | | 61 | |
6.500% due 04/25/2037 ^ | | | | | 1,259 | | | | | | 633 | |
| | | | | | |
| See Accompanying Notes | | ANNUAL REPORT | | DECEMBER 31, 2018 | | 73 |
Schedule of InvestmentsPIMCO Fixed Income SHares: Series M(Cont.)
| | | | | | | | | | | | |
| | | | | PRINCIPAL
AMOUNT
(000S) | | | | | MARKET
VALUE
(000S) | |
|
Residential Funding Mortgage Securities, Inc. Trust | |
4.625% due 03/25/2035 ^~ | | $ | | | 1,357 | | | $ | | | 1,097 | |
6.000% due 09/25/2036 ^ | | | | | 271 | | | | | | 252 | |
|
Structured Adjustable Rate Mortgage Loan Trust | |
2.826% due 10/25/2035 • | | | | | 1,464 | | | | | | 1,388 | |
3.241% due 06/25/2034 • | | | | | 527 | | | | | | 508 | |
3.557% due 05/25/2035 ^• | | | | | 469 | | | | | | 393 | |
3.922% due 09/25/2036 ^~ | | | | | 3,897 | | | | | | 2,986 | |
3.993% due 06/25/2036 ^~ | | | | | 21 | | | | | | 21 | |
4.022% due 02/25/2036 ^~ | | | | | 318 | | | | | | 293 | |
4.072% due 10/25/2036 ^~ | | | | | 156 | | | | | | 127 | |
4.213% due 07/25/2037 ^~ | | | | | 6 | | | | | | 5 | |
4.233% due 10/25/2034 ~ | | | | | 62 | | | | | | 62 | |
|
Structured Asset Mortgage Investments Trust | |
2.612% due 02/25/2036 ^• | | | | | 677 | | | | | | 665 | |
2.686% due 09/25/2047 • | | | | | 89 | | | | | | 86 | |
2.696% due 06/25/2036 • | | | | | 10,248 | | | | | | 10,129 | |
2.696% due 07/25/2046 ^• | | | | | 564 | | | | | | 468 | |
2.696% due 09/25/2047 • | | | | | 1,006 | | | | | | 966 | |
2.706% due 05/25/2036 • | | | | | 1,001 | | | | | | 921 | |
2.716% due 09/25/2047 ^• | | | | | 1,541 | | | | | | 1,519 | |
2.726% due 05/25/2046 • | | | | | 1,027 | | | | | | 578 | |
2.766% due 03/25/2037 • | | | | | 170 | | | | | | 121 | |
2.766% due 05/25/2046 ^• | | | | | 33 | | | | | | 46 | |
3.170% due 03/19/2034 • | | | | | 344 | | | | | | 331 | |
3.170% due 02/19/2035 • | | | | | 155 | | | | | | 152 | |
3.210% due 12/19/2033 • | | | | | 347 | | | | | | 339 | |
|
Structured Asset Securities Corp. Trust | |
2.856% due 02/25/2035 • | | | | | 26 | | | | | | 25 | |
|
Suntrust Adjustable Rate Mortgage Loan Trust | |
4.102% due 02/25/2037 ^~ | | | | | 422 | | | | | | 406 | |
|
SunTrust Alternative Loan Trust | |
6.000% due 12/25/2035 | | | | | 553 | | | | | | 544 | |
|
TBW Mortgage-Backed Trust | |
5.965% due 07/25/2037 ~ | | | | | 4,127 | | | | | | 2,226 | |
|
Thornburg Mortgage Securities Trust | |
3.146% due 09/25/2043 • | | | | | 266 | | | | | | 264 | |
3.246% due 09/25/2044 • | | | | | 43 | | | | | | 43 | |
4.282% due 09/25/2037 ~ | | | | | 83 | | | | | | 83 | |
|
Wachovia Mortgage Loan Trust LLC | |
4.677% due 10/20/2035 ~ | | | | | 64 | | | | | | 60 | |
|
WaMu Mortgage Pass-Through Certificates Trust | |
2.579% due 11/25/2046 • | | | | | 275 | | | | | | 270 | |
2.678% due 07/25/2047 • | | | | | 17,136 | | | | | | 15,611 | |
2.776% due 12/25/2045 • | | | | | 8 | | | | | | 8 | |
2.907% due 06/25/2047 ^• | | | | | 89 | | | | | | 37 | |
2.916% due 11/25/2045 • | | | | | 253 | | | | | | 246 | |
3.146% due 01/25/2045 • | | | | | 258 | | | | | | 265 | |
3.157% due 08/25/2046 • | | | | | 1,758 | | | | | | 1,647 | |
3.246% due 11/25/2034 • | | | | | 220 | | | | | | 217 | |
3.286% due 10/25/2044 • | | | | | 1,153 | | | | | | 1,156 | |
3.357% due 11/25/2042 • | | | | | 31 | | | | | | 30 | |
3.486% due 11/25/2034 • | | | | | 605 | | | | | | 606 | |
3.645% due 12/25/2036 ^~ | | | | | 1,425 | | | | | | 1,396 | |
| | | | | | | | | | | | |
| | | | | PRINCIPAL
AMOUNT
(000S) | | | | | MARKET
VALUE
(000S) | |
3.693% due 12/25/2036 ^~ | | $ | | | 163 | | | $ | | | 157 | |
3.909% due 08/25/2036 ^~ | | | | | 125 | | | | | | 121 | |
4.239% due 08/25/2033 ~ | | | | | 315 | | | | | | 320 | |
|
Washington Mutual Mortgage Pass-Through Certificates Trust | |
2.857% due 04/25/2047 • | | | | | 462 | | | | | | 385 | |
2.927% due 04/25/2047 • | | | | | 675 | | | | | | 501 | |
2.956% due 05/25/2035 ^• | | | | | 443 | | | | | | 375 | |
4.376% due 09/25/2036 ^Ø | | | | | 161 | | | | | | 75 | |
|
Wells Fargo Alternative Loan Trust | |
4.486% due 07/25/2037 ^~ | | | | | 65 | | | | | | 60 | |
|
Wells Fargo Mortgage-Backed Securities Trust | |
3.006% due 07/25/2037 ^• | | | | | 98 | | | | | | 88 | |
4.048% due 03/25/2036 ^~ | | | | | 91 | | | | | | 90 | |
4.127% due 03/25/2035 ~ | | | | | 1,182 | | | | | | 1,199 | |
4.309% due 07/25/2036 ^~ | | | | | 1,370 | | | | | | 1,341 | |
4.602% due 08/25/2034 ~ | | | | | 92 | | | | | | 95 | |
4.607% due 03/25/2036 ~ | | | | | 622 | | | | | | 633 | |
4.694% due 06/25/2035 ~ | | | | | 1,638 | | | | | | 1,658 | |
4.748% due 10/25/2036 ^~ | | | | | 44 | | | | | | 44 | |
4.754% due 10/25/2036 ^~ | | | | | 481 | | | | | | 475 | |
4.931% due 01/25/2035 ~ | | | | | 312 | | | | | | 316 | |
6.000% due 06/25/2037 ^ | | | | | 104 | | | | | | 103 | |
| | | | | | | | | | | | |
TotalNon-Agency Mortgage-Backed Securities (Cost $244,136) | | | | | | 256,310 | |
| | | | | | | | | | | | |
| |
| ASSET-BACKED SECURITIES 36.4% | |
|
Aames Mortgage Investment Trust | |
3.286% due 10/25/2035 • | | | | | 200 | | | | | | 198 | |
3.515% due 06/25/2035 • | | | | | 696 | | | | | | 678 | |
|
AASET Trust | |
3.967% due 05/16/2042 | | | | | 2,419 | | | | | | 2,416 | |
|
AASET U.S. Ltd. | |
3.844% due 01/16/2038 | | | | | 4,007 | | | | | | 4,023 | |
|
Accredited Mortgage Loan Trust | |
2.636% due 02/25/2037 • | | | | | 530 | | | | | | 530 | |
2.766% due 09/25/2036 • | | | | | 877 | | | | | | 856 | |
2.903% due 09/25/2035 • | | | | | 200 | | | | | | 192 | |
|
ACE Securities Corp. Home Equity Loan Trust | |
2.616% due 12/25/2036 • | | | | | 348 | | | | | | 130 | |
2.646% due 07/25/2036 • | | | | | 176 | | | | | | 143 | |
2.661% due 08/25/2036 • | | | | | 669 | | | | | | 648 | |
2.666% due 05/25/2036 • | | | | | 3 | | | | | | 3 | |
2.806% due 02/25/2036 • | | | | | 131 | | | | | | 130 | |
3.121% due 12/25/2035 • | | | | | 2,000 | | | | | | 1,857 | |
3.126% due 02/25/2036 ^• | | | | | 147 | | | | | | 138 | |
3.166% due 11/25/2035 • | | | | | 191 | | | | | | 191 | |
3.406% due 12/25/2034 • | | | | | 163 | | | | | | 159 | |
3.481% due 06/25/2034 • | | | | | 144 | | | | | | 145 | |
3.481% due 07/25/2035 • | | | | | 100 | | | | | | 101 | |
|
Aegis Asset-Backed Securities Trust | |
2.936% due 12/25/2035 • | | | | | 200 | | | | | | 194 | |
| | | | | | |
| 74 | | PIMCO MANAGED ACCOUNTS TRUST | | | | See Accompanying Notes |
December 31, 2018
| | | | | | | | | | | | |
| | | | | PRINCIPAL
AMOUNT
(000S) | | | | | MARKET
VALUE
(000S) | |
2.986% due 06/25/2035 • | | $ | | | 200 | | | $ | | | 178 | |
3.015% due 03/25/2035 • | | | | | 300 | | | | | | 287 | |
3.506% due 03/25/2035 ^• | | | | | 113 | | | | | | 105 | |
|
Ameriquest Mortgage Securities Trust | |
2.896% due 03/25/2036 • | | | | | 400 | | | | | | 397 | |
|
Ameriquest Mortgage Securities, Inc. Asset-Backed Pass-Through Certificates | |
2.956% due 01/25/2036 • | | | | | 280 | | | | | | 280 | |
2.976% due 11/25/2035 • | | | | | 200 | | | | | | 194 | |
3.026% due 09/25/2035 • | | | | | 10,000 | | | | | | 9,954 | |
3.106% due 08/25/2035 • | | | | | 22 | | | | | | 22 | |
3.181% due 07/25/2035 • | | | | | 790 | | | | | | 792 | |
3.616% due 03/25/2035 • | | | | | 200 | | | | | | 199 | |
|
Amortizing Residential Collateral Trust | |
3.506% due 10/25/2034 • | | | | | 194 | | | | | | 193 | |
|
Argent Securities Trust | |
2.656% due 09/25/2036 • | | | | | 892 | | | | | | 363 | |
2.696% due 03/25/2036 • | | | | | 350 | | | | | | 207 | |
|
Argent Securities, Inc. Asset-Backed Pass-Through Certificates | |
2.736% due 01/25/2036 • | | | | | 107 | | | | | | 99 | |
2.826% due 01/25/2036 • | | | | | 4,347 | | | | | | 3,981 | |
3.346% due 04/25/2034 • | | | | | 1,551 | | | | | | 1,534 | |
|
Asset-Backed Funding Certificates Trust | |
2.616% due 01/25/2037 • | | | | | 489 | | | | | | 311 | |
2.646% due 11/25/2036 • | | | | | 11,800 | | | | | | 8,743 | |
2.666% due 01/25/2037 • | | | | | 308 | | | | | | 198 | |
2.726% due 01/25/2037 • | | | | | 185 | | | | | | 120 | |
3.126% due 04/25/2034 • | | | | | 205 | | | | | | 205 | |
3.181% due 06/25/2035 • | | | | | 163 | | | | | | 163 | |
3.506% due 06/25/2037 • | | | | | 227 | | | | | | 194 | |
|
Asset-Backed Securities Corp. Home Equity Loan Trust | |
2.956% due 11/25/2035 • | | | | | 300 | | | | | | 300 | |
3.406% due 06/25/2035 • | | | | | 200 | | | | | | 199 | |
4.319% due 08/15/2033 • | | | | | 31 | | | | | | 30 | |
4.381% due 09/25/2034 • | | | | | 1,433 | | | | | | 1,478 | |
|
Avery Point CLO Ltd. | |
3.590% due 04/25/2026 • | | | | | 3,885 | | | | | | 3,886 | |
|
Babson Euro CLO BV | |
0.503% due 10/25/2029 • | | EUR | | | 2,250 | | | | | | 2,554 | |
|
Basic Asset-Backed Securities Trust | |
2.816% due 04/25/2036 • | | $ | | | 150 | | | | | | 149 | |
|
Bayview Opportunity Master Fund Trust | |
4.066% due 09/28/2033 Ø | | | | | 905 | | | | | | 908 | |
|
Bear Stearns Asset-Backed Securities Trust | |
2.616% due 04/25/2031 • | | | | | 71 | | | | | | 100 | |
2.656% due 06/25/2036 • | | | | | 142 | | | | | | 143 | |
2.686% due 06/25/2047 • | | | | | 36 | | | | | | 36 | |
2.696% due 05/25/2037 • | | | | | 125 | | | | | | 140 | |
2.706% due 12/25/2036 • | | | | | 289 | | | | | | 289 | |
2.736% due 02/25/2037 • | | | | | 11,495 | | | | | | 10,184 | |
2.776% due 06/25/2036 • | | | | | 200 | | | | | | 199 | |
| | | | | | | | | | | | |
| | | | | PRINCIPAL
AMOUNT
(000S) | | | | | MARKET
VALUE
(000S) | |
2.846% due 05/25/2036 ^• | | $ | | | 207 | | | $ | | | 246 | |
2.906% due 09/25/2046 • | | | | | 204 | | | | | | 197 | |
2.936% due 12/25/2035 • | | | | | 500 | | | | | | 501 | |
2.956% due 08/25/2036 • | | | | | 331 | | | | | | 323 | |
3.006% due 12/25/2035 • | | | | | 164 | | | | | | 163 | |
3.056% due 06/25/2036 • | | | | | 300 | | | | | | 298 | |
3.206% due 11/25/2035 ^• | | | | | 175 | | | | | | 141 | |
3.466% due 04/25/2035 • | | | | | 92 | | | | | | 92 | |
3.556% due 08/25/2037 • | | | | | 7,964 | | | | | | 7,092 | |
3.559% due 10/25/2036 ~ | | | | | 59 | | | | | | 41 | |
3.686% due 06/25/2043 • | | | | | 1,051 | | | | | | 1,055 | |
3.756% due 08/25/2037 • | | | | | 116 | | | | | | 115 | |
4.240% due 07/25/2036 ~ | | | | | 317 | | | | | | 321 | |
15.258% due 03/25/2036 ^• | | | | | 192 | | | | | | 168 | |
|
Business Jet Securities LLC | |
4.447% due 06/15/2033 | | | | | 7,233 | | | | | | 7,316 | |
|
Carrington Mortgage Loan Trust | |
2.726% due 01/25/2037 • | | | | | 1,200 | | | | | | 935 | |
2.766% due 02/25/2037 • | | | | | 1,400 | | | | | | 1,308 | |
3.556% due 05/25/2035 • | | | | | 300 | | | | | | 293 | |
|
Catamaran CLO Ltd. | |
3.859% due 01/27/2028 • | | | | | 400 | | | | | | 392 | |
|
Cendant Mortgage Corp. | |
6.000% due 07/25/2043 ~ | | | | | 21 | | | | | | 22 | |
|
Cent CLO Ltd. | |
3.839% due 10/29/2025 • | | | | | 7,133 | | | | | | 7,142 | |
|
Citigroup Mortgage Loan Trust | |
2.646% due 12/25/2036 • | | | | | 495 | | | | | | 491 | |
2.676% due 05/25/2037 • | | | | | 17,763 | | | | | | 15,878 | |
2.906% due 11/25/2046 • | | | | | 237 | | | | | | 231 | |
2.956% due 11/25/2045 • | | | | | 231 | | | | | | 229 | |
3.126% due 12/25/2035 • | | | | | 132 | | | | | | 132 | |
6.351% due 05/25/2036 ^Ø | | | | | 171 | | | | | | 97 | |
|
Citigroup Mortgage Loan Trust Asset-Backed Pass-Through Certificates | |
3.436% due 05/25/2035 • | | | | | 200 | | | | | | 198 | |
|
Citigroup Mortgage Loan Trust, Inc. | |
2.766% due 01/25/2037 • | | | | | 300 | | | | | | 296 | |
2.916% due 10/25/2035 • | | | | | 1,064 | | | | | | 1,065 | |
3.226% due 09/25/2035 ^• | | | | | 77 | | | | | | 77 | |
3.241% due 09/25/2035 ^• | | | | | 500 | | | | | | 500 | |
|
Conseco Finance Corp. | |
6.810% due 12/01/2028 ~ | | | | | 269 | | | | | | 275 | |
6.870% due 04/01/2030 ~ | | | | | 198 | | | | | | 209 | |
7.060% due 02/01/2031 ~ | | | | | 635 | | | | | | 627 | |
|
Countrywide Asset-Backed Certificates | |
2.615% due 07/25/2036 • | | | | | 178 | | | | | | 177 | |
2.646% due 06/25/2035 • | | | | | 1,476 | | | | | | 1,341 | |
2.646% due 07/25/2037 ^• | | | | | 3,811 | | | | | | 3,321 | |
2.656% due 07/25/2036 ^• | | | | | 90 | | | | | | 90 | |
2.656% due 01/25/2037 • | | | | | 5,308 | | | | | | 5,145 | |
2.656% due 05/25/2037 • | | | | | 425 | | | | | | 420 | |
2.666% due 01/25/2034 • | | | | | 50 | | | | | | 49 | |
2.666% due 05/25/2036 • | | | | | 488 | | | | | | 436 | |
| | | | | | |
| See Accompanying Notes | | ANNUAL REPORT | | DECEMBER 31, 2018 | | 75 |
Schedule of InvestmentsPIMCO Fixed Income SHares: Series M(Cont.)
| | | | | | | | | | | | |
| | | | | PRINCIPAL
AMOUNT
(000S) | | | | | MARKET
VALUE
(000S) | |
2.666% due 03/25/2037 • | | $ | | | 159 | | | $ | | | 157 | |
2.676% due 03/25/2037 • | | | | | 229 | | | | | | 220 | |
2.676% due 05/25/2037 • | | | | | 125 | | | | | | 124 | |
2.676% due 06/25/2047 • | | | | | 169 | | | | | | 168 | |
2.686% due 06/25/2047 • | | | | | 367 | | | | | | 363 | |
2.696% due 06/25/2047 • | | | | | 201 | | | | | | 199 | |
2.706% due 09/25/2037 • | | | | | 5,014 | | | | | | 4,302 | |
2.726% due 09/25/2037 ^• | | | | | 206 | | | | | | 174 | |
2.726% due 09/25/2047 ^• | | | | | 1,681 | | | | | | 1,547 | |
2.736% due 10/25/2047 • | | | | | 386 | | | | | | 370 | |
2.756% due 01/25/2046 ^• | | | | | 4,344 | | | | | | 4,104 | |
2.756% due 06/25/2047 • | | | | | 243 | | | | | | 227 | |
2.765% due 03/25/2036 • | | | | | 1,100 | | | | | | 1,079 | |
2.856% due 04/25/2036 • | | | | | 39 | | | | | | 39 | |
2.906% due 06/25/2036 • | | | | | 300 | | | | | | 294 | |
2.956% due 03/25/2047 ^• | | | | | 100 | | | | | | 76 | |
2.996% due 02/25/2036 • | | | | | 200 | | | | | | 199 | |
3.166% due 12/25/2035 • | | | | | 300 | | | | | | 302 | |
3.481% due 02/25/2034 • | | | | | 72 | | | | | | 72 | |
3.556% due 08/25/2035 • | | | | | 100 | | | | | | 101 | |
4.006% due 02/25/2035 • | | | | | 300 | | | | | | 306 | |
4.700% due 10/25/2046 ^~ | | | | | 14,991 | | | | | | 13,806 | |
|
Countrywide Asset-Backed Certificates Trust | |
2.636% due 04/25/2046 • | | | | | 5,968 | | | | | | 5,618 | |
2.646% due 02/25/2037 • | | | | | 10,434 | | | | | | 9,736 | |
2.656% due 09/25/2046 • | | | | | 4,977 | | | | | | 4,934 | |
2.656% due 10/25/2046 ^• | | | | | 578 | | | | | | 579 | |
2.656% due 03/25/2047 ^• | | | | | 178 | | | | | | 174 | |
2.966% due 05/25/2036 • | | | | | 600 | | | | | | 593 | |
3.036% due 02/25/2036 • | | | | | 200 | | | | | | 199 | |
3.226% due 07/25/2034 • | | | | | 145 | | | | | | 145 | |
3.236% due 07/25/2035 • | | | | | 400 | | | | | | 400 | |
3.306% due 08/25/2047 • | | | | | 694 | | | | | | 689 | |
3.406% due 10/25/2034 • | | | | | 97 | | | | | | 96 | |
3.436% due 08/25/2035 • | | | | | 6 | | | | | | 6 | |
3.665% due 04/25/2035 • | | | | | 200 | | | | | | 202 | |
|
Credit-Based Asset Servicing & Securitization LLC | |
2.626% due 07/25/2037 • | | | | | 14 | | | | | | 9 | |
2.726% due 07/25/2037 • | | | | | 293 | | | | | | 191 | |
3.076% due 07/25/2036 • | | | | | 98 | | | | | | 98 | |
3.451% due 04/25/2036 • | | | | | 77 | | | | | | 77 | |
3.791% due 06/25/2035 Ø | | | | | 4 | | | | | | 4 | |
|
CVP Cascade CLO Ltd. | |
3.586% due 01/16/2026 • | | | | | 8,242 | | | | | | 8,235 | |
|
Delta Funding Home Equity Loan Trust | |
3.095% due 08/15/2030 • | | | | | 60 | | | | | | 57 | |
|
ECMC Group Student Loan Trust | |
3.256% due 02/27/2068 • | | | | | 8,945 | | | | | | 8,941 | |
|
EMC Mortgage Loan Trust | |
3.246% due 05/25/2040 • | | | | | 11 | | | | | | 11 | |
|
First Franklin Mortgage Loan Trust | |
2.646% due 12/25/2036 • | | | | | 309 | | | | | | 183 | |
2.656% due 07/25/2036 • | | | | | 50 | | | | | | 50 | |
2.666% due 04/25/2036 • | | | | | 222 | | | | | | 216 | |
| | | | | | | | | | | | |
| | | | | PRINCIPAL
AMOUNT
(000S) | | | | | MARKET
VALUE
(000S) | |
2.746% due 04/25/2036 • | | $ | | | 400 | | | $ | | | 368 | |
2.746% due 08/25/2036 • | | | | | 305 | | | | | | 259 | |
2.866% due 10/25/2035 • | | | | | 115 | | | | | | 114 | |
2.866% due 11/25/2035 • | | | | | 195 | | | | | | 187 | |
2.956% due 06/25/2036 • | | | | | 153 | | | | | | 154 | |
3.241% due 09/25/2035 • | | | | | 82 | | | | | | 83 | |
3.316% due 04/25/2035 • | | | | | 297 | | | | | | 298 | |
3.376% due 09/25/2034 • | | | | | 247 | | | | | | 247 | |
3.451% due 03/25/2035 • | | | | | 100 | | | | | | 99 | |
3.706% due 01/25/2035 • | | | | | 122 | | | | | | 122 | |
3.931% due 10/25/2034 • | | | | | 759 | | | | | | 750 | |
|
First NLC Trust | |
1.188% due 05/25/2035 • | | | | | 927 | | | | | | 899 | |
2.576% due 08/25/2037 • | | | | | 59 | | | | | | 35 | |
|
FIRSTPLUS Home Loan Owner Trust | |
7.320% due 11/10/2023 ^ | | | | | 6 | | | | | | 1 | |
|
Fremont Home Loan Trust | |
2.656% due 01/25/2037 • | | | | | 272 | | | | | | 154 | |
2.666% due 08/25/2036 • | | | | | 228 | | | | | | 102 | |
2.676% due 02/25/2036 • | | | | | 63 | | | | | | 59 | |
2.676% due 02/25/2037 • | | | | | 948 | | | | | | 492 | |
2.776% due 02/25/2036 • | | | | | 300 | | | | | | 242 | |
2.776% due 04/25/2036 • | | | | | 3,000 | | | | | | 1,817 | |
3.241% due 07/25/2035 • | | | | | 2,900 | | | | | | 2,889 | |
3.296% due 12/25/2029 • | | | | | 7 | | | | | | 7 | |
|
Gallatin CLO Ltd. | |
3.486% (US0003M + 1.050%) due 07/15/2027 ~ | | | | | 7,600 | | | | | | 7,570 | |
|
GE-WMC Asset-Backed Pass-Through Certificates | |
2.756% due 12/25/2035 • | | | | | 1,824 | | | | | | 1,816 | |
|
GSAA Home Equity Trust | |
2.626% due 04/25/2047 • | | | | | 225 | | | | | | 211 | |
|
GSAMP Trust | |
2.596% due 01/25/2037 • | | | | | 3,083 | | | | | | 2,048 | |
2.626% due 12/25/2036 • | | | | | 1,042 | | | | | | 621 | |
2.656% due 06/25/2036 • | | | | | 181 | | | | | | 180 | |
2.656% due 09/25/2036 • | | | | | 367 | | | | | | 176 | |
2.656% due 12/25/2046 • | | | | | 648 | | | | | | 396 | |
2.666% due 05/25/2046 • | | | | | 32 | | | | | | 32 | |
2.706% due 11/25/2036 • | | | | | 194 | | | | | | 118 | |
2.736% due 12/25/2046 • | | | | | 194 | | | | | | 120 | |
2.746% due 12/25/2035 • | | | | | 76 | | | | | | 76 | |
2.746% due 06/25/2036 • | | | | | 289 | | | | | | 193 | |
2.776% due 04/25/2036 • | | | | | 367 | | | | | | 274 | |
4.156% due 10/25/2034 • | | | | | 53 | | | | | | 51 | |
|
Home Equity Asset Trust | |
3.601% due 05/25/2035 • | | | | | 200 | | | | | | 199 | |
|
Home Equity Loan Trust | |
2.736% due 04/25/2037 • | | | | | 800 | | | | | | 718 | |
2.846% due 04/25/2037 • | | | | | 500 | | | | | | 412 | |
|
Home Equity Mortgage Loan Asset-Backed Trust | |
2.646% due 11/25/2036 • | | | | | 467 | | | | | | 440 | |
2.666% due 11/25/2036 • | | | | | 376 | | | | | | 299 | |
2.826% due 04/25/2037 • | | | | | 345 | | | | | | 307 | |
| | | | | | |
| 76 | | PIMCO MANAGED ACCOUNTS TRUST | | | | See Accompanying Notes |
December 31, 2018
| | | | | | | | | | | | |
| | | | | PRINCIPAL
AMOUNT
(000S) | | | | | MARKET
VALUE
(000S) | |
|
HSI Asset Securitization Corp. Trust | |
2.616% due 12/25/2036 • | | $ | | | 247 | | | $ | | | 90 | |
2.676% due 12/25/2036 • | | | | | 1,124 | | | | | | 409 | |
2.726% due 12/25/2036 • | | | | | 749 | | | | | | 274 | |
2.896% due 11/25/2035 • | | | | | 300 | | | | | | 290 | |
|
IXIS Real Estate Capital Trust | |
3.136% due 02/25/2036 • | | | | | 318 | | | | | | 319 | |
|
JPMorgan Mortgage Acquisition Corp. | |
2.686% due 02/25/2036 • | | | | | 13 | | | | | | 13 | |
2.736% due 05/25/2035 • | | | | | 2 | | | | | | 2 | |
|
JPMorgan Mortgage Acquisition Trust | |
2.666% due 01/25/2036 • | | | | | 80 | | | | | | 80 | |
2.666% due 05/25/2036 • | | | | | 45 | | | | | | 45 | |
2.666% due 06/25/2036 • | | | | | 46 | | | | | | 46 | |
2.666% due 01/25/2037 • | | | | | 60 | | | | | | 60 | |
2.676% due 04/25/2036 • | | | | | 191 | | | | | | 191 | |
2.766% due 03/25/2037 • | | | | | 300 | | | | | | 295 | |
2.766% due 06/25/2037 • | | | | | 300 | | | | | | 295 | |
2.776% due 04/25/2036 • | | | | | 243 | | | | | | 239 | |
2.776% due 05/25/2036 • | | | | | 700 | | | | | | 689 | |
2.776% due 07/25/2036 • | | | | | 200 | | | | | | 191 | |
2.786% due 01/25/2037 • | | | | | 200 | | | | | | 194 | |
6.337% due 08/25/2036 ^Ø | | | | | 141 | | | | | | 104 | |
|
Lehman ABS Mortgage Loan Trust | |
2.596% due 06/25/2037 • | | | | | 249 | | | | | | 178 | |
2.706% due 06/25/2037 • | | | | | 200 | | | | | | 146 | |
|
Lehman XS Trust | |
2.656% due 04/25/2037 ^• | | | | | 289 | | | | | | 275 | |
2.676% due 12/25/2036 • | | | | | 2,820 | | | | | | 2,701 | |
2.676% due 02/25/2037 ^• | | | | | 1,772 | | | | | | 1,439 | |
|
LoanCore Issuer Ltd. | |
3.585% due 05/15/2028 • | | | | | 10,700 | | | | | | 10,688 | |
|
Long Beach Mortgage Loan Trust | |
3.066% due 07/25/2031 • | | | | | 154 | | | | | | 156 | |
3.151% due 11/25/2035 • | | | | | 416 | | | | | | 411 | |
3.266% due 08/25/2045 • | | | | | 104 | | | | | | 105 | |
3.556% due 06/25/2035 • | | | | | 500 | | | | | | 496 | |
3.781% due 02/25/2035 • | | | | | 12,750 | | | | | | 12,673 | |
3.931% due 03/25/2032 • | | | | | 333 | | | | | | 330 | |
|
Loomis Sayles CLO Ltd. | |
3.836% due 04/15/2028 • | | | | | 550 | | | | | | 532 | |
|
M360 Advisors LLC | |
4.395% due 07/24/2028 | | | | | 5,800 | | | | | | 5,825 | |
|
MAPS Ltd. | |
4.212% due 05/15/2043 | | | | | 4,364 | | | | | | 4,413 | |
|
MASTR Asset-Backed Securities Trust | |
2.616% due 08/25/2036 • | | | | | 184 | | | | | | 97 | |
2.656% due 08/25/2036 • | | | | | 304 | | | | | | 162 | |
2.686% due 02/25/2036 • | | | | | 405 | | | | | | 214 | |
2.746% due 06/25/2036 • | | | | | 182 | | | | | | 102 | |
2.746% due 08/25/2036 • | | | | | 183 | | | | | | 98 | |
3.006% due 10/25/2035 ^• | | | | | 311 | | | | | | 292 | |
3.006% due 11/25/2035 • | | | | | 10,927 | | | | | | 7,735 | |
| | | | | | | | | | | | |
| | | | | PRINCIPAL
AMOUNT
(000S) | | | | | MARKET
VALUE
(000S) | |
3.076% due 01/25/2036 • | | $ | | | 300 | | | $ | | | 293 | |
3.106% due 01/25/2036 • | | | | | 110 | | | | | | 110 | |
3.256% due 12/25/2034 ^• | | | | | 41 | | | | | | 41 | |
|
Meritage Mortgage Loan Trust | |
3.256% due 11/25/2035 • | | | | | 78 | | | | | | 79 | |
|
Merrill Lynch Mortgage Investors Trust | |
2.746% due 08/25/2037 • | | | | | 973 | | | | | | 617 | |
2.816% due 08/25/2036 • | | | | | 300 | | | | | | 300 | |
2.956% due 02/25/2047 • | | | | | 1,195 | | | | | | 876 | |
3.226% due 05/25/2036 • | | | | | 252 | | | | | | 248 | |
|
MESA Trust | |
3.306% due 12/25/2031 • | | | | | 530 | | | | | | 525 | |
|
METAL LLC | |
4.581% due 10/15/2042 | | | | | 5,372 | | | | | | 5,421 | |
|
Mid-State Capital Corp. Trust | |
6.005% due 08/15/2037 | | | | | 623 | | | | | | 671 | |
|
Morgan Stanley ABS Capital, Inc. Trust | |
2.576% due 10/25/2036 • | | | | | 98 | | | | | | 59 | |
2.616% due 10/25/2036 • | | | | | 806 | | | | | | 508 | |
2.646% due 10/25/2036 • | | | | | 145 | | | | | | 88 | |
2.646% due 11/25/2036 • | | | | | 258 | | | | | | 163 | |
2.656% due 06/25/2036 • | | | | | 288 | | | | | | 202 | |
2.656% due 09/25/2036 • | �� | | | | 403 | | | | | | 197 | |
2.656% due 10/25/2036 • | | | | | 236 | | | | | | 149 | |
2.656% due 11/25/2036 • | | | | | 1,371 | | | | | | 940 | |
2.686% due 03/25/2037 • | | | | | 425 | | | | | | 223 | |
2.706% due 02/25/2037 • | | | | | 147 | | | | | | 93 | |
2.726% due 11/25/2036 • | | | | | 1,551 | | | | | | 988 | |
2.756% due 03/25/2037 • | | | | | 425 | | | | | | 225 | |
2.816% due 12/25/2035 • | | | | | 363 | | | | | | 358 | |
3.406% due 05/25/2034 • | | | | | 106 | | | | | | 105 | |
3.436% due 03/25/2035 • | | | | | 196 | | | | | | 197 | |
3.496% due 06/25/2035 • | | | | | 400 | | | | | | 398 | |
3.556% due 04/25/2035 • | | | | | 200 | | | | | | 193 | |
3.756% due 07/25/2037 • | | | | | 400 | | | | | | 372 | |
4.156% due 03/25/2034 • | | | | | 434 | | | | | | 431 | |
|
Morgan Stanley Capital, Inc. Trust | |
2.796% due 01/25/2036 • | | | | | 1,247 | | | | | | 1,225 | |
|
Morgan Stanley Dean Witter Capital, Inc. Trust | |
3.856% due 02/25/2033 • | | | | | 672 | | | | | | 674 | |
|
Morgan Stanley Home Equity Loan Trust | |
2.666% due 04/25/2036 • | | | | | 126 | | | | | | 96 | |
2.676% due 04/25/2037 • | | | | | 653 | | | | | | 425 | |
2.736% due 04/25/2037 • | | | | | 218 | | | | | | 143 | |
|
Morgan Stanley Mortgage Loan Trust | |
2.736% due 02/25/2037 • | | | | | 149 | | | | | | 69 | |
2.866% due 04/25/2037 • | | | | | 288 | | | | | | 138 | |
4.135% due 11/25/2036 ^• | | | | | 278 | | | | | | 134 | |
5.965% due 09/25/2046 ^Ø | | | | | 385 | | | | | | 210 | |
|
Mountain View CLO Ltd. | |
3.236% due 10/15/2026 • | | | | | 700 | | | | | | 699 | |
|
Nelnet Student Loan Trust | |
4.327% due 11/25/2024 • | | | | | 8,391 | | | | | | 8,456 | |
| | | | | | |
| See Accompanying Notes | | ANNUAL REPORT | | DECEMBER 31, 2018 | | 77 |
Schedule of InvestmentsPIMCO Fixed Income SHares: Series M(Cont.)
| | | | | | | | | | | | |
| | | | | PRINCIPAL
AMOUNT
(000S) | | | | | MARKET
VALUE
(000S) | |
|
New Century Home Equity Loan Trust | |
2.756% due 12/25/2035 • | | $ | | | 23 | | | $ | | | 23 | |
3.181% due 06/25/2035 • | | | | | 434 | | | | | | 435 | |
|
Nomura Home Equity Loan, Inc. Home Equity Loan Trust | |
2.916% due 02/25/2036 • | | | | | 137 | | | | | | 137 | |
6.032% due 10/25/2036 ^Ø | | | | | 172 | | | | | | 66 | |
|
NovaStar Mortgage Funding Trust | |
2.656% due 06/25/2036 • | | | | | 138 | | | | | | 108 | |
3.211% due 01/25/2036 • | | | | | 7,500 | | | | | | 7,421 | |
|
OHA Credit Partners Ltd. | |
3.479% due 10/20/2025 • | | | | | 2,629 | | | | | | 2,625 | |
|
OneMain Financial Issuance Trust | |
2.370% due 09/14/2032 | | | | | 7,300 | | | | | | 7,190 | |
|
Option One Mortgage Loan Trust | |
2.646% due 01/25/2037 • | | | | | 73 | | | | | | 46 | |
2.676% due 05/25/2037 • | | | | | 181 | | | | | | 111 | |
2.726% due 01/25/2037 • | | | | | 291 | | | | | | 185 | |
2.836% due 04/25/2037 • | | | | | 134 | | | | | | 85 | |
2.866% due 01/25/2036 • | | | | | 300 | | | | | | 266 | |
3.271% due 08/25/2035 • | | | | | 400 | | | | | | 387 | |
|
Option One Mortgage Loan Trust Asset-Backed Certificates | |
2.946% due 11/25/2035 • | | | | | 227 | | | | | | 227 | |
2.966% due 11/25/2035 • | | | | | 3,100 | | | | | | 2,979 | |
|
Ownit Mortgage Loan Trust | |
3.106% due 10/25/2036 ^• | | | | | 236 | | | | | | 201 | |
|
Park Place Securities, Inc. | |
2.996% due 09/25/2035 • | | | | | 200 | | | | | | 190 | |
|
Park Place Securities, Inc. Asset-Backed Pass-Through Certificates | |
2.996% due 08/25/2035 • | | | | | 200 | | | | | | 193 | |
2.996% due 09/25/2035 • | | | | | 500 | | | | | | 498 | |
3.301% due 07/25/2035 • | | | | | 400 | | | | | | 400 | |
3.331% due 07/25/2035 • | | | | | 950 | | | | | | 896 | |
3.451% due 06/25/2035 • | | | | | 200 | | | | | | 199 | |
3.556% due 10/25/2034 • | | | | | 500 | | | | | | 506 | |
3.631% due 03/25/2035 • | | | | | 400 | | | | | | 402 | |
3.751% due 01/25/2036 • | | | | | 300 | | | | | | 300 | |
4.306% due 12/25/2034 • | | | | | 676 | | | | | | 686 | |
|
People’s Choice Home Loan Securities Trust | |
3.035% due 05/25/2035 ^• | | | | | 102 | | | | | | 100 | |
|
People’s Financial Realty Mortgage Securities Trust | |
2.646% due 09/25/2036 • | | | | | 414 | | | | | | 161 | |
|
Popular ABS Mortgage Pass-Through Trust | |
2.766% due 11/25/2036 • | | | | | 190 | | | | | | 187 | |
2.896% due 02/25/2036 • | | | | | 400 | | | | | | 396 | |
|
RAAC Trust | |
2.806% due 06/25/2044 • | | | | | 67 | | | | | | 59 | |
2.856% due 11/25/2046 • | | | | | 611 | | | | | | 577 | |
2.906% due 09/25/2045 • | | | | | 3,927 | | | | | | 3,887 | |
2.906% due 06/25/2047 • | | | | | 59 | | | | | | 59 | |
3.515% due 10/25/2045 • | | | | | 250 | | | | | | 253 | |
| | | | | | | | | | | | |
| | | | | PRINCIPAL
AMOUNT
(000S) | | | | | MARKET
VALUE
(000S) | |
4.006% due 09/25/2047 • | | $ | | | 600 | | | $ | | | 612 | |
|
Renaissance Home Equity Loan Trust | |
5.812% due 11/25/2036 Ø | | | | | 536 | | | | | | 303 | |
7.238% due 09/25/2037 ^Ø | | | | | 254 | | | | | | 150 | |
|
Residential Asset Mortgage Products Trust | |
2.666% due 12/25/2036 • | | | | | 59 | | | | | | 59 | |
2.666% due 02/25/2037 • | | | | | 162 | | | | | | 161 | |
2.726% due 10/25/2034 • | | | | | 12 | | | | | | 11 | |
2.786% due 09/25/2036 • | | | | | 199 | | | | | | 190 | |
2.806% due 05/25/2036 ^• | | | | | 1,236 | | | | | | 1,175 | |
2.826% due 01/25/2036 • | | | | | 800 | | | | | | 722 | |
2.986% due 09/25/2035 • | | | | | 300 | | | | | | 302 | |
3.151% due 11/25/2035 • | | | | | 223 | | | | | | 223 | |
3.166% due 10/25/2035 • | | | | | 152 | | | | | | 152 | |
3.196% due 10/25/2035 • | | | | | 100 | | | | | | 99 | |
3.406% due 08/25/2034 • | | | | | 98 | | | | | | 98 | |
|
Residential Asset Securities Corp. Trust | |
2.636% due 11/25/2036 • | | | | | 573 | | | | | | 478 | |
2.666% due 11/25/2036 ^• | | | | | 404 | | | | | | 386 | |
2.676% due 11/25/2036 • | | | | | 724 | | | | | | 605 | |
2.746% due 09/25/2036 • | | | | | 580 | | | | | | 574 | |
2.756% due 04/25/2037 • | | | | | 199 | | | | | | 197 | |
2.776% due 05/25/2037 • | | | | | 150 | | | | | | 149 | |
2.786% due 06/25/2036 • | | | | | 1,000 | | | | | | 986 | |
2.846% due 04/25/2037 • | | | | | 1,600 | | | | | | 1,538 | |
2.886% due 02/25/2036 • | | | | | 280 | | | | | | 281 | |
2.916% due 01/25/2036 • | | | | | 133 | | | | | | 132 | |
2.926% due 10/25/2035 • | | | | | 300 | | | | | | 298 | |
2.926% due 12/25/2035 • | | | | | 400 | | | | | | 400 | |
2.946% due 11/25/2035 • | | | | | 300 | | | | | | 299 | |
3.151% due 03/25/2035 • | | | | | 796 | | | | | | 796 | |
3.166% due 12/25/2035 • | | | | | 224 | | | | | | 186 | |
3.196% due 11/25/2035 • | | | | | 300 | | | | | | 296 | |
3.271% due 03/25/2034 • | | | | | 72 | | | | | | 72 | |
3.346% due 12/25/2034 • | | | | | 32 | | | | | | 32 | |
|
Rise Ltd. | |
4.750% due 02/15/2039 «~(f) | | | | | 424 | | | | | | 416 | |
|
Salomon Mortgage Loan Trust | |
3.215% due 11/25/2033 • | | | | | 153 | | | | | | 154 | |
|
Saxon Asset Securities Trust | |
3.676% due 07/25/2031 • | | | | | 25 | | | | | | 25 | |
|
Securitized Asset-Backed Receivables LLC Trust | |
2.596% due 07/25/2036 • | | | | | 248 | | | | | | 117 | |
2.646% due 05/25/2036 • | | | | | 539 | | | | | | 339 | |
2.666% due 07/25/2036 • | | | | | 242 | | | | | | 116 | |
2.746% due 07/25/2036 • | | | | | 207 | | | | | | 101 | |
2.756% due 05/25/2036 • | | | | | 1,197 | | | | | | 763 | |
2.776% due 03/25/2036 • | | | | | 212 | | | | | | 195 | |
3.166% due 08/25/2035 ^• | | | | | 229 | | | | | | 154 | |
3.181% due 01/25/2035 • | | | | | 67 | | | | | | 66 | |
3.371% due 01/25/2036 ^Ø | | | | | 64 | | | | | | 56 | |
3.466% due 01/25/2036 ^• | | | | | 92 | | | | | | 69 | |
|
Seneca Park CLO Ltd. | |
3.569% due 07/17/2026 • | | | | | 5,976 | | | | | | 5,962 | |
| | | | | | |
| 78 | | PIMCO MANAGED ACCOUNTS TRUST | | | | See Accompanying Notes |
December 31, 2018
| | | | | | | | | | | | |
| | | | | PRINCIPAL
AMOUNT
(000S) | | | | | MARKET
VALUE
(000S) | |
|
SG Mortgage Securities Trust | |
2.666% due 07/25/2036 • | | $ | | | 31,420 | | | $ | | | 10,099 | |
2.956% due 10/25/2035 • | | | | | 1,000 | | | | | | 993 | |
|
SLM Student Loan Trust | |
3.990% due 04/25/2023 • | | | | | 8,307 | | | | | | 8,389 | |
|
Soundview Home Loan Trust | |
2.586% due 06/25/2037 • | | | | | 60 | | | | | | 42 | |
2.616% due 02/25/2037 • | | | | | 328 | | | | | | 125 | |
2.666% due 11/25/2036 • | | | | | 311 | | | | | | 303 | |
2.686% due 02/25/2037 • | | | | | 459 | | | | | | 178 | |
2.686% due 07/25/2037 • | | | | | 2,517 | | | | | | 2,269 | |
2.756% due 06/25/2036 • | | | | | 8,440 | | | | | | 8,153 | |
2.856% due 03/25/2036 • | | | | | 400 | | | | | | 387 | |
3.331% due 06/25/2035 • | | | | | 98 | | | | | | 97 | |
3.456% due 10/25/2037 • | | | | | 376 | | | | | | 319 | |
|
South Carolina Student Loan Corp. | |
3.738% due 09/03/2024 • | | | | | 439 | | | | | | 441 | |
|
Specialty Underwriting & Residential Finance Trust | |
2.656% due 09/25/2037 • | | | | | 133 | | | | | | 79 | |
2.656% due 11/25/2037 • | | | | | 929 | | | | | | 696 | |
2.776% due 04/25/2037 • | | | | | 236 | | | | | | 146 | |
2.806% due 12/25/2036 • | | | | | 3,615 | | | | | | 3,523 | |
3.481% due 12/25/2035 • | | | | | 320 | | | | | | 319 | |
|
SpringCastle America Funding LLC | |
3.050% due 04/25/2029 | | | | | 7,824 | | | | | | 7,758 | |
|
Staniford Street CLO Ltd. | |
3.968% due 06/15/2025 • | | | | | 9,989 | | | | | | 10,001 | |
|
Structured Asset Investment Loan Trust | |
2.656% due 09/25/2036 • | | | | | 277 | | | | | | 267 | |
2.696% due 03/25/2036 • | | | | | 549 | | | | | | 521 | |
3.106% due 01/25/2036 • | | | | | 313 | | | | | | 311 | |
3.406% due 05/25/2035 • | | | | | 600 | | | | | | 597 | |
3.436% due 09/25/2034 • | | | | | 802 | | | | | | 791 | |
3.631% due 07/25/2033 • | | | | | 62 | | | | | | 62 | |
3.781% due 12/25/2034 • | | | | | 1,138 | | | | | | 1,122 | |
|
Structured Asset Securities Corp. Mortgage Loan Trust | |
2.641% due 07/25/2036 • | | | | | 8,411 | | | | | | 8,194 | |
2.646% due 09/25/2036 • | | | | | 123 | | | | | | 123 | |
2.656% due 09/25/2036 • | | | | | 135 | | | | | | 131 | |
2.676% due 12/25/2036 • | | | | | 194 | | | | | | 187 | |
2.716% due 02/25/2037 • | | | | | 692 | | | | | | 683 | |
2.736% due 01/25/2037 • | | | | | 2,571 | | | | | | 1,877 | |
2.756% due 09/25/2036 • | | | | | 200 | | | | | | 196 | |
3.406% due 08/25/2037 • | | | | | 223 | | | | | | 225 | |
3.506% due 08/25/2037 • | | | | | 615 | | | | | | 618 | |
|
Structured Asset Securities Corp. Trust | |
2.966% due 09/25/2035 • | | | | | 700 | | | | | | 662 | |
|
THL Credit Wind River CLO Ltd. | |
3.306% due 10/15/2027 • | | | | | 300 | | | | | | 298 | |
3.886% due 01/15/2026 • | | | | | 10,500 | | | | | | 10,507 | |
|
Vericrest Opportunity Loan Transferee LLC | |
3.250% due 06/25/2047 Ø | | | | | 7,985 | | | | | | 7,966 | |
| | | | | | | | | | | | |
| | | | | PRINCIPAL
AMOUNT
(000S) | | | | | MARKET
VALUE
(000S) | |
|
WaMu Asset-Backed Certificates WaMu Trust | |
2.731% due 05/25/2037 • | | $ | | | 11,419 | | | $ | | | 10,782 | |
|
Wells Fargo Home Equity Asset-Backed Securities Trust | |
2.836% due 05/25/2036 • | | | | | 300 | | | | | | 296 | |
3.451% due 03/25/2035 • | | | | | 1,000 | | | | | | 1,007 | |
3.451% due 11/25/2035 • | | | | | 200 | | | | | | 199 | |
4.081% due 02/25/2035 • | | | | | 200 | | | | | | 200 | |
| | | | | | | | | | | | |
Total Asset-Backed Securities (Cost $432,016) | | | 452,106 | |
| | | | |
| |
| SOVEREIGN ISSUES 0.6% | |
|
Corp. Financiera de Desarrollo S.A. | |
4.750% due 02/08/2022 | | | | | 7,000 | | | | | | 7,096 | |
| | | | | | | | | | | | |
Total Sovereign Issues (Cost $6,970) | | | 7,096 | |
| | | | |
| |
| SHORT-TERM INSTRUMENTS 2.4% | |
| |
| REPURCHASE AGREEMENTS (g) 2.4% | |
| | | | | | | | | | | 29,446 | |
| | | | | | | | | | | | |
| |
| U.S. TREASURY BILLS 0.0% | |
2.325% due 01/31/2019 (b)(c)(l) | | | | | 396 | | | | | | 395 | |
| | | | | | | | | | | | |
Total Short-Term Instruments (Cost $29,841) | | | 29,841 | |
| | | | |
|
| |
| Total Investments in Securities (Cost $1,814,437) | | | 1,848,651 | |
| | | | |
| | | | | | | | | | | | |
| | | | | SHARES | | | | | | |
| INVESTMENTS IN AFFILIATES 1.9% | |
| |
| SHORT-TERM INSTRUMENTS 1.9% | |
| |
| CENTRAL FUNDS USED FOR CASH MANAGEMENT PURPOSES 1.9% | |
| | | |
PIMCO Short-Term Floating NAV Portfolio III | | | 2,377,936 | | | | | | 23,504 | |
| | | | | | | | | | | | |
Total Short-Term Instruments (Cost $23,504) | | | 23,504 | |
| | | | | | | | | | | | |
| |
| | | | |
| Total Investments in Affiliates (Cost $23,504) | | | 23,504 | |
| |
| | | | |
| Total Investments 150.8% (Cost $1,837,941) | | | $ | | | 1,872,155 | |
| | | | | | | | | | | | |
Financial Derivative
Instruments (i)(k) (0.1)% (Cost or Premiums, net $(1,949)) | | | (1,269 | ) |
| | | | | | | | | | | | |
| Other Assets and Liabilities, net (50.7)% | | | (629,758 | ) |
| | | | |
| Net Assets 100.0% | | | $ | | | 1,241,128 | |
| | | | | | | |
| | | | | | |
| See Accompanying Notes | | ANNUAL REPORT | | DECEMBER 31, 2018 | | 79 |
Schedule of InvestmentsPIMCO Fixed Income SHares: Series M(Cont.)
NOTES TO SCHEDULE OF INVESTMENTS:
| * | A zero balance may reflect actual amounts rounding to less than one thousand. |
| « | Security valued using significant unobservable inputs (Level 3). |
| ~ | Variable or Floating rate security. Rate shown is the rate in effect as of period end. Certain variable rate securities are not based on a published reference rate and spread, rather are determined by the issuer or agent and are based on current market conditions. Reference rate is as of reset date, which may vary by security. These securities may not indicate a reference rate and/or spread in their description. |
| • | Rate shown is the rate in effect as of period end. The rate may be based on a fixed rate, a capped rate or a floor rate and may convert to a variable or floating rate in the future. These securities do not indicate a reference rate and spread in their description. |
| Ø | Coupon represents a rate which changes periodically based on a predetermined schedule or event. Rate shown is the rate in effect as of period end. |
| (a) | Paymentin-kind security. |
| (c) | Coupon represents a yield to maturity. |
| (d) | Perpetual maturity; date shown, if applicable, represents next contractual call date. |
| (e) | Contingent convertible security. |
(f) RESTRICTED SECURITIES:
| | | | | | | | | | | | | | | | | | | | | | | | |
| Issuer Description | | Coupon | | | Maturity
Date | | | Acquisition
Date | | | Cost | | | Market
Value | | | Market Value
as Percentage
of Net Assets
| |
Rise Ltd. | | | 4.750 | % | | | 02/15/2039 | | | | 03/14/2017 | | | $ | 424 | | | $ | 416 | | | | 0.03% | |
| | | | | | | | | | | | | | | | | | | | |
BORROWINGS AND OTHER FINANCING TRANSACTIONS
(g) REPURCHASE AGREEMENTS:
| | | | | | | | | | | | | | | | | | | | | | | | | | | | |
| Counterparty | | Lending
Rate | | Settlement
Date | | | Maturity
Date | | | Principal
Amount | | | Collateralized By | | Collateral
(Received) | | | Repurchase
Agreements,
at Value | | | Repurchase
Agreement
Proceeds
to be
Received(1) | |
FICC | | 2.000% | | | 12/31/2018 | | | | 01/02/2019 | | | $ | 3,046 | | | U.S. Treasury Notes 2.875% due 09/30/2023 | | $ | (3,109 | ) | | $ | 3,046 | | | $ | 3,046 | |
RDR | | 3.200 | | | 12/31/2018 | | | | 01/02/2019 | | | | 26,400 | | | U.S. Treasury Notes 2.000% due 11/30/2022 | | | (26,975 | ) | | | 26,400 | | | | 26,405 | |
| | | | | | | | | | | | | | | | | | | | | | | | | | | | |
Total Repurchase Agreements | | $ | (30,084 | ) | | $ | 29,446 | | | $ | 29,451 | |
| | | | | | | | | | | | | | | | | | | | | | | | | | | | |
REVERSE REPURCHASE AGREEMENTS:
| | | | | | | | | | | | | | | | | | | | |
| Counterparty | | Borrowing
Rate(2) | | | Settlement
Date | | | Maturity
Date | | | Amount
Borrowed(2) | | | Payable for
Reverse
Repurchase
Agreements | |
BOM | | | 2.570 | % | | | 11/14/2018 | | | | 01/14/2019 | | | $ | (8,139) | | | $ | (8,167 | ) |
| | | 2.780 | | | | 12/13/2018 | | | | 01/11/2019 | | | | (6,905) | | | | (6,915 | ) |
BOS | | | 2.500 | | | | 11/08/2018 | | | | 01/08/2019 | | | | (4,005) | | | | (4,021 | ) |
GRE | | | 2.540 | | | | 11/14/2018 | | | | 02/14/2019 | | | | (8,522) | | | | (8,551 | ) |
RCY | | | 2.470 | | | | 10/22/2018 | | | | 01/22/2019 | | | | (762) | | | | (766 | ) |
| | | 2.660 | | | | 12/14/2018 | | | | 01/14/2019 | | | | (9,036) | | | | (9,049 | ) |
| | | | | | | | | | | | | | | | | | | | |
Total Reverse Repurchase Agreements | | | | | | | | | | | $ | (37,469 | ) |
| | | | | | | | | | | | | | | | | | | | |
| | | | | | |
| 80 | | PIMCO MANAGED ACCOUNTS TRUST | | | | See Accompanying Notes |
December 31, 2018
BORROWINGS AND OTHER FINANCING TRANSACTIONS SUMMARY
The following is a summary by counterparty of the market value of Borrowings and Other Financing Transactions and collateral pledged/(received) as of December 31, 2018:
| | | | | | | | | | | | | | | | | | | | | | | | |
| Counterparty | | Repurchase
Agreement
Proceeds
to be
Received(1) | | | Payable for
Reverse
Repurchase
Agreements | | | Payable for
Sale-Buyback
Transactions | | | Total
Borrowings and
Other Financing
Transactions | | | Collateral
Pledged/
(Received) | | | Net Exposure(3) | |
Global/Master Repurchase Agreement | | | | | | | | | | | | | | | | | | | | | |
BOM | | $ | 0 | | | $ | (15,082 | ) | | $ | 0 | | | $ | (15,082 | ) | | $ | 15,256 | | | $ | 174 | |
BOS | | | 0 | | | | (4,021 | ) | | | 0 | | | | (4,021 | ) | | | 4,088 | | | | 67 | |
FICC | | | 3,046 | | | | 0 | | | | 0 | | | | 3,046 | | | | (3,109 | ) | | | (63 | ) |
GRE | | | 0 | | | | (8,551 | ) | | | 0 | | | | (8,551 | ) | | | 8,662 | | | | 111 | |
RCY | | | 0 | | | | (9,815 | ) | | | 0 | | | | (9,815 | ) | | | 9,927 | | | | 112 | |
RDR | | | 26,405 | | | | 0 | | | | 0 | | | | 26,405 | | | | (26,975 | ) | | | (570 | ) |
| | | | | | | | | | | | | | | | | | | | | | | | |
Total Borrowings and Other Financing Transactions | | $ | 29,451 | | | $ | (37,469 | ) | | $ | 0 | | | | | | | | | | | | | |
| | | | | | | | | | | | | | | | | | | | | | | | |
CERTAIN TRANSFERS ACCOUNTED FOR AS SECURED BORROWINGS
Remaining Contractual Maturity of the Agreements
| | | | | | | | | | | | | | | | | | | | |
| | | Overnight and
Continuous | | | Up to 30 days | | | 31-90 days | | | Greater Than 90 days | | | Total | |
Reverse Repurchase Agreements | |
U.S. Treasury Obligations | | $ | 0 | | | $ | (28,918 | ) | | $ | (8,551 | ) | | $ | 0 | | | $ | (37,469 | ) |
| | | | | | | | | | | | | | | | | | | | |
Total Borrowings | | $ | 0 | | | $ | (28,918 | ) | | $ | (8,551 | ) | | $ | 0 | | | $ | (37,469 | ) |
| | | | | | | | | | | | | | | | | | | | |
Payable for reverse repurchase agreements | | | $ | (37,469 | ) |
| | | | | | | | | | | | | | | | | | | | |
| (h) | Securities with an aggregate market value of $37,932 have been pledged as collateral under the terms of the above master agreements as of December 31, 2018. |
| (1) | Includes accrued interest. |
| (2) | The average amount of borrowings outstanding during the period ended December 31, 2018 was $(223,131) at a weighted average interest rate of 1.749%. Average borrowings may include sale-buyback transactions and reverse repurchase agreements, if held during the period. |
| (3) | Net Exposure represents the net receivable/(payable) that would be due from/to the counterparty in the event of default. Exposure from borrowings and other financing transactions can only be netted across transactions governed under the same master agreement with the same legal entity. See Note 8, Master Netting Arrangements, in the Notes to Financial Statements for more information regarding master netting arrangements. |
(i) FINANCIAL DERIVATIVE INSTRUMENTS: EXCHANGE-TRADED OR CENTRALLY CLEARED
PURCHASED OPTIONS:
OPTIONS ON EXCHANGE-TRADED FUTURES CONTRACTS
| | | | | | | | | | | | | | | | | | | | | | | | |
| Description | | Strike
Price | | | Expiration
Date | | | # of
Contracts | | | Notional
Amount | | | Cost | | | Market
Value | |
Put - CBOT U.S. Treasury10-Year Note March 2019 Futures | | $ | 106.000 | | | | 02/22/2019 | | | | 350 | | | $ | 350 | | | $ | 3 | | | $ | 1 | |
Put - CBOT U.S. Treasury10-Year Note March 2019 Futures | | | 106.500 | | | | 02/22/2019 | | | | 165 | | | | 165 | | | | 1 | | | | 0 | |
Put - CBOT U.S. Treasury10-Year Note March 2019 Futures | | | 107.000 | | | | 02/22/2019 | | | | 3 | | | | 3 | | | | 0 | | | | 0 | |
| | | | | | |
| See Accompanying Notes | | ANNUAL REPORT | | DECEMBER 31, 2018 | | 81 |
Schedule of InvestmentsPIMCO Fixed Income SHares: Series M(Cont.)
| | | | | | | | | | | | | | | | | | | | | | | | |
| Description | | Strike
Price | | | Expiration
Date | | | # of
Contracts | | | Notional
Amount | | | Cost | | | Market
Value | |
Put - CBOT U.S. Treasury5-Year Note March 2019 Futures | | $ | 104.000 | | | | 02/22/2019 | | | | 725 | | | $ | 725 | | | $ | 6 | | | $ | 1 | |
Put - CBOT U.S. Treasury5-Year Note March 2019 Futures | | | 105.000 | | | | 02/22/2019 | | | | 323 | | | | 323 | | | | 3 | | | | 0 | |
Put - CBOT U.S. Treasury5-Year Note March 2019 Futures | | | 105.500 | | | | 02/22/2019 | | | | 31 | | | | 31 | | | | 0 | | | | 0 | |
Put - CBOT U.S. Treasury5-Year Note March 2019 Futures | | | 106.500 | | | | 02/22/2019 | | | | 207 | | | | 207 | | | | 2 | | | | 0 | |
Put - CBOT U.S. Treasury5-Year Note March 2019 Futures | | | 107.000 | | | | 02/22/2019 | | | | 35 | | | | 35 | | | | 0 | | | | 0 | |
Put - CBOT U.S. Treasury5-Year Note March 2019 Futures | | | 107.250 | | | | 02/22/2019 | | | | 196 | | | | 196 | | | | 2 | | | | 0 | |
Put - CBOT U.S. Treasury5-Year Note March 2019 Futures | | | 107.500 | | | | 02/22/2019 | | | | 205 | | | | 205 | | | | 2 | | | | 2 | |
| | | | | | | | | | | | | | | | | | | | | | | | |
Total Purchased Options | | | $ | 19 | | | $ | 4 | |
| | | | | | | | | | | | | | | | | | | | | | | | |
FUTURES CONTRACTS:
LONG FUTURES CONTRACTS
| | | | | | | | | | | | | | | | | | | | | | |
Description | | Expiration
Month | | # of
Contracts | | | Notional
Amount | | | Unrealized
Appreciation/
(Depreciation) | | | Variation Margin | |
| | Asset | | | Liability | |
90-Day Eurodollar December Futures | | 12/2019 | | | 1,635 | | | $ | 397,918 | | | $ | 1,142 | | | $ | 41 | | | $ | 0 | |
U.S. Treasury5-Year Note March Futures | | 03/2019 | | | 3,265 | | | | 374,455 | | | | 6,163 | | | | 816 | | | | 0 | |
| | | | | | | | | | | | | | | | | | | | | | |
| | | | | | | | | | | | $ | 7,305 | | | $ | 857 | | | $ | 0 | |
| | | | | | | | | | | | | | | | | | | | | | |
SHORT FUTURES CONTRACTS
| | | | | | | | | | | | | | | | | | | | | | | | | | |
Description | | Expiration
Month | | # of
Contracts | | | Notional
Amount | | | Unrealized
Appreciation/
(Depreciation) | | | Variation Margin | |
| | Asset | | | Liability | |
Euro-OAT France Government10-Year Bond March Futures | | 03/2019 | | | 217 | | | | $ | | | | (37,493 | ) | | $ | (176 | ) | | $ | 52 | | | $ | 0 | |
U.S. Treasury Ultra Long-Term Bond March Futures | | 03/2019 | | | 235 | | | | | | | | (37,754 | ) | | | (771 | ) | | | 0 | | | | (140 | ) |
United Kingdom Long Gilt March Futures | | 03/2019 | | | 395 | | | | | | | | (62,012 | ) | | | (567 | ) | | | 66 | | | | (201 | ) |
| | | | | | | | | | | | | | | | | | | | | | | | | | |
| | | | | | | | | | | | | | | | $ | (1,514 | ) | | $ | 118 | | | $ | (341 | ) |
| | | | | | | | | | | | | | | | | | | | | | | | | | |
Total Futures Contracts | | | $ | 5,791 | | | $ | 975 | | | $ | (341 | ) |
| | | | | | | | | | | | | | | | | | | | | | | | | | |
SWAP AGREEMENTS:
CREDIT DEFAULT SWAPS ON CORPORATE ISSUES - SELL PROTECTION(1)
| | | | | | | | | | | | | | | | | | | | | | | | | | | | | | | | | | | | | | | | |
Reference Entity | | Fixed
Receive
Rate | | | Payment
Frequency | | | Maturity
Date | | | Implied
Credit
Spread at
December 31,
2018(2) | | | Notional
Amount(3) | | | Premiums
Paid/
(Received) | | | Unrealized
Appreciation/
(Depreciation) | | | Market
Value(4) | | | Variation Margin | |
| | Asset | | | Liability | |
Ford Motor Credit Co. LLC | | | 5.000 | % | | | Quarterly | | | | 06/20/2023 | | | | 2.182 | % | | $ | 1,000 | | | $ | 167 | | | $ | (52 | ) | | $ | 115 | | | $ | 0 | | | $ | 0 | |
General Electric Co. | | | 1.000 | | | | Quarterly | | | | 12/20/2023 | | | | 2.039 | | | | 5,350 | | | | (42 | ) | | | (200 | ) | | | (242 | ) | | | 2 | | | | 0 | |
| | | | | | | | | | | | | | | | | | | | | | | | | | | | | | | | | | | | | | | | |
| | | | | | | | | | | | | | | | | | | $ | 125 | | | $ | (252 | ) | | $ | (127 | ) | | $ | 2 | | | $ | 0 | |
| | | | | | | | | | | | | | | | | | | | | | | | | | | | | | | | | | | | | |
| | | | | | |
| 82 | | PIMCO MANAGED ACCOUNTS TRUST | | | | See Accompanying Notes |
December 31, 2018
CREDIT DEFAULT SWAPS ON CREDIT INDICES - SELL PROTECTION(1)
| | | | | | | | | | | | | | | | | | | | | | | | | | | | | | | | | | |
Index/Tranches | | Fixed
Receive
Rate | | | Payment
Frequency | | Maturity
Date | | | Notional
Amount(3) | | | Premiums
Paid/
(Received) | | | Unrealized
Appreciation/
(Depreciation) | | | Market
Value(4) | | | Variation Margin | |
| | Asset | | | Liability | |
CDX.EM-295-Year Index | | | 1.000 | % | | Quarterly | | | 06/20/2023 | | | $ | 4,100 | | | $ | (189 | ) | | $ | 39 | | | $ | (150 | ) | | $ | 3 | | | $ | 0 | |
CDX.EM-305-Year Index | | | 1.000 | | | Quarterly | | | 12/20/2023 | | | | 24,700 | | | | (1,160 | ) | | | 5 | | | | (1,155 | ) | | | 18 | | | | 0 | |
| | | | | | | | | | | | | | | | | | | | | | | | | | | | | | | | | | |
| | | | | | | | | | | | | | | | $ | (1,349 | ) | | $ | 44 | | | $ | (1,305 | ) | | $ | 21 | | | $ | 0 | |
| | | | | | | | | | | | | | | | | | | | | | | | | | | | | | | | | | |
INTEREST RATE SWAPS
| | | | | | | | | | | | | | | | | | | | | | | | | | | | | | | | | | | | | | | | | | |
Pay/
Receive
Floating
Rate | | Floating
Rate Index | | Fixed
Rate | | | Payment
Frequency | | | Maturity
Date | | | Notional
Amount | | | Premiums
Paid/
(Received) | | | Unrealized
Appreciation/
(Depreciation) | | | Market
Value | | | Variation Margin | |
| | Asset | | | Liability | |
Pay | | 3-MonthUSD-LIBOR | | | 1.750 | % | | | Semi-Annual | | | | 06/20/2020 | | | | $ | | | | 240,000 | | | $ | (4,898 | ) | | $ | 1,444 | | | $ | (3,454 | ) | | $ | 0 | | | $ | (8 | ) |
Receive | | 3-MonthUSD-LIBOR | | | 2.000 | | | | Semi-Annual | | | | 06/20/2023 | | | | | | | | 88,200 | | | | 3,405 | | | | (1,261 | ) | | | 2,144 | | | | 0 | | | | (160 | ) |
Receive | | 3-MonthUSD-LIBOR | | | 3.000 | | | | Semi-Annual | | | | 12/19/2028 | | | | | | | | 31,800 | | | | (137 | ) | | | (629 | ) | | | (766 | ) | | | 0 | | | | (123 | ) |
Receive(5) | | 6-MonthGBP-LIBOR | | | 1.500 | | | | Semi-Annual | | | | 03/20/2029 | | | | GBP | | | | 44,700 | | | | 1,931 | | | | (2,232 | ) | | | (301 | ) | | | 0 | | | | (214 | ) |
| | | | | | | | | | | | | | | | | | | | | | | | | | | | | | | | | | | | | | | | | | |
| | | | | | | | | | | | | | | | | | | | | | | | $ | 301 | | | $ | (2,678 | ) | | $ | (2,377 | ) | | $ | 0 | | | $ | (505 | ) |
| | | | | | | | | | | | | | | | | | | | | | | | | | | | | | | | | | | | | | | | | | |
Total Swap Agreements | | | $ | (923 | ) | | $ | (2,886 | ) | | $ | (3,809 | ) | | $ | 23 | | | $ | (505 | ) |
| | | | | | | | | | | | | | | | | | | | | | | | | | | | | | | | | | | | | | | | | | |
FINANCIAL DERIVATIVE INSTRUMENTS: EXCHANGE-TRADED OR CENTRALLY CLEARED SUMMARY
The following is a summary of the market value and variation margin of Exchange-Traded or Centrally Cleared Financial Derivative Instruments as of December 31, 2018:
| | | | | | | | | | | | | | | | | | | | | | | | | | | | | | | | | | |
| | | Financial Derivative Assets | | | | | | Financial Derivative Liabilities | |
| | | Market Value | | Variation Margin
Asset | | | | | | | | | Market Value | | | Variation Margin
Liability | | | | |
| | | Purchased
Options | | Futures | | | Swap
Agreements | | | Total | | | | | | Written
Options | | | Futures | | | Swap
Agreements | | | Total | |
Total Exchange-Traded or Centrally Cleared | | $ 4 | | $ | 975 | | | $ | 23 | | | $ | 1,002 | | | | | | | $ | 0 | | | | $ (341) | | | | $ (505) | | | | $ (846) | |
| | | | | | | | | | | | | | | | | | | | | | | | | | | | | | | | | | |
| (j) | Securities with an aggregate market value of $12,196 and cash of $3,169 have been pledged as collateral for exchange-traded and centrally cleared financial derivative instruments as of December 31, 2018. See Note 8, Master Netting Arrangements, in the Notes to Financial Statements for more information regarding master netting arrangements. |
| (1) | If the Portfolio is a seller of protection and a credit event occurs, as defined under the terms of that particular swap agreement, the Portfolio will either (i) pay to the buyer of protection an amount equal to the notional amount of the swap and take delivery of the referenced obligation or underlying securities comprising the referenced index or (ii) pay a net settlement amount in the form of cash, securities or other deliverable obligations equal to the notional amount of the swap less the recovery value of the referenced obligation or underlying securities comprising the referenced index. |
| (2) | Implied credit spreads, represented in absolute terms, utilized in determining the market value of credit default swap agreements on sovereign issues as of period end serve as indicators of the current status of the payment/performance risk and represent the likelihood or risk of default for the credit derivative. The implied credit spread of a particular referenced entity reflects the cost of buying/selling protection and may include upfront payments required to be made to enter into the agreement. Wider credit spreads represent a deterioration of the referenced entity’s credit soundness and a greater likelihood or risk of default or other credit event occurring as defined under the terms of the agreement. |
| | | | | | |
| See Accompanying Notes | | ANNUAL REPORT | | DECEMBER 31, 2018 | | 83 |
Schedule of InvestmentsPIMCO Fixed Income SHares: Series M(Cont.)
| (3) | The maximum potential amount the Portfolio could be required to pay as a seller of credit protection or receive as a buyer of credit protection if a credit event occurs as defined under the terms of that particular swap agreement. |
| (4) | The prices and resulting values for credit default swap agreements serve as indicators of the current status of the payment/performance risk and represent the likelihood of an expected liability (or profit) for the credit derivative should the notional amount of the swap agreement be closed/sold as of the period end. Increasing market values, in absolute terms when compared to the notional amount of the swap, represent a deterioration of the referenced indices’ credit soundness and a greater likelihood or risk of default or other credit event occurring as defined under the terms of the agreement. |
| (5) | This instrument has a forward starting effective date. See Note 2, Securities Transactions and Investment Income, in the Notes to Financial Statements for further information. |
(k) FINANCIAL DERIVATIVE INSTRUMENTS: OVER THE COUNTER
FORWARD FOREIGN CURRENCY CONTRACTS:
| | | | | | | | | | | | | | | | | | | | | | | | | | | | |
Counterparty | | Settlement
Month | | | Currency to
be Delivered | | | Currency to
be Received | | | Unrealized Appreciation/
(Depreciation) | |
| | Asset | | | Liability | |
BOA | | | 01/2019 | | | | EUR | | | | 38,033 | | | $ | | | | | 43,421 | | | $ | 0 | | | $ | (184 | ) |
CBK | | | 01/2019 | | | | | | | | 3,873 | | | | | | | | 4,417 | | | | 0 | | | | (24 | ) |
| | | 01/2019 | | | | GBP | | | | 973 | | | | | | | | 1,246 | | | | 5 | | | | 0 | |
| | | 02/2019 | | | | AUD | | | | 28,474 | | | | | | | | 20,516 | | | | 444 | | | | 0 | |
| | | 03/2019 | | | | KRW | | | | 25,119,481 | | | | | | | | 22,413 | | | | 0 | | | | (160 | ) |
GLM | | | 01/2019 | | | | GBP | | | | 18,945 | | | | | | | | 24,210 | | | | 65 | | | | (12 | ) |
| | | 02/2019 | | | | ILS | | | | 1,840 | | | | | | | | 500 | | | | 7 | | | | 0 | |
| | | 02/2019 | | | $ | | | | | 1,085 | | | | CAD | | | | 1,433 | | | | 0 | | | | (34 | ) |
| | | 07/2019 | | | | | | | | 5,890 | | | | ARS | | | | 277,132 | | | | 73 | | | | 0 | |
JPM | | | 01/2019 | | | | | | | | 1,055 | | | | GBP | | | | 840 | | | | 16 | | | | 0 | |
| | | 01/2019 | | | | | | | | 2,816 | | | | MXN | | | | 53,822 | | | | 0 | | | | (86 | ) |
SOG | | | 01/2019 | | | | | | | | 11,739 | | | | RUB | | | | 784,517 | | | | 0 | | | | (512 | ) |
| | | | | | | | | | | | | | | | | | | | | | | | | | | | |
Total Forward Foreign Currency Contracts | | | $ | 610 | | | $ | (1,012 | ) |
| | | | | | | | | | | | | | | | | | | | | | | | | | | | |
PURCHASED OPTIONS:
OPTIONS ON SECURITIES
| | | | | | | | | | | | | | | | | | | | | | | | | | | | | | |
| Counterparty | | Description | | Strike
Price | | | Expiration
Date | | | Notional
Amount | | | Cost | | | Market
Value | |
| DUB | | Put - OTC Fannie Mae, TBA 4.000% due 01/01/2049 | | $ | | | | | 69.500 | | | | 01/07/2019 | | | | $ | | | | 62,000 | | | $ | 2 | | | $ | 0 | |
| JPM | | Put - OTC Fannie Mae, TBA 3.000% due 01/01/2049 | | | | | | | 68.000 | | | | 01/07/2019 | | | | | | | | 100,000 | | | | 4 | | | | 0 | |
| | Put - OTC Fannie Mae, TBA 3.500% due 01/01/2049 | | | | | | | 69.000 | | | | 01/07/2019 | | | | | | | | 50,000 | | | | 2 | | | | 0 | |
| | Put - OTC Fannie Mae, TBA 4.000% due 01/01/2049 | | | | | | | 70.000 | | | | 01/07/2019 | | | | | | | | 100,000 | | | | 4 | | | | 0 | |
| | | | | | | | | | | | | | | | | | | | | | | | | | | | | | |
Total Purchased Options | | | $ | 12 | | | $ | 0 | |
| | | | | | | | | |
WRITTEN OPTIONS:
CREDIT DEFAULT SWAPTIONS ON CREDIT INDICES
| | | | | | | | | | | | | | | | | | | | | | | | | | | | |
| Counterparty | | Description | | Buy/Sell
Protection | | Exercise
Rate | | | Expiration
Date | | | Notional
Amount | | | Premiums
(Received) | | | Market
Value | |
| BOA | | Put - OTCCDX.IG-315-Year Index | | Sell | | | 1.200 | % | | | 03/20/2019 | | | $ | | | | | 89,200 | | | $ | (101 | ) | | $ | (150 | ) |
| CBK | | Put - OTCCDX.IG-315-Year Index | | Sell | | | 1.050 | | | | 02/20/2019 | | | | | | | | 15,000 | | | | (25 | ) | | | (25 | ) |
| GST | | Put - OTCCDX.IG-315-Year Index | | Sell | | | 2.400 | | | | 09/18/2019 | | | | | | | | 20,400 | | | | (35 | ) | | | (39 | ) |
| JPM | | Put - OTCCDX.IG-315-Year Index | | Sell | | | 0.950 | | | | 02/20/2019 | | | | | | | | 93,900 | | | | (170 | ) | | | (256 | ) |
| MYC | | Put - OTCCDX.IG-315-Year Index | | Sell | | | 1.400 | | | | 04/17/2019 | | | | | | | | 25,000 | | | | (47 | ) | | | (40 | ) |
| | | | | | | | | | | | | | | | | | | | | | | | | | | | |
Total Written Options | | | $ | (378 | ) | | $ | (510 | ) |
| | | | | | | | | |
| | | | | | |
| 84 | | PIMCO MANAGED ACCOUNTS TRUST | | | | See Accompanying Notes |
December 31, 2018
SWAP AGREEMENTS:
CREDIT DEFAULT SWAPS ON SOVEREIGN ISSUES - SELL PROTECTION(1)
| | | | | | | | | | | | | | | | | | | | | | | | | | | | | | | | | | | | |
| Counterparty | | Reference Entity | | Fixed
Receive
Rate | | | Payment
Frequency | | Maturity
Date | | | Implied
Credit
Spread at
December 31,
2018(2) | | | Notional
Amount(3) | | | Premiums
Paid/
(Received) | | | Unrealized
Appreciation/
(Depreciation) | | | Swap
Agreements,
at Value(4) | |
| | Asset | | | Liability | |
BPS | | Mexico Government International Bond | | | 1.000 | % | | Quarterly | | | 12/20/2023 | | | | 1.549 | % | | $ | 100 | | | $ | 0 | | | $ | (3 | ) | | $ | 0 | | | $ | (3 | ) |
CBK | | Mexico Government International Bond | | | 1.000 | | | Quarterly | | | 12/20/2023 | | | | 1.549 | | | | 200 | | | | (1 | ) | | | (4 | ) | | | 0 | | | | (5 | ) |
FBF | | Brazil Government International Bond | | | 1.000 | | | Quarterly | | | 06/20/2022 | | | | 1.609 | | | | 1,200 | | | | (80 | ) | | | 57 | | | | 0 | | | | (23 | ) |
GST | | Brazil Government International Bond | | | 1.000 | | | Quarterly | | | 06/20/2023 | | | | 1.903 | | | | 6,700 | | | | (271 | ) | | | 26 | | | | 0 | | | | (245 | ) |
HUS | | Brazil Government International Bond | | | 1.000 | | | Quarterly | | | 06/20/2023 | | | | 1.903 | | | | 4,600 | | | | (291 | ) | | | 123 | | | | 0 | | | | (168 | ) |
| | Mexico Government International Bond | | | 1.000 | | | Quarterly | | | 06/20/2023 | | | | 1.434 | | | | 2,300 | | | | (20 | ) | | | (20 | ) | | | 0 | | | | (40 | ) |
| | Mexico Government International Bond | | | 1.000 | | | Quarterly | | | 12/20/2023 | | | | 1.549 | | | | 1,100 | | | | (15 | ) | | | (12 | ) | | | 0 | | | | (27 | ) |
JPM | | Mexico Government International Bond | | | 1.000 | | | Quarterly | | | 12/20/2023 | | | | 1.549 | | | | 100 | | | | (1 | ) | | | (1 | ) | | | 0 | | | | (2 | ) |
| | | | | | | | | | | | | | | | | | | | | | | | | | | | | | | | | | | | |
Total Swap Agreements | | | $ | (679 | ) | | $ | 166 | | | $ | 0 | | | $ | (513 | ) |
| | | | | | | | | | | | | | | | | | | | | | | | | | | | | | | | | | | | |
FINANCIAL DERIVATIVE INSTRUMENTS: OVER THE COUNTER SUMMARY
The following is a summary by counterparty of the market value of OTC financial derivative instruments and collateral pledged/(received) as of December 31, 2018:
| | | | | | | | | | | | | | | | | | | | | | | | | | | | | | | | | | | | | | | | | | | | | | | | |
| | | Financial Derivative Assets | | | | | | Financial Derivative Liabilities | | | | | | | | | | |
| Counterparty | | Forward
Foreign
Currency
Contracts | | | Purchased
Options | | | Swap
Agreements | | | Total
Over the
Counter | | | | | | Forward
Foreign
Currency
Contracts | | | Written
Options | | | Swap
Agreements | | | Total
Over the
Counter | | | Net Market
Value of OTC
Derivatives | | | Collateral
Pledged/
(Received) | | | Net
Exposure(5) | |
BOA | | $ | 0 | | | $ | 0 | | | $ | 0 | | | $ | 0 | | | | | | | $ | (184 | ) | | $ | (150 | ) | | $ | 0 | | | $ | (334 | ) | | $ | (334 | ) | | $ | 85 | | | $ | (249 | ) |
BPS | | | 0 | | | | 0 | | | | 0 | | | | 0 | | | | | | | | 0 | | | | 0 | | | | (3 | ) | | | (3 | ) | | | (3 | ) | | | 0 | | | | (3 | ) |
CBK | | | 449 | | | | 0 | | | | 0 | | | | 449 | | | | | | | | (184 | ) | | | (25 | ) | | | (5 | ) | | | (214 | ) | | | 235 | | | | (290 | ) | | | (55 | ) |
FBF | | | 0 | | | | 0 | | | | 0 | | | | 0 | | | | | | | | 0 | | | | 0 | | | | (23 | ) | | | (23 | ) | | | (23 | ) | | | 4 | | | | (19 | ) |
GLM | | | 145 | | | | 0 | | | | 0 | | | | 145 | | | | | | | | (46 | ) | | | 0 | | | | 0 | | | | (46 | ) | | | 99 | | | | (50 | ) | | | 49 | |
GST | | | 0 | | | | 0 | | | | 0 | | | | 0 | | | | | | | | 0 | | | | (39 | ) | | | (245 | ) | | | (284 | ) | | | (284 | ) | | | 284 | | | | (0 | ) |
HUS | | | 0 | | | | 0 | | | | 0 | | | | 0 | | | | | | | | 0 | | | | 0 | | | | (235 | ) | | | (235 | ) | | | (235 | ) | | | 424 | | | | 189 | |
JPM | | | 16 | | | | 0 | | | | 0 | | | | 16 | | | | | | | | (86 | ) | | | (256 | ) | | | (2 | ) | | | (344 | ) | | | (328 | ) | | | 454 | | | | 126 | |
MYC | | | 0 | | | | 0 | | | | 0 | | | | 0 | | | | | | | | 0 | | | | (40 | ) | | | 0 | | | | (40 | ) | | | (40 | ) | | | 0 | | | | (40 | ) |
SOG | | | 0 | | | | 0 | | | | 0 | | | | 0 | | | | | | | | (512 | ) | | | 0 | | | | 0 | | | | (512 | ) | | | (512 | ) | | | 346 | | | | (166 | ) |
| | | | | | | | | | | | | | | | | | | | | | | | | | | | | | | | | | | | | | | | | | | | | | | | |
Total Over the Counter | | $ | 610 | | | $ | 0 | | | $ | 0 | | | $ | 610 | | | | | | | $ | (1,012 | ) | | $ | (510 | ) | | $ | (513 | ) | | $ | (2,035 | ) | | | | | | | | | | | | |
| | | | | | | | | | | | | | | | | | | | | | | | | | | | | | | | | | | | | | | | | | | | | | | | |
| | | | | | |
| See Accompanying Notes | | ANNUAL REPORT | | DECEMBER 31, 2018 | | 85 |
Schedule of InvestmentsPIMCO Fixed Income SHares: Series M(Cont.)
| (l) | Securities with an aggregate market value of $1,597 have been pledged as collateral for financial derivative instruments as governed by International Swaps and Derivatives Association, Inc. master agreements as of December 31, 2018. |
| (1) | If the Portfolio is a seller of protection and a credit event occurs, as defined under the terms of that particular swap agreement, the Portfolio will either (i) pay to the buyer of protection an amount equal to the notional amount of the swap and take delivery of the referenced obligation or underlying securities comprising the referenced index or (ii) pay a net settlement amount in the form of cash, securities or other deliverable obligations equal to the notional amount of the swap less the recovery value of the referenced obligation or underlying securities comprising the referenced index. |
| (2) | Implied credit spreads, represented in absolute terms, utilized in determining the market value of credit default swap agreements on sovereign issues as of period end serve as indicators of the current status of the payment/performance risk and represent the likelihood or risk of default for the credit derivative. The implied credit spread of a particular referenced entity reflects the cost of buying/selling protection and may include upfront payments required to be made to enter into the agreement. Wider credit spreads represent a deterioration of the referenced entity’s credit soundness and a greater likelihood or risk of default or other credit event occurring as defined under the terms of the agreement. |
| (3) | The maximum potential amount the Portfolio could be required to pay as a seller of credit protection or receive as a buyer of credit protection if a credit event occurs as defined under the terms of that particular swap agreement. |
| (4) | The prices and resulting values for credit default swap agreements serve as indicators of the current status of the payment/performance risk and represent the likelihood of an expected liability (or profit) for the credit derivative should the notional amount of the swap agreement be closed/sold as of the period end. Increasing market values, in absolute terms when compared to the notional amount of the swap, represent a deterioration of the referenced indices’ credit soundness and a greater likelihood or risk of default or other credit event occurring as defined under the terms of the agreement. |
| (5) | Net Exposure represents the net receivable/(payable) that would be due from/to the counterparty in the event of default. Exposure from OTC financial derivative instruments can only be netted across transactions governed under the same master agreement with the same legal entity. See Note 8, Master Netting Arrangements, in the Notes to Financial Statements for more information regarding master netting arrangements. |
FAIR VALUE OF FINANCIAL DERIVATIVE INSTRUMENTS
The following is a summary of the fair valuation of the Portfolio’s derivative instruments categorized by risk exposure. See Note 7, Principal Risks, in the Notes to Financial Statements on risks of the Portfolio.
Fair Values of Financial Derivative Instruments on the Statements of Assets and Liabilities as of December 31, 2018:
| | | | | | | | | | | | | | | | | | | | | | | | |
| | | Derivatives not accounted for as hedging instruments | |
| | | Commodity
Contracts | | | Credit
Contracts | | | Equity
Contracts | | | Foreign
Exchange
Contracts | | | Interest
Rate Contracts | | | Total | |
Financial Derivative Instruments - Assets | |
Exchange-traded or centrally cleared | |
Purchased Options | | $ | 0 | | | $ | 0 | | | $ | 0 | | | $ | 0 | | | $ | 4 | | | $ | 4 | |
Futures | | | 0 | | | | 0 | | | | 0 | | | | 0 | | | | 975 | | | | 975 | |
Swap Agreements | | | 0 | | | | 23 | | | | 0 | | | | 0 | | | | 0 | | | | 23 | |
| | | | | | | | | | | | | | | | | | | | | | | | |
| | $ | 0 | | | $ | 23 | | | $ | 0 | | | $ | 0 | | | $ | 979 | | | $ | 1,002 | |
| | | | | | | | | | | | | | | | | | | | | | | | |
Over the counter | | | | | | | | | | | | | | | | | | | | | | | | |
Forward Foreign Currency Contracts | | $ | 0 | | | $ | 0 | | | $ | 0 | | | $ | 610 | | | $ | 0 | | | $ | 610 | |
| | | | | | | | | | | | | | | | | | | | | | | | |
| | $ | 0 | | | $ | 23 | | | $ | 0 | | | $ | 610 | | | $ | 979 | | | $ | 1,612 | |
| | | | | | | | | | | | | | | | | | | | | | | | |
| | | | | | |
| 86 | | PIMCO MANAGED ACCOUNTS TRUST | | | | See Accompanying Notes |
December 31, 2018
| | | | | | | | | | | | | | | | | | | | | | | | |
| | | Derivatives not accounted for as hedging instruments | |
| | | Commodity
Contracts | | | Credit
Contracts | | | Equity
Contracts | | | Foreign
Exchange
Contracts | | | Interest
Rate Contracts | | | Total | |
Financial Derivative Instruments - Liabilities | |
Exchange-traded or centrally cleared | |
Futures | | $ | 0 | | | $ | 0 | | | $ | 0 | | | $ | 0 | | | $ | 341 | | | $ | 341 | |
Swap Agreements | | | 0 | | | | 0 | | | | 0 | | | | 0 | | | | 505 | | | | 505 | |
| | | | | | | | | | | | | | | | | | | | | | | | |
| | $ | 0 | | | $ | 0 | | | $ | 0 | | | $ | 0 | | | $ | 846 | | | $ | 846 | |
| | | | | | | | | | | | | | | | | | | | | | | | |
Over the counter | |
Forward Foreign Currency Contracts | | $ | 0 | | | $ | 0 | | | $ | 0 | | | $ | 1,012 | | | $ | 0 | | | $ | 1,012 | |
Written Options | | | 0 | | | | 510 | | | | 0 | | | | 0 | | | | 0 | | | | 510 | |
Swap Agreements | | | 0 | | | | 513 | | | | 0 | | | | 0 | | | | 0 | | | | 513 | |
| | | | | | | | | | | | | | | | | | | | | | | | |
| | $ | 0 | | | $ | 1,023 | | | $ | 0 | | | $ | 1,012 | | | $ | 0 | | | $ | 2,035 | |
| | | | | | | | | | | | | | | | | | | | | | | | |
| | $ | 0 | | | $ | 1,023 | | | $ | 0 | | | $ | 1,012 | | | $ | 846 | | | $ | 2,881 | |
| | | | | | | | | | | | | | | | | | | | | | | | |
The effect of Financial Derivative Instruments on the Statements of Operations for the period ended December 31, 2018:
| | | | | | | | | | | | | | | | | | | | | | | | |
| | | Derivatives not accounted for as hedging instruments | |
| | | Commodity
Contracts | | | Credit
Contracts | | | Equity
Contracts | | | Foreign
Exchange
Contracts | | | Interest
Rate Contracts | | | Total | |
Net Realized Gain (Loss) on Financial Derivative Instruments | |
Exchange-traded or centrally cleared | |
Purchased Options | | $ | 0 | | | $ | 0 | | | $ | 0 | | | $ | 0 | | | $ | (69 | ) | | $ | (69 | ) |
Futures | | | 0 | | | | 0 | | | | 0 | | | | 0 | | | | (5,183 | ) | | | (5,183 | ) |
Swap Agreements | | | 0 | | | | 328 | | | | 0 | | | | 0 | | | | 5,639 | | | | 5,967 | |
| | | | | | | | | | | | | | | | | | | | | | | | |
| | $ | 0 | | | $ | 328 | | | $ | 0 | | | $ | 0 | | | $ | 387 | | | $ | 715 | |
| | | | | | | | | | | | | | | | | | | | | | | | |
Over the counter | |
Forward Foreign Currency Contracts | | $ | 0 | | | $ | 0 | | | $ | 0 | | | $ | 8,452 | | | $ | 0 | | | $ | 8,452 | |
Purchased Options | | | 0 | | | | 0 | | | | 0 | | | | (6 | ) | | | (55 | ) | | | (61 | ) |
Written Options | | | 0 | | | | 703 | | | | 0 | | | | 0 | | | | 80 | | | | 783 | |
Swap Agreements | | | 0 | | | | 531 | | | | 0 | | | | 0 | | | | 0 | | | | 531 | |
| | | | | | | | | | | | | | | | | | | | | | | | |
| | $ | 0 | | | $ | 1,234 | | | $ | 0 | | | $ | 8,446 | | | $ | 25 | | | $ | 9,705 | |
| | | | | | | | | | | | | | | | | | | | | | | | |
| | $ | 0 | | | $ | 1,562 | | | $ | 0 | | | $ | 8,446 | | | $ | 412 | | | $ | 10,420 | |
| | | | | | | | | | | | | | | | | | | | | | | | |
|
Net Change in Unrealized Appreciation (Depreciation) on Financial Derivative Instruments | |
Exchange-traded or centrally cleared | |
Purchased Options | | $ | 0 | | | $ | 0 | | | $ | 0 | | | $ | 0 | | | $ | (13 | ) | | $ | (13 | ) |
Futures | | | 0 | | | | 0 | | | | 0 | | | | 0 | | | | 6,173 | | | | 6,173 | |
Swap Agreements | | | 0 | | | | (208 | ) | | | 0 | | | | 0 | | | | (3,786 | ) | | | (3,994 | ) |
| | | | | | | | | | | | | | | | | | | | | | | | |
| | $ | 0 | | | $ | (208 | ) | | $ | 0 | | | $ | 0 | | | $ | 2,374 | | | $ | 2,166 | |
| | | | | | | | | | | | | | | | | | | | | | | | |
Over the counter | |
Forward Foreign Currency Contracts | | $ | 0 | | | $ | 0 | | | $ | 0 | | | $ | 1,740 | | | $ | 0 | | | $ | 1,740 | |
Purchased Options | | | 0 | | | | 0 | | | | 0 | | | | 0 | | | | (6 | ) | | | (6 | ) |
Written Options | | | 0 | | | | (132 | ) | | | 0 | | | | 0 | | | | 0 | | | | (132 | ) |
Swap Agreements | | | 0 | | | | (336 | ) | | | 0 | | | | 0 | | | | 0 | | | | (336 | ) |
| | | | | | | | | | | | | | | | | | | | | | | | |
| | $ | 0 | | | $ | (468 | ) | | $ | 0 | | | $ | 1,740 | | | $ | (6 | ) | | $ | 1,266 | |
| | | | | | | | | | | | | | | | | | | | | | | | |
| | $ | 0 | | | $ | (676 | ) | | $ | 0 | | | $ | 1,740 | | | $ | 2,368 | | | $ | 3,432 | |
| | | | | | | | | | | | | | | | | | | | | | | | |
| | | | | | |
| See Accompanying Notes | | ANNUAL REPORT | | DECEMBER 31, 2018 | | 87 |
Schedule of InvestmentsPIMCO Fixed Income SHares: Series M(Cont.)
December 31, 2018
FAIR VALUE MEASUREMENTS
The following is a summary of the fair valuations according to the inputs used as of December 31, 2018 in valuing the Portfolio’s assets and liabilities:
| | | | | | | | | | | | | | | | |
| Category and Subcategory | | Level 1 | | | Level 2 | | | Level 3 | | | Fair
Value at
12/31/2018 | |
Investments in Securities, at Value | |
Corporate Bonds & Notes | |
Banking & Finance | | $ | 0 | | | $ | 253,232 | | | $ | 0 | | | $ | 253,232 | |
Industrials | | | 0 | | | | 84,042 | | | | 0 | | | | 84,042 | |
Utilities | | | 0 | | | | 2,921 | | | | 0 | | | | 2,921 | |
Municipal Bonds & Notes | |
California | | | 0 | | | | 4,783 | | | | 0 | | | | 4,783 | |
Illinois | | | 0 | | | | 2,986 | | | | 0 | | | | 2,986 | |
Ohio | | | 0 | | | | 1,245 | | | | 0 | | | | 1,245 | |
Pennsylvania | | | 0 | | | | 10,092 | | | | 0 | | | | 10,092 | |
Texas | | | 0 | | | | 905 | | | | 0 | | | | 905 | |
Virginia | | | 0 | | | | 17,789 | | | | 0 | | | | 17,789 | |
West Virginia | | | 0 | | | | 22,905 | | | | 0 | | | | 22,905 | |
U.S. Government Agencies | | | 0 | | | | 635,668 | | | | 0 | | | | 635,668 | |
U.S. Treasury Obligations | | | 0 | | | | 66,730 | | | | 0 | | | | 66,730 | |
Non-Agency Mortgage-Backed Securities | | | 0 | | | | 256,310 | | | | 0 | | | | 256,310 | |
Asset-Backed Securities | | | 0 | | | | 451,690 | | | | 416 | | | | 452,106 | |
Sovereign Issues | | | 0 | | | | 7,096 | | | | 0 | | | | 7,096 | |
Short-Term Instruments | |
Repurchase Agreements | | | 0 | | | | 29,446 | | | | 0 | | | | 29,446 | |
U.S. Treasury Bills | | | 0 | | | | 395 | | | | 0 | | | | 395 | |
| | $ | 0 | | | $ | 1,848,235 | | | $ | 416 | | | $ | 1,848,651 | |
|
Investments in Affiliates, at Value | |
Short-Term Instruments | |
Central Funds Used for Cash Management Purposes | | $ | 23,504 | | | $ | 0 | | | $ | 0 | | | $ | 23,504 | |
| | | | |
Total Investments | | $ | 23,504 | | | $ | 1,848,235 | | | $ | 416 | | | $ | 1,872,155 | |
|
Financial Derivative Instruments - Assets | |
Exchange-traded or centrally cleared | | | 975 | | | | 27 | | | | 0 | | | | 1,002 | |
Over the counter | | | 0 | | | | 610 | | | | 0 | | | | 610 | |
| | $ | 975 | | | $ | 637 | | | $ | 0 | | | $ | 1,612 | |
|
Financial Derivative Instruments - Liabilities | |
Exchange-traded or centrally cleared | | | (341 | ) | | | (505 | ) | | | 0 | | | | (846 | ) |
Over the counter | | | 0 | | | | (2,035 | ) | | | 0 | | | | (2,035 | ) |
| | $ | (341 | ) | | $ | (2,540 | ) | | $ | 0 | | | $ | (2,881 | ) |
| | | | |
Total Financial Derivative Instruments | | $ | 634 | | | $ | (1,903 | ) | | $ | 0 | | | $ | (1,269 | ) |
| | | | |
Totals | | $ | 24,138 | | | $ | 1,846,332 | | | $ | 416 | | | $ | 1,870,886 | |
There were no significant transfers into or out of Level 3 during the period ended December 31, 2018.
| | | | | | |
| 88 | | PIMCO MANAGED ACCOUNTS TRUST | | | | See Accompanying Notes |
Schedule of InvestmentsPIMCO Fixed Income SHares: Series R
December 31, 2018
(Amounts in thousands*, except number of shares, contracts and units, if any)
| | | | | | | | | | | | |
| | | | | PRINCIPAL
AMOUNT
(000S) | | | | | MARKET
VALUE
(000S) | |
| INVESTMENTS IN SECURITIES 179.1% | |
| |
| CORPORATE BONDS & NOTES 10.4% | |
| |
| BANKING & FINANCE 7.2% | |
|
AerCap Ireland Capital DAC | |
3.750% due 05/15/2019 | | $ | | | 100 | | | $ | | | 100 | |
4.625% due 10/30/2020 | | | | | 100 | | | | | | 101 | |
|
Ally Financial, Inc. | |
3.500% due 01/27/2019 | | | | | 400 | | | | | | 400 | |
|
Deutsche Bank AG | |
4.250% due 10/14/2021 | | | | | 1,400 | | | | | | 1,370 | |
|
Goldman Sachs Group, Inc. | |
3.988% (US0003M + 1.200%) due 09/15/2020 ~ | | | | | 1,400 | | | | | | 1,407 | |
|
ING Bank NV | |
2.625% due 12/05/2022 | | | | | 400 | | | | | | 394 | |
|
International Lease Finance Corp. | |
5.875% due 04/01/2019 | | | | | 100 | | | | | | 100 | |
6.250% due 05/15/2019 | | | | | 100 | | | | | | 101 | |
8.250% due 12/15/2020 | | | | | 100 | | | | | | 108 | |
|
Lloyds Banking Group PLC | |
3.590% (US0003M + 0.800%) due 06/21/2021 ~ | | | | | 200 | | | | | | 198 | |
7.000% due 06/27/2019 •(d)(e) | | GBP | | | 400 | | | | | | 511 | |
|
National Rural Utilities Cooperative Finance Corp. | |
3.178% (US0003M + 0.375%) due 06/30/2021 ~ | | $ | | | 200 | | | | | | 198 | |
|
Nordea Kredit Realkreditaktieselskab | |
2.500% due 10/01/2047 | | DKK | | | 1 | | | | | | 0 | |
|
Nykredit Realkredit A/S | |
2.500% due 10/01/2047 | | | | | 142 | | | | | | 23 | |
|
Realkredit Danmark A/S | |
2.500% due 07/01/2047 | | | | | 106 | | | | | | 17 | |
|
Royal Bank of Scotland Group PLC | |
4.372% (US0003M + 1.550%) due 06/25/2024 ~ | | $ | | | 300 | | | | | | 287 | |
4.519% due 06/25/2024 • | | | | | 200 | | | | | | 196 | |
|
UBS AG | |
3.347% due 06/08/2020 • | | | | | 1,000 | | | | | | 1,000 | |
|
UniCredit SpA | |
7.830% due 12/04/2023 | | | | | 1,700 | | | | | | 1,780 | |
| | | | | | | | | | | | |
| | | | | | | | | | | 8,291 | |
| | | | | | | | | | | | |
| |
| INDUSTRIALS 1.0% | |
|
BAT Capital Corp. | |
3.204% due 08/14/2020 • | | | | | 300 | | | | | | 297 | |
|
Dominion Energy Gas Holdings LLC | |
3.388% (US0003M + 0.600%) due 06/15/2021 ~ | | | | | 200 | | | | | | 199 | |
| | | | | | | | | | | | |
| | | | | PRINCIPAL
AMOUNT
(000S) | | | | | MARKET
VALUE
(000S) | |
|
eBay, Inc. | |
2.750% due 01/30/2023 | | $ | | | 300 | | | $ | | | 289 | |
|
Enbridge, Inc. | |
2.814% (US0003M + 0.400%) due 01/10/2020 ~ | | | | | 300 | | | | | | 299 | |
| | | | | | | | | | | | |
| | | | | | | | | | | 1,084 | |
| | | | | | | | | | | | |
| | | | | | | | | | | | |
| UTILITIES 2.2% | |
|
AT&T, Inc. | |
3.386% (US0003M + 0.950%) due 07/15/2021 ~ | | | | | 300 | | | | | | 299 | |
5.150% due 02/15/2050 | | | | | 300 | | | | | | 279 | |
5.300% due 08/15/2058 | | | | | 100 | | | | | | 93 | |
|
NextEra Energy Capital Holdings, Inc. | |
3.053% (US0003M + 0.315%) due 09/03/2019 ~ | | | | | 570 | | | | | | 570 | |
|
Petrobras Global Finance BV | |
4.375% due 05/20/2023 | | | | | 200 | | | | | | 191 | |
5.999% due 01/27/2028 | | | | | 490 | | | | | | 463 | |
6.125% due 01/17/2022 | | | | | 68 | | | | | | 70 | |
7.375% due 01/17/2027 | | | | | 500 | | | | | | 515 | |
|
Sempra Energy | |
3.238% (US0003M + 0.450%) due 03/15/2021 ~ | | | | | 100 | | | | | | 98 | |
| | | | | | | | | | | | |
| | | | | | | | | | | 2,578 | |
| | | | | | | | | | | | |
Total Corporate Bonds & Notes
(Cost $12,032) | | | 11,953 | |
| | | | | | | | | | | | |
| |
| U.S. GOVERNMENT AGENCIES 20.9% | |
|
Fannie Mae | |
2.951% due 02/25/2037 • | | | | | 34 | | | | | | 34 | |
3.253% due 10/01/2044 • | | | | | 4 | | | | | | 4 | |
3.500% due 12/01/2045 - 01/01/2048 | | | | | 795 | | | | | | 796 | |
|
Fannie Mae, TBA | |
3.000% due 01/01/2049 | | | | | 300 | | | | | | 293 | |
3.500% due 01/01/2049 - 02/01/2049 | | | | | 11,200 | | | | | | 11,197 | |
4.000% due 01/01/2049 | | | | | 11,500 | | | | | | 11,727 | |
|
Freddie Mac | |
4.251% due 07/01/2036 • | | | | | 43 | | | | | | 45 | |
4.254% due 09/01/2036 • | | | | | 39 | | | | | | 41 | |
| | | | | | | | | | | | |
Total U.S. Government Agencies
(Cost $23,795) | | | 24,137 | |
| | | | | | | | | | | | |
| |
| U.S. TREASURY OBLIGATIONS 123.1% | |
|
U.S. Treasury Inflation Protected Securities (c) | |
0.125% due 04/15/2020 (g) | | | | | 6,625 | | | | | | 6,478 | |
0.125% due 04/15/2021 | | | | | 1,494 | | | | | | 1,453 | |
0.125% due 01/15/2022 (i)(k) | | | | | 860 | | | | | | 835 | |
| | | | | | |
| See Accompanying Notes | | ANNUAL REPORT | | DECEMBER 31, 2018 | | 89 |
Schedule of InvestmentsPIMCO Fixed Income SHares: Series R(Cont.)
| | | | | | | | | | | | |
| | | | | PRINCIPAL
AMOUNT
(000S) | | | | | MARKET
VALUE
(000S) | |
0.125% due 04/15/2022 (g) | | $ | | | 6,866 | | | $ | | | 6,645 | |
0.125% due 01/15/2023 | | | | | 2,182 | | | | | | 2,108 | |
0.125% due 07/15/2024 (g) | | | | | 12,108 | | | | | | 11,615 | |
0.125% due 07/15/2026 | | | | | 2,574 | | | | | | 2,419 | |
0.250% due 01/15/2025 (g) | | | | | 7,452 | | | | | | 7,139 | |
0.375% due 07/15/2025 | | | | | 2,935 | | | | | | 2,831 | |
0.375% due 01/15/2027 | | | | | 670 | | | | | | 637 | |
0.625% due 07/15/2021 | | | | | 673 | | | | | | 666 | |
0.625% due 04/15/2023 | | | | | 2,637 | | | | | | 2,594 | |
0.625% due 01/15/2024 | | | | | 3,041 | | | | | | 2,995 | |
0.625% due 01/15/2026 (g) | | | | | 14,517 | | | | | | 14,140 | |
0.625% due 02/15/2043 (k) | | | | | 440 | | | | | | 387 | |
0.750% due 07/15/2028 | | | | | 1,078 | | | | | | 1,056 | |
0.750% due 02/15/2042 | | | | | 1,668 | | | | | | 1,517 | |
0.750% due 02/15/2045 | | | | | 3,114 | | | | | | 2,792 | |
0.875% due 02/15/2047 | | | | | 4,709 | | | | | | 4,333 | |
1.000% due 02/15/2046 | | | | | 4,568 | | | | | | 4,342 | |
1.000% due 02/15/2048 (g) | | | | | 10,784 | | | | | | 10,243 | |
1.250% due 07/15/2020 | | | | | 845 | | | | | | 844 | |
1.375% due 02/15/2044 (g) | | | | | 7,324 | | | | | | 7,580 | |
1.750% due 01/15/2028 (g) | | | | | 17,449 | | | | | | 18,544 | |
2.000% due 01/15/2026 | | | | | 1,928 | | | | | | 2,058 | |
2.125% due 02/15/2040 | | | | | 269 | | | | | | 317 | |
2.125% due 02/15/2041 | | | | | 2,540 | | | | | | 3,007 | |
2.375% due 01/15/2025 | | | | | 3,917 | | | | | | 4,237 | |
2.500% due 01/15/2029 (g) | | | | | 10,611 | | | | | | 12,089 | |
3.375% due 04/15/2032 | | | | | 591 | | | | | | 760 | |
3.625% due 04/15/2028 | | | | | 2,361 | | | | | | 2,900 | |
3.875% due 04/15/2029 | | | | | 2,007 | | | | | | 2,558 | |
| | | | | | | | | | | | |
Total U.S. Treasury Obligations
(Cost $146,480) | | | 142,119 | |
| | | | | | | | | | | | |
| |
| NON-AGENCY MORTGAGE-BACKED SECURITIES 3.1% | |
|
Citigroup Mortgage Loan Trust | |
2.515% due 06/25/2047 • | | | | | 506 | | | | | | 507 | |
|
Countrywide Alternative Loan Trust | |
2.665% due 12/20/2046 ^• | | | | | 1,109 | | | | | | 980 | |
|
Grifonas Finance PLC | |
0.014% due 08/28/2039 • | | EUR | | | 155 | | | | | | 157 | |
|
GSR Mortgage Loan Trust | |
4.300% due 09/25/2035 ~ | | $ | | | 26 | | | | | | 26 | |
|
HarborView Mortgage Loan Trust | |
3.070% due 06/20/2035 • | | | | | 508 | | | | | | 505 | |
|
IndyMac Mortgage Loan Trust | |
3.346% due 05/25/2034 • | | | | | 1,188 | | | | | | 1,112 | |
|
MortgageIT Trust | |
3.511% due 12/25/2034 • | | | | | 23 | | | | | | 22 | |
|
Residential Accredit Loans, Inc. Trust | |
2.686% due 06/25/2046 • | | | | | 245 | | | | | | 99 | |
|
Swan Trust | |
3.332% due 04/25/2041 • | | AUD | | | 207 | | | | | | 146 | |
| | | | | | | | | | | | |
TotalNon-Agency Mortgage-Backed Securities (Cost $3,303) | | | 3,554 | |
| | | | | | | | | | | | |
| | | | | | | | | | | | |
| | | | | PRINCIPAL
AMOUNT
(000S) | | | | | MARKET
VALUE
(000S) | |
| ASSET-BACKED SECURITIES 8.3% | |
|
Asset-Backed Funding Certificates Trust | |
3.106% due 10/25/2034 • | | $ | | | 22 | | | $ | | | 22 | |
|
CIT Mortgage Loan Trust | |
3.856% due 10/25/2037 • | | | | | 594 | | | | | | 602 | |
|
Citigroup Mortgage Loan Trust | |
2.586% due 01/25/2037 • | | | | | 211 | | | | | | 149 | |
2.651% due 09/25/2036 • | | | | | 639 | | | | | | 616 | |
|
Citigroup Mortgage Loan Trust, Inc. | |
2.966% due 10/25/2035 • | | | | | 500 | | | | | | 461 | |
|
Countrywide Asset-Backed Certificates Trust | |
3.036% due 02/25/2036 • | | | | | 500 | | | | | | 497 | |
|
Credit Suisse Mortgage Capital Trust | |
4.500% due 03/25/2021 | | | | | 272 | | | | | | 273 | |
|
Dryden Senior Loan Fund | |
3.336% due 10/15/2027 • | | | | | 700 | | | | | | 695 | |
|
Evans Grove CLO Ltd. | |
3.627% due 05/28/2028 • | | | | | 1,600 | | | | | | 1,589 | |
|
First Franklin Mortgage Loan Trust | |
3.331% due 01/25/2035 • | | | | | 26 | | | | | | 26 | |
|
Home Equity Asset Trust | |
3.361% due 08/25/2034 • | | | | | 94 | | | | | | 93 | |
|
Massachusetts Educational Financing Authority | |
3.440% due 04/25/2038 • | | | | | 55 | | | | | | 55 | |
|
Morgan Stanley ABS Capital, Inc. Trust | |
3.166% due 01/25/2035 • | | | | | 268 | | | | | | 263 | |
|
Mountain View CLO Ltd. | |
3.256% due 10/13/2027 • | | | | | 200 | | | | | | 198 | |
|
Nomura Home Equity Loan, Inc. Home Equity Loan Trust | |
3.016% due 05/25/2035 • | | | | | 1,300 | | | | | | 1,236 | |
|
RAAC Trust | |
2.846% due 08/25/2036 • | | | | | 100 | | | | | | 100 | |
|
Saxon Asset Securities Trust | |
3.035% due 05/25/2035 • | | | | | 42 | | | | | | 38 | |
|
Sound Point CLO Ltd. | |
3.296% due 04/15/2027 • | | | | | 600 | | | | | | 597 | |
|
Structured Asset Securities Corp. Mortgage Loan Trust | |
3.506% due 08/25/2037 • | | | | | 46 | | | | | | 46 | |
|
Venture CLO Ltd. | |
3.507% due 02/28/2026 • | | | | | 1,650 | | | | | | 1,642 | |
|
Vericrest Opportunity Loan Transferee LLC | |
3.125% due 09/25/2047 Ø | | | | | 363 | | | | | | 361 | |
| | | | | | | | | | | | |
Total Asset-Backed Securities
(Cost $9,411) | | | 9,559 | |
| | | | | | | | | | | | |
| |
| SOVEREIGN ISSUES 12.6% | |
|
Argentina Government International Bond | |
5.875% due 01/11/2028 | | | | | 320 | | | | | | 231 | |
6.875% due 01/26/2027 | | | | | 730 | | | | | | 559 | |
| | | | | | |
| 90 | | PIMCO MANAGED ACCOUNTS TRUST | | | | See Accompanying Notes |
December 31, 2018
| | | | | | | | | | | | |
| | | | | PRINCIPAL
AMOUNT
(000S) | | | | | MARKET
VALUE
(000S) | |
41.328% (BADLARPP) due 10/04/2022 ~ | | ARS | | | 100 | | | $ | | | 4 | |
50.225% (BADLARPP + 2.000%) due 04/03/2022 ~(a) | | | 1,596 | | | | | | 41 | |
59.257% (ARLLMONP)
due 06/21/2020 ~(a) | | | | | 14,879 | | | | | | 426 | |
|
Australia Government International Bond | |
1.250% due 02/21/2022 | | AUD | | | 865 | | | | | | 622 | |
3.000% due 09/20/2025 | | | | | 1,900 | | | | | | 1,543 | |
|
Brazil Letras do Tesouro Nacional | |
0.000% due 04/01/2019 (b) | | BRL | | | 1,230 | | | | | | 313 | |
|
Canadian Government Real Return Bond | |
4.250% due 12/01/2026 (c) | | CAD | | | 916 | | | | | | 860 | |
|
Denmark Government Bond | |
0.100% due 11/15/2023 (c) | | DKK | | | 11,647 | | | | | | 1,896 | |
|
France Government International Bond | |
1.850% due 07/25/2027 (c) | | EUR | | | 334 | | | | | | 466 | |
|
Japan Government International Bond | |
0.100% due 03/10/2028 (c) | | JPY | | | 80,646 | | | | | | 759 | |
|
Mexico Government International Bond | |
7.750% due 05/29/2031 | | MXN | | | 8,021 | | | | | | 377 | |
|
New Zealand Government International Bond | |
2.000% due 09/20/2025 | | NZD | | | 430 | | | | | | 305 | |
2.500% due 09/20/2035 | | | | | 420 | | | | | | 320 | |
3.000% due 09/20/2030 | | | | | 1,280 | | | | | | 1,007 | |
|
Peru Government International Bond | |
5.940% due 02/12/2029 | | PEN | | | 900 | | | | | | 272 | |
|
Qatar Government International Bond | |
3.875% due 04/23/2023 | | $ | | | 300 | | | | | | 304 | |
5.103% due 04/23/2048 | | | | | 200 | | | | | | 210 | |
| | | | | | | | | | | | |
| | | | | PRINCIPAL
AMOUNT
(000S) | | | | | MARKET
VALUE
(000S) | |
|
United Kingdom Gilt | |
0.125% due 03/22/2046 (c) | | GBP | | | 138 | | | $ | | | 274 | |
0.125% due 08/10/2048 (c) | | | | | 114 | | | | | | 235 | |
0.125% due 11/22/2056 (c) | | | | | 146 | | | | | | 336 | |
0.125% due 11/22/2065 (c) | | | | | 152 | | | | | | 403 | |
0.750% due 11/22/2047 (c) | | | | | 27 | | | | | | 64 | |
1.750% due 09/07/2037 | | | | | 1,770 | | | | | | 2,260 | |
1.875% due 11/22/2022 (c) | | | | | 318 | | | | | | 474 | |
| | | | | | | | | | | | |
Total Sovereign Issues
(Cost $16,003) | | | 14,561 | |
| | | | | | | | | | | | |
| |
| SHORT-TERM INSTRUMENTS 0.7% | |
| |
| REPURCHASE AGREEMENTS (f) 0.7% | |
| | | | | | | | | | | 779 | |
| | | | | | | | | | | | |
Total Short-Term Instruments
(Cost $779) | | | 779 | |
| | | | | | | | | | | | |
| |
| | | | |
Total Investments in Securities
(Cost $211,803) | | | 206,662 | |
| |
| | | | |
Total Investments 179.1%
(Cost $211,803) | | | $ | | | 206,662 | |
| | | | | | | | | | | | |
Financial Derivative
Instruments (h)(j) 0.1% (Cost or Premiums, net $(612)) | | | 97 | |
| | | | | | | | | | | | |
| Other Assets and Liabilities, net (79.2)% | | | (91,352 | ) |
| | | | |
| Net Assets 100.0% | | | $ | | | 115,407 | |
| | | | | | | |
NOTES TO SCHEDULE OF INVESTMENTS:
| * | A zero balance may reflect actual amounts rounding to less than one thousand. |
| ~ | Variable or Floating rate security. Rate shown is the rate in effect as of period end. Certain variable rate securities are not based on a published reference rate and spread, rather are determined by the issuer or agent and are based on current market conditions. Reference rate is as of reset date, which may vary by security. These securities may not indicate a reference rate and/or spread in their description. |
| • | Rate shown is the rate in effect as of period end. The rate may be based on a fixed rate, a capped rate or a floor rate and may convert to a variable or floating rate in the future. These securities do not indicate a reference rate and spread in their description. |
| Ø | Coupon represents a rate which changes periodically based on a predetermined schedule or event. Rate shown is the rate in effect as of period end. |
| (a) | Interest only security. |
| (c) | Principal amount of security is adjusted for inflation. |
| (d) | Perpetual maturity; date shown, if applicable, represents next contractual call date. |
| (e) | Contingent convertible security. |
| | | | | | |
| See Accompanying Notes | | ANNUAL REPORT | | DECEMBER 31, 2018 | | 91 |
Schedule of InvestmentsPIMCO Fixed Income SHares: Series R(Cont.)
BORROWINGS AND OTHER FINANCING TRANSACTIONS
(f) REPURCHASE AGREEMENTS:
| | | | | | | | | | | | | | | | | | | | | | | | | | | | |
| Counterparty | | Lending
Rate | | Settlement
Date | | | Maturity
Date | | | Principal
Amount | | | Collateralized By | | Collateral
(Received) | | | Repurchase
Agreements,
at Value | | | Repurchase
Agreement
Proceeds
to be
Received(1) | |
FICC | | 2.000% | | | 12/31/2018 | | | | 01/02/2019 | | | $ | 779 | | | U.S. Treasury Notes 2.875% due 09/30/2023 | | $ | (796 | ) | | $ | 779 | | | $ | 779 | |
| | | | | | | | | | | | | | | | | | | | | | | | | | | | |
Total Repurchase Agreements | | | | | $ | (796 | ) | | $ | 779 | | | $ | 779 | |
| | | | | | | | | | | | | | | | | | | | | | | | | | | | |
SALE-BUYBACK TRANSACTIONS:
| | | | | | | | | | | | | | | | | | | | |
| Counterparty | | Borrowing
Rate(2) | | | Borrowing
Date | | | Maturity
Date | | | Amount
Borrowed(2) | | | Payable for
Sale-Buyback
Transactions(3) | |
BCY | | | 2.570 | % | | | 11/19/2018 | | | | 01/18/2019 | | | $ | (3,467 | ) | | $ | (3,478 | ) |
BPG | | | 2.640 | | | | 11/29/2018 | | | | 01/29/2019 | | | | (32,170 | ) | | | (32,250 | ) |
MSC | | | 2.520 | | | | 11/06/2018 | | | | 01/07/2019 | | | | (3,872 | ) | | | (3,888 | ) |
| | | 2.670 | | | | 11/21/2018 | | | | 01/02/2019 | | | | (11,510 | ) | | | (11,546 | ) |
| | | 2.920 | | | | 12/12/2018 | | | | 01/02/2019 | | | | (7,157 | ) | | | (7,170 | ) |
| | | 2.960 | | | | 12/13/2018 | | | | 01/03/2019 | | | | (1,690 | ) | | | (1,693 | ) |
| | | 3.100 | | | | 12/18/2018 | | | | 01/02/2019 | | | | (1,706 | ) | | | (1,708 | ) |
| | | 3.140 | | | | 12/18/2018 | | | | 01/02/2019 | | | | (3,039 | ) | | | (3,042 | ) |
TDM | | | 2.500 | | | | 11/01/2018 | | | | 01/31/2019 | | | | (477 | ) | | | (479 | ) |
| | | 2.920 | | | | 12/11/2018 | | | | 01/02/2019 | | | | (17,754 | ) | | | (17,786 | ) |
| | | | | | | | | | | | | | | | | | | | |
Total Sale-Buyback Transactions | | | $ | (83,040 | ) |
| | | | | | | | | | | | | | | | | | | | |
BORROWINGS AND OTHER FINANCING TRANSACTIONS SUMMARY
The following is a summary by counterparty of the market value of Borrowings and Other Financing Transactions and collateral pledged/(received) as of December 31, 2018:
| | | | | | | | | | | | | | | | | | | | | | | | |
| Counterparty | | Repurchase
Agreement
Proceeds to be
Received(1) | | | Payable for
Reverse
Repurchase
Agreements | | | Payable for
Sale-Buyback
Transactions(3) | | | Total
Borrowings and
Other Financing
Transactions | | | Collateral
Pledged/
(Received) | | | Net Exposure(4) | |
Global/Master Repurchase Agreement | |
FICC | | $ | 779 | | | $ | 0 | | | $ | 0 | | | $ | 779 | | | $ | (796 | ) | | $ | (17 | ) |
| | | | |
Master Securities Forward Transaction Agreement | | | | | | | | | | | | | | | | | |
BCY | | | 0 | | | | 0 | | | | (3,478 | ) | | | (3,478 | ) | | | 3,481 | | | | 3 | |
BPG | | | 0 | | | | 0 | | | | (32,250 | ) | | | (32,250 | ) | | | 32,283 | | | | 33 | |
MSC | | | 0 | | | | 0 | | | | (29,047 | ) | | | (29,047 | ) | | | 28,805 | | | | (242 | ) |
TDM | | | 0 | | | | 0 | | | | (18,265 | ) | | | (18,265 | ) | | | 18,213 | | | | (52 | ) |
| | | | | | | | | | | | | | | | | | | | | | | | |
Total Borrowings and Other Financing Transactions | | $ | 779 | | | $ | 0 | | | $ | (83,040 | ) | | | | | | | | | | | | |
| | | | | | | | | | | | | | | | | | | | | | | | |
| | | | | | |
| 92 | | PIMCO MANAGED ACCOUNTS TRUST | | | | See Accompanying Notes |
December 31, 2018
CERTAIN TRANSFERS ACCOUNTED FOR AS SECURED BORROWINGS
Remaining Contractual Maturity of the Agreements
| | | | | | | | | | | | | | | | | | | | |
| | | Overnight and
Continuous | | | Up to 30 days | | | 31-90 days | | | Greater Than 90 days | | | Total | |
Sale-Buyback Transactions | |
U.S. Treasury Obligations | | $ | 0 | | | $ | (82,561) | | | $ | (479) | | | $ | 0 | | | $ | (83,040) | |
| | | | | | | | | | | | | | | | | | | | |
Total Borrowings | | $ | 0 | | | $ | (82,561) | | | $ | (479) | | | $ | 0 | | | $ | (83,040) | |
| | | | | | | | | | | | | | | | | | | | |
Payable for sale-buyback financing transactions | | | $ | (83,040) | |
| | | | | | | | | | | | | | | | | | | | |
| (g) | Securities with an aggregate market value of $83,152 have been pledged as collateral under the terms of the above master agreements as of December 31, 2018. |
| (1) | Includes accrued interest. |
| (2) | The average amount of borrowings outstanding during the period ended December 31, 2018 was $(88,270) at a weighted average interest rate of 1.960%. Average borrowings may include sale-buyback transactions and reverse repurchase agreements, if held during the period. |
| (3) | Payable for sale-buyback transactions includes $(70) of deferred price drop. |
| (4) | Net Exposure represents the net receivable/(payable) that would be due from/to the counterparty in the event of default. Exposure from borrowings and other financing transactions can only be netted across transactions governed under the same master agreement with the same legal entity. See Note 8, Master Netting Arrangements, in the Notes to Financial Statements for more information regarding master netting arrangements. |
(h) FINANCIAL DERIVATIVE INSTRUMENTS: EXCHANGE-TRADED OR CENTRALLY CLEARED
PURCHASED OPTIONS:
OPTIONS ON EXCHANGE-TRADED FUTURES CONTRACTS
| | | | | | | | | | | | | | | | | | | | | | | | |
| Description | | Strike
Price | | | Expiration
Date | | | # of
Contracts | | | Notional
Amount | | | Cost | | | Market
Value | |
Put - CBOT U.S. Treasury10-Year Note March 2019 Futures | | $ | 106.000 | | | | 02/22/2019 | | | | 16 | | | $ | 16 | | | $ | 0 | | | $ | 0 | |
Put - CBOT U.S. Treasury10-Year Note March 2019 Futures | | | 106.500 | | | | 02/22/2019 | | | | 108 | | | | 108 | | | | 1 | | | | 0 | |
Put - CBOT U.S. Treasury10-Year Note March 2019 Futures | | | 110.500 | | | | 02/22/2019 | | | | 13 | | | | 13 | | | | 0 | | | | 0 | |
Put - CBOT U.S. Treasury10-Year Note March 2019 Futures | | | 112.500 | | | | 02/22/2019 | | | | 13 | | | | 13 | | | | 0 | | | | 0 | |
Call - CBOT U.S. Treasury30-Year Bond March 2019 Futures | | | 171.000 | | | | 02/22/2019 | | | | 60 | | | | 60 | | | | 1 | | | | 1 | |
Call - CBOT U.S. Treasury30-Year Bond March 2019 Futures | | | 174.000 | | | | 02/22/2019 | | | | 1 | | | | 1 | | | | 0 | | | | 0 | |
Call - CBOT U.S. Treasury30-Year Bond March 2019 Futures | | | 180.000 | | | | 02/22/2019 | | | | 7 | | | | 7 | | | | 0 | | | | 0 | |
Call - CBOT U.S. Treasury5-Year Note March 2019 Futures | | | 119.750 | | | | 02/22/2019 | | | | 3 | | | | 3 | | | | 0 | | | | 0 | |
Call - CBOT U.S. Treasury5-Year Note March 2019 Futures | | | 120.000 | | | | 02/22/2019 | | | | 49 | | | | 49 | | | | 1 | | | | 1 | |
Call - CBOT U.S. Treasury5-Year Note March 2019 Futures | | | 120.250 | | | | 02/22/2019 | | | | 31 | | | | 31 | | | | 0 | | | | 0 | |
Call - CBOT U.S. Treasury5-Year Note March 2019 Futures | | | 120.500 | | | | 02/22/2019 | | | | 3 | | | | 3 | | | | 0 | | | | 0 | |
Call - CBOT U.S. Treasury Ultra Long-Term Bond March 2019 Futures | | | 200.000 | | | | 02/22/2019 | | | | 1 | | | | 1 | | | | 0 | | | | 0 | |
| | | | | | | | | | | | | | | | | | | | | | | | |
Total Purchased Options | | | $ | 3 | | | $ | 2 | |
| | | | | | | | | | | | | | | | | | | | | | | | |
WRITTEN OPTIONS:
OPTIONS ON EXCHANGE-TRADED FUTURES CONTRACTS
| | | | | | | | | | | | | | | | | | | | | | | | |
| Description | | Strike
Price | | | Expiration
Date | | | # of
Contracts | | | Notional
Amount | | | Premiums
(Received) | | | Market
Value | |
Call - CBOT U.S. Treasury10-Year Note February 2019 Futures | | $ | 122.000 | | | | 01/25/2019 | | | | 6 | | | $ | 6 | | | $ | (3 | ) | | $ | (3 | ) |
Call - CBOT U.S. Treasury10-Year Note February 2019 Futures | | | 122.250 | | | | 01/25/2019 | | | | 8 | | | | 8 | | | | (3 | ) | | | (3 | ) |
| | | | | | |
| See Accompanying Notes | | ANNUAL REPORT | | DECEMBER 31, 2018 | | 93 |
Schedule of InvestmentsPIMCO Fixed Income SHares: Series R(Cont.)
| | | | | | | | | | | | | | | | | | | | | | | | |
| Description | | Strike
Price | | | Expiration
Date | | | # of
Contracts | | | Notional
Amount | | | Premiums
(Received) | | | Market
Value | |
Call - CBOT U.S. Treasury10-Year Note March 2019 Futures | | $ | 122.500 | | | | 02/22/2019 | | | | 11 | | | $ | 11 | | | $ | (5) | | | $ | (5) | |
Put - CBOT U.S. Treasury30-Year Bond February 2019 Futures | | | 141.000 | | | | 01/25/2019 | | | | 8 | | | | 8 | | | | (6) | | | | (1) | |
Call - CBOT U.S. Treasury30-Year Bond March 2019 Futures | | | 148.000 | | | | 02/22/2019 | | | | 6 | | | | 6 | | | | (4) | | | | (4) | |
Call - CBOT U.S. Treasury5-Year Note February 2019 Futures | | | 113.500 | | | | 01/25/2019 | | | | 23 | | | | 23 | | | | (8) | | | | (26) | |
| | | | | | | | | | | | | | | | | | | | | | | | |
Total Written Options | | | | $ (29) | | | | $ (42) | |
| | | | | | | | | | | | | | | | | | | | | | | | |
FUTURES CONTRACTS:
LONG FUTURES CONTRACTS
| | | | | | | | | | | | | | | | | | | | | | | | | | | | |
Description | | Expiration
Month | | | # of
Contracts | | | Notional
Amount | | | Unrealized
Appreciation/
(Depreciation) | | | Variation Margin | |
| | Asset | | | Liability | |
90-Day Eurodollar December Futures | | | 12/2019 | | | | 2 | | | | $ | | | | 487 | | | $ | (1 | ) | | $ | 0 | | | | $0 | |
90-Day Eurodollar June Futures | | | 06/2019 | | | | 181 | | | | | | | | 44,035 | | | | 98 | | | | 2 | | | | 0 | |
90-Day Eurodollar March Futures | | | 03/2019 | | | | 2 | | | | | | | | 486 | | | | (2 | ) | | | 0 | | | | 0 | |
90-Day Eurodollar September Futures | | | 09/2019 | | | | 2 | | | | | | | | 487 | | | | (1 | ) | | | 0 | | | | 0 | |
Call Options Strike @ EUR 113.900 onEuro-Schatz March 2019 Futures | | | 02/2019 | | | | 22 | | | | | | | | 0 | | | | 0 | | | | 0 | | | | 0 | |
Call Options Strike @ EUR 165.000 onEuro-OAT France Government10-Year Bond March 2019 Futures | | | 02/2019 | | | | 72 | | | | | | | | 1 | | | | 0 | | | | 0 | | | | 0 | |
Euro-Bund10-Year Bond March Futures | | | 03/2019 | | | | 29 | | | | | | | | 5,434 | | | | 64 | | | | 0 | | | | (6 | ) |
Put Options Strike @ EUR 148.000 on Euro-Bund10-Year Bond March 2019 Futures | | | 02/2019 | | | | 33 | | | | | | | | 0 | | | | 0 | | | | 0 | | | | 0 | |
U.S. Treasury10-Year Note March Futures | | | 03/2019 | | | | 115 | | | | | | | | 14,032 | | | | 347 | | | | 45 | | | | 0 | |
| | | | | | | | | | | | | | | | | | | | | | | | | | | | |
| | | | | | | | | | | | | | $ | 505 | | | $ | 47 | | | | $ (6 | ) |
| | | | | | | | | | | | | | | | | | | | | | | | | | | | |
SHORT FUTURES CONTRACTS
| | | | | | | | | | | | | | | | | | | | | | | | | | |
| Description | | Expiration
Month | | # of
Contracts | | | Notional
Amount | | | Unrealized
Appreciation/
(Depreciation) | | | Variation Margin | |
| | Asset | | | Liability | |
90-Day Eurodollar June Futures | | 06/2020 | | | 179 | | | $ | | | | | (43,633 | ) | | $ | (199 | ) | | $ | 0 | | | $ | (11 | ) |
Australia Government3-Year Note March Futures | | 03/2019 | | | 10 | | | | | | | | (790 | ) | | | (4 | ) | | | 0 | | | | (1 | ) |
Australia Government10-Year Bond March Futures | | 03/2019 | | | 7 | | | | | | | | (654 | ) | | | (7 | ) | | | 0 | | | | (3 | ) |
Euro-BTP Italy Government Bond March Futures | | 03/2019 | | | 25 | | | | | | | | (3,661 | ) | | | (84 | ) | | | 0 | | | | (2 | ) |
Euro-OAT France Government10-Year Bond March Futures | | 03/2019 | | | 54 | | | | | | | | (9,330 | ) | | | (58 | ) | | | 13 | | | | 0 | |
U.S. Treasury5-Year Note March Futures | | 03/2019 | | | 63 | | | | | | | | (7,225 | ) | | | (118 | ) | | | 0 | | | | (16 | ) |
U.S. Treasury10-Year Ultra March Futures | | 03/2019 | | | 29 | | | | | | | | (3,772 | ) | | | (122 | ) | | | 0 | | | | (13 | ) |
U.S. Treasury30-Year Bond March Futures | | 03/2019 | | | 68 | | | | | | | | (9,928 | ) | | | (421 | ) | | | 0 | | | | (32 | ) |
U.S. Treasury Ultra Long-Term Bond March Futures | | 03/2019 | | | 1 | | | | | | | | (161 | ) | | | (8 | ) | | | 0 | | | | (1 | ) |
United Kingdom Long Gilt March Futures | | 03/2019 | | | 57 | | | | | | | | (8,949 | ) | | | (74 | ) | | | 10 | | | | (29 | ) |
| | | | | | | | | | | | | | | | | | | | | | | | | | |
| | | | | | | | | | | | | | | | $ | (1,095 | ) | | $ | 23 | | | $ | (108 | ) |
| | | | | | | | | | | | | | | | | | | | | | | | | | |
Total Futures Contracts | | | $ | (590 | ) | | $ | 70 | | | $ | (114 | ) |
| | | | | | | | | | | | | | | | | | | | | | | | | | |
| | | | | | |
| 94 | | PIMCO MANAGED ACCOUNTS TRUST | | | | See Accompanying Notes |
December 31, 2018
SWAP AGREEMENTS:
CREDIT DEFAULT SWAPS ON CORPORATE ISSUES - SELL PROTECTION(1)
| | | | | | | | | | | | | | | | | | | | | | | | | | | | | | | | | | | | | | | | |
Reference
Entity | | Fixed
Receive
Rate | | | Payment
Frequency | | | Maturity
Date | | | Implied
Credit
Spread at
December 31,
2018(3) | | | Notional
Amount(4) | | | Premiums
Paid/
(Received) | | | Unrealized
Appreciation/
(Depreciation) | | | Market
Value(5) | | | Variation Margin | |
| | Asset | | | Liability | |
Daimler AG | | | 1.000 | % | | | Quarterly | | | | 12/20/2020 | | | | 0.442 | % | | | EUR 110 | | | $ | 2 | | | $ | (1 | ) | | $ | 1 | | | $ | 0 | | | $ | 0 | |
General Electric Co. | | | 1.000 | | | | Quarterly | | | | 12/20/2020 | | | | 1.653 | | | | $ 100 | | | | (3 | ) | | | 2 | | | | (1 | ) | | | 0 | | | | 0 | |
General Electric Co. | | | 1.000 | | | | Quarterly | | | | 12/20/2023 | | | | 2.039 | | | | 100 | | | | (5 | ) | | | 1 | | | | (4 | ) | | | 0 | | | | 0 | |
| | | | | | | | | | | | | | | | | | | | | | | | | | | | | | | | | | | | | | | | |
| | | | | | | | | | | | | | | | | | | | | | $ | (6 | ) | | $ | 2 | | | $ | (4 | ) | | $ | 0 | | | $ | 0 | |
| | | | | | | | | | | | | | | | | | | | | | | | | | | | | | | | | | | | | | | | |
CREDIT DEFAULT SWAPS ON CREDIT INDICES - BUY PROTECTION(2)
| | | | | | | | | | | | | | | | | | | | | | | | | | | | | | | | | | |
| Index/Tranches | | Fixed
(Pay) Rate | | | Payment
Frequency | | Maturity
Date | | | Notional
Amount(4) | | | Premiums
Paid/
(Received) | | | Unrealized
Appreciation/
(Depreciation) | | | Market
Value(5) | | | Variation Margin | |
| | Asset | | | Liability | |
iTraxx Europe Main 265-Year Index | | | (1.000)% | | | Quarterly | | | 12/20/2021 | | | | EUR 1,900 | | | $ | (34 | ) | | $ | (1 | ) | | $ | (35 | ) | | $ | 0 | | | $ | (3 | ) |
iTraxx Europe Main 285-Year Index | | | (1.000) | | | Quarterly | | | 12/20/2022 | | | | 5,200 | | | | (146 | ) | | | 67 | | | | (79 | ) | | | 0 | | | | (10 | ) |
| | | | | | | | | | | | | | | | | | | | | | | | | | | | | | | | | | |
| | | | | | | | | | | | | | | | $ | (180 | ) | | $ | 66 | | | $ | (114 | ) | | $ | 0 | | | $ | (13 | ) |
| | | | | | | | | | | | | | | | | | | | | | | | | | | | | | | | | | |
INTEREST RATE SWAPS
| | | | | | | | | | | | | | | | | | | | | | | | | | | | | | | | | | | | | | | | |
Pay/
Receive
Floating
Rate | | Floating Rate Index | | Fixed
Rate | | | Payment
Frequency | | Maturity
Date | | | Notional
Amount | | | Premiums
Paid/
(Received) | | | Unrealized
Appreciation/
(Depreciation) | | | Market
Value | | | Variation Margin | |
| | Asset | | | Liability | |
Receive | | 1-DayUSD-Federal Funds RateCompounded-OIS | | | 2.000 | % | | Annual | | | 12/15/2047 | | | | $ | | | | 1,190 | | | $ | 2 | | | $ | 129 | | | $ | 131 | | | $ | 0 | | | $ | (3 | ) |
Receive | | 1-DayUSD-Federal Funds RateCompounded-OIS | | | 2.428 | | | Annual | | | 12/20/2047 | | | | | | | | 1,100 | | | | 3 | | | | 21 | | | | 24 | | | | 0 | | | | (3 | ) |
Receive | | 3-Month NZD-BBR | | | 3.250 | | | Semi-Annual | | | 03/21/2028 | | | | NZD | | | | 1,200 | | | | 4 | | | | (54 | ) | | | (50 | ) | | | 0 | | | | (3 | ) |
Receive | | 3-Month USD-LIBOR | | | 1.750 | | | Semi-Annual | | | 06/20/2020 | | | | $ | | | | 10,580 | | | | 199 | | | | (47 | ) | | | 152 | | | | 0 | | | | 0 | |
Pay | | 3-Month USD-LIBOR | | | 2.250 | | | Semi-Annual | | | 12/16/2022 | | | | | | | | 7,200 | | | | 16 | | | | (105 | ) | | | (89 | ) | | | 11 | | | | 0 | |
Pay | | 3-Month USD-LIBOR | | | 2.250 | | | Semi-Annual | | | 12/20/2022 | | | | | | | | 4,700 | | | | 6 | | | | (64 | ) | | | (58 | ) | | | 7 | | | | 0 | |
Pay | | 3-Month USD-LIBOR | | | 2.000 | | | Semi-Annual | | | 06/20/2023 | | | | | | | | 6,100 | | | | (236 | ) | | | 87 | | | | (149 | ) | | | 11 | | | | 0 | |
Pay | | 3-Month USD-LIBOR | | | 2.678 | | | Semi-Annual | | | 10/25/2023 | | | | | | | | 2,000 | | | | 0 | | | | 10 | | | | 10 | | | | 4 | | | | 0 | |
Pay | | 3-Month USD-LIBOR | | | 2.670 | | | Semi-Annual | | | 11/19/2023 | | | | | | | | 2,000 | | | | 0 | | | | 9 | | | | 9 | | | | 4 | | | | 0 | |
Pay | | 3-Month USD-LIBOR | | | 2.681 | | | Semi-Annual | | | 12/12/2023 | | | | | | | | 2,000 | | | | 0 | | | | 9 | | | | 9 | | | | 4 | | | | 0 | |
Pay | | 3-Month USD-LIBOR | | | 2.500 | | | Semi-Annual | | | 12/19/2023 | | | | | | | | 3,000 | | | | (24 | ) | | | 12 | | | | (12 | ) | | | 6 | | | | 0 | |
Receive(6) | | 3-Month USD-LIBOR | | | 2.300 | | | Semi-Annual | | | 04/21/2026 | | | | | | | | 2,300 | | | | (10 | ) | | | 44 | | | | 34 | | | | 0 | | | | (7 | ) |
Receive(6) | | 3-Month USD-LIBOR | | | 2.300 | | | Semi-Annual | | | 04/27/2026 | | | | | | | | 5,900 | | | | (23 | ) | | | 112 | | | | 89 | | | | 0 | | | | (17 | ) |
Receive(6) | | 3-Month USD-LIBOR | | | 1.850 | | | Semi-Annual | | | 07/27/2026 | | | | | | | | 1,600 | | | | (3 | ) | | | 60 | | | | 57 | | | | 0 | | | | (4 | ) |
Receive(6) | | 3-Month USD-LIBOR | | | 2.000 | | | Semi-Annual | | | 07/27/2026 | | | | | | | | 11,500 | | | | 194 | | | | 141 | | | | 335 | | | | 0 | | | | (32 | ) |
Receive(6) | | 3-Month USD-LIBOR | | | 2.400 | | | Semi-Annual | | | 12/07/2026 | | | | | | | | 12,200 | | | | 112 | | | | 45 | | | | 157 | | | | 0 | | | | (34 | ) |
Receive | | 3-Month USD-LIBOR | | | 1.750 | | | Semi-Annual | | | 12/21/2026 | | | | | | | | 1,140 | | | | (32 | ) | | | 107 | | | | 75 | | | | 0 | | | | (4 | ) |
Receive(6) | | 3-Month USD-LIBOR | | | 3.100 | | | Semi-Annual | | | 04/17/2028 | | | | | | | | 6,980 | | | | (21 | ) | | | (58 | ) | | | (79 | ) | | | 0 | | | | (15 | ) |
Receive | | 3-Month USD-LIBOR | | | 2.250 | | | Semi-Annual | | | 06/20/2028 | | | | | | | | 2,100 | | | | 116 | | | | (36 | ) | | | 80 | | | | 0 | | | | (8 | ) |
Receive | | 3-Month USD-LIBOR | | | 2.765 | | | Semi-Annual | | | 07/18/2028 | | | | | | | | 3,300 | | | | 38 | | | | (78 | ) | | | (40 | ) | | | 0 | | | | (13 | ) |
Receive(6) | | 3-Month USD-LIBOR | | | 3.134 | | | Semi-Annual | | | 09/13/2028 | | | | | | | | 6,800 | | | | 0 | | | | (76 | ) | | | (76 | ) | | | 0 | | | | (14 | ) |
Receive | | 3-Month USD-LIBOR | | | 3.000 | | | Semi-Annual | | | 12/19/2048 | | | | | | | | 1,060 | | | | 63 | | | | (93 | ) | | | (30 | ) | | | 0 | | | | (6 | ) |
Receive(6) | | 6-Month GBP-LIBOR | | | 1.500 | | | Semi-Annual | | | 03/20/2029 | | | | GBP | | | | 7,630 | | | | 123 | | | | (174 | ) | | | (51 | ) | | | 0 | | | | (37 | ) |
| | | | | | |
| See Accompanying Notes | | ANNUAL REPORT | | DECEMBER 31, 2018 | | 95 |
Schedule of InvestmentsPIMCO Fixed Income SHares: Series R(Cont.)
| | | | | | | | | | | | | | | | | | | | | | | | | | | | | | | | | | | | | | | | | | |
Pay/
Receive
Floating
Rate | | Floating Rate Index | | Fixed
Rate | | | Payment
Frequency | | | Maturity
Date | | | Notional
Amount | | | Premiums
Paid/
(Received) | | | Unrealized
Appreciation/
(Depreciation) | | | Market
Value | | | Variation Margin | |
| | Asset | | | Liability | |
Receive(6) | | 6-Month GBP-LIBOR | | | 1.750 | % | | | Semi-Annual | | | | 03/20/2049 | | | | GBP | | | | 2,510 | | | $ | (77 | ) | | $ | (88 | ) | | $ | (165 | ) | | $ | 0 | | | $ | (28 | ) |
Receive | | 6-Month JPY-LIBOR | | | 0.300 | | | | Semi-Annual | | | | 09/20/2027 | | | | JPY | | | | 390,000 | | | | (7 | ) | | | (49 | ) | | | (56 | ) | | | 0 | | | | (1 | ) |
Receive | | 6-Month JPY-LIBOR | | | 0.300 | | | | Semi-Annual | | | | 03/20/2028 | | | | | | | | 170,000 | | | | (3 | ) | | | (20 | ) | | | (23 | ) | | | 0 | | | | 0 | |
Receive(6) | | 6-Month JPY-LIBOR | | | 0.450 | | | | Semi-Annual | | | | 03/20/2029 | | | | | | | | 180,000 | | | | (10 | ) | | | (32 | ) | | | (42 | ) | | | 0 | | | | (1 | ) |
Pay | | 28-Day MXN-TIIE | | | 9.182 | | | | Lunar | | | | 11/28/2028 | | | | MXN | | | | 19,600 | | | | 0 | | | | 24 | | | | 24 | | | | 6 | | | | 0 | |
Receive | | CPTFEMU | | | 1.535 | | | | Maturity | | | | 06/15/2023 | | | | EUR | | | | 2,400 | | | | 0 | | | | 46 | | | | 46 | | | | 3 | | | | 0 | |
Receive | | CPTFEMU | | | 1.535 | | | | Maturity | | | | 03/15/2028 | | | | | | | | 600 | | | | 0 | | | | 15 | | | | 15 | | | | 1 | | | | 0 | |
Receive | | CPTFEMU | | | 1.620 | | | | Maturity | | | | 05/15/2028 | | | | | | | | 620 | | | | 0 | | | | 20 | | | | 20 | | | | 1 | | | | 0 | |
Pay | | CPTFEMU | | | 1.710 | | | | Maturity | | | | 03/15/2033 | | | | | | | | 300 | | | | (1 | ) | | | (11 | ) | | | (12 | ) | | | 0 | | | | (1 | ) |
Receive | | CPTFEMU | | | 1.796 | | | | Maturity | | | | 11/15/2038 | | | | | | | | 470 | | | | 0 | | | | 18 | | | | 18 | | | | 1 | | | | 0 | |
Receive | | CPTFEMU | | | 1.808 | | | | Maturity | | | | 11/15/2038 | | | | | | | | 500 | | | | 0 | | | | 21 | | | | 21 | | | | 2 | | | | 0 | |
Receive | | CPTFEMU | | | 1.946 | | | | Maturity | | | | 03/15/2048 | | | | | | | | 300 | | | | 1 | | | | 17 | | | | 18 | | | | 2 | | | | 0 | |
Receive | | CPTFEMU | | | 1.945 | | | | Maturity | | | | 11/15/2048 | | | | | | | | 170 | | | | 0 | | | | 10 | | | | 10 | | | | 1 | | | | 0 | |
Receive | | CPTFEMU | | | 1.950 | | | | Maturity | | | | 11/15/2048 | | | | | | | | 250 | | | | 1 | | | | 14 | | | | 15 | | | | 1 | | | | 0 | |
Pay | | CPURNSA | | | 2.168 | | | | Maturity | | | | 07/15/2020 | | | | $ | | | | 1,700 | | | | 0 | | | | (18 | ) | | | (18 | ) | | | 1 | | | | 0 | |
Pay | | CPURNSA | | | 2.027 | | | | Maturity | | | | 11/23/2020 | | | | | | | | 1,400 | | | | 0 | | | | (10 | ) | | | (10 | ) | | | 0 | | | | 0 | |
Pay | | CPURNSA | | | 2.021 | | | | Maturity | | | | 11/25/2020 | | | | | | | | 1,300 | | | | 0 | | | | (9 | ) | | | (9 | ) | | | 0 | | | | 0 | |
Pay | | CPURNSA | | | 1.550 | | | | Maturity | | | | 07/26/2021 | | | | | | | | 900 | | | | 30 | | | | (15 | ) | | | 15 | | | | 1 | | | | 0 | |
Pay | | CPURNSA | | | 1.603 | | | | Maturity | | | | 09/12/2021 | | | | | | | | 770 | | | | 23 | | | | (13 | ) | | | 10 | | | | 0 | | | | 0 | |
Pay | | CPURNSA | | | 2.210 | | | | Maturity | | | | 02/05/2023 | | | | | | | | 3,240 | | | | 0 | | | | (62 | ) | | | (62 | ) | | | 0 | | | | (3 | ) |
Pay | | CPURNSA | | | 2.220 | | | | Maturity | | | | 04/13/2023 | | | | | | | | 2,240 | | | | 0 | | | | (49 | ) | | | (49 | ) | | | 0 | | | | (1 | ) |
Pay | | CPURNSA | | | 2.263 | | | | Maturity | | | | 04/27/2023 | | | | | | | | 720 | | | | 0 | | | | (18 | ) | | | (18 | ) | | | 0 | | | | 0 | |
Pay | | CPURNSA | | | 2.263 | | | | Maturity | | | | 05/09/2023 | | | | | | | | 510 | | | | 0 | | | | (12 | ) | | | (12 | ) | | | 0 | | | | 0 | |
Pay | | CPURNSA | | | 2.281 | | | | Maturity | | | | 05/10/2023 | | | | | | | | 770 | | | | 0 | | | | (20 | ) | | | (20 | ) | | | 0 | | | | (1 | ) |
Receive | | CPURNSA | | | 1.730 | | | | Maturity | | | | 07/26/2026 | | | | | | | | 900 | | | | (48 | ) | | | 27 | | | | (21 | ) | | | 1 | | | | 0 | |
Receive | | CPURNSA | | | 1.762 | | | | Maturity | | | | 08/30/2026 | | | | | | | | 1,100 | | | | (54 | ) | | | 34 | | | | (20 | ) | | | 1 | | | | 0 | |
Receive | | CPURNSA | | | 1.800 | | | | Maturity | | | | 09/12/2026 | | | | | | | | 1,900 | | | | (19 | ) | | | (10 | ) | | | (29 | ) | | | 3 | | | | 0 | |
Receive | | CPURNSA | | | 1.801 | | | | Maturity | | | | 09/12/2026 | | | | | | | | 770 | | | | (36 | ) | | | 24 | | | | (12 | ) | | | 1 | | | | 0 | |
Receive | | CPURNSA | | | 1.805 | | | | Maturity | | | | 09/12/2026 | | | | | | | | 600 | | | | (27 | ) | | | 18 | | | | (9 | ) | | | 1 | | | | 0 | |
Receive | | CPURNSA | | | 1.780 | | | | Maturity | | | | 09/15/2026 | | | | | | | | 1,300 | | | | (63 | ) | | | 40 | | | | (23 | ) | | | 2 | | | | 0 | |
Receive | | CPURNSA | | | 2.335 | | | | Maturity | | | | 02/05/2028 | | | | | | | | 1,650 | | | | 4 | | | | 57 | | | | 61 | | | | 4 | | | | 0 | |
Receive | | CPURNSA | | | 2.353 | | | | Maturity | | | | 05/09/2028 | | | | | | | | 510 | | | | 0 | | | | 20 | | | | 20 | | | | 1 | | | | 0 | |
Receive | | CPURNSA | | | 2.360 | | | | Maturity | | | | 05/09/2028 | | | | | | | | 770 | | | | 0 | | | | 31 | | | | 31 | | | | 1 | | | | 0 | |
Receive | | CPURNSA | | | 2.364 | | | | Maturity | | | | 05/10/2028 | | | | | | | | 770 | | | | 0 | | | | 32 | | | | 32 | | | | 1 | | | | 0 | |
Receive | | CPURNSA | | | 2.370 | | | | Maturity | | | | 06/06/2028 | | | | | | | | 2,200 | | | | 0 | | | | 88 | | | | 88 | | | | 4 | | | | 0 | |
Pay | | FRCPXTOB | | | 1.000 | | | | Maturity | | | | 04/15/2020 | | | | EUR | | | | 150 | | | | 0 | | | | (1 | ) | | | (1 | ) | | | 0 | | | | 0 | |
Pay | | FRCPXTOB | | | 1.160 | | | | Maturity | | | | 08/15/2020 | | | | | | | | 40 | | | | 0 | | | | 0 | | | | 0 | | | | 0 | | | | 0 | |
Pay | | FRCPXTOB | | | 1.345 | | | | Maturity | | | | 06/15/2021 | | | | | | | | 600 | | | | 0 | | | | (9 | ) | | | (9 | ) | | | 0 | | | | 0 | |
Receive | | FRCPXTOB | | | 1.575 | | | | Maturity | | | | 01/15/2028 | | | | | | | | 430 | | | | 0 | | | | 17 | | | | 17 | | | | 1 | | | | 0 | |
Receive | | FRCPXTOB | | | 1.590 | | | | Maturity | | | | 02/15/2028 | | | | | | | | 1,670 | | | | 0 | | | | 70 | | | | 70 | | | | 5 | | | | 0 | |
Receive | | FRCPXTOB | | | 1.606 | | | | Maturity | | | | 02/15/2028 | | | | | | | | 240 | | | | 0 | | | | 11 | | | | 11 | | | | 1 | | | | 0 | |
Receive | | FRCPXTOB | | | 1.621 | | | | Maturity | | | | 07/15/2028 | | | | | | | | 1,230 | | | | 0 | | | | 53 | | | | 53 | | | | 3 | | | | 0 | |
Receive | | UKRPI | | | 3.513 | | | | Maturity | | | | 09/15/2028 | | | | GBP | | | | 600 | | | | 0 | | | | (3 | ) | | | (3 | ) | | | 5 | | | | 0 | |
Receive | | UKRPI | | | 3.595 | | | | Maturity | | | | 11/15/2028 | | | | | | | | 290 | | | | 0 | | | | 3 | | | | 3 | | | | 2 | | | | 0 | |
Receive | | UKRPI | | | 3.603 | | | | Maturity | | | | 11/15/2028 | | | | | | | | 560 | | | | 0 | | | | 6 | | | | 6 | | | | 4 | | | | 0 | |
Receive | | UKRPI | | | 3.633 | | | | Maturity | | | | 12/15/2028 | | | | | | | | 600 | | | | 0 | | | | 8 | | | | 8 | | | | 4 | | | | 0 | |
Receive | | UKRPI | | | 3.718 | | | | Maturity | | | | 12/15/2028 | | | | | | | | 10 | | | | 0 | | | | 0 | | | | 0 | | | | 0 | | | | 0 | |
Receive | | UKRPI | | | 3.190 | | | | Maturity | | | | 04/15/2030 | | | | | | | | 1,500 | | | | (85 | ) | | | 18 | | | | (67 | ) | | | 13 | | | | 0 | |
Receive | | UKRPI | | | 3.350 | | | | Maturity | | | | 05/15/2030 | | | | | | | | 1,800 | | | | (18 | ) | | | 5 | | | | (13 | ) | | | 17 | | | | 0 | |
Receive | | UKRPI | | | 3.400 | | | | Maturity | | | | 06/15/2030 | | | | | | | | 1,000 | | | | 17 | | | | (16 | ) | | | 1 | | | | 9 | | | | 0 | |
Receive | | UKRPI | | | 3.325 | | | | Maturity | | | | 08/15/2030 | | | | | | | | 3,950 | | | | (39 | ) | | | (57 | ) | | | (96 | ) | | | 35 | | | | 0 | |
Receive | | UKRPI | | | 3.140 | | | | Maturity | | | | 04/15/2031 | | | | | | | | 40 | | | | (4 | ) | | | 0 | | | | (4 | ) | | | 0 | | | | 0 | |
Receive | | UKRPI | | | 3.470 | | | | Maturity | | | | 09/15/2032 | | | | | | | | 1,870 | | | | (2 | ) | | | (33 | ) | | | (35 | ) | | | 21 | | | | 0 | |
Receive | | UKRPI | | | 3.500 | | | | Maturity | | | | 09/15/2033 | | | | | | | | 190 | | | | 0 | | | | (3 | ) | | | (3 | ) | | | 2 | | | | 0 | |
Receive | | UKRPI | | | 3.579 | | | | Maturity | | | | 10/15/2033 | | | | | | | | 210 | | | | 0 | | | | 2 | | | | 2 | | | | 3 | | | | 0 | |
Receive | | UKRPI | | | 3.358 | | | | Maturity | | | | 04/15/2035 | | | | | | | | 700 | | | | (24 | ) | | | 7 | | | | (17 | ) | | | 10 | | | | 0 | |
Pay | | UKRPI | | | 3.585 | | | | Maturity | | | | 10/15/2046 | | | | | | | | 980 | | | | (73 | ) | | | 14 | | | | (59 | ) | | | 0 | | | | (28 | ) |
Pay | | UKRPI | | | 3.428 | | | | Maturity | | | | 03/15/2047 | | | | | | | | 1,210 | | | | 78 | | | | (11 | ) | | | 67 | | | | 0 | | | | (35 | ) |
| | | | | | | | | | | | | | | | | | | | | | | | | | | | | | | | | | | | | | | | | | |
| | | | | | | | | | | | | | | | | | | | | | | | $ | 91 | | | $ | 202 | | | $ | 293 | | | $ | 222 | | | $ | (299 | ) |
| | | | | | | | | | | | | | | | | | | | | | | | | | | | | | | | | | | | | | | | | | |
Total Swap Agreements | | | $ | (95 | ) | | $ | 270 | | | $ | 175 | | | $ | 222 | | | $ | (312 | ) |
| | | | | | | | | | | | | | | | | | | | | | | | | | | | | | | | | | | | | | | | | | |
| | | | | | |
| 96 | | PIMCO MANAGED ACCOUNTS TRUST | | | | See Accompanying Notes |
December 31, 2018
FINANCIAL DERIVATIVE INSTRUMENTS: EXCHANGE-TRADED OR CENTRALLY CLEARED SUMMARY
The following is a summary of the market value and variation margin of Exchange-Traded or Centrally Cleared Financial Derivative Instruments as of December 31, 2018:
| | | | | | | | | | | | | | | | | | | | | | | | | | | | | | | | | | |
| | | Financial Derivative Assets | | | | | | Financial Derivative Liabilities | |
| | | Market Value | | Variation Margin
Asset | | | | | | | | | Market Value | | | Variation Margin
Liability | | | | |
| | | Purchased
Options | | Futures | | | Swap
Agreements | | | Total | | | | | | Written
Options | | | Futures | | | Swap
Agreements | | | Total | |
Total Exchange-Traded or Centrally Cleared | | $ 2 | | $ | 70 | | | $ | 222 | | | $ | 294 | | | | | | | $ | (42) | | | | $ (114) | | | | $ (312) | | | | $ (468) | |
| | | | | | | | | | | | | | | | | | | | | | | | | | | | | | | | | | |
| (i) | Securities with an aggregate market value of $229 and cash of $2,670 have been pledged as collateral for exchange-traded and centrally cleared financial derivative instruments as of December 31, 2018. See Note 8, Master Netting Arrangements, in the Notes to Financial Statements for more information regarding master netting arrangements. |
| (1) | If the Portfolio is a seller of protection and a credit event occurs, as defined under the terms of that particular swap agreement, the Portfolio will either (i) pay to the buyer of protection an amount equal to the notional amount of the swap and take delivery of the referenced obligation or underlying securities comprising the referenced index or (ii) pay a net settlement amount in the form of cash, securities or other deliverable obligations equal to the notional amount of the swap less the recovery value of the referenced obligation or underlying securities comprising the referenced index. |
| (2) | If the Portfolio is a buyer of protection and a credit event occurs, as defined under the terms of that particular swap agreement, the Portfolio will either (i) receive from the seller of protection an amount equal to the notional amount of the swap and deliver the referenced obligation or underlying securities comprising the referenced index or (ii) receive a net settlement amount in the form of cash, securities or other deliverable obligations equal to the notional amount of the swap less the recovery value of the referenced obligation or underlying securities comprising the referenced index. |
| (3) | Implied credit spreads, represented in absolute terms, utilized in determining the market value of credit default swap agreements on issues as of period end serve as indicators of the current status of the payment/performance risk and represent the likelihood or risk of default for the credit derivative. The implied credit spread of a particular referenced entity reflects the cost of buying/selling protection and may include upfront payments required to be made to enter into the agreement. Wider credit spreads represent a deterioration of the referenced entity’s credit soundness and a greater likelihood or risk of default or other credit event occurring as defined under the terms of the agreement. |
| (4) | The maximum potential amount the Portfolio could be required to pay as a seller of credit protection or receive as a buyer of credit protection if a credit event occurs as defined under the terms of that particular swap agreement. |
| (5) | The prices and resulting values for credit default swap agreements serve as indicators of the current status of the payment/performance risk and represent the likelihood of an expected liability (or profit) for the credit derivative should the notional amount of the swap agreement be closed/sold as of the period end. Increasing market values, in absolute terms when compared to the notional amount of the swap, represent a deterioration of the referenced indices’ credit soundness and a greater likelihood or risk of default or other credit event occurring as defined under the terms of the agreement. |
| (6) | This instrument has a forward starting effective date. See Note 2, Securities Transactions and Investment Income, in the Notes to Financial Statements for further information. |
(j) FINANCIAL DERIVATIVE INSTRUMENTS: OVER THE COUNTER
FORWARD FOREIGN CURRENCY CONTRACTS:
| | | | | | | | | | | | | | | | | | | | | | | | | | | | |
| Counterparty | | Settlement
Month | | | Currency to
be Delivered | | | Currency to
be Received | | | Unrealized Appreciation/
(Depreciation) | |
| | Asset | | | Liability | |
BOA | | | 01/2019 | | | | ARS | | | | 2,837 | | | $ | | | | | 70 | | | $ | 0 | | | $ | (4 | ) |
| | | 01/2019 | | | | CAD | | | | 2,238 | | | | | | | | 1,681 | | | | 41 | | | | 0 | |
| | | 01/2019 | | | | DKK | | | | 12,153 | | | | | | | | 1,932 | | | | 67 | | | | 0 | |
| | | 01/2019 | | | | EUR | | | | 2,669 | | | | | | | | 3,047 | | | | 0 | | | | (13 | ) |
| | | | | | |
| See Accompanying Notes | | ANNUAL REPORT | | DECEMBER 31, 2018 | | 97 |
Schedule of InvestmentsPIMCO Fixed Income SHares: Series R(Cont.)
| | | | | | | | | | | | | | | | | | | | | | | | | | | | |
| Counterparty | | Settlement
Month | | | Currency to
be Delivered | | | Currency to
be Received | | | Unrealized Appreciation/
(Depreciation) | |
| | Asset | | | Liability | |
| | | 01/2019 | | | | GBP | | | | 319 | | | $ | | | | | 408 | | | $ | 1 | | | $ | 0 | |
| | | 01/2019 | | | | JPY | | | | 8,000 | | | | | | | | 71 | | | | 0 | | | | (2 | ) |
BPS | | | 01/2019 | | | | BRL | | | | 15,832 | | | | | | | | 4,271 | | | | 186 | | | | 0 | |
| | | 01/2019 | | | $ | | | | | 135 | | | | ARS | | | | 5,218 | | | | 3 | | | | 0 | |
| | | 01/2019 | | | | | | | | 4,083 | | | | BRL | | | | 15,832 | | | | 3 | | | | (1 | ) |
CBK | | | 01/2019 | | | | AUD | | | | 5,694 | | | $ | | | | | 4,171 | | | | 160 | | | | 0 | |
| | | 01/2019 | | | | BRL | | | | 4,391 | | | | | | | | 1,155 | | | | 22 | | | | 0 | |
| | | 01/2019 | | | $ | | | | | 1,133 | | | | BRL | | | | 4,391 | | | | 0 | | | | 0 | |
| | | 01/2019 | | | | | | | | 344 | | | | GBP | | | | 270 | | | | 0 | | | | 0 | |
| | | 02/2019 | | | | | | | | 742 | | | | COP | | | | 2,348,420 | | | | 0 | | | | (20 | ) |
| | | 03/2019 | | | | KRW | | | | 731,536 | | | $ | | | | | 653 | | | | 0 | | | | (5 | ) |
DUB | | | 01/2019 | | | | BRL | | | | 6,064 | | | | | | | | 1,568 | | | | 3 | | | | 0 | |
| | | 01/2019 | | | $ | | | | | 1,575 | | | | BRL | | | | 6,064 | | | | 0 | | | | (10 | ) |
| | | 02/2019 | | | | BRL | | | | 6,064 | | | $ | | | | | 1,572 | | | | 10 | | | | 0 | |
| | | 02/2019 | | | $ | | | | | 1,187 | | | | BRL | | | | 4,599 | | | | 0 | | | | (3 | ) |
GLM | | | 01/2019 | | | | BRL | | | | 5,818 | | | $ | | | | | 1,501 | | | | 0 | | | | 0 | |
| | | 01/2019 | | | | GBP | | | | 4,188 | | | | | | | | 5,356 | | | | 15 | | | | 0 | |
| | | 01/2019 | | | $ | | | | | 1,506 | | | | BRL | | | | 5,818 | | | | 1 | | | | (6 | ) |
| | | 01/2019 | | | | | | | | 991 | | | | EUR | | | | 870 | | | | 7 | | | | 0 | |
| | | 01/2019 | | | | | | | | 138 | | | | GBP | | | | 109 | | | | 1 | | | | 0 | |
| | | 01/2019 | | | | | | | | 627 | | | | RUB | | | | 41,533 | | | | 0 | | | | (33 | ) |
| | | 03/2019 | | | | | | | | 503 | | | | IDR | | | | 7,387,126 | | | | 7 | | | | 0 | |
| | | 04/2019 | | | | BRL | | | | 1,230 | | | $ | | | | | 315 | | | | 0 | | | | (1 | ) |
HUS | | | 01/2019 | | | | | | | | 853 | | | | | | | | 220 | | | | 0 | | | | (1 | ) |
| | | 01/2019 | | | | PLN | | | | 446 | | | | | | | | 121 | | | | 2 | | | | 0 | |
| | | 01/2019 | | | $ | | | | | 220 | | | | BRL | | | | 853 | | | | 0 | | | | 0 | |
| | | 04/2019 | | | | CNH | | | | 5,177 | | | $ | | | | | 739 | | | | 0 | | | | (14 | ) |
IND | | | 01/2019 | | | | NZD | | | | 2,425 | | | | | | | | 1,650 | | | | 22 | | | | 0 | |
| | | 01/2019 | | | $ | | | | | 1,079 | | | | JPY | | | | 122,300 | | | | 37 | | | | 0 | |
JPM | | | 01/2019 | | | | BRL | | | | 18,500 | | | $ | | | | | 4,982 | | | | 209 | | | | 0 | |
| | | 01/2019 | | | | MXN | | | | 3,230 | | | | | | | | 169 | | | | 5 | | | | 0 | |
| | | 01/2019 | | | $ | | | | | 4,741 | | | | BRL | | | | 18,500 | | | | 32 | | | | 0 | |
| | | 04/2019 | | | | | | | | 727 | | | | CNH | | | | 5,017 | | | | 3 | | | | 0 | |
MYI | | | 01/2019 | | | | BRL | | | | 13,885 | | | $ | | | | | 3,580 | | | | 1 | | | | (4 | ) |
| | | 01/2019 | | | $ | | | | | 3,614 | | | | BRL | | | | 13,885 | | | | 16 | | | | (47 | ) |
| | | 02/2019 | | | | | | | | 310 | | | | | | | | 1,219 | | | | 4 | | | | 0 | |
SCX | | | 01/2019 | | | | BRL | | | | 8,000 | | | $ | | | | | 2,143 | | | | 79 | | | | 0 | |
| | | 01/2019 | | | $ | | | | | 2,049 | | | | BRL | | | | 8,000 | | | | 15 | | | | 0 | |
SSB | | | 03/2019 | | | | SGD | | | | 454 | | | $ | | | | | 332 | | | | 0 | | | | (1 | ) |
| | | 03/2019 | | | | TWD | | | | 10,068 | | | | | | | | 329 | | | | 0 | | | | 0 | |
UAG | | | 01/2019 | | | $ | | | | | 1,855 | | | | DKK | | | | 12,152 | | | | 10 | | | | 0 | |
| | | 04/2019 | | | | DKK | | | | 12,152 | | | $ | | | | | 1,870 | | | | 0 | | | | (10 | ) |
| | | | | | | | | | | | | | | | | | | | | | | | | | | | |
Total Forward Foreign Currency Contracts | | | $ | 962 | | | $ | (175 | ) |
| | | | | | | | | | | | | | | | | | | | | | | | | | | | |
PURCHASED OPTIONS:
CREDIT DEFAULT SWAPTIONS ON CREDIT INDICES
| | | | | | | | | | | | | | | | | | | | | | | | | | | | |
| Counterparty | | Description | | Buy/Sell
Protection | | Exercise
Rate | | | Expiration
Date | | | Notional
Amount | | | Cost | | | Market
Value | |
| FBF | | Put - OTCCDX.IG-315-Year Index | | Buy | | | 1.600 | % | | | 01/16/2019 | | | $ | | | | | 17,200 | | | $ | 2 | | | $ | 0 | |
| GST | | Put - OTCCDX.IG-315-Year Index | | Buy | | | 2.000 | | | | 02/20/2019 | | | | | | | | 3,900 | | | | 0 | | | | 0 | |
| | | | | | | | | | | | | | | | | | | | | | | | | | | | |
| | | | | | | | | | | | | | | | | | | | $ | 2 | | | $ | 0 | |
| | | | | | | | | | | | | | | | | | | | | | | | | | |
| | | | | | |
| 98 | | PIMCO MANAGED ACCOUNTS TRUST | | | | See Accompanying Notes |
December 31, 2018
FOREIGN CURRENCY OPTIONS
| | | | | | | | | | | | | | | | | | | | | | |
| Counterparty | | Description | | Strike
Price | | | Expiration
Date | | | Notional
Amount | | | Cost | | | Market
Value | |
| HUS | | Call - OTC AUD versus USD | | $ | 0.799 | | | | 02/25/2019 | | | | AUD 2,200 | | | $ | 0 | | | $ | 0 | |
| | | | | | | | | | | | | | | | | | | | | | |
OPTIONS ON SECURITIES
| | | | | | | | | | | | | | | | | | | | | | |
| Counterparty | | Description | | Strike
Price | | | Expiration
Date | | | Notional
Amount | | | Cost | | | Market
Value | |
| JPM | | Put - OTC Fannie Mae, TBA 3.500% due 01/01/2049 | | $ | 69.000 | | | | 01/07/2019 | | | $ | 11,200 | | | $ | 1 | | | $ | 0 | |
| | Put - OTC Fannie Mae, TBA 4.000% due 01/01/2049 | | | 70.000 | | | | 01/07/2019 | | | | 9,800 | | | | 0 | | | | 0 | |
| | | | | | | | | | | | | | | | | | | | | | |
| | | | | | | | | | | | | | $ | 1 | | | $ | 0 | |
| | | | | | | | | | | | | | | | | | | | | | |
Total Purchased Options | | | $ | 3 | | | $ | 0 | |
| | | | | | | | | | | | | | | | | | | | | | |
WRITTEN OPTIONS:
CREDIT DEFAULT SWAPTIONS ON CREDIT INDICES
| | | | | | | | | | | | | | | | | | | | | | | | | | | | | | |
| Counterparty | | Description | | Buy/Sell
Protection | | | Exercise
Rate | | | Expiration
Date | | | Notional
Amount | | | Premiums
(Received) | | | Market
Value | |
| BOA | | Put - OTCCDX.IG-315-Year Index | | | Sell | | | | 0.850 | % | | | 01/16/2019 | | | | $ | | | | 800 | | | $ | (1 | ) | | $ | (2 | ) |
| | Put - OTCCDX.IG-315-Year Index | | | Sell | | | | 0.900 | | | | 01/16/2019 | | | | | | | | 1,400 | | | | (2 | ) | | | (2 | ) |
| | Put - OTCCDX.IG-315-Year Index | | | Sell | | | | 0.950 | | | | 02/20/2019 | | | | | | | | 800 | | | | (2 | ) | | | (2 | ) |
| | Put - OTCCDX.IG-315-Year Index | | | Sell | | | | 1.000 | | | | 02/20/2019 | | | | | | | | 1,000 | | | | (2 | ) | | | (2 | ) |
| | Put - OTCCDX.IG-315-Year Index | | | Sell | | | | 1.100 | | | | 02/20/2019 | | | | | | | | 400 | | | | (1 | ) | | | (1 | ) |
| | Put - OTCCDX.IG-315-Year Index | | | Sell | | | | 1.000 | | | | 03/20/2019 | | | | | | | | 800 | | | | (1 | ) | | | (2 | ) |
| | Put - OTCCDX.IG-315-Year Index | | | Sell | | | | 1.200 | | | | 03/20/2019 | | | | | | | | 1,100 | | | | (1 | ) | | | (2 | ) |
| BPS | | Put - OTCCDX.IG-315-Year Index | | | Sell | | | | 1.000 | | | | 02/20/2019 | | | | | | | | 600 | | | | (1 | ) | | | (1 | ) |
| BRC | | Put - OTCCDX.IG-315-Year Index | | | Sell | | | | 1.000 | | | | 01/16/2019 | | | | | | | | 700 | | | | (1 | ) | | | 0 | |
| | Put - OTCCDX.IG-315-Year Index | | | Sell | | | | 1.050 | | | | 02/20/2019 | | | | | | | | 600 | | | | (1 | ) | | | (1 | ) |
| | Put - OTCCDX.IG-315-Year Index | | | Sell | | | | 1.100 | | | | 03/20/2019 | | | | | | | | 300 | | | | (1 | ) | | | (1 | ) |
| CBK | | Put - OTCCDX.IG-315-Year Index | | | Sell | | | | 0.950 | | | | 01/16/2019 | | | | | | | | 700 | | | | (1 | ) | | | (1 | ) |
| | Put - OTCCDX.IG-315-Year Index | | | Sell | | | | 1.000 | | | | 01/16/2019 | | | | | | | | 3,000 | | | | (2 | ) | | | (2 | ) |
| | Put - OTCCDX.IG-315-Year Index | | | Sell | | | | 0.950 | | | | 02/20/2019 | | | | | | | | 1,300 | | | | (3 | ) | | | (4 | ) |
| | Put - OTCCDX.IG-315-Year Index | | | Sell | | | | 1.050 | | | | 02/20/2019 | | | | | | | | 500 | | | | (1 | ) | | | (1 | ) |
| | Put - OTCCDX.IG-315-Year Index | | | Sell | | | | 1.100 | | | | 02/20/2019 | | | | | | | | 400 | | | | 0 | | | | (1 | ) |
| | Put - OTCCDX.IG-315-Year Index | | | Sell | | | | 1.050 | | | | 03/20/2019 | | | | | | | | 700 | | | | (1 | ) | | | (2 | ) |
| | Put - OTCCDX.IG-315-Year Index | | | Sell | | | | 1.100 | | | | 03/20/2019 | | | | | | | | 700 | | | | (2 | ) | | | (2 | ) |
| | Put - OTCCDX.IG-315-Year Index | | | Sell | | | | 1.200 | | | | 03/20/2019 | | | | | | | | 800 | | | | (1 | ) | | | (1 | ) |
| GST | | Put - OTCCDX.IG-315-Year Index | | | Sell | | | | 0.900 | | | | 01/16/2019 | | | | | | | | 1,300 | | | | (2 | ) | | | (2 | ) |
| | Put - OTCCDX.IG-315-Year Index | | | Sell | | | | 1.100 | | | | 02/20/2019 | | | | | | | | 400 | | | | 0 | | | | (1 | ) |
| | Put - OTCCDX.IG-315-Year Index | | | Sell | | | | 2.400 | | | | 09/18/2019 | | | | | | | | 800 | | | | (1 | ) | | | (1 | ) |
| | Put - OTC iTraxx Europe 305-Year Index | | | Sell | | | | 2.400 | | | | 09/18/2019 | | | | EUR | | | | 200 | | | | 0 | | | | 0 | |
| JPM | | Put - OTCCDX.IG-315-Year Index | | | Sell | | | | 0.950 | | | | 02/20/2019 | | | | $ | | | | 700 | | | | (1 | ) | | | (2 | ) |
| | Put - OTCCDX.IG-315-Year Index | | | Sell | | | | 1.200 | | | | 03/20/2019 | | | | | | | | 600 | | | | (1 | ) | | | (1 | ) |
| MYC | | Put - OTCCDX.IG-315-Year Index | | | Sell | | | | 0.900 | | | | 01/16/2019 | | | | | | | | 700 | | | | (1 | ) | | | (1 | ) |
| | | | | | | | | | | | | | | | | | | | | | | | | | | | | | |
| | | | | | | | | | | | | | | | | | | | | | $ | (31 | ) | | $ | (38 | ) |
| | | | | | | | | | | | | | | | | | | | | | | | | | | | | | |
FOREIGN CURRENCY OPTIONS
| | | | | | | | | | | | | | | | | | | | | | | | | | | | | | |
| Counterparty | | Description | | Strike
Price | | | Expiration
Date | | | Notional
Amount | | | Premiums
(Received) | | | Market
Value | |
| HUS | | Put - OTC EUR versus USD | | $ | | | | | 1.100 | | | | 02/13/2019 | | | | EUR | | | | 1,078 | | | $ | (6 | ) | | $ | (1 | ) |
| | | | | | | | | | | | | | | | | | | | | | | | | | | | | | |
| | | | | | |
| See Accompanying Notes | | ANNUAL REPORT | | DECEMBER 31, 2018 | | 99 |
Schedule of InvestmentsPIMCO Fixed Income SHares: Series R(Cont.)
INFLATION-CAPPED OPTIONS
| | | | | | | | | | | | | | | | | | | | | | | | |
| Counterparty | | Description | | Initial
Index | | | Floating Rate | | Expiration
Date(1) | | | Notional
Amount | | | Premiums
(Received) | | | Market
Value | |
| CBK | | Floor - OTC
CPURNSA | | | 216.687 | | | Maximum of [(1 + 0.000%)10 - (Final Index/Initial Index)] or 0 | | | 04/07/2020 | | | | $ 32,200 | | | $ | (287 | ) | | $ | 0 | |
| | Floor - OTC
CPURNSA | | | 217.965 | | | Maximum of [(1 + 0.000%)10 - (Final Index/Initial Index)] or 0 | | | 09/29/2020 | | | | 1,500 | | | | (19 | ) | | | 0 | |
| GLM | | Cap -OTC
CPALEMU | | | 100.151 | | | Maximum of [(Final Index/Initial Index - 1) - 3.000%] or 0 | | | 06/22/2035 | | | | EUR 1,200 | | | | (55 | ) | | | (5 | ) |
| JPM | | Cap - OTC
CPURNSA | | | 233.916 | | | Maximum of [(Final Index/Initial Index - 1) - 4.000%] or 0 | | | 04/22/2024 | | | | $ 6,500 | | | | (47 | ) | | | 0 | |
| | Cap - OTC
CPURNSA | | | 234.781 | | | Maximum of [(Final Index/Initial Index - 1) - 4.000%] or 0 | | | 05/16/2024 | | | | 500 | | | | (4 | ) | | | 0 | |
| | Floor - OTC
YOY CPURNSA | | | 234.812 | | | Maximum of [0.000% - (Final Index/Initial Index - 1)] or 0 | | | 03/24/2020 | | | | 4,800 | | | | (54 | ) | | | (2 | ) |
| | Floor - OTC
YOY CPURNSA | | | 238.654 | | | Maximum of [0.000% - (Final Index/Initial Index - 1)] or 0 | | | 10/02/2020 | | | | 2,100 | | | | (39 | ) | | | (2 | ) |
| | | | | | | | | | | | | | | | | | | | | | | | |
| | | | | | | | | | | | | | | | $ | (505 | ) | | $ | (9 | ) |
| | | | | | | | | | | | | | | | | | | | | | | | |
INTEREST RATE-CAPPED OPTIONS
| | | | | | | | | | | | | | | | | | | | | | | | |
| Counterparty | | Description | | Exercise
Rate | | | Floating Rate Index | | Expiration
Date | | | Notional
Amount | | | Premiums
(Received) | | | Market
Value | |
| MYC | | Call - OTC1-Year Interest Rate Floor(2) | | | 0.000% | | | 10-YearUSD-ISDA -2-Year USD-ISDA | | | 01/02/2020 | | | $ | 25,000 | | | $ | (20 | ) | | $ | (12 | ) |
| | | | | | | | | | | | | | | | | | | | | | | | |
Total Written Options | | | $ | (562 | ) | | $ | (60 | ) |
| | | | | | | | | | | | | | | | | | | | | | | | |
SWAP AGREEMENTS:
CREDIT DEFAULT SWAPS ON CREDIT INDICES - SELL PROTECTION(3)
| | | | | | | | | | | | | | | | | | | | | | | | | | | | | | | | | | |
Counterparty | | Index/Tranches | | Fixed
Receive
Rate | | | Payment
Frequency | | | Maturity
Date | | | Notional
Amount(4) | | | Premiums
Paid/
(Received) | | | Unrealized
Appreciation/
(Depreciation) | | | Swap
Agreements,
at Value(5) | |
| | Asset | | | Liability | |
DUB | | CMBX.NA.AAA.7 Index | | | 0.500 | % | | | Monthly | | | | 01/17/2047 | | | $ | 220 | | | $ | (7 | ) | | $ | 8 | | | $ | 1 | | | $ | 0 | |
| | CMBX.NA.AAA.8 Index | | | 0.500 | | | | Monthly | | | | 10/17/2057 | | | | 500 | | | | (22 | ) | | | 23 | | | | 1 | | | | 0 | |
MYC | | CMBX.NA.AAA.7 Index | | | 0.500 | | | | Monthly | | | | 01/17/2047 | | | | 180 | | | | (6 | ) | | | 7 | | | | 1 | | | | 0 | |
| | | | | | | | | | | | | | | | | | | | | | | | | | | | | | | | | | |
| | | | | | | | | | | | | | | | | | $ | (35 | ) | | $ | 38 | | | $ | 3 | | | $ | 0 | |
| | | | | | | | | | | | | | | | | | | | | | | | | | | | | | | | | | |
INTEREST RATE SWAPS
| | | | | | | | | | | | | | | | | | | | | | | | | | | | | | | | | | | | | | |
| Counterparty | | Pay/
Receive
Floating
Rate | | Floating
Rate Index | | Fixed
Rate | | | Payment
Frequency | | Maturity
Date | | | Notional
Amount | | | Premiums
Paid/
(Received) | | | Unrealized
Appreciation/
(Depreciation) | | | Swap
Agreements,
at Value | |
| | Asset | | | Liability | |
BOA | | Pay | | CPURNSA | | | 1.560% | | | Maturity | | | 12/17/2020 | | | | $ | | | | 1,700 | | | $ | 0 | | | $ | 19 | | | $ | 19 | | | $ | 0 | |
BRC | | Receive | | 1-YearILS-TELBOR | | | 0.374 | | | Annual | | | 06/20/2020 | | | | ILS | | | | 2,240 | | | | 0 | | | | 1 | | | | 1 | | | | 0 | |
| | Pay | | 1-YearILS-TELBOR | | | 1.950 | | | Annual | | | 06/20/2028 | | | | | | | | 480 | | | | 0 | | | | (1 | ) | | | 0 | | | | (1 | ) |
DUB | | Pay | | CPURNSA | | | 2.500 | | | Maturity | | | 07/15/2022 | | | | $ | | | | 5,000 | | | | 103 | | | | (618 | ) | | | 0 | | | | (515 | ) |
GLM | | Receive | | 1-YearILS-TELBOR | | | 0.290 | | | Annual | | | 02/16/2020 | | | | ILS | | | | 4,230 | | | | 0 | | | | 1 | | | | 1 | | | | 0 | |
| | | | | | |
| 100 | | PIMCO MANAGED ACCOUNTS TRUST | | | | See Accompanying Notes |
December 31, 2018
| | | | | | | | | | | | | | | | | | | | | | | | | | | | | | | | | | | | | | | | |
| Counterparty | | Pay/
Receive
Floating
Rate | | Floating
Rate Index | | Fixed
Rate | | | Payment
Frequency | | | Maturity
Date | | | Notional
Amount | | | Premiums
Paid/
(Received) | | | Unrealized
Appreciation/
(Depreciation) | | | Swap
Agreements,
at Value | |
| | Asset | | | Liability | |
| | Receive | | 1-YearILS-TELBOR | | | 0.370% | | | | Annual | | | | 06/20/2020 | | | | ILS | | | | 1,740 | | | $ | 0 | | | $ | 1 | | | $ | 1 | | | $ | 0 | |
| | Pay | | 1-YearILS-TELBOR | | | 1.971 | | | | Annual | | | | 02/16/2028 | | | | | | | | 890 | | | | 0 | | | | 1 | | | | 1 | | | | 0 | |
| | Pay | | 1-YearILS-TELBOR | | | 1.998 | | | | Annual | | | | 06/20/2028 | | | | | | | | 370 | | | | 0 | | | | 0 | | | | 0 | | | | 0 | |
JPM | | Receive | | 1-YearILS-TELBOR | | | 0.420 | | | | Annual | | | | 06/20/2020 | | | | | | | | 2,150 | | | | 0 | | | | 1 | | | | 1 | | | | 0 | |
| | Pay | | 1-YearILS-TELBOR | | | 2.078 | | | | Annual | | | | 06/20/2028 | | | | | | | | 460 | | | | 0 | | | | 1 | | | | 1 | | | | 0 | |
MYC | | Pay | | CPURNSA | | | 1.548 | | | | Maturity | | | | 12/21/2020 | | | | $ | | | | 4,000 | | | | 0 | | | | 47 | | | | 47 | | | | 0 | |
| | Pay | | CPURNSA | | | 1.800 | | | | Maturity | | | | 07/20/2026 | | | | | | | | 600 | | | | 0 | | | | (10 | ) | | | 0 | | | | (10 | ) |
| | Pay | | CPURNSA | | | 1.805 | | | | Maturity | | | | 09/20/2026 | | | | | | | | 300 | | | | 0 | | | | (5 | ) | | | 0 | | | | (5 | ) |
| | | | | | | | | | | | | | | | | | | | | | | | | | | | | | | | | | | | | | | | |
| | | | | | | | | | | | | | | | | | | | | | | | | | $ | 103 | | | $ | (562 | ) | | $ | 72 | | | $ | (531 | ) |
| | | | | | | | | | | | | | | | | | | | | | | | | | | | | | | | | | | | | | | | |
Total Swap Agreements | | | $ | 68 | | | $ | (524 | ) | | $ | 75 | | | $ | (531 | ) |
| | | | | | | | | | | | | | | | | | | | | | | | | | | | | | | | | | | | | | | | |
FINANCIAL DERIVATIVE INSTRUMENTS: OVER THE COUNTER SUMMARY
The following is a summary by counterparty of the market value of OTC financial derivative instruments and collateral pledged/(received) as of December 31, 2018:
| | | | | | | | | | | | | | | | | | | | | | | | | | | | | | | | | | | | | | | | | | | | | | | | |
| | | Financial Derivative Assets | | | | | | Financial Derivative Liabilities | | | | | | | | | | |
| Counterparty | | Forward
Foreign
Currency
Contracts | | | Purchased
Options | | | Swap
Agreements | | | Total
Over the
Counter | | | | | | Forward
Foreign
Currency
Contracts | | | Written
Options | | | Swap
Agreements | | | Total
Over the
Counter | | | Net Market
Value of OTC
Derivatives | | | Collateral
Pledged/
(Received) | | | Net
Exposure(6) | |
BOA | | $ | 109 | | | $ | 0 | | | $ | 19 | | | $ | 128 | | | | | | | $ | (19 | ) | | $ | (13 | ) | | $ | 0 | | | $ | (32 | ) | | $ | 96 | | | $ | 0 | | | $ | 96 | |
BPS | | | 192 | | | | 0 | | | | 0 | | | | 192 | | | | | | | | (1 | ) | | | (1 | ) | | | 0 | | | | (2 | ) | | | 190 | | | | (10 | ) | | | 180 | |
BRC | | | 0 | | | | 0 | | | | 1 | | | | 1 | | | | | | | | 0 | | | | (2 | ) | | | (1 | ) | | | (3 | ) | | | (2 | ) | | | 0 | | | | (2 | ) |
CBK | | | 182 | | | | 0 | | | | 0 | | | | 182 | | | | | | | | (25 | ) | | | (14 | ) | | | 0 | | | | (39 | ) | | | 143 | | | | 0 | | | | 143 | |
DUB | | | 13 | | | | 0 | | | | 2 | | | | 15 | | | | | | | | (13 | ) | | | 0 | | | | (515 | ) | | | (528 | ) | | | (513 | ) | | | 328 | | | | (185 | ) |
GLM | | | 31 | | | | 0 | | | | 3 | | | | 34 | | | | | | | | (40 | ) | | | (5 | ) | | | 0 | | | | (45 | ) | | | (11 | ) | | | 0 | | | | (11 | ) |
GST | | | 0 | | | | 0 | | | | 0 | | | | 0 | | | | | | | | 0 | | | | (4 | ) | | | 0 | | | | (4 | ) | | | (4 | ) | | | 0 | | | | (4 | ) |
HUS | | | 2 | | | | 0 | | | | 0 | | | | 2 | | | | | | | | (15 | ) | | | (1 | ) | | | 0 | | | | (16 | ) | | | (14 | ) | | | 0 | | | | (14 | ) |
IND | | | 59 | | | | 0 | | | | 0 | | | | 59 | | | | | | | | 0 | | | | 0 | | | | 0 | | | | 0 | | | | 59 | | | | 0 | | | | 59 | |
JPM | | | 249 | | | | 0 | | | | 2 | | | | 251 | | | | | | | | 0 | | | | (7 | ) | | | 0 | | | | (7 | ) | | | 244 | | | | (270 | ) | | | (26 | ) |
MYI | | | 21 | | | | 0 | | | | 0 | | | | 21 | | | | | | | | (51 | ) | | | 0 | | | | 0 | | | | (51 | ) | | | (30 | ) | | | 0 | | | | (30 | ) |
MYC | | | 0 | | | | 0 | | | | 48 | | | | 48 | | | | | | | | 0 | | | | (13 | ) | | | (15 | ) | | | (28 | ) | | | 20 | | | | 0 | | | | 20 | |
SCX | | | 94 | | | | 0 | | | | 0 | | | | 94 | | | | | | | | 0 | | | | 0 | | | | 0 | | | | 0 | | | | 94 | | | | 0 | | | | 94 | |
SSB | | | 0 | | | | 0 | | | | 0 | | | | 0 | | | | | | | | (1 | ) | | | 0 | | | | 0 | | | | (1 | ) | | | (1 | ) | | | 0 | | | | (1 | ) |
UAG | | | 10 | | | | 0 | | | | 0 | | | | 10 | | | | | | | | (10 | ) | | | 0 | | | | 0 | | | | (10 | ) | | | 0 | | | | 0 | | | | 0 | |
| | | | | | | | | | | | | | | | | | | | | | | | | | | | | | | | | | | | | | | | | | | | | | | | |
Total Over the Counter | | $ | 962 | | | $ | 0 | | | $ | 75 | | | $ | 1,037 | | | | | | | $ | (175) | | | $ | (60) | | | $ | (531) | | | $ | (766) | | | | | | | | | | | | | |
| | | | | | | | | | | | | | | | | | | | | | | | | | | | | | | | | | | | | | | | | | | | | | | | |
| (k) | Securities with an aggregate market value of $368 have been pledged as collateral for financial derivative instruments as governed by International Swaps and Derivatives Association, Inc. master agreements as of December 31, 2018. |
| (1) | YOY options may have a series of expirations. |
| (2) | The underlying instrument has a forward starting effective date. See Note 2, Securities Transactions and Investment Income, in the Notes to Financial Statements for further information. |
| (3) | If the Portfolio is a seller of protection and a credit event occurs, as defined under the terms of that particular swap agreement, the Portfolio will either (i) pay to the buyer of protection an amount equal to the notional amount of the swap and take delivery of the referenced obligation or underlying securities comprising the referenced index or (ii) pay a net settlement amount in the form of cash, securities or other deliverable obligations equal to the notional amount of the swap less the recovery value of the referenced obligation or underlying securities comprising the referenced index. |
| | | | | | |
| See Accompanying Notes | | ANNUAL REPORT | | DECEMBER 31, 2018 | | 101 |
Schedule of InvestmentsPIMCO Fixed Income SHares: Series R(Cont.)
| (4) | The maximum potential amount the Portfolio could be required to pay as a seller of credit protection or receive as a buyer of credit protection if a credit event occurs as defined under the terms of that particular swap agreement. |
| (5) | The prices and resulting values for credit default swap agreements serve as indicators of the current status of the payment/performance risk and represent the likelihood of an expected liability (or profit) for the credit derivative should the notional amount of the swap agreement be closed/sold as of the period end. Increasing market values, in absolute terms when compared to the notional amount of the swap, represent a deterioration of the referenced indices’ credit soundness and a greater likelihood or risk of default or other credit event occurring as defined under the terms of the agreement. |
| (6) | Net Exposure represents the net receivable/(payable) that would be due from/to the counterparty in the event of default. Exposure from OTC financial derivative instruments can only be netted across transactions governed under the same master agreement with the same legal entity. See Note 8, Master Netting Arrangements, in the Notes to Financial Statements for more information regarding master netting arrangements. |
FAIR VALUE OF FINANCIAL DERIVATIVE INSTRUMENTS
The following is a summary of the fair valuation of the Portfolio’s derivative instruments categorized by risk exposure. See Note 7, Principal Risks, in the Notes to Financial Statements on risks of the Portfolio.
Fair Values of Financial Derivative Instruments on the Statements of Assets and Liabilities as of December 31, 2018:
| | | | | | | | | | | | | | | | | | | | | | | | |
| | | Derivatives not accounted for as hedging instruments | |
| | | Commodity
Contracts | | | Credit
Contracts | | | Equity
Contracts | | | Foreign
Exchange
Contracts | | | Interest
Rate Contracts | | | Total | |
Financial Derivative Instruments - Assets | | | | | | | | | | | | | | | | | | | | | | | | |
Exchange-traded or centrally cleared | | | | | | | | | | | | | | | | | | | | | | | | |
Purchased Options | | $ | 0 | | | $ | 0 | | | $ | 0 | | | $ | 0 | | | $ | 2 | | | $ | 2 | |
Futures | | | 0 | | | | 0 | | | | 0 | | | | 0 | | | | 70 | | | | 70 | |
Swap Agreements | | | 0 | | | | 0 | | | | 0 | | | | 0 | | | | 222 | | | | 222 | |
| | | | | | | | | | | | | | | | | | | | | | | | |
| | $ | 0 | | | $ | 0 | | | $ | 0 | | | $ | 0 | | | $ | 294 | | | $ | 294 | |
| | | | | | | | | | | | | | | | | | | | | | | | |
Over the counter | | | | | | | | | | | | | | | | | | | | | | | | |
Forward Foreign Currency Contracts | | $ | 0 | | | $ | 0 | | | $ | 0 | | | $ | 962 | | | $ | 0 | | | $ | 962 | |
Swap Agreements | | | 0 | | | | 3 | | | | 0 | | | | 0 | | | | 72 | | | | 75 | |
| | | | | | | | | | | | | | | | | | | | | | | | |
| | $ | 0 | | | $ | 3 | | | $ | 0 | | | $ | 962 | | | $ | 72 | | | $ | 1,037 | |
| | | | | | | | | | | | | | | | | | | | | | | | |
| | $ | 0 | | | $ | 3 | | | $ | 0 | | | $ | 962 | | | $ | 366 | | | $ | 1,331 | |
| | | | | | | | | | | | | | | | | | | | | | | | |
| | | | | | |
Financial Derivative Instruments - Liabilities | | | | | | | | | | | | | | | | | | | | | | | | |
Exchange-traded or centrally cleared | | | | | | | | | | | | | | | | | | | | | | | | |
Written Options | | $ | 0 | | | $ | 0 | | | $ | 0 | | | $ | 0 | | | $ | 42 | | | $ | 42 | |
Futures | | | 0 | | | | 0 | | | | 0 | | | | 0 | | | | 114 | | | | 114 | |
Swap Agreements | | | 0 | | | | 13 | | | | 0 | | | | 0 | | | | 299 | | | | 312 | |
| | | | | | | | | | | | | | | | | | | | | | | | |
| | $ | 0 | | | $ | 13 | | | $ | 0 | | | $ | 0 | | | $ | 455 | | | $ | 468 | |
| | | | | | | | | | | | | | | | | | | | | | | | |
Over the counter | | | | | | | | | | | | | | | | | | | | | | | | |
Forward Foreign Currency Contracts | | $ | 0 | | | $ | 0 | | | $ | 0 | | | $ | 175 | | | $ | 0 | | | $ | 175 | |
Written Options | | | 0 | | | | 38 | | | | 0 | | | | 1 | | | | 21 | | | | 60 | |
Swap Agreements | | | 0 | | | | 0 | | | | 0 | | | | 0 | | | | 531 | | | | 531 | |
| | | | | | | | | | | | | | | | | | | | | | | | |
| | $ | 0 | | | $ | 38 | | | $ | 0 | | | $ | 176 | | | $ | 552 | | | $ | 766 | |
| | | | | | | | | | | | | | | | | | | | | | | | |
| | $ | 0 | | | $ | 51 | | | $ | 0 | | | $ | 176 | | | $ | 1,007 | | | $ | 1,234 | |
| | | | | | | | | | | | | | | | | | | | | | | | |
| | | | | | |
| 102 | | PIMCO MANAGED ACCOUNTS TRUST | | | | See Accompanying Notes |
December 31, 2018
The effect of Financial Derivative Instruments on the Statements of Operations for the period ended December 31, 2018:
| | | | | | | | | | | | | | | | | | | | | | | | |
| | | Derivatives not accounted for as hedging instruments | |
| | | Commodity
Contracts | | | Credit
Contracts | | | Equity
Contracts | | | Foreign
Exchange
Contracts | | | Interest
Rate Contracts | | | Total | |
Net Realized Gain (Loss) on Financial Derivative Instruments | |
Exchange-traded or centrally cleared | | | | | | | | | | | | | | | | | | | | | | | | |
Purchased Options | | $ | 0 | | | $ | 0 | | | $ | 0 | | | $ | 0 | | | $ | 12 | | | $ | 12 | |
Written Options | | | 0 | | | | 0 | | | | 0 | | | | 0 | | | | 184 | | | | 184 | |
Futures | | | 0 | | | | 0 | | | | 0 | | | | 0 | | | | 256 | | | | 256 | |
Swap Agreements | | | 0 | | | | (197 | ) | | | 0 | | | | 0 | | | | 1,394 | | | | 1,197 | |
| | | | | | | | | | | | | | | | | | | | | | | | |
| | $ | 0 | | | $ | (197 | ) | | $ | 0 | | | $ | 0 | | | $ | 1,846 | | | $ | 1,649 | |
| | | | | | | | | | | | | | | | | | | | | | | | |
Over the counter | |
Forward Foreign Currency Contracts | | $ | 0 | | | $ | 0 | | | $ | 0 | | | $ | 1,122 | | | $ | 0 | | | $ | 1,122 | |
Purchased Options | | | 0 | | | | 0 | | | | 0 | | | | 3 | | | | (119 | ) | | | (116 | ) |
Written Options | | | 0 | | | | 46 | | | | 0 | | | | 30 | | | | 115 | | | | 191 | |
Swap Agreements | | | 0 | | | | 127 | | | | 0 | | | | 0 | | | | (308 | ) | | | (181 | ) |
| | | | | | | | | | | | | | | | | | | | | | | | |
| | $ | 0 | | | $ | 173 | | | $ | 0 | | | $ | 1,155 | | | $ | (312 | ) | | $ | 1,016 | |
| | | | | | | | | | | | | | | | | | | | | | | | |
| | $ | 0 | | | $ | (24 | ) | | $ | 0 | | | $ | 1,155 | | | $ | 1,534 | | | $ | 2,665 | |
| | | | | | | | | | | | | | | | | | | | | | | | |
|
Net Change in Unrealized Appreciation (Depreciation) on Financial Derivative Instruments | |
Exchange-traded or centrally cleared | |
Purchased Options | | $ | 0 | | | $ | 0 | | | $ | 0 | | | $ | 0 | | | $ | (3 | ) | | $ | (3 | ) |
Written Options | | | 0 | | | | 0 | | | | 0 | | | | 0 | | | | (33 | ) | | | (33 | ) |
Futures | | | 0 | | | | 0 | | | | 0 | | | | 0 | | | | (605 | ) | | | (605 | ) |
Swap Agreements | | | 0 | | | | 159 | | | | 0 | | | | 0 | | | | (590 | ) | | | (431 | ) |
| | | | | | | | | | | | | | | | | | | | | | | | |
| | $ | 0 | | | $ | 159 | | | $ | 0 | | | $ | 0 | | | $ | (1,231 | ) | | $ | (1,072 | ) |
| | | | | | | | | | | | | | | | | | | | | | | | |
Over the counter | |
Forward Foreign Currency Contracts | | $ | 0 | | | $ | 0 | | | $ | 0 | | | $ | 1,694 | | | $ | 0 | | | $ | 1,694 | |
Purchased Options | | | 0 | | | | (2 | ) | | | 0 | | | | 0 | | | | 122 | | | | 120 | |
Written Options | | | 0 | | | | (8 | ) | | | 0 | | | | 6 | | | | (20 | ) | | | (22 | ) |
Swap Agreements | | | 0 | | | | (133 | ) | | | 0 | | | | 0 | | | | 196 | | | | 63 | |
| | | | | | | | | | | | | | | | | | | | | | | | |
| | $ | 0 | | | $ | (143 | ) | | $ | 0 | | | $ | 1,700 | | | $ | 298 | | | $ | 1,855 | |
| | | | | | | | | | | | | | | | | | | | | | | | |
| | $ | 0 | | | $ | 16 | | | $ | 0 | | | $ | 1,700 | | | $ | (933 | ) | | $ | 783 | |
| | | | | | | | | | | | | | | | | | | | | | | | |
FAIR VALUE MEASUREMENTS
The following is a summary of the fair valuations according to the inputs used as of December 31, 2018 in valuing the Portfolio’s assets and liabilities:
| | | | | | | | | | | | | | | | |
| Category and Subcategory | | Level 1 | | | Level 2 | | | Level 3 | | | Fair
Value at
12/31/2018 | |
Investments in Securities, at Value | |
Corporate Bonds & Notes | |
Banking & Finance | | $ | 0 | | | $ | 8,291 | | | $ | 0 | | | $ | 8,291 | |
Industrials | | | 0 | | | | 1,084 | | | | 0 | | | | 1,084 | |
Utilities | | | 0 | | | | 2,578 | | | | 0 | | | | 2,578 | |
U.S. Government Agencies | | | 0 | | | | 24,137 | | | | 0 | | | | 24,137 | |
U.S. Treasury Obligations | | | 0 | | | | 142,119 | | | | 0 | | | | 142,119 | |
Non-Agency Mortgage-Backed Securities | | | 0 | | | | 3,554 | | | | 0 | | | | 3,554 | |
Asset-Backed Securities | | | 0 | | | | 9,559 | | | | 0 | | | | 9,559 | |
Sovereign Issues | | | 0 | | | | 14,561 | | | | 0 | | | | 14,561 | |
| | | | | | |
| See Accompanying Notes | | ANNUAL REPORT | | DECEMBER 31, 2018 | | 103 |
Schedule of InvestmentsPIMCO Fixed Income SHares: Series R(Cont.)
December 31, 2018
| | | | | | | | | | | | | | | | |
| Category and Subcategory | | Level 1 | | | Level 2 | | | Level 3 | | | Fair
Value at
12/31/2018 | |
Short-Term Instruments | |
Repurchase Agreements | | $ | 0 | | | $ | 779 | | | $ | 0 | | | $ | 779 | |
| | | | |
Total Investments | | $ | 0 | | | $ | 206,662 | | | $ | 0 | | | $ | 206,662 | |
|
Financial Derivative Instruments - Assets | |
Exchange-traded or centrally cleared | | | 70 | | | | 224 | | | | 0 | | | | 294 | |
Over the counter | | | 0 | | | | 1,037 | | | | 0 | | | | 1,037 | |
| | $ | 70 | | | $ | 1,261 | | | $ | 0 | | | $ | 1,331 | |
|
Financial Derivative Instruments - Liabilities | |
Exchange-traded or centrally cleared | | | (126 | ) | | | (342 | ) | | | 0 | | | | (468 | ) |
Over the counter | | | 0 | | | | (766 | ) | | | 0 | | | | (766 | ) |
| | $ | (126 | ) | | $ | (1,108 | ) | | $ | 0 | | | $ | (1,234 | ) |
| | | | |
Total Financial Derivative Instruments | | $ | (56 | ) | | $ | 153 | | | $ | 0 | | | $ | 97 | |
| | | | |
Totals | | $ | (56) | | | $ | 206,815 | | | $ | 0 | | | $ | 206,759 | |
There were no significant transfers into or out of Level 3 during the period ended December 31, 2018.
| | | | | | |
| 104 | | PIMCO MANAGED ACCOUNTS TRUST | | | | See Accompanying Notes |
Schedule of InvestmentsPIMCO Fixed Income SHares: Series TE
December 31, 2018
(Amounts in thousands*, except number of shares, contracts and units, if any)
| | | | | | | | | | | | |
| | | | | PRINCIPAL
AMOUNT
(000S) | | | | | MARKET
VALUE
(000S) | |
| INVESTMENTS IN SECURITIES 101.6% | |
| |
| MUNICIPAL BONDS & NOTES 101.2% | |
| |
| ARIZONA 2.9% | |
|
Industrial Development Authority of the City of Phoenix, Arizona Revenue Notes, Series 2018 | |
5.000% due 07/01/2028 | | $ | | | 250 | | | $ | | | 283 | |
|
Phoenix Civic Improvement Corp., Arizona Revenue Bonds, Series 2010 | |
5.000% due 07/01/2028 | | | | | 1,000 | | | | | | 1,047 | |
|
Salt River Project Agricultural Improvement & Power District, Arizona Revenue Bonds, Series 2012 | |
5.000% due 12/01/2030 | | | | | 1,000 | | | | | | 1,088 | |
| | | | | | | | | | | | |
| | | | | | | | | | | 2,418 | |
| | | | | | | | | | | | |
| | | | | | | | | | | | |
| CALIFORNIA 13.7% | |
|
Bay Area Toll Authority, California Revenue Bonds, Series 2013 | |
5.000% due 04/01/2038 | | | | | 2,000 | | | | | | 2,272 | |
|
California County Tobacco Securitization Agency Revenue Bonds, Series 2002 | |
5.750% due 06/01/2029 | | | | | 945 | | | | | | 955 | |
|
California Educational Facilities Authority Revenue Bonds, Series 2017 | |
5.000% due 04/01/2042 | | | | | 1,000 | | | | | | 1,119 | |
|
California Health Facilities Financing Authority Revenue Bonds, Series 2013 | |
5.000% due 07/01/2043 | | | | | 1,000 | | | | | | 1,054 | |
|
California Health Facilities Financing Authority Revenue Bonds, Series 2016 | |
5.000% due 11/15/2046 (a) | | | | | 3,000 | | | | | | 3,318 | |
|
Golden State, California Tobacco Securitization Corp. Revenue Bonds, Series 2018 | |
5.000% due 06/01/2030 | | | | | 1,300 | | | | | | 1,436 | |
|
Los Angeles Department of Water & Power Power System, California Revenue Bonds, Series 2018 | |
5.000% due 07/01/2037 | | | | | 1,000 | | | | | | 1,171 | |
| | | | | | | | | | | | |
| | | | | | | | | | | 11,325 | |
| | | | | | | | | | | | |
| | | | | | | | | | | | |
| COLORADO 2.8% | |
|
Colorado Health Facilities Authority Revenue Bonds, Series 2013 | |
5.000% due 12/01/2033 | | | | | 2,125 | | | | | | 2,331 | |
| | | | | | | | | | | | |
| | | | | | | | | | | | |
| CONNECTICUT 1.5% | |
|
Connecticut Special Tax State Revenue Bonds, Series 2018 | |
5.000% due 01/01/2029 | | | | | 110 | | | | | | 127 | |
| | | | | | | | | | | | |
| | | | | PRINCIPAL
AMOUNT
(000S) | | | | | MARKET
VALUE
(000S) | |
|
Connecticut State Health & Educational Facility Authority Revenue Bonds, Series 2014 | |
5.000% due 07/01/2026 | | $ | | | 1,000 | | | $ | | | 1,121 | |
| | | | | | | | | | | | |
| | | | | | | | | | | 1,248 | |
| | | | | | | | | | | | |
| | | | | | | | | | | | |
| FLORIDA 2.4% | |
|
Broward County, Florida Airport System Revenue Bonds, Series 2012 | |
5.000% due 10/01/2037 | | | | | 1,300 | | | | | | 1,393 | |
|
Miami-Dade County, Florida Water & Sewer System Revenue Bonds, Series 2013 | |
5.000% due 10/01/2028 | | | | | 555 | | | | | | 620 | |
| | | | | | | | | | | | |
| | | | | | | | | | | 2,013 | |
| | | | | | | | | | | | |
| | | | | | | | | | | | |
| GEORGIA 1.2% | |
|
Main Street Natural Gas, Inc., Georgia Revenue Bonds, Series 2018 | |
2.324% (0.67*US0001M + 0.750%) due 04/01/2048 ~ | | | | | 1,000 | | | | | | 989 | |
| | | | | | | | | | | | |
| | | | | | | | | | | | |
| ILLINOIS 16.6% | |
|
Chicago O’Hare International Airport, Illinois Revenue Bonds, Series 2018 | |
5.000% due 01/01/2036 | | | | | 1,000 | | | | | | 1,144 | |
5.000% due 01/01/2048 | | | | | 1,000 | | | | | | 1,113 | |
|
Chicago, Illinois General Obligation Bonds, Series 2002 | |
5.500% due 01/01/2037 | | | | | 1,000 | | | | | | 1,052 | |
|
Chicago, Illinois General Obligation Bonds, Series 2017 | |
5.750% due 01/01/2034 | | | | | 1,500 | | | | | | 1,651 | |
|
Chicago, Illinois General Obligation Notes, Series 2016 | |
5.000% due 01/01/2024 | | | | | 1,000 | | | | | | 1,060 | |
|
Illinois Finance Authority Revenue Bonds, Series 2017 | |
5.000% due 12/01/2037 | | | | | 1,000 | | | | | | 615 | |
|
Illinois State General Obligation Bonds, Series 2014 | |
5.250% due 02/01/2028 | | | | | 1,000 | | | | | | 1,001 | |
|
Illinois State General Obligation Bonds, Series 2018 | |
5.000% due 05/01/2036 | | | | | 1,000 | | | | | | 1,042 | |
5.000% due 05/01/2042 | | | | | 1,000 | | | | | | 1,030 | |
|
Illinois State General Obligation Notes, Series 2017 | |
5.000% due 11/01/2025 | | | | | 2,000 | | | | | | 2,141 | |
|
Illinois State Revenue Bonds, Series 2016 | |
3.000% due 06/15/2031 | | | | | 1,000 | | | | | | 863 | |
3.000% due 06/15/2034 | | | | | 1,180 | | | | | | 973 | |
| | | | | | | | | | | | |
| | | | | | | | | | | 13,685 | |
| | | | | | | | | | | | |
| | | | | | | | | | | | |
| | | | | | |
| See Accompanying Notes | | ANNUAL REPORT | | DECEMBER 31, 2018 | | 105 |
Schedule of InvestmentsPIMCO Fixed Income SHares: Series TE(Cont.)
| | | | | | | | | | | | |
| | | | | PRINCIPAL
AMOUNT
(000S) | | | | | MARKET
VALUE
(000S) | |
| INDIANA 0.6% | |
|
Rockport, Indiana Revenue Bonds, Series 2009 | |
3.050% due 06/01/2025 | | $ | | | 500 | | | $ | | | 501 | |
| | | | | | | | | | | | |
| | | | | | | | | | | | |
| KANSAS 2.6% | |
|
Kansas Development Finance Authority Revenue Bonds, Series 2012 | |
5.000% due 11/15/2034 | | | | | 2,000 | | | | | | 2,150 | |
| | | | | | | | | | | | |
| | | | | | | | | | | | |
| MASSACHUSETTS 5.2% | |
|
Commonwealth of Massachusetts General Obligation Bonds, Series 2018 | |
4.000% due 05/01/2041 | | | | | 1,000 | | | | | | 1,027 | |
|
Massachusetts Development Finance Agency Revenue Bonds, Series 2016 | |
5.000% due 01/01/2047 | | | | | 1,000 | | | | | | 1,070 | |
|
Massachusetts State College Building Authority Revenue Bonds, Series 2014 | |
5.000% due 05/01/2028 | | | | | 2,000 | | | | | | 2,234 | |
| | | | | | | | | | | | |
| | | | | | | | | | | 4,331 | |
| | | | | | | | | | | | |
| | | | | | | | | | | | |
| MICHIGAN 3.9% | |
|
Michigan Finance Authority Revenue Notes, Series 2014 | |
4.000% due 10/01/2024 | | | | | 2,000 | | | | | | 2,108 | |
|
Michigan Finance Authority Revenue Notes, Series 2016 | |
5.000% due 04/01/2024 | | | | | 1,000 | | | | | | 1,125 | |
| | | | | | | | | | | | |
| | | | | | | | | | | 3,233 | |
| | | | | | | | | | | | |
| | | | | | | | | | | | |
| NEVADA 1.5% | |
|
Reno, Nevada Revenue Bonds, (AGM Insured), Series 2018 | |
4.125% due 06/01/2058 | | | | | 1,250 | | | | | | 1,266 | |
| | | | | | | | | | | | |
| | | | | | | | | | | | |
| NEW JERSEY 11.7% | |
|
Atlantic City, New Jersey General Obligation Bonds, (BAM Insured), Series 2017 | |
5.000% due 03/01/2042 | | | | | 1,250 | | | | | | 1,368 | |
|
Atlantic City, New Jersey General Obligation Notes, (BAM Insured), Series 2017 | |
5.000% due 03/01/2026 | | | | | 250 | | | | | | 287 | |
|
New Jersey Economic Development Authority Revenue Bonds, Series 2013 | |
3.260% (MUNIPSA + 1.550%) due 09/01/2027 ~ | | | | | 500 | | | | | | 493 | |
|
New Jersey Economic Development Authority Revenue Notes, Series 2016 | |
5.000% due 06/15/2022 | | | | | 1,500 | | | | | | 1,613 | |
| | | | | | | | | | | | |
| | | | | PRINCIPAL
AMOUNT
(000S) | | | | | MARKET
VALUE
(000S) | |
|
New Jersey Health Care Facilities Financing Authority Revenue Bonds, Series 2013 | |
5.250% due 07/01/2035 | | $ | | | 1,000 | | | $ | | | 1,110 | |
|
New Jersey Turnpike Authority Revenue Notes, Series 2017 | |
2.340% (0.7*US0001M + 0.700%) due 01/01/2024 ~ | | | | | 1,000 | | | | | | 1,002 | |
|
Tobacco Settlement Financing Corp, New Jersey Revenue Bonds, Series 2018 | |
5.000% due 06/01/2033 | | | | | 1,000 | | | | | | 1,111 | |
|
Tobacco Settlement Financing Corp., New Jersey Revenue Bonds, Series 2018 | |
5.000% due 06/01/2029 | | | | | 500 | | | | | | 566 | |
5.000% due 06/01/2046 | | | | | 2,000 | | | | | | 2,081 | |
| | | | | | | | | | | | |
| | | | | | | | | | | 9,631 | |
| | | | | | | | | | | | |
| |
| NEW MEXICO 0.7% | |
|
Albuquerque Municipal School District No.12, New Mexico General Obligation Bonds, Series 2017 | |
5.000% due 08/01/2027 | | | | | 500 | | | | | | 592 | |
| | | | | | | | | | | | |
| |
| NEW YORK 10.6% | |
|
Metropolitan Transportation Authority, New York Revenue Bonds, Series 2012 | |
5.000% due 11/15/2028 | | | | | 1,340 | | | | | | 1,479 | |
|
New York City, New York General Obligation Bonds, Series 2018 | |
5.000% due 12/01/2038 | | | | | 1,000 | | | | | | 1,158 | |
|
New York State Energy Research & Development Authority Revenue Bonds, Series 1994 | |
3.500% due 10/01/2029 | | | | | 1,000 | | | | | | 1,009 | |
|
Triborough Bridge & Tunnel Authority, New York Revenue Bonds, Series 2013 | |
5.000% due 11/15/2027 | | | | | 2,000 | | | | | | 2,256 | |
|
TSASC, Inc., New York Revenue Bonds, Series 2017 | |
5.000% due 06/01/2033 | | | | | 1,000 | | | | | | 1,100 | |
|
TSASC, Inc., New York Revenue Notes, Series 2017 | |
5.000% due 06/01/2027 | | | | | 1,500 | | | | | | 1,717 | |
| | | | | | | | | | | | |
| | | | | | | | | | | 8,719 | |
| | | | | | | | | | | | |
| |
| NORTH CAROLINA 1.3% | |
|
North Carolina Turnpike Authority Revenue Bonds, Series 2011 | |
5.000% due 07/01/2024 | | | | | 1,000 | | | | | | 1,074 | |
| | | | | | | | | | | | |
| | | | | | | | | | | | |
| PENNSYLVANIA 4.1% | |
|
Commonwealth Financing Authority, Pennsylvania Revenue Bonds, Series 2018 | |
5.000% due 06/01/2031 | | | | | 1,000 | | | | | | 1,137 | |
| | | | | | |
| 106 | | PIMCO MANAGED ACCOUNTS TRUST | | | | See Accompanying Notes |
December 31, 2018
| | | | | | | | | | | | |
| | | | | PRINCIPAL
AMOUNT
(000S) | | | | | MARKET
VALUE
(000S) | |
|
Delaware River Port Authority, Pennsylvania Revenue Notes, Series 2012 | |
5.000% due 01/01/2023 | | $ | | | 1,000 | | | $ | | | 1,098 | |
|
Geisinger Authority, Pennsylvania Revenue Bonds, Series 2017 | |
5.000% due 02/15/2045 (a) | | | | | 1,000 | | | | | | 1,110 | |
| | | | | | | | | | | | |
| | | | | | | | | | | 3,345 | |
| | | | | | | | | | | | |
| |
| PUERTO RICO 1.8% | |
|
Puerto Rico Electric Power Authority Revenue Bonds, (AGM Insured), Series 2007 | |
2.125% (0.67*US0003M + 0.520%) due 07/01/2029 ~ | | | | | 1,010 | | | | | | 937 | |
|
Puerto Rico Highway & Transportation Authority Revenue Bonds, (AGC Insured), Series 2005 | |
5.250% due 07/01/2041 | | | | | 500 | | | | | | 527 | |
| | | | | | | | | | | | |
| | | | | | | | | | | 1,464 | |
| | | | | | | | | | | | |
| | | | | | | | | | | | |
| TENNESSEE 0.3% | |
|
Tennessee Energy Acquisition Corp. Revenue Bonds, Series 2006 | |
5.250% due 09/01/2024 | | | | | 200 | | | | | | 224 | |
| | | | | | | | | | | | |
| | | | | | | | | | | | |
| TEXAS 13.8% | |
|
Irving Hospital Authority, Texas Revenue Bonds, Series 2017 | |
2.810% (MUNIPSA + 1.100%) due 10/15/2044 ~ | | | | | 1,000 | | | | | | 1,003 | |
|
New Hope Cultural Education Facilities Corp., Texas Revenue Bonds, Series 2016 | |
4.000% due 07/01/2036 | | | | | 1,000 | | | | | | 1,017 | |
|
New Hope Cultural Education Facilities Finance Corp., Texas Revenue Bonds, Series 2017 | |
5.000% due 01/01/2030 | | | | | 630 | | | | | | 652 | |
|
North Texas Tollway Authority Revenue Bonds, Series 2018 | |
5.000% due 01/01/2048 | | | | | 1,000 | | | | | | 1,105 | |
|
SA Energy Acquisition Public Facility Corp., Texas Revenue Bonds, Series 2007 | |
5.500% due 08/01/2025 | | | | | 1,000 | | | | | | 1,143 | |
|
Texas Municipal Gas Acquisition & Supply Corp. Revenue Bonds, Series 2006 | |
5.250% due 12/15/2023 | | | | | 1,000 | | | | | | 1,123 | |
|
Texas Municipal Gas Acquisition & Supply Corp. Revenue Bonds, Series 2008 | |
6.250% due 12/15/2026 | | | | | 4,650 | | | | | | 5,318 | |
| | | | | | | | | | | | |
| | | | | | | | | | | 11,361 | |
| | | | | | | | | | | | |
| | | | | | | | | | | | |
| | | | | PRINCIPAL
AMOUNT
(000S) | | | | | MARKET
VALUE
(000S) | |
| WASHINGTON 0.6% | |
|
Seattle, Washington Municipal Light and Power Revenue Bonds, Series 2018 | |
4.000% due 01/01/2040 (a) | | $ | | | 500 | | | $ | | | 517 | |
| | | | | | | | | | | | |
| | | | | | | | | | | 517 | |
| | | | | | | | | | | | |
| | | | | | | | | | | | |
| WISCONSIN 1.4% | |
|
WPPI Energy, Wisconsin Revenue Bonds, Series 2013 | |
5.000% due 07/01/2025 | | | | | 1,000 | | | | | | 1,114 | |
| | | | | | | | | | | | |
Total Municipal Bonds & Notes
(Cost $81,224) | | | 83,531 | |
| | | | | | | | | | | | |
| | | | | | | | | | | | |
| SHORT-TERM INSTRUMENTS 0.4% | |
| |
| REPURCHASE AGREEMENTS (b) 0.4% | |
| | | | | | | | | | | 339 | |
| | | | | | | | | | | | |
Total Short-Term Instruments
(Cost $339) | | | 339 | |
| | | | | | | | | | | | |
| | | | |
| | | | | | | | | | | | |
Total Investments in Securities
(Cost $81,563) | | | 83,870 | |
| | | | | | | | | | | | |
| | | | | | | | | | | | |
| | | | | SHARES | | | | | | |
| INVESTMENTS IN AFFILIATES 1.7% | |
| |
| SHORT-TERM INSTRUMENTS 1.7% | |
| |
| CENTRAL FUNDS USED FOR CASH MANAGEMENT PURPOSES 1.7% | |
| | | | |
PIMCO Short-Term Floating NAV Portfolio III | | | | | 139,588 | | | | | | 1,380 | |
| | | | | | | | | | | | |
Total Short-Term Instruments
(Cost $1,380) | | | 1,380 | |
| | | | | | | | | | | | |
| | | | |
| | | | | | | | | | | | |
Total Investments in Affiliates
(Cost $1,380) | | | 1,380 | |
| | | | |
| | | | | | | | | | | | |
Total Investments 103.3%
(Cost $82,943) | | | $ | | | 85,250 | |
| | | | | | | | | | | | |
Financial Derivative
Instruments (c) (0.1)% (Cost or Premiums, net $0) | | | (45 | ) |
| | | | | | | | | | | | |
| Other Assets and Liabilities, net (3.2)% | | | | | | (2,684 | ) |
| | | | | | | | | | | | |
| Net Assets 100.0% | | | $ | | | 82,521 | |
| | | | | | | | | | | | |
| | | | | | |
| See Accompanying Notes | | ANNUAL REPORT | | DECEMBER 31, 2018 | | 107 |
Schedule of InvestmentsPIMCO Fixed Income SHares: Series TE(Cont.)
NOTES TO SCHEDULE OF INVESTMENTS:
| * | A zero balance may reflect actual amounts rounding to less than one thousand. |
| ~ | Variable or Floating rate security. Rate shown is the rate in effect as of period end. Certain variable rate securities are not based on a published reference rate and spread, rather are determined by the issuer or agent and are based on current market conditions. Reference rate is as of reset date, which may vary by security. These securities may not indicate a reference rate and/or spread in their description. |
| (a) | Represents an underlying municipal bond transferred to a tender option bond trust established in a tender option bond transaction in which the Portfolio sold, or caused the sale of, the underlying municipal bond and purchased the residual interest certificate. The security serves as collateral in a financing transaction. See Note 5, Tender Option Bond Transactions, in the Notes to Financial Statements for more information. |
BORROWINGS AND OTHER FINANCING TRANSACTIONS
(b) REPURCHASE AGREEMENTS:
| | | | | | | | | | | | | | | | | | | | | | | | | | | | |
| Counterparty | | Lending
Rate | | Settlement
Date | | | Maturity
Date | | | Principal
Amount | | | Collateralized By | | Collateral
(Received) | | | Repurchase
Agreements,
at Value | | | Repurchase
Agreement
Proceeds
to be
Received(1) | |
FICC | | 2.000% | | | 12/31/2018 | | | | 01/02/2019 | | | $ | 339 | | | U.S. Treasury Notes 2.875% due 09/30/2023 | | $ | (347 | ) | | $ | 339 | | | $ | 339 | |
| | | | | | | | | | | | | | | | | | | | | | | | | | | | |
Total Repurchase Agreements | | | | | $ | (347 | ) | | $ | 339 | | | $ | 339 | |
| | | | | | | | | | | | | | | | | | | | | | | | | | | | |
BORROWINGS AND OTHER FINANCING TRANSACTIONS SUMMARY
The following is a summary by counterparty of the market value of Borrowings and Other Financing Transactions and collateral pledged/(received) as of December 31, 2018:
| | | | | | | | | | | | | | | | | | | | | | | | |
| Counterparty | | Repurchase
Agreement
Proceeds to be
Received(1) | | | Payable for
Reverse
Repurchase
Agreements | | | Payable for
Sale-Buyback
Transactions | | | Total
Borrowings and
Other Financing
Transactions | | | Collateral
Pledged/
(Received) | | | Net Exposure(2) | |
Global/Master Repurchase Agreement | |
FICC | | $ | 339 | | | $ | 0 | | | $ | 0 | | | $ | 339 | | | $ | | (347) | | $ | | (8) |
| | | | | | | | | | | | | | | | | | | | | | | | |
Total Borrowings and Other Financing Transactions | | $ | 339 | | | $ | 0 | | | $ | 0 | | | | | | | | | | | | | |
| | | | | | | | | | | | | | | | | | | | | | | | |
| (1) | Includes accrued interest. |
| (2) | Net Exposure represents the net receivable/(payable) that would be due from/to the counterparty in the event of default. Exposure from borrowings and other financing transactions can only be netted across transactions governed under the same master agreement with the same legal entity. See Note 8, Master Netting Arrangements, in the Notes to Financial Statements for more information regarding master netting arrangements. |
(c) FINANCIAL DERIVATIVE INSTRUMENTS: EXCHANGE-TRADED OR CENTRALLY CLEARED
FUTURES CONTRACTS:
SHORT FUTURES CONTRACTS
| | | | | | | | | | | | | | | | | | | | | | | | | | | | |
Description | | Expiration
Month | | | # of
Contracts | | | Notional
Amount | | | Unrealized
Appreciation/
(Depreciation) | | | Variation Margin | |
| | Asset | | | Liability | |
U.S. Treasury10-Year Note March Futures | | | 03/2019 | | | | 116 | | | | $ | | | | (14,154 | ) | | $ | (222 | ) | | $ | 0 | | | $ | (45 | ) |
| | | | | | | | | | | | | | | | | | | | | | | | | | | | |
Total Futures Contracts | | | | | | | | | | | | | | $ | (222 | ) | | $ | 0 | | | $ | (45 | ) |
| | | | | | | | | | | | | | | | | | | | | | | | | | | | |
| | | | | | |
| 108 | | PIMCO MANAGED ACCOUNTS TRUST | | | | See Accompanying Notes |
December 31, 2018
FINANCIAL DERIVATIVE INSTRUMENTS: EXCHANGE-TRADED OR CENTRALLY CLEARED SUMMARY
The following is a summary of the market value and variation margin of Exchange-Traded or Centrally Cleared Financial Derivative Instruments as of December 31, 2018:
| | | | | | | | | | | | | | | | | | | | | | | | | | | | | | | | | | | | |
| | | Financial Derivative Assets | | | | | | Financial Derivative Liabilities | |
| | | Market Value | | | Variation Margin
Asset | | | | | | | | | Market Value | | | Variation Margin
Liability | | | | |
| | | Purchased
Options | | | Futures | | | Swap
Agreements | | | Total | | | | | | Written
Options | | | Futures | | | Swap
Agreements | | | Total | |
Total Exchange-Traded or Centrally Cleared | | $ | 0 | | | $ | 0 | | | $ | 0 | | | $ | 0 | | | | | | | $ | 0 | | | $ | (45) | | | $ | 0 | | | $ | (45) | |
| | | | | | | | | | | | | | | | | | | | | | | | | | | | | | | | | | | | |
Cash of $174 has been pledged as collateral for exchange-traded and centrally cleared financial derivative instruments as of December 31, 2018. See Note 8, Master Netting Arrangements, in the Notes to Financial Statements for more information regarding master netting arrangements.
FAIR VALUE OF FINANCIAL DERIVATIVE INSTRUMENTS
The following is a summary of the fair valuation of the Portfolio’s derivative instruments categorized by risk exposure. See Note 7, Principal Risks, in the Notes to Financial Statements on risks of the Portfolio.
Fair Values of Financial Derivative Instruments on the Statements of Assets and Liabilities as of December 31, 2018:
| | | | | | | | | | | | | | | | | | | | | | | | |
| | | Derivatives not accounted for as hedging instruments | |
| | | Commodity
Contracts | | | Credit
Contracts | | | Equity
Contracts | | | Foreign
Exchange
Contracts | | | Interest
Rate Contracts | | | Total | |
Financial Derivative Instruments - Liabilities | |
Exchange-traded or centrally cleared | |
Futures | | $ | 0 | | | $ | 0 | | | $ | 0 | | | $ | 0 | | | $ | 45 | | | $ | 45 | |
| | | | | | | | | | | | | | | | | | | | | | | | |
The effect of Financial Derivative Instruments on the Statements of Operations for the period ended December 31, 2018:
| | | | | | | | | | | | | | | | | | | | | | | | |
| | | Derivatives not accounted for as hedging instruments | |
| | | Commodity
Contracts | | | Credit
Contracts | | | Equity
Contracts | | | Foreign
Exchange
Contracts | | | Interest
Rate Contracts | | | Total | |
Net Realized Gain (Loss) on Financial Derivative Instruments | |
Exchange-traded or centrally cleared | |
Futures | | $ | 0 | | | $ | 0 | | | $ | 0 | | | $ | 0 | | | $ | 348 | | | $ | 348 | |
| | | | | | | | | | | | | | | | | | | | | | | | |
Over the counter | |
Swap Agreements | | $ | 0 | | | $ | (13 | ) | | $ | 0 | | | $ | 0 | | | $ | 46 | | | $ | 33 | |
| | | | | | | | | | | | | | | | | | | | | | | | |
| | $ | 0 | | | $ | (13 | ) | | $ | 0 | | | $ | 0 | | | $ | 394 | | | $ | 381 | |
| | | | | | | | | | | | | | | | | | | | | | | | |
|
Net Change in Unrealized Appreciation (Depreciation) on Financial Derivative Instruments | |
Exchange-traded or centrally cleared | |
Futures | | $ | 0 | | | $ | 0 | | | $ | 0 | | | $ | 0 | | | $ | (270 | ) | | $ | (270 | ) |
| | | | | | | | | | | | | | | | | | | | | | | | |
Over the counter | |
Swap Agreements | | $ | 0 | | | $ | 9 | | | $ | 0 | | | $ | 0 | | | $ | (32 | ) | | $ | (23 | ) |
| | | | | | | | | | | | | | | | | | | | | | | | |
| | $ | 0 | | | $ | 9 | | | $ | 0 | | | $ | 0 | | | $ | (302 | ) | | $ | (293 | ) |
| | | | | | | | | | | | | | | | | | | | | | | | |
| | | | | | |
| See Accompanying Notes | | ANNUAL REPORT | | DECEMBER 31, 2018 | | 109 |
Schedule of InvestmentsPIMCO Fixed Income SHares: Series TE(Cont.)
December 31, 2018
FAIR VALUE MEASUREMENTS
The following is a summary of the fair valuations according to the inputs used as of December 31, 2018 in valuing the Portfolio’s assets and liabilities:
| | | | | | | | | | | | | | | | |
| Category and Subcategory | | Level 1 | | | Level 2 | | | Level 3 | | | Fair
Value at
12/31/2018 | |
Investments in Securities, at Value | |
Municipal Bonds & Notes | |
Arizona | | $ | 0 | | | $ | 2,418 | | | $ | 0 | | | $ | 2,418 | |
California | | | 0 | | | | 11,325 | | | | 0 | | | | 11,325 | |
Colorado | | | 0 | | | | 2,331 | | | | 0 | | | | 2,331 | |
Connecticut | | | 0 | | | | 1,248 | | | | 0 | | | | 1,248 | |
Florida | | | 0 | | | | 2,013 | | | | 0 | | | | 2,013 | |
Georgia | | | 0 | | | | 989 | | | | 0 | | | | 989 | |
Illinois | | | 0 | | | | 13,685 | | | | 0 | | | | 13,685 | |
Indiana | | | 0 | | | | 501 | | | | 0 | | | | 501 | |
Kansas | | | 0 | | | | 2,150 | | | | 0 | | | | 2,150 | |
Massachusetts | | | 0 | | | | 4,331 | | | | 0 | | | | 4,331 | |
Michigan | | | 0 | | | | 3,233 | | | | 0 | | | | 3,233 | |
Nevada | | | 0 | | | | 1,266 | | | | 0 | | | | 1,266 | |
New Jersey | | | 0 | | | | 9,631 | | | | 0 | | | | 9,631 | |
New Mexico | | | 0 | | | | 592 | | | | 0 | | | | 592 | |
New York | | | 0 | | | | 8,719 | | | | 0 | | | | 8,719 | |
North Carolina | | | 0 | | | | 1,074 | | | | 0 | | | | 1,074 | |
Pennsylvania | | | 0 | | | | 3,345 | | | | 0 | | | | 3,345 | |
Puerto Rico | | | 0 | | | | 1,464 | | | | 0 | | | | 1,464 | |
Tennessee | | | 0 | | | | 224 | | | | 0 | | | | 224 | |
Texas | | | 0 | | | | 11,361 | | | | 0 | | | | 11,361 | |
Washington | | | 0 | | | | 517 | | | | 0 | | | | 517 | |
Wisconsin | | | 0 | | | | 1,114 | | | | 0 | | | | 1,114 | |
Short-Term Instruments | |
Repurchase Agreements | | | 0 | | | | 339 | | | | 0 | | | | 339 | |
| | | | |
| | $ | 0 | | | $ | 83,870 | | | $ | 0 | | | $ | 83,870 | |
|
Investments in Affiliates, at Value | |
Short-Term Instruments | |
Central Funds Used for Cash Management Purposes | | $ | 1,380 | | | $ | 0 | | | $ | 0 | | | $ | 1,380 | |
| | | | |
Total Investments | | $ | 1,380 | | | $ | 83,870 | | | $ | 0 | | | $ | 85,250 | |
|
Financial Derivative Instruments - Liabilities | |
Exchange-traded or centrally cleared | | $ | (45 | ) | | $ | 0 | | | $ | 0 | | | $ | (45 | ) |
| | | | |
Total Financial Derivative Instruments | | $ | (45 | ) | | $ | 0 | | | $ | 0 | | | $ | (45 | ) |
| | | | |
Totals | | $ | 1,335 | | | $ | 83,870 | | | $ | 0 | | | $ | 85,205 | |
There were no significant transfers into or out of Level 3 during the period ended December 31, 2018.
| | | | | | |
| 110 | | PIMCO MANAGED ACCOUNTS TRUST | | | | See Accompanying Notes |
Notes to Financial Statements
December 31, 2018
1. ORGANIZATION
PIMCO Managed Accounts Trust (the “Trust”), was organized as a Massachusetts business trust on November 3, 1999. The Trust is comprised of Fixed Income SHares (“FISH”): Series C, Series LD, Series M, Series R and Series TE (each a “Portfolio” or “Series” and collectively the “Portfolios” or “Series”). Each Portfolio has authorized an unlimited number of shares of beneficial interest with $0.001 par value. Pacific Investment Management Company LLC (“PIMCO” or the “Adviser”) serves as the Portfolios’ investment adviser and administrator.
2. SIGNIFICANT ACCOUNTING POLICIES
The following is a summary of significant accounting policies consistently followed by each Portfolio in the preparation of its financial statements in conformity with accounting principles generally accepted in the United States of America (“U.S. GAAP”). Each Portfolio is treated as an investment company under the reporting requirements of U.S. GAAP. The functional and reporting currency for the Portfolios is the U.S. dollar. The preparation of financial statements in accordance with U.S. GAAP requires management to make estimates and assumptions that affect the reported amounts of assets and liabilities and disclosure of contingent assets and liabilities at the date of the financial statements and the reported amounts of increases and decreases in net assets from operations during the reporting period. Actual results could differ from those estimates.
(a) Securities Transactions and Investment Income Securities transactions are recorded as of the trade date for financial reporting purposes. Realized gains (losses) from securities sold are recorded on the identified cost basis. Securities purchased or sold on a when-issued or delayed-delivery basis may be settled beyond a standard settlement period for the security after the trade date. Dividend income is recorded on theex-dividend date, except certain dividends from foreign securities where theex-dividend date may have passed, which are recorded as soon as a Portfolio is informed of theex-dividend date. Interest income, adjusted for the accretion of discounts and amortization of premiums, is recorded on the accrual basis from settlement date, with the exception of securities with a forward starting effective date, where interest income is recorded on the accrual basis from effective date. For convertible securities, premiums attributable to the conversion feature are not amortized. Estimated tax liabilities on certain foreign securities are recorded on an accrual basis and are reflected as components of interest income or net change in unrealized appreciation (depreciation) on investments on the Statements of Operations, as appropriate. Tax liabilities realized as a result of such security sales are reflected as a component of net realized gain (loss) on investments on the Statements of Operations. Paydown gains (losses) on mortgage-related and other asset-backed securities, if any, are recorded as components of interest income on the Statements of Operations. Income or short-term capital gain distributions received from registered investment companies, if any, are recorded as dividend income. Long-term capital gain distributions received from registered investment companies, if any, are recorded as realized gains.
Debt obligations may be placed onnon-accrual status and related interest income may be reduced by ceasing current accruals and writing off interest receivable when the collection of all or a portion of interest has become doubtful based on consistently applied procedures. A debt obligation is removed fromnon-accrual status when the issuer resumes interest payments or when collectability of interest is probable.
| | | | | | |
| | ANNUAL REPORT | | DECEMBER 31, 2018 | | 111 |
Notes to Financial Statements(Cont.)
(b) Foreign Currency Translation The market values of foreign securities, currency holdings and other assets and liabilities denominated in foreign currencies are translated into U.S. dollars based on the current exchange rates each business day. Purchases and sales of securities and income and expense items denominated in foreign currencies, if any, are translated into U.S. dollars at the exchange rate in effect on the transaction date. The Portfolios do not separately report the effects of changes in foreign exchange rates from changes in market prices on securities held. Such changes are included in net realized gain (loss) and net change in unrealized appreciation (depreciation) from investments on the Statements of Operations. The Portfolios may invest in foreign currency-denominated securities and may engage in foreign currency transactions either on a spot (cash) basis at the rate prevailing in the currency exchange market at the time or through a forward foreign currency contract. Realized foreign exchange gains (losses) arising from sales of spot foreign currencies, currency gains (losses) realized between the trade and settlement dates on securities transactions and the difference between the recorded amounts of dividends, interest, and foreign withholding taxes and the U.S. dollar equivalent of the amounts actually received or paid are included in net realized gain (loss) on foreign currency transactions on the Statements of Operations. Net unrealized foreign exchange gains (losses) arising from changes in foreign exchange rates on foreign denominated assets and liabilities other than investments in securities held at the end of the reporting period are included in net change in unrealized appreciation (depreciation) on foreign currency assets and liabilities on the Statements of Operations.
(c) Distributions to Shareholders Each Portfolio distributes substantially all of its net investment income to shareholders in the form of dividends. Dividends are declared daily and paid monthly, generally on the last business day of the month. Net realized capital gains earned by each Portfolio, if any, will be distributed no less frequently than once each year. A Portfolio may engage in investment strategies, including the use of derivatives, to, among other things, seek to generate current, distributable income without regard to possible declines in the Portfolio’s net asset value (“NAV”). A Portfolio’s income and gain-generating strategies, including certain derivatives strategies, may generate current, distributable income, even if such strategies could potentially result in declines in a Portfolio’s NAV. A Portfolio’s income and gain-generating strategies, including certain derivatives strategies, may generate current income and gains taxable as ordinary income sufficient to support monthly distributions even in situations when the Portfolio has experienced a decline in net assets due to, for example, adverse changes in the broad U.S. or non U.S. equity markets or the Portfolio’s debt investments, or arising from its use of derivatives. A Portfolio’s transactions in derivatives, short sales, or similar transactions could affect the amount, timing and character of distributions from the Portfolio, and could increase the amount or accelerate the timing for payment of taxes payable by shareholders.
Income distributions and capital gain distributions are determined in accordance with income tax regulations which may differ from U.S. GAAP. Differences between tax regulations and U.S. GAAP may cause timing differences between income and capital gain recognition. Further, the character of investment income and capital gains may be different for certain transactions under the two methods of accounting. As a result, income distributions and capital gain distributions declared during a fiscal period may differ significantly from the net investment income (loss) and realized gains (losses) reported on each Portfolio’s annual financial statements presented under U.S. GAAP.
| | | | | | |
| 112 | | PIMCO MANAGED ACCOUNTS TRUST | | | | |
December 31, 2018
If a Portfolio estimates that a portion of its distribution may be comprised of amounts from sources other than net investment income in accordance with its policies and good accounting practices, the Portfolio will notify shareholders of the estimated composition of such distribution through a Section 19 Notice. For these purposes, a Portfolio estimates the source or sources from which a distribution is paid, to the close of the period as of which it is paid, in reference to its internal accounting records and related accounting practices. If, based on such accounting records and practices, it is estimated that a particular distribution does not include capital gains orpaid-in surplus or other capital sources, a Section 19 Notice generally would not be issued. It is important to note that differences exist between a Portfolio’s daily internal accounting records and practices, a Portfolio’s financial statements presented in accordance with U.S. GAAP, and recordkeeping practices under income tax regulations. For instance, a Portfolio’s internal accounting records and practices may take into account, among other factors,tax-related characteristics of certain sources of distributions that differ from treatment under U.S. GAAP. Examples of such differences may include, among others, the treatment of paydowns on mortgage-backed securities purchased at a discount and periodic payments under interest rate swap contracts. Accordingly, among other consequences, it is possible that a Portfolio may not issue a Section 19 Notice in situations where the Portfolio’s financial statements prepared later and in accordance with U.S. GAAP and/or the final tax character of those distributions might later report that the sources of those distributions included capital gains and/or a return of capital. Please visit www.pimco.com for the most recent Section 19 Notice, if applicable, for additional information regarding the estimated composition of distributions. Final determination of a distribution’s tax character will be reported on Form 1099 DIV sent to shareholders for the calendar year.
Distributions classified as a tax basis return of capital, if any, are reflected on the Statements of Changes in Net Assets and have been recorded to paid in capital on the Statements of Assets and Liabilities. In addition, other amounts have been reclassified between distributable earnings (accumulated loss) and paid in capital on the Statements of Assets and Liabilities to more appropriately conform U.S. GAAP to tax characterizations of distributions.
(d) New Accounting Pronouncements In August 2016, the Financial Accounting Standards Board (“FASB”) issued an Accounting Standards Update (“ASU”), ASU2016-15, which amends Accounting Standards Codification (“ASC”) 230 to clarify guidance on the classification of certain cash receipts and cash payments in the Statement of Cash Flows. The ASU is effective for annual periods beginning after December 15, 2017, and interim periods within those annual periods. The Portfolio have adopted the ASU. The implementation of the ASU did not have an impact on the Portfolio’s financial statements.
In November 2016, the FASB issued ASU2016-18 which amends ASC 230 to provide guidance on the classification and presentation of changes in restricted cash and restricted cash equivalents on the Statement of Cash Flows. The ASU is effective for annual periods beginning after December 15, 2017, and interim periods within those annual periods. The Portfolio have adopted the ASU. The implementation of the ASU did not have an impact on the Portfolio’s financial statements.
In March 2017, the FASB issued ASU2017-08 which provides guidance related to the amortization period for certain purchased callable debt securities held at a premium. The ASU is effective for
| | | | | | |
| | ANNUAL REPORT | | DECEMBER 31, 2018 | | 113 |
Notes to Financial Statements(Cont.)
annual periods beginning after December 15, 2018, and interim periods within those annual periods. The Portfolio have adopted the ASU. The implementation of the ASU did not have an impact on the Portfolio’s financial statements.
In August 2018, the FASB issued ASU2018-13 which modifies certain disclosure requirements for fair value measurements in ASC 820. The ASU is effective for annual periods beginning after December 15, 2019, and interim periods within those annual periods. At this time, management has elected to early adopt the amendments that allow for removal of certain disclosure requirements. Management plans to adopt the amendments that require additional fair value measurement disclosures for annual periods beginning after December 15, 2019, and interim periods within those annual periods. Management is currently evaluating the impact of these changes on the financial statements.
In August 2018, the U.S. Securities and Exchange Commission (“SEC”) adopted amendments to certain rules and forms for the purpose of disclosure update and simplification. The compliance date for these amendments is 30 days after date of publication in the Federal Register, which was on October 4, 2018. Management has adopted these amendments and the changes are incorporated throughout all periods presented in the financial statements. Prior distributions for the year ended December 31, 2017, before these amendments became effective, were presented as follows (amounts in thousands†):
| | | | | | | | | | | | | | | | | | | | | | | | |
| | | | | | Series C | | | Series LD | | | Series M | | | Series R | | | Series TE | |
| | | | | | |
Distributions to Shareholders: | | | | | | | | | | | | | | | | | | | | | | | | |
| | | | | | |
| From net investment income | | | | | | $ | (37,777 | ) | | $ | (2,436 | ) | | $ | (64,159 | ) | | $ | (2,982 | ) | | $ | (3,191 | ) |
| | | | | | |
| From net realized capital gains | | | | | | | 0 | | | | 0 | | | | (11,632 | ) | | | 0 | | | | 0 | |
| | | | | | |
Total Distributions from Net Investment Income and/or Net Realized Capital Gains | | | | | | $ | (37,777 | ) | | $ | (2,436 | ) | | $ | (75,791 | ) | | $ | (2,982 | ) | | $ | (3,191 | ) |
| † | A zero balance may reflect actual amounts rounding to less than one thousand. |
3. INVESTMENT VALUATION AND FAIR VALUE MEASUREMENTS
(a) Investment Valuation Policies The price of a Portfolio’s shares is based on the Portfolio’s NAV. The NAV of a Portfolio’s, or each of its share classes, as applicable, is determined by dividing the total value of portfolio investments and other assets attributable to that Portfolio or class less any liabilities by the total number of shares outstanding of that Portfolio or class.
On each day that the New York Stock Exchange (“NYSE”) is open, Portfolio shares are ordinarily valued as of the close of regular trading (“NYSE Close”). Information that becomes known to the Portfolios or their agents after the time as of which NAV has been calculated on a particular day will not generally be used to retroactively adjust the price of a security or the NAV determined earlier that day. Each Portfolio reserves the right to change the time as of which its respective NAV is calculated if the Portfolio closes earlier, or as permitted by the SEC.
For purposes of calculating a NAV, portfolio securities and other assets for which market quotes are readily available are valued at market value. Market value is generally determined on the basis of official closing prices or the last reported sales prices, or if no sales are reported, based on quotes obtained from established market makers or prices (including evaluated prices) supplied by the Portfolios’ approved pricing services, quotation reporting systems and other third-party sources (together, “Pricing Services”). The Portfolios will normally use pricing data for domestic equity
| | | | | | |
| 114 | | PIMCO MANAGED ACCOUNTS TRUST | | | | |
December 31, 2018
securities received shortly after the NYSE Close and do not normally take into account trading, clearances or settlements that take place after the NYSE Close. If market value pricing is used, a foreign(non-U.S.) equity security traded on a foreign exchange or on more than one exchange is typically valued using pricing information from the exchange considered by PIMCO to be the primary exchange. A foreign(non-U.S.) equity security will be valued as of the close of trading on the foreign exchange, or the NYSE Close, if the NYSE Close occurs before the end of trading on the foreign exchange. Domestic and foreign(non-U.S.) fixed income securities,non-exchange traded derivatives, and equity options are normally valued on the basis of quotes obtained from brokers and dealers or Pricing Services using data reflecting the earlier closing of the principal markets for those securities. Prices obtained from Pricing Services may be based on, among other things, information provided by market makers or estimates of market values obtained from yield data relating to investments or securities with similar characteristics. Certain fixed income securities purchased on a delayed-delivery basis are marked to market daily until settlement at the forward settlement date. Exchange-traded options, except equity options, futures and options on futures are valued at the settlement price determined by the relevant exchange. Swap agreements are valued on the basis of bid quotes obtained from brokers and dealers or market-based prices supplied by Pricing Services. A Portfolio’s investments inopen-end management investment companies, other than exchange-traded funds (“ETFs”), are valued at the NAVs of such investments.
If a foreign(non-U.S.) equity security’s value has materially changed after the close of the security’s primary exchange or principal market but before the NYSE Close, the security may be valued at fair value based on procedures established and approved by the Board of Trustees (the “Board”). Foreign(non-U.S.) equity securities that do not trade when the NYSE is open are also valued at fair value. With respect to foreign(non-U.S.) equity securities, a Portfolio may determine the fair value of investments based on information provided by Pricing Services and other third-party vendors, which may recommend fair value or adjustments with reference to other securities, indices or assets. In considering whether fair valuation is required and in determining fair values, a Portfolio may, among other things, consider significant events (which may be considered to include changes in the value of U.S. securities or securities indices) that occur after the close of the relevant market and before the NYSE Close. A Portfolio may utilize modeling tools provided by third-party vendors to determine fair values ofnon-U.S. securities. For these purposes, any movement in the applicable reference index or instrument (“zero trigger”) relating to thenon-U.S security being fair valued between the earlier close of the applicable foreign market and the NYSE Close may be deemed to be a significant event, prompting the application of the pricing model (effectively resulting in daily fair valuations). Foreign exchanges may permit trading in foreign(non-U.S.) equity securities on days when a Portfolio is not open for business, which may result in a Portfolio’s portfolio investments being affected when shareholders are unable to buy or sell shares.
Senior secured floating rate loans for which an active secondary market exists to a reliable degree will be valued at the mean of the last available bid/ask prices in the market for such loans, as provided by a Pricing Service. Senior secured floating rate loans for which an active secondary market does not exist to a reliable degree will be valued at fair value, which is intended to approximate market value. In valuing a senior secured floating rate loan at fair value, the factors considered may include, but are not limited to, the following: (a) the creditworthiness of the borrower and any intermediate participants, (b) the terms of the loan, (c) recent prices in the market for similar loans, if any, and (d) recent prices in the market for instruments of similar quality, rate, period until next interest rate reset and maturity.
| | | | | | |
| | ANNUAL REPORT | | DECEMBER 31, 2018 | | 115 |
Notes to Financial Statements(Cont.)
Investments valued in currencies other than the U.S. dollar are converted to the U.S. dollar using exchange rates obtained from Pricing Services. As a result, the value of such investments and, in turn, the NAV of a Portfolio’s shares may be affected by changes in the value of currencies in relation to the U.S. dollar. The value of investments traded in markets outside the United States or denominated in currencies other than the U.S. dollar may be affected significantly on a day that a Portfolio is not open for business. As a result, to the extent that a Portfolio holds foreign(non-U.S.) investments, the value of those investments may change at times when shareholders are unable to buy or sell shares and the value of such investments will be reflected in the Portfolio’s next calculated NAV.
Investments for which market quotes or market based valuations are not readily available are valued at fair value as determined in good faith by the Board or persons acting at their direction. The Board has adopted methods for valuing securities and other assets in circumstances where market quotes are not readily available, and has delegated to PIMCO the responsibility for applying the fair valuation methods. In the event that market quotes or market based valuations are not readily available, and the security or asset cannot be valued pursuant to a Board approved valuation method, the value of the security or asset will be determined in good faith by the Board. Market quotes are considered not readily available in circumstances where there is an absence of current or reliable market-based data (e.g., trade information, bid/ask information, indicative market quotations (“Broker Quotes”), Pricing Services’ prices), including where events occur after the close of the relevant market, but prior to the NYSE Close, that materially affect the values of a Portfolio’s securities or assets. In addition, market quotes are considered not readily available when, due to extraordinary circumstances, the exchanges or markets on which the securities trade do not open for trading for the entire day and no other market prices are available. The Board has delegated, to the Adviser, the responsibility for monitoring significant events that may materially affect the values of a Portfolio’s securities or assets and for determining whether the value of the applicable securities or assets should be reevaluated in light of such significant events.
When a Portfolio uses fair valuation to determine the value of a portfolio security or other asset for purposes of calculating its NAV, such investments will not be priced on the basis of quotes from the primary market in which they are traded, but rather may be priced by another method that the Board or persons acting at their direction believe reflects fair value. Fair valuation may require subjective determinations about the value of a security. While the Trust’s policy is intended to result in a calculation of a Portfolio’s NAV that fairly reflects security values as of the time of pricing, the Trust cannot ensure that fair values determined by the Board or persons acting at their direction would accurately reflect the price that a Portfolio could obtain for a security if it were to dispose of that security as of the time of pricing (for instance, in a forced or distressed sale). The prices used by a Portfolio may differ from the value that would be realized if the securities were sold.
(b) Fair Value Hierarchy U.S. GAAP describes fair value as the price that a Portfolio would receive to sell an asset or pay to transfer a liability in an orderly transaction between market participants at the measurement date. It establishes a fair value hierarchy that prioritizes inputs to valuation methods and requires disclosure of the fair value hierarchy, separately for each major category of assets and liabilities, that segregates fair value measurements into levels (Level 1, 2, or 3). The
| | | | | | |
| 116 | | PIMCO MANAGED ACCOUNTS TRUST | | | | |
December 31, 2018
inputs or methodology used for valuing securities are not necessarily an indication of the risks associated with investing in those securities. Levels 1, 2, and 3 of the fair value hierarchy are defined as follows:
| ∎ | | Level 1 — Quoted prices in active markets or exchanges for identical assets and liabilities. |
| ∎ | | Level 2 — Significant other observable inputs, which may include, but are not limited to, quoted prices for similar assets or liabilities in markets that are active, quoted prices for identical or similar assets or liabilities in markets that are not active, inputs other than quoted prices that are observable for the assets or liabilities (such as interest rates, yield curves, volatilities, prepayment speeds, loss severities, credit risks and default rates) or other market corroborated inputs. |
| ∎ | | Level 3 — Significant unobservable inputs based on the best information available in the circumstances, to the extent observable inputs are not available, which may include assumptions made by the Board or persons acting at their direction that are used in determining the fair value of investments. |
Assets or liabilities categorized as Level 2 or 3 as of period end have been transferred between Levels 2 and 3 since the prior period due to changes in the method utilized in valuing the investments. Transfers from Level 3 to Level 2 are a result of the availability of current and reliable market-based data provided by Pricing Services or other valuation techniques which utilize significant observable inputs. In accordance with the requirements of U.S. GAAP, the amounts of transfers into and out of Level 3, if material, are disclosed in the Notes to Schedule of Investments for each respective Portfolio.
For fair valuations using significant unobservable inputs, U.S. GAAP requires a reconciliation of the beginning to ending balances for reported fair values that presents changes attributable to realized gain (loss), unrealized appreciation (depreciation), purchases and sales, accrued discounts (premiums), and transfers into and out of the Level 3 category during the period. The end of period value is used for the transfers between Levels of a Portfolio’s assets and liabilities. Additionally, U.S. GAAP requires quantitative information regarding the significant unobservable inputs used in the determination of fair value of assets or liabilities categorized as Level 3 in the fair value hierarchy. In accordance with the requirements of U.S. GAAP, a fair value hierarchy, and if material, a Level 3 reconciliation and details of significant unobservable inputs, have been included in the Notes to Schedule of Investments for each respective Portfolio.
(c) Valuation Techniques and the Fair Value Hierarchy
Level 1 and Level 2 trading assets and trading liabilities, at fair value The valuation methods (or “techniques”) and significant inputs used in determining the fair values of portfolio securities or other assets and liabilities categorized as Level 1 and Level 2 of the fair value hierarchy are as follows:
Fixed income securities including corporate, convertible and municipal bonds and notes, U.S. government agencies, U.S. treasury obligations, sovereign issues, bank loans, convertible preferred securities andnon-U.S. bonds are normally valued on the basis of quotes obtained from brokers and dealers or Pricing Services that use broker-dealer quotations, reported trades or valuation estimates from their internal pricing models. The Pricing Services’ internal models use inputs that are observable such as issuer details, interest rates, yield curves, prepayment speeds, credit risks/spreads,
| | | | | | |
| | ANNUAL REPORT | | DECEMBER 31, 2018 | | 117 |
Notes to Financial Statements(Cont.)
default rates and quoted prices for similar assets. Securities that use similar valuation techniques and inputs as described above are categorized as Level 2 of the fair value hierarchy.
Fixed income securities purchased on a delayed-delivery basis or as a repurchase commitment in a sale-buyback transaction are marked to market daily until settlement at the forward settlement date and are categorized as Level 2 of the fair value hierarchy.
Mortgage-related and asset-backed securities are usually issued as separate tranches, or classes, of securities within each deal. These securities are also normally valued by Pricing Services that use broker-dealer quotations, reported trades or valuation estimates from their internal pricing models. The pricing models for these securities usually consider tranche-level attributes, current market data, estimated cash flows and market-based yield spreads for each tranche, and incorporate deal collateral performance, as available. Mortgage-related and asset-backed securities that use similar valuation techniques and inputs as described above are categorized as Level 2 of the fair value hierarchy.
Common stocks, ETFs, exchange-traded notes and financial derivative instruments, such as futures contracts, rights and warrants, or options on futures that are traded on a national securities exchange, are stated at the last reported sale or settlement price on the day of valuation. To the extent these securities are actively traded and valuation adjustments are not applied, they are categorized as Level 1 of the fair value hierarchy. Investments valued (denominated) in currencies other than the U.S. dollar are converted to the U.S. dollar using exchange rates (currency spot and forward rates) obtained from Pricing Services. As a result, the NAV of a Portfolio’s shares may be affected by changes in the value of currencies in relation to the U.S. dollar. The value of securities traded in markets outside the United States or denominated in currencies other than the U.S. dollar may be affected significantly on a day that the Trust is not open for business.
Valuation adjustments may be applied to certain securities that are solely traded on a foreign exchange to account for the market movement between the close of the foreign market and the NYSE Close. These securities are valued using Pricing Services that consider the correlation of the trading patterns of the foreign security to the intraday trading in the U.S. markets for investments. Securities using these valuation adjustments are categorized as Level 2 of the fair value hierarchy. Preferred securities and other equities traded on inactive markets or valued by reference to similar instruments are also categorized as Level 2 of the fair value hierarchy.
Investments in registered open-end investment companies (other than ETFs) will be valued based upon the NAVs of such investments and are categorized as Level 1 of the fair value hierarchy. Investments in unregistered open-end investment companies will be calculated based upon the NAVs of such investments and are considered Level 1 provided that the NAVs are observable, calculated daily and are the value at which both purchases and sales will be conducted.
Equity exchange-traded options and over the counter financial derivative instruments, such as forward foreign currency contracts and options contracts derive their value from underlying asset prices, indices, reference rates, and other inputs or a combination of these factors. These contracts are normally valued on the basis of quotes obtained from a quotation reporting system, established market makers or Pricing Services (normally determined as of the NYSE Close). Depending on the product and the terms of the transaction, financial derivative instruments can be valued by Pricing
| | | | | | |
| 118 | | PIMCO MANAGED ACCOUNTS TRUST | | | | |
December 31, 2018
Services using a series of techniques, including simulation pricing models. The pricing models use inputs that are observed from actively quoted markets such as quoted prices, issuer details, indices, bid/ask spreads, interest rates, implied volatilities, yield curves, dividends and exchange rates. Financial derivative instruments that use similar valuation techniques and inputs as described above are categorized as Level 2 of the fair value hierarchy.
Centrally cleared swaps and over the counter swaps derive their value from underlying asset prices, indices, reference rates, and other inputs or a combination of these factors. They are valued using a broker-dealer bid quotation or on market-based prices provided by Pricing Services (normally determined as of the NYSE close). Centrally cleared swaps and over the counter swaps can be valued by Pricing Services using a series of techniques, including simulation pricing models. The pricing models may use inputs that are observed from actively quoted markets such as the overnight index swap rate (“OIS”), London Interbank Offered Rate (“LIBOR”) forward rate, interest rates, yield curves and credit spreads. These securities are categorized as Level 2 of the fair value hierarchy.
Level 3 trading assets and trading liabilities, at fair value When a fair valuation method is applied by PIMCO that uses significant unobservable inputs, investments will be priced by a method that the Board or persons acting at their direction believe reflects fair value and are categorized as Level 3 of the fair value hierarchy. The valuation techniques and significant inputs used in determining the fair values of portfolio assets and liabilities categorized as Level 3 of the fair value hierarchy are as follows:
Proxy pricing procedures set the base price of a fixed income security and subsequently adjust the price proportionally to market value changes of apre-determined security deemed to be comparable in duration, generally a U.S. Treasury or sovereign note based on country of issuance. The base price may be a broker-dealer quote, transaction price, or an internal value as derived by analysis of market data. The base price of the security may be reset on a periodic basis based on the availability of market data and procedures approved by the Valuation Oversight Committee. Significant changes in the unobservable inputs of the proxy pricing process (the base price) would result in direct and proportional changes in the fair value of the security. These securities are categorized as Level 3 of the fair value hierarchy.
If third-party evaluated vendor pricing is not available or not deemed to be indicative of fair value, the Adviser may elect to obtain Broker Quotes directly from the broker-dealer or passed through from a third-party vendor. In the event that fair value is based upon a single sourced Broker Quote, these securities are categorized as Level 3 of the fair value hierarchy. Broker Quotes are typically received from established market participants. Although independently received, the Adviser does not have the transparency to view the underlying inputs which support the market quotation. Significant changes in the Broker Quote would have direct and proportional changes in the fair value of the security.
Short-term debt instruments (such as commercial paper) having a remaining maturity of 60 days or less may be valued at amortized cost, so long as the amortized cost value of such short-term debt instruments is approximately the same as the fair value of the instrument as determined without the use of amortized cost valuation. These securities are categorized as Level 2 or Level 3 of the fair value hierarchy depending on the source of the base price.
| | | | | | |
| | ANNUAL REPORT | | DECEMBER 31, 2018 | | 119 |
Notes to Financial Statements(Cont.)
4. SECURITIES AND OTHER INVESTMENTS
(a) Investments in Affiliates
Each Portfolio may invest in the PIMCO Short Asset Portfolio and the PIMCO Short-Term Floating NAV Portfolio III (“Central Funds”) to the extent permitted by the Act and rules thereunder. The Central Funds are registered investment companies created for use solely by the series of the Trust and other series of registered investment companies advised by the Adviser, in connection with their cash management activities. The main investments of the Central Funds are money market and short maturity fixed income instruments. The Central Funds may incur expenses related to their investment activities, but do not pay Investment Advisory Fees or Supervisory and Administrative Fees to the Adviser. The Central Funds are considered to be affiliated with the Portfolios. The table below shows the Portfolios’ transactions in and earnings from these affiliated issuers for the period ended December 31, 2018 (amounts in thousands†):
Investments in PIMCO Short-Term Floating NAV Portfolio III
| | | | | | | | | | | | | | | | | | | | | | | | | | | | | | | | | | | | |
| Portfolio Name | | | | | Market
Value
12/31/2017 | | | Purchases at
Cost | | | Proceeds
from
Sales | | | Net
Realized
Gain
(Loss) | | | Change in
Unrealized
Appreciation
(Depreciation) | | | Market
Value
12/31/2018 | | | Dividend
Income(1) | | | Realized Net
Capital
Gain
Distributions(1) | |
| | | | | | | | | |
| Fixed Income SHares: Series C | | | | | | $ | 0 | | | $ | 131,837 | | | $ | (115,500 | ) | | $ | 2 | | | $ | 0 | | | $ | 16,339 | | | $ | 36 | | | $ | 0 | |
| | | | | | | | | |
| Fixed Income SHares: Series LD | | | | | | | 0 | | | | 36,407 | | | | (31,090 | ) | | | 0 | | | | 0 | | | | 5,317 | | | | 7 | | | | 0 | |
| | | | | | | | | |
| Fixed Income SHares: Series M | | | | | | | 0 | | | | 139,200 | | | | (115,700 | ) | | | 4 | | | | 0 | | | | 23,504 | | | | 199 | | | | 0 | |
| | | | | | | | | |
| Fixed Income SHares: Series TE | | | | | | | 0 | | | | 17,839 | | | | (16,460 | ) | | | 1 | | | | 0 | | | | 1,380 | | | | 38 | | | | 0 | |
| † | A zero balance may reflect actual amounts rounding to less than one thousand. |
| (1) | The tax characterization of distributions is determined in accordance with Federal income tax regulations and may contain a return of capital. The actual tax characterization of distributions received is determined at the end of the fiscal year of the affiliated fund. See Note 2, Distributions to Shareholders, in the Notes to Financial Statements for more information. |
(b) Investments in Securities
The Portfolios may utilize the investments and strategies described below to the extent permitted by each Portfolio’s respective investment policies.
Delayed-Delivery Transactions involve a commitment by a Portfolio to purchase or sell securities for a predetermined price or yield, with payment and delivery taking place beyond the customary settlement period. When delayed-delivery transactions are outstanding, a Portfolio will designate or receive as collateral liquid assets in an amount sufficient to meet the purchase price or respective obligations. When purchasing a security on a delayed-delivery basis, a Portfolio assumes the rights and risks of ownership of the security, including the risk of price and yield fluctuations, and takes such fluctuations into account when determining its NAV. A Portfolio may dispose of or renegotiate a delayed-delivery transaction after it is entered into, which may result in a realized gain (loss). When a Portfolio has sold a security on a delayed-delivery basis, the Portfolio does not participate in future gains (losses) with respect to the security.
Inflation-Indexed Bonds are fixed income securities whose principal value is periodically adjusted to the rate of inflation. In general, the value of an inflation-indexed security tends to decrease when
| | | | | | |
| 120 | | PIMCO MANAGED ACCOUNTS TRUST | | | | |
December 31, 2018
real interest rates increase and can increase when real interest rates decrease. Thus generally, during periods of rising inflation, the value of inflation-indexed securities will tend to increase and during periods of deflation, their value will tend to decrease. The interest rate on these bonds is generally fixed at issuance at a rate lower than typical bonds. Over the life of an inflation-indexed bond, however, interest will be paid based on a principal value which is adjusted for inflation. Any increase or decrease in the principal amount of an inflation-indexed bond will be included as interest income on the Statements of Operations, even though investors do not receive their principal until maturity. Repayment of the original bond principal upon maturity (as adjusted for inflation) is guaranteed in the case of U.S. Treasury inflation-indexed bonds. For bonds that do not provide a similar guarantee, the adjusted principal value of the bond repaid at maturity may be less than the original principal.
Loans and Other Indebtedness, Loan Participations and Assignments are direct debt instruments which are interests in amounts owed to lenders or lending syndicates by corporate, governmental, or other borrowers. A Portfolio’s investments in loans may be in the form of direct investments, participations in loans or assignments of all or a portion of loans from third parties or exposure to investments in loans through investments in a mutual fund or other pooled investment vehicle. A loan is often administered by a bank or other financial institution (the “agent”) that acts as agent for all holders. The agent administers the terms of the loan, as specified in the loan agreement. A Portfolio may invest in multiple series or tranches of a loan, which may have varying terms and carry different associated risks. A Portfolio generally has no right to enforce compliance with the terms of the loan agreement with the borrower. As a result, a Portfolio may be subject to the credit risk of both the borrower and the agent that is selling the loan agreement.
In the event of the insolvency of the agent selling a participation, a Portfolio may be treated as a general creditor of the agent and may not benefit from anyset-off between the agent and the borrower. When a Portfolio purchases assignments from agents it acquires direct rights against the borrowers of the loans. These loans may include participations in bridge loans, which are loans taken out by borrowers for a short period (typically less than one year) pending arrangement of more permanent financing through, for example, the issuance of bonds, frequently high yield bonds issued for the purpose of acquisitions.
Investments in loans are generally subject to risks similar to those of investments in other types of debt obligations, including, among others, credit risk, interest rate risk, variable and floating rate securities risk, and risks associated with mortgage-related securities. In addition, in many cases loans are subject to the risks associated with below-investment grade securities. The Portfolios may be subject to heightened or additional risks and potential liabilities and costs by investing in mezzanine and other subordinated loans, including those arising under bankruptcy, fraudulent conveyance, equitable subordination, environmental and other laws and regulations, and risks and costs associated with debt servicing and taking foreclosure actions associated with the loans.
Additionally, because loans are not ordinarily registered with the SEC or any state securities commission or listed on any securities exchange, there is usually less publicly available information about such instruments. In addition, loans may not be considered “securities” for purposes of the anti-fraud provisions under the federal securities laws and, as a result, as a purchaser of these instruments, a Portfolio may not be entitled to the anti-fraud protections of the federal securities laws. In the course of investing in such instruments, a Portfolio may come into possession of material
| | | | | | |
| | ANNUAL REPORT | | DECEMBER 31, 2018 | | 121 |
Notes to Financial Statements(Cont.)
nonpublic information and, because of prohibitions on trading in securities of issuers while in possession of such information, the Portfolio may be unable to enter into a transaction in a publicly-traded security of that issuer when it would otherwise be advantageous for the Portfolio to do so. Alternatively, a Portfolio may choose not to receive material nonpublic information about an issuer of such loans, with the result that the Portfolio may have less information about such issuers than other investors who transact in such assets.
The types of loans and related investments in which the Portfolios may invest include, among others, senior loans, subordinated loans (including second lien loans,B-Notes and mezzanine loans), whole loans, commercial real estate and other commercial loans and structured loans. The Portfolios may acquire direct interests in loans through primary loan distributions and/or in private transactions. In the case of subordinated loans, there may be significant indebtedness ranking ahead of the borrower’s obligation to the holder of such a loan, including in the event of the borrower’s insolvency. Mezzanine loans are typically secured by a pledge of an equity interest in the mortgage borrower that owns the real estate rather than an interest in a mortgage.
Investments in loans may include unfunded loan commitments, which are contractual obligations for future funding. Unfunded loan commitments may include revolving credit facilities, which may obligate a Portfolio to supply additional cash to the borrower on demand. Unfunded loan commitments represent a future obligation in full, even though a percentage of the committed amount may not be utilized by the borrower. When investing in a loan participation, a Portfolio has the right to receive payments of principal, interest and any fees to which it is entitled only from the agent selling the loan agreement and only upon receipt of payments by the agent from the borrower. Because investing in unfunded loan commitments creates a future obligation for a Portfolio to provide funding to a borrower upon demand in exchange for a fee, the Portfolio will segregate or earmark liquid assets with the Portfolio’s custodian in amounts sufficient to satisfy any such future obligations. A Portfolio may receive a commitment fee based on the undrawn portion of the underlying line of credit portion of a loan. In certain circumstances, a Portfolio may receive a penalty fee upon the prepayment of a loan by a borrower. Fees earned or paid are recorded as a component of interest income or interest expense, respectively, on the Statements of Operations. Unfunded loan commitments are reflected as a liability on the Statements of Assets and Liabilities.
Mortgage-Related and Other Asset-Backed Securities directly or indirectly represent a participation in, or are secured by and payable from, loans on real property. Mortgage-related securities are created from pools of residential or commercial mortgage loans, including mortgage loans made by savings and loan institutions, mortgage bankers, commercial banks and others. These securities typically provide a monthly payment which consists of both principal and interest. Interest may be determined by fixed or adjustable rates. In times of declining interest rates, there is a greater likelihood that a Portfolio’s higher yielding securities will bepre-paid with the Portfolio being unable to reinvest the proceeds in an investment with as great a yield. The rate of prepayments on underlying mortgages will affect the price and volatility of a mortgage-related security, and may have the effect of shortening or extending the effective duration of the security relative to what was anticipated at the time of purchase. Interest-only and principal-only securities are especially sensitive to interest rate changes, which can affect not only their prices but can also change the income flows and repayment assumptions about those investments. The timely payment of principal and interest of certain mortgage-related securities is guaranteed with the full faith and credit of the
| | | | | | |
| 122 | | PIMCO MANAGED ACCOUNTS TRUST | | | | |
December 31, 2018
U.S. Government. Pools created and guaranteed bynon-governmental issuers, including government-sponsored corporations, may be supported by various forms of insurance or guarantees, but there can be no assurance that private insurers or guarantors can meet their obligations under the insurance policies or guarantee arrangements. Many of the risks of investing in mortgage-related securities secured by commercial mortgage loans (“CMBS”) reflect the effects of local and other economic conditions on real estate markets, the ability of tenants to make lease payments, and the ability of a property to attract and retain tenants. These securities may be less liquid and may exhibit greater price volatility than other types of mortgage-related or other asset-backed securities. Other asset-backed securities are created from many types of assets, including, but not limited to, auto loans, accounts receivable, such as credit card receivables and hospital account receivables, home equity loans, student loans, boat loans, mobile home loans, recreational vehicle loans, manufactured housing loans, aircraft leases, computer leases and syndicated bank loans. The Portfolios may invest in any level of the capital structure of an issuer of mortgage-backed or asset-backed securities, including the equity or “first loss” tranche.
Collateralized Debt Obligations (“CDOs”) include Collateralized Bond Obligations (“CBOs”), Collateralized Loan Obligations (“CLOs”) and other similarly structured securities. CBOs and CLOs are types of asset-backed securities. A CBO is a trust which is typically backed by a diversified pool of high risk, below investment grade fixed income securities. A CLO is a trust typically collateralized by a pool of loans, which may include, among others, domestic and foreign senior secured loans, senior unsecured loans, and subordinate corporate loans, including loans that may be rated below investment grade or equivalent unrated loans. For both CBOs and CLOs, the cash flows from the trust are split into two or more portions, called tranches, varying in risk and yield. The riskiest portion is the “equity” tranche which bears the bulk of defaults from the bonds or loans in the trust and serves to protect the other, more senior tranches from default in all but the most severe circumstances. Since it is partially protected from defaults, a senior tranche from a CBO trust or CLO trust typically has higher ratings and lower yields than the underlying securities, and can be rated investment grade. Despite the protection from the equity tranche, CBO or CLO tranches can experience substantial losses due to actual defaults, increased sensitivity to defaults due to collateral default and disappearance of protecting tranches, market anticipation of defaults and aversion to CBO or CLO securities as a class. The risks of an investment in a CDO depend largely on the type of the collateral securities and the class of the CDO in which a Portfolio invests. CDOs carry additional risks including, but not limited to, (i) the possibility that distributions from collateral securities will not be adequate to make interest or other payments, (ii) the collateral may decline in value or default, (iii) the risk that a Portfolio may invest in CDOs that are subordinate to other classes, and (iv) the complex structure of the security may not be fully understood at the time of investment and may produce disputes with the issuer or unexpected investment results.
Collateralized Mortgage Obligations (“CMOs”) are debt obligations of a legal entity that are collateralized by whole mortgage loans or private mortgage bonds and divided into classes. CMOs are structured into multiple classes, often referred to as “tranches”, with each class bearing a different stated maturity and entitled to a different schedule for payments of principal and interest, including prepayments. CMOs may be less liquid and may exhibit greater price volatility than other types of mortgage-related or asset-backed securities.
| | | | | | |
| | ANNUAL REPORT | | DECEMBER 31, 2018 | | 123 |
Notes to Financial Statements(Cont.)
As CMOs have evolved, some classes of CMO bonds have become more common. For example, a Portfolio may invest inparallel-pay and planned amortization class (“PAC”) CMOs and multi-class pass-through certificates.Parallel-pay CMOs and multi-class pass-through certificates are structured to provide payments of principal on each payment date to more than one class. These simultaneous payments are taken into account in calculating the stated maturity date or final distribution date of each class, which, as with other CMO and multi-class pass-through structures, must be retired by its stated maturity date or final distribution date but may be retired earlier. PACs generally require payments of a specified amount of principal on each payment date. PACs areparallel-pay CMOs with the required principal amount on such securities having the highest priority after interest has been paid to all classes. Any CMO or multi-class pass-through structure that includes PAC securities must also have support tranches — known as support bonds, companion bonds ornon-PAC bonds — which lend or absorb principal cash flows to allow the PAC securities to maintain their stated maturities and final distribution dates within a range of actual prepayment experience. These support tranches are subject to a higher level of maturity risk compared to other mortgage-related securities, and usually provide a higher yield to compensate investors. If principal cash flows are received in amounts outside apre-determined range such that the support bonds cannot lend or absorb sufficient cash flows to the PAC securities as intended, the PAC securities are subject to heightened maturity risk. A Portfolio may invest in various tranches of CMO bonds, including support bonds and equity or “first loss” tranches (see “Collateralized Debt Obligations” above).
Stripped Mortgage-Backed Securities (“SMBS”) are derivative multi-class mortgage securities. SMBS are usually structured with two classes that receive different proportions of the interest and principal distributions on a pool of mortgage assets. An SMBS will have one class that will receive all of the interest (the interest-only or “IO” class), while the other class will receive the entire principal (the principal-only or “PO” class). Payments received for IOs are included in interest income on the Statements of Operations. Because no principal will be received at the maturity of an IO, adjustments are made to the cost of the security on a monthly basis until maturity. These adjustments are included in interest income on the Statements of Operations. Payments received for POs are treated as reductions to the cost and par value of the securities.
PaymentIn-Kind Securities (“PIKs”) may give the issuer the option at each interest payment date of making interest payments in either cash and/or additional debt securities. Those additional debt securities usually have the same terms, including maturity dates and interest rates, and associated risks as the original bonds. The daily market quotations of the original bonds may include the accrued interest (referred to as a dirty price) and require a pro rata adjustment from the unrealized appreciation (depreciation) on investments to interest receivable on the Statements of Assets and Liabilities.
Perpetual Bonds are fixed income securities with no maturity date but pay a coupon in perpetuity (with no specified ending or maturity date). Unlike typical fixed income securities, there is no obligation for perpetual bonds to repay principal. The coupon payments, however, are mandatory. While perpetual bonds have no maturity date, they may have a callable date in which the perpetuity is eliminated and the issuer may return the principal received on the specified call date. Additionally, a perpetual bond may have additional features, such as interest rate increases at periodic dates or an increase as of a predetermined point in the future.
| | | | | | |
| 124 | | PIMCO MANAGED ACCOUNTS TRUST | | | | |
December 31, 2018
Restricted Investments are subject to legal or contractual restrictions on resale and may generally be sold privately, but may be required to be registered or exempted from such registration before being sold to the public. Private placement securities are generally considered to be restricted except for those securities traded between qualified institutional investors under the provisions of Rule 144A of the Securities Act of 1933. Disposal of restricted investments may involve time-consuming negotiations and expenses, and prompt sale at an acceptable price may be difficult to achieve. Restricted investments held by the Portfolios at December 31, 2018 are disclosed in the Notes to Schedules of Investments.
Securities Issued by U.S. Government Agencies or Government-Sponsored Enterprises are obligations of and, in certain cases, guaranteed by, the U.S. Government, its agencies or instrumentalities. Some U.S. Government securities, such as Treasury bills, notes and bonds, and securities guaranteed by the Government National Mortgage Association (“GNMA” or “Ginnie Mae”), are supported by the full faith and credit of the U.S. Government; others, such as those of the Federal Home Loan Banks, are supported by the right of the issuer to borrow from the U.S. Department of the Treasury (the “U.S. Treasury”); and others, such as those of the Federal National Mortgage Association (“FNMA” or “Fannie Mae”), are supported by the discretionary authority of the U.S. Government to purchase the agency’s obligations. U.S. Government securities may include zero coupon securities. Zero coupon securities do not distribute interest on a current basis and tend to be subject to a greater risk than interest-paying securities.
Government-related guarantors (i.e., not backed by the full faith and credit of the U.S. Government) include FNMA and the Federal Home Loan Mortgage Corporation (“FHLMC” or “Freddie Mac”). FNMA is a government-sponsored corporation. FNMA purchases conventional (i.e., not insured or guaranteed by any government agency) residential mortgages from a list of approved seller/servicers which include state and federally chartered savings and loan associations, mutual savings banks, commercial banks and credit unions and mortgage bankers. Pass-through securities issued by FNMA are guaranteed as to timely payment of principal and interest by FNMA, but are not backed by the full faith and credit of the U.S. Government. FHLMC issues Participation Certificates (“PCs”), which are pass-through securities, each representing an undivided interest in a pool of residential mortgages. FHLMC guarantees the timely payment of interest and ultimate collection of principal, but PCs are not backed by the full faith and credit of the U.S. Government. Instead, they are supported only by the discretionary authority of the U.S. Government to purchase the agency’s obligations.
Roll-timing strategies can be used where a Portfolio seeks to extend the expiration or maturity of a position, such as a TBA security on an underlying asset, by closing out the position before expiration and opening a new position with respect to substantially the same underlying asset with a later expiration date. TBA securities purchased or sold are reflected on the Statements of Assets and Liabilities as an asset or liability, respectively. Recently finalized FINRA rules include mandatory margin requirements for the TBA market that require the Portfolios to post collateral in connection with their TBA transactions. There is no similar requirement applicable to the Portfolios’ TBA counterparties. The required collateralization of TBA trades could increase the cost of TBA transactions to the Portfolios and impose added operational complexity.
| | | | | | |
| | ANNUAL REPORT | | DECEMBER 31, 2018 | | 125 |
Notes to Financial Statements(Cont.)
5. BORROWINGS AND OTHER FINANCING TRANSACTIONS
The Portfolios may enter into the borrowings and other financing transactions described below to the extent permitted by each Portfolio’s respective investment policies.
The following disclosures contain information on a Portfolio’s ability to lend or borrow cash or securities to the extent permitted under the Act, which may be viewed as borrowing or financing transactions by a Portfolio. The location of these instruments in each Portfolio’s financial statements is described below. For a detailed description of credit and counterparty risks that can be associated with borrowings and other financing transactions; please see Note 7, Principal Risks.
(a) Repurchase Agreements Under the terms of a typical repurchase agreement, a Portfolio purchases an underlying debt obligation (collateral) subject to an obligation of the seller to repurchase, and a Portfolio to resell, the obligation at an agreed-upon price and time. In an open maturity repurchase agreement, there is nopre-determined repurchase date and the agreement can be terminated by the Portfolio or counterparty at any time. The underlying securities for all repurchase agreements are held by a Portfolio’s custodian or designated subcustodians undertri-party repurchase agreements and in certain instances will remain in custody with the counterparty. The market value of the collateral must be equal to or exceed the total amount of the repurchase obligations, including interest. Repurchase agreements, if any, including accrued interest, are included on the Statements of Assets and Liabilities. Interest earned is recorded as a component of interest income on the Statements of Operations. In periods of increased demand for collateral, a Portfolio may pay a fee for the receipt of collateral, which may result in interest expense to the Portfolio.
(b) Reverse Repurchase Agreements In a reverse repurchase agreement, a Portfolio delivers a security in exchange for cash to a financial institution, the counterparty, with a simultaneous agreement to repurchase the same or substantially the same security at an agreed upon price and date. In an open maturity reverse repurchase agreement, there is nopre-determined repurchase date and the agreement can be terminated by the Portfolio or counterparty at any time. A Portfolio is entitled to receive principal and interest payments, if any, made on the security delivered to the counterparty during the term of the agreement. Cash received in exchange for securities delivered plus accrued interest payments to be made by a Portfolio to counterparties are reflected as a liability on the Statements of Assets and Liabilities. Interest payments made by a Portfolio to counterparties are recorded as a component of interest expense on the Statements of Operations. In periods of increased demand for the security, a Portfolio may receive a fee for use of the security by the counterparty, which may result in interest income to the Portfolio. In the event the buyer of securities under a reverse repurchase agreement files for bankruptcy or becomes insolvent, a Portfolio’s use of the proceeds of the agreement may be restricted pending a determination by the other party, or its trustee or receiver, whether to enforce a Portfolio’s obligation to repurchase the securities. Reverse repurchase agreements involve leverage risk and also the risk that the market value of the securities to be repurchased may decline below the repurchase price; please see Note 7, Principal Risks. A Portfolio will segregate assets determined to be liquid by PIMCO or will otherwise cover its obligations under reverse repurchase agreements.
(c) Sale-Buybacks A sale-buyback financing transaction consists of a sale of a security by a Portfolio to a financial institution, the counterparty, with a simultaneous agreement to repurchase the same or
| | | | | | |
| 126 | | PIMCO MANAGED ACCOUNTS TRUST | | | | |
December 31, 2018
substantially the same security at an agreed-upon price and date. A Portfolio is not entitled to receive principal and interest payments, if any, made on the security sold to the counterparty during the term of the agreement. The agreed-upon proceeds for securities to be repurchased by a Portfolio are reflected as a liability on the Statements of Assets and Liabilities. A Portfolio will recognize net income represented by the price differential between the price received for the transferred security and the agreed-upon repurchase price. This is commonly referred to as the ‘price drop’. A price drop consists of (i) the foregone interest and inflationary income adjustments, if any, a Portfolio would have otherwise received had the security not been sold and (ii) the negotiated financing terms between a Portfolio and counterparty. Foregone interest and inflationary income adjustments, if any, are recorded as components of interest income on the Statements of Operations. Interest payments based upon negotiated financing terms made by a Portfolio to counterparties are recorded as a component of interest expense on the Statements of Operations. In periods of increased demand for the security, a Portfolio may receive a fee for use of the security by the counterparty, which may result in interest income to the Portfolio. A Portfolio will segregate assets determined to be liquid by PIMCO or will otherwise cover its obligations under sale-buyback transactions. Sale-buybacks involve leverage risk and also the risk that the market value of the securities to be repurchased may decline below the repurchase price ; please see Note 7, Principal Risks.
(d) Short Sales Short sales are transactions in which a Portfolio sells a security that it may not own. A Portfolio may make short sales of securities to (i) offset potential declines in long positions in similar securities, (ii) to increase the flexibility of the Portfolio, (iii) for investment return, (iv) as part of a risk arbitrage strategy, and (v) as part of its overall portfolio management strategies involving the use of derivative instruments. When a Portfolio engages in a short sale, it may borrow the security sold short and deliver it to the counterparty. A Portfolio will ordinarily have to pay a fee or premium to borrow a security and be obligated to repay the lender of the security any dividend or interest that accrues on the security during the period of the loan. Securities sold in short sale transactions and the dividend or interest payable on such securities, if any, are reflected as payable for short sales on the Statements of Assets and Liabilities. Short sales expose a Portfolio to the risk that it will be required to cover its short position at a time when the security or other asset has appreciated in value, thus resulting in losses to a Portfolio. A short sale is “against the box” if a Portfolio holds in its portfolio or has the right to acquire the security sold short, or securities identical to the security sold short, at no additional cost. A Portfolio will be subject to additional risks to the extent that it engages in short sales that are not “against the box.” A Portfolio’s loss on a short sale could theoretically be unlimited in cases where a Portfolio is unable, for whatever reason, to close out its short position.
(e) Tender Option Bond Transactions In a tender option bond transaction (“TOB”), a tender option bond trust (“TOB Trust”) issues floating rate certificates (“TOB Floater”) and residual interest certificates (“TOB Residual”) and utilizes the proceeds of such issuances to purchase a fixed rate municipal bond (“Fixed Rate Bond”) that is either owned or identified by a Portfolio. The TOB Floater is generally issued to third party investors (typically a money market fund) and the TOB Residual is generally issued to a Portfolio that sold or identified the Fixed Rate Bond. The TOB Trust divides the income stream provided by the Fixed Rate Bond to create two securities, the TOB Floater, which is a short-term security, and the TOB Residual, which is a longer-term security. The interest rates payable on the TOB Residual issued to a Portfolio bear an inverse relationship to the interest rate on the TOB Floater. The interest rate on the TOB Floater is reset by a remarketing process typically every 7 to 35 days. After income is paid on the TOB Floater at current rates, the residual income from the Fixed
| | | | | | |
| | ANNUAL REPORT | | DECEMBER 31, 2018 | | 127 |
Notes to Financial Statements(Cont.)
Rate Bond goes to the TOB Residual. Therefore, rising short-term rates result in lower income for the TOB Residual, and vice versa. In the case of a TOB Trust that utilizes the cash received (less transaction expenses) from the issuance of the TOB Floater and TOB Residual to purchase the Fixed Rate Bond from a Portfolio, a Portfolio may then invest the cash received in additional securities, generating leverage for a Portfolio. Other PIMCO-managed accounts may also contribute municipal bonds to a TOB Trust into which a Portfolio has contributed Fixed Rate Bonds. If multiple PIMCO-managed accounts participate in the same TOB Trust, the economic rights and obligations under the TOB Residual will be shared among the Portfolios ratably in proportion to their participation in the TOB Trust.
The TOB Residual may be more volatile and less liquid than other municipal bonds of comparable maturity. In most circumstances the TOB Residual holder bears substantially all of the underlying Fixed Rate Bond’s downside investment risk and also benefits from any appreciation in the value of the underlying Fixed Rate Bond. Investments in a TOB Residual typically will involve greater risk than investments in Fixed Rate Bonds.
A TOB Residual held by a Portfolio provides the Portfolio with the right to: (1) cause the holders of the TOB Floater to tender their notes at par, and (2) cause the sale of the Fixed Rate Bond held by the TOB Trust, thereby collapsing the TOB Trust. TOB Trusts are generally supported by a liquidity facility provided by a third party bank or other financial institution (the “Liquidity Provider”) that provides for the purchase of TOB Floaters that cannot be remarketed. The holders of the TOB Floaters have the right to tender their certificates in exchange for payment of par plus accrued interest on a periodic basis (typically weekly) or on the occurrence of certain mandatory tender events. The tendered TOB Floaters are remarketed by a remarketing agent, which is typically an affiliated entity of the Liquidity Provider. If the TOB Floaters cannot be remarketed, the TOB Floaters are purchased by the TOB Trust either from the proceeds of a loan from the Liquidity Provider or from a liquidation of the Fixed Rate Bond.
The TOB Trust may also be collapsed without the consent of a Portfolio, as the TOB Residual holder, upon the occurrence of certain “tender option termination events” (or “TOTEs”) as defined in the TOB Trust agreements. Such termination events typically include the bankruptcy or default of the Fixed Rate Bond, a substantial downgrade in credit quality of the Fixed Rate Bond, or a judgment or ruling that interest on the Fixed Rate Bond is subject to Federal income taxation. Upon the occurrence of a termination event, the TOB Trust would generally be liquidated in full with the proceeds typically applied first to any accrued fees owed to the trustee, remarketing agent and liquidity provider, and then to the holders of the TOB Floater up to par plus accrued interest owed on the TOB Floater and a portion of gain share, if any, with the balance paid out to the TOB Residual holder. In the case of a mandatory termination event (“MTE”), after the payment of fees, the TOB Floater holders would be paid before the TOB Residual holders (i.e., the Portfolios). In contrast, in the case of a TOTE, after payment of fees, the TOB Floater holders and the TOB Residual holders would be paid pro rata in proportion to the respective face values of their certificates.
Each Portfolio’s transfer of Fixed Rate Bonds to a TOB Trust is considered a secured borrowing for financial reporting purposes. The cash received by the TOB Trust from the sale of the TOB Floaters, less certain transaction expenses, is paid to a Portfolio. A Portfolio typically invests the cash received in additional municipal bonds. The Portfolios account for the transactions described above as secured
| | | | | | |
| 128 | | PIMCO MANAGED ACCOUNTS TRUST | | | | |
December 31, 2018
borrowings by including the Fixed Rate Bonds in their Schedules of Investments, and account for the TOB Floater as a liability under the caption “Payable for tender option bond floating rate certificates” in the Portfolios’ Statements of Assets and Liabilities. Interest income, including amortization and accretion of premiums and discounts, from the underlying municipal bonds is recorded by each Portfolio on an accrual basis and is shown as interest on the Statements of Operations. Interest expense incurred on the secured borrowing is shown as interest expense on the Statements of Operations.
The Portfolios may also purchase TOB Residuals in a secondary market transaction without transferring a fixed rate municipal bond into a TOB Trust. Such transactions are not accounted for as secured borrowings but rather as a security purchase with the TOB Residual being included in the Schedule of Investments.
In December 2013, regulators finalized rules implementing Section 619 (the “Volcker Rule”) and Section 941 (the “Risk Retention Rules”) of the Dodd-Frank Wall Street Reform and Consumer Protection Act. Both the Volcker Rule and the Risk Retention Rules apply to tender option bond programs. The Volcker Rule precludes banking entities from (i) sponsoring or acquiring interests in the trusts used to hold a municipal bond in the creation of TOB Trusts; and (ii) continuing to service or maintain relationships with existing programs involving TOB Trusts to the same extent and in the same capacity as existing programs. The Risk Retention Rules require the sponsor to a TOB Trust (e.g., a Portfolio) to retain at least five percent of the credit risk of the underlying assets supporting to the TOB Trust’s municipal bonds. The Risk Retention Rules may adversely affect the Portfolio’s ability to engage in tender option bond trust transactions or increase the costs of such transactions in certain circumstances.
In response to these rules, industry participants explored various structuring alternatives for TOB Trusts established after December 31, 2013 and TOB Trusts established prior to December 31, 2013 (“Legacy TOB Trusts”) and agreed on a new tender option bond structure in which the Portfolios hire service providers to assist with establishing, structuring and sponsoring a TOB Trust. Service providers to a TOB Trust, such as administrators, liquidity providers, trustees and remarketing agents act at the direction of, and as agent of, the Portfolios as the TOB residual holders.
The Portfolios have restructured their Legacy TOB Trusts in conformity with regulatory guidelines. Under the new TOB Trust structure, the Liquidity Provider or remarketing agent will no longer purchase the tendered TOB Floaters, even in the event of failed remarketing. This may increase the likelihood that a TOB Trust will need to be collapsed and liquidated in order to purchase the tendered TOB Floaters. The TOB Trust may draw upon a loan from the Liquidity Provider to purchase the tendered TOB Floaters. Any loans made by the Liquidity Provider will be secured by the purchased TOB Floaters held by the TOB Trust and will be subject to an interest rate agreed upon with the liquidity provider.
For the period ended December 31, 2018, the Portfolios’ average leverage outstanding from the use of TOB transactions and the daily weighted average interest rate, including fees, were as follows:
| | | | | | | | | | | | |
| Portfolio Name | | | | | Average Leverage
Outstanding (000s) | | | Weighted Average
Interest Rate | |
| Fixed Income SHares: Series TE | | | | | | $ | 3,198 | | | | 2.08% | |
| | | | | | |
| | ANNUAL REPORT | | DECEMBER 31, 2018 | | 129 |
Notes to Financial Statements(Cont.)
6. FINANCIAL DERIVATIVE INSTRUMENTS
The Portfolios may enter into the financial derivative instruments described below to the extent permitted by each Portfolio’s respective investment policies.
The following disclosures contain information on how and why the Portfolios use financial derivative instruments, and how financial derivative instruments affect the Portfolios’ financial position, results of operations and cash flows. The location and fair value amounts of these instruments on the Statements of Assets and Liabilities and the net realized gain (loss) and net change in unrealized appreciation (depreciation) on the Statements of Operations, each categorized by type of financial derivative contract and related risk exposure, are included in a table in the Notes to Schedules of Investments. The financial derivative instruments outstanding as of period end and the amounts of net realized gain (loss) and net change in unrealized appreciation (depreciation) on financial derivative instruments during the period, as disclosed in the Notes to Schedules of Investments, serve as indicators of the volume of financial derivative activity for the Portfolios.
(a) Forward Foreign Currency Contracts may be engaged, in connection with settling planned purchases or sales of securities, to hedge the currency exposure associated with some or all of a Portfolio’s securities or as part of an investment strategy. A forward foreign currency contract is an agreement between two parties to buy and sell a currency at a set price on a future date. The market value of a forward foreign currency contract fluctuates with changes in foreign currency exchange rates. Forward foreign currency contracts are marked to market daily, and the change in value is recorded by a Portfolio as an unrealized gain (loss). Realized gains (losses) are equal to the difference between the value of the contract at the time it was opened and the value at the time it was closed and are recorded upon delivery or receipt of the currency. The contractual obligations of a buyer or seller of a forward foreign currency contract may generally be satisfied by taking or making physical delivery of the underlying currency, establishing an opposite position in the contract and recognizing the profit or loss on both positions simultaneously on the delivery date or, in some instances, paying a cash settlement before the designated date of delivery. These contracts may involve market risk in excess of the unrealized gain (loss) reflected on the Statements of Assets and Liabilities. Although forwards may be intended to minimize the risk of loss due to a decline in the value of the hedged currencies, at the same time, they tend to limit any potential gain which might result should the value of such currencies increase. In addition, a Portfolio could be exposed to risk if the counterparties are unable to meet the terms of the contracts or if the value of the currency changes unfavorably to the U.S. dollar. To mitigate such risk, cash or securities may be exchanged as collateral pursuant to the terms of the underlying contracts.
(b) Futures Contracts are agreements to buy or sell a security or other asset for a set price on a future date.A Portfolio may use futures contracts to manage its exposure to the securities markets or to movements in interest rates and currency values or for other investment purposes. Generally, a futures contract provides for the future sale by one party and purchase by another party of a specified quantity of the security or other financial instrument at a specified price and time. The primary risks associated with the use of futures contracts are the imperfect correlation between the change in market value of the securities held by a Portfolio and the prices of futures contracts and the possibility of an illiquid market. Futures contracts are valued based upon their quoted daily settlement prices. Upon entering into a futures contract, a Portfolio is required to deposit with its futures broker an amount of cash, U.S. Government and Agency Obligations, or select sovereign
| | | | | | |
| 130 | | PIMCO MANAGED ACCOUNTS TRUST | | | | |
December 31, 2018
debt, in accordance with the initial margin requirements of the broker or exchange. Futures contracts are marked to market daily and based on changes in the price of the contracts, a Portfolio pays or receives cash or other eligible assets equal to the daily change in the value of the contract (“variation margin”). Gains (losses) are recognized but not considered realized until the contracts expire or close. Futures contracts involve, to varying degrees, risk of loss in excess of the variation margin included within exchange traded or centrally cleared financial derivative instruments on the Statements of Assets and Liabilities.
(c) Options Contracts An option on an instrument (or an index) is a contract that gives the holder of the option, in return for a premium, the right to buy from (in the case of a call) or sell to (in the case of a put) the writer of the option the instrument underlying the option (or the cash value of the index) at a specified exercise price at any time during the term of the option. Writing put options tends to increase a Portfolio’s exposure to the underlying instrument. Writing call options tends to decrease a Portfolio’s exposure to the underlying instrument. When a Portfolio writes a call or put, an amount equal to the premium received is recorded and subsequently marked to market to reflect the current value of the option written. These amounts are included on the Statements of Assets and Liabilities. Premiums received from writing options which expire are treated as realized gains. Premiums received from writing options which are exercised or closed are added to the proceeds or offset against amounts paid on the underlying futures, swap, security or currency transaction to determine the realized gain (loss). Certain options may be written with premiums to be determined on a future date. The premiums for these options are based upon implied volatility parameters at specified terms. A Portfolio as a writer of an option has no control over whether the underlying instrument may be sold (“call”) or purchased (“put”) and as a result bears the market risk of an unfavorable change in the price of the instrument underlying the written option. There is the risk a Portfolio may not be able to enter into a closing transaction because of an illiquid market.
Purchasing call options tends to increase a Portfolio’s exposure to the underlying instrument. Purchasing put options tends to decrease a Portfolio’s exposure to the underlying instrument. A Portfolio pays a premium which is included as an asset on the Statements of Assets and Liabilities and subsequently marked to market to reflect the current value of the option. Premiums paid for purchasing options which expire are treated as realized losses. Certain options may be purchased with premiums to be determined on a future date. The premiums for these options are based upon implied volatility parameters at specified terms. The risk associated with purchasing put and call options is limited to the premium paid. Premiums paid for purchasing options which are exercised or closed are added to the amounts paid or offset against the proceeds on the underlying investment transaction to determine the realized gain (loss) when the underlying transaction is executed.
Credit Default Swaptions may be written or purchased to hedge exposure to the credit risk of an investment without making a commitment to the underlying instrument. A credit default swaption is an option to sell or buy credit protection on a specific reference by entering into apre-defined swap agreement by some specified date in the future.
Foreign Currency Options may be written or purchased to be used as a short or long hedge against possible variations in foreign exchange rates or to gain exposure to foreign currencies.
| | | | | | |
| | ANNUAL REPORT | | DECEMBER 31, 2018 | | 131 |
Notes to Financial Statements(Cont.)
Inflation-Capped Options may be written or purchased to enhance returns or for hedging opportunities. The purpose of purchasing inflation-capped options is to protect a Portfolio from inflation erosion above a certain rate on a given notional exposure. A floor can be used to give downside protection to investments in inflation-linked products.
Interest Rate-Capped Optionsmay be written or purchased to enhance returns or for hedging opportunities. The purpose of purchasing interest rate-capped options is to protect a Portfolio from floating rate risk above a certain rate on a given notional exposure. A floor can be used to give downside protection to investments in interest rate linked products.
Interest Rate Swaptions may be written or purchased to enter into apre-defined swap agreement or to shorten, extend, cancel or otherwise modify an existing swap agreement, by some specified date in the future. The writer of the swaption becomes the counterparty to the swap if the buyer exercises. The interest rate swaption agreement will specify whether the buyer of the swaption will be a fixed-rate receiver or a fixed-rate payer upon exercise.
Options on Exchange-Traded Futures Contracts (“Futures Option”) may be written or purchased to hedge an existing position or future investment, for speculative purposes or to manage exposure to market movements. A Futures Option is an option contract in which the underlying instrument is a single futures contract.
Options on Securities may be written or purchased to enhance returns or to hedge an existing position or future investment. An option on a security uses a specified security as the underlying instrument for the option contract.
(d) Swap Agreements are bilaterally negotiated agreements between a Portfolio and a counterparty to exchange or swap investment cash flows, assets, foreign currencies or market-linked returns at specified, future intervals. Swap agreements may be privately negotiated in the over the counter market (“OTC swaps”) or may be cleared through a third party, known as a central counterparty or derivatives clearing organization (“Centrally Cleared Swaps”). A Portfolio may enter into asset, credit default, cross-currency, interest rate, total return, variance and other forms of swap agreements to manage its exposure to credit, currency, interest rate, commodity, equity and inflation risk. In connection with these agreements, securities or cash may be identified as collateral or margin in accordance with the terms of the respective swap agreements to provide assets of value and recourse in the event of default or bankruptcy/insolvency.
Centrally Cleared Swaps are marked to market daily based upon valuations as determined from the underlying contract or in accordance with the requirements of the central counterparty or derivatives clearing organization. Changes in market value, if any, are reflected as a component of net change in unrealized appreciation (depreciation) on the Statements of Operations. Daily changes in valuation of centrally cleared swaps, if any, are recorded as variation margin on the Statements of Assets and Liabilities. Centrally Cleared and OTC swap payments received or paid at the beginning of the measurement period are included on the Statements of Assets and Liabilities and represent premiums paid or received upon entering into the swap agreement to compensate for differences between the stated terms of the swap agreement and prevailing market conditions (credit spreads, currency exchange rates, interest rates, and other relevant factors). Upfront premiums received (paid) are
| | | | | | |
| 132 | | PIMCO MANAGED ACCOUNTS TRUST | | | | |
December 31, 2018
initially recorded as liabilities (assets) and subsequently marked to market to reflect the current value of the swap. These upfront premiums are recorded as realized gain (loss) on the Statements of Operations upon termination or maturity of the swap. A liquidation payment received or made at the termination of the swap is recorded as realized gain (loss) on the Statements of Operations. Net periodic payments received or paid by a Portfolio are included as part of realized gain (loss) on the Statements of Operations.
For purposes of a Portfolio’s investment policy adopted pursuant to Rule35d-1 under the 1940 Act (if any), the Portfolio will count derivative instruments at market value. For purposes of applying a Portfolio’s other investment policies and restrictions, swap agreements, like other derivative instruments, may be valued by a Portfolio at market value, notional value or full exposure value (i.e., the sum of the notional amount for the contract plus the market value) or any combination of the foregoing (e.g., notional value for purposes of calculating the numerator and market value for purposes of calculating the denominator for compliance with a particular policy or restriction). See Note 6 — Asset Segregation below. In the case of a credit default swap, in applying certain of a Portfolio’s investment policies and restrictions, the Portfolios will value the credit default swap at its notional value or its full exposure value (i.e., the sum of the notional amount for the contract plus the market value), but may value the credit default swap at market value for purposes of applying certain of a Portfolio’s other investment policies and restrictions. For example, a Portfolio may value credit default swaps at full exposure value for purposes of a Portfolio’s credit quality guidelines (if any) because such value in general better reflects a Portfolio’s actual economic exposure during the term of the credit default swap agreement. As a result, a Portfolio may, at times, have notional exposure to an asset class (before netting) that is greater or lesser than the stated limit or restriction noted in a Portfolio’s prospectus. In this context, both the notional amount and the market value may be positive or negative depending on whether a Portfolio is selling or buying protection through the credit default swap. The manner in which certain securities or other instruments are valued by a Portfolio for purposes of applying investment policies and restrictions may differ from the manner in which those investments are valued by other types of investors.
Entering into swap agreements involves, to varying degrees, elements of interest, credit, market and documentation risk in excess of the amounts recognized on the Statements of Assets and Liabilities. Such risks involve the possibility that there will be no liquid market for these agreements, that the counterparty to the agreements may default on its obligation to perform or disagree as to the meaning of contractual terms in the agreements and that there may be unfavorable changes in interest rates or the values of the asset upon which the swap is based.
A Portfolio’s maximum risk of loss from counterparty credit risk is the discounted net value of the cash flows to be received from the counterparty over the contract’s remaining life, to the extent that amount is positive. The risk may be mitigated by having a master netting arrangement between a Portfolio and the counterparty and by the posting of collateral to a Portfolio to cover a Portfolio’s exposure to the counterparty.
To the extent a Portfolio has a policy to limit the net amount owed to or to be received from a single counterparty under existing swap agreements, such limitation only applies to counterparties to OTC swaps and does not apply to centrally cleared swaps where the counterparty is a central counterparty or derivatives clearing organization.
| | | | | | |
| | ANNUAL REPORT | | DECEMBER 31, 2018 | | 133 |
Notes to Financial Statements(Cont.)
Credit Default Swap Agreements on corporate, loan, sovereign, U.S. municipal or U.S. Treasury issues are entered into to provide a measure of protection against defaults of the issuers (i.e., to reduce risk where a Portfolio owns or has exposure to the referenced obligation) or to take an active long or short position with respect to the likelihood of a particular issuer’s default. Credit default swap agreements involve one party making a stream of payments (referred to as the buyer of protection) to another party (the seller of protection) in exchange for the right to receive a specified return in the event that the referenced entity, obligation or index, as specified in the swap agreement, undergoes a certain credit event. As a seller of protection on credit default swap agreements, a Portfolio will generally receive from the buyer of protection a fixed rate of income throughout the term of the swap provided that there is no credit event. As the seller, a Portfolio would effectively add leverage to its portfolio because, in addition to its total net assets, a Portfolio would be subject to investment exposure on the notional amount of the swap.
If a Portfolio is a seller of protection and a credit event occurs, as defined under the terms of that particular swap agreement, a Portfolio will either (i) pay to the buyer of protection an amount equal to the notional amount of the swap and take delivery of the referenced obligation, other deliverable obligations or underlying securities comprising the referenced index or (ii) pay a net settlement amount in the form of cash or securities equal to the notional amount of the swap less the recovery value of the referenced obligation or underlying securities comprising the referenced index. If a Portfolio is a buyer of protection and a credit event occurs, as defined under the terms of that particular swap agreement, a Portfolio will either (i) receive from the seller of protection an amount equal to the notional amount of the swap and deliver the referenced obligation, other deliverable obligations or underlying securities comprising the referenced index or (ii) receive a net settlement amount in the form of cash or securities equal to the notional amount of the swap less the recovery value of the referenced obligation or underlying securities comprising the referenced index. Recovery values are estimated by market makers considering either industry standard recovery rates or entity specific factors and considerations until a credit event occurs. If a credit event has occurred, the recovery value is determined by a facilitated auction whereby a minimum number of allowable broker bids, together with a specified valuation method, are used to calculate the settlement value. The ability to deliver other obligations may result in acheapest-to-deliver option (the buyer of protection’s right to choose the deliverable obligation with the lowest value following a credit event).
Credit default swap agreements on corporate or sovereign issues involve one party making a stream of payments to another party in exchange for the right to receive a specified return in the event of a default or other credit event. If a credit event occurs and cash settlement is not elected, a variety of other deliverable obligations may be delivered in lieu of the specific referenced obligation. The ability to deliver other obligations may result in acheapest-to-deliver option (the buyer of protection’s right to choose the deliverable obligation with the lowest value following a credit event).
Credit default swap agreements on credit indices involve one party making a stream of payments to another party in exchange for the right to receive a specified return in the event of a write-down, principal shortfall, interest shortfall or default of all or part of the referenced entities comprising the credit index. A credit index is a basket of credit instruments or exposures designed to be representative of some part of the credit market as a whole. These indices are made up of reference credits that are judged by a poll of dealers to be the most liquid entities in the credit default swap market based on the sector of the index. Components of the indices may include, but are not limited
| | | | | | |
| 134 | | PIMCO MANAGED ACCOUNTS TRUST | | | | |
December 31, 2018
to, investment grade securities, high yield securities, asset-backed securities, emerging markets, and/or various credit ratings within each sector. Credit indices are traded using credit default swaps with standardized terms including a fixed spread and standard maturity dates. An index credit default swap references all the names in the index, and if there is a default, the credit event is settled based on that name’s weight in the index. The composition of the indices changes periodically, usually every six months, and for most indices, each name has an equal weight in the index. Credit default swaps on credit indices may be used to hedge a portfolio of credit default swaps or bonds, which is less expensive than it would be to buy many credit default swaps to achieve a similar effect or to take an active long or short position with respect to the likelihood of a particular referenced obligation’s default. Credit default swaps on indices are instruments often used to attempt to protect investors owning bonds against default, but may also be used for speculative purposes.
Implied credit spreads, represented in absolute terms, utilized in determining the market value of credit default swap agreements on corporate, loan, sovereign, U.S. municipal or U.S. Treasury issues as of period end, if any, are disclosed in the Notes to Schedules of Investments. They serve as an indicator of the current status of payment/performance risk and represent the likelihood or risk of default for the reference entity. The implied credit spread of a particular referenced entity reflects the cost of buying/selling protection and may include upfront payments required to be made to enter into the agreement. Wider credit spreads represent a deterioration of the referenced entity’s credit soundness and a greater likelihood or risk of default or other credit event occurring as defined under the terms of the agreement. For credit default swap agreements on asset-backed securities and credit indices, the quoted market prices and resulting values serve as the indicator of the current status of the payment/performance risk. Increasing market values, in absolute terms when compared to the notional amount of the swap, represent a deterioration of the referenced entity’s credit soundness and a greater likelihood or risk of default or other credit event occurring as defined under the terms of the agreement.
The maximum potential amount of future payments (undiscounted) that a Portfolio as a seller of protection could be required to make under a credit default swap agreement equals the notional amount of the agreement. Notional amounts of each individual credit default swap agreement outstanding as of period end for which a Portfolio is the seller of protection are disclosed in the Notes to Schedules of Investments. These potential amounts would be partially offset by any recovery values of the respective referenced obligations, upfront payments received upon entering into the agreement, or net amounts received from the settlement of buy protection credit default swap agreements entered into by a Portfolio for the same referenced entity or entities.
Interest Rate Swap Agreements may be entered into to help hedge against interest rate risk exposure and to maintain a Portfolio’s ability to generate income at prevailing market rates. The value of the fixed rate bonds that the Portfolios hold may decrease if interest rates rise. To help hedge against this risk and to maintain its ability to generate income at prevailing market rates, a Portfolio may enter into interest rate swap agreements. Interest rate swap agreements involve the exchange by a Portfolio with another party for their respective commitment to pay or receive interest on the notional amount of principal. Certain forms of interest rate swap agreements may include: (i) interest rate caps, under which, in return for a premium, one party agrees to make payments to the other to the extent that interest rates exceed a specified rate, or “cap”, (ii) interest rate floors, under which, in return for a premium, one party agrees to make payments to the other to the extent
| | | | | | |
| | ANNUAL REPORT | | DECEMBER 31, 2018 | | 135 |
Notes to Financial Statements(Cont.)
that interest rates fall below a specified rate, or “floor”, (iii) interest rate collars, under which a party sells a cap and purchases a floor or vice versa in an attempt to protect itself against interest rate movements exceeding given minimum or maximum levels, (iv) callable interest rate swaps, under which the buyer pays an upfront fee in consideration for the right to early terminate the swap transaction in whole, at zero cost and at a predetermined date and time prior to the maturity date, (v) spreadlocks, which allow the interest rate swap users to lock in the forward differential (or spread) between the interest rate swap rate and a specified benchmark, or (vi) basis swaps, under which two parties can exchange variable interest rates based on different segments of money markets.
Total Return Swap Agreements are entered into to gain or mitigate exposure to the underlying reference asset. Total return swap agreements involve commitments where single or multiple cash flows are exchanged based on the price of an underlying reference asset and on a fixed or variable interest rate. Total return swap agreements may involve commitments to pay interest in exchange for a market-linked return. One counterparty pays out the total return of a specific underlying reference asset, which may include a single security, a basket of securities, or an index, and in return receives a fixed or variable rate. At the maturity date, a net cash flow is exchanged where the total return is equivalent to the return of the underlying reference asset less a financing rate, if any. As a receiver, a Portfolio would receive payments based on any net positive total return and would owe payments in the event of a net negative total return. As the payer, a Portfolio would owe payments on any net positive total return, and would receive payments in the event of a net negative total return.
Asset Segregation Certain of the transactions described above can be viewed as constituting a form of borrowing or financing transaction by a Portfolio. In such event, a Portfolio will cover its commitment under such transactions by segregating or “earmarking” assets in accordance with procedures adopted by the Board, in which case such transactions will not be considered “senior securities” by a Portfolio. With respect to forwards, futures contracts, options and swaps that are required to cash settle (i.e., where physical delivery of the underlying reference asset is not required), a Portfolio is permitted to segregate or earmark liquid assets equal to the Portfolio’s dailymarked-to-market net obligation under the derivative instrument, if any, rather than the derivative’s full notional value (i.e., the market value of the reference asset underlying the forward or derivative). By segregating or earmarking liquid assets equal to only its netmarked-to-market obligation under derivatives that are required to cash settle, a Portfolio will have the ability to utilize such instruments to a greater extent than if a Portfolio were to segregate or earmark liquid assets equal to the full notional value of the instrument.
7. PRINCIPAL RISKS
The principal risks of investing in a Portfolio, which could adversely affect its net asset value, yield and total return, are listed below.
| | | | | | | | | | | | | | | | | | | | | | | | |
| | | | | | FISH: Series C | | | FISH: Series LD | | | FISH: Series M | | | FISH: Series R | | | FISH: Series TE | |
| Risks | | | | | | | | | | | | | | | | | | | | | | | | |
| Interest Rate | | | | | | | X | | | | X | | | | X | | | | X | | | | X | |
| Credit | | | | | | | X | | | | X | | | | X | | | | X | | | | X | |
| Market | | | | | | | X | | | | X | | | | X | | | | X | | | | X | |
| Foreign(Non-U.S.) Investment | | | | | | | X | | | | X | | | | X | | | | X | | | | — | |
| | | | | | |
| 136 | | PIMCO MANAGED ACCOUNTS TRUST | | | | |
December 31, 2018
| | | | | | | | | | | | | | |
| | | | | | FISH: Series C | | FISH: Series LD | | FISH: Series M | | FISH: Series R | | FISH: Series TE |
| Mortgage-Related and Other Asset-Backed Securities | | | | | | X | | X | | X | | X | | — |
| Emerging Markets | | | | | | X | | X | | X | | X | | — |
| Focused Investment | | | | | | X | | X | | X | | X | | X |
| Derivatives | | | | | | X | | X | | X | | X | | X |
| Liquidity | | | | | | X | | X | | X | | X | | X |
| Management | | | | | | X | | X | | X | | X | | X |
| High Yield | | | | | | X | | X | | X | | X | | — |
| Currency | | | | | | X | | X | | X | | X | | — |
| Leveraging | | | | | | X | | X | | X | | X | | — |
| Issuer | | | | | | X | | X | | X | | X | | X |
| Turnover | | | | | | X | | X | | X | | X | | X |
| Municipal Securities | | | | | | X | | X | | X | | X | | X |
| IssuerNon-Diversification | | | | | | — | | — | | — | | — | | X |
| Municipal Project-Specific | | | | | | — | | — | | — | | — | | X |
| Municipal Bond Market | | | | | | — | | — | | — | | — | | X |
| California State-Specific | | | | | | — | | — | | — | | — | | X |
| New York State-Specific | | | | | | — | | — | | — | | — | | X |
| Sovereign Debt | | | | | | — | | — | | — | | X | | — |
Please see “Description of Principal Risks” in a Portfolio’s prospectus for a more detailed description of the risks of investing in a Portfolio.
Interest Rate Risk is the risk that fixed income securities will decline in value because of an increase in interest rates; a portfolio with a longer average portfolio duration will be more sensitive to changes in interest rates than a portfolio with a shorter average portfolio duration.
Credit Risk is the risk that the Portfolio could lose money if the issuer or guarantor of a fixed income security, or the counterparty to a derivative contract, is unable or unwilling to meet its financial obligations.
Market Risk is the risk that the value of securities owned by the Portfolio may go up or down, sometimes rapidly or unpredictably, due to factors affecting securities markets generally or particular industries.
Foreign(Non-U.S.) Investment Risk is the risk that investing in foreign(non-U.S.) securities may result in the Portfolio experiencing more rapid and extreme changes in value than a portfolio that invests exclusively in securities of U.S. companies due to smaller markets, differing reporting, accounting and auditing standards, increased risk of delayed settlement of portfolio transactions or loss of certificates of portfolio securities, and the risk of unfavorable foreign government actions, including nationalization, expropriation or confiscatory taxation, currency blockage, or political changes or diplomatic developments. Foreign securities may also be less liquid and more difficult to value than securities of U.S. issuers.
| | | | | | |
| | ANNUAL REPORT | | DECEMBER 31, 2018 | | 137 |
Notes to Financial Statements(Cont.)
Mortgage-Related and Other Asset-Backed Securities Risk is the risk of investing in mortgage-related and other asset- backed securities, including interest rate risk, extension risk, prepayment risk, and credit risk.
Emerging Markets Risk is the risk of investing in securities of issuers economically tied to countries with developing economies, which may subject the Portfolio to market, credit, currency, liquidity, legal, political, technical and other risks different from, or greater than, the risks of investing in developed countries.
Focused Investment Risk is the risk that, to the extent that the Portfolio focuses its investments in a particular sector, it may be susceptible to loss due to adverse developments affecting that sector. Furthermore, the Portfolio may invest a substantial portion of its assets in companies in related sectors that may share common characteristics, are often subject to similar business risks and regulatory burdens, and whose securities may react similarly to market developments, which will subject the Portfolio to greater risk. The Portfolio also will be subject to focused investment risk to the extent that it invests a substantial portion of its assets in a particular issuer, market, asset class, country or geographic region.
Derivatives Risk is the risk of investing in derivative instruments (such as futures, swaps and structured securities), including leverage, liquidity, interest rate, market, credit, management and valuation risks, as well as the risks of valuation complexity. The Portfolio’s use of derivatives may result in losses to the Portfolio, a reduction in the Portfolio’s returns and/or increased volatility. Changes in the value of a derivative may not correlate perfectly with, and may be more sensitive to market events than, the underlying asset, rate or index, and the Portfolio could lose more than the initial amount invested.Over-the-counter (“OTC”) derivatives are also subject to the risk that a counterparty to the transaction will not fulfill its contractual obligations to the other party, as many of the protections afforded to centrally-cleared derivative transactions might not be available for OTC derivatives. For derivatives traded on exchanges or through a central counterparty, credit risk resides with the Portfolio’s clearing broker or the clearinghouse itself, rather than with a counterparty in an OTC derivative transaction. Changes in regulation relating to a mutual fund’s use of derivatives and related instruments could potentially limit or impact the Portfolio’s ability to invest in derivatives, limit the Portfolio’s ability to employ certain strategies that use derivatives and/or adversely affect the value of derivatives and the Portfolio’s performance.
Liquidity Risk is the risk that a particular investment may be difficult to purchase or sell and the Portfolio may be unable to sell illiquid securities at an advantageous time or price or achieve its desired level of exposure to a certain sector. Liquidity risk may result from the lack of an active market, reduced number and capacity of traditional market participants to make a market in fixed income securities, and may be magnified in a rising interest rate environment or other circumstances where investor redemptions from fixed income funds may be higher than normal, causing increased supply in the market due to selling activity.
Management Risk isthe risk that the investment techniques and risk analyses applied by PIMCO will not produce the desired results and that actual or potential conflicts of interest, legislative, regulatory, or tax restrictions, policies or developments may affect the investment techniques available to PIMCO and the individual portfolio manager(s) in connection with managing the
| | | | | | |
| 138 | | PIMCO MANAGED ACCOUNTS TRUST | | | | |
December 31, 2018
Portfolio and may cause PIMCO to restrict or prohibit participation in certain investments. There is no guarantee that the investment objective of the Portfolio will be achieved.
High Yield Risk is the risk that high yield securities and unrated securities of similar credit quality (commonly known as “junk bonds”) are subject to greater levels of credit and liquidity risks. High yield securities are considered primarily speculative with respect to the issuer’s continuing ability to make principal and interest payments, and may be more volatile than higher-rated securities of similar maturity.
Currency Risk is the risk that foreign(non-U.S.) currencies will decline in value relative to the U.S. dollar or other foreign(non-U.S.) currencies and affect the Portfolio’s investments in foreign(non-U.S.) currencies or in securities that trade in, and receive revenues in, or in derivatives that provide exposure to, foreign(non-U.S.) currencies.
Leveraging Risk is the risk that certain transactions of the Portfolio, such as reverse repurchase agreements, loans of portfolio securities, the use of when-issued, delayed delivery or forward commitment transactions, or derivative instruments, may give rise to leverage, magnifying gains and losses and causing the Portfolio to be more volatile than if it had not been leveraged. This means that leverage entails a heightened risk of loss.
Issuer Risk is the risk that the value of a security may decline for a reason directly related to the issuer, such as management performance, financial leverage and/or reduced demand for the issuer’s goods or services.
Turnover Risk is the risk that high levels of portfolio turnover may increase transaction costs and taxes and may lower investment performance.
Municipal Securities Risk is the risk that investing in municipal securities subjects the Portfolio to certain risks, including variations in the quality of municipal securities, both within a particular classification and between classifications. The rates of return on municipal securities can depend on a variety of factors, including general money market conditions, the financial condition of the issuer, general conditions of the municipal bond market, the size of a particular offering, the maturity of the obligation, and the rating of the issue.
IssuerNon-Diversification Risk is the risk of focusing investments in a small number of issuers, including being more susceptible to risks associated with a single economic, political or regulatory occurrence than a more diversified portfolio might be. Portfolios that are“non-diversified” may invest a greater percentage of their assets in the securities of a single issuer (such as bonds issued by a particular state) than funds that are “diversified”.
Municipal Project-Specific Risk is the risk that the Portfolio may be more sensitive to adverse economic, business or political developments if it invests a substantial portion of its assets in the bonds of similar projects (such as those relating to education, health care, housing, transportation, and utilities), industrial development bonds, or in bonds from issuers in a single state.
Municipal Bond Market Risk is the risk that the Portfolio may be adversely affected due to factors such as limited amount of public information available regarding the municipal bonds held in the
| | | | | | |
| | ANNUAL REPORT | | DECEMBER 31, 2018 | | 139 |
Notes to Financial Statements(Cont.)
Portfolio as compared to that for corporate equities or bonds, legislative changes and local and business developments, general conditions of the municipal bond market, the size of the particular offering, the rating of the issue and the maturity of the obligation.
California State-Specific Risk is the risk that the Portfolio, to the extent it concentrates its investments in California municipal bonds, may be affected significantly by economic, regulatory or political developments affecting the ability of California issuers to pay interest or repay principal.
New York State-Specific Risk is the risk that the Portfolio, to the extent it concentrates its investments in New York municipal bonds, may be affected significantly by economic, regulatory or political developments affecting the ability of New York issuers to pay interest or repay principal.
Sovereign Debt Risk is the risk that investments in fixed income instruments issued by sovereign entities may decline in value as a result of default or other adverse credit event resulting from the issuer’s inability or unwillingness to make principal or interest payments in a timely fashion.
8. MASTER NETTING ARRANGEMENTS
A Portfolio may be subject to various netting arrangements (“Master Agreements”) with select counterparties. Master Agreements govern the terms of certain transactions, and are intended to reduce the counterparty risk associated with relevant transactions by specifying credit protection mechanisms and providing standardization that is intended to improve legal certainty. Each type of Master Agreement governs certain types of transactions. Different types of transactions may be traded out of different legal entities or affiliates of a particular organization, resulting in the need for multiple agreements with a single counterparty. As the Master Agreements are specific to unique operations of different asset types, they allow a Portfolio to close out and net its total exposure to a counterparty in the event of a default with respect to all the transactions governed under a single Master Agreement with a counterparty. For financial reporting purposes the Statements of Assets and Liabilities generally present derivative assets and liabilities on a gross basis, which reflects the full risks and exposures prior to netting.
Master Agreements can also help limit counterparty risk by specifying collateral posting arrangements atpre-arranged exposure levels. Under most Master Agreements, collateral is routinely transferred if the total net exposure to certain transactions (net of existing collateral already in place) governed under the relevant Master Agreement with a counterparty in a given account exceeds a specified threshold, which typically ranges from zero to $250,000 depending on the counterparty and the type of Master Agreement. United States Treasury Bills and U.S. dollar cash are generally the preferred forms of collateral, although other securities may be used depending on the terms outlined in the applicable Master Agreement. Securities and cash pledged as collateral are reflected as assets on the Statements of Assets and Liabilities as either a component of Investments at value (securities) or Deposits with counterparty. Cash collateral received is not typically held in a segregated account and as such is reflected as a liability on the Statements of Assets and Liabilities as Deposits from counterparty. The market value of any securities received as collateral is not reflected as a component of NAV. A Portfolio’s overall exposure to counterparty risk can change substantially within a short period, as it is affected by each transaction subject to the relevant Master Agreement.
Master Repurchase Agreements and Global Master Repurchase Agreements (individually and collectively “Master Repo Agreements”) govern repurchase, reverse repurchase, and certain sale-
| | | | | | |
| 140 | | PIMCO MANAGED ACCOUNTS TRUST | | | | |
December 31, 2018
buyback transactions between a Portfolio and select counterparties. Master Repo Agreements maintain provisions for, among other things, initiation, income payments, events of default, and maintenance of collateral. The market value of transactions under the Master Repo Agreement, collateral pledged or received, and the net exposure by counterparty as of period end are disclosed in the Notes to Schedules of Investments.
Master Securities Forward Transaction Agreements (“Master Forward Agreements”) govern certain forward settling transactions, such as TBA securities, delayed-delivery or certain sale-buyback transactions by and between a Portfolio and select counterparties. The Master Forward Agreements maintain provisions for, among other things, transaction initiation and confirmation, payment and transfer, events of default, termination, and maintenance of collateral. The market value of forward settling transactions, collateral pledged or received, and the net exposure by counterparty as of period end is disclosed in the Notes to Schedules of Investments.
Customer Account Agreements and related addenda govern cleared derivatives transactions such as futures, options on futures, and cleared OTC derivatives. Such transactions require posting of initial margin as determined by each relevant clearing agency which is segregated in an account at a futures commission merchant (“FCM”) registered with the Commodity Futures Trading Commission (“CFTC”). In the United States, counterparty risk may be reduced as creditors of an FCM cannot have a claim to Portfolio assets in the segregated account. Portability of exposure reduces risk to the Portfolios. Variation margin, or changes in market value, are exchanged daily, but may not be netted between futures and cleared OTC derivatives unless the parties have agreed to a separate arrangement in respect of portfolio margining. The market value or accumulated unrealized appreciation (depreciation), initial margin posted, and any unsettled variation margin as of period end are disclosed in the Notes to Schedules of Investments.
International Swaps and Derivatives Association, Inc. Master Agreements and Credit Support Annexes (“ISDA Master Agreements”) govern bilateral OTC derivative transactions entered into by a Portfolio with select counterparties. ISDA Master Agreements maintain provisions for general obligations, representations, agreements, collateral posting and events of default or termination. Events of termination include conditions that may entitle counterparties to elect to terminate early and cause settlement of all outstanding transactions under the applicable ISDA Master Agreement. Any election to terminate early could be material to the financial statements. In limited circumstances, the ISDA Master Agreement may contain additional provisions that add counterparty protection beyond coverage of existing daily exposure if the counterparty has a decline in credit quality below a predefined level. These amounts, if any, may be segregated with a third-party custodian. The market value of OTC financial derivative instruments, collateral received or pledged, and net exposure by counterparty as of period end are disclosed in the Notes to Schedules of Investments.
9. FEES AND EXPENSES
(a) Investment Advisory Fee The Trust entered into an Investment Advisory Contract with the Adviser (the “Advisory Contract”) pursuant to which the Adviser serves as the investment adviser to each Portfolio. The Adviser does not receive investment advisory or other fees from the Portfolios or the Trust (although PIMCO may receive compensation under the Advisory Contract with respect to
| | | | | | |
| | ANNUAL REPORT | | DECEMBER 31, 2018 | | 141 |
Notes to Financial Statements(Cont.)
future series of the Trust). The financial statements reflect the fact that no investment management fees or expenses are incurred by the Portfolios.
Each Portfolio is an integral part of one or more“wrap-fee” programs, including those sponsored by investment advisers and/or broker-dealers unaffiliated with the Portfolios or PIMCO. Participants in these programs pay a “wrap” fee to the sponsor of the program. PIMCO may receive fees or other benefits from or through its relationships with the sponsors of suchwrap-fee programs for which the Portfolios are an investment option.
(b) Supervisory and Administration Fee Pursuant to the Supervision and Administration Agreement with PIMCO (the “Administration Agreement”), PIMCO also serves as administrator to the Portfolios (in this capacity, PIMCO is referred to as the “Administrator”). Under the Administration Agreement, the Administrator, at its expense, is required to procure most supervisory and administrative services required by the Portfolios including, but not limited to, expenses of most third-party service providers (e.g., audit, custodial, legal, transfer agency, printing) and other expenses, such as those associated with insurance, proxy solicitations and mailings for shareholder meetings, tax services, valuation services and other services required for the Portfolios’ daily operations. Under the Administration Agreement, the Administrator has agreed to provide or procure these services, and to bear the expenses associated with these services at no charge to the Portfolios. In addition, PIMCO has entered into an expense limitation agreement with the Trust pursuant to which it has agreed to pay or reimburse certain other expenses of the Portfolios, as discussed in more detail below. The Administrator does not receive any administration or other fees from the Portfolios or the Trust for serving as administrator to the Portfolios (although the Administrator may receive compensation under the Administration Agreement with respect to future series of the Trust).
(c) Distribution Contract The Trust has entered into a distribution contract with PIMCO Investments LLC (the “Distributor”), a wholly-owned subsidiary of PIMCO, pursuant to which the Distributor serves as the distributor and principal underwriter of the Portfolios’ shares (the “Distribution Contract”). The Distributor does not receive any distribution or other fees from the Portfolios or the Trust for serving as the distributor and principal underwriter of the Portfolios’ shares (although the Distributor may receive compensation under the Distribution Contract with respect to future series of the Trust).
(d) Expense Limitation Agreement The Adviser has contractually agreed pursuant to an expense limitation agreement (the “Expense Limitation Agreement”) to bear the expenses of or make payments to each Portfolio to the extent that, for any calendar month, “Specified Expenses”, as defined in the Expense Limitation Agreement of such Portfolio would exceed 0.00%. “Specified Expenses” of a Portfolio means all expenses incurred by the Portfolio, including organizational and offering expenses and expenses associated with obtaining or maintaining a Legal Entity Finder, but excluding any brokerage fees and commissions and other portfolio transaction expenses, costs, including interest expenses, of borrowing money or engaging in other types of leverage financing, including, without limitation, through reverse repurchase agreements, tender option bonds, bank borrowings and credit facilities, fees and expenses of any underlying Portfolios or other pooled vehicles in which the Portfolio invests, taxes, governmental fees, dividends and interest on short positions, and extraordinary expenses, including extraordinary legal expenses. This Expense
| | | | | | |
| 142 | | PIMCO MANAGED ACCOUNTS TRUST | | | | |
December 31, 2018
Limitation Agreement shall continue in effect, unless sooner terminated by the Trust’s Board of Trustees, for so long as the Adviser serves as the investment adviser to the applicable Portfolio pursuant to the Advisory Contract.
10. RELATED PARTY TRANSACTIONS
The Adviser, Administrator, and Distributor are related parties. Fees paid to these parties are disclosed in Note 9, Fees and Expenses, and the accrued related party fee amounts are disclosed on the Statements of Assets and Liabilities.
Certain Portfolios are permitted to purchase or sell securities from or to certain related affiliated funds under specified conditions outlined in procedures adopted by the Board. The procedures have been designed to ensure that any purchase or sale of securities by the Portfolios from or to another fund or portfolio that are, or could be, considered an affiliate, or an affiliate of an affiliate, by virtue of having a common investment adviser (or affiliated investment advisers), common Trustees and/or common officers complies with Rule17a-7 under the Act. Further, as defined under the procedures, each transaction is effected at the current market price. Purchases and sales of securities pursuant to Rule17a-7 under the Act for the period ended December 31, 2018, were as follows (amounts in thousands†):
| | | | | | | | | | | | |
| Portfolio Name | | | | | Purchases | | | Sales | |
| Fixed Income SHares: Series C | | | | | | $ | 17,332 | | | $ | 9,728 | |
| Fixed Income SHares: Series LD | | | | | | | 3,023 | | | | 5,889 | |
| Fixed Income SHares: Series M | | | | | | | 7,952 | | | | 40,087 | |
| Fixed Income SHares: Series R | | | | | | | 377 | | | | 1,313 | |
| Fixed Income SHares: Series TE | | | | | | | 0 | | | | 0 | |
| † | A zero balance may reflect actual amounts rounding to less than one thousand. |
11. GUARANTEES AND INDEMNIFICATIONS
Under the Trust’s organizational documents, each Trustee and officer is indemnified, to the extent permitted by the Act, against certain liabilities that may arise out of performance of their duties to the Portfolios. Additionally, in the normal course of business, the Portfolios enter into contracts that contain a variety of indemnification clauses. The Portfolios’ maximum exposure under these arrangements is unknown as this would involve future claims that may be made against the Portfolios that have not yet occurred. However, the Portfolios have not had prior claims or losses pursuant to these contracts.
12. PURCHASES AND SALES OF SECURITIES
The length of time a Portfolio has held a particular security is not generally a consideration in investment decisions. A change in the securities held by a Portfolio is known as “portfolio turnover.” Each Portfolio may engage in frequent and active trading of portfolio securities to achieve its investment objective, particularly during periods of volatile market movements. High portfolio turnover may involve correspondingly greater transaction costs to a Portfolio, including brokerage commissions or dealermark-ups and other transaction costs on the sale of securities and reinvestments in other securities. Such sales may also result in realization of taxable capital gains,
| | | | | | |
| | ANNUAL REPORT | | DECEMBER 31, 2018 | | 143 |
Notes to Financial Statements(Cont.)
including short-term capital gains (which are generally taxed at ordinary income tax rates). The transaction costs and tax effects associated with portfolio turnover may adversely affect a shareholder’s performance. The portfolio turnover rates are reported in the Financial Highlights.
Purchases and sales of securities (excluding short-term investments) for the period ended December 31, 2018, were as follows (amounts in thousands†):
| | | | | | | | | | | | | | | | | | | | | | | | |
| | | | | | U.S. Government/Agency | | | | | | All Other | |
| | | | | | |
| Portfolio Name | | | | | Purchases | | | Sales | | | | | | Purchases | | | Sales | |
| Fixed Income SHares: Series C | | | | | | $ | 7,998,082 | | | $ | 8,433,354 | | | | | | | $ | 451,803 | | | $ | 326,894 | |
| Fixed Income SHares: Series LD | | | | | | | 546,589 | | | | 493,259 | | | | | | | | 61,624 | | | | 42,420 | |
| Fixed Income SHares: Series M | | | | | | | 10,054,524 | | | | 10,513,840 | | | | | | | | 292,653 | | | | 152,169 | |
| Fixed Income SHares: Series R | | | | | | | 503,752 | | | | 524,937 | | | | | | | | 29,590 | | | | 41,242 | |
| Fixed Income SHares: Series TE | | | | | | | 0 | | | | 0 | | | | | | | | 49,536 | | | | 53,403 | |
| † | A zero balance may reflect actual amounts rounding to less than one thousand. |
13. SHARES OF BENEFICIAL INTEREST
The Trust may issue an unlimited number of shares of beneficial interest with a $0.001 par value.
14. REGULATORY AND LITIGATION MATTERS
The Portfolios are not named as defendants in any material litigation or arbitration proceedings and are not aware of any material litigation or claim pending or threatened against them.
The foregoing speaks only as of the date of this report.
15. FEDERAL INCOME TAX MATTERS
Each Portfolio intends to qualify as a regulated investment company under Subchapter M of the Internal Revenue Code (the “Code”) and distribute all of its taxable income and net realized gains, if applicable, to shareholders. Accordingly, no provision for Federal income taxes has been made.
A Portfolio may be subject to local withholding taxes, including those imposed on realized capital gains. Any applicable foreign capital gains tax is accrued daily based upon net unrealized gains, and may be payable following the sale of any applicable investments.
In accordance with U.S. GAAP, the Adviser has reviewed the Portfolios’ tax positions for all open tax years. As of December 31, 2018, the Portfolios have recorded no liability for net unrecognized tax benefits relating to uncertain income tax positions they have taken or expect to take in future tax returns.
The Portfolios file U.S. federal, state, and local tax returns as required. The Portfolios’ tax returns are subject to examination by relevant tax authorities until expiration of the applicable statute of limitations, which is generally three years after the filing of the tax return but which can be extended to six years in certain circumstances. Tax returns for open years have incorporated no uncertain tax positions that require a provision for income taxes.
| | | | | | |
| 144 | | PIMCO MANAGED ACCOUNTS TRUST | | | | |
December 31, 2018
As of December 31, 2018, the components of distributable taxable earnings are as follows (amounts in thousands†):
| | | | | | | | | | | | | | | | | | | | | | | | | | | | | | | | | | | | |
| | | | | | Undistributed
Tax Exempt
Income | | | Undistributed
Ordinary
Income(1) | | | Undistributed
Long-Term
Capital Gains | | | Net Tax Basis
Unrealized
Appreciation/
(Depreciation)(2) | | | Other
Book-to-Tax
Accounting
Differences(3) | | | Accumulated
Capital
Losses(4) | | | Qualified
Late-Year
Loss
Deferral-
Capital(5) | | | Qualified
Late-Year
Loss
Deferral-
Ordinary(6) | |
| Fixed Income SHares - Series C | | | | | | $ | 0 | | | $ | 6,355 | | | $ | 0 | | | $ | (22,609 | ) | | $ | 0 | | | $ | (204,534 | ) | | $ | 0 | | | $ | 0 | |
| Fixed Income SHares - Series LD | | | | | | | 0 | | | | 0 | | | | 0 | | | | (1,466 | ) | | | (196 | ) | | | (2,371 | ) | | | 0 | | | | 0 | |
| Fixed Income SHares - Series M | | | | | | | 0 | | | | 17,632 | | | | 0 | | | | 28,151 | | | | 0 | | | | (28,725 | ) | | | 0 | | | | 0 | |
| Fixed Income SHares - Series R | | | | | | | 0 | | | | 849 | | | | 0 | | | | (3,506 | ) | | | 0 | | | | (39,412 | ) | | | 0 | | | | 0 | |
| Fixed Income SHares - Series TE | | | | | | | 0 | | | | 0 | | | | 0 | | | | 2,329 | | | | (15 | ) | | | (1,506 | ) | | | 0 | | | | 0 | |
| † | A zero balance may reflect actual amounts rounding to less than one thousand. |
| (1) | Includes undistributed short-term capital gains, if any. |
| (2) | Adjusted for open wash sale loss deferrals and the accelerated recognition of unrealized gain or loss on certain futures, options and forward contracts for federal income tax purposes. Also adjusted for differences between book and tax realized and unrealized gain (loss) on swap contracts, treasury inflation-protected securities (TIPS), sale/buyback transactions, inverse floater transactions, straddle loss deferrals, and Lehman securities. |
| (3) | Represents differences in income tax regulations and financial accounting principles generally accepted in the United States of America, mainly for distributions payable at fiscalyear-end. |
| (4) | Capital losses available to offset future net capital gains expire in varying amounts as shown below. |
| (5) | Capital losses realized during the period November 1, 2018 through December 31, 2018 which the Portfolios elected to defer to the following taxable year pursuant to income tax regulations. |
| (6) | Specified losses realized during the period November 1, 2018 through December 31, 2018 which the Portfolios elected to defer to the following taxable year pursuant to income tax regulations. |
Under the Regulated Investment Company Modernization Act of 2010, a Portfolio is permitted to carry forward any new capital losses for an unlimited period. Additionally, such capital losses that are carried forward will retain their character as either short-term or long-term capital losses rather than being considered all short-term under previous law.
As of December 31, 2018, the Portfolios had the following post-effective capital losses with no expiration (amounts in thousands†):
| | | | | | | | | | | | |
| | | | | | Short-Term | | | Long-Term | |
| Fixed Income SHares - Series C | | | | | | $ | 196,212 | | | $ | 8,322 | |
| Fixed Income SHares - Series LD | | | | | | | 612 | | | | 1,759 | |
| Fixed Income SHares - Series M | | | | | | | 20,484 | | | | 8,241 | |
| Fixed Income SHares - Series R | | | | | | | 4,573 | | | | 34,839 | |
| Fixed Income SHares - Series TE | | | | | | | 491 | | | | 1,015 | |
| † | A zero balance may reflect actual amounts rounding to less than one thousand. |
| | | | | | |
| | ANNUAL REPORT | | DECEMBER 31, 2018 | | 145 |
Notes to Financial Statements(Cont.)
December 31, 2018
As of December 31, 2018, the aggregate cost and the net unrealized appreciation/(depreciation) of investments for federal income tax purposes are as follows (amounts in thousands†):
| | | | | | | | | | | | | | | | | | | | |
| | | | | | Federal
Tax Cost | | | Unrealized
Appreciation | | | Unrealized
(Depreciation) | | | Net Unrealized
Appreciation/
(Depreciation)(7) | |
| Fixed Income SHares - Series C | | | | | | $ | 1,897,885 | | | $ | 38,330 | | | $ | (45,009 | ) | | $ | (6,679 | ) |
| Fixed Income SHares - Series LD | | | | | | | 214,363 | | | | 2,441 | | | | (3,905 | ) | | | (1,464 | ) |
| Fixed Income SHares - Series M | | | | | | | 1,842,429 | | | | 63,591 | | | | (33,304 | ) | | | 30,287 | |
| Fixed Income SHares - Series R | | | | | | | 213,210 | | | | 4,955 | | | | (11,687 | ) | | | (6,732 | ) |
| Fixed Income SHares - Series TE | | | | | | | 82,697 | | | | 3,080 | | | | (750 | ) | | | 2,330 | |
| † | A zero balance may reflect actual amounts rounding to less than one thousand. |
| (7) | Primary differences, if any, between book and tax net unrealized appreciation/(depreciation) on investments are attributable to open wash sale loss deferrals, unrealized gain or loss on certain futures, options and forward contracts, treasury inflation protected securities (TIPS), sale/buyback transactions, realized and unrealized gain (loss) swap contracts, inverse floater transactions, straddle loss deferrals, and Lehman securities. |
For the fiscal years ended December 31, 2018 and December 31, 2017, respectively, the Portfolios made the following tax basis distributions (amounts in thousands†):
| | | | | | | | | | | | | | | | | | | | | | | | | | | | | | | | | | | | | | | | |
| | | | | | December 31, 2018 | | | | | | December 31, 2017 | |
| | | | | | Tax-Exempt
Income
Distributions | | | Ordinary
Income
Distributions(8) | | | Long-Term
Capital Gain
Distributions | | | Return of
Capital(9) | | | | | | Tax-Exempt
Income
Distributions | | | Ordinary
Income
Distributions(8) | | | Long-Term
Capital Gain
Distributions | | | Return of
Capital(9) | |
| Fixed Income SHares - Series C | | | | | | $ | 0 | | | $ | 48,344 | | | $ | 0 | | | $ | 0 | | | | | | | $ | 0 | | | $ | 37,777 | | | $ | 0 | | | $ | 12,824 | |
| Fixed Income SHares - Series LD | | | | | | | 0 | | | | 3,596 | | | | 0 | | | | 45 | | | | | | | | 0 | | | | 2,436 | | | | 0 | | | | 0 | |
| Fixed Income SHares - Series M | | | | | | | 0 | | | | 50,390 | | | | 0 | | | | 0 | | | | | | | | 0 | | | | 64,183 | | | | 11,608 | | | | 0 | |
| Fixed Income SHares - Series R | | | | | | | 0 | | | | 5,447 | | | | 0 | | | | 0 | | | | | | | | 0 | | | | 2,982 | | | | 0 | | | | 2,658 | |
| Fixed Income SHares - Series TE | | | | | | | 3,197 | | | | 85 | | | | 0 | | | | 0 | | | | | | | | 3,142 | | | | 49 | | | | 0 | | | | 0 | |
| † | A zero balance may reflect actual amounts rounding to less than one thousand. |
| (8) | Includes short-term capital gains distributed, if any. |
| (9) | A portion of the distributions made represents a tax return of capital. Return of capital distributions have been reclassified from undistributed net investment income topaid-in capital to more appropriately conform financial accounting to tax accounting. |
| | | | | | |
| 146 | | PIMCO MANAGED ACCOUNTS TRUST | | | | |
Report of Independent Registered Public Accounting Firm
To the Board of Trustees of PIMCO Managed Accounts Trust and Shareholders of Fixed Income SHares: Series C, Fixed Income SHares: Series LD, Fixed Income SHares: Series M, Fixed Income SHares: Series R and Fixed Income SHares: Series TE
Opinions on the Financial Statements
We have audited the accompanying statements of assets and liabilities, including the schedules of investments, ofFixed Income SHares: Series C, Fixed Income SHares: Series LD, Fixed Income SHares: Series M, Fixed Income SHares: Series R and Fixed Income SHares: Series TE (constituting PIMCO Managed Accounts Trust, hereafter collectively referred to as the “Portfolios”) as of December 31, 2018, the related statements of operations for the year ended December 31, 2018, the statements of changes in net assets for each of the two years in the period ended December 31, 2018, and for Fixed Income SHares: Series LD and Fixed Income SHares: Series R the statements of cash flows for the year ended December 31, 2018, including the related notes,and the financial highlights for each of the periods indicated therein (collectively referred to as the “financial statements”). In our opinion, the financial statements present fairly, in all material respects, the financial position of each of the Portfolios as of December 31, 2018, the results of each of their operations for the year then ended, the changes in each of their net assets for each of the two years in the period ended December 31, 2018, for Fixed Income SHares: Series LD and Fixed Income SHares: Series R, the results of each of their cash flowsfor the year then ended and each of the financial highlights for each of the periods indicated therein in conformity with accounting principles generally accepted in the United States of America.
Basis for Opinions
These financial statements are the responsibility of the Portfolios’ management. Our responsibility is to express an opinion on the Portfolios’ financial statements based on our audits. We are a public accounting firm registered with the Public Company Accounting Oversight Board (United States) (“PCAOB”) and are required to be independent with respect to the Portfolios in accordance with the U.S. federal securities laws and the applicable rules and regulations of the Securities and Exchange Commission and the PCAOB.
We conducted our audits of these financial statements in accordance with the standards of the PCAOB. Those standards require that we plan and perform the audit to obtain reasonable assurance about whether the financial statements are free of material misstatement, whether due to error or fraud.
Our audits included performing procedures to assess the risks of material misstatement of the financial statements, whether due to error or fraud, and performing procedures that respond to those risks. Such procedures included examining, on a test basis, evidence regarding the amounts and disclosures in the financial statements. Our audits also included evaluating the accounting principles used and significant estimates made by management, as well as evaluating the overall presentation of the financial statements. Our procedures included confirmation of securities owned as of December 31, 2018 by correspondence with the custodian, transfer agent and brokers; when replies were not received from brokers, we performed other auditing procedures. We believe that our audits provide a reasonable basis for our opinions.
/s/ PricewaterhouseCoopers LLP
Kansas City, Missouri
February 27, 2019
We have served as the auditor of one or more investment companies in PIMCO Managed Accounts Trust since 2000.
| | | | | | |
| | ANNUAL REPORT | | DECEMBER 31, 2018 | | 147 |
Glossary:(abbreviations that may be used in the preceding statements)
| | | | | | | | |
| Counterparty Abbreviations: | | | | | | |
| BCY | | Barclays Capital, Inc. | | GSC | | Goldman Sachs & Co. | | |
| BOA | | Bank of America N.A. | | GST | | Goldman Sachs International | | |
| BOM | | Bank of Montreal | | HUS | | HSBC Bank USA N.A. | | |
| BOS | | Banc of America Securities LLC | | IND | | Crédit Agricole Corporate and Investment Bank S.A. | | |
| BPG | | BNP Paribas Securities Corp. | | JPM | | JP Morgan Chase Bank N.A. | | |
| BPS | | BNP Paribas S.A. | | MSB | | Morgan Stanley Bank, N.A | | |
| BRC | | Barclays Bank PLC | | MSC | | Morgan Stanley & Co., Inc. | | |
| BSN | | Bank of Nova Scotia | | MYC | | Morgan Stanley Capital Services, Inc. | | |
| CBK | | Citibank N.A. | | RCY | | Royal Bank of Canada | | |
| CIW | | CIBC World Markets Corp. | | RDR | | RBC Capital Markets LLC | | |
| DUB | | Deutsche Bank AG | | SCX | | Standard Chartered Bank | | |
| FBF | | Credit Suisse International | | SOG | | Societe Generale | | |
| FICC | | Fixed Income Clearing Corporation | | SSB | | State Street Bank and Trust Co. | | |
| FOB | | Credit Suisse Securities (USA) LLC | | TDM | | TD Securities (USA) LLC | | |
| GLM | | Goldman Sachs Bank USA | | UAG | | UBS AG Stamford | | |
| GRE | | RBS Securities, Inc. | | UBS | | UBS Securities LLC | | |
| | | |
| Currency Abbreviations: | | | | | | |
| ARS | | Argentine Peso | | JPY | | Japanese Yen | | |
| AUD | | Australian Dollar | | KRW | | South Korean Won | | |
| BRL | | Brazilian Real | | MXN | | Mexican Peso | | |
| CAD | | Canadian Dollar | | NZD | | New Zealand Dollar | | |
| CNH | | Chinese Renminbi (Offshore) | | PEN | | Peruvian New Sol | | |
| COP | | Colombian Peso | | PLN | | Polish Zloty | | |
| DKK | | Danish Krone | | RUB | | Russian Ruble | | |
| EUR | | Euro | | SGD | | Singapore Dollar | | |
| GBP | | British Pound | | TRY | | Turkish New Lira | | |
| IDR | | Indonesian Rupiah | | TWD | | Taiwanese Dollar | | |
| ILS | | Israeli Shekel | | USD (or $) | | United States Dollar | | |
| INR | | Indian Rupee | | ZAR | | South African Rand | | |
| | | |
| Exchange Abbreviations: | | | | | | |
| CBOT | | Chicago Board of Trade | | OTC | | Over the Counter | | |
| | | |
| Index/Spread Abbreviations: | | | | | | |
| BADLARPP | | Argentina Badlar Floating Rate Notes | | CPURNSA | | Consumer Price All UrbanNon-Seasonally Adjusted Index | | |
| BP0003M | | 3 MonthGBP-LIBOR | | FRCPXTOB | | France Consumer Priceex-Tobacco Index | | |
| CDX.EM | | Credit Derivatives Index - Emerging Markets | | ISDA | | International Swaps and Derivatives Association, Inc. | | |
| CDX.HY | | Credit Derivatives Index - High Yield | | LIBOR03M | | 3 MonthUSD-LIBOR | | |
| CDX.IG | | Credit Derivatives Index - Investment Grade | | UKRPI | | United Kingdom Retail Prices Index | | |
| CMBX | | Commercial Mortgage-Backed Index | | US0001M | | 1 Month USD Swap Rate | | |
| CPALEMU | | Euro Area All ItemsNon-Seasonally Adjusted Index | | US0003M | | 3 Month USD Swap Rate | | |
| CPTFEMU | | Eurozone HICPex-Tobacco Index | | | | | | |
| | | |
| Municipal Bond or Agency Abbreviations: | | | | | | |
| AGC | | Assured Guaranty Corp. | | BAM | | Build America Mutual Assurance | | |
| AGM | | Assured Guaranty Municipal | | | | | | |
| | | | | | |
| 148 | | PIMCO MANAGED ACCOUNTS TRUST | | | | |
(Unaudited)
| | | | | | | | |
| | | |
| Other Abbreviations: | | | | | | |
| ABS | | Asset-Backed Security | | OAT | | Obligations Assimilables du Trésor | | |
| ALT | | Alternate Loan Trust | | OIS | | Overnight Index Swap | | |
| BABs | | Build America Bonds | | PIK | | Payment-in-Kind | | |
| BBR | | Bank Bill Rate | | REMIC | | Real Estate Mortgage Investment Conduit | | |
| BTP | | Buoni del Tesoro Poliennali | | RMBS | | Residential Mortgage-Backed Security | | |
| CLO | | Collateralized Loan Obligation | | TBA | | To-Be-Announced | | |
| DAC | | Designated Activity Company | | TELBOR | | Tel Aviv Inter-Bank Offered Rate | | |
| LIBOR | | London Interbank Offered Rate | | TIIE | | Tasa de Interés Interbancaria de Equilibrio “Equilibrium Interbank Interest Rate” | | |
| Lunar | | Monthly payment based on28-day periods. One year consists of 13 periods. | | YOY | | Year-Over-Year | | |
| NCUA | | National Credit Union Administration | | | | | | |
| | | | | | |
| | ANNUAL REPORT | | DECEMBER 31, 2018 | | 149 |
Federal Income Tax Information
(Unaudited)
As required by the Internal Revenue Code (“Code”) and Treasury Regulations, if applicable, shareholders must be notified within 60 days of the Portfolios’ fiscal year end regarding the status of qualified dividend income and the dividend received deduction.
Dividend Received Deduction. Corporate shareholders are generally entitled to take the dividend received deduction on the portion of a Portfolios’ dividend distribution that qualifies under tax law. The percentage of the following Portfolios’ Fiscal 2018 ordinary income dividend that qualifies for the corporate dividend received deduction is set forth below:
Qualified Dividend Income. Under the Jobs and Growth Tax Relief Reconciliation Act of 2003, the following percentage of ordinary dividends paid during the fiscal year ended December 31, 2018 was designated as ‘qualified dividend income’ as defined in the Jobs and Growth Tax Relief Reconciliation Act of 2003 subject to reduced tax rates in 2018:
Qualified Interest Income and Qualified Short-Term Capital Gain (fornon-U.S. resident shareholders only). Under the American Jobs Creation Act of 2004, the following amounts of ordinary dividends paid during the fiscal year ended December 31, 2018 are considered to be derived from “qualified interest income,” as defined in Section 871(k)(1)(E) of the Code, and therefore are designated as interest-related dividends, as defined in Section 871(k)(1)(C) of the Code. Further, the following amounts of ordinary dividends paid during the fiscal year ended December 31, 2018 are considered to be derived from “qualified short-term capital gain,” as defined in Section 871(k)(2)(D) of the Code, and therefore are designated as qualified short-term gain dividends, as defined by Section 871(k)(2)(C) of the Code.
| | | | | | | | | | | | | | | | | | | | |
| | | | | | Dividend
Received
Deduction % | | | Qualified
Dividend
Income % | | | Qualified Interest
Income
(000s†) | | | Qualified
Short-Term
Capital Gain
(000s†) | |
| Fixed Income SHares - Series C | | | | | | | 0 | % | | | 0 | % | | $ | 31,129 | | | $ | 0 | |
| Fixed Income SHares - Series LD | | | | | | | 0 | % | | | 0 | % | | | 3,596 | | | | 0 | |
| Fixed Income SHares - Series M | | | | | | | 0 | % | | | 0 | % | | | 42,826 | | | | 0 | |
| Fixed Income SHares - Series R | | | | | | | 0 | % | | | 0 | % | | | 5,447 | | | | 0 | |
| Fixed Income SHares - Series TE | | | | | | | 0 | % | | | 0 | % | | | 3,282 | | | | 0 | |
| † | A zero balance may reflect actual amounts rounding to less than one thousand. |
Shareholders are advised to consult their own tax advisor with respect to the tax consequences of their investment in the Trust. In January 2019, you will be advised on IRS Form1099-DIV as to the federal tax status of the dividends and distributions received by you in calendar year 2018.
| | | | | | |
| 150 | | PIMCO MANAGED ACCOUNTS TRUST | | | | |
Management of the Trust
(Unaudited)
The chart below identifies Trustees and Officers of the Trust. Unless otherwise indicated, the address of all persons below is c/o Pacific Investment Management Company LLC, 1633 Broadway, New York, New York 10019.
The Trust’s Statement of Additional Information includes more information about the Trustees and Officers. To request a copy, call PIMCO at (800) 927-4648 or visit the Portfolios’ website at pimco.com/FISH.
Trustees
| | | | | | | | | | |
Name and
Year of Birth | | Position(s)
Held
with the
Trust | | Length of
Time Served | | Principal Occupation(s)
During the Past 5 Years | | Number
of Portfolios
in Fund
Complex
Overseen
by Trustee | | Other
Directorships
Held by Trustee
During the
Past 5 Years |
|
Independent Trustees |
| | | | | |
Deborah A. DeCotis 1952 | | Chair of the Board, Trustee | | Trustee since 2011 | | Advisory Director, Morgan Stanley & Co., Inc. (since 1996); Member, Circle Financial Group (since 2009); Member, Council on Foreign Relations (since 2013); Trustee, Smith College (since 2017); and Director, Watford Re (since 2017). Formerly, Co-Chair Special Projects Committee, Memorial Sloan-Kettering(2005-2015); Trustee, Stanford University (2010-2015); Director, Helena Rubenstein Foundation (1997-2010); Principal, LaLoop LLC, a retail accessories company (1999-2014); and Director, Armor Holdings (2002-2010). | | 92 | | None |
| | | | | |
Sarah E. Cogan* 1956 | | Trustee | | Trustee of the Funds since 2019, expected to stand for election at the annual meeting of the shareholders during the 2019 fiscal year for each fund. | | Of Counsel, Simpson Thacher & Bartlett LLP (law firm); Director, Girl Scouts of Greater New York, Inc. (since 2016); and Trustee, Natural Resources Defense Council, Inc. (since 2013). Formerly, Partner, Simpson Thacher & Bartlett LLP (1989-2018). | | 91 | | None |
| | | | | |
| Bradford K. Gallagher1944 | | Trustee | | Trustee since 2010 | | Retired. Founder, Spyglass Investments LLC, a private investment vehicle (since 2001). Formerly, Chairman and Trustee, The Common Fund (2005-2014); Partner, New Technology Ventures Capital Management LLC, a venture capital fund (2011-2013); Chairman and Trustee, Atlantic Maritime Heritage Foundation (2007-2012); and Founder, President and CEO, Cypress Holding Company and Cypress Tree Investment Management Company (1995-2001). | | 92 | | Formerly, Chairman and Trustee, Grail Advisors ETF Trust(2009-2010); and Trustee, Nicholas- Applegate Institutional Funds(2007-2010). |
| | | | | |
Hans W. Kertess 1939 | | Trustee | | Trustee since 2005 | | President, H. Kertess & Co., a financial advisory company; and Senior Adviser (formerly Managing Director), Royal Bank of Canada Capital Markets (since 2004). | | 92 | | None |
| | | | | | |
| | ANNUAL REPORT | | DECEMBER 31, 2018 | | 151 |
Management of the Trust(Cont.)
| | | | | | | | | | |
Name and
Year of Birth | | Position(s)
Held
with the
Trust | | Length of
Time Served | | Principal Occupation(s)
During the Past 5 Years | | Number
of Portfolios
in Fund
Complex
Overseen
by Trustee | | Other
Directorships
Held by Trustee
During the
Past 5 Years |
| | | | | |
James A. Jacobson 1945 | | Trustee | | Trustee since 2010 | | Retired. Trustee (since 2002) and Chairman of Investment Committee (since 2007), Ronald McDonald House of New York; and Trustee, New Jersey City University (since 2014). Formerly, Vice Chairman and Managing Director, Spear, Leeds & Kellogg Specialists, LLC, a specialist firm on the New York Stock Exchange (2003-2008). | | 92 | | Formerly, Trustee, Alpine Mutual Funds Complex (consisting of 18 funds) (2009-2016) |
| | | | | |
William B. Ogden, IV 1945 | | Trustee | | Trustee since 2006 | | Retired. Formerly, Asset Management Industry Consultant; and Managing Director, Investment Banking Division of Citigroup Global Markets Inc. | | 92 | | None |
| | | | | |
Alan Rappaport 1953 | | Trustee | | Trustee since 2010 | | Adjunct Professor, New York University Stern School of Business (since 2011); Lecturer, Stanford University Graduate School of Business (since 2013); and Director, Victory Capital Holdings, Inc., an asset management firm (since 2013). Formerly, Advisory Director (formerly Vice Chairman), Roundtable Investment Partners (2009-2018); Member of Board of Overseers, NYU Langone Medical Center (2015-2016); Trustee, American Museum of Natural History (2005-2015); Trustee, NYU Langone Medical Center (2007-2015); Vice Chairman (formerly Chairman and President), U.S. Trust (formerly Private Bank of Bank of America, the predecessor entity of U.S. Trust) (2001-2008). | | 92 | | None |
|
Interested Trustees |
| | | | | |
Craig A. Dawson** 1968 | | Trustee | | Trustee since 2014 | | Managing Director and Head of PIMCO Europe, Middle East and Africa (since 2016). Director of a number of PIMCO’s European investment vehicles and affiliates (since 2008). Formerly, Head of Strategic Business Management, PIMCO (2014-2016), head of PIMCO’s Munich office and head of European product management for PIMCO. | | 26 | | None |
| | | | | | |
| 152 | | PIMCO MANAGED ACCOUNTS TRUST | | | | |
(Unaudited)
| | | | | | | | | | |
Name and
Year of Birth | | Position(s)
Held
with the
Trust | | Length of
Time Served | | Principal Occupation(s)
During the Past 5 Years | | Number
of Portfolios
in Fund
Complex
Overseen
by Trustee | | Other
Directorships
Held by Trustee
During the
Past 5 Years |
| | | | | |
David N. Fisher*** 1968 | | Trustee | | Trustee of the Funds since 2019, expected to stand for election at the annual meeting of the shareholders during the 2019 fiscal year for each fund. | | Managing Director and Head of Traditional Product Strategies, PIMCO (Since 2015); and Director, Court Appointed Special Advocates (CASA) of Orange County, a nonprofit organization (since 2015). Formerly, Global Bond Strategist, PIMCO (2008-2015); and Managing Director and Head of Global Fixed Income, HSBC Global Asset Management(2005-2008). | | 27 | | None |
| | | | | |
John C. Maney**** 1959 | | Trustee | | Trustee since 2006 | | Managing Director of Allianz Asset Management of America L.P. (since January 2005) and a member of the Management Board and Chief Operating Officer of Allianz Asset Management of America L.P. (since November 2006) and a Non-Executive Director and a member of the Compensation Committee of PIMCO Europe Ltd (since December 2017). Formerly, Member of the Management Board of Allianz Global Investors Fund Management LLC (2007-2014) and Managing Director of Allianz Global Investors Fund Management LLC (2011-2014). | | 26 | | None |
| * | Ms. Cogan was appointed as a Trustee of the Fund by the Board effective January 1, 2019. |
| ** | Mr. Dawson is an “interested person” of the Trust, as defined in Section 2(a)(19) of the Act, due to his affiliation with PIMCO and its affiliates. Mr. Dawson’s address is 650 Newport Center Drive, Newport Beach, CA 92660. Effective January 1, 2019, Craig Dawson resigned as Trustee from the Board. |
| *** | Mr. Fisher is an “interested person” of the Trust, as defined in Section 2(a)(19) of the Act, due to his affiliation with PIMCO and its affiliates. Mr. Fisher’s address is 650 Newport Center Drive, Newport Beach, CA 92660. He was appointed as a Trustee by the Board effective January 1, 2019. |
| **** | Mr. Maney is an “interested person” of the Trust, as defined in Section 2(a)(19) of the Act, due to his affiliation with Allianz Asset Management of America L.P. and its affiliates. Mr. Maney’s address is 650 Newport Center Drive, Newport Beach, CA 92660. |
| | | | | | |
| | ANNUAL REPORT | | DECEMBER 31, 2018 | | 153 |
Management of the Funds(Cont.)
Officers
| | | | | | |
Name, Address and
Year of Birth | | Position(s) Held
with Funds | | Term of Office
and Length of
Time Served | | Principal Occupation(s) During the Past 5 Years |
| | | |
Peter G. Strelow1
1970 | | President | | Since 2014 | | Managing Director andCo-Chief Operating Officer, PIMCO. President, PIMCO-Managed Funds, PIMCO Funds, PIMCO Variable Insurance Trust, PIMCO ETF Trust, PIMCO Equity Series and PIMCO Equity Series VIT. Formerly, Chief Administrative Officer, PIMCO. |
| | | |
Keisha Audain-Pressley
1975 | | Chief Compliance Officer | | Since
January
2018 | | Senior Vice President and Deputy Chief Compliance Officer, PIMCO. Chief Compliance Officer, PIMCO-Managed Funds. |
| | | |
Joshua D. Ratner 1976 | | Chief Legal Officer | | Since 2014 | | Executive Vice President and Deputy General Counsel, PIMCO. Chief Legal Officer, PIMCO Investments LLC. Chief Legal Officer, PIMCO-Managed Funds, PIMCO Funds, PIMCO Variable Insurance Trust, PIMCO ETF Trust, PIMCO Equity Series and PIMCO Equity Series VIT. |
| | | |
Wu-Kwan Kit1
1981 | | Vice President, Senior Counsel and Secretary | | Since December 2018 | | Senior Vice President and Senior Counsel, PIMCO. Vice President, Senior Counsel and Secretary, PIMCO-Managed Funds. Assistant Secretary, PIMCO Funds, PIMCO Variable Insurance Trust, PIMCO ETF Trust, PIMCO Equity Series and PIMCO Equity Series VIT. Formerly, Assistant General Counsel, VanEck Associates Corp. |
| | | |
Ryan G. Leshaw1 1980 | | Assistant Secretary | | Since 2014 | | Senior Vice President and Senior Counsel, PIMCO. Assistant Secretary, PIMCO-Managed Funds. Vice President, Senior Counsel and Secretary, PIMCO Funds, PIMCO Variable Insurance Trust, PIMCO ETF Trust, PIMCO Equity Series and PIMCO Equity Series VIT. Formerly, Associate, Willkie Farr & Gallagher LLP. |
| | | |
Stacie D. Anctil1
1969 | | Vice President | | Since 2015 | | Executive Vice President, PIMCO. Vice President, PIMCO-Managed Funds, PIMCO Funds, PIMCO Variable Insurance Trust, PIMCO ETF Trust, PIMCO Equity Series and PIMCO Equity Series VIT. |
| | | |
Eric D. Johnson1 1970 | | Vice President | | Since 2014 | | Executive Vice President, PIMCO. Vice President, PIMCO-Managed Funds, PIMCO Funds, PIMCO Variable Insurance Trust, PIMCO ETF Trust, PIMCO Equity Series and PIMCO Equity Series VIT. |
| | | |
William G. Galipeau1 1974 | | Vice President | | Since 2017 | | Executive Vice President, PIMCO. Vice President, PIMCO-Managed Funds, PIMCO Funds, PIMCO Variable Insurance Trust, PIMCO ETF Trust, PIMCO Equity Series and PIMCO Equity Series VIT. |
| | | |
Bijal Parikh1 1978 | | Vice President | | Since 2017 | | Senior Vice President, PIMCO. Vice President, PIMCO-Managed Funds, PIMCO Funds, PIMCO Variable Insurance Trust, PIMCO ETF Trust and PIMCO Equity Series. |
| | | |
Trent W. Walker1 1974 | | Treasurer | | Since 2017 | | Executive Vice President, PIMCO. Treasurer, PIMCO-Managed Funds, PIMCO Funds, PIMCO Variable Insurance Trust, PIMCO ETF Trust, PIMCO Equity Series and PIMCO Equity Series VIT. |
| | | |
Erik C. Brown 1967 | | Assistant Treasurer | | Since 2015 | | Executive Vice President, PIMCO. Assistant Treasurer, PIMCO-Managed Funds, PIMCO Funds, PIMCO Variable Insurance Trust, PIMCO ETF Trust, PIMCO Equity Series and PIMCO Equity Series VIT. |
| | | |
Colleen Miller 1980 | | Assistant Treasurer | | Since 2017 | | Senior Vice President, PIMCO. Assistant Treasurer, PIMCO-Managed Funds, PIMCO Funds, PIMCO Variable Insurance Trust, PIMCO ETF Trust, PIMCO Equity Series and PIMCO Equity Series VIT. |
| | | |
Christopher M. Morin1 1980 | | Assistant Treasurer | | Since 2016 | | Senior Vice President, PIMCO. Assistant Treasurer, PIMCO-Managed Funds, PIMCO Funds, PIMCO Variable Insurance Trust, PIMCO ETF Trust, PIMCO Equity Series and PIMCO Equity Series VIT. |
| | | | | | |
| 154 | | PIMCO MANAGED ACCOUNTS TRUST | | | | |
(Unaudited)
| | | | | | |
Name, Address and
Year of Birth | | Position(s) Held
with Funds | | Term of Office
and Length of
Time Served | | Principal Occupation(s) During the Past 5 Years |
| | | |
Jason J. Nagler 1982 | | Assistant Treasurer | | Since 2015 | | Senior Vice President, PIMCO. Assistant Treasurer, PIMCO-Managed Funds, PIMCO Funds, PIMCO Variable Insurance Trust, PIMCO ETF Trust, PIMCO Equity Series and PIMCO Equity Series VIT. |
| 1 | The address of these officers is Pacific Investment Management Company LLC, 650 Newport Center Drive, Newport Beach, California 92660. |
| | | | | | |
| | ANNUAL REPORT | | DECEMBER 31, 2018 | | 155 |
Privacy Policy1
The Portfolios2,3 consider customer privacy to be a fundamental aspect of their relationships with shareholders and are committed to maintaining the confidentiality, integrity and security of their current, prospective and former shareholders’non-public personal information. The Portfolios have developed policies that are designed to protect this confidentiality, while allowing shareholder needs to be served.
Obtaining Personal Information
In the course of providing shareholders with products and services, the Portfolios and certain service providers to the Portfolios, such as Portfolios’ investment adviser orsub-adviser (“Adviser”), may obtainnon-public personal information about shareholders, which may come from sources such as account applications and other forms, from other written, electronic or verbal correspondence, from shareholder transactions, from a shareholder’s brokerage or financial advisory firm, financial advisor or consultant, and/or from information captured on applicable websites.
Respecting Your Privacy
As a matter of policy, the Portfolios do not disclose anynon-public personal information provided by shareholders or gathered by the Portfolios tonon-affiliated third parties, except as required or permitted by law or as necessary for such third parties to perform their agreements with respect to the Portfolios. As is common in the industry,non-affiliated companies may from time to time be used to provide certain services, such as preparing and mailing prospectuses, reports, account statements and other information, conducting research on shareholder satisfaction and gathering shareholder proxies. The Portfolios or their affiliates may also retainnon-affiliated companies to market Portfolio shares or products which use Portfolio shares and enter into joint marketing arrangements with them and other companies. These companies may have access to a shareholder’s personal and account information, but are permitted to use this information solely to provide the specific service or as otherwise permitted by law. In most cases, the shareholders will be clients of a third party, but the Portfolios may also provide a shareholder’s personal and account information to the shareholder’s respective brokerage or financial advisory firm and/or financial advisor or consultant.
Sharing Information with Third Parties
The Portfolios reserve the right to disclose or report personal or account information tonon-affiliated third parties in limited circumstances where the Portfolios believe in good faith that disclosure is required under law, to cooperate with regulators or law enforcement authorities, to protect their rights or property, or upon reasonable request by any fund advised by PIMCO in which a shareholder has invested. In addition, the Portfolios may disclose information about a shareholder or a shareholder’s accounts to anon-affiliated third party at the shareholder’s request or with the consent of the shareholder.
Sharing Information with Affiliates
The Portfolios may share shareholder information with their affiliates in connection with servicing shareholders’ accounts, and subject to applicable law may provide shareholders with information about products and services that the Portfolios or their Adviser, distributor or their affiliates (“Service Affiliates”) believe may be of interest to such shareholders. The information that the Portfolios may share may include, for example, a shareholder’s participation in the Portfolios or in other investment programs sponsored by a Service Affiliate, a shareholder’s ownership of certain types of accounts (such as IRAs), information about the Portfolios’ experiences or transactions with a shareholder, information captured on applicable websites, or other data about a shareholder’s accounts, subject
| | | | | | |
| 156 | | PIMCO MANAGED ACCOUNTS TRUST | | | | |
(Unaudited)
to applicable law. The Portfolios’ Service Affiliates, in turn, are not permitted to share shareholder information withnon-affiliated entities, except as required or permitted by law.
Procedures to Safeguard Private Information
The Portfolios take seriously the obligation to safeguard shareholdernon-public personal information. In addition to this policy, the Portfolios have implemented procedures that are designed to restrict access to a shareholder’snon-public personal information to internal personnel who need to know that information to perform their jobs, such as servicing shareholder accounts or notifying shareholders of new products or services. Physical, electronic and procedural safeguards are in place to guard a shareholder’snon-public personal information.
Information Collected from Websites
Websites maintained by the Portfolios or their service providers may use a variety of technologies to collect information that help the Portfolios and their service providers understand how the website is used. Information collected from your web browser (including small files stored on your device that are commonly referred to as “cookies”) allow the websites to recognize your web browser and help to personalize and improve your user experience and enhance navigation of the website. In addition, the Portfolios or their Service Affiliates may use third parties to place advertisements for the Portfolios on other websites, including banner advertisements. Such third parties may collect anonymous information through the use of cookies or action tags (such as web beacons). The information these third parties collect is generally limited to technical and web navigation information, such as your IP address, web pages visited and browser type, and does not include personally identifiable information such as name, address, phone number or email address.
If you are a registered user of the Portfolios’ website, the Portfolios or their service providers or third party firms engaged by the Portfolios or their service providers may collect or share information submitted by you, which may include personally identifiable information. This information can be useful to the Portfolios when assessing and offering services and website features. You can change your cookie preferences by changing the setting on your web browser to delete or reject cookies. If you delete or reject cookies, some website pages may not function properly. The Portfolios do not look for web browser “do not track” requests.
Changes to the Privacy Policy
From time to time, the Portfolios may update or revise this privacy policy. If there are changes to the terms of this privacy policy, documents containing the revised policy on the relevant website will be updated.
1 Amended as of March 23, 2017.
2PIMCO Investments LLC (“PI”) serves as the Portfolios’ distributor. This Privacy Policy applies to the activities of PI to the extent that PI regularly effects or engages in transactions with or for a Portfolio shareholder who is the record owner of such shares. For purposes of this Privacy Policy, references to “the Portfolios” shall include PI when acting in this capacity.
3When distributing this Policy, a Portfolio may combine the distribution with any similar distribution of its investment adviser’s privacy policy. The distributed, combined policy may be written in the first person (i.e., by using “we” instead of “the Portfolios”).
| | | | | | |
| | ANNUAL REPORT | | DECEMBER 31, 2018 | | 157 |
General Information
Investment Adviser and Administrator
Pacific Investment Management Company LLC
650 Newport Center Drive
Newport Beach, CA 92660
Distributor
PIMCO Investments LLC
1633 Broadway
New York, NY 10019
Custodian
State Street Bank and Trust Company
801 Pennsylvania Avenue
Kansas City, MO 64105
Transfer Agent
DST Asset Manager Solutions, Inc.
430 W 7th Street STE 219024
Kansas City, MO 64105-1407
Legal Counsel
Ropes & Gray LLP
Prudential Tower
800 Boylston Street
Boston, MA 02199
Independent Registered Public Accounting Firm
PricewaterhouseCoopers LLP
1100 Walnut Street, Suite 1300
Kansas City, MO 64106
This report is submitted for the general information of the shareholders of the Portfolios listed on the Report cover.

FISH3001AR_123118
As of the end of the period covered by this report, the Registrant has adopted a code of ethics (the “Code”) that applies to the Registrant’s principal executive officer and principal financial & accounting officer. The Registrant did not grant any waivers, including implicit waivers, from any provisions of the Code to the principal executive officer or principal financial & accounting officer during the period covered by this report.
A copy of the Code is included as an exhibit to this report.
| Item 3. | Audit Committee Financial Expert. |
The Board of Trustees has determined that James A. Jacobson, who serves on the Board’s Audit Oversight Committee, qualifies as an “audit committee financial expert” as such term is defined in the instructions to this Item 3. The Board has also determined that Mr. Jacobson is “independent” as such term is interpreted under this Item 3.
| Item 4. | Principal Accountant Fees and Services. |
| | | | | | |
| (a) | | Fiscal Year Ended | | Audit Fees | | |
| | December 31, 2018 | | $ 227,052 |
| | December 31, 2017 | | $ 226,674 |
| | | | |
| (b) | | Fiscal Year Ended | | Audit-Related Fees(1) |
| | December 31, 2018 | | $ — |
| | December 31, 2017 | | $ — |
| | | | |
| (c) | | Fiscal Year Ended | | Tax Fees |
| | December 31, 2018 | | $ — |
| | December 31, 2017 | | $ 29,700 |
| | | | |
| (d) | | Fiscal Year Ended | | All Other Fees(1) |
| | December 31, 2018 | | $ — |
| | December 31, 2017 | | $ — |
“Audit Fees” represents fees billed for each of the last two fiscal years for professional services rendered for the audit and review of the Registrant’s annual financial statements for those fiscal years or services that are normally provided by the accountant in connection with statutory or regulatory filings or engagements for those fiscal years.
“Audit-Related Fees” represents fees billed for each of the last two fiscal years for assurance and related services that are reasonably related to the performance of the audit or review of the Registrant’s financial statements, but not reported under “Audit Fees” above, and that include accounting consultations, agreed-upon procedure reports, attestation reports and comfort letters for those fiscal years.
“Tax Fees” represents fees billed for each of the last two fiscal years for professional services related to tax compliance, tax advice and tax planning, including services relating to the filing or amendment of federal, state or local income tax returns, regulated investment company qualification reviews, and tax distribution and analysis reviews.
“All Other Fees” represents fees, if any, billed for other products and services rendered by the principal accountant to the Registrant other than those reported above under “Audit Fees,” “Audit-Related Fees” and “Tax Fees” for the last two fiscal years.
(1)There were no “Audit-Related Fees” and “All Other Fees” for the last two fiscal years.
| | (e) | Pre-approval policies and procedures |
(1) The Registrant’s Audit Oversight Committee has adoptedpre-approval policies and procedures (the “Procedures”) to govern the Audit Oversight Committee’spre-approval of (i) all audit services and permissiblenon-audit services to be provided to the Registrant by its independent accountant, and (ii) all permissiblenon-audit services to be provided by such independent accountant to the Registrant’s investment adviser and to any entity controlling, controlled by, or under common control with the investment adviser that provides ongoing services to the Registrant (collectively, the “Service Affiliates”) if the services provided directly relate to the Registrant’s operations and financial reporting. In accordance with the Procedures, the Audit Oversight Committee is responsible for the engagement of the independent accountant to certify the Registrant’s financial statements for each fiscal year. With respect to thepre-approval ofnon-audit services provided to the Registrant and its Service Affiliates, the Procedures provide that the Audit Oversight Committee may annuallypre-approve a list of types or categories ofnon-audit services that may be provided to the Registrant or its Service Affiliates, or the Audit Oversight Committee maypre-approve such services on aproject-by-project basis as they arise. Unless a type of service has received generalpre-approval, it will require specificpre-approval by the Audit Oversight Committee if it is to be provided by the independent accountant. The Procedures also permit the Audit Oversight Committee to delegate authority to one or more of its members topre-approve any proposednon-audit services that have not been previouslypre-approved by the Audit Oversight Committee, subject to the ratification by the full Audit Oversight Committee no later than its next scheduled meeting.
(2) With respect to the services described in paragraphs (b) through (d) of this Item 4, no amount was approved by the Audit Oversight Committee pursuant to paragraph (c)(7)(i)(C) of Rule2-01 of RegulationS-X.
| | | | | | | | | | | | |
| | | AggregateNon-Audit Fees Billed to Entity | |
| | | | |
| Entity | | December 31, 2018 | | | | | | December 31, 2017 | |
| | | | | | | | | |
PIMCO Managed Accounts Trust | | $ | — | | | | | | | $ | 29,700 | |
Pacific Investment Management Company LLC (“PIMCO”) | | | 8,437,919 | | | | | | | | 6,271,517 | |
| | | | | | | | | | | | |
| | | | |
Total | | $ | 8,437,919 | | | | | | | $ | 6,301,217 | |
| | | | | | | | | | | | |
| | (h) | The Registrant’s Audit Committee has considered whether the provision ofnon-audit services that were rendered to the Registrant’s investment adviser, and any entity controlling, controlled by, or under common control with the investment adviser that provides ongoing services to the Registrant which were notpre-approved (not requiring pre-approval) is compatible with maintaining the principal accountant’s independence. |
| Item 5. | Audit Committee of Listed Registrants. |
Not applicable.
| Item 6. | Schedule of Investments. |
The Schedule of Investments is included as part of the reports to shareholders under Item 1.
| Item 7. | Disclosure of Proxy Voting Policies and Procedures for Closed-End Management Investment Companies. |
Not applicable.
| Item 8. | Portfolio Managers of Closed-End Management Investment Companies. |
Not applicable.
| Item 9. | Purchases of Equity Securities by Closed-End Management Investment Company and Affiliated Purchasers. |
Not applicable.
| Item 10. | Submission of Matters to a Vote of Security Holders. |
There have been no material changes to the procedures by which shareholders may recommend nominees to the Trust’s Board of Trustees since the Trust last provided disclosure in response to this item.
| Item 11. | Controls and Procedures. |
| | (a) | The principal executive officer and principal financial & accounting officer have concluded as of a date within 90 days of the filing date of this report, based on their evaluation of the Registrant’s disclosure controls and procedures (as defined in Rule30a-3(c) under the 1940 Act), that the design of such procedures is effective to provide reasonable assurance that material information required to be disclosed by the Registrant on FormN-CSR is recorded, processed, summarized and reported within the time periods specified in the Commission’s rules and forms. |
| | (b) | There were no changes in the Registrant’s internal control over financial reporting (as defined in Rule30a-3(d) under the 1940 Act (17 CFR270.30a-3(d))) that occurred during the last fiscal quarter of the period covered by this report that have materially affected, or are reasonably likely to materially affect, the Registrant’s internal control over financial reporting. |
| Item 12. | Disclosure of Securities Lending Activities forClosed-End Management Investment Companies. |
Not applicable.
| | (a)(1) | Exhibit 99.CODE—Code of Ethics pursuant to Section 406 of the Sarbanes-Oxley Act of 2002. |
| | (a)(2) | Exhibit 99.CERT—Certifications pursuant to Section 302 of the Sarbanes-Oxley Act of 2002. |
| | (a)(4) | There was no change in the registrant’s independent public accountant for the period covered by the report. |
| | (b) | Exhibit 99.906CERT—Certifications pursuant to Section 906 of the Sarbanes-Oxley Act of 2002. |
Signatures
Pursuant to the requirements of the Securities Exchange Act of 1934 and the Investment Company Act of 1940, the registrant has duly caused this report to be signed on its behalf by the undersigned, thereunto duly authorized.
| | |
| PIMCO Managed Accounts Trust |
| |
| By: | | /s/ Peter G. Strelow |
| | Peter G. Strelow |
| | President (Principal Executive Officer) |
| |
| Date: | | February 28, 2019 |
Pursuant to the requirements of the Securities Exchange Act of 1934 and the Investment Company Act of 1940, this report has been signed below by the following persons on behalf of the registrant and in the capacities and on the dates indicated.
| | |
| By: | | /s/ Peter G. Strelow |
| | Peter G. Strelow |
| | President (Principal Executive Officer) |
|
| Date: February 28, 2019 |
| |
| By: | | /s/ Trent W. Walker |
| | Trent W. Walker |
| | Treasurer (Principal Financial & Accounting Officer) |
| |
| Date: | | February 28, 2019 |