Exhibit 99.1
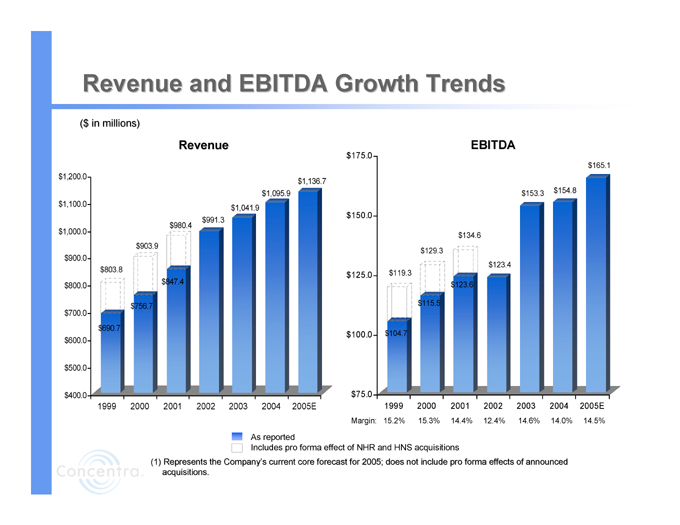
Exhibit 99.1
Revenue and EBITDA Growth Trends
($ in millions)
Revenue
$1,200.0
$1,100.0
$1,000.0
$900.0
$800.0
$700.0
$600.0
$500.0
$400.0
$803.8
$690.7
1999 $903.9
$756.7
2000 $980.4
$847.4
2001 $991.3
2002 $1,041.9
2003 $1,095.9
2004 $1,136.7
2005E
EBITDA
$175.0 $150.0 $125.0 $100.0 $75.0 $119.3
$104.7
1999 $129.3
$115.5
2000 $134.6
$123.6
2001 $123.4
2002 $153.3
2003 $154.8
2004 $165.1
2005E
Margin: 15.2% 15.3% 14.4% 12.4% 14.6% 14.0% 14.5%
As reported
Includes pro forma effect of NHR and HNS acquisitions
(1) Represents the Company’s current core forecast for 2005; does not include pro forma effects of announced acquisitions.
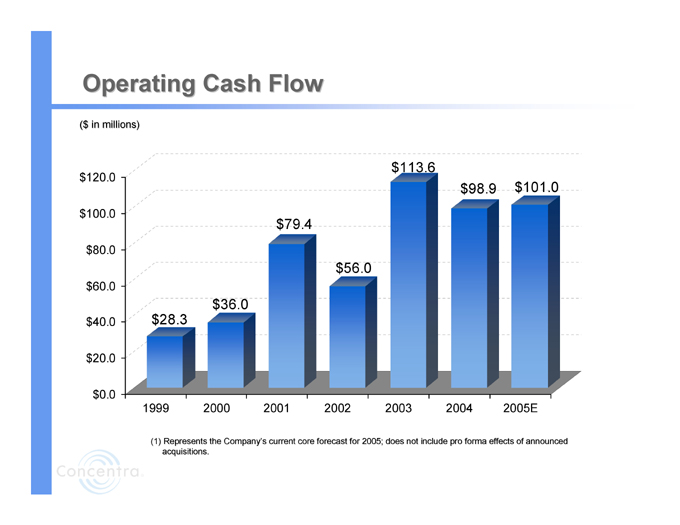
Operating Cash Flow
($ in millions)
$120.0
$100.0
$80.0
$60.0
$40.0
$20.0
$0.0
$28.3
1999 $36.0
2000 $79.4
2001 $56.0
2002 $113.6
2003 $98.9
2004 $101.0
2005E
(1) Represents the Company’s current core forecast for 2005; does not include pro forma effects of announced acquisitions.
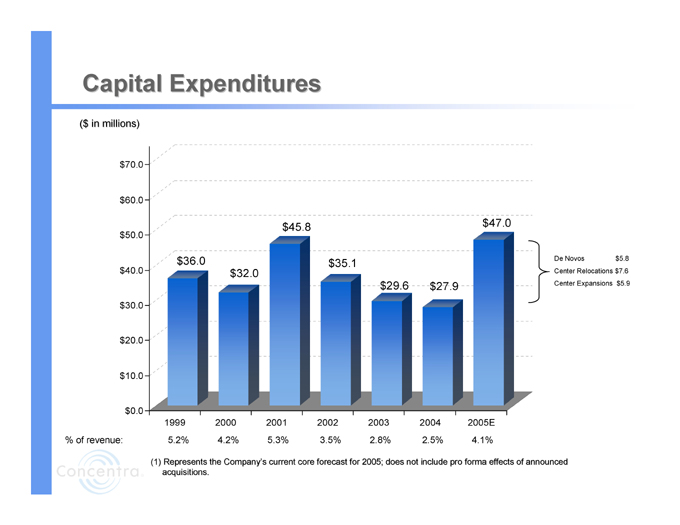
Capital Expenditures
($ in millions)
$70.0
$60.0
$50.0
$40.0
$30.0
$20.0
$10.0
$0.0
$36.0
1999 $32.0
2000 $45.8
2001 $35.1
2002 $29.6
2003 $27.9
2004 $47.0
2005E
De Novos $5.8
Center Relocations $7.6
Center Expansions $5.9
% of revenue: 5.2% 4.2% 5.3% 3.5% 2.8% 2.5% 4.1%
(1) Represents the Company’s current core forecast for 2005; does not include pro forma effects of announced acquisitions.
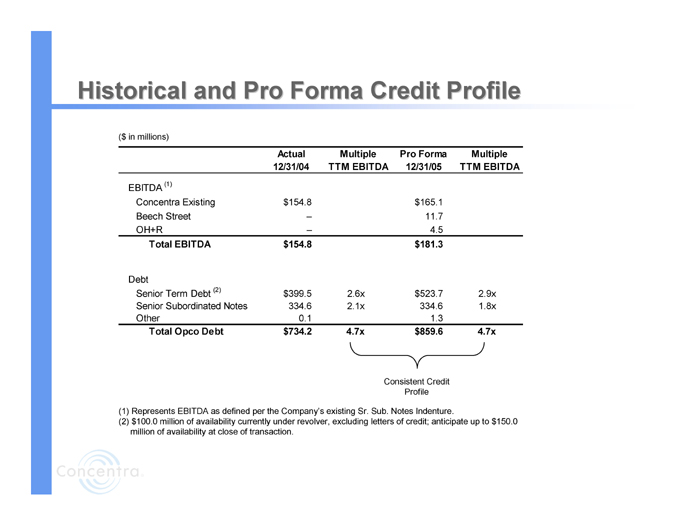
Historical and Pro Forma Credit Profile
($ in millions)
Actual 12/31/04 Multiple TTM EBITDA Pro Forma 12/31/05 Multiple TTM EBITDA
EBITDA (1)
Concentra Existing $154.8 $165.1
Beech Street – 11.7
OH+R – 4.5
Total EBITDA $154.8 $181.3
Debt
Senior Term Debt (2) $399.5 2.6x $523.7 2.9x
Senior Subordinated Notes 334.6 2.1x 334.6 1.8x
Other 0.1 1.3
Total Opco Debt $734.2 4.7x $859.6 4.7x
Consistent Credit Profile
(1) Represents EBITDA as defined per the Company’s existing Sr. Sub. Notes Indenture.
(2) $100.0 million of availability currently under revolver, excluding letters of credit; anticipate up to $150.0 million of availability at close of transaction.
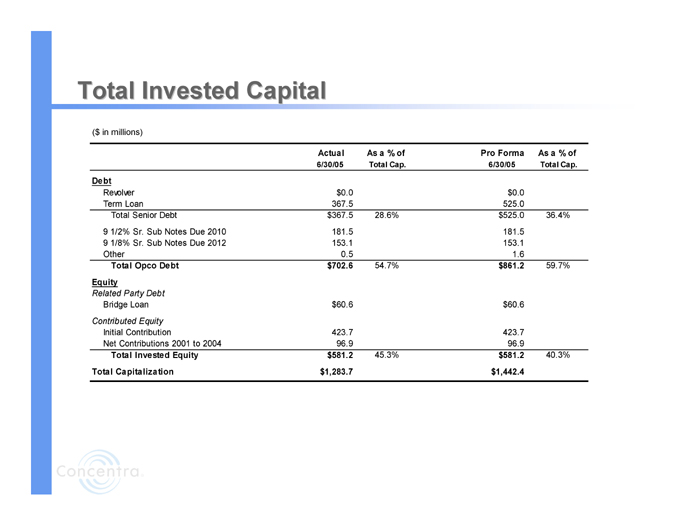
Total Invested Capital
($ in millions)
Actual 6/30/05 As a % of Total Cap. Pro Forma 6/30/05 As a % of Total Cap.
Debt
Revolver $0.0 $0.0
Term Loan 367.5 525.0
Total Senior Debt $367.5 28.6% $525.0 36.4%
9 1/2% Sr. Sub Notes Due 2010 181.5 181.5
9 1/8% Sr. Sub Notes Due 2012 153.1 153.1
Other 0.5 1.6
Total Opco Debt $702.6 54.7% $861.2 59.7%
Equity
Related Party Debt
Bridge Loan $60.6 $60.6
Contributed Equity
Initial Contribution 423.7 423.7
Net Contributions 2001 to 2004 96.9 96.9
Total Invested Equity $581.2 45.3% $581.2 40.3%
Total Capitalization $1,283.7 $1,442.4